
the Creative Commons Attribution 4.0 License.
the Creative Commons Attribution 4.0 License.
 | 30 Sep 2026
Managed aquifer recharge in confined multi-layer aquifers: a scalable framework for drought resilience in central Europe
Abdelrahman Ahmed Ali Abdelrahman

Hagen Koch
Mobarok Hossain
Ronjon Heim
Clara Hauke
Irina Engelhardt
Managed Aquifer Recharge (MAR), particularly Aquifer Storage, Transfer and Recovery (ASTR), can enhance groundwater resilience in confined multi-layer aquifers under drought stress. We develop an integrated and scalable framework to assess ASTR feasibility by combining (i) meteorological and groundwater drought analysis using the Standardized Precipitation Evapotranspiration Index (SPEI) and Standardized Groundwater Index (SGI), (ii) GIS-based multi-criteria decision analysis (MCDA) for recharge site suitability, and (iii) dynamic assessment of surface-water availability using ecological flow thresholds. Applied to the water-stressed Berlin-Brandenburg region, one of Germany's driest areas, where water supply relies heavily on induced bank filtration and faces emerging deficits. Results show that groundwater levels respond to climatic variability, supporting climate- informed ASTR planning. The MCDA identified 62.8 % of the area (2154 km2) as viable for ASTR. Flow-threshold analysis at 27 gauges showed that specific high-potential downstream sites could provide mean annual recharge volumes of 1.6–4.3 Mm3, offsetting 6 %–79 % of local extractions at those locations, although these volumes decreased substantially (40 %–100 %) during severe drought years (e.g., 2018), highlighting the importance of capturing wet-period surpluses for reliable ASTR operation. At the catchment scale, total mean annual available recharge is 18.2–23.0 Mm3. Literature-based cost estimates (EUR 0.30–0.60 m−3) are substantially lower than regional drinking-water production costs (EUR 1.80 m−3), suggesting potential for substantial cost savings relative to conventional water supply, though precise economic benefits require site-specific validation.
- Article
(8341 KB) - Full-text XML
-
Supplement
(6270 KB) - BibTeX
- EndNote


For decades, many parts of Central Europe have been considered water-secure, a view that delayed the development of integrated groundwater management strategies (Özerol et al., 2016). However, the severe and recurrent droughts of 2018, 2019, 2020 and 2022 have fundamentally challenged this assumption, exposing the vulnerability of groundwater resources under combined climatic and anthropogenic pressures (Brakkee et al., 2022). Rising temperatures, more frequent heat extremes, and prolonged periods of low or no precipitation are now decreasing groundwater recharge and accelerate groundwater depletion (Hellwig et al., 2020; Kosow et al., 2024).
A critical issue emerging across the continent is the growing discrepancy between groundwater extraction and natural recharge. The European Environment Agency estimates that a significant portion of EU river basins experience structural water stress, where total abstraction exceeds sustainable levels (EEA, 2021). In Germany, for instance, total groundwater extraction reached 6.1×10⁹ m3 in 2019, corresponding to over 12 % of the average long-term recharge ( m3 yr−1 for 1961–1990) (BGR, 2023). This imbalance is projected to intensify as water demand grows, particularly in densely populated urban centres.
Urban agglomerations such as Berlin and the surrounding Brandenburg region serve as a compelling example of this broader European challenge. While often characterized as a moderately stressed zone, it faces acute water stress driven by rapid urban expansion, high water demand from the metropolitan area, and limited natural recharge capacity (Pohle et al., 2025). At the same time, surface-water inflows are expected to decline by up to 126 Mm3 yr−1 following the phase-out of lignite mining, which previously discharged groundwater into the river and thus served as an indirect water source (UBA, 2023). This combination of reduced supply and increasing demand underscores the urgent need for adaptive water management.
These examples reflect a broader European challenge: how to maintain groundwater resilience under simultaneous climatic and socio-economic stressors. Managed Aquifer Recharge (MAR) offers a technically sound solution to bridge the temporal gap between water availability and demand by intentionally storing surplus water underground for later recovery (Shandilya et al., 2022; Bonilla et al., 2016). However, most MAR applications in Central Europe have historically focused on unconfined aquifers and induced bank filtration, leaving the large potential of confined multi-layer systems largely unexplored (Stefan and Ansems, 2018; Ferencz et al., 2024). The adoption of Aquifer Storage and Recovery (ASR) and Aquifer Storage, Transfer and Recovery (ASTR) in these settings is limited by data scarcity, operational uncertainty, and a lack of transferable assessment frameworks that integrate hydroclimatic variability, recharge feasibility, and environmental flow constraints (Brown et al., 2005; Ross and Hasnain, 2018). While ASR uses co-located injection and recovery wells, this study focuses on ASTR, which uses spatially separated injection and recovery sites and therefore requires distinct operational, hydrogeological, and regulatory considerations.
This study addresses this critical research gap by developing a scalable and generalizable framework for evaluating ASTR feasibility in confined multi-layer aquifers under drought stress. Its principal scientific innovation is the integration of drought indices, GIS-MCDA, recharge water availability and environmental flow thresholds into a spatiotemporal framework for climate-resilient ASTR planning. Specifically, the framework includes (i) assesses hydroclimatic drought using a comparative index approach (SPEI and SGI), (ii) developes a multi-criteria decision analysis to identify optimal sites for ASTR implementation within a confined multi-layer aquifer system, (iii) quantifies available surface water for MAR recharge considering ecological flow-threshold analyses for evaluation of the ASTR feasibility under drought stress to meet future water demand and enhance drought resilience.
The study area lies within a moderate water stress zone, where induced bank filtration represents an established MAR approach, yet groundwater stress persists (Fig. 1). This gap underlines the need for ASTR strategies to enhance groundwater resilience in such contexts. By focusing on the methodological framework and drawing broader implications for other European regions with similar hydrogeological conditions, this study delivers broader relevance and contributes meaningfully to sustainable groundwater management and regional water resource planning.
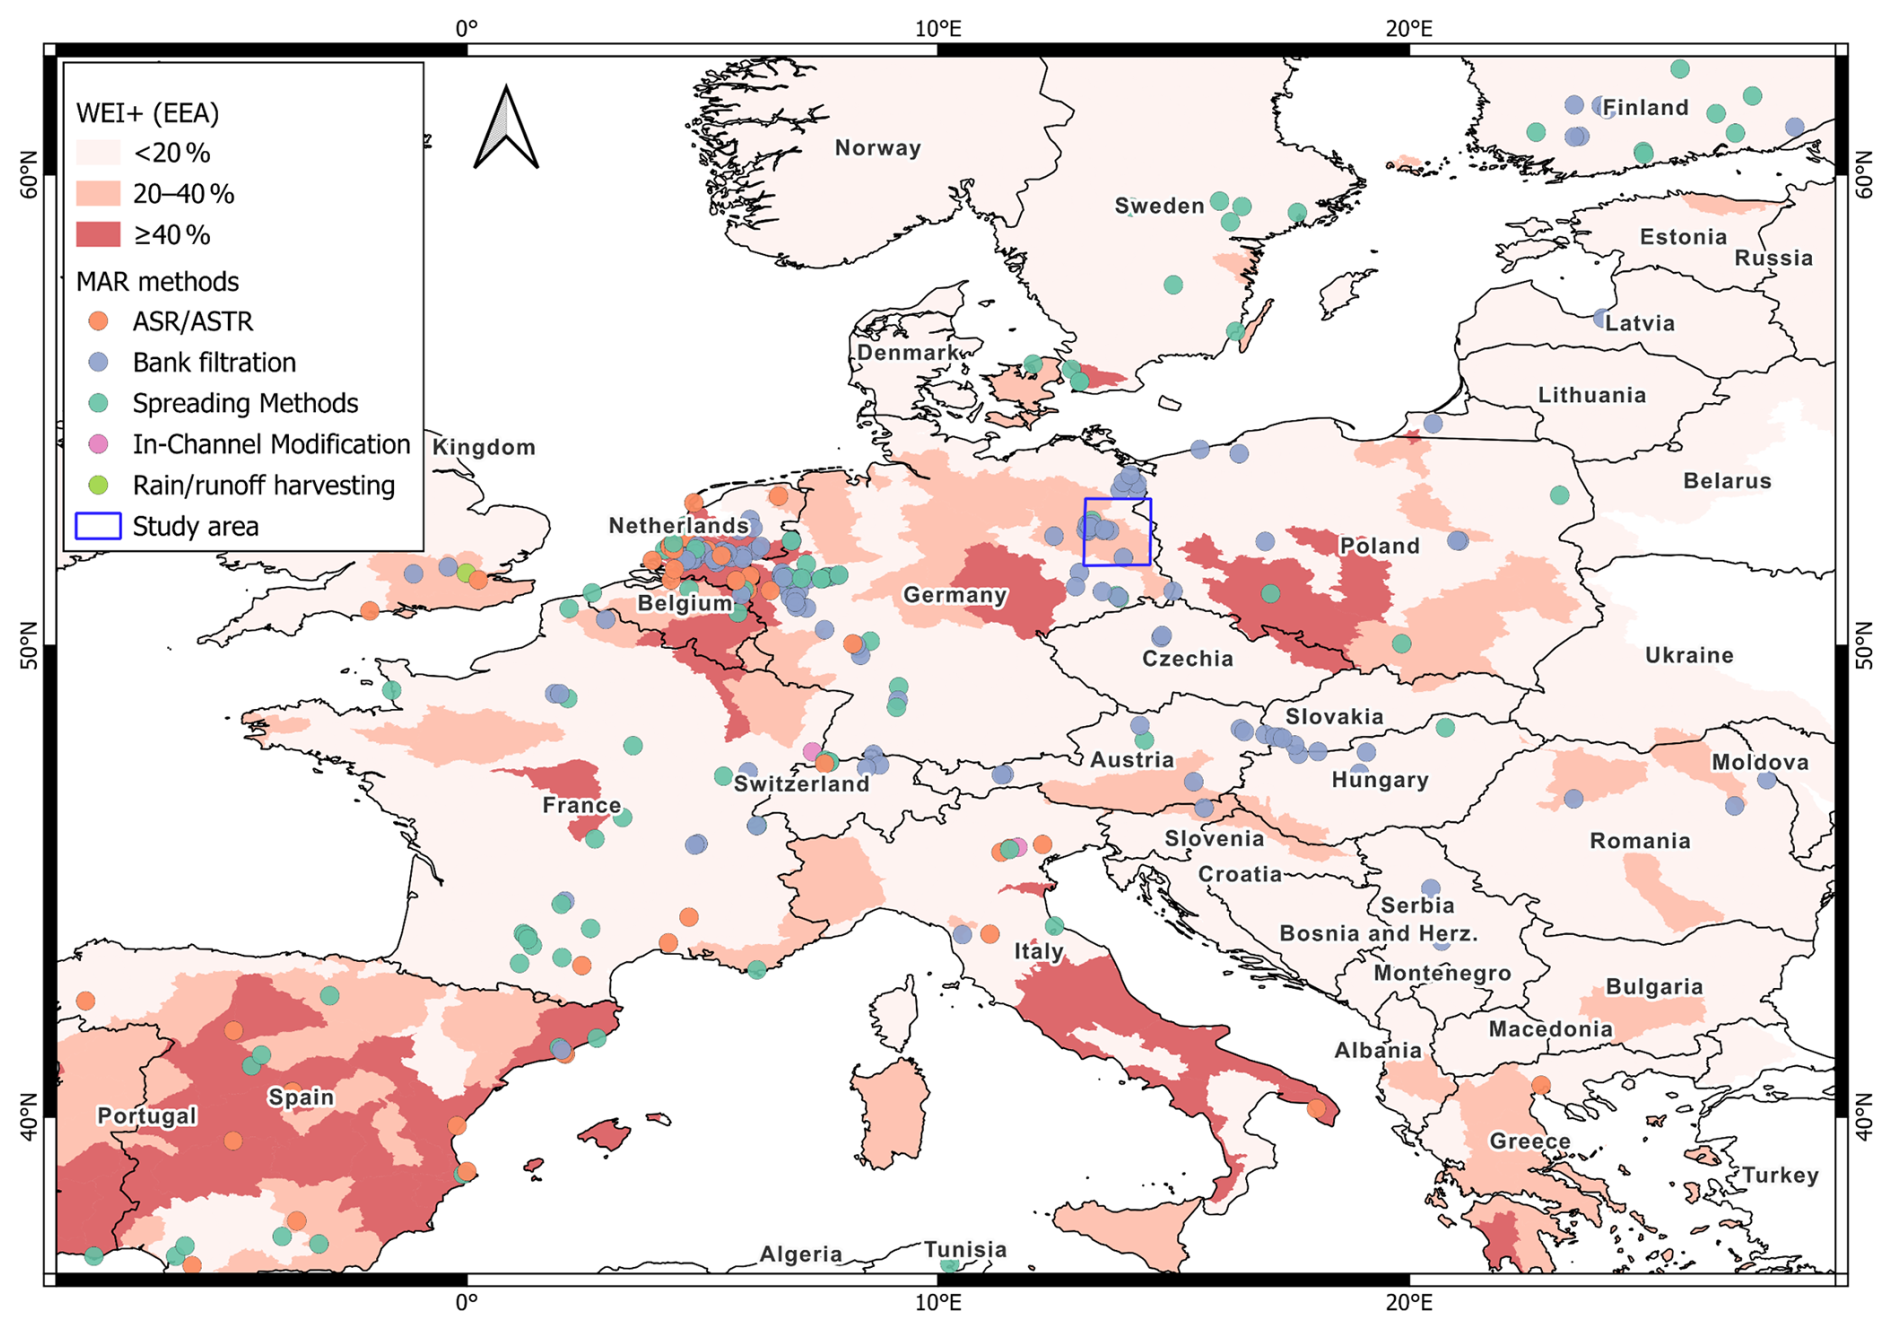
Figure 1Distribution of MAR methods across Europe, including spreading methods, bank filtration, and ASR/ASTR, highlighting the relative scarcity of ASTR applications in Central Europe. Background shading indicates water stress levels: moderate (WEI+ 20 %–40 %) and severe (WEI+ ≥40 %) (EEA, 2021; IGRAC, 2025; Stefan and Ansems, 2018).
2.1 Location and Regional Water Stress
The Berlin-Brandenburg region, particularly its eastern part, is among the driest areas in Germany, with mean annual precipitation ranging from 500 to 700 mm and predominantly sandy soils with low water retention capacity (UBA, 2025b) (Fig. 2a). The study catchment, covering ∼3500 km2 southeast of the Berlin metropolitan area (Fig. 3a), has experienced significant hydrological changes, including a ∼40 % decline in river discharge since 1980, decreased groundwater recharge, and the drying up of many small streams, resulting in a net hydrological water balance deficit that highlights its vulnerability to droughts and increasing water demand (Francke and Heistermann, 2025; Pohle et al., 2025).
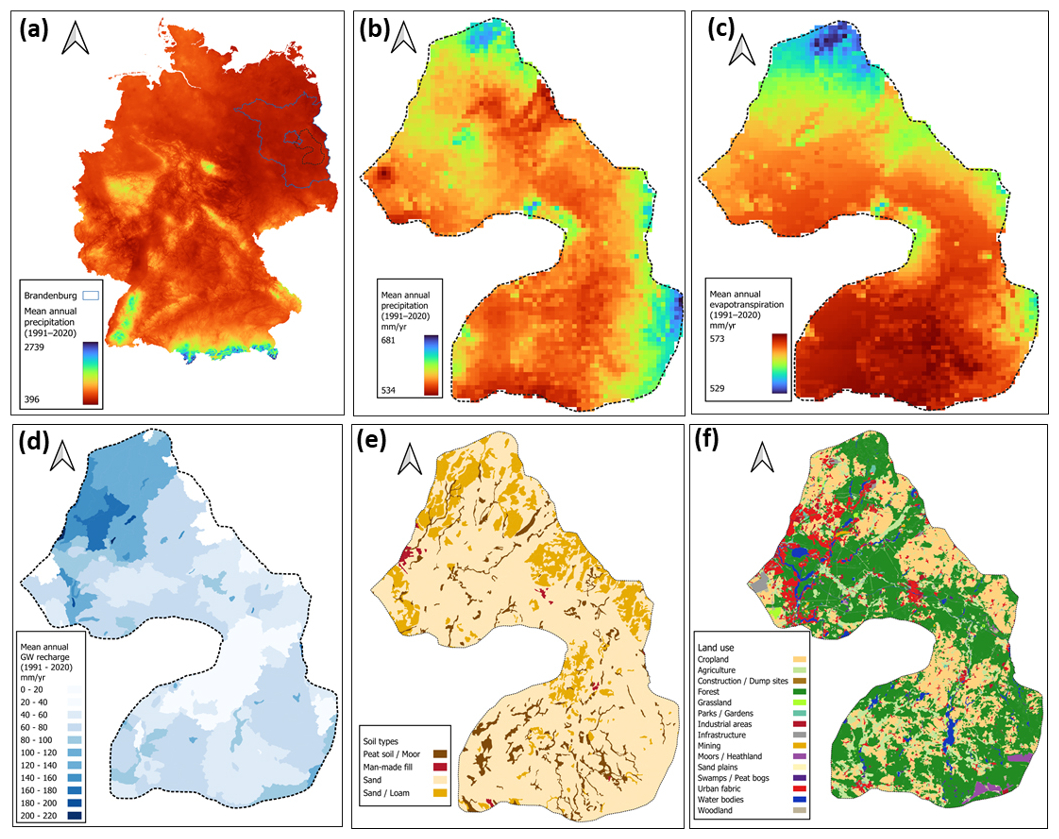
Figure 2(a) Mean annual precipitation in Germany (1991–2020, Deutscher Wetterdienst (DWD), 2024). (b) Mean annual precipitation in the study catchment (1991–2020, DWD, 2024). (c) Mean annual evapotranspiration (1991–2020, DWD, 2024). (d) Mean annual groundwater recharge (1991–2020, Potsdam Institute for Climate Impact Research (PIK), 2024). (e) Soil types, adapted from State Office for Mining, Geology and Raw Materials Brandenburg (LBGR), 2024. (f) Land use, adapted from CORINE Land Cover 2018 (European Environment Agency (EEA)/Copernicus, 2019). All maps were prepared and visualized by the authors.
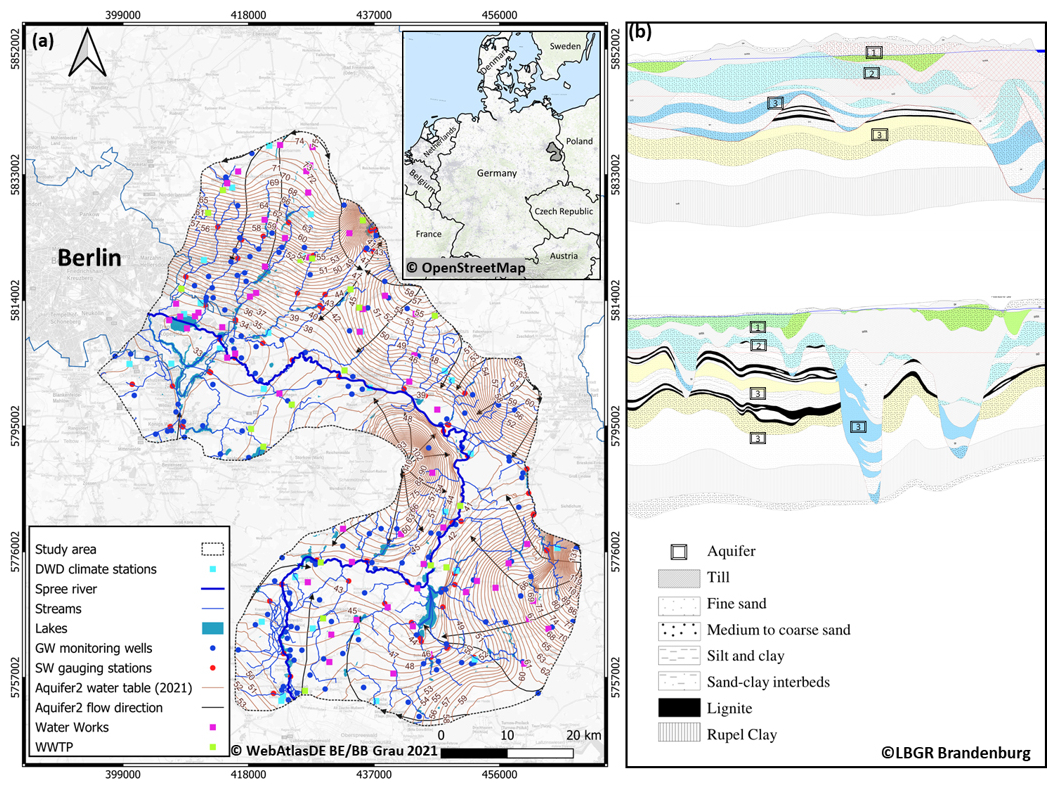
Figure 3Hydrogeological setting and monitoring network of the study catchment. (a) Overview map showing monitoring infrastructure and key hydrogeological features, including DWD climate stations, groundwater (GW) monitoring wells, surface water (SW) gauging stations, waterworks, and wastewater treatment plants (WWTPs). The map also shows the Spree River, associated streams and lakes, and Aquifer 2 water table (2021) with inferred groundwater flow directions. Base map: © OpenStreetMap contributors, https://www.openstreetmap.org/copyright (last access: 27 September 2026); © WebAtlasDE BE/BB Grau 2021, https://isk.geobasis-bb.de/mapproxy/webatlasde_2021/service/wms (last access: 27 September 2026). (b) Representative hydrogeological cross-sections illustrating the stratigraphic framework of Quaternary and Tertiary deposits, including Aquifer 1 (unconfined Weichselian sands and gravels), Aquifer 2 (confined Saalian aquifer, the primary source for regional water supply), and Aquifer 3 (deeper Quaternary/Tertiary aquifers), while the Rupelian Clay serves as a regional aquitard, safeguarding freshwater aquifers from deeper saline groundwater.
2.2 Climate, Hydrology, Soil Types, and Land Use
The study area exhibits flat to gently rolling terrain with numerous lakes and multi-channel river system. Despite abundant surface water, the area experiences chronic water scarcity due to low annual precipitation (averaging 534 to 631 mm yr−1) and high evapotranspiration (averaging 529 to 673 mm yr−1) for the period 1991–2020 (Fig. 2b and c). Severe droughts in 2018, 2019, 2020 and 2022 caused record-low groundwater levels, pronounced soil-moisture deficits, and ecological stress (UBA, 2025a; IGB, 2025). Climate projections suggest ongoing warming and increasing drought frequency and duration throughout the 21st century (UBA, 2023, 2025b).
Over centuries, river canalization, groundwater abstraction, and mine-water discharges have altered natural flow patterns and the hydrological balance (Pohle et al., 2025). Groundwater recharge varies spatially, with higher rates in the north than in the south (Fig. 2d), reflecting precipitation, soil type, land use, and evapotranspiration gradients (PIK, 2024). Groundwater level declines exceeding 2 m between 2003 and 2022 have been observed, mainly due to increased drought frequency and rising temperatures (Abdelrahman et al., 2026).
Soils are mainly sandy and sandy loams, with smaller areas of peat and man-made fills (Fig. 2e). These light-textured soils exhibit low water retention capacity, which exacerbates the effects of droughts and reduces infiltration efficiency in some areas (FAO, 1988). Land use is dominated by forests and croplands, interspersed with grasslands and woodlands. Urban areas, industrial sites, mining locations, and infrastructure are concentrated in the northern and central zones, while swamps, peat bogs, and water bodies are scattered (Fig. 2f). This heterogeneous land-use pattern influences recharge distribution and water demand across the area (Barua et al., 2021).
2.3 Geology and Hydrogeology
The catchment lies within the North German Basin, where the subsurface is strongly influenced by repeated glacial and interglacial periods that deposited a heterogeneous sequence of sands, gravels, clays, and tills forming three major aquifer complexes: Aquifer 1 (Shallow) represents largely unconfined Weichselian deposits; Aquifer 2 (Intermediate) consists mainly of confined Saalian sediments and serves as the primary groundwater source; and Aquifer 3 (Deep) comprises deeper Saalian and Tertiary sand deposits, separated by confining tills and clays that restrict groundwater flow, with the Rupelian Clay acting as a regional aquitard protecting the freshwater aquifers from underlying saline groundwater (Manhenke et al., 1995; Manhenke, 2001; Lippstreu et al., 2015; Abdelrahman et al., 2026; Fig. 3b). The focus on the confined Aquifer 2 makes this study particularly relevant for ASTR application.
2.4 Water Demand, Supply, and Future Scenarios
The catchment is critical for water supply for the Berlin metropolitan area. In 2024, the Berliner public water utility (BWB) reported supplying 214 Mm3 of drinking water and returned 265 Mm3 of treated wastewater to the hydrological system (BWB, 2024; Fig. 3a). The region faces a dual challenge of supply reduction and demand increase, together amplify long-term water stress and justify the need for MAR/ASTR interventions.
- (1)
Supply Reduction: The planned coal phase-out by 2038 will remove long-standing mine-water discharges, creating an annual deficit of ∼126 Mm3 during dry summers (UBA, 2023). This will exacerbate existing seasonal shortages and constrain the region's capacity to sustain groundwater levels and ecological flows, especially under prolonged drought conditions.
- (2)
Demand Increase: Regional water demand is projected to rise by around 50 Mm3 by 2050, driven by population growth and the effects of climate change (BWB, 2020; IHK Ostbrandenburg, 2023). This increase is likely to further intensify water stress and compromise overall water security.
We compiled a comprehensive dataset of meteorological, hydrological, groundwater, hydrogeological, and water-use records spanning 1980–2024 and applied established drought indices to identify anomalies in both meteorological conditions and groundwater storage, comparing their temporal dynamics to guide the assessment of ASTR suitability. Building on this, the study employs a four-component framework to evaluate the feasibility of ASTR in confined multi-layer aquifers, designed to be transferable across European hydrogeological settings. The framework integrates a hydroclimatic drought assessment through comparative analysis of meteorological and groundwater drought indices; a groundwater stress evaluation using non-parametric indexing of long-term water-level records; a GIS-based site suitability analysis employing multi-criteria decision analysis (MCDA) to determine optimal recharge locations; and surface water availability quantification via dynamic operational assessments of flow variability coupled with ecological flow-threshold analyses. The methodological framework is illustrated in Fig. 4, integrating hydroclimatic drought assessment, GIS-MCDA site suitability, surface water availability, and economic screening.
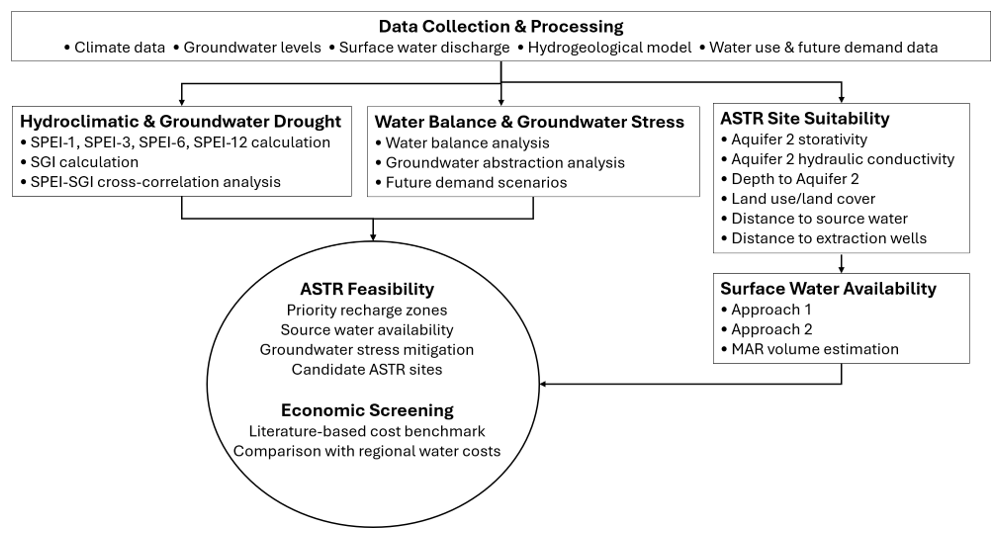
Figure 4Methodological flowchart of the integrated ASTR feasibility assessment framework, from data processing and analysis to final suitability and economic outputs.
3.1 Data Sources and Processing
We used precipitation and potential evapotranspiration (PET) from the DWD 1 km gridded datasets (monthly) for hydrological characterization. For drought index computation (SPEI), we used daily precipitation and PET from ERA5 (see Sect. 3.2), with 1-, 3-, 6-, and 12-month accumulation periods (SPEI-1, SPEI-3, SPEI-6, and SPEI-12). We obtained river and stream discharges, lake levels, and ecological flow thresholds from the State Office for the Environment Brandenburg (LfU, 2024), encompassing approximately 89 gauging stations with daily records. We used the daily discharge records for flow-threshold analysis.
We obtained groundwater heads from 176 long-term monitoring wells spanning Aquifer 1, 2, and 3 from the LfU. We aggregated the groundwater-head records to monthly values for SGI calculation. We derived aquifer characteristics, such as thicknesses of the aquifer and unsaturated zone, depth to aquifer tops, confined/unconfined conditions, and lateral extent from a 3D hydrogeological model developed for the region (Abdelrahman et al., 2026).
We compiled historical water use data and future demand projections for agriculture, industry, domestic supply, and waterworks from Berliner waterworks (BWB), Adelphi Research, the Office for Statistics Berlin-Brandenburg (AFS), the German Technical and Scientific Association for Gas and Water (DVGW), the Leibniz Centre for Agricultural Landscape Research (ZALF), and LfU (Adelphi Research, 2025; AFS, 2024; DVGW, 2024; ZALF, 2025; BWB, 2025). We aggregated water-use data from monthly to annual values for the water-balance analysis.
We acknowledge challenges related to heterogeneous monitoring density across aquifers, temporal gaps in some records, inconsistencies in water use reporting, and uncertainties in PET estimates from gridded climate data. Nevertheless, these datasets provide a solid foundation for drought assessment and ASTR suitability evaluation.
3.2 Hydroclimatic and Groundwater Drought Indices
To quantify the severity and propagation of drought, we applied two key indices. We assessed meteorological drought using the Standardized Precipitation Evapotranspiration Index (SPEI; Vicente-Serrano et al., 2010) from daily precipitation and potential evapotranspiration (PET) data for 1980–2024 from ERA5, the fifth-generation global reanalysis produced by the European Centre for Medium-Range Weather Forecasts (ECMWF) (Hersbach et al., 2020). The data were aggregated to 1-, 3-, 6-, and 12-month accumulation periods (SPEI-1, SPEI-3, SPEI-6, and SPEI-12) to characterize drought conditions across different timescales. The index was computed by fitting the precipitation minus PET series to a probability distribution and transforming it into standardized values (mean = 0, variance = 1), where positive values indicate wet conditions and negative values indicate drought.
To quantify groundwater drought, we applied the non-parametric monthly Standardized Groundwater Index (SGI)of Bloomfield and Marchant (2013). This approach is suitable for groundwater-level data because it does not assume a specific probability distribution and accounts for seasonal variability. For each well, we arranged monthly groundwater-head records as a continuous time series, with missing values excluded only from ranking. We calculated the SGI separately for each calendar month, so January values were compared only with other January values, February values with February values, and so on. Within each month, we ranked groundwater levels, converted them to plotting positions, and transformed them to standard-normal scores.
For a given calendar month, we calculated the SGI as:
where Φ−1 is the inverse standard-normal cumulative distribution function, pi is the plotting position, i is the rank, and n is the number of observations for that month. Negative SGI values indicate below-normal groundwater levels, whereas positive values indicate above-normal conditions. Month-wise standardization removes the seasonal cycle, while we applied no additional detrending because we considered long-term groundwater decline part of the drought and depletion signal. We first calculated the SGI for individual wells and then spatially aggregated it for the entire catchment and 21 sub-catchments. A common preprocessing step was to remove non-stationarity, such as seasonal cycles, to isolate purely wet-dry fluctuations (Henao Casas et al., 2022; Brakkee et al., 2022).
Finally, we performed a cross-correlation analysis between SPEI-1, SPEI-3, SPEI-6, and SPEI-12 and SGI time series to quantify the strength and timescale of the relationship between climatic and groundwater anomalies.
3.3 Water Balance, Extraction Distribution, and Future Scenarios
We evaluated the spatial and temporal dynamics (1980–2024) of the hydrological water balance, groundwater abstraction, treated wastewater return flows, and future water-demand projections to quantify current pressures and assess prospective deficits across the catchment, distinguishing sectoral uses for domestic, industrial, and agricultural purposes. To assess the historical water balance, we used data from the Soil and Water Integrated Model (SWIM) developed by the Potsdam Institute for Climate Impact Research (PIK) for 1980–2024. Climate inputs were based on spatially downscaled and bias-adjusted datasets, with historical model calibration and validation using the W5E5v2.0 dataset, which is bias-adjusted against observational records (Lange, 2019). Simulated historical streamflows were further compared with observed discharge records to evaluate the reliability of the hydrological inputs. This semi-distributed ecohydrological model simulates key components of the water cycle, including precipitation, actual evapotranspiration, runoff, and storage change (Krysanova et al., 2022). We aggregated monthly outputs to annual means and computed the long-term balance for each sub-catchment to delineate zones of surplus and deficit and identify areas with sustained negative water balance, indicating potential recharge limitations.
We estimated future water-demand trajectories (2025–2050) by integrating data collected from BWB, Adelphi Research, AFS, DVGW, and ZALF. Projections were developed using Shared Socioeconomic Pathways (SSPs; SSP1-2.6 and SSP2-4.5), consistent with the Intergovernmental Panel on Climate Change (IPCC) Sixth Assessment Report (AR6) and German Environment Agency (UBA) regional climate projections (Kreienkamp et al., 2022). These pathways represent different socio-economic trajectories and were linked to sector-specific water demand projections from local stakeholders (BWB, Adelphi Research, ZALF). The high-emission SSP5-8.5 pathway was not considered, as the analysis focused on SSP1-2.6 and SSP2-4.5. Climate variables were bias-corrected and calibrated against historical meteorological and hydrological records within the Soil and Water Integrated Model (SWIM) to ensure reliable water-balance estimates. We evaluated sectoral demand across four categories: total waterworks, S1 (agriculture, forestry, and fisheries), S2 (industry and energy), and S3 (services, domestic, and recreation).
3.4 ASTR/MAR Site Suitability (MCDA)
We applied a GIS-based multi-criteria decision analysis (MCDA) to map the suitability of the study catchment for ASTR implementation, following established MAR/ASTR suitability frameworks (e.g., Khalil et al., 2022; Sharma et al., 2022; Sallwey et al., 2019; Russo et al., 2015). We defined six key site-selection criteria (Table 1), using datasets including Aquifer 2 storativity (specific storage × thickness), horizontal hydraulic conductivity (HK) from the 3D hydrogeological model, depth to Aquifer 2, land-use maps, and river and extraction well locations. We scored criteria from 1 (unsuitable) to 5 (highly suitable) and applied masks for absolute constraints such as water bodies, and Well Protection Zones 1–2.
Table 1MCDA criteria and suitability scores for ASTR site selection.
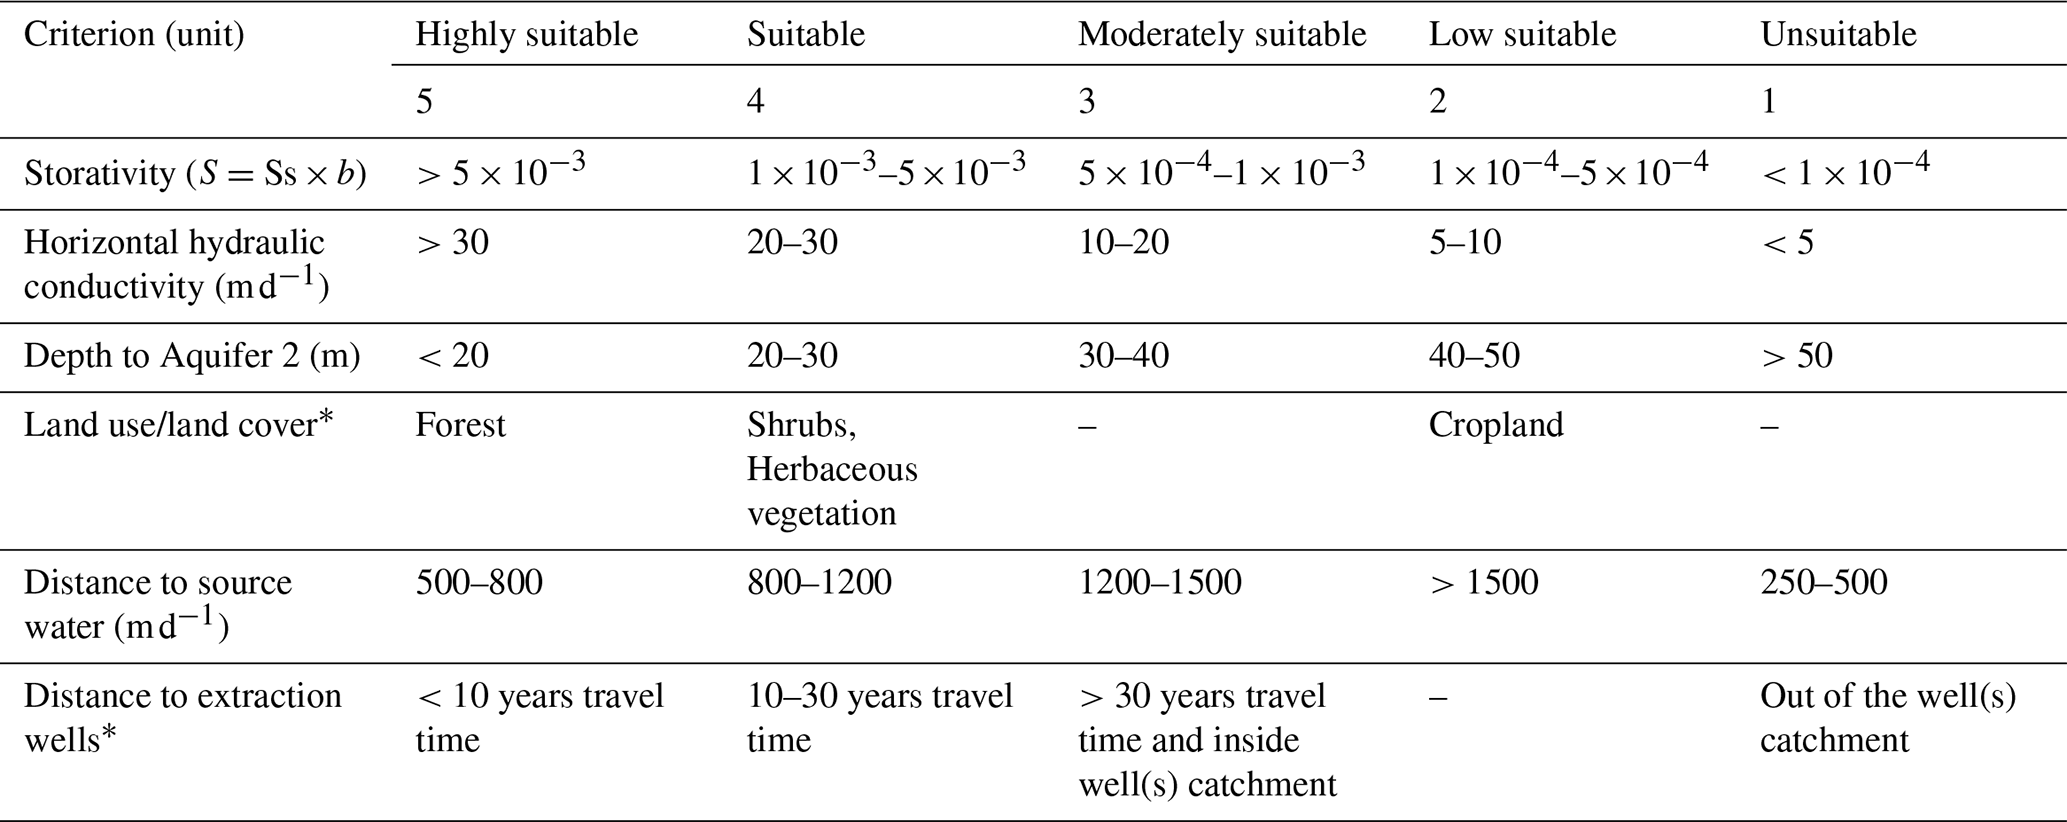
∗ Notes: Water bodies, wetlands, and Well protection zones 1–2 were masked as absolute constraints.
Aquifer 2 storativity: We calculated Aquifer 2 storativity as the product of specific storage (Ss) and layer thickness (b) () to represent actual storage capacity for Aquifer 2, following established MAR assessments approaches (Russo et al., 2015; Gibson et al., 2018). We derived specific storage values from lithology-based estimates within the 3D hydrogeological model and multiplied by the actual Aquifer 2 thickness for each cell. Suitability scores ranged from 5 () to 1 (), consistent with reported MAR storage thresholds (Seidl et al., 2024; Vandala and Mahed, 2025).
Horizontal hydraulic conductivity (HK): We prioritized areas with higher HK values, as they allow the injected water to infiltrate and spread laterally and support recovery well yields at the regional scale (Dillon et al., 2019). Suitability scores ranged from 5 (>30 m d−1) to 1 (<5 m d−1), consistent with thresholds reported in MAR feasibility studies (Russo et al., 2015; Sitek et al., 2026). We acknowledge that vertical hydraulic conductivity is also critical for local injection efficiency; however, its detailed evaluation is beyond the scope of this regional screening and is reserved for future site-specific pilot designs.
Depth to Aquifer 2: We assessed the depth from land surface to the aquifer top, as greater depths increase injection costs. Scores ranged from 5 (highly suitable, <20 m) to 1 (unsuitable, >50 m), following recommendations from MAR implementation guidelines (Gibson et al., 2018; Abdo et al., 2024; Stefan and Ansems, 2018; Seidl et al., 2024).
Land Use/Land Cover: We excluded densely urban areas, water bodies, wetlands, and protected natural reserves, favouring forests, open land, and agricultural areas, as they are more likely to accommodate recharge facilities with minimal siting conflicts. Forest scored 5, shrubs/herbaceous 4, cropland 2, consistent with land-use suitability classifications in recent MAR studies (Sallwey et al., 2019; Sitek et al., 2026; Meng et al., 2024).
Distance to source water: We considered the distance to the river and its tributaries to minimize pipelines, canals, and costs, while excluding flood-prone areas (Gibson et al., 2018; Russo et al., 2015). We estimated groundwater travel time from recharge areas to source water using particle tracking simulations within the hydrogeological model to prevent rapid return flow that could reduce recovery efficiency or affect the river ecosystem (Pollock, 1994; Harbaugh, 2005; Wang et al., 2020). Sites within 500–800 m scored 5, while those >1500 m scored 2, following distance-decay principles established in MAR site selection literature (Dillon et al., 2019; Seidl et al., 2024).
Distance to extraction wells: We assessed the proximity of groundwater pumping wells, excluding highly sensitive Protection Zones 1 and 2 to avoid well interference while ensuring effective recovery (Gibson et al., 2018). We relied on official LfU data on groundwater travel times to pumping wells, which are based on hydrogeological assessments and the delineation of water protection areas. For the remaining areas, we scored suitability according to travel time: <10 years = 5 (highly suitable), 10–30 years = 4, >30 years within the catchment = 3, and outside the catchment = 1 (unsuitable), consistent with well protection criteria in ASTR applications (Russo et al., 2015; Stefan and Ansems, 2018).
We combined all criteria using a weighted overlay, with weighting based on literature and expert judgment. We then produced a composite suitability index, rescaled to a range of 0 (Unsuitable) to 100 (Highly Suitable). To address potential subjectivity in criterion weighting, we performed a sensitivity analysis comparing three scenarios: S1 (equal weighting), S2 (hydrogeology-focused, prioritizing storativity and conductivity), and S3 (distance-focused, prioritizing proximity to source water and wells) (Table 2). Finally, we screened high-scoring areas for aquifer volume, source water availability, and location suitability, generating a shortlist of candidate ASTR sites for further evaluation.

Finally, we summarized ASTR suitability at the sub-catchment scale by assigning each sub-catchment to a suitability category based on its MCDA results and underlying hydrogeological characteristics, supporting the prioritization of candidate areas for further investigation.
3.5 Surface Water Availability and Flow-Threshold Analysis
Streams and lakes provide potential sources of water for MAR/ASTR but any abstraction must be carefully regulated to avoid compromising ecological functions and downstream water users in already stressed hydrological systems (Kocis and Dahlke, 2017; Stein et al., 2021). We assessed surface water availability across the study catchment. From a total of 89 surface water gauging stations, 27 provided sufficient long-term daily discharge records (1980–2024) for a robust analysis. For these locations, we defined available volumes using percentile- and frequency- based thresholds from daily streamflow records (1980–2024) at the gauging stations, with rules that maintain environmental flows and allocate only surplus water (Yarnell et al., 2020; Schmidt et al., 2004; Alley et al., 2022). Therefore, we analysed the interannual and spatial variability of streamflow available for MAR/ASTR across 27 locations to evaluate recharge feasibility. We applied two distinct threshold-based approaches to define MAR-eligible surplus flow while protecting ecological functions and hydrological variability:
Approach 1: A more permissive method that applies a fixed hydroecological flow limit combined with a 20 % extraction rule (Alley et al., 2022), aiming to maximize recharge potential. When river flows are at or below the hydroecological limit, no water is abstracted in order to protect minimum ecological flows and meet downstream needs (Vanham et al., 2022; Yarnell et al., 2020). When flows surpass the hydroecological limit, up to 20 % of the instantaneous flow can be abstracted for ASTR, ensuring that a substantial portion of the flow remains in the channel for ecological and other uses.
Approach 2: A more restrictive method that limits abstraction to extreme flood peaks, prioritizing the preservation of environmental flows. We combined several hydrological and hydroecological thresholds to further refine conditions for abstraction. We obtained the base hydroecological limit directly from the local ecological flow guidelines provided by LfU, ensuring its applicability to the regional context. We derived the additional hydrological thresholds (e.g., median daily flow, 2-year and 5-year flood levels) from established scientific literature (Schmidt et al., 2004; Vanham et al., 2022; Yarnell et al., 2020) to preserve channel maintenance flows and associated habitat functions. Under this approach, no water is diverted for ASTR when the flows are at or below the hydroecological limit, at or below the median daily flow, or within the range defined by the 2-year and 5-year flood levels, in order to preserve channel maintenance flows and associated habitat functions (Schmidt et al., 2004; Vanham et al., 2022; Yarnell et al., 2020). Abstraction is only permitted when flows exceed the median daily flow but remain below the 2-year flood threshold, provided that post-abstraction discharge remains at or above the median daily flow or when flows exceed the 5-year flood up to the physical capacity of intake, pretreatment, wells, and pond storage infrastructure (Yarnell et al., 2020; Alley et al., 2022; Richter et al., 2011; CEFWG, 2021).
We applied these methodologies (approach 1, and 2) to long-term daily discharge records to quantify the volume, frequency, and reliability of water available for MAR/ASTR. In addition, we compared stream- water availability with annual groundwater extraction rates and treated wastewater volumes (Meles et al., 2024; Ulibarri et al., 2021) in four representative stressed sub-catchments to assess their potential impacts.
3.6 Indicative Cost Benchmark from Literature
To provide an initial economic context for the technically viable sites identified, we derived an indicative cost range for ASTR implementation from a review of recent European MAR literature. While a detailed, site-specific economic analysis was beyond the scope of this study, reported total costs for well-based MAR schemes, typically range from EUR 0.30 to EUR 0.60 m−3 of recharged water, including capital and operational expenditures (Ross and Hasnain, 2018; Stefan and Ansems, 2018; Sprenger et al., 2017; Dillon et al., 2019). For comparison, the production cost for drinking water in the region is approximately EUR 1.80 m−3 (BWB, 2019). Table 3 summarizes specific benchmarks extracted from reviewed studies, highlighting their inherent limitations.
Table 3Indicative ASTR/MAR Cost Benchmarks from European Literature.
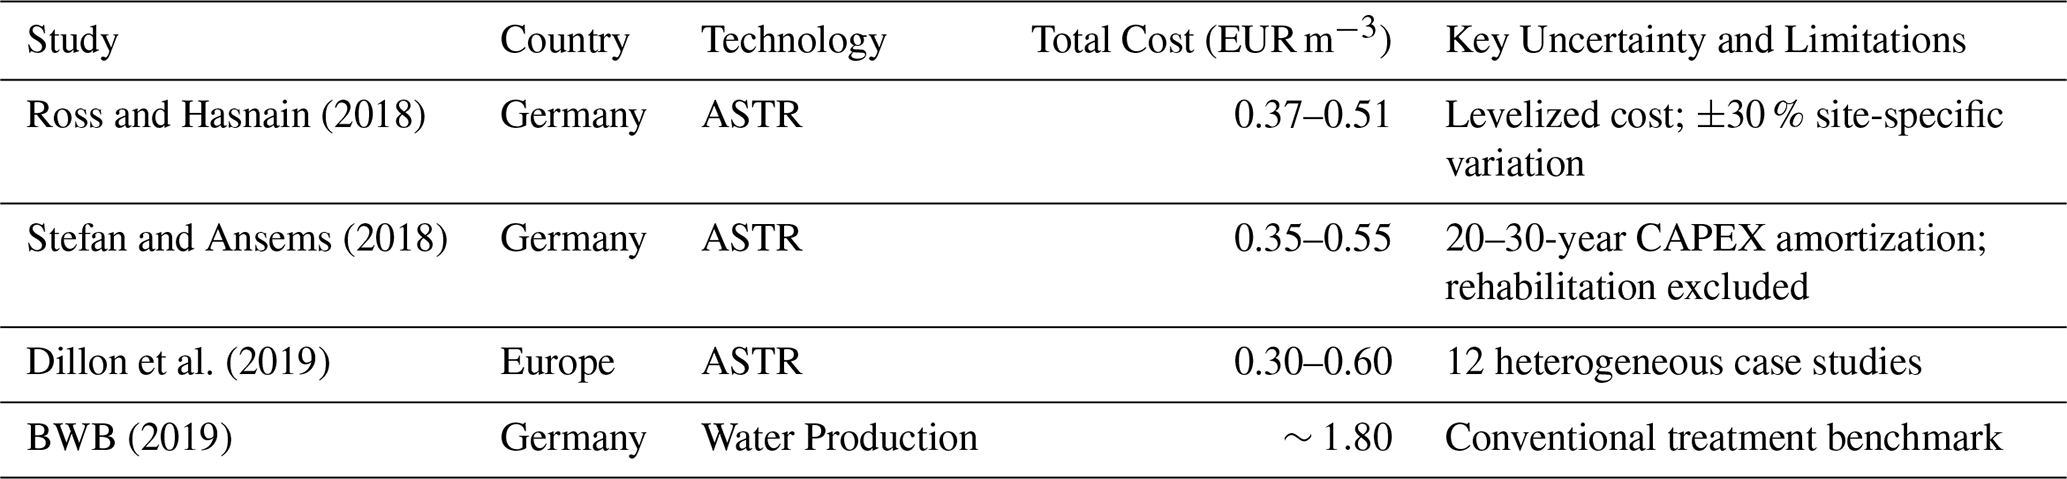
Note: All values are indicative order-of-magnitude estimates. Actual costs depend on local hydrogeology, energy tariffs, and regulatory requirements.
4.1 Hydroclimatic and Groundwater Drought Dynamics (SGI/SPEI Indices)
First, we assessed long-term hydroclimatic conditions to characterize water stress in the region, and we observed a steady rise in potential evapotranspiration (PET) over the 45-year period from 1980–2024 (Fig. 5a), driven by rising air temperatures and higher evaporative demand, which together reduce groundwater recharge (Francke and Heistermann, 2025; Tsypin et al., 2024). Precipitation shows strong interannual variability without a robust long-term trend, but the severe drought from 2018 to 2023 is clearly visible (Fig. 5a). The Standardized Precipitation Evapotranspiration Index (SPEI) time series (Fig. 5b) highlights repeated and intense drought episodes over the last four decades, particularly the severe and prolonged periods of 2018–2019 and 2020–2023, characterized by low precipitation and high evapotranspiration, leading to significant moisture deficits.
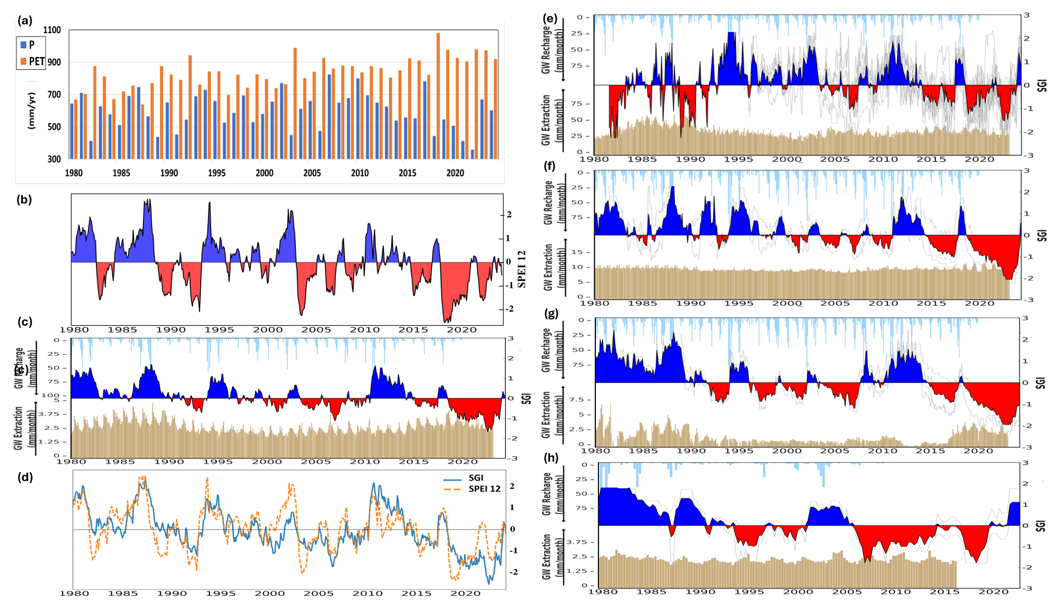
Figure 5Hydroclimatic and groundwater drought dynamics (1980–2024). (a) Time series of Precipitation (P) and Potential Evapotranspiration (PET). (b) SPEI time series for the entire catchment. (c) SGI time series for the entire catchment. (d) Joint SPEI-12 and SGI comparison illustrating the strong co-variation between annual-scale hydroclimatic anomalies and groundwater-level variations. (e, f) SGI time series of highly stressed sub-catchments. (g, h) SGI time series of moderately stressed sub-catchments, showing the spatial variability in drought response.
The catchment-scale Standardized Groundwater Index (SGI) time series (Fig. 5c) indicates substantial groundwater variability. Lag-correlation analysis across multiple SPEI accumulation periods in Table S1 in the Supplement showed that the relationship with SGI strengthened with increasing accumulation timescale, from very weak correlations for SPEI-1 (Pearson correlation r=0.191 at a 5-month lag) and SPEI-3 (r=0.208 at a 3-month lag) to a weak correlation for SPEI-6 (r=0.291 at a 1-month lag), SPEI-12 showed the strongest correlation at zero lag (r=0.734, r2=0.539; Fig. 5d).
At the sub-catchment scale, SGI time series reveal pronounced spatial variability in groundwater drought response. Two representative highly stressed sub-catchments (H1, H2; Fig. 5e and f) and two moderately stressed sub-catchments (M1, M2; Fig. 5g and h) exhibited persistently negative SGI values, often below −1.5, indicating chronic groundwater drought and limited recovery. These areas correspond to zones of high abstraction and align with the most severe negative hydrological water balance, as detailed in Sect. 4.2. Other sub-catchments with high, medium, and low stress are presented in Figs. S1–S3 in the Supplement.
Overall, the regional SGI shows a gradual long-term decline, indicating an ongoing tendency toward groundwater depletion across the study catchment.
4.2 Water Balance, Extraction Distribution, and Future Scenarios
To get comprehensive information on the water availability, we calculated water balance and regional groundwater extraction pattern. The catchment exhibits a net hydrological water balance of approximately −91.2 mm yr−1, equivalent to a mean deficit of ∼319 Mm3 yr−1 during 1980–2024. From a climatic perspective (precipitation minus potential evapotranspiration), the deficit increases to −210 mm yr−1 (∼735 Mm3 yr−1), highlighting the system's vulnerability to droughts, low river flows, and increasing water demand.
We analysed long-term hydrological data (1980–2024) and observed substantial spatial heterogeneity in the mean water balance across the catchment (Fig. 6a). Negative water balance values dominate the northwestern sub-catchments (H1 and H2), ranging from −154 to nearly −138 mm yr−1, reflecting persistently higher evapotranspiration relative to precipitation. These areas correspond to zones of intensive groundwater abstraction and lower recharge potential.
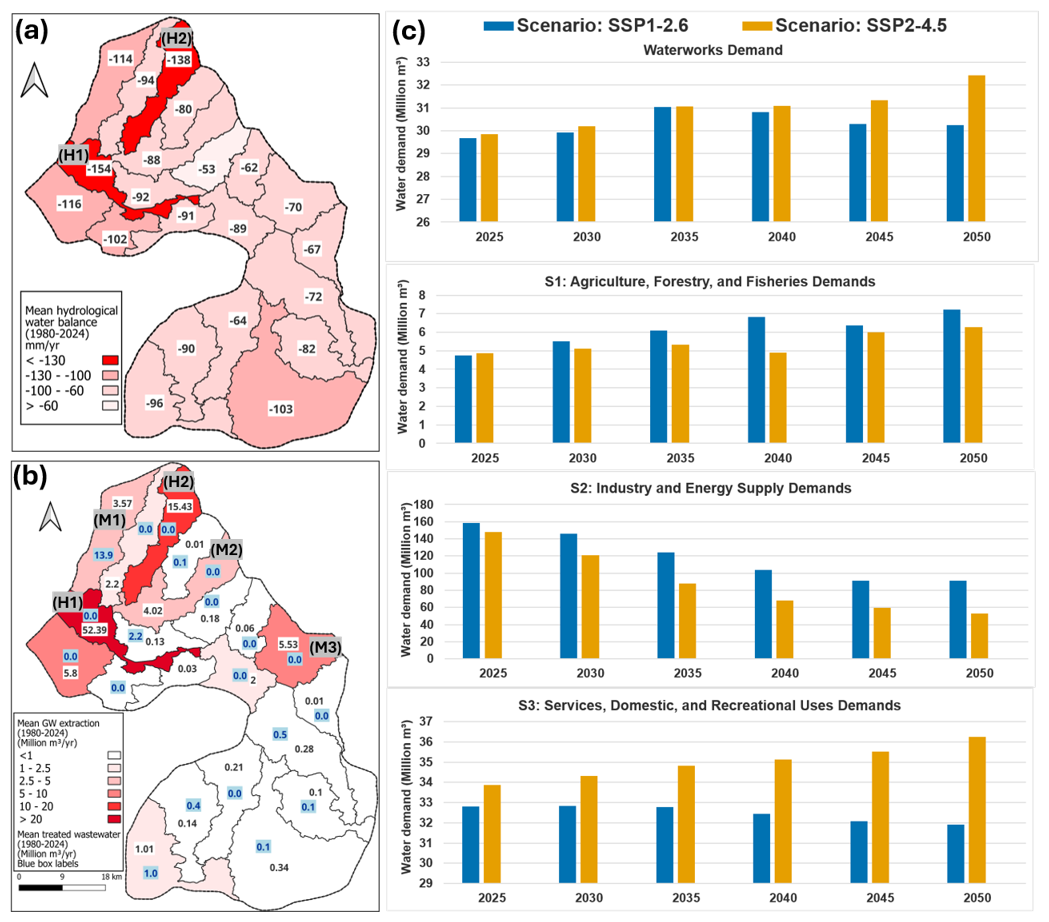
Figure 6(a) Mean hydrological water balance (1980–2024) across the sub-catchments (mm yr−1). (b) Spatial distribution of mean annual groundwater abstraction and treated wastewater volumes across sub-catchments (1980–2024). (c) Future water-demand scenarios (2025–2050) showing total waterworks demand and sectoral demands: S1 – agriculture, forestry, and fisheries; S2 – industry and energy; S3 – services, domestic use, and recreation. Raw data obtained from LfU, PIK, BWB, Adelphi Research, AFS, DVGW, and ZALF. Data were processed and visualized by the authors.
We found that groundwater abstraction is also unevenly distributed across the catchment (1980–2024; Fig. 6b). The highest extraction rates occur in the northwestern sub-catchments, primarily driven by water demand from the Berlin metropolitan area. This spatial pattern highlights the direct link between major demand centres and observed hydrological deficits.
We observed that treated wastewater volumes exceed total groundwater extraction in some northwestern sub-catchments (Fig. 6b). For instance, in the uppermost northwestern sub-catchment (M1), treated wastewater amounts to 13.9 Mm3, compared to 3.57 Mm3 of groundwater extraction. However, in most areas, treated wastewater remains relatively low, ranging from 0.1 to 1.01 Mm3 yr−1 per sub-catchment.
We analysed projected water-demand scenarios for 2025–2050 and found a moderate but steady increase in total waterworks demand across the twoclimate scenarios considered (Fig. 6c). Under SSP1-2.6, total waterworks demand fluctuates around 30–31 Mm3, while the most-likely SSP2-4.5 scenario shows a modest increase from ∼30 to ∼32 Mm3 by 2050. This spread (∼1–2 Mm3) defines the stress-test range for storage and recovery capacity.
Sectoral patterns exhibit contrasting dynamics. S1 (Agriculture, Forestry, and Fisheries) shows a consistent upward trend under both scenarios, reflecting higher irrigation and landscape water demands. S2 (Industry and Energy) declines markedly due to improvements in water-use efficiency and structural transitions toward less water-intensive industries. The decline is most pronounced under SSP2-4.5 (from ∼150 to ∼55 Mm). Despite the decrease, S2 remains the dominant contributor to total demand. S3 (Services, Domestic, and Recreational Uses) diverges across scenarios: slightly decreasing under SSP1-2.6 (∼33 to 31 Mm3) and gradually increasing under SSP2-4.5 (∼34 to 37 Mm3), with pronounced seasonal peaks during summer months. When combined with the expected reduction in in surface water availability due to the planned coal phase-out by 2038 (removing ∼126 Mm3 yr−1 of mine-water discharges that previously augmented river flow), we project that the catchment will face a significant future water deficit.
4.3 ASTR suitability
We developed an ASTR suitability map using a GIS-based MCDA (Fig. 7). The analysis integrated critical factors into criteria layers, including distance to source water (rivers and streams), distance to existing extraction wells, land cover, depth to the target Aquifer 2, Aquifer 2 storativity and hydraulic conductivity (Fig. 7a). Suitability scores were calculated and classified into five classes: very low (0–20), low (21–40), moderate (41–60), suitable (61–80), and highly suitable (81–100).
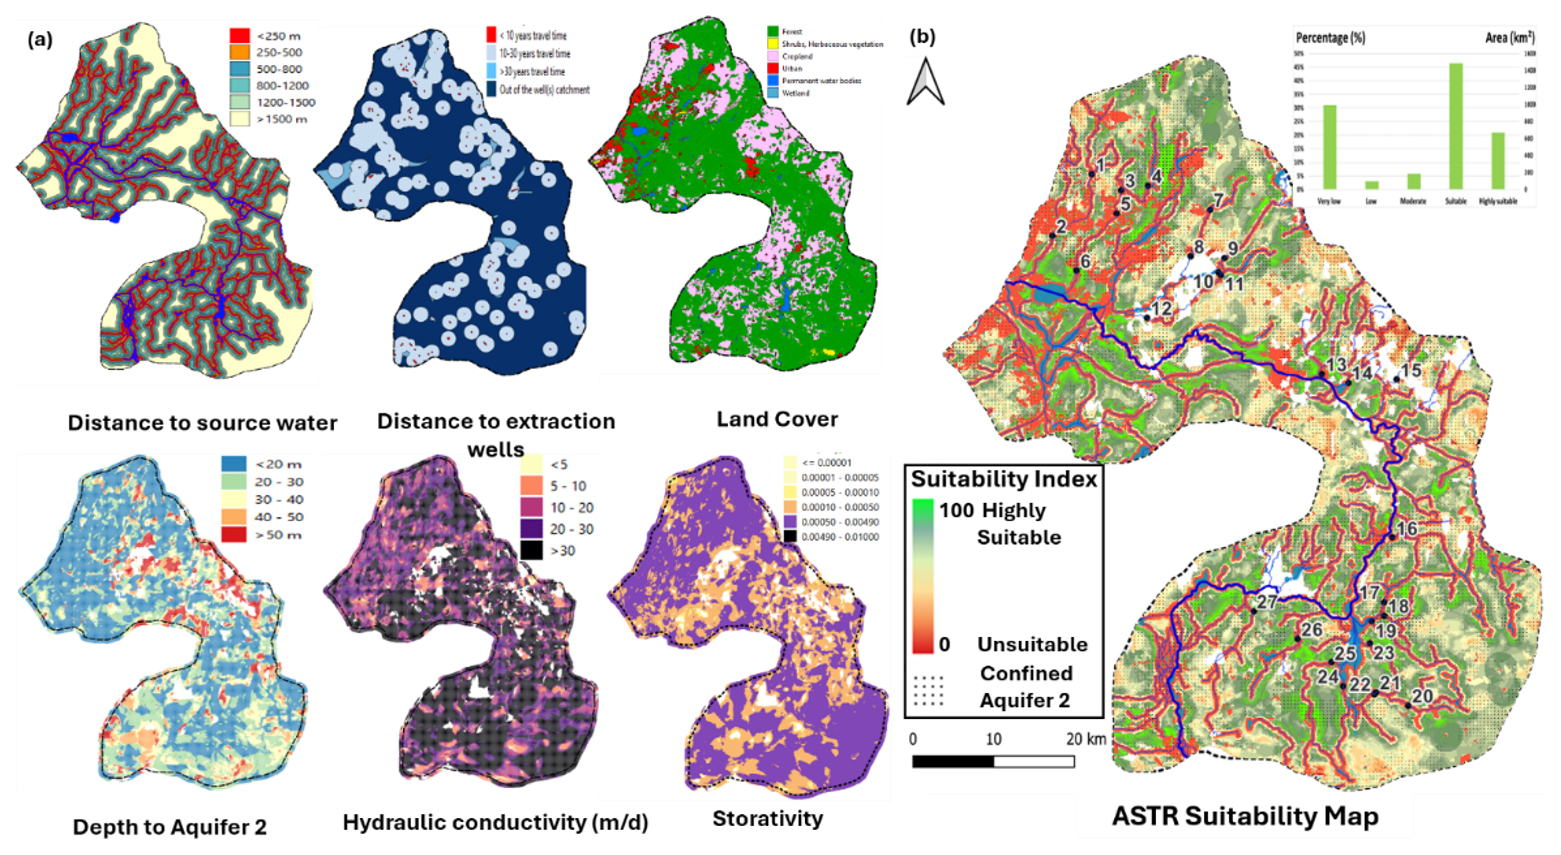
Figure 7ASTR suitability assessment. (a) Criteria layers used in the GIS-based MCDA. (b) Integrated ASTR suitability map with scores ranging from 0 (unsuitable) to 100 (highly suitable) with a bar chart of the percentage and total area by class.
The GIS-MCDA revealed that a significant fraction of the area is suitable for ASTR implementation (Fig. 7b). Under the equal-weight scenario (S1) and after masking exclusion zones, 19.5 % of the remaining area (670 km2) was classified as highly suitable, and a further 43.3 % (1484 km2) was classified as suitable. An additional 5.5 % (185 km2) was rated as moderately suitable, while 31.7 % (1086 km2) fell into the low to very low suitability categories. This indicates that a combined 62.8 % of the catchment area (2154 km2) is viable for ASTR. Highly suitable zones are spatially concentrated where Aquifer 2 is relatively thick with relatively higher storativity () and horizontal hydraulic conductivity (>30 m d−1), where distances to rivers (500–800 m) and production wells (<10 years travel time), and where land-use conflicts are minimal.
To enhance the practical application of these results, we classified the assessed sub-catchments based on their hydrogeological characteristics and ASTR suitability (Table S2 in the Supplement). Highly Suitable includes sub-catchments 8 and 9, which show excellent hydraulic properties and minimal “no aquifer” areas, making them priority candidates for ASTR implementation. Suitable comprises most sub-catchments (e.g., 2, 3, 6, 7, 10, 13, 14, 16–20) with good overall conditions and MCDA scores of 60 %–70 %, while Moderate to Low Suitability includes areas limited by lower storativity or extensive “no aquifer” zones. This classification supports prioritization of pilot projects in highly and suitable catchments to maximize drought resilience benefits.
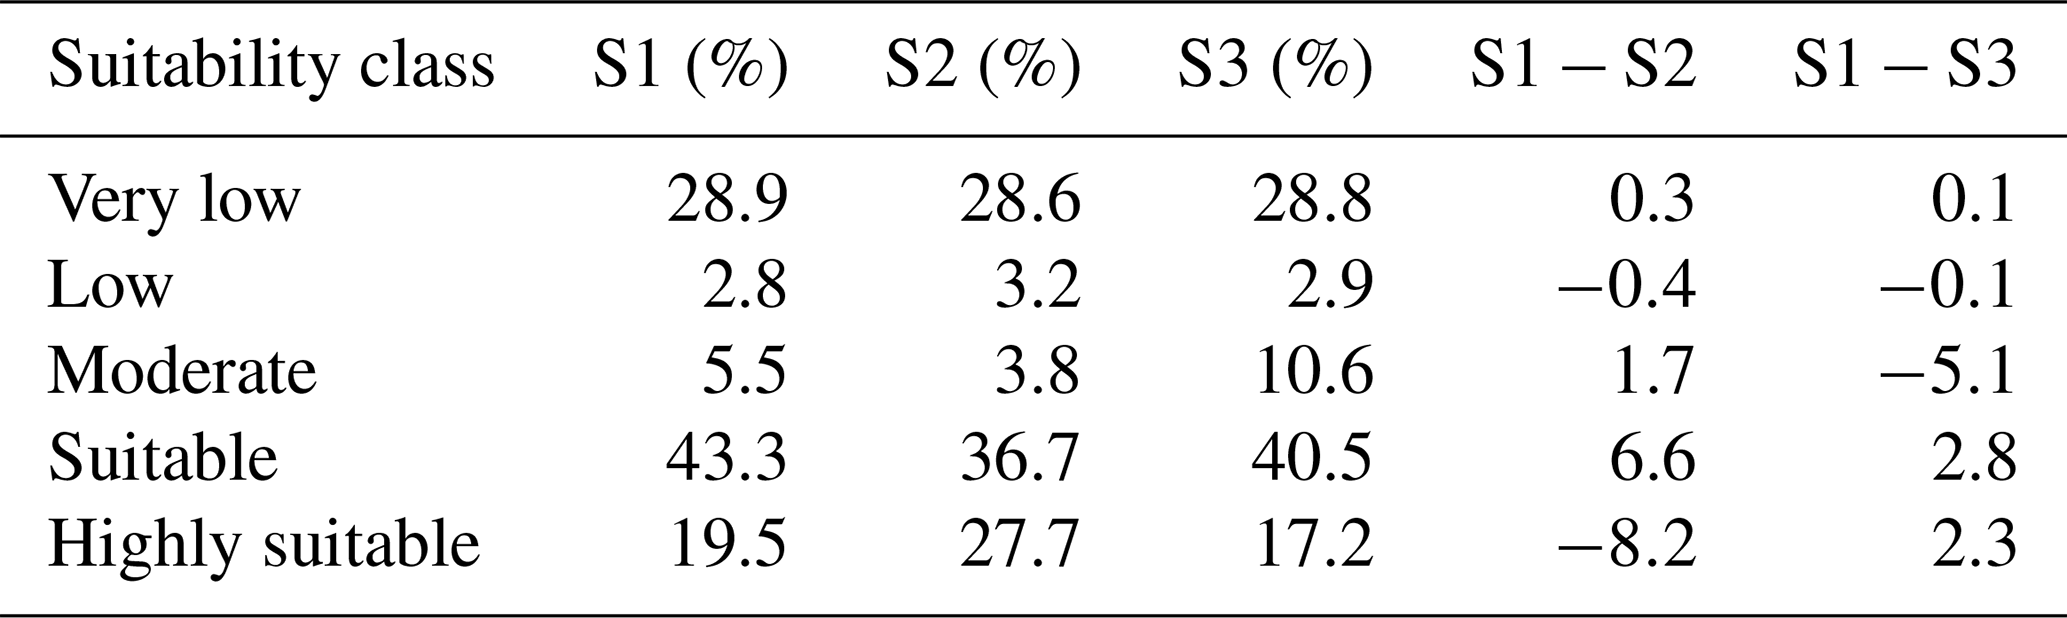
The sensitivity analysis results demonstrate high robustness (Fig. 8; Table 4). The “Very Low” suitability class remained stable at ∼29 % across all scenarios (variation <0.3 %), indicating physical constraints consistently define unsuitable areas. The “Suitable” class showed moderate variation (36.7 %–43.3 %; Δ=6.6 %), while “Highly Suitable” areas varied between 17.2 % (S3) and 27.7 % (S2) (Δ=10.5 %). Despite percentage variations, the spatial distribution of high-suitability zones remained geographically consistent across all scenarios (Fig. 8a–c), confirming that site suitability is primarily controlled by underlying physical characteristics rather than subjective weight assignment.
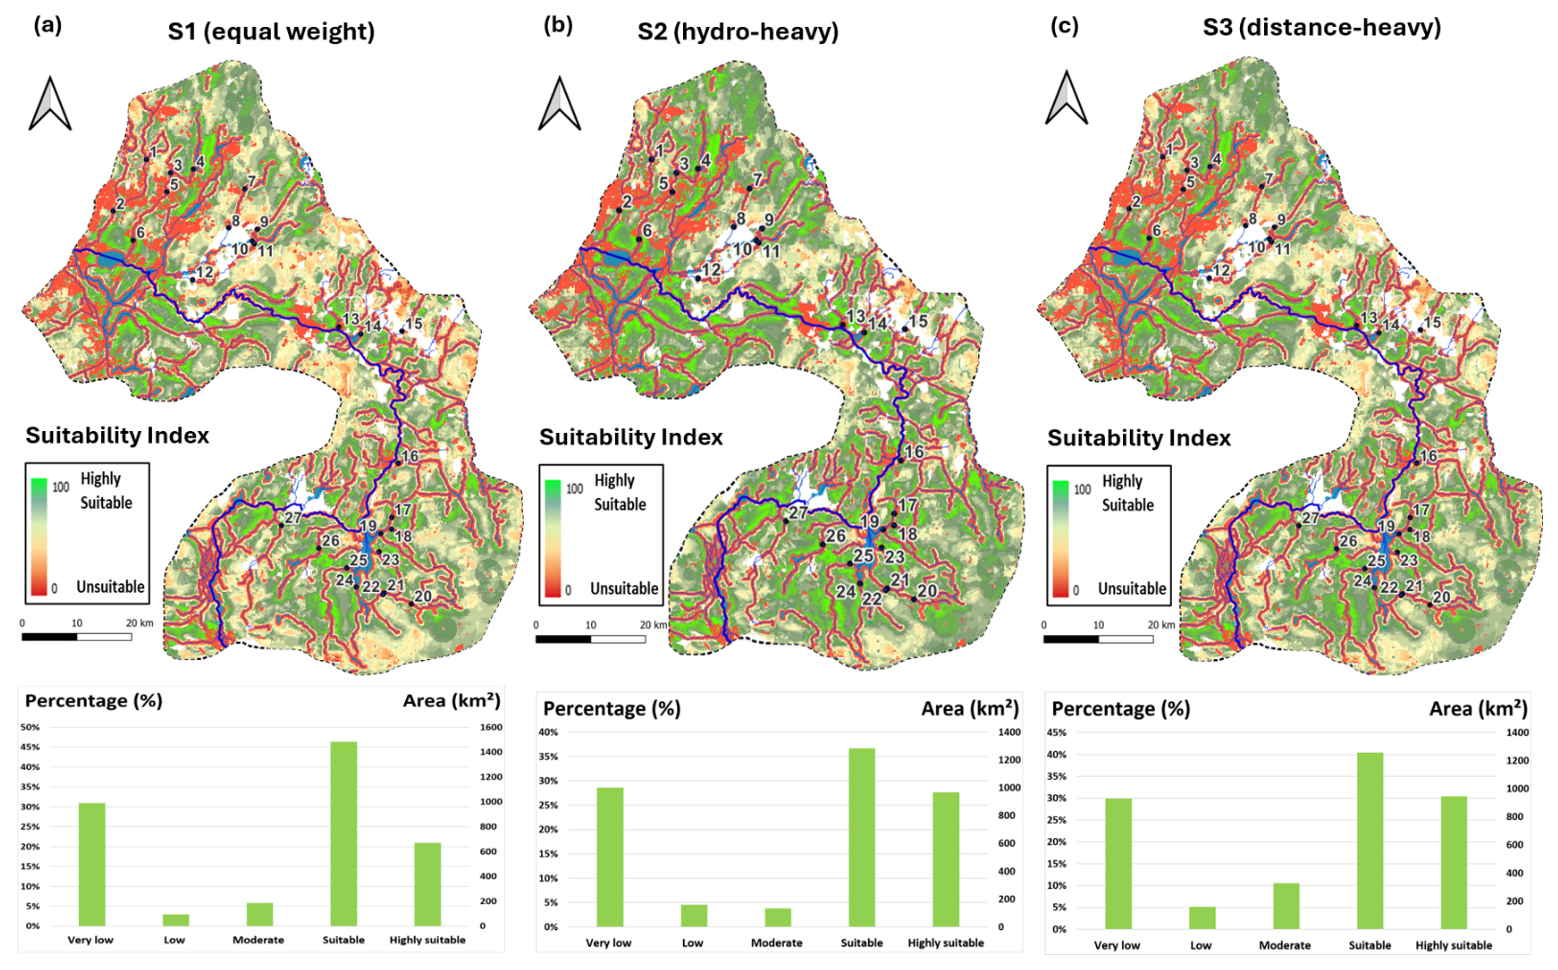
Figure 8Sensitivity analysis of ASTR site suitability under three MCDA weighting scenarios: (a) S1 (equal weight), (b) S2 (hydro-heavy), and (c) S3 (distance-heavy). Bar charts show the percentage and area per suitability class. The consistent spatial distribution of high-suitability zones across scenarios demonstrates the robustness of the MCDA results to criterion weighting. See Tables 2 and 3 for detailed weights and distributions.
Table 4Suitability class distribution across weighting scenarios.
4.4 Surface Water Availability and Economic Potential
Analysis of daily flow series across 27 surface water gauging sites identified recurring “abstraction windows” or water surplus for MAR, revealing a clear upstream-downstream gradient in potential. Hydrographs for representative sites illustrated how Approach 1 enables sustained abstraction during high-flow periods, while Approach 2 limits it to major peaks (Fig. 9). Six representative sites (1, 2, 4, 12, 13, 15) exhibited long, repeatable wet-season windows, whereas low-moderate sites (e.g., 7, 17, 24) offered only short, sporadic peaks that rarely met thresholds. Hydrographs for the remaining gauging sites are provided in Figs. S4 and S5 in the Supplement.
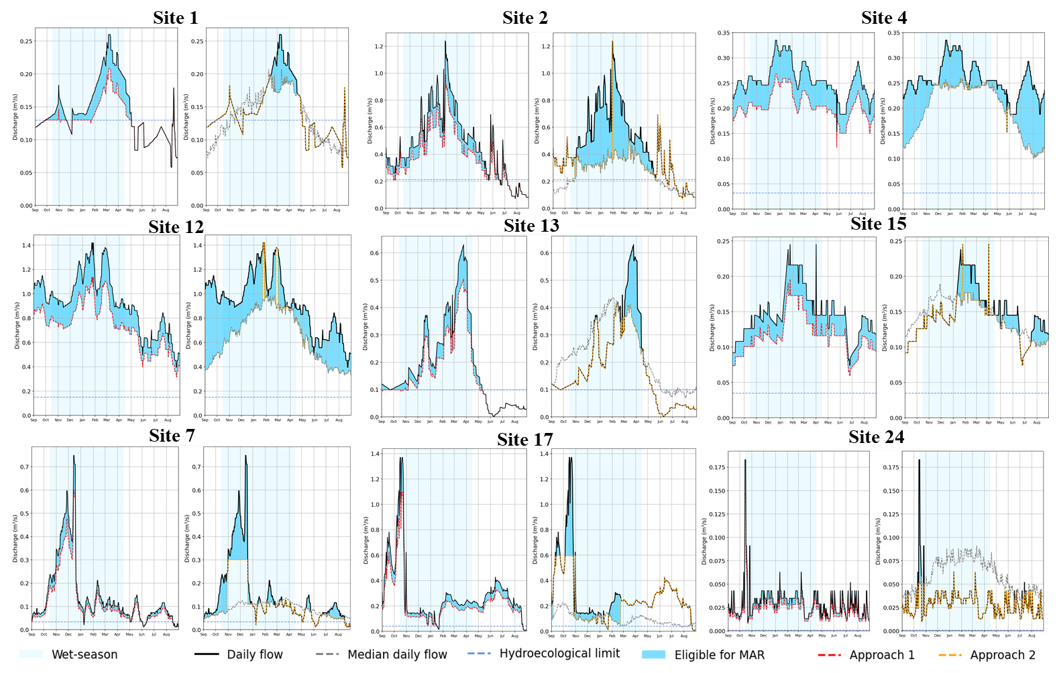
Figure 9Hydrographs with daily flow, ecological thresholds, and MAR-eligible windows (blue shading) at representative sites; dashed red = Approach 1 (20 % rule), dashed orange = Approach 2 (multi-threshold).
We found that the two abstraction approaches revealed a fundamental trade-off between maximizing recharge volume and preserving ecological flows. A comparative analysis of seasonal discharge regimes highlights this operational difference: Approach 1 increases the number and duration of eligible days, while Approach 2 results in a more event-driven capture strategy (Fig. 10).
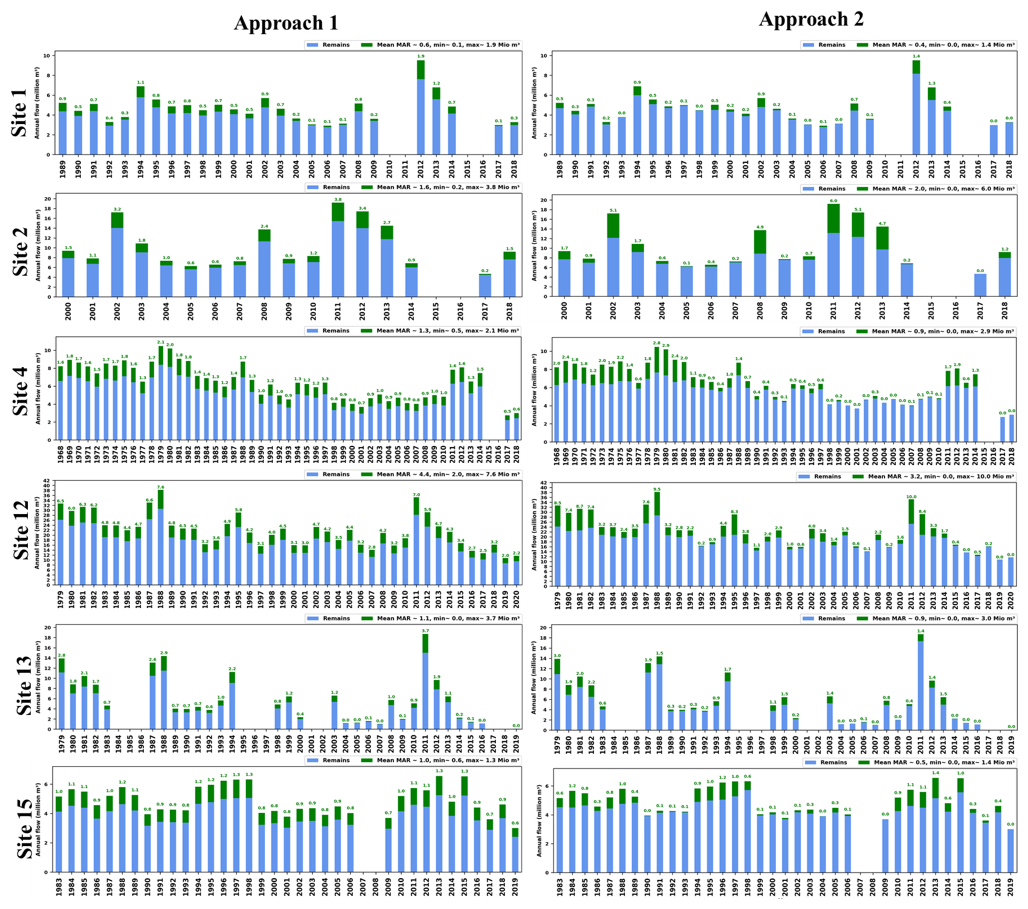
Figure 10Seasonal discharge regimes and MAR eligibility for Sites 1, 2, 4, 12, 13, and 15 under both approaches, illustrating frequent eligibility under Approach 1 versus event-focused eligibility under Approach 2.
Site-specific analysis quantified this potential. At the upstream Site 1 (Fig. 10), the mean annual MAR potential ranges from 0.6 Mm3 (Approach 1) to 0.4 Mm3 (Approach 2), equivalent to only 11 %–17 % of groundwater extraction in the local medium-stressed sub-catchment (M1) and 3 %–4 % of the annual treated wastewater volume. Even in the wettest years, maximum MAR values of 1.9 Mm3 (Approach 1) to 1.4 Mm3 (Approach 2) increases this to 39 %–53 % and 10 %–14 %, respectively.
In contrast, the downstream Site 2 demonstrates significantly higher potential, with mean annual MAR ranging from 1.6 Mm3 (Approach 1) to 1.9 Mm3 (Approach 2). These volumes correspond to 45 %–53 % of local groundwater extraction and 12 %–14 % of the annual treated wastewater volume. During high-flow years, maximum MAR values reach 3.8 Mm3 (Approach 1) to 6.1 Mm3 (Approach 2), equivalent to 106 %–169 % of annual groundwater extraction and 27 %–44 % of treated wastewater volume, indicating the potential to completely offset, or even surpass, local groundwater withdrawals.
At Site 4, mean annual MAR reaches 1.3 Mm3 (maximum 2.8 Mm3) under Approach 1 and 1.1 Mm3 (maximum 3.4 Mm3) under Approach 2. These volumes could support a nearby highly stressed sub-catchment (H2), offsetting 9 % of its annual groundwater extraction under normal conditions and up to 22 % during wet years (Approach 2).
At Site 12, the mean annual MAR is 4.3 Mm3 (maximum 7.64 Mm3) under Approach 1 and 3.2 Mm3 (maximum 9.96 Mm3) under Approach 2. This capacity could support the highly stressed sub-catchment (H1), contributing 6 %–19 % of its annual extraction, or fully meet the needs of a medium-stressed sub-catchment (M2), covering 79 %–248 % of its groundwater demand.
Sites 13 and 15, considered jointly, show strong potential to support the medium-stressed sub-catchment (M3). The mean annual MAR is 2.1 Mm3 (maximum 5 Mm3) under Approach 1 and 1.4 Mm3 (maximum 4.4 Mm3) under Approach 2, representing 37 % and up to 80 % (during wet years) of M3's annual groundwater extraction.
Low to moderate-potential sites (e.g., Sites 7, 17, 24) exhibit severely constrained opportunities, with annual volumes generally remaining below 1.5 Mm3 yr−1 and frequently approaching zero. Results for the remaining gauging sites are provided in Figs. S6–S8 in the Supplement.
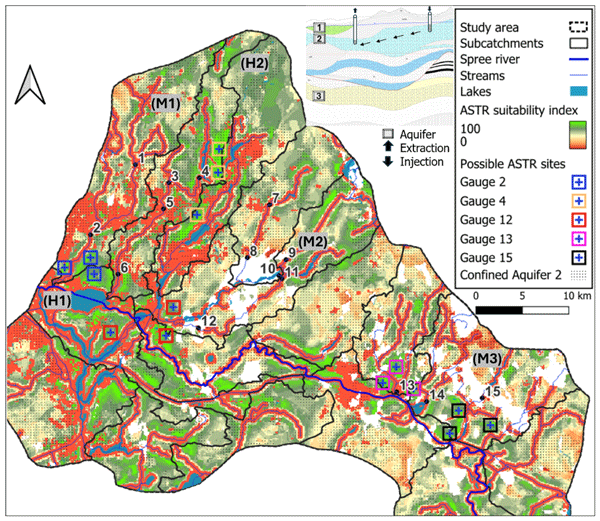
A boxplot analysis across all 27 sites confirmed substantial interannual variability in MAR-available flow (Fig. 11). Approach 1 consistently provides higher median and maximum MAR volumes but exhibits greater variability, making it more productive but less predictable. Approach 2 offers more constrained but potentially more consistent volumes from year to year. The data show that while high-potential downstream sites can yield over 10 Mm3 in wet years, drought years provide little to no surplus across most sites. The severe drought year 2018 showed reductions of 40 %–100 % across sites and thresholds (Table S3 in the Supplement), highlighting strong climate-driven variability in source-water reliability. However, ASTR is primarily designed to capture surplus flood flows during wet periods for storage and later recovery, rather than depending on drought-period surface-water availability. This underscores that the reliability of MAR is a function of both hydrological variability and the stringency of management thresholds. The spatial integration of these findings is shown in Fig. 12, which maps streamflow-driven ASTR suitability, highlighting where high-potential surplus streamflow (e.g., at Gauges 2, 4, 12, 13, 15) aligns with stressed sub-catchments (H1, H2, M1–M3). The assessment focuses on direct injection and recovery within confined Aquifer 2, as illustrated in the schematic diagram in Fig. 12.
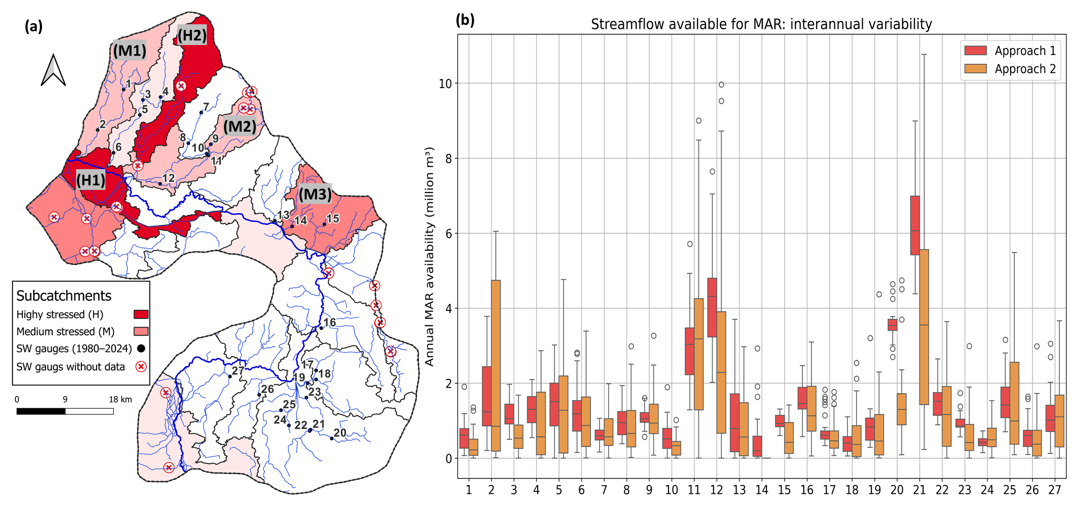
Figure 11Interannual variability of MAR-eligible streamflow across 27 sites shown as boxplots for Approach 1 (red) and Approach 2 (orange), highlighting differences in central tendency and spread.
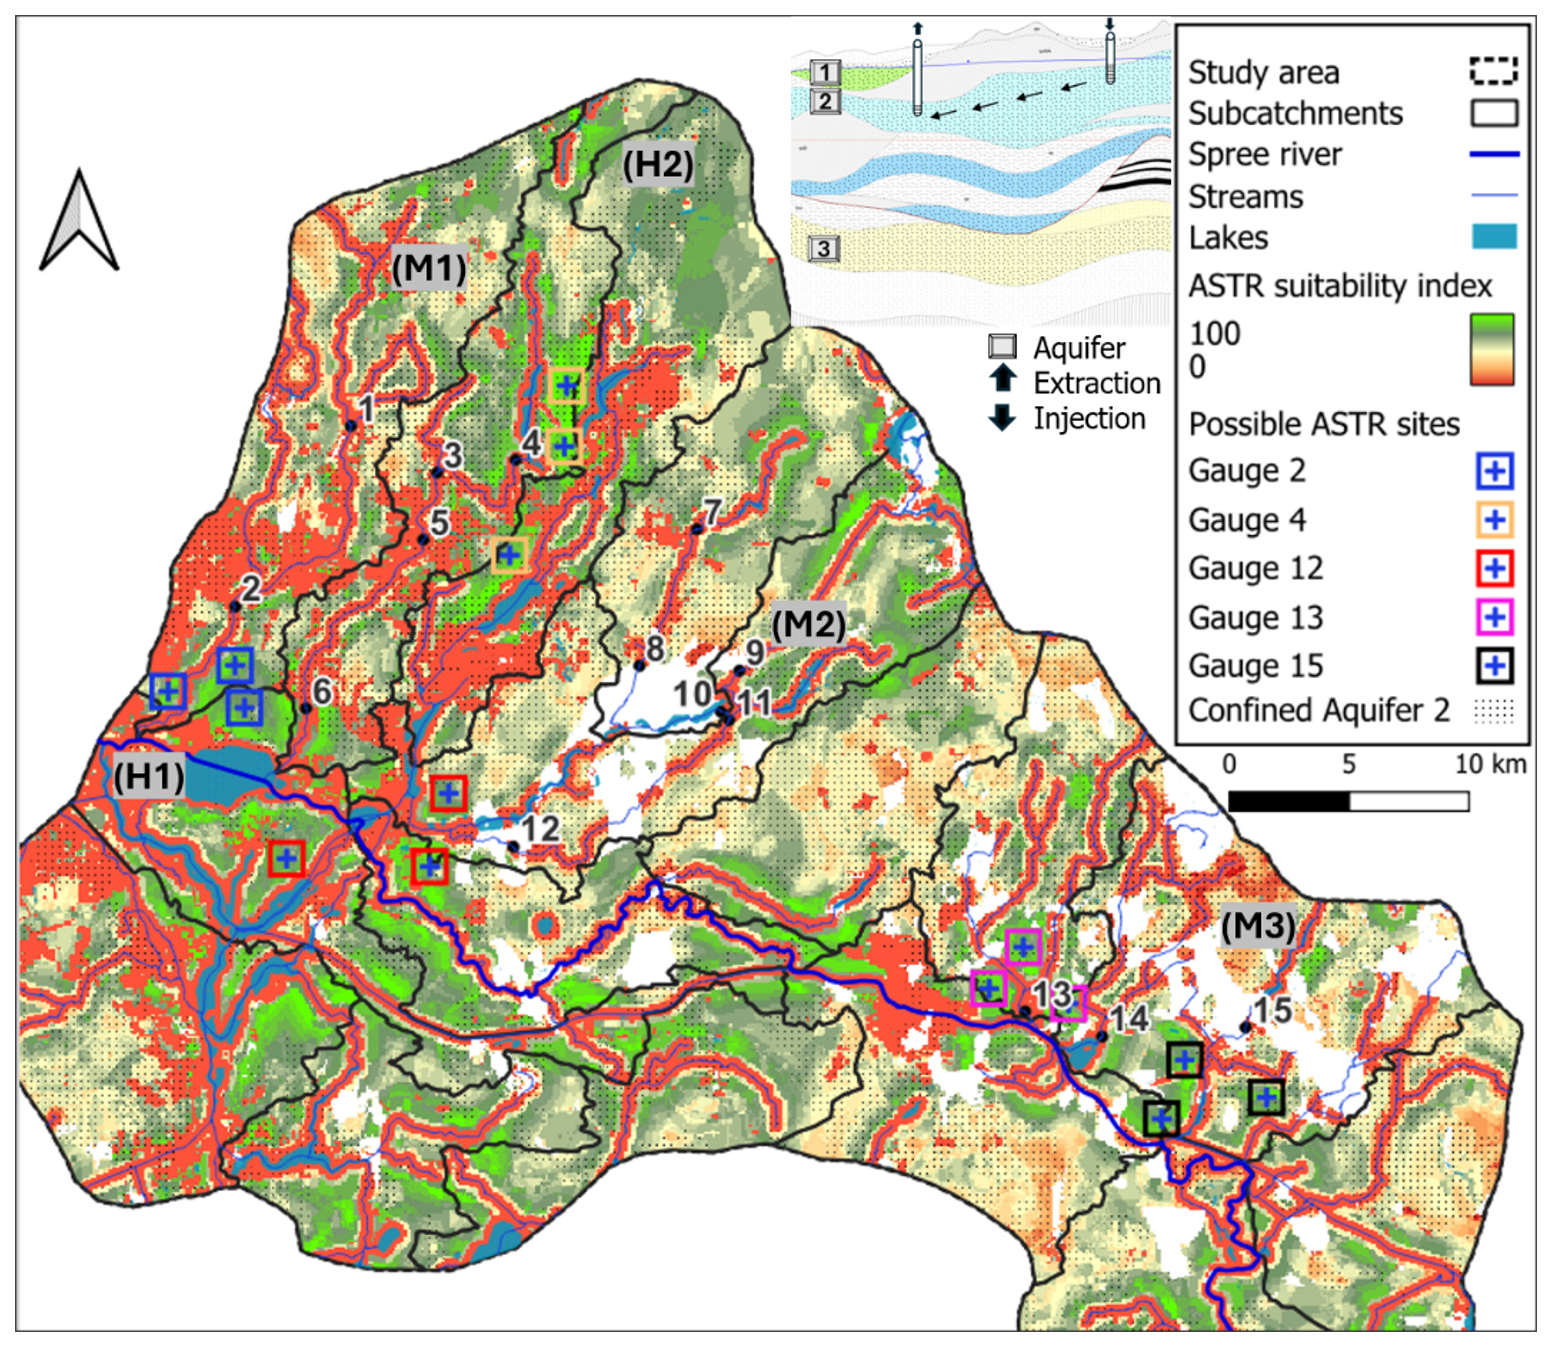
Figure 12Streamflow-driven ASTR suitability across the catchment, with candidate recharge sites at Gauge 2 (blue), Gauge 4 (orange), Gauge 12 (red), Gauge 13 (pink), and Gauge 15 (dark blue); stressed sub-catchments (H1, H2, M1–M3) are labeled, highlighting where monitored surplus streamflow aligns with favorable hydrogeology for ASTR. The inset schematic diagram illustrates the conceptual ASTR process involving direct injection and recovery in the confined Aquifer 2.
To estimate the catchment-scale potential while avoiding double-counting of stream flows, we selected 16 key sites to represent the cumulative, non-overlapping MAR volume in Table S4 in the Supplement. We calculated the total mean annual divertible volume to be 23 Mm3 under Approach 1 and 18.2 Mm3 under the more restrictive Approach 2. During high-flow conditions, these volumes rise significantly to 49.8 and 61.9 Mm3, respectively, highlighting the substantial role of infrequent flood events in recharge strategies.
When we contextualized these volumes using the literature-derived cost benchmark (EUR 0.30–0.60 m−3), the annual investment required to manage the mean annual volumes is estimated at EUR 6.9–13.8 million (Approach 1) and EUR 5.5–10.9 million (Approach 2). Compared to the cost of producing an equivalent volume of new drinking water (∼ EUR 1.80 m−3), this represents potential savings of EUR 27.5–34.5 million per year for Approach 1, and EUR 21.6–27.2 million for Approach 2 at the mean annual volume. During high-flow years, these potential savings could increase substantially, reaching up to EUR 82.7 million (Approach 1) and EUR 105.5 million (Approach 2). This significant cost differential underscores the value of ASTR as a cost-competitive drought resilience strategy.
Finally, we note that the 27 gauges analysed represent only about 33 % of the surface-water network. While this monitoring coverage provides a robust basis for the catchment-scale assessment, the remaining 67 % of the network was not included in this analysis. Future research should investigate the hydrological characteristics, ecological constraints, and ASTR suitability of these unmonitored tributaries to verify the full extent of the regional MAR potential.
This study demonstrates that a scalable framework integrating drought indices, GIS-MCDA, and flow-threshold analysis can effectively evaluate ASTR feasibility in confined multi-layer aquifers. The framework identifies substantial opportunities for ASTR as a drought-resilience strategy while accounting for hydrogeological suitability, surface-water availability, and ecological flow constraints.
The strong SPEI-12–SGI correlation at zero lag should not be interpreted as instantaneous recharge. Because SPEI-12 integrates the climatic water balance over the preceding 12 months, the zero-lag correlation indicates that groundwater anomalies co-vary with annual-scale climatic conditions. The additional multi-timescale analysis showed that correlations were very weak for SPEI-1 and SPEI-3, increased for SPEI-6, and were strongest for SPEI-12 (Table S1), indicating that the confined multi-layer aquifer primarily reflects accumulated climatic anomalies rather than individual monthly anomalies. In this confined system, SGI represents piezometric head variations that may respond to pressure propagation and changing boundary conditions without requiring immediate movement of newly recharged water. Thus, the response timescale is not resolved at the SPEI-12 scale. Combining SPEI and SGI can nevertheless support climate-informed ASTR planning by providing complementary information on hydroclimatic and groundwater conditions (Vicente-Serrano et al., 2010; Bloomfield and Marchant, 2013; Van Loon, 2015).
Contrary to the perception that ASTR is only feasible in highly specific hydrogeological settings (Dillon, 2015; Page et al., 2018), our GIS-MCDA revealed that 62.8 % of the catchment area (2154 km2) is viable ASTR under the equal-weight scenario. This potential, identified through systematic criteria like Aquifer 2 storativity and hydraulic conductivity, depth, proximity to sources water and extraction wells, and land-use conditions. The sensitivity analysis further showed that the spatial distribution of high-suitability zones remained broadly consistent across weighting scenarios, indicating that priority areas are primarily controlled by physical characteristics rather than weighting differences. These criteria are applicable to many sedimentary aquifer systems, supporting the transferability of the framework for regional ASTR screening.
The sub-catchment classification further supports prioritization of future pilot sites. Highly suitable sub-catchments, including 8 and 9, combine favourable hydraulic properties with limited areas lacking Aquifer 2, while suitable sub-catchments provide broader opportunities under generally favourable conditions. This classification helps identify areas where hydrogeological suitability and groundwater stress can be jointly considered when prioritizing future ASTR investigations and pilot projects.
The contrast between the two water-availability approaches highlights a central management trade-off between maximizing recharge volume and preserving ecological flows. High-yield downstream sites (e.g., Sites 2 and 12) provide substantial recharge volumes, capable of offsetting over 100 % of local abstraction during wet years. This upstream-downstream gradient is critical for prioritizing investments. An adaptive management regime that applies stricter thresholds during droughts and leveraging flexible rules during wet periods, could balance water security and ecosystem protection (Yarnell et al., 2020). However, surface-water availability was assessed using historical flow regimes, while future demand projections incorporated SSP1-2.6 and SSP2-4.5; projected changes in evapotranspiration and precipitation variability may therefore further constrain future recharge opportunities.
The economic analysis, contextualized by literature benchmarks, indicates that ASTR could be economically attractive relative to conventional drinking-water production. Based on recharge costs of EUR 0.30–0.60 m−3, the potential savings of EUR 21–34 million annually at the catchment scale under mean conditions, rising to EUR 82–105 million in wet years, demonstrate that ASTR is not just technically feasible but financially prudent, compared with approximately EUR 1.80 m−3 for drinking-water production. The cost of recharging water (EUR 0.30–0.60 m−3) is substantially lower than producing new drinking water (EUR 1.80 m−3). These estimates should be interpreted as screening-level comparisons because site-specific capital, rehabilitation, and operational costs may vary substantially.
While this study quantifies significant potential, translating these results into operational reality requires further site-specific investigation. Transient groundwater-flow modelling could evaluate hydraulic responses, storage efficiency, recovery performance, and potential impacts on neighbouring users, while field investigations are needed to assess vertical hydraulic conductivity, leakage, groundwater age, and geochemical compatibility. In addition, the analysis covered only 33 % of the surface water network, underscoring the need for expanded hydrological monitoring. Pilot-scale projects are needed to validate injection rates, assess geochemical interactions, and refine cost estimates under real-world conditions. Finally, successful implementation hinges on developing robust governance frameworks that define water rights, cost-sharing mechanisms, and adaptive management protocols to ensure environmental and social sustainability.
This study presents a scalable framework to assess the feasibility of Aquifer Storage, Transfer, and Recovery (ASTR) in confined multi-layer aquifers. Four central findings emerge.
First, hydroclimatic and hydrogeologic indicators (SPEI-12 and SGI) show that groundwater-level anomalies in the confined multi-layer system are strongly coupled to annual-scale climatic water-balance anomalies, although the actual response time cannot be resolved from the SPEI-12 zero-lag relationship alone.
Second, GIS-MCDA mapping highlights extensive areas suitable for ASTR, underscoring the largely untapped potential of confined aquifer systems in drought-mitigation planning.
Third, ecological flow-threshold analyses show that available surface-water volumes vary with hydrological conditions; although restrictive thresholds limit annual yields, even conservative scenarios provide substantial recharge opportunities. While mean annual estimates indicate significant potential, drought-year constraints highlight the importance of capturing wet-period surplus, which is central to ASTR implementation.
Fourth, the economic evaluation suggests that ASTR can deliver cost-competitive performance while helping offset projected water-supply deficits. Collectively, the integrated assessment of drought dynamics, spatial suitability, and water availability establishes a transferable blueprint for similar sedimentary basins across Europe.
Realizing this potential will require pilot-scale trials, enhanced hydrological monitoring, and site-specific hydraulic and hydrogeological assessment, together with governance arrangements that support long-term managed recharge. Implementing such a proactive approach can strengthen groundwater resilience, stabilize regional water supplies, and improve preparedness for climatic variability. Overall, the framework developed here offers a solid foundation for strategic planning and sustainable deployment of ASTR in water-stressed regions.
The data supporting the findings of this study are available from the corresponding author upon reasonable request.
The supplement related to this article is available online at https://doi.org/10.5194/nhess-26-4641-2026-supplement.
Abdelrahman Ahmed Ali Abdelrahman: Conceptualization, Data Analysis, Methodology, Investigation, Data Curation, Visualization, Writing (original draft, review and editing). Hagen Koch: Methodology, Review, Writing (review and editing). Mobarok Hossain: Methodology, Investigation, Writing (review and editing). Ronjon Heim: Methodology, Investigation, Writing (review and editing). Clara Hauke: Methodology, Investigation, Writing (review and editing). Irina Engelhardt: Conceptualization, Data Curation, Methodology, Investigation, Supervision, Funding acquisition, Writing (review and editing).
The contact author has declared that none of the authors has any competing interests.
Publisher's note: Copernicus Publications remains neutral with regard to jurisdictional claims made in the text, published maps, institutional affiliations, or any other geographical representation in this paper. The authors bear the ultimate responsibility for providing appropriate place names. Views expressed in the text are those of the authors and do not necessarily reflect the views of the publisher.
This work was conducted within the framework of the SpreewasserN project (https://www.tu.berlin/en/hydrogeologie/research/bmbf-spreewassern/adaptation-to-extreme-water-events, last access: 27 September 2026), funded by the German Federal Ministry of Education and Research (BMBF). The first author is supported by a scholarship from the Ministry of Higher Education and Scientific Research of Egypt. The authors gratefully acknowledge the constructive feedback provided by Dr. Ata Joodavi and Dr. Margarita Saft, as well as the ongoing support and collaboration from Berliner Wasserbetriebe (BWB) and Wasserverband Strausberg-Erkner (WSE).
This research has been supported by the Bundesministerium für Forschung, Technologie und Raumfahrt (grant no. DKKV-the WAX collection).
The publication of this article was funded by the Open Access Publication Fund of TU Berlin.
This paper was edited by Brunella Bonaccorso and reviewed by Iolanda Borzì and two anonymous referees.
Abdelrahman, A. A. A., Cominola, A., Guadagnini, A., Bussert, R., and Engelhardt, I.: Benchmarking traditional interpolation and machine learning methods for 3D hydrogeological modeling in complex multi-aquifer systems, J. Hydrol.-Reg. Stud., 103837, https://doi.org/10.1016/j.ejrh.2026.103837, 2026.
Abdo, H. G., Vishwakarma, D. K., Alsafadi, K., Bindajam, A. A., Mallick, J., Mallick, S. K., Arun Kumar, K. C., Albanai, J. A., Kuriqi, A., and Hysa, A.: GIS-based multi-criteria decision making for delineation of potential groundwater recharge zones for sustainable resource management in the Eastern Mediterranean: A case study, Applied Water Science, 14, 160, https://doi.org/10.1007/s13201-024-02217-z, 2024.
Alley, W. M., Dillon, P., and Zheng, Y.: Overview and governance of managed aquifer recharge, IAH Special Publication on MAR, IAH Commission on Managed Aquifer Recharge, https://recharge.iah.org/files/2022/06/MAR-overview-and-governance-IAH-Special-Publication-18June2022.pdf (last access: 27 September 2026), 2022.
Barua, S., Cartwright, I., Dresel, P. E., and Daly, E.: Using multiple methods to investigate the effects of land-use changes on groundwater recharge in a semi-arid area, Hydrol. Earth Syst. Sci., 25, 89–104, https://doi.org/10.5194/hess-25-89-2021, 2021.
Berlin Water Utility (BWB): Our tariffs for drinking water and drainage, https://languages.bwb.de/en/327.php (last access: 27 September 2026), 2019.
Berlin Water Utility (BWB): Der Durst der Region wächst stark – Wasserversorger aus Berlin und Brandenburg mit gemeinsamer Strategie, https://www.bwb.de/de/pressemitteilungen-2020_25586.php (last access: 27 September 2026), 2020.
Berlin Water Utility (BWB): Jahresrückblick 2024: Jeder Tropfen zählt, https://www.bwb.de/de/jahresrueckblick-2024.php (last access: 27 September 2026), 2024.
Bloomfield, J. P. and Marchant, B. P.: Analysis of groundwater drought building on the standardised precipitation index approach, Hydrol. Earth Syst. Sci., 17, 4769–4787, https://doi.org/10.5194/hess-17-4769-2013, 2013.
Bonilla, J., Blank, C., Roidt, M., Schneider, L., and Stefan, C.: Application of a GIS multi-criteria decision analysis for the identification of intrinsically suitable sites in Costa Rica for managed aquifer recharge through spreading methods, Water-Sui, 8, 391, https://doi.org/10.3390/w8090391, 2016.
Brakkee, E., van Huijgevoort, M. H. J., and Bartholomeus, R. P.: Improved understanding of regional groundwater drought development through time series modelling: the 2018–2019 drought in the Netherlands, Hydrol. Earth Syst. Sci., 26, 551–569, https://doi.org/10.5194/hess-26-551-2022, 2022.
Brown, C., Weiss, R., Verrastro, R., and Schubert, J.: Development of an aquifer storage and recovery (ASR) site selection suitability index in support of the Comprehensive Everglades Restoration Project, J. Environ. Hydrol., 13, 1–13, 2005.
Bundesanstalt für Geowissenschaften und Rohstoffe (BGR): Groundwater in Germany, Hannover, https://www.bgr.bund.de/EN/Themen/Grundwasser/Deutschland/grundwasser_deutschland_node.html (last access: 27 September 2026), 2023.
California Environmental Flows Working Group (CEFWG): California Environmental Flows Framework Version 1.0, California Water Quality Monitoring Council Technical Report, https://ceff.ucdavis.edu/sites/g/files/dgvnsk5566/files/media/documents/CEFF Technical Report Ver 1.0 Mar_31_2021_DRAFT_FINAL for web.pdf (last access: 27 September 2026), 2021.
Deutscher Wetterdienst (DWD): Climate Data Center (CDC): Gridded precipitation data (1991–2020), https://opendata.dwd.de/climate_environment/CDC (last access: 27 September 2026), 2024.
Dillon, P.: Future management of aquifer recharge, Hydrogeol. J., 23, 1121–1124, https://doi.org/10.1007/s10040-015-1253-2, 2015.
Dillon, P., Stuyfzand, P., Grischek, T., Lluria, M., Pyne, R. D. G., Tredoux, G., Varma, M. R. R., Wang, W., and Wiese, B.: Sixty years of global progress in managed aquifer recharge, Hydrogeol. J., 27, 1–30, https://doi.org/10.1007/s10040-018-1841-z, 2019.
European Environment Agency (EEA): Water resources across Europe – confronting water stress, EEA Report No. 12/2021, Publications Office of the European Union, Luxembourg, https://doi.org/10.2800/359938, 2021.
European Environment Agency (EEA)/Copernicus: CORINE Land Cover 2018 (100 m, vector and raster), Copernicus Land Monitoring Service, https://doi.org/10.2909/71c95a07-e296-44fc-b22b-415f42acfdf0, 2019.
Ferencz, S. B., Mangel, A., and Day-Lewis, F.: Managed aquifer recharge as a strategy to redistribute excess surface flow to baseflow in snowmelt hydrologic regimes, Front. Water, 6, 1375523, https://doi.org/10.3389/frwa.2024.1375523, 2024.
Food and Agriculture Organization of the United Nations (FAO): Management of gypsiferous soils, FAO Soils Bulletin No. 62, Rome, https://www.fao.org/4/x5869e/x5869e04.htm (last access: 27 September 2026), 1988.
Francke, T. and Heistermann, M.: Groundwater recharge in Brandenburg is declining – but why?, Nat. Hazards Earth Syst. Sci., 25, 2783–2802, https://doi.org/10.5194/nhess-25-2783-2025, 2025.
German Environment Agency (UBA): Spree faces increased water shortage after coal phase-out, https://www.umweltbundesamt.de/en/press/pressinformation/spree-faces-increased-water-shortage-after-coal (last access: 27 September 2026), 2023.
German Environment Agency (UBA): Regionale Klimafolgen in Brandenburg, https://www.umweltbundesamt.de/themen/klima-energie/klimafolgen-anpassung/folgen-des-klimawandels/klimafolgen-deutschland/regionale-klimafolgen-in-brandenburg (last access: 27 September 2026), 2025a.
German Environment Agency (UBA): Trockenheit in Deutschland – Fragen und Antworten, https://www.umweltbundesamt.de/themen/wasser/extremereignisseklimawandel/trockenheit-in-deutschland-fragen-antworten (last access: 27 September 2026), 2025b.
Gibson, M. T., Campana, M. E., and Nazy, D.: Estimating Aquifer Storage and Recovery (ASR) Regional and Local Suitability: A Case Study in Washington State, USA, Hydrology, 5, 7, https://doi.org/10.3390/hydrology5010007, 2018.
Harbaugh, A. W.: MODFLOW-2005, the U. S. Geological Survey modular ground-water model – The Ground-Water Flow Process, U. S. Geological Survey Techniques and Methods 6-A16, https://pubs.usgs.gov/tm/2005/tm6A16/ (last access: 27 September 2026), 2005.
Hellwig, J., de Graaf, I. E. M., Weiler, M., and Stahl, K.: Large-scale assessment of delayed groundwater responses to drought, Water Resour. Res., 56, e2019WR025441, https://doi.org/10.1029/2019WR025441, 2020.
Henao Casas, J. D., Fernández Escalante, E., and Ayuga, F.: Alleviating drought and water scarcity in the Mediterranean region through managed aquifer recharge, Hydrogeol. J., 30, 1685–1699, https://doi.org/10.1007/s10040-022-02513-5, 2022.
Hersbach, H., Bell, B., Berrisford, P., Hirahara, S., Horányi, A., Muñoz-Sabater, J., Nicolas, J., Peubey, C., Radu, R., Schepers, D., Simmons, A., Soci, C., Abdalla, S., Abellan, X., Balsamo, G., Bechtold, P., Biavati, G., Bidlot, J., Bonavita, M., De Chiara, G., Dahlgren, P., Dee, D., Diamantakis, M., Dragani, R., Flemming, J., Forbes, R., Fuentes, M., Geer, A., Haimberger, L., Healy, S., Hogan, R. J., Hólm, E., Janisková, M., Keeley, S., Laloyaux, P., Lopez, P., Lupu, C., Radnoti, G., de Rosnay, P., Rozum, I., Vamborg, F., Villaume, S., and Thépaut, J.-N.: The ERA5 global reanalysis, Q. J. Roy. Meteor. Soc., 146, 1999–2049, https://doi.org/10.1002/qj.3803, 2020.
IGRAC: Global Managed Aquifer Recharge Inventory, International Groundwater Resources Assessment Centre, https://un-igrac.org/our-work/activities/global-inventory-of-managed-aquifer-recharge-schemes/ (last access: 27 September 2026), 2025.
Industrie- und Handelskammer Ostbrandenburg (IHK Ostbrandenburg): IHKs: Länderübergreifende Strukturen zentral für zukunftsorientiertes Wassermanagement, https://www.ihk.de/ostbrandenburg/zielgruppeneinstieg-unternehmer/umwelt/wasser-5857192 (last access: 27 September 2026), 2023.
Khalil, K., Khan, Q., and Mohamed, M.: Selection criteria of best sites for aquifer storage and recovery in the Eastern District of Abu Dhabi, United Arab Emirates, Groundwater for Sustainable Development, 18, 100771, https://doi.org/10.1016/j.gsd.2022.100771, 2022.
Kocis, T. N. and Dahlke, H. E.: Availability of high-magnitude streamflow for groundwater banking in the Central Valley, California, Environ. Res. Lett., 12, 084009, https://doi.org/10.1088/1748-9326/aa7b1b, 2017.
Kosow, H., Brauner, S., Brumme, A., Hauser, W., Hölzlberger, F., Moschner, J., Rübbelke, D., Vögele, S., and Weimer-Jehle, W.: Uncharted water conflicts ahead: mapping the scenario space for Germany in the year 2050, Front. Water, 6, 1492336, https://doi.org/10.3389/frwa.2024.1492336, 2024.
Kreienkamp, F., Früh, B., Kotlarski, S., Linke, C., Olefs, M., Schauser, I., Schinko, T., Schwierz, C., Walter, A., and Zimmer, M.: Empfehlungen für die Charakterisierung ausgewählter Klimaszenarien, Umweltbundesamt, https://pure.iiasa.ac.at/17944 (last access: 27 September 2026), 2022.
Krysanova, V., Wechsung, F., Arnold, J., Srinivasan, R., and Williams, J.: SWIM (Soil and Water Integrated Model): User manual, PIK Report No. 69, Potsdam Institute for Climate Impact Research, https://www.pik-potsdam.de/~wortmann/swim/swim_manual.pdf (last access: 27 September 2026), 2022.
Landesamt für Bergbau, Geologie und Rohstoffe Brandenburg (LBGR): Bodenkarte Brandenburg 1:25 000, Landesamt für Bergbau, Geologie und Rohstoffe Brandenburg, Cottbus, https://lbgr.brandenburg.de/ (last access: 27 September 2026), 2024.
Landesamt für Umwelt Brandenburg (LfU): Auskunftsplattform Wasser, https://apw.brandenburg.de (last access: 27 September 2026), 2024.
Lange, S.: Trend-preserving bias adjustment and statistical downscaling with ISIMIP3BASD (v1.0), Geosci. Model Dev., 12, 3055–3070, https://doi.org/10.5194/gmd-12-3055-2019, 2019.
Leibniz Institute of Freshwater Ecology and Inland Fisheries (IGB): The complex issue of drought, https://www.igb-berlin.de/en/news/complex-issue-drought (last access: 27 September 2026), 2025.
Lippstreu, L., Kühner, K., Reichenbacher, B., and Theuerkauf, E.: Zur Schichtenfolge der Spree-Sedimente im Oderbruch, Z. Dtsch. Ges. Geowiss., 166, 347–361, https://doi.org/10.1127/zdgg/2015/0041, 2015.
Manhenke, B.: Hydrostratigrafische Gliederung des nord- und mitteldeutschen känozoischen Lockergesteinsgebietes, Z. Angew. Geol., 47, 146–153, 2001.
Manhenke, V., Hannemann, M., and Rechlin, B.: Gliederung und Bezeichnung der Grundwasserleiterkomplexe im Lockergestein des Landes Brandenburg, Brand. Geowiss. Beitr., 2, 1–25, 1995.
Meles, M. B., Bradford, S. A., Casillas-Trasvina, A., Chen, L., Osterman, G., Hatch, T., Ajami, H., Crompton, O., Levers, L., and Kisekka, I.: Uncovering the gaps in managed aquifer recharge for distributed drought risk reduction, J. Hydrol., 638, 130942, https://doi.org/10.1016/j.jhydrol.2024.130942, 2024.
Meng, F., Khan, M. I., Naqvi, S. A. A., Sarwar, A., Islam, F., Ali, M., Tariq, A., Ullah, S., Soufan, W., and Faraj, T. K.: Identification and mapping of groundwater recharge zones using multi influencing factor and analytical hierarchy process, Sci. Rep.-UK, 14, 19240, https://doi.org/10.1038/s41598-024-70324-7, 2024.
Özerol, G., Stein, U., Tröltzsch, J., Landgrebe, R., Szendrenyi, A., and Vidaurre, R.: European drought and water scarcity policies, in: Governance for Drought Resilience: Land and Water Drought Management in Europe, edited by: Bressers, H., Bressers, N., and Larrue, C., Springer, Cham, 17–43, https://doi.org/10.1007/978-3-319-29671-5_2, 2016.
Page, D., Vanderzalm, J., Toze, S., and Dillon, P.: Risk assessment of aquifer storage transfer and recovery with urban stormwater for producing water of a potable quality, J. Environ. Qual., 47, 1254–1264, https://doi.org/10.2134/jeq2018.01.0036, 2018.
Pohle, I., Zeilfelder, S., Birner, J., and Creutzfeldt, B.: The 2018–2023 drought in Berlin: impacts and analysis of the perspective of water resources management, Nat. Hazards Earth Syst. Sci., 25, 1293–1313, https://doi.org/10.5194/nhess-25-1293-2025, 2025.
Pollock, D. W.: User's guide for MODPATH/MODPATH-PLOT: A particle-tracking post-processing package for MODFLOW, U. S. Geological Survey Open-File Report 94-464, https://pubs.usgs.gov/of/1994/0464/report.pdf (last access: 27 September 2026), 1994.
Richter, B. D., Davis, M. M., Apse, C., and Konrad, C.: A presumptive standard for environmental flow protection, River Res. Appl., 28, 1312–1321, https://doi.org/10.1002/rra.1511, 2011.
Ross, A. and Hasnain, S.: Factors affecting the cost of managed aquifer recharge (MAR) schemes, Sustain. Water Resour. Manag., 4, 179–190, https://doi.org/10.1007/s40899-017-0210-8, 2018.
Russo, T. A., Fisher, A. T., and Lockwood, B. S.: Assessment of Managed Aquifer Recharge Site Suitability Using a GIS and Modeling, Groundwater, 53, 269–287, https://doi.org/10.1111/gwat.12213, 2015.
Sallwey, J., Bonilla Valverde, J.P., Vásquez López, F., Junghanns, R., and Stefan, C.: Suitability maps for managed aquifer recharge: a review of multi-criteria decision analysis studies, Environ. Rev., 27, 138–150, https://doi.org/10.1139/er-2018-0069, 2019.
Schmidt, J. C., Webb, R. H., Valdez, R. A., Marzolf, G. R., and Stevens, L. E.: Science and values in river restoration in the Grand Canyon, BioScience, 54, 57–71, https://doi.org/10.2307/1313336, 2004.
Seidl, C., Sprenger, C., and Wang, W.: Understanding the global success criteria for managed aquifer recharge, J. Hydrol., 628, 130411, https://doi.org/10.1016/j.jhydrol.2023.130469, 2024.
Shandilya, R. N., Bresciani, E., Runkel, A. C., Jennings, C. E., Lee, S., and Kang, P. K.: Aquifer-scale mapping of injection capacity for potential aquifer storage and recovery sites: Methodology and case studies in Minnesota, USA, J. Hydrol.-Reg. Stud., 42, 101048, https://doi.org/10.1016/j.ejrh.2022.101048, 2022.
Sharma, P., Verma, A., Sharma, A., Verma, P., and Bandyopadhyay, S.: An integrated site selection criterion for aquifer storage and recovery, J. Irrig. Drain. E.-ASCE, 148, 04022009, https://doi.org/10.1061/(ASCE)IR.1943-4774.0001674, 2022.
Sitek, S., Janik, K., Piechota, A., Rubin, H., and Witkowski, A. J.: Application of GIS-MCDA methodology for managed aquifer recharge suitability mapping in Poland, Water-Sui, 18, 219, https://doi.org/10.3390/w18020219, 2026.
Sprenger, C., Hartog, N., Hernández, M., Vilanova, E., Grützmacher, G., Scheibler, F., and Hannappel, S.: Inventory of managed aquifer recharge sites in Europe: Historical development, current situation and perspectives, Hydrogeol. J., 25, 1909–1922, https://doi.org/10.1007/s10040-017-1554-8, 2017.
Stefan, C. and Ansems, N.: Web-based global inventory of managed aquifer recharge applications, Sustain. Water Resour. Manag., 4, 153–162, https://doi.org/10.1007/s40899-017-0212-6, 2018.
Stein, E. D., Zimmerman, J., Yarnell, S. M., Stanford, B., Lane, B., Taniguchi-Quan, K. T., Obester, A., Grantham, T. E., Lusardi, R. A., and Sandoval-Solis, S.: The California Environmental Flows Framework: Meeting the challenges of developing a large-scale environmental flows program, Front. Environ. Sci., 9, 769943, https://doi.org/10.3389/fenvs.2021.769943, 2021.
Tsypin, M., Cacace, M., Guse, B., Güntner, A., and Scheck-Wenderoth, M.: Modeling the influence of climate on groundwater flow and heat regime in Brandenburg (Germany), Front. Water, 6, 1353394, https://doi.org/10.3389/frwa.2024.1353394, 2024.
Ulibarri, N., Escobedo Garcia, N., Nelson, R. L., Cravens, A. E., and McCarty, R. J.: Assessing the feasibility of managed aquifer recharge in California's sustainable groundwater management, Water Resour. Res., 57, e2020WR029292, https://doi.org/10.1029/2020WR029292, 2021.
Van Loon, A. F.: Hydrological drought explained, WIREs Water, 2, 359–392, https://doi.org/10.1002/wat2.1085, 2015.
Vandala, B. and Mahed, G.: Managed aquifer recharge (MAR) site suitability in the Nelson Mandela Bay: the application of multi-criteria decision analysis techniques, Sustain. Water Resour. Manag., 11, 78, https://doi.org/10.1007/s40899-025-01241-4, 2025.
Vanham, D., Alfieri, L., and Feyen, L.: National water shortage for low to high environmental flow protection, Sci. Rep.-UK, 12, 3225, https://doi.org/10.1038/s41598-022-06978-y, 2022.
Vicente-Serrano, S. M., Beguería, S., and López-Moreno, J. I.: A multi-scalar drought index sensitive to global warming: The Standardized Precipitation Evapotranspiration Index, J. Climate, 23, 1696–1718, https://doi.org/10.1175/2009JCLI2909.1, 2010.
Wang, W.-S., Oswald, S. E., Gräff, T., Lensing, H.-J., Liu, T., Strasser, D., and Munz, M.: Impact of river reconstruction on groundwater flow during bank filtration assessed by transient three-dimensional modelling of flow and heat transport, Hydrogeol. J., 28, 723–743, https://doi.org/10.1007/s10040-019-02063-3, 2020.
Yarnell, S. M., Petts, G. E., Schmidt, J. C., Whitelaw, E. D., and Walter, C.: A functional flows approach to selecting ecologically relevant flow metrics for environmental flow applications, River Res. Appl., 36, 318–324, https://doi.org/10.1002/rra.3575, 2020.
Facing water scarcity, the Berlin-Brandenburg region explored underground water storage to capture excess surface water during wet periods and store it in deep aquifers for use during droughts. We identified extensive areas suitable for storage and found substantial downstream water availability under ecological flow constraints. The approach could help offset local water demand and provide a cost-effective, transferable strategy for strengthening water security in other water-stressed regions.
Facing water scarcity, the Berlin-Brandenburg region explored underground water storage to...