
the Creative Commons Attribution 4.0 License.
the Creative Commons Attribution 4.0 License.
 | 26 Aug 2026
Exposure of settlements to wildfires in a transboundary wildland–urban interface region in Central Europe
Evripidis Avouris

Christopher Marrs
Kristina Beetz
Lucie Kudláčková
Johanna Kranz
Markéta Poděbradská
Miroslav Trnka
Matthias Forkel
Climate change has been causing a noticeable rise in disastrous wildfires in Mediterranean and temperate forests. Although forest fires were of smaller size and less concern in Central Europe than, for example, in the Mediterranean, the region has recently experienced large wildfires. For example, a wildfire burned significant parts of two National Parks on the border between Germany and the Czech Republic in 2022. This event demonstrated the need for local stakeholders and the scientific community to adapt fire risk assessment and management to this new reality. Here, we aim to create an interactive wildfire exposure map for the transboundary National Park region Saxon-Bohemian Switzerland between Germany and the Czech Republic. We use several Earth observation products, historical fire occurrence points, medium to very high fire danger weather and wind scenarios, and three different fire duration scenarios (1, 2, and 3 d) to simulate fire behaviour and burn probability, and to finally assess the potential exposure of settlements to wildfires. Observations from the wildfire in 2022 were used to validate the modelling framework. The interactive wildfire exposure map was tested with members of the general public and local stakeholders to assess its usability and usefulness. The 50 questionnaire responses showed that participants generally rated the map as easy to use and were able to interpret the bivariate legend correctly in most cases, while also providing suggestions for improvements to support potential applications in the monitoring and management of the national parks. We generally found higher flame lengths in Czech municipalities, whereas elevated burn probabilities occurred on both sides of the border. As our results and the experiences from the past fire have shown, wildfires cross borders, demonstrating the need for coordinated cross-border wildfire management.
- Article
(15393 KB) - Full-text XML
- BibTeX
- EndNote


In recent years, destructive wildfires have expanded far beyond the regions where they have traditionally occurred, becoming a global and escalating phenomenon linked to climate change (Abatzoglou et al., 2025; Bowman et al., 2017; Jones et al., 2022, 2024). At the same time, the rapid expansion of the wildland–urban interface (WUI), where human settlements are intermixed with natural vegetation, has increased the exposure of human settlements to wildfire risk (Guo et al., 2024; Radeloff et al., 2018). In addition, land-use change and the abandonment of agricultural and silvicultural practices contribute to fuel accumulation and increased wildfire activity in many regions (Ursino and Romano, 2014). The expansion of the WUI, combined with the worsening effects of climate change, renders WUI wildfires potentially even more disastrous (Oliveira et al., 2020; Trnka et al., 2020). Wildfires in WUIs can have a significant impact on both natural and human environments, and they pose unique challenges to traditional firefighting approaches due to their complexity and the interface between different land uses (Caballero and Beltrán, 2003).
Even temperate countries like those in Central Europe, which have historically been spared from destructive wildfires in the WUI (Heisig et al., 2022), have recently experienced wildfires with direct impacts on the built environment. In 2022, three houses burned down in Mezná, the Czech Republic (Almeida et al., 2024), while in Falkenberg/Elster, Germany, a fire spread to built structures and burned part of a piglet-breeding facility; nearby single-family houses were also seriously threatened (Ministerium des Innern und für Kommunales des Landes Brandenburg, 2023). These events are consistent with the reported significant increase in fire-conducive conditions in the Czech Republic since the 1960s (Trnka et al., 2021). Wildfire behaviour in the WUI in Central Europe has recently been changing because of changes in land use and forest structure. Since 2017, bark beetle infestations have been prevalent in Central Europe. Bark beetles (predominantly Ips typographus in this region) cause widespread mortality in the extensive spruce forests of the region (mainly Picea abies) (Müller et al., 2008). The Czech Republic, in particular, has been heavily affected, with a drought-fuelled bark beetle dynamic in 2017–2019 (Brázdil et al., 2022) impacting vast regions simultaneously – an event of unprecedented magnitude in the region (Hlásny et al., 2021). This outbreak has played a substantial role in the observed twofold increase in canopy mortality across Central Europe (Seidl et al., 2014; Senf et al., 2018). The prevalence of dead and weakened trees, combined with regenerating young vegetation, has significantly altered fuel structures, increasing the likelihood and severity of wildfires.
Disturbed forests in Central Europe can experience perilous wildfires comparable to the most serious fires of Southern Europe (Berčák et al., 2023). In particular, Beetz et al. (2024) showed that disturbed forest stands in the Bohemian-Saxon Switzerland region exhibited extreme fire behaviour during the 2022 wildfire, including high flame lengths and radiative power, which were driven by high loads of dead wood and dense regenerating vegetation following bark beetle infestation. These conditions underscore the evolving fire risk in the region and highlight the urgent need for further research on wildfire dynamics in Central European WUIs, as also emphasised by Kudláčková et al. (2024), who demonstrated the applicability of advanced fire behaviour modelling to simulate and analyse the unprecedented 2022 wildfire.
Although professional and voluntary fire services have a long tradition and are widespread in Central European countries, societal awareness about wildfires in the WUI and the capacities to fight wildfires are at an early stage of development, making wildfires in such places potentially much more difficult to handle (Heisig et al., 2022). This situation creates the need to inform the public about the potential exposure of their homes and properties to wildfires. Moreover, the stakeholders responsible for dealing with wildfires in Central Europe, such as firefighters, emergency management services, National Park administrations and relevant government agencies, should be aware of the potential danger that areas under their jurisdiction are increasingly in.
Wildfire exposure quantifies the risk posed by wildfires to human and environmental assets. Generally, exposure can be described as the condition of human assets, such as people, infrastructure, housing, and production capabilities, being situated in areas that are susceptible to hazards, such as wildfires (Safaie et al., 2017). Hence, an assessment of wildfire exposure is the evaluation of the assets that could be endangered in case of a wildfire (Johnston et al., 2020). Such spatially explicit approaches have been increasingly applied in wildfire exposure assessments, particularly in wildland–urban interface contexts, where the combination of fire likelihood, potential fire behaviour, and the location of assets is used to identify areas of elevated exposure (Argañaraz et al., 2017; Haas et al., 2013; Scott et al., 2013). To quantify wildfire exposure, hazard metrics of wildfire likelihood and potential intensity are estimated before being juxtaposed with the location of assets (Abrahams et al., 2017). A common way to derive such metrics is through the use of landscape fire modelling. Fire modelling offers an analytical framework for the characterisation and prediction of fire spread and behaviour in varied and intricate fire environments (Stephens, 1998; Van Wagtendonk, 1996). This approach has been proven beneficial in the development of suitable wildfire management strategies in order to mitigate potential disasters and establish effective coping capacities (Alcasena et al., 2017; Moghaddas et al., 2010; Oliveira et al., 2020, 2021; Sá et al., 2022). FlamMap is the tool chosen here for wildfire modelling.
FlamMap is a fire analysis application developed by the Missoula Fire Sciences Laboratory (FlamMap – Missoula Fire Sciences Laboratory, 2026). FlamMap has the advantage of being able to visualise fire behaviour characteristics directly related to hazard, such as flame length and burn probability, in the form of geolocated rasters, which facilitate the derivation of settlements' exposure (Peterson et al., 2007). It is commonly used to analyse fire behaviour in European settings. For example, Salis et al. (2009, 2012) used FlamMap to assess wildfire severity in Italy, Mitsopoulos et al. (2016) used it for a Greek landscape, Sá et al. (2022) used it in Portugal, and Alcasena et al. (2017, 2018) used it in Spain. For applications in Central Europe, FlamMap has been used only recently (Kudláčková et al., 2024), which is, however, related to the rather limited wildfire research in that region.
The objective of this study was to assess wildfire exposure for the Bohemian-Saxon Switzerland transboundary WUI region in Central Europe, where ongoing changes in land use – such as declining forest management, increasing protection of natural processes, and increasing attractiveness for tourism – have been reinforced by the founding of two National Parks (NP Saxon Switzerland in Germany in 1990, NP Bohemian Switzerland in the Czech Republic in 2000). Firstly, we aimed to produce an interactive wildfire exposure map that includes two support capability indicators, namely, the locations of fire stations and local transportation infrastructure. Secondly, we aimed to quantify wildfire exposure for different settlements in the region. Thirdly, we performed a qualitative user study to assess the usability of the map for the general public and its usefulness for local stakeholders.
2.1 Study area
The study area extends across a transboundary area of 720 km2 on both sides of the River Elbe in Germany (322 km2) and the Czech Republic (398 km2). Specifically, the study area consists of the two National Parks Saxon Switzerland (Sächsische Schweiz) and Bohemian Switzerland (České Švýcarsko) and the two surrounding conservation areas, the Conservation Area of Saxon Switzerland (Landschaftsschutzgebiet Sächsische Schweiz) and the Conservation Area of the Elbe Sandstone Mountains (Chráněná krajinná oblast Labské pískovce) (Nationalpark Sächsische Schweiz, 2023) (Fig. 1). The area is dominated by forests (69 %) and grasslands (17 %), with croplands also covering a substantial share (10 %) – mainly on the German side of the border (Copernicus Land Monitoring Service, 2025). Built-up areas account for 2 % of the study area. These are primarily located in the south (e.g., the towns of Děčín, Jílové, and Česká Kamenice) and on the German side along the Elbe River (e.g., the towns of Stadt Wehlen, Königstein, and Bad Schandau; Fig. 1). The study area is characterized by prominent sandstone formations, rocky outcrops, and steep cliffs. Elevations range from approximately 200 m (Elbe River valley) to 723 m (Děčínský Sněžník), and this rugged topography poses substantial challenges for firefighting operations. The study area is dotted with several settlements (small towns, villages, remote houses; only local towns are indicated in Fig. 1). The study area also includes several settlements that are not part of the conservation area of Saxon Switzerland but are surrounded by it. Altogether, around 1 million inhabitants live in the respective wider administrative districts, i.e., 246 000 in the Saxon Switzerland/Eastern Ore Mountains district in Germany and 811 000 in the Ústecký kraj district in the Czech Republic.
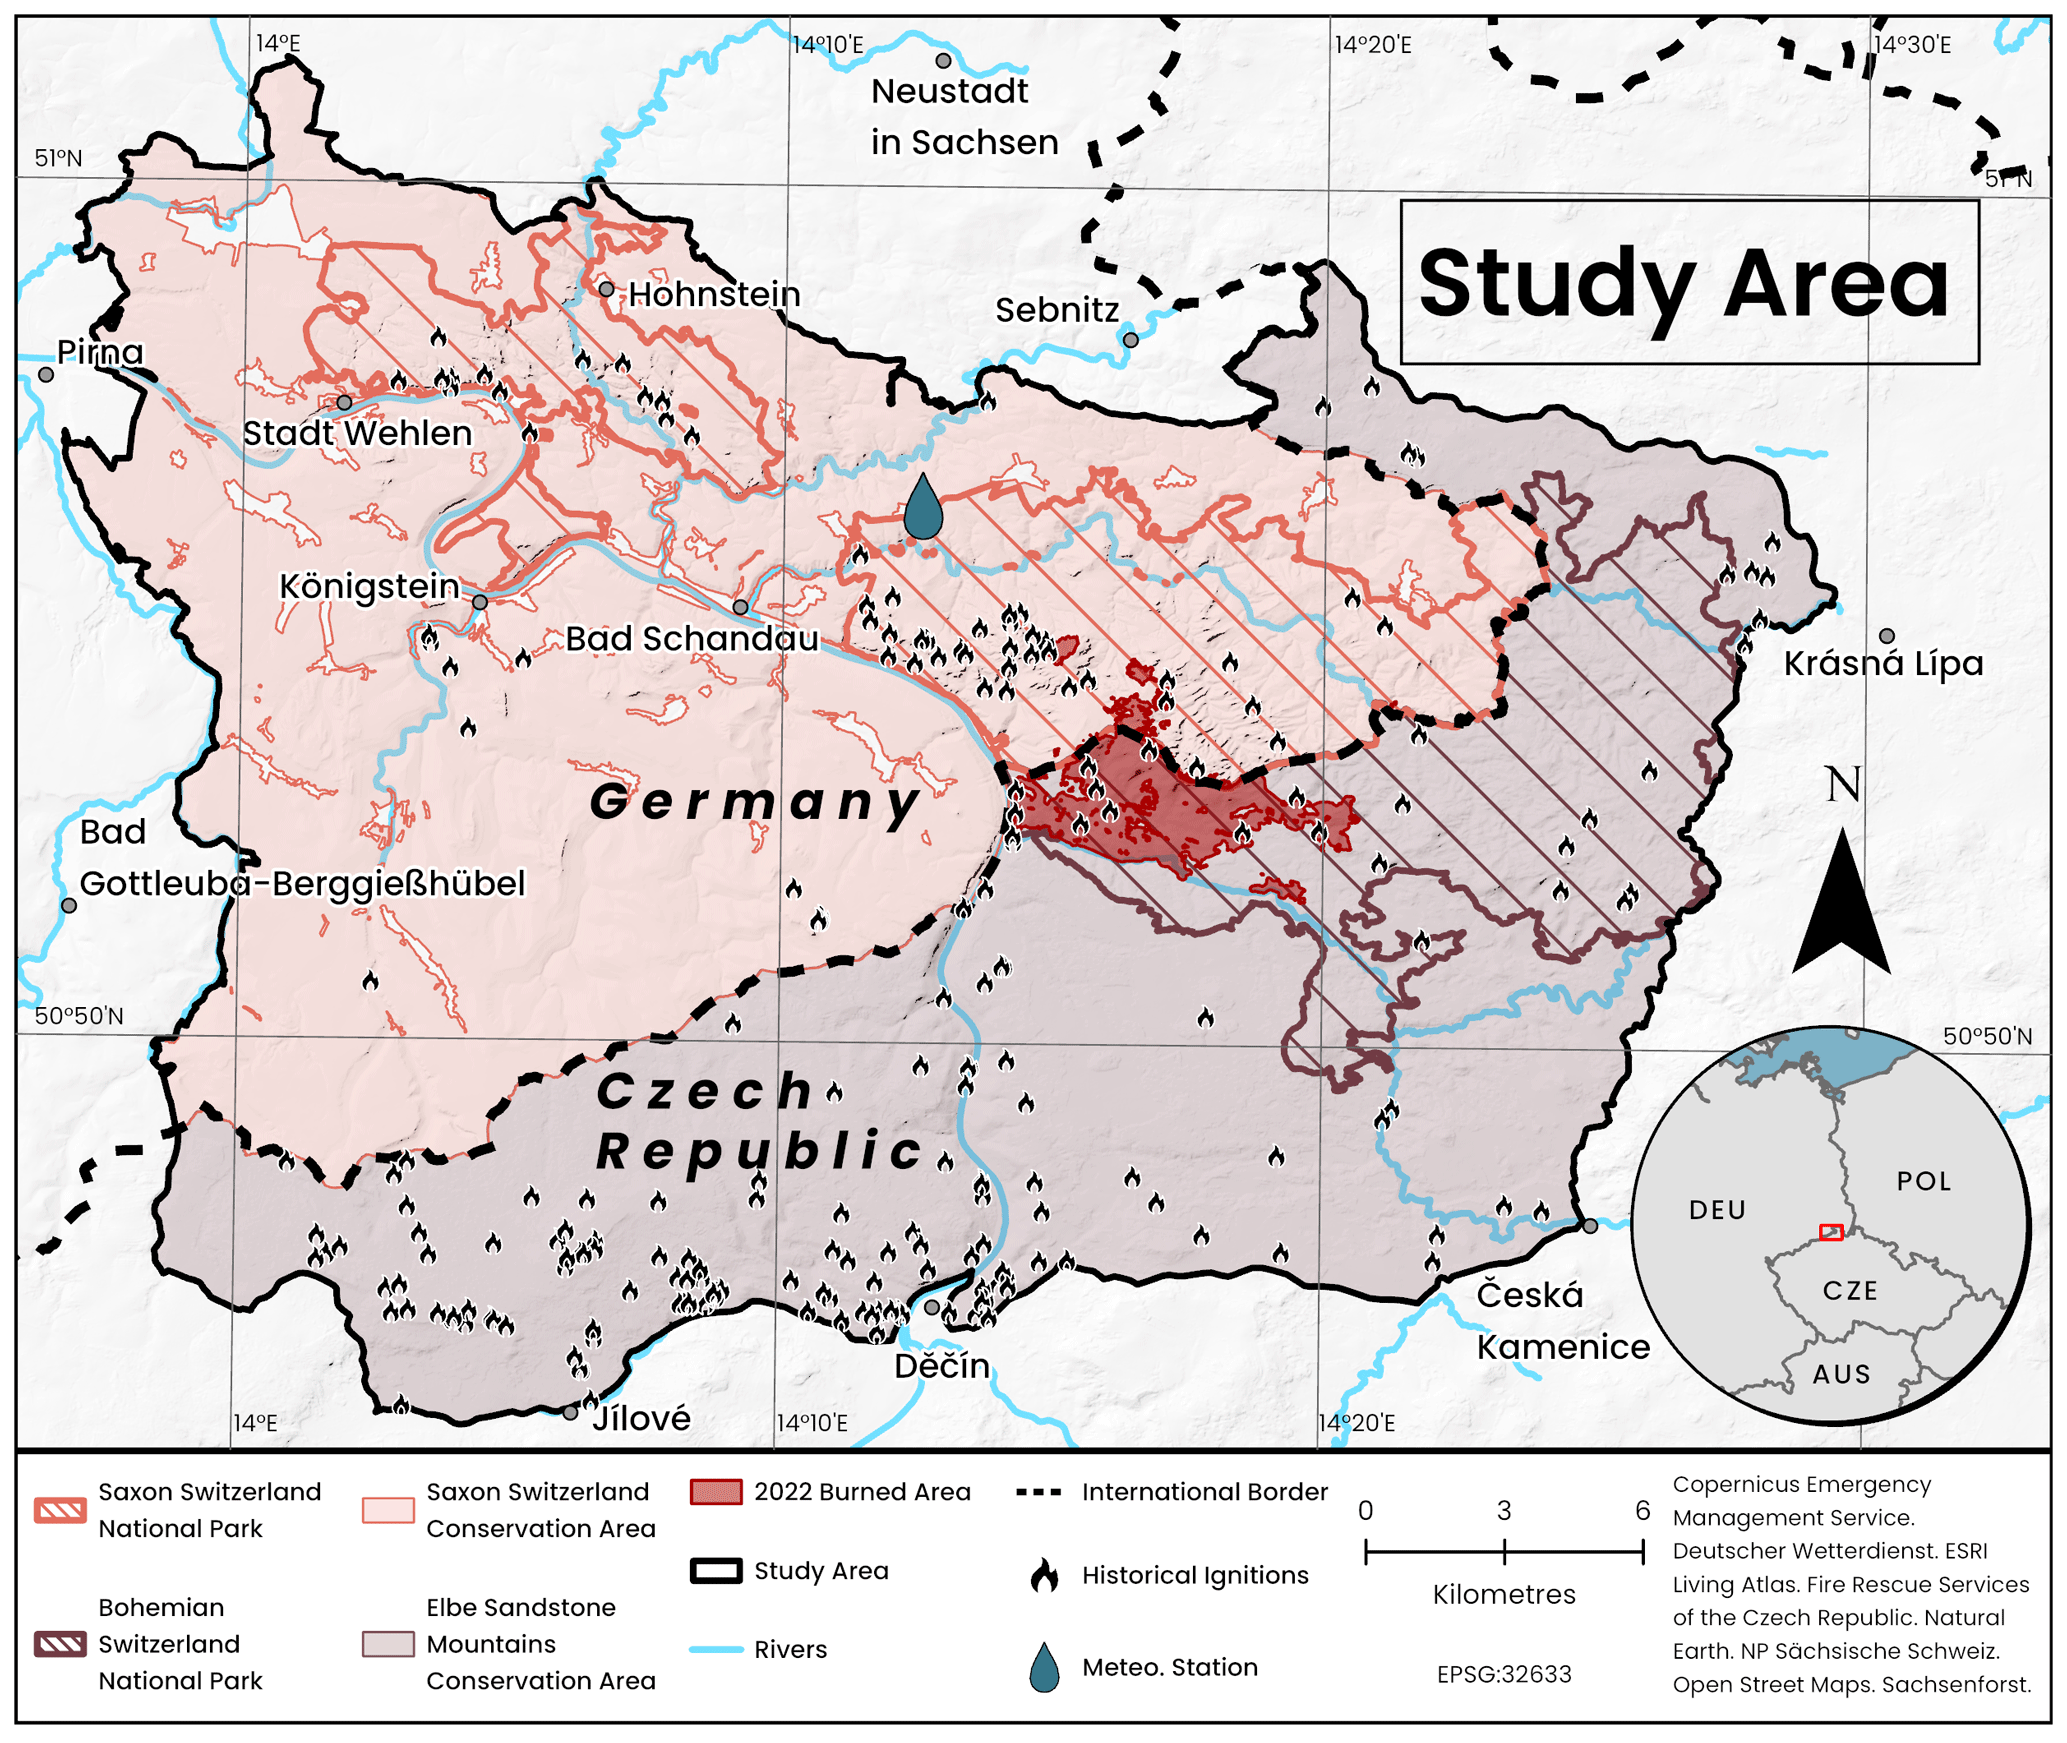
Figure 1Study Area. The study area consists of two National Parks and two Conservation Areas on the border between the Czech Republic and Germany, and experienced a large wildfire in 2022. Historical ignitions for the period 2008–2020 are also shown.
Based on the historical ignition datasets described in Sect. 2.3.1, wildfire occurrence in the study area is predominantly human-caused. For the German (Saxon) part, the most frequently reported ignition category is open fires by other persons (41.7 %), followed by unknown or unclear causes (26.6 % combined), while lightning accounts for 10 % of cases. For the Czech part, the dominant ignition categories are setting fires in the countryside/burning grass (44.2 %) and smoking (37.4 %), whereas lightning represents 3.1 % of cases (other natural causes <2 %). Based on the available records used in this study, the Czech dataset (2016–2020) includes 163 ignitions (32.6 per year), while the German dataset (2008–2020) includes 60 ignitions (∼4.6 per year). Seasonality differs between the two sides of the border: in Saxony, ignitions are strongly concentrated in late spring and summer (April to August: 80 % of cases; May to June alone: 50 %), whereas in the Czech Republic ignitions are more broadly distributed across the year (April to August: 67.5 %), with a secondary contribution in October and November (∼16.6 %). The available records do not include burned-area information; therefore, fire size statistics could not be derived.
The selection of the study region was motivated by the occurrence of a wildfire which lasted from 24 July 2022 until it was extinguished on 12 August 2022, and which burnt 113 ha in the Saxon Switzerland National Park and 1060 ha in the Bohemian Switzerland National Park (Požár v NP České Švýcarsko, 2024) (Fig. 1). The fire, caused by arson, started in the Czech National Park and spread across the border into the German National Park (Beetz, 2023).
The forested parts of the study area are largely dominated by Norway spruce (Picea abies), although pines (Pinus sp.), larch (Larix sp.), European beech (Fagus sylvatica) and silver birch (Betula pendula) are also present (Beetz et al., 2024). Extreme drought conditions and high temperatures in Central Europe between 2018 and 2022 triggered massive bark beetle infestations in the Czech Republic and Germany (Knutzen et al., 2025), leading to extensive spruce mortality and subsequent accumulation of deadwood in the study area (European Commission, Joint Research Centre et al., 2024). The effects of these forest changes on the behaviour of the 2022 forest fire were investigated previously by Beetz et al. (2024) using field and satellite observations, and by Kudláčková et al. (2024) using the FlamMap landscape fire model. Here, we build on the first of these two studies by making use of the fuel model classifications that it developed (Sect. 2.3.2).
2.2 Quantifying wildfire hazard using FlamMap
Wildfire hazard was quantified in terms of burn probability and potential flame length using FlamMap. It was first used in our study area by Kudláčková et al. (2024) to investigate drivers of the 2022 wildfire. FlamMap computes fire behaviour characteristics such as flame length and burn probability in the form of geolocated rasters suitable for deriving settlement exposure (Peterson et al., 2007). FlamMap modelling was conducted at a spatial resolution of 30 m×30 m, which is adequate to allow the identification of individual buildings exposed to the modelled wildfire hazard.
Burn probability (BP) is the likelihood that a location (a grid cell in the case of this study) will burn, taking into account the cumulative number of modelled fires (Sá et al., 2022). The Burn Probability (BP) of grid cell p is calculated as
where Fp is the frequency of cell p burning, out of a number of Np simulated ignitions (Sá et al., 2022, p. 3922). It is therefore a proxy for wildfire likelihood. In FlamMap, BP is one of the outputs of the Minimum Travel Time (MTT) Algorithm. The calculation of fire growth in the MTT algorithm involves the exploration of pathways that exhibit the minimum spread time among cells within a two-dimensional gridded landscape, operating at a spatial resolution determined by the user (in this study, 30 m×30 m) (Sá et al., 2022). Wildfire spread is forecasted by employing Rothermel's model (Rothermel, 1972), which calculates fire characteristics in the direction of the highest rate of spread.
Flame length (FL) is the average distance from the midpoint of the active flaming zone at the fuel surface to the flame tip (Rothermel and Deeming, 1980). This measurement is taken on a slant when the flames are tilted as a result of the influence of wind and slope. FL has long served as a proxy for measuring fire intensity (Byram, 1959): longer flames are indicative of a greater amount of fuel consumed and of energy released per unit of time (Finney et al., 2021). FL is one of the basic fire behaviour outputs of FlamMap. FL, along with Fireline Intensity and Heat per Unit Area are generated for all cells of the fire modelling landscape by taking into account the constant wind and other environmental conditions such as fuel moisture (Finney, 2006).
2.3 Datasets
2.3.1 Input data for FlamMap
For simulations with FlamMap, a fire modelling landscape and weather conditions are necessary input datasets. A fire modelling landscape is a geospatial characterisation in raster format that includes topography (aspect, slope and elevation), vegetation (stand height and canopy cover), and fuel (canopy bulk density, canopy base height and surface fuel model) (Scott, 2019). Hourly weather data are needed for the determination of dead fuel moisture and information about wind conditions to simulate fire spread. Here, we first describe the required input datasets, except for the fuel models, which are covered in the next section.
To start fire spread simulations, ignition locations are needed. For the ignition points, we first considered historical fires, which reveal clear spatial patterns of fire occurrence and ignitions in the study area, mainly along the Elbe valley and forests north of the city of Děčín and along some common hiking trails and points of interest in both National Parks (Fig. 1). Historical forest fire ignition data (60 ignitions, spanning 2008–2020) for the German part of the study area were provided by the Saxon State Authority for Forestry (Staatsbetrieb Sachsenforst, 2023). Additionally, we included known locations in the National Park Saxon Switzerland considered particularly susceptible to future ignitions in the German part of the study area. These comprised parking areas, viewing points, legal fire pits, and legal and illegal rock shelters (“Boofen” in German), totalling 697 sites. At those sites, campfires are often ignited but have not resulted in a forest fire to date. Ignition locations from the Czech part (163 ignitions, spanning 2016–2020) were acquired from the Fire Rescue Service of the Czech Republic (Hasičský záchranný sbor České republiky, 2023). Neither dataset is publicly available. The ignition location of the 2022 fire was manually added to the dataset as it had not yet been included in the respective dataset. The joint datasets encompassed the locations of 921 ignition points. To balance ignition density between the German and Czech parts of the study area (i.e., number of ignitions per km2), we used the lower-density Czech side as the reference and randomly subsampled the German ignition locations so that the German ignition density matched the Czech one. The final number of ignition points was 363. These can be seen in Fig. E1 of Appendix E. Weather data (wind speed and direction, temperature, relative humidity, precipitation, and cloud cover) were derived from the Climate Data Centre (CDC) of the German Weather Service (Deutscher Wetterdienst, 2025) for the Lichtenhain-Mittelndorf station (station ID: 02985) located inside the borders of the study area (Fig. 1).
Initial dead fuel moisture values were derived from the fuel moisture observations reported by Kranz et al. (2025), who established fuel moisture monitoring sites within the Saxon Switzerland National Park. To represent bark-beetle-affected forest conditions, data from the DE-SHW site, located in a disturbed spruce stand, were used. For non-disturbed forest conditions, data from the DE-BWB site, located in a beech stand, were used. Kranz et al. (2025) collected destructively sampled dead fuel moisture content (DFMC) measurements for 1, 10, and 100 h fuels from June to September 2023 and additionally operated automated 10 h fuel sticks at both sites, which have been recording fuel moisture at 30 min intervals since January 2023. Live fuel moisture content was set to 60 % for herbaceous fuels and 90 % for woody fuels. These values were adopted from Kudláčková et al. (2024), who used FlamMap to reconstruct the 2022 Bohemian Switzerland wildfire and selected the same values based on the fuel moisture scenarios of Scott and Burgan (2005) in consultation with experts from the Missoula Fire Sciences Laboratory.
Digital ground elevation (DGM) tiles covering the study area were downloaded from the Saxony State Office for Basic Geographic Information (Landesamt für Geobasisinformation Sachsen, 2023) for Germany and the State Administration of Land Surveying and Cadastre for the Czech Republic (ČÚZK: Geoportál, 2024). The merged elevation file was resampled to a 30 m×30 m resolution and clipped to the borders of the study area. The slope and aspect layers were derived from the respective Slope and Aspect geoprocessing tools from ArcGIS Pro. Canopy cover was derived from Copernicus' Land Monitoring Service, which provides 10 m×10 m resolution rasters with canopy cover density; the latest dataset available dates from 2018 (Copernicus Land Monitoring Service, 2024).
2.3.2 Fuel model map
Fuel models are defined by a set of often complex characteristics of surface fuels such as heat content, mineral content and dead fuel moisture of extinction (Keane, 2015). Fuel models are a main input to fire behaviour models such as FlamMap. Here, we developed a fuel model map for the study area following the classification scheme of Scott and Burgan (2005). Fuel models are often derived from fuel types that are more generally defined vegetation types which have been grouped together because of their similar characteristics from a fire behaviour point of view (Aragoneses et al., 2023).
The fuel models for the study area are based on the fuel type map by Beetz et al. (2024), which offers high resolution (10 m×10 m) for the entire study area. Beetz et al. (2024) created a fuel type classification system by combining the European fuel type classification of Aragoneses et al. (2023) and that of the Alaska Fuel Model Guide Task Group (2018). We first translated the fuel types into fuel models as listed in Table B1 of Appendix B. Thereby, we also checked whether the resulting fire behaviour simulations appeared realistic, resulting in a preliminary fuel model map. In a second step, we reclassified NB9 (bare ground) to SH3 (moderate load, humid climate shrub) where NDVI>0.72, and GS3 (moderate load, humid climate grass-shrub – dynamic) areas to GR3 (low load, very coarse, humid climate grass – dynamic). We then conducted 83 field surveys on the German side of the study area in October 2023 in order to check the plausibility of the fuel models. The field surveys were stratified with information about land use and biotope classifications from the Free State of Saxony (Natur und Biologische Vielfalt, 2024). This resulted in 47 unique combinations of fuel models and land use. Those combinations were used to reclassify the preliminary fuel model map to fuel models which were observed in the field. Cases in which different fuel models were surveyed within the same land-cover polygons were left unchanged. This resulted in an update of 18 % of the total fuel models of the German part of the study area. The fuel model creation pipeline is shown in Fig. B1.
The resulting fuel model map is shown in Fig. 2. Note the existence of significant areas that have been infested by bark beetle; these are noted in the fuel model map with the model “Slash-Blowdown 2” (SB2), an assignment also employed by the Alaska Fuel Model Guide Task Group (2018) for bark beetle-infested forests.
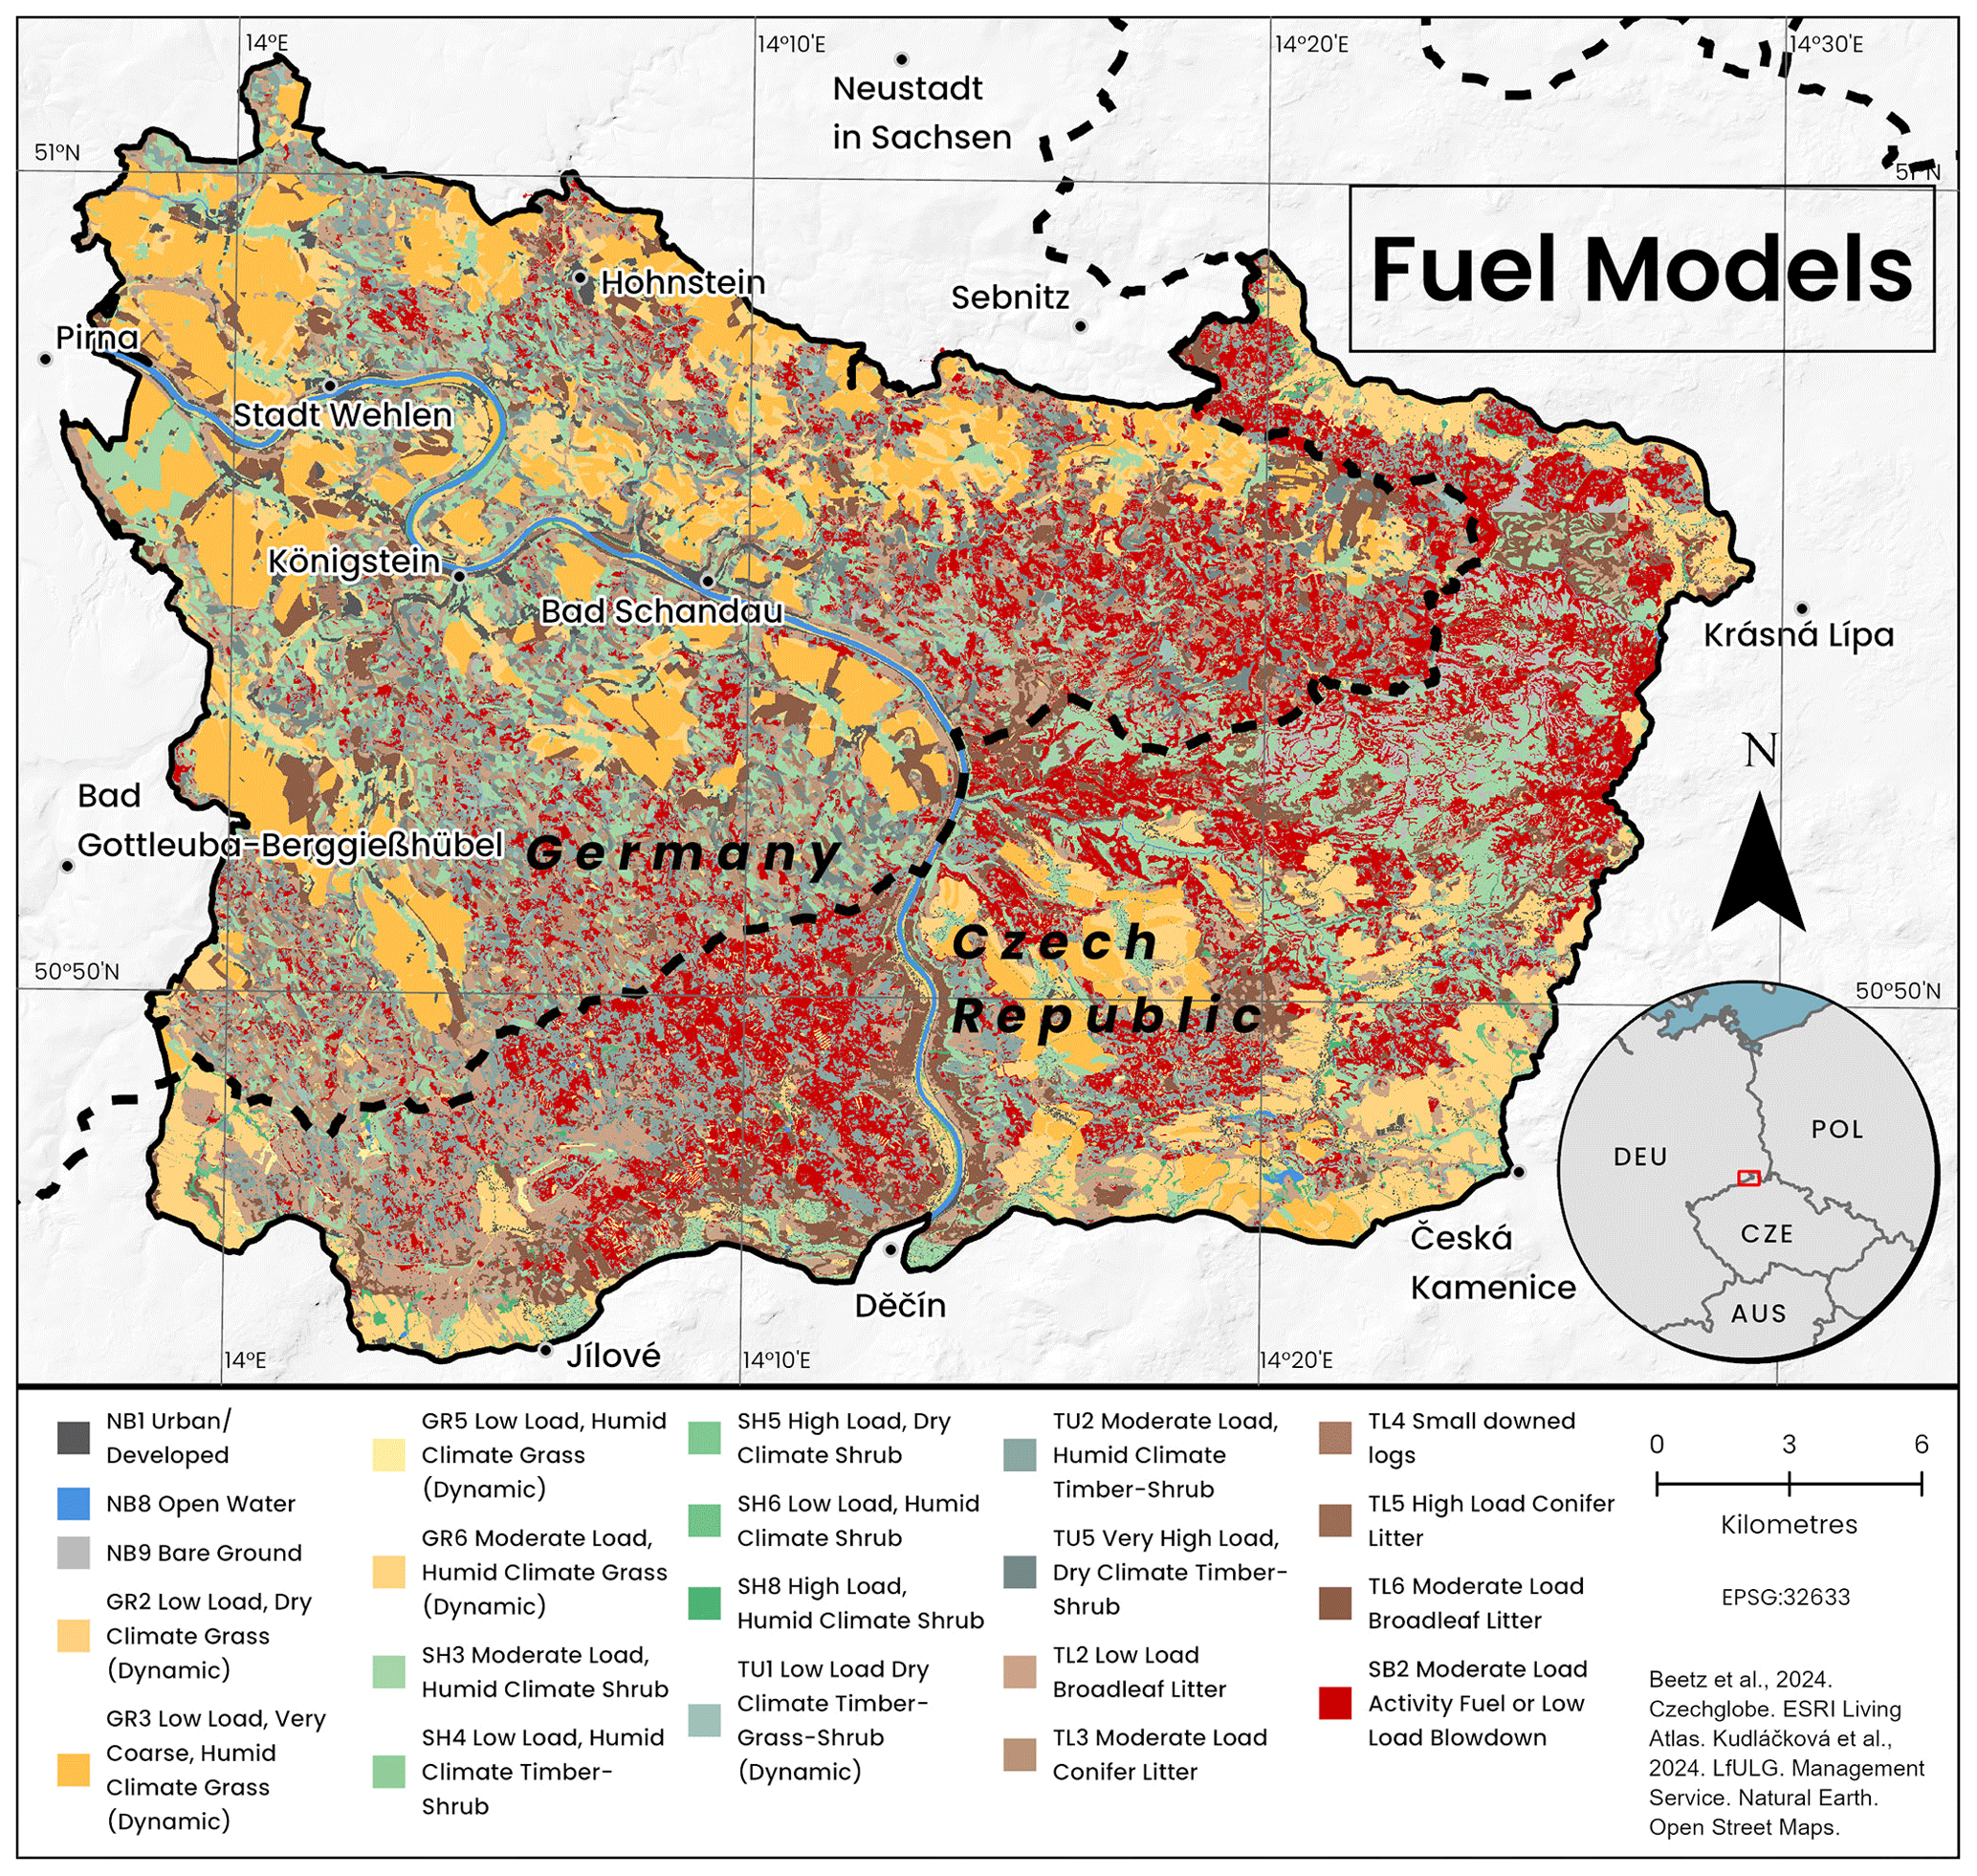
Figure 2Fuel model map of the study area.
2.3.3 Ancillary datasets
For the assessment of wildfire exposure, we included local settlements and building infrastructure. In addition, fire stations and the local transportation network were included as contextual support capability indicators to support user orientation and route planning in the interactive web map and to enable the task-based evaluation described in Sect. 2.7. These were not used as input variables in the exposure calculation. Settlements of the study area for both the Czech Republic and Germany were derived from OpenStreetMap data (Geofabrik – Europe, 2023). Only towns (4) and villages (73) were considered and then labelled, in order to not overpopulate the map with hamlets, farms and localities, which, although potentially equally exposed, are much smaller and less populated than bigger settlements. Apart from settlements, a polygon layer of buildings was also included to allow the assessment of individual buildings' exposure in the interactive web map.
For the location of fire stations and the local transportation infrastructure, a 30 km circular buffer around the centroid of the study area was considered, primarily in order to take into account fire stations outside the main study area which are nevertheless nearby enough to provide rapid assistance in the case of a wildfire.
Three sources were used to derive the locations of German fire stations. Firstly, locations were obtained from OSM (Geofabrik – Europe, 2023). Secondly, fire station locations were provided upon personal request by the District Fire Brigade Association (Kreisfeuerwehrverband – Sächsische Schweiz-Osterzgebirge e.V., 2023) to reinforce the scarce OSM data. Thirdly, the Saxon State Office for Geographic Information (Geoportal Sachsenatlas, 2024) also provided fire station information.
For the Czech Republic, fire station locations were likewise first derived from OSM (Geofabrik – Europe, 2023). Second, the web map of the Hasičovo community portal of Czech firefighters provided the majority of fire stations' location information (Hasičovo, 2023). All fire station datasets lack information on their equipment and on whether they are volunteer or professional stations, both of which affect the availability of personnel and resources in case of wildfires. Therefore, fire stations were summarised and visualised as one class.
Data on local transportation infrastructure were derived solely from OSM (Geofabrik – Europe, 2023). OSM data on transportation infrastructure are divided into several classes, which needed to be grouped in order to not overburden the exposure map with superfluous information, and to focus on car roads that fire appliances can use. Groups were created based on the classification and explanation of classes found on OpenStreetMap Wiki (OpenStreetMap, 2023). All roads classified as “unclassified” were manually checked with Google Earth and then reclassified appropriately.
2.4 Model simulations and scenarios
Several factors need to be considered in simulations with FlamMap, namely ignition locations, fuel moisture, weather conditions and the duration of the fire. While ignition locations and live fuel moisture were held constant based on historical observations (Sect. 2.3.1), varying dead fuel moisture as well as different scenarios for fire duration and wind conditions were selected to give realistic outputs in terms of BP and FL. The different factors resulted in a total of 27 wildfire simulations, comprising combinations of three fire durations (1, 2, and 3 d) and nine winds (the three most frequent wind direction–wind speed combinations for each of the three wildfire danger levels).
2.4.1 Fire duration
The duration of a simulation in FlamMap is controlled by the Maximum Simulation Time parameter, which takes minutes as its unit (FlamMap Help, 2023). The duration of wildfire simulations varies among studies. For example, Mallinis et al. (2016) used a duration of 480 min based on the historical wildfire record of the region, Mallinis (2014) used 360 min, and Sá et al. (2022) considered several durations (300, 540, and 720 min).
Here, we decided to run simulations for 1440 min (1 d), 2880 min (2 d), and 4320 min (3 d). This was done as a compromise between the many wildfires that often occur in the area and are usually detected and extinguished quickly, and the 2022 wildfire, which occurred in the study area and lasted 20 d, with most of its spread occurring during the first three days (Kudláčková et al., 2024). In addition, the longer simulation times corresponded well with the lower wind speeds observed in the area, and this match was supported by the evaluation presented in Sect. 3.4. Unfortunately, no other data are available about the duration of historical fires in the region.
2.4.2 Wind and fire weather scenarios
Mesoscale wind conditions and local topography are the main drivers of wildfire behaviour. Therefore, different authors have used various wind scenarios. For example, Alcasena et al. (2017) considered five wind scenarios, considering the most frequent wind directions (frequency>5 % in weather records) during the wildfire season and the respective 97th percentile wind speeds. Sá et al. (2022) derived different weather types after classifying 326 fire weather days based on the average values of temperature (T), relative humidity (RH), and wind speed. Each fire weather type (frequent/hotter, drier/windier and cooler/wetter) then had a representative wind based on the average wind speed and the most common of eight wind directions.
Here we considered the mesoscale wind condition by developing different wind and fire weather scenarios and accounted for the microscale topography by making use of the WindNinja diagnostic model (Forthofer et al., 2009). This model takes the mesoscale input wind speed and direction and the slope of the fire modelling landscape to generate high-resolution wind vectors. The chosen resolution for this study was 40 m×40 m.
In order to generate typical mesoscale wind scenarios, we used the Forest Fire Danger Index (Waldbrandgefahrenindex, WBI) of the German Weather Service (DWD). WBI is based on the Canadian Fire Weather Index, while also adopting elements of the German Baumgartner and M68 indexes, and describes the meteorological potential for forest fire danger from 1 (“very low risk of fire”) to 5 (“very high risk of fire”) (Wittich et al., 2014; Wittich and Bock, 2014). WBI values from DWD are provided for different municipalities through the Central German Information Service Agency (Waldbrandgefährdung, 2023). Daily WBI data for the municipality of Bad Schandau were chosen for the period 15 February 2009 to 12 August 2022. Bad Schandau lies entirely in the study area, is close to the meteorological station of Lichtenhain-Mittelndorf and contains a high concentration of recorded ignition locations. The dates were then categorised according to their WBI as medium danger (WBI=3; 740 d), high danger (WBI=4; 445 d) and very high danger (WBI=5; 45 d).
Finally, the hourly wind data for the Lichtenhain-Mittelndorf station were filtered into three new datasets with hourly wind information for the three considered WBI values. Hourly values outside the 15 February 2009–12 August 2022 span were not used. Similarly to Sá et al. (2022), the frequency of each wind direction was analysed for each WBI value (Appendix C). The frequencies and mean speeds of all directional wind conditions for each WBI are shown in Tables 1 and 2.
Table 1Frequency of each wind direction for medium, high and very high fire danger conditions. The three most frequent wind directions for each WBI value are highlighted in bold.
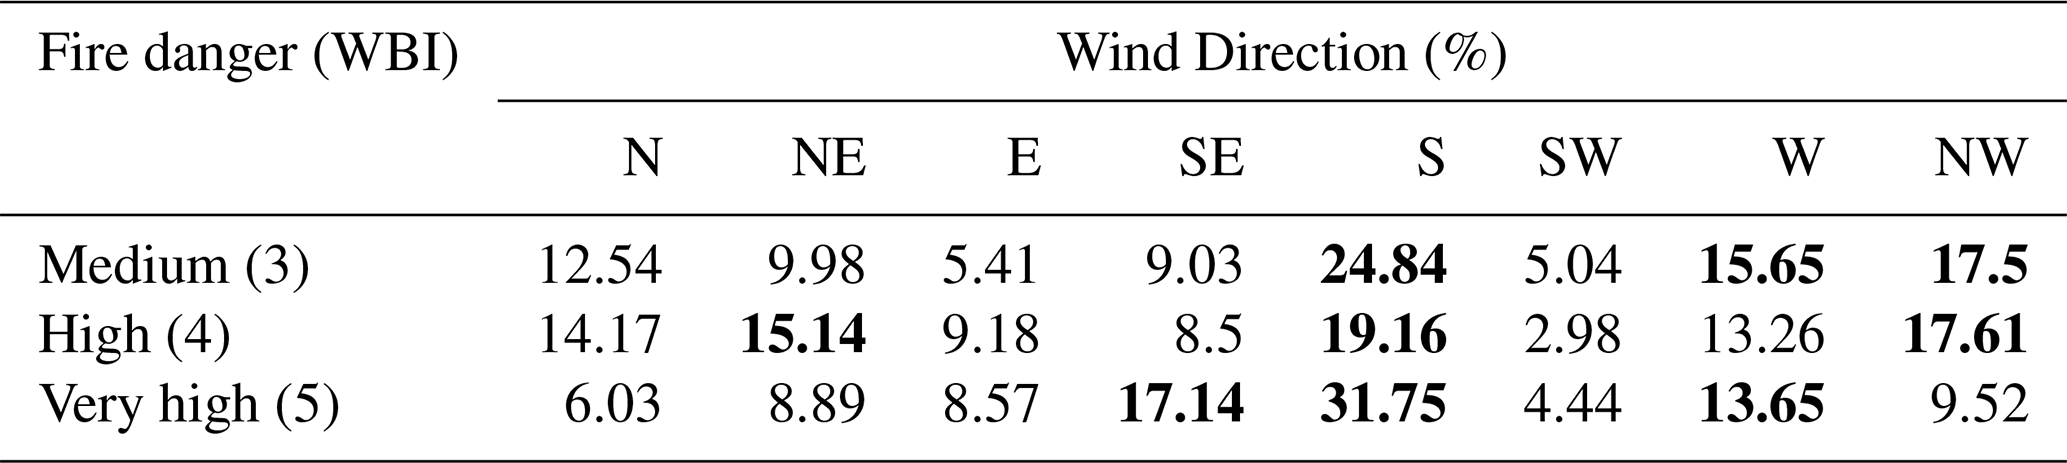
Table 2Mean wind speed for each direction in each of the three WBI-specific hourly wind datasets. The mean speeds of the three most frequent wind directions for each WBI value are highlighted.
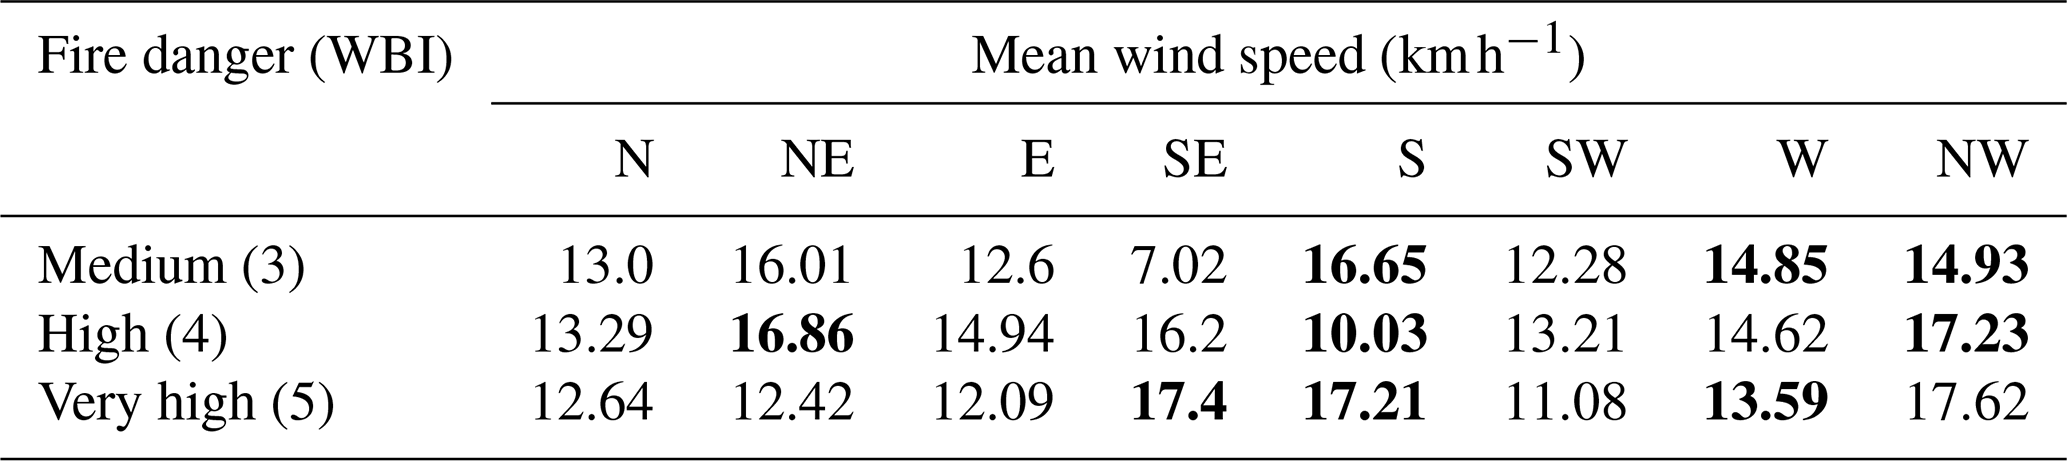
We then ran FlamMap using the three most frequent wind direction–wind speed combinations associated with each WBI level. Each combination was simulated for fire durations of one, two, and three days, resulting in a total of 27 model simulations (3 WBI levels × 3 wind scenarios × 3 fire durations). In each of these simulations, burn probability was computed using the same fire list containing the 363 ignition locations (Sect. 2.3.1). The 363 ignition locations were treated as independent single-ignition fires in MTT, and burn probability represents the fraction of these fires that burned each cell in each simulation.
2.4.3 Dead and live fuel moisture parameterisation
To ensure consistency between the fire-weather scenarios and fuel conditions, the destructively sampled DFMC observations were grouped according to the three WBI classes, and representative values were derived separately for bark-beetle-affected and non-affected forest stands. As no destructive DFMC measurements were available for days classified as WBI 5 within the timespan of the destructive measurement campaign, the corresponding WBI 5 fuel moisture values were estimated from the WBI 4 values using the relative difference observed between WBI 4 and WBI 5 fuel-stick measurements at the respective monitoring site. The resulting fuel moisture values are presented in Appendix A (Tables A1–A3). Unlike dead fuel moisture, live fuel moisture values were not varied between the WBI scenarios. Per the FlamMap modelling framework, live fuel moisture was treated as constant throughout the conditioning period of each simulation.
2.5 Development of the hazard layer of the wildfire exposure map
The hazard layer of the exposure map simultaneously represents burn probability (BP) and flame length (FL). Therefore, the 27 model simulations were combined into nine wildfire hazard scenarios by calculating weighted averages of the three wind simulations associated with each combination of wildfire danger level and fire duration. The FL and BP weighted mean rasters were calculated using wind-frequency percentages as weights in order to assign greater importance to wind scenarios that occur more frequently under a given wildfire danger level:
where X is either FL or BP of a grid cell at location i, j and p is the percentage frequency of the three most frequent wind directions A, B, and C (Table 1).
Burn probability and flame length were each classified into five classes for the hazard layer of the exposure map. The burn probability classification consisted of the intervals <0.01, [0.01,0.02), [0.02,0.05), [0.05,0.10), and ≥0.10. Flame length was likewise classified into five classes based on the distribution of modelled flame length values across the study area: <0.5, [0.5,1.0), [1.0,1.5), [1.5,2.0), and ≥2.0 m. These thresholds were selected to provide sufficient differentiation between areas with low and high potential fire intensity. To create the bivariate hazard layer of the final exposure map, the two classifications of FL and BP were combined in a bivariate classification corresponding to 25 combinations of FL and BP. The simultaneous combination of fire intensity and probability measures to support exposure assessment has been applied in previous studies. For example, Sá et al. (2022) combined burn probability with fireline intensity, while Heisig et al. (2022) employed the integrated fire hazard classification scheme of the Interagency Fuels Treatment Decision Support System, which gives a single fire hazard value based on both conditional flame length and conditional burn probability.
2.6 Assessment of the exposure of municipalities
To derive residential wildfire exposure from the hazard layer, the BP and FL rasters were overlaid with the locations of residential buildings and their Home Ignition Zones (HIZs). Exposure was then assessed at the scale of individual homes and municipalities. The HIZ refers to the 60 m buffer zone directly surrounding residential buildings, which plays a critical role in assessing the likelihood of structure ignition during severe wildfire incidents (Alcasena et al., 2017). To identify residential buildings, the buildings layer was filtered to retain only buildings classified as residential by the Czech State Administration of Surveying and Cadastre for the Czech side (ČÚZK: Geoportál, 2024) or by the Saxon State Office for Geoinformation (Landnutzung – Geobasisinformation, 2024) for the German side. We then computed the 5th and 95th percentiles of BP and FL for all grid cells located within the HIZ of the residential buildings for an extreme scenario (very high fire danger at WBI=5 and a 3 d fire duration) and for a mild scenario (medium fire danger at WBI=3 and a 1 d fire duration). We finally used the borders of the 28 Czech and 16 German municipalities situated within the study area to evaluate wildfire exposure on a low administrative division level.
2.7 Interactive web map and questionnaire design
We developed an interactive web-based wildfire exposure map to allow users and stakeholders to easily explore the potential exposure of settlements in the study area under the nine wildfire hazard scenarios. The interactive map was first prototyped in ArcGIS Online and, after receiving feedback from stakeholders, was implemented in the open-source software Leaflet to enable a more widespread and provider-independent hosting of the tool. The web map allows for interactive data exploration, such as zooming, panning, and view configuration. The map includes the nine wildfire hazard rasters, the residential Home Ignition Zone, the buildings, fire stations, transportation network, the historical fire ignition locations, the river network, the names of towns and villages located within the same 30 km circular buffer as the fire stations, and the burned area from the 2022 wildfire (Copernicus Emergency Management Service, 2022). Finally, the international border between Germany and the Czech Republic and the borders of the National Parks and Conservation Areas were also included.
To evaluate the usability of the interactive web map, a usability questionnaire was developed – an approach commonly used in similar contexts (e.g., Flink et al., 2011; Wang, 2014). The questionnaire included four parts: an introductory explanation of the map, participant profiling, a task-based activity, and follow-up usability questions. Participants were asked to identify a route from a specific settlement to its nearest fire station under a defined wildfire scenario and assess the settlement's exposure. They then rated the difficulty of this task on a 5-point Likert scale (1 = very easy, 5 = very difficult), followed by questions on the clarity of the map's bivariate legend and overall design. Two final open-ended questions gathered qualitative feedback. A usefulness questionnaire was additionally developed to assess whether the interactive map could support wildfire protection stakeholders in the study area. Its first part mirrored the usability questionnaire, with a language selection option added to the initial screen. Full English and German versions were provided, while a partial Czech version included a translated introduction followed by English-language questions. The second part collected information on participants' professional background, their link to the study area, and general familiarity with maps. The third part replicated the activity section from the usability questionnaire. In the final part, participants rated each map layer's relevance to their work using a 5-point Likert scale (1 = not relevant, 5 = highly relevant), and described potential use cases. Aside from the scale ratings, the questionnaire relied mostly on open-ended responses. A bilingual user guide (German/English) was attached to each email to assist unfamiliar participants.
2.8 Methodology for the evaluation of wildfire modelling
To assess the plausibility of the wildfire modelling approach used in this study, we evaluated whether FlamMap could reproduce spatially consistent short-term fire spread patterns during the first three days of the 2022 wildfire, under daily mean fire-weather conditions. For this evaluation, the first three days of the 2022 wildfire were modelled using three simulations, each lasting one day; the first simulation used the 2022 wildfire ignition as its ignition location, as well as the mean daily wind and fuel moistures of the first day of the 2022 wildfire (24 July 2022). The second simulation used a point layer describing the perimeter of the first modelled fire as its multiple ignition locations, as well as the mean daily wind and fuel moistures of the second day of fire (25 July 2022). The third simulation used a point layer describing the perimeter of the second day modelled fire as its multiple ignition locations, as well as the mean daily wind and fuel moisture of the third day of fire (26 July 2022). The River Elbe was assumed to act as a natural fire barrier in all simulations, as in Kudláčková et al. (2024). The usage of three different simulations was done to counter the inaccuracies that might develop when using one sole wind to represent varying wind conditions over multiple days, as was the case with the wind conditions of the 2022 wildfire. A time series of the mean daily wind velocities of the 2022 wildfire is displayed in Fig. 3, along with the daily WBI values illustrating the constantly changing wind direction:
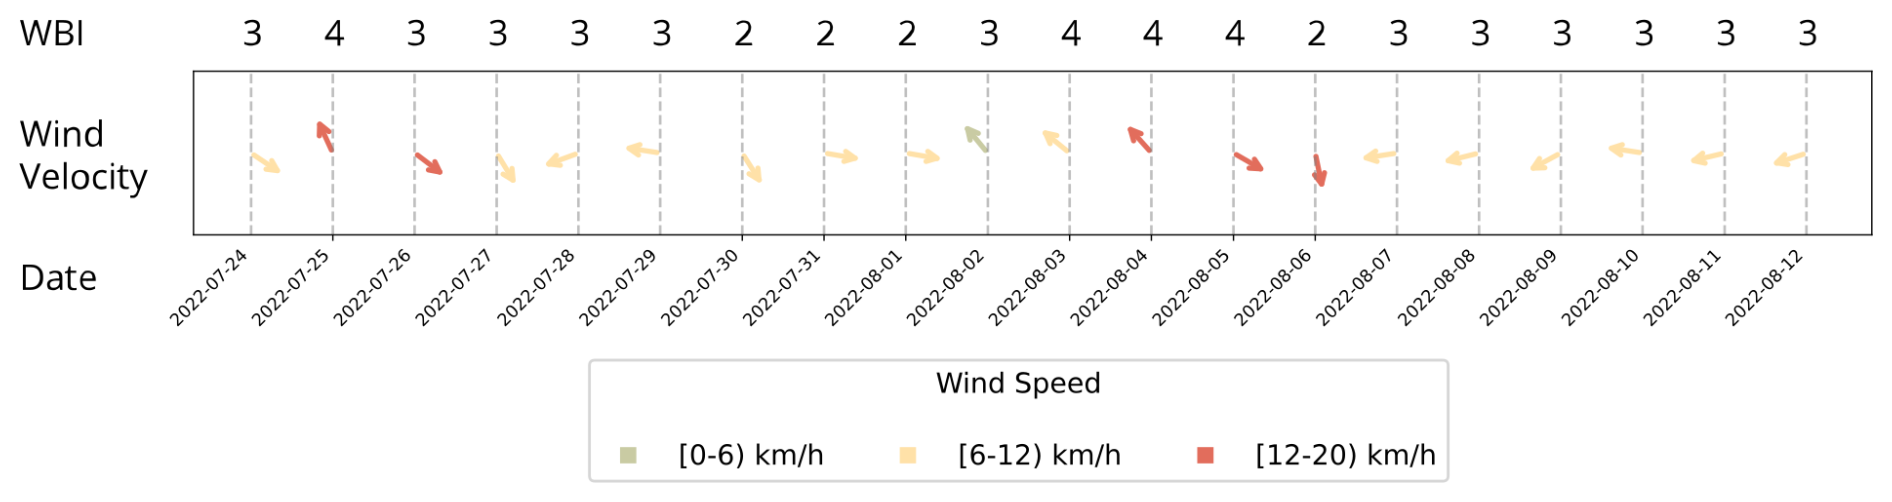
Figure 3Time series showing wind velocity (speed and direction), as well as daily WBI values throughout the duration of the 2022 study area wildfire.
The modelled daily fire perimeters were evaluated against the dates of first fire detection. As there are no ground-observed isochrones of fire spread available for this fire event, we combined active fire detections by the Moderate Resolution Imaging Spectroradiometer (MODIS; NASA MODIS Science Data Support Team, 2021) and the Visible Infrared Imaging Radiometer Suite (VIIRS) aboard S-NPP and NOAA-20 (formerly known as JPSS-1) (NASA VIIRS Land Science Team, 2020) within the boundary of the final burned area perimeter. VIIRS and MODIS active fire data are provided at spatial resolutions of 375 m and 1 km (at nadir), respectively. The final burned area perimeter is based on the map of the Copernicus Emergency Management Service, which has been checked and revised by in situ mapping of the National Park administrations. The burned area map was previously used by Beetz et al. (2024). For the evaluation, the available satellite-detected active fires for the first three days of the 2022 wildfire (24–26 July 2022) were merged and then classified into three daily layers. Each active fire point was then assigned a 500 m buffer as a compromise between the spatial resolutions of the VIIRS and MODIS sensors. The resulting buffered daily active-fire detections were overlaid with the final burned-area perimeter to approximate which areas of the final burned area were burning on each day. These daily maps of fire detection were then compared with the fire perimeters derived from the three aforementioned FlamMap simulations, which were likewise produced for the first three days of the wildfire.
3.1 Wildfire hazard under different weather and fire-duration scenarios
The nine wildfire hazard scenarios are illustrated in Fig. 4.
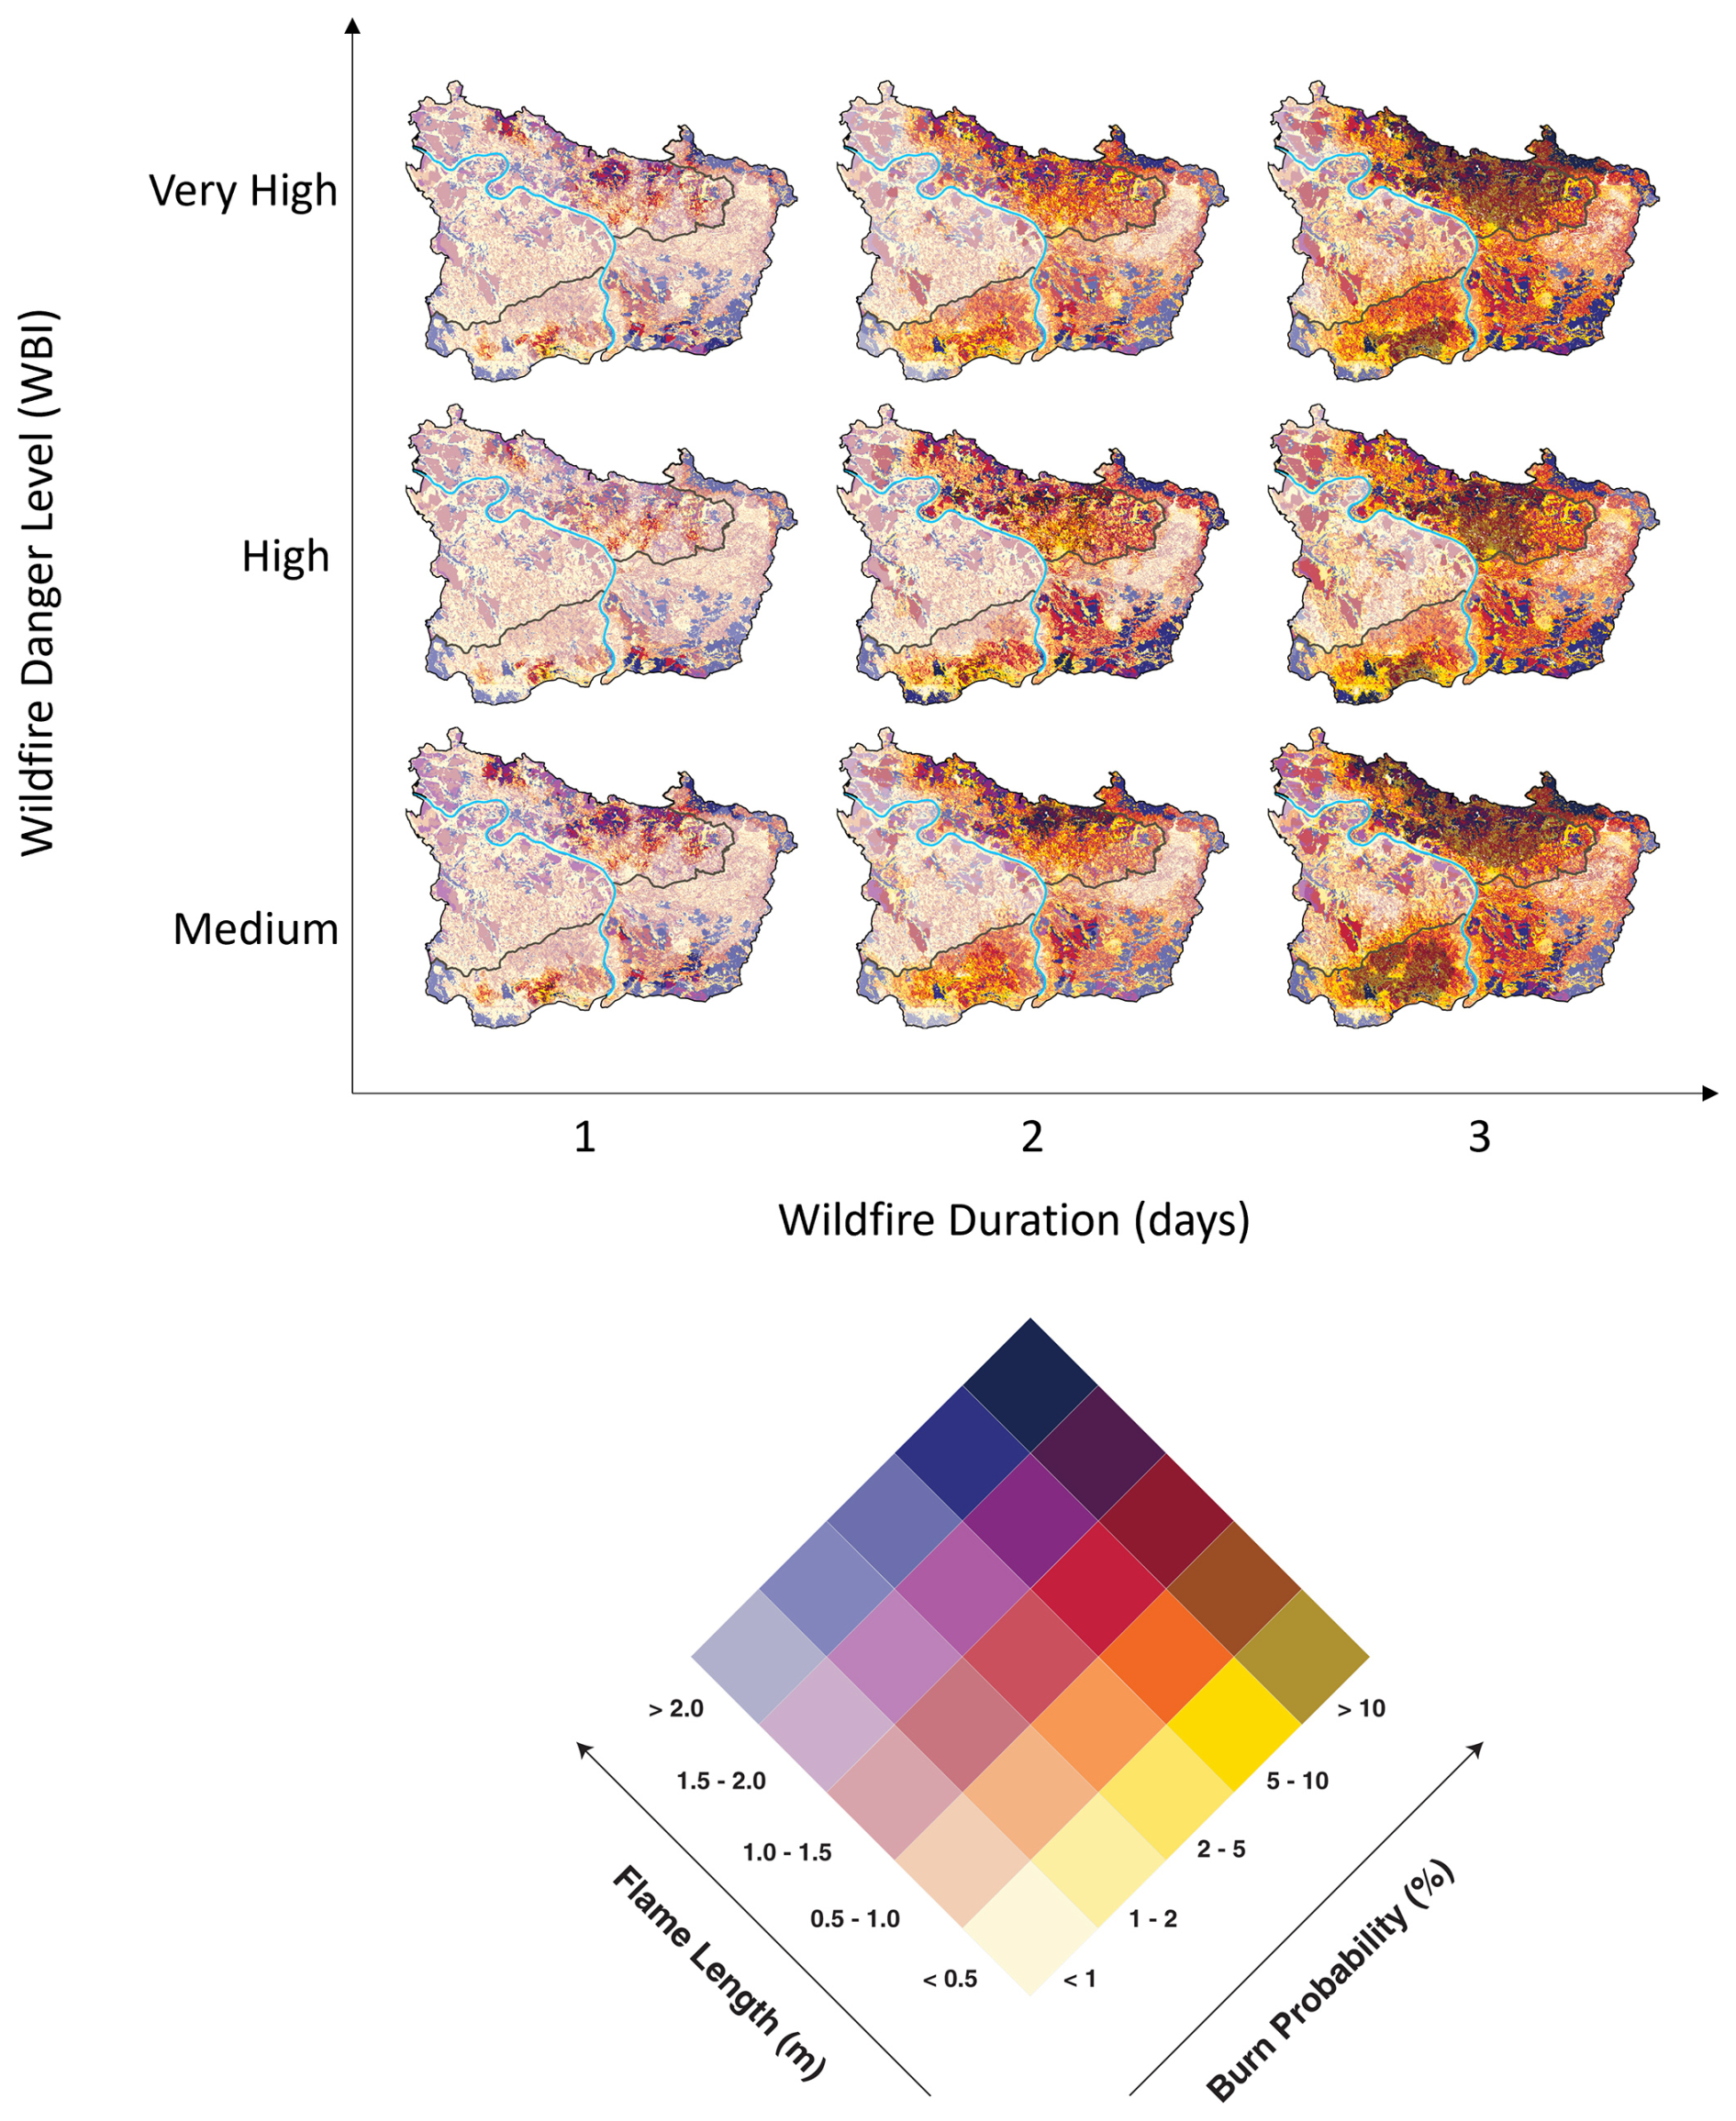
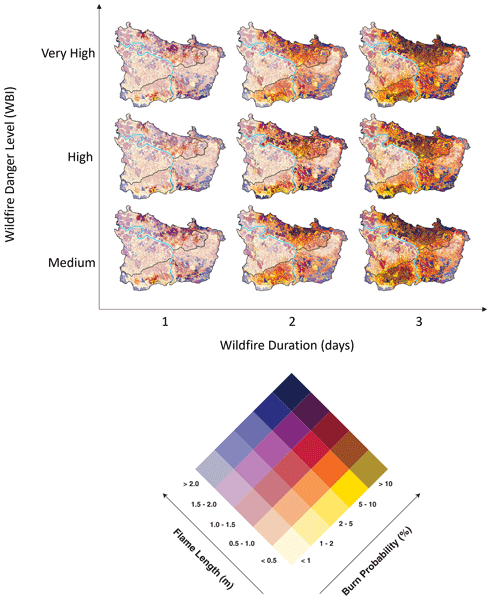
Figure 4The nine wildfire hazard rasters for three different levels of forest fire danger (WBI) and three different fire durations. The international border and the River Elbe are also superimposed. Each scenario simultaneously represents the flame length (FL) and burn probability (BP) classes. The legend's colours were created using the HSB (hue, saturation, and brightness) colour model. Hue was varied to visualise FL ranging from yellow (low flame lengths) to dark blue (high flame lengths). Saturation was varied to represent BP from light colours (low burn probability) to dark colours (high burn probability).
It is evident that high BP is primarily influenced by the duration of the simulation. Across all fire danger levels, the 2 d simulations consistently yielded higher BP values than the 1 d ones, and, similarly, the 3 d simulations consistently yielded the highest BP values in total. In contrast, FL is more sensitive to wildfire danger conditions (WBI) than to simulation duration, remaining relatively stable across all scenarios, with only minor variation as WBI increases and virtually no sensitivity to the length of the simulation. This difference is likely due to the nature of the two metrics: FL represents an instantaneous fire behaviour measure and is therefore less affected by time, whereas BP accumulates over the entire simulation. Since the same set of weather conditions was used to model dead fuel moisture across all simulations, differences in FL are primarily driven by the variation in wind conditions. However, the impact of wind is somewhat muted, as the prevailing wind directions are similar across all three fire danger scenarios – particularly the dominance of southern winds (see Appendix C).
Despite these general trends, some spatial patterns remain consistent across all nine scenarios. Specific areas – especially in the north and southwest of the study area – consistently show both high BP and high FL, indicating substantial wildfire hazard. The southeast consistently shows high BP, albeit with lower FL. There is a large, roughly triangular area in the German part of the study area, bounded by the Elbe and the international border, that consistently demonstrates low FL but contains some red and purple patches of land. These are agricultural areas where few ignitions occur. Patterns of BP can be better understood by examining the ignition locations used for the modelling in Fig. E1 in Appendix E. It is evident that there are two main clusters, one centred around the city of Děčín and the other located in the municipality of Bad Schandau, making areas surrounding them more likely to burn in the simulations. Finally, a consistent pattern across the scenarios is that wildfires rarely cross the Elbe River. While high BP values can be observed along both banks, they often do not extend across the river. This can be assumed to be an outcome of the prevailing western winds, ignition locations on the eastern bank, and the lack of a spotting component in the modelling. Each of the modelling scenarios also resulted in intermediate BP and FL maps. These can be seen in Appendix D for the example scenario of WBI=5 and duration=3 d.
3.2 Interactive web map
A typical view of the interactive web map is shown in Fig. 5. The map is available for download at https://doi.org/10.25532/OPARA-954 (Avouris, 2025). Upon first access, users are presented with a general overview of the study area, including the 30 km centroid buffer used for the support capability indicator layers. By selecting the appropriate checkboxes in the layer visibility menu, users can display these indicators, which highlight fire stations and the three types of paved routes. The wildfire hazard rasters are organised in a dedicated subsection of the layer menu. Here, radio buttons allow users to view one scenario at a time. If the Home Ignition Zone (HIZ) layer is enabled, it is overlaid on the selected hazard raster, masking areas outside the residential HIZs. To examine individual building exposure, users can zoom into a specific settlement and activate the buildings layer. Comparing the buildings layer with the 2022 wildfire boundary layer allows the identification of structures that were within the fire perimeter – such as in the village of Mezná. A dedicated legend button helps users interpret the hazard rasters. For example, in Mezná, several beige cells – assumed to represent non-burnable built-up areas – are interspersed with deep blue cells, indicating zones of highest wildfire hazard (i.e., highest FL and BP values), and therefore areas where parts of the settlement are potentially highly exposed. Additionally, a help button marked with a “?” opens a pop-up window that provides a more detailed explanation of the colour scheme and map functionality. A full description of the map's interactive features is available in Appendix F.
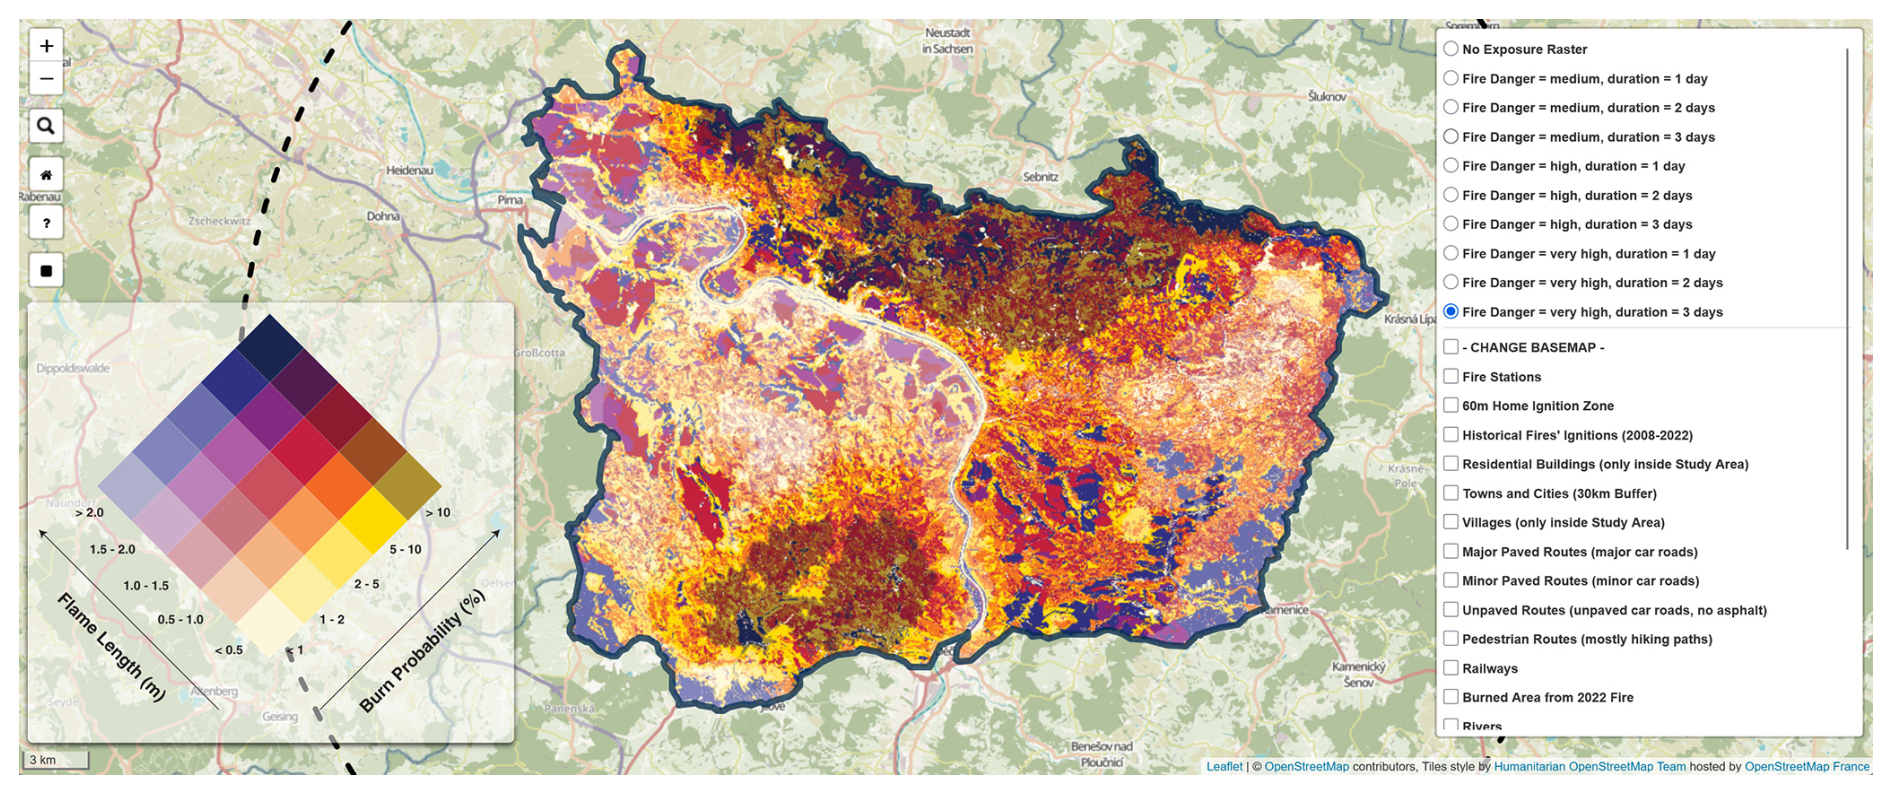
Figure 5A typical view of the interactive web map.
3.3 Wildfire exposure per municipality
The results reveal substantial variation in exposure between municipalities and between the two hazard metrics. Sebnitz exhibits the highest median BP at 15 %, followed closely by Mikulášovice, Hohnstein, Vilémov, and Rathmannsdorf. In contrast, the top five municipalities in terms of median HIZ FL are all in the Czech Republic, with values ranging from approximately 2.11 m in Srbská Kamenice to 3.51 m in Veselé.
Figure 7 extends the analysis by comparing the extreme scenario (WBI=5, 3 d duration) to a milder scenario (WBI=3, 1 d duration) for the municipalities highlighted in Fig. 6. The BP values show substantial variation between scenarios, with much lower BP under mild conditions. In contrast, FL remains relatively consistent across scenarios, reaffirming the earlier observation from Fig. 4 that FL is less sensitive to fire duration and WBI levels than BP. A complete list of BP and FL for these two scenarios for all municipalities, as well as a map of the municipalities and Home Ignition Zones, are shown in Tables E1 and E2 and Fig. E1 in Appendix E.
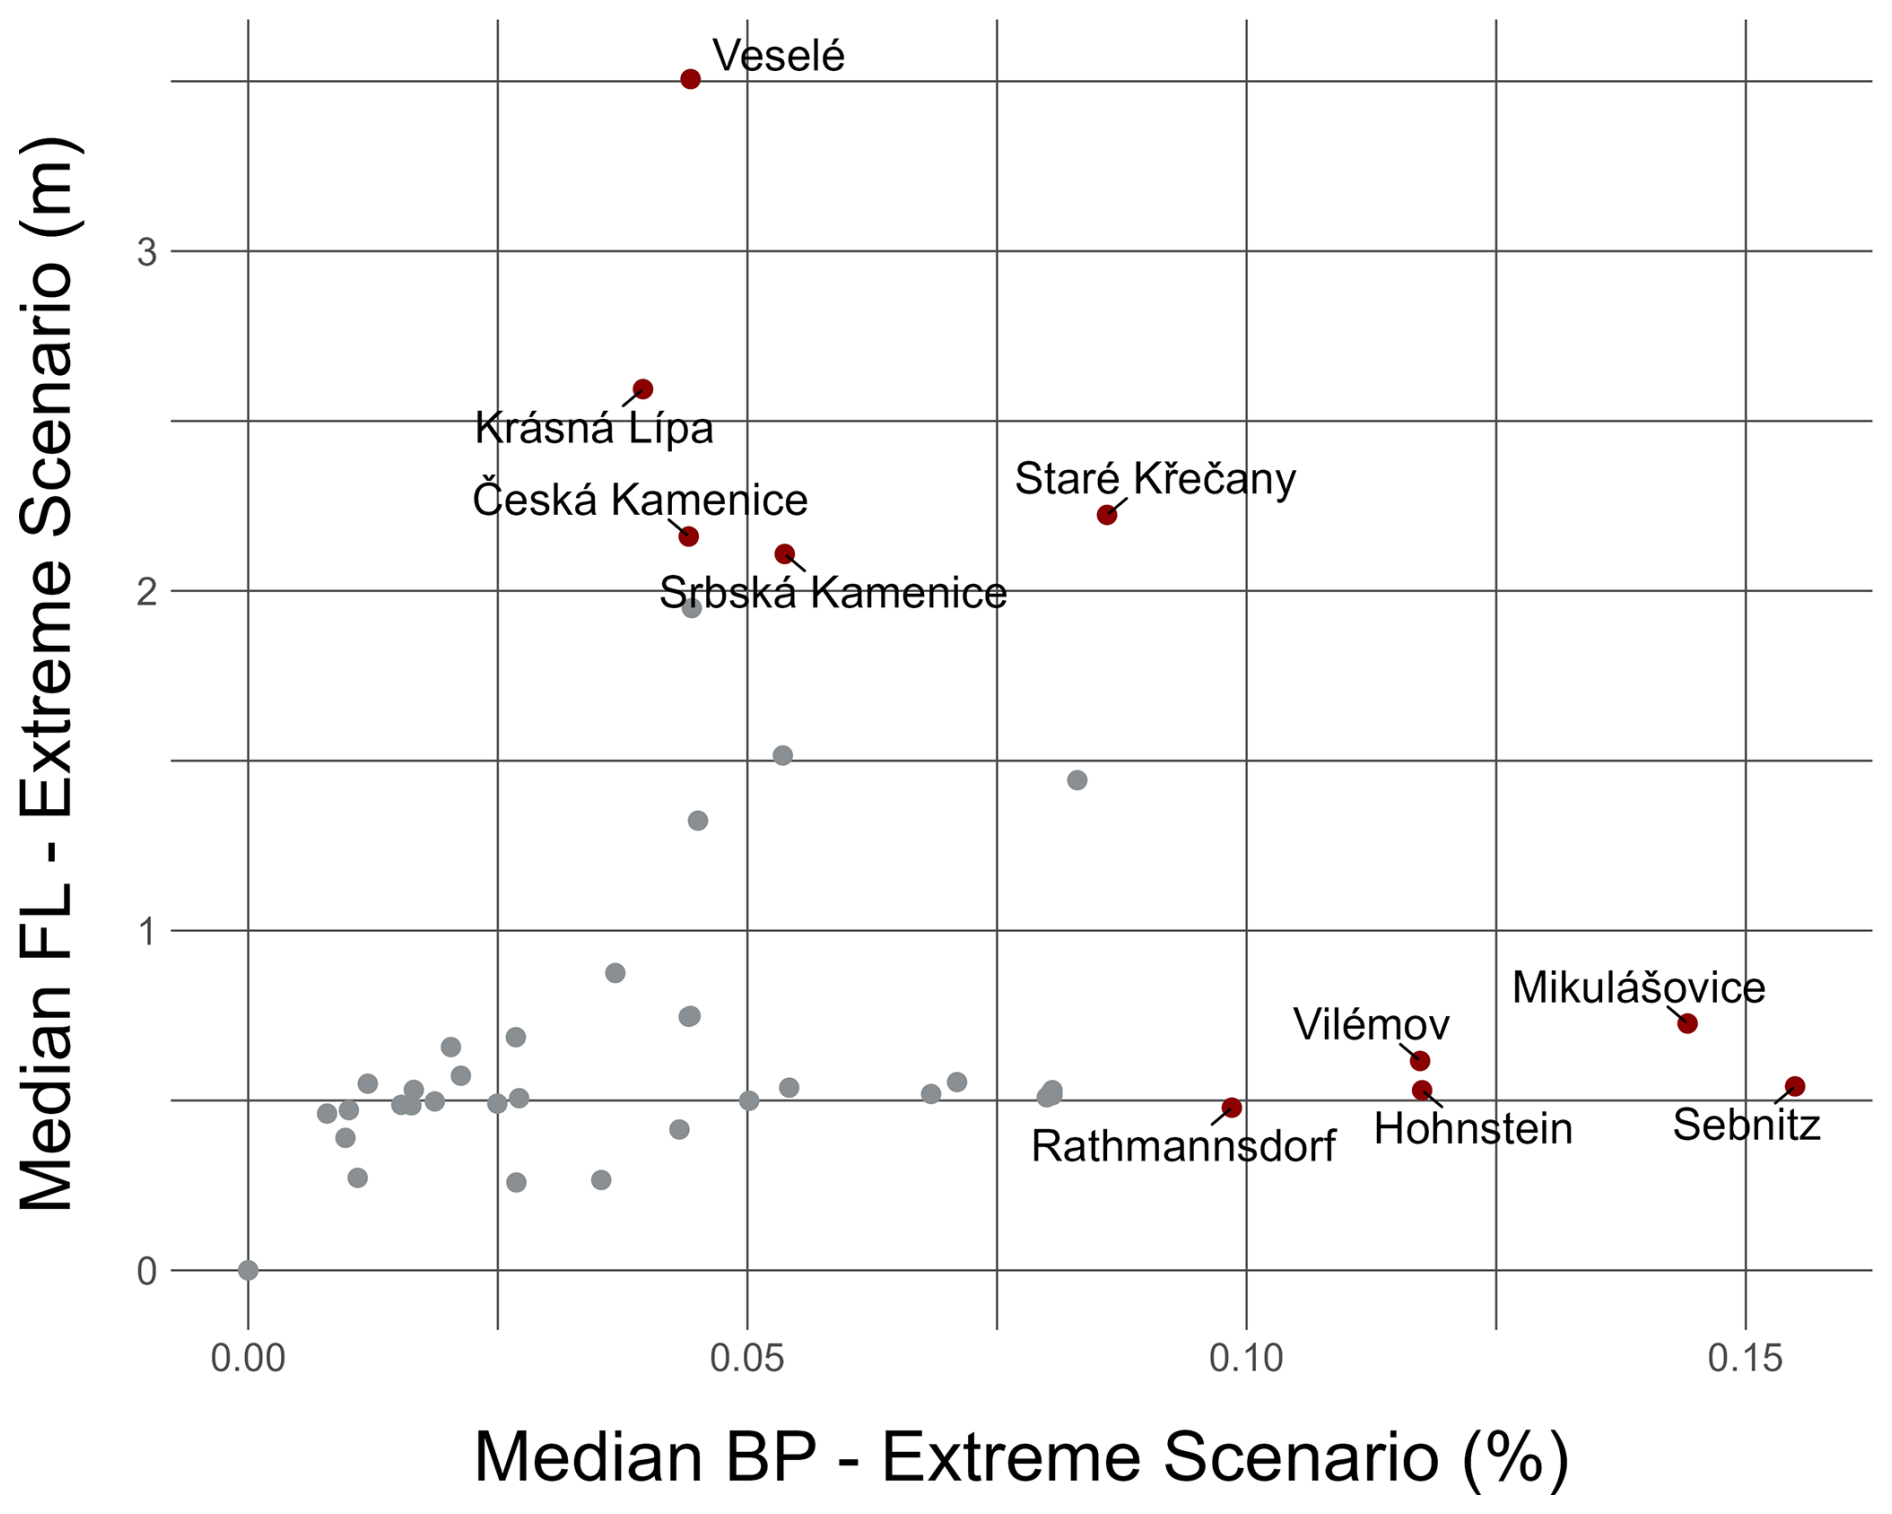
Figure 6Hazard values (BP, FL) for different municipalities based on their residential Home Ignition Zones under the extreme scenario of WBI=5 and a duration=3 d. The municipalities with the five highest median BP values and those with the five highest median FL values are highlighted in red.
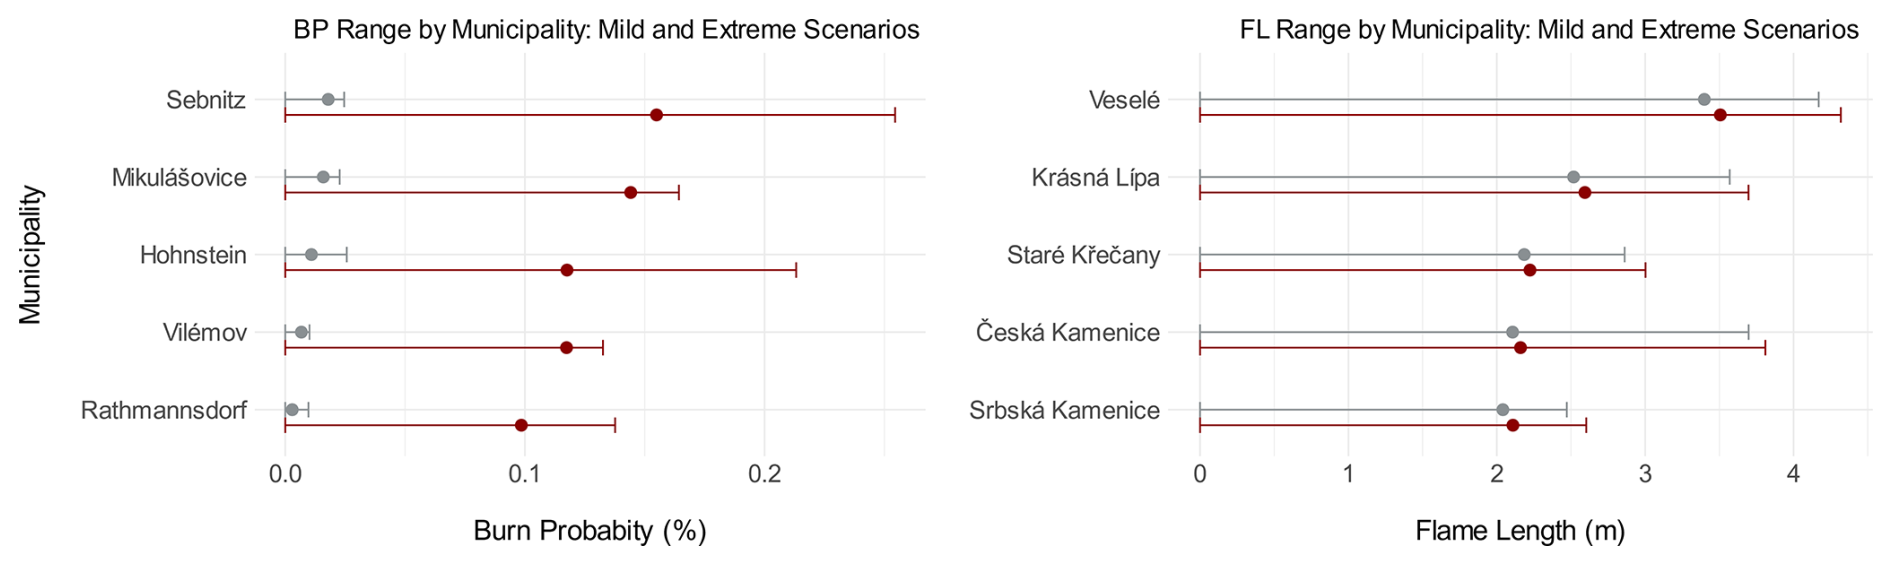
Figure 7The five municipalities of the study area with the highest median burn probabilities and flame lengths, based on their residential Home Ignition Zones, for two scenarios: an extreme scenario (WBI=5, duration=3 d; shown in red) and a mild scenario (WBI=3, duration=1 d; shown in grey). Each scenario is based on three FlamMap-MTT simulations (one per dominant wind direction) with 363 independent single-ignition fires per simulation (n=1089 fires per scenario). Median values are indicated with points, and vertical lines show the 5th–95th percentile range.
3.4 Evaluation of wildfire modelling
The comparison between the daily fire areas derived from VIIRS/MODIS active-fire detections and the fire perimeters produced by the three FlamMap simulations is shown in Fig. 8. Table 3 presents the confusion-matrix results and validation metrics for the comparison between simulated fire spread and satellite-based active-fire detections. Metrics utilising true negatives (TNs), such as overall accuracy, were not considered in the discussion because they would produce misleadingly high values due to the over-prominence of TNs.
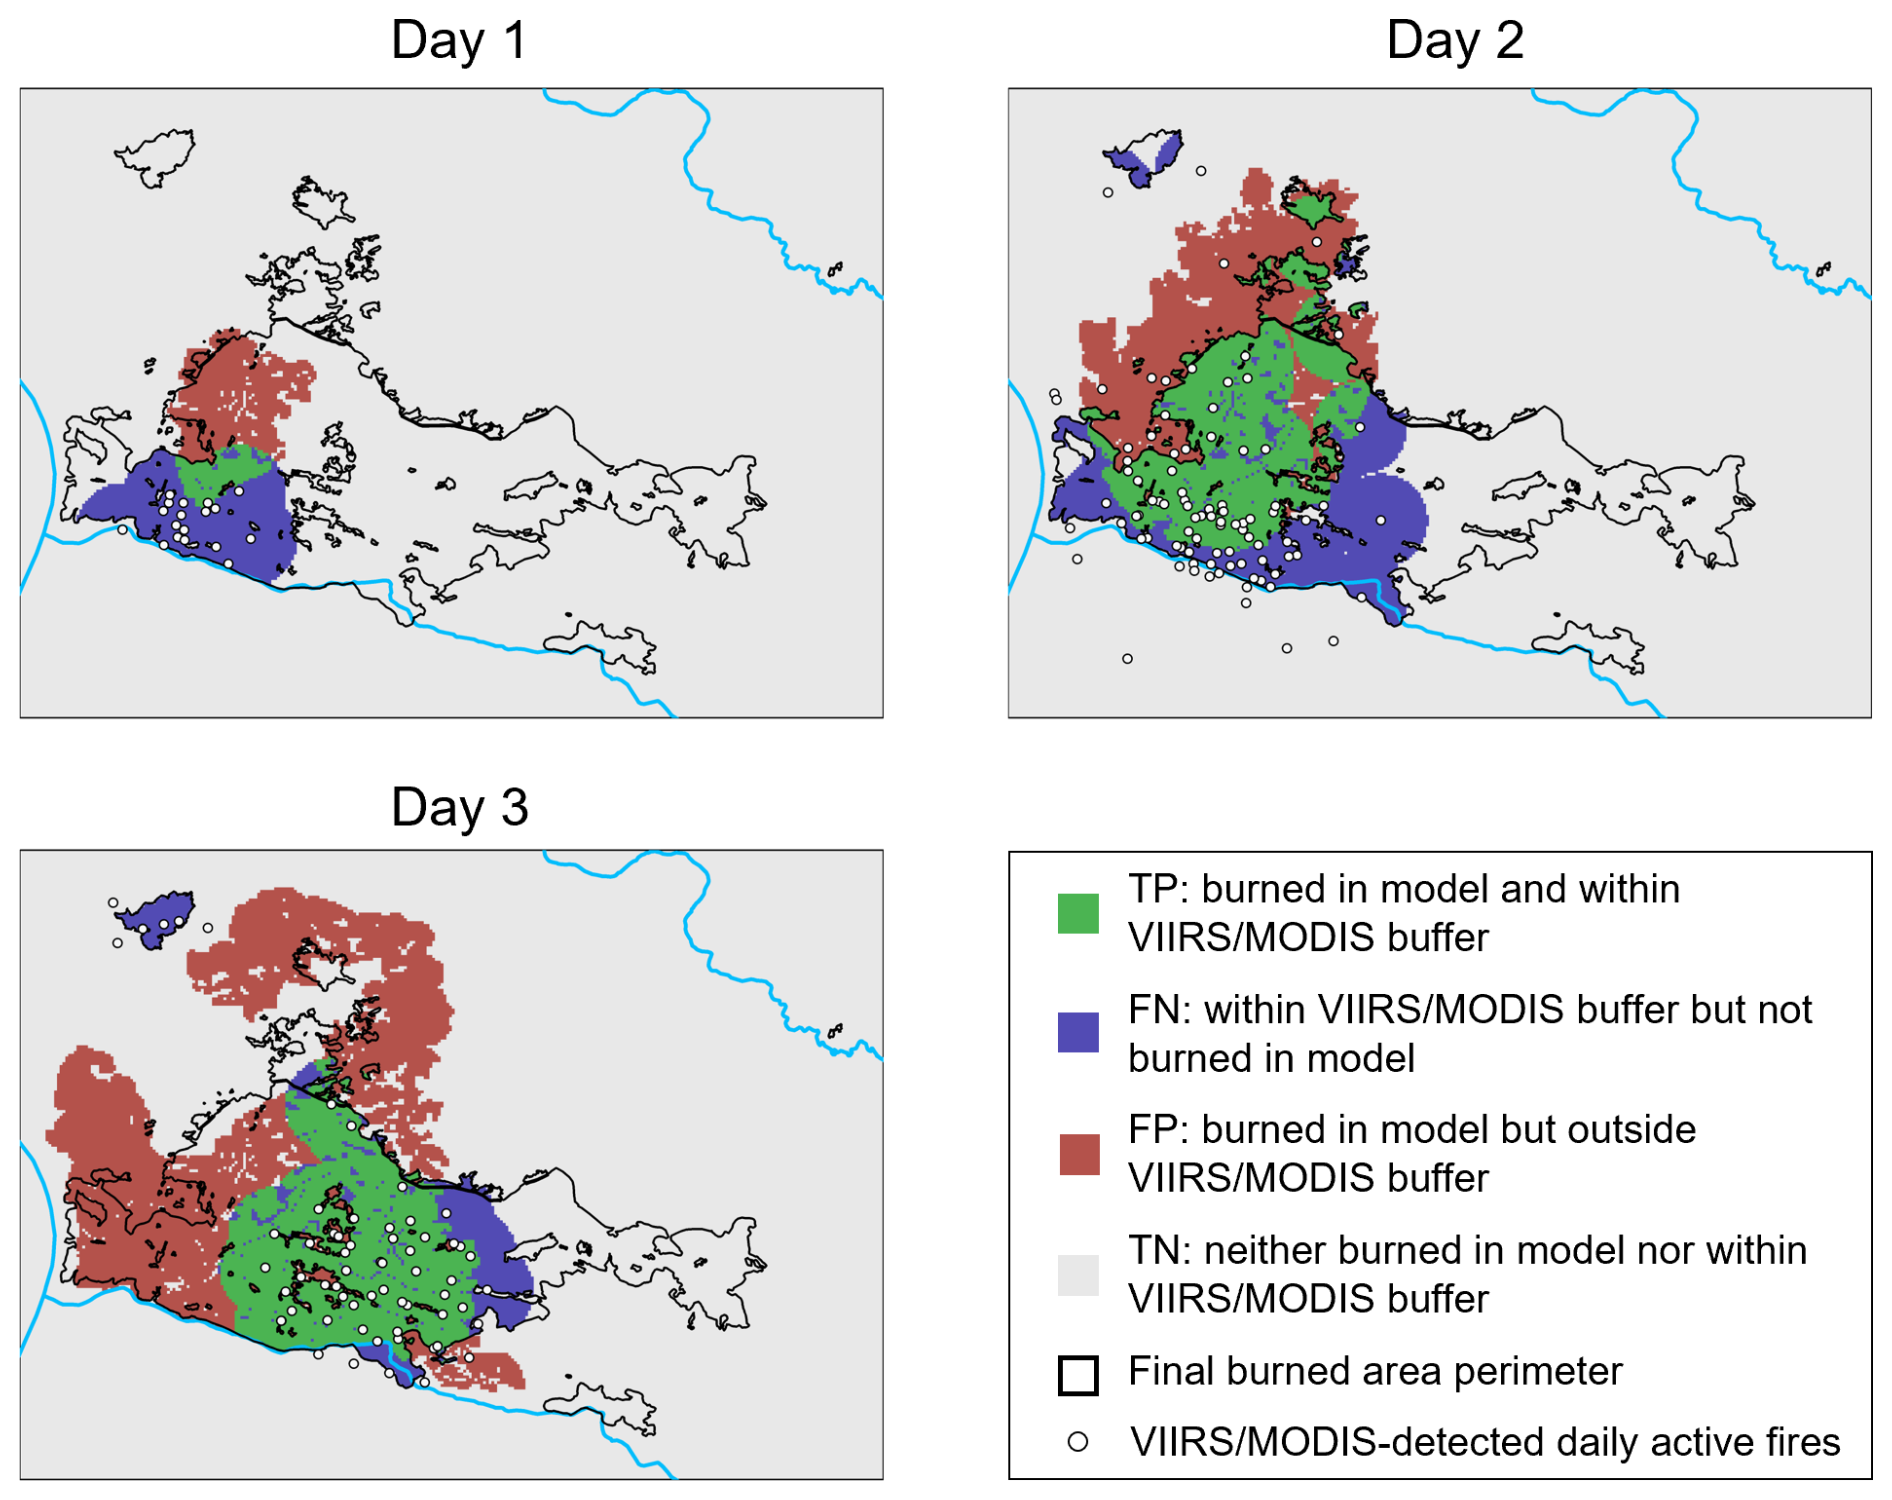
Figure 8Comparison of three daily FlamMap simulations with satellite-detected fires (TP true positive, FN false negative, FP false positive, TN true negative).
Table 3Confusion-matrix percentages and derived validation metrics comparing simulated fire spread with VIIRS/MODIS-based active-fire detections for the first three days of the 2022 wildfire, based on a random sample of 50 000 raster cells for each day.

The simulated fire spread increasingly resembled the satellite-derived active-fire detections as the wildfire progressed (Fig. 8). On Day 1, the overlap between simulated and observed fire areas was limited, with only 0.6 % of sampled cells classified as true positives and a Jaccard similarity of 0.106 (Table 3). By Day 2, the correspondence improved substantially, reflected in a higher true-positive percentage (6.5 %) and a Jaccard similarity of 0.355. On Day 3, the simulated fire perimeter continued to capture a large proportion of the observed fire extent, although the increased number of false-positive cells resulted in a slightly lower Jaccard similarity (0.315) than on Day 2. Omission error decreased steadily from Day 1 (0.824) to Day 3 (0.269), whereas commission error was lowest on Day 2 (0.501) and increased again on Day 3 (0.644).
3.5 Evaluation of usability and usefulness
Fifty completed usability questionnaires were collected from both GIS and cartography professionals and members of the general public. Profiling responses (Appendix G, Fig. G1) showed that most participants had at least moderate map-reading skills: 84 % and 86 % reported moderate to expert knowledge of static and interactive maps, respectively.
Task difficulty ratings differed by background. Among non-GIS users, responses centred on “3 – neutral” (median and mode = 3). GIS professionals, however, found the task easier: 61 % rated it as either “1 – very easy” or “2 – easy,” with a median and mode of 2 (see Fig. 9). This suggests a clear link between domain expertise and ease of use.
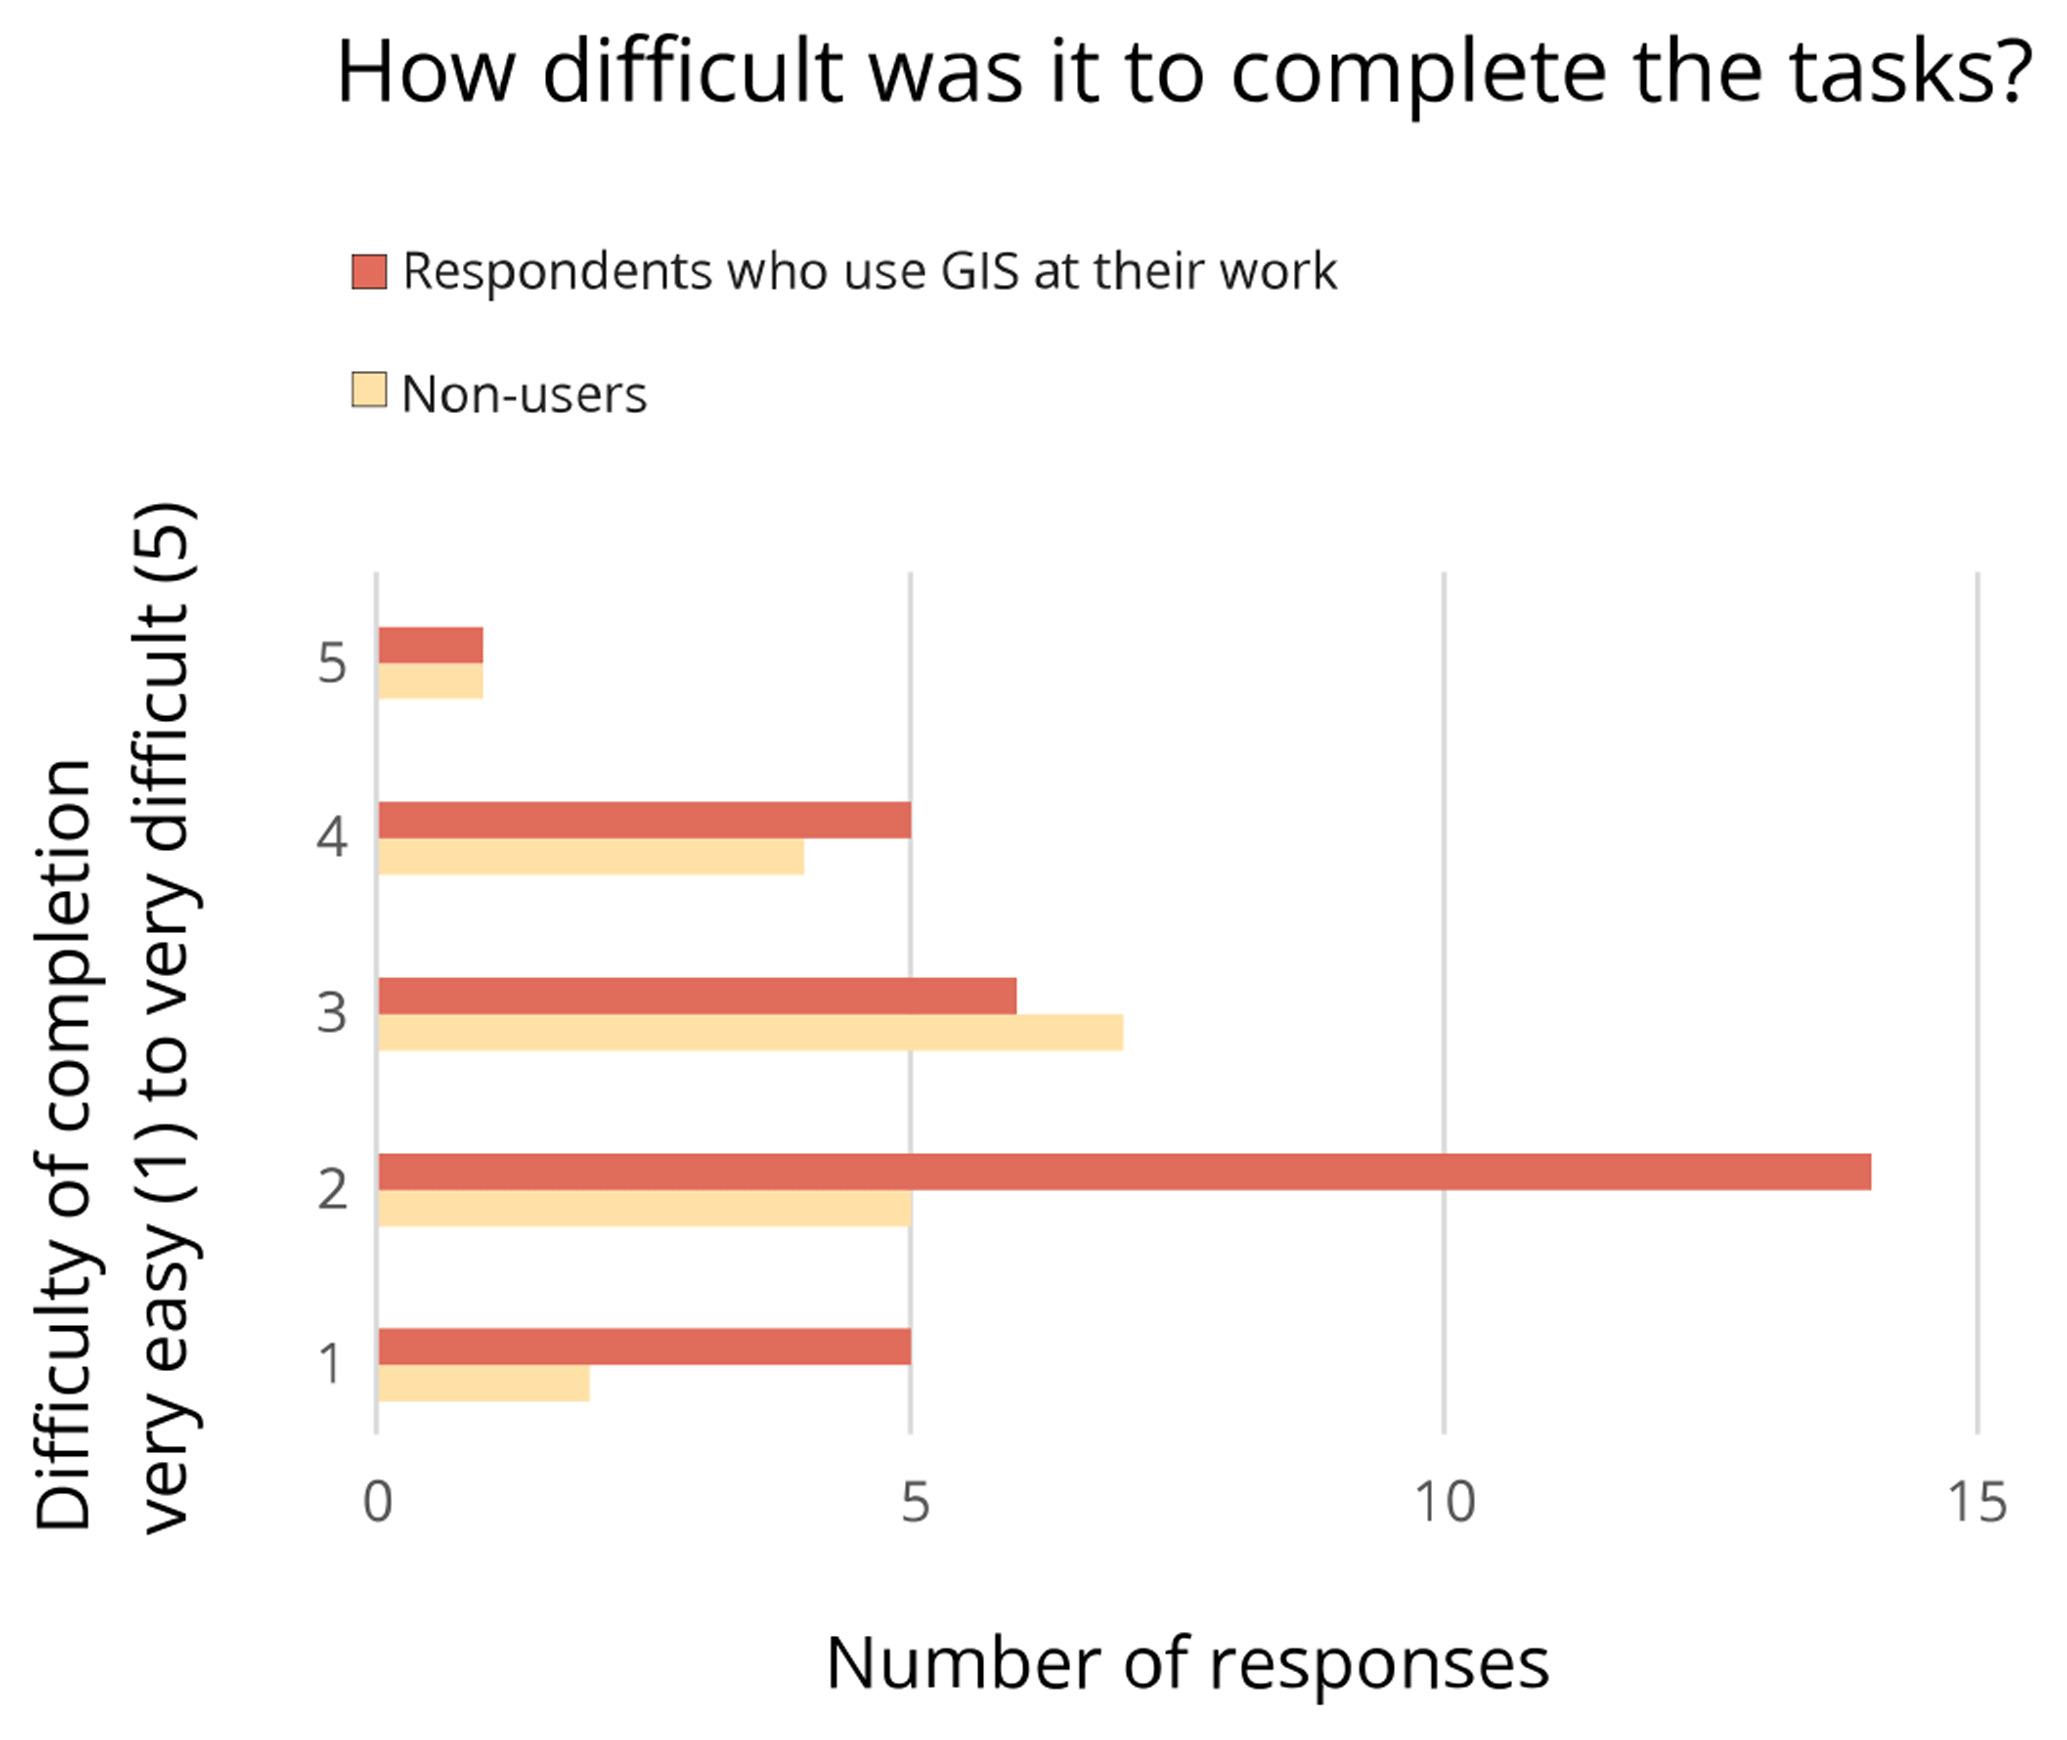
Figure 9Responses showing the difficulty of completion of the interactive map activity. The activity consisted of identifying a route from a specific settlement to its nearest fire station under a defined wildfire scenario and assessing the settlement's exposure.
Interpretation of the legend's colours was generally successful. For two key questions – one about the meaning of blue areas (Q1) and one about the role of colour intensity (Q2) – 78 % and 70 % of all participants answered correctly. GIS users scored higher, with 84 % and 81 % answering correctly, respectively (Fig. G2). Overall clarity of the bivariate legend was also rated positively (mean=3.86, median and mode = 4 – “easy”; see Fig. G3).
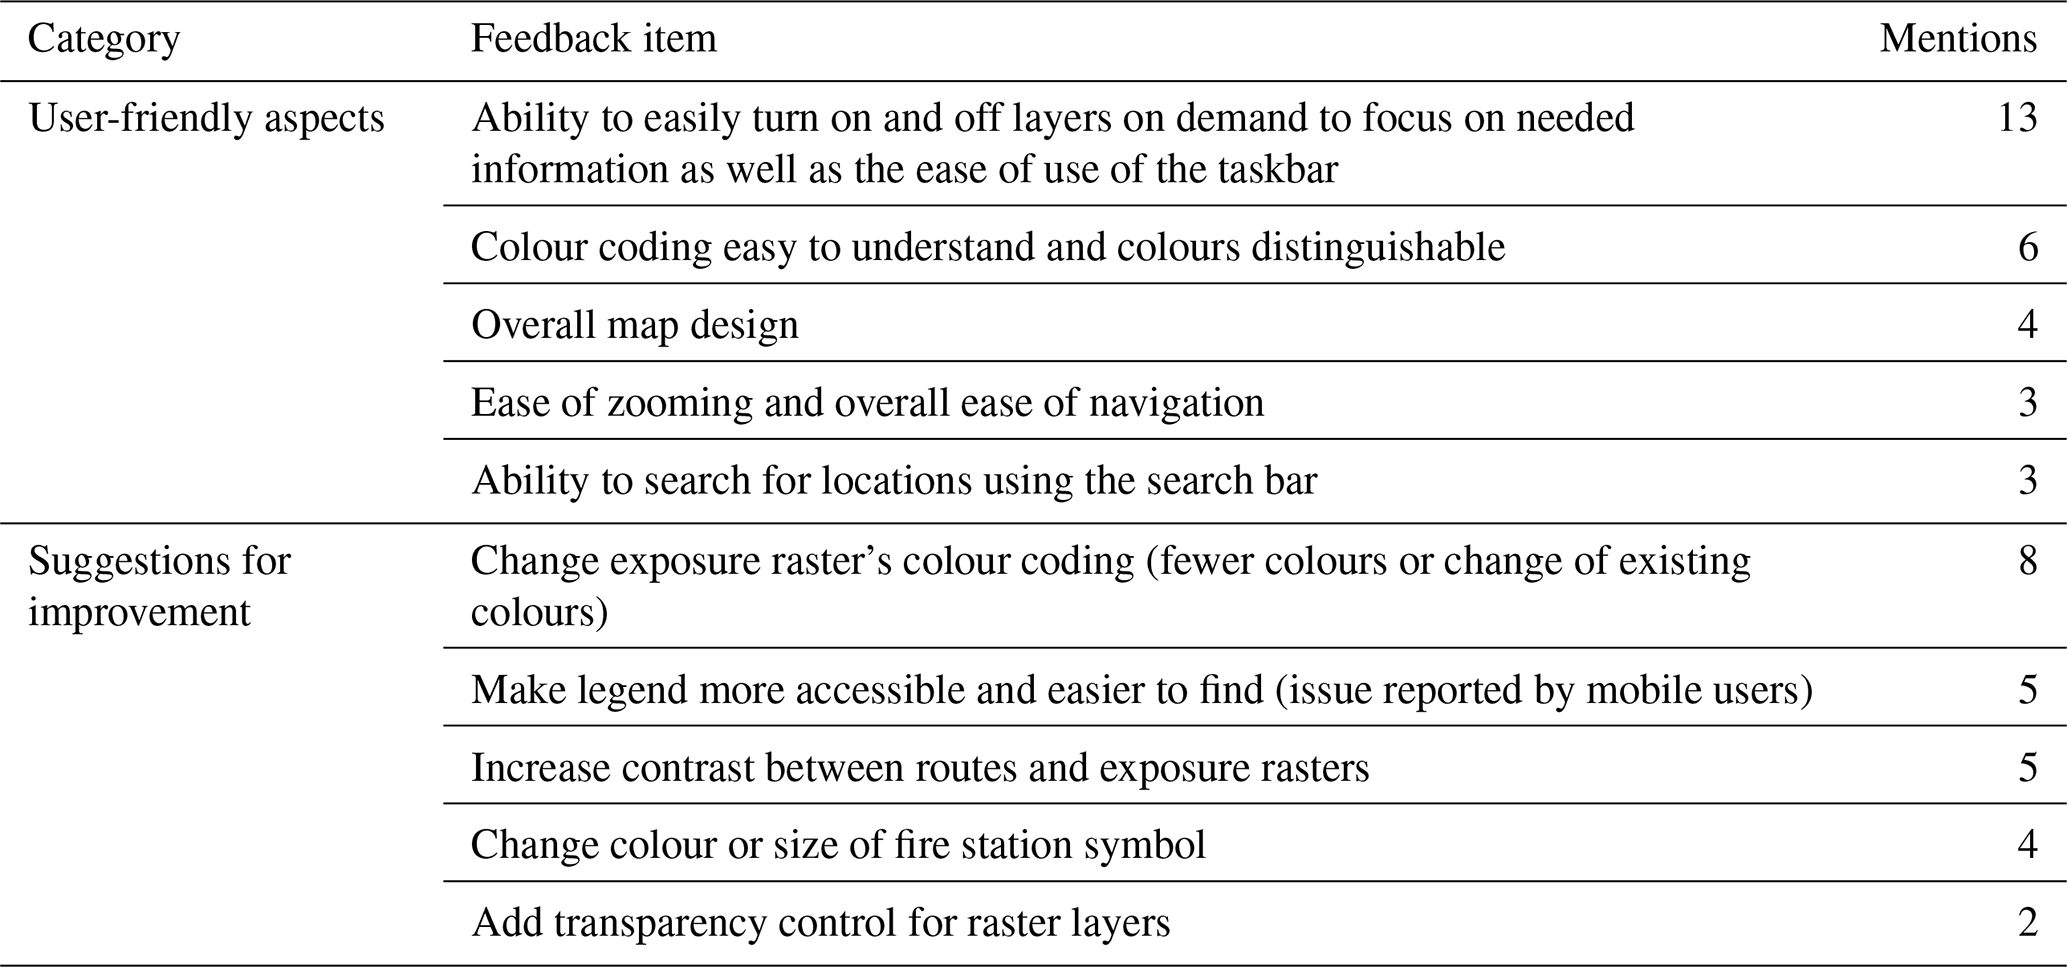
Finally, participants identified both strengths and design challenges of the map. The five most common suggestions for improvement are summarised in Appendix G – Summary of User Feedback. These findings are further discussed in Sect. 4.
Two stakeholders completed the usefulness questionnaire. Participant A is affiliated with the Bohemian Switzerland National Park Administration, and Participant B is affiliated with Germany's Virtual Operations Support Team (VOST) under the Federal Agency for Technical Relief (THW). Both had prior experience with interactive maps and completed all tasks.
Both participants rated the buildings and settlement layers as very or highly relevant. Fire stations and transportation networks were also valued, though to varying degrees (ratings ranged from 3 to 5). Opinions differed on the relevance of rivers – Participant A, familiar with the Elbe's fire-containment potential, rated them highly, while Participant B rated them as slightly relevant (2). Other layers, such as historical ignitions, the 2022 burned area, and conservation boundaries, were considered less relevant. The wildfire hazard rasters were viewed positively, with ratings ranging from moderately to very relevant. Participant A suggested adding terrain relief and slope layers to aid orientation and assess fire spread.
When asked about potential use cases, Participant A raised concerns about the wildfire modelling approach's accuracy and outdated or disconnected paths, suggesting limited applicability in their context. In contrast, Participant B identified future value: while the current map has limited relevance to VOST operations – due to its geographic scope and VOST's infrequent missions in eastern Germany – it could become more useful if expanded to other regions. Participant B suggested the development of printable or open-format (e.g., GeoPackage or raster) versions. This comment was one of the factors that motivated the decision to develop the map using open-source software.
4.1 Methodological contributions
This study presents a flexible workflow for wildfire exposure mapping in transboundary WUI regions using the FlamMap fire behaviour model, multi-scenario simulations, and open-access geospatial data. It resulted in one of the first interactive wildfire exposure maps for an area of Central Europe. Notably, this workflow integrates burn probability (BP) and flame length (FL) into a bivariate hazard classification that is visualised through a custom colour scheme and implemented in an interactive web-based map. This methodological approach is consistent with previous wildfire exposure studies that combine burn probability and fire behaviour metrics with the spatial distribution of exposed assets (e.g., Alcasena et al., 2017, 2021; Argañaraz et al., 2017; Haas et al., 2013), but its application to a transboundary Central European landscape remains comparatively rare.
An important methodological innovation was the use of WBI-based fire weather scenarios paired with varying fire durations to simulate realistic wildfire dynamics. The approach accounted for the most frequent wind directions associated with each WBI level, using WindNinja to model microscale topographic effects. While FlamMap's design limits wildfire simulations to a single wind direction and speed per simulation, a workaround was implemented to capture daily variability in wind conditions during the 2022 wildfire, as part of the evaluation of the methodology. Although this technique was not used to generate the exposure map itself, it demonstrated the feasibility of adapting FlamMap for multi-day wildfires. Fuel modelling was improved through local expert validation and field surveys. Expert input led to the amendment of two fuel models, and 83 ground truth surveys enabled refinement of 18 % of the fuel model classifications in the German portion of the study area. These efforts enhanced the reliability of the fuel input data, especially in a landscape undergoing significant ecological change due to bark beetle infestations. Finally, support capability indicators – namely the locations of fire stations and transportation infrastructure – were integrated into the exposure map using a 30 km buffer. This ensured that the locations of both local and nearby firefighting resources were visually represented, acknowledging the crucial role of rapid response in WUI wildfire contexts.
4.2 Key findings and interpretations
The empirical results indicate substantial spatial variation in wildfire exposure across the study area. Analysis of BP and FL patterns across the nine scenarios revealed that BP was primarily influenced by fire duration, whereas FL was more sensitive to fire weather conditions. While FL values remained relatively stable across scenarios, BP increased markedly with longer durations. The River Elbe consistently acted as a natural firebreak, with simulated fires rarely crossing it. At the municipal scale, the highest BP values were observed in three German (Sebnitz, Hohnstein, Rathmannsdorf) and two Czech (Vilémov, Mikulášovice) municipalities, indicating that wildfire likelihood was not restricted to one side of the border. This pattern can be explained by the spatial relationship between HIZs, ignition clusters, and dominant fire-spread pathways. These municipalities are located close to the dense ignition cluster around Bad Schandau or along likely spread corridors extending from it. Sebnitz represents the clearest example: although it is far larger than the Czech municipalities with high BP and contains numerous HIZs distributed across a broad area, many of these HIZs lie east and northeast of the Bad Schandau ignition cluster and can therefore be reached by modelled fires under the dominant wind scenarios. Similarly, Rathmannsdorf and Hohnstein contain HIZs close to ignition locations on the German side, while Mikulášovice and Vilémov are positioned farther along the same cross-border corridor of simulated fire spread. Moreover, the variation in BP across HIZs is much greater for Sebnitz and Hohnstein than for the other municipalities with high BP. This likely reflects their administrative structure, with numerous villages of different sizes and WUI configurations belonging to the same municipality, resulting in a broader distribution of exposure values. These results suggest that high BP is mainly controlled by the proximity and orientation of residential HIZs relative to ignition clusters and prevailing wind directions, rather than by national location alone. Finally, neither Bad Schandau nor Děčín experiences high BP. Although they host the two largest clusters of ignitions, their HIZs are often situated away from the paths taken by the fires and are large enough for the median BP values to remain low. The observed cross-border asymmetry in wildfire exposure may additionally reflect differences in forest structure and land-use management across the border. At the same time, ignition locations are not confined to one side; for example, the Bad Schandau ignition cluster in Germany was found to contribute to exposure in adjacent Czech municipalities. These findings underscore the need for international cooperation and data sharing between wildfire agencies across borders.
The observed contrast between BP and FL is also in line with previous wildfire exposure studies, where burn probability is typically interpreted as a likelihood metric and flame length or conditional flame length, as proxies for potential fire intensity and suppression difficulty (e.g., Alcasena et al., 2017; Sá et al., 2022). The observed relationship between BP and FL partly agrees with previous wildfire exposure studies, but also highlights differences related to the Central European setting of this study. Similarly to Alcasena et al. (2017), BP and FL did not necessarily peak in the same areas: in northern Spain, high BP was linked mainly to fast-spreading herbaceous fuels such as rangelands and cereal crops, whereas the highest conditional flame length values occurred in shrublands and dense forests on slopes aligned with dominant winds. In our study, a comparable decoupling occurs, with some agricultural areas showing high potential FL but low BP due to their limited connection to ignition locations and thus to simulated fire pathways. However, unlike the Mediterranean case studies of Sá et al. (2022) and Alcasena et al. (2021), where shrublands, pine forests, and unmanaged protected areas were major contributors to high intensity or high exposure, high exposure in our study is more strongly shaped by the spatial distribution of ignition clusters, HIZs, wind direction, and cross-border forest structure. This suggests that, in this Central European WUI landscape, exposure depends on local ignition placement, fuel continuity, and the proximity of settlements to simulated fire paths.
The validation of the wildfire modelling approach using satellite-detected active fires during the 2022 wildfire demonstrated that the modelling approach can approximate observed fire spread with reasonable accuracy. The overlap with actual burned areas was high, especially for the third day of the fire. On Day 1, the model shows very limited correspondence with the areas identified from VIIRS/MODIS detections, reflected in the high omission (0.824) and commission (0.788) errors. Consequently, the Jaccard similarity is low (0.106), indicating only minor spatial overlap between modelled and detection-based fire areas. This is likely caused by the frequently changing wind directions during this day as reported by local firefighters, which is however not represented in the wind data used here. On Day 2, the model reproduces the general spatial pattern of fire spread more successfully, with a substantially higher Jaccard similarity (0.355). Both omission (0.448) and commission (0.501) errors remain moderate, suggesting that while the model captures a considerable portion of the observed burning, it still both misses and overpredicts parts of the burned area. On Day 3, omission error decreases further (0.269), indicating that most of the detection-based fire areas are captured by the simulation. However, commission error increases to 0.644 and false positives are substantially higher than on Day 2, reflecting a tendency of the model to overestimate the spatial extent of fire spread, which might be related to the success of firefighting operations that were not represented in the model. Overall, these results suggest that the model captures the general progression of the wildfire during the later stages of the event, although notable discrepancies between simulated and observed fire extents remain. In terms of the area lying in Germany shown in Fig. 8, it should be noted that the modelled fire spread beyond the limits of the actual 2022 wildfire, which could be attributed to the strong defensive efforts mounted by firefighters on the German side of the border. The explicit representation of fire-suppression activities, which could not be fully modelled in FlamMap, is available only in the FSim software as recently described by Finney et al. (2025).
The usability study involving 50 participants showed that the map was generally perceived as easy to use, particularly by GIS professionals. Participants appreciated features such as toggling layers and zooming, though some reported difficulties interpreting the bivariate colour legend, especially on mobile devices. Feedback also highlighted the need for improved contrast between certain layers and for better legend accessibility. The usefulness evaluation, while limited to two stakeholders, offered contrasting perspectives. Participant B, from Germany's VOST, identified potential future applications of the map, especially if its geographic scope were expanded. Participant A, from the Bohemian Switzerland National Park Administration, expressed scepticism regarding the accuracy of the transportation data, which highlights the need for an updated mapping of forest roads and paths including information on their traversability for different classes of trucks and vehicles. Importantly, both participants rated the layers representing settlements and fire stations as highly relevant, supporting the inclusion of these elements in future operational tools.
4.3 Limitations
Some limitations constrained the scope of this study's results. Most notably, the lack of historical fire perimeter data for the study area limited the validation of the modelled scenarios. While the 2022 wildfire provided one opportunity for comparison, more cases would be needed to systematically assess model accuracy across varied conditions. We acknowledge that our evaluation approach can only approximate the assessment of actual fire spread because active fire products contain omission and commission errors, which are caused by the limited temporal overpass of the satellites, the under-detection of low-intensity and small fires, and the coarse spatial resolution. Therefore, the evaluation should be interpreted as an informed consistency check rather than as a strict validation of accuracy. The assumption of constant wind in the primary FlamMap simulations also introduces biases and uncertainty into the scenarios, especially for longer-duration wildfires. Although a workaround was tested, it was not applied to the hazard rasters used in the exposure map, potentially underestimating fire spread in complex wind scenarios. This is especially important in this study area, where energy emissions during fires together with the complex topography of small valleys and high rock cliffs likely cause strong local pyrogenetic circulation features. Accounting for such fire-atmosphere feedbacks requires the coupling of a fire spread model with an atmospheric large eddy simulator. As up-to-date data on canopy structure representative of bark-beetle-affected conditions were unavailable, crown fires and thus spotting were not modelled. Consequently, fire spread and intensity may be underestimated under extreme weather, especially where firebrand transport could enable rapid downwind growth or cross-barrier spread. The unavailability of detailed information on the status and equipment of fire stations also limited the representativeness of the support capability indicators. The evaluation of map usefulness was constrained by low response rates; only two of the contacted stakeholders responded. While their feedback was insightful, it cannot be considered representative of the broader emergency response community. Finally, data inconsistencies – such as outdated or misclassified roads – underscore the need for continuous stakeholder engagement throughout the data preparation process.
4.4 Future directions
Future wildfire exposure assessments in Central Europe and comparable regions should prioritise the integration of dynamic vegetation and disturbance data, particularly in forest landscapes affected by disturbances such as bark beetle outbreaks or windthrow. Field validation and expert consultation should be embedded in the workflow from the outset, not only during post-processing stages. Developing modular workflows that can easily accommodate new data inputs – such as updated fuel models, canopy characteristics, or fire station capacities – would enhance the adaptability and operational relevance of the exposure mapping process, particularly across seasons when fuel types and weather conditions vary. Additionally, improving crown fire modelling by incorporating canopy structure data (e.g., stand height, canopy base height, and crown bulk density) would allow for more accurate intensity estimation.
We used weather data from a meteorological station in the centre of the study region and assumed that this station is representative of the entire area. However, given the complex topography and elevation differences, micro-climatic conditions are quite different in the study region (Wild et al., 2019) which also affects fuel moisture (Kranz et al., 2025). In addition, heat fluxes from the fire, in conjunction with the small-scale complex topography, cause local circulation patterns that require coupled fire spread-atmosphere models in future studies to accurately represent fire dynamics in this region.
Additionally, expanding the use of fire weather indices beyond WBI – for example, using the Canadian Fire Weather Index in other regions – would support broader applicability. Furthermore, future work could explore a weighted bivariate metric for hazard. While the symbology developed in this study accounts for both variables, an integrated single hazard index – similar to that used by the US Department of the Interior and US Department of Agriculture in the Interagency Fuels Treatment Decision Support System (IFTDSS) – might provide additional insights. Such an approach could highlight areas that currently receive low hazard classifications under the present scheme but still present considerable hazard potential, such as agricultural areas with high potential flame length yet few nearby ignitions. In such cases, these areas might warrant a higher hazard classification than, for example, locations with high burn probability but low flame length.
From a user perspective, enhancing accessibility is essential. Open-access and licence-free versions of the exposure map should be provided, including static maps or raster data downloads. This would support wider use across agencies that lack access to proprietary platforms. Stakeholder feedback suggests that open-source solutions improve uptake in decentralised emergency services.
This study presented the development of an interactive wildfire exposure map for a transboundary area of Germany and the Czech Republic consisting of two National Parks and two Conservation Areas. Such mapping in that area is still at a relatively early stage, but it is an area where wildfires are expected to become an ever-increasing threat due to climate change. Wildfire scenarios were devised based on local historical weather and classified based on WBI values and wildfire duration. These scenarios were then converted into hazard rasters and combined with settlement data, showcasing which human settlements are potentially most exposed to wildfires in the study area. The modelling results were subsequently integrated into a web-based interactive map. The modelling approach was evaluated against satellite-derived active-fire detections, while the exposure map was evaluated for its usability and usefulness. The results of the usability evaluation have shown that the design workflow of the interactive map is promising, and that the resulting product, though it presents complex information, shows it in an understandable way. The usefulness questionnaire revealed the need to include stakeholders in such research in different ways, and to generally engage local stakeholders and experts from an early stage and throughout the research process. Moreover, significant work remains to be done in order for future research to have access to adequate historical wildfire data, indispensable for evaluating the accuracy of the wildfire modelling approach. Finally, the produced map contributes to the preparation of accurate and effective disaster risk management strategies for this area of Central Europe.
Table A1Dead fuel moisture values (%) used for non-bark-beetle-affected (beech) stands under WBI 3–5 conditions.
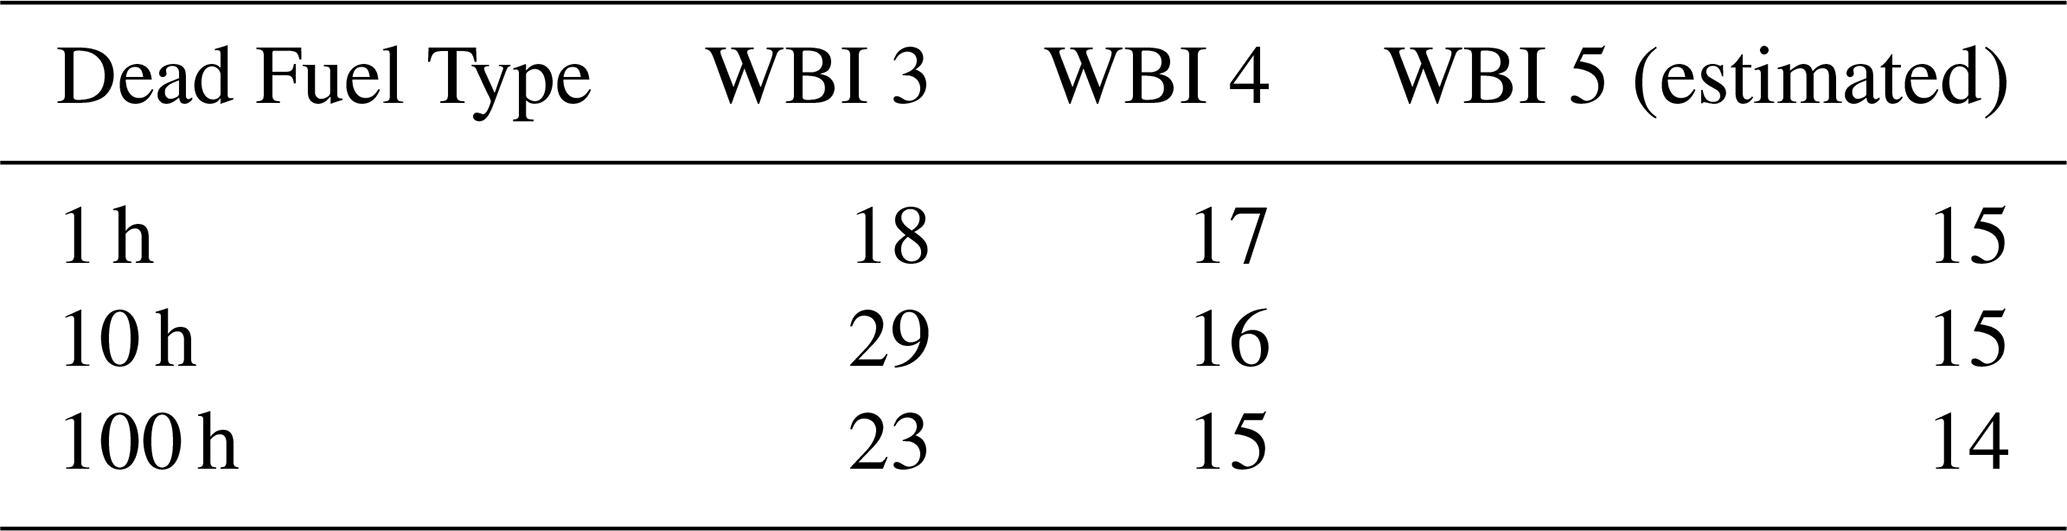
Table A2Dead fuel moisture values (%) used for bark-beetle-affected stands (spruce) under WBI 3–5 conditions.
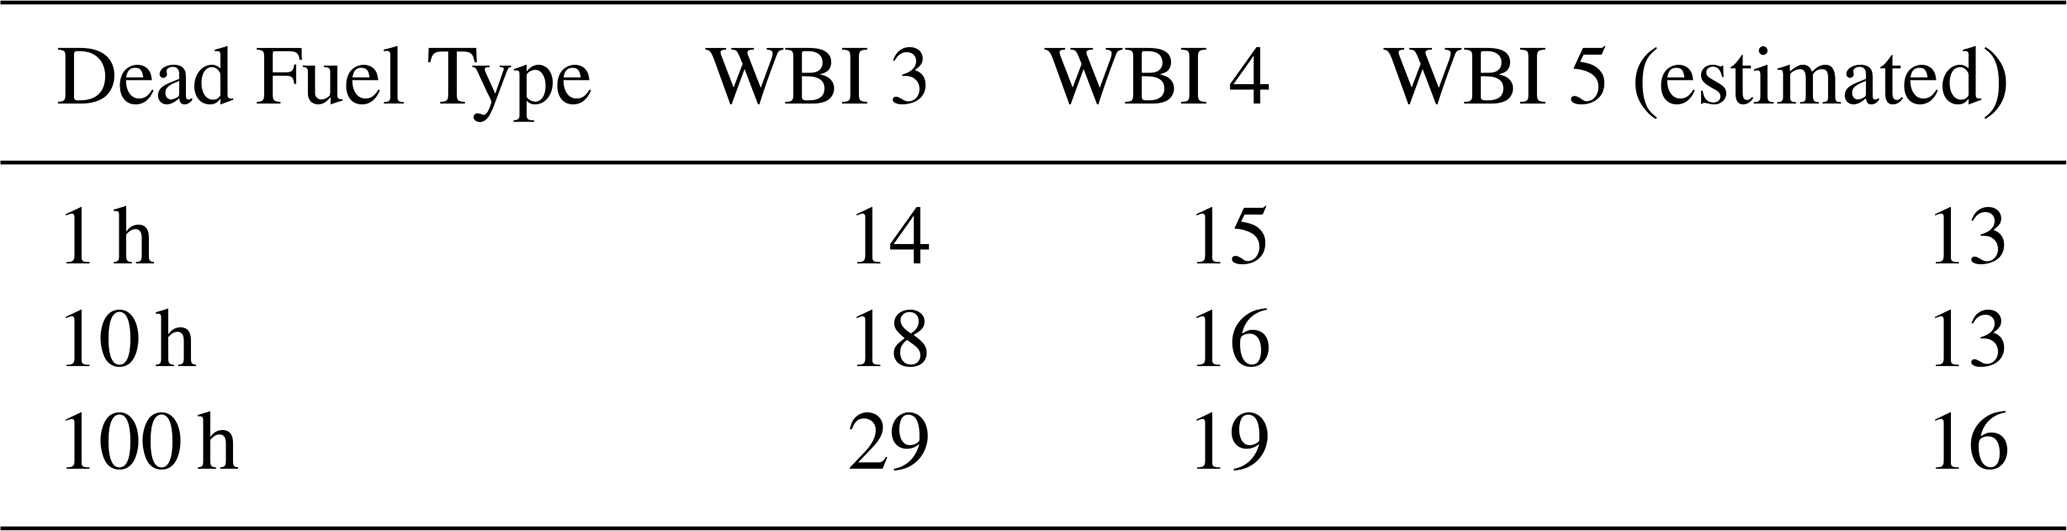
Table A3Observed 10 h fuel-stick moisture (%) for beech and bark-beetle-affected stands under WBI 3–5 conditions. Data derived from Kranz et al. (2025).

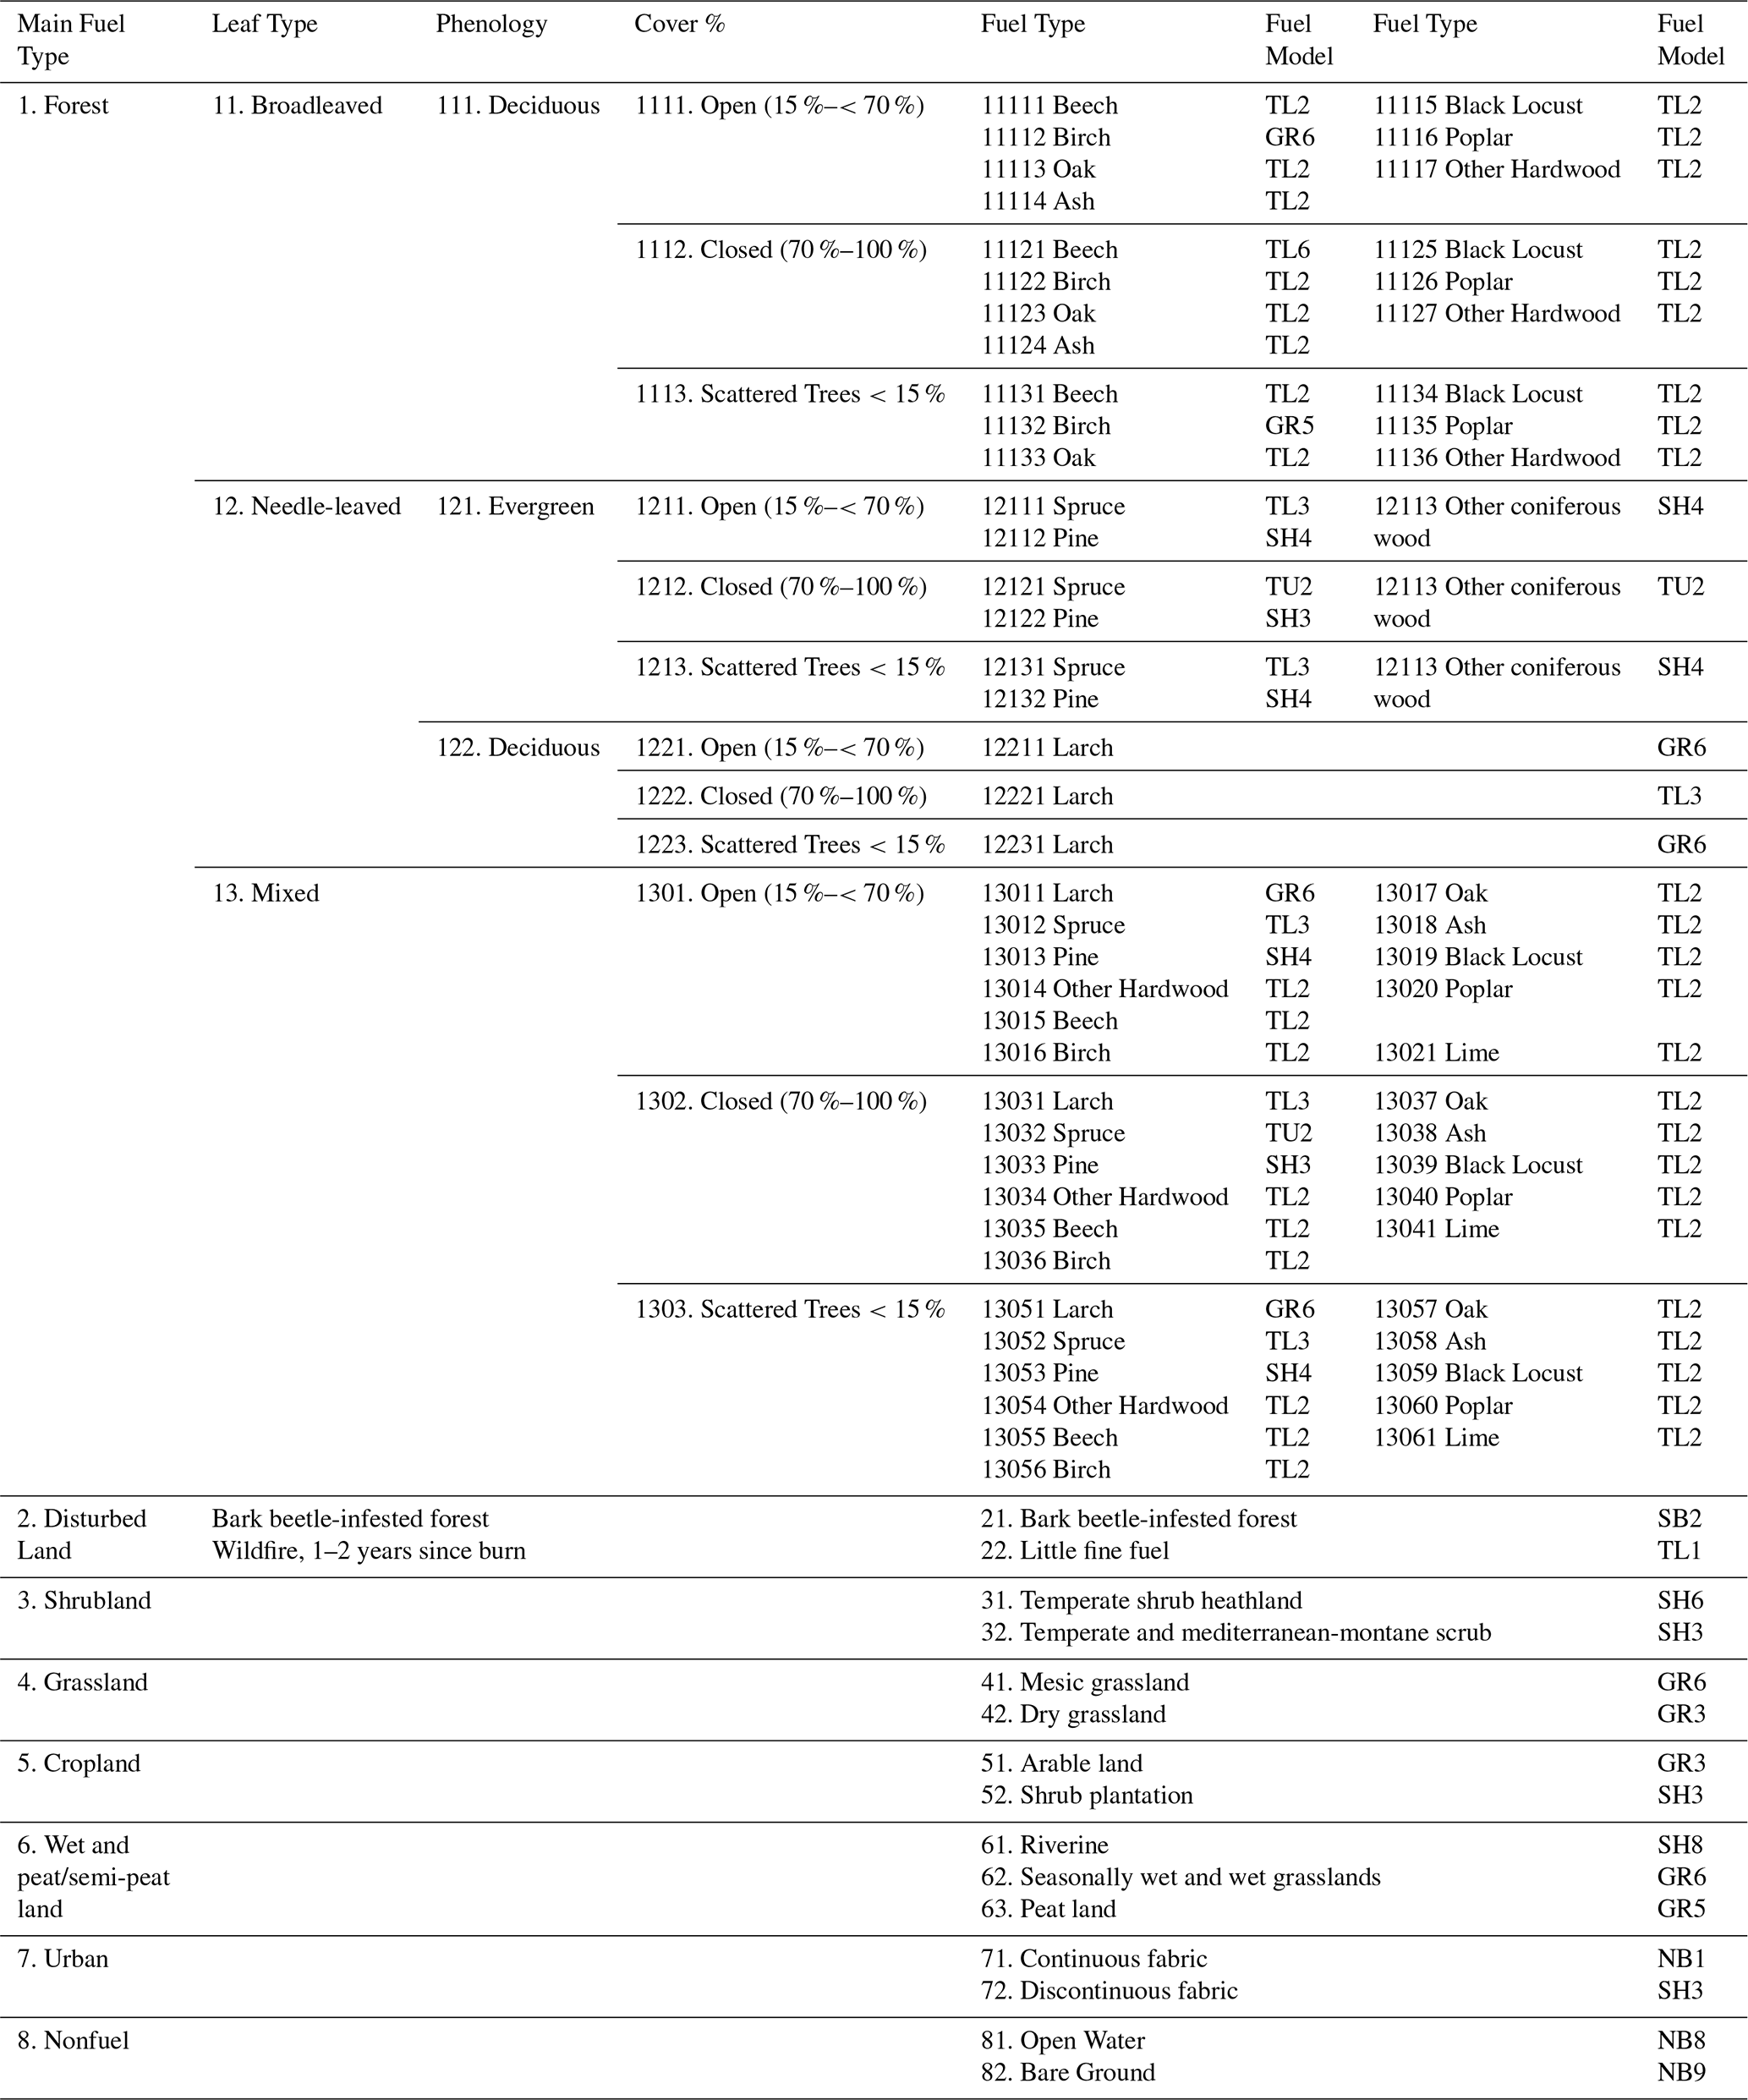
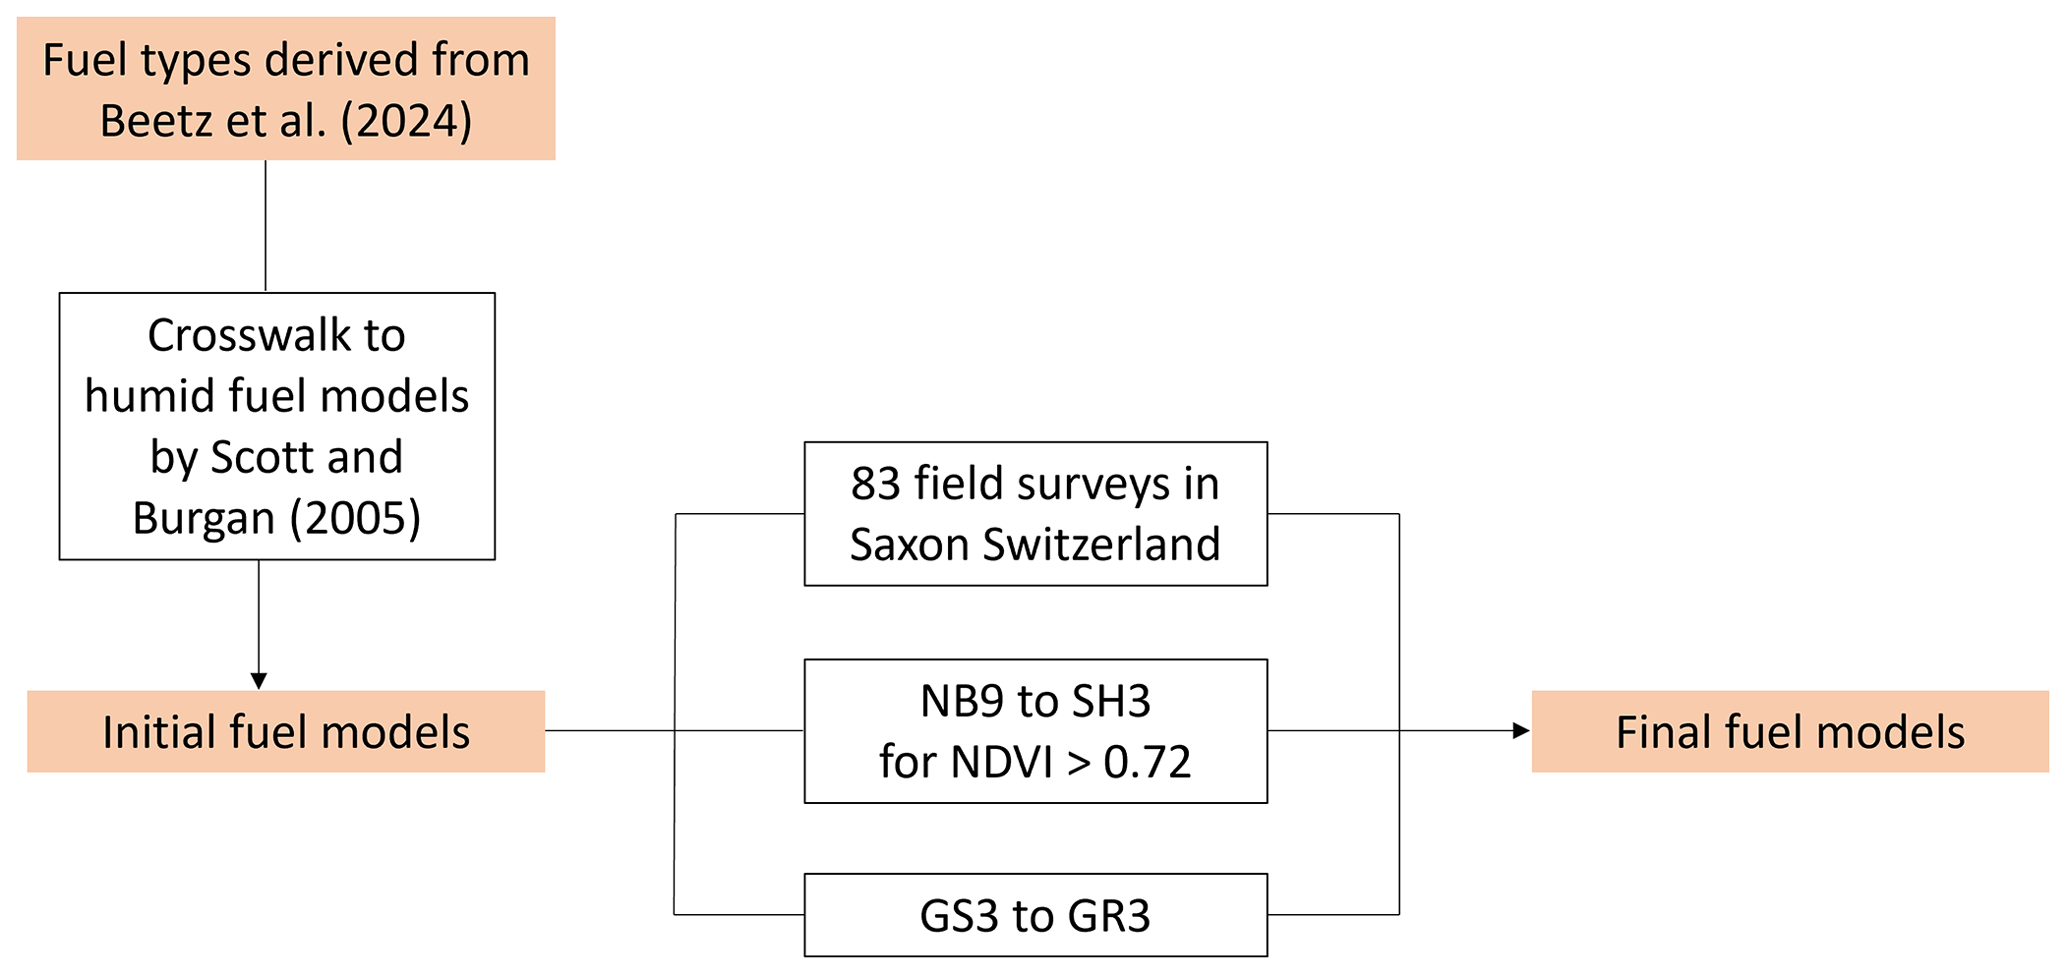
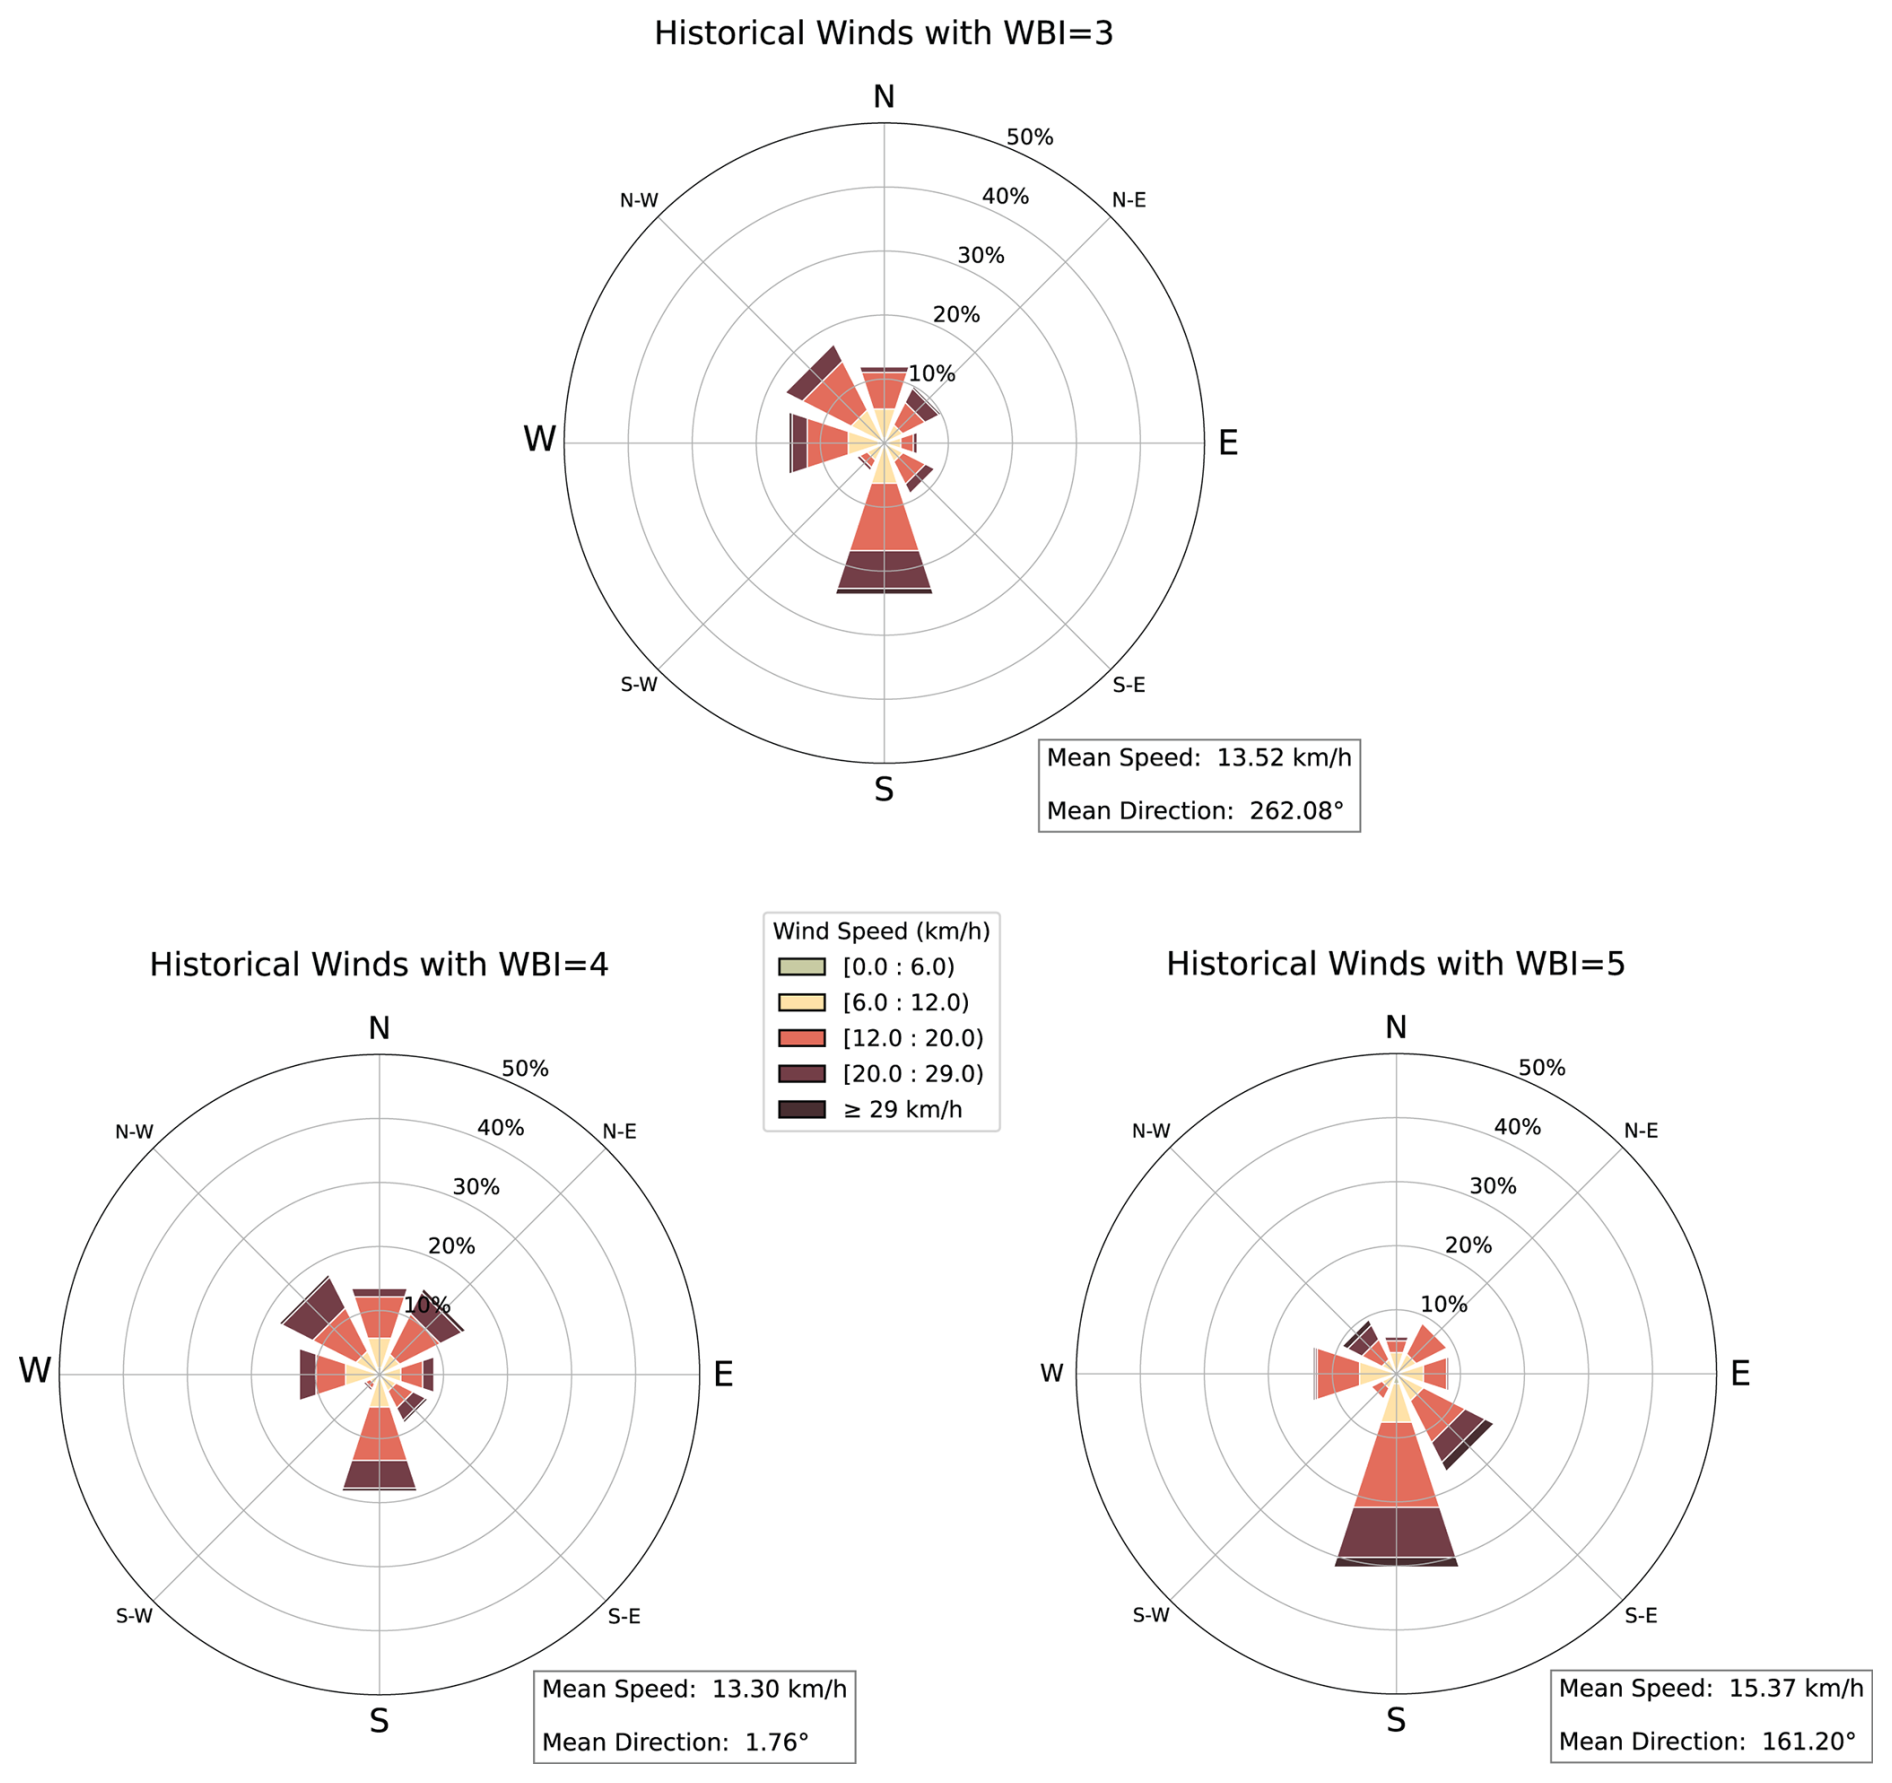
Figure C1Wind roses for winds that occurred on days with WBI=3, 4 and 5 in Bad Schandau from 15 February 2009 until 12 August 2022.
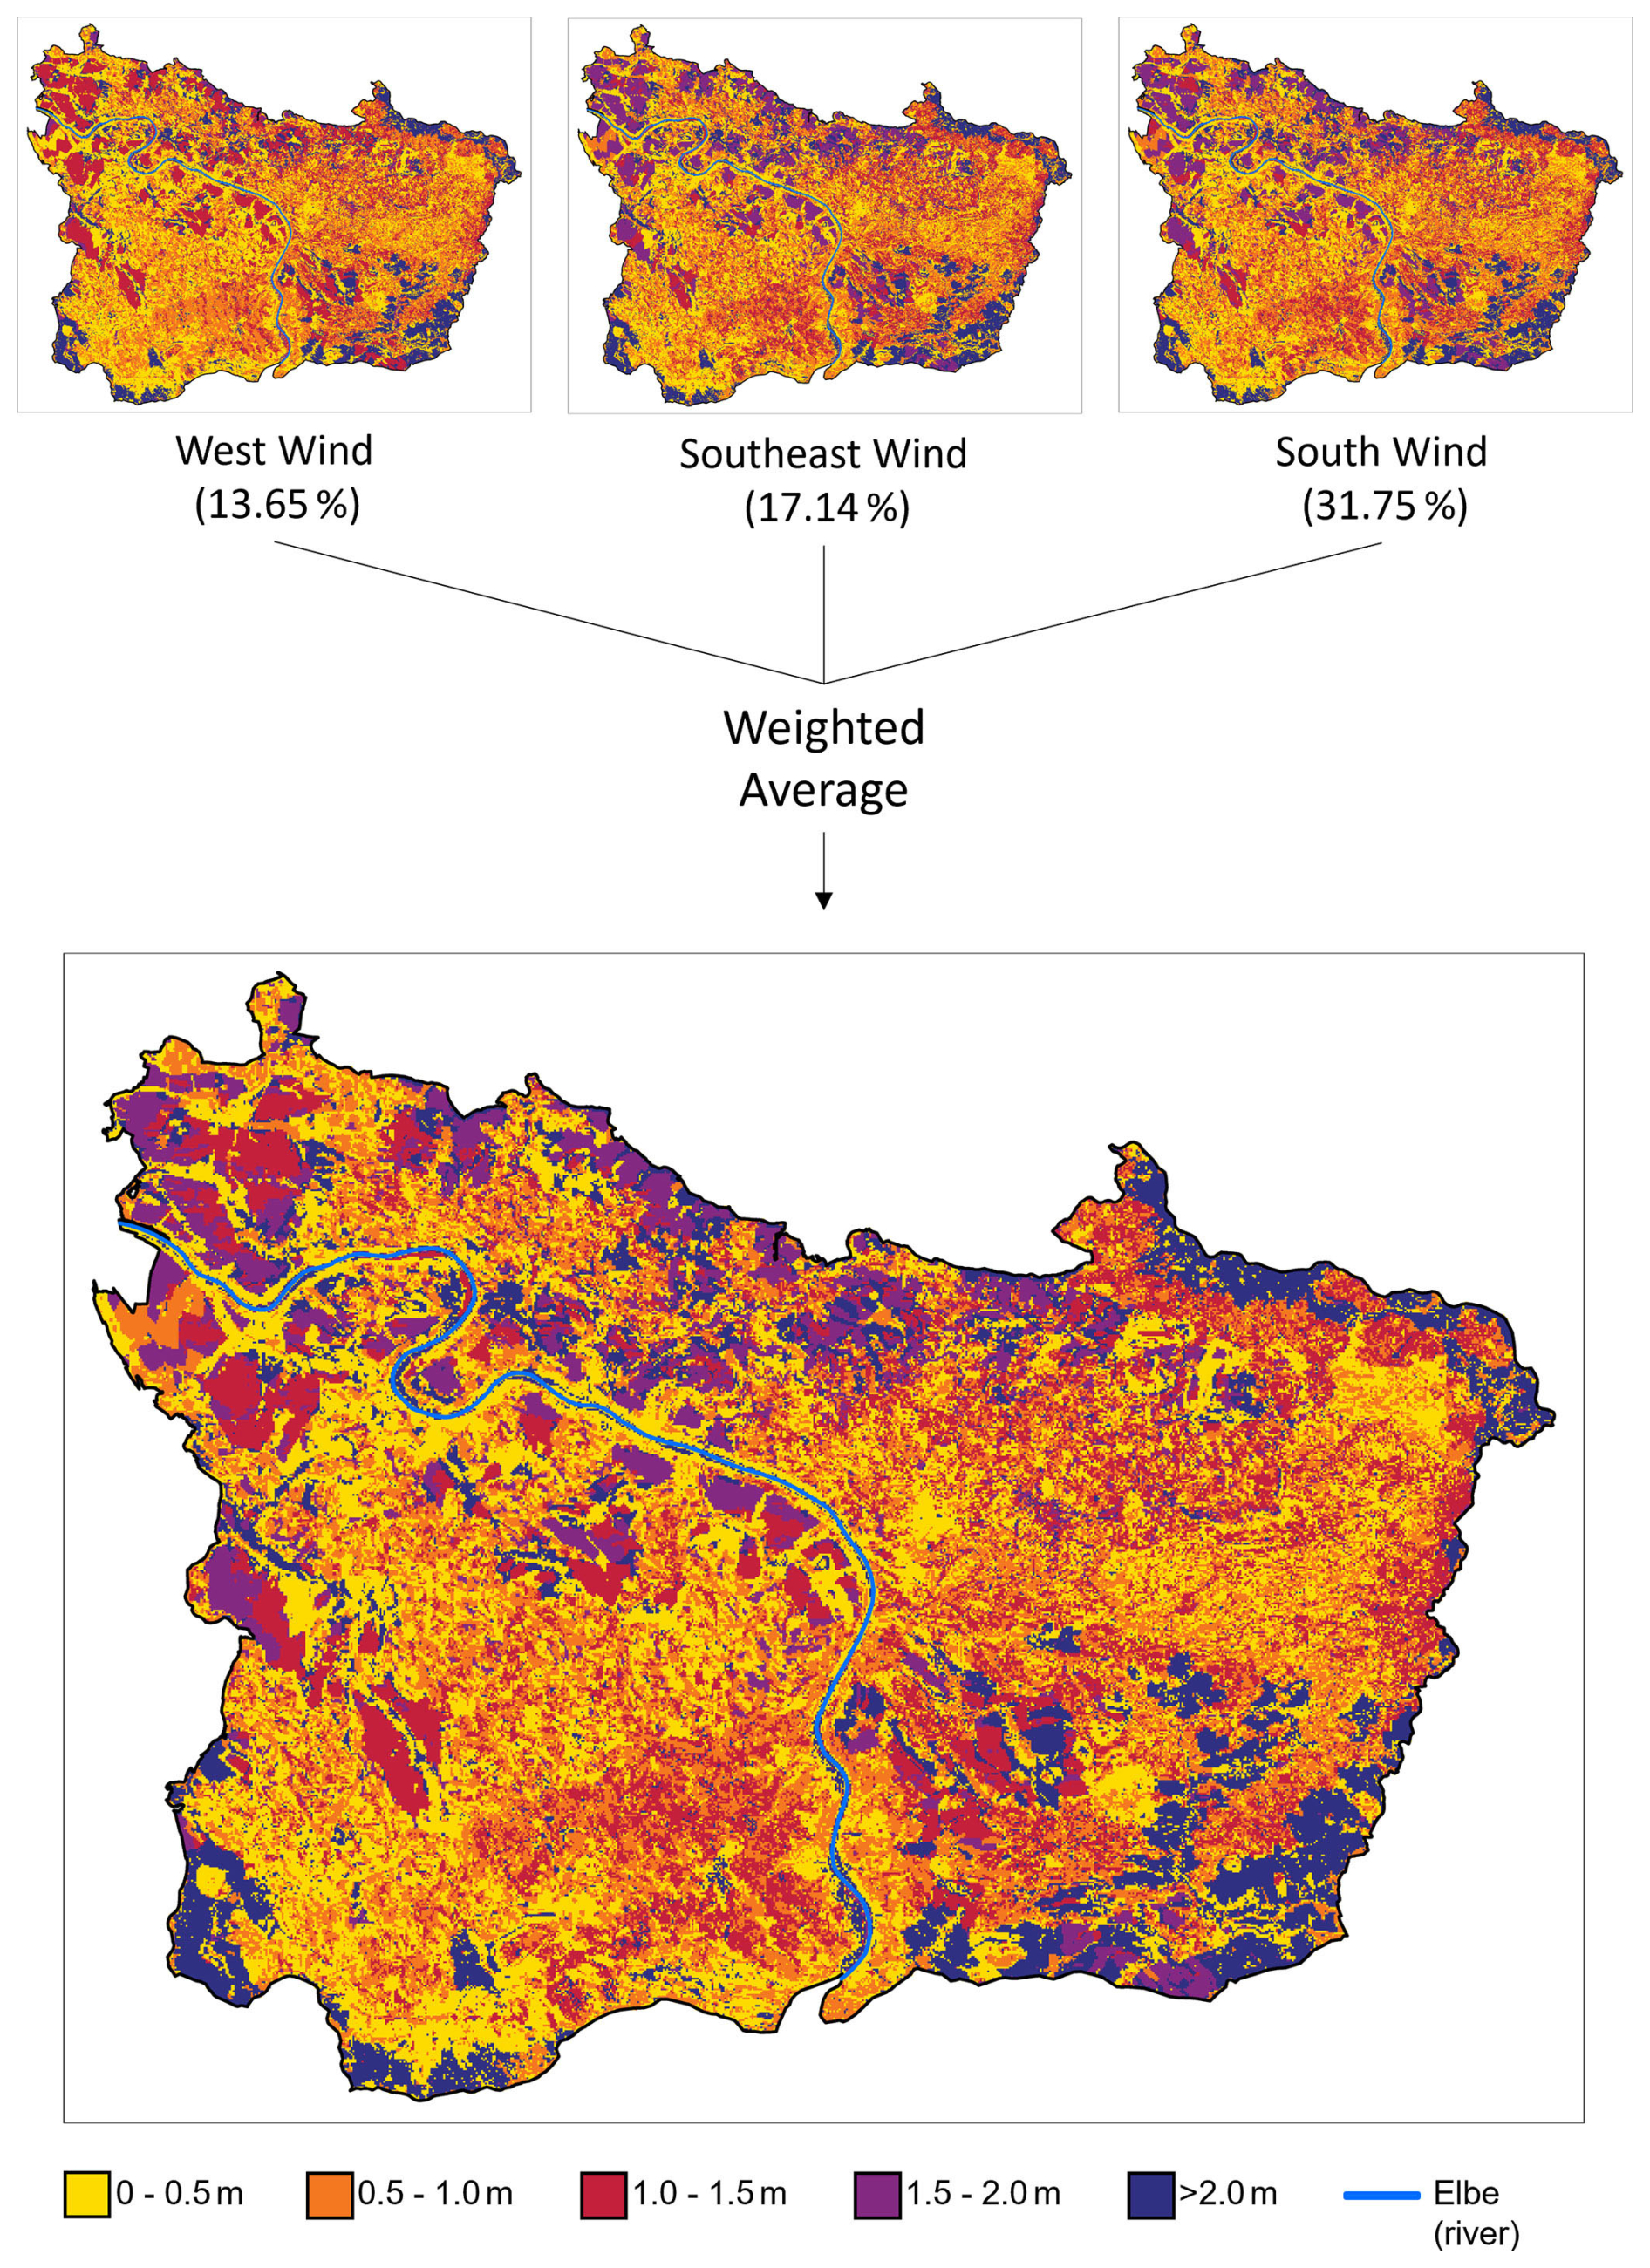
Figure D1Workflow for derivation of flame length raster for scenario WBI=5 and duration=3 d.
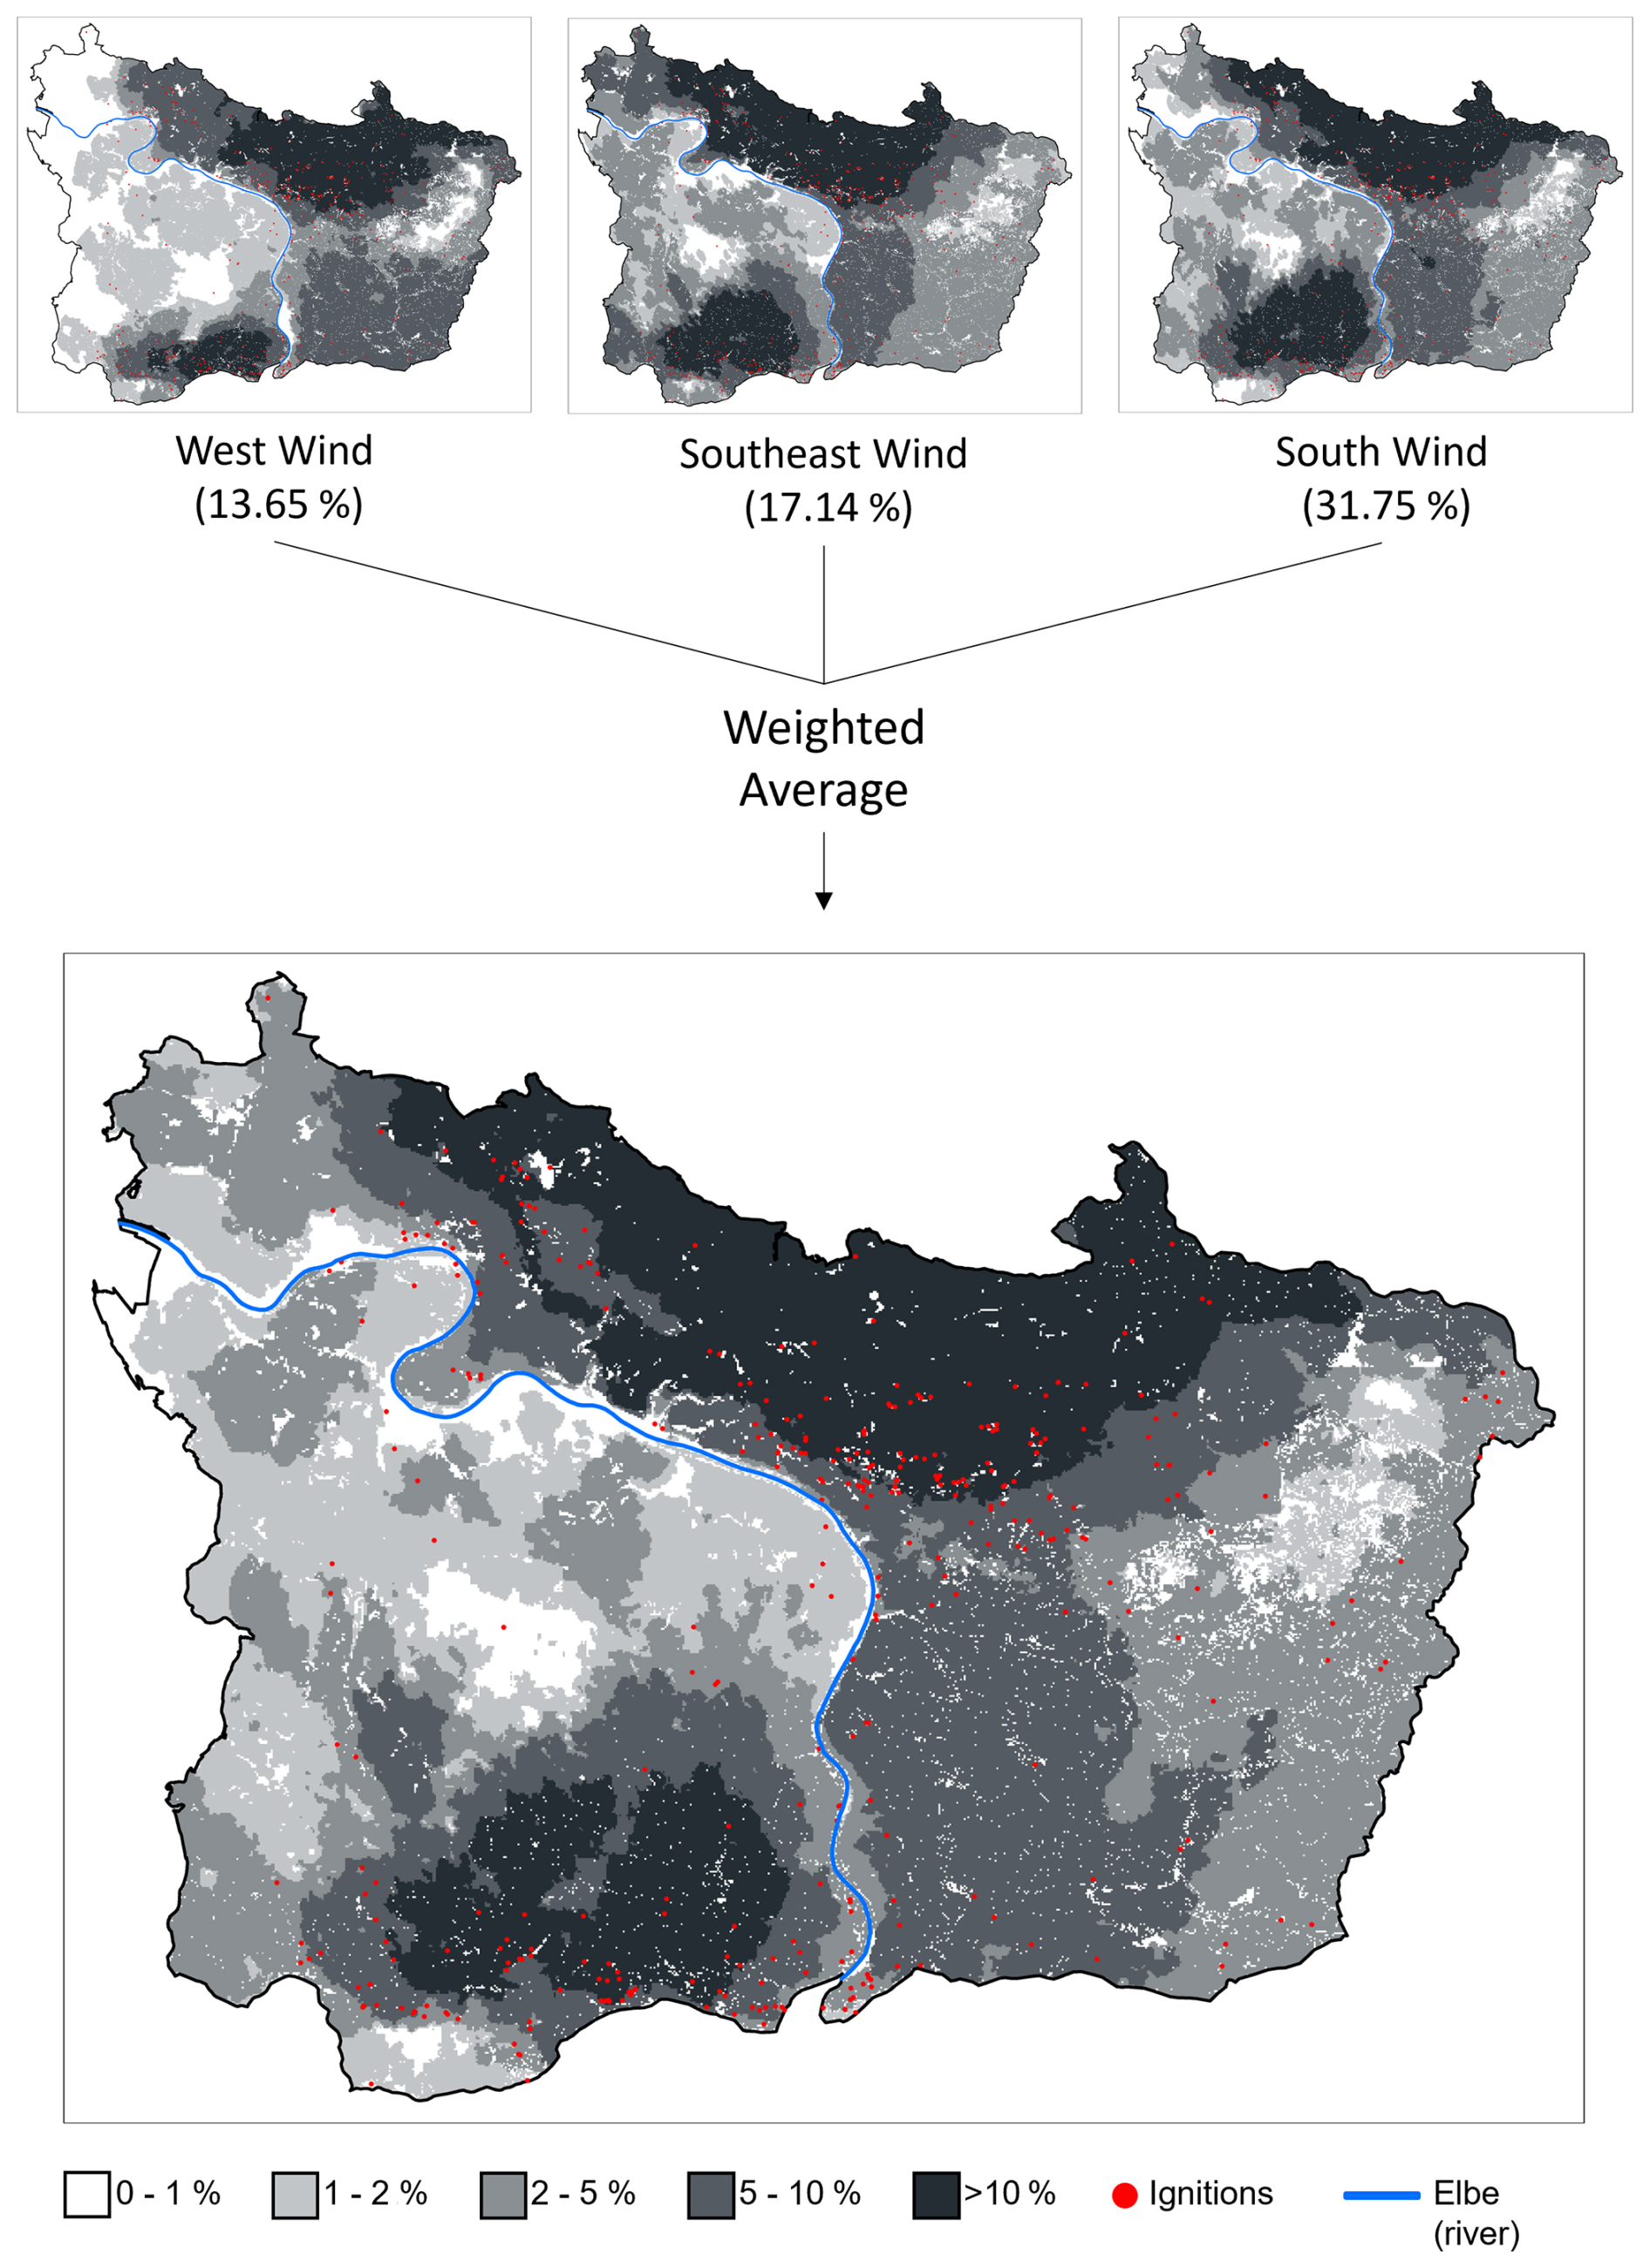
Figure D2Workflow for derivation of burn probability raster for scenario WBI=5 and duration=3 d.
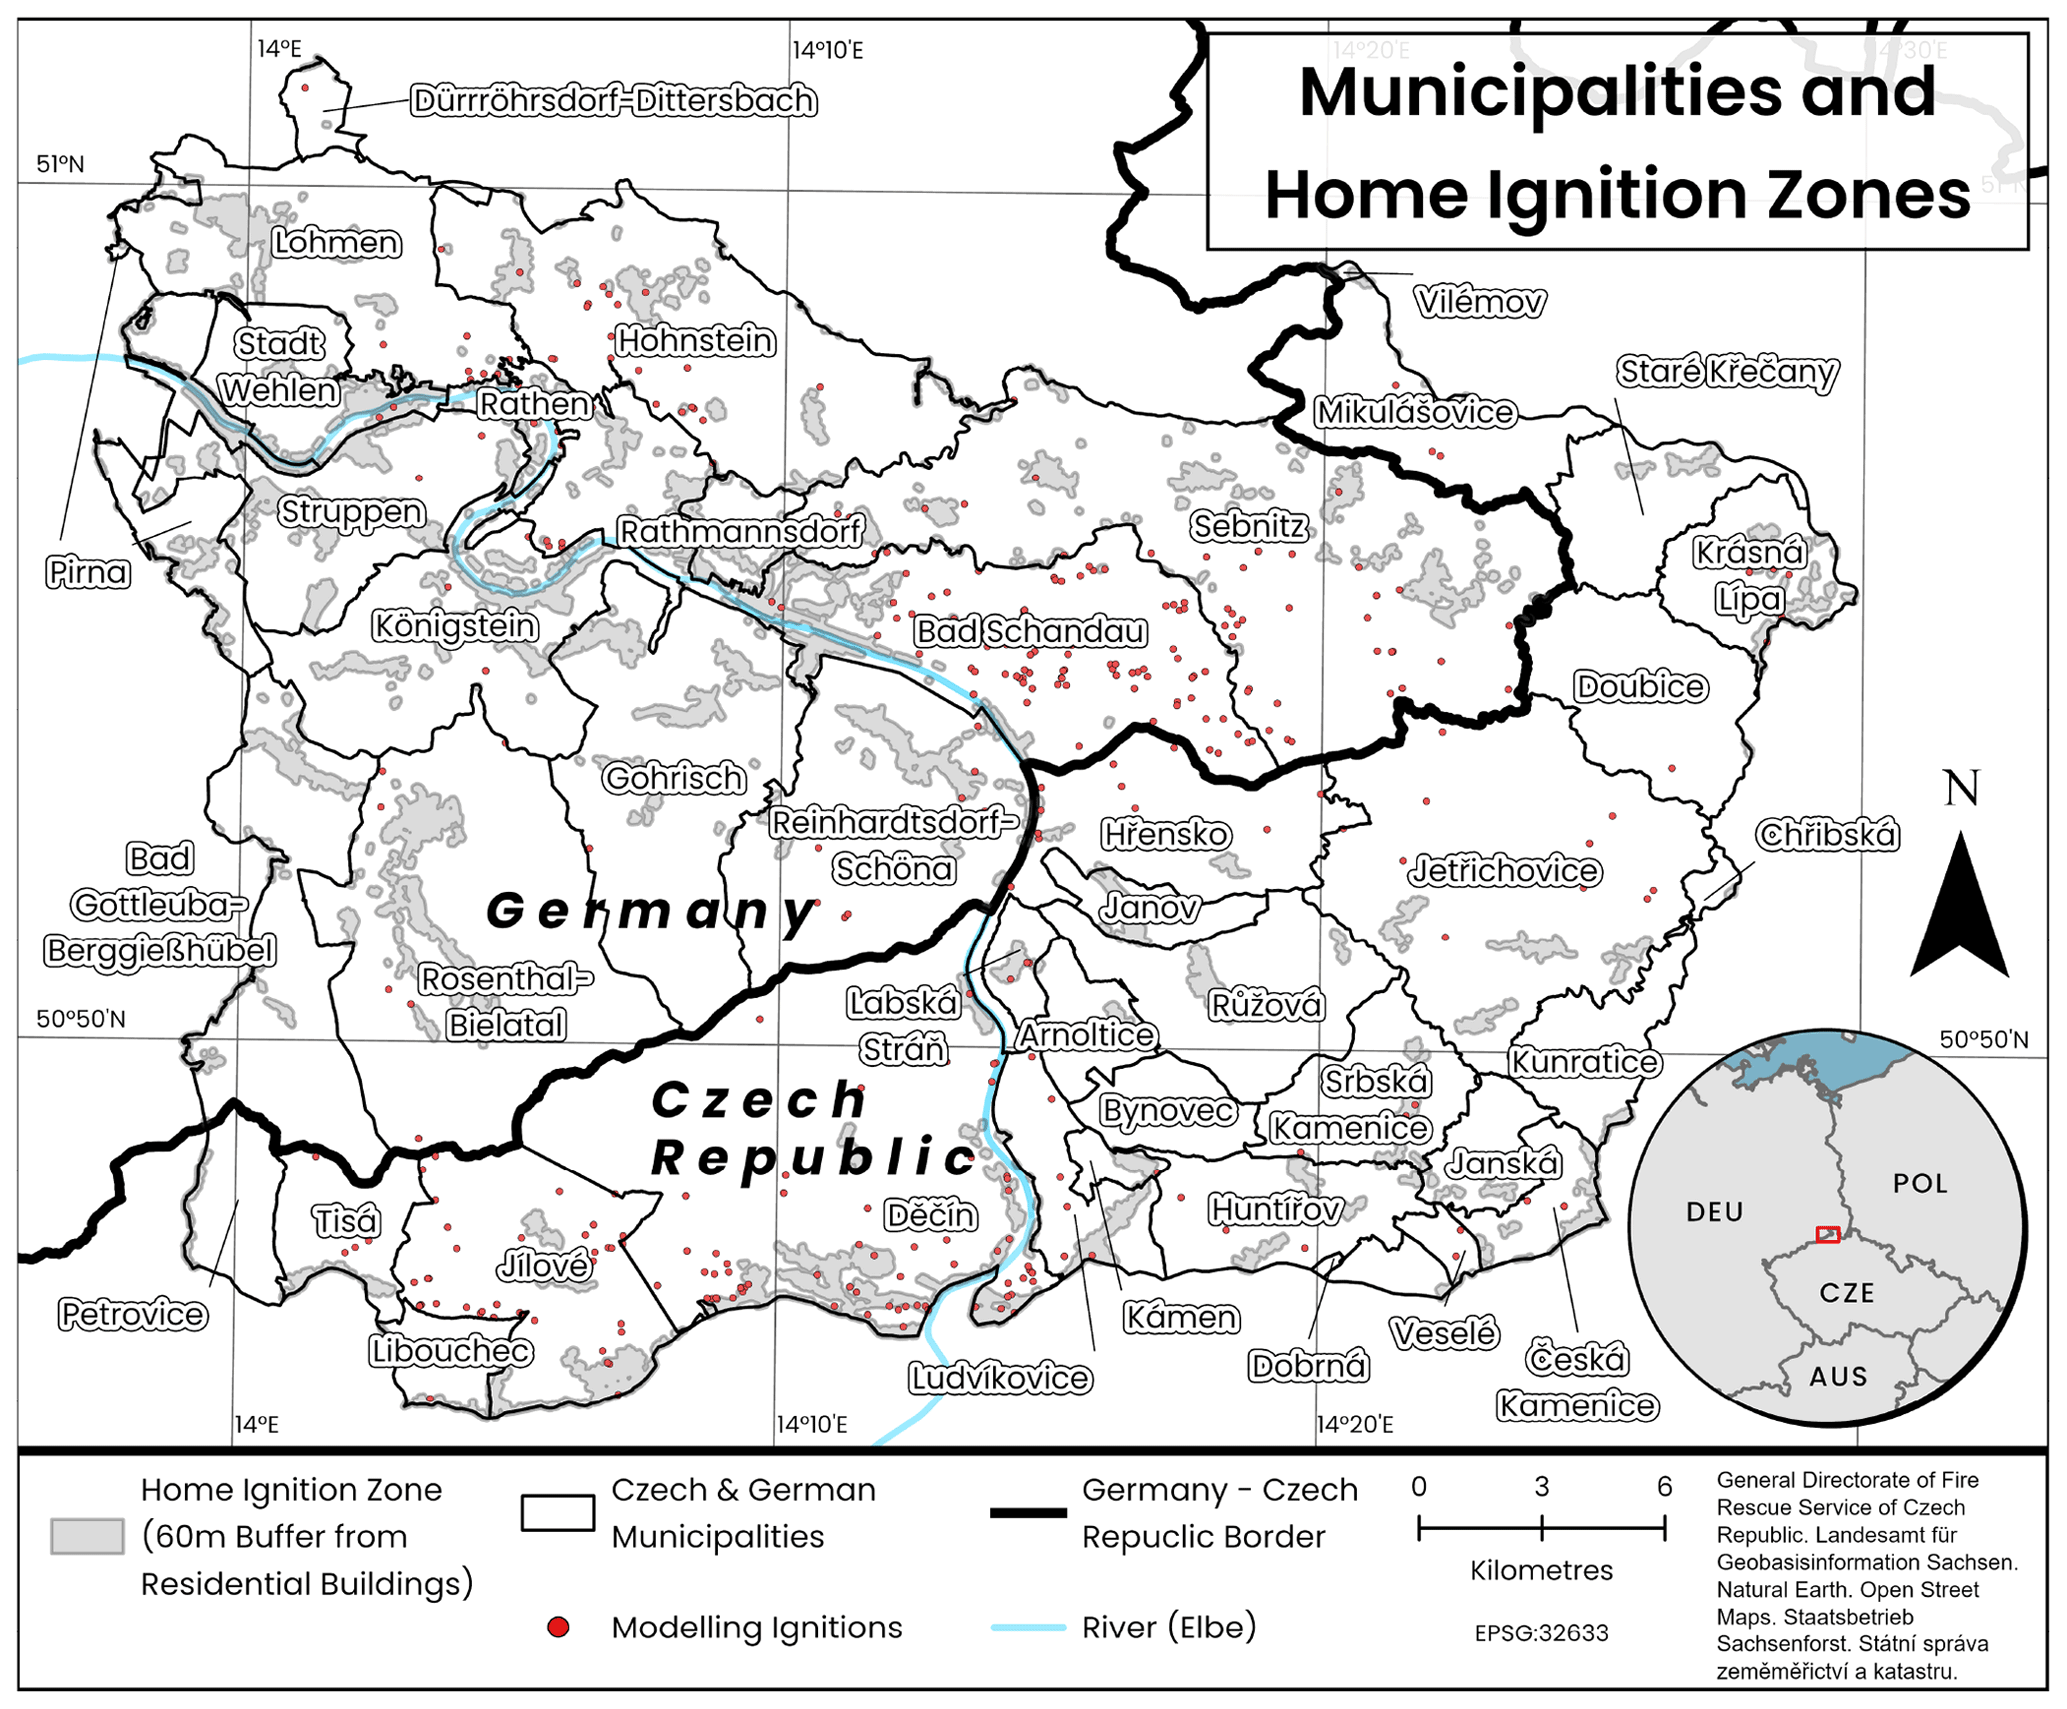
Figure E1Map of municipalities and Home Ignition Zone of residential areas in the study area.
Table E1Exposure of Czech residential areas per municipality. Burn probability metrics are in grey and flame length ones in yellow. Minimum, maximum and median values are presented for the modelling scenaria of WBI=5, duration=3 d (“extreme”) and for WBI=3, duration=1 d (“mild”). All metrics are based on values between the 5th and 95th percentiles to reduce the influence of outliers.
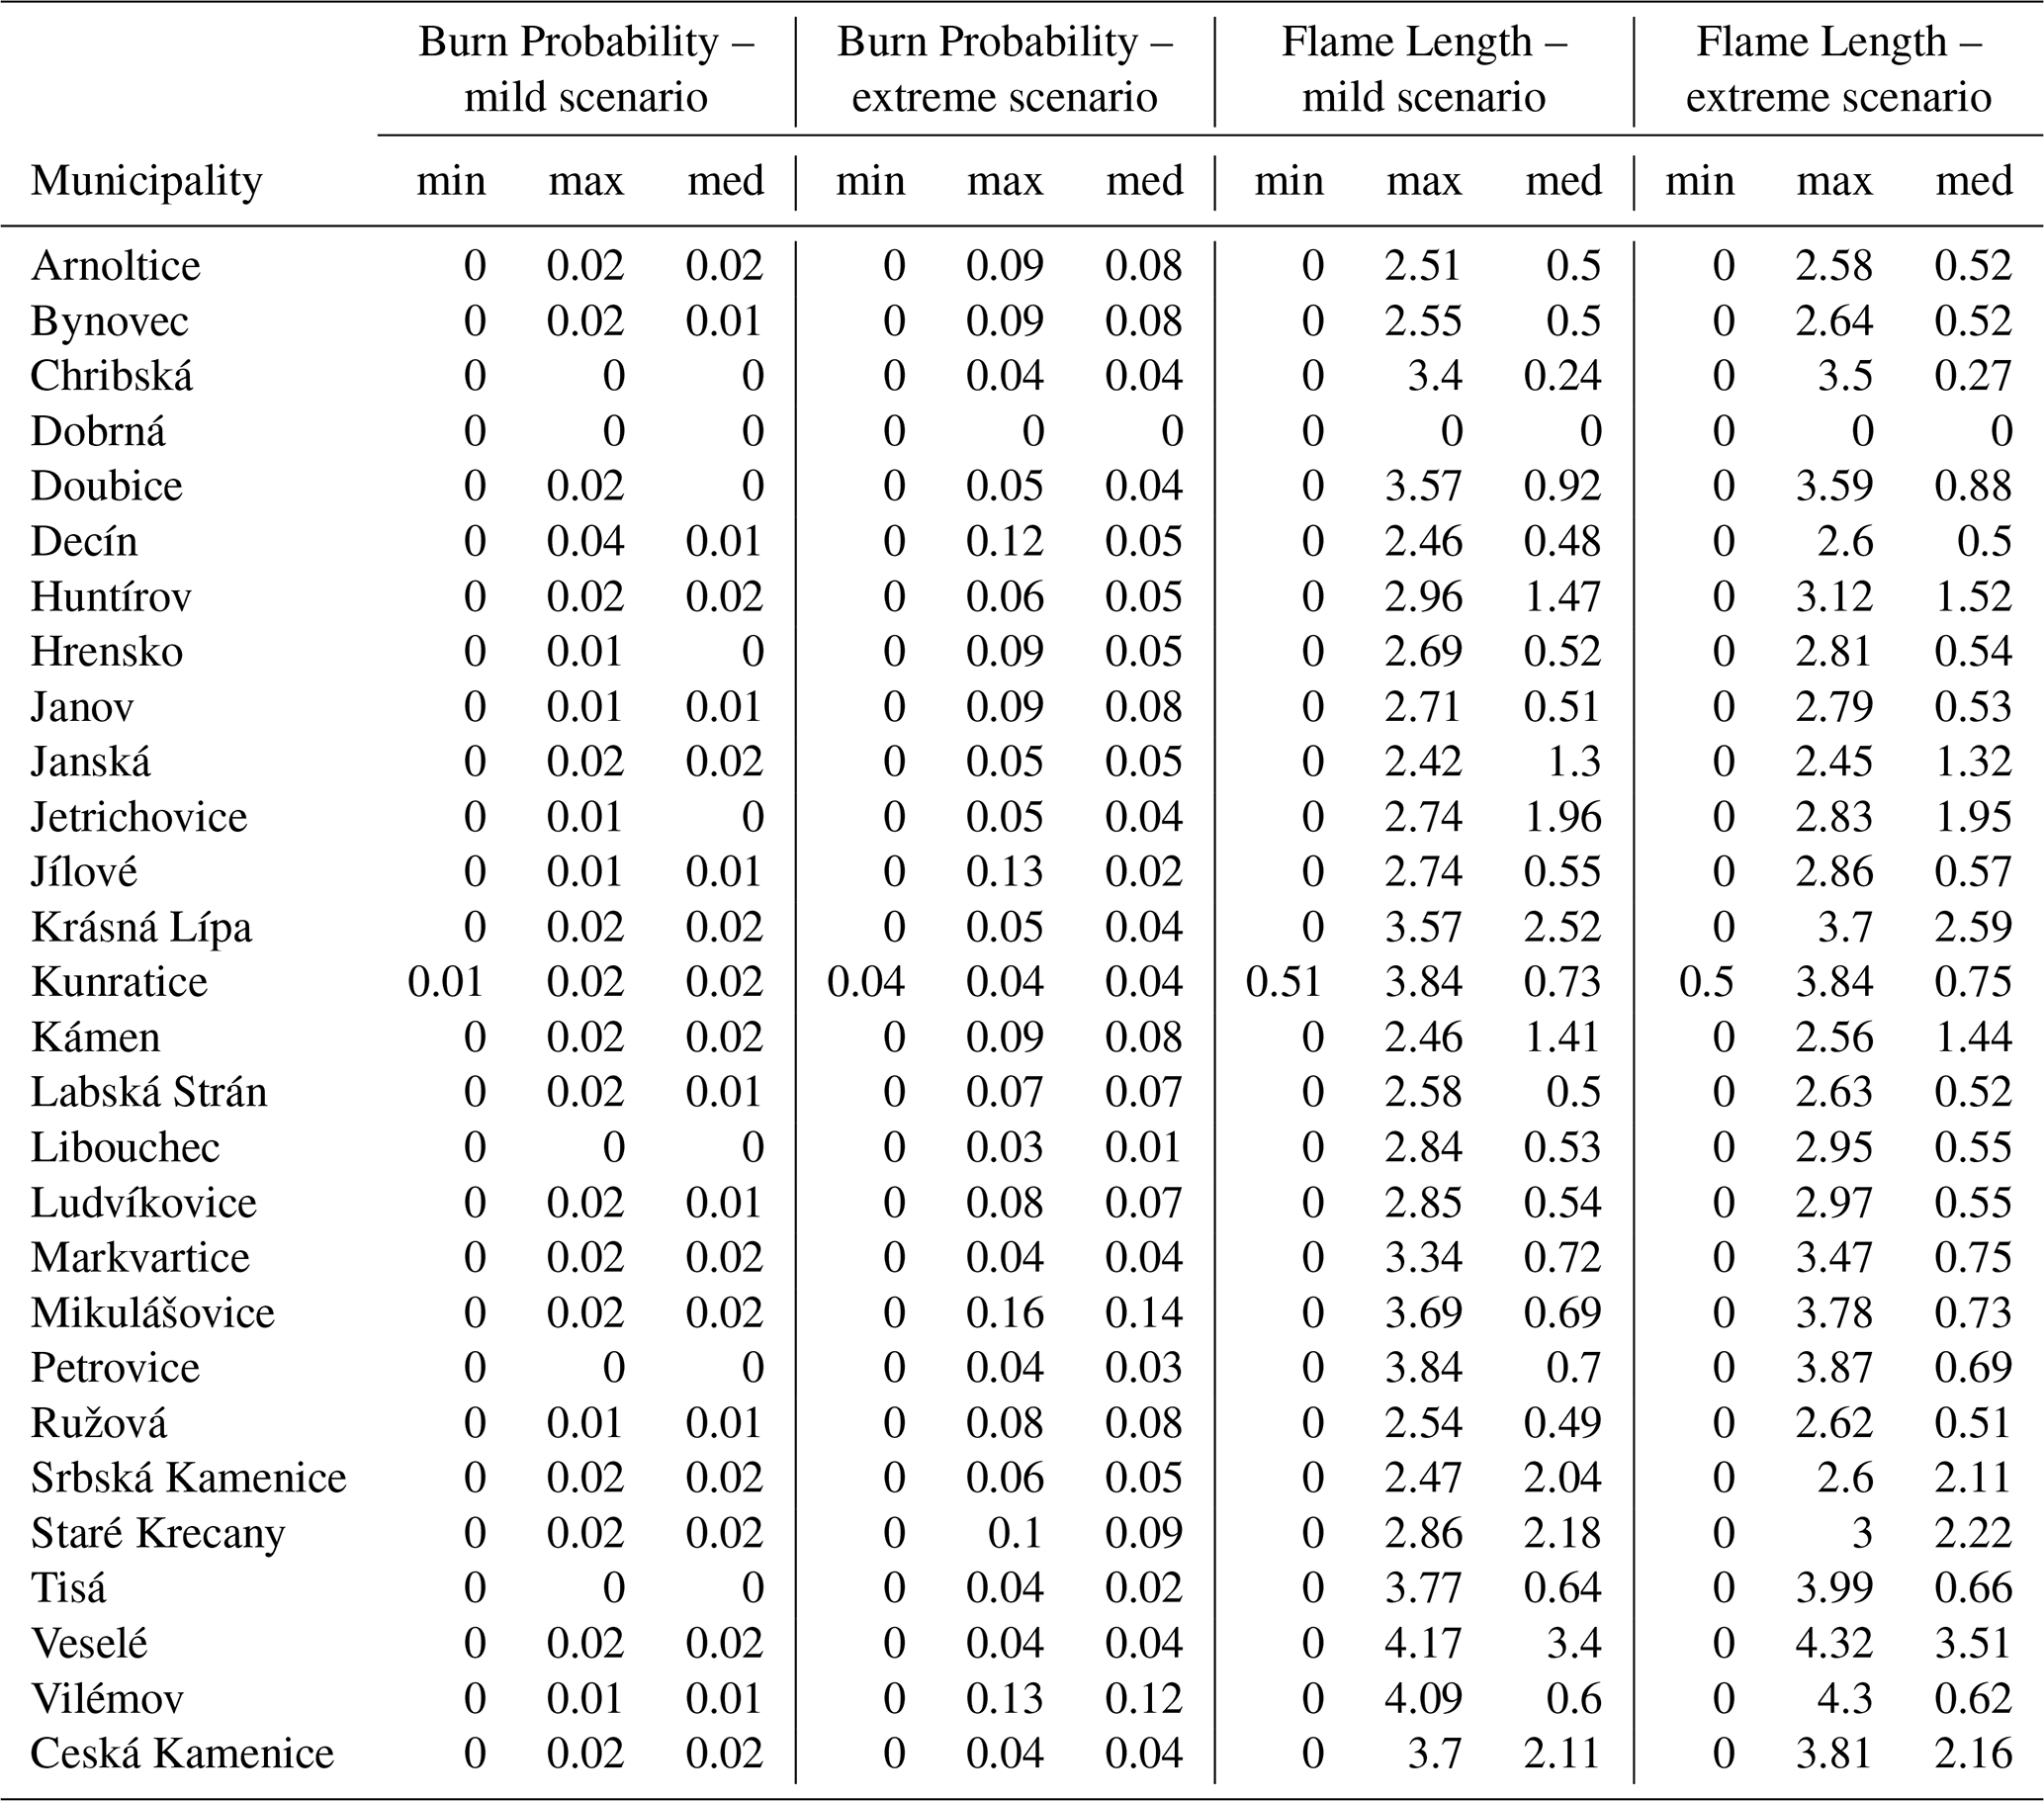
Table E2Exposure of German residential areas per municipality. Burn probability metrics are in grey and flame length ones in yellow. Minimum, maximum and median values are presented for the modelling scenaria of WBI=5, duration=3 d (“extreme”) and for WBI=3, duration=1 d (“mild”). All metrics are based on values between the 5th and 95th percentiles to reduce the influence of outliers.
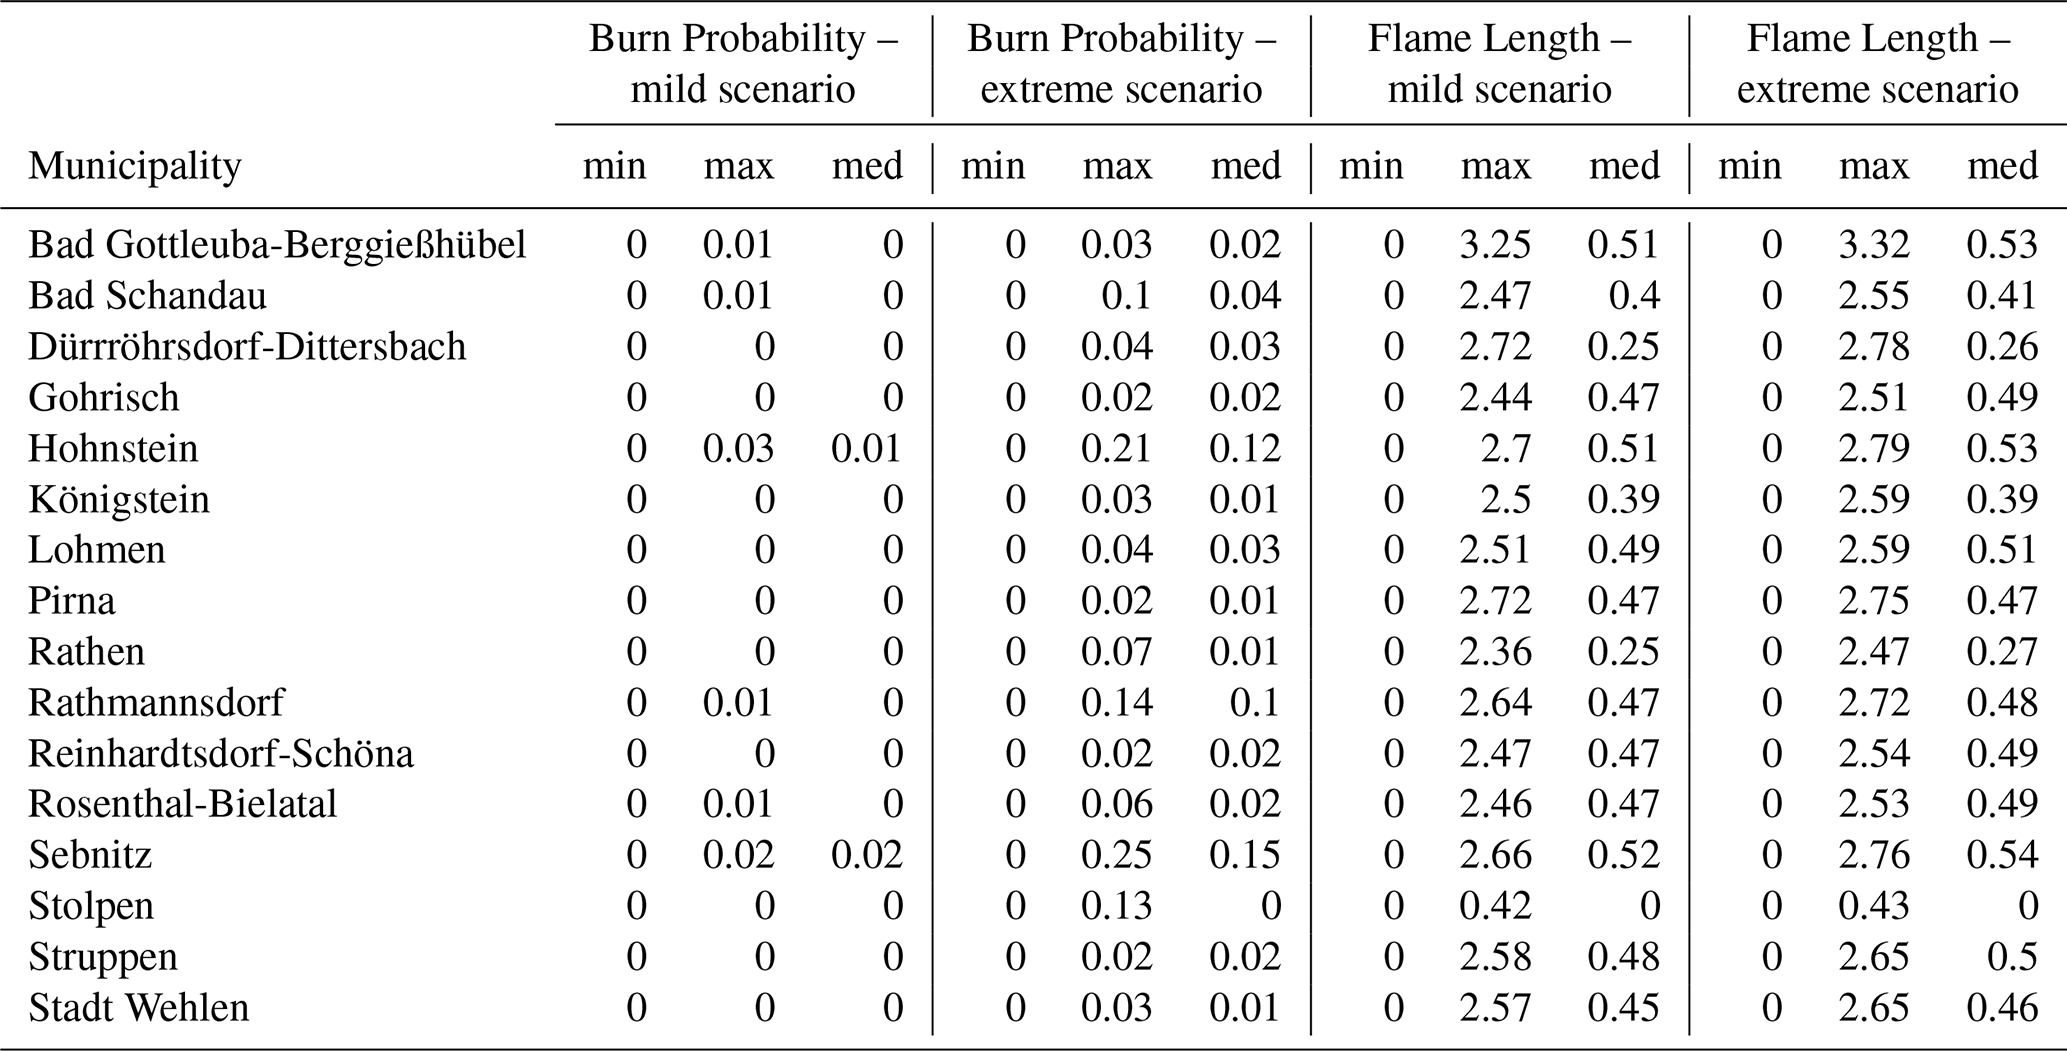
Figure F1 shows a typical map view. Initially, only certain layers are available. Here, apart from the basemap and an exposure raster, the fire stations, the historical fires' ignitions, the villages, rivers and the study area layers are also visible. The main window is marked with “G”. The zoom buttons “A” may be pressed to change the zoom level and the search bar “B” can be used to search for locations in the study area but also outside of it. “C” is the home button which when pressed brings the user to the initial zoom level. The question mark button “D” brings up the bivariate legend explanation. “E” shows the quick legend button, which brings up the legend shown in the bottom-left of the screen. This was created to assist viewer to quickly check the burn probability and flame lengths when needed. “H” and “I” indicate the two parts of the layer pane, namely the one for the hazard rasters and the one for the rest of them. This pane automatically opens upon hovering over its symbol, located in the top-right of the window. Finally, “F” indicates the map's scale bar, which updates according to the current zoom level.
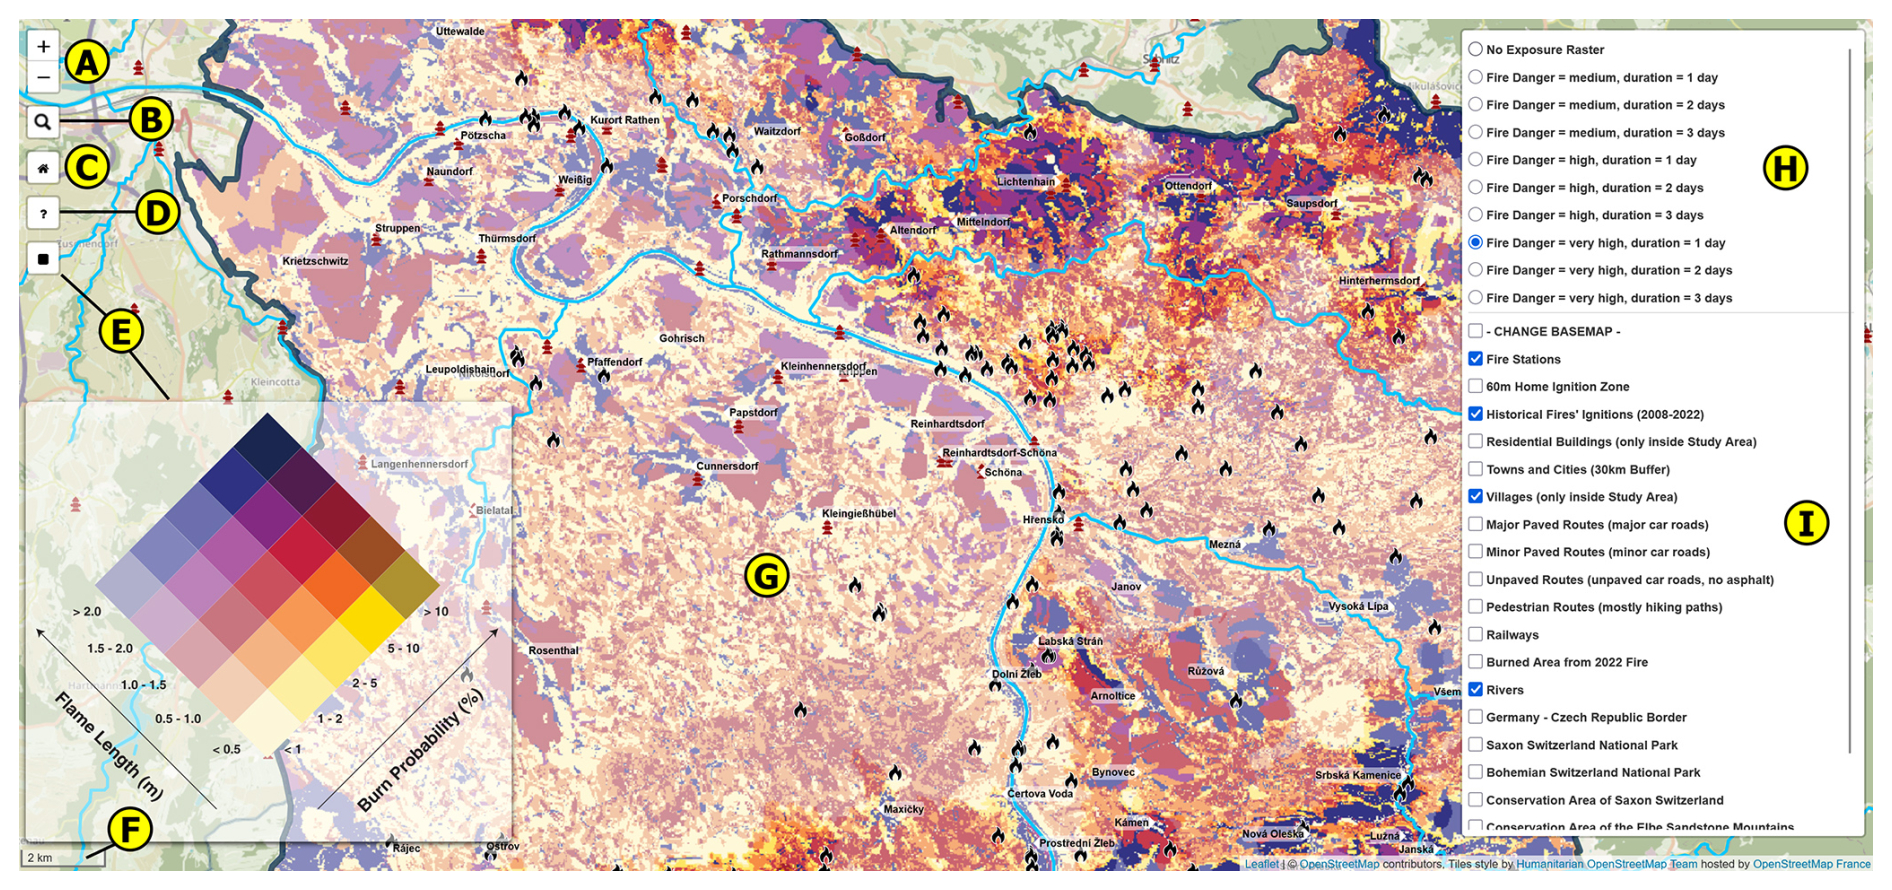
Figure F1Interactive web map features.
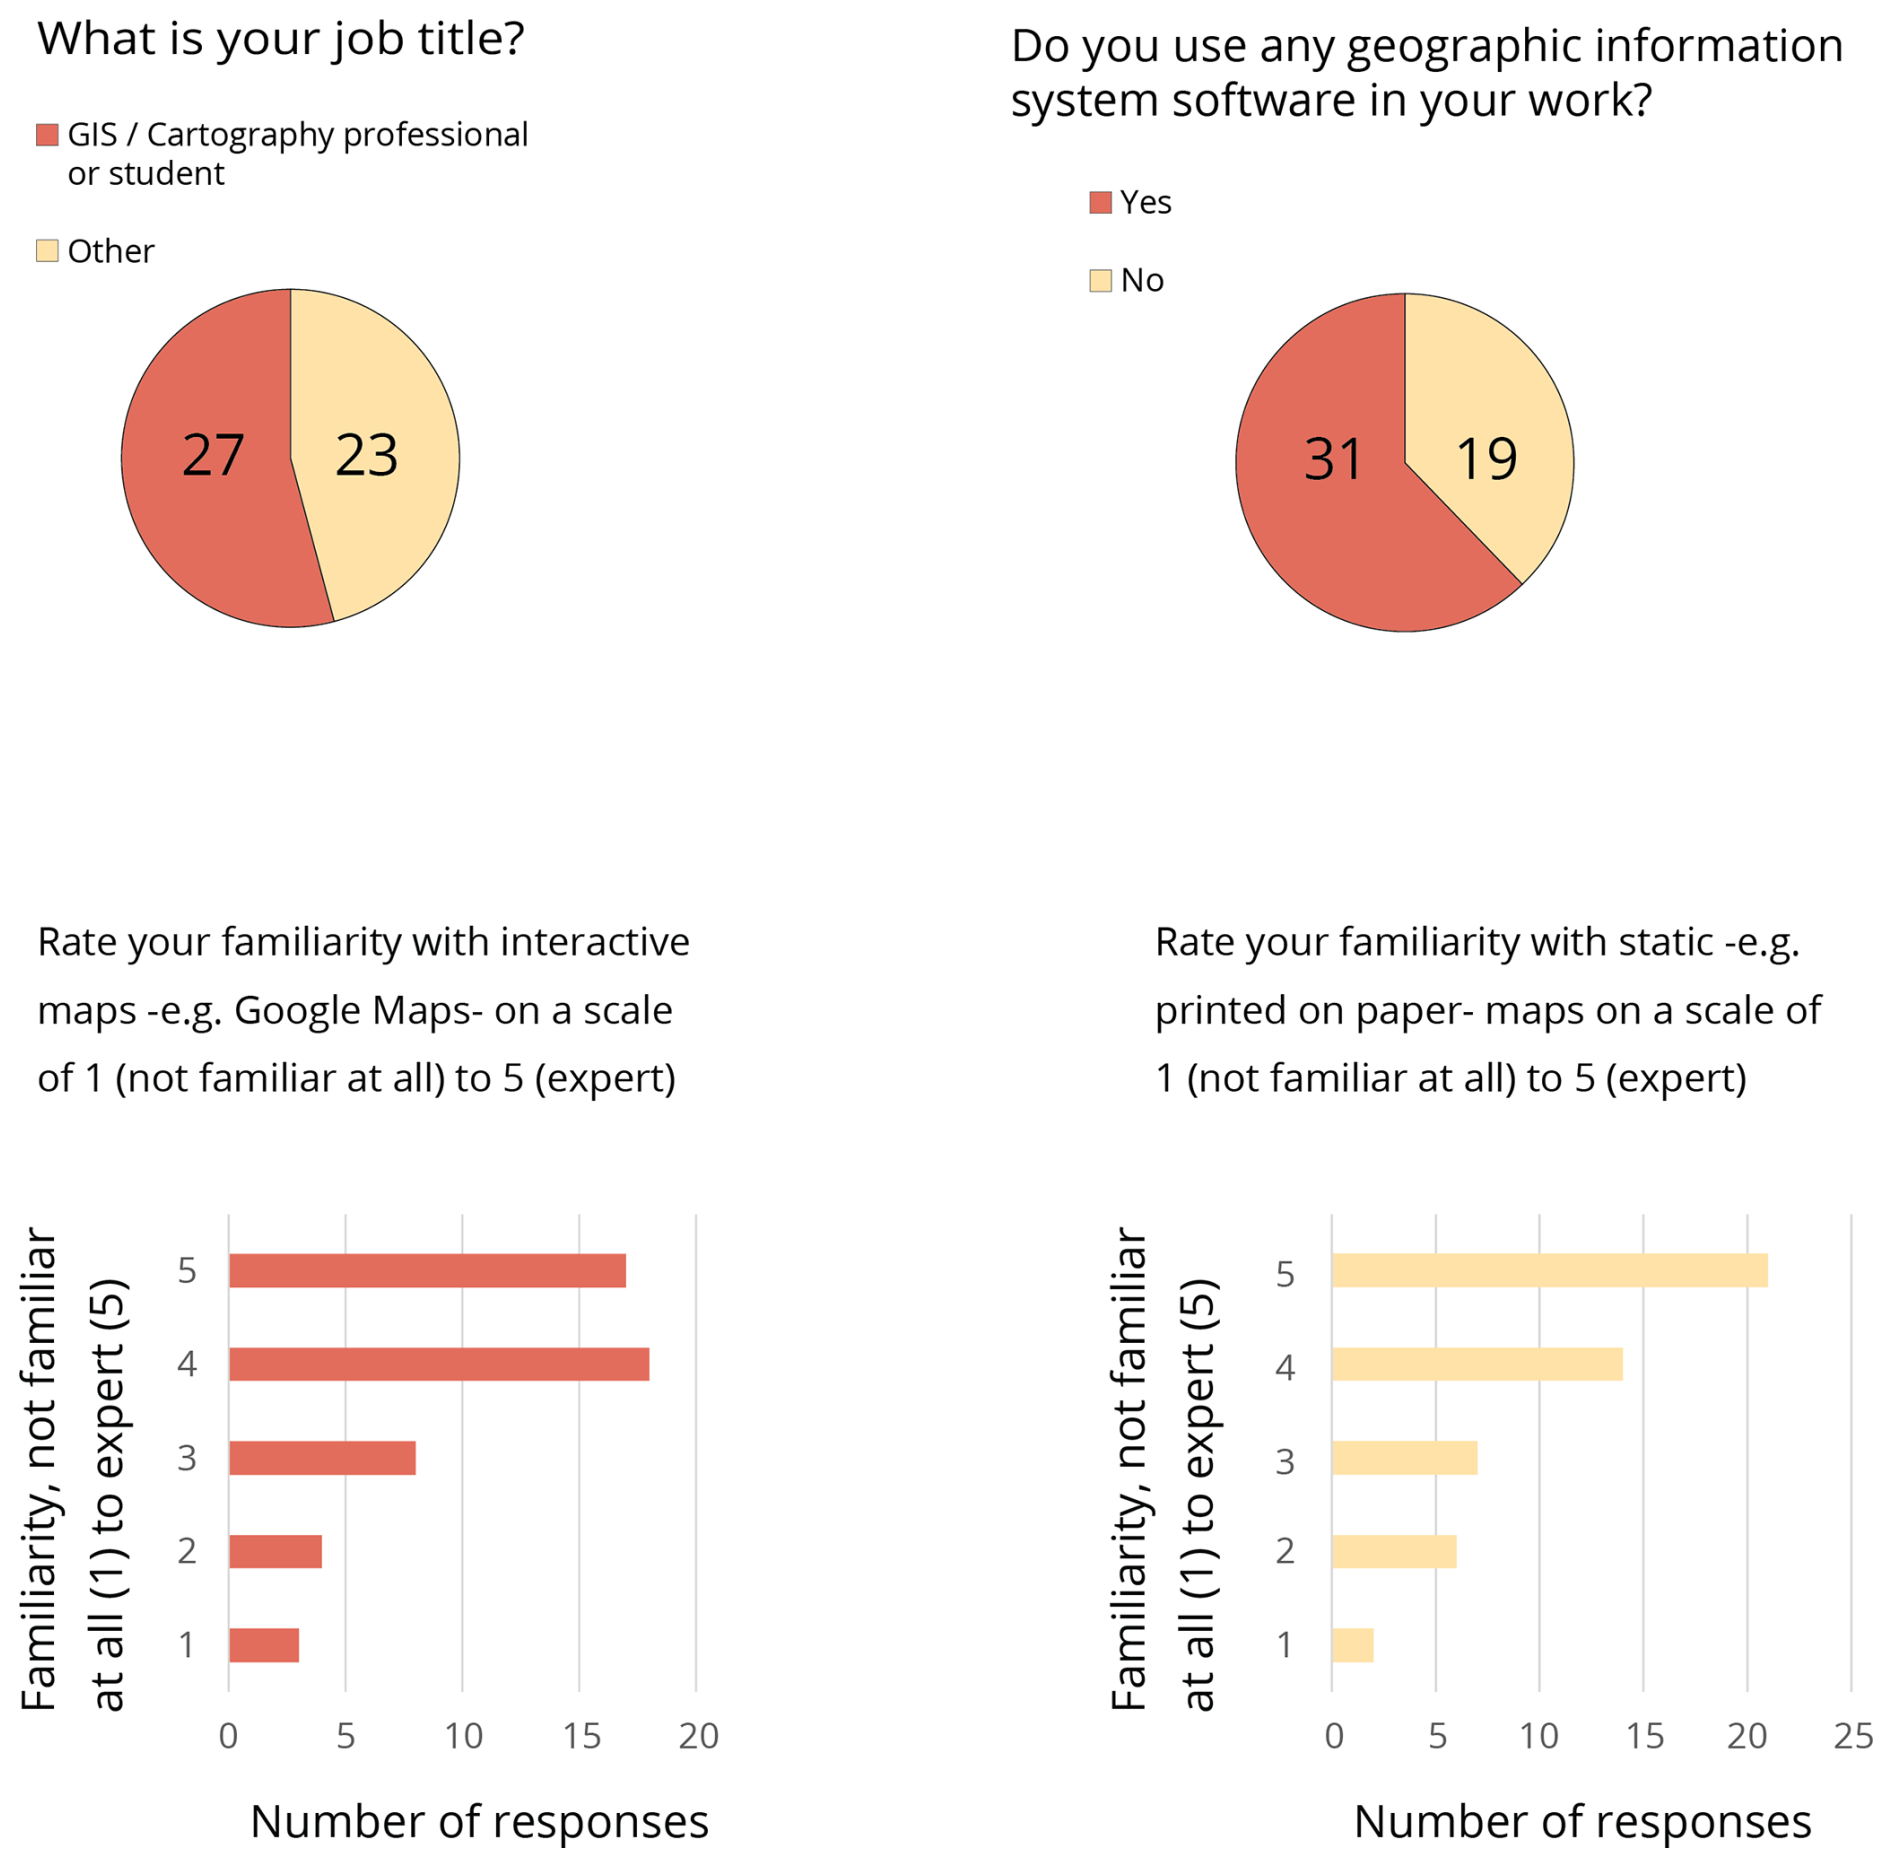
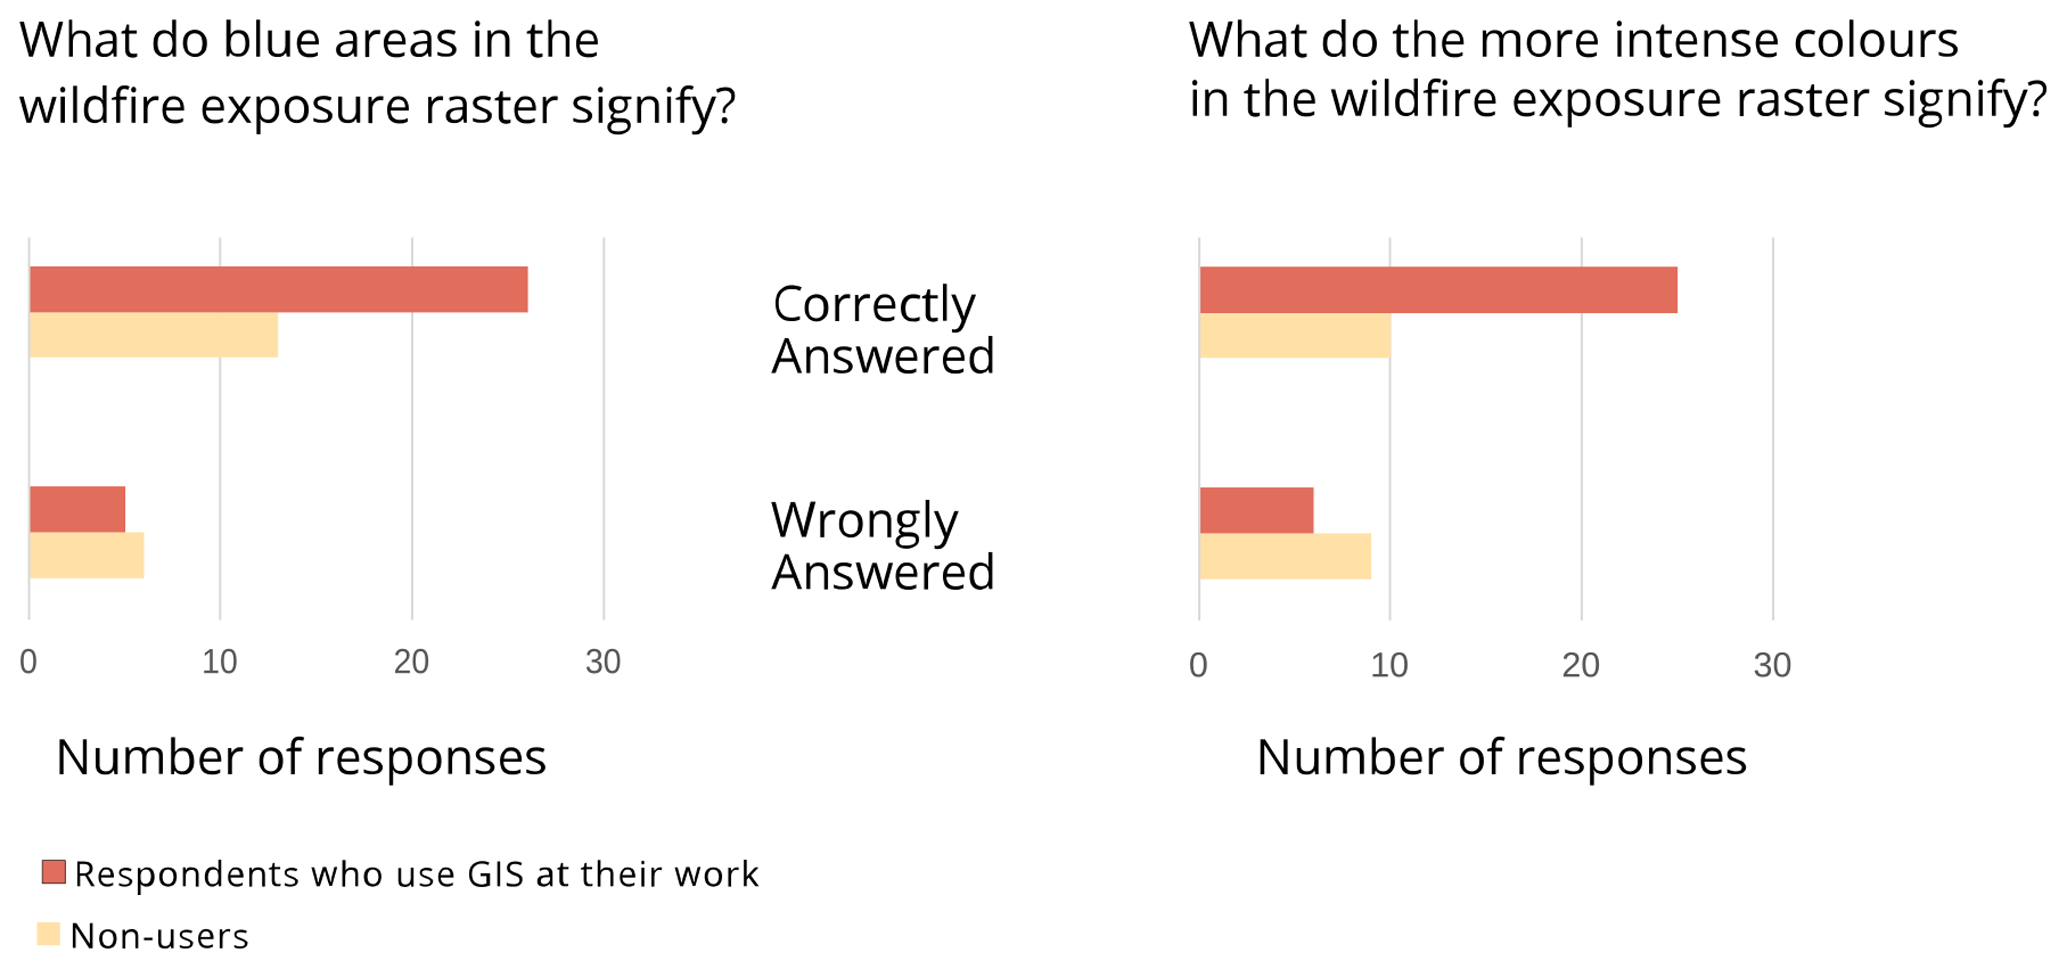
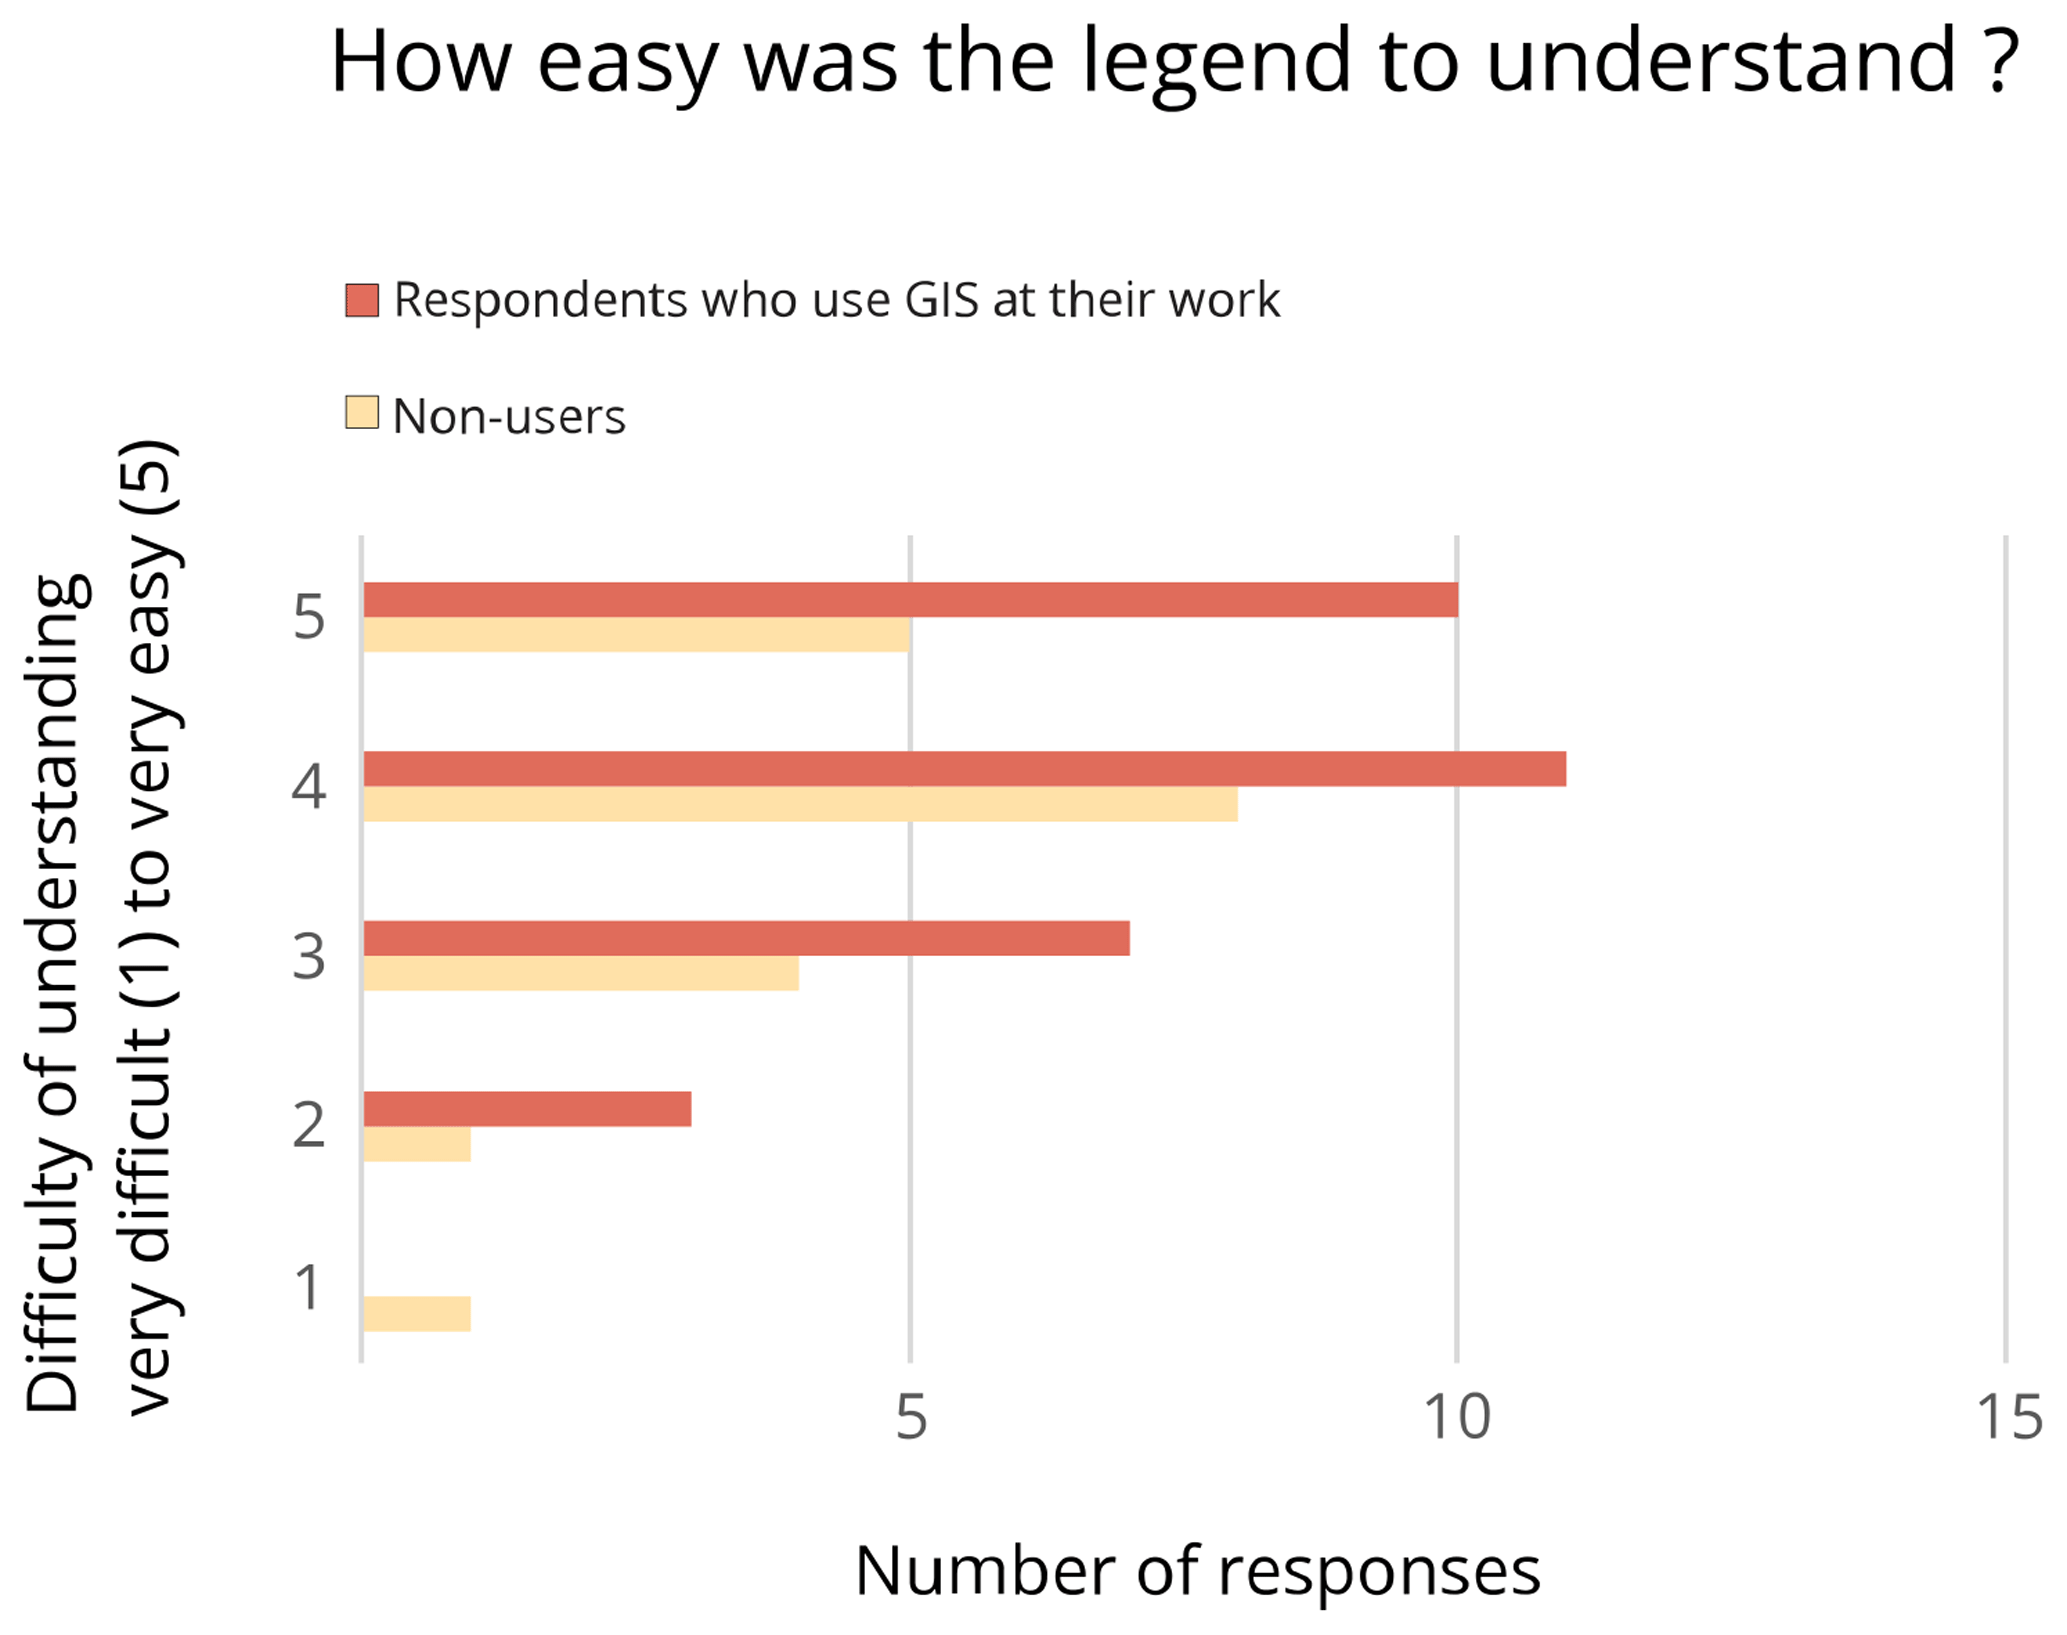
Table G1Most frequently mentioned user-friendly aspects and improvement suggestions for the online wildfire exposure map from the usability questionnaire.
The fuel model map, burn probability and flame length rasters, as well as the exposure rasters can be provided by the corresponding authors upon request. Additionally, all raw data with the exception of the ignition data used, can also be provided. The online map can be found under https://doi.org/10.25532/OPARA-954 (Avouris, 2025).
Writing – Original Draft, Software, Formal Analysis, Visualization, Investigation: EA; Conceptualisation, Methodology: EA, MF, CM; Validation: EA, MF, LK, JK, CM, MT; Writing – Review, Editing: EA, CM, MF; Supervision: MF; Data Curation, Resources: EA, KB, JK, CM, MP.
The contact author has declared that none of the authors has any competing interests.
Publisher's note: Copernicus Publications remains neutral with regard to jurisdictional claims made in the text, published maps, institutional affiliations, or any other geographical representation in this paper. The authors bear the ultimate responsibility for providing appropriate place names. Views expressed in the text are those of the authors and do not necessarily reflect the views of the publisher.
The authors would like to thank Charles McHugh of the Missoula Fire Sciences Laboratory for his invaluable guidance and expertise in answering our questions about FlamMap, which greatly facilitated our understanding and use of this tool. We would also like to thank Louis Georgi of the Saxon National Park for providing ignition locations.
This research has been supported by the European Union through the Horizon 2020 research and innovation programme (FirEUrisk project) under the grant agreement no. 101003890. CM, MF, MT, JK, and LK acknowledge funding from Interreg Central Europe (Wildfire CE, project ID CE0200934). The contributions of MT and LK were supported by the OP JAK project AdAgriF – Advanced methods of greenhouse gases emission reduction and sequestration in agriculture and forest landscape for climate change mitigation (CZ.02.01.01/00/22_008/0004635).
This paper was edited by Sven Fuchs and reviewed by two anonymous referees.
Abatzoglou, J. T., Kolden, C. A., Cullen, A. C., Sadegh, M., Williams, E. L., Turco, M., and Jones, M. W.: Climate change has increased the odds of extreme regional forest fire years globally, Nat. Commun., 16, 6390, https://doi.org/10.1038/s41467-025-61608-1, 2025.
Abrahams, J., Anacia, A., Beavers, R., Gabriel Andrés, B., Caffrey, M., Omar Darío, C., Ciotti, M., Derrough, T., Douris, J., Espinosa, L., Fraser, G., G. Goldammer, J., Gudnason, T., Gyenes, Z., Hainsworth, A., Krausmann, E., Loughlin, S., Løvholt, F., Mallinis, G., Mitsopoulos, I., Nadim, F., Necci, A., Rudari, R., Severi, E., Sexton, J., Silva, V., Smallwood, C., Suk, J., Tsolova, S., Vigh, J. L., Villegas, C., Wannous, C., Weatherill, G., Yepes-Estrada, C., and Woolf, M.: Words into Action guidelines: National disaster risk assessment, Part Three: Hazard specific Risk Assessment, United Nations Office for Disaster Risk Reduction, https://www.preventionweb.net/files/52828_nationaldisasterriskassessmenthazar%5B1%5D.pdf (last access: 20 August 2026), 2017.
Alaska Fuel Model Guide Task Group (Ed.): Fuel model guide to Alaska vegetation, Alaska Wildland Fire Coordinating Group, Fire Modeling and Analysis Committee, Fairbanks, AK, https://fire.ak.blm.gov/content/admin/awfcg_committees/Fire%20Modeling%20and%20Analysis/AK%20Revised%20Fuel%20Model%20Guide%20May%202018.pdf (last access: 20 August 2026), 2018.
Alcasena, F., Salis, M., Ager, A., Castell, R., and Vega-García, C.: Assessing Wildland Fire Risk Transmission to Communities in Northern Spain, Forests, 8, 30, https://doi.org/10.3390/f8020030, 2017.
Alcasena, F., Ager, A., Le Page, Y., Bessa, P., Loureiro, C., and Oliveira, T.: Assessing Wildfire Exposure to Communities and Protected Areas in Portugal, Fire, 4, 82, https://doi.org/10.3390/fire4040082, 2021.
Alcasena, F. J., Ager, A. A., Salis, M., Day, M. A., and Vega-Garcia, C.: Wildfire spread, hazard and exposure metric raster grids for central Catalonia, Data in Brief, 17, 1–5, https://doi.org/10.1016/j.dib.2017.12.069, 2018.
Almeida, M., Soviev, M., San-Miguel, J., Durrant, T., Oom, D., Branco, A., Ferrari, D., Boca, R., Maianti, P., De, R. D., Suarez-Moreno, M., Roglia, E., Scionti, N., Broglia, M., Alves, D., Matos, C., Ribeiro, L. M., Viegas, D. X., Ribeiro, C., Rodrigues, T., Chuvieco, E., Oliva, P., Garcia, M., Velea, R., Laterza, R., De, L. M., Lorenzoni, P., Arca, B., Salis, M., Bacciu, V., Del, G. L., Pelizzaro, G., Duce, P., Marrs, C., Forkel, M., Beetz, K., Kosczor, E., Podebradska, M., Politi, N., Sfetsos, A., Vlachogiannis, D., Eftychidis, G., Stavrakoudis, D., Varela, V., Gitas, I. Z., Sjostrom, J., Petrila, M., Lorent, A., Drobinkova, N., Vasilev, V., Tsvetkova, N., Yanko, B., Gospodinov, I., Zibtsev, S., Goldammer, J., Myroniuk, V., Sydorenko, S., Soshenskyi, O., Bogomolov, V., and Borsuk, O.: Report on the large wildfires of 2022 in Europe, Joint Research Centre, https://doi.org/10.2760/19760, 2024.
Aragoneses, E., García, M., Salis, M., Ribeiro, L. M., and Chuvieco, E.: Classification and mapping of European fuels using a hierarchical, multipurpose fuel classification system, Earth Syst. Sci. Data, 15, 1287–1315, https://doi.org/10.5194/essd-15-1287-2023, 2023.
Argañaraz, J. P., Radeloff, V. C., Bar-Massada, A., Gavier-Pizarro, G. I., Scavuzzo, C. M., and Bellis, L. M.: Assessing wildfire exposure in the Wildland-Urban Interface area of the mountains of central Argentina, J. Environ. Manage., 196, 499–510, https://doi.org/10.1016/j.jenvman.2017.03.058, 2017.
Avouris, E.: Wildfire Exposure Online Map, Technische Universität Dresden, OPARA [data set], https://doi.org/10.25532/OPARA-954, 2025.
Beetz, K.: Forest fires in the Bohemian-Saxon Switzerland in 2022: Mapping and analysis of fuel types, fire dynamics and severity using remote sensing data, unpublished master's thesis, TU Dresden, 2023.
Beetz, K., Marrs, C., Busse, A., Poděbradská, M., Kinalczyk, D., Kranz, J., and Forkel, M.: Effects of bark beetle disturbance and fuel types on fire radiative power and burn severity in the Bohemian-Saxon Switzerland, Forestry, cpae024, https://doi.org/10.1093/forestry/cpae024, 2024.
Berčák, R., Holuša, J., Kaczmarowski, J., Tyburski, Ł., Szczygieł, R., Held, A., Vacik, H., Slivinský, J., and Chromek, I.: Fire Protection Principles and Recommendations in Disturbed Forest Areas in Central Europe: A Review, Fire, 6, 310, https://doi.org/10.3390/fire6080310, 2023.
Bowman, D. M. J. S., Williamson, G. J., Abatzoglou, J. T., Kolden, C. A., Cochrane, M. A., and Smith, A. M. S.: Human exposure and sensitivity to globally extreme wildfire events, Nat. Ecol. Evol., 1, 0058, https://doi.org/10.1038/s41559-016-0058, 2017.
Brázdil, R., Zahradník, P., Szabó, P., Chromá, K., Dobrovolný, P., Dolák, L., Trnka, M., Řehoř, J., and Suchánková, S.: Meteorological and climatological triggers of notable past and present bark beetle outbreaks in the Czech Republic, Clim. Past, 18, 2155–2180, https://doi.org/10.5194/cp-18-2155-2022, 2022.
Byram, G. M.: Combustion of Forest Fuels, in: Forest Fire: Control and Use, McGraw-Hill, 61–89, ISBN 978-0-07-015484-1, 1959.
Caballero, D. and Beltrán, I.: Concepts and ideas of assessing settlement fire vulnerability in the W-UI zone, International Workshop Forest Fires in the Wildland-Urban Interface and Rural Areas in Europe Athens, Greece, 15–16 May 2003, https://www.fria.gr/WARM/chapters/warmCh07Caballero.pdf (last access: 20 August 2026), 2003.
Copernicus Emergency Management Service: EMSR610: Wildfire in Saxony, Germany, https://mapping.emergency.copernicus.eu/activations/EMSR610/ (last access: 20 August 2026), 2022.
Copernicus Land Monitoring Service: Tree Cover Density 2018 (raster 10 m, 100 m), Europe, yearly, https://doi.org/10.2909/e677441e-fb94-431c-b4f9-304f10e4dfd8, 2024.
Copernicus Land Monitoring Service: Land Cover 2020 (raster 10 m), global, annual – version 1 (01.00), https://doi.org/10.2909/602507B2-96C7-47BB-B79D-7BA25E97D0A9, 2025.
ČÚZK: Geoportál: https://geoportal.cuzk.cz, last access: 17 November 2024.
Deutscher Wetterdienst: Climate Data Center (CDC) (CDC-v2.1.b22.09), https://cdc.dwd.de/portal/ (last access: 29 October 2025), 2025.
European Commission, Joint Research Centre, Almeida, M., Soviev, M., San-Miguel, J., Durrant, T., Oom, D., Branco, A., Ferrari, D., Boca, R., Maianti, P., De Rigo, D., Suarez-Moreno, M., Roglia, E., Scionti, N., Broglia, M., Alves, D., Matos, C., Ribeiro, L. M., Viegas, D. X., Ribeiro, C., Rodrigues, T., Chuvieco, E., Oliva, P., Garcia, M., Velea, R., Laterza, R., De Lucia, M., Lorenzoni, P., Arca, B., Salis, M., Bacciu, V., Del Giudice, L., Pelizzaro, G., Duce, P., Marrs, C., Forkel, M., Beetz, K., Kosczor, E., Podebradska, M., Politi, N., Sfetsos, A., Vlachogiannis, D., Eftychidis, G., Stavrakoudis, D., Varela, V., Gitas, I. Z., Sjostrom, J., Petrila, M., Lorent, A., Drobinkova, N., Vasilev, V., Tsvetkova, N., Yanko, B., Gospodinov, I., Zibtsev, S., Goldammer, J., Myroniuk, V., Sydorenko, S., Soshenskyi, O., Bogomolov, V., and Borsuk, O.: Report on the large wildfires of 2022 in Europe, Publications Office of the European Union, Luxembourg, https://doi.org/10.2760/19760, 2024.
Finney, M. A.: An Overview of FlamMap Fire Modeling Capabilities, in: Andrews, P. L. and Butler, B. W., comps. 2006, Fuels Management-How to Measure Success: Conference Proceedings, 28–30 March 2006, Portland, OR, Proceedings RMRS-P-41, U.S. Department of Agriculture, Forest Service, Rocky Mountain Research Station, Fort Collins, CO, 213–220, https://research.fs.usda.gov/treesearch/25948 (last access: 20 August 2026), 2006.
Finney, M. A., McAllister, S. S., Grumstrup, T. P., and Forthofer, J. M.: Wildland fire behaviour: dynamics, principles and processes, CSIRO Publishing, https://doi.org/10.1071/9781486309092, 2021.
Finney, M. A., Zimmer, S. N., Riley, K. L., and Grenfell, I. C.: A generalized wildfire containment algorithm, Ecol. Model., 505, 111134, https://doi.org/10.1016/j.ecolmodel.2025.111134, 2025.
FlamMap Help: https://owfflammaphelp62.firenet.gov, last access: 7 October 2023.
FlamMap – Missoula Fire Sciences Laboratory: https://research.fs.usda.gov/firelab/products/dataandtools/flammap, last access: 20 April 2026.
Flink, H.-M., Oksanen, J., Pyysalo, U., Rönneberg, M., and Sarjakoski, L. T.: Usability Evaluation of a Map-Based Multi-Publishing Service, in: Advances in Cartography and GIScience. Volume 1: Selection from ICC 2011, Paris, edited by: Ruas, A., Springer, Berlin, Heidelberg, 239–257, https://doi.org/10.1007/978-3-642-19143-5_14, 2011.
Forthofer, J., Shannon, K., and Butler, B.: Simulating diurnally driven slope winds with WindNinja, in: Proceedings of 8th Eighth Symposium on Fire and Forest Meteorology, Kalispell, MT, 13–15 October 2009, American Meteorological Society, Boston, MA, 13 pp., https://ams.confex.com/ams/8Fire/techprogram/paper_156275.htm (last access: 26 October 2025), 2009.
Geofabrik – Europe: http://download.geofabrik.de/europe.html, last access: 23 October 2023.
Geoportal Sachsenatlas: https://geoportal.sachsen.de/, last access: 24 June 2024.
Guo, Y., Wang, J., Ge, Y., and Zhou, C.: Global expansion of wildland-urban interface intensifies human exposure to wildfire risk in the 21st century, Science Advances, 10, eado9587, https://doi.org/10.1126/sciadv.ado9587, 2024.
Haas, J. R., Calkin, D. E., and Thompson, M. P.: A national approach for integrating wildfire simulation modeling into Wildland Urban Interface risk assessments within the United States, Landscape Urban Plan., 119, 44–53, https://doi.org/10.1016/j.landurbplan.2013.06.011, 2013.
Hasičovo: https://www.hasicovo.cz, last access: 31 October 2023.
Hasičský záchranný sbor České republiky: https://www.hzscr.cz, last access: 24 October 2023.
Heisig, J., Olson, E., and Pebesma, E.: Predicting Wildfire Fuels and Hazard in a Central European Temperate Forest Using Active and Passive Remote Sensing, Fire, 5, 29, https://doi.org/10.3390/fire5010029, 2022.
Hlásny, T., Zimová, S., Merganičová, K., Štěpánek, P., Modlinger, R., and Turčáni, M.: Devastating outbreak of bark beetles in the Czech Republic: Drivers, impacts, and management implications, Forest Ecol. Manag., 490, 1–13, https://doi.org/10.1016/j.foreco.2021.119075, 2021.
Johnston, L. M., Wang, X., Erni, S., Taylor, S. W., McFayden, C. B., Oliver, J. A., Stockdale, C., Christianson, A., Boulanger, Y., Gauthier, S., Arseneault, D., Wotton, B. M., Parisien, M.-A., and Flannigan, M. D.: Wildland fire risk research in Canada, Environ. Rev., 28, 164–186, https://doi.org/10.1139/er-2019-0046, 2020.
Jones, M. W., Abatzoglou, J. T., Veraverbeke, S., Andela, N., Lasslop, G., Forkel, M., Smith, A. J. P., Burton, C., Betts, R. A., van der Werf, G. R., Sitch, S., Canadell, J. G., Santín, C., Kolden, C., Doerr, S. H., and Le Quéré, C.: Global and Regional Trends and Drivers of Fire Under Climate Change, Rev. Geophys., 60, e2020RG000726, https://doi.org/10.1029/2020RG000726, 2022.
Jones, M. W., Kelley, D. I., Burton, C. A., Di Giuseppe, F., Barbosa, M. L. F., Brambleby, E., Hartley, A. J., Lombardi, A., Mataveli, G., McNorton, J. R., Spuler, F. R., Wessel, J. B., Abatzoglou, J. T., Anderson, L. O., Andela, N., Archibald, S., Armenteras, D., Burke, E., Carmenta, R., Chuvieco, E., Clarke, H., Doerr, S. H., Fernandes, P. M., Giglio, L., Hamilton, D. S., Hantson, S., Harris, S., Jain, P., Kolden, C. A., Kurvits, T., Lampe, S., Meier, S., New, S., Parrington, M., Perron, M. M. G., Qu, Y., Ribeiro, N. S., Saharjo, B. H., San-Miguel-Ayanz, J., Shuman, J. K., Tanpipat, V., van der Werf, G. R., Veraverbeke, S., and Xanthopoulos, G.: State of Wildfires 2023–2024, Earth Syst. Sci. Data, 16, 3601–3685, https://doi.org/10.5194/essd-16-3601-2024, 2024.
Keane, R. E.: Wildland Fuel Fundamentals and Applications, 1st edn., Springer Cham, https://doi.org/10.1007/978-3-319-09015-3, 2015.
Knutzen, F., Averbeck, P., Barrasso, C., Bouwer, L. M., Gardiner, B., Grünzweig, J. M., Hänel, S., Haustein, K., Johannessen, M. R., Kollet, S., Müller, M. M., Pietikäinen, J.-P., Pietras-Couffignal, K., Pinto, J. G., Rechid, D., Rousi, E., Russo, A., Suarez-Gutierrez, L., Veit, S., Wendler, J., Xoplaki, E., and Gliksman, D.: Impacts on and damage to European forests from the 2018–2022 heat and drought events, Nat. Hazards Earth Syst. Sci., 25, 77–117, https://doi.org/10.5194/nhess-25-77-2025, 2025.
Kranz, J., Bauer, K., Pampanoni, V., Zhao, L., Marrs, C., Mauder, M., Poděbradská, M., van der Maaten-Theunissen, M., Yebra, M., and Forkel, M.: Assessing predictors for fuel moisture content in Central European forests, Agr. Forest Meteorol., 371, 110590, https://doi.org/10.1016/j.agrformet.2025.110590, 2025.
Kreisfeuerwehrverband – Sächsische Schweiz-Osterzgebirge e.V.: https://kfv-soe.de/, last access: 31 October 2023.
Kudláčková, L., Poděbradská, M., Bláhová, M., Cienciala, E., Beranová, J., McHugh, C., Finney, M., Novotný, J., Zahradníček, P., Štěpánek, P., Linda, R., Pikl, M., Vébrová, D., Možný, M., Surový, P., Žalud, Z., and Trnka, M.: Using FlamMap to assess wildfire behavior in Bohemian Switzerland National Park, Nat. Hazards, 120, 3943–3977, https://doi.org/10.1007/s11069-023-06361-8, 2024.
Landesamt für Geobasisinformation Sachsen: https://www.landesvermessung.sachsen.de, last access: 19 October 2023.
Landnutzung – Geobasisinformation: https://www.landesvermessung.sachsen.de//landnutzung-9558.html, last access: 17 November 2024.
Mallinis, G.: Assessing differences in fire hazard over Mediterranean coppice and high forests, STSM Report, University of Sassari, Department of Science for Nature and Environmental Resources, https://www.eurocoppice.uni-freiburg.de/intern/pdf/stsm/stsmreport-giorgos-mallinis-rev.pdf (last access: 20 August 2026), 2014.
Mallinis, G., Mitsopoulos, I., Beltran, E., and Goldammer, J.: Assessing Wildfire Risk in Cultural Heritage Properties Using High Spatial and Temporal Resolution Satellite Imagery and Spatially Explicit Fire Simulations: The Case of Holy Mount Athos, Greece, Forests, 7, 46, https://doi.org/10.3390/f7020046, 2016.
Ministerium des Innern und für Kommunales des Landes Brandenburg: Großwaldbrände im Land Brandenburg – Bericht zur Waldbrandsaison 2022, Landesschule und Technische Einrichtung für Brand- und Katastrophenschutz, Potsdam, https://mik.brandenburg.de/mik/de/service/publikationen/detail/~18-07-2023-waldbrandbericht-2022 (last access: 20 August 2026), 2023.
Mitsopoulos, I., Mallinis, G., Karali, A., Giannakopoulos, C., and Arianoutsou, M.: Mapping fire behaviour under changing climate in a Mediterranean landscape in Greece, Reg. Environ. Change, 16, 1929–1940, https://doi.org/10.1007/s10113-015-0884-0, 2016.
Moghaddas, J. J., Collins, B. M., Menning, K., Moghaddas, E. E. Y., and Stephens, S. L.: Fuel treatment effects on modeled landscape-level fire behavior in the northern Sierra Nevada, Can. J. Forest Res., 40, 1751–1765, https://doi.org/10.1139/X10-118, 2010.
Müller, J., Bußler, H., Goßner, M., Rettelbach, T., and Duelli, P.: The European spruce bark beetle Ips typographus in a national park: from pest to keystone species, Biodivers. Conserv., 17, 2979–3001, https://doi.org/10.1007/s10531-008-9409-1, 2008.
NASA MODIS Science Data Support Team: MODIS/Aqua Terra Thermal Anomalies/Fire locations 1 km FIRMS NRT (Vector data), https://doi.org/10.5067/FIRMS/MODIS/MCD14DL.NRT.0061, 2021.
NASA VIIRS Land Science Team: VIIRS (S-NPP) I Band 375 m Active Fire Product NRT (Vector data), https://doi.org/10.5067/FIRMS/VIIRS/VNP14IMGT_NRT.002, 2020.
Nationalpark Sächsische Schweiz: https://nationalpark-saechsische-schweiz.de, last access: 14 April 2023.
Natur und Biologische Vielfalt: https://www.natur.sachsen.de, last access: 13 November 2024.
Oliveira, S., Gonçalves, A., Benali, A., Sá, A., Zêzere, J. L., and Pereira, J. M.: Assessing Risk and Prioritizing Safety Interventions in Human Settlements Affected by Large Wildfires, Forests, 11, 859, https://doi.org/10.3390/f11080859, 2020.
Oliveira, S., Rocha, J., and Sá, A.: Wildfire risk modeling, Current Opinion in Environmental Science & Health, 23, 100274, https://doi.org/10.1016/j.coesh.2021.100274, 2021.
OpenStreetMap: https://wiki.openstreetmap.org/wiki, last access: 31 October 2023.
Peterson, D. L., Evers, L., Gravenmier, R. A., and Eberhardt, E.: A consumer guide: tools to manage vegetation and fuels, U.S. Department of Agriculture, Forest Service, Pacific Northwest Research Station, Portland, OR, https://doi.org/10.2737/PNW-GTR-690, 2007.
Požár v NP České Švýcarsko: https://www.npcs.cz/pozar-v-np-ceske-svycarsko, last access: 16 November 2024.
Radeloff, V. C., Helmers, D. P., Kramer, H. A., Mockrin, M. H., Alexandre, P. M., Bar-Massada, A., Butsic, V., Hawbaker, T. J., Martinuzzi, S., Syphard, A. D., and Stewart, S. I.: Rapid growth of the US wildland-urban interface raises wildfire risk, P. Natl. Acad. Sci. USA, 115, 3314–3319, https://doi.org/10.1073/pnas.1718850115, 2018.
Rothermel, R. C.: A mathematical model for predicting fire spread in wildland fuels, Res. Pap. INT-115, U.S. Department of Agriculture, Intermountain Forest and Range Experiment Station, Ogden, UT, 40 pp., https://research.fs.usda.gov/treesearch/32533 (last access: 20 August 2026), 1972.
Rothermel, R. C. and Deeming, J. E.: Measuring and Interpreting Fire Behavior for Correlation with Fire Effects, USDA Forest Service, Ogden, Utah, https://www.frames.gov/catalog/6153 (last access: 20 August 2026), 1980.
Sá, A. C. L., Aparicio, B., Benali, A., Bruni, C., Salis, M., Silva, F., Marta-Almeida, M., Pereira, S., Rocha, A., and Pereira, J.: Coupling wildfire spread simulations and connectivity analysis for hazard assessment: a case study in Serra da Cabreira, Portugal, Nat. Hazards Earth Syst. Sci., 22, 3917–3938, https://doi.org/10.5194/nhess-22-3917-2022, 2022.
Safaie, S., Stepanyan, M., Houdijk, R., and Onur, T.: Words into Action guidelines: National disaster risk assessment, Part One: Main Body, United Nations Office for Disaster Risk Reduction, https://www.preventionweb.net/files/52828_nationaldisasterriskassessmentpart1.pdf (last access: 20 August 2026), 2017.
Salis, M., Arca, B., Bacciu, V., Duce, P., and Spano, D.: Assessment of Fire Severity in a Mediterranean Area using FlamMap Simulator, Eighth Symposium on Fire and Forest Meteorology, Kalispell, Montana, USA, 12–15 October 2009, https://ams.confex.com/ams/pdfpapers/156339.pdf (last access: 20 August 2026), 2009.
Salis, M., Ager, A. A., Arca, B., Finney, M. A., Bacciu, V., Duce, P., and Spano, D.: Assessing exposure of human and ecological values to wildfire in Sardinia, Italy, Int. J. Wildland Fire, https://doi.org/10.1071/WF11060, 2012.
Scott, J. H.: Glossary of wildfire hazard and risk, Pyrologix, https://pyrologix.com/downloads/wildfirehazardandriskglossary_20190523/ (last access: 20 August 2026), 2019.
Scott, J. H. and Burgan, R. E.: Standard fire behavior fuel models: a comprehensive set for use with Rothermel's surface fire spread model, U.S. Department of Agriculture, Forest Service, Rocky Mountain Research Station, Ft. Collins, CO, https://doi.org/10.2737/RMRS-GTR-153, 2005.
Scott, J. H., Thompson, M. P., and Calkin, D. E.: A wildfire risk assessment framework for land and resource management, Gen. Tech. Rep. RMRS-GTR-315, U.S. Department of Agriculture, Forest Service, Rocky Mountain Research Station. 83 pp., https://doi.org/10.2737/rmrs-gtr-315, 2013.
Seidl, R., Schelhaas, M.-J., Rammer, W., and Verkerk, P. J.: Increasing forest disturbances in Europe and their impact on carbon storage, Nat. Clim. Change, 4, 806–810, https://doi.org/10.1038/nclimate2318, 2014.
Senf, C., Pflugmacher, D., Zhiqiang, Y., Sebald, J., Knorn, J., Neumann, M., Hostert, P., and Seidl, R.: Canopy mortality has doubled in Europe's temperate forests over the last three decades, Nat. Commun., 9, 4978, https://doi.org/10.1038/s41467-018-07539-6, 2018.
Staatsbetrieb Sachsenforst: https://www.sbs.sachsen.de, last access: 24 October 2023.
Stephens, S. L.: Evaluation of the effects of silvicultural and fuels treatments on potential fire behaviour in Sierra Nevada mixed-conifer forests, Forest Ecol. Manag., 105, 21–35, https://doi.org/10.1016/S0378-1127(97)00293-4, 1998.
Trnka, M., Balek, J., Možný, M., Cienciala, E., Čermák, P., Semerádová, D., Jurecka, F., Hlavinka, P., Štepánek, P., Farda, A., Skalák, P., Beranová, J., Chuchma, F., Zahradníček, P., Janouš, D., Žalud, Z., Dubrovsky, M., Kindlmann, P., Křenová, Z., Fischer, M., Hruška, J., and Brázdil, R.: Observed and expected changes in wildfire-conducive weather and fire events in peri-urban zones and key nature reserves of the Czech Republic, Clim. Res., 82, 33–54, https://doi.org/10.3354/cr01617, 2020.
Trnka, M., Možný, M., Jurečka, F., Balek, J., Semerádová, D., Hlavinka, P., Štěpánek, P., Farda, A., Skalák, P., Cienciala, E., Čermák, P., Chuchma, F., Zahradníček, P., Janouš, D., Fischer, M., Žalud, Z., and Brázdil, R.: Observed and estimated consequences of climate change for the fire weather regime in the moist-temperate climate of the Czech Republic, Agr. Forest Meteorol., 310, 108583, https://doi.org/10.1016/j.agrformet.2021.108583, 2021.
Ursino, N. and Romano, N.: Wild forest fire regime following land abandonment in the Mediterranean region, Geophys. Res. Lett., 41, 8359–8368, https://doi.org/10.1002/2014GL061560, 2014.
Van Wagtendonk, J. W.: Use of a deterministic fire growth model to test fuel treatments, in: Sierra Nevada Ecosystem Project: Final Report to Congress, Volume II: Assessments and Scientific Basis for Management Options, University of California, Centers for Water and Wildland Resources, Davis, California, ISBN 978-1-887673-01-3, 1996.
Waldbrandgefährdung: https://www.mais.de/php/sachsenforst.php, last access: 26 October 2023.
Wang, C.: Usability Evaluation of Public Web Mapping Sites, Int. Arch. Photogramm., XL-4, 285–289, https://doi.org/10.5194/isprsarchives-XL-4-285-2014, 2014.
Wild, J., Kopecký, M., Macek, M., Šanda, M., Jankovec, J., and Haase, T.: Climate at ecologically relevant scales: A new temperature and soil moisture logger for long-term microclimate measurement, Agr. Forest Meteorol., 268, 40–47, https://doi.org/10.1016/j.agrformet.2018.12.018, 2019.
Wittich, K.-P. and Bock, L.: Historie der Waldbrandgefahrenvorhersage in Deutschland, AFZ-DerWald, 69, 18–21, 2014.
Wittich, K.-P., Bock, L., and Zimmermann, L.: Der WBI und dessen Anwendung auf bayerische Waldbrände, AFZ-DerWald, 69, 22–25, 2014.
- Abstract
- Introduction
- Data and Methods
- Results
- Discussion
- Conclusions
- Appendix A: Dead Fuel Moisture
- Appendix B: Fuel Types to Fuel Models
- Appendix C: Distribution of Wind Roses
- Appendix D: Example Burn Probability and Flame Length Rasters
- Appendix E: Municipality Exposure
- Appendix F: Interactive web map
- Appendix G: Usability Questionnaire Replies
- Data availability
- Author contributions
- Competing interests
- Disclaimer
- Acknowledgements
- Financial support
- Review statement
- References
- Abstract
- Introduction
- Data and Methods
- Results
- Discussion
- Conclusions
- Appendix A: Dead Fuel Moisture
- Appendix B: Fuel Types to Fuel Models
- Appendix C: Distribution of Wind Roses
- Appendix D: Example Burn Probability and Flame Length Rasters
- Appendix E: Municipality Exposure
- Appendix F: Interactive web map
- Appendix G: Usability Questionnaire Replies
- Data availability
- Author contributions
- Competing interests
- Disclaimer
- Acknowledgements
- Financial support
- Review statement
- References