
the Creative Commons Attribution 4.0 License.
the Creative Commons Attribution 4.0 License.
 | 20 Aug 2026
Integrating flood-induced population movements into future fluvial flood damage estimates in Japan
Hayata Yanagihara
So Kazama
Kei Gomi
Yusuke Hiraga
Atsuya Ikemoto
Recent studies have highlighted that flooding can influence population dynamics. However, existing estimates of future fluvial flood damage primarily consider population changes driven by births, deaths, and migration unrelated to flooding. As a result, the potential impacts of flood-induced population movements (FIPMs) on future fluvial flood damage costs remain largely unexplored. This study evaluated the impacts of FIPMs on future fluvial flood damage costs in Japan, a country that faces flood risk and population decline. We developed a methodological framework that uses statistical causal inference to quantify FIPMs, integrates these estimates into future population and land-use projections, and evaluates future fluvial flood damage costs under scenarios of climate and land-use change. Empirical relationships between flood magnitude and FIPMs were estimated using grid-cell-level data from two flood events in 2019 and 2020 and municipality-level data from municipalities affected by flood disasters during 2015–2020, and then applied to future population projections using flood magnitude indicators derived from future fluvial flood inundation analyses. The results indicate that incorporating FIPMs leads to only modest changes in estimated fluvial flood damage costs at the national level (generally below 1 %), and similarly modest impacts at the prefectural level, except for a few prefectures with changes of approximately 2 %. However, greater variability is observed at the municipal level, with approximately 10 % of municipalities experiencing changes exceeding 1 % and some municipalities showing reductions in estimated fluvial flood damage costs exceeding 10 %. These findings highlight the importance of accounting for FIPMs in municipal-level fluvial flood risk management frameworks and policy evaluations.
- Article
(2238 KB) - Full-text XML
-
Supplement
(845 KB) - BibTeX
- EndNote


According to the Emergency Events Database, flood disasters caused by heavy rainfall occurred in 115 countries from 2015 to 2024 (Delforge et al., 2025). Accordingly, flood disasters are a pressing issue across many countries. In response, flood damage assessments have been conducted to inform the development of flood mitigation strategies (Marvi, 2020; Merz et al., 2010; Redondo-Tilano et al., 2025). Moreover, changes in precipitation patterns caused by global warming are expected to affect the extent of flood damage. For example, Alfieri et al. (2017) demonstrated that, under a 4 °C global warming scenario, fluvial flood damage costs could increase by an average of 500 % in countries collectively accounting for 79 % of the global gross domestic product. In addition to climate change, flood damage costs and population exposure have been assessed considering population change (Rogers et al., 2025; Swain et al., 2020; Wing et al., 2022). Future changes in fluvial and pluvial flood damage costs driven by climate and population change have also been assessed using Shared Socioeconomic Pathways (SSPs) downscaled for national-scale assessments (Yanagihara et al., 2024). These studies utilized existing population projections at the county or grid-cell level to estimate flood damage costs and population exposure. However, such population projections typically consider demographic changes driven only by births, deaths, and migration, without explicitly accounting for flood-induced population movements (FIPMs). Such approaches assume that future population projections are independent of flood damage estimates.
In contrast, recent studies have highlighted the importance of FIPMs (Del Rio Amador et al., 2025; Kakinuma et al., 2020; Kam et al., 2021). FIPMs can take different forms, including planned relocation or policy-driven resettlement and spontaneous migration by households or individuals. Planned relocation involves organized efforts to move residents away from hazardous areas (McAdam and Ferris, 2015), whereas spontaneous migration reflects household- or individual-level decisions to move (Black et al., 2011). FIPMs can alter patterns of exposure to flood hazards, thereby influencing the extent of flood damage. Therefore, FIPMs may influence future fluvial flood damage costs. However, the extent to which such movements affect future fluvial flood damage costs remains underexplored. For example, while Shu et al. (2023) evaluated the impact of flooding on future population projections across the United States, they did not incorporate these impacts into estimates of future flood damage costs. They reported that population responses to observed flood exposure have already emerged in some areas, leading to reduced population growth rates. This projected decrease in growth rates could result in fewer people and assets being exposed to flood hazards, thereby potentially lowering future flood damage costs. Since lower flood damage costs may diminish the estimated total benefits of flood mitigation strategies (Yanagihara et al., 2024), overlooking FIPMs could result in the overestimation of their effectiveness. Therefore, it is essential to evaluate the influence of FIPMs on future fluvial flood damage estimates. Moreover, socio-hydrology has received increasing attention as a framework for comprehensively understanding the interactions between human activities and water systems (Sivapalan et al., 2012). Accordingly, quantitatively assessing the impact of FIPMs on future fluvial flood damage costs is important from a socio-hydrological perspective.
In Japan, many urban areas lie below river water levels, making them highly vulnerable to large-scale fluvial flood damage (MLIT, 2006). Moreover, Japanese rivers are steeper than major rivers in other countries (MLIT, 2006), causing rainfall to flow rapidly and making the rivers more susceptible to sudden increases in water levels. In addition, Japan's average annual precipitation is approximately twice the global average (MLIT, 2006). These topographical and climatic conditions contribute to Japan's high susceptibility to fluvial flooding. Furthermore, Japan is projected to experience a significant population decline (Jarzebski et al., 2021). Given the dual challenges of fluvial flood damage and population decline, evaluating the impact of FIPMs on future fluvial flood damage costs in Japan is essential. However, no existing assessments of future fluvial flood damage costs in Japan have incorporated FIPMs. This gap is largely due to a lack of sufficient quantitative understanding of how flooding influences population movements. Although previous studies have indicated that floods can influence population movements in Japan (Ujihara et al., 2019; Namikawa et al., 2022), few have quantitatively analyzed intermunicipal population movements in relation to flood magnitude (Okamoto et al., 2023). Even internationally, quantitative analyses of the relationships between flood magnitude and population movements at fine spatial scales remain limited (Shu et al., 2023; Tsuda and Tebakari, 2023). Therefore, to incorporate FIPMs into future population projections and integrate these projections into fluvial flood damage cost assessments, a more advanced quantitative understanding of population movements in relation to flood magnitude is required.
Previous studies have used empirical approaches to analyze relationships between flood exposure or natural-hazard-related damage and population dynamics. For example, Shu et al. (2023) used propensity score matching followed by regression-based statistical modeling to estimate the relationship between flood exposure and population change, while Ton et al. (2025) applied panel gravity models to county-to-county migration flows to analyze the relationship between economic damage from natural hazards and internal migration. These approaches provide important insights into population responses to flood exposure and natural-hazard-related damage. Incorporating FIPMs into future population projections requires estimating population responses relative to a counterfactual scenario in which flooding did not occur. For this purpose, the difference-in-differences (DiD) method, a statistical causal inference technique developed in the fields of econometrics and sociology, is well suited when its identification assumptions are plausible. It quantifies FIPMs by estimating population changes and migration responses attributable to flooding through comparisons between affected and unaffected areas before and after flood events.
Against this background, this study aims to evaluate the impacts of FIPMs on future fluvial flood damage costs in Japan. To achieve this, we propose a methodological framework for projecting future population and estimating fluvial flood damage costs that accounts for FIPMs. Specifically, we use the DiD method to quantify FIPMs between and within municipalities in response to varying flood magnitudes and incorporate the estimated relationships into future population and land-use projections. These empirical relationships are estimated using grid-cell-level data from two flood events in 2019 and 2020 and municipality-level data from flood-affected municipalities during 2015–2020. They are then applied to future population projections using flood magnitude indicators derived from future fluvial flood inundation analyses, rather than by directly extrapolating the observed events themselves.
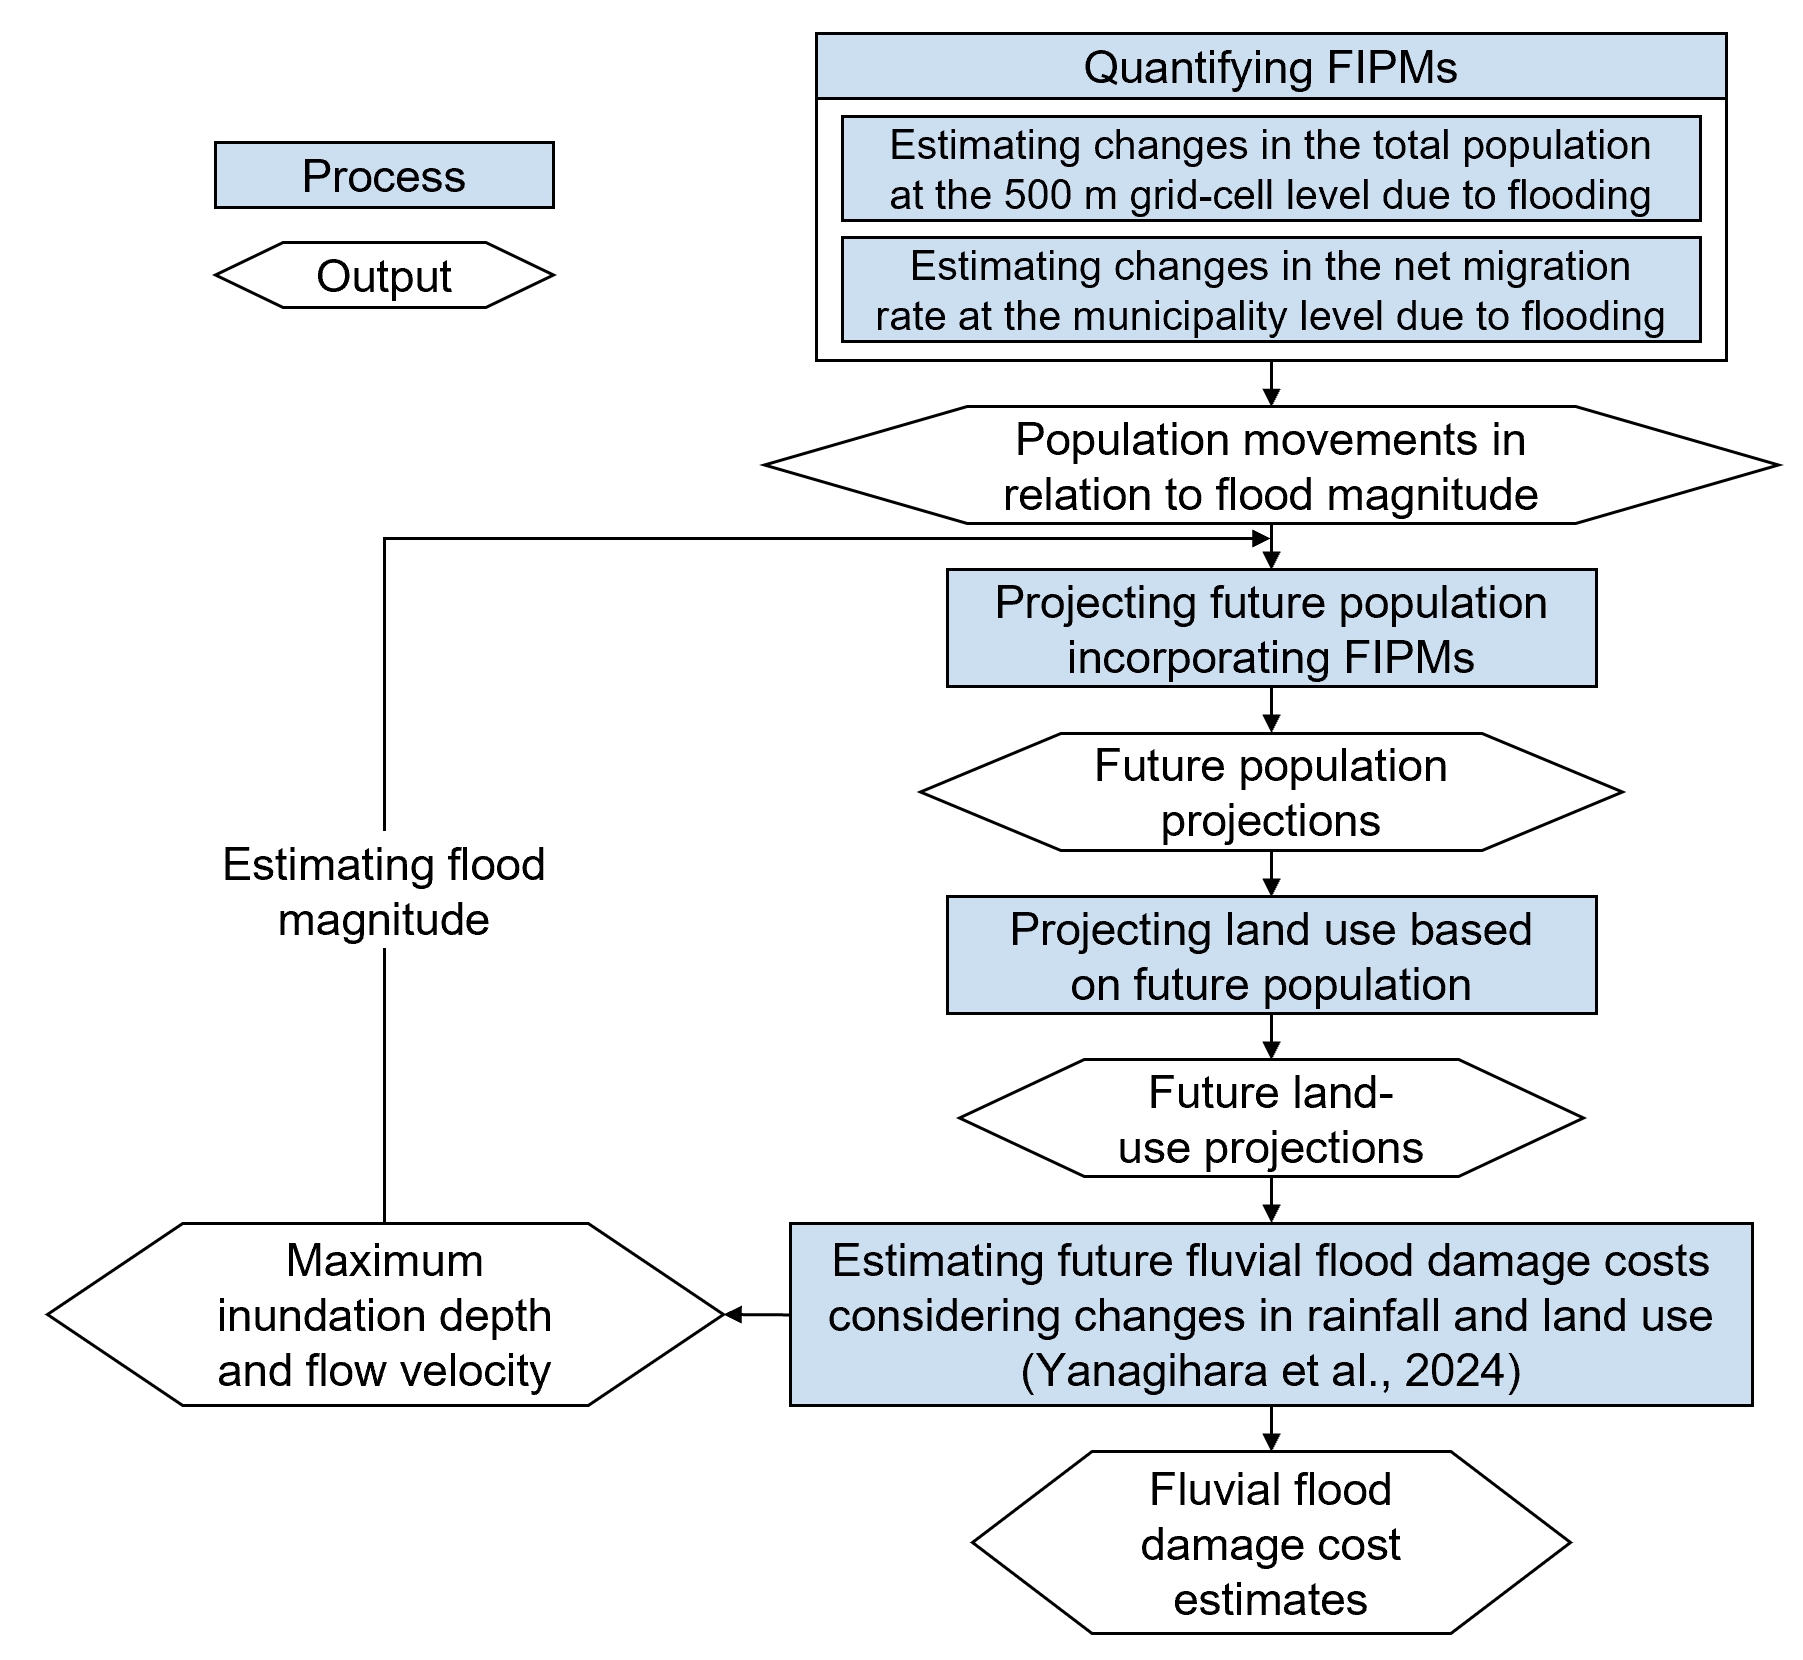
Figure 1Methodological framework for estimating future fluvial flood damage costs accounting for FIPMs.
2.1 Methodological framework
The proposed methodological framework for estimating future fluvial flood damage costs, accounting for FIPMs, is presented in Fig. 1. This framework comprises four main processes: quantifying FIPMs, projecting future population incorporating FIPMs, projecting land use based on future population, and estimating future fluvial flood damage costs considering changes in rainfall and land use. These processes follow a sequential relationship: quantified FIPMs inform projections of future population distributions, subsequent changes in population distribution determine shifts in land-use patterns, and these land-use changes influence the estimation of fluvial flood damage costs. FIPMs were quantified at both the grid-cell and municipality levels using available demographic data to capture population movements occurring within and between municipalities in response to varying flood magnitudes. Specifically, FIPMs were quantified using two types of observed datasets that combine flood-related and demographic information. Within-municipality population changes were estimated using flood inundation maps for areas affected by Typhoon Hagibis (2019) and the heavy rainfall event of July 2020, together with 500 m grid-cell population data. Inter-municipality population movements were estimated using municipality-level flood damage records and annual migration data. These data were used to estimate empirical relationships between flood magnitude and FIPMs, rather than to directly extrapolate the observed events themselves. The areas covered by the flood inundation maps used in the 500 m grid-cell-level analysis and the treated municipalities used in the municipality-level DiD analysis are shown in Figs. S1 and S2 in the Supplement, respectively. Detailed methodologies for quantifying FIPMs are presented in Sect. 2.2 and 2.3, while methodologies for the subsequent processes of the framework are described in Sect. 2.4–2.6.
2.2 Estimating changes in the total population at the 500 m grid-cell level due to flooding
2.2.1 Analysis target and period
This study analyzed the impact of flooding on the total population at the 500 m grid-cell level in areas affected by Typhoon Hagibis (2019) and the heavy rainfall event of July 2020 in Japan. Population data at five-year intervals from 2005 to 2020 were used. To isolate the effects of population movements, data excluding natural changes resulting from births and deaths would be preferable; however, such data are unavailable at the grid-cell level. Grid cells inundated during the selected events were designated as the treatment group, while the control group consisted of grid cells in municipalities that did not experience residential water-related disasters between 2005 and 2020. Affected municipalities were identified using data on areas affected by water-related disasters, while inundated grid cells were identified using flood inundation maps. Criteria for excluding grid cells from the analysis are detailed in Sect. S1 in the Supplement. Given data availability, flood magnitude was represented using the maximum inundation depth estimated within each grid cell. For grid cells in the treatment group, the maximum inundation depth was calculated based on values provided in the flood inundation maps. The flood inundation maps provide estimates of inundated areas and inundation depths during the target heavy rainfall events and do not distinguish between fluvial and pluvial flooding. Therefore, the grid-cell-level analysis uses the estimated inundation without separating fluvial and pluvial components. Details regarding the total population data at the 500 m grid-cell level, data on areas affected by water-related disasters, and flood inundation maps are provided in Sect. S2. Descriptive statistics are presented in Tables S1 and S2 in the Supplement.
2.2.2 Covariates
Based on previous studies of population movements in Japan (Arakawa and Noyori, 2023; Ushiki et al., 2019), we selected 21 covariates, including climatological variables, socioeconomic indicators, accessibility to public and social facilities, demographic composition, and flood risk. Covariates and their descriptive statistics are listed in Table S3. All covariates were compiled at the 500 m grid-cell level (see Sect. S3).
2.2.3 Analytical method
As the difference in the total population before and after a flood does not solely reflect the flood's impact on the population but also reflects the effects of other unrelated factors, our framework incorporates the DiD method (see Sect. S4) to evaluate changes in the total population attributable to flooding. We applied DiD using the following regression model:
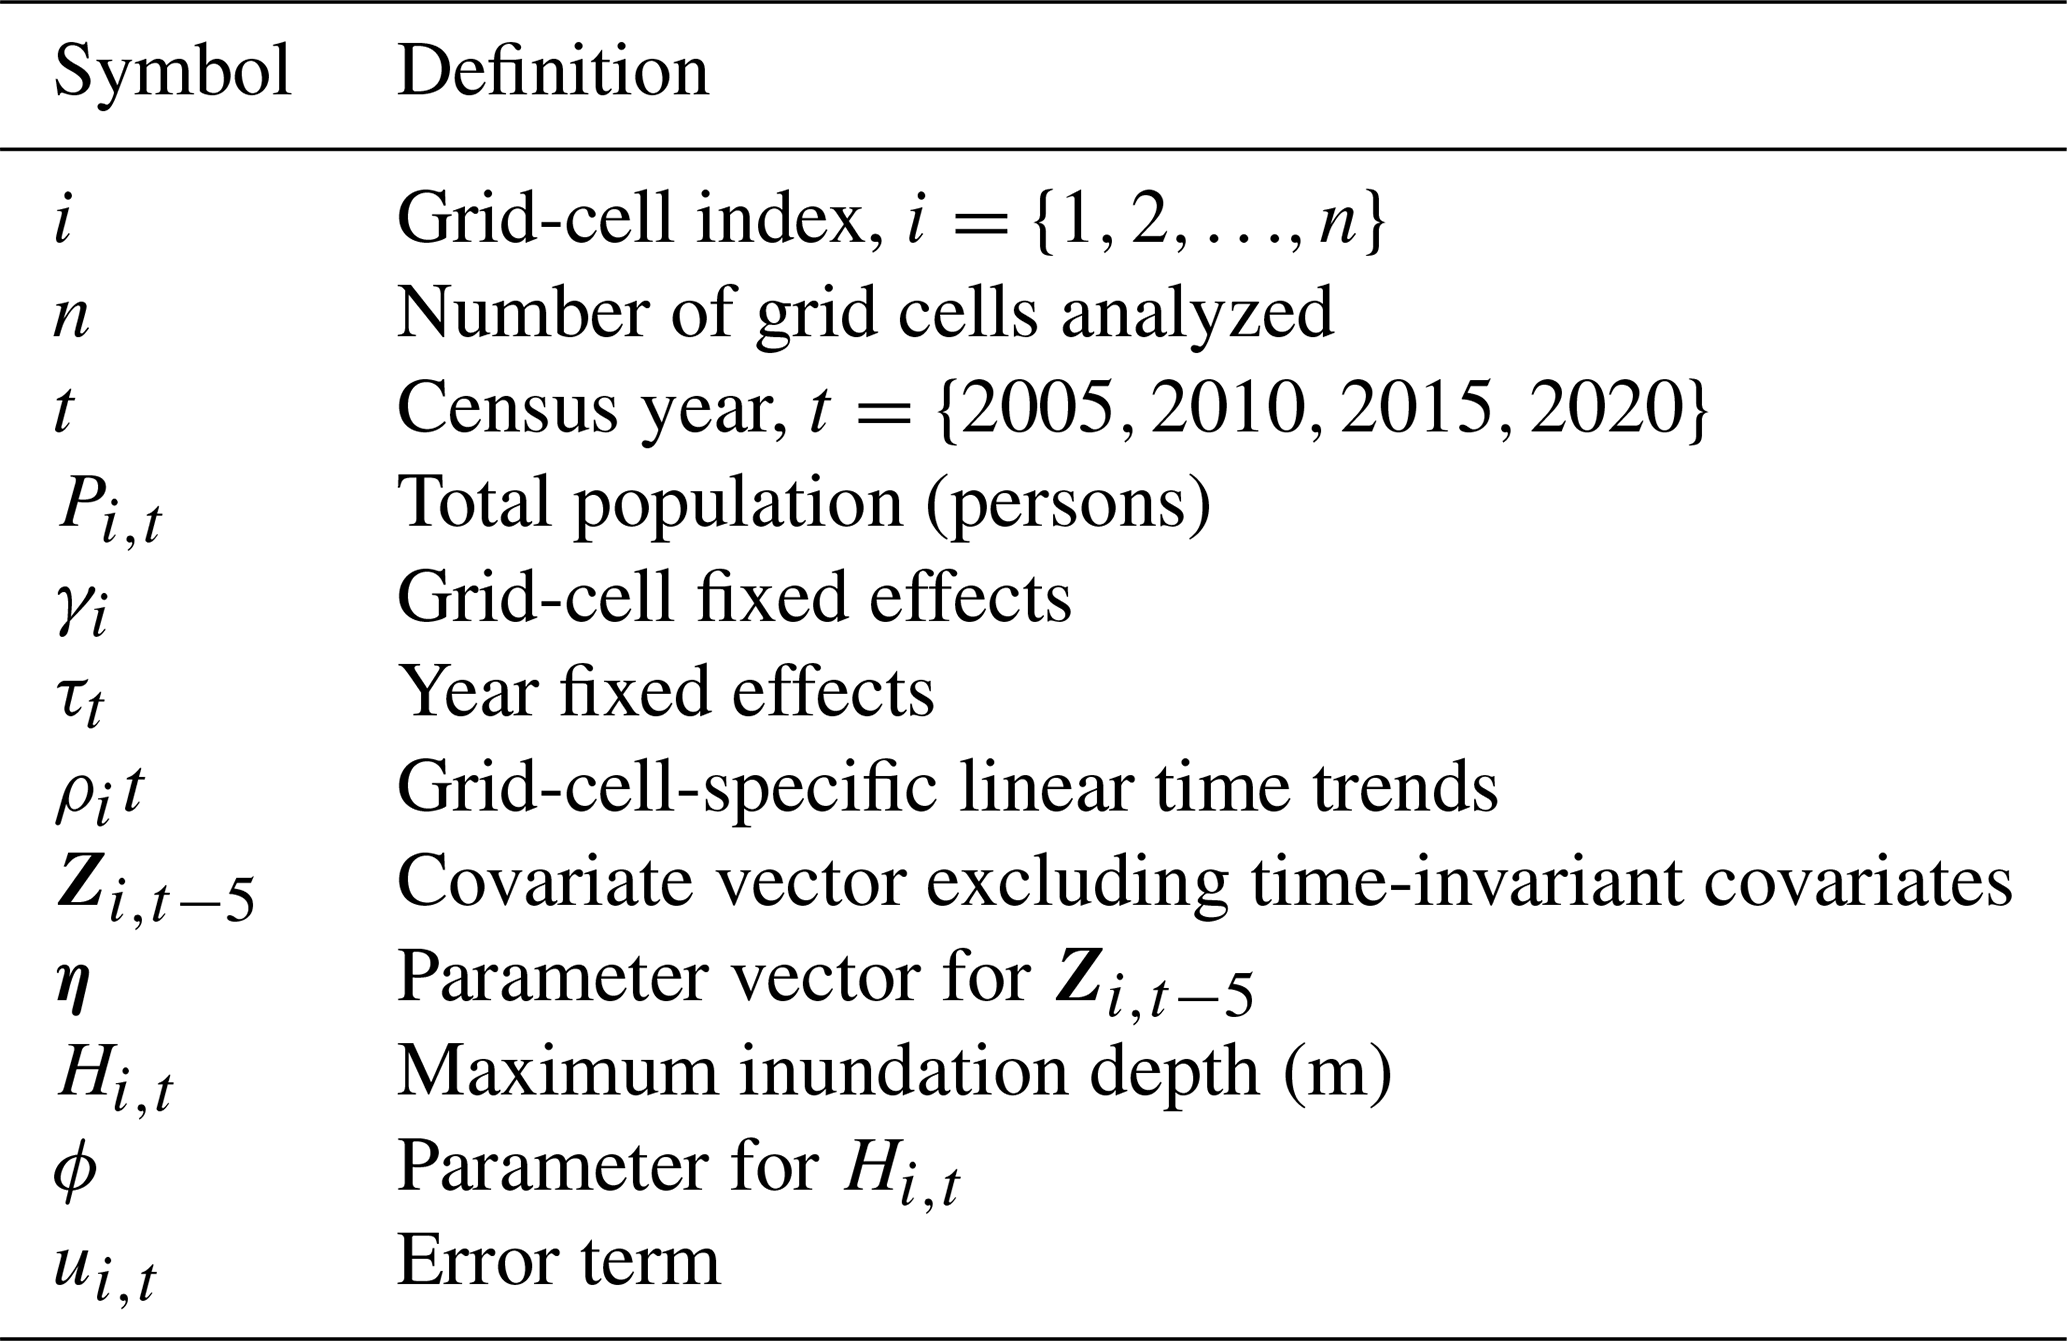
Definitions of the variables and parameters in Eq. (1) are summarized in Table 1. The key parameter is ϕ, which quantifies the effect of the maximum inundation depth on the total population. The variable Hi,t records the maximum inundation depth only for treatment-group grid cells in flood years and takes a value of 0 otherwise. Because the dependent variable is specified as the natural logarithm of the total population, ϕ allows us to estimate the percentage change in the total population per 1 m increase in maximum inundation depth at the 500 m grid-cell level, calculated as (eϕ−1) ×100 % (Morita, 2014). This percentage change represents the difference relative to a counterfactual scenario in which flooding did not occur. A negative ϕ implies a decrease in the total population resulting from flooding. Details of the analytical method are provided in Sect. S5.
In regression-based DiD analysis, the overall fit of the regression model is not the primary concern (Nguyen, 2020). To interpret ϕ as the causal effect of treatment on the outcome, the parallel trends assumption must be satisfied (Kono et al., 2021). This assumption states that the treated and control grid cells would have followed parallel trends in the outcome variable over time had the treatment not occurred. Since the counterfactual outcomes for the treated grid cells (i.e., outcomes that would have occurred without flooding) cannot be observed, the parallel trends assumption cannot be tested directly. Following previous studies, we conducted an indirect test of the parallel trends assumption by checking for statistically significant differences in the outcome variable between the treatment and control grid cells before treatment (Alves et al., 2022). No statistically significant difference in the total population was observed, suggesting that the parallel trends assumption may hold (see Sect. S6).
2.3 Estimating changes in the net migration rate at the municipality level due to flooding
2.3.1 Analysis target and period
This study analyzed the impact of flooding on the net migration rate at the municipality level in Japanese municipalities that experienced flood disasters between 2015 and 2020. The net migration rate was calculated by subtracting the number of out-migrants from the number of in-migrants during the target period and dividing the result by the initial population. We focused on the net migration rate rather than the total population change to isolate the effects of migration from natural population changes such as births and deaths. The net migration rate was calculated using annual migration data for Japanese nationals from 2014 to 2020. Municipalities that experienced flood disasters were assigned to the treatment group, while those that did not were assigned to the control group. The classification into treatment and control groups varied by year. To represent flood magnitude, we used the following municipality-level indicators: the proportion of households affected below floor level by flooding, the proportion of households affected above floor level by flooding, and the proportion of households that were completely destroyed (including washed away) by flooding. These indicators were calculated to represent household damage associated with both fluvial and pluvial flooding. They were expressed as percentages of the total households, following the method of Okamoto et al. (2023). Details regarding the net migration rate data at the municipality level and data on the proportion of households affected by flooding are provided in Sect. S7. Descriptive statistics are presented in Table S5.
2.3.2 Covariates
Based on previous domestic studies on population movements within Japan (Arakawa and Noyori, 2023), we selected 32 covariates, including indicators of water-related disasters other than flooding, climatological variables, socioeconomic factors, access to public and social facilities, demographic composition, and flood risk. Covariates and their descriptive statistics are listed in Table S6. All covariates were compiled at the municipality level (see Sect. S8).
2.3.3 Analytical method
The DiD method was employed to quantify the impact of flooding on the net migration rate. However, because flood disasters occurred in different years across municipalities, applying a standard DiD approach (Eq. S1 in the Supplement) may result in inappropriate comparisons between treated and non-treated units, introducing bias into the estimated results (Baker et al., 2022; Goodman-Bacon, 2021). To address this, we employed the stacked regression approach for the DiD analysis (Cengiz et al., 2019). To prevent inappropriate comparisons, we constructed separate datasets for each year using the method described in Sect. S9. The datasets for each year were then stacked, and the following regression model was applied for the DiD analysis:
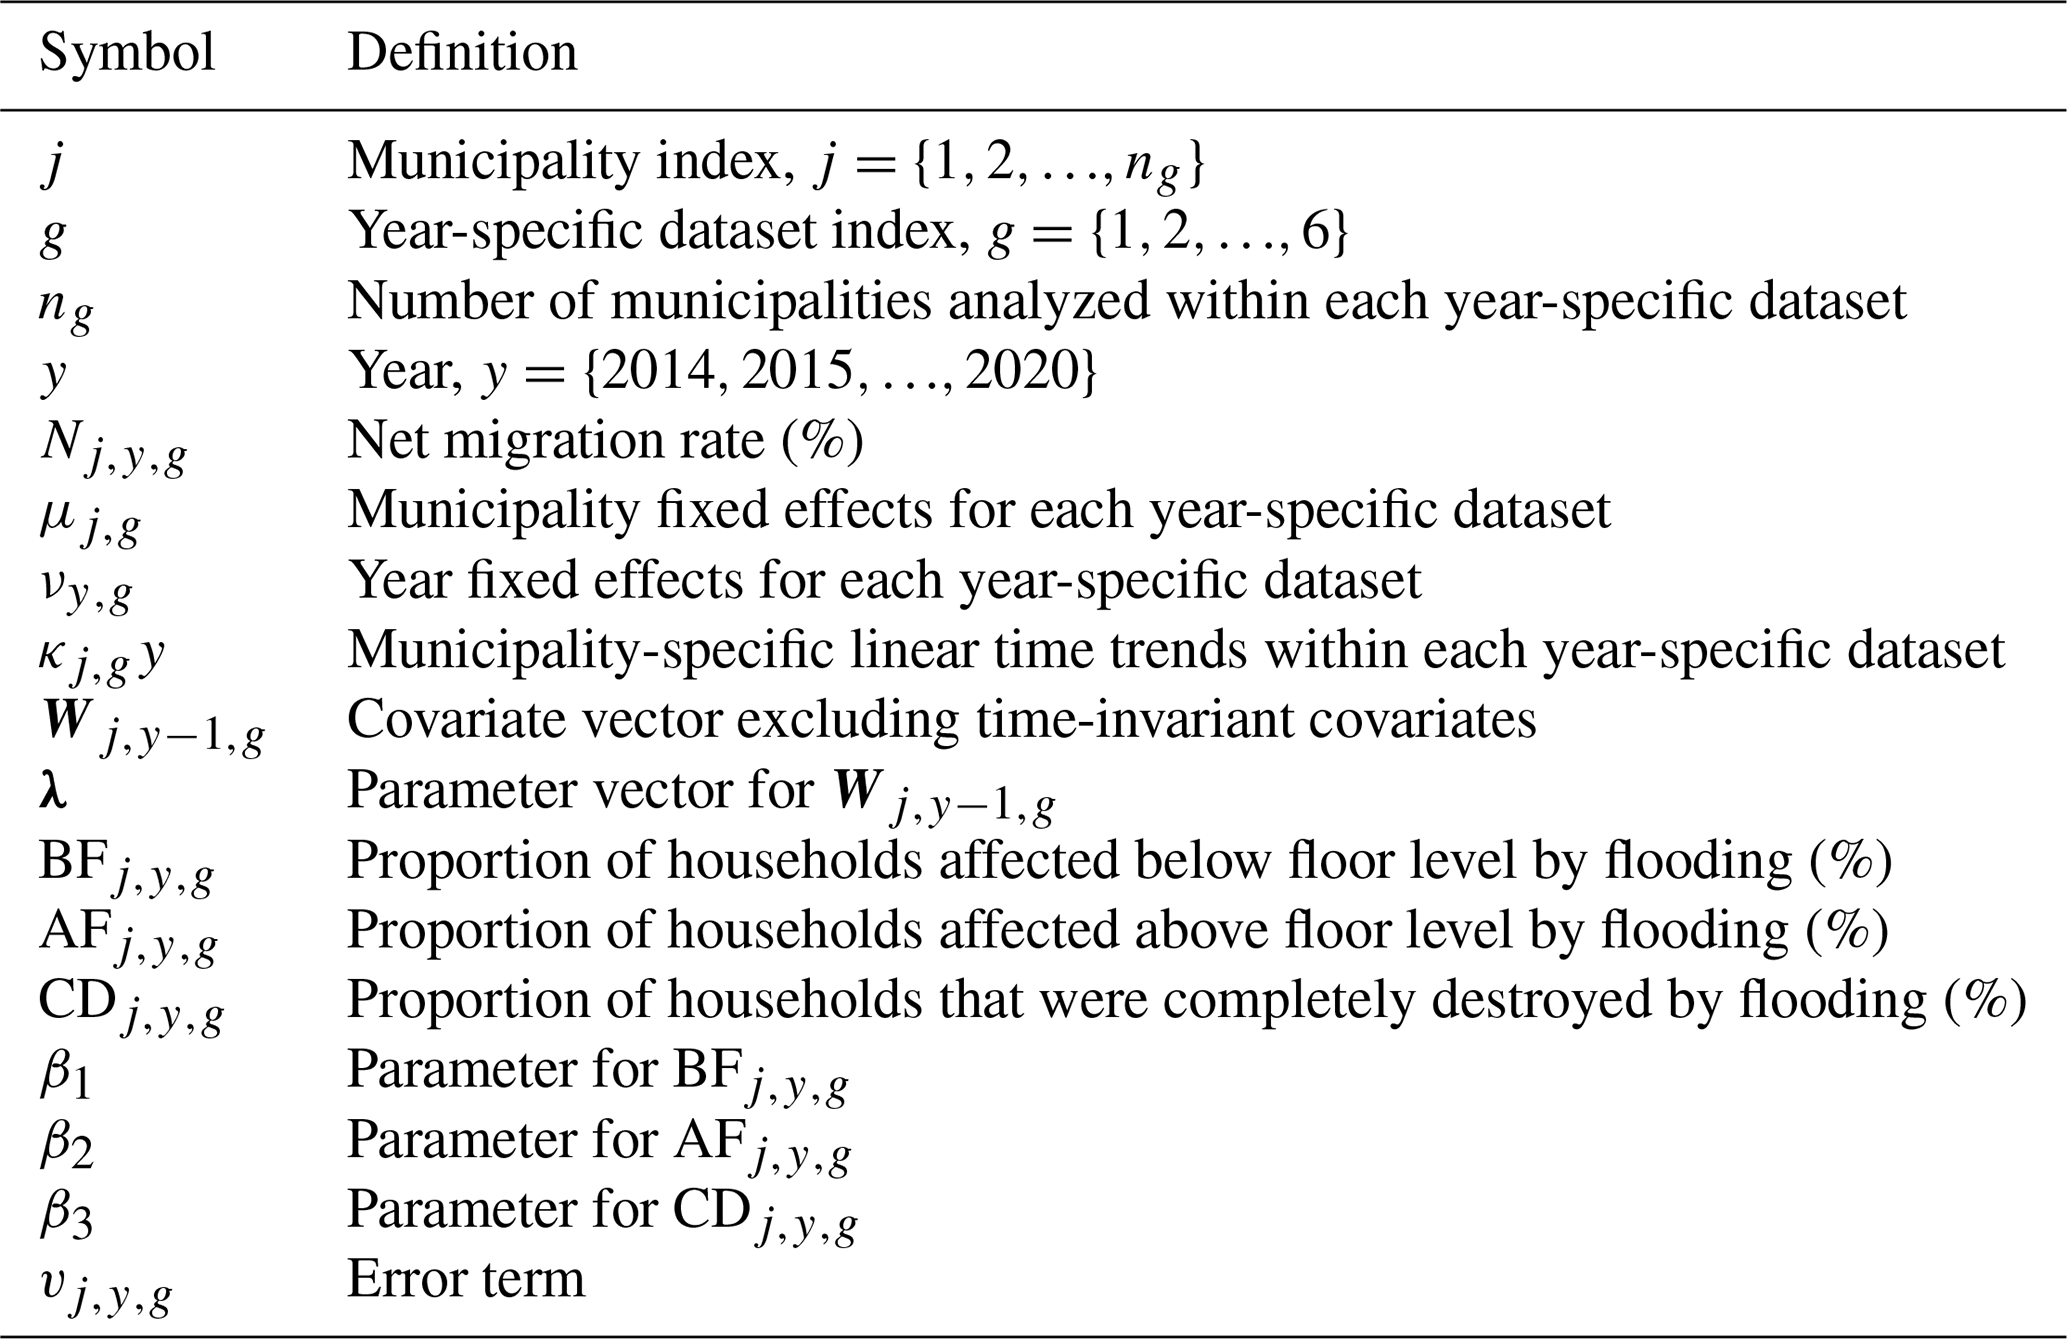
Definitions of the variables and parameters in Eq. (2) are summarized in Table 2. The key parameters are β1, β2, and β3, which quantify the effects of the proportions of households affected by flooding on the net migration rate. Due to multicollinearity between the covariates and the proportions of households affected by flooding, we excluded the following two covariates: (a) the proportion of households affected above floor level by water-related disasters other than flooding, and (b) the proportion of primary industry workers. Multicollinearity was assessed using the variance inflation factor, adopting a threshold value of 5. The variables , , and represent the proportions of households affected by flooding – below floor level, above floor level, and completely destroyed, respectively – in municipalities experiencing flooding in the year of occurrence. These variables take a value of 0 for municipalities not affected by flooding during that year. We used the net migration rate instead of the net number of migrants because the latter substantially varies with population size. If the net number of migrants was employed, a logarithmic transformation would be required to interpret proportional changes. However, this is infeasible because the net number of migrants can be negative. Therefore, we used the net migration rate to account for differences in population size without necessitating a logarithmic transformation. The changes in the net migration rate at the municipality level per 1 % increase in the proportions of households affected by flooding – below floor level, above floor level, and completely destroyed – can be estimated using β1, β2, and β3, respectively, expressed in percentage points (Morita, 2014), interpreted relative to a counterfactual scenario in which flooding did not occur. A negative value indicates that flooding resulted in a decrease in the net migration rate. Finally, we indirectly validated the parallel trends assumption following the procedure described in Sect. 2.2.3. No statistically significant differences in net migration rates were observed between the treated and control groups before the flood events, suggesting that the parallel trends assumption may hold (see Sect. S10).
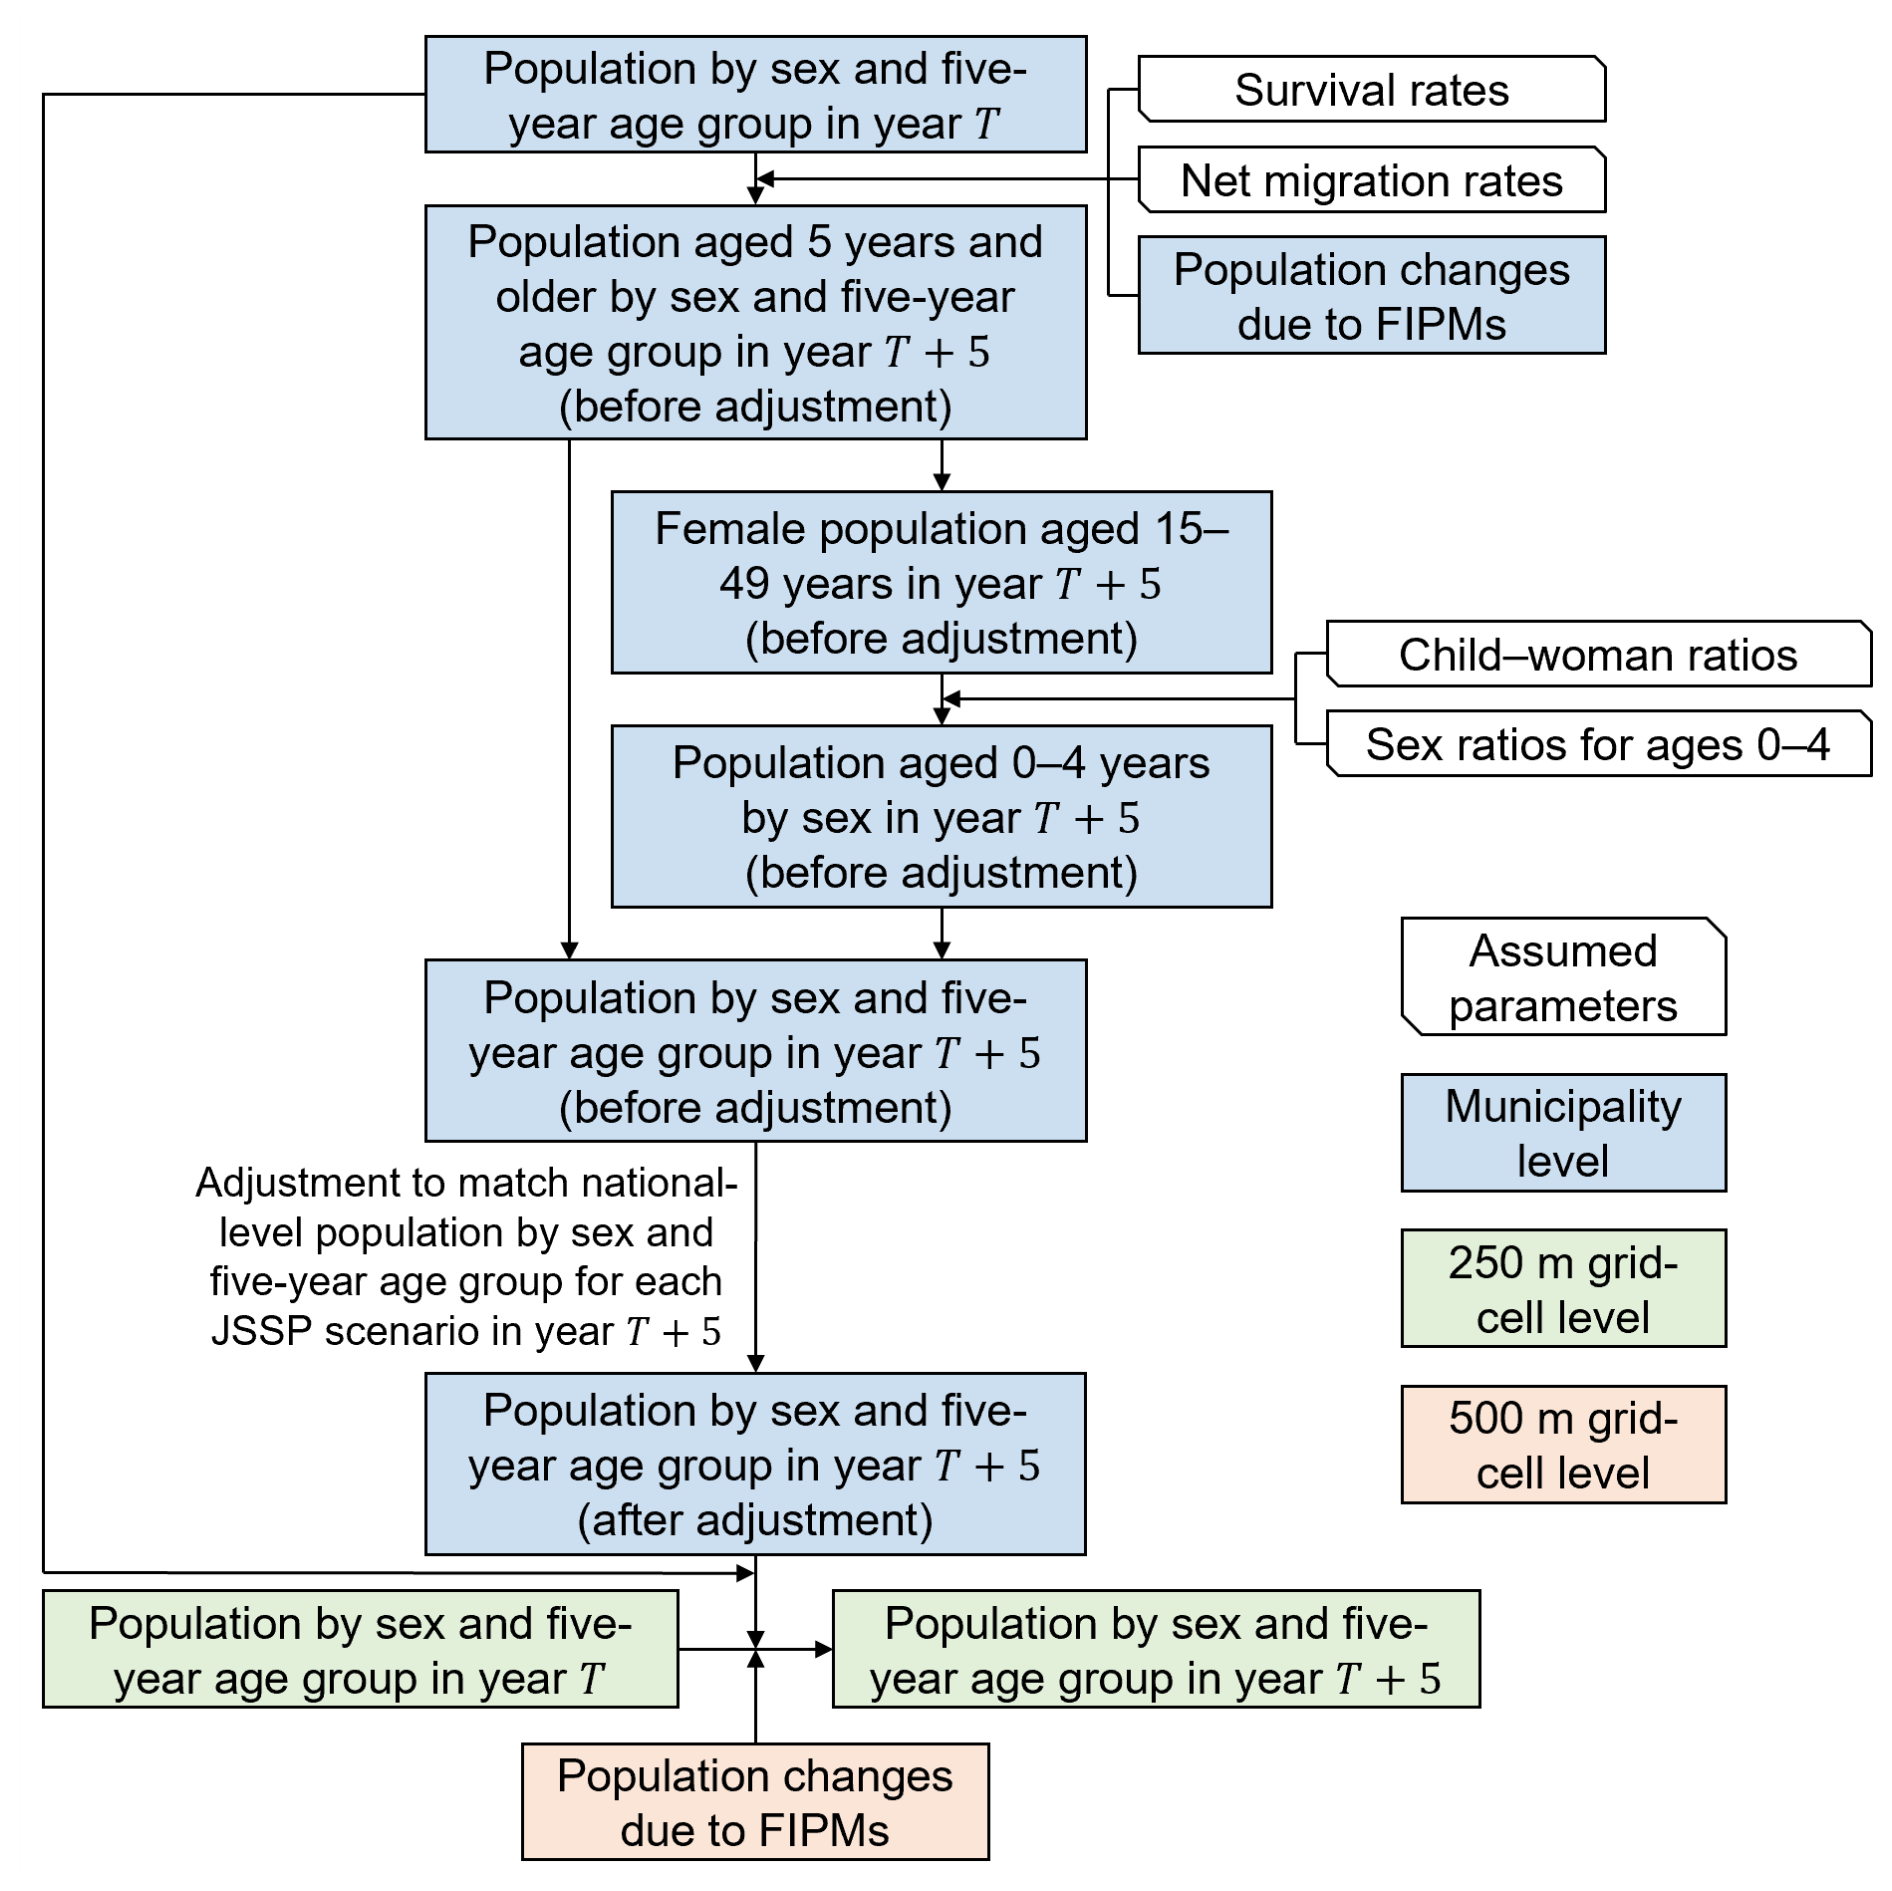
2.4 Projecting future population incorporating FIPMs
In Japan, municipality-level projections of future population aligned with the downscaled SSPs (JSSPs) (Chen et al., 2020) have been developed for national-scale assessments by the National Institute for Environmental Studies, Japan (NIES) (NIES, 2021a, b). Based on these municipality-level projections, population projections at the 1 km grid-cell level have also been developed under the JSSPs (NIES, 2021c). We incorporated the impacts of FIPMs into the JSSP-based future population projections developed by NIES. These projections use 2015 as the base year and cover 2015 to 2100 at five-year intervals, projecting population by sex and five-year age group up to age 85 and older. Figure 2 illustrates the workflow for projecting future population incorporating FIPMs. Detailed information and definitions of assumed parameters for future population projections are presented in Table S9 and Sect. S11, respectively. Except for the population changes due to FIPMs at the municipality and 500 m grid-cell levels and population by sex and five-year age group at the 250 m grid-cell level, this study adopted the methodologies and assumptions used in the JSSP-based future population projections developed by NIES (NIES, 2021a, b). To reflect FIPMs in future population projections, this study incorporated the expected annual values of variables that represent flood magnitude. In the JSSP-based projection methodology, municipality-level population projections by sex and five-year age group are adjusted to ensure that the aggregated national totals match the values specified by Chen et al. (2020) for each JSSP scenario. Specifically, an adjustment coefficient is calculated by dividing the JSSP-based national total population for each sex and five-year age group by the sum of unadjusted municipality-level projections for the corresponding group. This coefficient is then multiplied by the corresponding unadjusted municipality-level population projections to obtain the adjusted projections. As a result, even after incorporating FIPMs, the total population of Japan remains consistent with the national totals specified in the JSSP scenarios. As described in Sect. 2.6, future estimates of fluvial flood damage costs incorporate the effects of climate change using climate scenario data from the Coupled Model Intercomparison Project Phase 6 (CMIP6), specifically SSP1–RCP2.6 and SSP5–RCP8.5. Therefore, future population projections incorporating FIPMs were conducted under both the JSSP1 and JSSP5 scenarios.
2.4.1 Population changes due to FIPMs at the municipality level
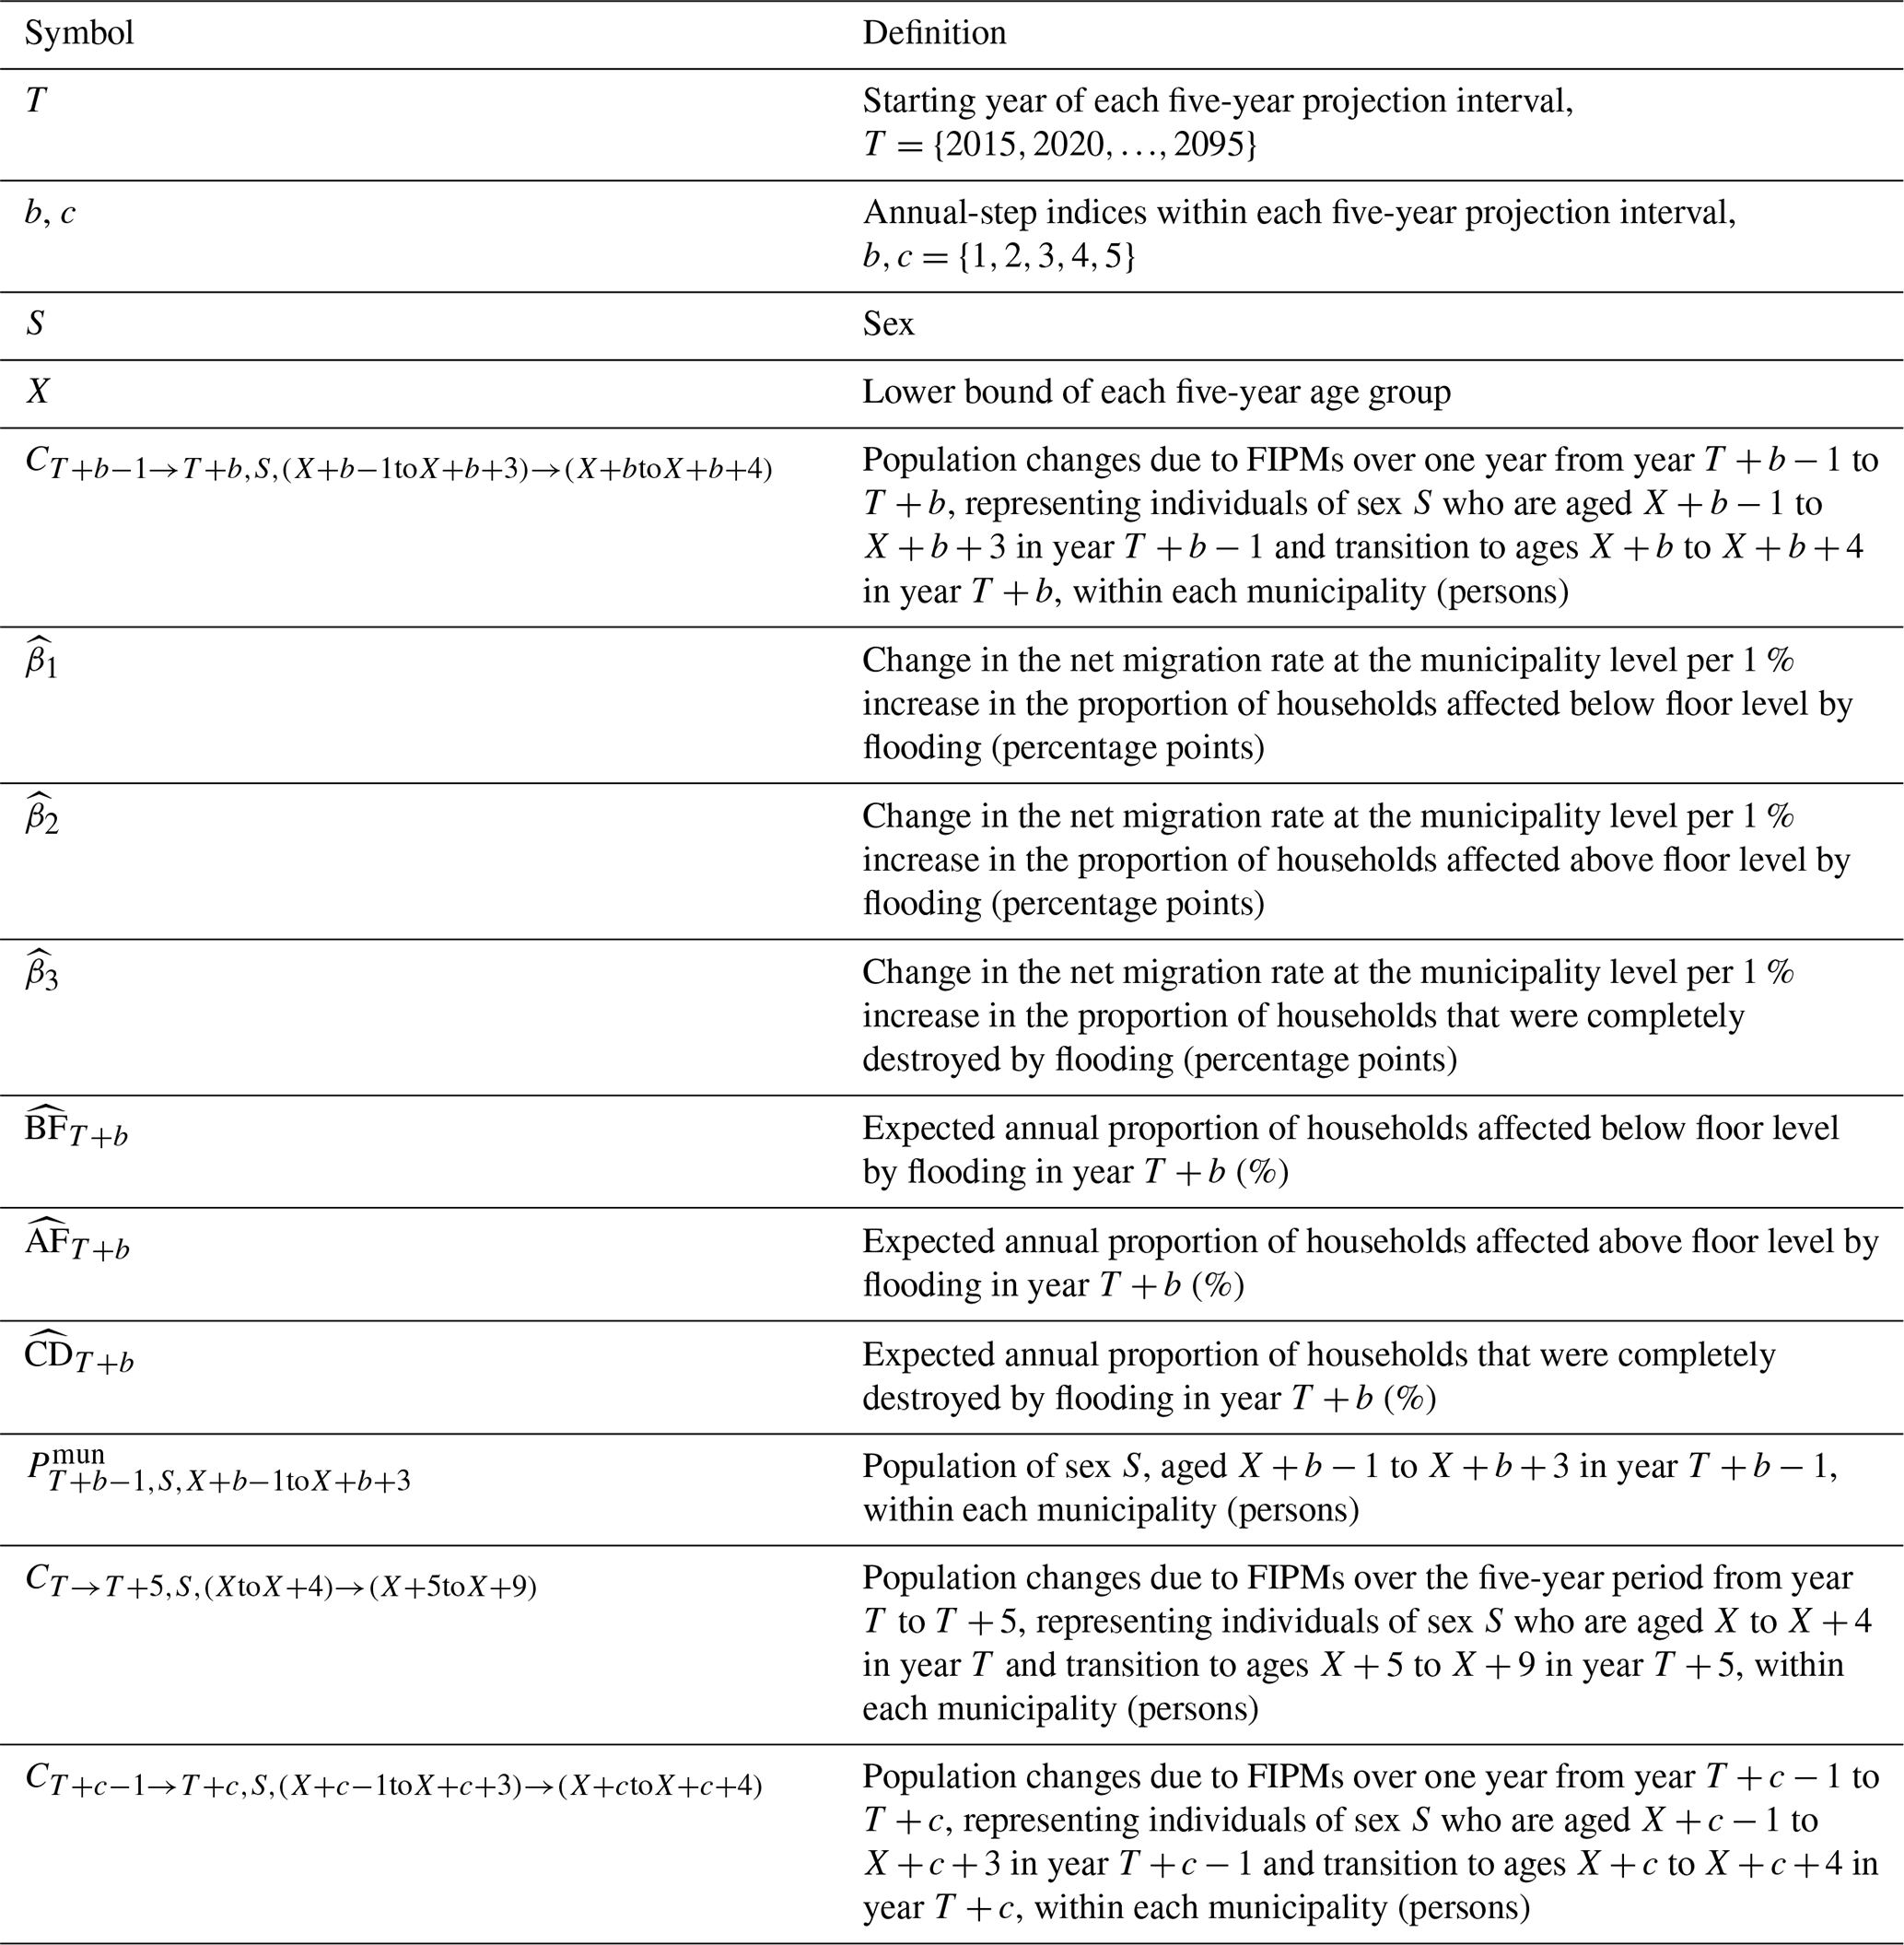
To incorporate inter-municipality FIPMs into future population projections, we applied the following equations to each municipality to estimate population changes:
Definitions of the variables and parameters in Eqs. (3) and (4) are summarized in Table 3. The indices b and c represent annual-step indices within each five-year projection interval rather than fixed calendar years. For example, when T=2020, b=1 represents the one-year population change from 2020 to 2021, whereas b=5 represents the change from 2024 to 2025. The same interpretation applies to c. Based on the quantified changes in net migration rates at the municipality level due to flooding (Sect. 2.3), the values of , , and were determined, representing the impacts of flooding on the annual net migration rate. Accordingly, Eq. (3) was employed to estimate the population changes due to FIPMs over a one-year period, and Eq. (4) was applied to calculate the population changes due to FIPMs over five years by summing the annual estimates. For any of , , and that was not statistically significant at the 5 % level, the corresponding value was set to zero. The expected annual proportions of households affected by flooding (, , ) were calculated using the maximum inundation depth and maximum flow velocity obtained from fluvial flood inundation analyses that incorporate climate change impacts, based on Yanagihara et al. (2024), as described in Sect. 2.6, following a similar method outlined in Sect. S8. Since fluvial flood inundation analyses were conducted only for specific periods (baseline period: 1981–2000, near future: 2031–2050, and end of the 21st century: 2081–2100), values for the maximum inundation depth and maximum flow velocity caused by flooding in year T+b under each return period were obtained using linear interpolation. For linear interpolation, representative years were set as follows: baseline period, 2000; near future, 2050; and end of the 21st century, 2100. This study considered the impacts of climate change by using climate scenario data from five general circulation models (GCMs) and accordingly conducted future population projections incorporating FIPMs for each of the five GCMs (see Sect. 2.6). The number of households used in the calculation of the proportions of households affected by flooding was derived from the population by sex and five-year age group at the 250 m grid-cell level in year T. Specifically, based on the future household projection method aligned with the JSSP proposed by Yoshikawa et al. (2024), the number of households in each grid cell was projected by multiplying the population by the household head rate and then aggregated at the municipality level. The household head rate refers to the proportion of household heads in the total population and was taken from Yoshikawa et al. (2024). The number of households was assumed to remain constant for each year within the five-year period.
Table 3Definitions of variables and parameters in Eqs. (3) and (4).
For b≥2, was calculated using the following equation:
where denotes the population (persons) of sex S, aged X to X+4 years in year T, within each municipality; denotes the net migration rate; and denotes the survival rate. Detailed definitions of and are provided in Sect. S11. Using Eq. (5), the five-year net migration and deaths were evenly distributed across each of the five years to derive annual values. The municipality-level population changes due to FIPMs obtained using the method described above were incorporated into the future population projections shown in Fig. 2. If the projected population by sex and five-year age group became negative due to the incorporation of FIPMs, the negative values were replaced with zero.
2.4.2 Population changes due to FIPMs at the 500 m grid-cell level
Considering population changes due to FIPMs at the 500 m grid-cell level, we projected the future population by sex and five-year age group at the 250 m grid-cell level by applying the following equation to each grid cell:
where denotes the population (persons) by sex S and age group X to X+4 in year T+5 in each 250 m grid cell; denotes the corresponding population (persons) in year T; denotes the population by sex S and age group X to X+4 in year T+5 in each municipality; denotes the percentage change (%) in the total population per 1 m increase in maximum inundation depth at the 500 m grid-cell level; and ET+c denotes the expected annual maximum inundation depth (m) in year T+c for each 500 m grid cell. Consistent with the projections at the 1 km grid-cell level based on the JSSPs (NIES, 2021c), the rate of population change for each grid cell was assumed to be the same as that of the municipality to which the grid cell belongs. In addition, population changes due to FIPMs at the 500 m grid-cell level were incorporated into the projections.
Based on the quantified changes in the total population at the 500 m grid-cell level, was determined, representing the estimated population response to flood inundation depth. In Eq. (6), population changes induced by the expected annual maximum inundation depth for each of the five years were considered. When was not statistically significant at the 5 % level, its value was set to zero. In calculating ET+c, the maximum inundation depth for each return period in year T+c was determined using the method described in Sect. 2.4.1. Since the maximum inundation depth was used at the 250 m grid-cell level, the maximum inundation depth within each 250 m grid cell located inside each 500 m grid cell was extracted. During this process, inundation within river-channel grid cells was disregarded, and the inundation depth for these cells was assumed to be 0 m. After applying Eq. (6), any negative projected population by sex and five-year age group for each 250 m grid cell was replaced with zero. The municipality-level population, aggregated from the 250 m grid-cell projections of , did not match the corresponding population . This discrepancy arose due to the population decrease caused by FIPMs. Therefore, the decreased population was adjusted by uniformly scaling the populations of all 250 m grid cells – excluding specific cases such as river-channel grid cells – to ensure consistency with the municipality-level totals (see Sect. S12).
2.5 Projecting land use based on future population
To estimate future fluvial flood damage costs, future land-use data are required. Yoshikawa et al. (2024) projected the future number of households at the 1 km grid-cell level based on population changes under the JSSPs and used them to project shortages and unused residential building land areas at the 1 km grid-cell level. Accordingly, we projected future land use for each 1 km grid cell using the relationships between the number of households and both the shortage and unused residential building land areas obtained from Yoshikawa et al. (2024) (see Sect. S13). Yoshikawa et al. (2024) also projected shortages of land for industrial and commercial/business buildings in response to population changes under the JSSPs. The starting point of population decline for each prefecture was used. If this starting point remains unchanged regardless of whether FIPMs are considered, the projected shortage of land for industrial and commercial/business buildings will also remain unchanged. Therefore, we compared prefecture-specific population data based on the JSSPs (NIES, 2021a, b) with the projected prefecture-specific population data incorporating FIPMs. The comparison showed that the starting point of population decline was unchanged across all prefectures. Therefore, this study adopted the projected shortages of land for industrial and commercial/business buildings calculated by Yoshikawa et al. (2024). The land use based on the future population projected using the above method was spatially downscaled to the 250 m grid-cell level using the method described in Sect. S14. Using the projected land-use data for 2050 and 2100, we estimated future fluvial flood damage costs considering FIPMs for the near future and the end of the 21st century.
2.6 Estimating future fluvial flood damage costs considering changes in rainfall and land use
Future fluvial flood damage costs were estimated using an existing fluvial flood damage model (Yanagihara et al., 2024) that considered rainfall changes associated with climate change and land use changes associated with population changes across Japan for the baseline period, the near future, and the end of the 21st century. In this model, flood inundation is simulated using a two-dimensional unsteady flow model uniformly applied to rivers and floodplains across Japan. Inundation occurs when simulated floods exceed the flood control safety level assigned to each river section. Although rainfall is applied over each river basin and converted into runoff in the model, the model does not explicitly simulate pluvial flooding processes or inland water drainage facilities. The costs were evaluated as expected annual values derived from damage calculations for return periods of 30, 50, 100, and 200 years. Maximum inundation depths were calculated using a fluvial flood inundation analysis on a 250 m grid. Damage costs were then estimated by overlaying inundation depths with land-use and asset-value data and applying depth-specific damage rates for each asset category. The effects of rainfall changes were incorporated by adjusting the input rainfall used in the fluvial flood inundation analysis. These rainfall changes were derived from climate scenario data from five GCMs based on CMIP6 for the SSP1–RCP2.6 and SSP5–RCP8.5 scenarios (Ishizaki, 2021; Ishizaki et al., 2022). In the original modeling framework, the effects of land-use changes were reflected through adjustments to the roughness coefficient and house occupancy ratio in the fluvial flood inundation analysis and to asset values in the damage cost calculations. This study estimated future fluvial flood damage costs by modifying the land-use projections of Yanagihara et al. (2024) to account for FIPMs. To reduce computational demands, land-use changes were not incorporated into the fluvial flood inundation analysis, as variations in asset values accounted for the majority of changes in fluvial flood damage costs. As in Yanagihara et al. (2024), this study focused on percentage changes in fluvial flood damage costs rather than absolute values to reduce uncertainty.
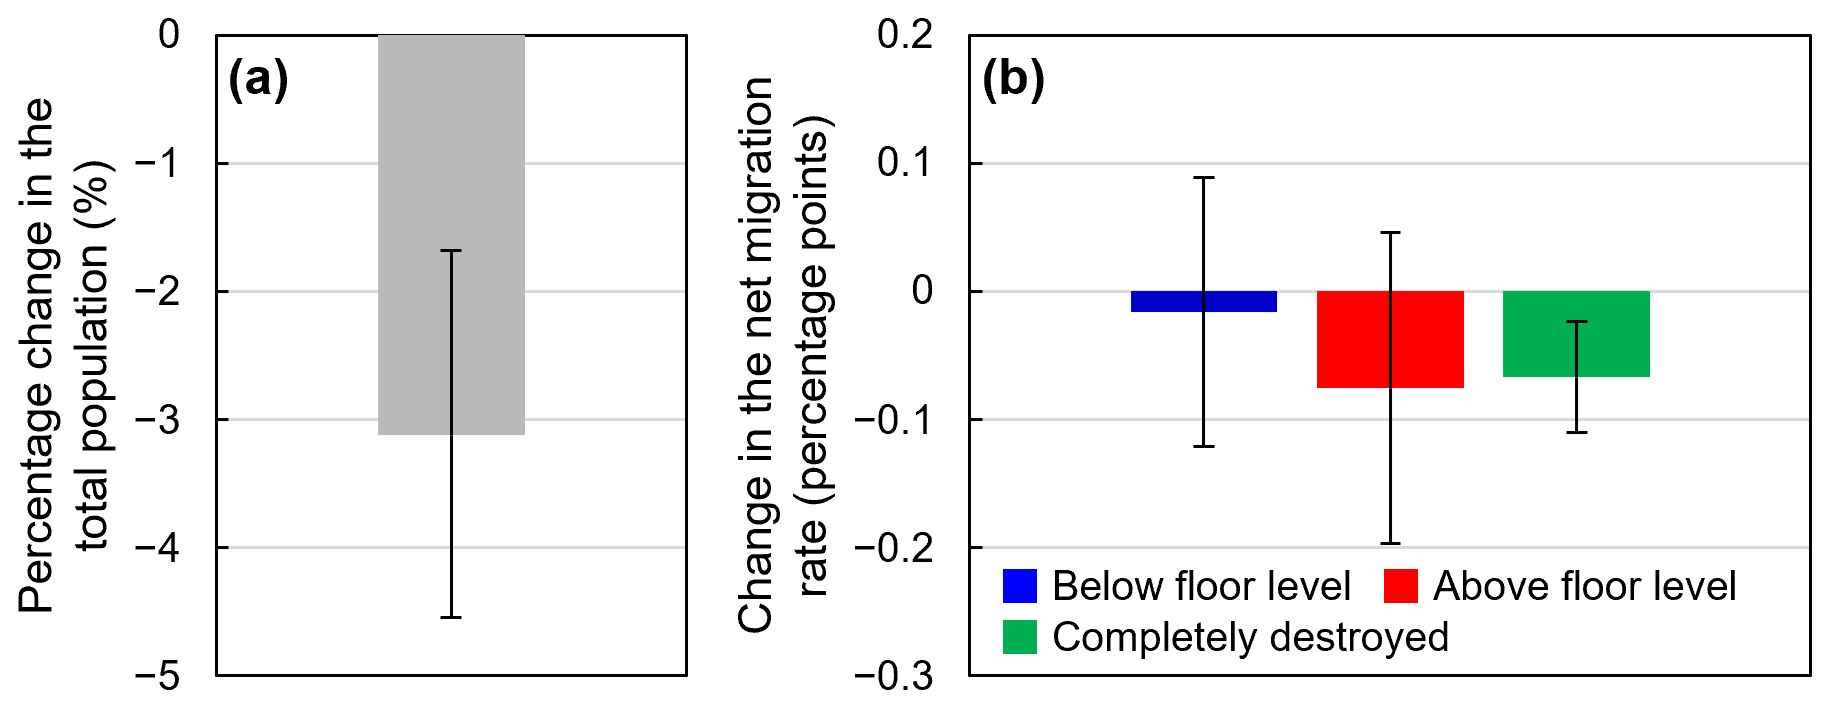
Figure 3Population responses to flood exposure. (a) Percentage change in the total population at the 500 m grid-cell level per 1 m increase in maximum inundation depth. (b) Changes in the net migration rate at the municipality level per 1 % increase in the proportions of households affected by flooding. Error bars represent 95 % confidence intervals.
3.1 Quantifying FIPMs
Figure 3 illustrates the population responses to flood exposure, as quantified using the DiD approach. Figure 3a shows the percentage change in the total population at the 500 m grid-cell level per 1 m increase in maximum inundation depth. Statistical significance at the 5 % level is indicated when the 95 % confidence interval (shown as error bars) does not include zero – a criterion consistently applied in this study. A statistically significant negative change in the total population due to flooding is evident, confirming that the total population decreases as the maximum inundation depth increases. Specifically, the percentage change in the total population at the 500 m grid-cell level per 1 m increase in maximum inundation depth was estimated to be −3.1 %. Figure 3b presents changes in the net migration rate at the municipality level per 1 % increase in the proportions of households affected by flooding. No statistically significant (5 % level) changes were observed in the net migration rate at the municipality level per 1 % increase in the proportions of households affected by flooding below floor level and above floor level, indicating no clear impact on migration from these levels of damage. However, the change in the net migration rate at the municipality level per 1 % increase in the proportion of households completely destroyed by flooding was statistically significant (5 % level), confirming that net migration rate decreases as the proportion of completely destroyed households increases. The change in the net migration rate due to flooding was estimated at −0.07 percentage points per 1 % increase in the proportion of households that were completely destroyed by flooding, indicating that flooding led to a population decline in municipalities. Detailed results of parameter estimation for Eqs. (1) and (2) can be found in Tables S10 and S11. As a sensitivity analysis, we also estimated Eqs. (1) and (2) without unit-specific linear time trends; the results are shown in Tables S12 and S13. The statistically significant estimates in Tables S10 and S11 remained statistically significant and retained the same signs in this sensitivity analysis.
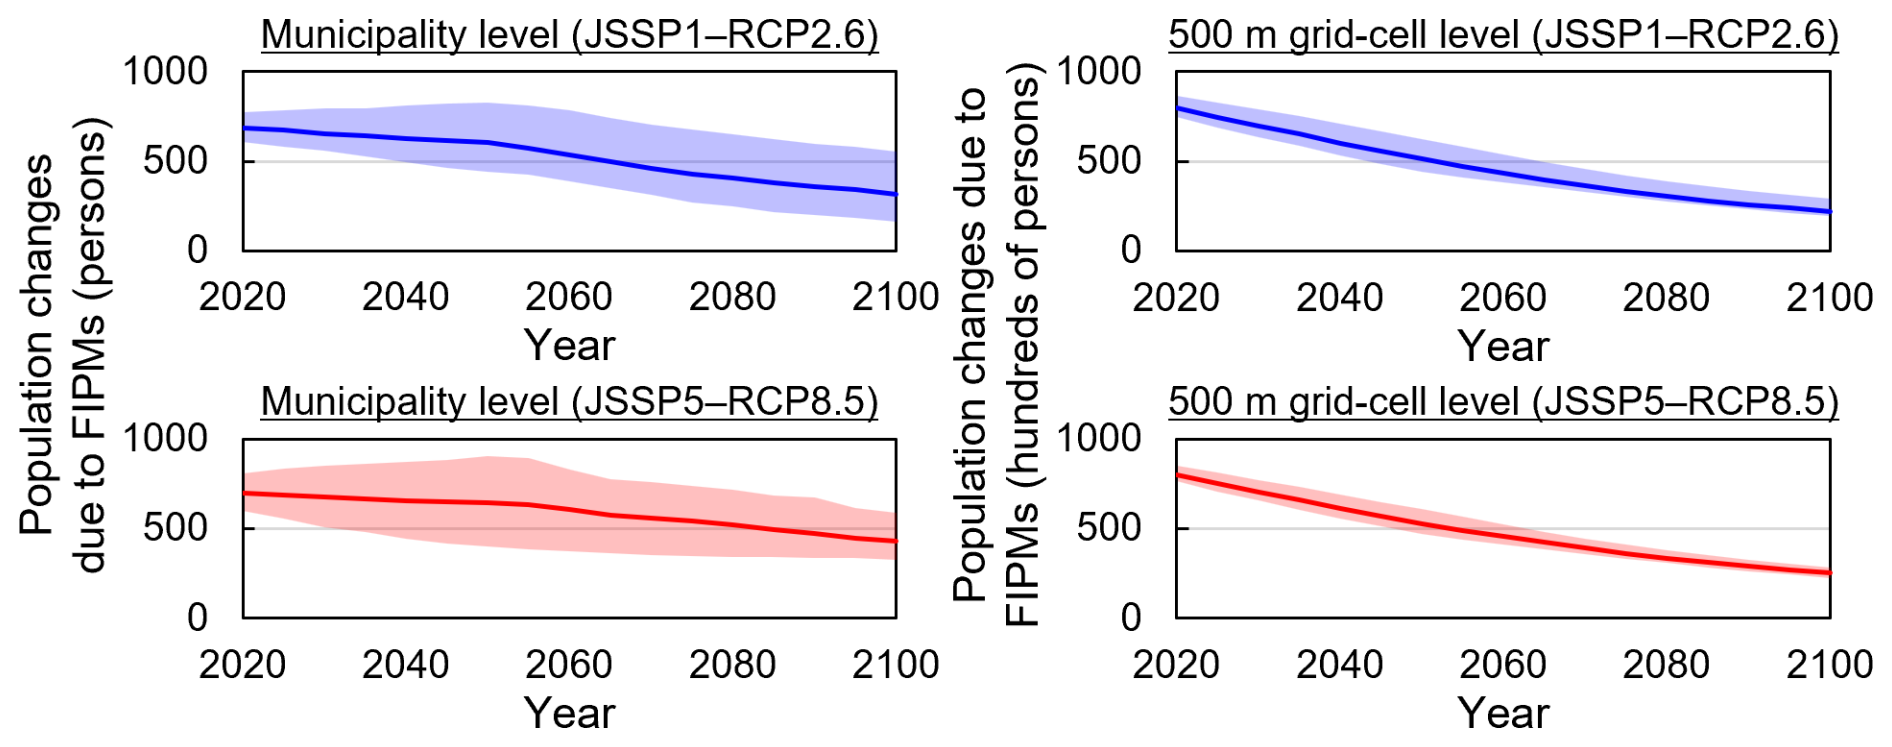
Figure 4Aggregated national-level population changes due to FIPMs at the municipality and the 500 m grid-cell levels. Values represent absolute population changes and are not normalized by area, municipality, grid cell, or population. For readability, values for the 500 m grid-cell-level analysis are divided by 100 and expressed in hundreds of persons, whereas values for the municipality-level analysis are expressed in persons. Population changes are shown at five-year intervals from 2020 to 2100, with each value representing the cumulative population change over the preceding five-year period. The changes were calculated based on the average values estimated from five GCMs. Error bands indicate the range between the maximum and minimum population changes derived from the five GCMs.
3.2 Population changes due to FIPMs
Figure 4 presents the aggregated national-level population changes due to FIPMs at the municipality and the 500 m grid-cell levels. The values shown in Fig. 4 represent absolute population changes and are not normalized by area, municipality, grid cell, or population. For readability, the 500 m grid-cell-level values are shown in hundreds of persons, whereas the municipality-level values are shown in persons. At the municipality level, absolute population changes due to FIPMs were obtained using Eq. (4) and summed across all municipalities in Japan. In contrast, at the 500 m grid-cell level, absolute differences in population with and without FIPMs were calculated using Eq. (6) and aggregated nationwide. The five-year population changes due to FIPMs at the municipality level ranged from approximately 320 to 690 persons under the JSSP1–RCP2.6 scenario and from approximately 430 to 700 persons under the JSSP5–RCP8.5 scenario, between 2020 and 2100. Similarly, the five-year population changes at the 500 m grid-cell level ranged from approximately 22 300 to 79 700 persons under the JSSP1–RCP2.6 scenario, and from approximately 25 200 to 80 200 persons under the JSSP5–RCP8.5 scenario, during the same period. Population changes due to FIPMs declined over time. Notably, changes at the 500 m grid-cell level were approximately 59 to 116 times greater than those at the municipality level. Additionally, differences in population changes between JSSP5–RCP8.5 and JSSP1–RCP2.6 gradually increased over time. Specifically, by 2100, the population changes due to FIPMs under JSSP5–RCP8.5 were 34 % greater at the municipality level and 13 % greater at the 500 m grid-cell level compared to those under JSSP1–RCP2.6.
3.3 Changes in fluvial flood damage costs due to FIPMs
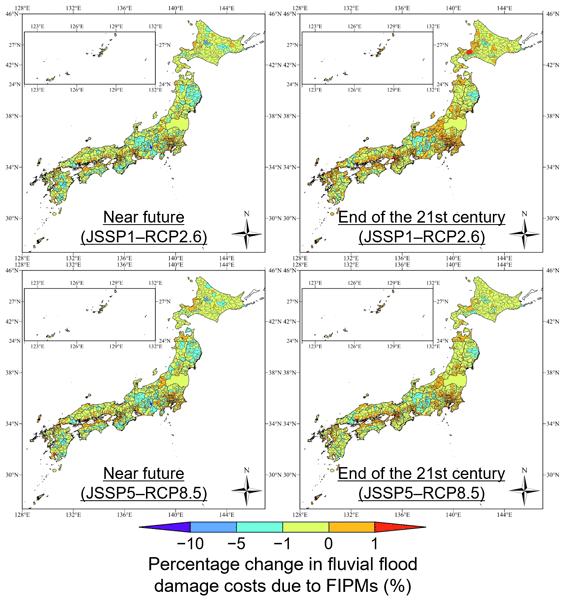
This section examines the impact of FIPMs on future fluvial flood damage costs. Here, the percentage change in fluvial flood damage costs due to FIPMs is defined as the relative difference from estimates without considering FIPMs. Negative values indicate that incorporating FIPMs reduces estimated fluvial flood damage costs relative to the corresponding estimates without FIPMs. Conversely, positive values indicate that incorporating FIPMs increases estimated fluvial flood damage costs relative to the corresponding estimates without FIPMs. At the national level, under JSSP1–RCP2.6, the percentage change due to FIPMs across Japan was −0.2 % in the near future and +0.3 % at the end of the 21st century, based on fluvial flood damage costs averaged across five GCMs. In contrast, under the JSSP5–RCP8.5 scenario, these percentage changes were −0.2 % and +0.1 %, respectively. Figure 5 presents the percentage changes in fluvial flood damage costs due to FIPMs at the prefectural level. Under JSSP1–RCP2.6, these ranged from −1.7 % to +0.1 % in the near future and −1.1 % to +1.0 % by the end of the 21st century. Under the JSSP5–RCP8.5 scenario, these values ranged from −1.7 % to +0.1 % and −1.3 % to +0.8 %, respectively. In the near future, FIPMs generally reduced fluvial flood damage costs in many prefectures, though the number of prefectures experiencing increases rose toward the end of the 21st century. However, only two prefectures exhibited absolute percentage changes exceeding 1 %, reaching approximately 2 %. At the municipal level, as shown in Fig. 6, under JSSP1–RCP2.6, percentage changes due to FIPMs ranged from −11.2 % to +1.7 % in the near future and −6.7 % to +2.9 % by the end of the 21st century. Under JSSP5–RCP8.5, these values ranged from −11.4 % to +1.2 % and −7.0 % to +1.9 %, respectively. Municipalities with absolute percentage changes greater than 1 % accounted for approximately 12 % of all municipalities under both scenarios in the near future, and approximately 7 % by the end of the 21st century. Municipalities with reductions exceeding 10 % were concentrated in areas heavily impacted by flooding.
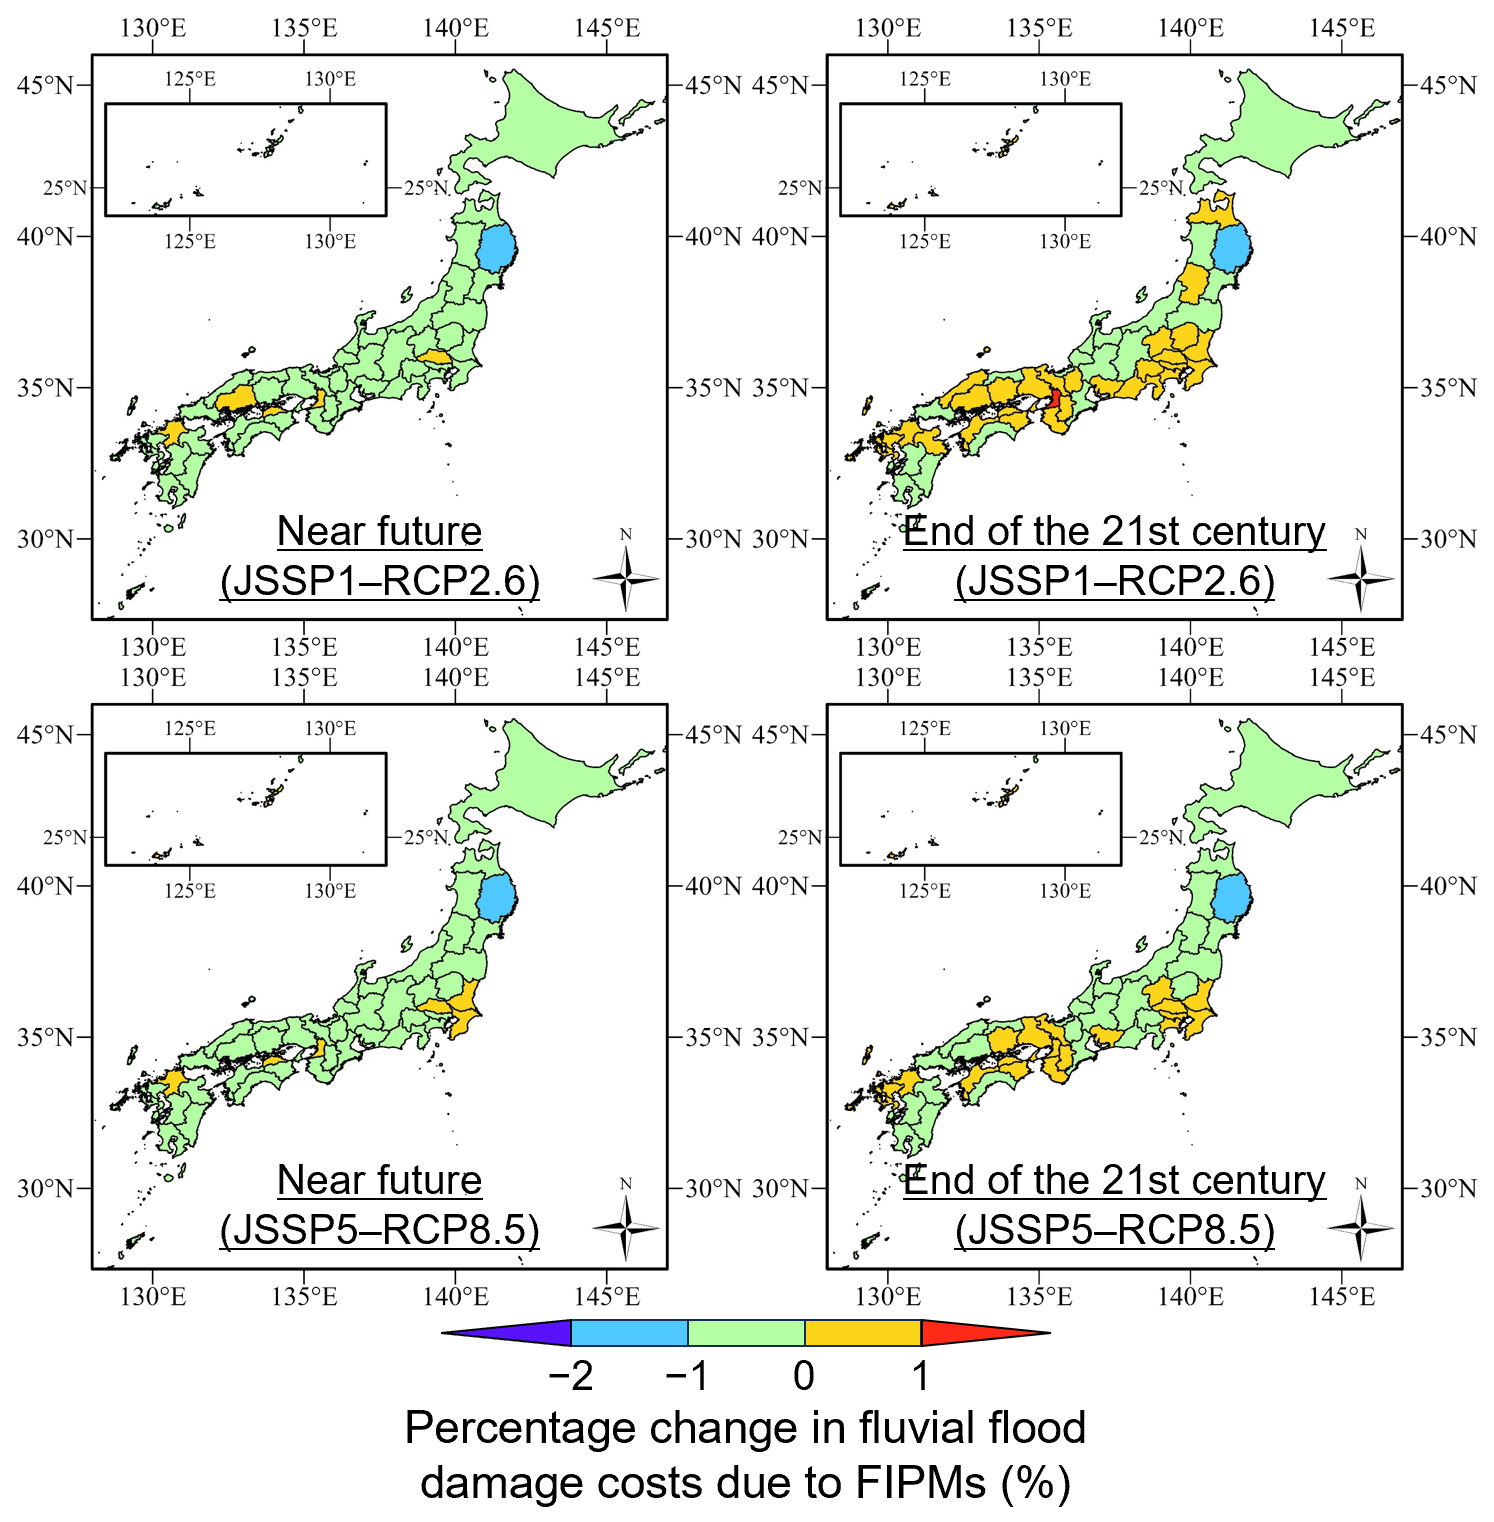
Figure 5Percentage change in fluvial flood damage costs by prefecture due to FIPMs. The percentage changes were calculated from average fluvial flood damage costs estimated across five GCMs.
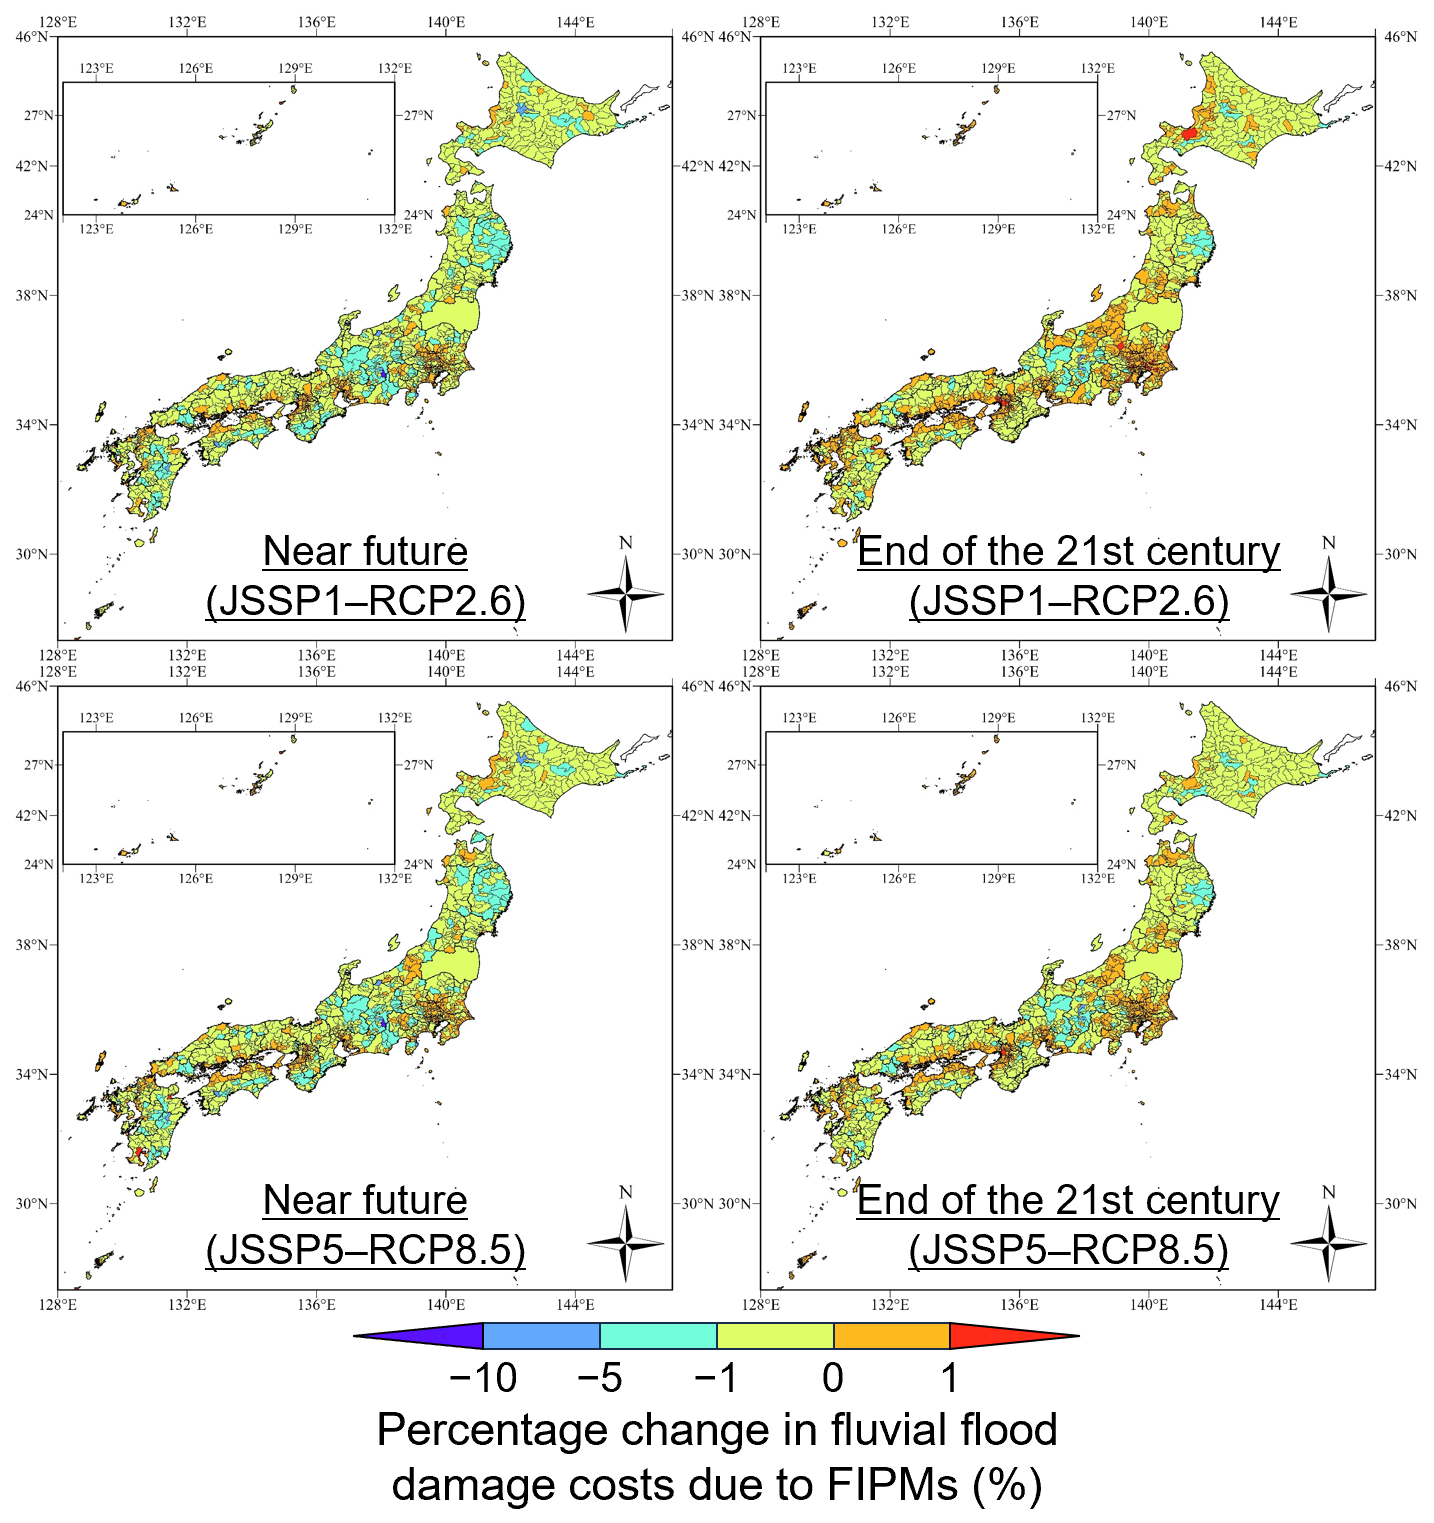
Figure 6Percentage change in fluvial flood damage costs by municipality due to FIPMs. The percentage changes were calculated from average fluvial flood damage costs estimated across five GCMs. Fukushima Prefecture is presented as a single region.
4.1 Population changes due to FIPMs and their validity
Section 3.2 presented quantitative results of population changes due to FIPMs. Here, we interpret these findings and validate them through comparisons with independent data sources. The decreasing trend in population changes due to FIPMs observed over time primarily reflects Japan's projected population decline rather than impacts directly attributable to climate change. Although Yanagihara et al. (2024) indicated that fluvial flood damage costs across Japan are expected to increase under future climate scenarios, our findings suggest demographic trends are more dominant. Additionally, our results show that population changes due to FIPMs are substantially greater at the 500 m grid-cell level than at the municipality level, highlighting the dominance of intra-municipal movements. Population changes due to FIPMs under JSSP5–RCP8.5 consistently exceeded those under JSSP1–RCP2.6, reflecting higher population projections and increased precipitation under JSSP5–RCP8.5 (Yanagihara et al., 2024).
To validate our estimates, we compared them with internal displacement data provided by the Internal Displacement Monitoring Centre (IDMC). The IDMC dataset (IDMC, 2023) includes event-based, national-level internal displacement data from 2008 to 2024, explicitly representing forced displacement. In contrast, our estimates also include voluntary population movements, such as decisions to avoid relocating into flood-affected areas, which are not captured by the IDMC dataset. Since the IDMC categorizes Typhoon Hagibis (2019) – a key event in our analysis – as “Storm”, we included both “Flood” and “Storm” categories in our validation. Furthermore, internal displacement corresponding specifically to the flood types considered in our analysis could not be extracted from the IDMC dataset because the dataset does not distinguish among flood types. As suggested by Kakinuma et al. (2020), differentiating displacement by flood type remains challenging. Nonetheless, the IDMC dataset is the most comprehensive and reliable independent source providing internal displacement data related to floods.
As our estimates represent expected annual population changes based on expected annual flood magnitudes, we arranged internal displacement numbers for each event from the IDMC dataset by year and calculated average annual internal displacement numbers. We compared population changes due to FIPMs at the 500 m grid-cell level to these average annual internal displacement numbers. Comparing our estimates at the municipality level with independent data sources was difficult due to a lack of relevant data. To align data periods, we compared the estimated population changes due to FIPMs specifically for the year 2020. The average annual internal displacement number (approximately 212 000 persons) substantially exceeded our estimate for 2020 (approximately 16 000 persons, calculated by dividing the five-year population changes due to FIPMs shown in Fig. 4 by five). This discrepancy is largely attributable to differences in what our estimate and the IDMC internal displacement number represent. First, in terms of flood types, the IDMC dataset may include displacement caused by various flood-related hazards, including coastal flooding. However, displacement corresponding specifically to the flood types represented in our estimates could not be extracted from the IDMC dataset, as noted above. Second, the IDMC dataset captures event-based forced displacement, including both short-term and longer-term movements, irrespective of whether displaced people later returned. In contrast, our estimates are based on total population data at five-year intervals and annual resident registration data, and therefore primarily capture longer-term changes in population distribution and registered migration. Individuals who were temporarily displaced but returned within the census interval, or who did not register a new address, are not captured in our estimates. Thus, our estimates should not be interpreted as the total number of people displaced by flood events, nor as strictly permanent migration, because the available data do not directly identify whether movements are permanent. Rather, they should be interpreted as longer-term population changes that remain visible in demographic datasets and can affect future population distribution, land use, and fluvial flood damage estimates. Methodological limitations (see Sect. 4.3) likely also contribute to this discrepancy. Considering these limitations, achieving a direct quantitative match remains challenging.
While recognizing these limitations, our methodological approach, rather than employing a basic DiD model, incorporates grid-cell or municipality-specific linear time trends, careful consideration of covariates, propensity score matching, and a stacked regression approach. This extended approach explicitly captures population changes due to FIPMs at both municipality and 500 m grid-cell levels, which cannot be resolved using IDMC datasets alone. Similarly, Shu et al. (2023) utilized a regression model to estimate the relationship between flooding and population dynamics. They validated their model through external predictive accuracy, assessing whether their model accurately predicted population changes in previously unused datasets. We did not adopt it because our study explicitly aims to integrate the causal impacts of flooding on population movements into existing population projections developed by NIES, and predictive accuracy alone does not necessarily reflect causal validity. Specifically, even highly predictive models may suffer from multicollinearity or spurious correlations, leading to misinterpretation of causal relationships. Therefore, our study employs the extended DiD methodology to quantify the causal effects of flooding on population movements. Although further methodological refinements remain necessary, our proposed framework can be considered a valid approach for evaluating population changes due to FIPMs.
4.2 Influence of FIPMs on future fluvial flood damage costs
As shown in Sect. 3.3, in the national-level estimates, the percentage changes in estimated fluvial flood damage costs due to FIPMs were negative in the near future. This indicates that FIPMs may reduce population exposure in flood-exposed areas, thereby lowering these costs. Toward the end of the 21st century, however, the percentage changes shifted from negative to positive values. This shift can occur when increases in population exposure in other areas that remain flood-exposed exceed reductions in exposure in areas where exposure decreases. Nevertheless, national-level impacts of FIPMs on future fluvial flood damage costs are minimal, with absolute percentage changes consistently below 1 %. This limited impact at the national scale likely results from counterbalancing effects, wherein regions experiencing population increases offset those with population losses, leading to negligible net changes when aggregated. Similarly, at the prefectural level, absolute percentage changes rarely exceed 1 %, reinforcing that the overall impact of FIPMs remains limited at broader spatial scales. In contrast, at the municipality level, localized effects become more apparent. Some municipalities experienced reductions in future fluvial flood damage costs exceeding 10 %, suggesting that the finer the spatial resolution, the greater the influence of FIPMs. Nonetheless, given that most municipalities exhibited absolute changes below 1 %, the overall influence of FIPMs is not large enough to overturn conclusions from prior studies – such as Swain et al. (2020), Wing et al. (2022), and Yanagihara et al. (2024) – showing that population change alone, even without explicitly considering FIPMs, can exceed the impacts of climate change. To the best of our knowledge, no previous national-scale studies have explicitly incorporated FIPMs into future fluvial flood damage cost estimations. However, Shu et al. (2023) conducted a related analysis in the United States, showing that exposure to high-frequency flooding (5- and 20-year return periods) led to 2 %–7 % lower population growth rates compared to baseline projections. Our findings extend this understanding, showing that reductions in population growth can translate into lower future fluvial flood damage costs. At the prefectural and municipal levels, Figs. 5 and 6 show that some prefectures and municipalities exhibited positive percentage changes, although their magnitudes were generally smaller than the largest reductions. As discussed above, such increases may occur when greater population exposure in some areas that remain flood-exposed exceeds reductions in exposure elsewhere. From a practical perspective, although only a limited number of municipalities experienced notable cost reductions due to FIPMs, overlooking these effects could lead to an overestimation of the effectiveness of flood mitigation measures. These findings suggest that incorporating FIPMs may be important for municipal-level fluvial flood risk assessments and policy evaluations, despite their limited influence at the national level.
4.3 Limitations and future research directions
This study had some limitations that future research should address. First, when incorporating FIPMs into future population projections, expected annual values of flood magnitude variables were used, capturing only average annual impacts. Consequently, the specific impacts of population movements associated with individual flood events were not considered. When considering individual flood events, computational resource constraints must be addressed. Approaches such as emulating physical models with machine learning (Momoi et al., 2023) and extracting essential precipitation events based on hydrological concepts (Chen et al., 2025) may help address these constraints. These methods would enable future studies to assess how event-specific FIPMs influence the findings of the current study. Second, the 250 m spatial resolution of the fluvial flood inundation analysis may limit the representation of localized flood hazards and micro-topographic features. Although this resolution is appropriate for maintaining consistency in a nationwide assessment, it may miss small-scale variations in inundation depth and flow velocity that can influence FIPMs. Therefore, this uncertainty should be considered when interpreting fine-scale spatial variations in FIPMs. Future studies should use higher-resolution inundation data, where available, to better assess fine-scale relationships between flood exposure and population movements. Third, the treatment of flood types requires careful interpretation. This study focuses primarily on future fluvial flood damage. As described by Yanagihara et al. (2024), the fluvial flood inundation model used for future projections partly includes the effect of pluvial flooding through basin-scale rainfall–runoff processes, but it does not explicitly account for inland water drainage facilities. To maintain consistency with this modeling framework, the flood data used in the DiD analyses were treated without separating fluvial and pluvial components. Thus, neither the observational data nor the predictive model fully separates fluvial and pluvial components, although their treatment of flood types is not identical. Coastal flooding is outside the scope of the predictive damage assessment. This limitation may introduce uncertainty in areas where drainage-related pluvial flooding or coastal flooding strongly influences population movements. Therefore, the results should be interpreted as an assessment of the impact of FIPMs on future fluvial flood damage, rather than as a comprehensive assessment of all flood types. Fourth, this study assumed uniformity in population movement responses to flood magnitude across different regions. However, regional differences may exist due to factors such as accessibility and occupational composition, potentially leading to variations in population movement responses even at similar flood magnitudes. By employing causal inference methods that explicitly account for such interaction effects (e.g., Lee and Lee, 2025), future research should quantitatively incorporate regional variations when evaluating population movements. Fifth, while integrating FIPMs into future population projections, the current framework does not explicitly consider the specific destinations of population movements. Instead, population distributions were uniformly scaled by applying adjustment factors across areas to ensure consistency with overall national or municipal totals. This approach does not represent destination-specific pull factors, such as employment opportunities and family or social networks. Therefore, the framework cannot capture cases in which post-flood population movements are concentrated in specific destination areas. Recent studies have developed population migration models capable of explicitly incorporating pull factors influencing migration (Niu, 2022). Future research should utilize these models to explicitly consider the destinations of population movements, thereby enhancing the methodological framework. Sixth, the temporal coverage of the demographic data limits the interpretation of population adjustments after flood events. The FIPMs quantified in this study should be interpreted as population changes and registered migration associated with flood exposure that are observable in the available demographic data. These datasets do not capture short-term evacuations or movements that occurred without changes in registered residence. Moreover, longer-term migration and population adjustment after flood events may be shaped by recovery processes, land markets, public investment, housing reconstruction, and changes in regional economies. Therefore, the long-term projections in this study should not be interpreted as predictions of event-specific migration trajectories, but rather as scenario-based assessments of how empirical relationships between flood magnitude and FIPMs could affect future population distributions, land use, and fluvial flood damage estimates. Explicitly modeling these longer-term adjustment processes is outside the scope of the present framework and should be addressed in future research when post-2020 census and migration data become available. Seventh, values quantified by the DiD method contain uncertainties. To better understand uncertainties associated with FIPMs, future research should include a detailed analysis of uncertainties in estimated fluvial flood damage costs considering FIPMs. Despite these limitations, this study is novel in its evaluation of the impacts of FIPMs on future fluvial flood damage costs. Addressing these limitations will be crucial for improving the accuracy and practical applicability of future fluvial flood damage estimates.
This study evaluated the impact of FIPMs on future fluvial flood damage costs in Japan. The main findings are summarized as follows:
-
The impacts of FIPMs on national-level future fluvial flood damage costs in Japan were minor, with absolute percentage changes of less than 1 %. Furthermore, only two prefectures showed percentage changes greater than 1 %, with maximum absolute changes of approximately 2 %, suggesting that the prefectural-level impacts of FIPMs on fluvial flood damage costs are limited.
-
At the municipal level, although only approximately 10 % of municipalities exhibited percentage changes in fluvial flood damage costs exceeding 1 % due to FIPMs, some municipalities experienced reductions exceeding 10 %. Thus, municipal-level fluvial flood risk assessments and policy evaluations should consider the effects of FIPMs.
While this study represents a case study focused on Japan, it contributes by demonstrating a methodological framework for estimating future fluvial flood damage costs that integrates FIPMs. Future research should improve the understanding of the impacts of FIPMs on future fluvial flood damage costs through consideration of individual flood events, regional characteristics, population movement destinations, and uncertainties related to population movements, ultimately enhancing the effectiveness of flood risk management strategies. In addition, to apply the methodological framework to other countries, adjustments based on data availability and specific regional contexts will be required.
Code and data supporting this study are available from Zenodo (https://doi.org/10.5281/zenodo.20823575, Yanagihara et al., 2026). The repository contains code, redistributable input data, and results for the 500 m grid-cell-level and municipality-level DiD analyses; population and household projection outputs; flood magnitude indicators; estimates of population changes due to FIPMs; land-use projection code and projected land-use data; estimated fluvial flood damage costs; and aggregated data used to create the figures. The full implementation of the fluvial flood damage model is not redistributed in this repository. This model is a pre-existing research model developed and used in previous studies, rather than a model newly developed for the present study. Instead, the repository provides the estimated fluvial flood damage costs generated and used in the present study. The full implementation of the population projection model is also not redistributed in this repository. The model depends on code developed by NIES, which was used by the authors under an agreement. Public redistribution of that code has not been separately authorized; therefore, the repository provides the projection outputs and related derived data used in this study rather than the full implementation. Requests regarding access to the non-redistributed model implementations may be directed to the corresponding author and will be considered subject to the necessary approvals.
The supplement related to this article is available online at https://doi.org/10.5194/nhess-26-3969-2026-supplement.
Conceptualization: HY, SK; Data curation: HY, YH, AI; Formal analysis: HY; Funding acquisition: HY, SK, YH; Investigation: HY; Methodology: HY, SK, KG; Project administration: HY, SK; Resources: HY, SK, KG, YH; Software: HY, SK, KG; Supervision: SK; Validation: HY, SK, KG; Visualization: HY, AI; Writing (original draft preparation): HY; Writing (review and editing): HY, SK, KG, YH, AI.
The contact author has declared that none of the authors has any competing interests.
Publisher's note: Copernicus Publications remains neutral with regard to jurisdictional claims made in the text, published maps, institutional affiliations, or any other geographical representation in this paper. The authors bear the ultimate responsibility for providing appropriate place names. Views expressed in the text are those of the authors and do not necessarily reflect the views of the publisher.
This study was supported by JSPS KAKENHI (Grant Number JP23KJ0119), the Environment Research and Technology Development Fund (Grant Number JPMEERF20S11813) of the Environmental Restoration and Conservation Agency provided by the Ministry of the Environment of Japan, and the Joint Usage/Research Center for Interdisciplinary Large-scale Information Infrastructures (JHPCN), Japan (Project IDs: jh230024 and jh240013).
This paper was edited by Timothy Tiggeloven and reviewed by Marijn Ton and two anonymous referees.
Alfieri, L., Bisselink, B., Dottori, F., Naumann, G., de Roo, A., Salamon, P., Wyser, K., and Feyen, L.: Global projections of river flood risk in a warmer world, Earth's Future, 5, 171–182, https://doi.org/10.1002/2016EF000485, 2017.
Alves, P. J., Lima, R. C. de A., and Emanuel, L.: Natural disasters and establishment performance: Evidence from the 2011 Rio de Janeiro Landslides, Reg. Sci. Urban Econ., 95, 103761, https://doi.org/10.1016/j.regsciurbeco.2021.103761, 2022.
Arakawa, K. and Noyori, S. S.: The relationship of socioeconomic factors and migration from large cities to rural areas, Socio-Informatics, 11, 19–33, https://doi.org/10.14836/ssi.11.3_19, 2023.
Baker, A. C., Larcker, D. F., and Wang, C. C. Y.: How much should we trust staggered difference-in-differences estimates?, J. Financ. Econ., 144, 370–395, https://doi.org/10.1016/j.jfineco.2022.01.004, 2022.
Black, R., Adger, W. N., Arnell, N. W., Dercon, S., Geddes, A., and Thomas, D.: The effect of environmental change on human migration, Glob. Environ. Change, 21, S3–S11, https://doi.org/10.1016/j.gloenvcha.2011.10.001, 2011.
Cengiz, D., Dube, A., Lindner, A., and Zipperer, B.: The effect of minimum wages on low-wage jobs, Q. J. Econ., 134, 1405–1454, https://doi.org/10.1093/qje/qjz014, 2019.
Chen, H., Matsuhashi, K., Takahashi, K., Fujimori, S., Honjo, K., and Gomi, K.: Adapting global shared socio-economic pathways for national scenarios in Japan, Sustain. Sci., 15, 985–1000, https://doi.org/10.1007/s11625-019-00780-y, 2020.
Chen, J., Sayama, T., Yamada, M., and Sugawara, Y.: Reducing the computational cost of process-based flood frequency estimation by extracting precipitation events from a large-ensemble climate dataset, J. Hydrol., 655, 132946, https://doi.org/10.1016/j.jhydrol.2025.132946, 2025.
Del Rio Amador, L., Boudreault, M., and Carozza, D. A.: Projecting climate and socioeconomic contributions to global flood-induced displacements using a data-driven approach, Nat. Hazards, 121, 16935–16973, https://doi.org/10.1007/s11069-025-07457-z, 2025.
Delforge, D., Wathelet, V., Below, R., Sofia, C. L., Tonnelier, M., van Loenhout, J. A. F., and Speybroeck, N.: EM-DAT: the Emergency Events Database, Int. J. Disast. Risk Re., 124, 105509, https://doi.org/10.1016/j.ijdrr.2025.105509, 2025.
Goodman-Bacon, A.: Difference-in-differences with variation in treatment timing, J. Econom., 225, 254–277, https://doi.org/10.1016/j.jeconom.2021.03.014, 2021.
Internal Displacement Monitoring Centre (IDMC): Global Internal Displacement Database – Disasters, https://www.internal-displacement.org/database/displacement-data/ (last access: 10 July 2025), 2023.
Ishizaki, N. N.: Bias corrected climate scenarios over Japan based on CDFDM method using CMIP6 (NIES2020), Ver.1, National Institute for Environmental Studies, Japan [data set], https://doi.org/10.17595/20210501.001, 2021.
Ishizaki, N. N., Shiogama, H., Hanasaki, N., and Takahashi, K.: Development of CMIP6-based climate scenarios for Japan using statistical method and their applicability to heat-related impact studies, Earth Space Sci., 9, e2022EA002451, https://doi.org/10.1029/2022EA002451, 2022.
Jarzebski, M. P., Elmqvist, T., Gasparatos, A., Fukushi, K., Eckersten, S., Haase, D., Goodness, J., Khoshkar, S., Saito, O., Takeuchi, K., Theorell, T., Dong, N., Kasuga, F., Watanabe, R., Sioen, G. B., Yokohari, M., and Pu, J.: Ageing and population shrinking: implications for sustainability in the urban century, npj Urban Sustain., 1, 17, https://doi.org/10.1038/s42949-021-00023-z, 2021.
Kakinuma, K., Puma, M. J., Hirabayashi, Y., Tanoue, M., Baptista, E. A., and Kanae, S.: Flood-induced population displacements in the world, Environ. Res. Lett., 15, 124029, https://doi.org/10.1088/1748-9326/abc586, 2020.
Kam, P. M., Aznar-Siguan, G., Schewe, J., Milano, L., Ginnetti, J., Willner, S., McCaughey, J. W., and Bresch, D. N.: Global warming and population change both heighten future risk of human displacement due to river floods, Environ. Res. Lett., 16, 044026, https://doi.org/10.1088/1748-9326/abd26c, 2021.
Kono, T., Tatano, H., Ushiki, K., Nakazono, D., and Sugisawa, F.: Relocation of firms due to public release of tsunami hazard map, Journal of Japan Society of Civil Engineers, Ser. D3 (Infrastructure Planning and Management), 77, 301–315, https://doi.org/10.2208/jscejipm.77.4_301, 2021.
Lee, Z. and Lee, K.: Causal interaction and effect modification: a randomization-based approach to inference, J. Korean Stat. Soc., 54, 665–684, https://doi.org/10.1007/s42952-025-00313-7, 2025.
Marvi, M. T.: A review of flood damage analysis for a building structure and contents, Nat. Hazards, 102, 967–995, https://doi.org/10.1007/s11069-020-03941-w, 2020.
McAdam, J. and Ferris, E.: Planned relocations in the context of climate change: unpacking the legal and conceptual issues, Camb. Int. Law J., 4, 137–166, https://doi.org/10.7574/cjicl.04.01.137, 2015.
Merz, B., Kreibich, H., Schwarze, R., and Thieken, A.: Review article “Assessment of economic flood damage”, Nat. Hazards Earth Syst. Sci., 10, 1697–1724, https://doi.org/10.5194/nhess-10-1697-2010, 2010.
Ministry of Land, Infrastructure and Transport of Japan (MLIT): Rivers in Japan, https://www.mlit.go.jp/river/basic_info/english/pdf/riversinjapan.pdf (last access: 2 July 2025), 2006.
Momoi, M., Kotsuki, S., Kikuchi, R., Watanabe, S., Yamada, M., and Abe, S.: Emulating rainfall-runoff-inundation model using deep neural network with dimensionality reduction, Artificial Intelligence for the Earth Systems, 2, e220036, https://doi.org/10.1175/AIES-D-22-0036.1, 2023.
Morita, H.: Introduction to empirical analysis, Nippon Hyoron Sha, Tokyo, 344 pp., ISBN 978-4-535-55793-2, 2014.
Namikawa, K., Koyama, N., and Yamada, T.: Analysis of impact of catastrophic flooding on the local population and its causes, Advances in River Engineering, 28, 385–390, https://doi.org/10.11532/river.28.0_385, 2022.
National Institute for Environmental Studies, Japan (NIES): Results of Environment Research and Technology Development Fund 2-1805 (Japanese SSP Population Scenarios for Municipalities, 2nd Edition), https://adaptation-platform.nies.go.jp/data/socioeconomic/index.html (last access: 2 July 2025), 2021a.
National Institute for Environmental Studies, Japan (NIES): Japanese SSP Population Projections for Municipalities (2nd Edition), http://adaptation-platform.nies.go.jp/data/socioeconomic/pdf/population_manual_v2.pdf (last access: 2 July 2025), 2021b.
National Institute for Environmental Studies, Japan (NIES): Results of Environment Research and Technology Development Fund 2-1805 (Japanese SSP Third Mesh Population Scenarios, 2nd Edition), https://adaptation-platform.nies.go.jp/data/socioeconomic/index.html (last access: 2 July 2025), 2021c.
Nguyen, M.: A Guide on Data Analysis, https://bookdown.org/mike/data_analysis/ (last access: 2 July 2025), 2020.
Niu, F.: A push-pull model for inter-city migration simulation, Cities, 131, 104005, https://doi.org/10.1016/j.cities.2022.104005, 2022.
Okamoto, A., Yanagihara, H., Kazama, S., and Hiraga, Y.: Statistical analysis of municipal population change and their factors caused by flood damage, Japanese Journal of JSCE, 79, 23-27044, https://doi.org/10.2208/jscejj.23-27044, 2023.
Redondo-Tilano, S. A., Boucher, M.-A., and Lacey, J.: Emerging strategies for addressing flood-damage modeling issues: A review, Int. J. Disast. Risk Re., 116, 105058, https://doi.org/10.1016/j.ijdrr.2024.105058, 2025.
Rogers, J. S., Maneta, M. P., Sain, S. R., Madaus, L. E., and Hacker, J. P.: The role of climate and population change in global flood exposure and vulnerability, Nat. Commun., 16, 1287, https://doi.org/10.1038/s41467-025-56654-8, 2025.
Shu, E. G., Porter, J. R., Hauer, M. E., Olascoaga, S. S., Gourevitch, J., Wilson, B., Pope, M., Melecio-Vazquez, D., and Kearns, E.: Integrating climate change induced flood risk into future population projections, Nat. Commun., 14, 7870, https://doi.org/10.1038/s41467-023-43493-8, 2023.
Sivapalan, M., Savenije, H. H. G., and Blöschl, G.: Socio-hydrology: A new science of people and water, Hydrol. Process., 26, 1270–1276, https://doi.org/10.1002/hyp.8426, 2012.
Swain, D. L., Wing, O. E. J., Bates, P. D., Done, J. M., Johnson, K. A., and Cameron, D. R.: Increased flood exposure due to climate change and population growth in the United States, Earth's Future, 8, e2020EF001778, https://doi.org/10.1029/2020EF001778, 2020.
Ton, M. J., de Moel, H., de Bruijn, J. A., Reimann, L., Botzen, W. J. W., and Aerts, J. C. J. H.: Economic damage from natural hazards and internal migration in the United States, Nat. Hazards, 121, 4985–5005, https://doi.org/10.1007/s11069-024-06987-2, 2025.
Tsuda, H. and Tebakari, T.: A macroscopic analysis of the demographic impacts of flood inundation in Thailand (2005–2019), Prog. Earth Planet. Sci., 10, 36, https://doi.org/10.1186/s40645-023-00569-9, 2023.
Ujihara, T., Wake, H., and Morinaga, Y.: Changing population and land prices in areas damaged by torrential rains in Kanto and Tohoku, September 2015, Journal of the City Planning Institute of Japan, 54, 57–63, https://doi.org/10.11361/journalcpij.54.57, 2019.
Ushiki, K., Kono, T., Tatano, H., Nakazono, D., and Sugisawa, F.: Understanding changes in population distribution by age group due to the publication of tsunami inundation estimates using difference-in-differences analysis, Proceedings of Infrastructure Planning, 60, 02–03, 2019.
Wing, O. E. J., Lehman, W., Bates, P. D., Sampson, C. C., Quinn, N., Smith, A. M., Neal, J. C., Porter, J. R., and Kousky, C.: Inequitable patterns of US flood risk in the Anthropocene, Nat. Clim. Change, 12, 156–162, https://doi.org/10.1038/s41558-021-01265-6, 2022.
Yanagihara, H., Kazama, S., Yamamoto, T., Ikemoto, A., Tada, T., and Touge, Y.: Nationwide evaluation of changes in fluvial and pluvial flood damage and the effectiveness of adaptation measures in Japan under population decline, Int. J. Disast. Risk Re., 110, 104605, https://doi.org/10.1016/j.ijdrr.2024.104605, 2024.
Yanagihara, H., Kazama, S., Gomi, K., Hiraga, Y., and Ikemoto, A.: Code and data supporting “Integrating flood-induced population movements into future fluvial flood damage estimates in Japan”, Zenodo [data set], https://doi.org/10.5281/zenodo.20823575, 2026.
Yoshikawa, S., Imamura, K., Yamasaki, J., Nitanai, R., Manabe, R., Murayama, A., Takahashi, K., Matsuhashi, K., and Mimura, N.: Estimation of future building area by use for data development associated with Japan SSPs, Japanese Journal of JSCE, 80, 24-27049, https://doi.org/10.2208/jscejj.24-27049, 2024.