
the Creative Commons Attribution 4.0 License.
the Creative Commons Attribution 4.0 License.
 | 07 Aug 2026
Storm surge dynamics in the northern Adriatic Sea: comparing AI emulators with high-resolution numerical simulations
Rodrigo Campos-Caba
Paula Camus
Andrea Mazzino
Michalis Vousdoukas
Massimo Tondello
Ivan Federico
Salvatore Causio
Lorenzo Mentaschi
Accurate storm surge forecasting is vital for protecting coastal regions, particularly in the northern Adriatic Sea where sea-level rise and increasingly severe storm events pose growing risks. Machine Learning (ML) approaches offer compelling speed and flexibility, yet their ability to emulate high-resolution dynamic models, especially for extreme surge events, has not been sufficiently assessed across methods and loss functions. In this study, a range of ML emulators, from Multivariate Linear Regression (MLR) to Long Short-Term Memory (LSTM) networks, is benchmarked against a high-resolution hydrodynamic model optimized for extreme surge representation. We also evaluate the impact of training loss functions, comparing the conventional Mean Squared Error (MSE) with the corrected Mean Absolute Deviation squared (MADc2), designed to better capture surge peaks. Results show that even simple models like MLR, when trained with MADc2, achieve performance comparable to advanced neural networks while remaining orders of magnitude faster. These findings demonstrate that with appropriate training strategies, data-driven emulators can rival physics-based models in reproducing extremes. Simple models such as MLR and the Multilayer Perceptron (MLP), when trained with MADc2, demonstrate a practical balance between computational efficiency and accuracy, underscoring the potential of ML emulators for coastal forecasting and risk assessment.
- Article
(10036 KB) - Full-text XML
-
Supplement
(2811 KB) - BibTeX
- EndNote


Accurate storm surge prediction is vital for coastal risk management, particularly in light of observed increases in extreme sea-level events and projected future changes associated with sea-level rise and climate change (Calafat et al., 2022; IPCC, 2021). While storm surge forecasting efforts have traditionally focused on tropical-cyclone-prone regions such as the North Atlantic and Pacific basins, semi-enclosed basins can also experience severe surge impacts driven by regional atmospheric circulation patterns.
The northern Adriatic Sea represents a vulnerable coastal environment in Europe. Its shallow bathymetry, funnel-shaped geometry, and frequent intense sirocco wind events make the Venice lagoon and surrounding low-lying coastal areas highly susceptible to flooding. Several extreme events have demonstrated the societal and economic consequences of Adriatic storm surges, including the catastrophic flood of 4 November 1966, which submerged most of Venice and caused extensive damage to infrastructure and cultural heritage (De Zolt et al., 2006), as well as more recent events in 2018 and 2019 that led to widespread urban flooding and economic losses of hundreds of millions of euros (Ferrarin et al., 2020; Umgiesser et al., 2021). The activation of the MoSE flood barrier system during the November 2022 surge further underscores both the persistent hazard and the operational importance of accurate surge prediction (Mel et al., 2023). Although Adriatic storm surges are generally smaller in magnitude than those associated with tropical cyclones, their interaction with densely populated and culturally significant coastal zones makes reliable surge modeling essential for risk management and infrastructure planning.
Physics-based hydrodynamic models remain the standard tool for operational storm surge forecasting. However, these models are computationally demanding, particularly when high spatial resolution is required to resolve coastal-scale processes. In recent years, Machine Learning (ML) approaches have emerged as promising alternatives or complements to traditional dynamical models, offering computational efficiency and flexibility (Chen et al., 2022; Zhao et al., 2024). In this context, ML emulators trained to approximate the behavior of complex dynamic systems are often referred to as emulators, i.e., surrogate models that replicate input–output relationships without explicitly resolving the governing physical equations.
Regression-based ML emulators, such as Multivariate Linear Regression (MLR), have been widely used to predict storm surge levels (Cid et al., 2018; Daizong et al., 2019; Tadesse et al., 2020; Harter et al., 2024). More flexible architectures like Neural Networks (NNs), particularly Recurrent Neural Networks (RNN) and gated variants such as Long Short-Term Memory (LSTM) emulators, are especially well suited for time series forecasting, as they can capture both short- and long-term dependencies in surge dynamics (Bezuglov et al., 2016; Suradhaniwar et al., 2021). These emulators have demonstrated strong performance across a variety of coastal settings (Igarashi and Tajima, 2021; Chen et al., 2022; Wang et al., 2021; Adeli et al., 2023).
Tiggeloven et al. (2021) tested CNN-LSTM hybrid emulators but ultimately found that standard LSTM models outperformed more complex architectures. However, they also showed that convolutional layers can improve performance when larger spatial predictor domains are considered, a result further supported by more recent studies (e.g., Hermans et al., 2025). Further enhancements include Gated Recurrent Units (GRUs) with physics-informed loss functions (Feng and Xu, 2024) and transformer-based models (Rus et al., 2023b), which extend emulator capabilities in capturing both spatial and temporal surge patterns. Ensemble techniques and bias correction approaches have also contributed to improved predictive skill and interpretability (Giaremis et al., 2024; Sun and Pan, 2023).
In the Adriatic Sea, applications of ML emulators remain limited. Notable efforts include the integration of NNs into operational surge systems for Venice (Bajo and Umgiesser, 2010), and the HIDRA model series for Koper, Slovenia, which have outperformed coarser hydrodynamic models in short-term forecasts and in reconstructing surge events (Žust et al., 2021; Rus et al., 2023a, b).
Nevertheless, gaps still persist in the literature: (1) a general lack of systematic comparisons between ML emulators and high-resolution storm surge models developed specifically for the extremes; (2) limited consideration of how emulator performance may vary across different coastal environments; and (3) insufficient analysis of emulator skill during extreme events. These limitations highlight the need for careful calibration and validation of ML-based emulators in each coastal setting, in order to identify the most suitable approach for local conditions and to assess when such emulators can serve as viable alternatives to dedicated dynamic models, particularly for extremes.
To help address these issues, this study benchmarks a range of ML-based emulators, from MLR to LSTM architectures, against a dedicated high-resolution hydrodynamic model of the northern Adriatic Sea. Emphasis is placed on assessing under which conditions emulators can reproduce the statistical and physical characteristics of storm surge, with a focus on their ability to capture extremes. While the analysis is limited to two locations, it provides insight into site-dependent performance and contributes to the broader understanding of emulator behavior across coastal environments.
In this study, we compare the performance of a high-resolution dynamic downscaling model with that of machine learning emulators of varying complexity. The remainder of this section outlines the numerical model and its forcing, the ML methods employed, and the datasets used for training and evaluation.
2.1 High-resolution numerical simulation
The numerical simulation used for comparison with the ML emulators is a dynamic downscaling of storm surges in the northern Adriatic Sea, based on the SHYFEM-MPI hydrodynamic model. SHYFEM-MPI is an unstructured-grid finite element code that solves the Navier–Stokes equations under hydrostatic and Boussinesq approximations (Umgiesser et al., 2004; Micaletto et al., 2022). It is an established modeling framework, previously applied in operational (Federico et al., 2017), relocatable (Trotta et al., 2016), and storm surge forecasting systems (Park et al., 2022; Alessandri et al., 2023).
The simulation employs an unstructured grid with a horizontal resolution of approximately 3 km at the open boundary and 50 m nearshore. Atmospheric forcing is provided by a 3.3 km downscaling of the Climate Forecast System Reanalysis (CFSR), performed using the WRF model. The simulation, hereinafter referred to as SHYFEM-MPI, spans the period 1987–2020 and provides hourly output. For more information, the reader is referred to Campos-Caba et al. (2024).
2.2 Predictand
Observed data from tide gauges were used as the predictand. In this study, the target variable corresponds to storm surge, defined as the meteorologically driven, non-tidal residual component of sea level. The storm surge estimation follows the procedure described in Campos-Caba et al. (2024) and consists of three main steps. First, the raw sea-level time series were centered to zero mean and linearly detrended to remove long-term changes. Second, harmonic analysis was performed separately for each calendar year using the T-Tide MATLAB package (Pawlowicz et al., 2022). The non-tidal residual (NTR) was computed as the arithmetic difference between the total sea level and the reconstructed tidal signal.
Finally, to isolate the pure storm surge signal (hereafter also referred to as “surge”), a low-pass filter was applied to the non-tidal residual following Park et al. (2022). A cut-off period of 13 h was adopted, consistent with the mixed semidiurnal tidal regime of the northern Adriatic Sea (Lionello et al., 2021). The resulting filtered non-tidal residual constitutes the predictand used for training and evaluation of the ML emulators. To ensure strict intercomparability, the identical preprocessing chain was applied to the SHYFEM-MPI output prior to performance assessment.
The ML emulators were applied at Punta della Salute and Trieste (Fig. 1), locations that offer consistent and long-term hourly observed data, a crucial requirement for training the implemented NN models. In both locations the data used extends from 1987 to 2020. Observations for Punta della Salute were provided by the Italian National Institute for Environmental Protection and Research (ISPRA), while data for Trieste were obtained from Raicich (2023). Additionally, data from the ISMAR-CNR research platform “Aqua Alta” (hereafter CNR platform, Fig. 1) were considered to compare the ML emulators with the regional numerical model for a storm surge event that occurred in November 2022 (Mel et al., 2023).
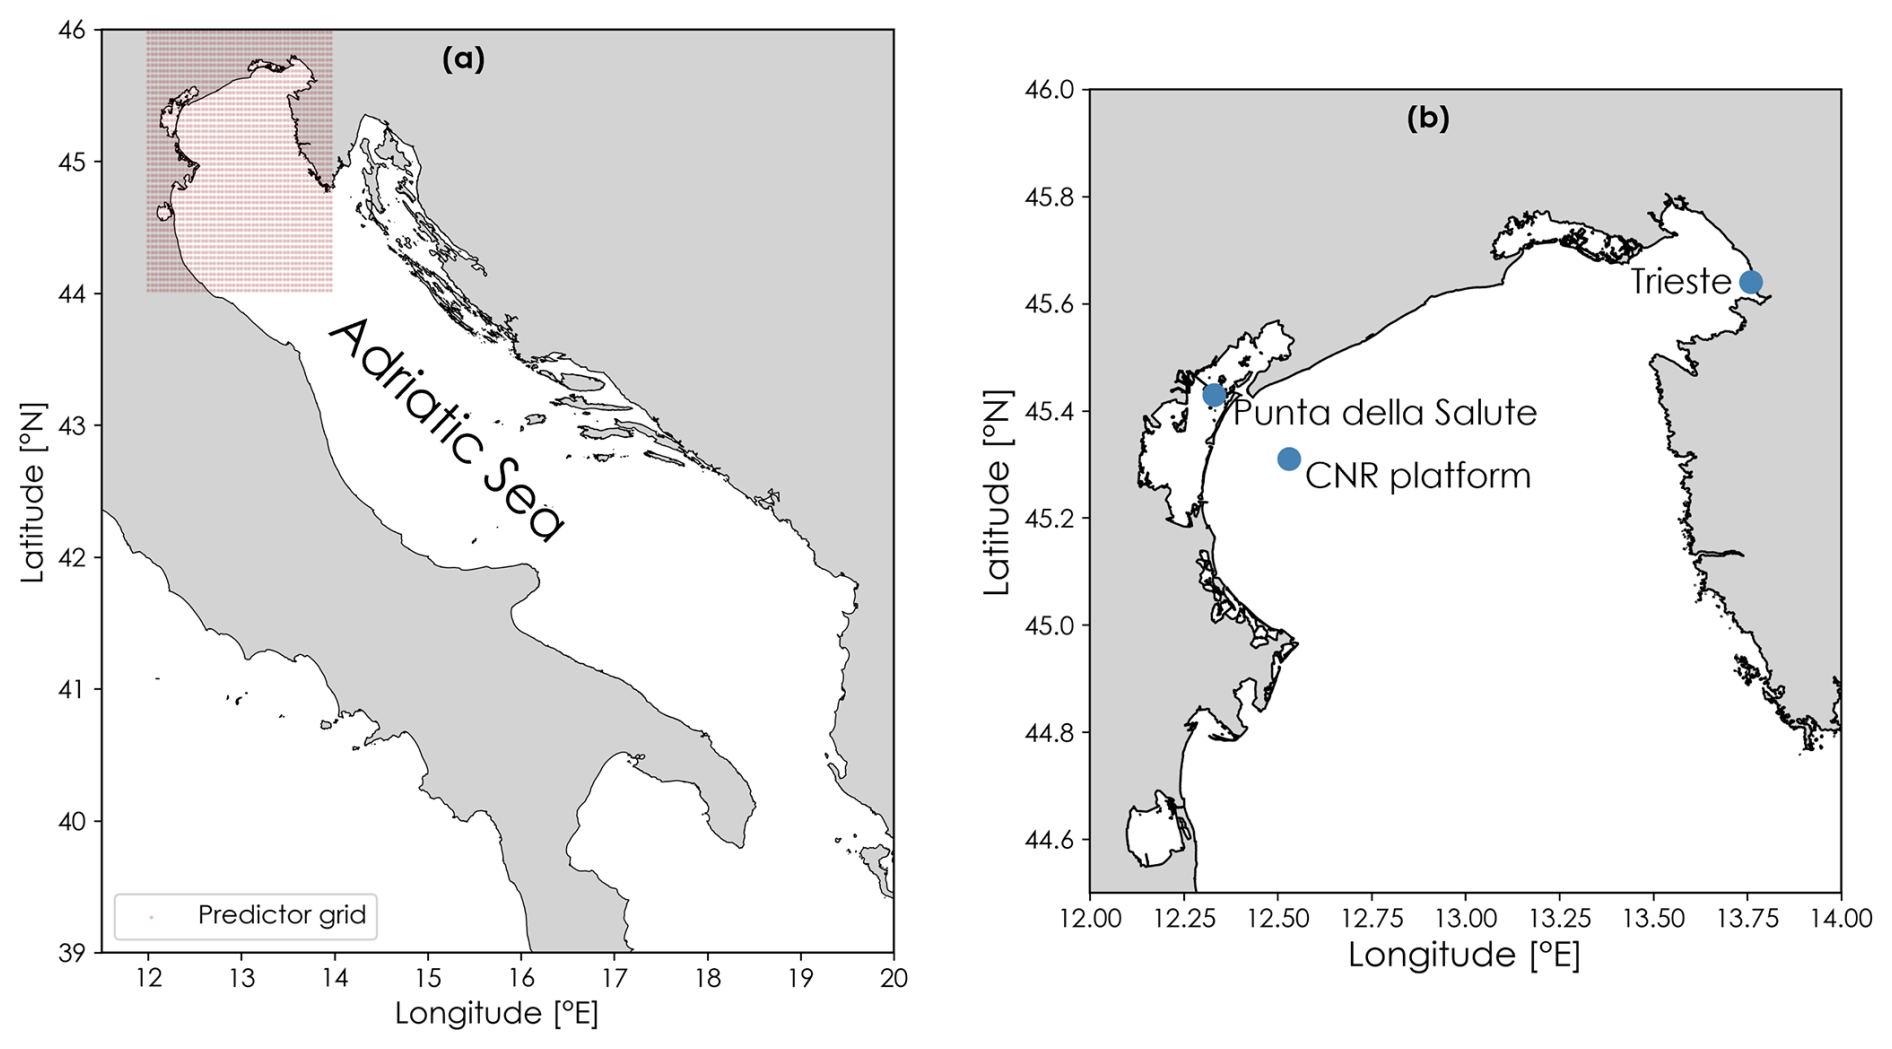
Figure 1Study area and locations for the implementation of the machine learning models. (a) Overview of the Adriatic Sea, including the predictors grid (red dots). (b) Northern Adriatic study area showing the locations where the ML emulators were applied, along with the ISMAR-CNR platform.
2.3 Predictors
The predictors used for ML emulators include meteorological and oceanographic variables known to influence storm surge dynamics and commonly adopted in recent data-driven studies (e.g., Kim et al., 2019; Žust et al., 2021; Chen et al., 2022; Rus et al., 2023a; Tausía et al., 2023; Harter et al., 2024; Dang et al., 2024). Specifically, we used sea surface height from Med-MFC (Escudier et al., 2021), tides from FES2014 (Lyard et al., 2021), and mean sea level pressure from ERA5 (Hersbach et al., 2020). Following Harter et al. (2024), wind stress was also included, computed from ERA5 wind fields. ERA5 variables were interpolated to the Med-MFC grid using the method by Wang et al. (2024).
The inclusion of basin-scale sea surface height (SSH) from the Med-MFC reanalysis reflects a deliberate choice aligned with a statistical downscaling framework, rather than an attempt to replace physics-based models. In coastal downscaling, large-scale ocean models routinely provide SSH boundary conditions that are subsequently refined by higher-resolution regional or coastal models. In this study, the ML emulators are designed to perform an analogous task: they take available basin-scale SSH fields together with atmospheric predictors and statistically refine them to tide gauge-scale storm surge signals. In this sense, the ML emulators function as data-driven coastal correctors of basin-scale output rather than standalone substitutes for ocean circulation models. This approach differs from purely atmospheric-driven time-series forecasting and instead mirrors established dynamical downscaling chains, focusing ML capacity on resolving coastal-scale processes that coarse models cannot explicitly capture.
The spatial domain for predictor extraction was selected via performance testing with multivariate linear regression (MLR) emulators and is shown in Figs. 1a and S1 in the Supplement. MLR was used at this stage as a computationally efficient baseline, allowing systematic exploration of multiple domain configurations while preserving physical interpretability of the predictors. Specifically, two alternative predictor domains were evaluated for each location (Fig. S2), consisting of regional domains centered on Punta della Salute and Trieste, respectively. These were compared against a larger domain encompassing a broader portion of the northern Adriatic Sea, which was ultimately selected for the final experiments. Performance was assessed using the MADc metric on the validation dataset, and the domain yielding the lowest MADc values was retained for subsequent analyses (Table S1 in the Supplement). This procedure ensured that the selected predictor domain provided sufficient spatial coverage to capture the large-scale atmospheric and oceanographic processes influencing storm surge variability at both locations.
Since most predictors are spatial fields and the target is time-series regression, dimensionality reduction was applied using Principal Component Analysis (PCA). Different numbers of principal components (3, 5, and 7) were evaluated using the same MLR-based validation procedure and the MADc metric. The first seven principal components (PCs) of each predictor were ultimately retained, as they provided the best compromise between information retention and dimensionality reduction while minimizing MADc (Table S2).
PCA was applied separately to each spatial predictor field (sea surface height, mean sea level pressure, and the two wind stress components), rather than jointly across all variables. The retained PCs from each predictor were subsequently concatenated to form a single multivariate predictor matrix. Tidal data were excluded from this process and used directly as single hourly time series. The selected EOFs for each predictor are shown in Figs. S3–S6 and the explained variance of each PC is shown in Fig. S7. Since four spatial predictors were considered (sea surface height, wind stress components, and mean sea level pressure), this results in 28 PCA-derived features per time step. These features, together with the tidal time series, form the final input vector at each time step. The resulting predictor matrix therefore has dimensions [Ntime,Nfeatures], where Nfeatures corresponds to the total number of retained PCs across all predictors plus tidal time series.
Predictor extraction and PCA were performed separately for each location using the corresponding spatial domain (Fig. 1a). Although the same types of basin-scale variables (sea surface height, mean sea level pressure, wind stress components, and tides) were used, the resulting predictor matrices are location-specific, reflecting differences in spatial footprint and local coastal dynamics. For reproducibility and clarity, Table 1 summarizes the predictor variables used in the ML emulators, their data sources, preprocessing steps, and resulting feature dimensionality.

To assess the relative influence of the input features on emulator predictions, a permutation importance analysis was conducted. For each predictor, the corresponding feature column was randomly shuffled along the temporal dimension while all other predictors were left unchanged. This procedure destroys the temporal correspondence between the selected predictor and the target variable, as well as the predictor's own temporal structure and autocorrelation, while preserving its marginal distribution. The trained emulator then generates predictions using the permuted dataset, and the resulting mean absolute deviation (MAD) is compared with the baseline MAD obtained from the original inputs. The increase in MAD reflects the importance of the feature, with larger increases indicating a stronger influence on model performance. To mitigate randomness, each permutation was repeated 10 times, and the final importance score was computed as the average increase in MAD.
The resulting importance scores should therefore be interpreted as reflecting the contribution of each predictor to the overall model performance across the analyzed time series. For feed-forward architectures (MLR and MLP), the permutation disrupts the temporal correspondence between the predictor and the target while preserving the predictor's marginal distribution. For recurrent architectures (RNN and LSTM families), temporal shuffling additionally alters the predictor's autocorrelation structure, thereby affecting the evolution of the hidden state. Consequently, the importance scores for recurrent models reflect both the direct contribution of the predictor and its influence on the temporal dynamics learned by the network.
2.4 Emulators
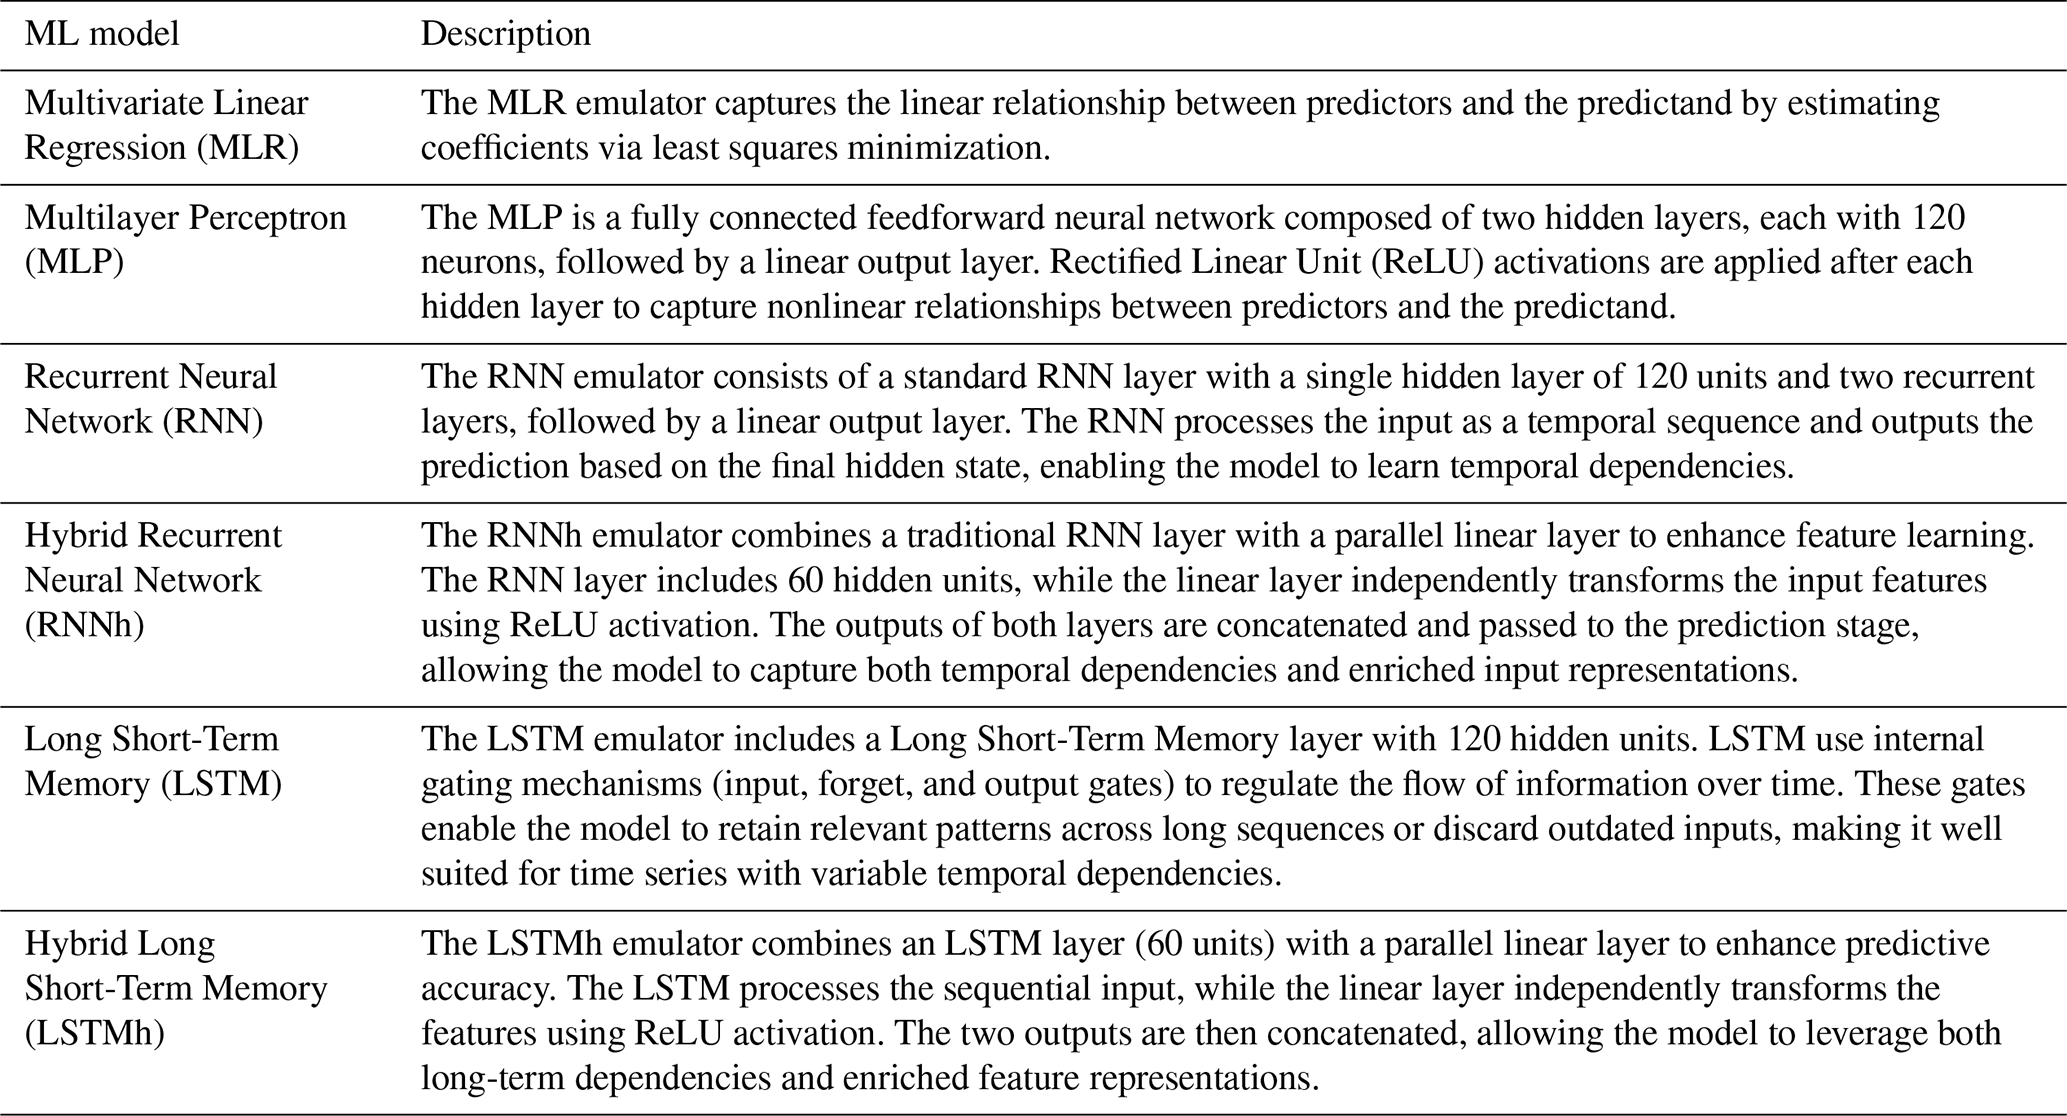
The ML emulators were implemented in Python using the PyTorch library (Paszke et al., 2017), a widely adopted framework for AI applications. The emulators used in this study range from simple approaches such as Multivariate Linear Regression (MLR) to deep recurrent architectures, including Long Short-Term Memory (LSTM) networks (Table 2), allowing us to evaluate the trade-off between emulator complexity and predictive skill.
The recurrent architectures (RNN and LSTM families) are trained on the full time series as a single continuous sequence, enabling the exploitation of temporal dependencies through their internal state dynamics. To make this approach computationally feasible for long records, training is carried out using truncated backpropagation through time (TBPTT). In this framework, the full sequence is partitioned into shorter temporal segments (chunks), which are processed sequentially during training. In this study, a chunk length of 1024 time steps (hours) is adopted, corresponding to approximately 43 d. This temporal extent is well beyond the characteristic duration of storm surge events, providing sufficient context for the model to capture physically relevant dependencies.
Crucially, the hidden state of the recurrent network is propagated across consecutive segments, allowing the model to retain information from previous time steps, while gradients are truncated at segment boundaries to control memory usage and ensure numerical stability. This strategy enables the model to approximate full-sequence learning while avoiding the prohibitive computational cost of backpropagating through the entire time series at once. As a result, temporal dependencies are not explicitly encoded in the input feature space (i.e. no lookback window is constructed), but are instead learned implicitly through the evolution of the hidden state. This formulation allows recurrent models to exploit temporal context without requiring manual construction of lagged predictors.
In all emulator configurations, the target variable corresponds to the storm surge associated with the available predictor fields at each time step. Consequently, neither feed-forward nor recurrent architectures impose an intrinsic prediction horizon; rather, the effective forecast horizon is determined solely by the temporal availability of input predictors. For feed-forward emulators (MLR and MLP), predictions are generated independently at each timestep based on contemporaneous predictor values, there is no architectural constraint limiting how far forward inference can proceed, provided future predictors remain available. For recurrent architectures (RNN and LSTM families), this flexibility is further enhanced by propagating the hidden and cell states continuously through the input sequence, allowing temporal dependencies to be retained across successive time steps. As long as predictor fields are available, predictions can therefore be generated for arbitrarily long sequences without imposing an architectural limit on the prediction horizon. In both cases, no architectural limit constrains the prediction horizon, only practical considerations such as forcing data availability and potential error accumulation over extended sequences. In the present study, the emulators were trained and evaluated using historical reanalysis and hindcast datasets, but the same framework can be applied to operational forecast products provided that the corresponding predictor fields are available. Assessing the influence of forecast lead time on emulator performance is beyond the scope of the present study and represents a natural direction for future research.
To further assess the adequacy of the recurrent formulation and to explicitly evaluate the role of temporal context, an additional set of experiments was conducted using a sliding window approach. In this formulation, the input at time t consists of a fixed-length window of past predictors, i.e. , where L denotes the look-back length. This approach provides an explicit representation of temporal memory in the input space, in contrast to the implicit memory learned through the hidden state in the TBPTT formulation. The comparison between both approaches was designed to ensure that the use of recurrent architectures is being properly exploited and that the adopted TBPTT strategy does not artificially constrain the temporal dependencies learned by the model.
The analysis was performed using the LSTM-MSE emulator as a baseline, following Hermans et al. (2025), and results were averaged across locations for surge peaks exceeding the 99th percentile. Each emulator configuration was trained ten times using different random initializations, and the reported performance corresponds to the best run, selected based on the linear fit slope closest to unity on the validation set. The validation dataset is described in Sect. 2.6. To assess the role of explicitly defined temporal memory, different look-back windows were tested (3, 12, 24, and 36 h), and the corresponding performance metrics are summarized in Table S3.
Overall, the full-time series + TBPTT approach consistently outperforms the sliding window formulation in our experiment, particularly in terms of bias and overall error characteristics. The TBPTT model exhibits a lower bias (−0.058) compared to all sliding window configurations (ranging from −0.083 to −0.102), indicating a reduced systematic underestimation of extreme surge values. While Pearson correlation and RMSE remain broadly comparable across approaches, the sliding window configurations tend to exhibit larger errors and a more pronounced bias, especially for both shorter and longer look-back windows. Furthermore, increasing the look-back length does not lead to a consistent improvement in performance. Although intermediate windows (e.g., 24 h) yield results closer to the TBPTT formulation, longer windows (e.g., 36 h) generally degrade performance. This suggests that explicitly increasing the input memory does not enhance predictive skill in the study area and may instead introduce noise or reduce model robustness. Nevertheless, these findings are likely conditioned by the characteristics of the study area and the predictor configuration adopted here, and do not necessarily imply that the TBPTT formulation will systematically outperform sliding-window approaches in other coastal environments or surge regimes.
The architectural hyperparameters of the neural network emulators were selected through an exploratory grid search designed to balance emulator complexity, robustness, and computational efficiency. For the MLP architecture, different configurations of hidden layers were tested, including one- and two-layer networks with 60 and 120 neurons per layer. For the recurrent architectures (RNN and LSTM), the number of hidden units was varied between 30, 60, and 120. In addition, multiple random weight initializations were considered for each configuration to account for stochastic variability in gradient-based optimization.
2.5 Loss functions
All emulators were trained using the Adam optimizer with a fixed learning rate of 1 × 10⁻³. An exception was made for the RNN-based emulators, for which a reduced learning rate of 5 × 10⁻⁴ was adopted to ensure stable training and mitigate gradient explosion effects inherent to simple (non-gated) recurrent neural network architectures. All remaining training parameters were kept fixed across architectures to ensure a consistent comparison and to isolate the impact of architectural choices and loss-function design. In particular, all emulators were trained using full-batch gradient descent, with each epoch processing the entire training dataset, while the optimizer type, learning rate, and input normalization were held constant across experiments. Hyperparameter selection for each model was based on validation performance using the slope of the linear fit between predicted and observed storm surge, as this metric directly reflects the ability of the emulator to reproduce the amplitude of extreme events. The configurations yielding the most robust validation performance across random initializations were retained for the full training experiments reported in this study. No additional regularization (e.g., dropout or weight decay) was applied, as preliminary tests did not indicate overfitting under the adopted data partitioning and full-batch training regime.
As loss functions, both the Mean Squared Error (MSE) and MADc2 were applied across all models. The MADc2 loss function is derived from the corrected mean absolute deviation (MADc), introduced in Campos-Caba et al. (2024). MADc combines the standard Mean Absolute Deviation (MAD) with a percentile-based component (MADp), which measures the average absolute difference between simulated and observed values across percentiles of the observed distribution, thereby quantifying how well the empirical distribution is reproduced. MADc is defined as the sum of MAD and MADp, capturing both overall magnitude errors and discrepancies in distributional shape. MADc2 is then defined as the square of MADc. This formulation is preferred over MADc as a loss function because it is differentiable at the theoretical minimum (unlike MADc, which is not) enabling smoother convergence in gradient-based optimization. Formally, MADc2 is defined as:
where S represents the simulation value and O the observation value. The full formulation of MADp, MADc, and MADc2 as performance metrics is provided in Sect. 2.7.
The percentile component of the MADc2 loss was computed using a non-uniform set of percentiles, with increased sampling density near the tails of the distribution in order to enhance sensitivity to extreme events. Specifically, additional percentiles were introduced in the upper and lower tails (e.g., 0.95, 0.98, 0.99, 0.995, and 0.999), while maintaining coarser sampling across the central portion of the distribution. This weighting strategy was designed to place greater emphasis on accurately reproducing rare surge levels without neglecting the overall distributional structure.
For recurrent architectures trained using the TBPTT approach, the percentile-based MADp component was not estimated independently within each chunk. Instead, a rolling buffer strategy was adopted, whereby the percentile distributions were computed using both the current chunk and a detached history of predictions and targets from previous chunks within the same epoch. This approach provides a more representative estimate of the global distribution while preserving the computational efficiency and memory constraints of TBPTT. Several buffer lengths were tested, and a size of 100 000 samples provided the best compromise between training stability and extreme-event representation.
Building on this definition, the adoption of MADc2 warrants a brief discussion from both theoretical and practical perspectives. Here, we focus on its definition as the square of MADc and on its convexity, i.e., the existence of a single global minimum, which underpins the robustness of gradient-based optimization algorithms. MADc2 is preferred over MADc because it is differentiable at the theoretical minimum (MADc2 = 0), whereas MADc is not. This differentiability enables smoother convergence in optimization routines that rely on gradient information.
From a theoretical standpoint, MADc2 is convex: for an ideal model that perfectly reproduces the observations, both the MAD and the MADp vanish. The loss function therefore reaches its unique global minimum at this point of perfect agreement, with no other minima admissible. In practice, however, convexity may be locally attenuated if the parameter values that minimize MAD differ from those minimizing MADp. In such cases, compensation effects between the two components can generate shallow valleys or low-gradient regions in parameter space, potentially slowing convergence.
To illustrate the optimization properties of MADc2, we constructed a synthetic case study based on a simple linear regression model of the form , where W and B denote single weight and bias parameter. Synthetic data were generated using known coefficients (W=2, B=1), and the MADc2 loss was evaluated over a grid of parameter values in the vicinity of the true solution. Figure S8 shows the resulting two-dimensional loss surface as a function of W and B, with colors representing log10(MADc2). The surface exhibits a single well-defined minimum located near the true coefficients and a smooth diagonal valley structure, with no evidence of multiple local minima in the explored region. While this simplified experiment does not constitute a formal proof of convexity in high-dimensional neural network parameter spaces, it provides a practical illustration that MADc2 yields a smooth and well-behaved optimization landscape in a representative regression setting, supporting the stability of gradient-based training.
Recent studies have explored alternative strategies to address data imbalance and improve the representation of extremes in data-driven storm surge modelling, including density-based weighting schemes (Hermans et al., 2025) and quantile-based loss functions (Longo et al., 2025). These approaches share the common objective of increasing sensitivity to the upper tail of the distribution, albeit through different formulations.
In this study, we focus on MADc2 as a representative and conceptually simple loss function that directly targets both overall error magnitude and distributional consistency through its combined MAD and percentile-based components. A systematic intercomparison of multiple extreme-aware loss functions is beyond the scope of the present work and would require additional design choices (e.g., quantile selection or weighting strategies) that may strongly influence results. Nevertheless, the convergence of findings across recent studies suggests that explicitly incorporating sensitivity to extremes into the training objective, rather than the specific mathematical form of the loss, is the key factor in improving emulator performance for storm surge extremes.
The hyperparameter exploration described above was performed independently of the loss function. Once the optimal architectural configuration for each emulator type was identified based on validation slope performance, the same architecture was trained using both MSE and MADc2 loss functions. This ensured that performance differences between MSE- and MADc2-trained models reflect solely the influence of the loss formulation, rather than architecture-specific tuning differences. We note that hyperparameter selection was based on the validation slope criterion rather than directly minimizing either MSE or MADc2. While it is conceivable that tuning architectures explicitly under MADc2 could further enhance extreme-event performance, adopting a common validation-based selection strategy across both loss functions ensures a controlled and comparable experimental framework.
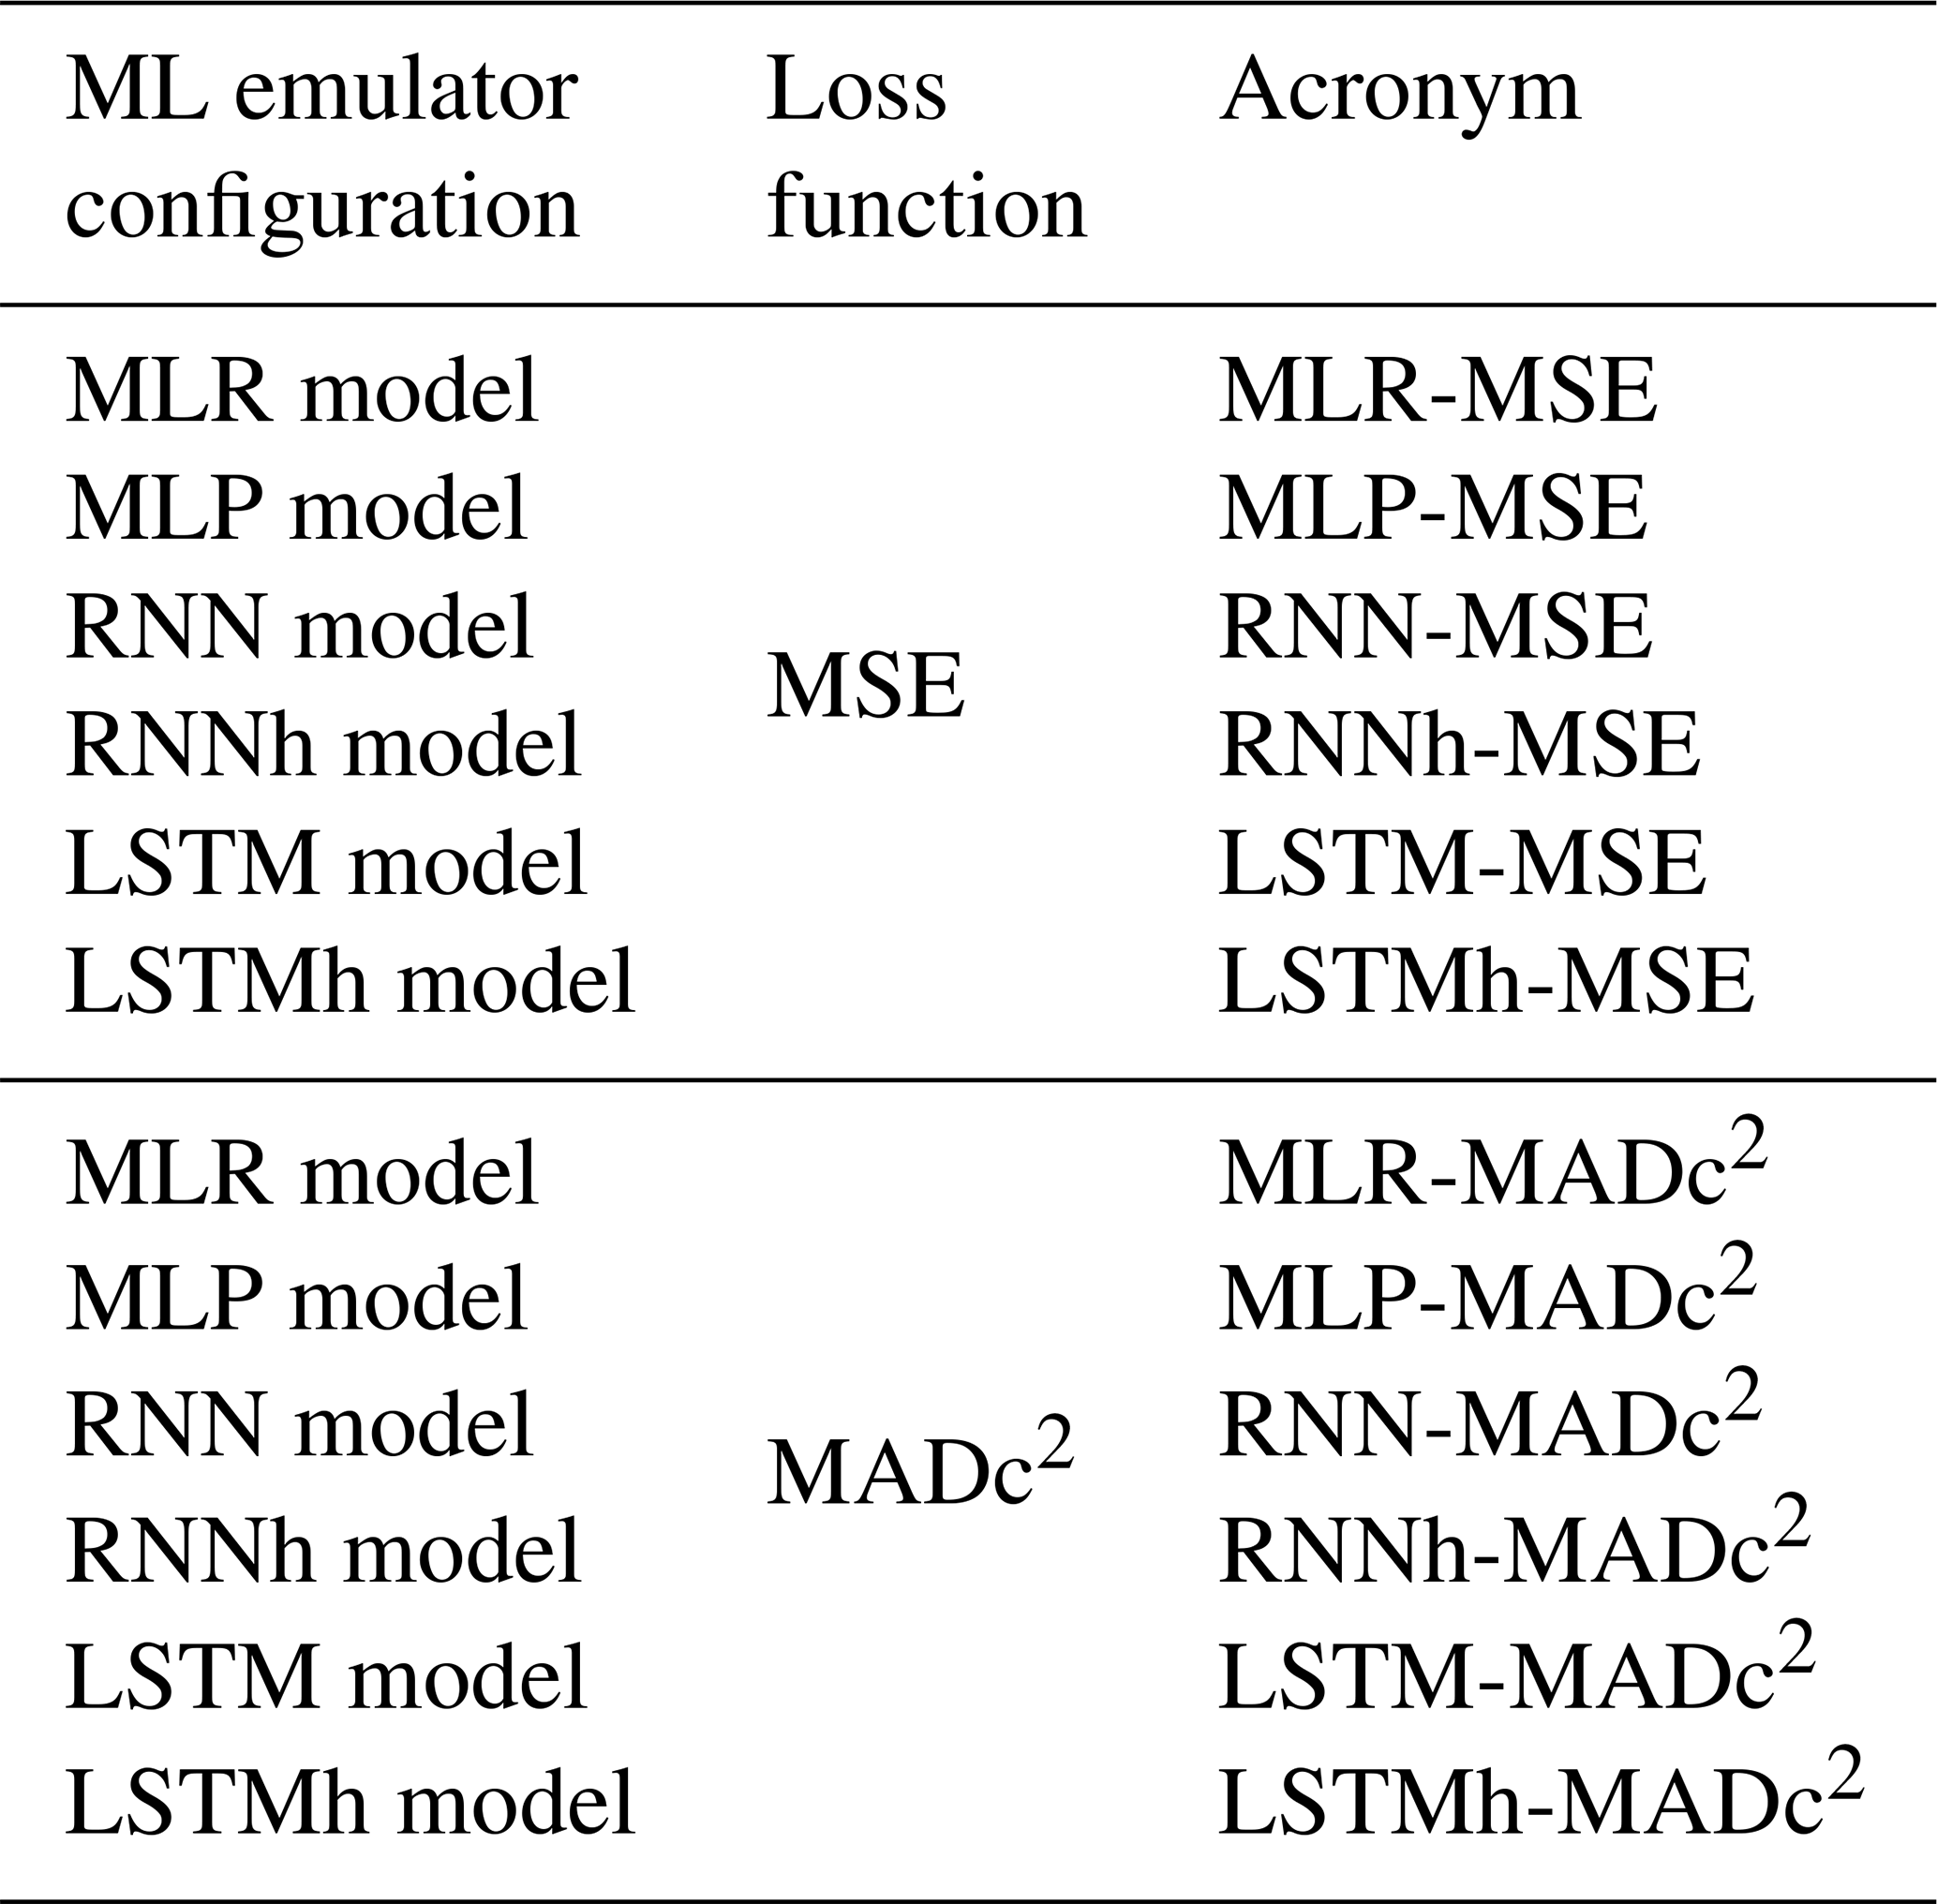
Considering the different emulator configurations and loss functions, a total of 12 ML emulators were implemented (Table 3). It is important to note that separate ML emulators were trained independently for Punta della Salute and Trieste. Although the same classes of basin-scale predictors were considered, predictor extraction, PCA dimensionality reduction, and model training were performed separately for each site. This ensures that each emulator learns a location-specific statistical mapping between large-scale forcing and local surge response.
2.6 Training, validation, and testing
To prepare the data for training and testing the ML emulators, both the predictand and predictors were standardized by subtracting the mean and dividing by the standard deviation, resulting in zero mean and unit variance. This normalization ensures that each predictor contributes equally to the learning process, preventing variables with larger magnitudes from disproportionately influencing model training.
Following the approach of Gholamy et al. (2018), 80 % of the available data (28 years) was allocated for training, while the remaining 20 % (6 years) was evenly split into validation and testing sets (3 years each). The specific years assigned to each set were as follows: training: 1987–1992 and 1997–2018; validation: 1993, 1994, and 2019; testing: 1995, 1996, and 2020. This temporal partitioning was designed to ensure that the distributions of observed storm surge values were comparable across sets, particularly between training and testing, in line with the recommendations of Uçar et al. (2020).
Figure S9 illustrates this comparison: Fig. S9a and c show that the training sets for Punta della Salute and Trieste include the highest observed percentiles, ensuring that the models are exposed to extreme events during training. Figure S9b and d demonstrate that the testing sets also sample the upper tail of the distribution, with percentile–percentile relationships closely aligned with those of the training and validation sets. This indicates that the extreme values present in the testing period are representative of the broader distribution and are neither systematically easier nor more difficult than those observed in the remaining record. While the testing period is necessarily limited to three years, the explicit comparison of percentile distributions across subsets provides confidence that the selected split offers a robust and unbiased evaluation of model performance on extreme storm surge events.
Gradient-based training methods introduce randomness into the optimization process, so the final parameter set is not identical across different training runs. For this reason, each ML emulator was trained 40 times, with each run corresponding to a unique random initialization of model weights. The number of repeated runs was selected empirically by progressively increasing the number of realizations and verifying that the distributions of performance metrics stabilized, indicating robust sampling of initialization-induced variability.
For the neural network emulators, each run consisted of 800 training epochs, while the MLR emulator was trained for 10 000 iterations to ensure convergence. These values were determined through preliminary convergence tests, in which training was extended until improvements in validation performance became negligible and performance metrics reached a stable plateau. The combination of multiple runs and sufficiently long training ensures both reproducibility and reliable estimation of emulator skill.
Model selection was based on validation performance, using a validation-based model selection strategy, a widely adopted approach for identifying optimal configurations during training (Bishop, 2006; Goodfellow et al., 2016). Several performance metrics were tested on the validation set, including both general metrics over the entire period and specialized ones computed over storm surge events exceeding the 99th percentile. The 99th percentile was selected as a compromise between focusing on rare, high-impact events and retaining a sufficiently large sample to ensure statistical robustness, allowing us to characterize extreme conditions while avoiding the instability associated with very small sample sizes at higher percentiles (Wahl et al., 2017). Among the tested metrics, the slope of the linear fit between emulator output and observations emerged as the most effective criterion, as it directly quantifies the ability of the models to reproduce the dynamic range and intensity of extreme surges while avoiding systematic over- or underestimation. While recent studies have shown that data-driven models may exhibit reduced skill at even more extreme percentiles (e.g., above the 99.9th percentile), a systematic evaluation at such thresholds is beyond the scope of the present work due to the limited number of events. Nevertheless, the behavior of the models in the upper tail of the distribution is discussed in Sect. 4 (Fig. 12), providing additional qualitative insight into performance under the most extreme conditions.
2.7 Emulator performance evaluation
The ML emulators were evaluated against SHYFEM-MPI over the testing period. Additionally, the trained ML emulators were applied and compared with the Copernicus Sea Physics Analysis and Forecast product (hereinafter Med-Physics, Clementi et al., 2023) for a storm surge event that occurred in November 2022 in the northern Adriatic Sea (Mel et al., 2023). The performance assessment was based on statistical metrics computed from hourly data, considering the entire dataset and surge peaks above the 99th percentile of the predictand's cumulative distribution at each location. The statistical metrics used for evaluation are the following:
-
Slope of linear fit (SLF).
The slope of the linear fit m quantifies the scaling agreement between simulated (S) and observed (O) values. It is obtained by fitting a simple linear regression line to the scatterplot of emulators' output (simulated data) versus observations. A slope close to 1 indicates that the model accurately reproduces the magnitude and dynamic range of the target variable, while deviations from 1 reflect systematic over- or underestimation of variability.
-
Pearson correlation (Corr).
The Pearson correlation coefficient (ρ) quantifies the degree of linear dependence between simulated and observed data, with values closer to 1 indicating stronger agreement and better model performance. In the formula, μS and μO are the simulated and observed means, while σS and σO correspond to their standard deviations.
-
Root-Mean Squared Error (RMSE).
The Root Mean Squared Error (RMSE) measures the average magnitude of the errors between simulated and observed values. It is defined as the square root of the mean of the squared differences between simulations and observations. A value closer to zero indicates a better performance.
-
Bias.
Bias quantifies the systematic error (the mean difference) between simulated and observed values. Scores near 0 reflect minimal bias; positive values indicate overestimation, negative values underestimation. In the formula, and yare the mean simulated and observed series. Since both datasets were detrended and mean-centered, bias was computed only for storm-surge peaks exceeding the 99th percentile, where residual offsets matter most.
-
Mean Absolute Deviation (MAD).
The Mean Absolute Deviation (MAD) measures the average absolute difference between simulated and observed values. It reflects overall prediction accuracy and is less sensitive to outliers than RMSE. A value closer to 0 indicates a better performance.
-
MAD of the percentiles (MADp) (Campos-Caba et al., 2024).
MADp measures the average absolute error between simulated and observed values across percentiles of the observed distribution. It quantifies how well a model reproduces the empirical distribution of the target variable. A value closer to 0 indicates a better performance.
-
Corrected MAD (MADc) (Campos-Caba et al., 2024).
MADc is a composite error metric combining the mean absolute deviation (MAD) with its percentile-based version (MADp). It captures both overall magnitude errors and differences in the distribution of values, making it robust to phase shifts and effective for evaluating extremes. A value closer to 0 indicates a better performance.
As noted earlier, each emulator architecture was trained 40 times using different random initializations. Performance metrics were computed separately for each run and location, and subsequently averaged across Punta della Salute and Trieste, yielding one set of values per run. Violin plots in Sect. 3 display the full distribution of these 40 realizations. For diagnostic analyses, scatter plots, cumulative distribution comparisons, and case studies (Sect. 3.3 and 3.4), a single run was selected based on the validation-based slope criterion described in Sect. 2.6, i.e., the run with slope closest to 1. This ensures consistency between model selection and detailed performance assessment. Analyses were conducted on both the full dataset and on surge peaks above the 99th percentile of the predictand distribution. The full dataset was assessed using RMSE, MADp, and MADc, while surge peaks were evaluated with bias, MADp, and MADc.
To further evaluate emulator performance relative to the SHYFEM-MPI baseline, we employed a paired bootstrap procedure to quantify the statistical significance of differences in key error metrics (bias, MADp, and MADc). The bootstrap analysis was applied to surge peaks above the 99th percentile, using 10 000 resampling iterations and a significance level of 0.05. This approach provides 95 % confidence intervals for the differences in metrics, allowing assessment of whether emulator errors systematically diverge from those of SHYFEM-MPI.
Complementing the bootstrap analysis, a one-sample t test was performed on the vector of metric differences between the emulator and SHYFEM-MPI across all runs. The null hypothesis assumes that the mean difference is zero, corresponding to no systematic performance gain or loss. The test was applied at a significance level of 0.05, with negative mean differences indicating improved emulator performance and positive mean differences indicating deterioration relative to SHYFEM-MPI.
3.1 Performance evaluation on the full time series
The RMSE distributions across the 40 training experiments indicate that emulators trained with the MSE loss generally achieve lower RMSE values than their MADc2-trained counterparts in the testing set (Fig. 2a). Among them, the MLR-MSE emulator ranks as the top performer in terms of RMSE. While several MADc2-based emulators also surpass the SHYFEM-MPI benchmark on this metric, their distributions tend to be broader, reflecting increased variability across runs.
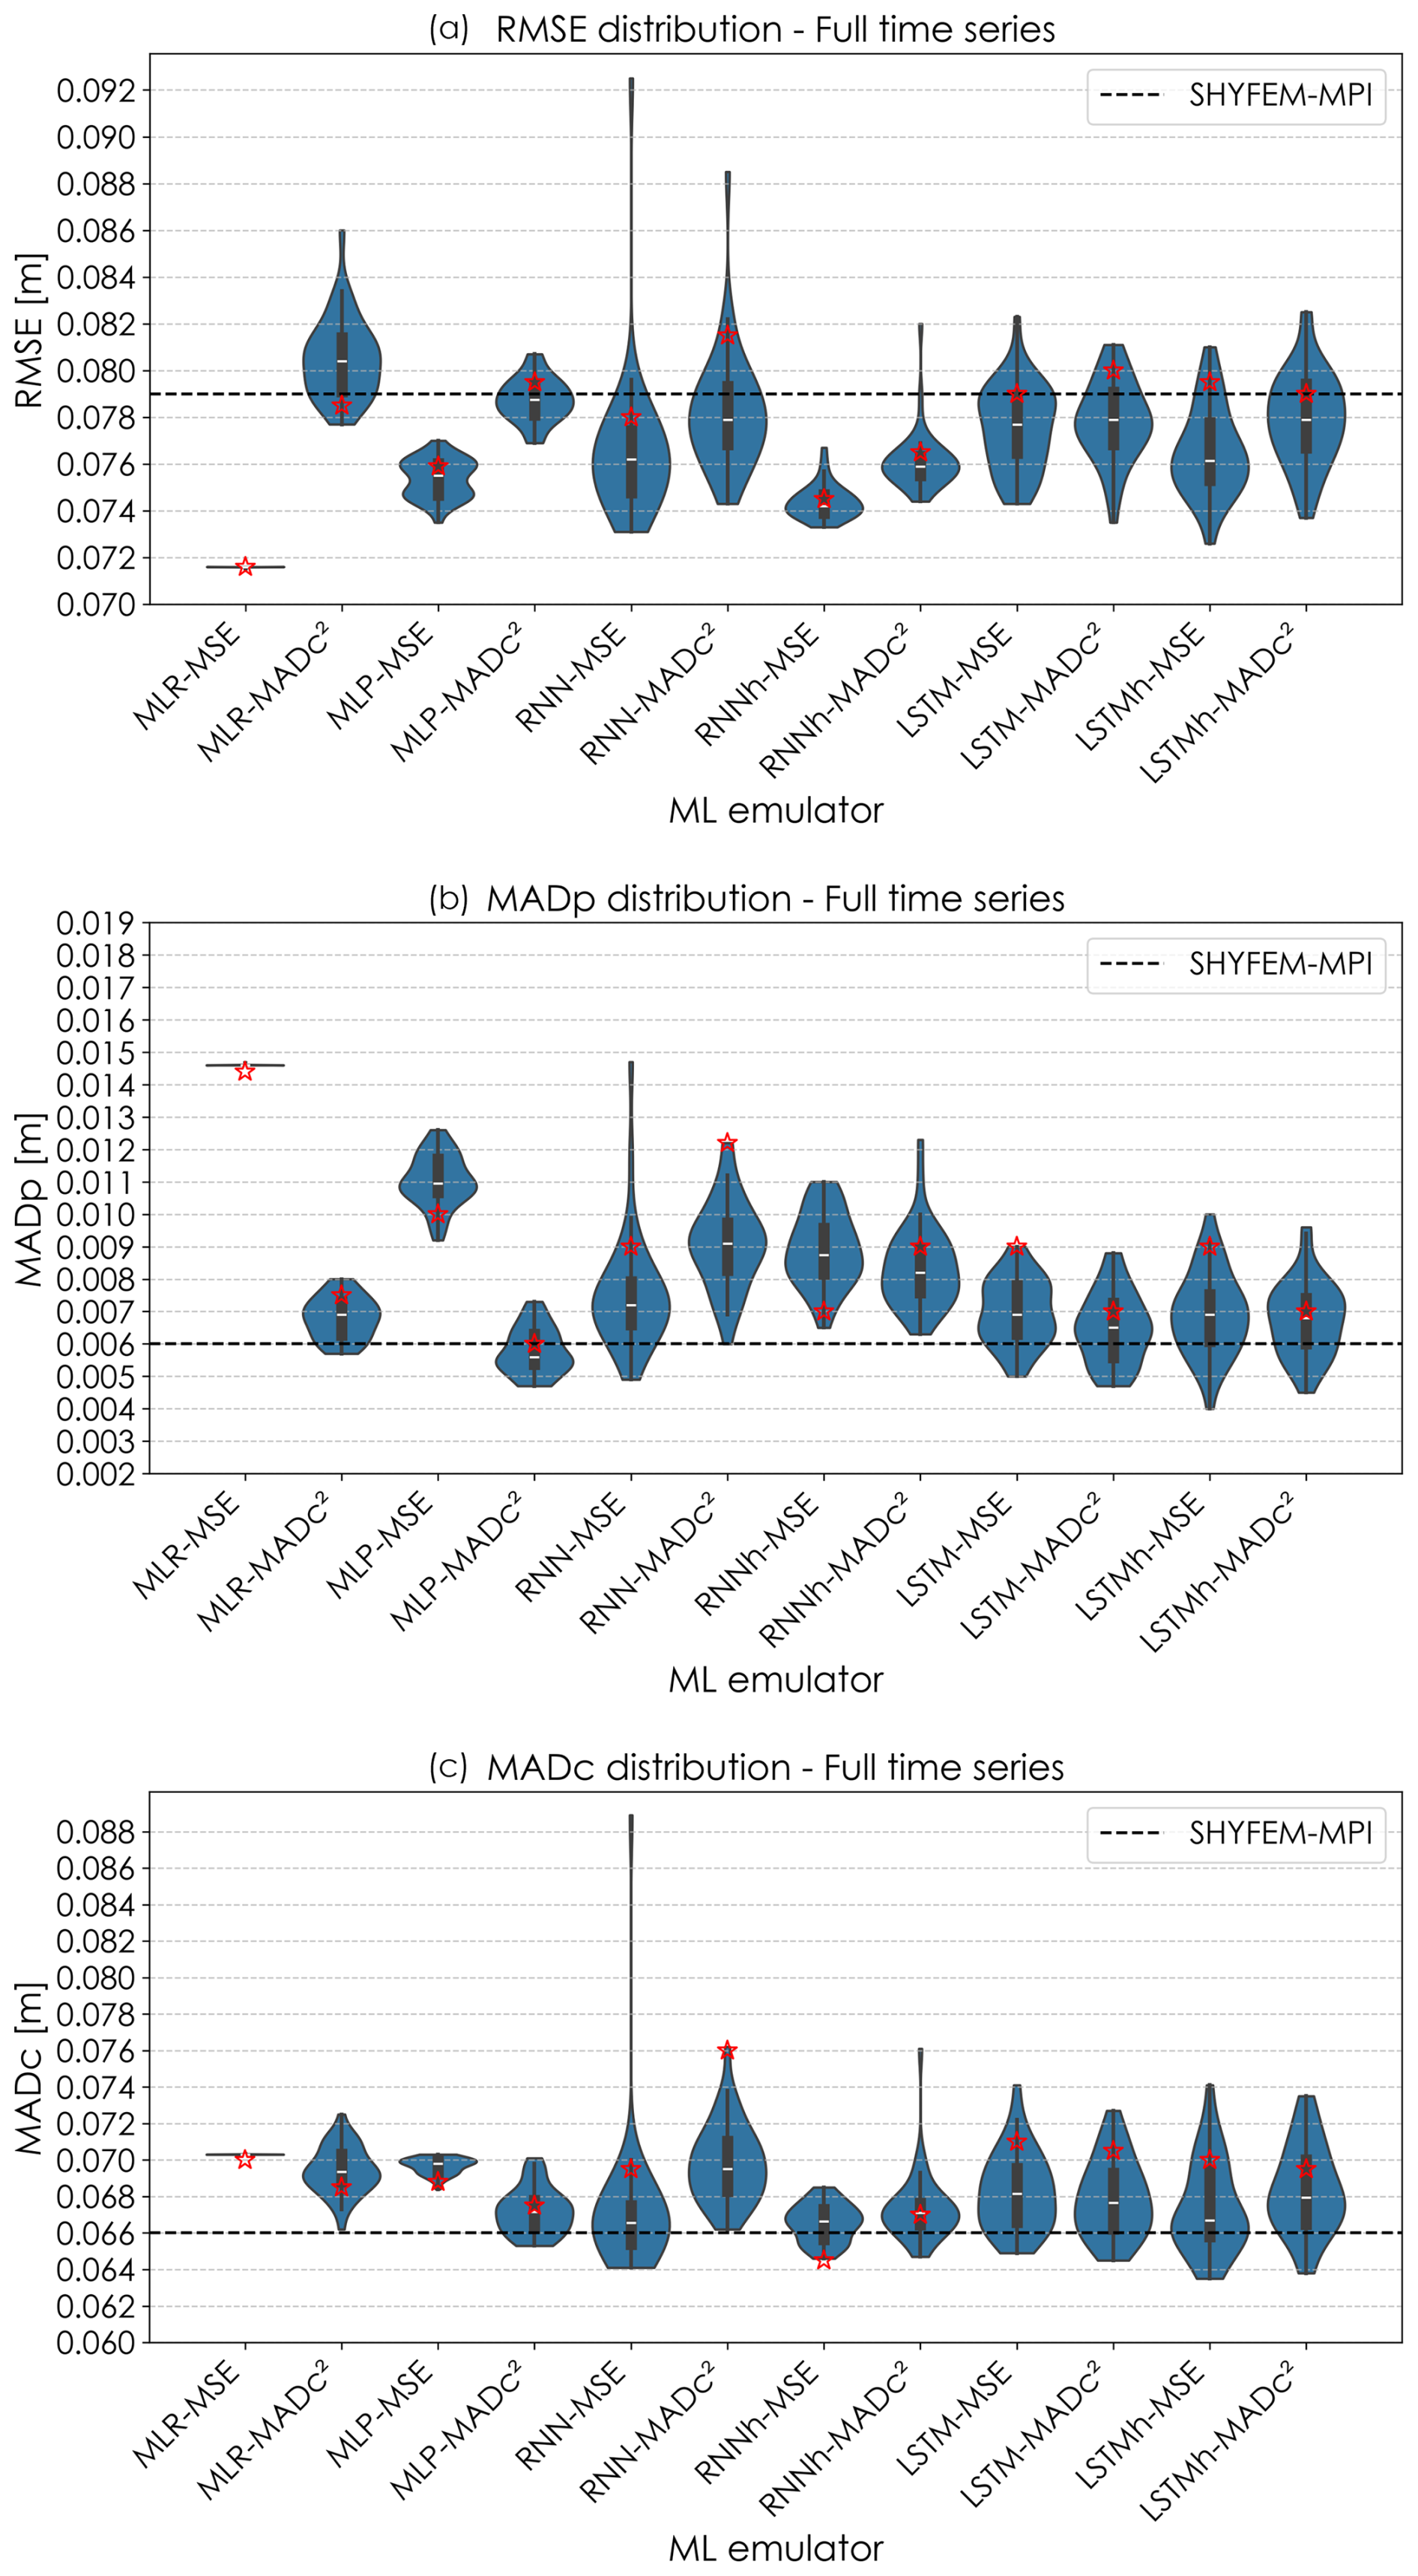
Figure 2Violin plots of (a) RMSE, (b) MADp, and (c) MADc, averaged across locations for the 40 training runs. Each violin shows the distribution of metric values across runs for a given emulator. The white dot indicates the median, the thick black bar shows the interquartile range, and red stars denote the scores of the selected run (chosen based on the slope criterion). The black dashed line corresponds to the performance of SHYFEM-MPI.
Regarding MADp, the effect of the MADc2 loss depends on the emulator architecture (Fig. 2b). The clearest improvements are observed for the MLR and MLP emulators, whose MADp distributions shift toward lower values relative to their MSE-trained counterparts and below the SHYFEM-MPI benchmark. In contrast, recurrent architectures show smaller and less systematic differences between loss functions, with substantial overlap between the corresponding distributions.
For MADc, the MLR-MADc2 and MLP-MADc2 emulators again exhibit the clearest improvements relative to their MSE-trained counterparts (Fig. 2c). For recurrent architectures, however, the effect of MADc2 is less pronounced, with only slight improvements observed for the selected LSTM-based runs (red stars). Overall, these results indicate that the impact of MADc2 on full time-series performance is architecture-dependent, improving percentile-based metrics for some emulators while providing more limited benefits for others.
The increased variability observed in MADc2-trained emulators, particularly for recurrent architectures (Fig. 2c), likely reflects the multi-objective nature of the loss function. By jointly penalizing pointwise deviations and discrepancies in the distributional structure, MADc2 introduces a more complex optimization landscape in which different parameter configurations can achieve comparable loss values through different trade-offs between components. This can increase sensitivity to initialization and training dynamics, especially in recurrent models, leading to a broader spread of outcomes. Conversely, the MSE loss defines a single quadratic objective, which tends to produce more stable solutions but does not explicitly enforce agreement in the distributional characteristics of the target signal.
3.2 Performance evaluation on the peaks above the 99th percentile
Focusing on surge peaks above the 99th percentile, the skill distributions across the 40 training experiments in the testing set reveal a strong dependence on both the loss function and the emulator architecture (Fig. 3). Overall, emulators trained with the MADc2 loss function generally achieve improved performance relative to their MSE-trained counterparts in terms of bias, MADp, and MADc, although the magnitude of the improvement varies across architectures.
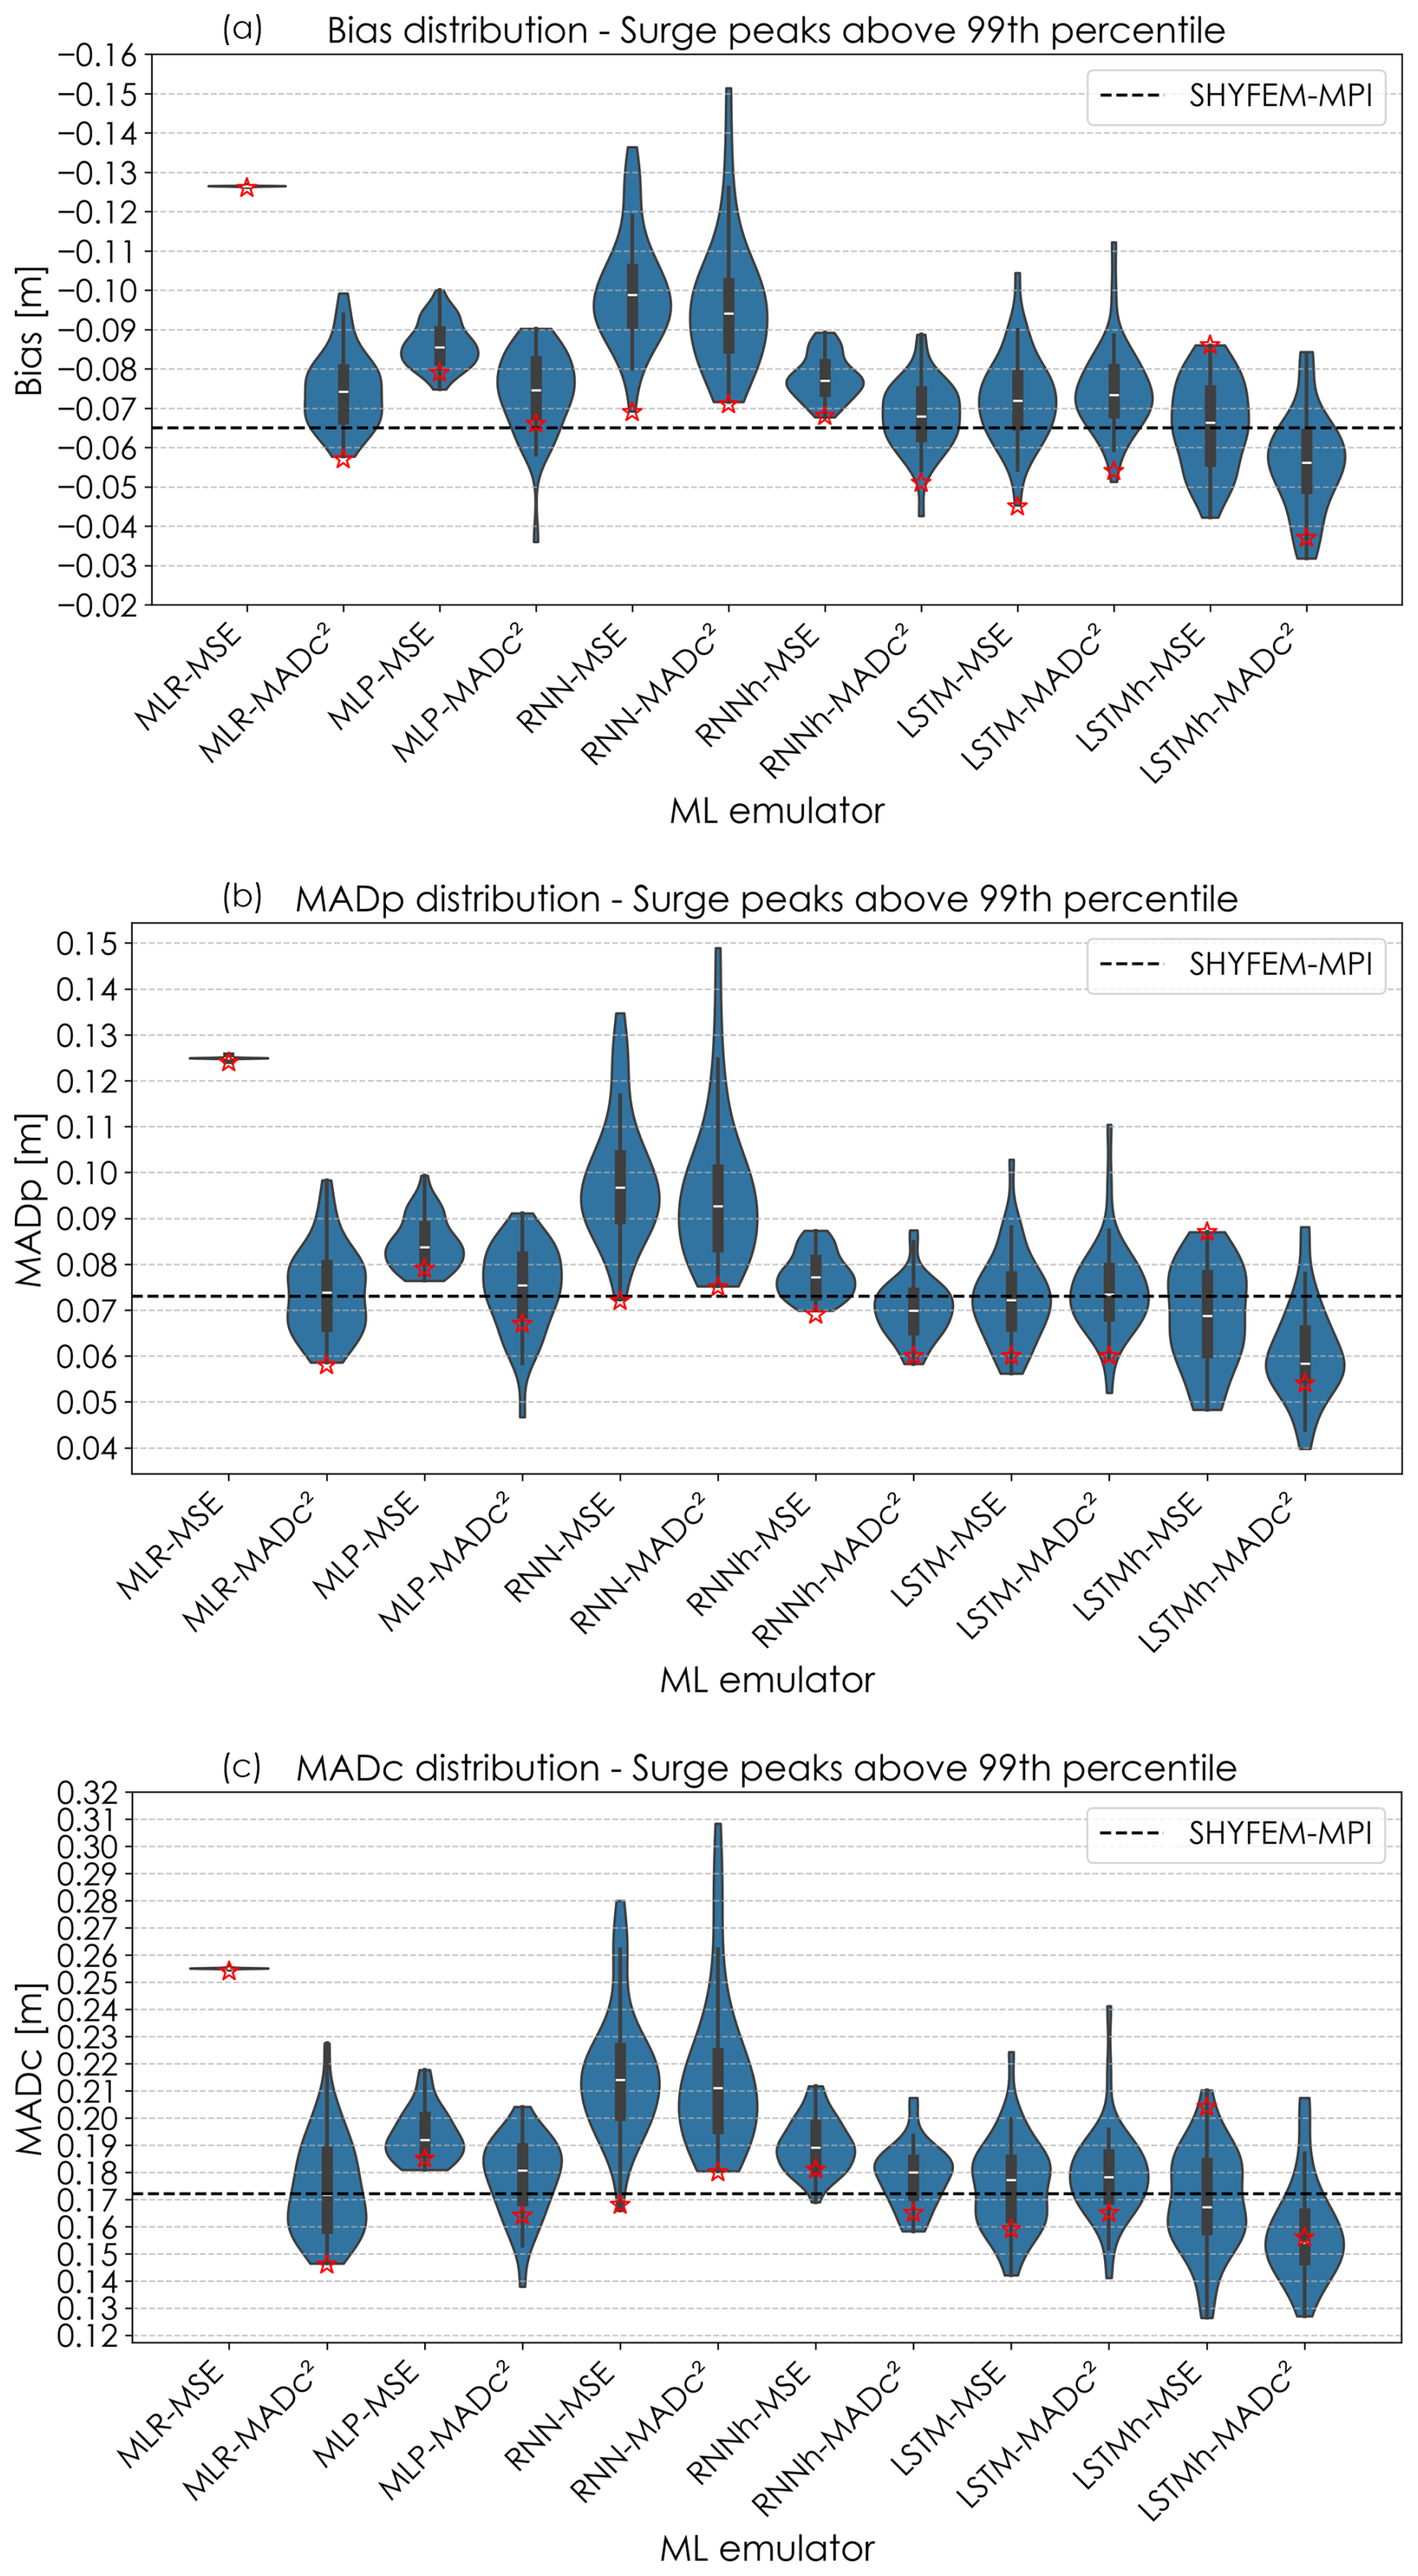
Figure 3Violin plots of (a) Bias, (b) MADp, and (c) MADc, averaged across locations for the 40 training runs, for the surge peaks above the 99th percentile. Each violin shows the distribution of metric values across runs for a given emulator. The white dot indicates the median, the thick black bar shows the interquartile range, and red stars denote the scores of the selected run (chosen based on the slope criterion). The black dashed line corresponds to the performance of SHYFEM-MPI.
The clearest improvements are observed for the MLR-MADc2 emulator, whose distributions shift markedly toward lower errors and consistently outperform both MLR-MSE and the SHYFEM-MPI benchmark across the three metrics. The MLP-MADc2 and LSTMh-MADc2 emulators also show noticeable improvements relative to their MSE-trained counterparts, particularly for MADp and MADc. In contrast, recurrent architectures such as RNN and RNNh exhibit more variable behaviour, with substantial overlap between the MSE- and MADc2-trained distributions.
Notably, MLR-MSE, despite achieving the best RMSE performance for the full time series, remains among the weakest-performing configurations for extreme surge events. These results highlight the trade-off between minimizing global errors and accurately reproducing the statistical structure of extremes, and indicate that the MADc2 loss function is generally more effective in enhancing the representation of high-impact surge events.
Figure 4 shows the mean percentage change in performance for surge peaks above the 99th percentile when using the MADc2 loss instead of MSE, based on the selected runs. The MLR emulator exhibits the most pronounced and consistent improvements across nearly all metrics, particularly for bias, MADp, and MADc, where error reductions exceed 40 %–50 %. These gains indicate a substantial enhancement in the representation of the distributional structure and magnitude of extreme surge events when training with MADc2. The MLP emulator also benefits from the MADc2 loss, showing moderate but systematic improvements across most metrics, especially for bias-related and percentile-based measures.
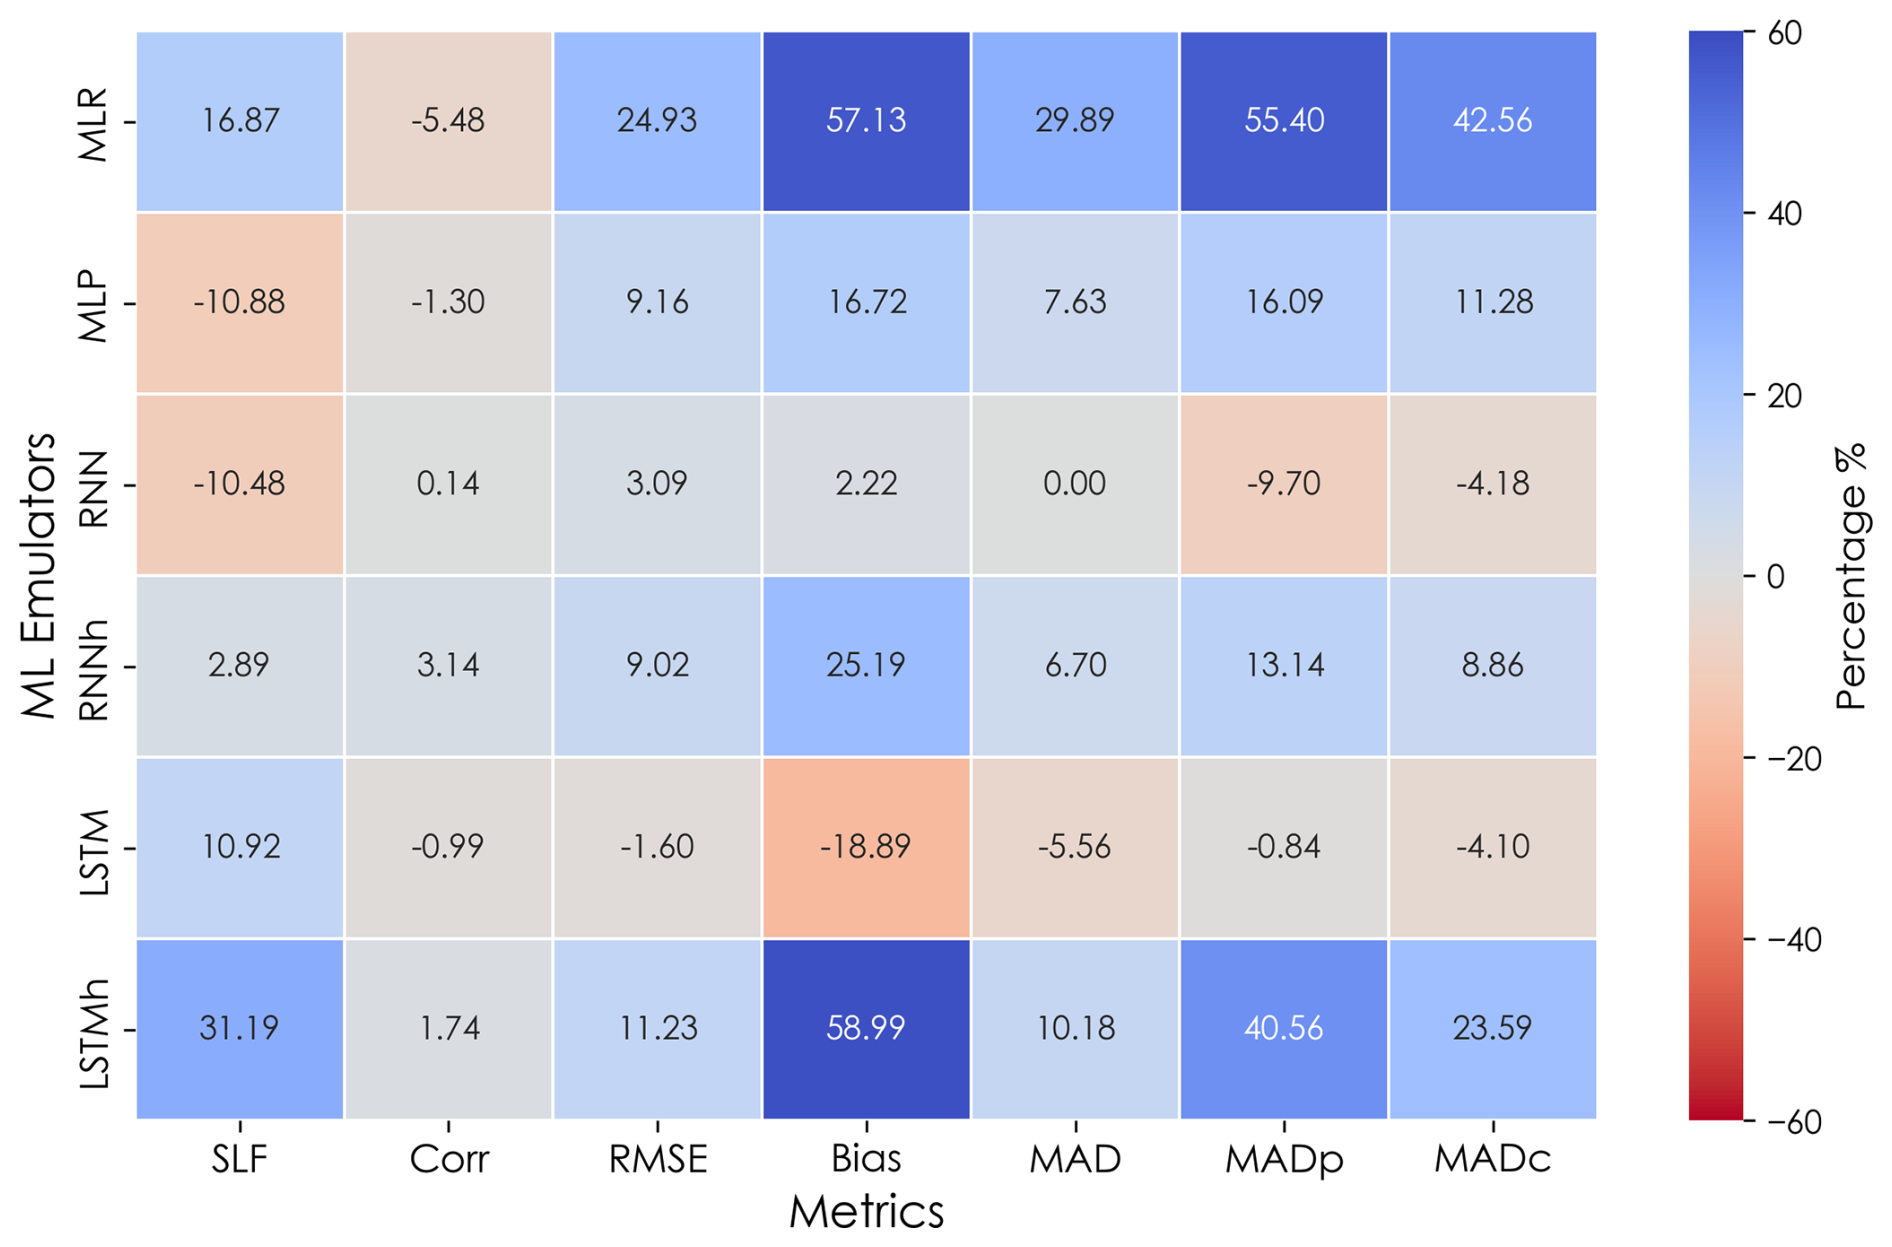
Figure 4Mean percentage deviation in performance metrics for surge peaks above the 99th percentile for the selected runs when using the MADc2 loss function instead of MSE for training. Deviation is computed as . Positive values (blue colors) indicate an improvement in performance, while negative values (warm colors) indicate a decline.
Among recurrent architectures, the response to MADc2 training is more variable. The RNNh and LSTMh emulators show consistent positive changes across most metrics, with particularly noticeable improvements in bias, MADp, and MADc for LSTMh. In contrast, the standard RNN emulator exhibits only limited gains and slight degradations in some distribution-based metrics, indicating a less stable optimization behaviour. The standard LSTM emulator presents a mixed response, with improvements in SLF but small degradations in RMSE, MAD, and bias.
T-test comparisons of emulator versus SHYFEM-MPI performance (Fig. 5) further highlight the impact of the MADc2 loss function on the representation of extreme surge peaks. In the figure, negative values indicate better performance of the ML emulators relative to SHYFEM-MPI. For the MLR emulator, training with MADc2 substantially improves the performance relative to MLR-MSE. While MLR-MSE shows statistically significant positive differences for MADp and MADc, indicating worse performance than SHYFEM-MPI, the MLR-MADc2 emulator reduces these differences considerably, bringing the mean values close to zero and removing the statistical significance of the discrepancies. This indicates a clear improvement in the representation of extreme surge behaviour when using MADc2 training.
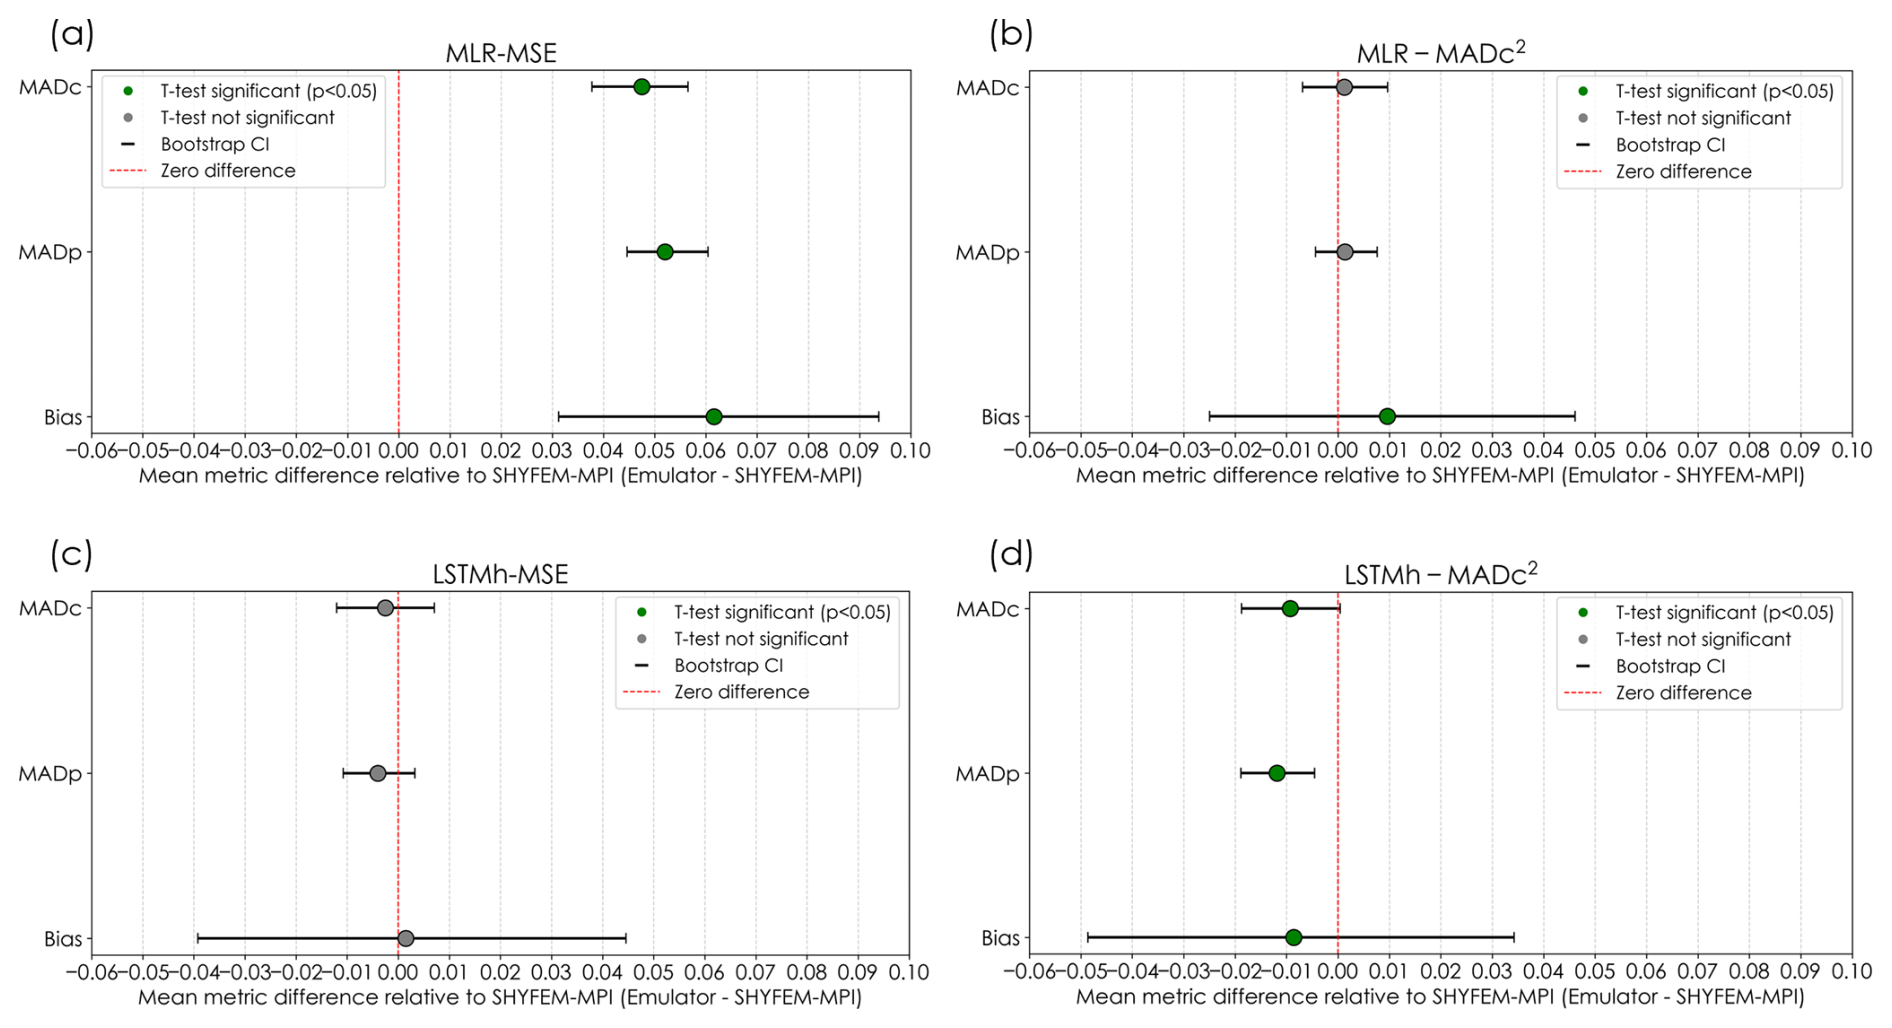
Figure 5Paired t-test results of emulator performance relative to SHYFEM-MPI for surge peaks above 99th percentile, averaged across locations. Metrics shown are bias, MADp, and MADc. Circles indicate mean differences; error bars show 95 % confidence intervals. Green markers denote statistically significant improvements (p < 0.05), while gray markers indicate no significance. (a, c) MSE-trained emulators; (b, d) MADc2-trained emulators.
For the LSTMh emulator, the differences between loss functions are more moderate. LSTMh-MSE already performs comparably to SHYFEM-MPI, with mean differences close to zero and no statistically significant deviations. Nevertheless, the MADc2-trained version shows slight additional improvements, particularly for MADp, where the emulator exhibits significantly lower errors than the benchmark. Bias and MADc also shift toward more favourable values under MADc2 training, indicating a modest but consistent enhancement in the representation of extreme surge behaviour.
3.3 Performance evaluation at selected peaks
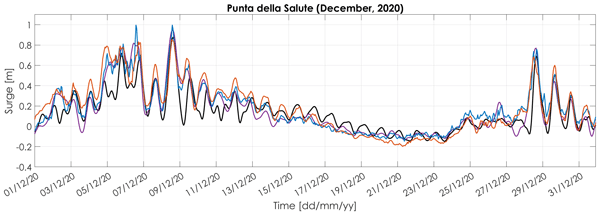
To further assess emulator performance under real-world conditions, we examined two high-impact periods from the testing set: November 1996 and December 2020, both marked by intense surge activity (Fig. 6). These case studies reveal how the selected emulators (MLR-MADc2 and LSTMh-MADc2) respond to complex surge dynamics, highlighting not only their capabilities but also specific limitations, for example, a tendency to reproduce dominant peaks more reliably than secondary structures, and site-dependent variability in amplitude reconstruction.
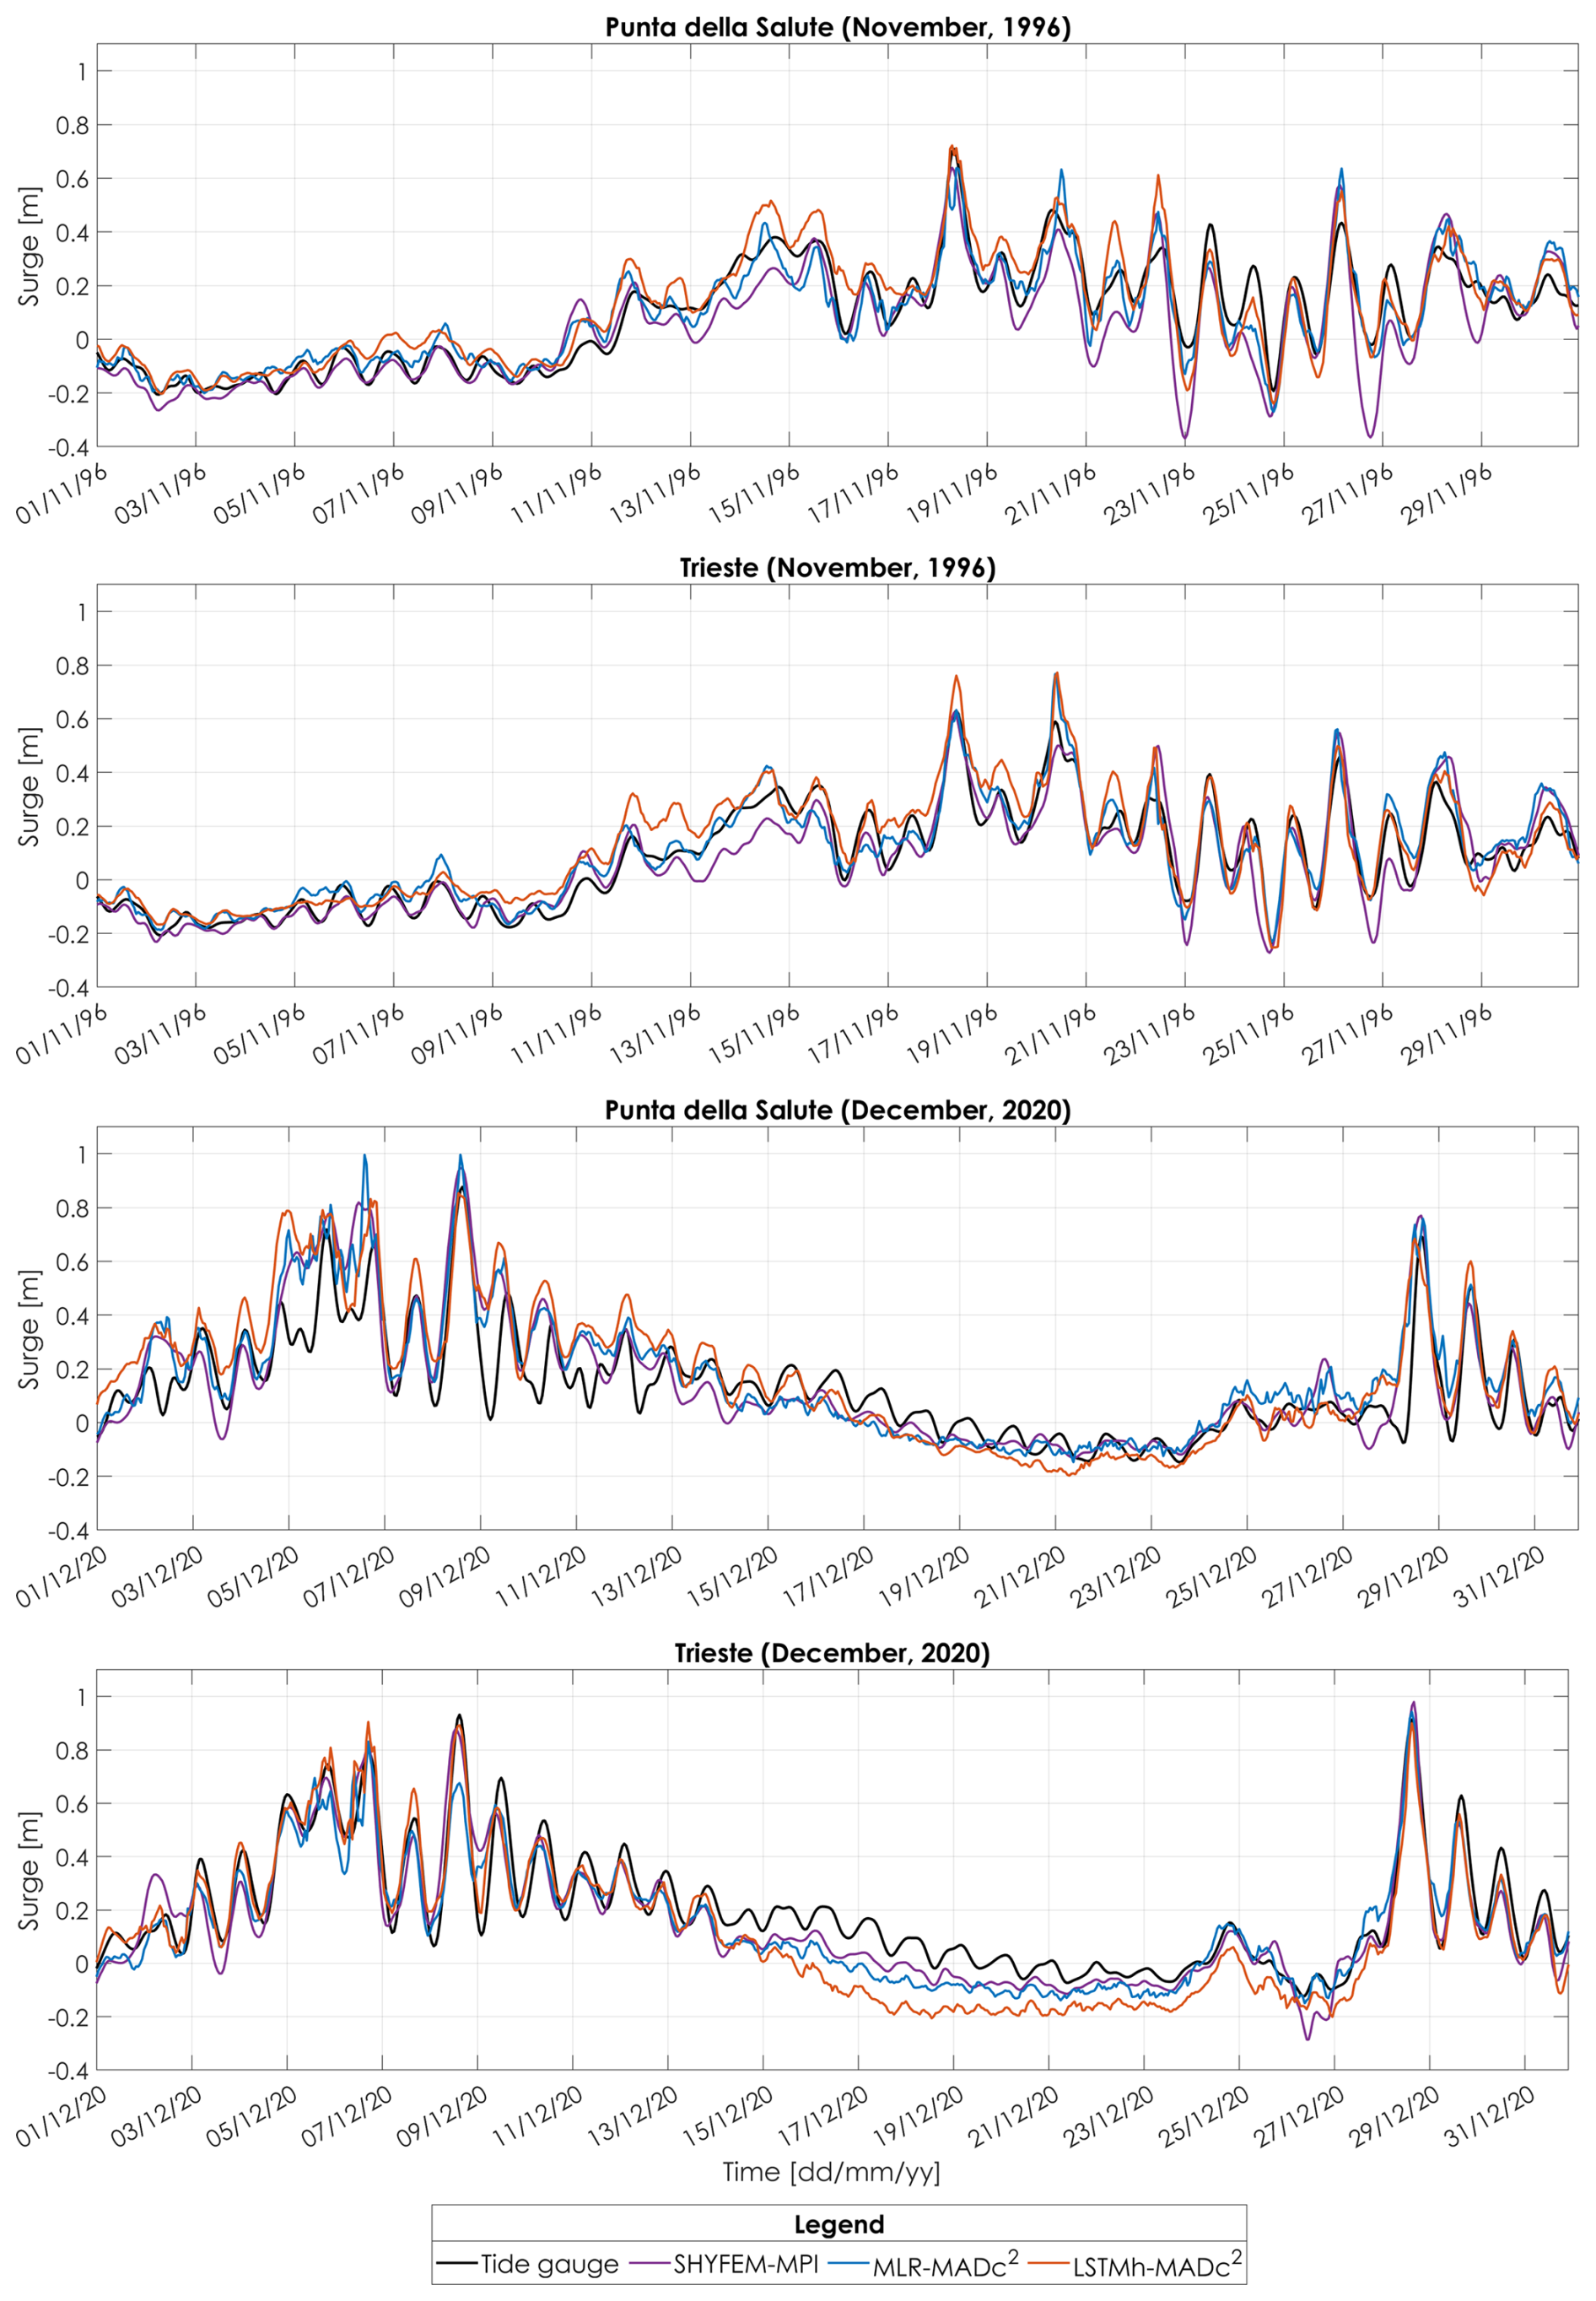
Figure 6Storm surge time-series for November 1996 and December 2020 in Punta della Salute and Trieste for observations, SHYFEM-MPI, and ML emulators MLR-MADc2 and LSTMh-MADc2.
During 18 November 1996, event the MLR-MADc2 emulator accurately captures the surge amplitude at both locations, demonstrating that even a simple linear architecture can perform effectively on extremes when paired with a suitable loss function. The LSTMh-MADc2 emulator also performs well at both locations, with overestimation of the main peak in Trieste. Nevertheless, both emulators align more closely with observations than the SHYFEM-MPI simulation, not only at the peak but also throughout the buildup and decay phases, indicating improved phase coherence and temporal fidelity.
The December 2020 sequence, which includes two major surge peaks (around 8 and 28 December), represents a more challenging case. During the first peak at Punta della Salute, both SHYFEM-MPI and MLR-MADc2 slightly overestimate the observed surge, while LSTMh-MADc2 provides the closest reconstruction of the peak magnitude. At Trieste, LSTMh-MADc2 again reproduces the peak most accurately, whereas SHYFEM-MPI slightly underestimates the surge and MLR-MADc2 exhibits a more pronounced underestimation.
For the second peak at the end of December, SHYFEM-MPI and MLR-MADc2 again overestimate surge levels at Punta della Salute, while LSTMh-MADc2 better captures the peak magnitude, although with a slight timing offset. At Trieste, both emulators reproduce the peak magnitude well, whereas SHYFEM-MPI slightly overestimates the event. Overall, these results indicate that the MADc2-trained emulators are capable of reproducing the temporal evolution and magnitude of complex surge events, although their performance remains sensitive to local dynamics, event characteristics, and emulator architecture.
3.4 Application of the emulators to November 2022
To evaluate the generalization capability of the emulators beyond the training and testing period, we examined their performance during the November 2022 surge event, comparing them against both observed data (from the Punta della Salute station and from the CNR platform) and Med-Physics. This case offers a useful benchmark for assessing emulator behavior under unseen conditions, but it also highlights an important limitation: the MoSE flood barriers, operational since 2020, significantly altered surge propagation within the lagoon. Because neither the training data nor the Med-Physics simulations account for these barrier operations, discrepancies between emulator predictions and observations reflect changes in the physical system rather than shortcomings of the models themselves. In this sense, the November 2022 event illustrates both the potential and the boundaries of purely data-driven emulation, showing that while emulators can generalize beyond their training period, their predictive skill is constrained when external interventions fundamentally reshape hydrodynamics.
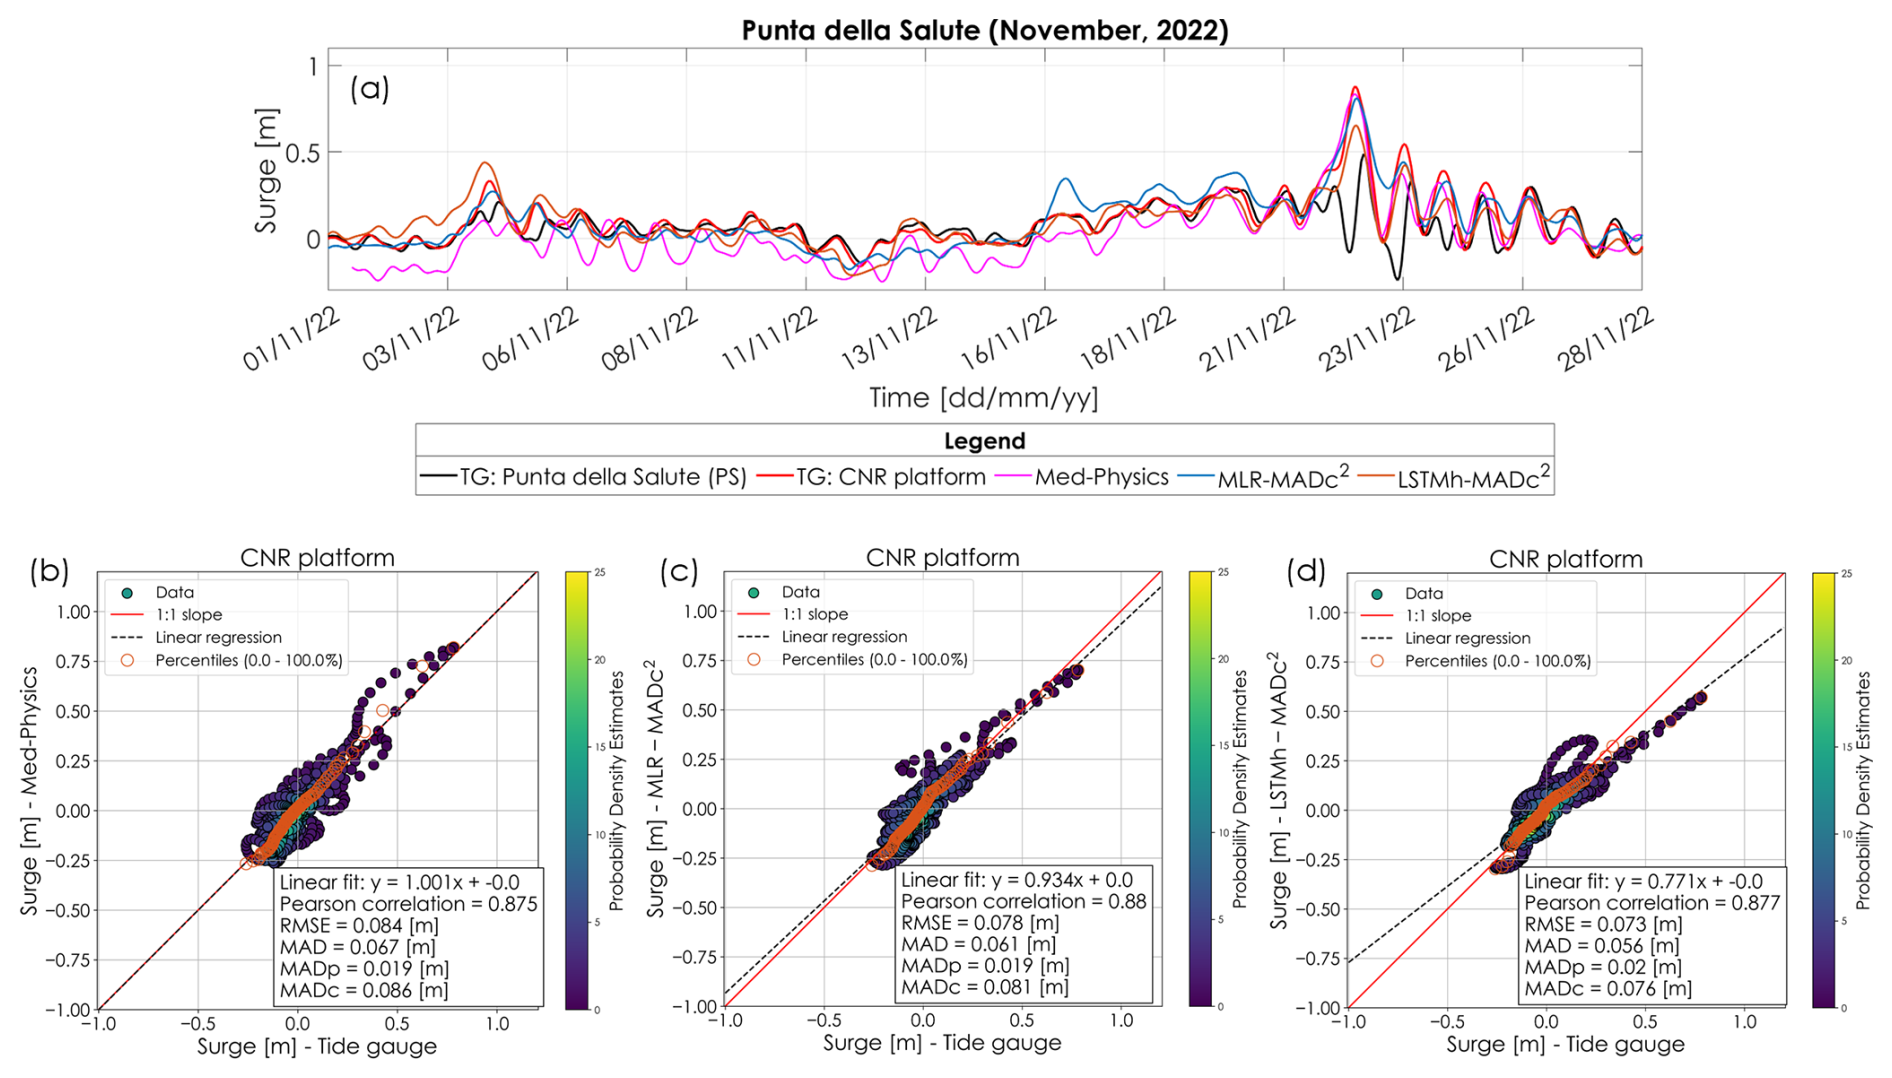
Figure 7Emulator results for November 2022 at Punta della Salute. (a) Time series of observed and predicted storm surges; (b–d) Scatter plots comparing observed values (at the CNR platform) with reconstruction from: (b) Med-Physics model, (c) MLR-MADc2 trained on PS, and (d) LSTMh-MADc2 model trained on PS.
At Punta della Salute, both emulators, MLR-MADc2 and LSTMh-MADc2, closely track the timing and shape of the observed surge, outperforming Med-Physics in overall alignment (Fig. 7a). In this location, the LSTMh-MADc2 emulator is the one that most closely matches the observed values at Punta della Salute. The discrepancy in amplitude between model outputs and observed values is due to the activation of the MoSE flood barriers, which dampened the sea levels within the lagoon but are not represented in any of the emulators. Notably, because the emulators were trained on pre-MoSE data, their outputs rather resemble those recorded at the CNR platform, a nearby offshore location unaffected by MoSE, suggesting consistency in their learned representation of surge dynamics. In Trieste, LSTMh-MADc2 provides a more accurate depiction of the magnitude of November 22nd peak, with a slight underestimation and time-offset, while MLR-MADc2 and the Med-Physics simulation overestimate the peak (Fig. 8a).
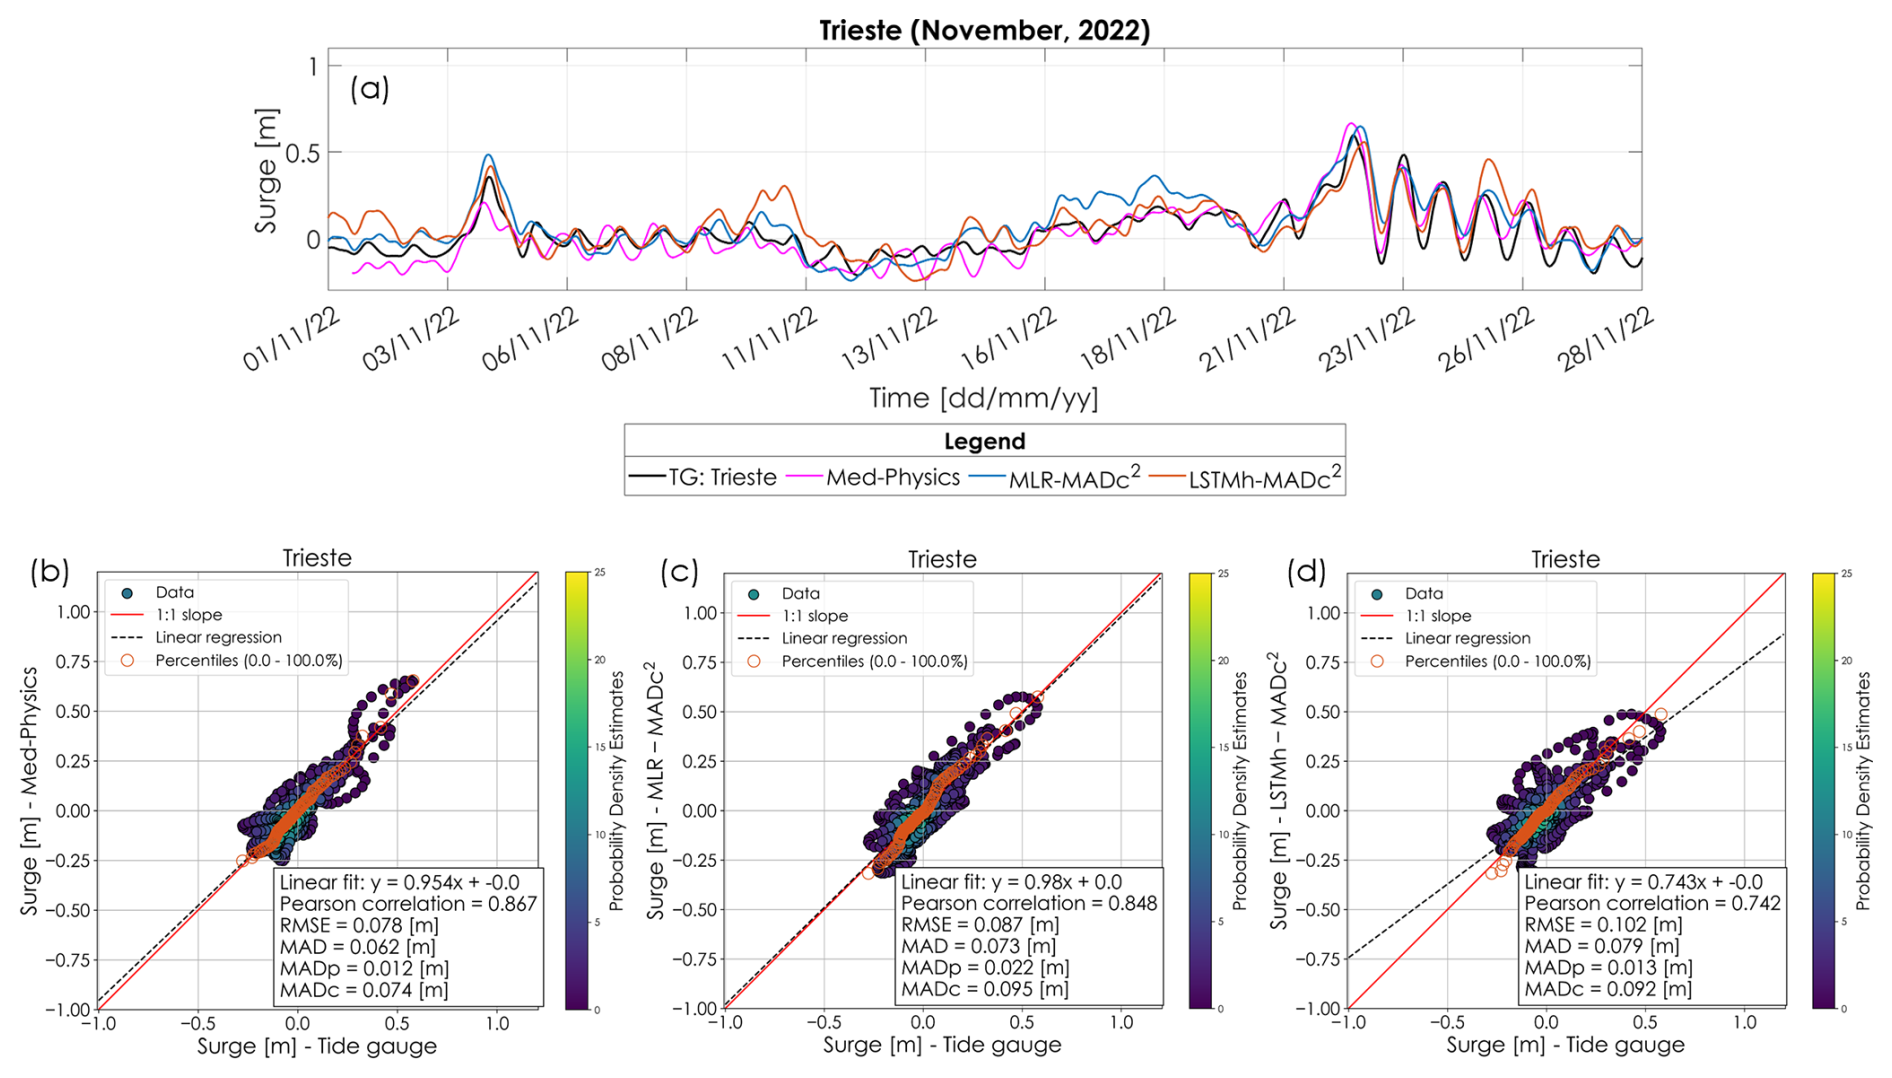
Figure 8Emulator results for November 2022 at Trieste. (a) Time series of observed and predicted storm surges; (b–d) Scatter plots comparing observed values with reconstruction from: (b) Med-Physics model, (c) MLR-MADc2, and (d) LSTMh-MADc2.
The scatter plots for Punta della Salute (Fig. 7b–d) indicate that both emulators outperform Med-Physics at the CNR platform, achieving superior performance in key metrics such as Pearson correlation, RMSE, MAD, and MADc. In Trieste, the emulators achieve performance comparable to that of Med-Physics (Fig. 8b–d), although none of the emulators clearly outperform Med-Physics.
As with any data-driven modeling study, several limitations should be acknowledged. First, the analysis is restricted to two tide-gauge locations in the northern Adriatic Sea, which limits the direct generalization of the results to coastal environments with different dynamical regimes. Second, model evaluation relies on a single temporal split between training, validation, and testing periods rather than a full cross-validation framework, which may introduce sampling dependence despite the representativeness of the extreme events in the testing set. Finally, the emulator configurations considered here represent a specific design choice in terms of predictor representation, model architecture, and operational integration. These aspects influence model behavior and therefore require careful interpretation. The following sections discuss these methodological considerations in more detail and outline directions for future research.
An important methodological choice in this study is the use of basin-scale sea surface height from Med-MFC as a predictor for the ML emulators. While several data-driven storm surge studies rely exclusively on atmospheric forcing, our approach is intentionally framed as statistical downscaling rather than standalone time-series downscaling. By leveraging basin-scale SSH, freely and consistently available through Copernicus services, the emulator refines the large-scale ocean signal to the local coastal response, in direct analogy with the role played by high-resolution dynamical models in traditional downscaling chains. This design choice is not circular, as the emulator does not attempt to reproduce the basin-scale solution, but instead learns the systematic transformations required to resolve local surge dynamics that are unresolved at coarse resolution. At the same time, this choice implies that emulator performance is conditional on the availability and quality of the parent ocean model, a limitation that we explicitly acknowledge.
To further assess the operational independence of the proposed framework, additional experiments were conducted using only atmospheric predictors (mean sea level pressure and wind stress components), excluding basin-scale SSH and tide, while maintaining the same configurations described in Sect. 2.4 and 2.6. These atmospheric-only configurations represent fully standalone forecasting-style emulators. As expected, overall performance metrics degrade relative to SSH-informed models, reflecting the loss of explicit basin-scale ocean state information. Pearson correlation and slope values decrease moderately, and error metrics increase across both locations (Fig. S10). However, the degradation is not drastic, and the atmospheric-only emulators retain substantial skill in reproducing surge variability. Notably, the percentile structure and the scaling of higher surge values remain reasonably well captured, indicating that atmospheric forcing alone contains significant predictive information for extreme events. These results suggest that while basin-scale SSH provides valuable additional skill, particularly for overall variance reproduction, purely atmospheric-driven emulators remain viable alternatives in contexts where ocean model output is unavailable. The comparison highlights a clear trade-off between physical completeness and operational independence.
Another important consideration in this study concerns the use of PCA for reducing the spatial dimensionality of the predictors. While PCA is effective in retaining the components that explain most of the variance, it applies a linear transformation to the input data, which may affect the emulator's ability to capture nonlinear patterns or interactions that are potentially relevant for storm surge dynamics. For this process, the selection of the predictor spatial domain and the number of retained principal components was guided by performance tests conducted with the MLR emulator. This choice was motivated by the computational efficiency and transparency of linear models, which enable rapid exploration of multiple configurations. While this approach provides a consistent and physically interpretable baseline across all architectures, it does not guarantee that the selected domain size or number of PCs is optimal for more complex nonlinear models. In particular, architectures such as LSTMs or hybrid networks may, in principle, benefit from alternative dimensionality-reduction strategies or from retaining a larger number of components. Exploring architecture-specific optimization of the predictor representation represents a natural extension of this work and will be addressed in future studies.
Despite this potential limitation, the use of PCA still provides valuable insights into the relative importance of each predictor. As shown in Figs. S11 and S12, the permutation importance analysis highlights a consistent hierarchy of predictors across both emulators and loss functions. For the full time series (Fig. S11), sea surface height (SSH) emerges as the most influential feature, followed by y component of wind stress (WSy) and the mean sea level pressure (MSLP). When focusing on surge peaks above the 99th percentile (Fig. S12), the dominance of SSH as the leading predictor becomes even more pronounced, with WSy retaining secondary importance. In both the full time series and surge peaks, a few predictors exhibit slightly negative importance values. These should not be interpreted as physically detrimental influences but rather as artifacts of the permutation procedure, arising from resampling variability and finite sample effects when estimating small contributions.
An alternative to PCA is the use of encoding layers, such as those implemented in neural networks by Žust et al. (2021) and Rus et al. (2023a, b), which can automatically learn nonlinear representations and extract higher-order dependencies from the predictors. In principle, such approaches could improve the ability of ML models to represent subtle spatial and temporal structures. In the present study, encoding layers were tested but yielded heavier models without improvements compared to PCA-based reduction. For this reason, PCA was retained as the preferred approach, offering a computationally efficient solution without a loss in predictive skill. Nonetheless, the potential of encoding layers remains promising, and future work could revisit these methods through optimized architectures or hybrid strategies that better balance model complexity and accuracy.
A key contribution of this work is the implementation of the MADc2 loss function, a custom formulation that integrates the Mean Absolute Deviation (MAD) with a percentile-based term (MADp). This hybrid loss rewards both accurate timing of peaks and faithful reproduction of signal amplitude, making it better suited than MSE for learning and reproducing extreme events. The benefit of this formulation is further evidenced by the Probability Integral Transform (PIT) histograms (Fig. 9), shown here for the MLR emulators. For each time step, the PIT value corresponds to the cumulative probability of the observed surge under the empirical distribution of emulator predictions. In practice, this is computed as the percentile position of the observed value within the distribution defined by the emulator outputs. The x axis of Fig. 9 therefore represents these PIT values, which range between 0 and 1.
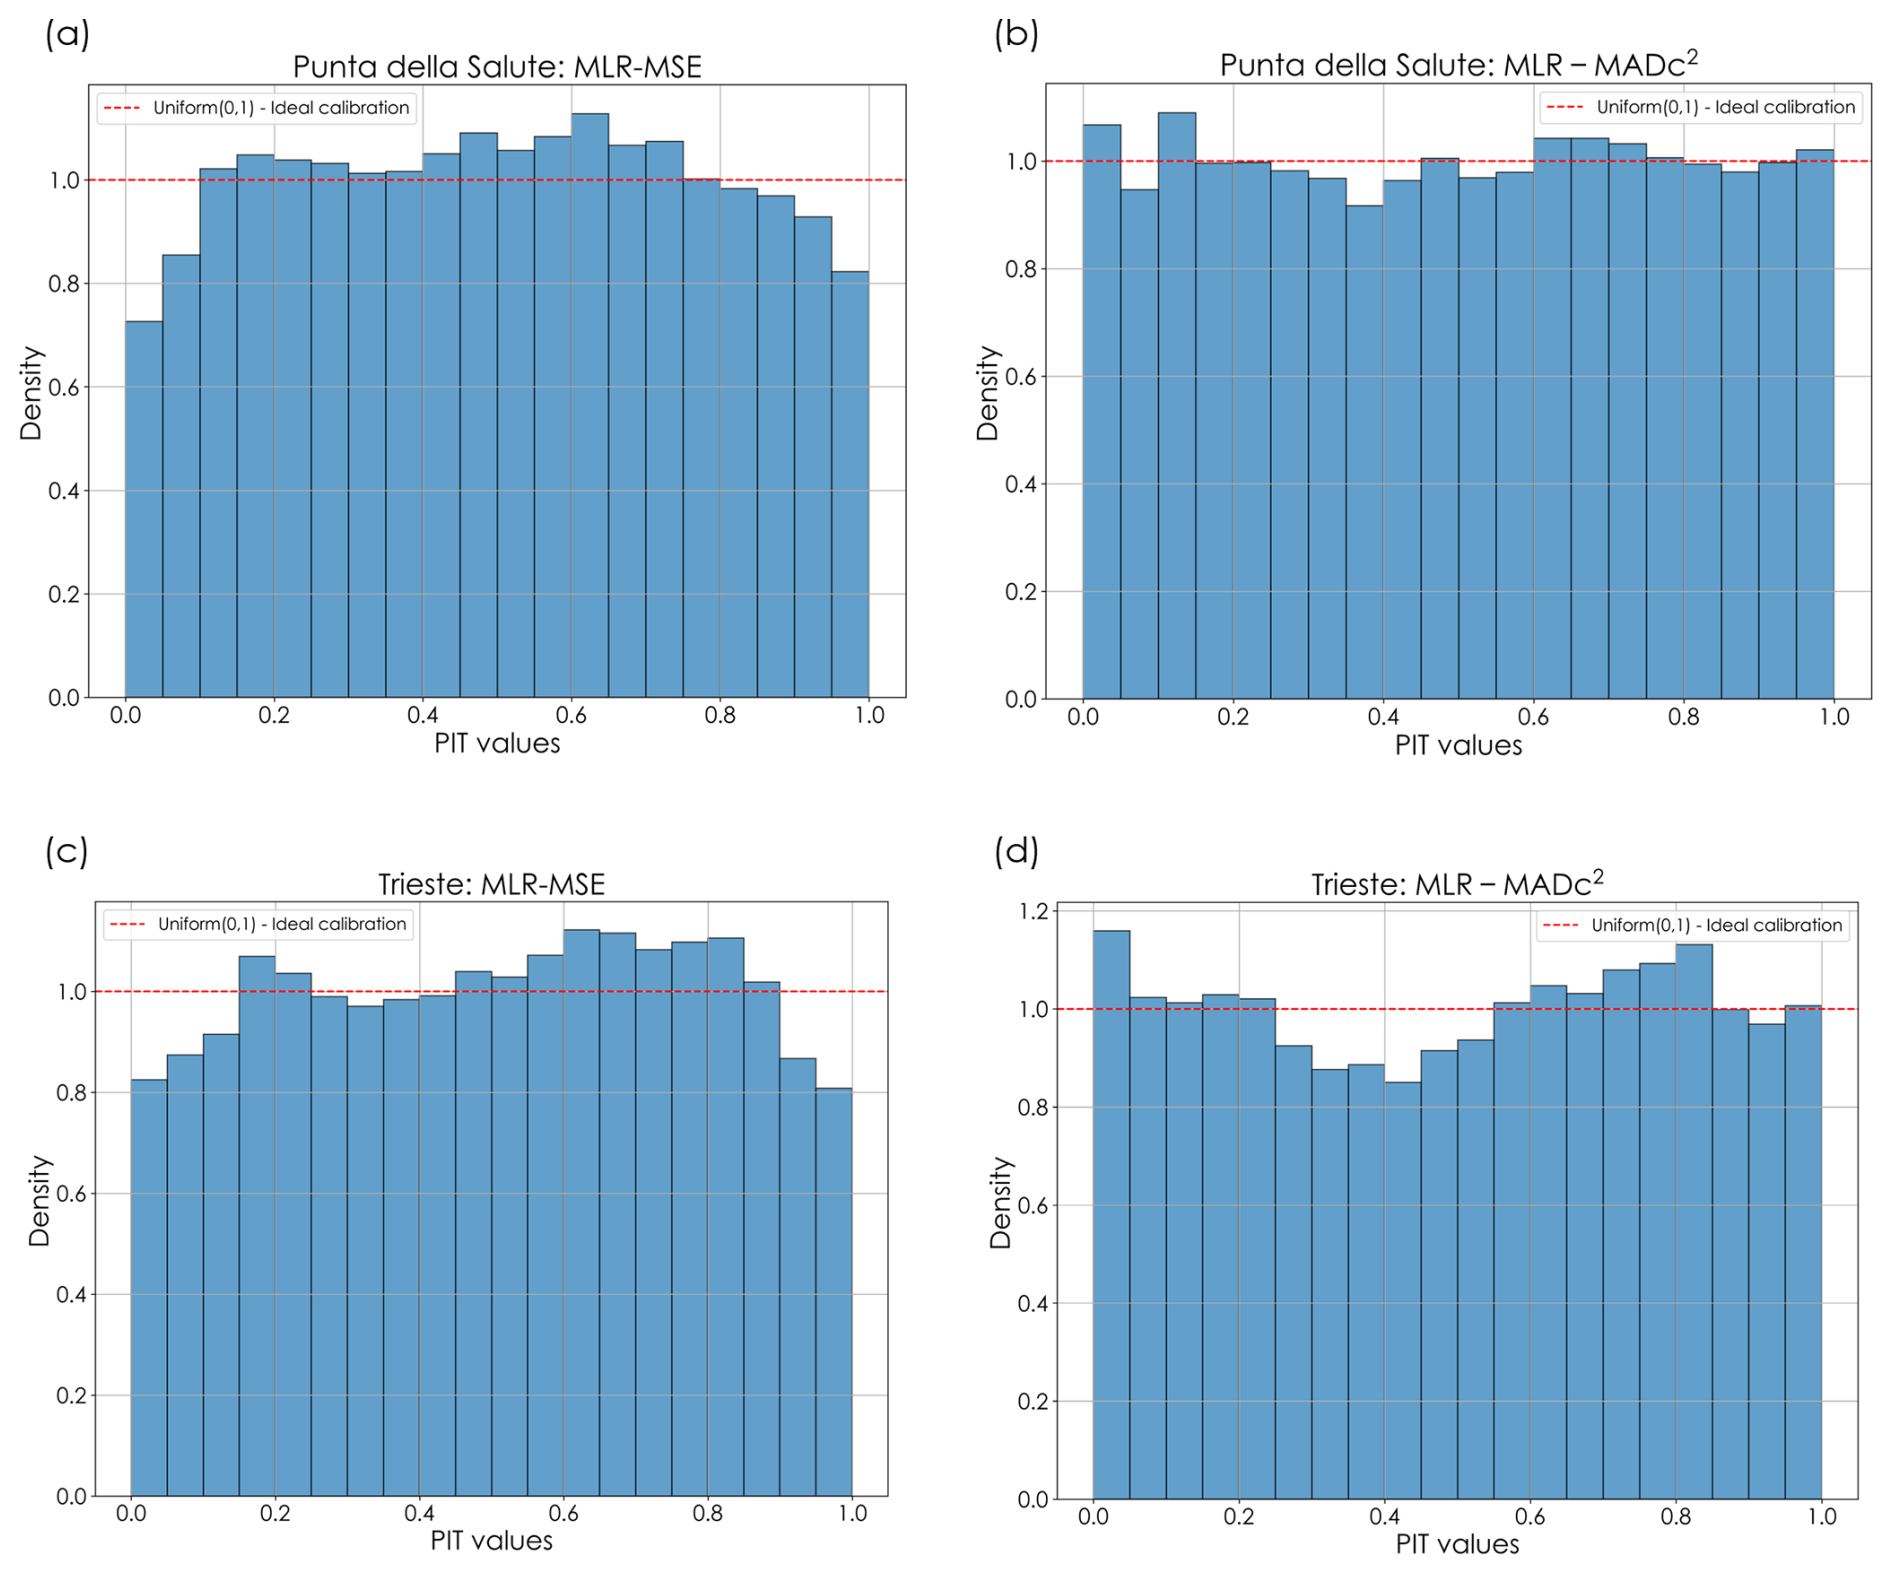
Figure 9Probability Integral Transform (PIT) histograms comparing the calibration of MLR emulators. Panels (a) and (c) show results with the MSE loss at Punta della Salute and Trieste, respectively, while panels (b) and (d) illustrate the improved uniformity achieved with the MADc2 loss.
PIT histograms provide a direct diagnostic of predictive calibration: if the emulator reproduces the full distribution of observed values without systematic bias, the PIT values should follow a uniform distribution on [0,1]. Deviations from uniformity indicate calibration errors. For example, U-shaped histograms suggest underdispersion (extremes occurring more frequently than predicted), whereas dome-shaped histograms indicate overdispersion. While the MLR-MSE emulator shows visible departures from uniformity (Fig. 9a and c), particularly under-representing the lowest and highest percentiles, the MLR-MADc2 emulator produces a distribution much closer to uniform (Fig. 9b and d). This result indicates improved distributional calibration and confirms that MADc2 enhances not only pointwise accuracy at extremes but also the overall statistical consistency of the predicted surge distribution.
Recent advances in data-driven storm surge modeling have increasingly emphasized the importance of tailoring the training objective to the representation of extremes. For example, Hermans et al. (2025) demonstrated that density-based weighting schemes can substantially improve the prediction of high-percentile surges, while (Longo et al., 2025) explored quantile-based loss functions to explicitly target the upper tail of the distribution. Although these approaches differ in formulation, they share a common principle: standard loss functions such as MSE tend to underweight rare but impactful events, leading to systematic underestimation of extremes. The results presented here are fully consistent with this emerging body of work and provide complementary evidence that explicitly embedding sensitivity to extremes within the loss function is a key driver of improved performance. In this context, MADc2 offers a conceptually simple and physically interpretable alternative, directly linking pointwise errors and distributional discrepancies, while avoiding the need for additional design choices such as quantile selection or density weighting. Our findings therefore reinforce the growing consensus that the choice of loss function is at least as important as model architecture for extreme-event emulation, and show that even simple models can achieve state-of-the-art performance when trained with objectives explicitly designed for extremes.
Across the tested architectures, emulators trained with MADc2 generally achieve improved performance on metrics sensitive to surge extremes, such as SLF, MADp, and MADc, although the magnitude of the improvement depends on the emulator architecture (Figs. 10 and 11). In contrast, emulators trained with the MSE loss tend to achieve slightly better RMSE and Pearson correlation values, while showing a reduced ability to reproduce the percentile structure of extreme surge events. This trade-off is consistent with the findings of Campos-Caba et al. (2024), who showed that optimizing dynamic models for RMSE tends to favor simplified configurations (e.g., ERA5 + barotropic) that perform poorly on extremes, while penalizing more physically accurate setups.
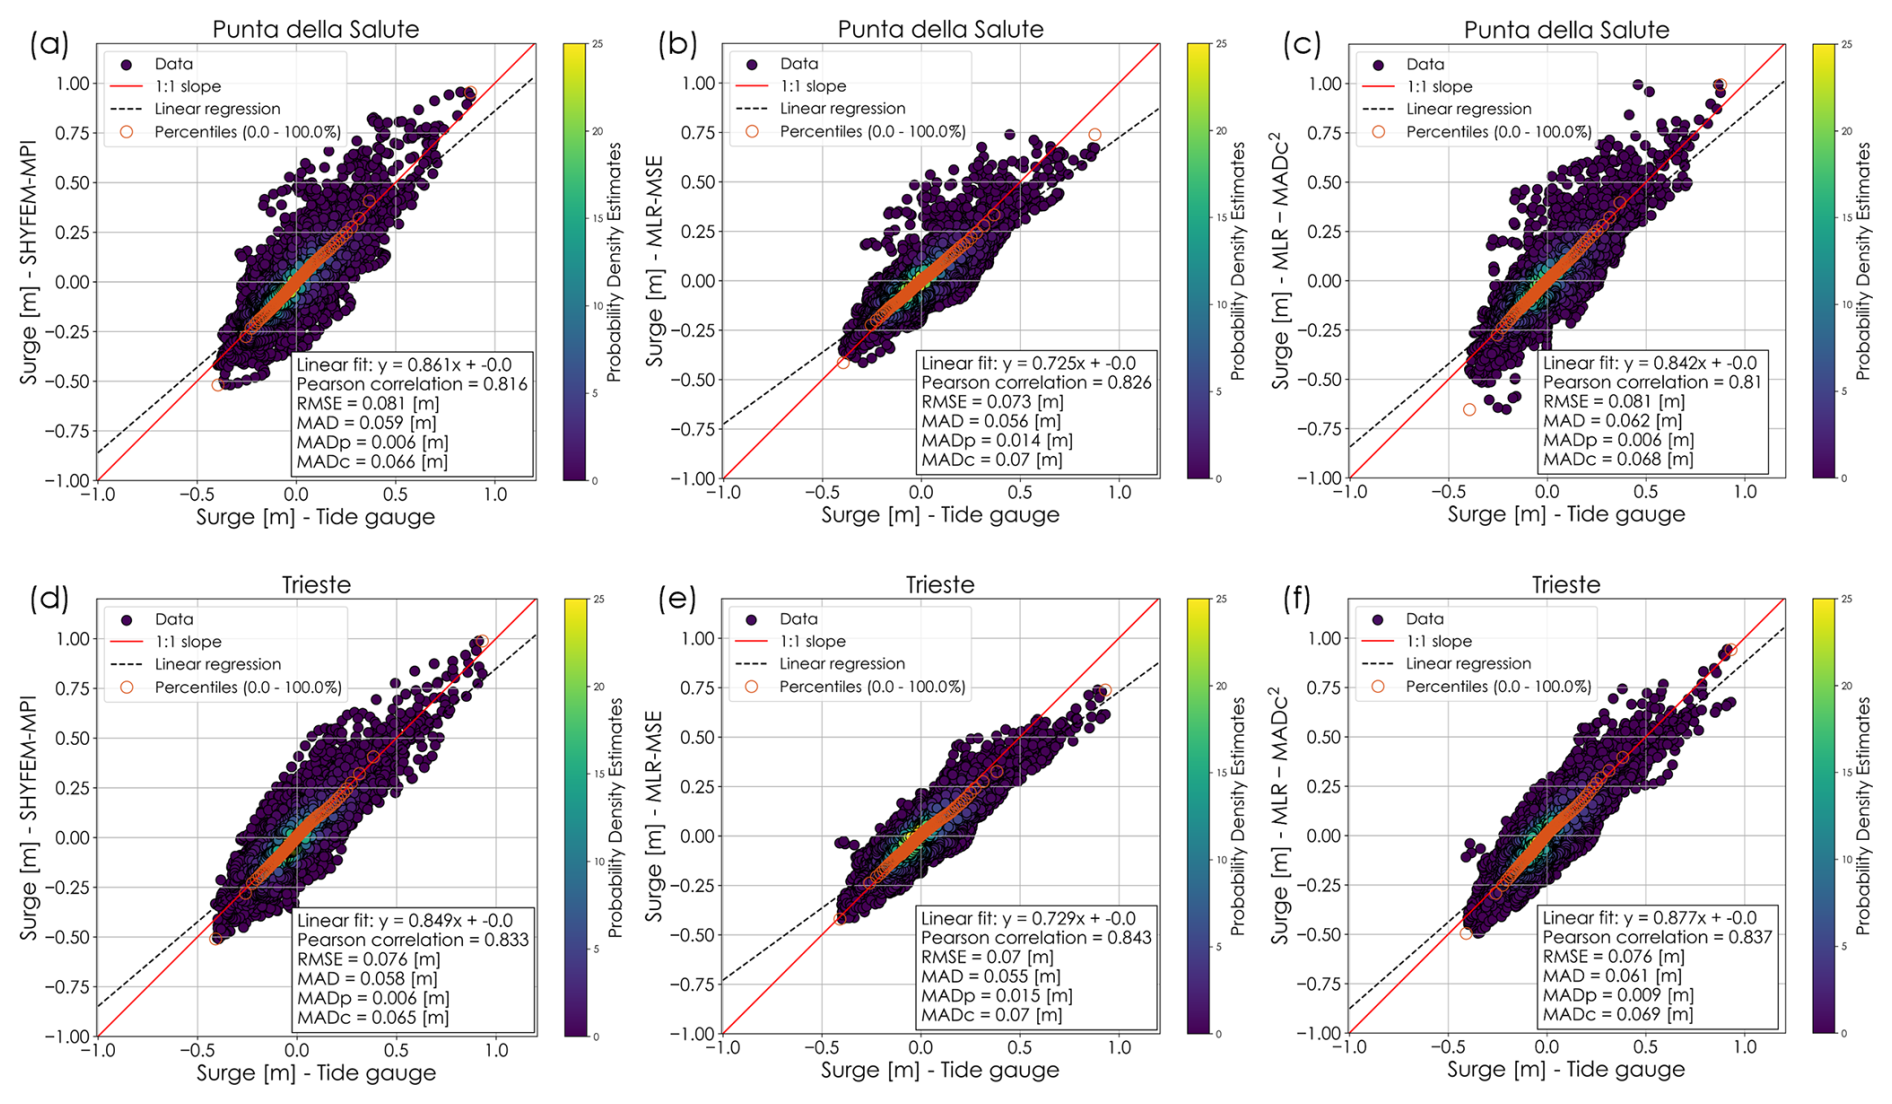
Figure 10Scatter plots with performance metrics for SHYFEM-MPI and MLR emulators at Punta della Salute (a–c) and Trieste (d–f). Panels (b) and (e) show the MSE-based MLR emulators, while panels (c) and (f) correspond to the MADc2-based variants. Panels (a) and (d) show the performance of the SHYFEM-MPI model for reference.
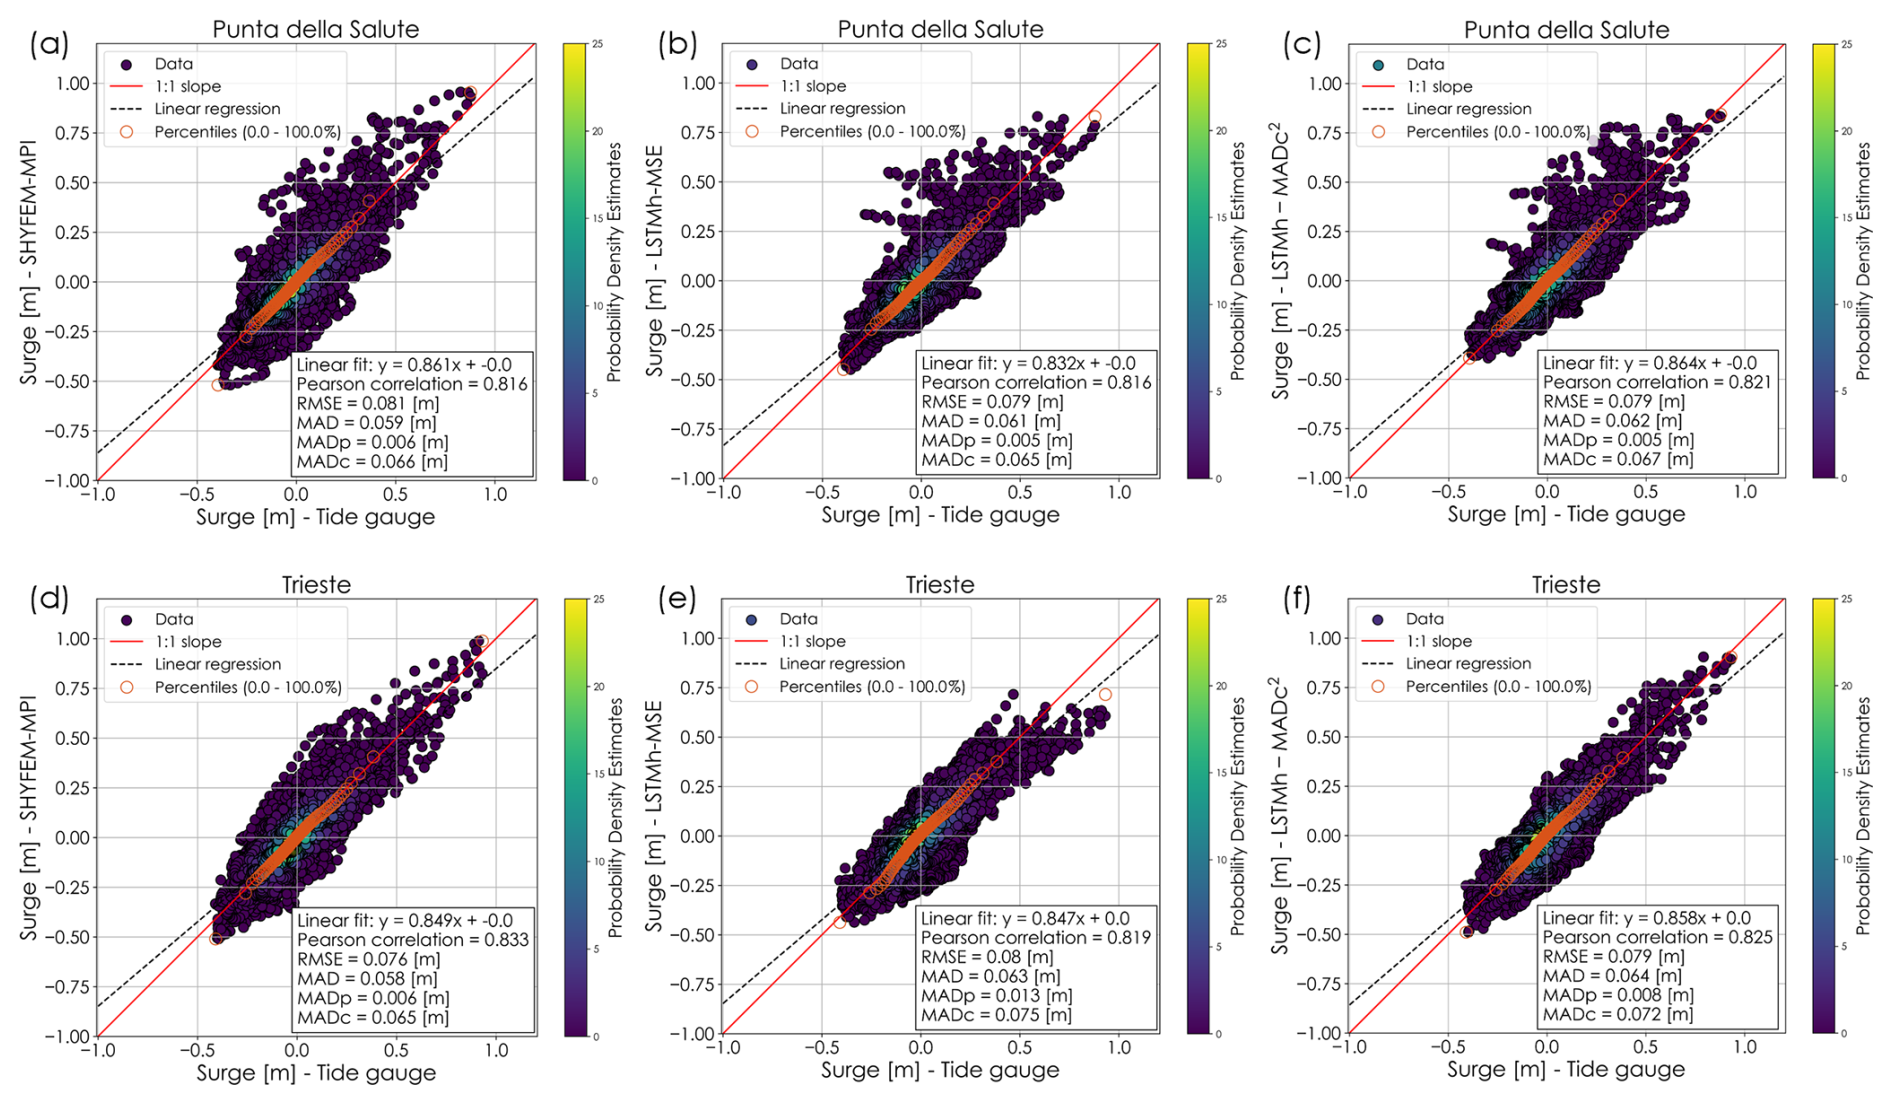
Figure 11Scatter plots with performance metrics for SHYFEM-MPI and LSTMh emulators at Punta della Salute (a–c) and Trieste (d–f). Panels (b) and (e) show the MSE-based LSTMh emulators, while panels (c) and (f) correspond to the MADc2-based variants. Panels (a) and (d) show the performance of the SHYFEM-MPI model for reference.
Notably, the simple MLR emulator illustrates this trade-off well: when trained with MSE, it achieves excellent RMSE scores but performs worse than any other architecture on extremes; conversely, when trained with MADc2, it attains some of the best performances for extreme events (Fig. 10). Another relevant finding is the relatively weaker and more variable performance of RNN-based models on extremes and their large skill variability when trained with MADc2. RNNs are known to suffer from the vanishing gradient problem (e.g., Noh, 2021), which can hinder their convergence with a loss function like MADc2, particularly when the minima of MAD and MADp do not coincide. Moreover, the inherent assumption in RNNs of a constant dependence of present conditions on past states may not align with storm surge dynamics, where dependence on past conditions weakens under extreme events. More broadly, the limited performance gain of recurrent architectures over feed-forward models suggests that, in the northern Adriatic, storm surge variability is largely governed by instantaneous forcing conditions, with antecedent states contributing only marginally to predictive skill. This may also explain the comparatively good extreme-event performance of simple feed-forward, stateless architectures like MLR, as well as gated architectures (e.g., LSTM and in particular LSTMh) that can quickly “forget” past states when conditions shift abruptly (Fig. 11). The good performance of LSTMh may also reflect its hybrid design, which combines a recurrent layer connected with a linear layer, potentially offering a more direct response to instantaneous forcing conditions, while retaining the ability to keep information from the past.
MADc2 training improves the ability of the emulators to reproduce the upper tail of the observed surge distribution, particularly at the highest percentiles (Fig. 12). In Trieste, several MSE-trained emulators underestimate the most extreme surge levels (Fig. 12a), whereas the MADc2-trained emulators generally provide a closer agreement with the empirical distribution of the tide gauge data (Fig. 12b). At Punta della Salute, the differences between MSE- and MADc2-trained emulators are more moderate above the 99th percentile (Fig. 12c and d), with both groups of models capturing the general distributional behaviour. However, when focusing on the most extreme events beyond the 99.9th percentile (Fig. 12e and f), the advantages of MADc2 training become more evident. Several MADc2-trained emulators reduce the underestimation observed in the MSE-based models and provide a closer representation of the most extreme surge levels. Nevertheless, some MADc2-trained emulators also exhibit a tendency to overestimate the highest surge values, particularly between the 99.9th and 99.98th percentiles.
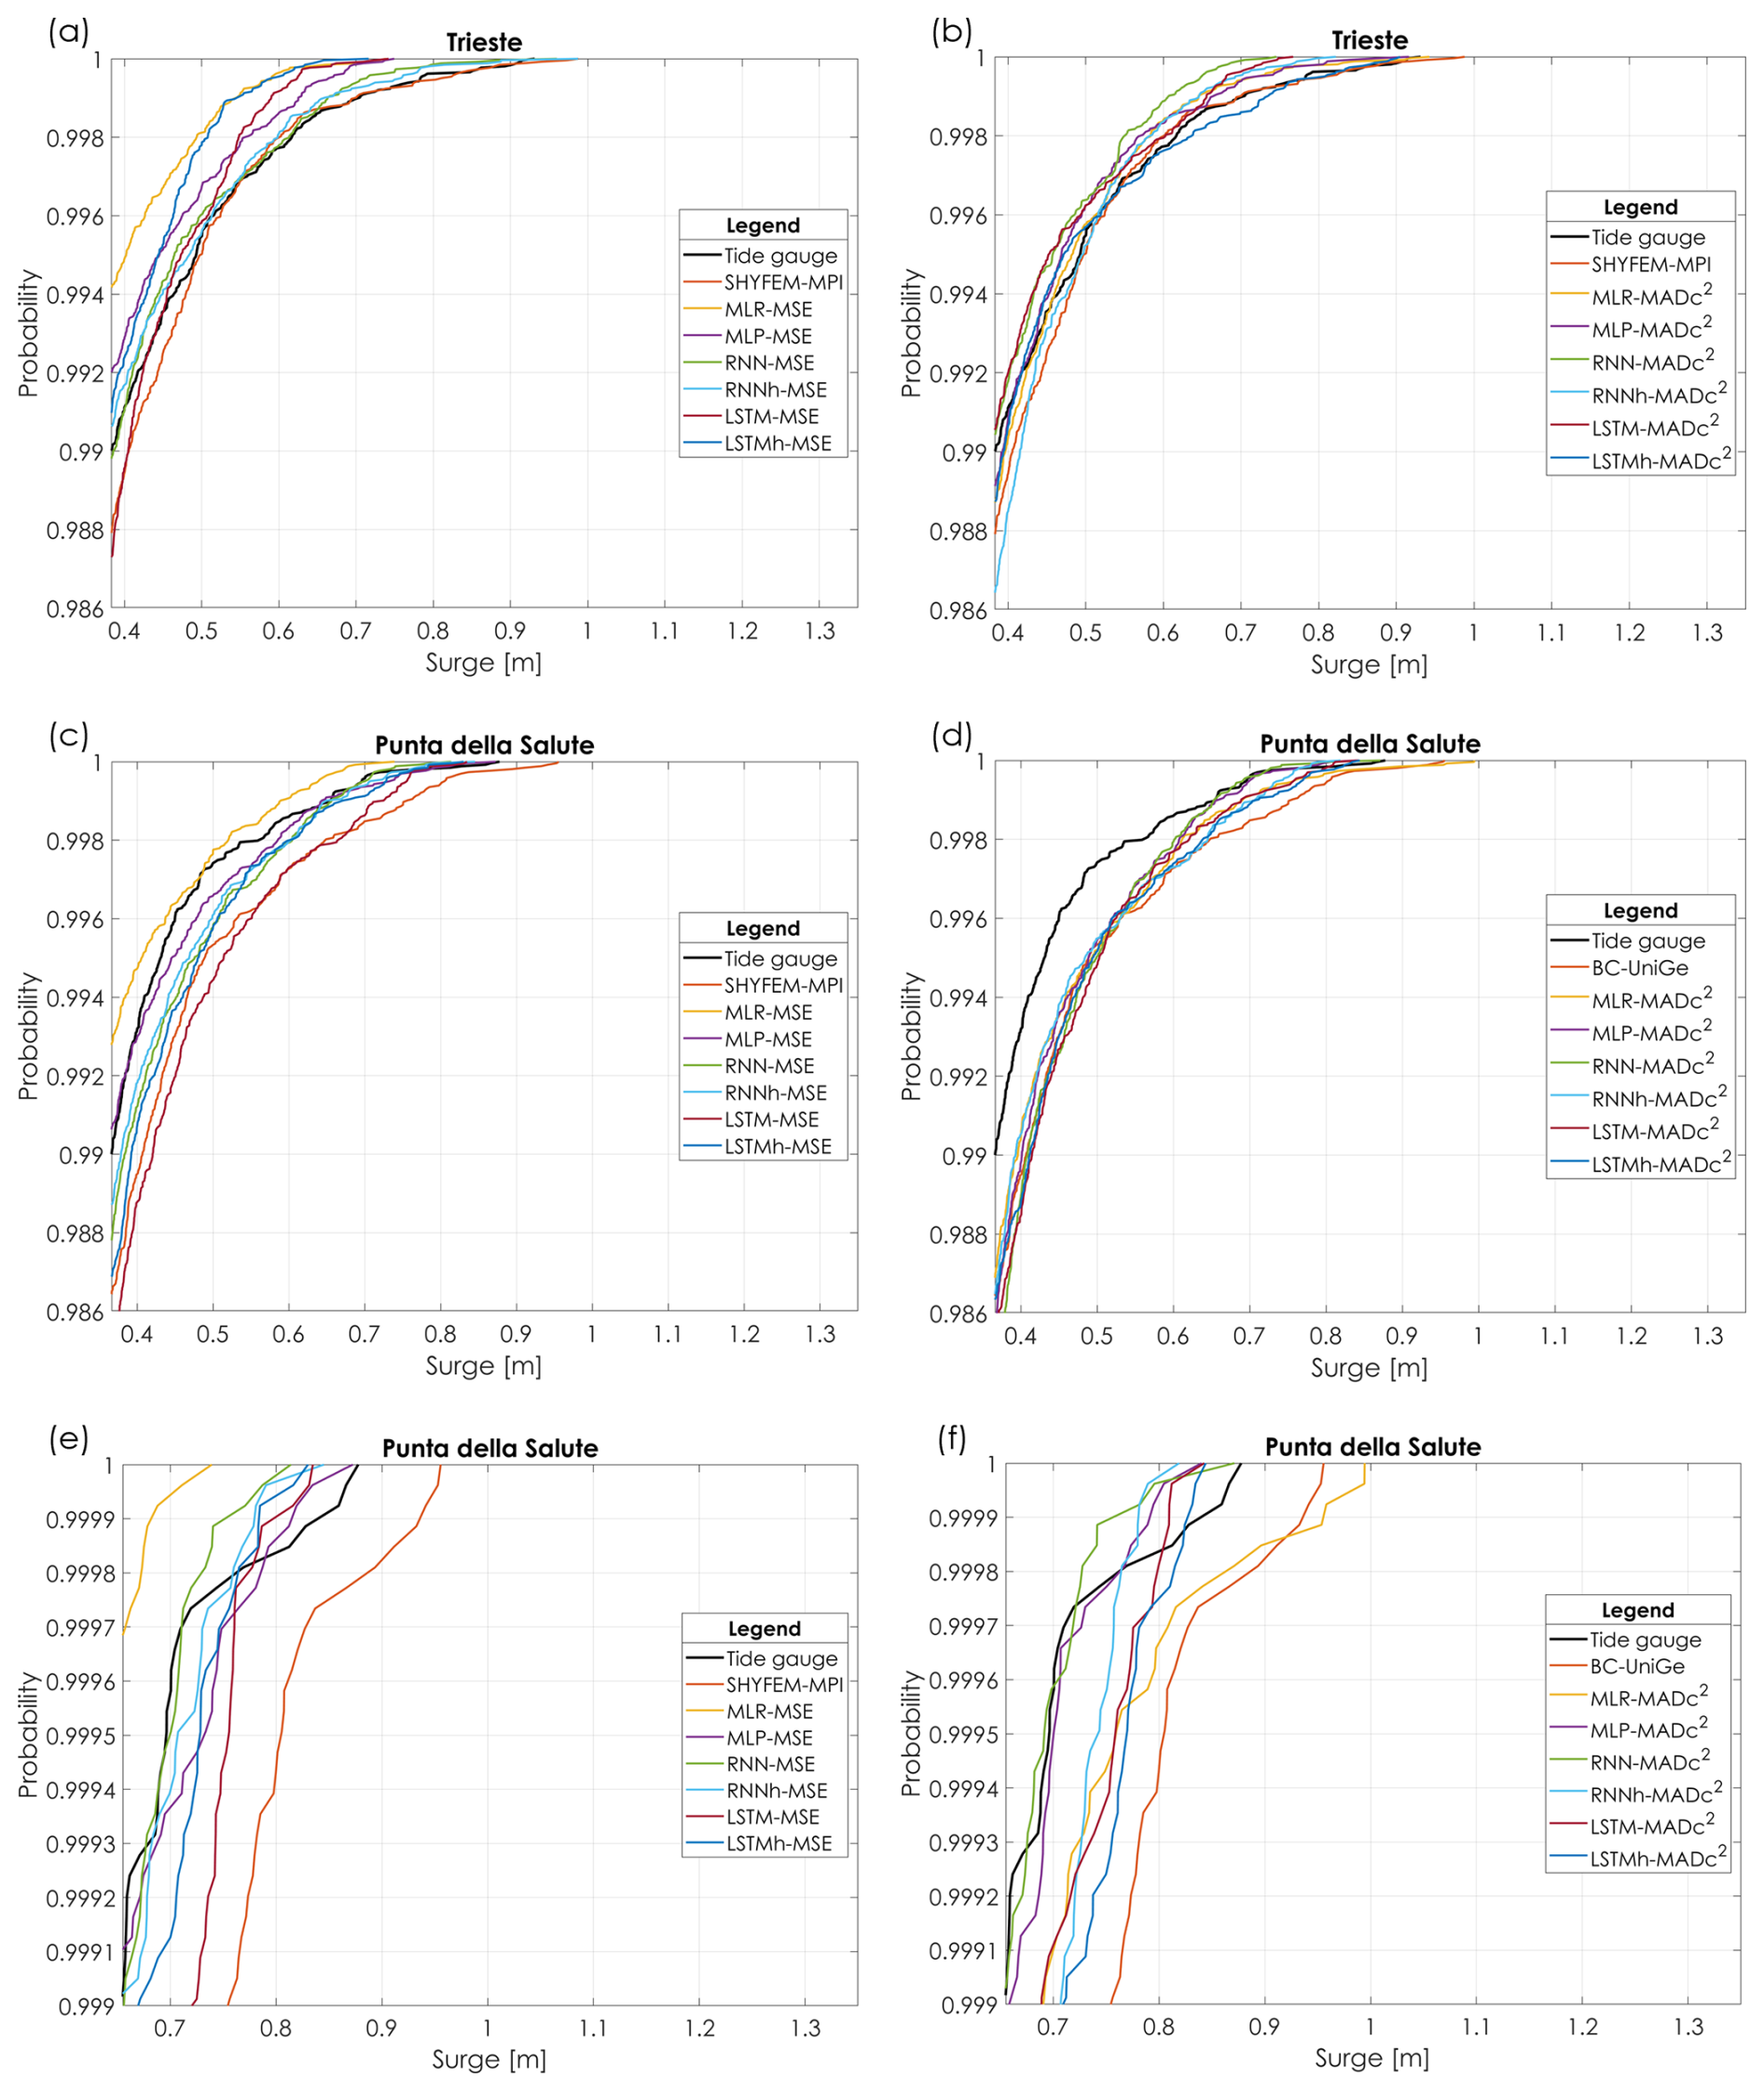
Figure 12Cumulative Distribution Functions (CDFs) beyond the 99th percentile at Trieste (a, b) and Punta della Salute (c, d), for emulators trained with the MSE loss function (a, c) and the MADc2 loss function (b, d). Panels (e) and (f) show the CDFs beyond the 99.9th percentile at Punta della Salute for MSE-based and MADc2-based models, respectively.
Overall, the results indicate that MADc2-trained emulators match or even surpass the performance of SHYFEM-MPI, a high-resolution dynamical model specifically developed for storm surge prediction in the region, when the most extreme surges are considered. For instance, the distributions of bias, MADp, and MADc for MLR-MADc2 for surge peaks above the 99th percentile shown in Fig. 3 indicate that a considerable portion of the 40 runs performed of this emulator outperforms SHYFEM-MPI across the mentioned metrics. Similarly, most of the distributions for LSTMh-MADc2 demonstrate better performance than the SHYFEM-MPI benchmark for the same evaluation criteria, including the selected runs based on the adopted validation-based model selection strategy. These results confirm that ML emulators, when trained with appropriate loss functions, can serve as efficient and accurate alternatives to physics-based models, particularly in ensemble forecasting or early warning applications.
Case studies of extreme events reinforce these results. The storm events of 1996, 2020, and 2022 provide valuable insight into the emulators' capacity to handle different surge dynamics and real-world complexities. The November 1996 event highlights the strength of the MADc2-trained models (both MLR and LSTMh) in accurately capturing intense peaks, suggesting their effectiveness in learning the underlying surge dynamics, particularly when the events fall within the training distribution. The December 2020 event further demonstrates the ability of the emulators to reproduce the main surge peaks at both locations, with LSTMh-MADc2 generally providing the closest agreement with the observations. At Trieste, however, MLR-MADc2 considerably underestimates the first major peak (8 December), highlighting the stronger sensitivity of the simpler linear architecture to event-specific dynamics. Overall, the results indicate that the MADc2-trained emulators effectively capture the dominant features of extreme surge events, although their performance may still vary depending on local conditions and event structure.
The November 2022 storm is especially revealing, as it occurred outside the training and testing periods and thus probes the models' generalization ability. Despite this, both MADc2-trained emulators obtained comparable performance to the physics-based Med-Physics model at the CNR platform and Trieste. This suggests a promising robustness in handling previously unseen conditions. However, the performance drop at Punta della Salute, likely due to MoSE flood barrier activations, which are not included among the input predictors, exposes a limitation: the lack of external forcings or human interventions in the training data can reduce local prediction accuracy. Importantly, emulators offer the flexibility to incorporate such additional predictors during training, which would enable the models to explicitly account for human interventions like barrier operations. Still, the fact that the emulators correctly track the timing and structure of the event, even under such altered conditions, points to a strong generalization capacity and resilience in preserving the underlying predictive relationships.
Importantly, the SSH predictor used for training (Med-MFC reanalysis) can be replaced in forecasting applications by operational Copernicus products such as the Sea Physics Analysis and Forecast system (Med-Physics). The November 2022 case study demonstrates this compatibility: the trained emulators were applied using Med-Physics SSH fields, without requiring retraining or reconfiguration. This indicates that the framework is directly transferable to forecast scenarios in which basin-scale SSH is provided by an operational forecasting system. In ensemble forecasting contexts, the emulator would ingest ensemble members of basin-scale SSH and atmospheric forcing fields. The computational cost associated with generating such ensembles remains tied to the basin-scale ocean model. However, the emulator replaces the expensive coastal refinement step for each ensemble member. Consequently, the efficiency gains arise from eliminating repeated high-resolution coastal simulations rather than from replacing the basin-scale circulation model itself.
In terms of computational efficiency, the contrast between dynamical downscaling and the ML approach is striking. The computational comparison discussed below concerns the replacement of the high-resolution coastal downscaling model (SHYFEM-MPI), while treating basin-scale Med-MFC output as an external operational input. Dynamic downscaling required access to the high-performance computing facilities of the CMCC Supercomputing Center, where one year of simulation on the Zeus infrastructure, comprising 348 Lenovo SD530 dual-processor nodes (12 528 cores in total) interconnected via an InfiniBand EDR network, with a theoretical peak performance of 1.202 TFlops, took approximately 36 h to complete when executed on 36 cores. By comparison, the ML emulators could be trained and validated on a single high-end laptop equipped with an Intel® Core™ Ultra 9 processor, 64 GB of RAM, and an NVIDIA RTX™ 3000 Ada GPU. On this system, the total runtime for a single experiment was reduced from hours to seconds or minutes, with average execution times ranging from 20–40 s for MLR and 20–60 s for MLP models to under 30 min for RNN and LSTM-based architectures. This difference highlights the ability of ML-based emulators to achieve orders-of-magnitude improvements in efficiency without the need for supercomputing infrastructure.
It is important to emphasize that the computational comparison presented in this study refers to replacing the high-resolution regional downscaling model (SHYFEM-MPI), not the basin-scale Med-MFC simulation itself. Med-MFC is treated here as an operationally available large-scale input, analogous to boundary conditions in traditional dynamical downscaling systems. The efficiency gains demonstrated by the ML emulators therefore arise from replacing expensive coastal-scale dynamical refinement rather than eliminating the need for basin-scale ocean simulations. We acknowledge that in ensemble forecasting applications, multiple realizations of basin-scale forcing would still be required. In this context, the ML emulators would act as lightweight refinements of ensemble SSH fields rather than full substitutes for circulation models.
This study demonstrates the potential of machine learning emulators as flexible and computationally efficient tools for storm surge prediction in coastal regions. A central contribution is the development of the MADc2 loss function, specifically designed to improve the representation of extremes by jointly penalizing amplitude errors and discrepancies in the percentile structure. Emulators trained with MADc2 generally show improved performance over their MSE-trained counterparts in reproducing extreme surge behaviour, while maintaining competitive accuracy over the full time series.
Our experiments highlight that emulator performance depends on the interaction between model architecture and loss-function design. Simple approaches such as MLR benefited substantially from MADc2 training, achieving strong skill in the representation of extremes despite their limited complexity. At the same time, LSTMh architectures also performed strongly, indicating that recurrent models with more flexible temporal-memory mechanisms can provide additional benefits when properly trained. In contrast, standard RNN-based models showed comparatively weaker and more variable results, likely linked to gradient instability and their more restrictive representation of temporal dependence. The simplicity and computational efficiency of MLR-MADc2 make it particularly attractive for large-scale or global studies, where rapid training and interpretability are key advantages, while LSTMh-MADc2 offers a strong alternative when improved temporal adaptability is required.
At the same time, we note that this conclusion is conditional on the spatial scale and predictor representation adopted in this study. The use of PCA-based dimensionality reduction limits the explicit exploitation of spatial structures in the predictors. Previous studies have shown that convolutional layers can provide substantial benefits when larger spatial predictor domains are considered and when spatial patterns play a dominant role in surge generation (e.g., Tiggeloven et al., 2021; Hermans et al., 2025). Therefore, while our results demonstrate that loss-function design can outweigh architectural complexity, future work could explore more complex architectures in combination with extreme-aware loss functions, particularly when larger spatial domains or richer spatial representations are considered.
MADc2-trained emulators also proved robust in generalization, retaining strong predictive skill during the November 2022 event despite operating outside their training and validation periods. This result indicates that, when trained with objectives tailored to extremes, ML emulators can extend their skill to previously unseen conditions, a crucial requirement for early warning and climate resilience applications.
Overall, this work supports the promise of data-driven emulators as complementary components of operational coastal hazard forecasting systems. The fact that they rival a top-tier numerical model underscores their readiness for practical integration. While the fitted cases here rely on observational data, whose availability can be a limiting factor, the emulators could also be trained directly on numerical model outputs, thereby extending their applicability to locations without long instrumental records. Such flexibility would enable seamless implementation within operational forecasting chains, including the possibility of probabilistic ensemble predictions. With further refinement and possibility to easily include additional forcings where needed (e.g., the MoSE barriers in Venice), these approaches offer a scalable pathway toward next-generation multihazard prediction frameworks that are adaptive, computationally efficient, and better aligned with the needs of risk management and preparedness.
The datasets, trained machine learning emulators, preprocessing files, inference workflows, and scripts used in this study are publicly available through the Zenodo repository at https://doi.org/10.5281/zenodo.20393561 (Campos-Caba and Mentaschi, 2026).
The supplement related to this article is available online at https://doi.org/10.5194/nhess-26-3683-2026-supplement.
RCC implemented the ML emulators, conducted the training, validation, and testing processes, performed post-processing and performance evaluation, and prepared the manuscript. LM supervised the implementation of the ML emulators, post-processing, and performance evaluation, and contributed to manuscript preparation. PC contributed theoretical insights during the implementation of the ML emulators, performance evaluation, and manuscript preparation. AM contributed to the performance analysis and manuscript preparation. MV, MT, IF, and SC contributed to the preparation and revision of the manuscript.
Co-author Massimo Tondello is employed by the company HS Marine SrL. Co-author Michalis Vousdoukas is employed by the company MV Coastal and Climate Research Ltd. The remaining authors declare that the research was conducted in the absence of any commercial or financial relationship that could be construed as a potential conflict of interest.
Publisher's note: Copernicus Publications remains neutral with regard to jurisdictional claims made in the text, published maps, institutional affiliations, or any other geographical representation in this paper. The authors bear the ultimate responsibility for providing appropriate place names. Views expressed in the text are those of the authors and do not necessarily reflect the views of the publisher.
The authors gratefully acknowledge the financial support described in the Financial support section.
Rodrigo Campos-Caba and Lorenzo Mentaschi have been supported by the Doctoral scholarship from the National Operational Programme for Research and Innovation 2014-2020 (CCI 2014IT16M2OP005), ESF REACT-EU resources, Action IV.4 “Doctorates and research contracts on innovation topics” and Action IV.5 “Doctorates on Green topics”, and the Interreg IT-HR AdriaClimPlus, under Grant Agreement ITHR0200333. Ivan Federico and Salvatore Causio have been supported by the REST-COAST project (European Union Horizon 2020 Research and Innovation Programme, Grant agreement ID: 101037097).
This paper was edited by Timothy Tiggeloven and reviewed by three anonymous referees.
Adeli, E., Sun, L., Wang, J., and Taflanidis, A. A.: An advanced spatio-temporal convolutional recurrent neural network for storm surge predictions, Neural Comput. Appl., 35, 18971–18987, https://doi.org/10.1007/s00521-023-08719-2, 2023.
Alessandri, J., Pinardi, N., Federico, I., and Valentini, A.: Storm Surge Ensemble Prediction System for Lagoons and Transitional Environments, Am. Meteorol. Soc., 38, https://doi.org/10.1175/WAF-D-23-0040.1, 2023.
Bajo, M. and Umgiesser, G.: Storm surge forecast through a combination of dynamic and neural network models, Ocean Model., 33, https://doi.org/10.1016/j.ocemod.2009.12.007, 2010.
Bezuglov, A., Blanton, B., and Santiago, R.: Multi-Output Artificial Neural Network for Storm Surge Prediction in North Carolina, arXiv [preprint], https://doi.org/10.48550/arXiv.1609.07378, 2016.
Bishop, C.: Pattern recognition and machine learning, Springer, ISBN: 978-0-387-31073-2, 2006.
Calafat, F. M., Wahl, T., Tadesse, M. G., and Sparrow, S. N.: Trends in Europe storm surge extremes match the rate of sea-level rise, Nature, 603, 841–845, https://doi.org/10.1038/s41586-022-04426-5, 2022.
Campos-Caba, R. and Mentaschi, L.: ro-camposcaba/stormsurge_ml: Machine Learning emulators for storm surge time-series, Version v1, Zenodo [computer software], https://doi.org/10.5281/zenodo.20393561, 2026.
Campos-Caba, R., Alessandri, J., Camus, P., Mazzino, A., Ferrari, F., Federico, I., Vousdoukas, M., Tondello, M., and Mentaschi, L.: Assessing storm surge model performance: what error indicators can measure the model's skill?, Ocean Sci., 20, 1513–1526, https://doi.org/10.5194/os-20-1513-2024, 2024.
Chen, K., Kuang, C., Wang, L., Chen, K., Han, X., and Fan, J.: Storm surge prediction based on long short-term memory neural network in the east China sea, Appl. Sci.-Bern, 12, https://doi.org/10.3390/app12010181, 2022.
Cid, A., Wahl, T., Chamber, D. P., and Muis, S.: Storm surge reconstruction and return water level estimation in Southeast Asia for the 20th century, J. Geophys. Res.-Oceans, 123, 437–451, https://doi.org/10.1002/2017JC013143, 2018.
Clementi, E., Drudi, M., Aydogdu, A., Moulin, A., Grandi, A., Mariani, A., Goglio, A. C., Pistoia, J., Miraglio, P., Lecci, R., Palermo, F., Coppini, G., Masina, S., and Pinardi, N.: Mediterranean Sea Physical Analysis and Forecast (CMEMS MED-Physics, EAS8 system), Version 1, Copernicus Marine Service (CMS) [data set], https://doi.org/10.25423/CMCC/MEDSEA_ANALYSISFORECAST_PHY_006_013_EAS8, 2023.
Daizong, D., Zhang, M., Yang, M. Pan, and He, X.: Modeling extreme events in time series prediction, in: 25th ACM SIGKDD Conference on Knowledge Discovery and Data Mining (KDD '19), 4–8 August 2019, Anchorage, AK, USA, ACM, New York, NY, USA, https://doi.org/10.1145/3292500.3330896, 2019.
Dang, W., Feng, J., Li, D., Fan, M., and Zhao, L.: A dataset of storm surge reconstructions in the Western North Pacific using CNN, Sci. Data, 11, https://doi.org/10.1038/s41597-024-03249-5, 2024.
De Zolt, S., Lionello, P., Nuhu, A., and Tomasin, A.: The disastrous storm of 4 November 1966 on Italy, Nat. Hazards Earth Syst. Sci., 6, 861–879, https://doi.org/10.5194/nhess-6-861-2006, 2006.
Escudier, R., Clementi, E., Cipollone, A., Pistoia, J., Drudi, M., Grandi, A., Lyubartsev, V., Lecci, R., Aydogdu, A., Delrosso, D., Omar, M., Masina, S., Coppini, G., and Pinardi, N.: A High Resolution Reanalysis for the Mediterranean Sea, Front. Earth Sci., 9, https://doi.org/10.3389/feart.2021.702285, 2021.
Federico, I., Pinardi, N., Coppini, G., Oddo, P., Lecci, R., and Mossa, M.: Coastal ocean forecasting with an unstructured grid model in the southern Adriatic and northern Ionian seas, Nat. Hazards Earth Syst. Sci., 17, 45–59, https://doi.org/10.5194/nhess-17-45-2017, 2017.
Feng, X.-C., and Xu, H.: Accurate storm surge prediction in hurricane area of the Atlantic Ocean using a new multi-recursive neural network based on gate recursive unit, Journal of Ocean Engineering and Science, 11, 726–739, https://doi.org/10.1016/j.joes.2024.01.001, 2024.
Ferrarin, C., Valentini, A., Vodopivec, M., Klaric, D., Massaro, G., Bajo, M., De Pascalis, F., Fadini, A., Ghezzo, M., Menegon, S., Bressan, L., Unguendoli, S., Fettich, A., Jerman, J., Ličer, M., Fustar, L., Papa, A., and Carraro, E.: Integrated sea storm management strategy: the 29 October 2018 event in the Adriatic Sea, Nat. Hazards Earth Syst. Sci., 20, 73–93, https://doi.org/10.5194/nhess-20-73-2020, 2020.
Gholamy, A., Kreinovich, V., and Kosheleva, O.: Why 70/30 or 80/20 relation between training and testing sets: A pedagogical explanation, Department of Computer Science, University of Texas at El Paso, https://scholarworks.utep.edu/cs_techrep/1209/ (last access: 4 August 2026), 2018.
Giaremis, S., Nader, N., Dawson, C., Kaiser, H., Kaiser, C., and Nikidis, E.: Storm surge modeling in the AI era: using LSTM-based machine learning for enhancing forecasting accuracy, arXiv [preprint], https://doi.org/10.48550/arXiv.2403.04818, 2024.
Goodfellow, I., Bengio, Y., and Courville, A.: Deep learning, MIT Press, ISBN: 978-0-262-03561-3, 2016.
Harter, L., Pineau-Guillou, L., and Chapron, B.: Underestimation of extremes in sea level surge reconstruction, Sci. Rep., 14, https://doi.org/10.1038/s41598-024-65718-6, 2024.
Hermans, T. H. J., Ben Hammouda, C., Treu, S., Tiggeloven, T., Couasnon, A., Busecke, J. J. M., and van de Wal, R. S. W.: Computing extreme storm surges in Europe using neural networks, Nat. Hazards Earth Syst. Sci., 25, 4593–4612, https://doi.org/10.5194/nhess-25-4593-2025, 2025.
Hersbach, H., Bell, B., Berrisford, P., Hirahara, S., Horányi, A., Muñoz-Sabater, J., Nicolas, J., Peubey, C., Radu, R., Schepers, D., Simmons, A., Soci, C., Abdalla, S., Abellan, X., Balsamo, G., Bechtold, P., Biavati, G., Bidlot, J., Bonavita, M., De Chiara, G., Dahlgren, P., Dee, D., Diamantakis, M., Dragani, R., Flemming, J., Forbes, R., Fuentes, M., Geer, A., Haimberger, L., Healy, S., Hogan, R. J., Hólm, E., Janiskova, M., Keeley, S., Laloyaux, P., Lopez, P., Lupu, C., Radnoti, G., de Rosnay, P., Rozum, I., Vamborg, F., Villaume, S., and Thépaut, J. N.: The ERA5 global reanalysis, Q. J. Roy. Meteor. Soc., 146, 1999–2049, https://doi.org/10.1002/qj.3803, 2020.
Igarashi, Y. and Tajima, Y.: Application of recurrent neural network for prediction of the time-varying storm surge, Coast. Eng. J., 63, 68–82, https://doi.org/10.1080/21664250.2020.1868736, 2021.
IPCC: Climate change 2021: The physical science basis. Contribution of working group I to the sixth assessment report of the Intergovernmental Panel on Climate Change, IPCC, https://doi.org/10.1017/9781009157896, 2021.
Kim, S., Pan, S., and Mase, H.: Artificial neural network-based storm surge forecast model: Practical application to Sakai Minato, Japan, Appl. Ocean Res., 91, https://doi.org/10.1016/j.apor.2019.101871, 2019.
Lionello, P., Barriopedro, D., Ferrarin, C., Nicholls, R. J., Orlić, M., Raicich, F., Reale, M., Umgiesser, G., Vousdoukas, M., and Zanchettin, D.: Extreme floods of Venice: characteristics, dynamics, past and future evolution (review article), Nat. Hazards Earth Syst. Sci., 21, 2705–2731, https://doi.org/10.5194/nhess-21-2705-2021, 2021.
Longo, E., Ficchì, A., Verlaan, M., Muis, S., and Castelletti, A.: A deep learning framework for extreme storm surge modelling under future climate scenarios, ESS Open Archive [preprint], https://doi.org/10.22541/essoar.175511719.92481227/v1, 2025.
Lyard, F. H., Allain, D. J., Cancet, M., Carrère, L., and Picot, N.: FES2014 global ocean tide atlas: design and performance, Ocean Sci., 17, 615–649, https://doi.org/10.5194/os-17-615-2021, 2021.
Mel, R. A., Coraci, E., Morucci, S., Crosato, F., Cornello, M., Casaioli, M., Mariani, S., Carniello, L., Papa, A., Bonometto, A., and Ferla, M.: Insights on the Extreme Storm Surge Event of the 22 November 2022 in the Venice Lagoon,. Journal of Marine Science and Engineering, 11, https://doi.org/10.3390/jmse11091750, 2023.
Micaletto, G., Barletta, I., Mocavero, S., Federico, I., Epicoco, I., Verri, G., Coppini, G., Schiano, P., Aloisio, G., and Pinardi, N.: Parallel implementation of the SHYFEM (System of HydrodYnamic Finite Element Modules) model, Geosci. Model Dev., 15, 6025–6046, https://doi.org/10.5194/gmd-15-6025-2022, 2022.
Noh, S. H.: Analysis of gradient vanishing of RNNs and performance comparison, Information, 12, https://doi.org/10.3390/info12110442, 2021.
Park, K., Federico, I., Di Lorenzo, E., Ezer, T., Cobb, K. M., Pinardi, N., and Coppini, G.: The contribution of hurricane remote ocean forcing to storm surge along the Southeastern U. S. coast, Coast. Eng., 173, https://doi.org/10.1016/j.coastaleng.2022.104098, 2022.
Paszke, A., Gross, S., Chintala, S., Chanan, G., Yang, E., Devito, Z., Lin, Z., Desmaison, A., Antiga, L., and Lerer, A.: Automatic differentiation in PyTorch, in: Conference on Neural Information Processing Systems (NIPS 2017), Long Beach, CA, USA, ISBN: 978-1-5108-6096-4, 2017.
Pawlowicz, R., Beardsley, B., and Lentz, S.: Classical harmonic analysis including error estimates in MATLAB using T_TIDE, Comput. Geosci., 28, 929–937, 2022.
Raicich, F.: The sea level time series of Trieste, Molo Sartorio, Italy (1869-2021). Earth System Science Data, 15, 1749–1763, https://doi.org/10.5194/essd-15-1749-2023, 2023.
Rus, M., Fettich, A., Kristan, M., and Ličer, M.: HIDRA2: deep-learning ensemble sea level and storm tide forecasting in the presence of seiches - the case of the northern Adriatic. Geosci. Model Dev., 16, 271–288, https://doi.org/10.5194/gmd-16-271-2023, 2023a.
Rus, M., Fettich, A., Kristan, M., and Ličer, M.: HIDRA-T – A transformer-based sea level forecasting method, ERK 2023 Computational Intelligence Section, 2023b.
Sun, K. and Pan, J.: Model of storm surge maximum water level increase in a coastal area using ensemble machine learning and explicable algorithm, Earth Space Sci., 10, https://doi.org/10.1029/2023EA003243, 2023.
Suradhaniwar, S., Kar, S., Durbha, S. S., and Jagarlapudi, A.: Time series forecasting of univariate agrometeorological data: A comparative performance evaluation via one-step and multi-step ahead forecasting strategies, Sensors, 21, https://doi.org/10.3390/s21072430, 2021.
Tadesse, M., Wahl, T., and Cid, A.: Data-Driven Modeling of Global Storm Surges, Frontiers in Marine Science, 7, https://doi.org/10.3389/fmars.2020.00260, 2020.
Tausía, J., Delaux, S., Camus, P., Rueda, A., Méndez, F., Bryan, K. R., Pérez, J., Costa, C. G. R., Zyngfogel, R., and Cofiño, A.: Rapid response data-driven reconstructions for storm surge around New Zealand, Appl. Ocean Res., 133, https://doi.org/10.1016/j.apor.2023.103496, 2023.
Tiggeloven, T., Couasnon, A., van Straaten, C., Muis, S., and Ward, P. J.: Exploring deep learning capabilities for surge predictions in coastal areas, Sci. Rep., 11, https://doi.org/10.1038/s41598-021-96674-0, 2021.
Trotta, F., Fenu, E., Pinardi, N., Bruciaferri, D., Giacomelli, L., Federico, I., and Coppini, G.: A structured and unstructured grid relocatable ocean platform for forecasting (SURF), Deep-Sea Res. Pt. II, 133, 54–75, https://doi.org/10.1016/j.dsr2.2016.05.004, 2016.
Uçar, M. K., Nour, M., Sindi, H., and Polat, K.: The effect of training and testing process on machine learning in biomedical datasets, Math. Probl. Eng., 2020, https://doi.org/10.1155/2020/2836236, 2020.
Umgiesser, G., Canu, D. M., Cucco, A., and Solidoro, C.: A finite element model for the Venice lagoon: Development, set up, calibration and validation, J. Marine Syst., 123–145, https://doi.org/10.1016/j.jmarsys.2004.05.009, 2004.
Umgiesser, G., Bajo, M., Ferrrarin, C., Cucco, A., Lionello, P., Zanchettin, D., Papa, A., Tosoni, A., Ferla, M., Coraci, E., Morucci, S., Crosato, F., Bonometto, A., Valentini, A., Orlic, M., Haigh, I. D., Nielsen, J. W., Bertin, X., Bustorff Fortunato, A., Perez, B., Alvarez, E., Paradis, D., Jourdan, D., Pasquet, A., Mourre, B., Tintoré, J. and Nicholls, R. J.: The prediction of floods in Venice: Methods, models and uncertainty (review article). Nat. Hazards Earth Syst. Sci., 21, 2679–2704, https://doi.org/10.5194/nhess-21-2679-2021, 2021.
Wahl, T., Haigh, I. D., Nicholls, R. J., Arns, A., Dangendorf, S., Hinkel, J., and Slangen, A. B. A.: Understanding extreme sea levels for broad-scale coastal impact and adaptation analysis, Nat. Commun., 8, https://doi.org/10.1038/ncomms16075, 2017.
Wang, B., Liu, S., Wang, B., Wu, W., Wang, J., and Shen, D.: Multi-step ahead short-term predictions of storm surge level using CNN and LSTM network, Acta Oceanol. Sin., 40, 104–118, https://doi.org/10.1007/s13131-021-1763-9, 2021.
Wang, X., Wang, R., Hu, N., Wang, P., Huo, P., Wang, G., Wang, H., Wang, S., Zhu, J., Xu, J., Yin, J., Bao, S., Luo, C., Zu, Z., Han, Y., Zhang, W., Ren, K., Deng, K., and Song, J.: XiHe: A Data-Driven Model for Global Ocean Eddy-Resolving Forecasting, arXiv [preprint], https://doi.org/10.48550/arXiv.2402.02995, 2024.
Zhao, T., Wang, S., Ouyang, C., Chen, M., Liu, C., Zhang, J., Yu, L., Wang, F., Xie, Y., Li, J., Wang, F., Grunwald, S., Wong, B. M., Zhang, F., Qian, Z., Xu, Y., Yu, C., Han, W., Sun, T., Shao, Z., Qian, T., Chen, Z., Zeng, J., Zhang, H., Letu, H., Zhang, B., Wang, L., Luo, L., Shi, C., Su, H., Zhang, H., Yin, S., Huang, N., Zhao, W., Li, N., Zheng, C., Zhou, Y., Huang, C., Feng, D., Xu, Q., Wu, Y., Hong, D., Wang, Z., Lin, Y., Zhang, T., Kumar, P., Plaza, A., Chanussot, J., Zhang, J., Shi, J., and Wang, L.: Artificial intelligence for geoscience: Progress, challenges, and perspectives, Innovation, 5, https://doi.org/10.1016/j.xinn.2024.100691, 2024.
Žust, L., Fettich, A., Kristan, M., and Licer, M.: HIDRA 1.0: deep-learning-based ensemble sea level forecasting in the northern Adriatic. Geosci. Model Dev., 14, 2057–2074, https://doi.org/10.5194/gmd-14-2057-2021, 2021.