
the Creative Commons Attribution 4.0 License.
the Creative Commons Attribution 4.0 License.
 | 07 Aug 2026

Drivers of flash flood frequency and intensity in the United States: a quantitative analysis of hydrometeorological interactions
Ying Hu
Huan Wu
Yiwen Mei
Zhijun Huang
Aihui Wang
Chaoqun Li
Bing Sui
Inconsistent changes in precipitation and flooding have spurred investigations into the underlying mechanisms, yet the quantitative understanding of interactions between precipitation, temperature, and land cover in streamflow dynamics remains limited. We investigate streamflow changes in 294 small and medium-sized catchments across the contiguous United States (CONUS), using over 30 years of hourly data from the USGS river-watching network. We find that 17.3 % of catchments exhibit significant increases in flash flood frequency (p < 0.05), though not all of these trends remain significant after correction for multiple comparisons; 6.5 % show significant increases in flashiness, while the majority experience no substantial changes. Despite significant upward trends in sub-daily heavy precipitation frequency at 67 % of stations, only 23 % show flood frequency increases, indicating complex catchment-specific hydrometeorological interactions. To quantify the contributions of precipitation, temperature, and land cover changes, we employ a novel time-space varying distributed unit-hydrograph (TS-DUH) model integrated with the DRIVE hydrological model and random forest regression. The results reveal that land cover changes across these predominantly upstream, forested catchments have remained stable over the past four decades, with 90.8 % of catchments showing minimal flow change (within ± 3 %) from 1985 to 2015. Precipitation emerges as the primary driver of streamflow changes, but rising temperature and evapotranspiration mitigate the expected increases in flood frequency and intensity associated with heavier precipitation. Model sensitivity experiments show a 3.6 % reduction in flood frequency and an 8.0 % reduction in flood intensity since the 1980s. Additionally, in rapidly urbanizing catchments, a 10 % increase in impervious surfaces could lead to a 20 % peak flow increase, highlighting the importance of urbanization in flood risk. These findings enhance the understanding of spatial-temporal variation in flash flooding. They also provide crucial insights for better flood hazard mitigation strategies.
- Article
(9217 KB) - Full-text XML
-
Supplement
(559 KB) - BibTeX
- EndNote


Global warming and human-induced land cover changes are widely acknowledged for their effects on enhancing the hydrological cycles (Winkler et al., 2021; Milly et al., 2008). Observational data consistently show increasing frequency and intensity of heavy precipitation events, thereby amplifying flood risks (Allan and Soden, 2008; Westra et al., 2013; Alexander et al., 2006). Flash floods, which are particularly hazardous due to their rapid onset and intensity, pose significant threats to human safety and socio-economic stability (Ahmadalipour and Moradkhani, 2019; Khajehei et al., 2020). These growing concerns underline the need for a better understanding of flash flood causes and characteristics to develop effective disaster management strategies.
While significant progress has been made in analyzing historical flood changes through long-term discharge records (Merz et al., 2021; Slater and Villarini, 2016; Archfield et al., 2016; Liu et al., 2022), the study of flash flood trends is hindered by the lack of high-quality, long-term sub-daily observational data, particularly for small catchments (Gourley et al., 2013; Gaume and Borga, 2008). This data gap, coupled with short time spans, limited spatial coverage, and infrequent observations, complicates the attribution of changes in flash flood behavior. Flash flood dynamics are influenced by the interaction of multiple drivers within the hydrometeorological system (Hapuarachchi et al., 2011; Borga et al., 2014). The mechanisms of precipitation-runoff processes across various landscapes are complex, and the current understanding remains limited (De Niel and Willems, 2019; Merz et al., 2012). Furthermore, in the context of land surface environmental changes and climate warming driven by human activities, the mechanisms behind flood occurrence have become increasingly complex. Therefore, a comprehensive investigation into the trends and causes of flash flood changes not only enhances our understanding of flash flood behavior but also provides a scientific foundation for future risk management and policy development related especially to flash floods.
In the study of attributing changes in flood characteristics, the roles of climate change and land use/land cover (LULC) changes have been increasingly focused (Wagener et al., 2010). In order to comprehensively evaluate these effects, researchers have widely employed methods such as hydrological models (Frans et al., 2013), statistical analysis (Blum et al., 2020), Budyko theory (Wang and Hejazi, 2011) and machine learning techniques (Jiang et al., 2022; Kemter et al., 2023). Climate-related changes, such as increased precipitation frequency and intensity, are widely recognized as the primary drivers of runoff ratio (Wang et al., 2022) and streamflow change (Slater et al., 2021). It is widely acknowledged that increasing impervious surfaces can intensify the hydrological response to precipitation events (De Niel and Willems, 2019); however, the extent of this impact remains uncertain (Blum et al., 2020; Debbage and Shepherd, 2018; Anderson et al., 2022).
Numerous studies utilizing historical observational data have revealed a lack of systematic increase in flood intensity, despite observed increases in extreme precipitation (Sharma et al., 2018; Archfield et al., 2016; Bloeschl et al., 2017; Do et al., 2017; Liu et al., 2022). The low signal-to-noise ratio in hydrological data, coupled with the inherent complexity of rainfall-runoff processes, hinders the derivation of a unified conclusion to explain this inconsistency (Wasko and Nathan, 2019; Hall et al., 2014). Current research indicates that the inconsistency between changes in precipitation and flooding can be attributed to several factors: rising temperature and decreased soil moisture (Sharma et al., 2018; Wasko and Sharma, 2017; Wasko and Nathan, 2019; Ivancic and Shaw, 2015), although the accelerating global transition toward flash droughts may paradoxically amplify flood response through altered soil hydrological properties when intense precipitation follows prolonged dry periods (Yuan et al., 2023; Barendrecht et al., 2024); the complexity arising from diverse flood generation mechanisms, leading to signal mixing (Zhang et al., 2022); and the varying hydrological responses to precipitation events of differing magnitudes (Brunner et al., 2021). While the impact of rising temperatures on flooding is increasingly recognized, quantitative assessments of flood intensity and frequency remain limited, and the comprehensive effects of LULC require further investigation (Sharma et al., 2018; Ivancic and Shaw, 2015). No consensus has been reached regarding the dominant influence of climate change and land cover change. The majority of research on flood changes utilizes daily data because of the availability of relatively longer time series; however, only a few studies have conducted trend attribution analyses of annual maximum flow using sub-daily data (Kemter et al., 2023; Hodgkins et al., 2019). Understanding abrupt flash floods depends on further study of sub-daily event intensity, frequency, and duration in small and medium watersheds (Carmen Llasat et al., 2016). This necessitates a quantitative analysis of changes in sub-daily flash flood characteristics, and the interactive effects of climate and land cover change on streamflow and flash floods.
In this study, we investigate the trends in flash flood intensity and frequency over the past 30 years (1990–2020) across the contiguous United States (CONUS), utilizing extensive observational instantaneous streamflow data from the United States Geological Survey (USGS) in small and medium-sized catchments (drainage area < 3000 km2). Subsequently, the random forest regression method is used to quantify the impact of climate variables and land cover changes, as well as their interactions, on flash floods. Furthermore, we employ the Dominant River Tracing-Routing Integrated with VIC Environment (DRIVE) model (Wu et al., 2011, 2012a, 2014), alongside a newly developed Time-Space varying Distributed Unit Hydrograph (TS-DUH) model (Hu et al., 2024), driven by DRIVE, to quantitatively assess the impacts of temperature and land cover changes on flash floods. We aim to enhance understanding of flash flood trends and their driving factors, providing valuable insights for improving flood risk management and policy formulation across the CONUS.
This paper is organized as follows: Sect. 2 describes the methodology used for analysis. Section 3 introduces the study catchments and datasets. Section 4 presents the results and analysis, including trends in the magnitude and frequency of heavy precipitation, flash floods, and other variables, as well as their impact on flash floods. Finally, Sect. 5 provides discussion and conclusions based on the study results.
This section outlines the methods used to detect trends in flash flood characteristics and assess their relationship with hydrometeorological variables. Initially, time series datasets for hydroclimatic variables, including streamflow records, precipitation, air temperature, potential evapotranspiration, and soil moisture, were compiled and subsequently analyzed for trends. To quantify the relative contributions of climatic factors (precipitation, temperature), land cover change, and their interactions to annual maximum streamflow, the Random Forest regression model was employed. Additionally, to explore the link between streamflow and temperature, we use both scaling curves and the DRIVE hydrological model for observed and simulated analyses. The DRIVE model, coupled with the TS-DUH model, was used to quantitatively assess the impact of land cover change on the streamflow response. This multi-method approach aims to provide a mechanistic understanding of the key drivers behind changes in flash flood frequency and intensity.
2.1 Extraction of hydrological and climatic characteristics based on observations
In this study, flash floods are operationally identified as rapid, high-intensity runoff responses of short duration, characterized solely from instantaneous streamflow hydrographs without imposing a rainfall duration criterion (Hapuarachchi et al., 2011). This study focuses on small-to-medium catchments (drainage area < 3000 km2). Flash flood streamflow characteristics were extracted using two approaches: the Annual Maximum Flow (AMF) method and the Peaks Over Threshold (POT) method (Lang et al., 1999). The AMF method refers to the practice of identifying the highest peak flow for each year from a given record of streamflow data. Throughout this study, flood intensity denotes peak flow magnitude (m3 s−1), as quantified by AMF and Peaks-over-threshold magnitude (POTM). For the POT method, the discharge threshold was iteratively determined for each station to achieve an average of two flood events per year, yielding time series data for both the number of flash flood events and peak flows. To ensure inter-event independence and appropriately handle multi-peak hydrographs, events were included in the POT time series only if they satisfied both of the following criteria:
Here, Eq. (1) prescribes a minimum inter-event separation (D, in days) that scales with catchment area (A, in km2). Equation (2) requires the minimum inter-peak discharge (Qmin) to fall below 75 % of the lesser adjacent peak (Q1 and Q2); when this condition is violated, the peaks are treated as a single event and only the maximum is retained. Unlike the AMF method that ensure at least one event per year, the POT method extracts only flood events that exceed a predetermined threshold. This means in dry years, the maximum flow recorded by AMF may not be identified as a flood event.
Table 1Summary of hydrological and climatic variables used for flood trends analysis.
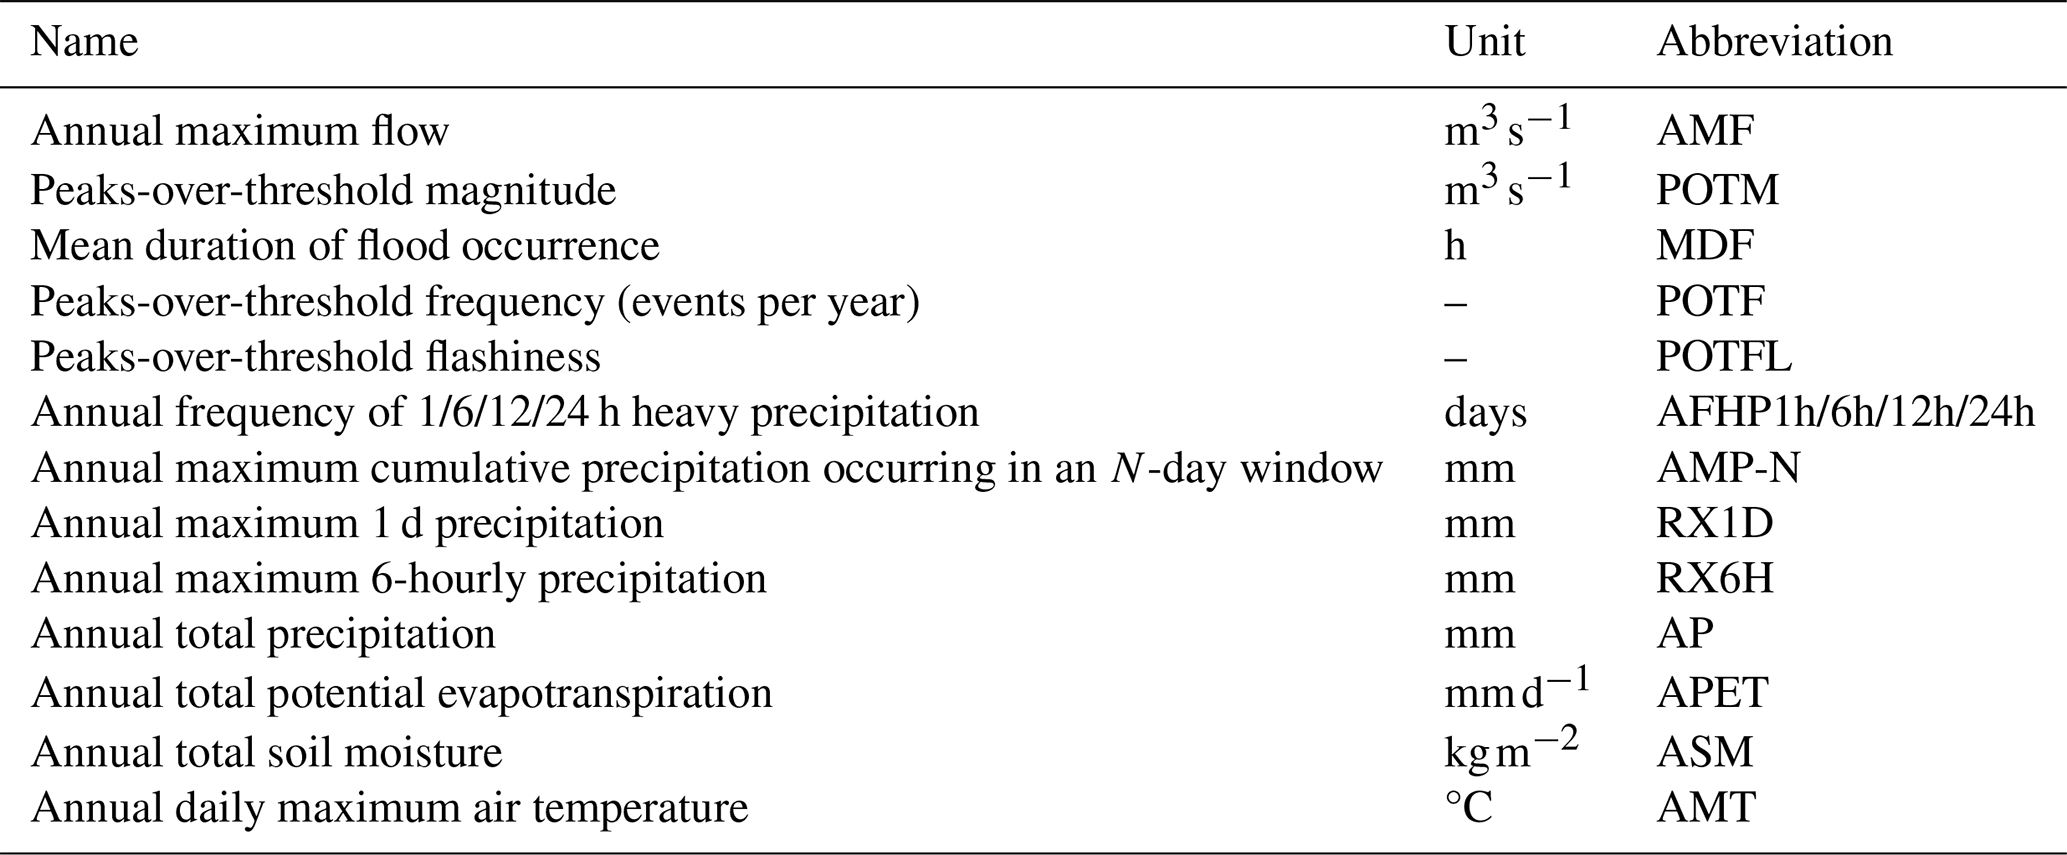
Catchment boundaries for each basin were delineated using the hierarchical dominant river tracing (DRT) algorithm (Wu et al., 2011, 2012b), employing 90 m resolution Flow Direction Raster (FDR) data. Basin-averaged temperature (°C), precipitation, and potential evapotranspiration (PET, mm d−1) were subsequently calculated. The hydrometeorological variables used for trend detection are listed in Table 1. A threshold of 95th percentile precipitation was employed to define heavy precipitation events (Mallakpour and Villarini, 2015). To capture differences in sub-daily (1, 6, and 12 h) and daily (24 h) precipitation patterns, we analyzed the annual frequency of heavy precipitation (AFHP) at multiple timescales. These time windows were selected to span the plausible range of catchment concentration times across our study domain. Annual maximum 1 d precipitation (RX1D) was calculated by summing hourly precipitation for each calendar day. Additionally, the annual maximum cumulative N-day precipitation (AMP-N) was analyzed, where n=log (0.386A), A is defined in Eq. (1) (Slater and Villarini, 2016). This formulation adapts the accumulation window to each catchment's response time. The mean duration of flood occurrence (MDF) was calculated as the average time span of each POT event above the threshold. The Peaks-over-threshold flashiness (POTFL) is calculated as the difference between the peak discharge and action stage discharge normalized by the flooding rise time and basin area (Saharia et al., 2017). In addition to streamflow and precipitation metrics, we analyzed annual daily maximum air temperature (AMT, °C), annual total potential evapotranspiration (APET, mm d−1), and annual total soil moisture (ASM, kg m−2) to characterize the thermal and moisture conditions influencing flood generation.
2.2 Trend detection
Trend detection in hydroclimatic time series was performed using the non-parametric Mann–Kendall (MK) test (Mann, 1945; Kendall, 1948). The MK test's robustness to non-normality and versatility across diverse datasets make it suitable for analyzing streamflow, precipitation, temperature, and potential evapotranspiration time series at individual stations. Additionally, trends in event occurrence data, including zero-event counts, were further assessed using Poisson regression, a method well-suited to analyzing discrete variables such as flood or heavy rainfall frequency (Mallakpour and Villarini, 2015; Slater and Villarini, 2016). Statistical significance was evaluated at the 5 % level.
2.3 The DRIVE and TS-DUH models
The DRIVE model is a distributed hydrological model developed by coupling the Variable Infiltration Capacity (VIC) land surface model (Liang et al., 1996) and the Dominant River Tracing based Routing (DRTR) model (Wu et al., 2012a, b, 2014). The Global Flood Monitoring System (GFMS) has consistently monitored and forecasted flood occurrences and developments for over a decade, utilizing the DRIVE model informed by satellite precipitation data (Hou et al., 2014; Kirschbaum et al., 2017). Within the DRIVE model, the runoff generation process is derived based on a variable infiltration curve that considers the subgrid heterogeneity of infiltration capacity and multiple soil infiltration layers (Cherkauer et al., 2003; Liang et al., 1996). River discharge, surface water storage, water level, and other streamflow variables are derived for each time step by solving the kinematic wave equations for each river path within the hierarchically organized river network defined by DRT algorithm (Wu et al., 2014). The DRIVE model has undergone extensive justification and validation worldwide and has demonstrated reliable performance (Wu et al., 2019, 2014, 2017; Nanding et al., 2021; Huang et al., 2021, 2023; Yan et al., 2020). In this study, the DRIVE model is run at a 0.125° spatial resolution with a 3-hourly time step. The hydrography dataset (e.g., FDR, Strahler order, flow accumulation) is derived using the DRT algorithm. To incorporate land cover information into DRIVE, the high resolution land cover data (details in Sect. 3) were reclassified to match the land cover classification scheme used in DRIVE by aggregating the original fine categories into broader land cover types via a cross-walking table, and subsequently processed to determine the fractional area of each land cover type within each 0.125° model grid cell. These fractional areas were then used to derive grid-averaged vegetation parameters within DRIVE, such as leaf area index, albedo, and roughness length, from the VIC parameter library, reflecting the composite land cover characteristics of each grid cell.
Our newly developed TS-DUH model, integrated with and driven by runoff outputs from the DRIVE model, was employed to refine flood peak estimation under different LUCC scenarios and to contribute to the separation of precipitation and LUCC impacts on streamflow. The TS-DUH model is designed for efficient flash flood analysis by estimating flow velocity and travel time based on topographic and hydroclimatic characteristics, emphasizing the dynamic contributions of runoff linked to variations in rainfall and soil moisture (Hu et al., 2024). The TS-DUH model operates at a significantly finer spatial resolution of 90 m. It leverages high-resolution DEM data for detailed flow path delineation and topographic analysis. In TS-DUH, Manning's roughness coefficients (n) for each grid cell are derived as the area-weighted average of n values assigned to the underlying 30 m land cover pixels. These n values determine spatially distributed flow velocities, thereby capturing the influence of land surface characteristics on flood wave propagation at a finer scale.
2.4 Analysis of potential driving factors
A random forest regression model (Breiman, 2001) was developed using AP, AFHP6h, AFHP12h, RX1D, RX6H, AMP-N, APET, AMT, ASM and TS-DUH simulated peak flows under varying land cover conditions (with values linearly interpolated for intervening years to represent land cover change) for each catchment to identify the relative importance of different drivers of AMF changes. Random Forest is an ensemble method that improves prediction accuracy and robustness by aggregating multiple decision trees, effectively modeling complex non-linear relationships. For each catchment, hyperparameters were independently optimized using the Tree-structured Parzen Estimator (TPE) algorithm (Bergstra et al., 2011), with the data split into 80 % training and 20 % validation sets and the R2 on the validation set maximized over 100 evaluations. The optimized hyperparameters include n_estimators (50–500), max_depth (None or 10–40 in steps of 10), min_samples_split (2–20), and min_samples_leaf (1–10). Finally, the mean decrease in impurity (MDI) scores were then used to rank variable contributions. For each catchment, the inflection point of the cumulative curve of ranked MDI values (the rank of maximum absolute second-order difference) was used to guide the choice of a single fixed MDI threshold, applied uniformly across all catchments to separate primary from marginal drivers. These primary drivers were further categorized into three types: precipitation (including AP, AFHP6h, AFHP12h, AMP-N, RX1D and RX6H), land cover (TS-DUH peak flows), and temperature (AMT, ASM and APET).
In order to investigate the drivers of observed trends, this study focuses on precipitation, temperature, and land cover change. Firstly, streamflow (Q) and precipitation (P) scaling curves with temperature and P∼T-were developed to characterize the relationships between these variables (Wasko and Sharma, 2017; Zhang et al., 2022; Yin et al., 2018). For each catchment, daily maximum air temperatures were averaged, and standardized peak flows (at catchment outlets) and maximum 3-hourly accumulated precipitation (for each POT event) were grouped into equally spaced temperature bins. The 99th percentile of streamflow and precipitation within each bin was calculated, and these conditional quantiles were connected to form the scaling curves. The scaling curves are generated using 2 °C temperature bins with a 1 °C overlap to reduce the sensitivity to bin boundary selection (Lenderink and Van Meijgaard, 2010). Furthermore, events with temperatures below 5 °C were excluded to minimize snowmelt effects (Wasko and Sharma, 2017). Secondly, we use the DRIVE hydrological model to simulate the impact of temperature changes on streamflow (Wu et al., 2011, 2012a, 2014). The DRIVE model was run separately with dynamic temperature data (1981–2020) (referred to as DRIVE-DT) and static temperature data (repeating only the 1981 3-hourly air temperature for each simulation year, while all other meteorological forcing fields remain dynamic) (referred to as DRIVE-ST) at 3-hourly temporal resolution and a 0.125° spatial resolution. Both simulations shared initial conditions; differences in multi-year average streamflow and POTF/POTM were then compared.
Land cover data from 1985 and 2015, reclassified using the International Geosphere-Biosphere Programme (IGBP) classification (Schaperow et al., 2021), were used to drive the DRIVE model, assessing the impact of land use/land cover change (LUCC) on runoff and multi-year average streamflow. The sensitivity of the DRIVE model parameters to land cover has been validated (Jiang et al., 2020). Subsequently, the TS-DUH was applied to further analyze the influence of LUCC on flood peaks during the routing process. Furthermore, the TS-DUH was used to simulate POT events to separate the impacts of precipitation and LUCC on streamflow. The TS-DUH captures the hydrological response of the catchment by accounting for subsurface characteristics, as well as the spatial and temporal dynamics of precipitation and soil moisture distribution (Hu et al., 2024).
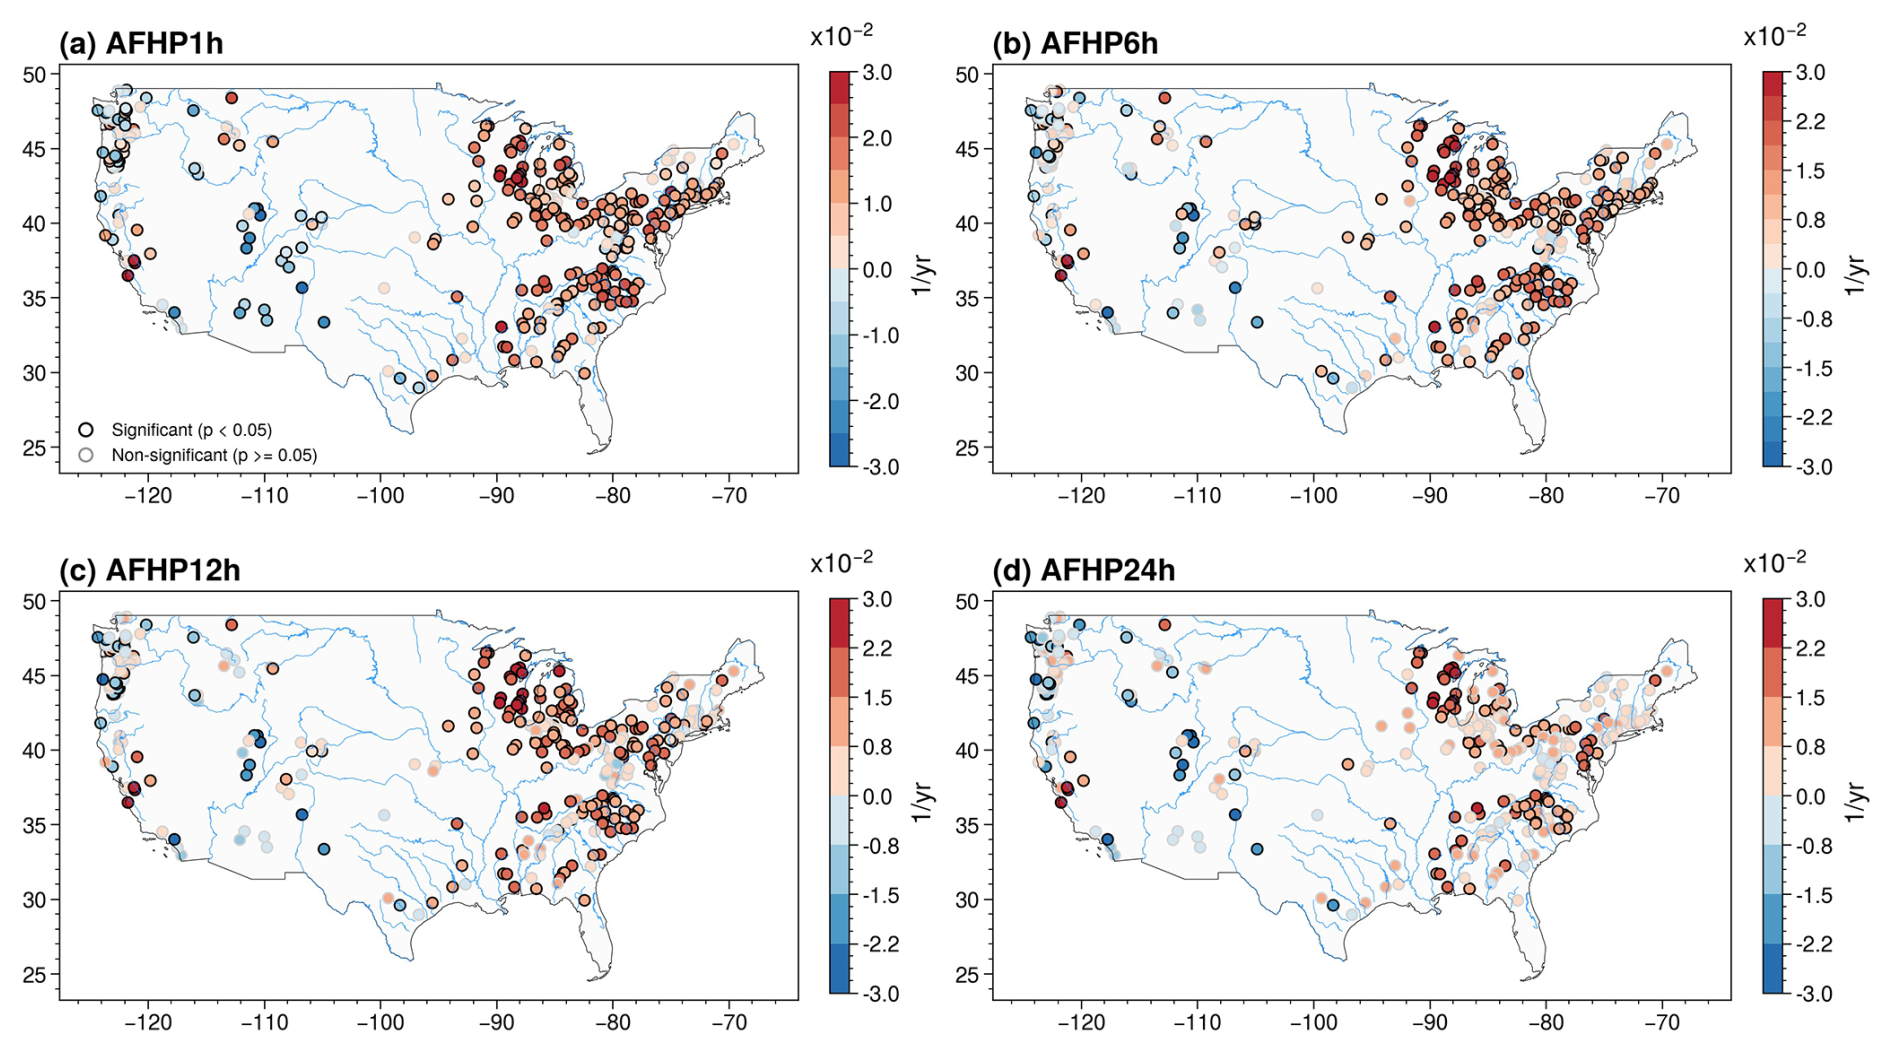
Figure 1Trends in annual frequency of heavy precipitation (AFHP) for AFHP1h (a), AFHP6h (b), AFHP12h (c), and AFHP24h (d), representing 1, 6, 12, and 24 h accumulation periods, respectively. Red represents upward trends, while blue indicates downward trends. Areas outlined in black represent trends that are significant at the 5 % level (both increases and decreases), with slopes estimated using the Theil–Sen estimator.
All instantaneous streamflow data used in this study were resampled to a uniform hourly interval to provide a consistent basis for sub-daily analysis. The selection of gauging stations for this study followed a multi-stage filtering protocol to construct a robust dataset suitable for sub-daily flash flood analysis. An initial screening identified 2492 stations matching the DRT river network (Wu et al., 2014) from the total of 21 344 USGS gauges with an area of less than 3000 km2 (Hu et al., 2024). This pool was then subjected to a stringent data completeness assessment. Recognizing the challenges in obtaining complete year-round hourly instantaneous streamflow records, this assessment focused on the May to September period, which typically exhibits high flash flood activity in many parts of CONUS. A seasonal year was deemed complete only if no gap exceeding six consecutive hours of missing streamflow occurred during the entire May-September window. Stations with fewer than 20 complete seasonal years were subsequently excluded. This criterion balances station density with record quality. Once a station met this selection criterion, all available data across its entire period of record were utilized for the trend analysis to maximize the length of the time series. Furthermore, stations identified as experiencing long-term drought conditions or those with an entire year of unobserved data within the potential analysis period were excluded. This rigorous screening process finally resulted in 294 stations, covering both eastern and western regions of CONUS. No interpolation or gap-filling procedures were applied to the retained records. Notably, no pre-screening was conducted to exclude regulated catchments. The focus on small to medium-sized headwater catchments inherently minimizes the influence of major reservoir operations, though minor regulation effects at some stations cannot be entirely ruled out. The drainage areas of these 294 catchments range from 78.8 to 2985.8 km2, with a median of 885.6 km2 and a mean of 1024.2 km2. Most of the resulting data spanned 1990–2020, with the analysis periods aligned with the available streamflow data.
This study utilized the phase 2 of the North American Land Data Assimilation System (NLDAS-2) precipitation product (Xia et al., 2012) for precipitation trends analysis and to force the DRIVE model, at a 0.125° resolution. Soil moisture data in 0–100 cm were also obtained from NLDAS-2. Atmospheric forcing data (air temperature and wind speed) for the DRIVE model and air temperature trend analysis came from NASA's Modern-Era Retrospective Analysis for Research and Applications version 2 (MERRA-2) (Gelaro et al., 2017), at a 0.5° × 0.625° resolution. The Global Land-Cover product with Fine Classification system at 30 m (GLC_FC30) (Zhang et al., 2021) provided 30 m resolution land cover data for 1985 and 2015. Potential evapotranspiration data were obtained from the Global Land Evaporation Amsterdam Model (GLEAM, version4.1a) at a 0.25° resolution. Finally, catchment characteristics, including the Digital Elevation Model (DEM) and FDR data consistent with Hu et al. (2024), were used to extract the TS-DUH.
4.1 Trends and spatial patterns of heavy precipitation characteristics
Heavy precipitation frequency trends vary across different time scales (Fig. 1). Significant upward trends in 1 h (AFHP1h) and 6 h (AFHP6h) heavy precipitation frequency are observed at approximately 67 % of the stations. However, this proportion decreases to 30 % for 24 h accumulations (AFHP24h). This discrepancy may be attributed to the inherently localized and intense nature of short-duration heavy precipitation events, which can mask consistent trends at longer timescales. Regional analysis reveals increasing trends in heavy precipitation frequency across the eastern CONUS, suggesting a heightened risk of flash flooding, while western regions show decreasing trends.
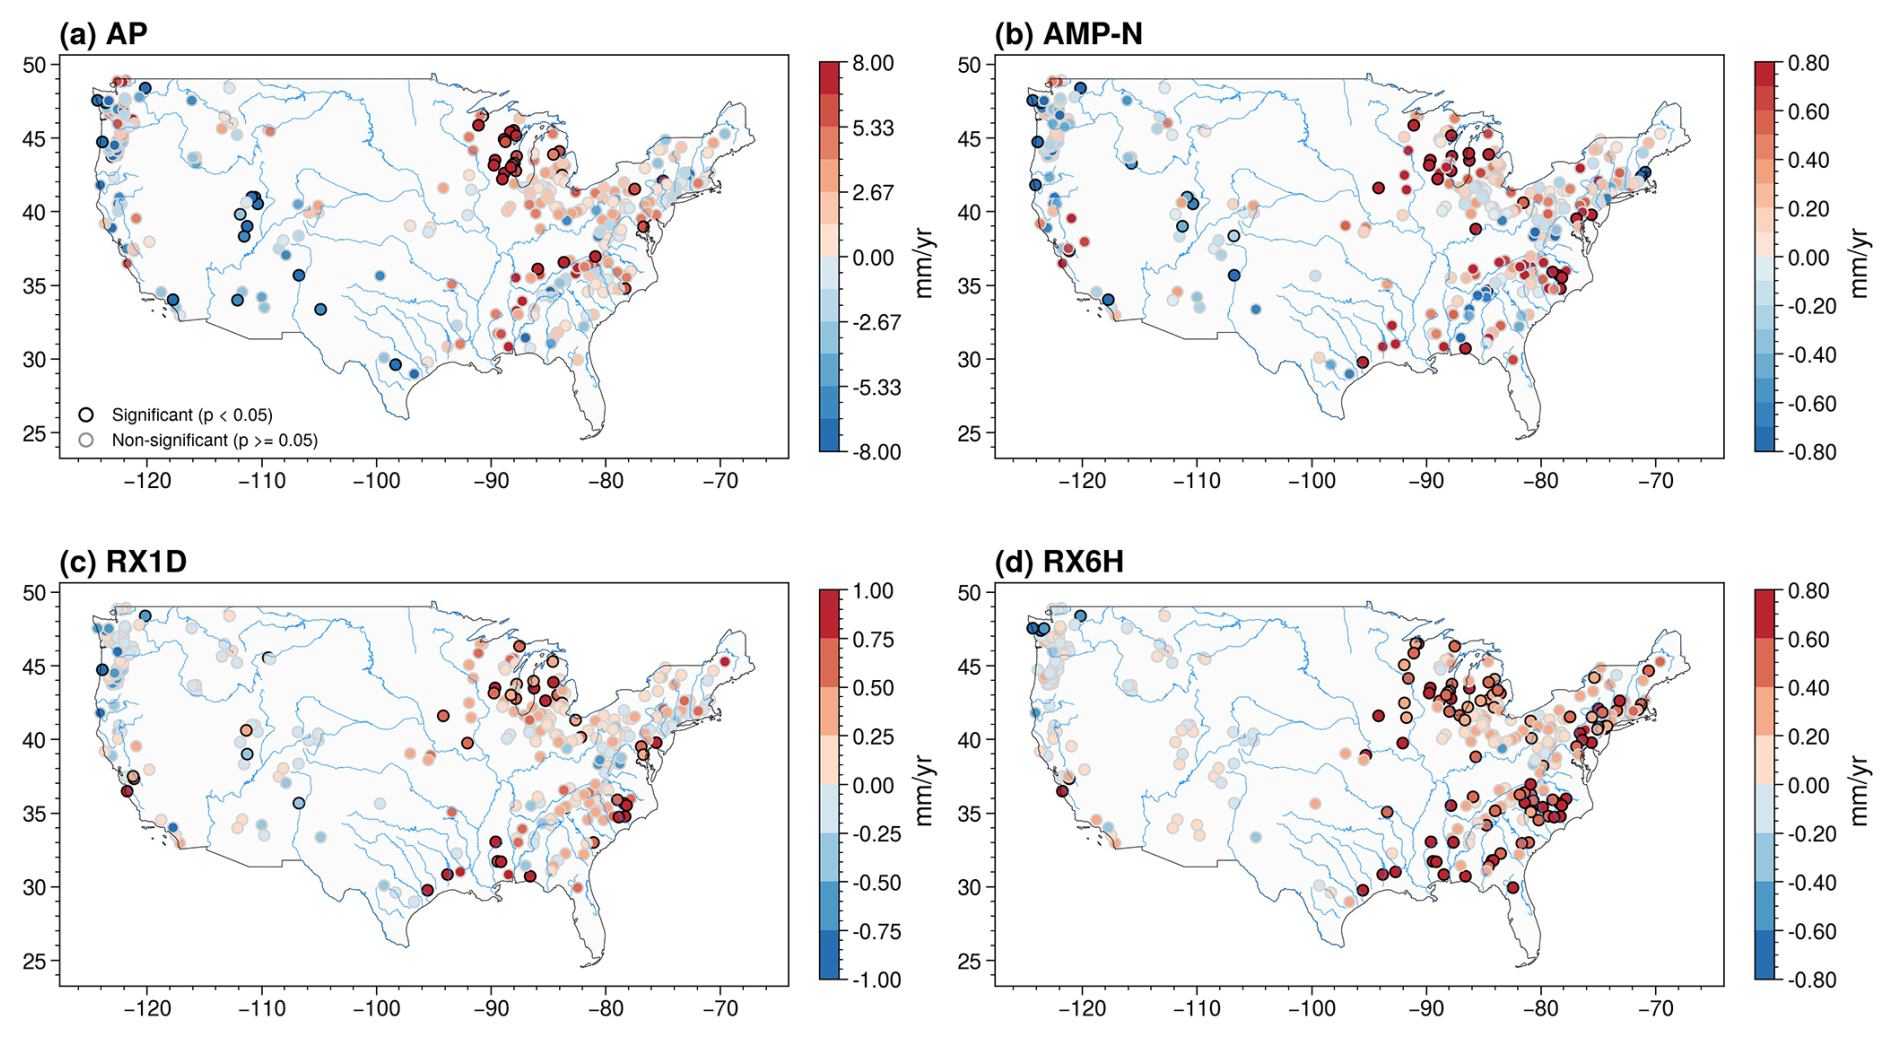
Figure 2Trends in annual total precipitation (AP, a), annual maximum cumulative N-day precipitation (AMP-N, b), annual maximum 1 d precipitation (RX-1D, c), and annual maximum 6-hourly precipitation (RX6H, d). The color bar descriptions are consistent with those in Fig. 1.
Regarding intensity, significant increasing trends are observed in RX1D at 12.6 % of stations and in RX6H at 33.7 % (Fig. 2). Spatially, the distribution of these intensity trends is largely consistent with the observed changes in heavy precipitation frequency. Specifically, the increase in RX1D and RX6H near the Gulf of Mexico is considerably greater than that of AMP-N, likely due to increased hurricane influences (Emanuel, 2005; Balaguru et al., 2023).
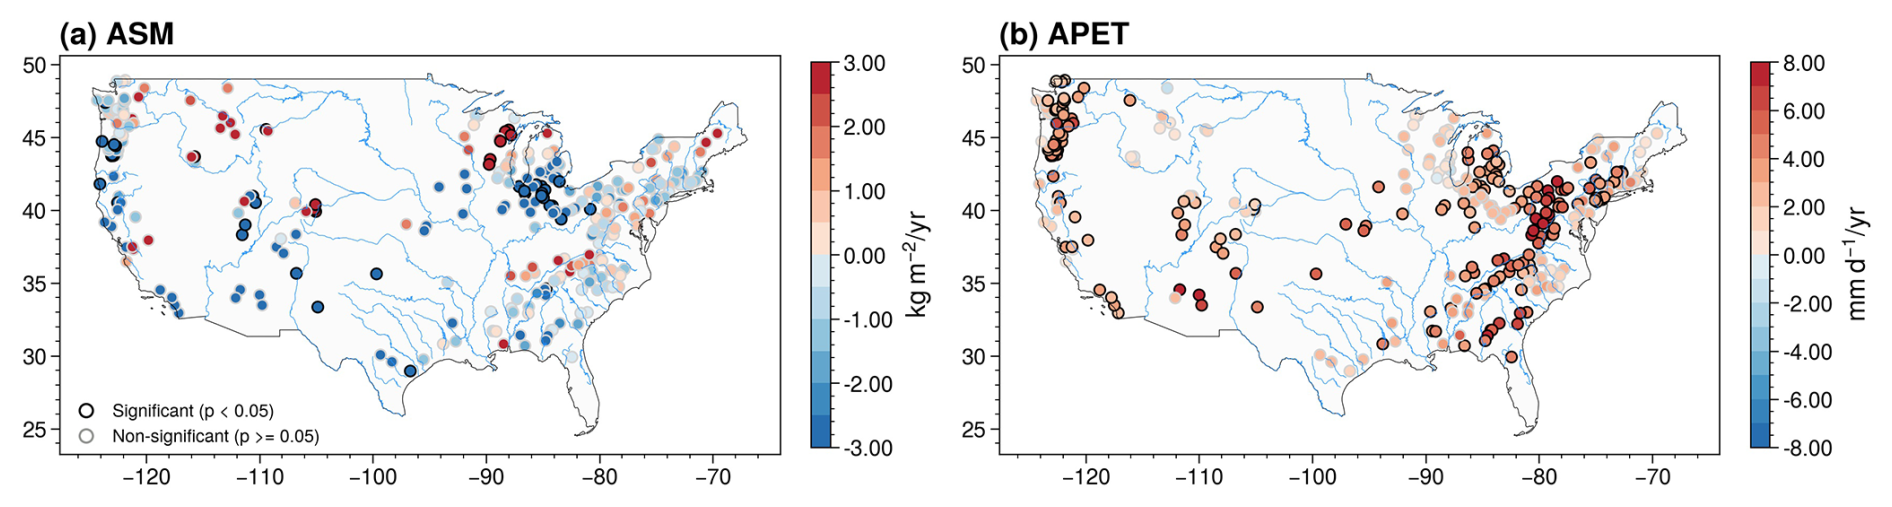
Figure 3Trends in annual total soil moisture (ASM, a), and annual total potential evapotranspiration (APET, b). The color bar descriptions are consistent with those in Fig. 1.
4.2 Trends and spatial patterns of soil moisture and PET characteristics
Soil moisture (ASM) trends exhibit varied patterns across the studied catchments (Fig. 3a). Approximately 10.9 % of catchments show a significant downward trend in ASM, while 3.7 % exhibit a significant upward trend. Overall, a decreasing trend in ASM is observed in approximately 65.3 % of catchments, with the remaining 34.7 % showing an increasing trend, irrespective of statistical significance. This widespread drying trend in antecedent soil moisture may significantly impact runoff generation. Consequently, a decreasing trend in ASM may act as a dampening effect on flood magnitudes and frequencies. Concurrently, a significant increase in APET was observed in over half of the catchments (58.2 %), which is typically associated with rising temperatures and a heightened demand for atmospheric water vapor (Dai et al., 2004). While increased precipitation may have an indirect effect on APET, analysis reveals a mean correlation of −0.35 between AP and APET across all catchments, and −0.39 in the eastern region (east of 100° W), suggesting a weak inverse relationship. Increased precipitation generally leads to higher humidity and lower vapor pressure deficit (VPD), reducing atmospheric demand for water. Nevertheless, the overall effect also depends on local conditions, including air temperature, wind speed, and radiation (Li et al., 2022). The combined effect of increasing APET and overall decreasing soil moisture highlights a shifting hydrological regime that could influence flood processes.
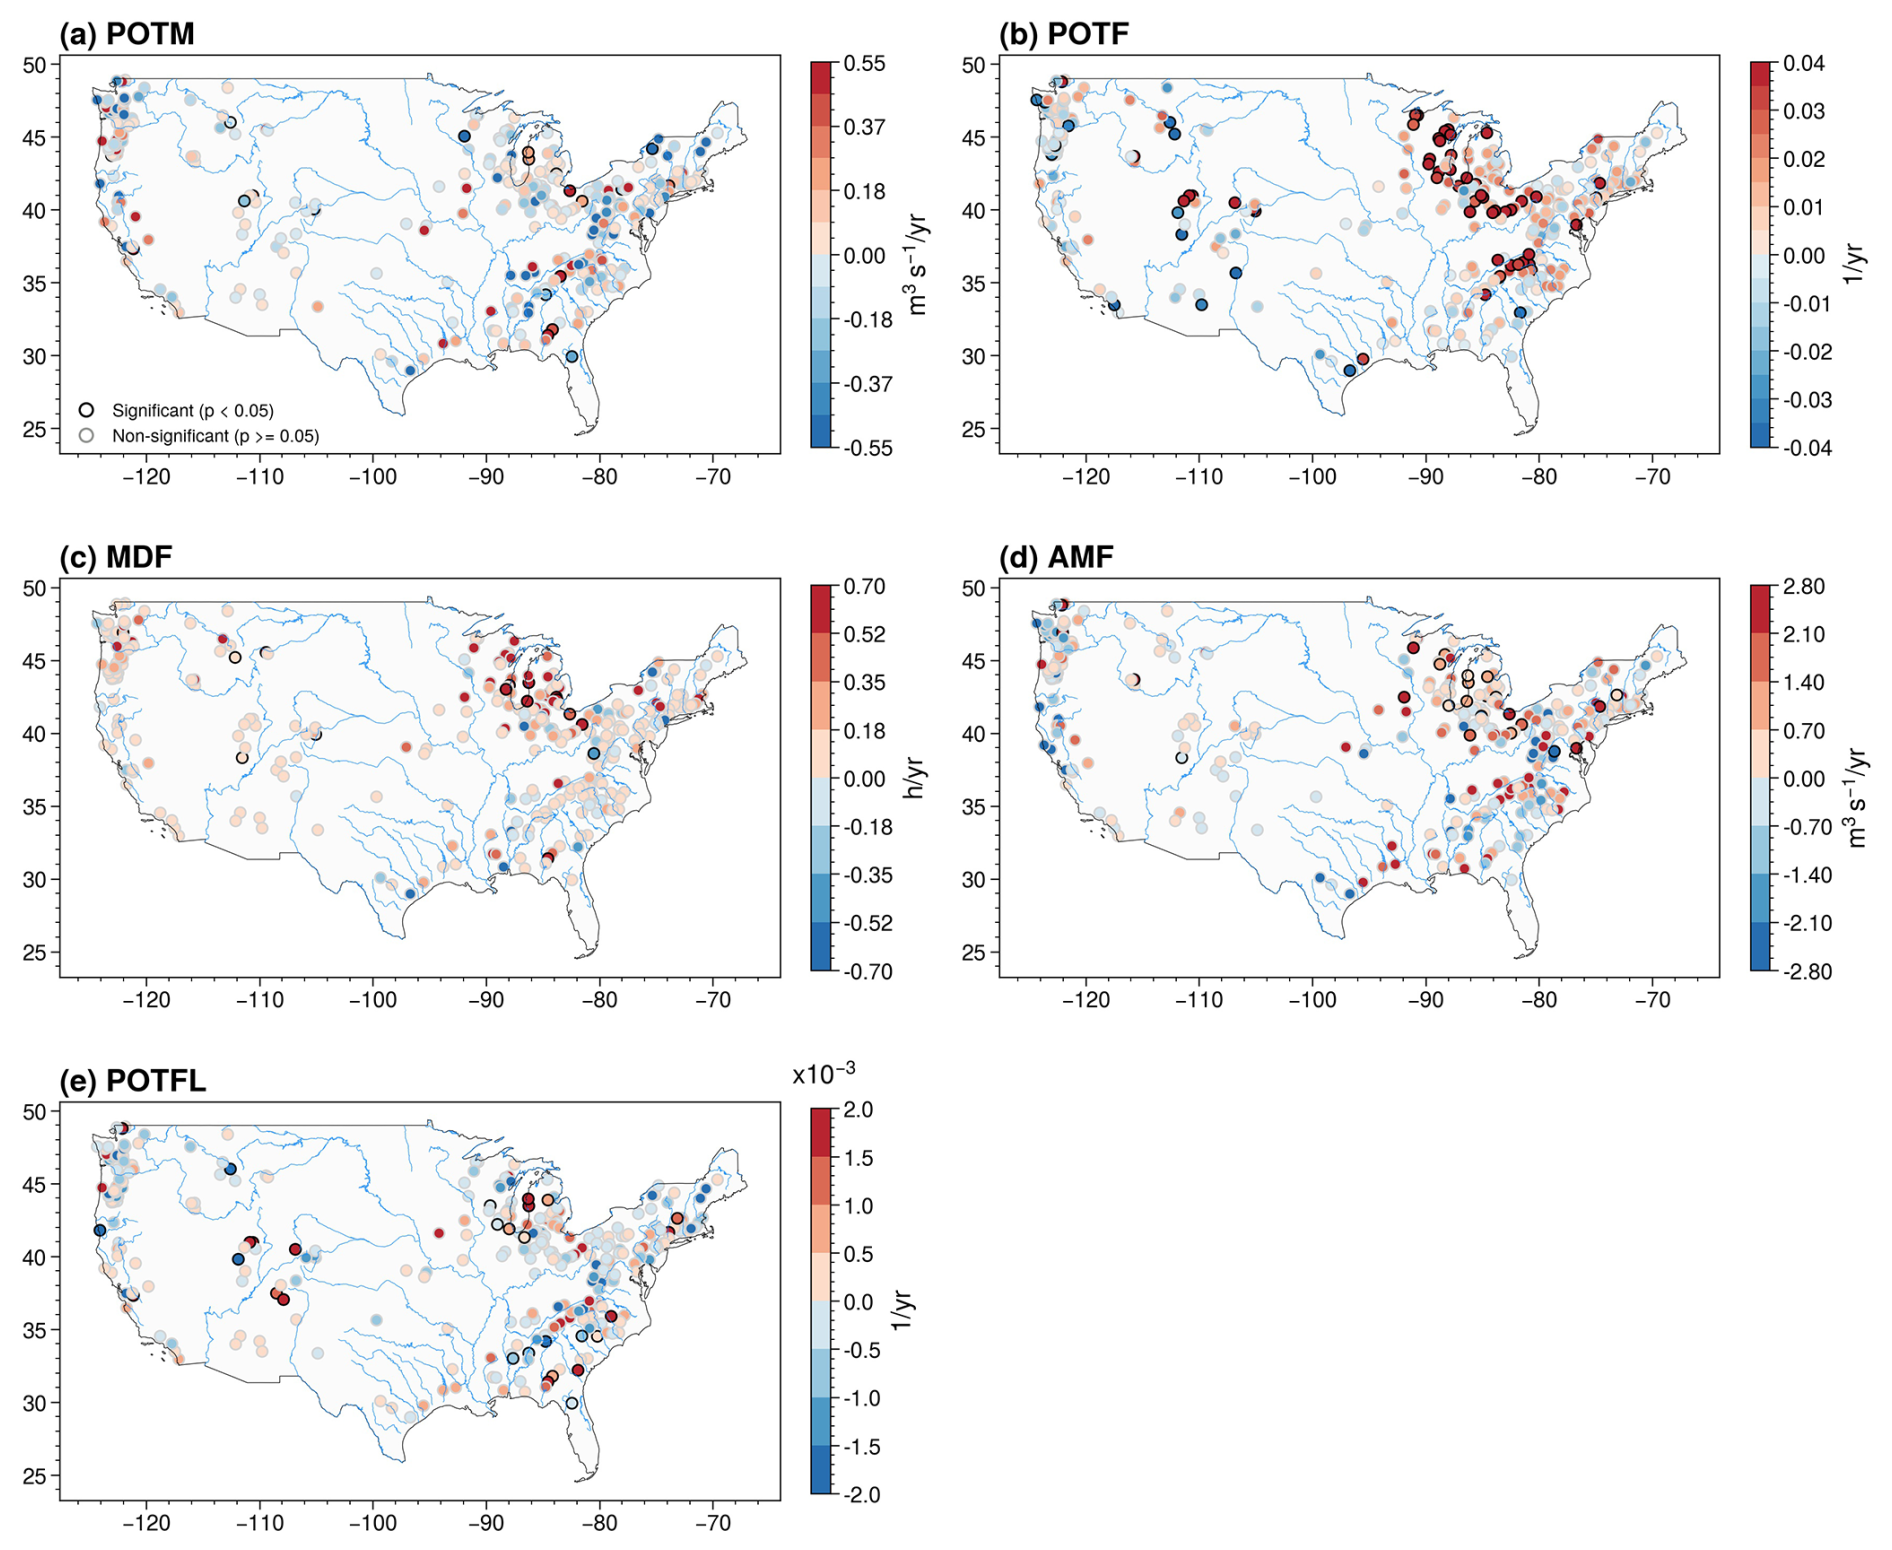
Figure 4Trends in Peaks-over-threshold magnitude (POTM, a), Peaks-over-threshold frequency (POTF, b), mean duration of flood occurrence (MDF, c), annual maximum flow (AMF, d) and Peaks-over-threshold flashiness (POTFL, e). The color bar descriptions are consistent with those in Fig. 1.
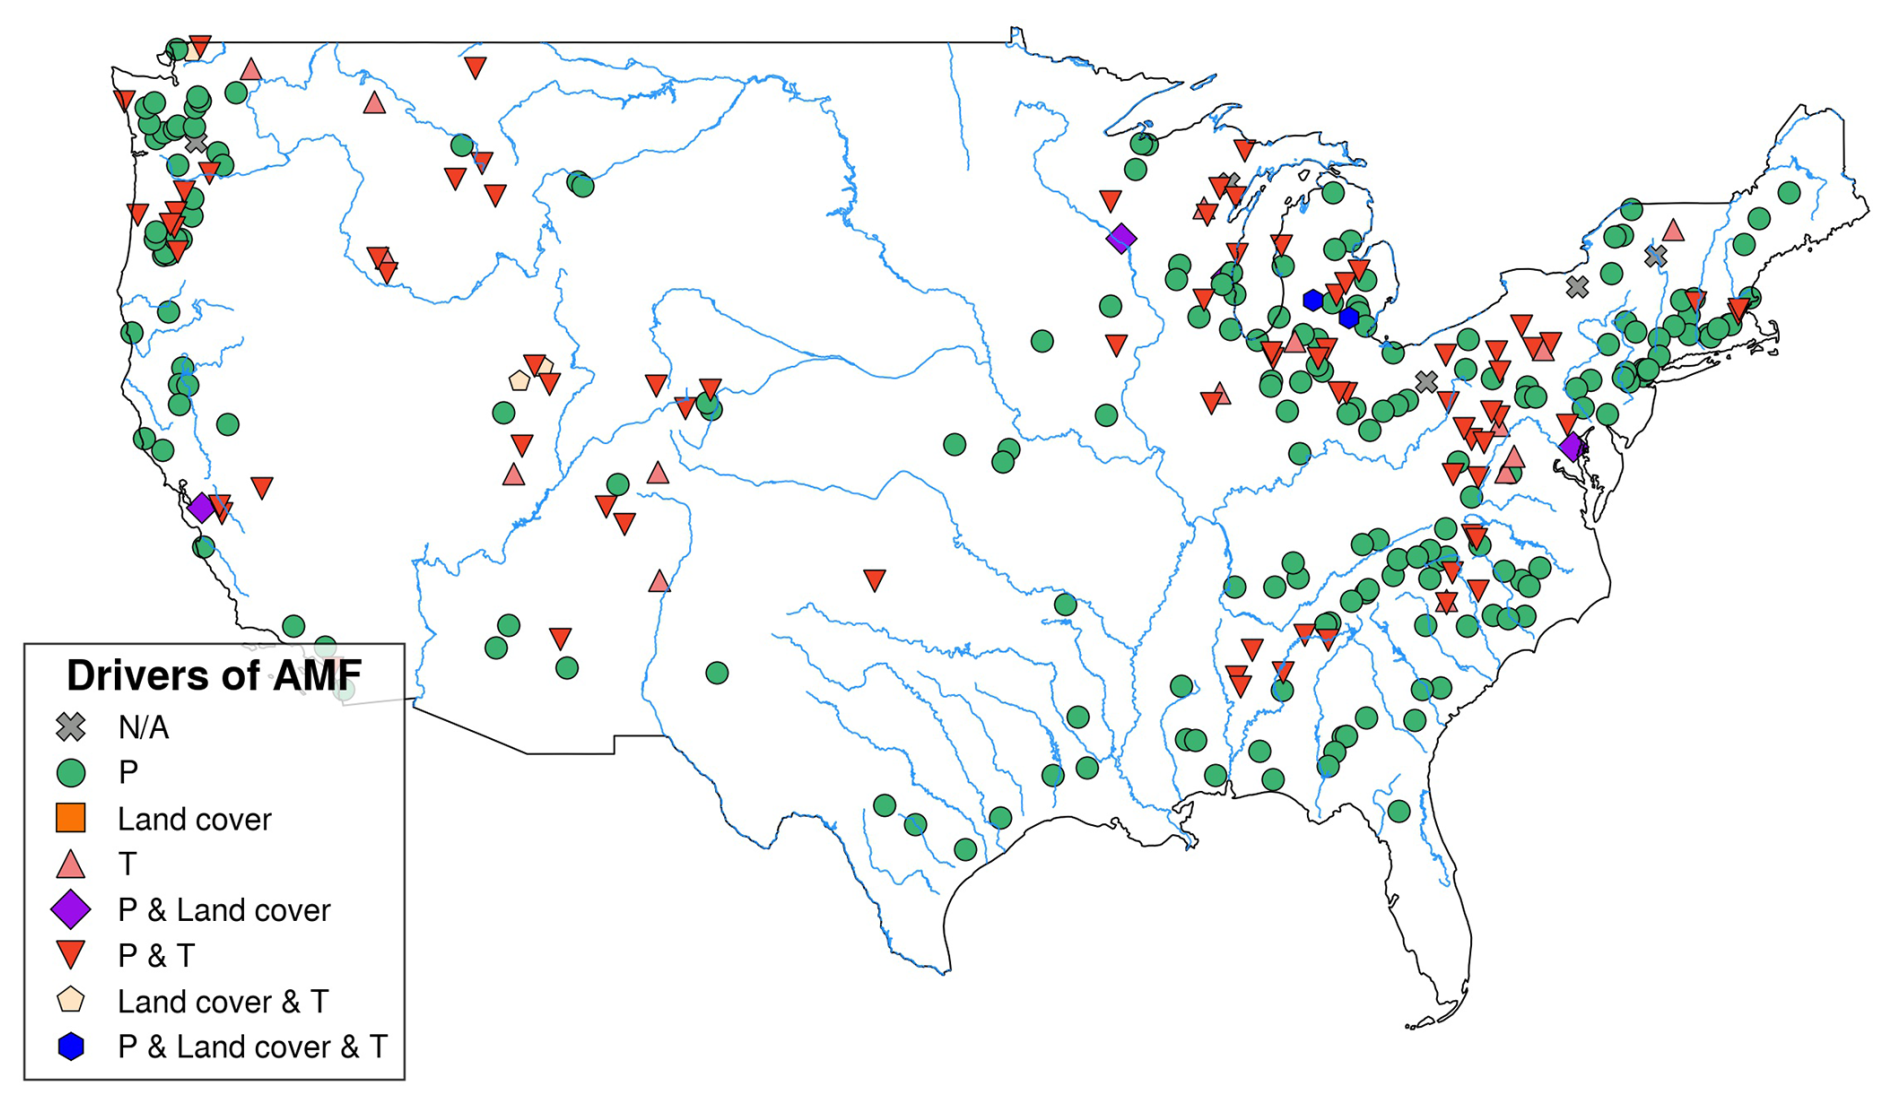
Figure 5Spatial distribution of the drivers influencing annual maximum flow (AMF) trends. Colors indicate the dominant drivers of AMF trends: precipitation (P, as a green circle), land cover (as an orange square), temperature (T, as a pink triangle), and their combinations. Gray points indicate areas where no significant driver has been identified (N/A).
4.3 Trends and spatial patterns of flash flood characteristics
Analysis of flash flood frequency and intensity trends reveals considerable spatial variability among catchments (Fig. 4). 17.3 % of catchments exhibit a significant upward trend in POTF, increasing by an average of 0.5 events per decade; conversely, 5.1 % show a significant downward trend, with an average decline of 0.4 events per decade. AMF displays limited statistically significant changes in most catchments, only 7.1 % exhibit a significant increase (average 2.5 ), and 1.4 % show a significant decrease (average 3.3 ). Additionally, 3.7 % of catchments exhibit a significant increase in POTM, 3.1 % show a significant decrease. Approximately 6.5 % of catchments show a significant upward trend in POTFL, with 3.4 % exhibiting a significant downward trend. Moreover, MDF shows a significant increase in 4.1 % of catchments (average 1.5 h decade−1), while showing a significant decrease in only 0.3 % (average 0.12 h decade−1). The observed MDF is generally on the order of tens of hours (median 21 h). While Sect. 4.1 revealed that approximately 67 % of stations experienced significant upward trends in AFHP6h, only 23 % of catchments exhibited a corresponding significant increase in POTF, suggesting complex catchment-scale interactions among precipitation, temperature, and land cover. Furthermore, statistical trends for catchments with drainage areas less than 1000 km2 (169 stations) showed only minor numerical differences compared to the overall trends.
Regionally, the spatial distribution of POTF trends mirrors the distribution of heavy precipitation frequency, consistent with our previous global-scale study (Yan et al., 2020) demonstrating a stronger correlation between flood frequency and daily precipitation frequency, especially at mid- to high-range daily frequencies. While heavy precipitation frequency significantly increased across much of the eastern CONUS (Fig. 1), significant POTF increases were concentrated near the Great Lakes and in the Appalachian Mountains (Fig. 4). Conversely, a limited number of catchments exhibit a significant decrease in POTF in the western CONUS, consistent with the reduced heavy precipitation trends observed in Sect. 4.1. The changes in flash flood intensity (AMF and POTM) exhibit a more mixed pattern, with POTM showing a higher number of declining catchments compared to AMF. The upward trend in MDF is most pronounced in the Great Lakes and northwestern CONUS. This is likely linked to warmer temperatures accelerating snowmelt, leading to more frequent and prolonged spring floods. The combination of increased precipitation, winter snowpack, and spring snowmelt in the Great Lakes region extends flood duration. Similarly, in the mountainous Northwest, combined snow and rain prolong spring flood events.
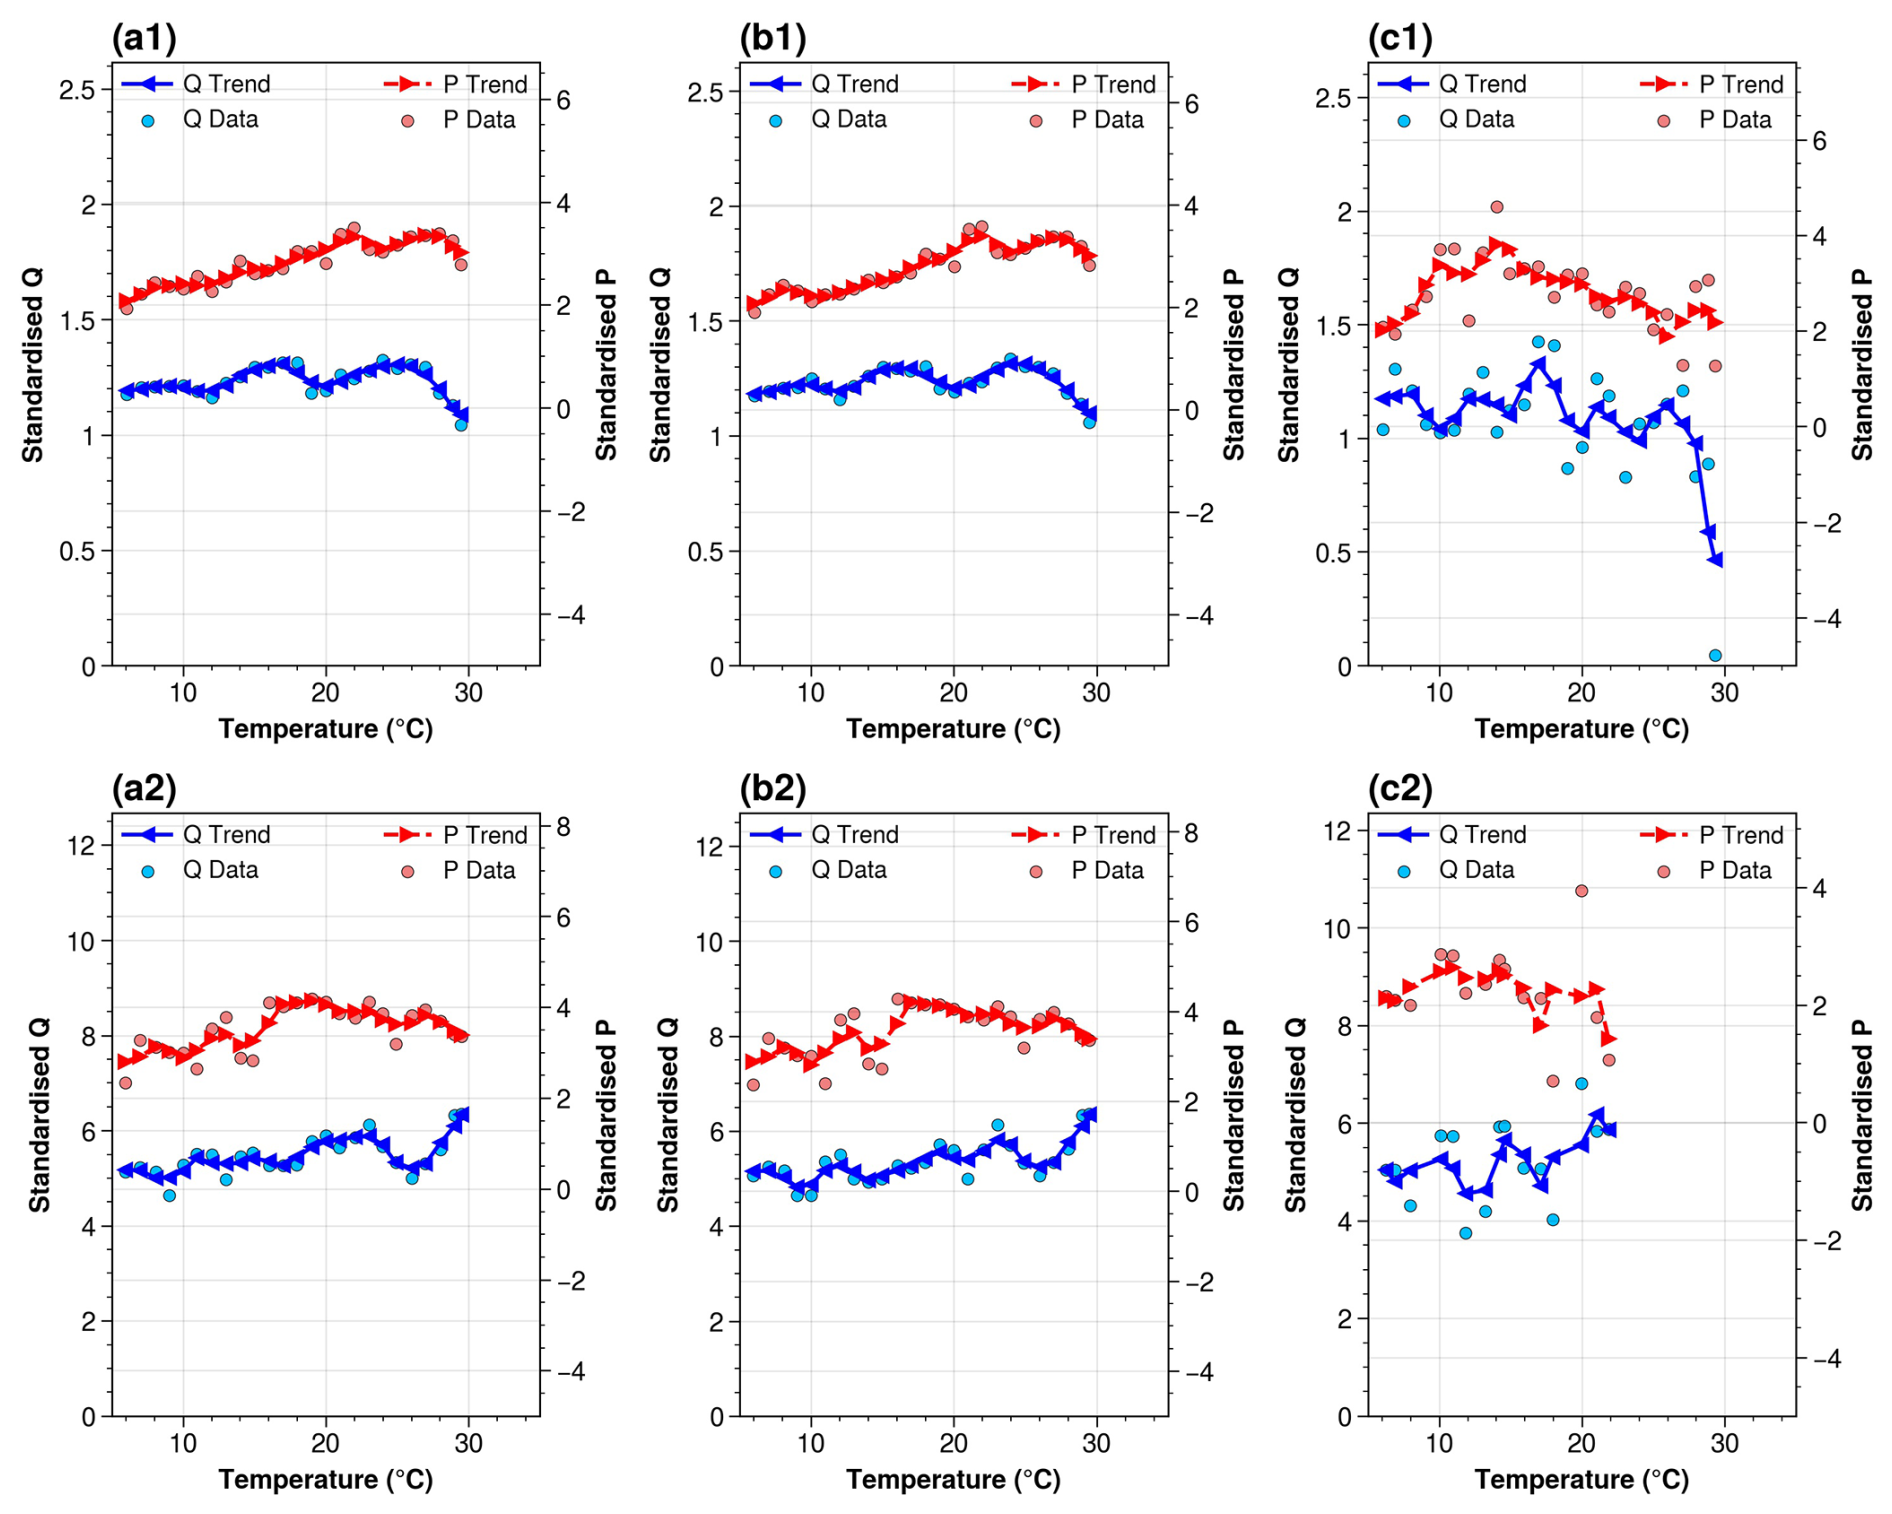
Figure 6Scaling curves of standardized peak flow (Q) and precipitation (P) with temperature for Peaks-over-threshold (POT) events below (a1, b1, c1) and above (a2, b2, c2) the 90th percentile across CONUS, the non-arid regions of CONUS, and the arid regions of CONUS. Circular markers highlight the 99th percentile, and solid lines depict the moving average.
4.4 Identifying major drivers of AMF trends using random forest regression
Across the 294 catchments, the single-variable MDI importance at the inflection point has a median of 0.171 (IQR 0.117–0.232). A fixed threshold of 0.15, which falls within this range, was therefore adopted and applied uniformly across all catchments. Random Forest regression analysis indicates that precipitation is the dominant driver of AMF trends across the studied catchments. Approximately 63.9 % of the catchments show that AMF trends are primarily driven by precipitation. However, land cover change and potential evapotranspiration/temperature can also play a significant role in certain catchments, with about 26.2 % of catchments influenced by both precipitation and temperature (P&T). A complete breakdown of all driver categories is provided in Table S1 in the Supplement. Spatially, P&T-dominated catchments tend to be more prevalent in the western CONUS, whereas P-dominated catchments are proportionally more concentrated in the humid eastern CONUS. To further distinguish these two groups, we compare their baseline climate and land cover characteristics. Compared to the 188 P-dominated catchments, the 77 P&T-dominated catchments receive approximately 17 % less mean annual precipitation (median of 982 mm versus 1184 mm) and are cooler on average (14.5 °C versus 15.9 °C). Despite comparable warming rates (0.269 and 0.291 °C decade−1), similar rates of soil moisture decline, and little difference in land cover composition between the two groups, the lower precipitation in P&T-dominated catchments means that temperature-driven increases in evaporative demand consume a proportionally larger share of the water budget, amplifying the sensitivity of runoff generation to warming. Rising air temperature elevates the atmospheric vapor pressure deficit, enhancing evapotranspiration and depleting soil moisture more rapidly during inter-storm periods. The drier antecedent conditions, consistent with the widespread decline in ASM documented in Sect. 4.3, increase available soil storage at storm onset so that a larger fraction of rainfall infiltrates rather than generating direct runoff, thereby attenuating flood peaks.
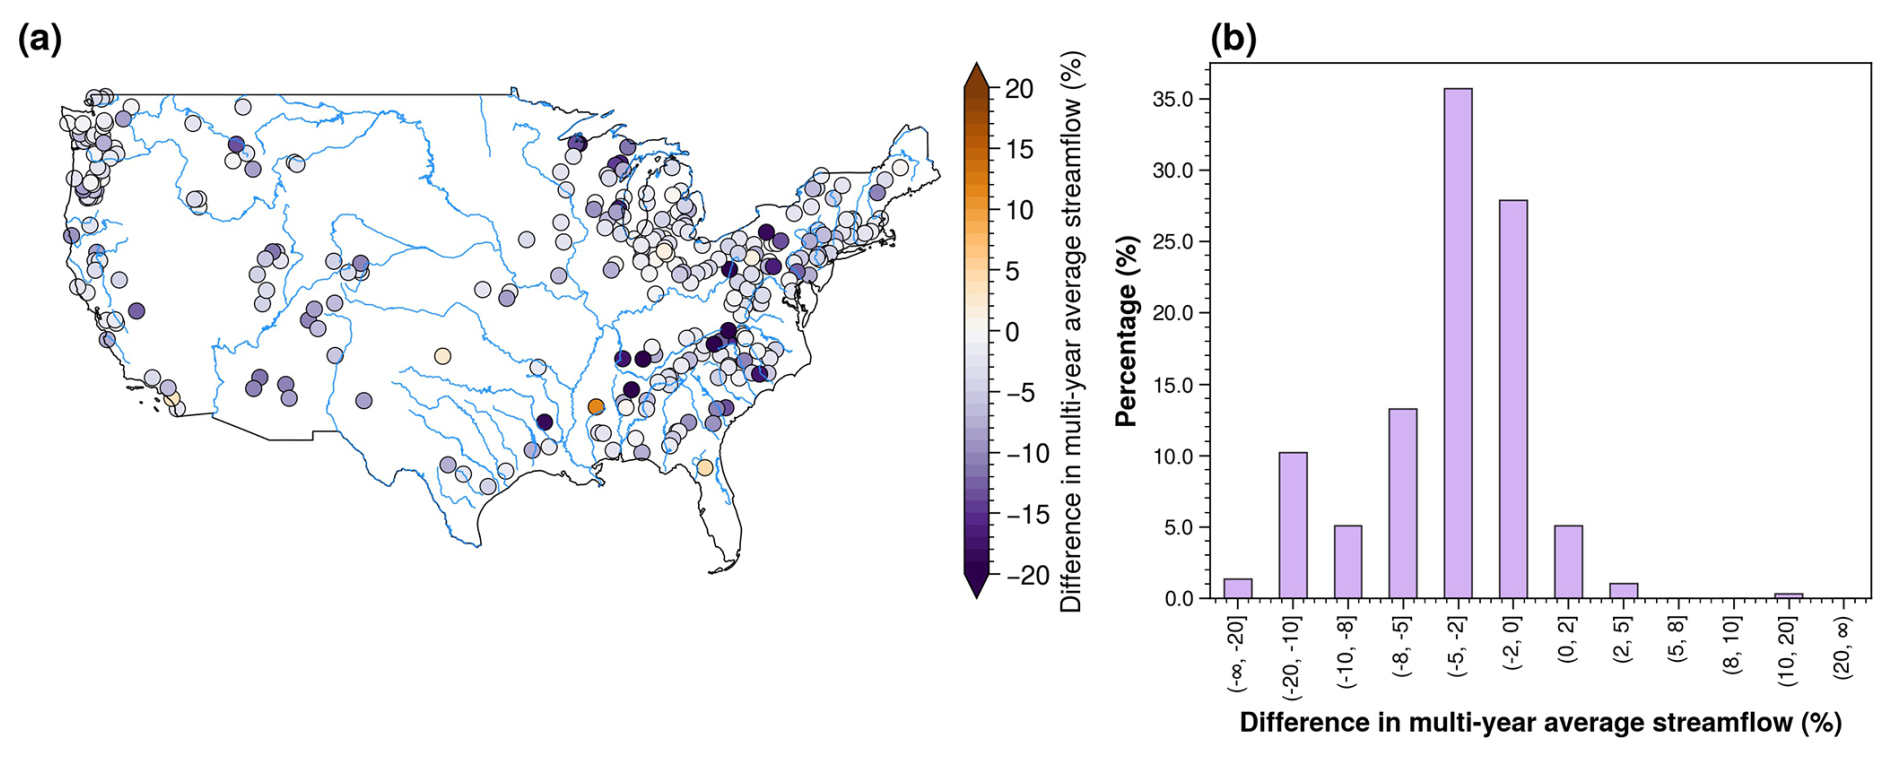
Figure 7(a) Spatial distribution of the percentage difference in multi-year average streamflow (1985–2015) between dynamic (DRIVE-DT; using observed temperature from 1981–2020) and static temperature (DRIVE-ST; recycling the complete 1981 3-hourly air temperature series for each simulation year) scenarios (calculated as ((DRIVE-DT − DRIVE-ST) DRIVE-ST) × 100 %); (b) histogram showing the frequency distribution of the percentage differences in multi-year average flow.
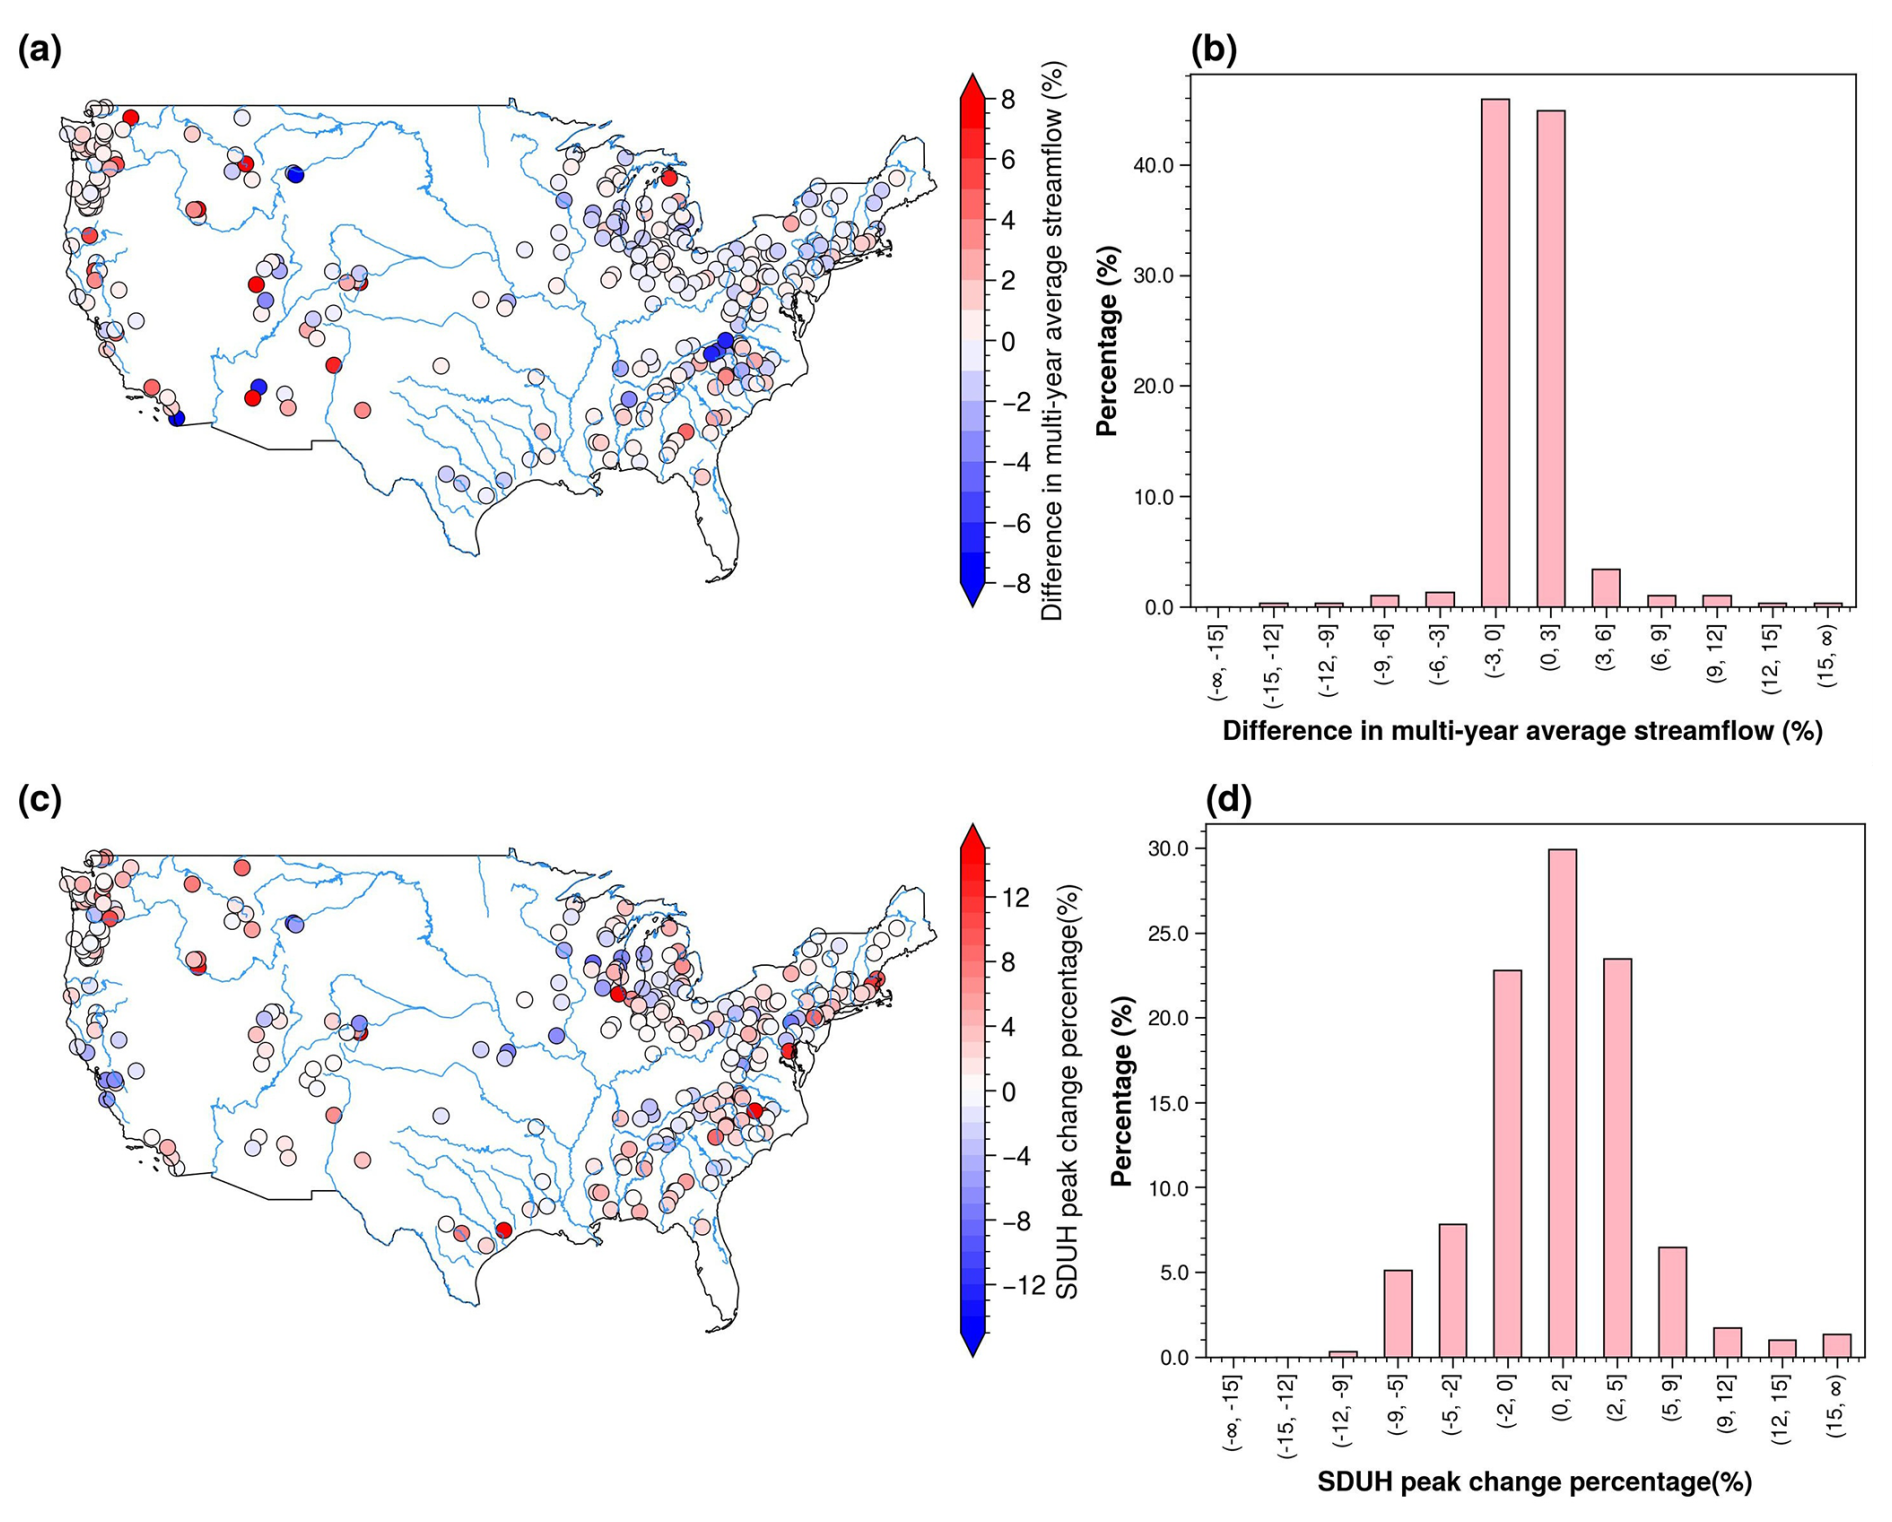
Figure 8(a) Spatial distribution of percentage differences in multi-year average flow between 1985 and 2015 land cover scenarios, modelled by the DRIVE model; (b) Frequency distribution of percentage differences in multi-year average flow; (c) Spatial distribution of TS-DUH peak change percentage between 1985 and 2015; (d) Frequency distribution of TS-DUH peak change percentage.
4.5 The impact of air temperature changes on streamflow
Figure 6 illustrates the relationship between streamflow (Q), precipitation (P), and temperature (T). The scaling curves for moderate- and high-intensity flash floods, defined by the 90th percentile threshold, are presented for three regions: the entire CONUS, the non-arid regions of CONUS, and the arid regions of CONUS (Beck et al., 2018). Limitations in sample size preclude a detailed analysis across hydroclimatic zones, and events with temperature exceeding 30 °C are excluded. P generally increases between 5 and 30 °C during both moderate- and high-intensity flood events, except in arid regions. For moderate events (below the 90th percentile), while P and Q increase with T, Q declines between approximately 25 and 30 °C across the CONUS, despite minimal precipitation change. This decline accounts for approximately 11.6 % of the total flood events (12852) across the CONUS. This reduction might stem from enhanced evapotranspiration and increased soil water retention. Conversely, for high-intensity events (above the 90th percentile), Q and P generally increase with T. Between 25 and 30 °C, high peak flows persist despite stable or slightly reduced precipitation, likely due to concentrated extreme rainfall and efficient runoff.
In order to further quantify the impact of temperature changes, we compare multi-year average streamflows (1985–2015) from dynamic (DRIVE-DT) and static (DRIVE-ST) temperature scenarios (Fig. 7). Under this experimental design where only temperature varies while precipitation remains identical, this comparison reveals that 63.6 % of catchments experience a flow change between −5 % and 0 %, while 16.7 % experience a decrease exceeding −8 % (Fig. 7b). DRIVE model simulations indicate that from 1981 to 2015–2020, rising temperatures lead to a 3.6 % reduction in catchments with significantly increased POTF and an 8.0 % reduction in those with significantly increased POTM in annual averages.
4.6 Impact of land cover changes on streamflow between 1985 and 2015
Analysis of land cover change between 1985 and 2015 reveals that urban areas comprised an average of 3.6 % across all study stations by 2015. Forest cover is significantly greater than urban areas, averaging 64.4 %. Most study areas are mountainous upstream catchments with minimal urban land and predominantly forest cover. Overall land cover change was minimal, with the total area undergoing any class transition averaging only 3.3 %. The primary net shifts were urban expansion (from 2.8 % to 3.6 %) and a slight decline in forest cover (from 65.2 % to 64.4 %), while all other classes changed by less than 0.3 %. DRIVE model simulations of land cover change between 1985 and 2015 (Fig. 8a and b) show that the multi-year average flow changes at 90.8 % of observation points fall within ± 3 %, indicating minimal impact compared to temperature variations (Sect. 4.5). Similarly, 82.7 % of gauges show TS-DUH peak changes between ± 5 % (Fig. 8c and d), suggesting relatively stable variation. However, some gauges that show increases exceeding 9 % are influenced by various factors such as snowmelt or urban expansion. Overall, the model suggests that temperature changes have a greater impact than land cover changes.
This study analyzed long-term (30 years) USGS hourly streamflow data from small to medium-sized catchments (≤ 3000 km2) to assess historical trends in flash flood intensity and frequency across the CONUS. It investigated the influences of precipitation, temperature, and land cover change on streamflow by employing multiple methodologies, including the DRIVE, TS-DUH, and random forest regression models, to quantitatively attribute their main drivers and impacts on flash floods. Specifically, we quantitatively assessed the modulatory effects of climate warming on flash flood occurrences and the possible impacts of land cover changes, providing a mechanistic understanding of the primary drivers behind changes in flash flood frequency and intensity. The main conclusions are as follows:
- 1.
Observations reveal an increase in heavy precipitation events, but this change does not uniformly translate to increase in flood frequency and intensity; 17.3 % of catchments show significant increase in flash flood frequency (p < 0.05), and 6.5 % (3.7 %) show significant increase in POTFL (POTM). Specifically, while approximately 67 % of catchments exhibit a significant upward trend in AFHP6h, only about 23 % of these same catchments show a corresponding significant increase in POTF.
- 2.
In our model experiments isolating temperature effects, rising temperature tends to decrease both the magnitude and frequency for general floods. DRIVE model simulations demonstrate that since the 1980s, there is a 3.6 % reduction in catchments with significantly increased POTF and an 8.0 % reduction in those with significantly increased POTM.
- 3.
Land cover changes across the CONUS (1985–2015) are modest overall. DRIVE model simulations indicate that the multi-year average flow changes are within ± 3 % at 90.8 % of the catchments.
The limited translation of widespread precipitation intensification into proportional flood increases likely reflects the combined buffering effects of declining antecedent soil moisture, warming-enhanced evapotranspiration, and catchment storage capacity. In order to examine whether larger catchments show stronger associations with longer-duration precipitation, we computed Spearman rank correlations between each precipitation index and flood metrics, stratified into four drainage-area classes (< 500, 500–1000, 1000–2000, and > 2000 km2). Median correlations remain stable across size classes for all three flood metrics, with ranges across groups typically below 0.05 and no systematic strengthening of longer duration indices in larger catchments (Fig. S1 in the Supplement). Sensitivity analysis across alternative thresholds (p < 0.01, 0.05, 0.10) further confirms that the asymmetry between increasing and decreasing trends is consistent regardless of the threshold adopted (Table S2 in the Supplement).
Several caveats related to statistical robustness merit discussion. Applying trend tests across 294 catchments and multiple variables introduces the potential for false positives; approximately 15 spurious rejections per variable would be expected at p = 0.05 under the null hypothesis. The Benjamini-Hochberg FDR correction was therefore applied (Table S3 in the Supplement). The heavy precipitation frequency trends prove highly robust, with 190 of 195 significant AFHP6h upward trends surviving correction at q = 0.05, and 22 of 51 POTF upward trends remaining significant. Regarding process-level limitations, a long-term decline in ASM indicates a shift toward drier antecedent conditions prior to flood-producing events. However, ASM cannot fully capture the role of antecedent soil moisture in runoff generation. Event-scale attribution linking antecedent moisture windows to individual flood responses therefore warrants further investigation. Furthermore, the study did not consider the evolution of river channels.
The influence of land cover change on flood intensity varies markedly with the degree of urbanization. Since most catchments are located in the less urbanized upstream mountainous areas, the impact of land cover change on flood intensity tends to be low. However, in the rapidly urbanizing catchments, the impact can be substantial. For example, in the Peachtree Creek catchment in Atlanta (Debbage and Shepherd, 2018), the impervious surface fraction increased from 45.2 % in 1985 to 54.8 % in 2015, leading to a 20 % rise (from 57.8 to 69.2 m3 s−1) in TS-DUH peak flow. This highlights that land cover changes can significantly influence flood intensity in certain areas.
Finally, several data and modeling uncertainties should be acknowledged. Data quality, record length, and completeness influence the reliability of trend analyses. Although the May-to-September window was used solely to screen data completeness at the station level, this criterion may favour catchments whose records are most complete during the warm season. Consequently, it may underrepresent basins where rain-on-snow or autumn extratropical storms contribute appreciably to flash flood activity. In the RF attribution, inter-correlated predictors share MDI scores, which dilutes individual variable importance. Aggregating importances into three broad driver categories before catchment classification renders within-category redistribution inconsequential. Cross-category redistribution cannot be excluded but is expected to be minor given the distinct physical nature of the three driver groups. Furthermore, the 0.125° resolution of NLDAS-2 provides limited grid coverage for the smallest catchments, potentially smoothing localized convective peaks and introducing uncertainty in extreme precipitation frequency estimates. This constraint is less consequential for the controlled DRIVE experiments, where identical precipitation forcing is applied across scenarios and only the relative response to temperature or land cover perturbations is compared. Finally, we acknowledge that the inherent limitations of the hydrological models and the uncertainties arising from different data sources warrant further parameter calibration.
Code/data will be made available on request.
The supplement related to this article is available online at https://doi.org/10.5194/nhess-26-3667-2026-supplement.
Conceptualization: YH and HW; Methodology: YH and HW; Data curation: YH, ZH, and CL; Formal analysis: YH; Writing – original draft: YH; Writing – review and editing: HW, YM, AW, and BS.
The contact author has declared that none of the authors has any competing interests.
Publisher's note: Copernicus Publications remains neutral with regard to jurisdictional claims made in the text, published maps, institutional affiliations, or any other geographical representation in this paper. The authors bear the ultimate responsibility for providing appropriate place names. Views expressed in the text are those of the authors and do not necessarily reflect the views of the publisher.
This study was supported by the National Key R&D Program of China (Grant: 2024YFC3013302), the Nanning Science Research and Technology Development Program (Grant: 20253026), the National Natural Science Foundation of China (Grants: 42275019, 42088101), CMA's Open Fund Project for Heavy Rain of China (Grant: BYKJ2024Z10), the Fengyun Satellite Application Program (Grant: FY-APP-2022.0402), and China's National International Technical Cooperation Research Project (Grant: ZE03).
This paper was edited by Zhe Li and reviewed by two anonymous referees.
Ahmadalipour, A. and Moradkhani, H.: A data-driven analysis of flash flood hazard, fatalities, and damages over the CONUS during 1996-2017, J. Hydrol., 578, https://doi.org/10.1016/j.jhydrol.2019.124106, 2019.
Alexander, L. V., Zhang, X., Peterson, T. C., Caesar, J., Gleason, B., Tank, A., Haylock, M., Collins, D., Trewin, B., Rahimzadeh, F., Tagipour, A., Kumar, K. R., Revadekar, J., Griffiths, G., Vincent, L., Stephenson, D. B., Burn, J., Aguilar, E., Brunet, M., Taylor, M., New, M., Zhai, P., Rusticucci, M., and Vazquez-Aguirre, J. L.: Global observed changes in daily climate extremes of temperature and precipitation, J. Geophys. Res.-Atmos., 111, https://doi.org/10.1029/2005jd006290, 2006.
Allan, R. P. and Soden, B. J.: Atmospheric warming and the amplification of precipitation extremes, Science, 321, 1481–1484, https://doi.org/10.1126/science.1160787, 2008.
Anderson, B. J., Slater, L. J., Dadson, S. J., Blum, A. G., and Prosdocimi, I.: Statistical Attribution of the Influence of Urban and Tree Cover Change on Streamflow: A Comparison of Large Sample Statistical Approaches, Water Resour. Res., 58, https://doi.org/10.1029/2021wr030742, 2022.
Archfield, S. A., Hirsch, R. M., Viglione, A., and Bloeschl, G.: Fragmented patterns of flood change across the United States, Geophys. Res. Lett., 43, 10232–10239, https://doi.org/10.1002/2016gl070590, 2016.
Balaguru, K., Xu, W., Chang, C.-C., Leung, L. R., Judi, D. R., Hagos, S. M., Wehner, M. F., Kossin, J. P., and Ting, M.: Increased US coastal hurricane risk under climate change, Science Advances, 9, https://doi.org/10.1126/sciadv.adf0259, 2023.
Barendrecht, M. H., Matano, A., Mendoza, H., Weesie, R., Rohse, M., Koehler, J., de Ruiter, M., Garcia, M., Mazzoleni, M., Aerts, J., Ward, P. J., Di Baldassarre, G., Day, R., and Van Loon, A. F.: Exploring drought-to-flood interactions and dynamics: A global case review, WIREs Water, 11, https://doi.org/10.1002/wat2.1726, 2024.
Beck, H. E., Zimmermann, N. E., McVicar, T. R., Vergopolan, N., Berg, A., and Wood, E. F.: Present and future Koppen-Geiger climate classification maps at 1-km resolution, Sci. Data, 5, https://doi.org/10.1038/sdata.2018.214, 2018.
Bergstra, J., Bardenet, R., Bengio, Y., and Kégl, B.: Algorithms for hyper-parameter optimization, Adv. Neur. In., 24, 2546–2554, 2011.
Bloeschl, G., Hall, J., Parajka, J., Perdigao, R. A. P., Merz, B., Arheimer, B., Aronica, G. T., Bilibashi, A., Bonacci, O., Borga, M., Canjevac, I., Castellarin, A., Chirico, G. B., Claps, P., Fiala, K., Frolova, N., Gorbachova, L., Gul, A., Hannaford, J., Harrigan, S., Kireeva, M., Kiss, A., Kjeldsen, T. R., Kohnova, S., Koskela, J. J., Ledvinka, O., Macdonald, N., Mavrova-Guirguinova, M., Mediero, L., Merz, R., Molnar, P., Montanari, A., Murphy, C., Osuch, M., Ovcharuk, V., Radevski, I., Rogger, M., Salinas, J. L., Sauquet, E., Sraj, M., Szolgay, J., Viglione, A., Volpi, E., Wilson, D., Zaimi, K., and Zivkovic, N.: Changing climate shifts timing of European floods, Science, 357, 588–590, https://doi.org/10.1126/science.aan2506, 2017.
Blum, A. G., Ferraro, P. J., Archfield, S. A., and Ryberg, K. R.: Causal Effect of Impervious Cover on Annual Flood Magnitude for the United States, Geophys. Res. Lett., 47, https://doi.org/10.1029/2019gl086480, 2020.
Borga, M., Stoffel, M., Marchi, L., Marra, F., and Jakob, M.: Hydrogeomorphic response to extreme rainfall in headwater systems: Flash floods and debris flows, J. Hydrol., 518, 194–205, https://doi.org/10.1016/j.jhydrol.2014.05.022, 2014.
Breiman, L.: Random forests, Mach. Learn., 45, 5–32, https://doi.org/10.1023/a:1010933404324, 2001.
Brunner, M. I., Swain, D. L., Wood, R. R., Willkofer, F., Done, J. M., Gilleland, E., and Ludwig, R.: An extremeness threshold determines the regional response of floods to changes in rainfall extremes, Commun. Earth Environ., 2, https://doi.org/10.1038/s43247-021-00248-x, 2021.
Carmen Llasat, M., Marcos, R., Turco, M., Gilabert, J., and Llasat-Botija, M.: Trends in flash flood events versus convective precipitation in the Mediterranean region: The case of Catalonia, J. Hydrol., 541, 24–37, https://doi.org/10.1016/j.jhydrol.2016.05.040, 2016.
Cherkauer, K. A., Bowling, L. C., and Lettenmaier, D. P.: Variable infiltration capacity cold land process model updates, Global Planet. Change, 38, 151–159, https://doi.org/10.1016/s0921-8181(03)00025-0, 2003.
Dai, A., Trenberth, K. E., and Qian, T. T.: A global dataset of Palmer Drought Severity Index for 1870–2002: Relationship with soil moisture and effects of surface warming, J. Hydrometeorol., 5, 1117–1130, https://doi.org/10.1175/jhm-386.1, 2004.
De Niel, J. and Willems, P.: Climate or land cover variations: what is driving observed changes in river peak flows? A data-based attribution study, Hydrol. Earth Syst. Sci., 23, 871–882, https://doi.org/10.5194/hess-23-871-2019, 2019.
Debbage, N. and Shepherd, J. M.: The Influence of Urban Development Patterns on Streamflow Characteristics in the Charlanta Megaregion, Water Resour. Res., 54, 3728–3747, https://doi.org/10.1029/2017wr021594, 2018.
Do, H. X., Westra, S., and Leonard, M.: A global-scale investigation of trends in annual maximum streamflow, J. Hydrol., 552, 28–43, https://doi.org/10.1016/j.jhydrol.2017.06.015, 2017.
Emanuel, K.: Increasing destructiveness of tropical cyclones over the past 30 years, Nature, 436, 686–688, https://doi.org/10.1038/nature03906, 2005.
Frans, C., Istanbulluoglu, E., Mishra, V., Munoz-Arriola, F., and Lettenmaier, D. P.: Are climatic or land cover changes the dominant cause of runoff trends in the Upper Mississippi River Basin?, Geophys. Res. Lett., 40, 1104–1110, https://doi.org/10.1002/grl.50262, 2013.
Gaume, E. and Borga, M.: Post-flood field investigations in upland catchments after major flash floods: proposal of a methodology and illustrations, J. Flood Risk Manag., 1, 175–189, https://doi.org/10.1111/j.1753-318X.2008.00023.x, 2008.
Gelaro, R., McCarty, W., Suarez, M. J., Todling, R., Molod, A., Takacs, L., Randles, C. A., Darmenov, A., Bosilovich, M. G., Reichle, R., Wargan, K., Coy, L., Cullather, R., Draper, C., Akella, S., Buchard, V., Conaty, A., da Silva, A. M., Gu, W., Kim, G.-K., Koster, R., Lucchesi, R., Merkova, D., Nielsen, J. E., Partyka, G., Pawson, S., Putman, W., Rienecker, M., Schubert, S. D., Sienkiewicz, M., and Zhao, B.: The Modern-Era Retrospective Analysis for Research and Applications, Version 2 (MERRA-2), J. Climate, 30, 5419–5454, https://doi.org/10.1175/jcli-d-16-0758.1, 2017.
Gourley, J. J., Hong, Y., Flamig, Z. L., Arthur, A., Clark, R., Calianno, M., Ruin, I., Ortel, T., Wieczorek, M. E., Kirstetter, P.-E., Clark, E., and Krajewski, W. F.: A Unified Flash Flood Database across the United States, B. Am. Meteorol. Soc., 94, 799–805, https://doi.org/10.1175/bams-d-12-00198.1, 2013.
Hall, J., Arheimer, B., Borga, M., Brázdil, R., Claps, P., Kiss, A., Kjeldsen, T. R., Kriaučiūnienė, J., Kundzewicz, Z. W., Lang, M., Llasat, M. C., Macdonald, N., McIntyre, N., Mediero, L., Merz, B., Merz, R., Molnar, P., Montanari, A., Neuhold, C., Parajka, J., Perdigão, R. A. P., Plavcová, L., Rogger, M., Salinas, J. L., Sauquet, E., Schär, C., Szolgay, J., Viglione, A., and Blöschl, G.: Understanding flood regime changes in Europe: a state-of-the-art assessment, Hydrol. Earth Syst. Sci., 18, 2735–2772, https://doi.org/10.5194/hess-18-2735-2014, 2014.
Hapuarachchi, H. A. P., Wang, Q. J., and Pagano, T. C.: A review of advances in flash flood forecasting, Hydrol. Process., 25, 2771–2784, https://doi.org/10.1002/hyp.8040, 2011.
Hodgkins, G. A., Dudley, R. W., Archfield, S. A., and Renard, B.: Effects of climate, regulation, and urbanization on historical flood trends in the United States, J. Hydrol., 573, 697–709, https://doi.org/10.1016/j.jhydrol.2019.03.102, 2019.
Hou, A. Y., Kakar, R. K., Neeck, S., Azarbarzin, A. A., Kummerow, C. D., Kojima, M., Oki, R., Nakamura, K., and Iguchi, T.: The global precipitation measurement mission, B. Am. Meteorol. Soc., 95, 701–722, https://doi.org/10.1175/bams-d-13-00164.1, 2014.
Hu, Y., Wu, H., Alfieri, L., Gu, G., Yilmaz, K. K., Li, C., Jiang, L., Huang, Z., Chen, W., Wu, W., and Han, Q.: A time-space varying distributed unit hydrograph (TS-DUH) for operational flash flood forecasting using publicly-available datasets, J. Hydrol., 642, 131785, https://doi.org/10.1016/j.jhydrol.2024.131785, 2024.
Huang, Z., Wu, H., Adler, R. F., Schumann, G., Gourley, J. J., Kettner, A., and Nanding, N.: Multisourced Flood Inventories over the Contiguous United States for Actual and Natural Conditions, B. Am. Meteorol. Soc., 102, E1133–E1149, https://doi.org/10.1175/bams-d-20-0001.1, 2021.
Huang, Z., Wu, H., Gu, G., Li, X., Nanding, N., Adler, R. F., Yilmaz, K. K., Alfieri, L., and Chen, S.: Paired Satellite and NWP Precipitation for Global Flood Forecasting, J. Hydrometeorol., 24, 2191–2205, https://doi.org/10.1175/jhm-d-23-0044.1, 2023.
Ivancic, T. J. and Shaw, S. B.: Examining why trends in very heavy precipitation should not be mistaken for trends in very high river discharge, Climatic Change, 133, 681–693, https://doi.org/10.1007/s10584-015-1476-1, 2015.
Jiang, L., Wu, H., Tao, J., Kimball, J. S., Alfieri, L., and Chen, X.: Satellite-based evapotranspiration in hydrological model calibration, Remote Sens., 12, 428, https://doi.org/10.3390/rs12030428, 2020.
Jiang, S., Bevacqua, E., and Zscheischler, J.: River flooding mechanisms and their changes in Europe revealed by explainable machine learning, Hydrol. Earth Syst. Sci., 26, 6339–6359, https://doi.org/10.5194/hess-26-6339-2022, 2022.
Kemter, M., Marwan, N., Villarini, G., and Merz, B.: Controls on Flood Trends Across the United States, Water Resour. Res., 59, https://doi.org/10.1029/2021wr031673, 2023.
Kendall, M. G.: Rank correlation methods, Charles Griffin & Co., London,, 1948.
Khajehei, S., Ahmadalipour, A., Shao, W., and Moradkhani, H.: A Place-based Assessment of Flash Flood Hazard and Vulnerability in the Contiguous United States, Sci. Rep., 10, https://doi.org/10.1038/s41598-019-57349-z, 2020.
Kirschbaum, D. B., Huffman, G. J., Adler, R. F., Braun, S., Garrett, K., Jones, E., McNally, A., Skofronick-Jackson, G., Stocker, E., Wu, H., and Zaitchik, B. F.: NASA's remotely sensed precipitation: A reservoir for applications users, B. Am. Meteorol. Soc., 98, 1169–1184, https://doi.org/10.1175/bams-d-15-00296.1, 2017.
Lang, M., Ouarda, T., and Bobée, B.: Towards operational guidelines for over-threshold modeling, J. Hydrol., 225, 103–117, https://doi.org/10.1016/s0022-1694(99)00167-5, 1999.
Lenderink, G. and van Meijgaard, E.: Linking increases in hourly precipitation extremes to atmospheric temperature and moisture changes, Environ. Res. Lett., 5, https://doi.org/10.1088/1748-9326/5/2/025208, 2010.
Li, S., Wang, G., Zhu, C., Lu, J., Ullah, W., Hagan, D. F. T., Kattel, G., and Peng, J.: Attribution of global evapotranspiration trends based on the Budyko framework, Hydrol. Earth Syst. Sci., 26, 3691–3707, https://doi.org/10.5194/hess-26-3691-2022, 2022.
Liang, X., Lettenmaier, D. P., and Wood, E. F.: One-dimensional statistical dynamic representation of subgrid spatial variability of precipitation in the two-layer variable infiltration capacity model, J. Geophys. Res., 101, 21403–21422, https://doi.org/10.1029/96jd01448, 1996.
Liu, J., Feng, S., Gu, X., Zhang, Y., Beck, H. E., Zhang, J., and Yan, S.: Global changes in floods and their drivers, J. Hydrol., 128553–128553, https://doi.org/10.1016/j.jhydrol.2022.128553, 2022.
Mallakpour, I. and Villarini, G.: The changing nature of flooding across the central United States, Nat. Clim. Change, 5, 250–254, https://doi.org/10.1038/nclimate2516, 2015.
Mann, H. B.: Nonparametric tests against trend, Econometrica, 13, 245–259, https://doi.org/10.2307/1907187, 1945.
Merz, B., Vorogushyn, S., Uhlemann, S., Delgado, J., and Hundecha, Y.: HESS Opinions “More efforts and scientific rigour are needed to attribute trends in flood time series”, Hydrol. Earth Syst. Sci., 16, 1379–1387, https://doi.org/10.5194/hess-16-1379-2012, 2012.
Merz, B., Bloesch, G., Vorogushyn, S., Dottori, F., Aerts, J. C. J. H., Bates, P., Bertola, M., Kemter, M., Kreibich, H., Lall, U., and Macdonald, E.: Causes, impacts and patterns of disastrous river floods, Nat. Rev. Earth Environ., 2, 592–609, https://doi.org/10.1038/s43017-021-00195-3, 2021.
Milly, P. C. D., Betancourt, J., Falkenmark, M., Hirsch, R. M., Kundzewicz, Z. W., Lettenmaier, D. P., and Stouffer, R. J.: Climate change - Stationarity is dead: Whither water management?, Science, 319, 573–574, https://doi.org/10.1126/science.1151915, 2008.
Nanding, N., Wu, H., Tao, J., Maggioni, V., Beck, H. E., Zhou, N., Huang, M., and Huang, Z.: Assessment of Precipitation Error Propagation in Discharge Simulations over the Contiguous United States, J. Hydrometeorol., 22, 1987–2008, https://doi.org/10.1175/jhm-d-20-0213.1, 2021.
Saharia, M., Kirstetter, P.-E., Vergara, H., Gourley, J. J., Hong, Y., and Giroud, M.: Mapping Flash Flood Severity in the United States, J. Hydrometeorol., 18, 397–411, https://doi.org/10.1175/jhm-d-16-0082.1, 2017.
Schaperow, J. R., Li, D., Margulis, S. A., and Lettenmaier, D. P.: A near-global, high resolution land surface parameter dataset for the variable infiltration capacity model, Sci. Data, 8, https://doi.org/10.1038/s41597-021-00999-4, 2021.
Sharma, A., Wasko, C., and Lettenmaier, D. P.: If Precipitation Extremes Are Increasing, Why Aren't Floods?, Water Resour. Res., 54, 8545–8551, https://doi.org/10.1029/2018wr023749, 2018.
Slater, L. J. and Villarini, G.: Recent trends in US flood risk, Geophys. Res. Lett., 43, 12428–12436, https://doi.org/10.1002/2016gl071199, 2016.
Slater, L. J., Anderson, B., Buechel, M., Dadson, S., Han, S., Harrigan, S., Kelder, T., Kowal, K., Lees, T., Matthews, T., Murphy, C., and Wilby, R. L.: Nonstationary weather and water extremes: a review of methods for their detection, attribution, and management, Hydrol. Earth Syst. Sci., 25, 3897–3935, https://doi.org/10.5194/hess-25-3897-2021, 2021.
Wagener, T., Sivapalan, M., Troch, P. A., McGlynn, B. L., Harman, C. J., Gupta, H. V., Kumar, P., Rao, P. S. C., Basu, N. B., and Wilson, J. S.: The future of hydrology: An evolving science for a changing world, Water Resour. Res., 46, https://doi.org/10.1029/2009wr008906, 2010.
Wang, A., Miao, Y., Kong, X., and Wu, H.: Future Changes in Global Runoff and Runoff Coefficient From CMIP6 Multi-Model Simulation Under SSP1-2.6 and SSP5-8.5 Scenarios, Earths Future, 10, https://doi.org/10.1029/2022ef002910, 2022.
Wang, D. and Hejazi, M.: Quantifying the relative contribution of the climate and direct human impacts on mean annual streamflow in the contiguous United States, Water Resour. Res., 47, https://doi.org/10.1029/2010wr010283, 2011.
Wasko, C. and Nathan, R.: Influence of changes in rainfall and soil moisture on trends in flooding, J. Hydrol., 575, 432–441, https://doi.org/10.1016/j.jhydrol.2019.05.054, 2019.
Wasko, C. and Sharma, A.: Global assessment of flood and storm extremes with increased temperatures, Sci. Rep., 7, https://doi.org/10.1038/s41598-017-08481-1, 2017.
Westra, S., Alexander, L. V., and Zwiers, F. W.: Global Increasing Trends in Annual Maximum Daily Precipitation, J. Climate, 26, 3904–3918, https://doi.org/10.1175/jcli-d-12-00502.1, 2013.
Winkler, K., Fuchs, R., Rounsevell, M., and Herold, M.: Global land use changes are four times greater than previously estimated, Nat. Commun., 12, https://doi.org/10.1038/s41467-021-22702-2, 2021.
Wu, H., Kimball, J. S., Mantua, N., and Stanford, J.: Automated upscaling of river networks for macroscale hydrological modeling, Water Resour. Res., 47, https://doi.org/10.1029/2009wr008871, 2011.
Wu, H., Adler, R. F., Hong, Y., Tian, Y., and Policelli, F.: Evaluation of Global Flood Detection Using Satellite-Based Rainfall and a Hydrologic Model, J. Hydrometeorol., 13, 1268–1284, https://doi.org/10.1175/jhm-d-11-087.1, 2012a.
Wu, H., Kimball, J. S., Li, H., Huang, M., Leung, L. R., and Adler, R. F.: A new global river network database for macroscale hydrologic modeling, Water Resour. Res., 48, https://doi.org/10.1029/2012wr012313, 2012b.
Wu, H., Adler, R. F., Tian, Y., Huffman, G. J., Li, H., and Wang, J.: Real-time global flood estimation using satellite-based precipitation and a coupled land surface and routing model, Water Resour. Res., 50, 2693–2717, https://doi.org/10.1002/2013wr014710, 2014.
Wu, H., Adler, R. F., Tian, Y., Gu, G., and Huffman, G. J.: Evaluation of Quantitative Precipitation Estimations through Hydrological Modeling in IFloodS River Basins, J. Hydrometeorol., 18, 529–553, https://doi.org/10.1175/jhm-d-15-0149.1, 2017.
Wu, H., Kimball, J. S., Zhou, N., Alfieri, L., Luo, L., Du, J., and Huang, Z.: Evaluation of real-time global flood modeling with satellite surface inundation observations from SMAP, Remote Sens. Environ., 233, https://doi.org/10.1016/j.rse.2019.111360, 2019.
Xia, Y., Mitchell, K., Ek, M., Cosgrove, B., Sheffield, J., Luo, L., Alonge, C., Wei, H., Meng, J., Livneh, B., Duan, Q., and Lohmann, D.: Continental-scale water and energy flux analysis and validation for North American Land Data Assimilation System project phase 2 (NLDAS-2): 2. Validation of model-simulated streamflow, J. Geophys. Res.-Atmos., 117, https://doi.org/10.1029/2011jd016051, 2012.
Yan, Y., Wu, H., Gu, G., Huang, Z., Alfieri, L., Li, X., Nanding, N., Pan, X., and Tang, Q.: Climatology and Interannual Variability of Floods during the TRMM Era (1998-2013), J. Climate, 33, 3289–3305, https://doi.org/10.1175/jcli-d-19-0415.1, 2020.
Yin, J., Gentine, P., Zhou, S., Sullivan, S. C., Wang, R., Zhang, Y., and Guo, S.: Large increase in global storm runoff extremes driven by climate and anthropogenic changes, Nat. Commun., 9, https://doi.org/10.1038/s41467-018-06765-2, 2018.
Yuan, X., Wang, Y. M., Ji, P., Wu, P. L., Sheffield, J., and Otkin, J. A.: A global transition to flash droughts under climate change, Science, 380, 187–191, https://doi.org/10.1126/science.abn6301, 2023.
Zhang, S., Zhou, L., Zhang, L., Yang, Y., Wei, Z., Zhou, S., Yang, D., Yang, X., Wu, X., Zhang, Y., Li, X., and Dai, Y.: Reconciling disagreement on global river flood changes in a warming climate, Nat. Clim. Change, 12, 1160–1167, https://doi.org/10.1038/s41558-022-01539-7, 2022.
Zhang, X., Liu, L., Chen, X., Gao, Y., Xie, S., and Mi, J.: GLC_FCS30: global land-cover product with fine classification system at 30 m using time-series Landsat imagery, Earth Syst. Sci. Data, 13, 2753–2776, https://doi.org/10.5194/essd-13-2753-2021, 2021.