
the Creative Commons Attribution 4.0 License.
the Creative Commons Attribution 4.0 License.
 | 23 Jul 2026
A fault-based application to model seismicity rates for seismic hazard assessment in the southern Apennines (Italy)
Giulia Alessandrini
Octavi Gómez-Novell
Silvia Castellaro
Michela Giustiniani
Umberta Tinivella
Although fault-based approaches to seismic hazard assessment have been increasingly adopted worldwide, the official Italian hazard model, on which the national building code is based, still relies on a catalogue-based framework, with well-known limitations in capturing the long-term recurrences of large-magnitude events. In this study, we present a fault-based application to model seismicity rates for the southern Apennines (Italy) that incorporates a multi-fault rupture assumption. This area is of particular interest due to its active seismicity and the presence of large dams, for which robust long-term hazard estimates are essential. We use the SHERIFS code to model seismicity rates at the fault system-level, which allow us to explore epistemic uncertainties of fault and seismicity parameters (rupture scenarios, scaling laws, b-values and background seismicity). Our results highlight the key role of rupture models: scenarios allowing multi-fault ruptures outperform single-fault rupture models in terms of agreement with the regional seismicity and paleoseismic rates. Our findings support the inclusion of multi-fault rupture models in PSHA logic trees for the region and emphasize the need for improved fault behaviour characterization in southern Italy.
- Article
(9875 KB) - Full-text XML
- BibTeX
- EndNote


In recent decades, fault-based approaches to seismic hazard assessment have gained increasing attention worldwide as an alternative to traditional methods relying exclusively on earthquake catalogues. These latter approaches, based on the original formulation of Probabilistic Seismic Hazard Analyses (PSHA) by Cornell (1968), have completeness limitations related to the combined effect of short earthquake catalogues (usually no more than a thousand years) and the long recurrence intervals of moderate-to large-magnitude earthquakes. These effects hamper the earthquake forecasting capabilities of PSHA, especially in regions with lower deformation rates. Moreover, catalogue-based approaches classically employ distributed seismicity models (area sources, grid sources, etc.) which, although suitable for representing background seismicity, i.e. earthquakes occurring on unmapped or poorly constrained faults, tend to unify or smooth out the seismic hazard over larger regions rather than localizing it along main active fault structures. Conversely, fault-based PSHA allows also the incorporation of fault-specific geological data (e.g., paleoseismology, geomorphology) into the source modelling, enabling a time-extended and more reliable characterization and localization of the seismic activity of a region. This approach provides improved spatial resolution of seismic hazard associated with moderate-to-large magnitude earthquakes (Mw≥6.5–7.0), whose occurrence is strongly controlled by the geometry, slip rates and segmentation of major active faults (e.g., Field et al., 2009; Gerstenberger et al., 2024).
Quantitative comparisons between the two approaches have shown that incorporating geological fault information may significantly modify both the spatial variability and the amplitude of ground-motion estimates. For example, fault-based models have been shown to produce increases in peak ground acceleration (PGA, 10 % probability of exceedance in 50 years) of up to 0.3 g compared to catalogue-based models in regions characterized by low deformation rates and limited instrumental seismicity (e.g., Williams et al., 2023), while differences exceeding 100 % have been observed for sites located close to major active faults (Gómez-Novell et al., 2020b). In California, the transition from area-source models to the fault-based UCERF framework reduced discrepancies between observed and modelled rates of intermediate-magnitude earthquakes (), improving consistency with historical catalogues (Field et al., 2009).
Despite the evolution and implementation of fault-based PSHA approaches in many countries worldwide (e.g., New Zealand, Gerstenberger et al., 2024; California, Petersen et al., 2024) and the advances achieved by large-scale hazard models such as ESHM20 (Danciu et al., 2024), whose results have been incorporated into the second generation of Eurocode 8 (Labbé and Paolucci, 2022), catalogue-based PSHA remains the standard practice, particularly for official seismic hazard assessment and regulatory applications. For example, in Italy the current building code (NTC, 2008, 2018) still relies on an area-source earthquake rupture forecast (Stucchi et al., 2011), as does the current Spanish seismic code (NCSE, 2002).
However, the reliance of catalogue-based hazard models on historical earthquakes can lead to the exclusion of faults with paleoseismic evidence of rupture – and thus capable of generating significant earthquakes – that have not produced events within the historical record. A relevant example, in Italy, is the Mount Vettore Fault, which ruptured during the 2016 Central Apennines earthquake even though it was previously classified as silent (Galadini and Galli, 2003; Galli et al., 2019).
Beyond these limitations, catalogue-based approaches do not account for the complexity of earthquake ruptures observed in nature. Seismological, geological and paleoseismological data show that earthquake ruptures can be very complex, involving the simultaneous activation of faults with different characteristics. Recent complex coseismic ruptures highlighted the need to include the multi-fault earthquakes in PSHA, going thus beyond strict fault segmentation assumptions (e.g., Mw 6.9 Irpinia in 1980, Bernard and Zollo, 1989; Mw 7.1 El Mayor-Cucapah in 2010, Wei et al., 2011; Mw 8.6 Sumatra in 2012, Zhang et al., 2012; Mw 6.5 central Italy in 2016, Peruzza et al., 2016; Mw 7.8 Kaikoura in 2016, Hamling et al., 2017; Mw 7.8 and Mw 7.7 Türkiye–Syria in 2023, Liu et al., 2023). Capturing such multi-fault ruptures is a key challenge in fault-based PSHA: implementations in California with UCERF3 (Field et al., 2009) or New Zealand (Stirling et al., 2012) pioneered the inclusion of such fault rupture complexities in PSHA.
However, incorporating faults into seismic hazard assessment in low-strain regions, such as Europe, is not yet a widespread practice and remains a topic of debate in many countries. A regulated implementation of such fault-based models in Europe remains a challenge mainly due to the larger recurrence intervals of the active faults and therefore to the scarcity of data to characterize such activity. In recent years, some initiatives such as the Fault2SHA Working Group of the European Seismological Commission have been founded to discuss the implementation of fault-based PSHA in Europe (central Italy, e.g., Peruzza et al., 2011; Pace et al., 2018; Valentini et al., 2018, 2019; Valentini, 2020; France, Scotti et al., 2014; Greece, Deligiannakis et al., 2018; and Spain, Gómez-Novell et al., 2020b). Along this line, in the recent MPS19 Seismic Hazard Model of Italy, two fault-based models were included in the earthquake rupture forecast, marking a significant step forward in Europe (Meletti et al., 2021; Visini et al., 2021).
In this study we model fault seismicity rates in the southern Apennines using a relaxed segmentation framework, i.e., considering multi-fault rupture scenarios. To our knowledge, this is the first study in the area to adopt such an approach for seismic hazard assessment. The Irpinia region, severely affected by the 1980 Mw 6.9 earthquake, the third deadliest in Italy (Peruzza, 2018), hosts several large earth dams located near active but poorly characterized faults, highlighting the need for accurate estimates of fault activity rates.
The study is designed as a comprehensive sensitivity test, aimed at observing how various model configurations of fault ruptures, fault and seismicity parameters impact fault system-level seismicity rates for seismic hazard assessment.
Geological and seismological setting
The study area, covering about 50 000 km2, is centred around the Irpinia district, one of the most seismically active regions of the southern Apennines (southern Italy; Fig. 1). The southern Apennines are part of an east-verging thrust belt related to the west-dipping subduction of the Apulian lithosphere beneath the Tyrrhenian domain (Doglioni et al., 1996). Since the Late Quaternary, slab rollback and trench retreat have promoted extensional tectonics along the Apennine chain, resulting in a system of large, segmented NW–SE-striking normal faults accommodating crustal stretching (Doglioni et al., 1996). At the same time, strike-slip to oblique-slip faulting is observed in the outer sectors of the belt and within the Adriatic foreland. These structures are commonly interpreted as the reactivation of inherited crustal discontinuities within the Apulian foreland, occurring at depth (typically ∼ 15–30 km; Latorre et al., 2023) and partially decoupled from the shallow extensional regime affecting the chain (generally confined within the upper ∼ 10–15 km of the crust; e.g., Boncio et al., 2007; Vannoli and Burrato, 2018). Recent studies (e.g., Adinolfi et al., 2015) have proposed that the coexistence of extensional and strike-slip faulting may reflect a vertically partitioned seismotectonic system, with shallow normal faulting and deeper strike-slip deformation. However, the relationship between these deformation regimes, and whether they are mechanically coupled or spatially overlapping, remains debated.
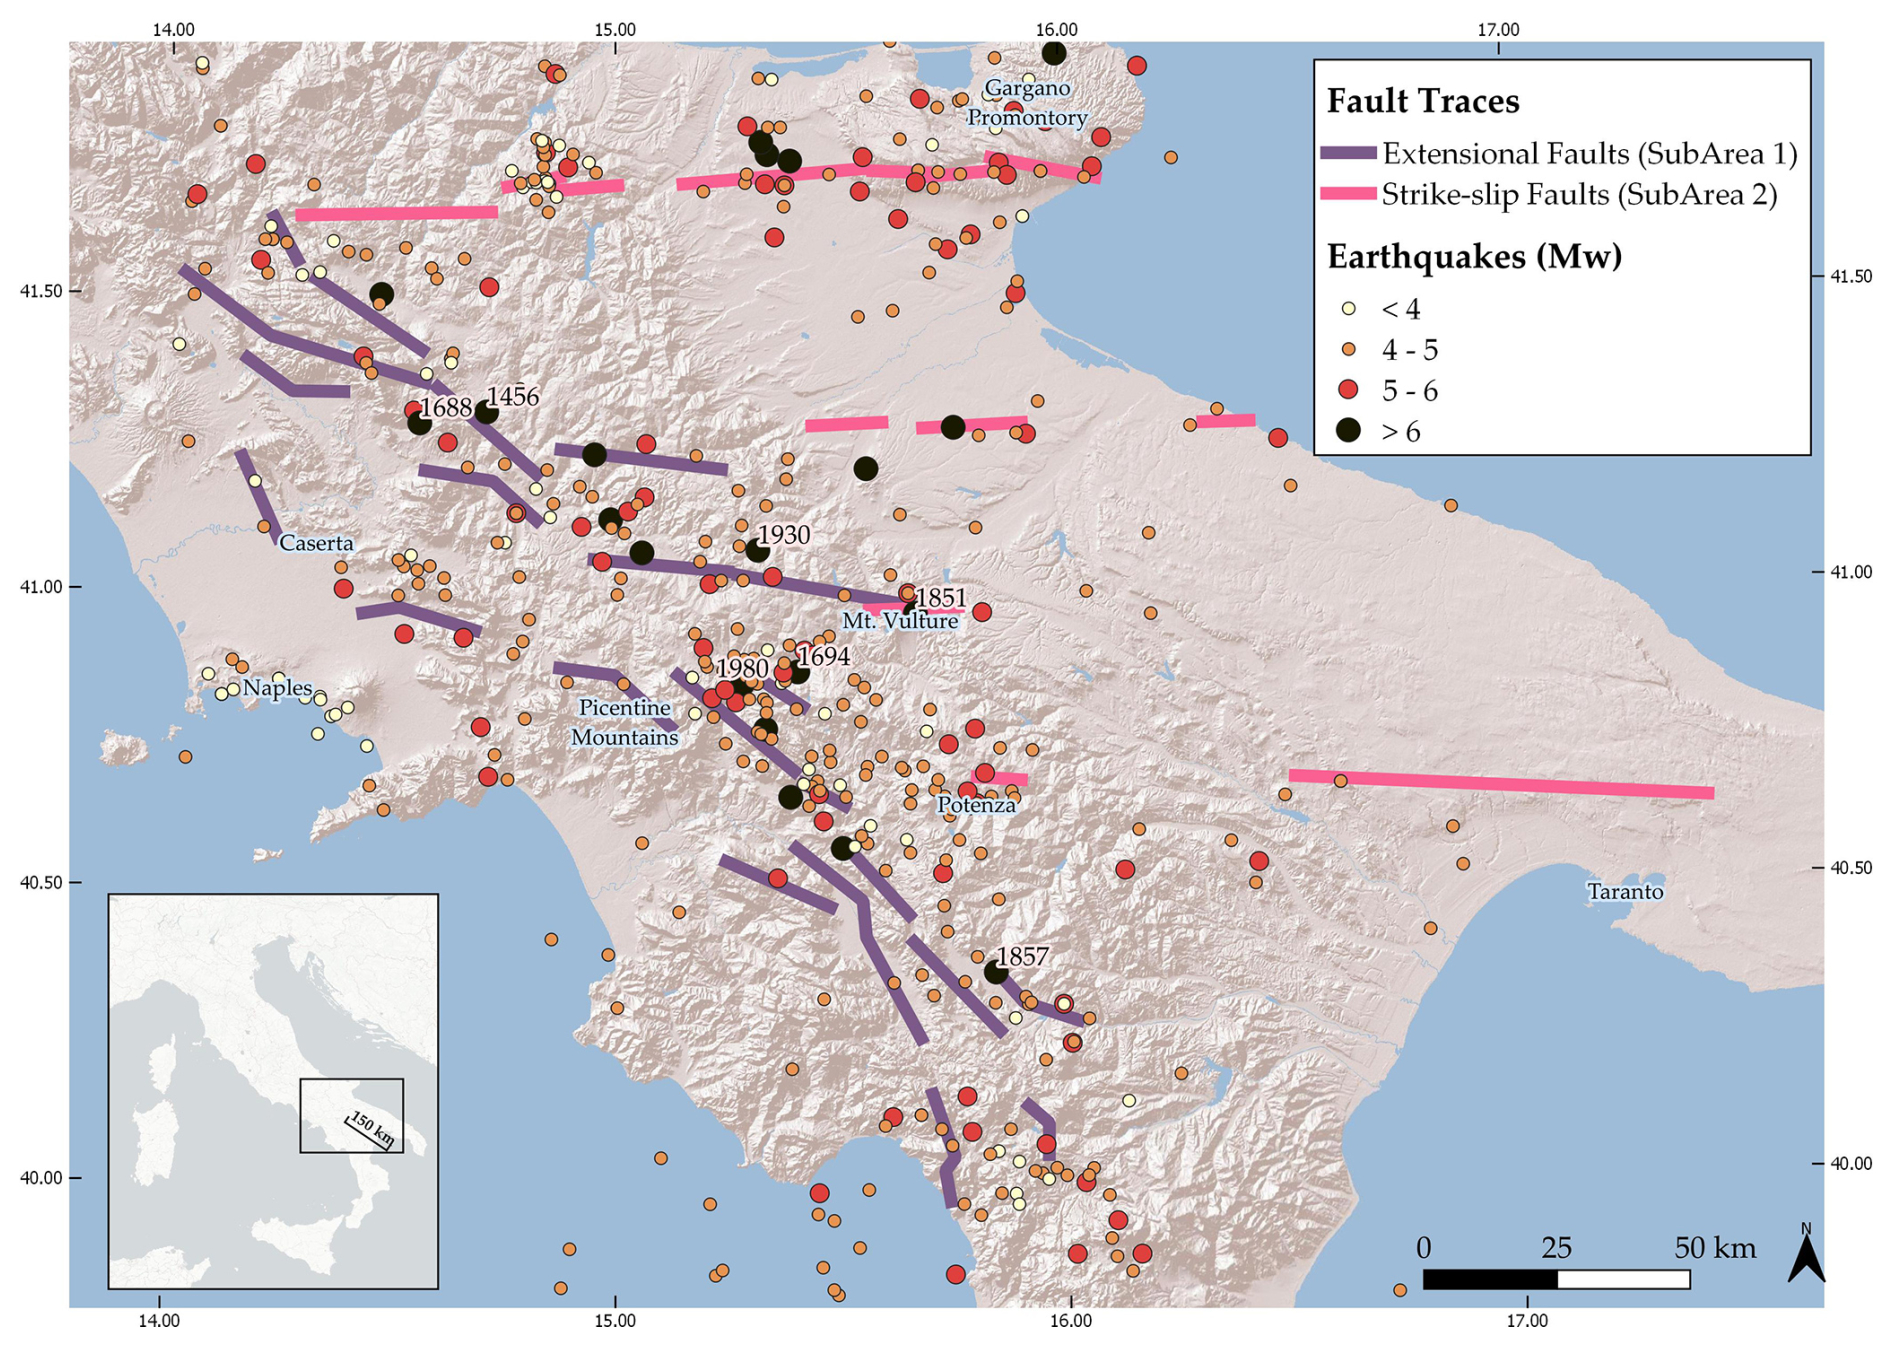
Figure 1Geographical distribution of the Mw≥4.0 earthquakes occurred in the southern Apennines between 1019 and 2017 (; reference catalogue: CPTI15 v4.0, Rovida et al., 2022) and the fault traces of the 35 seismogenic sources used for this study (references: Valentini et al., 2017; DISS Working Group, 2025). Earthquakes are colour-coded by magnitude class (Mw bin = 1.0), with larger symbols representing stronger events; major historical earthquakes are labelled by year. Faults are colour-coded by tectonic domain. Latitude and longitude grid shown in WGS84 coordinates.
This tectonic framework explains the subdivision of the study area into two main domains or fault systems. The strongest seismic events of the region (Fig. 1) mostly occurred in one of the domains, a segmented belt of large normal NW–SE striking faults, running along the chain axis, hereafter “SubArea 1” (DISS Working Group, 2025). In the other system, i.e., the foreland, faulting develops along E–W right-lateral strike-slip to oblique-slip faults, hereafter “SubArea 2” (DISS Working Group, 2025).
The strongest events (Fig. 1) reported in the Parametric Catalogue of Italian Earthquakes – CPTI15 v4.0 (Rovida et al., 2022) for this region are the 1456 Sannio-Irpinia sequence (Mw 7.2), which is one of the most destructive events that took place in the Italian peninsula, the 1688 (Mw 7.1) and the 1857 (Mw 7.1) earthquakes. The probably most famous destructive earthquake, the Mw 6.9 that hit the Irpinia district in 1980, had devastating effects in a large area of the southern Apennines, causing thousands of casualties and high damage to buildings. Latorre et al. (2023) observe that the highest earthquake concentration in the southern Apennines consistently occurs along the faults responsible for the 1980, Mw 6.9 Irpinia earthquake. Close to this epicentre, it is also worth to mention the 1694 (Mw 6.7) Irpinia-Basilicata earthquake, considered the ancestor of the 1980 (DISS Working Group, 2025), the 1851 (Mw 6.5), and the 1930 (MW 6.7) Irpinia earthquake.
2.1 The SHERIFS method
In this study, we employ SHERIFS V1.1 (Seismic Hazard and Earthquake Rate In Fault Systems), an approach introduced by Chartier et al. (2017) and further developed as an accompanying code by Chartier et al. (2019), designed to model seismicity rates in active fault systems using geological fault data as inputs. The approach treats fault systems as a whole, explicitly accounting for multi-fault rupture scenarios in the estimation of seismicity rates. So far, SHERIFS has been tested in several regions worldwide including SE Spain (Gómez-Novell et al., 2020a, b), the Marmara Region in Türkiye (Chartier et al., 2021), the Tibetan Plateau (Cheng et al., 2021) and the Levant Fault (El Kadri et al., 2025).
To derive seismicity rates from geological slip-rate data, SHERIFS requires several inputs: (i) the 3D geometry and slip rates of the fault system, (ii) a set of multi-fault rupture scenarios based on user-defined criteria (e.g., inter-fault distance), and (iii) a target Magnitude-Frequency Distribution (MFD) specified at the fault-system level (e.g., a Gutenberg-Richter law). The epistemic uncertainties of the input parameters in SHERIFS are explored through an iterative process that performs the computation n times exploring n different values of the input parameters within their uncertainty ranges. The result is the average and uncertainty dispersion cloud of all samples explored.
One of the main characteristics of SHERIFS is that the approach treats the prescribed slip rate of the fault system as a budget. Through an iterative procedure, this slip rate budget is distributed among faults according to the magnitudes they can accommodate, following analytical relationships that link seismic moment rate to seismicity rates. The slip rate budget is spent until the pre-imposed MFD target is reached and the slip rate budgets are consumed. In some cases, the target is reached before the budget of all faults is exhausted and therefore there is remaining slip rate budget that is not converted into seismicity rates. This remaining budget, namely Non-Main-Shock slip (hereafter NMS) in SHERIFS, is indeed an artifact of the modelling. However, according to the authors, small percentages of NMS (generally below 30 %–40 % of the total budget of the fault), can be interpreted as a natural phenomenon (e.g., post-seismic slip or creep) as geological slip rates might not be exclusively resulting from the coseismic phase, but also from other post-seismic relaxation processes. Conversely, NMS percentages above 30 %–40 % are less easily attributable to the natural phenomena described. Instead, they most likely indicate that the combination of input hypotheses used (fault parameters, target MFD and rupture hypotheses) is not optimal in the SHERIFS framework and that they should be reconsidered (Chartier et al., 2019).
In our model, the epistemic uncertainty is explored in two ways:
-
Model branches: we define 13 modelling branches (Fig. 2), covering variables such as rupture scenarios, scaling relationships, b-values, and background seismicity and buffer areas.
-
Random samples: we run 10 random samples per branch that explore different values of slip rate on faults within their uncertainty ranges.
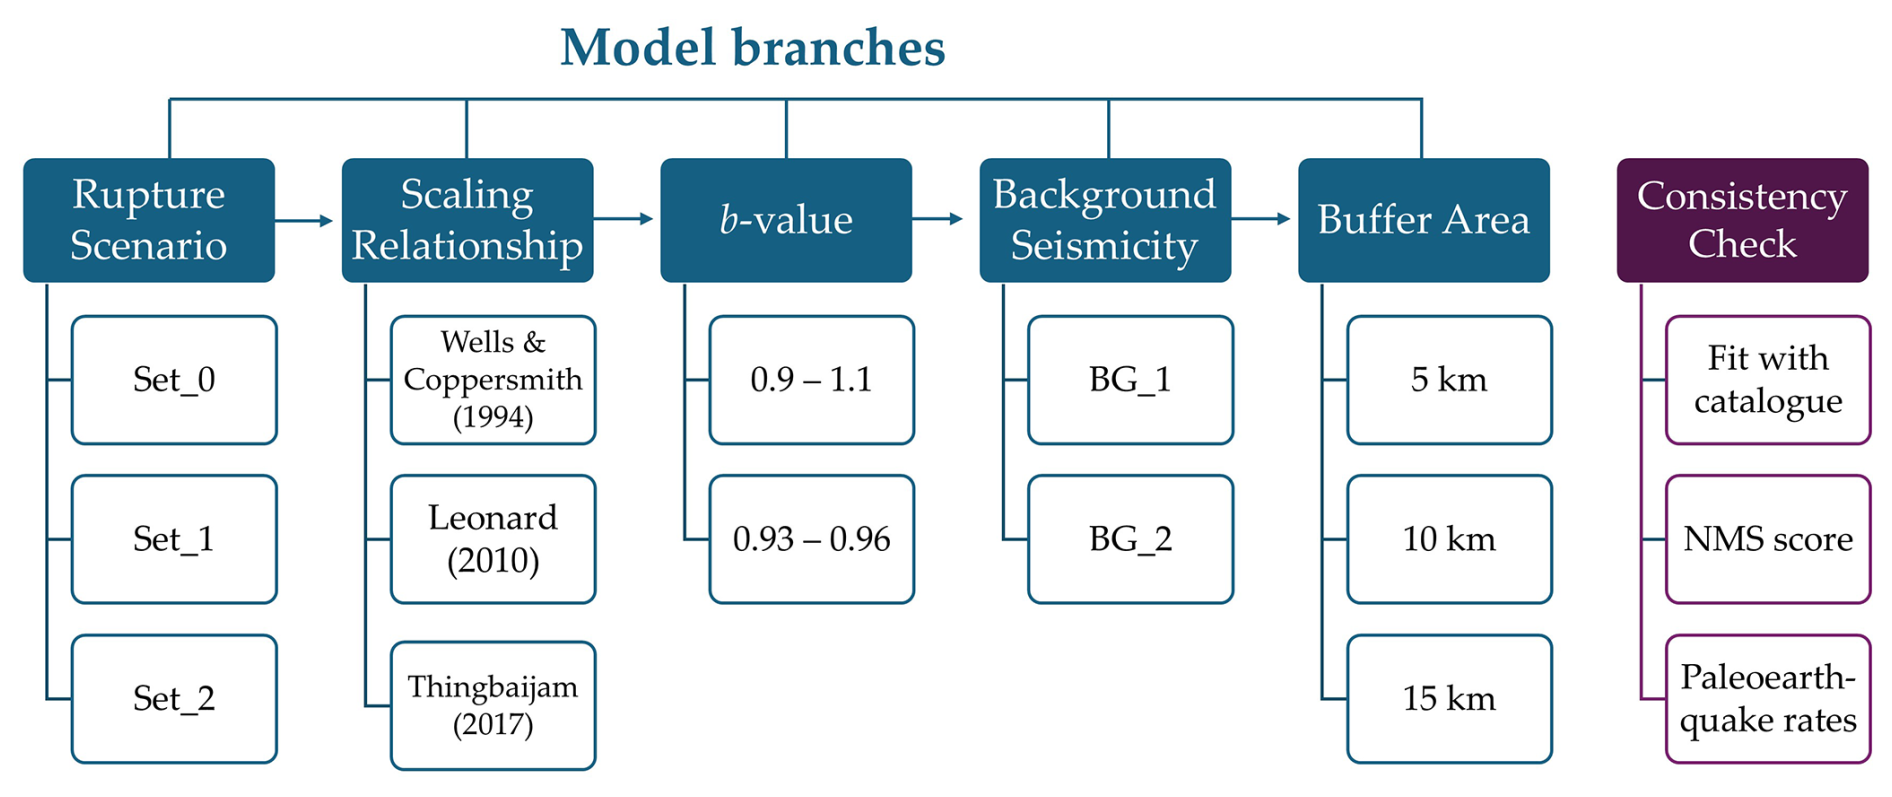
Figure 2Structure of the main model branches (blue) used to explore epistemic uncertainty in the fault-based model, and of the consistency check criteria (violet) adopted to assess their performance.
The inputs used in our modelling, which are discussed in detail in the following sections, are archived and openly accessible in a Zenodo repository (Alessandrini et al., 2026).
2.2 Input data and model parameters
2.2.1 Fault sources
We use 35 faults of the southern Apennines for our study. All fault identification names (thereafter IDs), and their main characteristics are listed in Table 1, while their geometries are shown in Fig. 3. Fault traces, 3D geometry (dip and seismogenic depth), slip rates and kinematics are mainly extracted from the Individual Seismogenic Sources (ISS) within the Database of Individual Seismogenic Sources – DISS 3.3.1 (DISS Working Group, 2025), a geo-referenced archive of information on seismogenic sources and of their seismogenic potential (Basili et al., 2008). This database is a reference in Italy and many recent seismic hazard studies have employed this database for seismic source modelling (e.g., Stucchi et al., 2011; Woessner et al., 2015). We include some additional active faults reported by Valentini et al. (2017), that are not part of the DISS (respectively faults 11, 15, 16, 26, 27, 28, 29, 30, 32, 33, 34, 35).
Table 1List of faults employed in the models. Faults highlighted by a star (*) are the integration of Valentini et al. (2017) while the other faults come from the DISS 3.3.1 database (DISS Working Group, 2025). For each of them, we list here the name, the fault ID used in the model, the dip angle, the kinematics (S = strike-slip, N = normal), the seismogenic depth range (km), length and the slip rate range (mm yr−1). Paleoseismic data are available for faults reported in the DISS database and here marked by a double star ().
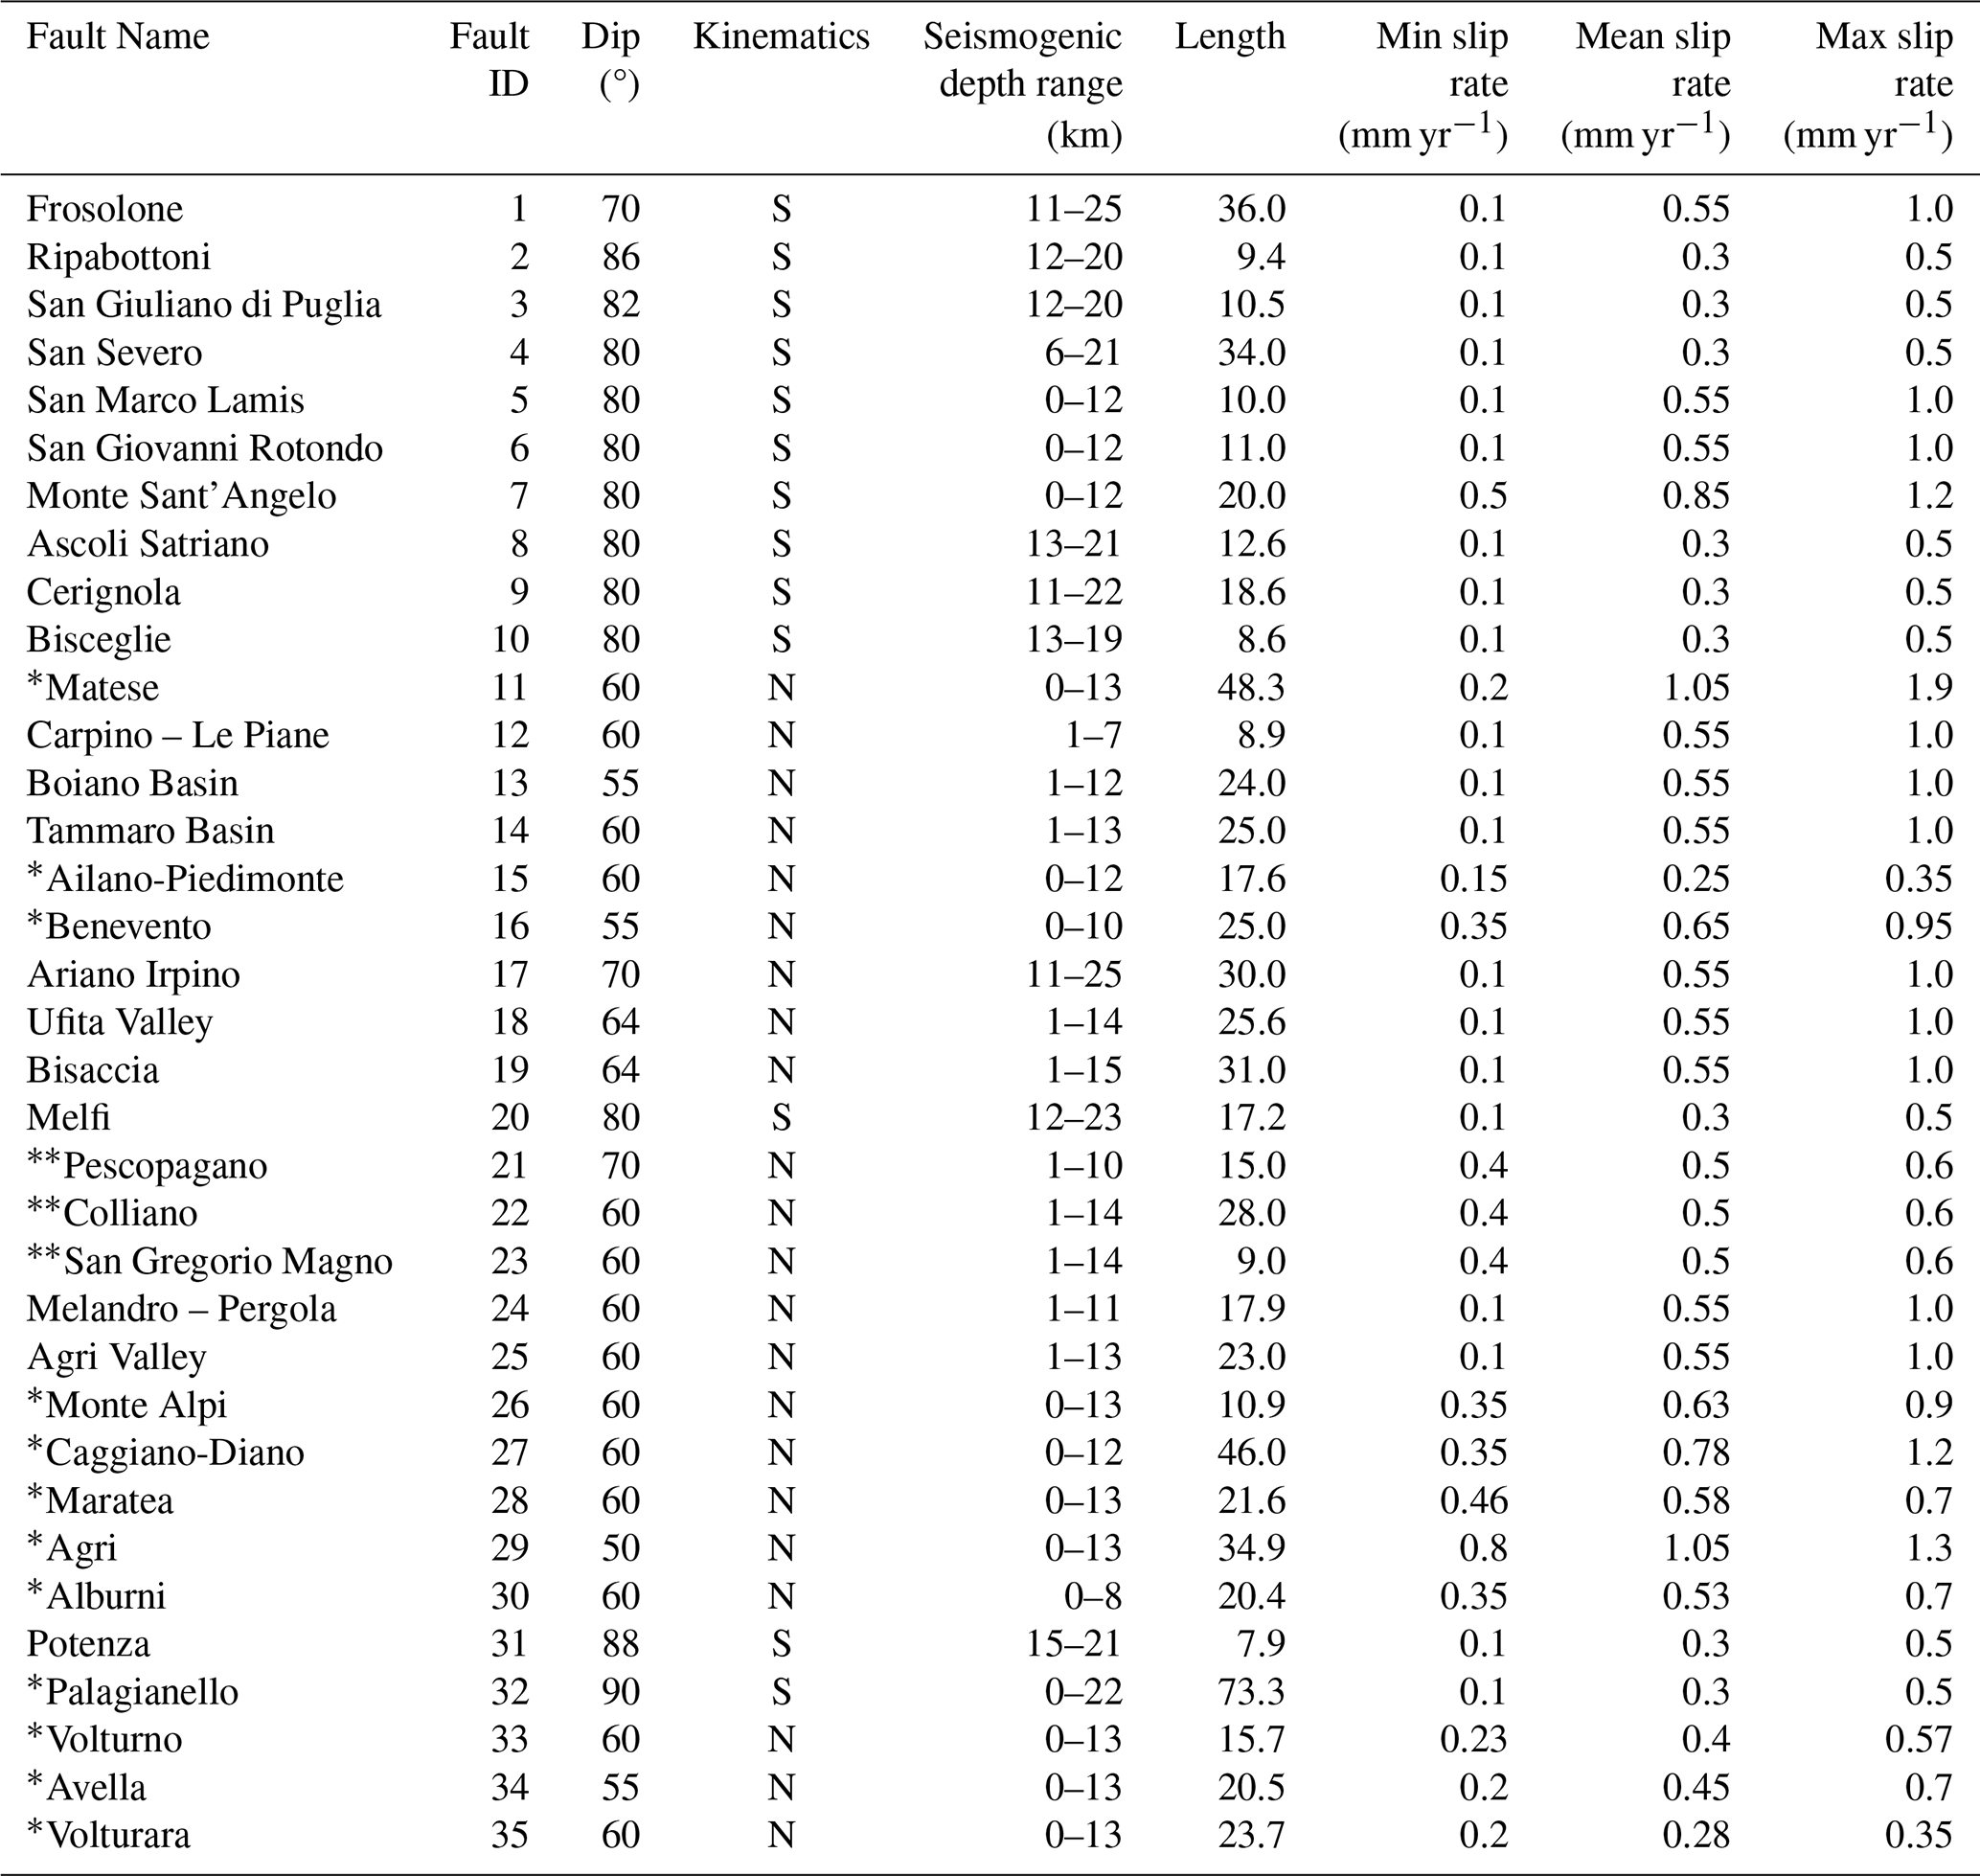
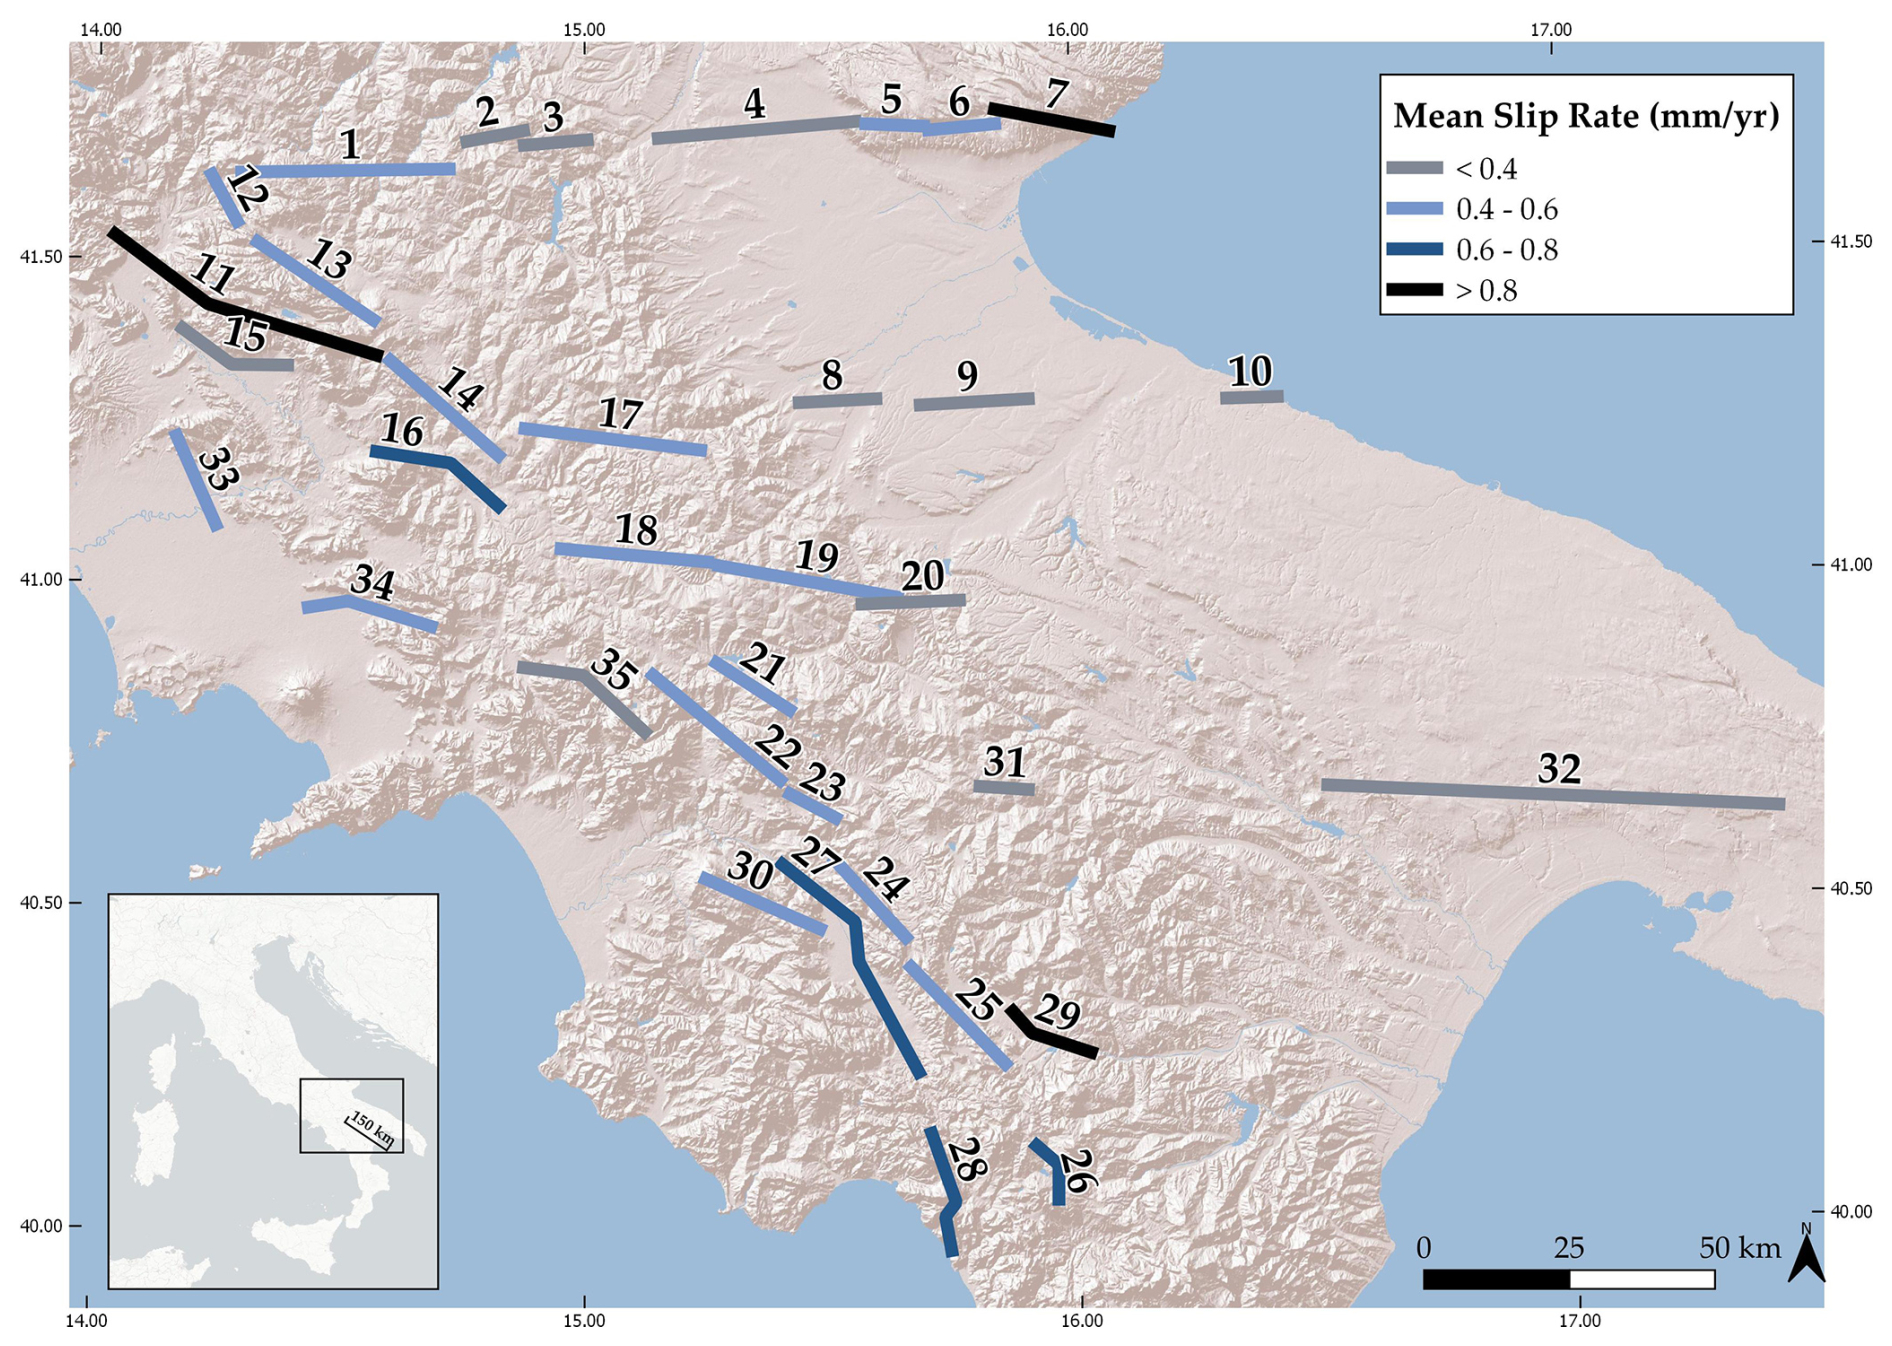
Figure 3Representation of the 35 fault sections, coloured based on their mean slip rates (references: Valentini et al., 2017; DISS Working Group, 2025).
Fault geometries and segmentation are directly adopted from these datasets, which define individual seismogenic sources based on geological, geophysical and seismotectonic criteria, including geological mapping, seismicity distribution, geomorphic evidence and geodetic observations. Potential discontinuities in fault traces, particularly within the strike-slip systems, may reflect the presence of unmapped or blind structures. For example, additional faults are identified in the ITHACA catalogue (ITaly HAzards from CApable faults; ITHACA Working Group, 2019). However, these structures generally lack the quantitative parameters required for earthquake rate modelling, such as slip rates and seismogenic depths. For this reason, only faults with sufficiently constrained geometric and kinematic parameters are included in the present modelling framework. The adopted segmentation therefore reflects the current state of knowledge on active faults for seismic hazard applications in the region.
The slip rates we assigned to each fault come from the DISS 3.3.1 database and by Valentini et al. (2017) and are constrained by geological and geodynamic observations. Variability in slip rates across adjacent faults is consistent with the heterogeneous accommodation of strain within fault systems, which depends on factors such as fault geometry, orientation and mechanical properties. This behaviour has been documented in several tectonic settings, including the Apennines, and is reflected in regional fault databases (e.g., Faure Walker et al., 2021).
2.2.2 Segmentation rules and rupture scenarios
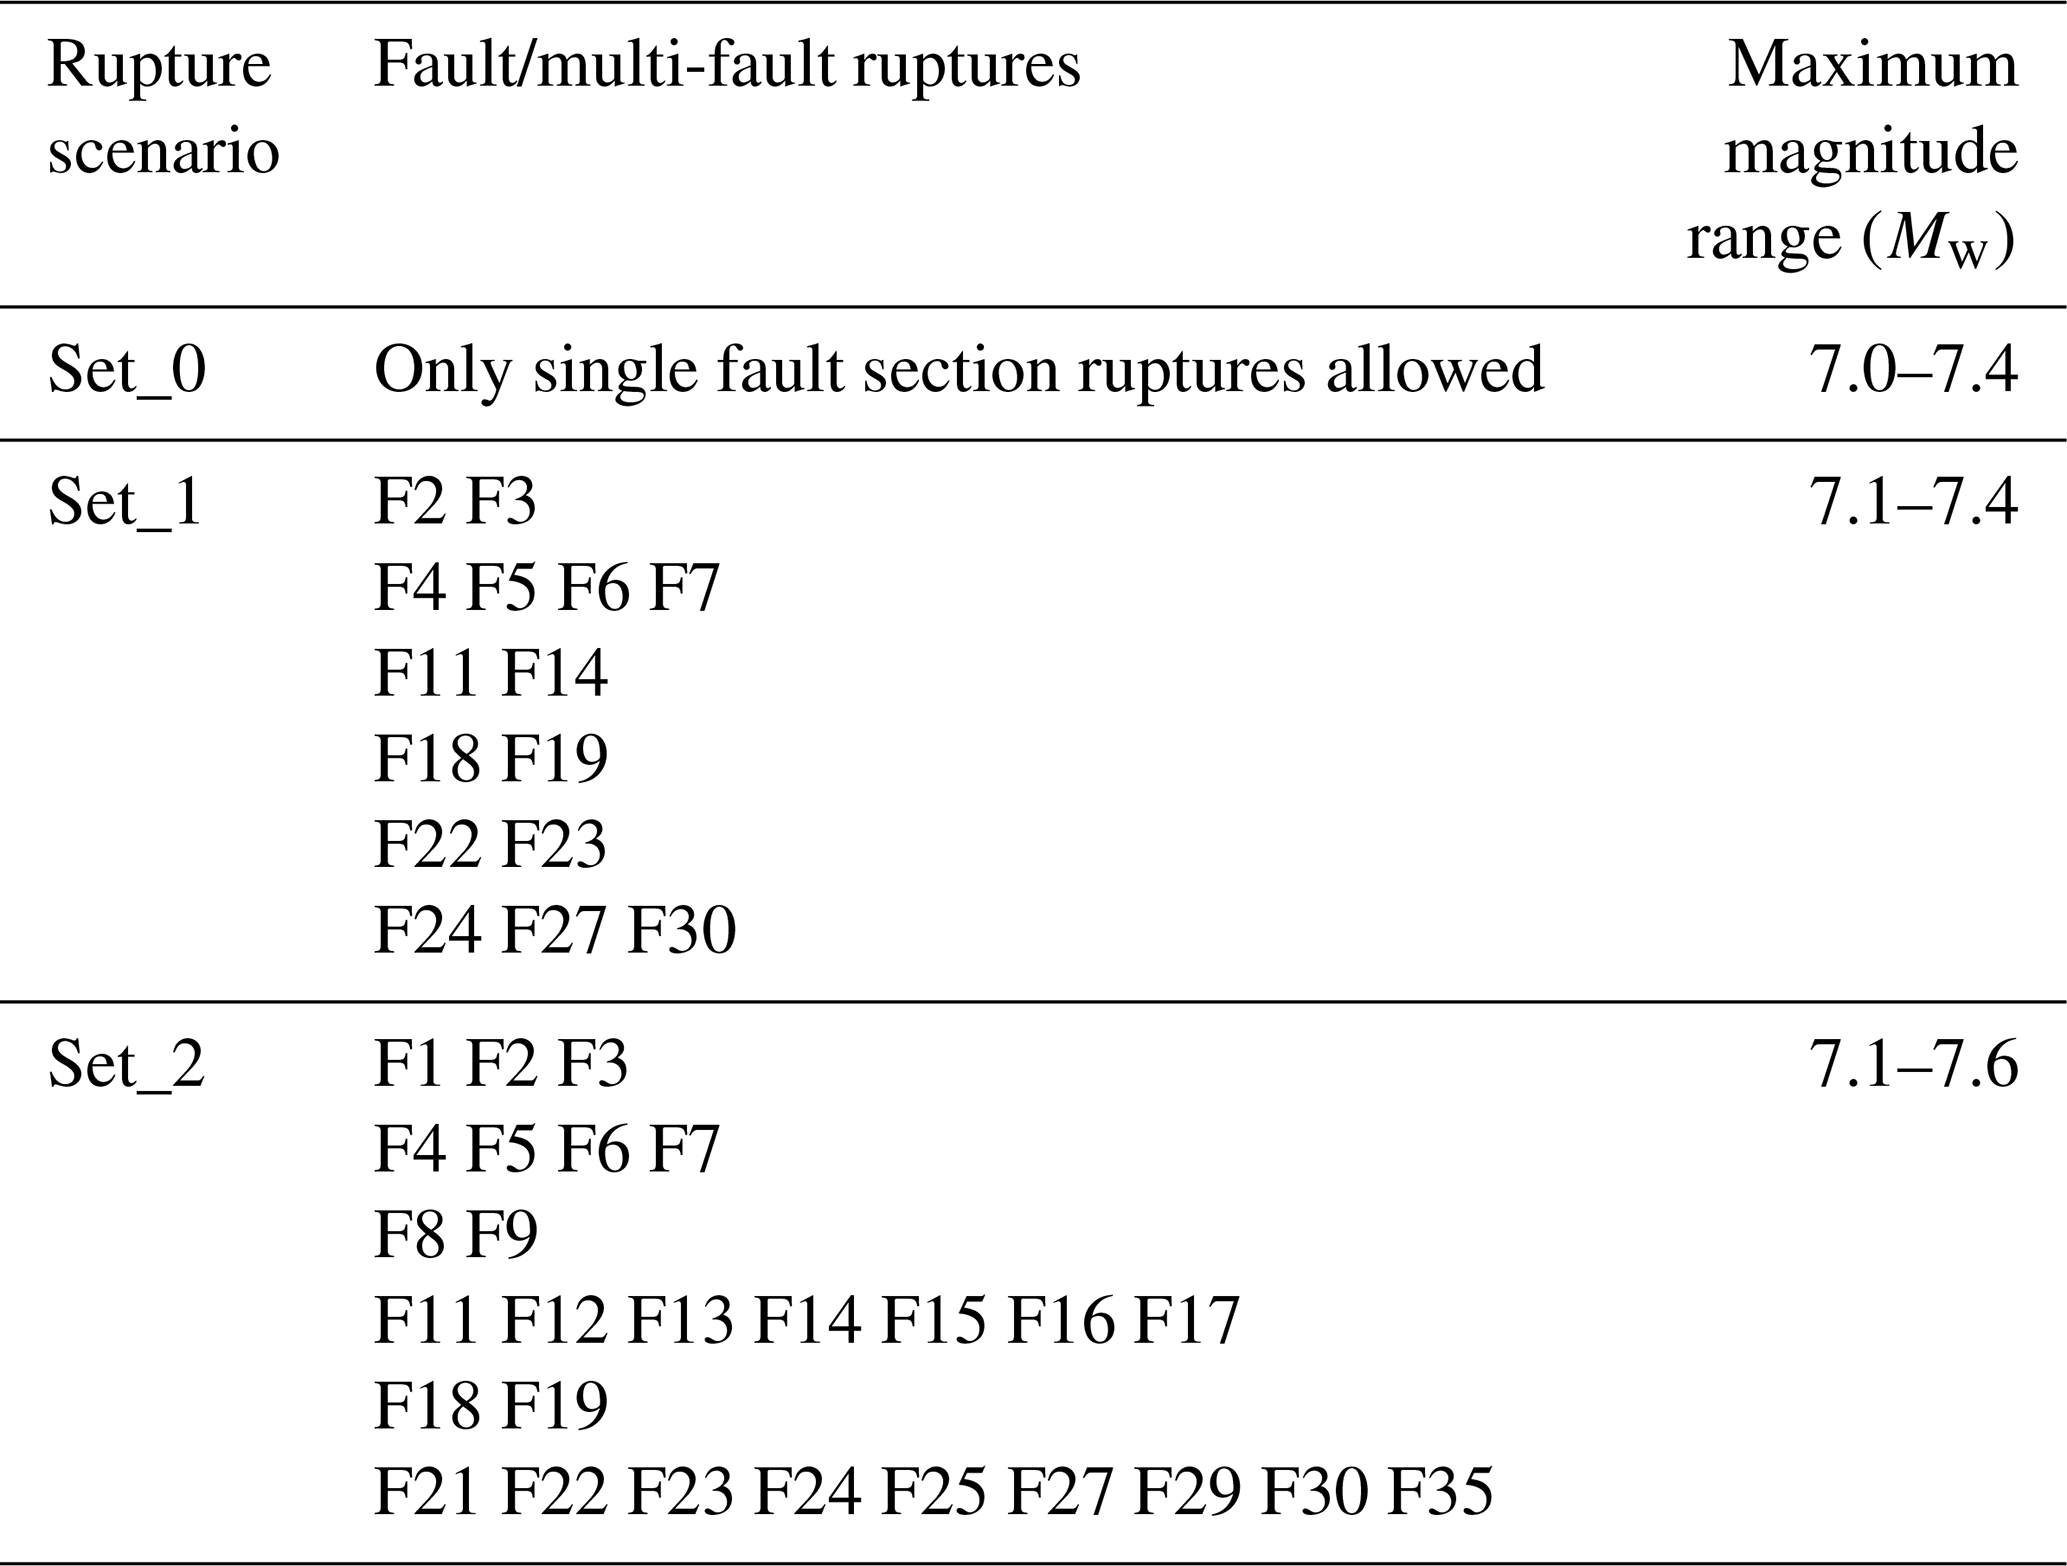
We explore fault-rupture scenarios to compute system-level seismicity rates under different hypotheses of fault connectivity within the fault system. We define three fault rupture scenarios for the whole fault system (Table 2), each representing an incremental increase in fault connectivity and, consequently, in multi-fault rupture length. These scenarios are exploratory hypotheses, and as such, other configurations could be tested.
Table 2List of the three fault rupture scenarios, characterized by incremental multi-fault ruptures. For each scenario the combinations of the maximum ruptures are listed, and the expected maximum magnitude range is provided. Fault sections (from 1 to 35) are shown in Fig. 3.
-
Set_0. In this hypothesis, only single fault section ruptures are allowed. The segment lengths reported in the literature for each fault define the maximum rupture length, and multi-segment ruptures involving neighbouring faults are not allowed.
-
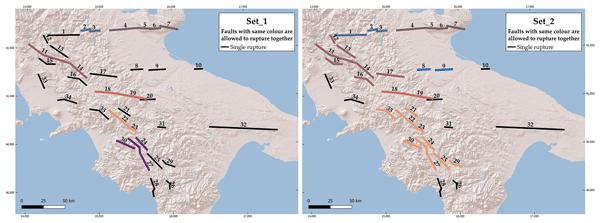
Set_1. In this scenario a subset of multi-fault ruptures is allowed based on geometric compatibility rules (i.e., faults with similar strike, dip direction, seismogenic depth), kinematics compatibility, as well as a fault distance threshold. In terms of kinematic compatibility, we follow the cumulative rake change criterion suggested by Milner et al. (2013), which limits the total rake variation within a rupture to 180° to prevent kinematic incompatibility. This means that only faults with the same kinematics are allowed to rupture together. In terms of distance for rupture propagation, we select 5 km as the threshold for rupture propagation, consistent with previous studies on multi-fault rupture connectivity, including the UCERF-3 framework (e.g., Milner et al., 2013; Field et al., 2014; Scotti et al., 2020), where similar inter-fault jump distances are commonly used. Based on the above criteria, Set_1 permits ruptures between neighbouring faults up to a maximum of 4 faults rupturing together (Fig. 4) with rupture lengths up to 75 km, which falls well within the typical rupture lengths observed in Gerstenberger et al. (2024), usually below a few hundred kilometres.
-
Set_2. The distinct feature of Set_2 is the adoption of a larger distance threshold of 10 km for rupture propagation, while maintaining the requirement of compatible faulting mechanism. This configuration is intentionally more speculative and is introduced to explore an upper-bound range of rupture behaviours and their impact on seismicity rates. The choice of extending the distance threshold beyond 5 km is motivated by observations of complex multi-fault ruptures in the study area, such as the 1980 Mw 6.9 Irpinia earthquake, which involved multiple adjacent fault segments (faults 21–22–23) separated by distances exceeding 5 km. Under this configuration, up to 8 faults can rupture together (Fig. 4) resulting in rupture lengths up to 184 km.
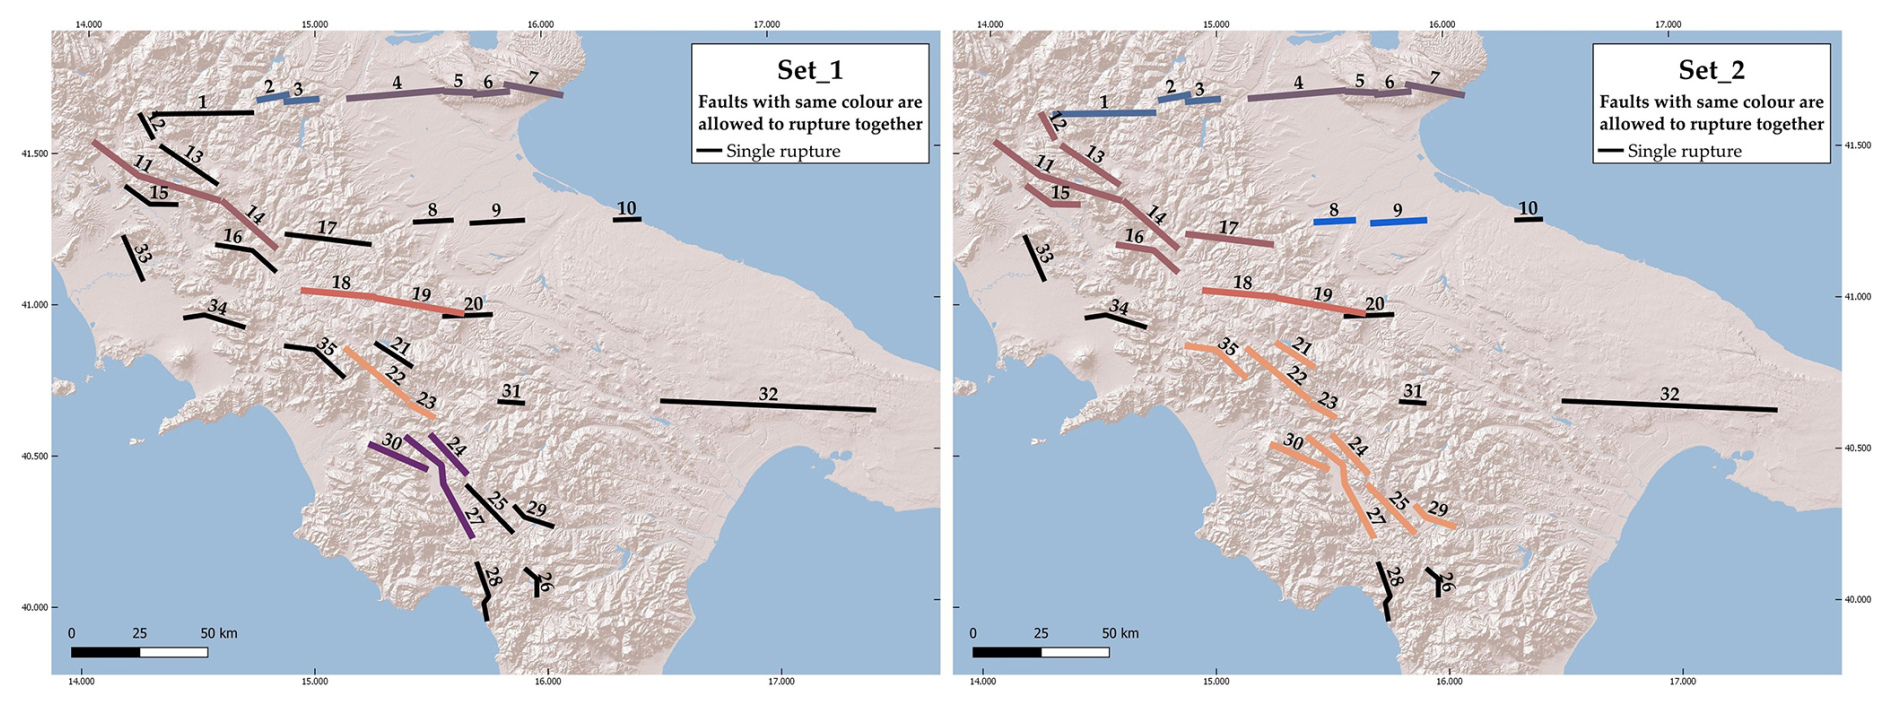
Figure 4Maximum extent (number of faults) of the multi-fault rupture scenarios in Set_1 and Set_2 explored in this study. Faults with the same colour are allowed to rupture together in a same rupture within that particular scenario set.
In order to study the relationship between magnitude and rupture area, we employ the empirical scaling relationships of Wells and Coppersmith (1994), Leonard (2010), and Thingbaijam et al. (2017). These scaling laws, widely used in PSHA applications, have broad applicability across tectonic settings and are implemented in the current version of the SHERIFS code. Leonard (2010) has been employed in regional studies in Italy and is used for the parametrization of national databases (e.g., DISS Working Group, 2025), supporting its suitability for the study area. Wells and Coppersmith (1994) provide a robust and widely adopted model that does not require specific adjustments between continental extensional and compressional regimes. In addition, Thingbaijam et al. (2017) provides coefficients specifically derived for normal faults, which represent the dominant faulting style in the Apennines, allowing a better representation of this tectonic regime. The maximum magnitude (Mmax) range is set by the scaling relationship, and it is shown for each scenario in Table 2. A comparative evaluation of their performance within the study area is presented in Sect. 4.3, where their implications for the modelling results are discussed.
2.2.3 Model MFD shape
To model the magnitude-frequency distribution (MFD) of seismicity on individual faults, we adopt a Gutenberg-Richter (G-R; Gutenberg and Richter, 1944) relationship, which is widely used in PSHA and is consistent with the Italian national seismic catalogue (e.g., CPTI; Rovida et al., 2022). To explore the influence of epistemic uncertainty, we test two different b-value ranges: a broader interval (0.9–1.1) based on the national CPTI catalogue (Rovida et al., 2022), and a narrower one (0.93–0.96) supported by previous studies focused on this region (Gulia and Meletti, 2007; Meletti et al., 2008).
2.2.4 Background seismicity
One common challenge in fault-based PSHA is selecting a magnitude threshold for a confident assignation of seismicity to the known active faults, as small-to-moderate earthquakes rarely cause surface faulting and therefore may not be related to the known active faults. Because the classical selection of a cut-off threshold can be somewhat arbitrary, SHERIFS deals with this issue by incorporating magnitude-dependent ratios that determine the proportion of the seismicity that will be assigned to the faults, usually increasing with magnitude. That is, for each magnitude a user-defined proportion – ratio – of the seismicity rates of the faults is subtracted and assigned to the background as a distributed source. This approach allows for a smoother distribution of seismicity between faults and background and is consistent with real observations.
We explore two alternative scenarios for background seismicity:
-
BG_1, a fault-only model where all seismicity is attributed to the known active faults.
-
BG_2, a hybrid model where a magnitude-dependent fraction of seismicity is assigned to the background buffer (Fig. 5), outside the mapped faults.
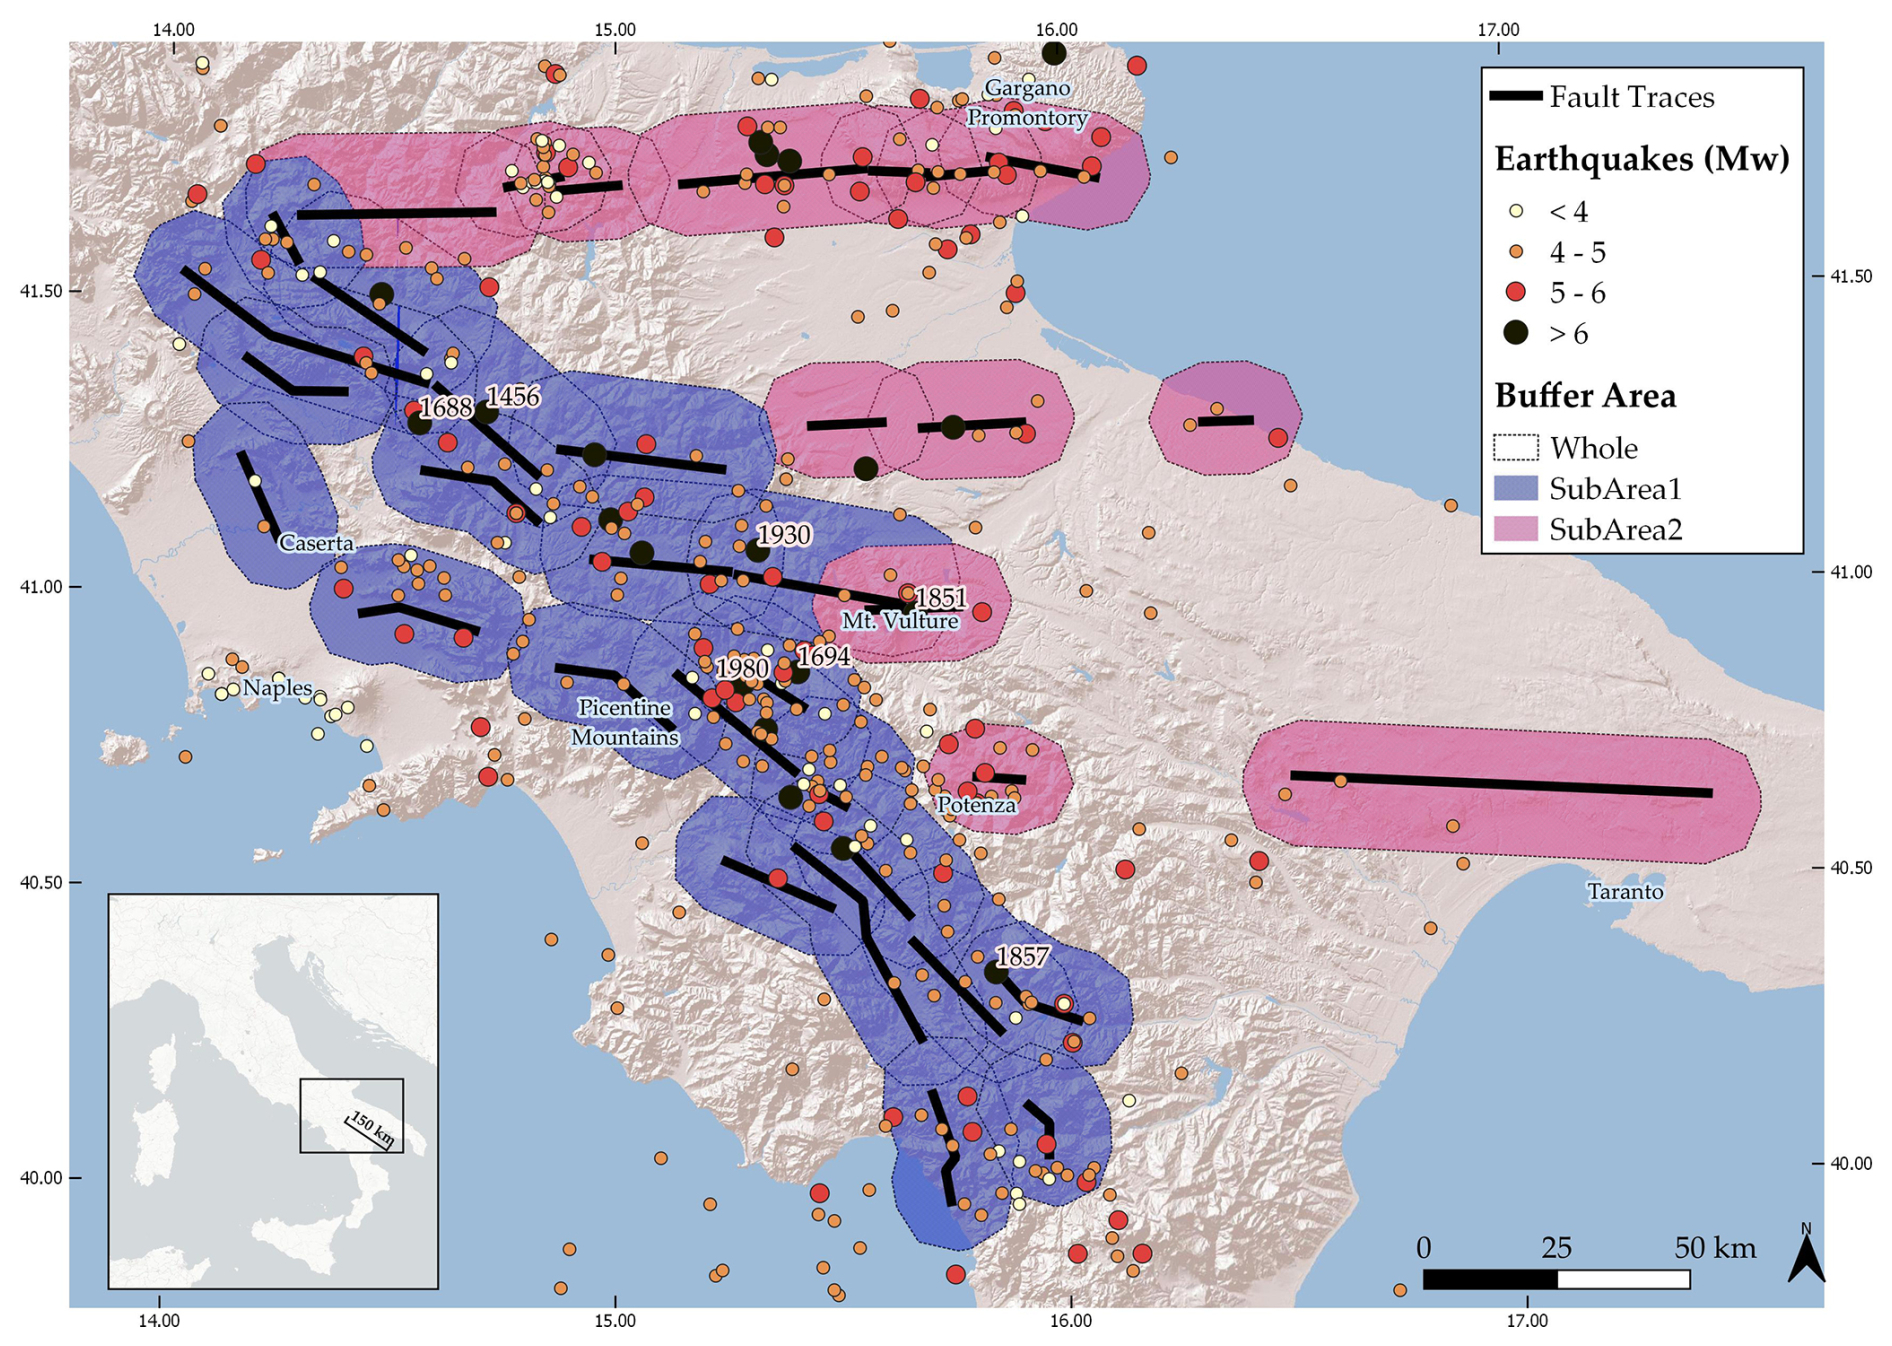
Figure 5Buffer area (10 km around the faults, dashed line) used in the BG_2 scenario to define the background seismicity and to extract the catalogue for the consistency check. Earthquakes from the CPTI15 v4.0 catalogue (Rovida et al., 2022) are shown for reference. Internal buffer areas are also displayed for the two structural domains (SubArea 1, blue shaded buffer and SubArea 2, pink shaded buffer).
To define the BG_2 scenario, we set up a buffer area of 10 km around the faults (Fig. 5), where background seismicity is assigned. This 10 km distance is consistent with background zone sizing proposed by Chartier et al. (2019) (e.g., 10 or 20 km from faults). In order to evaluate the sensitivity of the results to this modelling choice, we also tested alternative buffer distances of 5 and 15 km. The comparison between buffer sizes is further discussed in Sect. 4.4, and the corresponding models and figures are provided in the Zenodo repository (Alessandrini et al., 2026).
The ratios for each magnitude bin (Table 3) are custom set up using a magnitude-dependent criterion, based on the assumption that larger earthquakes are more likely to be associated with known, geomorphologically recognized faults, whereas smaller events may occur in secondary unmapped or buried faults. Consequently, BG_2 assigns higher background ratios to lower magnitudes.
Table 3Ratio of seismicity occurring on known faults for each background scenario considered in the model (Mw bin = 0.5).

2.2.5 Model setup
Each branch of the model is computed 10 times using different random values (samples) within the uncertainty ranges of the different input parameters (e.g., fault slip rates, b-values) to explore the epistemic variability of the seismicity rates linked to the input parameter uncertainties. This results in the computation of 1080 different models, 360 for each rupture scenario branch.
2.3 Comparison with observations
2.3.1 Regional historical and instrumental seismicity
We adopt the Parametric Catalogue of Italian Earthquakes – CPTI15 v4.0 (Rovida et al., 2022) as a regional seismic catalogue to compare the synthetic MFDs modelled in this study and to evaluate the models that best fit such seismicity rates. CPTI is nowadays the main tool for seismic hazard models in Italy, as it homogenises the magnitudes of pre-instrumental (historical) and instrumental events (Rovida et al., 2020). The catalogue contains all known Italian earthquakes from year 1000 AD. All the available events for this work have been selected within a radius of about 150 km encompassing the study area in the southern Apennines. The resulting selection (Fig. 1) spans a time interval from year 1019 to 2017, and a moment magnitude range of . The minimum magnitude for our analysis is set at Mw 4.0, and the completeness magnitudes to obtain the GR distributions for the CPTI catalogue are reported in Rovida et al. (2020). For the comparison with the models, only the events falling within the buffer area in Fig. 5, which is regarded as the area of influence of the active faults, are considered.
2.3.2 Paleoearthquake rates
In faults with available paleoseismological studies and, as such, estimates of paleoearthquake recurrence intervals, we compare the modelled participation rates of that fault with the estimated paleoearthquake rates from paleoseismological studies (paleoearthquake rate = 1 paleoearthquake recurrence interval). We considered that the paleoseismological earthquake rates (paleorates) data represent earthquakes of Mw≥6.0–6.5, based on the statistical fact that most surface rupturing earthquakes (i.e., those observed in paleoseismology) have a magnitude equal or higher than the said threshold (Baize et al., 2020; Nurminen et al., 2022).
Paleoseismic data, including annual paleoearthquake rates, are available for three faults activated during the 1980 Mw 6.9 Irpinia earthquake: Pescopagano (21), Colliano (22), and San Gregorio Magno (23), thanks to several studies (e.g., Pantosti and Valensise, 1990; D'Addezio et al., 1991; Pantosti et al., 1993).
Our results show that the choice of rupture scenario is the primary factor driving differences in the modelled seismicity rates, whereas the other explored branches have a much more limited impact. For this reason, to enable a direct comparison of the different rupture scenarios, we display our results for each rupture scenario showing a single branch for the scaling relationship, b-value, background seismicity and buffer area (“Leonard (2010)”, “b-value = 0.9–1.1”, “BG_1”, “buffer area = 10 km”, respectively). The results for all the other branches are available in the Zenodo repository of the paper (Alessandrini et al., 2026). The quality of our models is tested through the evaluation of their fit with the regional earthquake catalogue MFD, the overall model performance based on the SHERIFS NMS proportion, and the agreement with paleoseismic slip rates.
3.1 Modelled MFDs: fit with the earthquake catalogue
In the upper three panels of Fig. 6, we show the fit between the synthetic MFDs, i.e., the modelled seismicity rates, and the regional seismic catalogue for the different rupture scenarios. In each scenario, the synthetic MFD is formed by combining 10 different MFDs, generated from the 10 random samples explored in the modelling.
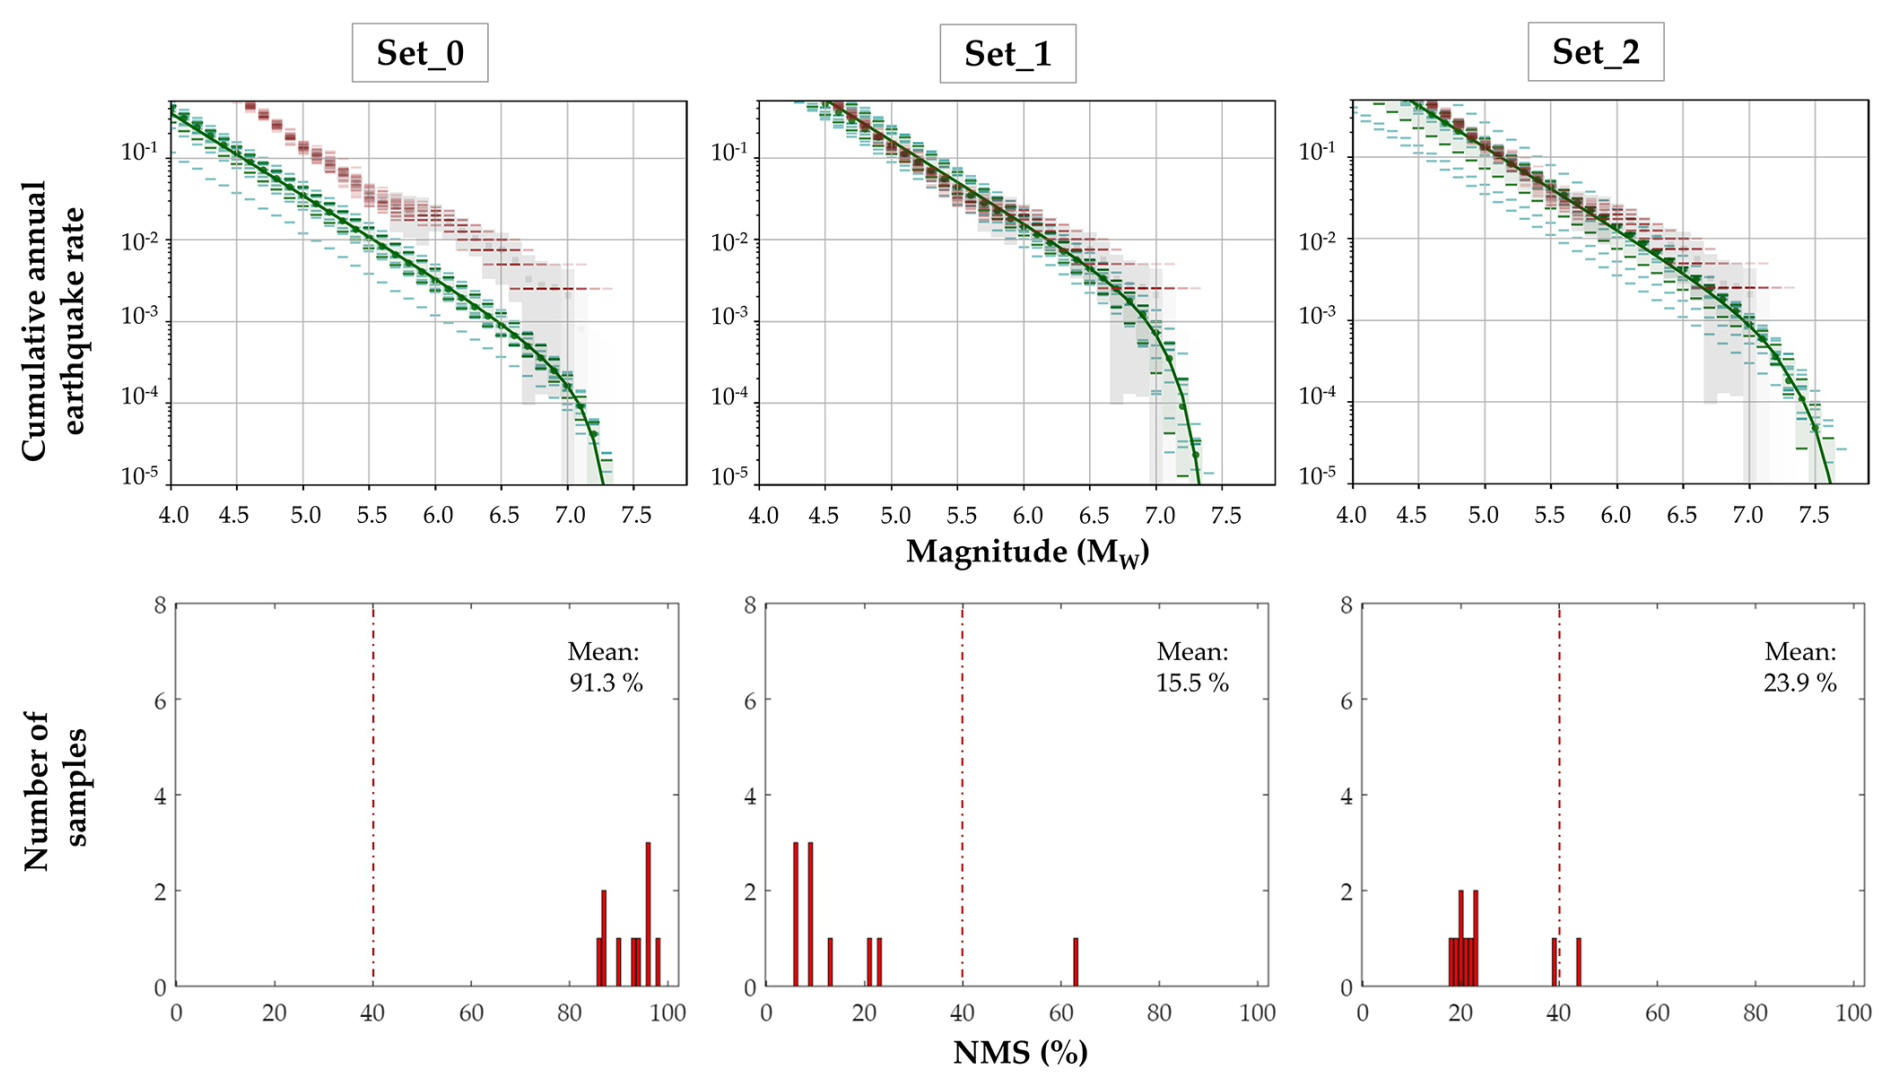
Figure 6Columns show different rupture scenarios. Above: comparison between the modelled MFDs (green) and the seismicity rates from the historical and instrumental regional catalogues within the study area (red). Solid green line is the mean MFD and green patches represent the uncertainty (16–84 percentiles). Below: NMS (expressed as a percentage) for each random sample explored in the model.
Results show that the choice of the rupture configuration directly influences the shape of the synthetic MFDs. The intermediate multi-fault rupture scenario Set_1 and the large multi-fault rupture scenario Set_2 exhibit the best fit with the catalogue, as the modelled rates with SHERIFS overlap with the catalogue-derived MFD. In particular, Set_1 displays a strong agreement with the catalogue for magnitudes up to Mw 6.0, while Set_2 tends to slightly underestimate the MFD across this magnitude range, but the modelled and observed rates still remain in good agreement when accounting for the respective variability.
Conversely, for Set_0 there is no match between the modelled and catalogue MFDs: the synthetic MFD lies consistently below the catalogue-derived curve across the entire magnitude range, even when considering their respective uncertainty bounds.
3.2 Non-Main-Shock slip
The choice of a rupture configuration also influences how the slip rate budget is consumed in the different SHERIFS iterations. When part of this budget remains unspent at the end of the calculation, it is referred to as non-mainshock slip. The NMS is expressed as a percentage and represented through histograms for each of the 10 random samples in each scenario (Fig. 6, lower panels). Following Chartier et al. (2019), NMS percentages above 30 %–40 % in a model indicate poor model performance. Accordingly, we use the NMS calculated by SHERIFS as an indicator of model quality: lower NMS correspond to better performance, as the models are able to spend the prescribed slip rate in the computation.
The NMS is also useful to differentiate between models with otherwise similar fits with the catalogue, as in the case of Set_1 and Set_2 (Fig. 6, upper panels). In our results, Set_1 exhibits the lowest NMS values among all models (mean value of 15.5 %), with 90 % of its samples falling below the 40 % threshold. Set_2 shows slightly higher values, but its mean value (23.9 %) remains well within the acceptable range. Conversely, Set_0 displays consistently high NMS values, ranging from (85 %–97 %). These results confirm that Set_1 and Set_2 yield the most robust performances, in line with their closer agreement with the catalogue-derived seismicity rates (Fig. 6).
3.3 Paleoearthquake rates on faults
Here we compare the participation rate curves modelled with SHERIFS in each of the three fault sections with the paleorates documented (faults 21, 22, 23; Fig. 3), for each rupture scenario, including their magnitude and rate uncertainty ranges (Fig. 7). The participation rates are derived from all ruptures involving these fault sections.
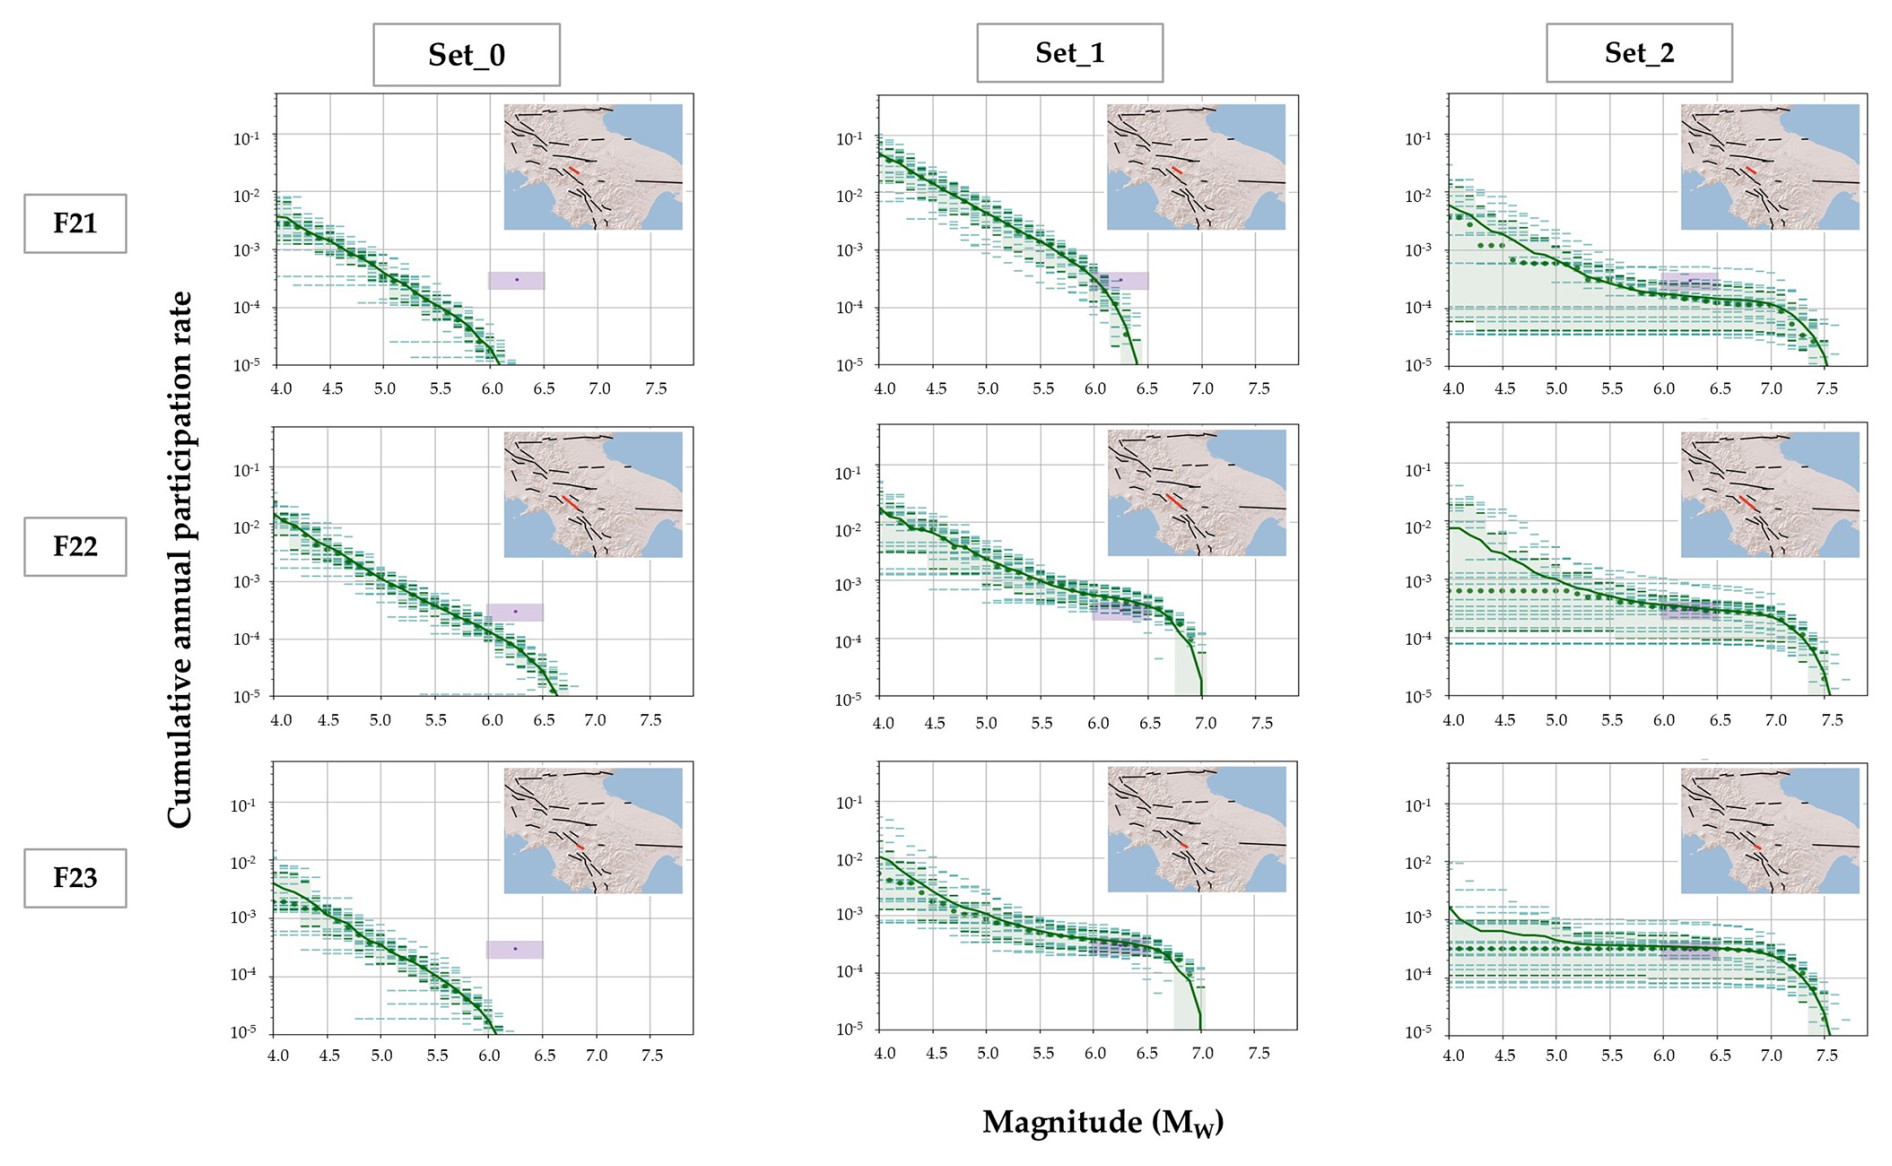
Figure 7Comparison of the modelled paleoearthquakes rates on faults and paleoseismic data. Green solid curves are the modelled mean cumulative participation rates rupturing the specific fault section; dashed lines are the dispersions of individual samples; purple points are the paleorates measured on the fault trench; purples boxes are the paleodata uncertainty ranges. The location of each fault (rows) is highlighted in red within the fault maps, for the three different scenarios (columns).
While all three rupture scenarios tend to underestimate the paleoseismic rates for fault 21, Set_1 and Set_2 closely match the paleoearthquake rate mean values and their uncertainty ranges for faults 22 and 23. Set_1 only slightly overestimates the central value for fault 22, but remains within the confidence intervals. In contrast, Set_0 consistently and significantly underestimates the measured rates for all three faults, confirming its weaker performance in line with the previous quality tests.
4.1 Segmentation models in the southern Apennines
The results of our analysis show that the impact of different rupture scenarios leads to markedly different behaviours in terms of seismicity rates, MFD shape, and expected maximum magnitudes. These results have implications for the segmentation models to be considered for PSHA in the southern Apennines.
Both Set_1 and Set_2, which allow ruptures involving multiple adjacent faults, show a good fit to the catalogue. Set_1, in particular, stands out as the most balanced configuration, showing strong consistency with the observed seismicity and producing a maximum expected magnitude (Mw 7.4) closer to historical records with respect to Set_2 (Mw 7.6). Conversely, individual segment ruptures show lower consistency with the observations for the study region. The good agreement of multi-fault rupture earthquake rates with the seismic and paleoseismic records in the region indicates that such multi-fault rupture scenarios are statistically consistent with observations in the southern Apennines, given the modelling set up and fault input data used. These results are also in line with historical observations, such as the 1980 Irpinia earthquake, which involved the rupture of multiple fault segments (21–22–23; Fig. 3, Table 1). In this sense, this study goes beyond simply generating alternative rupture sets and instead evaluates which classes of rupture complexity are required to reconcile independent observations at the regional scale.
Multi-fault rupture scenarios also have important implications for the maximum expected magnitude in the region, allowing earthquakes up to Mw 7.6 in the most permissive configurations (Set_2). Although such magnitudes are not represented in the historical catalogue (CPTI; Rovida et al., 2022), their occurrence cannot be rejected based on the available geological and seismological constraints adopted in this study. It is important to remark that SHERIFS is not a physics-based model (e.g., it does not simulate stress transfer or rupture propagation dynamics) to evaluate whether the fault system can accommodate such large magnitudes. Instead, it relies on statistical metrics derived from observations, which might not fully capture the specific characteristics of the southern Apennines fault system. Nevertheless, the explored rupture scenarios are not arbitrarily generated. Their definition is constrained by fault geometry, segmentation patterns, rupture jump distances, kinematic compatibility and seismogenic depth constraints, as discussed in Sect. 2.2.2.
Despite this and as observed in other tectonic regions (e.g., California, Field et al., 2014; New Zealand, Quigley et al., 2017; Taiwan, Chang et al., 2023), relaxing segmentation can give enhanced performance of seismicity models for PSHA. While the rupture scenario models explored in this study are a sample of the possible rupture scenario models to be explored, our results give valuable insight for future seismic hazard assessments in the region, suggesting that rupture complexity is a first-order control on long-term seismicity rates in the southern Apennines.
4.2 Tectonic domains impact
The modelled faults in the study area span two tectonically distinct domains: SubArea 1, characterised by extensional normal faulting, and SubArea 2, dominated by strike-slip structures (Fig. 1). These tectonic domains not only differ in fault kinematics but also in their seismic expression: SubArea 1 shows a denser clustering of seismicity, while SubArea 2 appears notably more quiescent. To investigate how these differences may influence model behaviour, we analysed the two sub-areas independently, that is, we computed the models considering only the faults and seismicity catalogue within each sub-area (the background seismicity buffers specific to each sub-area are shown in Fig. 5).
The results show that the two tectonic domains exhibit different statistical performances under the tested rupture hypotheses. In particular, we observe that the modelled rates of SubArea 1 faults (Fig. 8) return considerably better fits with the catalogue rates than SubArea 2 (Fig. 9), which systematically underestimates the catalogue. In SubArea 1, Set_1 is the configuration with the best overall performance for its agreement with the catalogue for Mw>6 and considerably low NMS percentages. The other sets underperform Set_1: Set_0 has higher NMS percentages, although holding mean values within the 40 % threshold; Set_2 slightly underestimates the catalogue rates. These results, especially the agreement of Set_1 and the NMS values across models, are consistent with the full model analysis (both sub-areas combined) and suggest that the extensional domain of the southern Apennines (SubArea 1) contributes substantially to the overall seismicity rates reproduced by the model. Conversely, the results of SubArea 2 indicate that the currently available fault data do not fully capture the seismicity rates observed in the catalogue in this area. While the lower seismic activity in SubArea 2 could suggest a role of tectonic behaviour, the modelling framework adopted in this study is not intended to resolve tectonic controls on seismicity. Rather, it evaluates the statistical consistency of alternative rupture hypotheses with available observations, which are inherently influenced by the quality and completeness of input data.
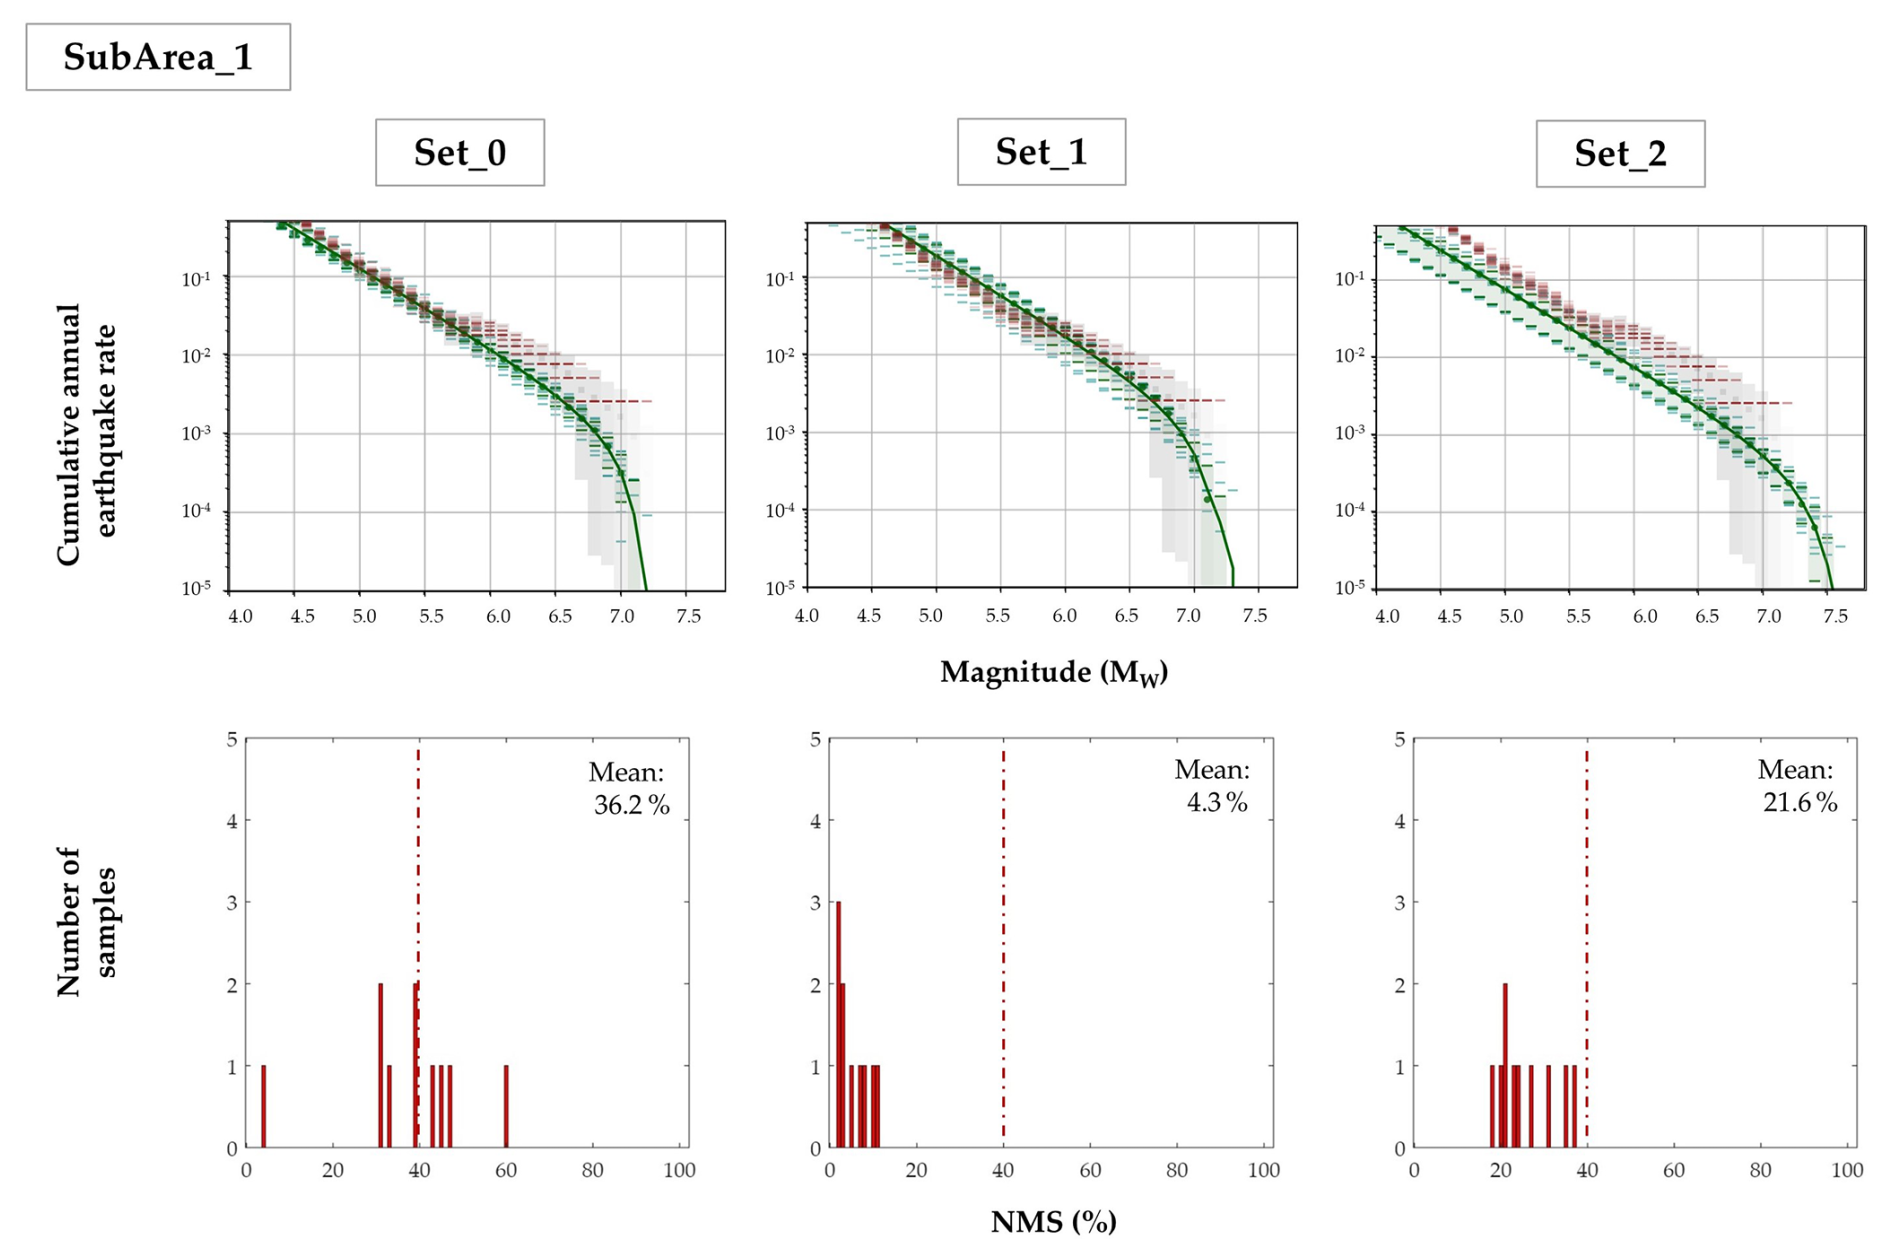
Figure 8SubArea 1 models: columns show different rupture scenarios. Above: comparison between the modelled MFDs (green) and the seismicity rates from the historical and instrumental regional catalogues within the study area (red). Below: NMS (expressed as a percentage) for each random sample explored in the model.
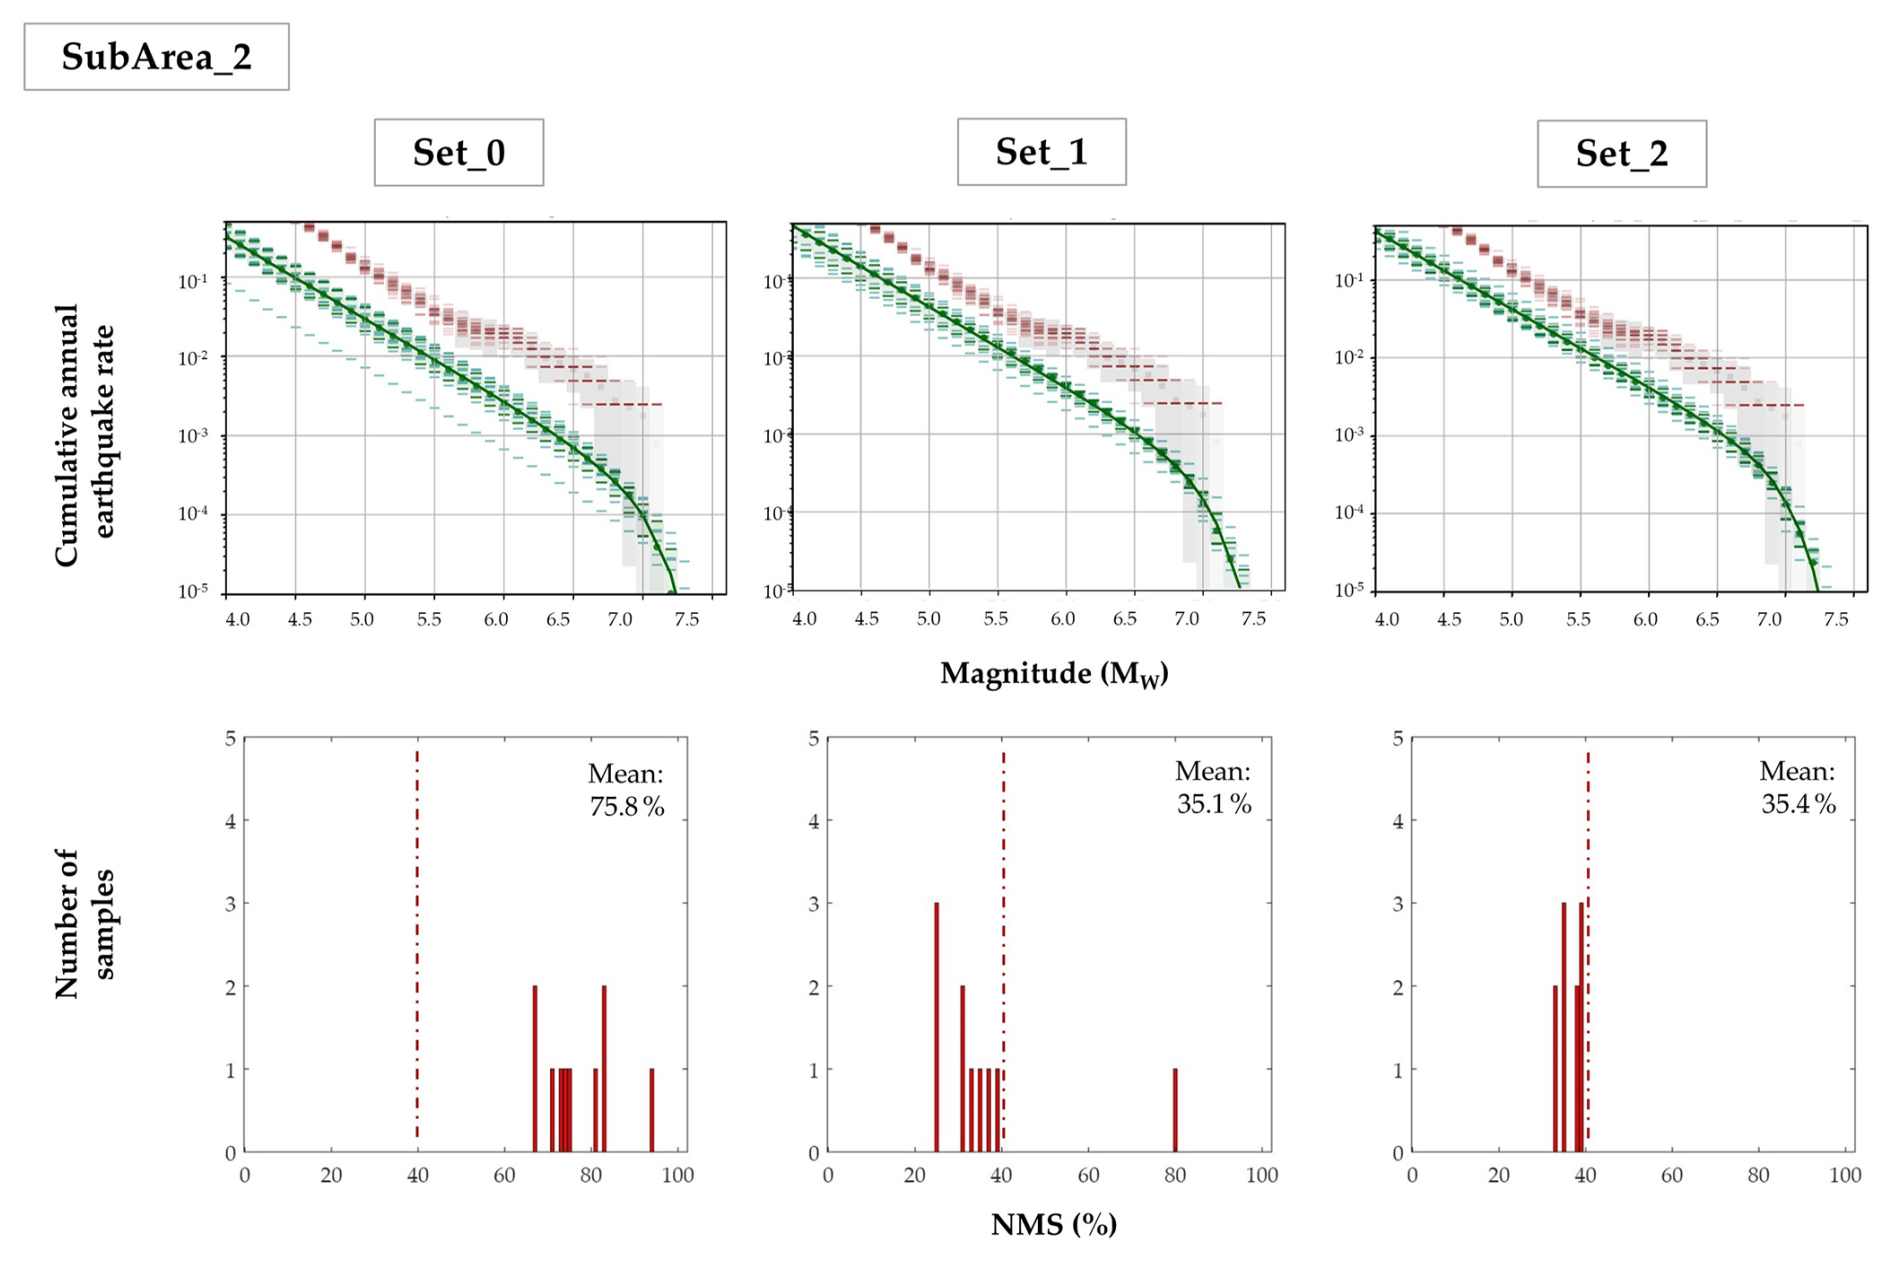
Figure 9SubArea 2 models: columns show different rupture scenarios. Above: comparison between the modelled MFDs (green) and the seismicity rates from the historical and instrumental regional catalogues within the study area (red). Below: NMS (expressed as a percentage) for each random sample explored in the model.
The observed underestimation of catalogue rates in SubArea 2 may be explained by two principal factors. First, the faults in this region generally have lower slip rates (Fig. 3), and in some cases, relatively long lengths. Since SHERIFS treats slip rate as a budget that is spent on larger magnitudes first (due to its moment rate formulation), these faults tend to release most of their seismic moment through fewer, higher-magnitude events. As a consequence, the earthquake rates across the full MFD are reduced, particularly at lower magnitudes.
A second factor may lie in the limited geological constraints available for several faults in SubArea 2. Many slip rates in this region come from regional geodynamic models rather than direct geological constraints (see DISS Working Group, 2025), and paleoseismic data are notably scarce. Although some structures – particularly in the Gargano Promontory – are well studied and associated with significant seismicity, the overall quantity and resolution of geological data in SubArea 2 remain more limited than in SubArea 1, likely due to the lower number of large earthquakes historically recorded in the region.
Additionally, certain faults in SubArea 2 are modelled with long, simplified traces that may not fully represent their internal segmentation. This generalisation could lead to an overestimation of rupture length in the models, ultimately affecting seismicity rate calculations. Similar effects have been observed in previous SHERIFS applications (e.g., Gómez-Novell et al., 2020a), where simplified fault geometries impacted the agreement between modelled and observed seismicity. From this perspective, the poorer performance of SubArea 2 should not be regarded solely as a limitation of the model, but rather as an informative result. Neither the current fault model, as represented in DISS, nor the wide range of rupture configurations explored in this study are able to satisfactorily reproduce the observed catalogue rates in this sector. This mismatch suggests that important geological constraints may still be incomplete or insufficiently resolved, such as slip-rate estimates, fault geometries, segmentation patterns, or potentially unmapped active structures.
Overall, the comparison between SubArea 1 and SubArea 2 highlights the critical role of geological constraints in controlling the robustness of fault-based PSHA models and helps identify priorities for future fault characterization efforts in the southern Apennines.
4.3 Scaling relationship impact
Among the three scaling relationships tested, the differences between Leonard (2010) and Wells and Coppersmith (1994) are minor, with both yielding consistent and reliable results across all rupture scenarios. The Leonard (2010) scaling relationship was ultimately selected as the reference scaling relationship in this study (Fig. 6), as it delivers a slightly better fit to the MFDs, lower NMS percentages, being also a more recent formulation applicable to a wider range of tectonic settings.
In contrast, the scaling law by Thingbaijam et al. (2017), while producing a closer match to the regional MFD in the single-fault scenario (Set_0), results in only minor differences across the three rupture sets (Fig. 10), making it less effective in distinguishing between different rupture behaviours. This, together with a generally broader dispersion and a systematically higher proportion of non-main-shock slip, limits its applicability in our modelling framework.
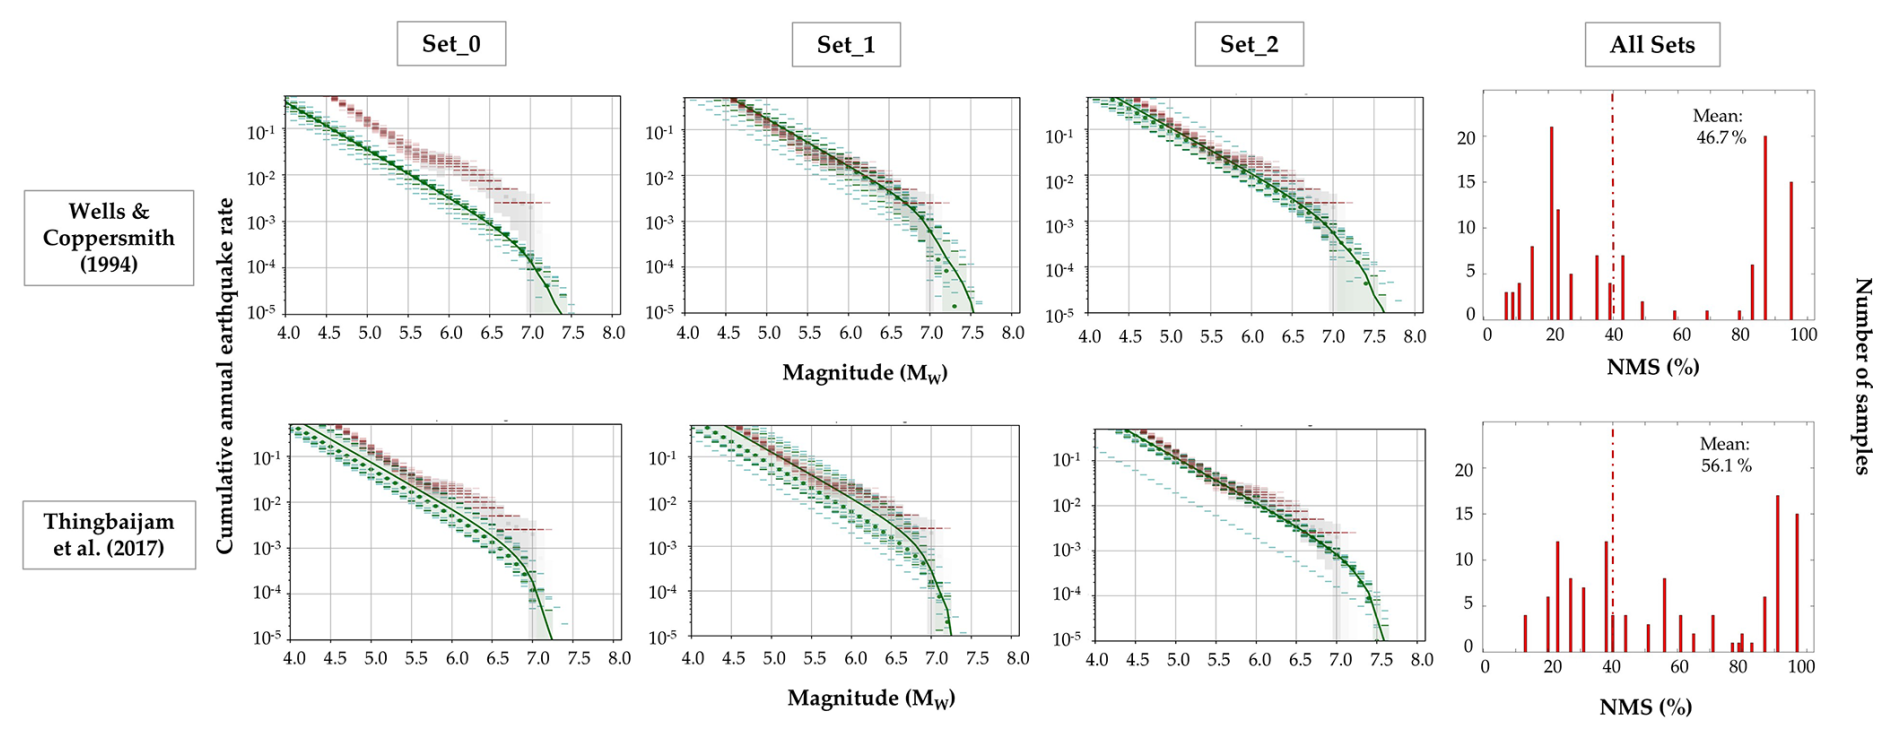
Figure 10Rows correspond to different scaling laws. Columns 1–3 show the comparison between modelled MFDs (green) and seismicity rates from the historical and instrumental regional catalogues within the study area (red), for the three rupture scenarios. Column 4 displays the NMS (expressed as a percentage) for each random sample explored under all rupture scenarios.
This behaviour may be attributed to the nature of the Thingbaijam et al. (2017) scaling law, which instead of geological data is based on source modelling inversion datasets. This scaling law tends to estimate smaller magnitudes for a given rupture area compared to Wells and Coppersmith (1994), as it can be seen by the maximum magnitudes of the models depending on the scaling relationship. Because SHERIFS operates under the preservation of the seismic moment assumption (budget), the reduction of Mmax in the Thingbaijam et al. (2017)-based models is compensated in the whole MFD, which leads to more similar earthquake rates across all models. This formulation seems less effective for our fault system and therefore has not adopted as the reference model.
4.4 Impact of MFD shape and background seismicity
Concerning the MFD shape assumption, the choice of a Gutenberg–Richter distribution fits the observed seismicity well and proves to be a valid and robust statistical representation. This choice is also consistent with long-standing applications of the GR law to the instrumental seismicity in Italy (e.g., Stucchi et al., 2011; Rovida et al., 2020; Meletti et al., 2021). Exploring a wider or a narrower b-value range has also a limited impact in our results (Fig. 11). Generally, the wider b-value range of 0.9–1.1 describes slightly better the regional seismicity and shows slightly lower NMS percentages. This is because the MFD shape is less restrictive in these models and allows the modelling to better capture the rate variability of the catalogue.
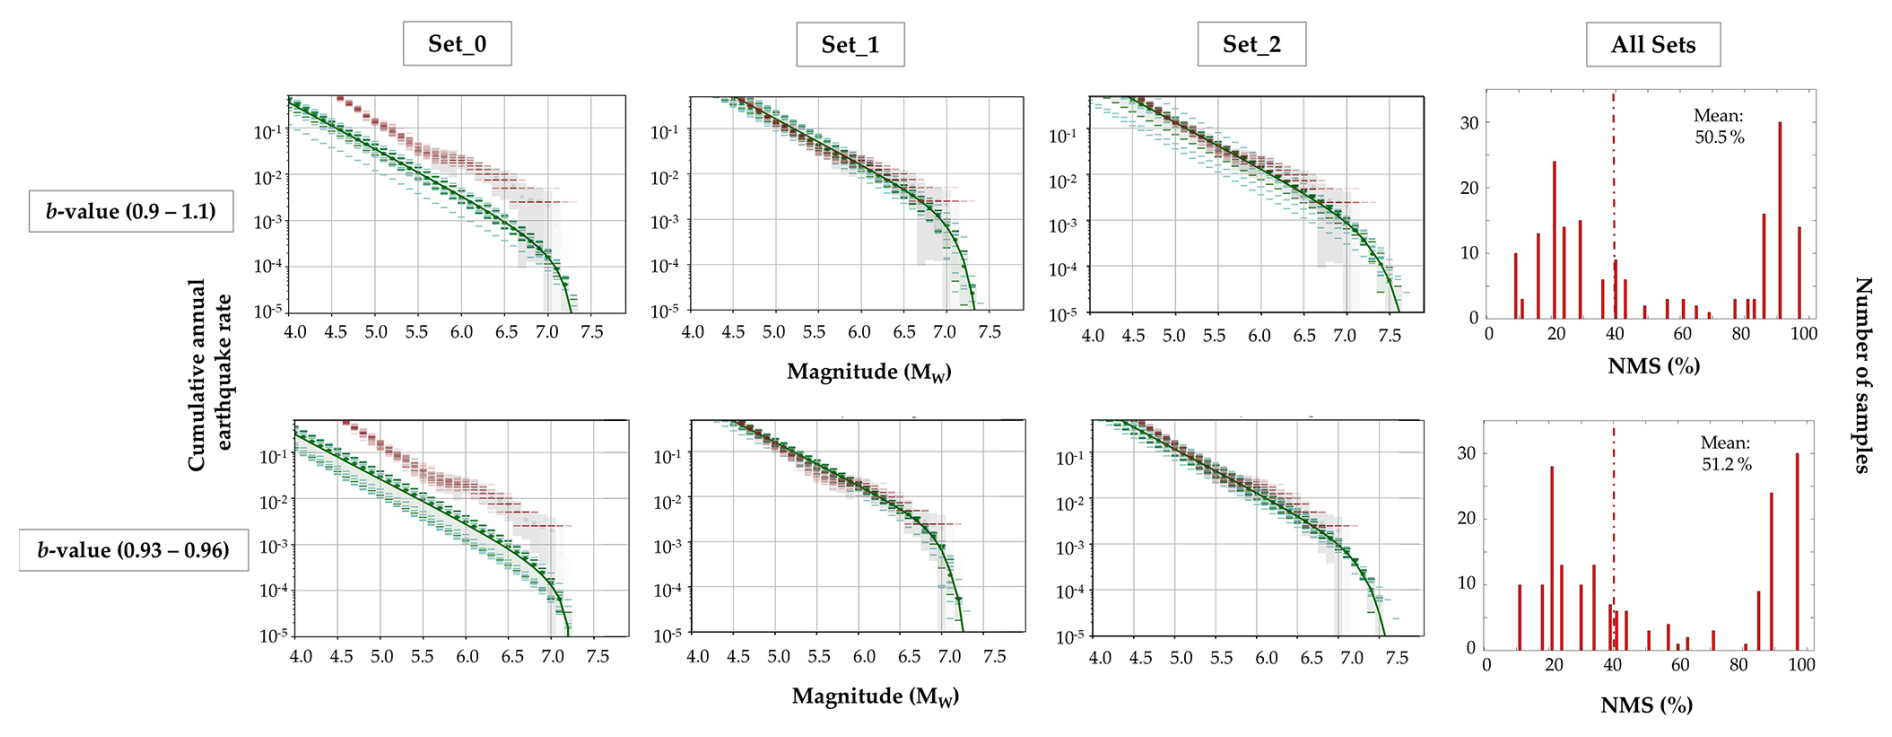
Figure 11Rows correspond to different b-values. Columns 1–3 show the comparison between modelled MFDs (green) and seismicity rates from the historical and instrumental regional catalogues within the study area (red), for the three rupture scenarios. Column 4 displays the NMS (expressed as a percentage) for each random sample explored under all rupture scenarios.
Consistent with previous studies that acknowledge the relevance of distributed background seismicity models to account for events not clearly linked to known faults (e.g., Stirling et al., 2002; Chartier et al., 2019; Gerstenberger et al., 2024), we configured BG_2 to include a magnitude-dependent fraction of seismicity within a 10 km buffer zone surrounding the mapped faults Set_0 is the one showing the larger differences related to background seismicity, allowing to partially compensate the model underestimation of the earthquake catalogue rates (Fig. 12). Conversely, the effect of BG_2 on multi-fault rupture models (Set_1 and Set_2) is minimal, and in some cases slightly worsens the fit to the observed MFD. Additionally, BG_1 yields slightly lower NMS values (Fig. 12), with only marginal differences. This indicates that introducing background seismicity does not produce any significant improvement in our modelling results and, as such, the relative performance between rupture scenario sets remains invariant.
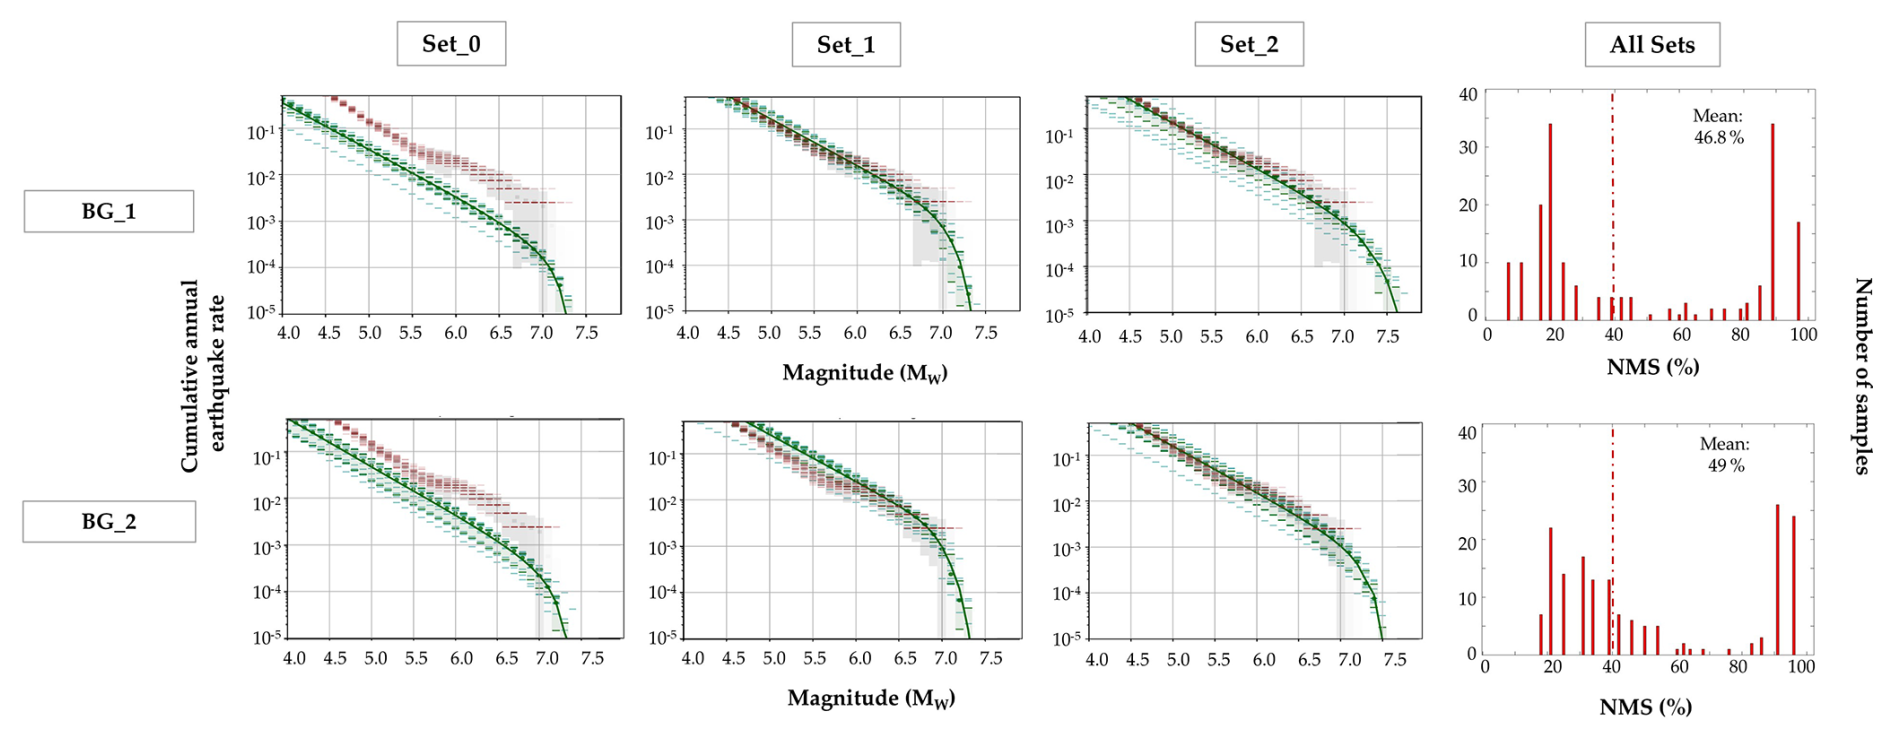
Figure 12Rows correspond to different background seismicity scenarios. Columns 1–3 show the comparison between modelled MFDs (green) and seismicity rates from the historical and instrumental regional catalogues within the study area (red), for the three rupture scenarios. Column 4 displays the NMS (expressed as a percentage) for each random sample explored under all rupture scenarios.
To evaluate the sensitivity of these results to the definition of the background area, we additionally tested buffer distances of 5 and 15 km (available in the Zenodo repository; Alessandrini et al., 2026). The results obtained with these alternative configurations are consistent with those derived for the 10 km buffer, confirming that the overall outcomes are not significantly influenced by the selected buffer size. Moreover, a 5 km buffer from fault traces is not optimal because it does not always capture the whole surface projection area of the faults and, as such, might exclude some seismicity related to the faults at study, while the 15 km buffer might include seismicity out of the known fault systems.
Although a distributed seismicity component is widely considered essential in modern PSHA frameworks, especially to account for unmapped faults, the similarity between fault seismicity rates and earthquake catalogue indicates that most of the recorded seismicity within the buffer is likely linked to the active fault structures considered. Nonetheless, the introduction of BG_2 also adds an additional layer of epistemic uncertainty, as the magnitude-dependent ratios adopted are based on expert judgment and remain inherently arbitrary. Given that our tests indicate a limited impact on overall model performance, we prefer to adopt the simpler BG_1 configuration, which avoids unnecessary complexity without compromising the quality of the results.
4.5 Model weighting and implications for probabilistic seismic hazard
The main challenges in fault-based PSHA applications adopting relaxed segmentation frameworks concern: (i) the definition of possible earthquake rupture scenarios and (ii) the estimation of their associated rates of occurrence. While the approach employed in this study does not aim to resolve the physical plausibility of multi-fault ruptures in the southern Apennines – which would require physics-based investigations – it provides a systematic framework to structure and explore epistemic uncertainties related to rupture configurations and earthquake rates within a PSHA context. In this framework, the approach does allow to narrow some of these uncertainties through consistency analyses with available observational data (instrumental seismicity and paleoseismic rates). At the same time, our hypothesis-based setup allows preserving the probabilistic nature of PSHA, as the results are intended to be implemented within a logic-tree scheme.
It is important to note that this study represents only a subset of the many rupture scenarios and seismicity parameters that could be explored for the southern Apennines and is therefore not intended to confirm or rule out other configurations. We also acknowledge the limitations in model quality check, as the available datasets – namely the regional seismic catalogue and the sparse paleoseismic records – may be insufficient to fully assess model performance.
Table 4Summary table of the main outcomes discussed for each branch explored.
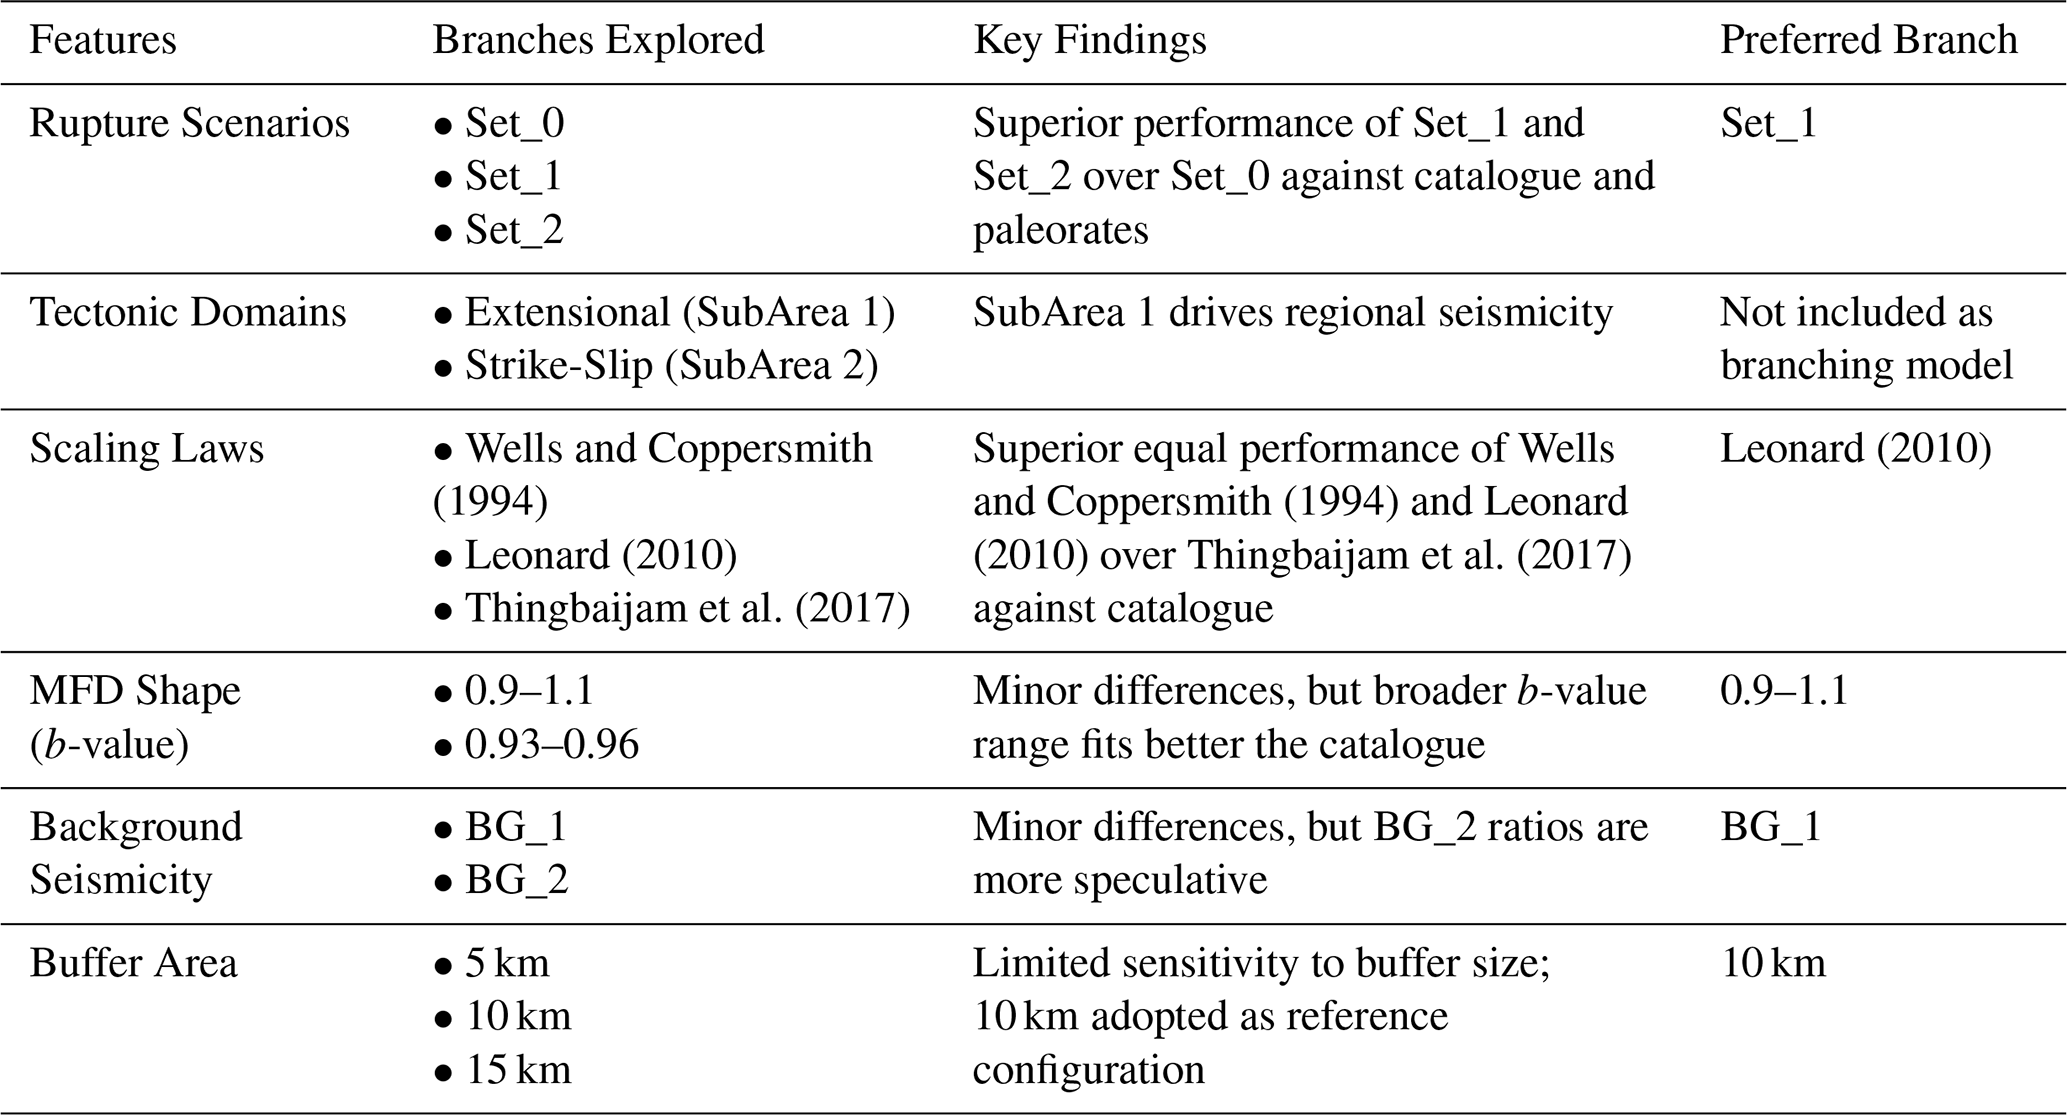
In this sense, the main outcome of this study is to provide a modelling framework that enables the use of geological-based criteria to assign weights to rupture hypotheses within a PSHA logic tree. The modelling framework we propose follows a logic-tree structure that can be directly implemented within PSHA engines such as OpenQuake, as SHERIFS is explicitly designed to explore epistemic uncertainties in fault parameters and rupture configurations and to propagate them into probabilistic hazard calculations. The weights derived for the different model branches remain region-specific, as they are based on comparisons with local observational constraints that are not directly transferable to other tectonic settings. However, the proposed weighting rationale and the general methodological framework can be used in other active regions worldwide.
Based on the performance of the different models across all consistency tests (summarized in Table 4), Set_1 emerges as the most robust configuration and should be assigned the highest weight in a PSHA logic tree, given its strong agreement with the catalogue MFD. Set_2, while slightly less aligned with the catalogue MFD, provides the best results in terms of NMS and paleoseismic fit, and should therefore receive a comparable weight. In contrast, Set_0 shows consistently poorer performance and limited agreement with observational data, and should be assigned a lower weight.
As for the other modelling branches explored, while their influence is less pronounced than that of the rupture scenarios, they can still serve as additional criteria for developing hazard models. Among the scaling relationships tested, Leonard (2010) is our preferred choice due to its consistent performance across scenarios. Wells and Coppersmith (1994) yields very similar results and can therefore be considered a valid alternative. In contrast, the relationship proposed by Thingbaijam et al. (2017) generally results in poorer model performance, with greater dispersion in the MFDs and higher NMS percentages.
Regarding the b-value, we find that adopting a broader range (0.9–1.1) results in better agreement between the modelled and observed seismicity, making it our preferred option. As for background seismicity, BG_1 (where all seismicity is attributed to the faults) is favoured, as it explains the observed seismicity well and yields model performances comparable to BG_2 for logic tree weighting purposes. Additionally, BG_1 avoids the added layer of arbitrariness required by BG_2, thus reducing unnecessary complexity in the modelling framework. Sensitivity tests performed using alternative background buffer distances (5, 10 and 15 km) show only minor variations in model performance, with the 10 km configuration representing the preferred compromise between spatial association of seismicity with mapped faults and the obtained results.
This study explores the impact of different variables on fault-based seismicity rate modelling in the southern Apennines, using a relaxed segmentation approach that allows multi-fault ruptures. The region, affected by the 1980 Mw 6.9 Irpinia earthquake, includes several critical infrastructures, highlighting the need for accurate seismic hazard assessment.
We computed seismicity rates from geological data in 35 seismogenic sources employing the SHERIFS algorithm through an exploration tree that combines different rupture scenarios and seismic parameter assumptions (e.g., scaling relationships, b-value, background seismicity, buffer area) to explore intrinsic epistemic uncertainties in fault data. We evaluated and quantified model performance by comparing the modelled seismicity rates with the regional earthquake catalogue data and paleoearthquake rates from paleoseismic studies.
Our results indicate that rupture assumptions strongly control the model outcomes: scenarios restricted to single-fault ruptures are systematically less consistent with observations than more complex rupture configurations. Multi-fault rupture scenarios are required within the explored modelling framework to reconcile geological and seismological observations at the regional scale. Importantly, these findings are consistent with evidence provided by the 1980 Irpinia earthquake, suggesting that similar rupture complexity cannot be neglected in long-term earthquake rupture forecasts for the southern Apennines.
Beyond the comparison of alternative rupture models, this study provides insight into the relative importance of different sources of epistemic uncertainty. In particular, rupture assumptions exert a stronger influence on model performance than background-seismicity assumptions, b-values and scaling relationships, while the contrasting behaviour of SubArea 1 and SubArea 2 highlights the importance of fault-system characteristics and geological constraints in controlling model robustness. In this sense, the study does not aim to reduce epistemic uncertainty, but rather to identify, structure, and evaluate the assumptions that most strongly affect fault-based PSHA results, thereby identifying priorities for future fault characterization and seismotectonic investigations in the Southern Apennines.
Nevertheless, this modelling has some limitations. The limited availability and quality of fault data, together with the necessary simplification of fault geometries, result in poorly constrained input parameters. In addition, the regional seismic catalogue and the limited number of paleoseismic constraints may not fully capture the long-term behaviour of the fault system. Finally, the modelling framework relies on statistical consistency with observations rather than physics-based rupture modelling, which could further refine rupture scenario selection and seismicity-rate estimates.
Addressing these aspects will be essential for the next generation of fault-based seismic hazard models in southern Italy, where the high seismicity and the presence of large populations and critical infrastructures demand accurate estimates of large-magnitude events, including those with long recurrence intervals.
The SHERIFS code (Seismic Hazard and Earthquake Rates in Fault Systems; Chartier et al., 2019) is publicly available at GitHub: (https://github.com/tomchartier/SHERIFS, tomchartier, 2026). The version used in this study (v1.1) is no longer available in the public repository but can be obtained upon request from the original authors.
All SHERIFS input and output files used in this study are publicly available through Zenodo: https://doi.org/10.5281/zenodo.17183317 (Alessandrini et al., 2026).
Conceptualization and software: G.A. and O.G.-N.; methodology and writing – original draft preparation: G.A.; writing – review and editing: G.A., O.G.-N., and S.C.; supervision: S.C., M.G., and U.T.
The contact author has declared that none of the authors has any competing interests.
Publisher's note: Copernicus Publications remains neutral with regard to jurisdictional claims made in the text, published maps, institutional affiliations, or any other geographical representation in this paper. The authors bear the ultimate responsibility for providing appropriate place names. Views expressed in the text are those of the authors and do not necessarily reflect the views of the publisher.
The authors are sincerely grateful to Oona Scotti (Institut de Radioprotection et de Sûreté Nucléaire, France) for her helpful discussions on the model. The first author also wishes to thank the Universitat de Barcelona and the Istituto Nazionale di Oceanografia e di Geofisica Sperimentale (OGS) for hosting and supporting the development of this work.
This research was conducted in the framework of activities made possible by the Consultancy Contract Commissioned between the Consorzio per la Bonifica della Capitanata and the Department of Physics and Astronomy of the University of Bologna. Octavi Gómez-Novell acknowledges support from the Generation D initiative, promoted by Red.es, an organisation attached to the Ministry for Digital Transformation and the Civil Service, and financed by the Recovery, Transformation and Resilience Plan through the European Union's NextGenerationEU.
This paper was edited by Seda Yolsal-Çevikbilen and reviewed by three anonymous referees.
Adinolfi, G. M., De Matteis, R., Orefice, A., Festa, G., Zollo, A., De Nardis, R., and Lavecchia, G.: The September 27, 2012, ML 4.1, Benevento earthquake: A case of strike-slip faulting in the southern Apennines (Italy), Tectonophysics, https://doi.org/10.1016/j.tecto.2015.06.036, 2015.
Alessandrini, G., Gómez-Novell, O., Castellaro, S., Giustiniani, M., and Tinivella, U.: Dataset for fault-based seismicity rates in the southern Apennines (Italy) – Version 2, Zenodo [data set], https://doi.org/10.5281/zenodo.17183317, 2026.
Baize, S., Nurminen, F., Sarmiento, A., Dawson, T., Takao, M., Scotti, O., Azuma, T., Boncio, P., Champenois, J., Cinti, F. R., Civico, R., Costa, C., Guerrieri, L., Marti, E., McCalpin, J., Okumura, K., and Villamor, P.: A worldwide and unified database of surface ruptures (SURE) for fault displacement hazard analyses, Seismol. Res. Lett., 91, 499–520, https://doi.org/10.1785/0220190144, 2020.
Basili, R., Valensise, G., Vannoli, P., Burrato, P., Fracassi, U., Mariano, S., Tiberti, M. M., and Boschi, E.: The Database of Individual Seismogenic Sources (DISS), version 3: summarizing 20 years of research on Italy's earthquake geology, Tectonophysics, 453, 20–43, https://doi.org/10.1016/j.tecto.2007.04.014, 2008.
Bernard, P. and Zollo, A.: The Irpinia (Italy) 1980 earthquake: detailed analysis of a complex normal faulting, J. Geophys. Res.-Sol. Ea., 94, 1631–1647, https://doi.org/10.1029/JB094iB02p01631, 1989.
Boncio, P., Mancini, T., Lavecchia, G., and Selvaggi, G.: Seismotectonics of strike–slip earthquakes within the deep crust of southern Italy: Geometry, kinematics, stress field and crustal rheology of the Potenza 1990–1991 seismic sequences (Mmax 5.7), Tectonophysics, 445, 281–300, https://doi.org/10.1016/j.tecto.2007.08.001, 2007.
Chang, C. C., Chang, C. Y., Gao, J. C., and Chan, C. H.: Quantifying the probability and uncertainty of multiple-structure rupture for Taiwan, Terr. Atmos. Ocean. Sci., 34, 7, https://doi.org/10.1007/s44195-023-00040-8, 2023.
Chartier, T., Scotti, O., Lyon-Caen, H., and Boiselet, A.: Methodology for earthquake rupture rate estimates of fault networks: example for the western Corinth rift, Greece, Nat. Hazards Earth Syst. Sci., 17, 1857–1869, https://doi.org/10.5194/nhess-17-1857-2017, 2017.
Chartier, T., Scotti, O., and Lyon-Caen, H.: SHERIFS: open-source code for computing earthquake rates in fault systems and constructing hazard models, Seismol. Res. Lett., 90, 1–10, https://doi.org/10.1785/0220180332, 2019.
Chartier, T., Scotti, O., Lyon-Caen, H., Richard-Dinger, K., Dieterich, J. H., and Shaw, B. E.: Modelling earthquake rates and associated uncertainties in the Marmara Region, Turkey, Nat. Hazards Earth Syst. Sci., 21, 2733–2751, https://doi.org/10.5194/nhess-21-2733-2021, 2021.
Cheng, J., Chartier, T., and Xu, X.: Multisegment rupture hazard modeling along the Xianshuihe Fault Zone, southeastern Tibetan Plateau, Seismol. Res. Lett., 92, 951–964, https://doi.org/10.1785/0220200117, 2021.
Cornell, C. A.: Engineering seismic risk analysis, Bull. Seismol. Soc. Am., 58, 1583–1606, 1968.
D'Addezio, G., Pantosti, D., and Valensise, G.: Paleoearthquakes along the Irpinia fault at Pantano di S. Gregorio Magno (southern Italy), Il Quaternario, 4, 121–136, 1991.
Danciu, L., Giardini, D., Weatherill, G., Basili, R., Nandan, S., Rovida, A., Beauval, C., Bard, P.-Y., Pagani, M., Reyes, C. G., Sesetyan, K., Vilanova, S., Cotton, F., and Wiemer, S.: The 2020 European Seismic Hazard Model: overview and results, Nat. Hazards Earth Syst. Sci., 24, 3049–3073, https://doi.org/10.5194/nhess-24-3049-2024, 2024.
Deligiannakis, G., Papanikolaou, I. D., and Roberts, G.: Fault specific GIS based seismic hazard maps for the Attica region, Greece, Geomorphology, 306, 264–282, https://doi.org/10.1016/j.geomorph.2016.12.005, 2018.
DISS Working Group: Database of Individual Seismogenic Sources (DISS), Version 3.3.1: a compilation of potential sources for earthquakes larger than M 5.5 in Italy and surrounding areas, Istituto Nazionale di Geofisica e Vulcanologia (INGV) [data set], https://doi.org/10.13127/diss3.3.1, 2025.
Doglioni, C., Harabaglia, P., Martinelli, G., Mongelli, F., and Zito, G.: A geodynamic model of the Southern Apennines accretionary prism, Terra Nova, 8, 540–547, https://doi.org/10.1111/j.1365-3121.1996.tb00783.x, 1996.
El Kadri, S., Beauval, C., Brax, M., and Klinger, Y.: Implementation of an interconnected fault system in probabilistic seismic hazard assessment (PSHA): the Levant fault system, Nat. Hazards Earth Syst. Sci., 25, 3397–3419, https://doi.org/10.5194/nhess-25-3397-2025, 2025.
Faure Walker, J., Boncio, P., Pace, B., Roberts, G., Benedetti, L., Scotti, O., Visini, F., and Peruzza, L.: Fault2SHA Central Apennines database and structuring active fault data for seismic hazard assessment, Sci. Data, 8, 87, https://doi.org/10.1038/s41597-021-00868-0, 2021.
Field, E. H., Dawson, T. E., Felzer, K. R., Frankel, A. D., Gupta, V., Jordan, T. H., Parsons, T., Petersen, M. D., Stein, R. S., Weldon II, R. J., and Wills, C. J.: Uniform California Earthquake Rupture Forecast, Version 2 (UCERF 2), Bull. Seismol. Soc. Am., 99, 2053–2107, https://doi.org/10.1785/0120080049, 2009.
Field, E. H., Arrowsmith, R. J., Biasi, G. P., Bird, P., Dawson, T. E., Felzer, K. R., Jackson, D. D., Johnson, K. M., Jordan, T. H., Madden, C., Michael, A. J., Milner, K. R., Page, M. T., Parsons, T., Powers, P. M., Shaw, B. E., Thatcher, W. R., Weldon, R. J., and Zeng, Y.: Uniform California Earthquake Rupture Forecast, Version 3 (UCERF3) – The time-independent model, Bull. Seismol. Soc. Am., 104, 1122–1180, https://doi.org/10.1785/0120130164, 2014.
Galadini, F. and Galli, P.: Paleoseismology of silent faults in the Central Apennines (Italy): the Mt. Vettore and Laga Mts. faults, Ann. Geophys., 46, https://doi.org/10.4401/ag-3457, 2003.
Galli, P., Galderisi, A., Peronace, E., Giaccio, B., Hajdas, I., Messina, P., and Polpetta, F.: The awakening of the dormant Mount Vettore fault (2016 central Italy earthquake, Mw 6.6): paleoseismic clues on its millennial silences, Tectonics, 38, 687–705, https://doi.org/10.1029/2018TC005326, 2019.
Gerstenberger, M. C., Van Dissen, R., Rollins, C., DiCaprio, C., Thingbaijam, K. K., Bora, S., and Williams, C.: The seismicity rate model for the 2022 Aotearoa New Zealand national seismic hazard model, Bull. Seismol. Soc. Am., 114, 182–216, https://doi.org/10.1785/0120230165, 2024.
Gómez-Novell, O., Chartier, T., García-Mayordomo, J., Ortuño, M., Masana, E., Insua-Arévalo, J. M., and Scotti, O.: Modelling earthquake rupture rates in fault systems for seismic hazard assessment: the Eastern Betics Shear Zone, Eng. Geol., 265, 105452, https://doi.org/10.1016/j.enggeo.2019.105452, 2020a.
Gómez-Novell, O., García-Mayordomo, J., Ortuño, M., Masana, E., and Chartier, T.: Fault system-based probabilistic seismic hazard assessment of a moderate seismicity region: the Eastern Betics Shear Zone (SE Spain), Front. Earth Sci., 8, 579398, https://doi.org/10.3389/feart.2020.579398, 2020b.
Gulia, L. and Meletti, C.: Testing the b-value variability in Italy and its influence on Italian PSHA, Boll. Geof. Teor. Appl., 49, 59–76, 2007.
Gutenberg, B. and Richter, C. F.: Frequency of earthquakes in California, Bull. Seismol. Soc. Am., 34, 185–188, 1944.
Hamling, I. J., Hreinsdóttir, S., Clark, K., Elliott, J., Liang, C., Fielding, E., and Stirling, M.: Complex multifault rupture during the 2016 Mw 7.8 Kaikōura earthquake, New Zealand, Science, 356, eaam7194, https://doi.org/10.1126/science.aam7194, 2017.
ITHACA Working Group: ITHACA (ITaly HAzard from CApable faulting), a database of active capable faults of the Italian territory, Version December 2019, ISPRA Geological Survey of Italy [data set], https://sgi.isprambiente.it/ithacaweb/Default.aspx (last access: 21 July 2026), 2019.
Labbé, P. and Paolucci, R.: Developments relating to seismic action in the Eurocode 8 of next generation, in: Proceedings of the European Conference on Earthquake Engineering and Seismology, 26–46, Springer International Publishing, Cham, https://doi.org/10.1007/978-3-031-15104-0_2, 2022.
Latorre, D., Di Stefano, R., Castello, B., Michele, M., and Chiaraluce, L.: An updated view of the Italian seismicity from probabilistic location in 3D velocity models: the 1981–2018 Italian catalog of absolute earthquake locations (CLASS), Tectonophysics, 846, 229664, https://doi.org/10.1016/j.tecto.2022.229664, 2023.
Leonard, M.: Earthquake fault scaling: Self-consistent relating of rupture length, width, average displacement, and moment release, Bull. Seismol. Soc. Am., 100, 1971–1988, https://doi.org/10.1785/0120090189, 2010.
Liu, C., Lay, T., Wang, R., Taymaz, T., Xie, Z., Xiong, X., Irmak, T. S., Kaharamn, M., and Erman, C.: Complex multi-fault rupture and triggering during the 2023 earthquake doublet in southeastern Türkiye, Nat. Commun., 14, 5564, https://doi.org/10.1038/s41467-023-41404-5, 2023.
Meletti, C., Galadini, F., Valensise, G., Stucchi, M., Basili, R., Barba, S., Vannucci, G., and Boschi, E.: A seismic source zone model for the seismic hazard assessment of the Italian territory, Tectonophysics, 450, 85–108, https://doi.org/10.1016/j.tecto.2008.01.003, 2008.
Meletti, C., Marzocchi, W., D'Amico, V., Lanzano, G., Luzi, L., Martinelli, F., Pace, B., Rovida, A., Taroni, M., Visini, F., and the MPS19 Working Group: The new Italian seismic hazard model (MPS19), Ann. Geophys., 64, https://doi.org/10.4401/ag-8579, 2021.
Milner, K. R., Page, M. T., Field, E. H., Parsons, T., Biasi, G. P., and Shaw, B. E.: Appendix T – Defining the inversion rupture set using plausibility filters, US Geol. Surv. Open-File Rept., 2013–1165, https://doi.org/10.3133/ofr20131165, 2013.
NCSE (Norma de la Construcción Sismorresistente Española): Real Decreto 997/2002, de 27 de septiembre, por el que se aprueba la norma de construcción sismorresistente: parte general y edificación (NCSR-02), Bol. Of. Estado, 244, 35898–35967, 2002.
NTC (Norme Tecniche sulle Costruzioni): Decreto Ministeriale 14 January 2008, Ministry of Infrastructures and Transportations, G. U. S. O. No. 29 of 4 February 2008, 2008.
NTC (Norme Tecniche sulle Costruzioni): Decreto Ministeriale 17 January 2018, Ministry of Infrastructures and Transportations, G. U. S. O. No. 8 of 20 February 2018, 2018.
Nurminen, F., Baize, S., Boncio, P., Blumetti, A. M., Cinti, F. R., Civico, R., and Guerrieri, L.: SURE 2.0–New release of the worldwide database of surface ruptures for fault displacement hazard analyses, Sci. Data, 9, 729, https://doi.org/10.1038/s41597-022-01835-z, 2022.
Pace, B., Visini, F., Scotti, O., and Peruzza, L.: Preface: Linking faults to seismic hazard assessment in Europe, Nat. Hazards Earth Syst. Sci., 18, 1349–1350, https://doi.org/10.5194/nhess-18-1349-2018, 2018.
Pantosti, D. and Valensise, G.: Faulting mechanism and complexity of the November 23, 1980, Campania-Lucania Earthquake, inferred from surface observations, J. Geophys. Res.-Sol. Ea., 95, 15319–15341, https://doi.org/10.1029/JB095iB10p15319, 1990.
Pantosti, D., Schwartz, D. P., and Valensise, G.: Paleoseismology along the 1980 surface rupture of the Irpinia Fault: Implications for earthquake recurrence in the southern Apennines, Italy, J. Geophys. Res.-Sol. Ea., 98, 6561–6577, https://doi.org/10.1029/92JB02277, 1993.
Peruzza, L.: Se i terremoti fossero lavatrici, Sapere, 3, 12–16, https://doi.org/10.12919/sapere.2018.03.1, 2018.
Peruzza, L., Pace, B., and Visini, F.: Fault-Based Earthquake Rupture Forecast in Central Italy: Remarks after the L'Aquila Mw 6.3 Event, Bull. Seismol. Soc. Am., 101, 404–412, https://doi.org/10.1785/0120090276, 2011.
Peruzza, R., Gee, B., Pace, B., Roberts, G., Scotti, O., Visini, F., Benedetti, L., and Pagani, M.: PSHA after a strong earthquake: Hints for the recovery, Ann. Geophys., 59, 35, https://doi.org/10.4401/ag-7257, 2016.
Petersen, M. D., Shumway, A. M., Powers, P. M., Field, E. H., Moschetti, M. P., Jaiswal, K. S., Milner, K. R., Rezaeian, S., Frankel, A. D., Llenos, A. L., Michael, A. J., Altekruse, J. M., Ahdi, S. K., Withers, K. B., Mueller, C. S., Zeng, Y., Chase, R. E., Salditch, L. M., Luco, N., Rukstales, K. S., Herrick, J. A., Girot, D. L., Aagaard, B. T., Bender, A. M., Blanpied, M. L., Briggs, R. W., Boyd, O. S., Clayton, B. S., DuRoss, C. B., Evans, E. L., Haeussler, P. J., Hatem, A. E., Haynie, K. L., Hearn, E. H., Johnson, K. M., Kortum, Z. A., Kwong, N. S., Makdisi, A. J., Mason, H. B., McNamara, D. E., McPhillips, D. F., Okubo, P. G., Page, M. T., Pollitz, F. F., Rubinstein, J. L., Shaw, B. E., Shen, Z.-K., Shiro, B. R., Smith, J. A., Stephenson, W. J., Thompson, E. M., Thompson Jobe, J. A., Wirth, E. A., and Witter, R. C.: The 2023 US 50-state national seismic hazard model: Overview and implications, Earthq. Spectra, 40, 5–88, https://doi.org/10.1177/87552930231215428, 2024.
Quigley, M., Mohammadi, H., Jiménez, A., and Duffy, B.: Multi-fault earthquakes with kinematic and geometric rupture complexity: how common?, 8th International INQUA Meeting on Paleoseismology, Active Tectonics and Archeoseismology (PATA), New Zealand, 13–16 November 2017, 316–318, 2017.
Rovida, A., Locati, M., Camassi, R., Lolli, B., and Gasperini, P.: The Italian earthquake catalogue CPTI15, Bull. Earthq. Eng., 18, 2953–2984, https://doi.org/10.1007/s10518-020-00818-y, 2020.
Rovida, A., Locati, M., Camassi, R., Lolli, B., Gasperini, P., and Antonucci, A.: Catalogo Parametrico dei Terremoti Italiani (CPTI15), versione 4.0, Istituto Nazionale di Geofisica e Vulcanologia (INGV) [data set], https://doi.org/10.13127/cpti/cpti15.4, 2022.
Scotti, O., Clément, C., and Baumont, D.: Seismic Hazard for Design and Verification of Nuclear Installations in France: Regulatory context, debated issues and ongoing developments, Boll. Geof. Teor. Appl., https://doi.org/10.4430/bgta0080, 2014.
Scotti, O., Visini, F., Faure Walker, J., Peruzza, L., Pace, B., Benedetti, L., Boncio, P., and Roberts, G.: Which Fault Threatens Me Most? Bridging the Gap Between Geologic Data-Providers and Seismic Risk Practitioners, Front. Earth Sci., 8, 626401, https://doi.org/10.3389/feart.2020.626401, 2020.
Stirling, M., McVerry, G., Gerstenberger, M., Litchfield, N., Van Dissen, R., Berryman, K., Barnes, P., Wallace, L., Villamor, P., Langridge, R., Lamarche, G., Nodder, S., Reyners, M., Bradley, B., Rhoades, D., Smith, W., Nicol, A., Pettinga, J., Clark, K., and Jacobs, K.: National Seismic Hazard Model for New Zealand: 2010 Update, Bull. Seismol. Soc. Am., 102, 1514–1542, https://doi.org/10.1785/0120110170, 2012.
Stirling, M. W., Verry, G. H. M., and Berryman, K. R.: A new seismic hazard model for New Zealand, Bull. Seismol. Soc. Am., 92, 1878–1903, https://doi.org/10.1785/0120010156, 2002.
Stucchi, M., Meletti, C., Montaldo, V., Crowley, H., Calvi, G. M., and Boschi, E.: Seismic Hazard Assessment (2003–2009) for the Italian Building Code, Bull. Seismol. Soc. Am., 101, 1885–1911, https://doi.org/10.1785/0120100130, 2011.
Thingbaijam, K. K. S., Mai, P. M., and Goda, K.: New empirical earthquake source-scaling laws, Bull. Seismol. Soc. Am., 107, 2225–2246, https://doi.org/10.1785/0120170017, 2017.
tomchartier: SHERIFS, GitHub [code], https://github.com/tomchartier/SHERIFS, last access: 22 July 2026.
Valentini, A.: Allowing multi-fault earthquakes and relaxing fault segmentation in Central Apennines (Italy): Hints for fault-based PSHA, Boll. Geofis. Teor. Appl., https://doi.org/10.4430/bgta0339, 2020.
Valentini, A., Visini, F., and Pace, B.: Integrating faults and past earthquakes into a probabilistic seismic hazard model for peninsular Italy, Nat. Hazards Earth Syst. Sci., 17, 2017–2039, https://doi.org/10.5194/nhess-17-2017-2017, 2017.
Valentini, A., Pace, B., Boncio, P., Visini, F., Pagliaroli, A., and Pergalani, F.: Analisi probabilistica fault-based della pericolosità sismica volta alla definizione di input sismici: osservazioni dopo la sequenza sismica del 2016 in Italia Centrale, GNGTS 2018 Sessione 2.1 (Atti del 37° Convegno Nazionale del Gruppo Nazionale di Geofisica della Terra Solida), Italy, https://hdl.handle.net/11311/1069164 (last access: 22 July 2026), 2018.
Valentini, A., Pace, B., Boncio, P., Visini, F., Pagliaroli, A., and Pergalani, F.: Definition of Seismic Input From Fault-Based PSHA: Remarks After the 2016 Central Italy Earthquake Sequence, Tectonics, 38, 595–620, https://doi.org/10.1029/2018TC005086, 2019.
Vannoli, P. and Burrato, P.: La sismicità del Veneto tra eventi storici e sorgenti sismogenetiche, in: Rischio sismico in Italia: analisi e prospettive per una geologia del rischio, Supplemento al n. 1/2018, Società Italiana di Geologia Ambientale (SIGEA), 139–147, https://www.earth-prints.org/handle/2122/11901 (last access: 22 July 2026), 2018.
Visini, F., Pace, B., Meletti, C., Marzocchi, W., Akinci, A., Azzaro, R., Barani, S., Barberi, G., Barreca, G., Basili, R., Bird, P., Bonini, M., Burrato, P., Busetti, M., Carafa, M. M. C., Cocina, O., Console, R., Corti, G., D'Agostino, N., D'Amico, S., D'Amico, V., Dal Cin, M., Falcone, G., Fracassi, U., Gee, R., Kastelic, V., Lai, C. G., Langer, H., Maesano, F. E., Marchesini, A., Martelli, L., Monaco, C., Murru, M., Peruzza, L., Poli, M. E., Pondrelli, S., Rebez, A., Rotondi, R., Rovida, A., Sani, F., Santulin, M., Scafidi, D., Selva, J., Slejko, D., Spallarossa, D., Tamaro, A., Tarabusi, G., Taroni, M., Tiberti, M. M., Tusa, G., Tuvè, T., Valensise, G., Vannoli, P., Varini, E., Zanferrari, A., and Zuccolo, E.: Earthquake Rupture Forecasts for the MPS19 Seismic Hazard Model of Italy, Ann. Geophys., 64, 3, https://doi.org/10.4401/ag-8608, 2021.
Wei, S., Fielding, E., Leprince, S., Sladen, A., Avouac, J. P., Helmberger, D., Hauksson, E., Chu, R., Simons, M., Hudnut, K., Herring, T., and Briggs, R.: Superficial simplicity of the 2010 El Mayorg-Cucapah earthquake of Baja California in Mexico, Nat. Geosci., 4, 615–618, https://doi.org/10.1038/ngeo1213, 2011.
Wells, D. L. and Coppersmith, K. J.: New Empirical Relationships among Magnitude, Rupture Length, Rupture Width, Rupture Area, and Surface Displacement, Bull. Seismol. Soc. Am., 84, 974–1002, https://doi.org/10.1785/BSSA0840040974, 1994.
Williams, J. N., Werner, M. J., Goda, K., Wedmore, L. N., De Risi, R., Biggs, J., Mdala, H., Dulanya, Z., Fagereng, A., Mphepo, F., and Chindandali, P.: Fault-based probabilistic seismic hazard analysis in regions with low strain rates and a thick seismogenic layer: A case study from Malawi, Geophys. J. Int., 233, 1557–1579, https://doi.org/10.1093/gji/ggad038, 2023.
Woessner, J., Laurentiu, D., Giardini, D., Crowley, H., Cotton, F., Grünthal, G., Valensise, G., Arvidsson, R., Basili, R., Demircioglu, M. B., Hiemer, S., Meletti, C., Musson, R. W., Rovida, A. N., Sesetyan, K., and Stucchi, M.: The 2013 European Seismic Hazard Model: Key components and results, Bull. Earthq. Eng., 13, 3553–3596, https://doi.org/10.1007/s10518-015-9795-1, 2015.
Zhang, H., Chen, J., and Ge, Z.: Multi-fault rupture and successive triggering during the 2012 Mw 8.6 Sumatra offshore earthquake, Geophys. Res. Lett., 39, 22, https://doi.org/10.1029/2012GL054207, 2012.