
the Creative Commons Attribution 4.0 License.
the Creative Commons Attribution 4.0 License.
 | 22 Jul 2026

Europe's transport infrastructure is not ready to face climate change
Arpita Asha Khanna
Wolfgang Schade
Chris Smith
Wim Thiery
Climate extremes are intensifying in frequency and severity, posing escalating risks to Europe's transport infrastructure. Over the past two decades, these events have caused physical damages, economic losses, user delays, and rising health emergencies. Here, we first review observed impacts of selected climate extremes on Europe’s transport network. We then present an analysis that accounts for multiple hazards, designed to be intuitive and accessible for policymakers, to quantify the increasing exposure of four transport modes to river floods, heatwaves, droughts, and wildfires. We find that climate extremes are already affecting all transport modes across large parts of Europe, with billions of euros of economic damage even for single events. One prominent example is the 2018 Rhine River drought, which is highlighted as a case study in this analysis and resulted in EUR 2.4 billion in economic losses in Germany. Under the medium-high emissions scenario Representative Concentration Pathway 6.0 (RCP6.0), which approximates the trajectory of current climate policies, exposure of European transport infrastructure to climate extremes is projected to increase. Heatwaves exposure could increase up to 30 times by mid-century (2040–2069) compared to historical conditions (1980–2009). Droughts could affect more than 50 % of inland waterways for the first time by mid-century in this scenario. By the end of the century (2070–2099), railways and roads are projected to face up to 26 times as many wildfires compared to the historical period and exposure to river floods is projected to increase locally up to 8 times. Mitigation efforts aligned with a low-emissions scenario (RCP2.6) demonstrate clear benefits, reducing EU-mean transport mode exposure to all hazards, especially to droughts and heatwaves, for which the mean increase in exposure compared to the historical conditions is already reduced by 22 %–30 % by mid-century. Urgent action is needed to strengthen the resilience of Europe’s transport network and address emerging climate challenges. A combination of ambitious mitigation and adaptation strategies is essential to ensuring their long-term functionality in a changing climate.
- Article
(42276 KB) - Full-text XML
- BibTeX
- EndNote


Climate extremes pose high risks to transport infrastructure, leading to substantial damages and economic losses. Economic losses attributed to climate extremes have increased markedly over the last decade. In the European Union (EU), climate-related extreme events accounted for approximately EUR 738 billion in economic losses between 1980 and 2023 (EEA, 2023). Out of this, EUR 63 billion was incurred in 2021 and EUR 56 billion in 2022 alone (EEA, 2023). Floods, droughts, heatwaves, and wildfires have severely impacted key transport systems, including airports, inland waterways, roads, and railways.
In recent years, the consequences of extreme weather events have intensified, often resulting in system malfunctions or complete closures of critical transport systems. The increasing frequency and intensity of climate extremes are affecting transport networks across Europe. For example, extreme weather and climate events can have short- and long-term effects through transportation delays and infrastructure damage, causing supply chain disruptions and economic losses (Rebally et al., 2021).
Extreme conditions are reaching unprecedented levels, introducing challenges and issues that were either non-existent or less common under past climate conditions. Temperatures at times become so high that they can cause materials to melt, leading to the deformation of pavement and road signs. The cascading effects of these extremes are not limited to infrastructure, they are also posing new health risks. In July and August 2022, multiple incidents across Europe left passengers stranded on trains for hours because of heatwaves or wildfires, often requiring medical assistance (Burgen, 2022; Rimi, 2022). On a Paris-Brussels train, extreme outdoor heat and a malfunctioning air conditioning system caused in-train temperatures to reach around 45 °C, with 750 passengers stranded for about four hours in discomfort (Chini, 2022a). Thalys, the train operator, attributed the incident to extreme outdoor heat, noting that trains and infrastructure are not designed for such high temperatures (Chini, 2022b).
Global warming is increasing the occurrence and frequency of extreme events, such as river floods, heatwaves, droughts, and wildfires (Lange et al., 2020; Seneviratne et al., 2021). As recent events show that we are already experiencing the severe impacts of these extreme events, the associated impacts are expected to escalate in the coming decades. Moreover, the increasing occurrence of extreme as single events as well as the co-occurrence of multiple events (Ridder et al., 2022; Muheki et al., 2024; Messori et al., 2025) can pose the whole transport network to a high risk of physical disruption, service interruptions, and lead to health discomfort for passengers (Bednar-Friedl et al., 2022).
The climate resilience of transport infrastructure is becoming central to long-term infrastructure planning (OECD, 2024). Robust risk analyses are needed to assess the costs of strengthening transport systems and to guide effective adaptation strategies (Zare and Miller-Hooks, 2025). However, existing methodological frameworks remain fragmented, as most have been developed for specific transport modes or individual hazards (e.g. airports De Vivo et al., 2022; Vivo et al., 2025, railways Haghighi et al., 2025b, roads Bles et al., 2016). Risk is determined by the interaction of hazards, the exposure of infrastructure, and its vulnerability (Christopher et al., 2014). Yet, the localized nature of impacts and the difficulty of defining vulnerability continue to hinder the development of comprehensive frameworks (Forzieri et al., 2018). The increasing urgency of climate change highlights the need for novel methodological approaches that can integrate multiple hazards and transport modes.
Assessing the past exposure of transport infrastructure to climate extremes and quantifying the subsequent impacts and economic losses is challenging. This is due to the absence of a comprehensive and up-to-date database which provides disentangled information of economic losses and impacts specific to transport infrastructure. Moreover, analysing the future exposure in a comprehensive way requires an approach that considers multiple hazards and ideally relies on an ensemble of bias-adjusted climate and impact models to account for structural model uncertainties. As a consequence, a comprehensive assessment of historical impacts of climate extremes on transport, as well as exposure projections covering all the transport modes and multiple hazards, are currently lacking for the European Union. The recently launched European Climate Risk Assessment (EUCRA) applies an approach considering multiple hazards and multiple sectors, but lacks the details required to assess the risks of climate change for critical European transport infrastructure (ECRA, 2024).
This work therefore aims to assess the current impacts and future exposure of Europe's transport network to a range of climate extremes. The study is structured in two parts: (i) A review covering the exposure, impacts, and economic losses from extreme events that have affected the transport network over the past fifteen years. This review is based on main publications, open-access databases, and public documents that offer detailed information on the impacts and costs of extreme events on transport networks. Additionally, we select four recent climate extremes as case studies, chosen for their particularly severe impacts on multiple transport modes. For each event, we gather detailed information on the event itself, its impact on transport infrastructure, economic losses, and the influence of climate change. This whole analysis is important to provide an overview of the costs and widespread impacts that different types of climate extremes can have on individual transport modes. (ii) A quantitative analysis of future exposure of the transport network to climate change. For this, we use biophysical impact simulations from the Inter-Sectoral Impact Model Intercomparison Project (ISIMIP) to project exposure of individual infrastructure elements within the transport network to a range of climate extremes. The projections focus exclusively on exposure and do not include future impacts or economic losses. Using the dataset provided by Lange et al. (2020), we assess the exposure of critical European transport infrastructure to five categories of extreme events: river floods, wildfires, droughts, and heatwaves. Due to its economic and strategic importance for the EU, the analysis incorporates the revised Trans-European Transport Network (TEN-T) network, which includes airports, maritime and inland ports, roads, railways, and inland waterways (IWWs). The revised TEN-T network is a new version that ensures sustainable connectivity across Europe and will be developed and completed in stages, with the final step scheduled for 2050 (TEN-T, 2024). For each transport mode, we calculate the yearly occurrence of each extreme event, accounting for both historical and future conditions. The analysis is conducted under three emissions scenarios: a low emissions scenario (RCP2.6), a medium-high emissions scenario (RCP6.0), and a very high emissions scenario (RCP8.5). The objective is to quantify (i) how exposure within the TEN-T network is projected to change under mid-century (2040–2069) and end-of-century (2070–2099) climates compared to historical (1980–2009) conditions, and (ii) the number of single extreme events that each transport mode is expected to experience under three RCPs.
2.1 Impacts and losses due to recent climate extremes on the transport infrastructure
As a first step, we map and review the impacts and economic losses from recent extreme events for each transport mode. This includes (i) quantitative information on recent exposure of transport infrastructure using the Geocoded Disasters (GDIS) dataset, (ii) insights into recent extreme events with detailed information on impacts and economic losses, and (iii) impact and cost data for each transport mode, obtained from official documents, reports, and relevant research papers.
First, we use the global georeferenced database (GDIS) (Rosvold and Buhaug, 2021) to link recent extreme events with transport infrastructure modes. GDIS is an expanded version of the Centre for Research on the Epidemiology of Disasters' (CRED) Emergency Events Database (EM-DAT) database. In GDIS, all the natural disasters reported in the EM-DAT database are geolocated. The events reported in GDIS have different levels of aggregation (e.g., NUTS-1, NUTS-2 and NUTS-3 level). The database provides a polygon with the event extension and epicenter coordinates for each event. It contains 39 953 locations for 9924 disasters worldwide between 1960 and 2018, including floods, storms (typhoons, monsoons etc.), earthquakes, landslides, droughts, volcanic activity and extreme temperatures. To capture the recent increase in extremes, we consider all events of floods, storms, droughts, and extreme temperatures recorded in the GDIS dataset, focusing on the last 15 years (2010–2018). For this study, the QGIS software was used to select the TEN-T infrastructure modes that lie or intersect within the polygons reported for each event, including airports, maritime ports, roads, railways, and inland water ways (IWWs). We used the 2022 TEN-T shapefile provided by the European Commission, delineating the TEN-T network as defined by the Council General Approach on the Proposal for a revision of the TEN-T Regulation. This analysis is not an exhaustive representation of all extreme events from the past decade, as it is limited to events documented in the EM-DAT database. However, it serves as a broad-ranging exploratory analysis to assess the importance and severity of the issue. While GDIS provides some information on TEN-T infrastructure exposure, related data on impacts and economic losses specifically linked to transport infrastructure damage are not recorded.
Second, we gather detailed information on costs and impacts for a selection of recent climate extremes. We then analyze the resulting effects on transport infrastructure, human lives, economic losses and the influence of climate change. The objective of these case studies is to illustrate the nature and extent of impacts when specific types of climate extremes affect transport infrastructure. We select the case studies according to specific criteria: (a) recent extreme events, (b) very high economic damages, (c) impacts across multiple transport modes, and (d) availability of reports and detailed documentation on impacts to transport infrastructure. We choose four case studies across the EU: (i) the heatwave and drought of 2018 in Germany, (ii) the floods of 2021 in Belgium, Germany, and the Netherlands, (iii) the consecutive flash floods between 2021 and 2023 in Greece, (iv) the compounding wildfires and heatwaves in 2023 in Sicily. These climate extremes generated huge adverse impacts across different regions in Europe.
Third, we gather and synthesize quantitative information on damages and economic losses for each transport mode from public documents, reports and publications. The main sources for mode-specific impacts are reported as follows.
-
Airports. The report “Climate Change Risks for European Aviation”, published by Egis and the UK Met Office on behalf of EUROCONTROL in 2021, provides extensive data on storms, wind changes, sea-level rise, and temperature increases to help the aviation industry update climate risk assessments and adaptation strategies (Eurocontrol, 2021b).
-
Ports. Verschuur et al. (2023) analyzed the risk that port infrastructure faces from multiple natural hazards on a global scale.
-
Inland waterways. The “European Drought Risk Atlas” published by the Joint Research Centre (JRC) and European Commission in 2023, offers an overview of drought impacts and risks in Europe, including for river transportation (Rossi et al., 2023).
-
Railways and roads. The DRMKC Risk Data Hub is a geo-portal that provides disaster loss data for Europe across multiple hazards. It includes disaggregated impact data for coastal, river, and flash floods, specifically for railways and roads (DRMKC, 2024). The DRMKC database includes events up to 2022; we consider the period 2010–2022 to cover the most recent 15 years with the latest available information.
2.2 Future exposure of transport infrastructure
2.2.1 Hazard data
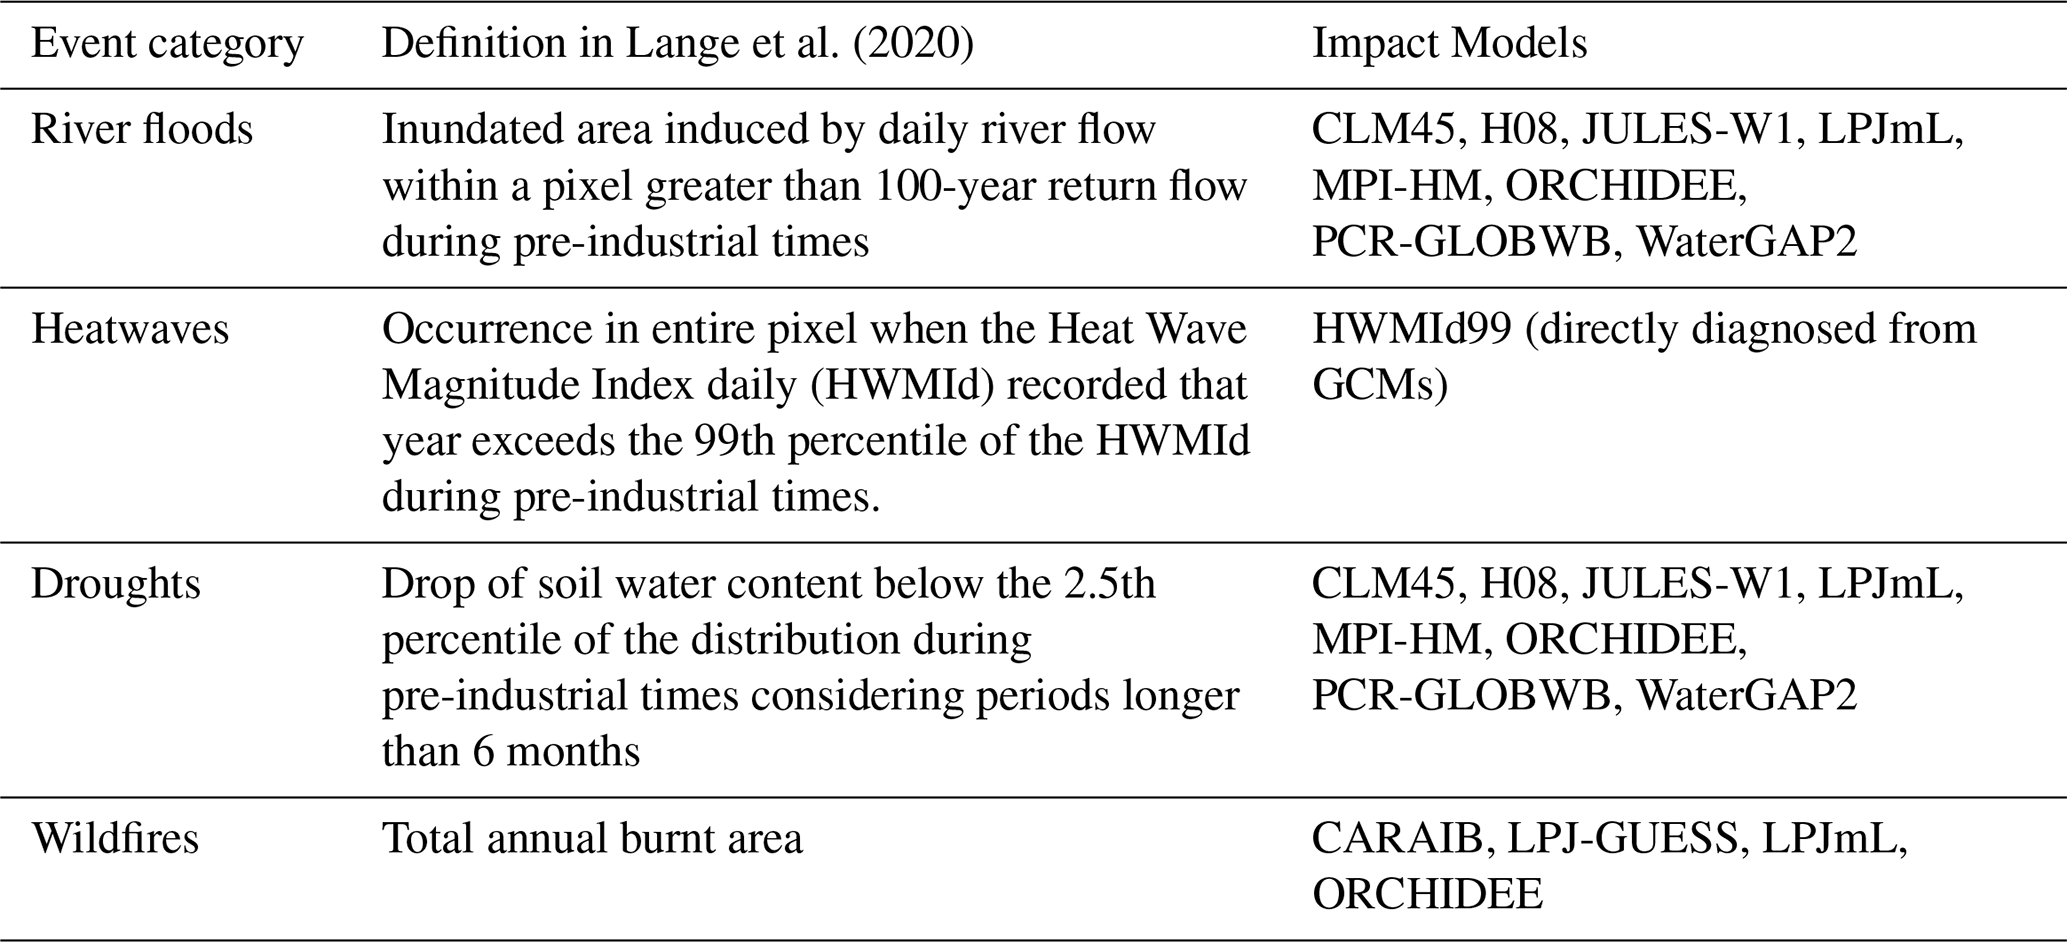
In a second step, we project the exposure of European transport infrastructure to several climate extremes. The exposure analysis builds on a dataset of multiple hazards (Lange et al., 2020) derived from the Inter-Sectoral Impact Model Intercomparison Project Phase 2b (ISIMIP2b) simulations. ISIMIP provides a set of consistent, global-scale, multi-sector climate change impact simulations, based on historical conditions and selected future scenarios. ISIMIP provides future projections at a global scale, at a spatial resolution of 0.5°×0.5° (approximately 55 km × 55 km at the equator) of variables of different impact sectors. Lange et al. (2020) analyzed an ensemble of climate and impact model simulations from ISIMIP project to quantify the change in frequency of droughts, heatwaves, river floods and wildfires under varying levels of future global warming. To this end, they developed a coherent dataset of yearly occurrence of these climate extremes considering historical and future climate conditions (1861–2099) following RCPs 2.6, 6.0, and 8.5. The climate extremes are obtained by forcing hydrological, vegetation, and heatwave, models with meteorological information generated by four Global Climate Models (GCMs; IPSL-CM5A-LR, HadGEM2-ES, MIROC5, and GFDL-ESM2M). Each GCM underwent trend-preserving bias adjustment against a reanalysis product (Lange, 2018; Frieler et al., 2017). The definition of each extreme event is reported in Table 1. The employed extreme events definitions are commonly used in the scientific community and already used in analyses across multiple hazards (e.g., Lange et al., 2020; Thiery et al., 2021a; Bauer et al., 2023; Pelz et al., 2025). For heatwaves and droughts, the data is expressed as the occurrence or not for each year and each grid cell. For river floods and wildfires, the data is presented as the percentage of the grid cell exposed to the climate extreme.
Table 1 Definitions of extreme event categories and impact models considered in this study. The impact models are described in CLM45 (Lawrence et al., 2011; Thiery et al., 2017), H08 (Hanasaki et al., 2018), JULES-W1 (Best et al., 2011), LPJmL (Schaphoff et al., 2018), MPI-HM (Hagemann and Gates, 2003; Stacke and Hagemann, 2012), ORCHIDEE (Guimberteau et al., 2018), PCR-GLOBWB (Wada et al., 2014, 2016), WaterGAP2 (Müller Schmied et al., 2014, 2016), HWMId (Russo et al., 2015, 2017; Lange et al., 2020), GEPIC (Folberth et al., 2012), PEPIC (Liu et al., 2016), CARAIB (Dury et al., 2011), LPJ-GUESS (Smith et al., 2014).
2.2.2 Methods
We quantify the exposure of European transport infrastructure considering two future time horizons: 2024–2075 (hereafter referred to as the mid-century) and 2070–2099 (hereafter referred to as the end-of-century). The dataset provided by Lange et al. (2020) for heatwaves, river floods, wildfires, and droughts is clipped in the European bounding box, with coordinates: longitude min/max [35° W, 40° E] and latitude min/max [25° N, 72° N]. Heatwaves and droughts are recorded as affecting entire grid cells, while wildfires and floods are expressed as the fraction of grid cell area exposed. To ensure consistency, for these latter hazards we convert the fractional values into binary data using a threshold: grid cells are classified as affected when more than 3 % of their area is exposed. This relatively low threshold was selected based on a sensitivity analysis to ensure that enough events remain available for extracting spatial statistics across Europe. We tested several thresholds ranging from 1 % to 5 % of the cell area affected. Using the 5 % threshold, most flood events were not captured in the spatial statistics. At the 1 % threshold, however, exposure to hazards such as wildfires was overestimated, with large portions of the network appearing to be affected in nearly every case. The 3 % threshold provided a balance, capturing localized events like river floods without inflating exposure from more widespread hazards. It accounts for the highly localized nature of these hazards and avoids the exclusion of a substantial number of impactful events.
The three scenarios used in the analysis, RCP2.6, RCP6.0, RCP8.5, represent possible futures with varying degrees of climate action. RCP8.5 represents the most extreme, worst-case scenario with a roll-back of existing policies and a continued, strong growth in the use of fossil fuels. RCP2.6 represents a scenario with strongly enhanced ambition in terms of climate change mitigation compared to current policies. RCP6.0 is a scenario with a range of temperature outcomes that encompass the expected temperature range under current climate policies (which currently have a best-estimate outcome of around 3 °C by 2100) (Rogelj et al., 2023; Hausfather, 2025; Hausfather and Betts, 2020; IPCC, 2019). In the main text, the results are presented for RCP6.0. Results for RCP2.6 and RCP8.5 are reported in the Appendix A, and the comparisons with RCP6.0 projections are discussed in Sect. 3.2.
2.2.3 Exposure Multiplication Factor
To analyse the exposure data, we use the Exposure Multiplication Factor (EMF), which describes the ratio of the number of future climate extremes across two time periods to the number of historical climate extremes. The EMF was proposed by Thiery et al. (2021a) and is defined as:
The future exposure, Efut, is defined as the number of events occurring in mid-century (2040–2069) or end-of-century (2070–2099) future scenarios, respectively, while the historical exposure, Ehis, represents the number of events in the historical period (1980–2009). This metric provides a clear visualization of the regions of the network projected to experience an increase in extreme events compared to the historical period. It is conceptually related to the probability ratio metric widely used in attribution studies (e.g., Joughin et al., 2004; Thiery et al., 2020; Pietroiusti et al., 2024), where the probability ratio is defined as the ratio of event probabilities, constrained within the range [0, 1]. However, the EMF differs in that since it is based on the ratio of event counts rather than probabilities. It explicitly incorporates exposure alongside hazard, advancing toward a more comprehensive risk definition (Fischer and Knutti, 2015). The use of the event count ratio as a metric makes it less dependent on the specific definitions of extreme events, which are often tied to return periods or other statistical thresholds (see Table 1). This reduced dependence enables the analysis of different extreme events in a single unified framework, leading to a comprehensive analysis across multiple hazards. Its simplicity is particularly valuable, making it a powerful tool for communicating scientific findings to policymakers and stakeholders in an accessible manner.
The EMF is calculated per hazard at the grid scale for each individual combination of emissions scenario, climate model, and impact model, after which the median value across each climate – impact model pair is computed per location and scenario. We consider a 30 years time windows, which provides a sufficiently large sample to account for the fact that the event counts are rare events. We use the multi-model ensemble median EMF as the primary indicator in our analysis to represent, for each pixel, the increase in exposure on which at least half of the climate-impact model simulations agreed. This is useful since there are some pixels for which zero extreme events occur in the historical period but a non-zero number in the future, so the EMF becomes infinite. Using the median as the metric for aggregating across simulations, the multi-model ensemble median EMF will be infinite if at least half of the simulations result in an infinite EMF. The count of pixels where the EMF tends to infinity is referred to as the “area newly exposed to extremes”, since EMF can also become infinite when changing from 0 to 1 extreme event. This metric describes the percentage of the network that was not exposed in the historical period but is projected to become exposed in the future. EMF statistics are provided for the historically exposed area of the network, where finite values of the multi-model ensemble median EMF are obtained.
The shapefile of the revised TEN-T network (see Sect. 2.1) is superimposed on the 0.5×0.5° grid dataset to extract the exposure for each node and line of the vector network and for each extreme event. We consider the same extent of the TEN-T network for the historical period as for the future scenarios. From this, we extract the percentage of transport network for each mode that is exposed to a climate extreme. Each event is assumed to affect all transport modes within a grid cell, even though the exact location of the event within the cell is unknown. This assumption is reasonable if we consider the affected area as experiencing direct and indirect impacts, which extend to neighbouring elements. For example, a flood affecting a single road can cause disruptions, operational issues, or even a complete halt in circulation across the interconnected transport network within a grid cell.
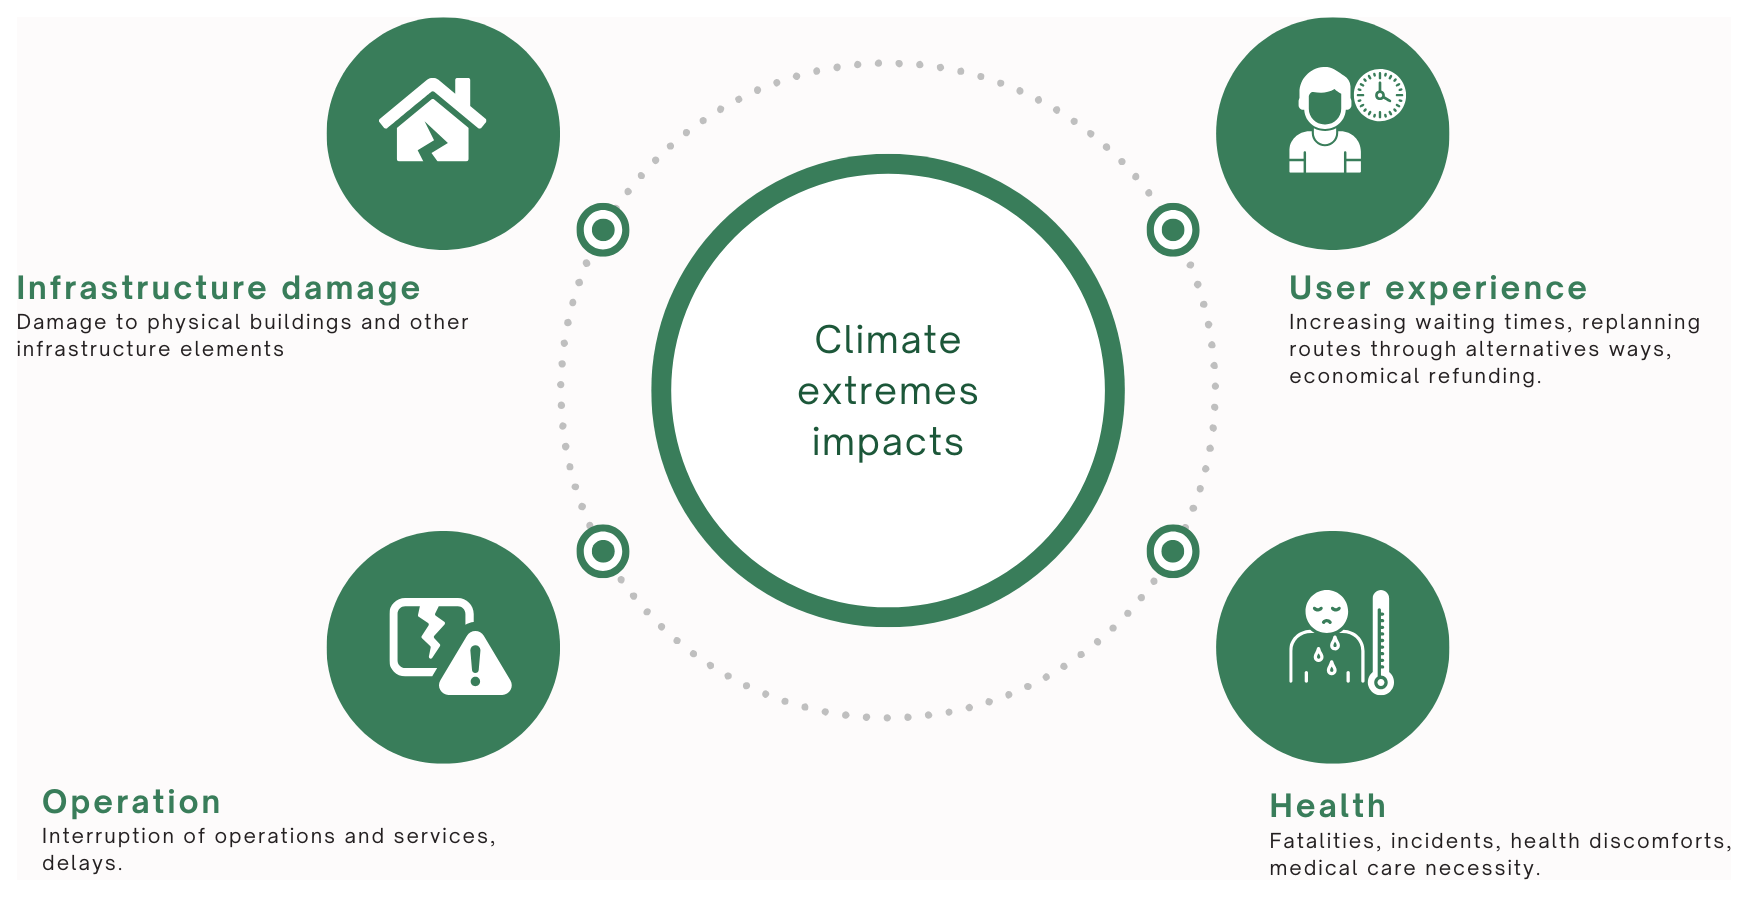
Figure 1Climate extremes and their impacts on the transport sector, based on Enei et al. (2010).
3.1 Impacts and losses due to recent climate extremes on the transport infrastructure
In recent decades, an increasing number of floods, heatwaves and droughts are putting the European transport network under high stress. The impacts of extreme events are not limited to damage to transport infrastructure and critical buildings but also include operational costs related to network disruptions, repercussions on user experience, such as increased waiting times, and health-related issues (Fig. 1) (Enei et al., 2010).
Each considered transport mode has been impacted by multiple hazards in recent years (Figs. 2, A1–A4). Extreme temperatures (both high and low) and storms affected the highest number of transport nodes, largely due to the extensive spatial reach of these events (Fig. 3). Storms are particularly relevant for maritime ports and inland waterways, while floods have largely impacted airports, railways, and roads, underscoring the importance of considering all hazards when assessing transport exposure. Based on the GDIS dataset, the transport infrastructure in France, Italy, and Germany experienced the highest exposure to reported climate extremes between 2010 and 2018 with 28, 26, and 18 events, respectively (Fig. 4). In contrast, Estonia, Latvia, and Denmark each reported only one event during this period.
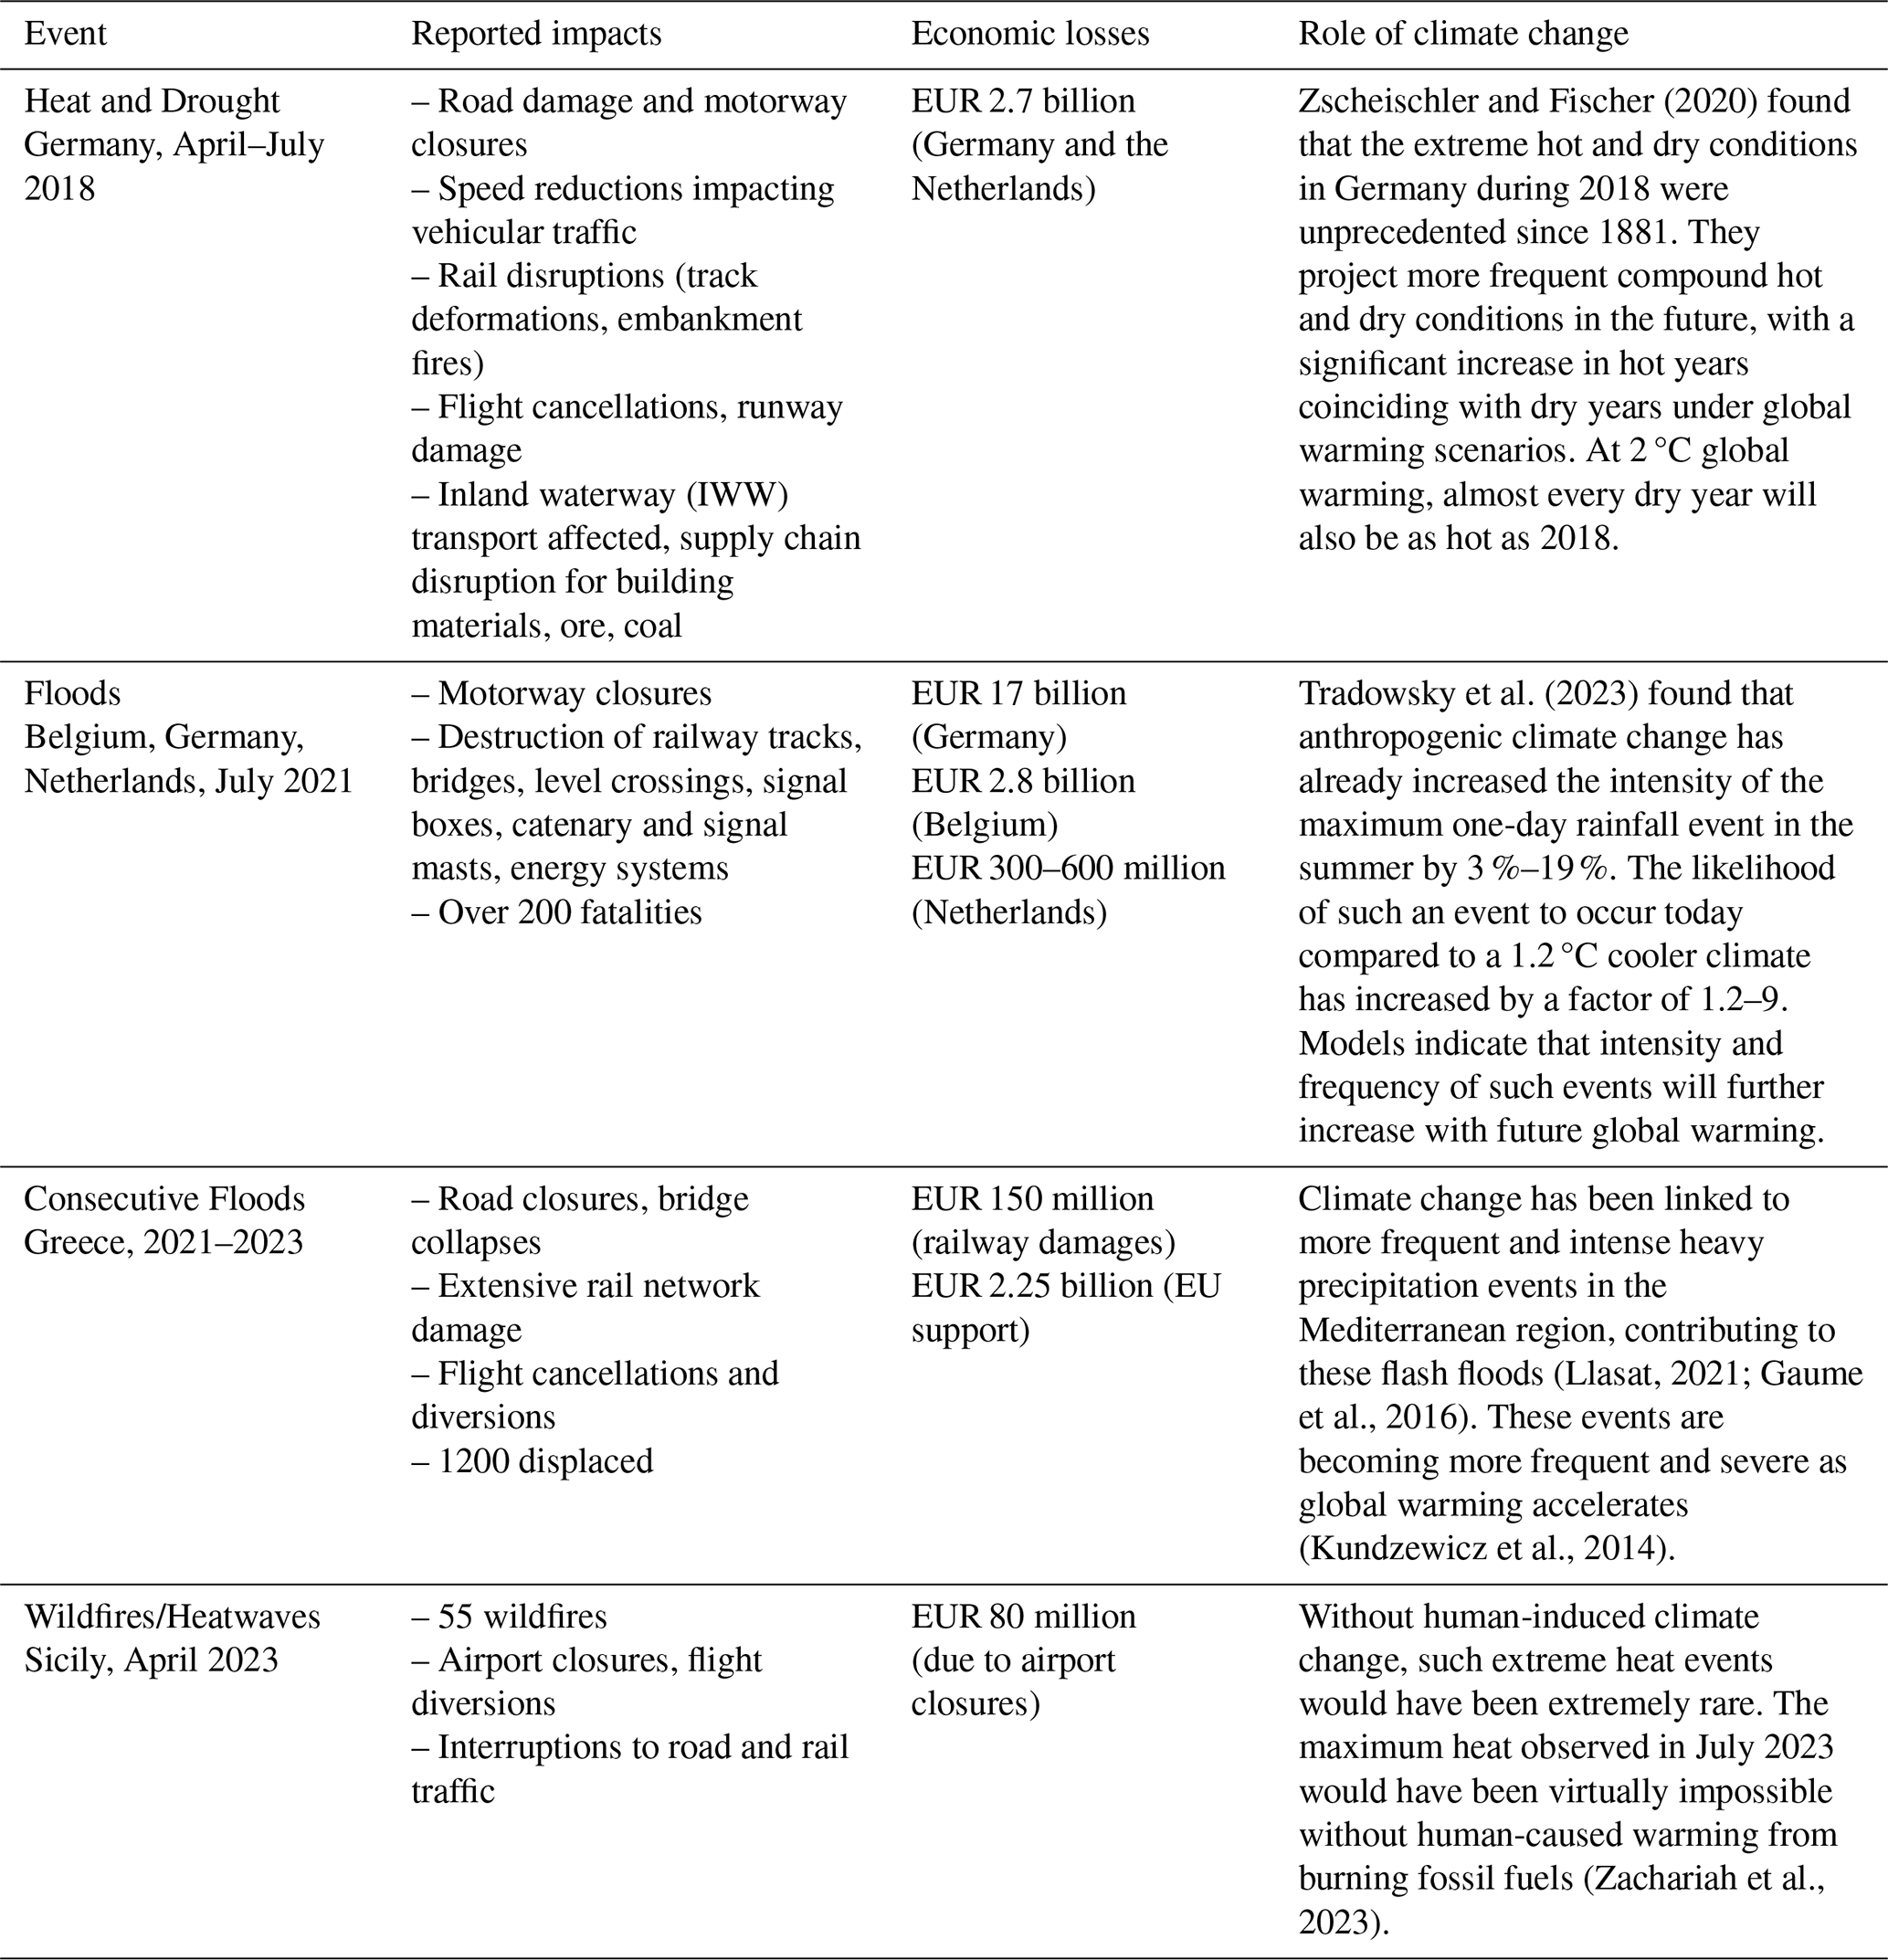
According to the GDIS dataset, a total of 7188 extreme events occurred globally between 1960 and 2018 (Rosvold and Buhaug, 2021). These include floods, storms, extreme temperatures, and droughts. Between 2010 and 2018, Europe witnessed 120 of these extreme events (Fig. 2). GDIS provides the location of extreme events but does not include specific information on possible transport infrastructure damages. The resulting impacts and economic losses can be widespread, affecting multiple countries and causing operational disruptions across various transport modes simultaneously. This can be illustrated by recent, well-documented climate extremes, which we have selected as case studies. For each of the four case studies we gather information on costs and impacts, and analyze the resulting effects on transport infrastructure, economy, and the role of climate change. The complete analysis of these four case studies is provided in Appendix A and is summarized hereafter and in Table 2.
(i) The heatwave and drought of 2018 in Germany set records for both high temperatures and low precipitation (Mühr et al., 2018). The impacts affected the entire transport network, leading to road traffic restrictions, rail track deformations, flight cancellations, and disruptions to river shipping due to low water levels. On the Rhine River, ships could only travel partially loaded due to the low water levels, resulting in interruptions in the logistics chain and an economic loss of EUR 2.7 billion in Germany and the Netherlands (Streng et al., 2020). Attribution studies have shown that the likelihood of extremely dry years coinciding with extreme heat is increasing (Zscheischler and Fischer, 2020) (Table A5). (ii) In 2021, extreme rainfall across Western Europe caused severe flooding in Belgium, Germany, and the Netherlands. The resulting casualties and economic losses due to road and rail infrastructure damage were exceptional, with reconstruction efforts taking months to years. For the larger Western European region, it was found that, under current climate conditions, on average one rainfall event of this magnitude can be expected every 400 years at any given location (Tradowsky et al., 2023) (Table A6). (iii) Over the past four years, Greece has experienced a series of heavy flash floods, causing significant economic damage. For three consecutive years, 2021, 2022, and 2023, roads and railways were severely affected, limiting the country's ability to recover from one event before the next occurred (Table A7). (iv) In the summer of 2023, the Northern Hemisphere was affected by a series of heatwaves, particularly severe in Southern Europe, with summer mean temperature anomalies of +4 °C in Italy, Greece, and Spain. These heatwaves also triggered wildfires, including 55 separate fires across Sicily that affected Palermo and Catania airports (Skoulding, 2023). As a result, Palermo’s Falcone Borsellino airport was closed for several hours. Two days of flight cancellations and the partial closure of Catania resulted in serious damage to the local economy, tourism, and jobs. The airport closures, alongside severe disruptions to air and ground transportation, led to estimated damages of at least EUR 80 million (Laudani, 2023). Without human-induced climate change, such extreme heat events would have been extremely rare (Zachariah et al., 2023) (Table A8).
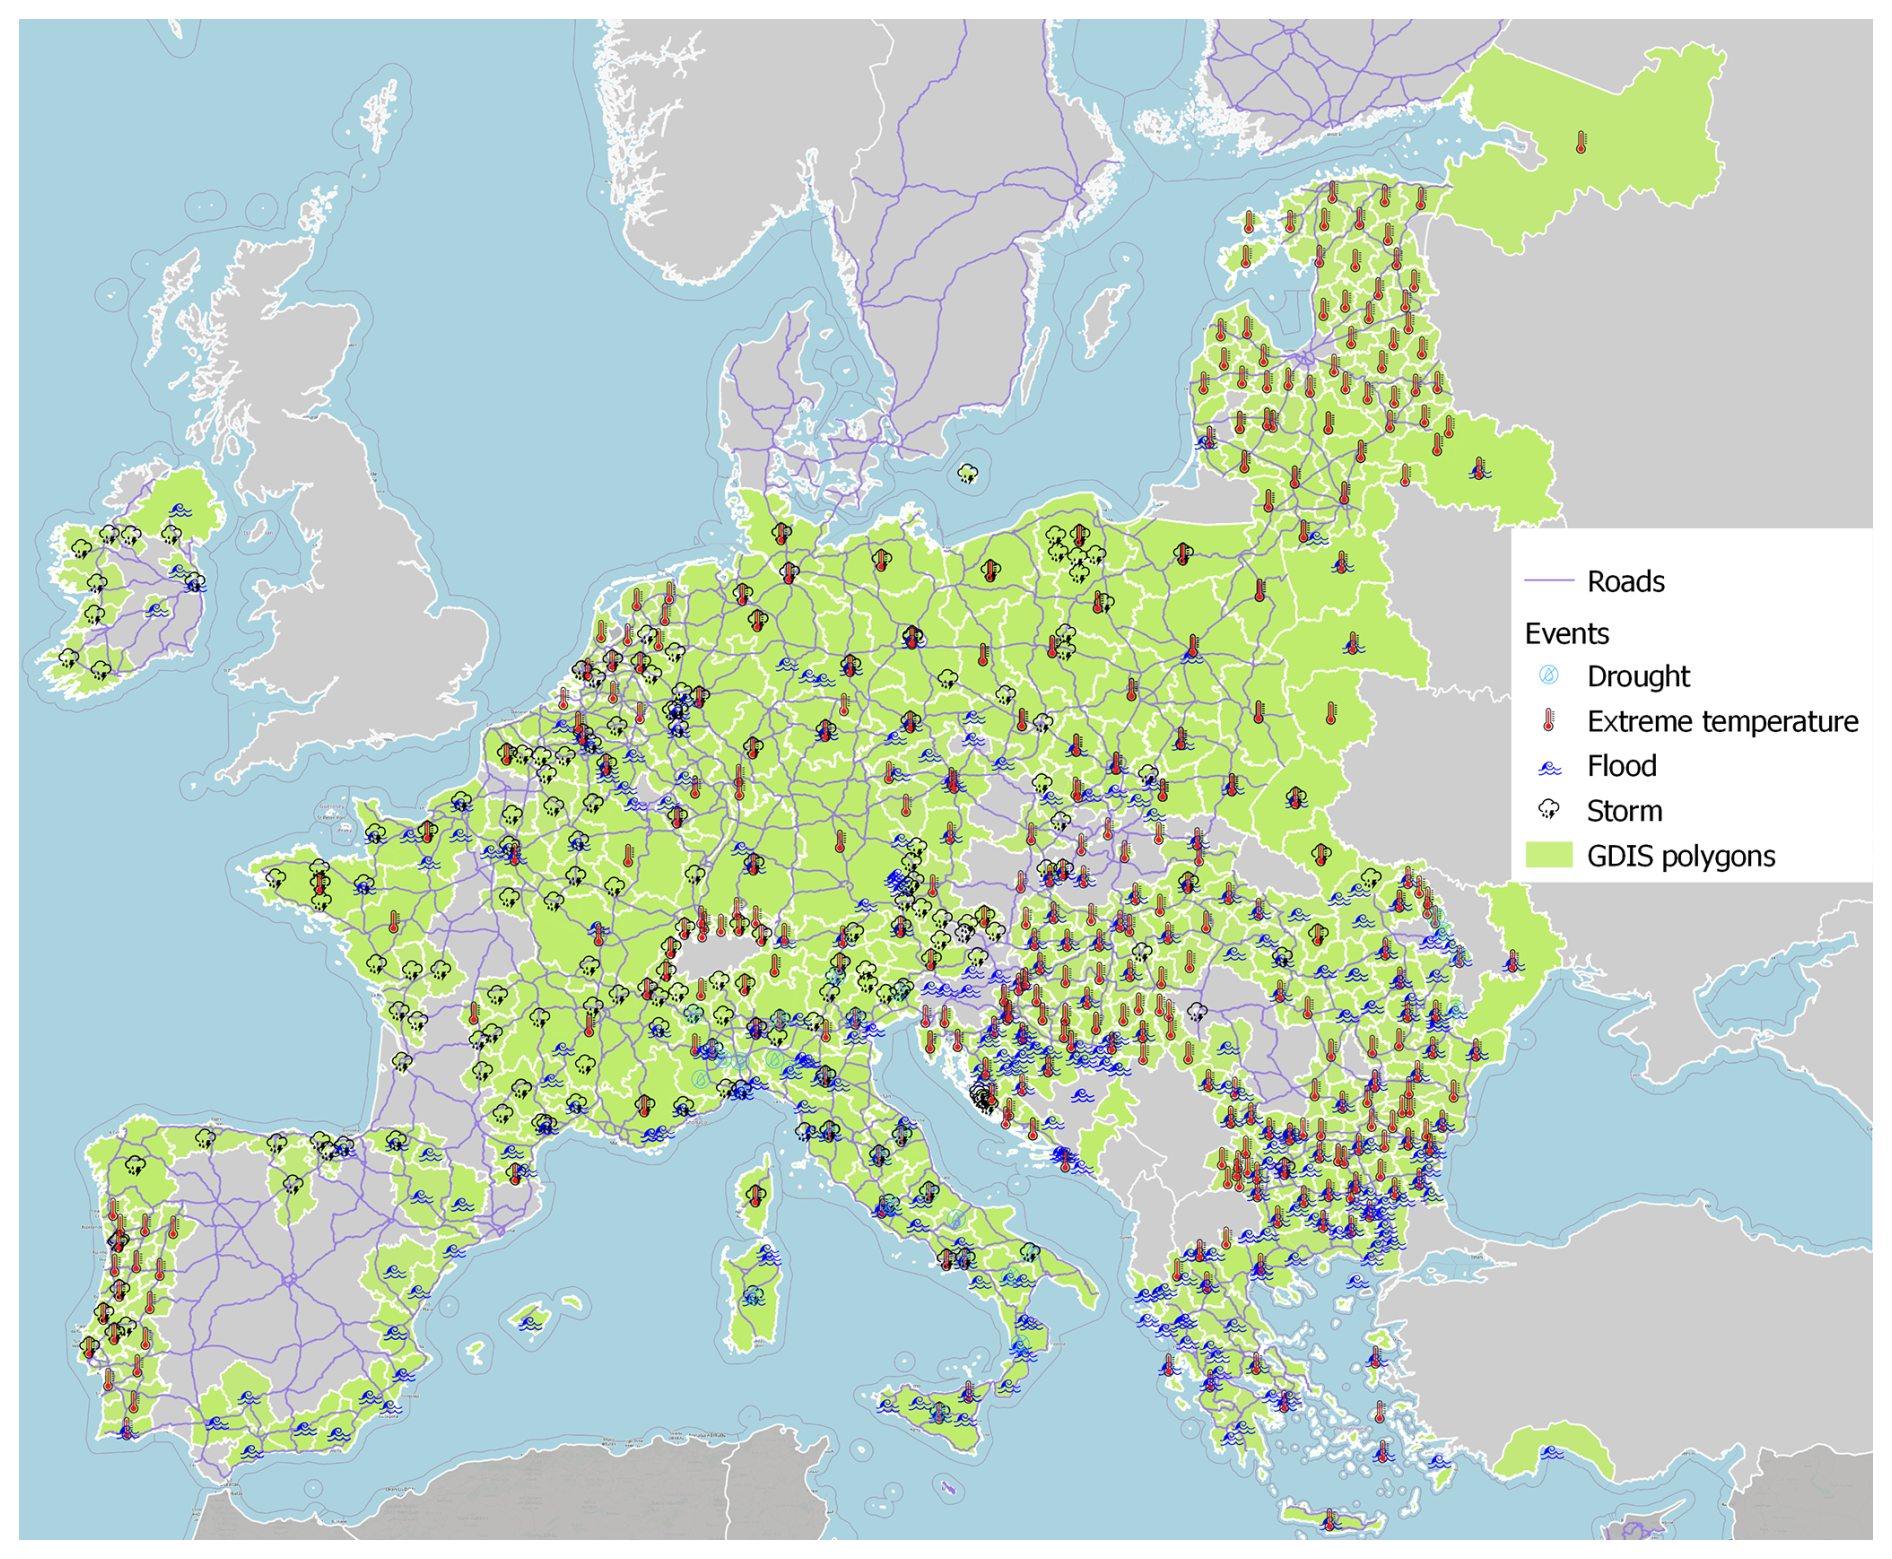
Figure 2 Drought, extreme temperature, flood, storm events reported from the GDIS database from 2010–2018. In green are GDIS polygons of extreme events that fall within, or partially overlap with, EU NUTS regions. The purple lines shows the TEN-T road network. Maps for the other four modes of transport are provided in Appendix A.
The effects of different types of climate extremes vary across transport modes. In the following subsections, we provide information on the impacts and costs of recent extreme events for each transport mode, based on open-source documents and literature research (see Sect. 2.1).
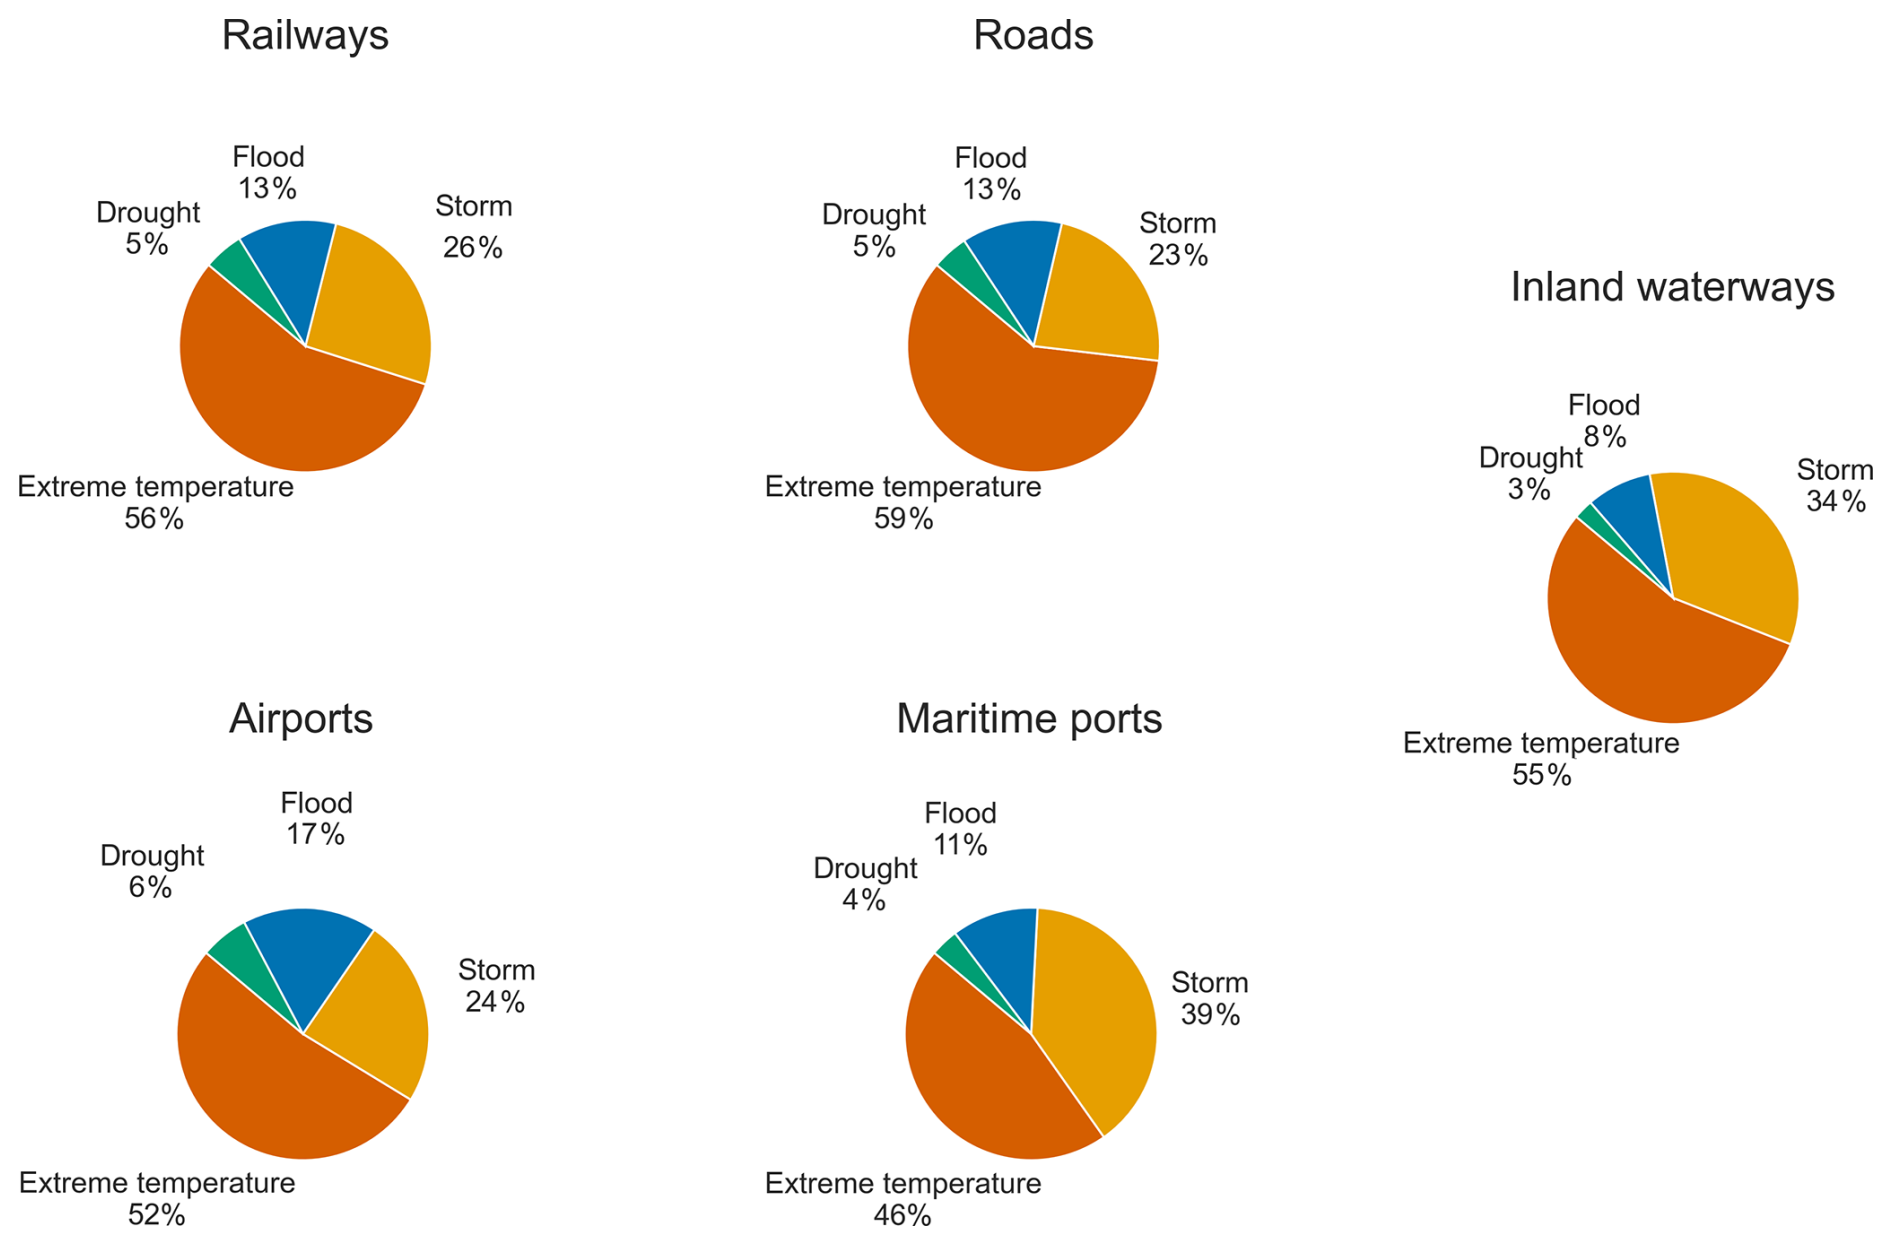
Figure 3 The TEN-T transport infrastructure modes exposed to climate extremes during the period 2010–2018, obtained by overlaying the transport network on the GDIS event polygons.
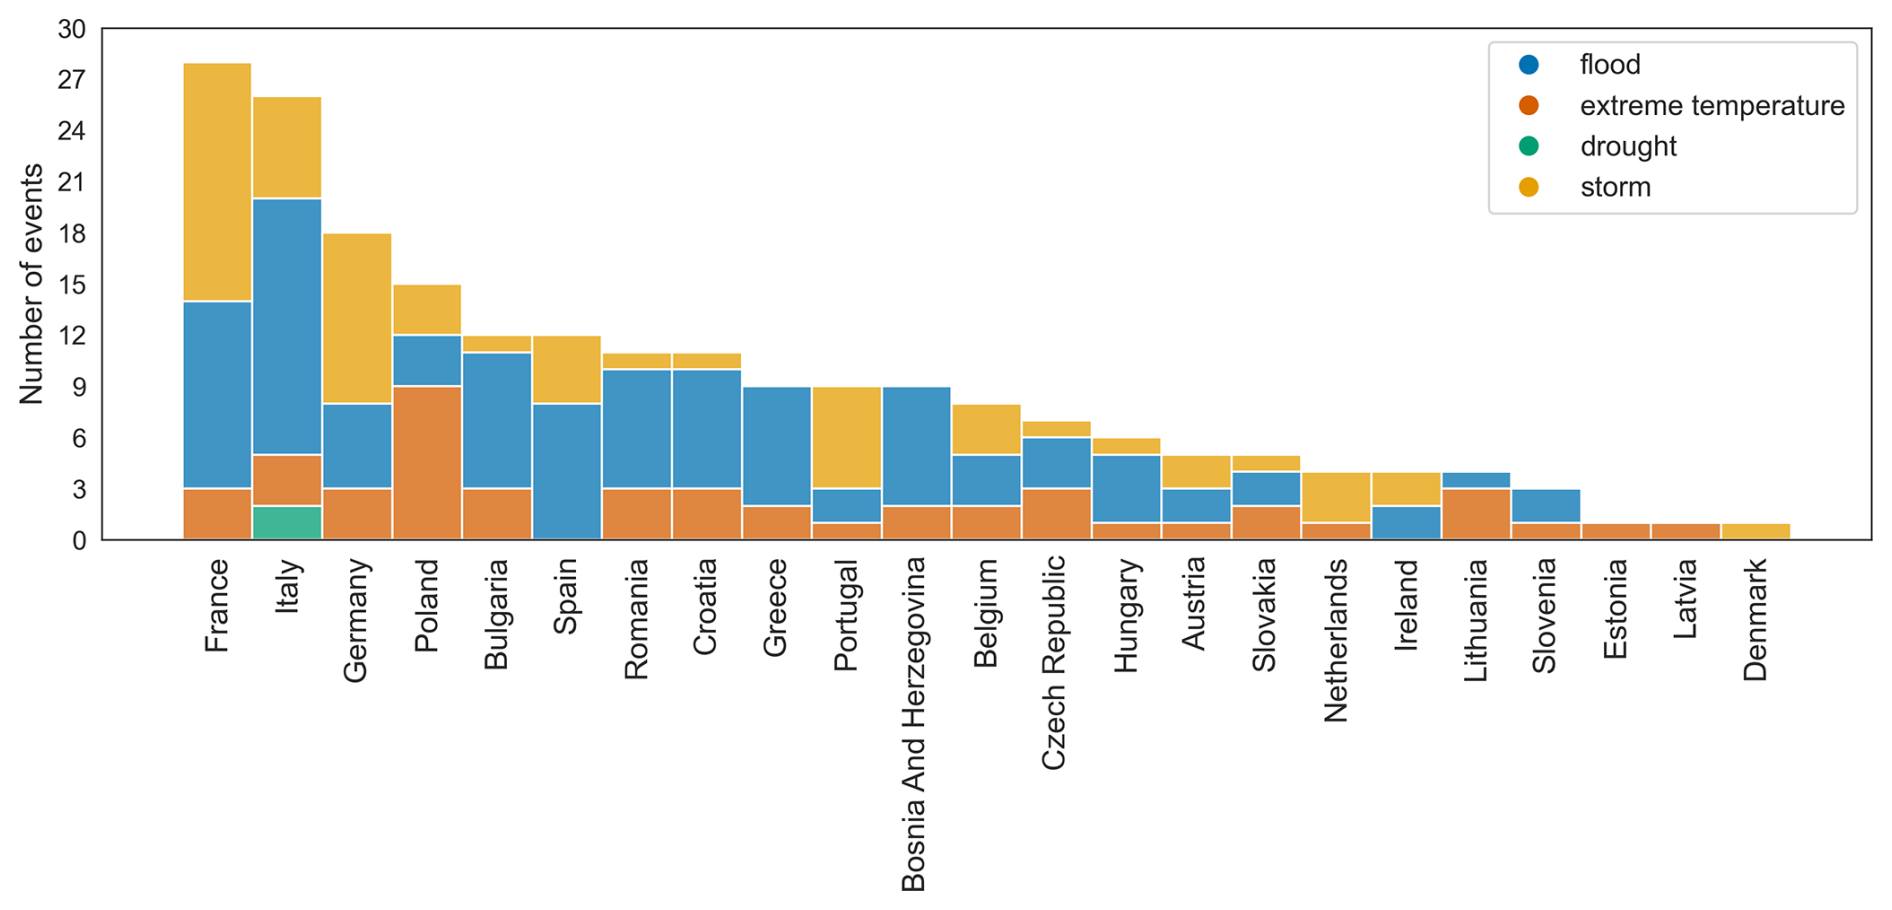
Figure 4 The number of extreme events affecting European countries during the period 2010–2018, according to the GDIS database.
Table 2 Events, impact, economic losses and climate change information for four selected and recent case studies. The four case studies are analysed in detail in Appendix A. The reported economic losses estimates are as reported in the original studies and are not adjusted for inflation.
3.1.1 Airports
Storms, windstorms, floods (pluvial, river and coastal), heatwaves and wildfires are climate extremes that affect European airport infrastructure the most (Burbidge, 2023; Burbidge et al., 2024). Their increasing impact on European airports is emerging as a growing problem in recent years (EASA, 2025) (Table A1). These events can cause both physical damage and operational disruptions. Examples of physical impacts include runway cracking, flooding, and melting, while operational issues can range from flight delays and suspensions to full airport closures (Voskaki et al., 2023). Additionally, these disruptions often lead to longer waiting times for passengers, an increase in refund requests, and the activation of emergency rescue services.
High temperatures, heatwaves, and wildfires are creating unprecedented challenges for airport infrastructure. Issues like melting runway pavement, cracking, and the deformation and melting of airport signage are emerging as problems that were not faced in the past (Sullivan, 2018; ITV, 2022; Euronews, 2022). For example, in July 2023 subsequent wildfires hit Sicily, Dubrovnik, Rhodes, Gran Canaria, Lisbon and Cascais in Portugal (Sullivan and Tondo, 2023). In Sicily, 55 separate wildfires broke out hitting Palermo and Catania airports (Skoulding, 2023). These wildfires caused direct airport infrastructure damage but also broader implications as the Palermo Borsellino airport closure, flight diversions generating impacts on tourism, and local economy, (see case study in Table A8 in Appendix A). Airport taxiways and runways built on expansive soils can be affected by prolonged drought, requiring soil stabilization methods to mitigate these issues. Although evidence from Europe is currently lacking, such impacts have been documented in the U.S. and should be taken into account for European airports built under similar conditions (Earth Systems, 2024).
Flooding is also leading to increasing problems and economic losses due to physical damage, as well as the suspension and cancellation of airport operations (Eurocontrol, 2021b). Over the past three years, the frequency of such events has risen, affecting both inland airports through river floods, and coastal airports due to the growing risk of coastal flooding. Sea level rise and associated coastal flooding present an especially significant threat to aviation. In the report “Climate Change Risks for European Aviation” the economic impact of a one-day closure due to full flooding is estimated at approximately EUR 3 million for medium-sized airports and EUR 18 million for large airports. For partial or short-term closures, these costs drop slightly to around EUR 2 million and EUR 15 million, respectively (Eurocontrol, 2021b). However, actual financial losses can vary considerably depending on factors like the proximity of alternative airports and the extent of damage. Coastal flooding is receiving increasing attention due to the exposure of airports to the risks associated with sea level rise (Eurocontrol, 2021a).
Air Traffic Flow Management (ATFM) involves regulating air traffic to prevent exceeding the capacity of airports or air traffic control systems. Storms are historically responsible for up to 7.5 % of total en route ATFM delays at the network level. In 2019 alone, storms caused an estimated EUR 2.2 billion in en route delays for the aviation industry. The bulk of these costs originated from en route ATFM delays (61.6 %), followed by the cost of lost passenger time (28.8 %) (Eurocontrol, 2021b). On average, each flight affected by a storm experienced an en route ATFM delay of 17 to 18 min. Attempts to avoid severe storms often result in longer flight distances. For instance, in 2019, over 1 million additional kilometers were flown in efforts to circumvent major storms (Eurocontrol, 2021b).
3.1.2 Ports
Port disruptions due to climate extremes can be multifaced, leading to a decrease in the volume of goods processed for a period of time, delays, goods depreciation, and, if cargo is rerouted, increased transportation costs (Verschuur et al., 2020; Asghari et al., 2023). River floods, flash floods and high temperature can be particularly damaging to river ports, while seaports are also more exposed to high winds and coastal flooding (Asariotis et al., 2024). The impacts also extend to maritime operations, posing risks to infrastructure, cargo, and personnel (Verschuur et al., 2020).
High winds create problems in seaport navigation and bething, endanger crane operators, destabilize containers, and reduce vessel maneuverability, increasing the likelihood of accidents in ports and at sea (Asariotis et al., 2017; Buluttan, 2025; Britannia P&I, 2025). Extreme high temperatures damage infrastructure, equipment, and cargo, may limit operations, cause pavement and track damages leading to asset lifetime reduction, and also increases in the staff health risk (Asariotis et al., 2017). They threaten perishable cargo by accelerating spoilage and increasing condensation inside shipping containers (Buluttan, 2025; Britannia P&I, 2025). Drought impacts ship and port operations by reducing water levels, causing severe disruption to supply chains (Table A5). Flooding from intensifying heavy rainfall, as well as other associated extreme events (e.g. landslides), increase the disruptions and delays in rail and road transportation, affecting also connections/access to seaports (Asariotis et al., 2017). Additionally, storms can generate high waves causing structural damage, cargo loss, and navigation hazards, and the rain can create visibility issues, impacting cargo transfer and worker safety (Asariotis et al., 2017; Buluttan, 2025). Maritime ports are located in vulnerable areas to climate change impacts: on coasts exposed to storms and sea-level rise or at river estuaries susceptible to flooding (Becker et al., 2012).
Verschuur et al. (2023) assessed the risk to global port infrastructure at the asset level, considering multiple hazards. Their risk framework includes both operational disruptions to ports (that do not cause damages), which typically occur due to extreme wind, temperature, wave heights and overtopping, as well as the physical damages to port infrastructure as a result of natural hazards from earthquakes, river flooding, pluvial flooding and coastal flooding. They quantified the potential impacts on both physical asset damage and the disruption of logistical services (i.e., port-specific risks), as well as the risk posed to maritime trade flows (i.e., trade-related risks). Port-specific risk is defined as the sum of three type of impacts affecting the actors who own, operate and use ports: (i) the physical damages to port infrastructure such as terminals, cranes and industrial facilities, (ii) the physical damages to critical infrastructure in the surrounding area (electricity, road, rail and power plants) on which the port relies and (iii) additional logistical losses incurred by port operators, carriers, and shippers due to downtime that exceeds operational limits or during asset reconstruction (Verschuur et al., 2023). Logistics losses are significant for ports that handle large quantities of cargo, especially those exposed to maritime extremes. Even without major damage to infrastructure, these high-traffic ports can face severe disruptions if forced to shut down.
Of the 1340 ports analyzed, 94.8 % are exposed to more than one natural hazard, with 50 % facing the impact of four to five hazards (Verschuur et al., 2023). Ports located in Northern and Eastern Europe are exposed to one or two hazards, whereas ports located in Western Europe – for instance, along the Spanish coast and the North-West region of France – are exposed to multiple hazards such as pluvial flooding, river flooding, cyclones, and coastal flooding (Portillo Juan et al., 2022; Asariotis et al., 2024) (Table A2). This suggests that the vast majority of maritime ports need to consider multiple hazards in the design and operations of infrastructure (Verschuur et al., 2023; Fernandez-Perez et al., 2024).
Fluvial (22.6 %) and coastal flood (23.7 %) are the leading hazards for Western and Northern Europe (Verschuur et al., 2023). The spatial footprints of port-specific risks contributed by flooding depend on the location of rivers and occurrence of extreme coastal water levels. Furthermore, the local presence or absence of flood protection standards and the freeboard of the terminals also contribute. The high exposure of ports in northwestern Europe to coastal flooding aligns with the findings of Christodoulou et al. (2019), who also identified this region as being highly vulnerable to current extreme water levels.
The three different risk factors (port infrastructure damages, critical infrastructure damages, and logistics losses) contribute to port-specific risk to varying extents. Globally, physical damages to port infrastructure account for 58.6 % of port-specific risk, followed by logistics losses (22.2 %) and critical infrastructure damages (19.2 %) (Verschuur et al., 2023). Damage to port infrastructure also emerges as the primary driver of port-specific risk across most ports in Europe. However, impacts on critical infrastructure are highly relevant as well, since flood-related disruptions to surrounding networks can hinder port functionality. Critical infrastructures are often more exposed to fluvial and coastal flooding, given that port terminals are typically built at higher elevations. Therefore, managing flood risks to critical infrastructure near ports should be a key component of overall risk management and the development of adaptive strategies, as emphasized in prior research (Allen et al., 2021; Vidas, 2015).
3.1.3 Inland waterways
Inland waterways (IWWs) in Europe are a network of almost 40 000 km of navigable waterways with the majority of these concentrated around relatively few river systems – for instance the Rhine, the Danube, the Elbe, the Rhone, the Seine, and the Po (Jonkeren et al., 2011). Over the past four decades, IWWs have seen a substantial growth in traffic and tonnage in Europe, becoming a reliable mode for transporting various goods, including raw materials (Rossi et al., 2023). IWWs are vulnerable to climate change as river navigation depends on water levels.
The droughts of 2018 and 2022 illustrate the significant consequences that low water level extremes can have on transport navigation (Mühr et al., 2018). In 2018, Europe experienced an extended period of high-pressure systems, causing extreme temperatures across the continent. Germany, in particular, saw a devastating combination of extremely high temperatures and minimal precipitation, amplifying the damage to its transport infrastructure (Mühr et al., 2018). This event, unprecedented in both heat and dryness, caused major disruptions, especially to river shipping (Zscheischler and Fischer, 2020). On the Rhine River, ships could only travel partially loaded due to the low water levels, resulting in interruptions in the logistics chain and an economic loss of EUR 2.7 billion in Germany and the Netherlands (Streng et al., 2020) (Table A5 in Appendix A). In 2022, Europe once again experienced a similar drought and its consequences due to low water levels (Bevacqua et al., 2024).
These events led to severe disruptions in commercial navigation across multiple European waterways, temporarily hindering the delivery of bulk and container goods (Vinke et al., 2024; Rossi et al., 2023). The sectors and companies dependent on IWWs are those most likely to suffer economically from low-flow events (Rossi et al., 2023). This comprises a variety of critical industries, since it does not only affect transportation of industrial goods but also of raw materials such as coal, metal ores and refined petroleum products. Moreover, interrupting the supply chain for these goods can substantially disrupt industrial production and indirectly affect economic sectors and segments of society well beyond the geographical extent of the river areas. The average annual amount of transported goods across Western, Central and Eastern Europe has been lowered as a consequence of droughts (Rossi et al., 2023).
The European Drought Risk Atlas presents the risk analysis outcomes under present climate conditions in terms of both average annual loss, and the anticipated loss occurring on average once every 50 years. Loss is measured as the relative decrease in transported goods, indicating the percentage reduction compared to the expected amount of goods transported annually for each country (Rossi et al., 2023). Average annual loss of transported goods in relation to expected transportation is quite homogeneous in the countries considered: less than 2.5 % except for Poland and Croatia which experience an average annual loss of 2.5 %–5 %. However, as countries are interlinked through the river network, bottlenecks in individual countries may affect riparian countries. When considering only a rare drought event, which is expected to occur only once every 50 years, losses increase to substantial fractions, especially in Eastern European countries (Rossi et al., 2023).
Floods, often caused by heavy rainfall or snowmelt, can lead to suspended navigation, delays, vessel damage from driftwood (e.g., to propulsion devices), and changes in river and bank morphology (Schweighofer, 2014). The impact on infrastructure and protected areas is generally more severe than on waterway transport itself, damaging or clogging navigation signs, gauges, ramps, and port areas, and flooding protected zones. Navigation suspension usually lasts only a few days per year but can extend longer, depending on the waterway (Schweighofer, 2014). Generally, wind does not constitute a significant obstacle to inland waterway transport. Most inland vessels are sufficiently wide and stable in order to cope with strong winds. Nevertheless, locally wind speeds may attain high values hindering navigation (Schweighofer, 2014). Heatwaves can lower water levels and affect the structural integrity of the infrastructure, affecting inland waterway navigation. Wildfires, can damage infrastructure, and create safety risks for vessels and crews, especially near ports and riverbanks. Droughts can severely disrupt inland navigation services by reducing water levels either to completely non-navigable ones or to levels that oblige operators to reduce vessel load. This results in a temporary interruption of the supply chain of industries dependent on IWWs.
3.1.4 Railways and roads
Climate extremes can lead to severe infrastructure damage to railways and roads, causing disruptions and delays in transportation services (Palin et al., 2021; Kasraei et al., 2024). Interruptions and damages due to heatwaves, floods and wildfires became more frequent in recent years for these two transport modes (Haghighi et al., 2025b; Leviäkangas et al., 2014) (Table A3).
Extreme heat can impact roads and railways causing, for instance, cable melting and pavement and track deformities due to heat-induced expansion, leading to issues such as asphalt rutting and rail track buckling (Nemry and Demirel, 2012). Heat stress can thus lead to structural damages, reducing the lifespan of roads and railways and necessitating more frequent maintenance and repairs (Dobney et al., 2009). Drought can have serious impacts on the functionality of the soils since by causing strong structural destabilization and associated geotechnical problems (Quintana et al., 2023). When soils become desiccated due to low moisture, they contract, compromising the frictional bond. As soils swell and shrink, they can stress and damage buildings and other structures that they support, such as roads (Harrison et al., 2023), bridges, and railways (Wang et al., 2016; Sánchez et al., 2014). A direct effect is the warping and cracking of highways' pavement. Railway tracks built on expansive soils, such as clay, can be particularly affected by prolonged drought, lack of precipitation, and soil moisture variations. These conditions may lead to reduced permeability, desiccation, desiccation cracking, and swell-shrink behavior. Consequently, the track structure can experience instability, and settlement problems (Haghighi et al., 2025a). Moreover, landslides triggered by flash floods can be intensified if a drought precedes the event, as it weakens vegetation and reduces soil cohesion (Alcántara-Ayala, 2025; Palin et al., 2021). Prolonged dry conditions also reduce soil moisture, lowering pore-fluid pressure and creating infiltration pathways that accelerate water percolation, ultimately destabilizing the slope (Handwerger et al., 2019).
Under dry and hot conditions, the risk of forest fires and roadside fires increases (Ma et al., 2024). When a fire occurs near railway lines, train traffic can be disrupted or even temporarily interrupted. Nezval et al. (2022) found that in the vicinity of an electrified railway line there is more than 4 times higher chance that a vegetation fire occurs than near a non-electrified line. The risk is also higher for sections of the rail network located within railway station perimeters or intensively used by freight traffic. The occurrence of vegetation fires near railway lines is exacerbated by warming weather conditions, with a 1 °C increase in the 10 d average air temperature raising the probability of a vegetation fire by 26 % (Nezval et al., 2022).
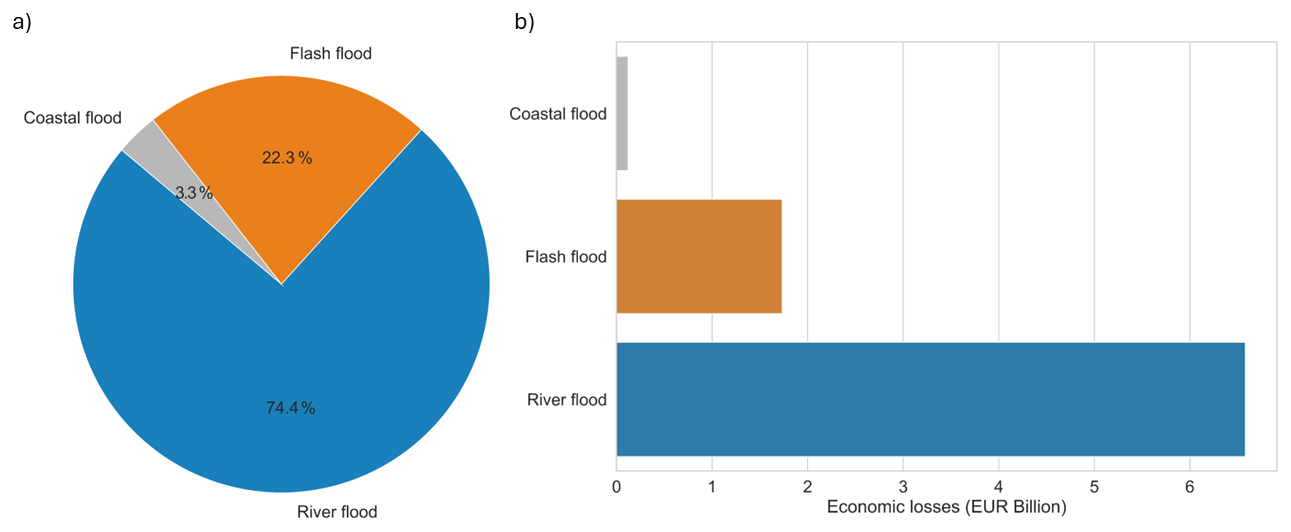
Figure 5 Economic losses reported on DRMKC-Risk Data Hub for railways and roads for Europe due to flooding, during the period 2010–2022. In (a) piechart with the type of extreme event and in (b) the associated economic losses in EUR billion.
Changing precipitation patterns contribute to soil instability, threatening the foundations of roads and railway tracks. Increased heavy precipitation can trigger landslides and erosion, further compromising the integrity of transportation infrastructure (Schlögl and Matulla, 2018). Flooding also poses a substantial threat by eroding road foundations and railway tracks and causing landslides that obstruct both modes of transportation (Chen and Wang, 2025). Extreme precipitation and consecutive floods can cause extensive road and rail infrastructure damage. For example, in July 2021 a flood event affected Germany and the Benelux countries. In Germany, road and railway infrastructure suffered severe damage, with over 130 km of motorway closed, and an overall cost estimated between EUR 700 million and EUR 2 billion (Koks et al., 2022). In Belgium, 10 km of railway tracks and 3000 sleepers required replacement, with costs estimated at EUR 30–50 million. In the Netherlands, damages included highway closures and railway infrastructure damage due to lower flow velocities (Koks et al., 2022).
According to the DRMKC database, between 2010 and 2022, EUR 8.44 billion losses were reported for railways and roads due to river floods, coastal floods, and flash floods. Italy, France, and Spain have experienced the highest number of events, while Germany has reported the highest economic losses reported. Most of the losses have been attributed to river floods (74.4 %) followed by flash floods (22.3 %) (Fig. 5).
In addition to infrastructure damage and service interruptions, extreme events are causing severe health impacts for passengers and other users (Sami and Keith, 2023). High temperatures can lead to technical and electrical issues that halt trains, as well as stoppages due to wildfires on the tracks (Nezval et al., 2022). In recent years, cases of passengers stranded on trains for hours have become increasingly common. In many cases, health impacts are exacerbated by the failure of air conditioning systems, often requiring the involvement of emergency services, the distribution of water, and, in severe instances, hospitalizations due to heat exhaustion (Burgen, 2022; Rimi, 2022).
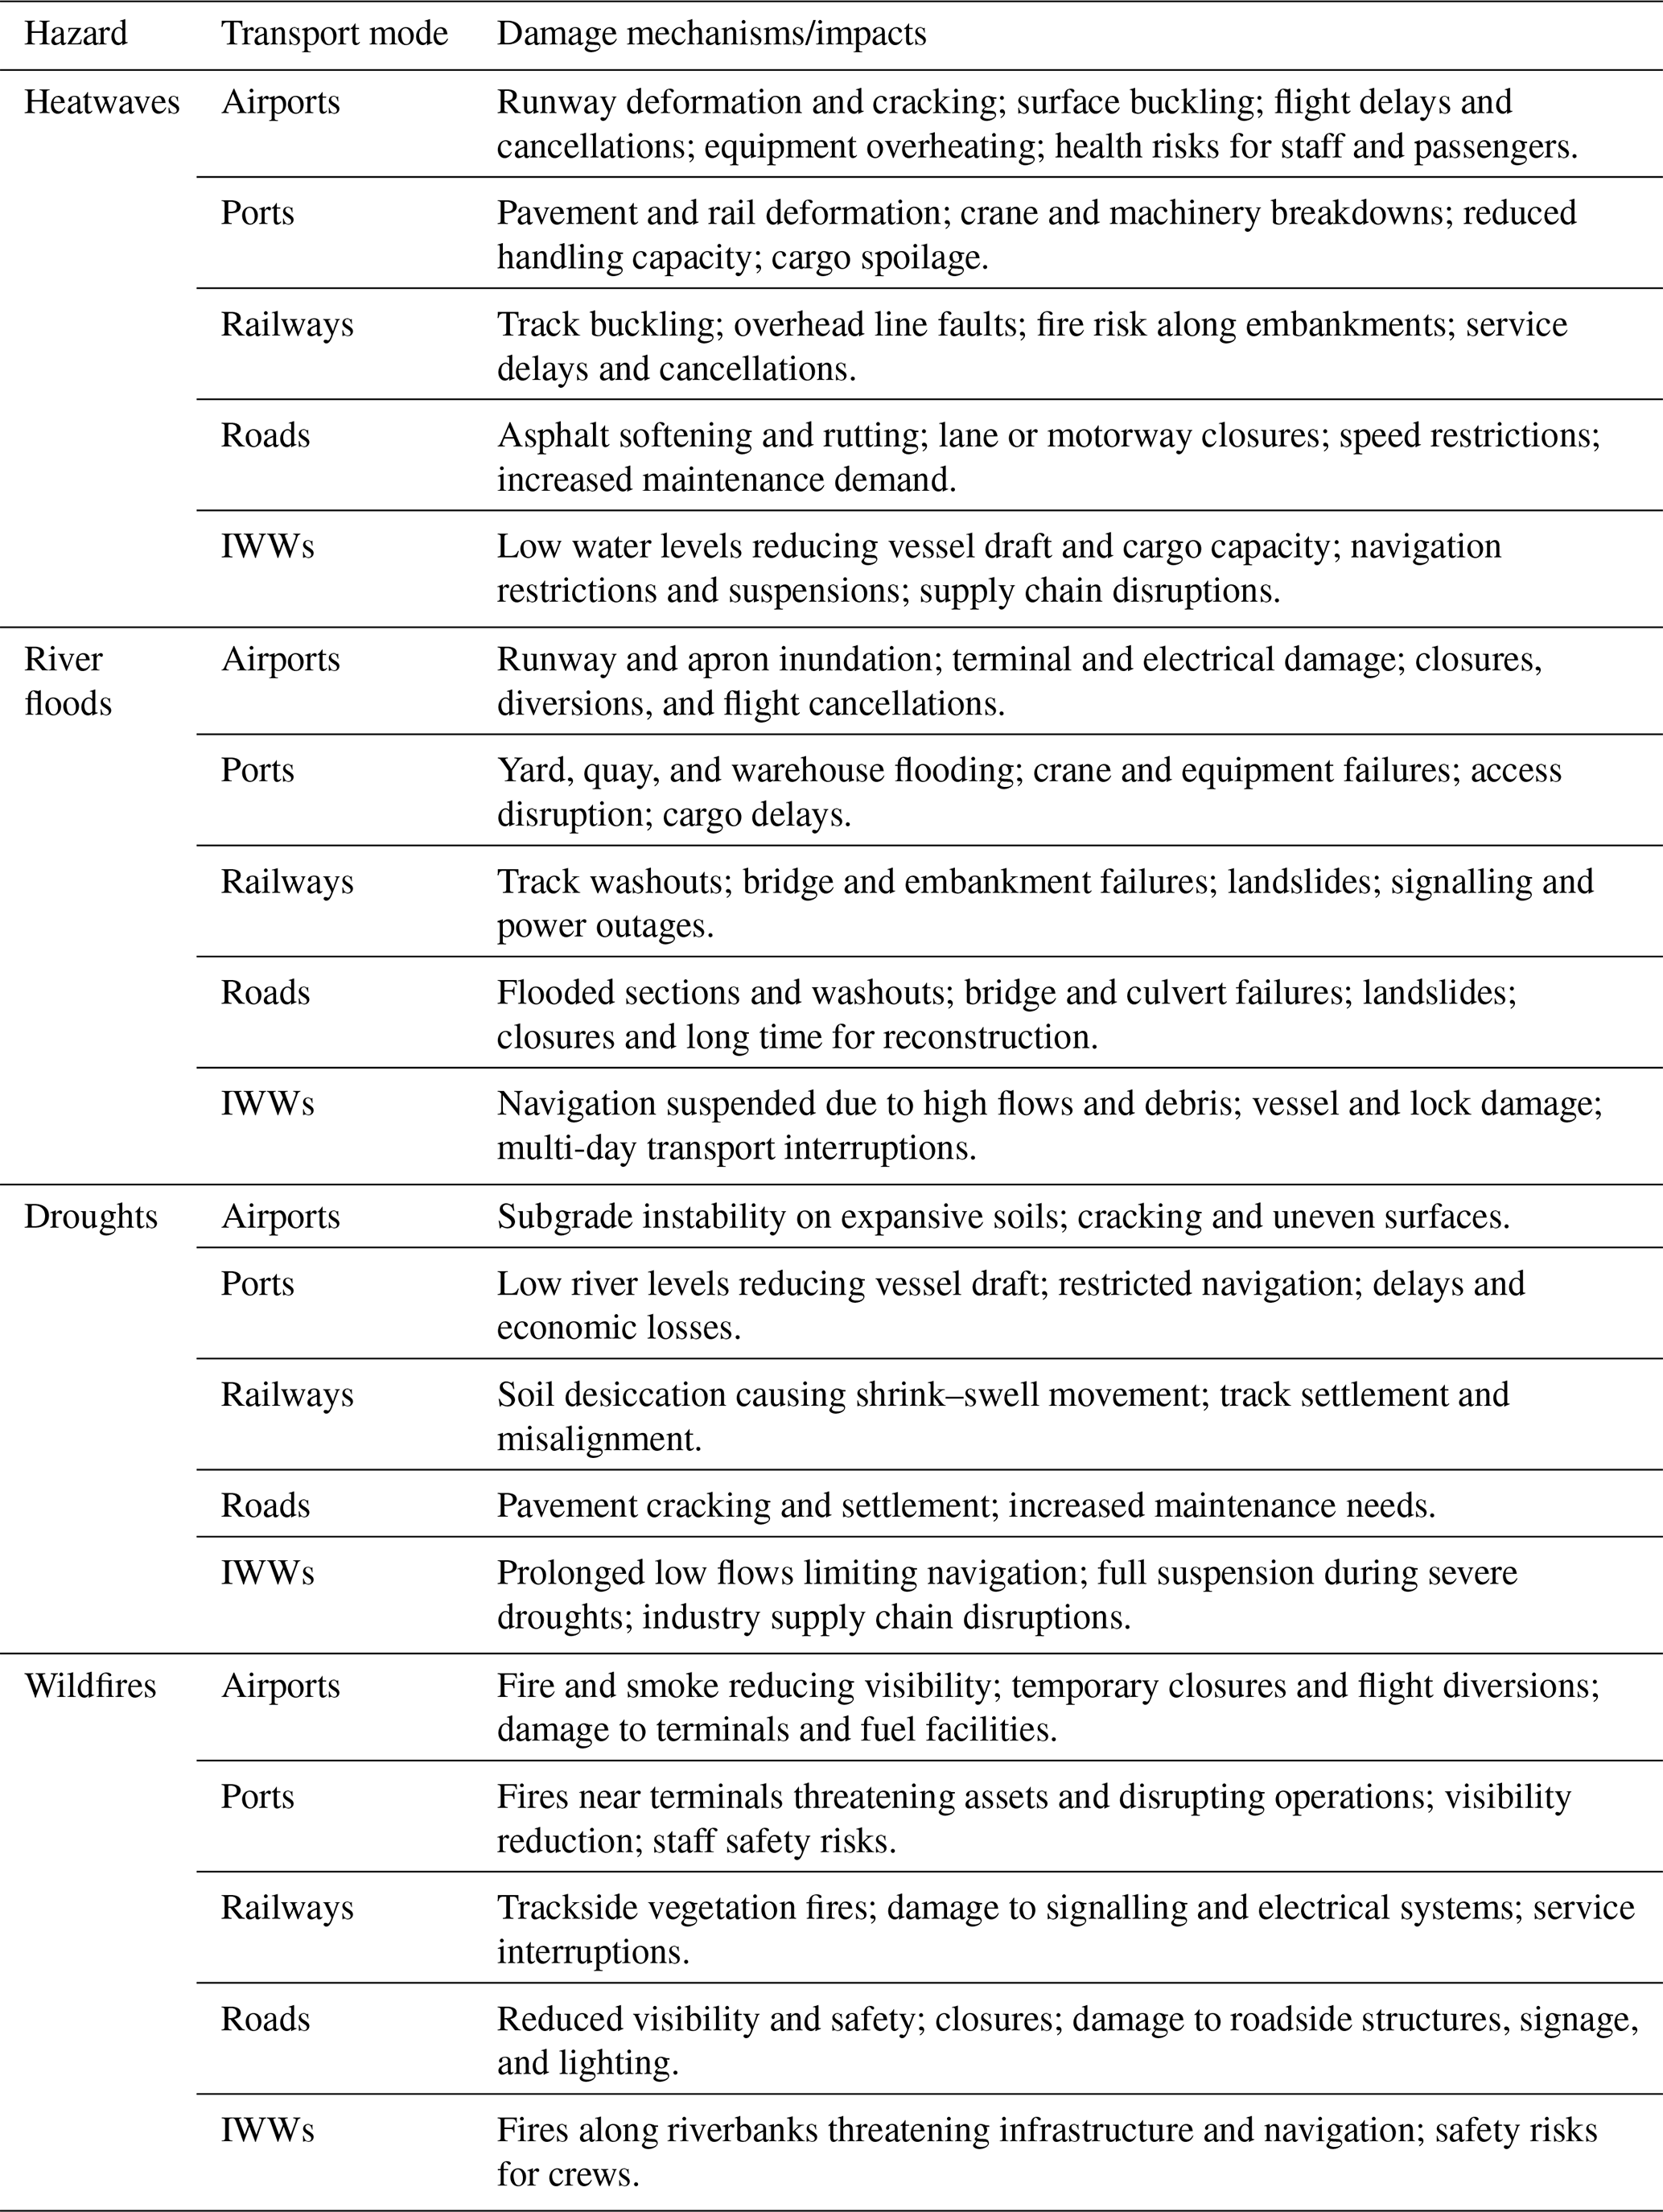
Table 3Summary of reported impacts of key climate hazards on transport infrastructure and operations. Examples of recent extreme events with specific impacts and economical losses are provided in Appendix A, for airports (Table A1), ports and IWWs (Table A2), and railways and roads (Table A3). The reported impacts of flash floods, coastal floods, landslides and windstorms, hazards not included in the projections analysis, are also summarized in Table A4.
3.2 Future exposure of transport infrastructure
From the literature and database review of impacts and costs over the last decade, it emerges that transport infrastructure is highly vulnerable to river floods, droughts, heatwaves, and wildfires (Table 3). Coastal floods and windstorms also contribute to extensive damage to transport infrastructure, as well as flash floods and landslides (Table A4). Coastal flooding is expected to rise substantially due to sea-level rise combined with storm surges, tides, and wave extremes, with particularly high exposure along Northern European coasts (Christodoulou et al., 2019). Future changes in windstorms are expected to be small but remain uncertain (Arias et al., 2021); however, some regions, especially the Mediterranean, may experience more intense cyclone-related winds and compound wind-rain events (Reale et al., 2022). Projecting the future occurrence of landslides and flash floods is challenging, but evidence suggests they are likely to increase in some parts of Europe (Marra et al., 2024), mainly driven by projected extremes of heavy and short-duration precipitation (Li et al., 2024). Due to the complexity of modelling these hazards in a manner consistent with the rest of our analysis, we discuss their future projections based on evidence from the scientific literature (see Sect. 4.2.2).
Hereafter we project the exposure of European transport infrastructure to each of these four climate extremes, by computing the Exposure Multiplication Factor (EMF) for each transport infrastructure element from an ensemble of ISIMIP impact models (see Methods in Sect. 2.2.2). The results highlight an increase in occurrence of the different climate extremes by mid-century (2040–2069) and the end-of-century (2070–2099) climates relative to historical conditions (1980–2009) for the RCP (Table 4, Figs. 7, 9, 11, 13). For some climate extremes, the increased exposure projections can reach high values locally, such as 15 times more likely for wildfires and droughts. Yet the highest EMF-values are obtained for heatwaves: some parts of the TEN-T network are projected to experience up to 20 times as many heatwaves by mid-century relative to the historical conditions. For river floods the increase in exposure is smaller.
Already a large part of the TEN-T network is expected to be exposed to heatwaves, wildfires and droughts by the middle of the century (Fig. 6).
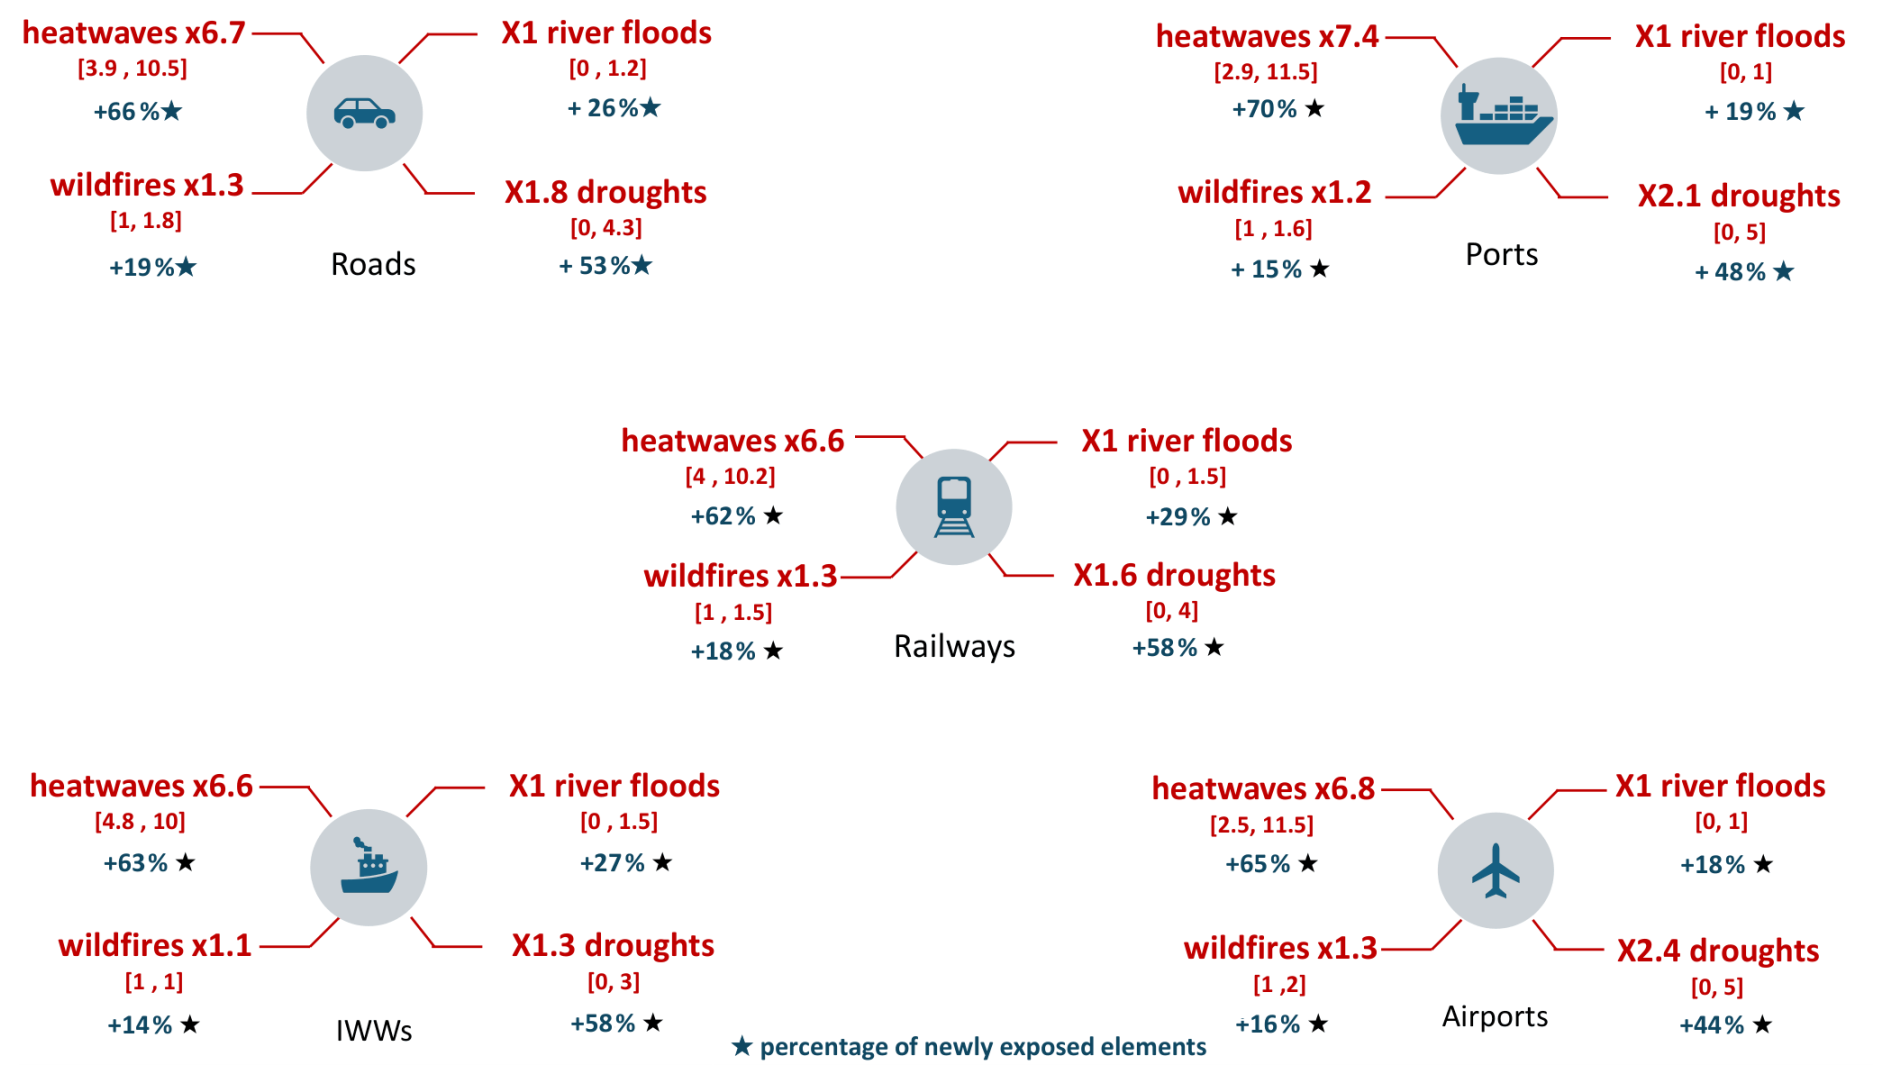
Figure 6 A schematic representation of all combinations among transport modes and hazards, illustrating the spatial variability of the multi-model ensemble median Exposure Multiplication Factor (EMF) values across Europe. The numbers in bold represent the mean values of increase in exposure by mid-century (2040–2069) over the already exposed network in the historical period (1980–2009), along with the 10th and 90th percentiles in bracket. Marked with a star are the percentages of newly exposed elements that had no historical exposure but are projected to experience at least one event in the future period.
For hazards such as heatwaves and droughts, the increase in exposure is more widespread across the entire European network, affecting more than 70 % of the total network. In contrast, for more localized hazards like river floods and wildfires, the increase in exposure is less spatially widespread, although an increase is still evident for more than 20 % of the network (EMF >1 in Table 4), with localized peaks of EMF in specific regions. The Mediterranean region could face the strongest increase in number of heatwaves and wildfires across Europe (Figs. 7, 9).
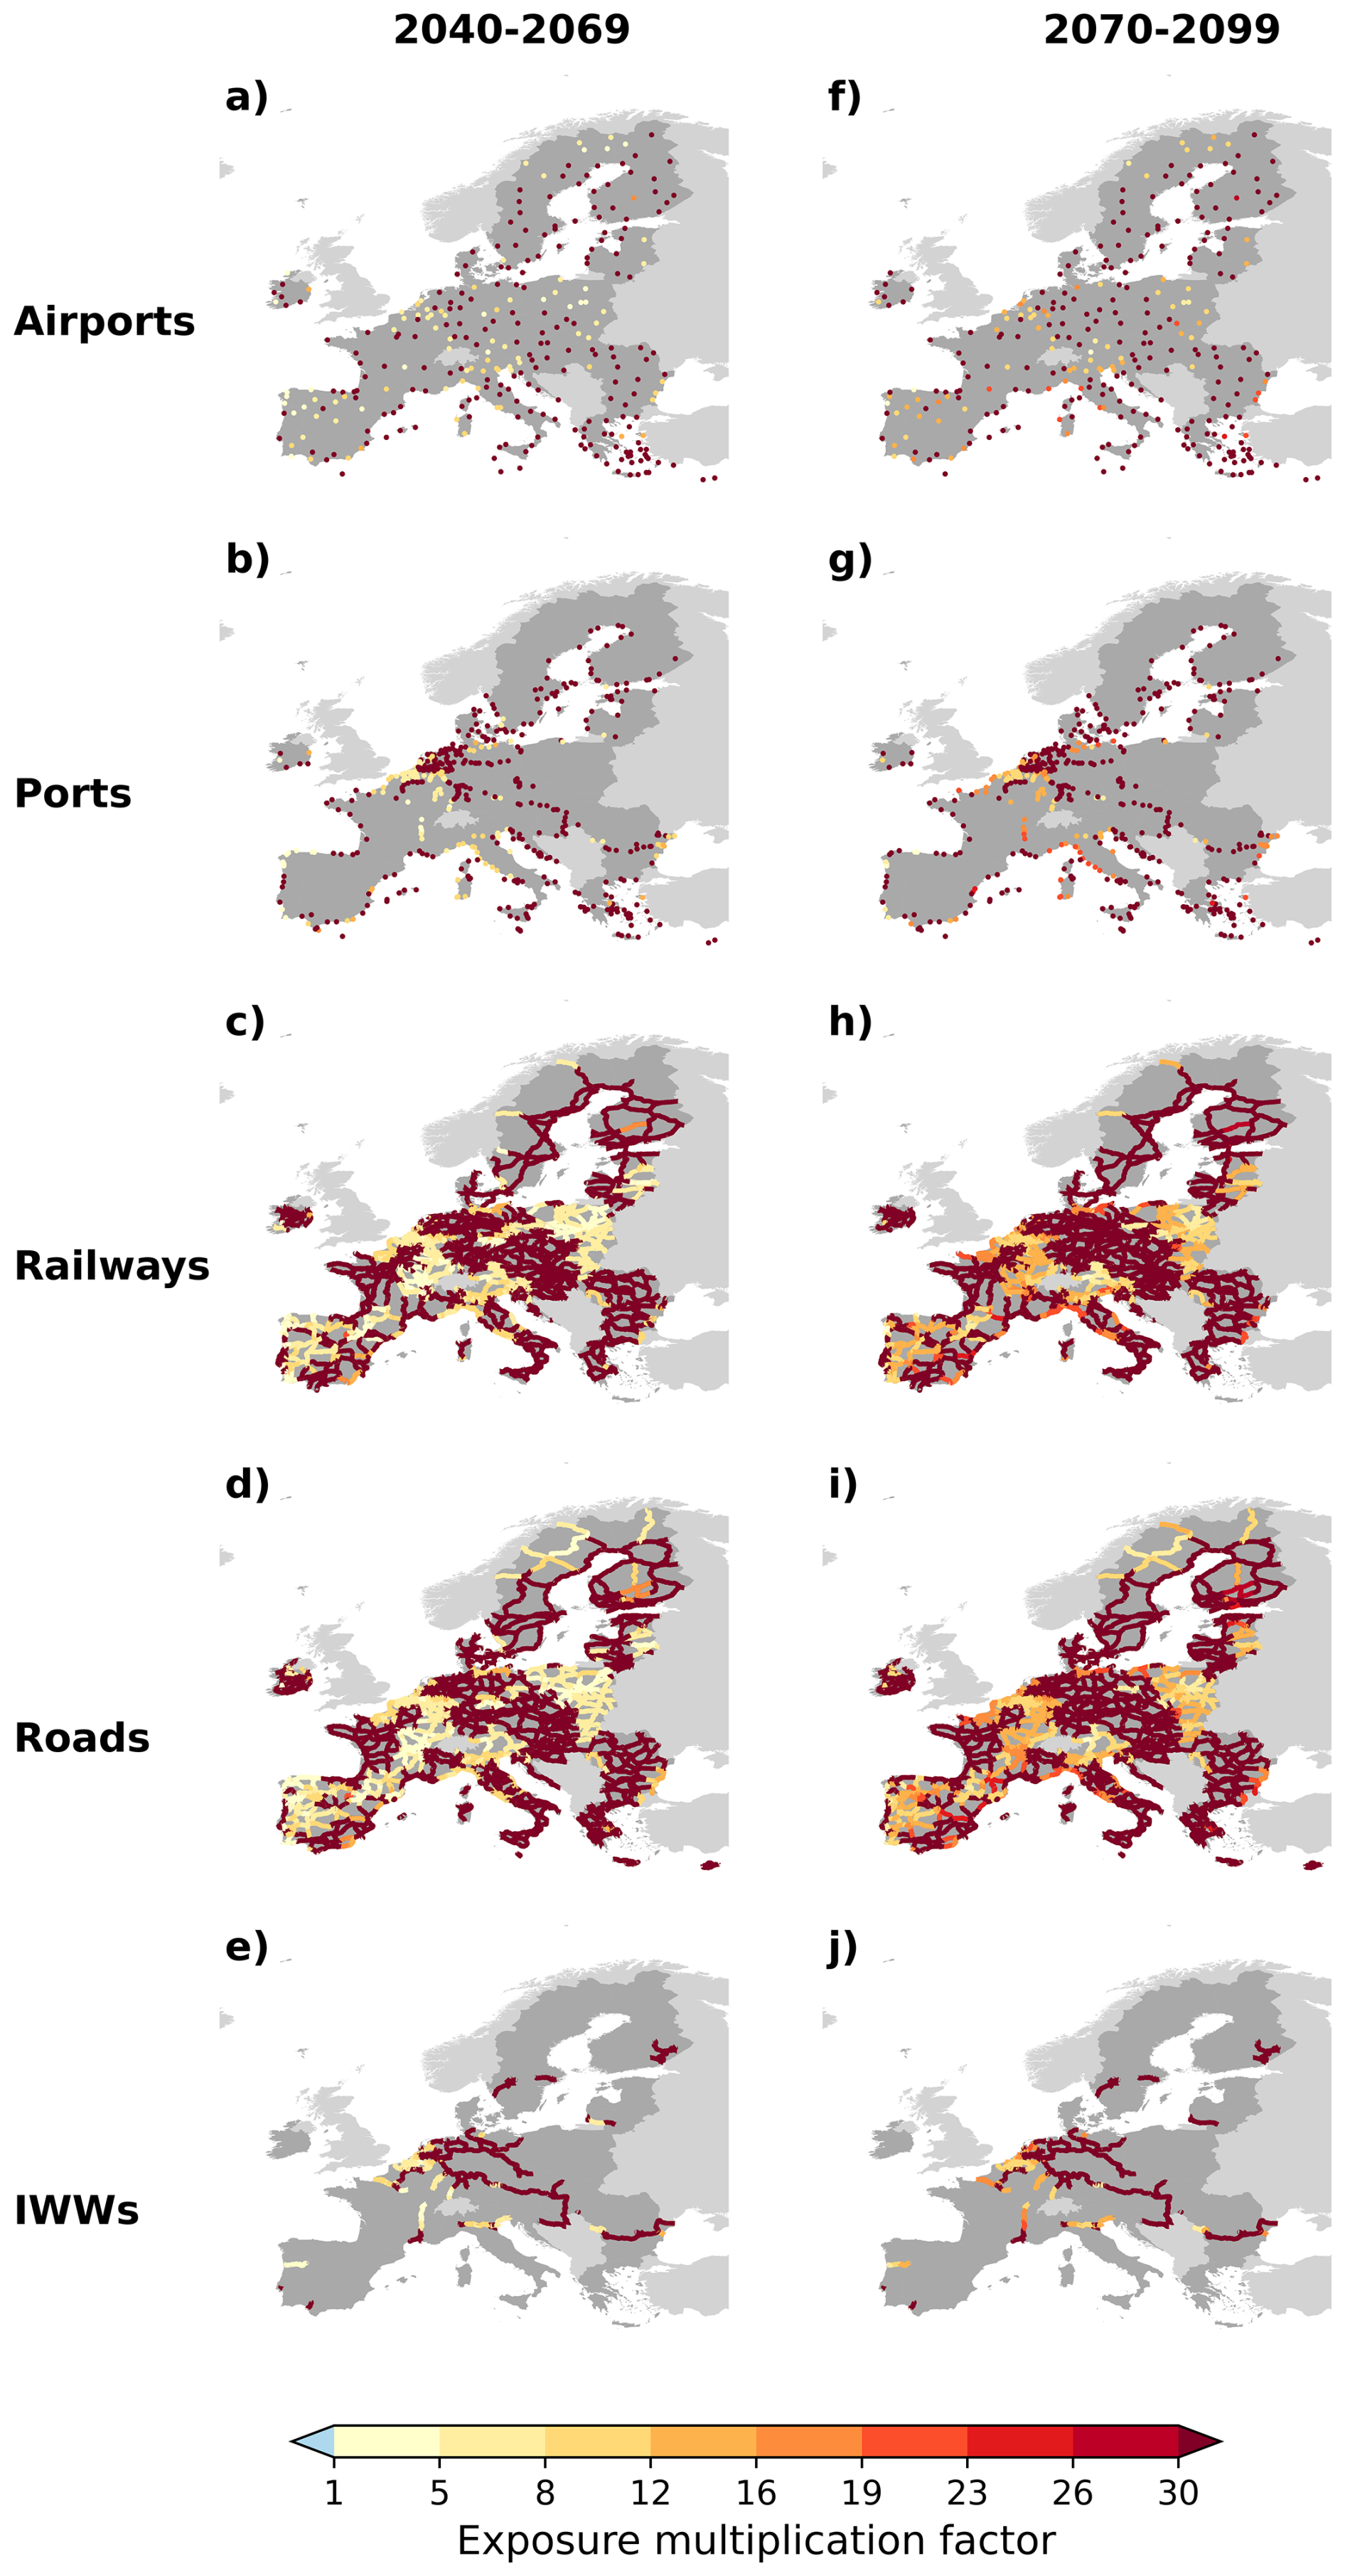
Figure 7 Maps of multi-model ensemble median Exposure Multiplication Factors by mode (rows) on the TEN-T to heatwaves by the middle (2040–2069) and the end of the century (2070–2099) (columns) relative to historical climate conditions (1980–2009) under a medium-high emissions scenario (RCP6.0). The multi-model ensemble median is computed across all available combinations of impacts models and GCMs.
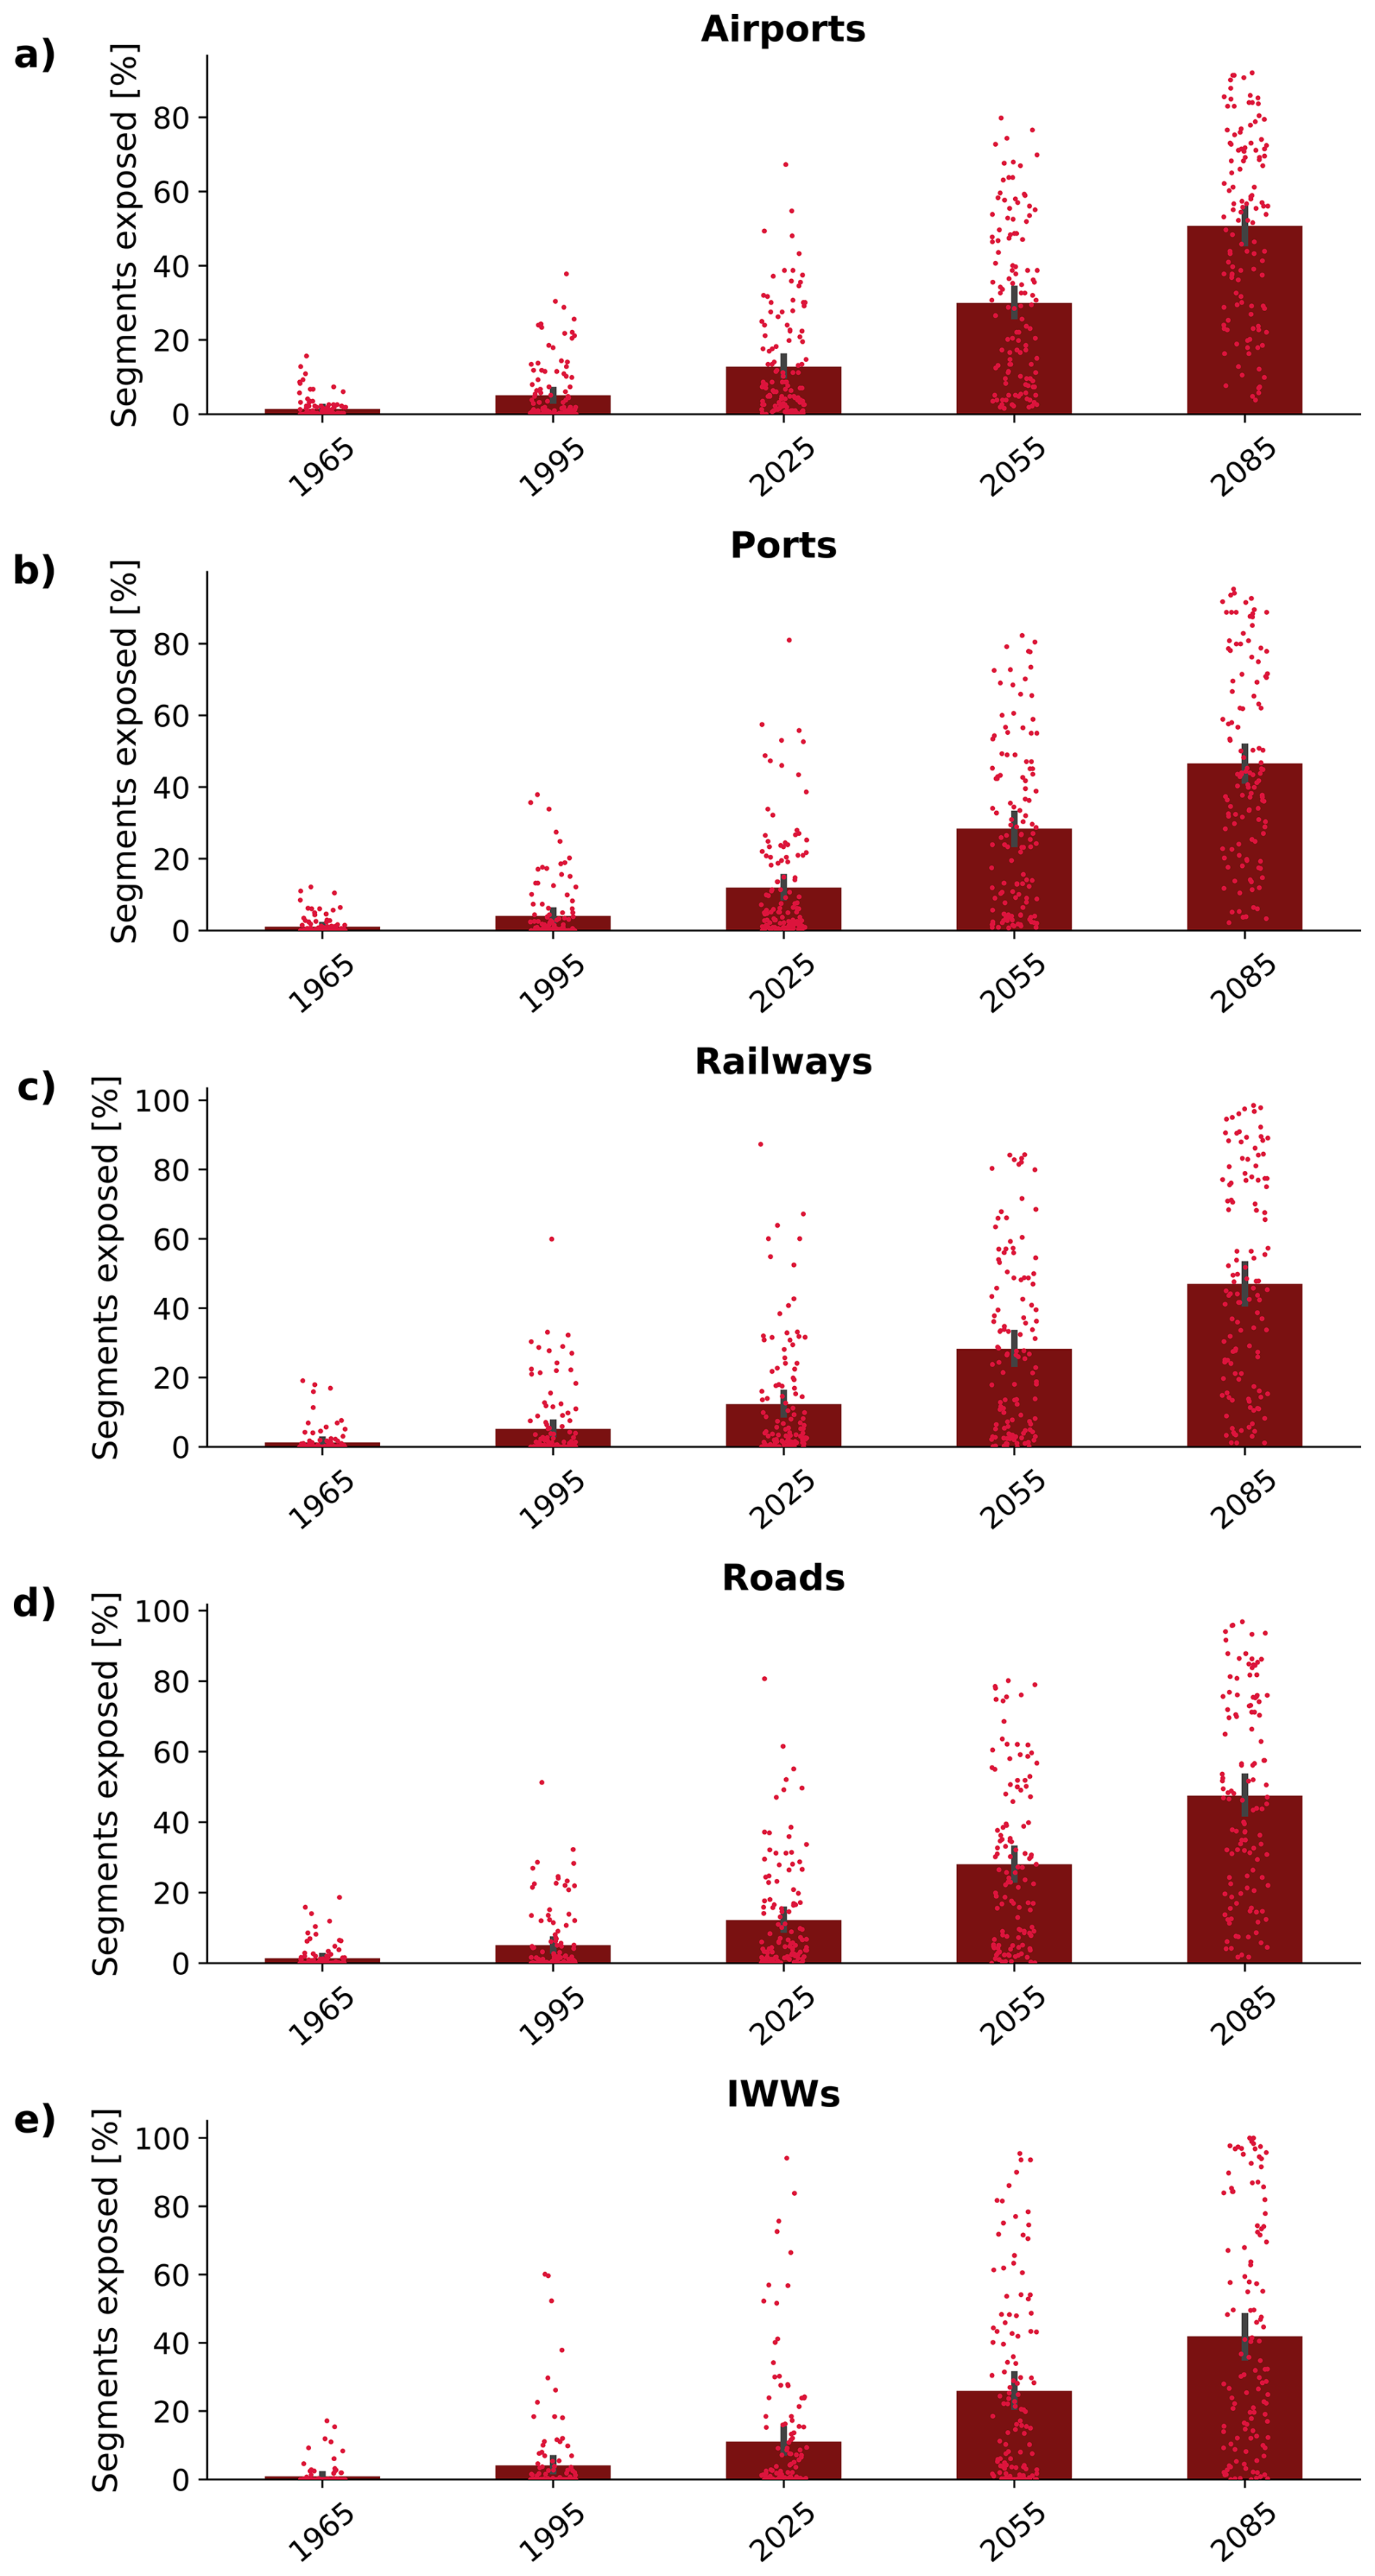
Figure 8 Percentage of European transport elements exposed to heatwaves over time under a medium-high emissions scenario (RCP6.0). The bar plot shows the mean percentage of exposed transport elements computed by pooling all annual values across all GCM-impact model simulations within each 30-year window. The black error bar denotes the 95 % bootstrap confidence intervals for the mean. Each dot represents the percentage of exposed segments for a single GCM-impact model pair, based on the number of transport elements in each grid cell projected to experience exposure. The year on the x-axis denotes the central year of a 30-year window (e.g., 1965 represents 1950–1979).
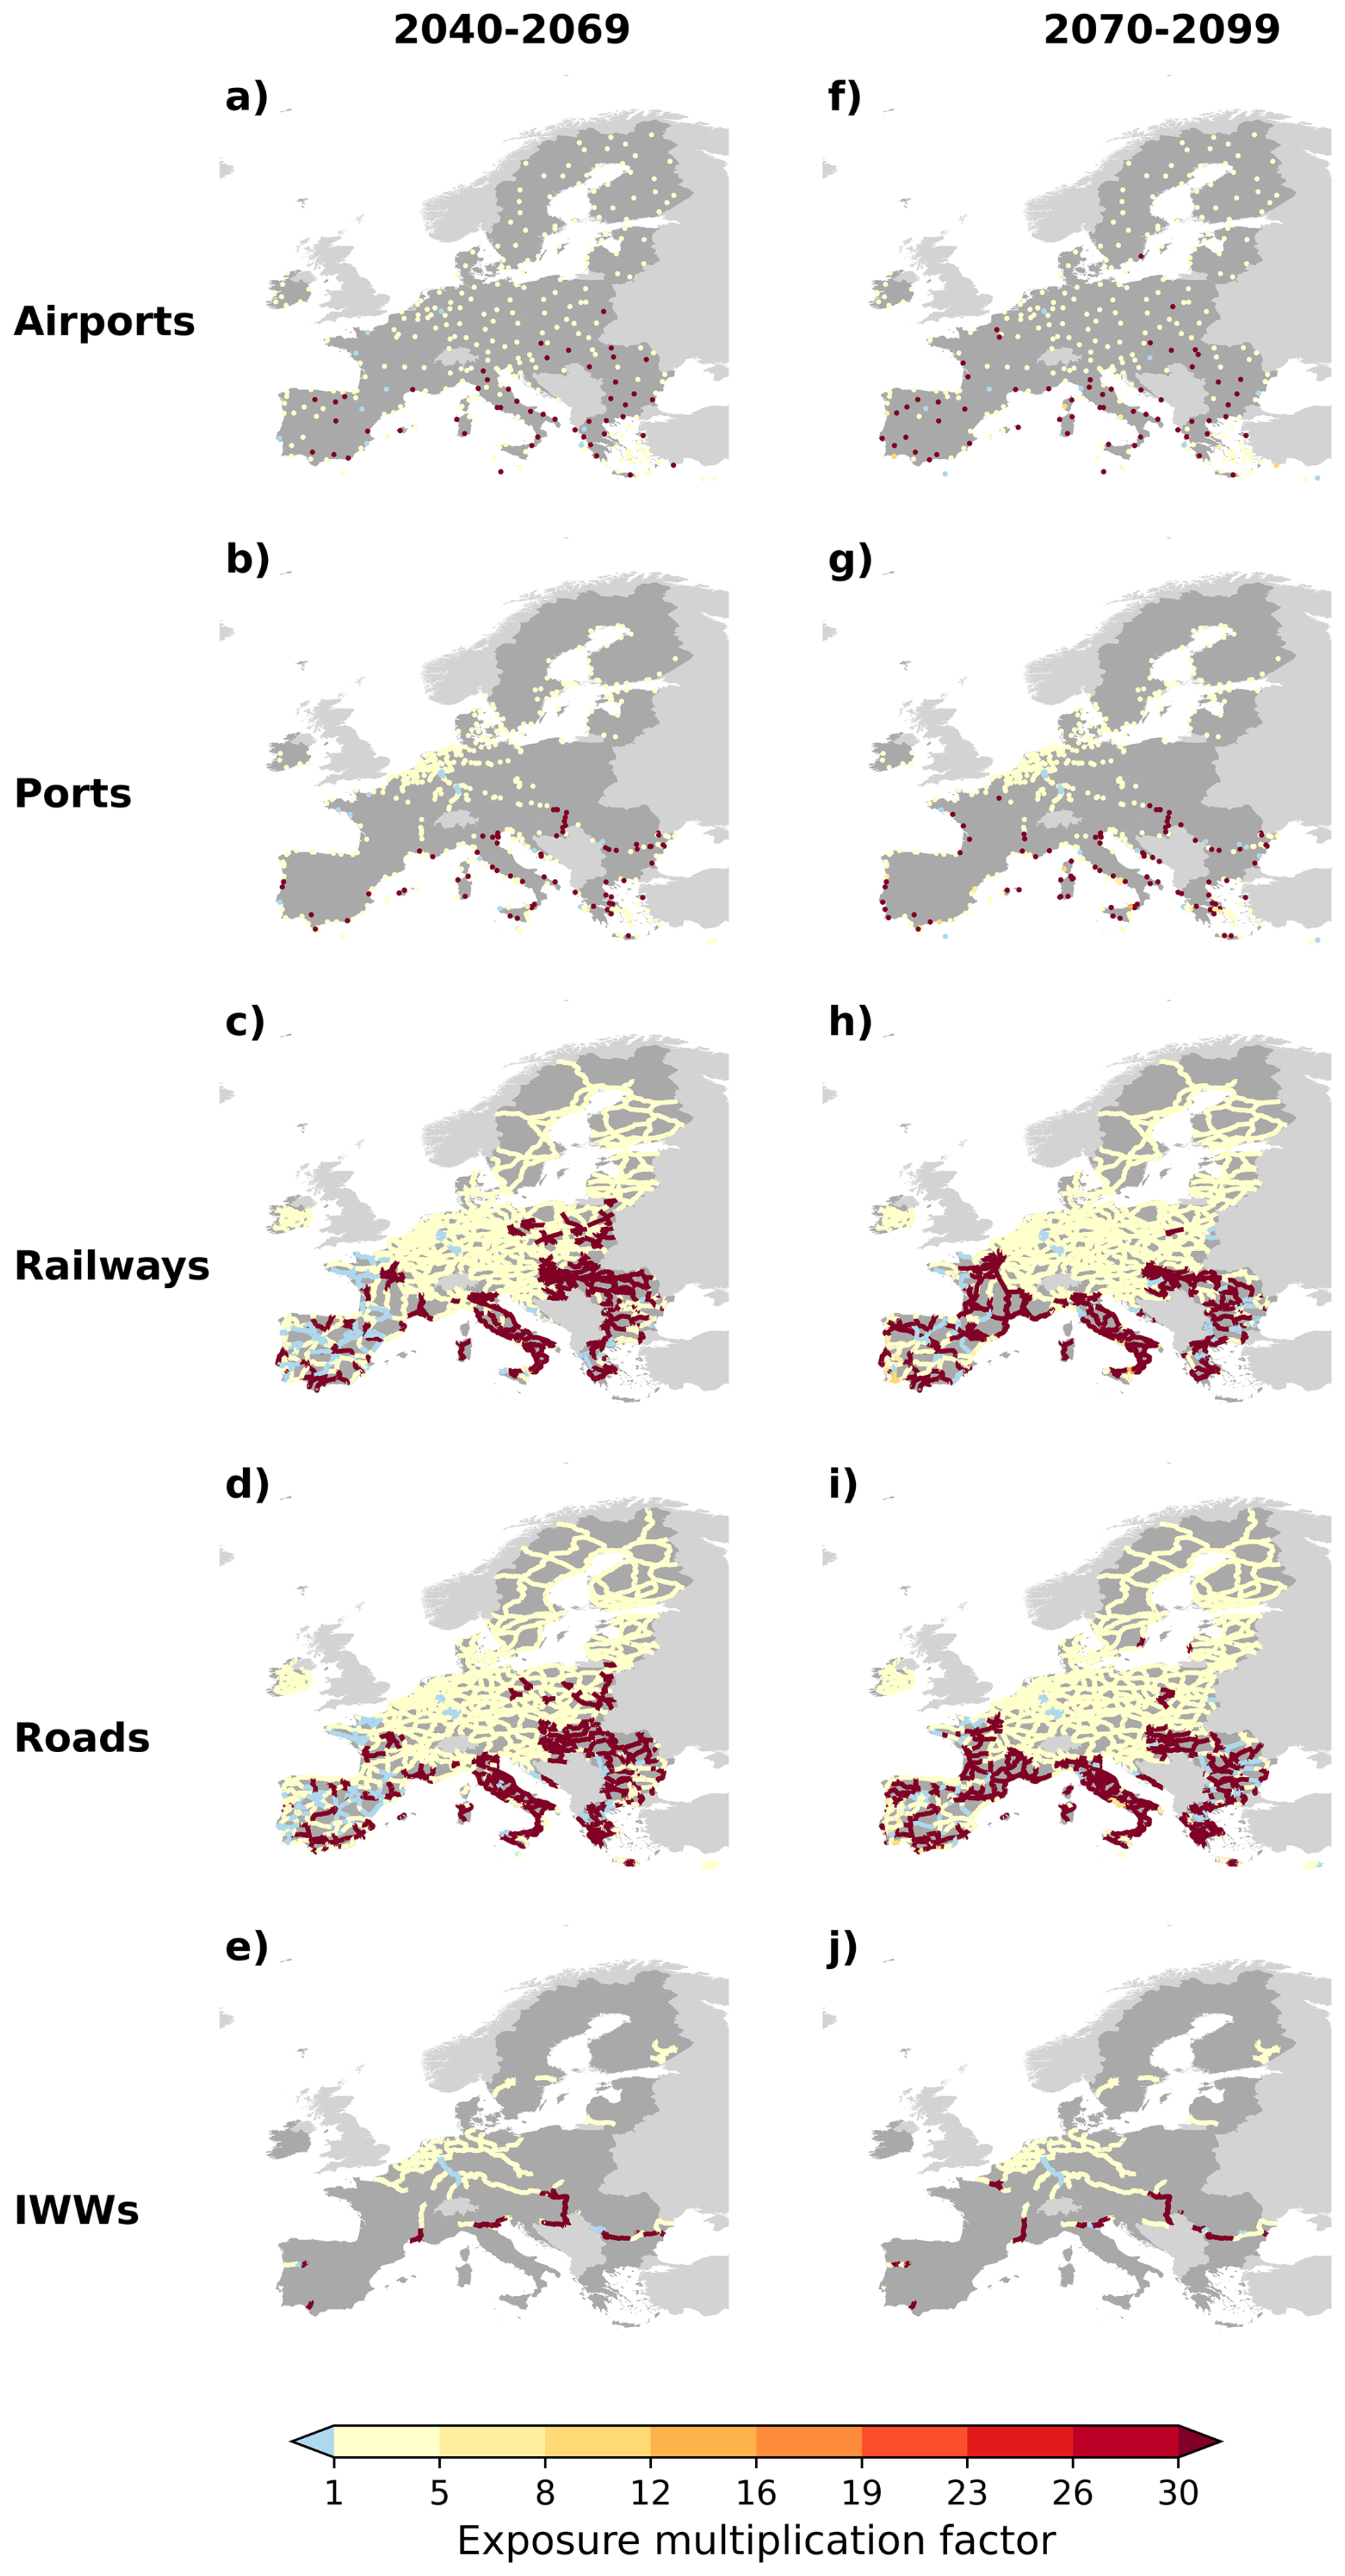
Figure 9 Maps of multi-model ensemble median Exposure Multiplication Factors of the TEN-T by mode (rows) to wildfires by the middle (2040–2069) and the end of the century (2070–2099) (columns) relative to historical climate conditions (1980–2009) under a medium-high emissions scenario (RCP6.0). The multi-model ensemble median is computed across all available combinations of impacts models and GCMs.
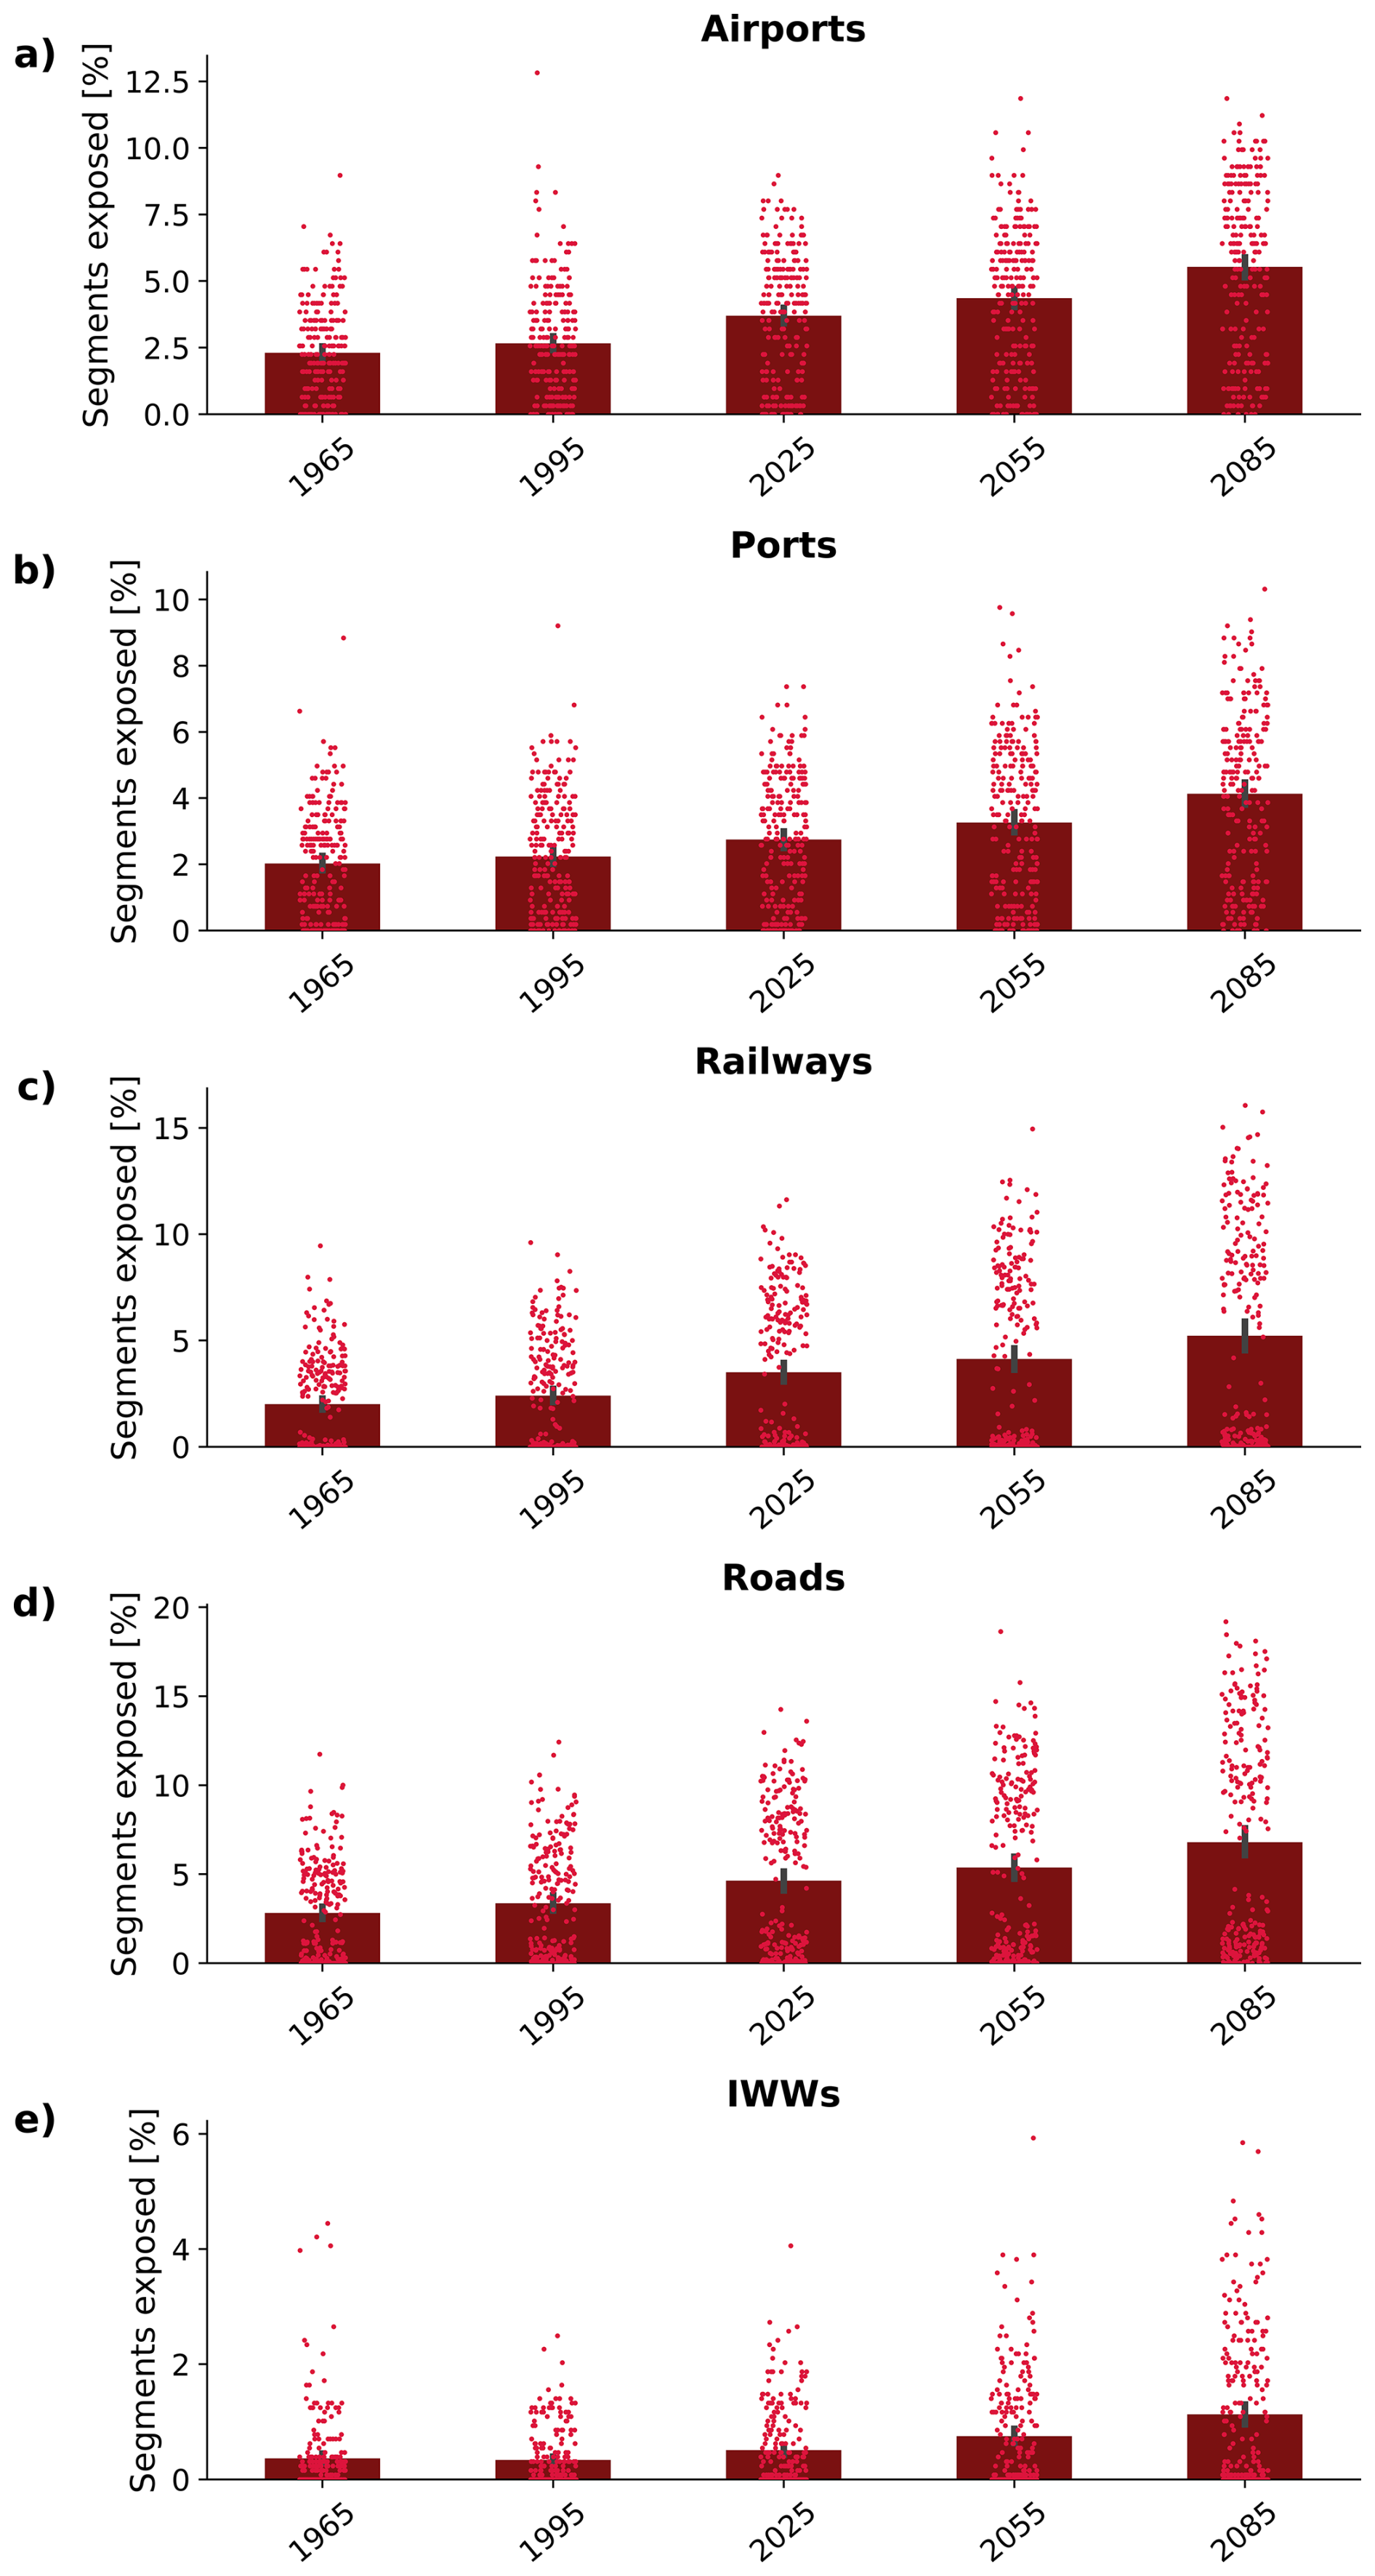
Figure 10 Percentage of European transport elements exposed to wildfires over time under a medium-high emissions scenario (RCP6.0) The bar plot shows the mean percentage of exposed transport elements computed by pooling all annual values across all GCM-impact model simulations within each 30-year window. The black error bar denotes the 95 % bootstrap confidence intervals for the mean. Each dot represents the percentage of exposed segments for a single GCM-impact model pair, based on the number of transport elements in each grid cell projected to experience exposure. The year on the x-axis denotes the central year of a 30-year window (e.g., 1965 represents 1950–1979).
We obtain the following results for the individual climate extremes (see also Table 4):
-
Heatwaves. Heatwaves represent the hazard category with the highest projected increase in occurrence across all transport modes.
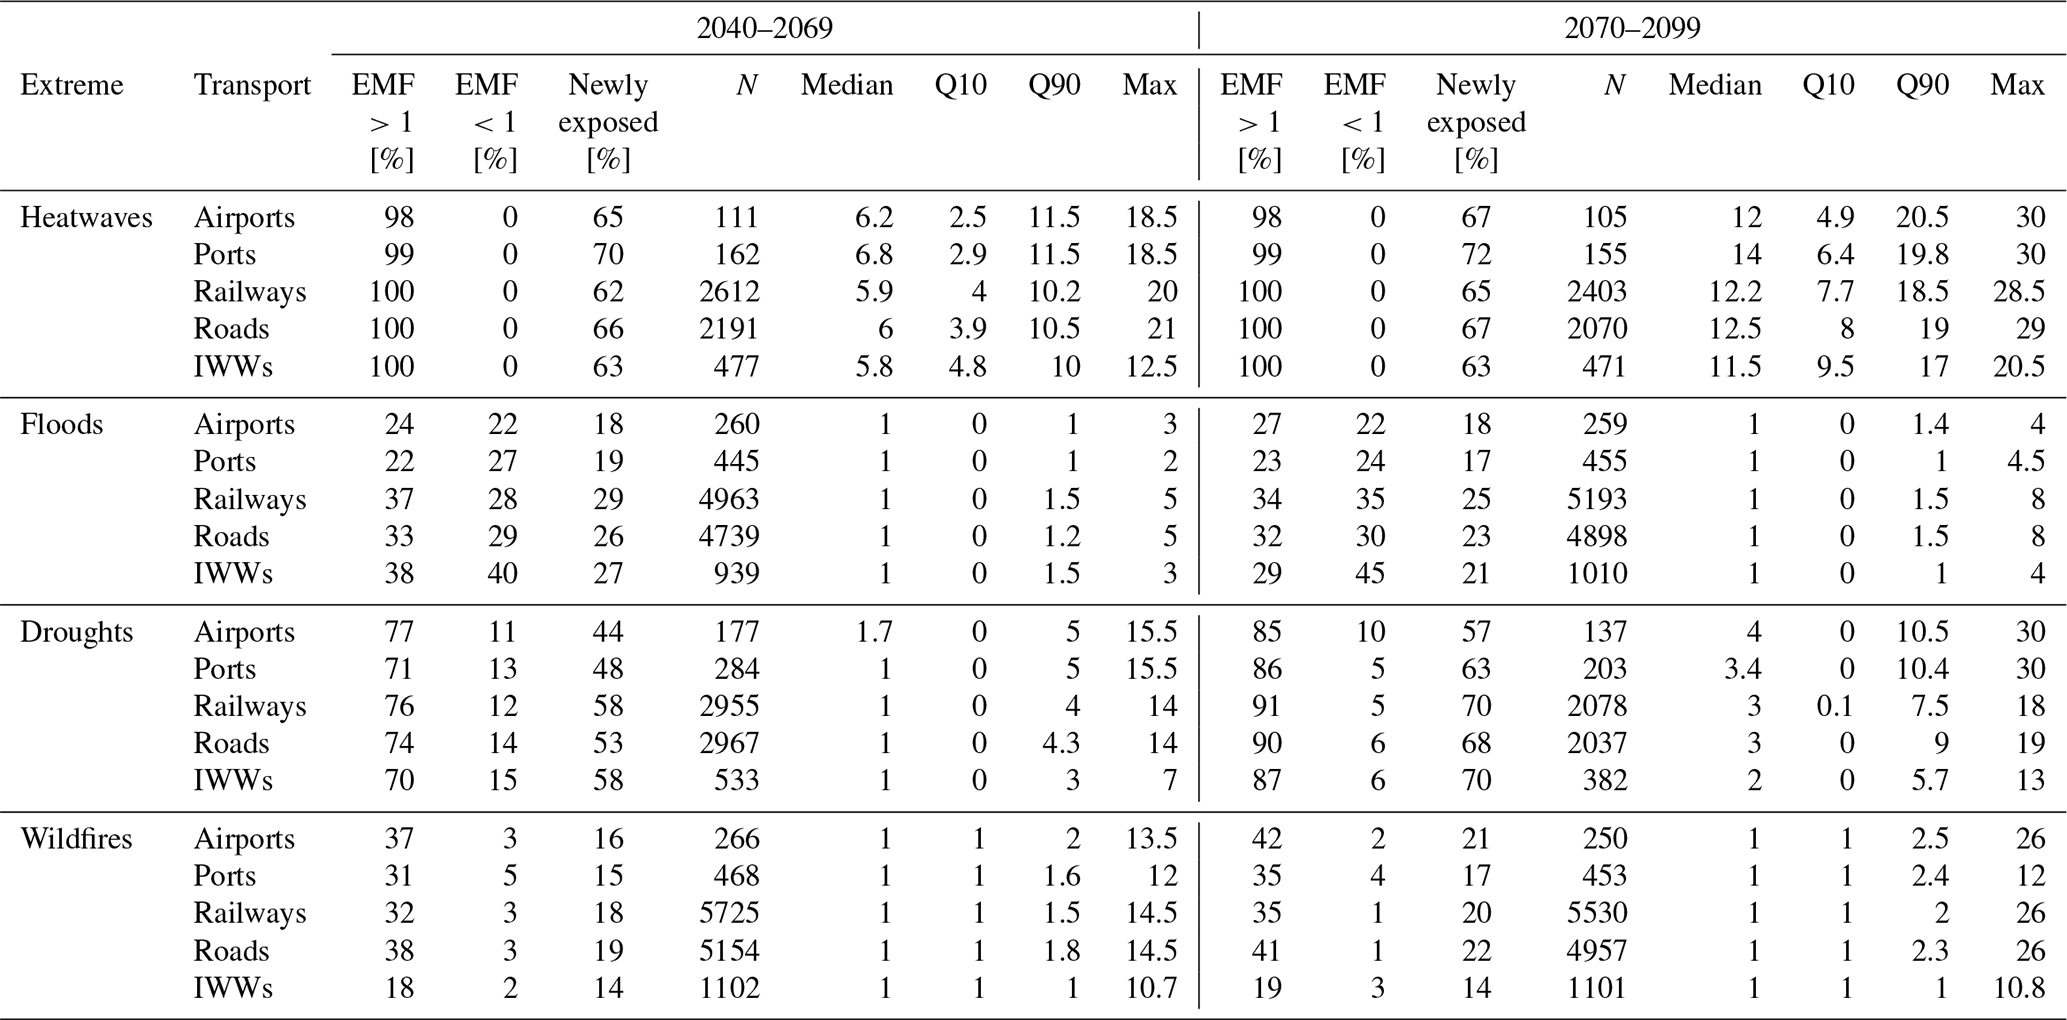
By mid-century (2040–2069), all transport modes across the European network are projected to experience more extreme heatwaves under RCP6.0, with 98 % of the respective networks expected to face an increasing in exposure with respect to the historical period (1980–2009) (Fig. 7a–e). Up to 60 % of the network is projected to be exposed to such events for the first time (percentage of the network with an EMF equal to infinite) already under RCP6.0 by mid-century. At least half of the network that was already exposed to heatwaves under historical conditions is projected to experience up to 7 times as many extreme heatwaves under RCP6.0 by mid-century (Table 4).
By the end of the century (2070–2099), exposure is projected to rise even further under RCP6.0 (Fig. 7f–j). Half of the airports, railways and roads, already exposed in historical conditions, could experience at least 12 times as many extreme heatwaves, while ports are projected to have a median increases by a factor of 14.
The Mediterranean region stands out as the European hotspot with the strongest projected increase in heatwave exposure, with some transport elements in this regions facing as much as 30 times as many heatwaves by the end of the century (Table 4f–j). This underscores the rapid escalation of heatwave exposure and its potential to impact the majority of the TEN-T network.
The above results are based on the multi-model ensemble median of EMF values over Europe. In a next step, we compute for each climate-impact model simulation the percentage of network elements exposed to at least one event per year. We then calculate the mean percentage across consecutive and non-overlapping 30 years windows, from 1950 to 2099, for each transport mode. The percentage of TEN-T network segments exposed to extreme heatwaves per year is projected to increase strongly over time across all transport modes (Fig. 8). For the period 2070–2099, compared to 2010–2039, the ensemble mean increases in absolute terms by 37.9 % for airports, the largest rise, followed by 34 %–35 % for other transport modes and 30.8 % for inland waterways. In addition to the increase in the ensemble mean for each transport mode, we also find a rise in the 10th and 90th percentiles (Q10 and Q90). Between the two periods, airports show the largest overall changes (+17.1 % and +51.4 %), followed by ports (+13.1 %, +59.3 %), railways (+6.5 %, +56.5 %), roads (+11.0 %, +53.1 %), and IWWs (+2.1 %, +64.6 %).
The consistently higher values of Q90 relative to the mean and Q10 reflect a wider range of extreme outcomes in future simulations with respect to current or past conditions. This means that there is an increasing numbers of models-years combinations that project extremes values. In the time window 2070–2099, 10 % of the simulations project that more than 85 % of the elements would be exposed yearly to heatwaves across all transport modes.
-
Wildfires. Wildfire exposure is projected to increase for 18 %–32 % of transport infrastructure compared to historical levels by mid-century (Fig. 9a–e). In particular, 37 % of European airports are projected to experience an increase in wildfire exposure, with EMF values reaching up to 14 locally. Furthermore, 16 % of airports and 15 % of ports could become exposed for the first time (Fig. 9a). An high increase in exposure is projected for railways and roads, with 32 %–38 % of the network experiencing higher exposure compared to historical levels by mid-century, and 18 %–19 % of their network could become exposed for the first time (Table 4).
By the end of the century, exposure will grow further. For example, airports, railways and roads are projected to face up to 26 times as many wildfires locally compared to the historical period (Fig. 9f–j), with 20 %–22 % of the network becoming newly exposed. As with heatwaves, the Mediterranean region, particularly Spain and Portugal, as well as Eastern Europe will experience the strongest increases in wildfire exposure.
All climate and impact model simulations consistently agree that TEN-T elements will face increasing wildfire exposure per year over time (Fig. 10). Airports, roads and railways are the mode for which the increase in percentage of yearly exposed elements over time is higher. For the period 2070–2099, compared to 2010–2039, the ensemble mean of the percentages of exposed elements, simulated by climate-impact model pairs, increases in absolute terms by 2 % for railways and roads, the largest rise, followed by 1.7 % for airports, 1.2 % for ports and IWWs. IThe increases in Q10 are close to zero, while for Q90, we observe positive increases up to 5.5 %–6.1 % for railways and roads, 4.1 % for airports and 2 %–3.1 % for ports and IWWs. Thus, as was the case for heatwaves, we also find for wildfires a consistently larger increase for the high tail of the ensemble compare to the mean and the low tail of the ensemble.
-
Droughts. European transport infrastructure is projected to face substantially more droughts under future climate change. By mid-century, drought exposure across the European transport network is projected to increase under a medium-high emission scenario, with up to 70 % of the network affected compared to historical conditions. Railways and roads could experience up to 14 times as many drought events locally, with 58 % and 53 % of their network becoming newly exposed, respectively (Fig. 11a–e).
IWWs in the EU could experience locally 7 times as many droughts as in the historical period, with 58 % of the network becoming exposed to droughts for the first time (Fig. 11e). By the end of the century, exposure to droughts is projected to increase further, with up to 57 %–63 % of airports and ports, and up to 68 %–70 % of railways, and roads experiencing droughts for the first time. The exposure of IWWs to droughts is also projected to rise considerably, with 87 % of the IWWs network facing at least one more drought and 70 % of the network experiencing drought for the first time (Fig. 11e). Railways, roads, ports and airports are projected to experience up to 18–30 times as many droughts locally by the end of the century compared to the historical conditions under a medium-high emissions scenario (Fig. 11f–j).
Although much of the TEN-T network is currently not exposed to droughts, a large fraction is projected to experience this climate extreme in the future. This is evident in the bar plots, which show a substantial increase in the percentage of elements exposed over time (Fig. 12). For the period 2070–2099 compared to 2010–2039, the ensemble mean of the percentages of yearly exposed elements simulated by climate-impact model pairs increases by 3 %–4 % for most transport modes, with the largest rise for airports (4.0 %) and the smallest for IWWs (1.8 %). The increases in Q10 are close to zero, while for Q90, we again find the strongest increases, ranging from 5.5 % for IWWs to 11.2 % for airports, with ports, railways, and roads showing an increase of 9 %–10 %.
-
River floods. By mid-century, airports in the EU are projected to face up to 3 times as many extreme river flood events locally under a medium-high emission scenario, with 18 % of their network becoming newly exposed (Fig. 13a). Roads and railways could experience up to 5 times as many extreme river floods events locally relative to the historical period, with 26 %–29 % of their network becoming newly exposed, respectively (Fig. 13c, d). Ports and IWWs would experience similar increases in river flood exposure with an increase up to 2 and 3 times locally, with 19 % and 27 % of the network becoming newly exposed, respectively (Fig. 13b, e). 38 % of the IWWs network is projected to have an EMF greater than one, so it is projected to experience at least one additional extreme river flood event by mid-century relative to historical conditions.
By the end of the century, the exposure of the TEN-T network to river floods across all transport modes is projected to rise further. Railways and roads could experience up to 8 times as many river flood events locally, while airports, IWWs, and ports could face up to 4–4.5 times as many (Fig. 13f–j).
Overall, European transport infrastructure exposure to river floods is projected to increase, albeit to a lesser extent than the increase in other extremes such as heatwaves (Fig. 14).
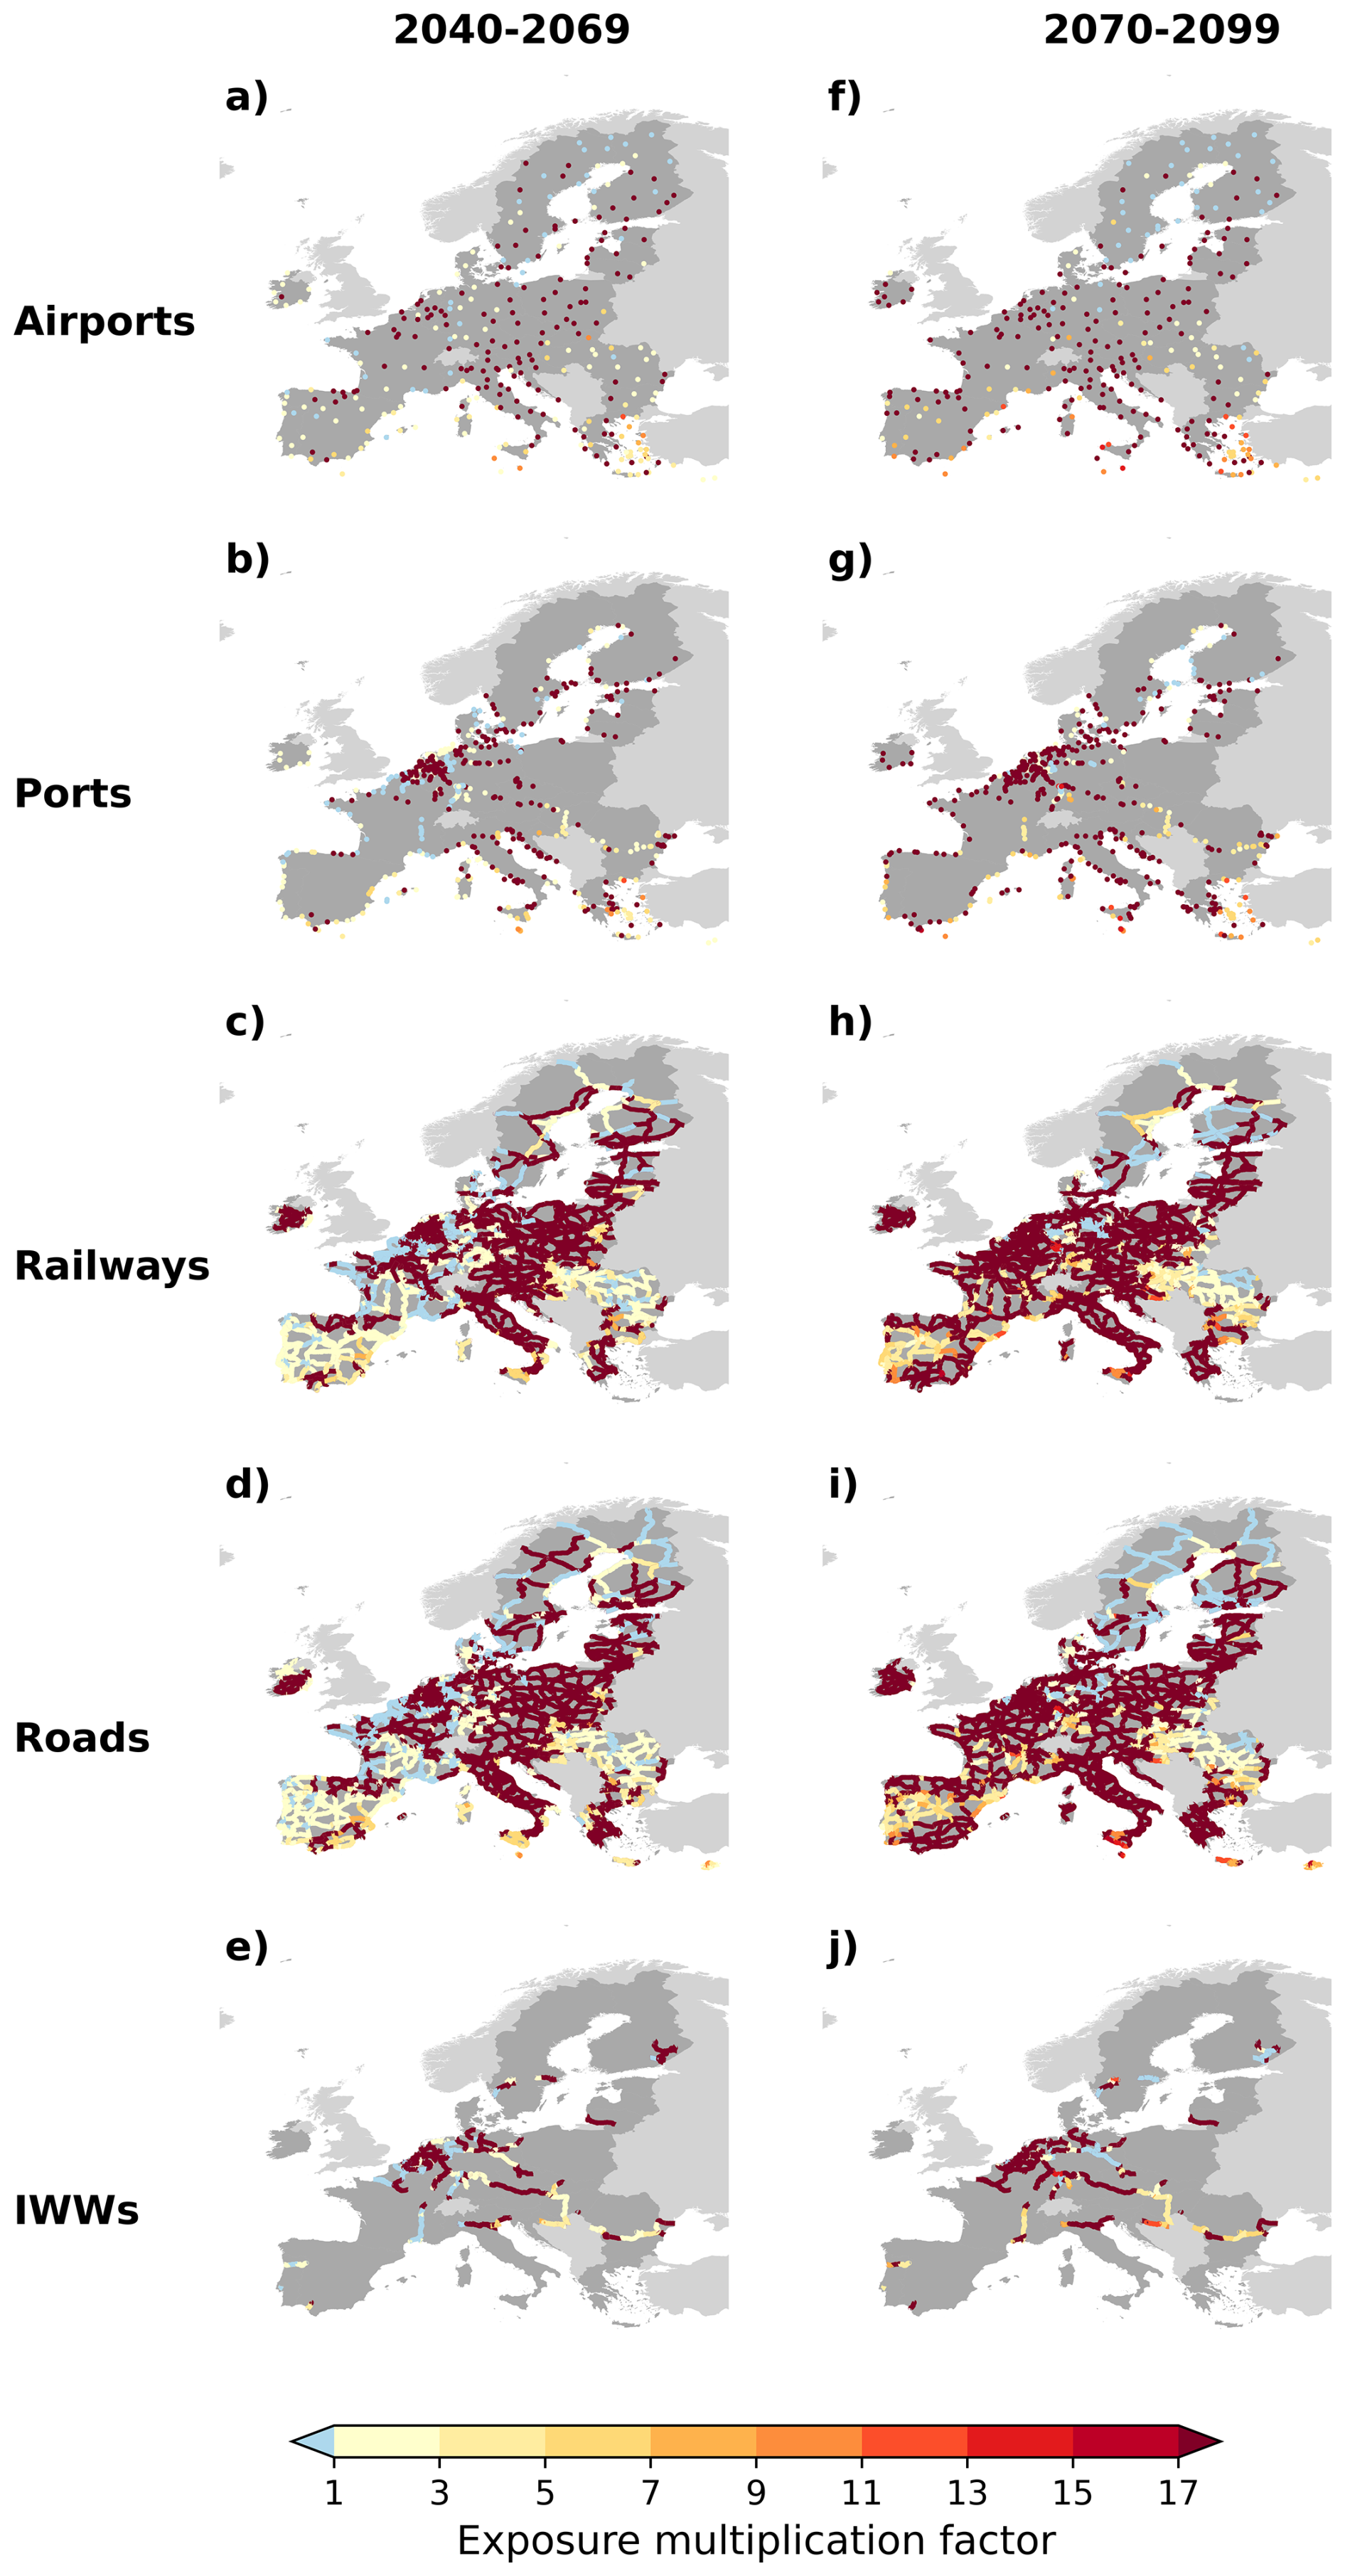
Figure 11 Maps of multi-model ensemble median Exposure Multiplication Factors of the TEN-T by mode (rows) to droughts by the middle (2040–2069) and the end of the century (2070–2099) (columns) relative to historical climate conditions (1980–2009) under a medium-high emissions scenario (RCP6.0). The multi-model ensemble median is computed across all available combinations of impacts models and GCMs.
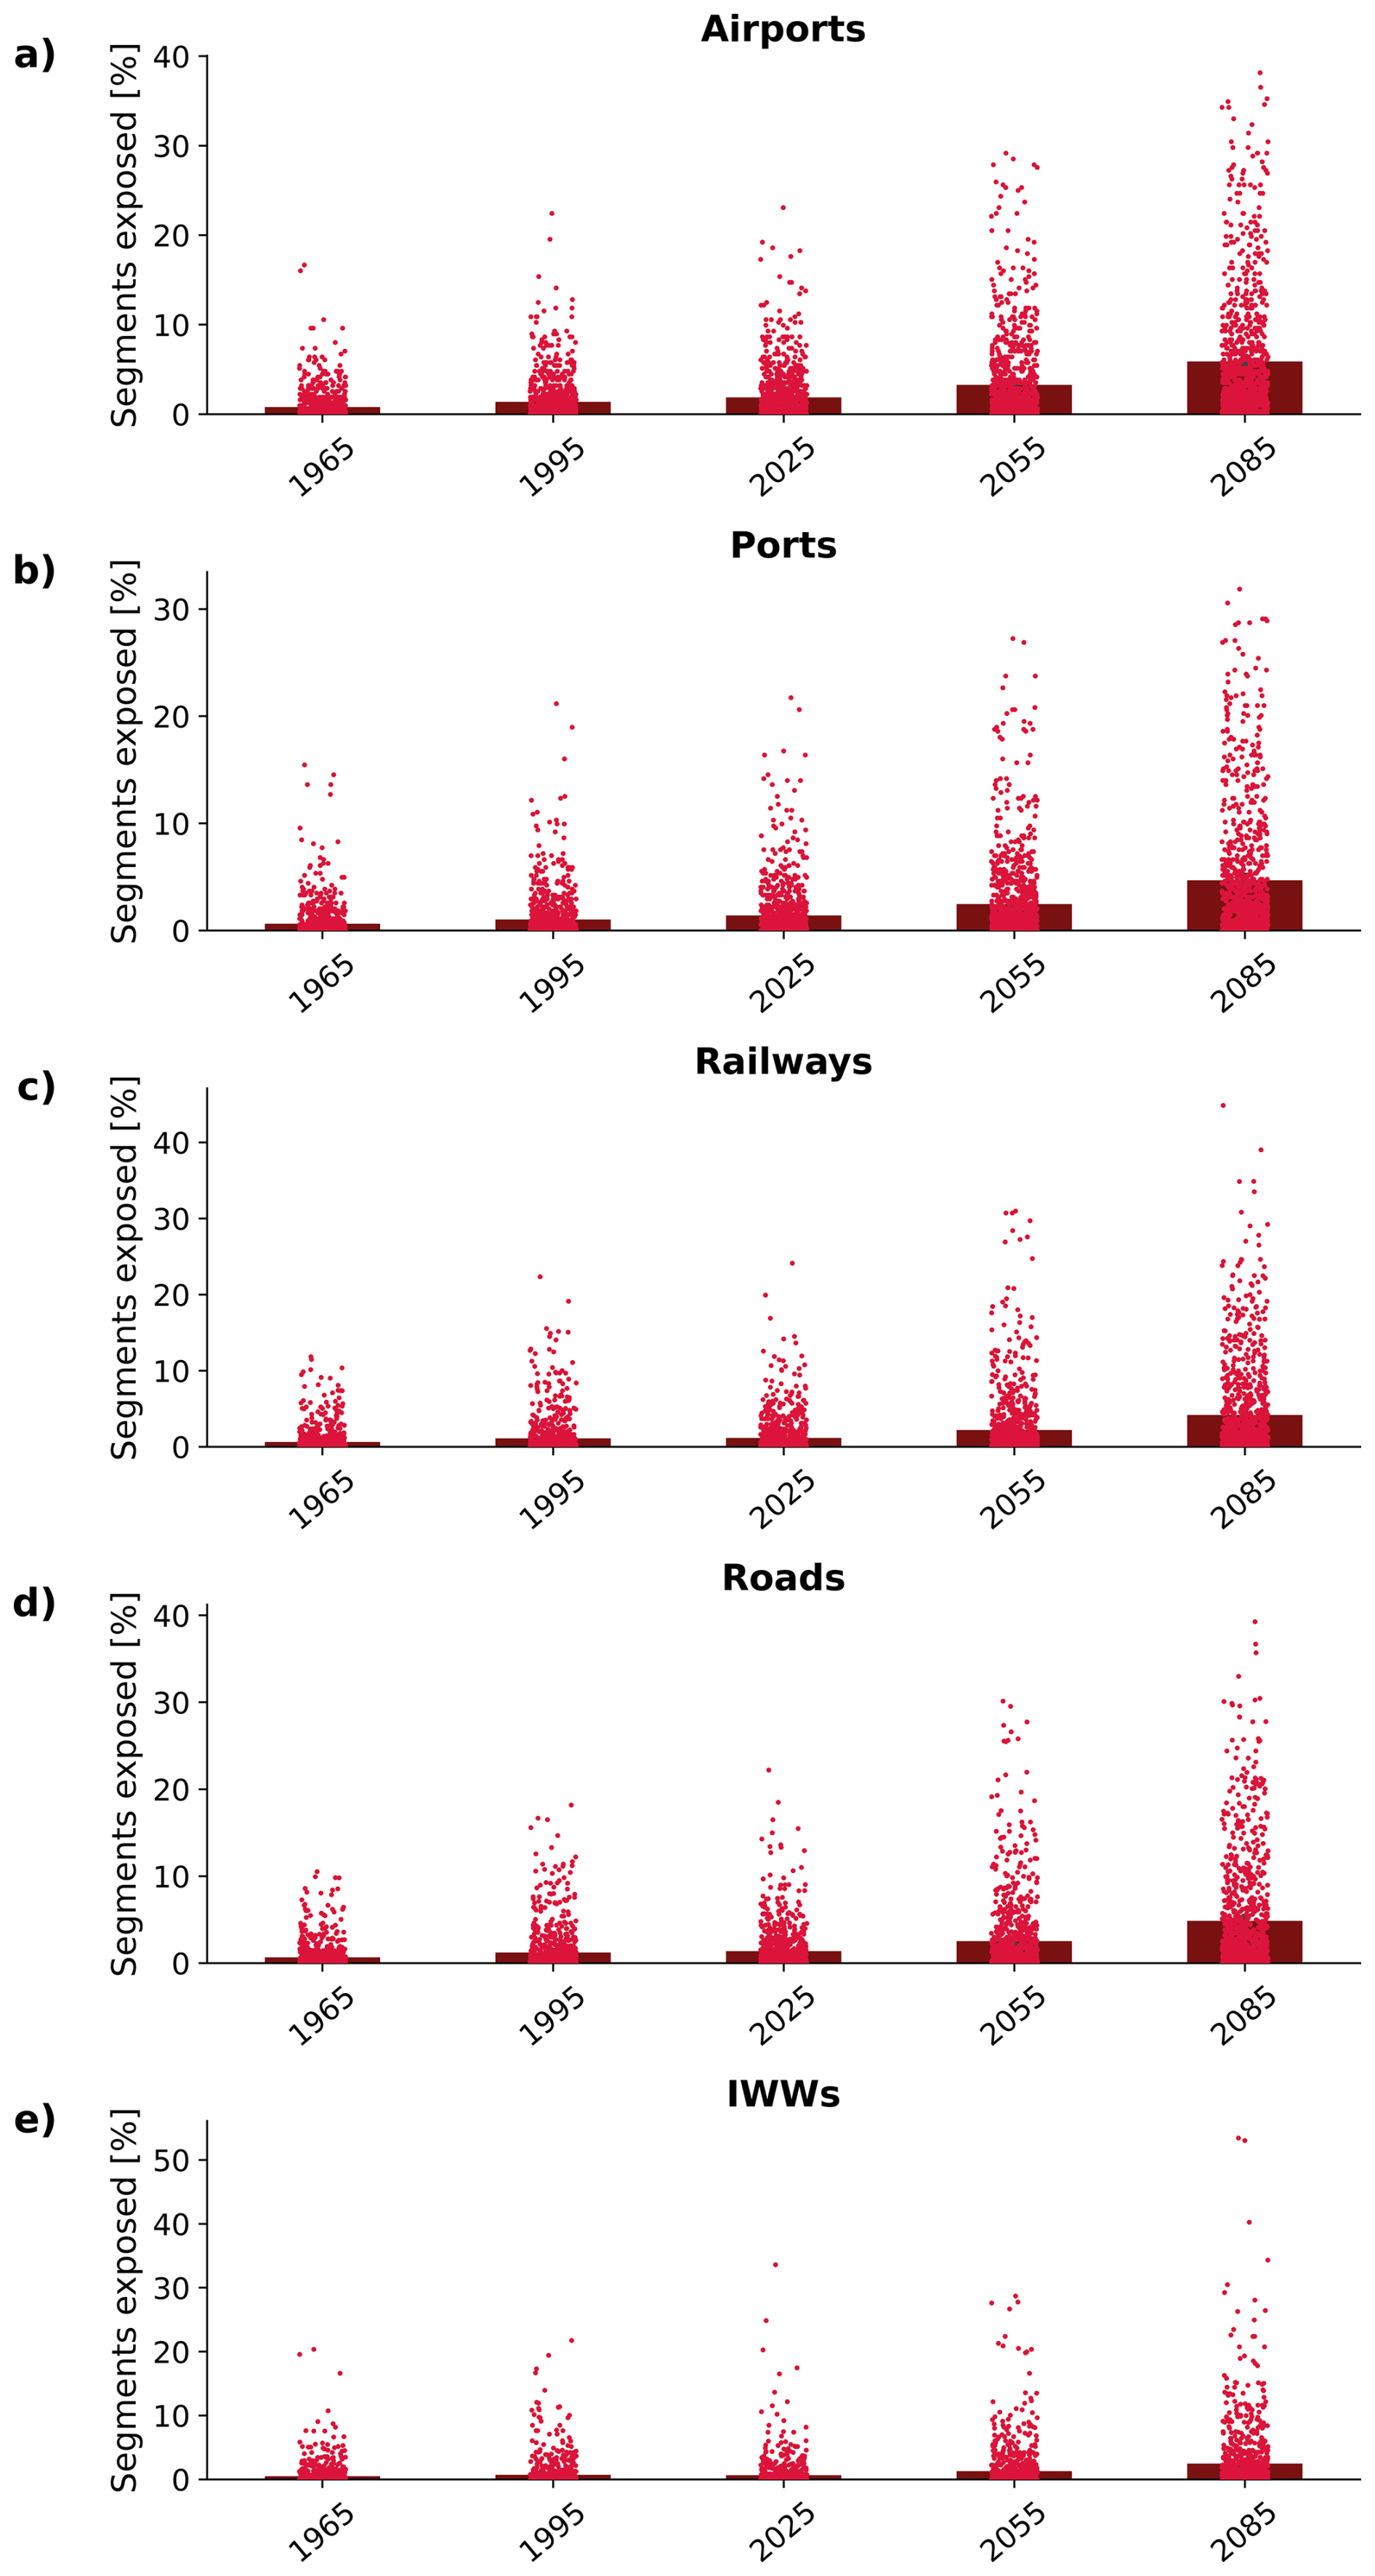
Figure 12 Percentage of European transport elements exposed to droughts over time under a medium high-emissions scenario (RCP6.0). The bar plot shows the mean percentage of exposed transport elements computed by pooling all annual values across all GCM-impact model simulations within each 30-year window. The black error bar denotes the 95 % bootstrap confidence intervals for the mean. Each dot represents the percentage of exposed segments for a single GCM-impact model pair, based on the number of transport elements in each grid cell projected to experience exposure. The year on the x-axis denotes the central year of a 30-year window (e.g., 1965 represents 1950–1979).
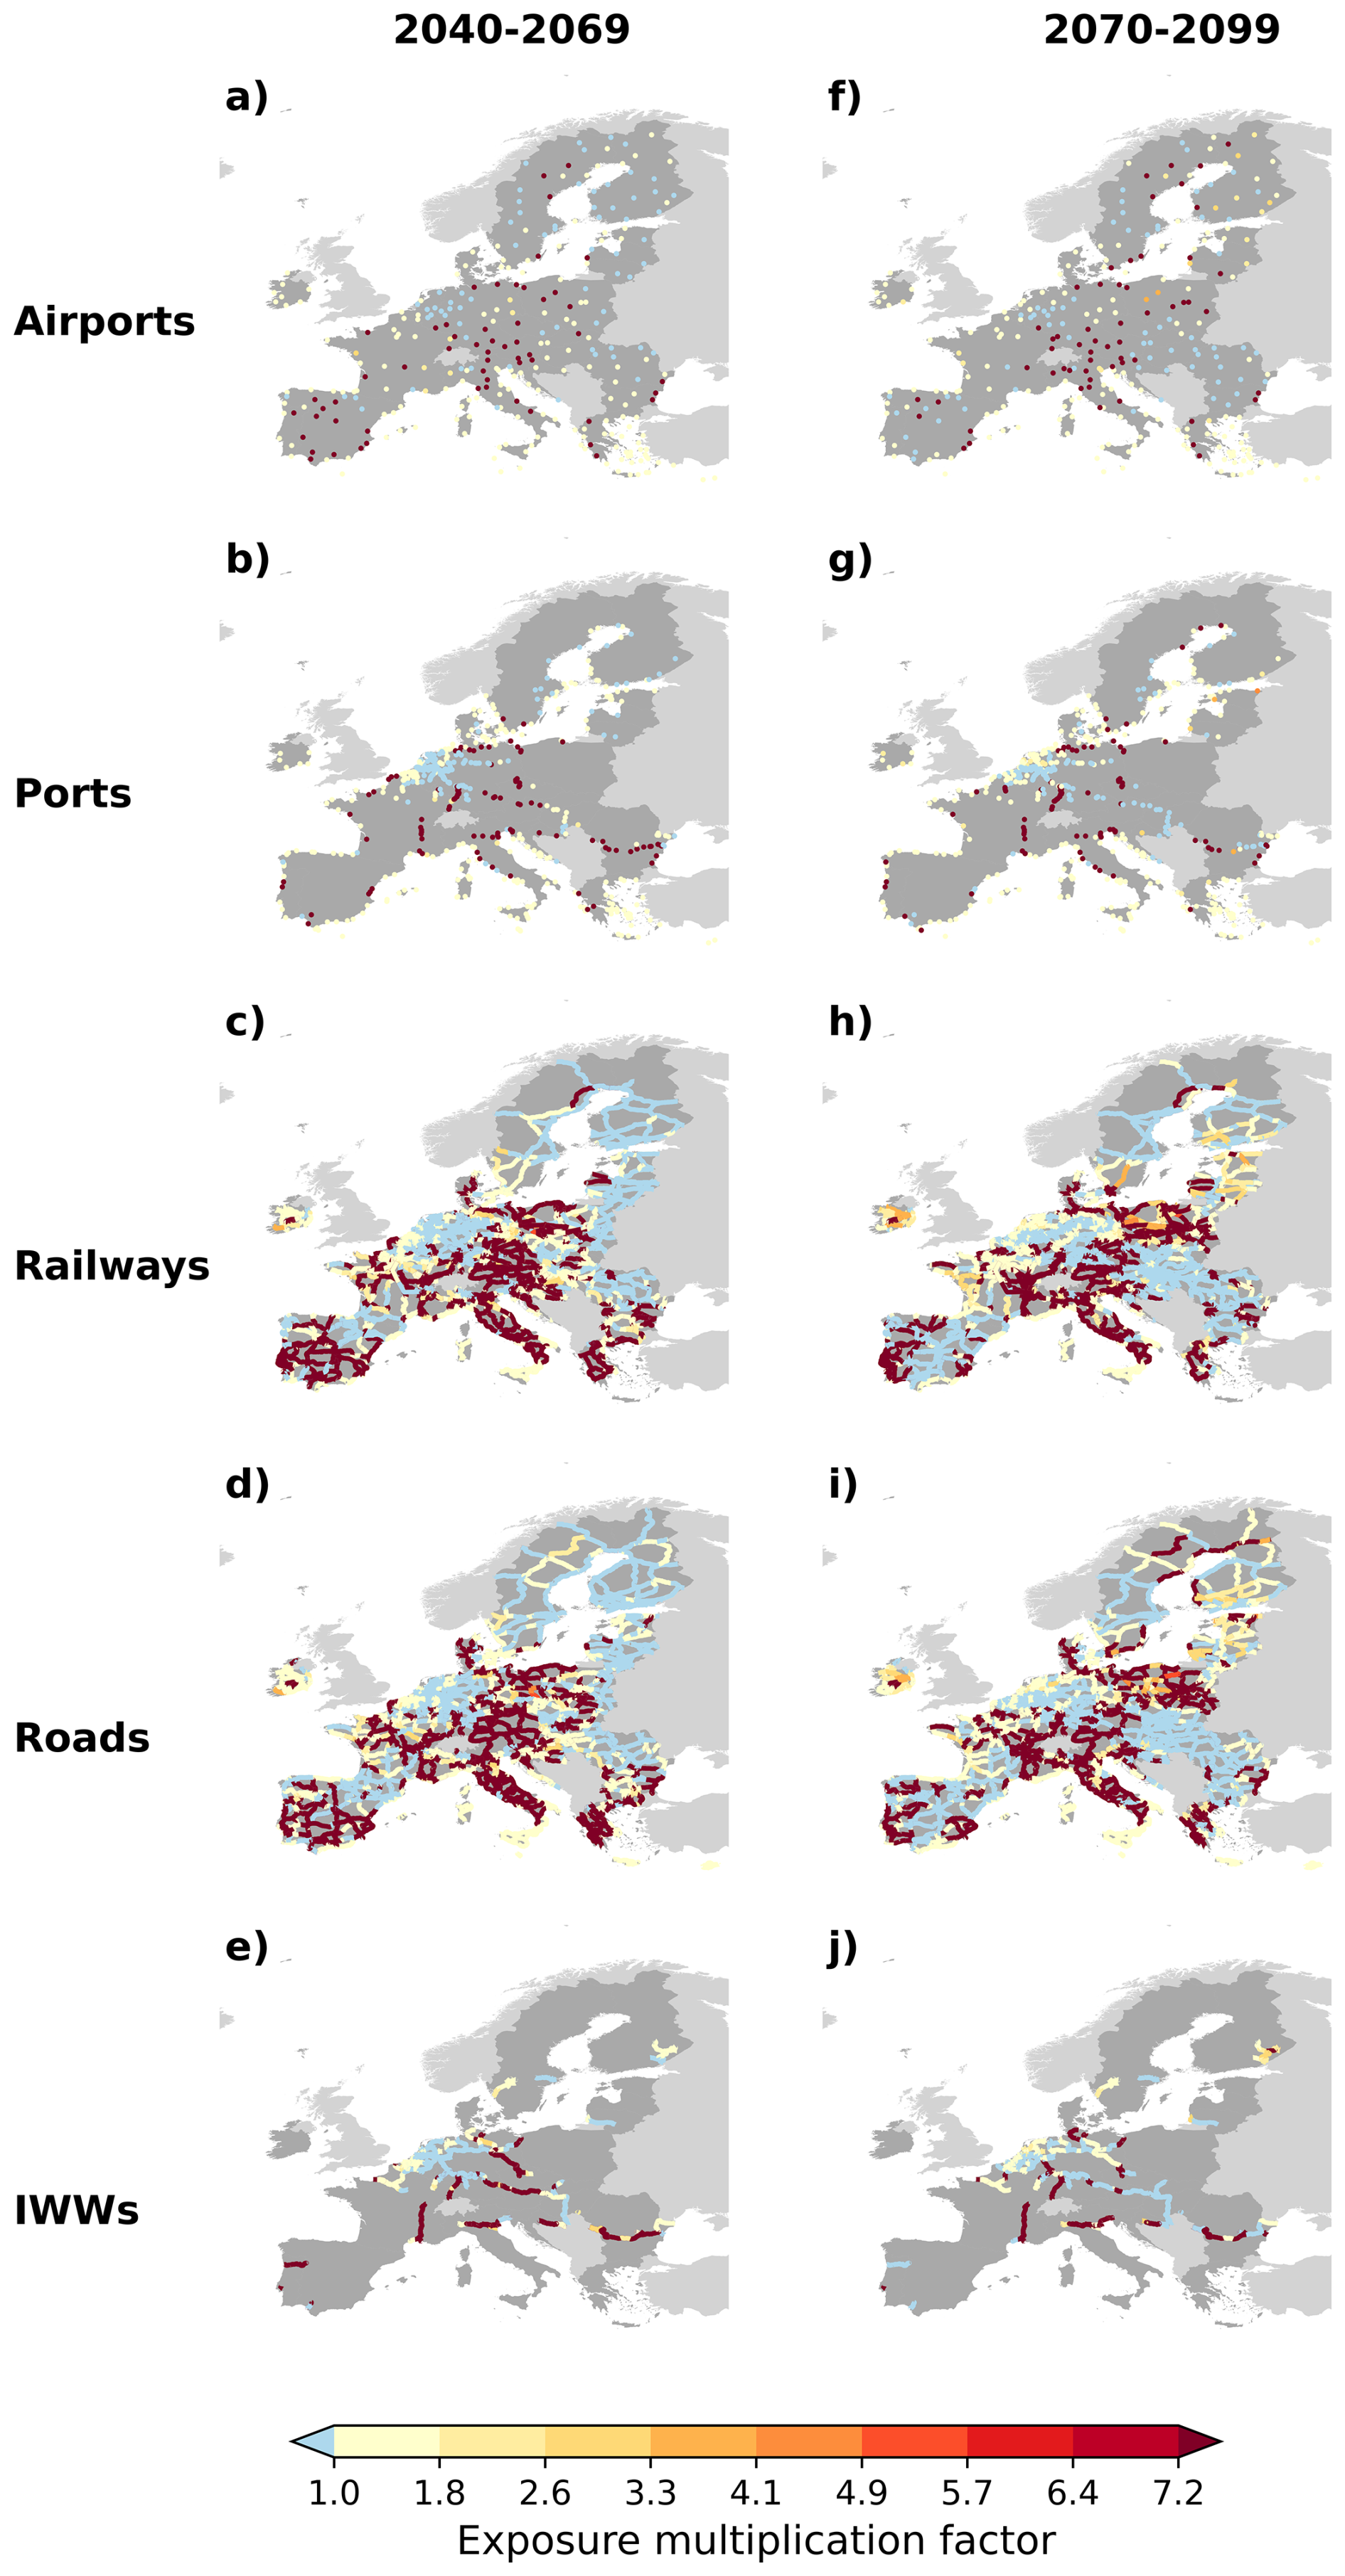
Figure 13 Maps of multi-model ensemble median Exposure Multiplication Factors of the TEN-T by mode (rows) to river floods by the middle (2040–2069) and the end of the century (2070–2099) (columns) relative to historical climate conditions (1980–2009) under a medium-high emissions scenario (RCP6.0). The multi-model multi-model ensemble median is computed across all available combinations of impacts models and GCMs.
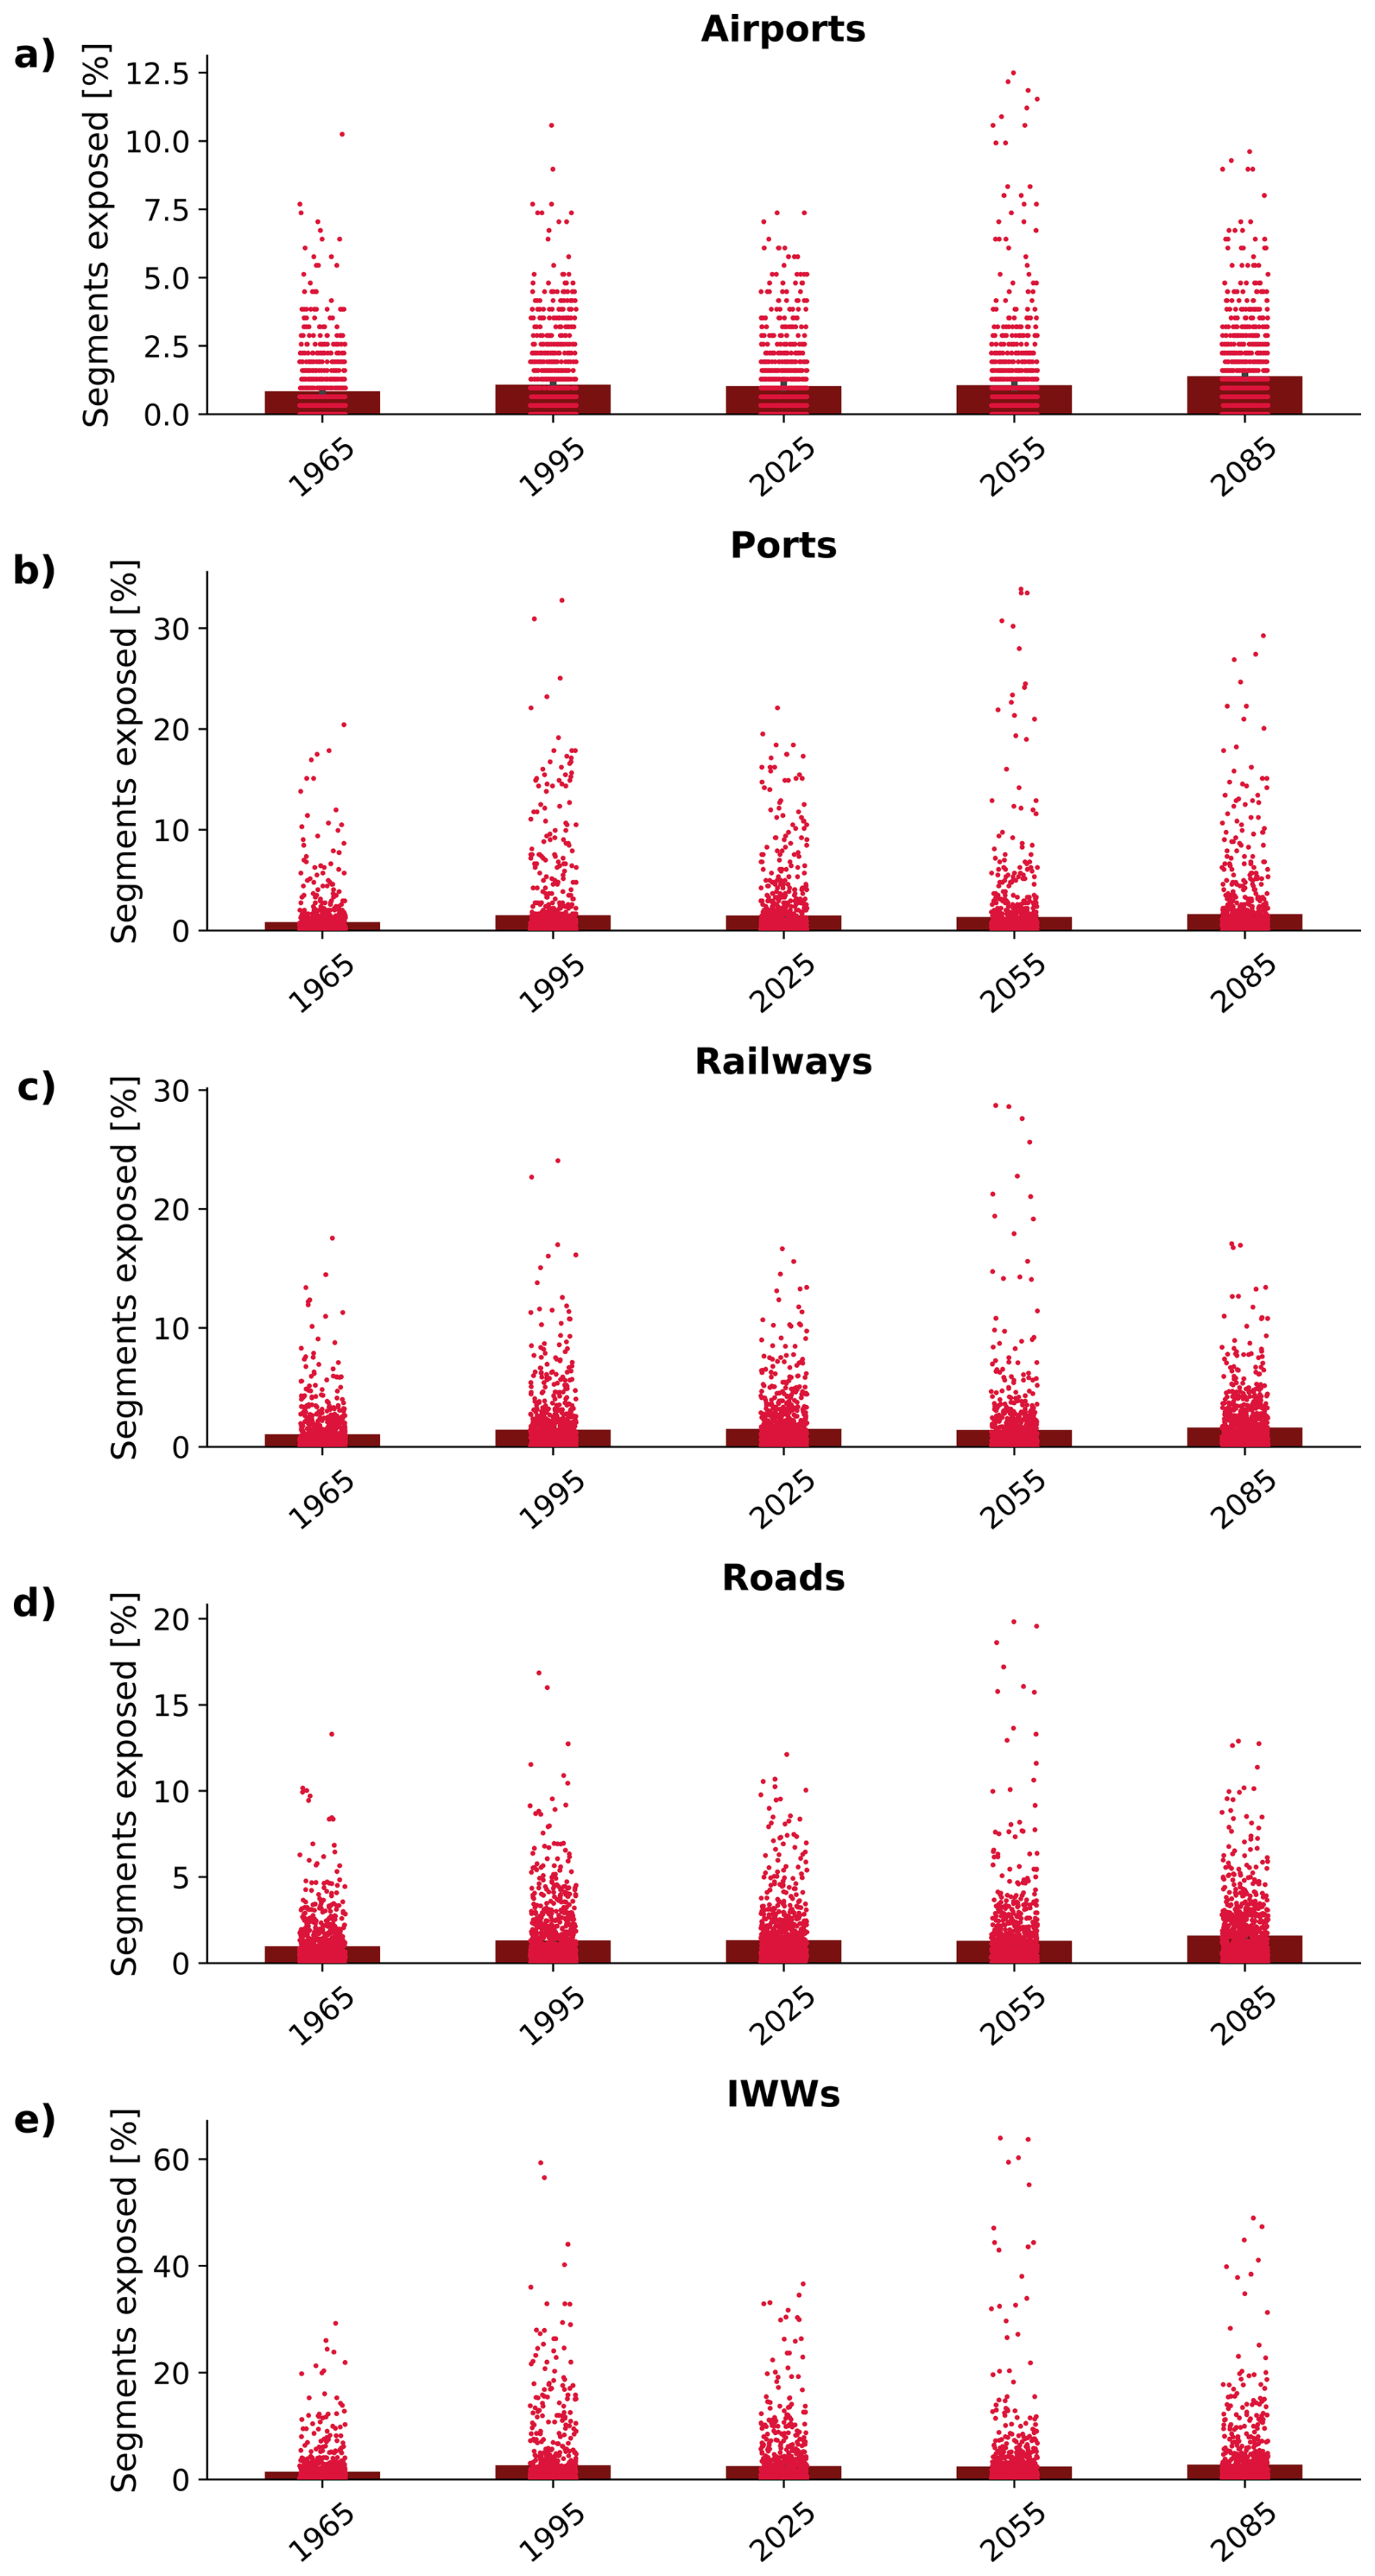
Figure 14 Percentage of European transport elements exposed to river floods over time under a medium high-emissions scenario (RCP6.0). The bar plot shows the mean percentage of exposed transport elements computed by pooling all annual values across all GCM-impact model simulations within each 30-year window. The black error bar denotes the 95 % bootstrap confidence intervals for the mean. Each dot represents the percentage of exposed segments for a single GCM-impact model pair, based on the number of transport elements in each grid cell projected to experience exposure. The year on the x-axis denotes the central year of a 30-year window (e.g., 1965 represents 1950–1979).
Under the very high emissions scenario RCP8.5, an increase in both the median and maximum values of the multi-model ensemble median EMF is projected over Europe for all climate extremes (Table A9). By the end of the century, heatwaves show the largest increases (Fig. A5). The increase in exposure, expressed as relative differences in mean values across Europe under RCP8.5 compared to RCP6.0, varies by extreme type and transport mode. Heatwave exposure shows substantial increases, with relative differences ranging from 31 % to 43 %, the largest being for inland waterways, railways, and roads. Under RCP8.5, there is also a large expansion of areas where the EMF tends toward infinity, indicating that a growing portion of the network will become newly exposed to droughts, ranging from 87 % for ports and roads to up to 90 % for railways and ports. For wildfires, up to 41 %–51 % of network is projected to experience an increase in exposure. River flood also increase, although the differences between RCP6.0 and RCP8.5 remain moderate compared to heatwaves and droughts (Fig. A7). Still, there is a relative increase of 33 %–56 % in local maximum values.
The comparison between the medium-high emissions scenario (RCP6.0) and the low emissions scenario (RCP2.6) reveals substantial benefits of climate change mitigation in reducing the impacts of climate extremes on European transport infrastructure. The magnitude of these benefits varies across hazards and transport modes, with the highest reductions observed at the end of the century (2070–2099) (see Table A10). The largest benefits are observed for heatwaves, where mitigation under RCP2.6 leads to a reduction of the EMF values over Europe, with a mean decrease of 61 %–67 % in relative terms, by the end of the century, compared to RCP6.0 (Fig. A9). The maximum local increase is reduced by 40 %–53 %, in terms of relative differences. This reduction highlights the crucial role of mitigation in limiting the increasing exposure of critical European transport infrastructure to extreme temperatures. Mitigation also bring substantial benefits for droughts, with a reduction of 55 %–64 % in mean exposure and up to 62 % in local maxima (Fig. A11). The percentage of network exposed to drought decreases from 85 %–91 % under RCP6.0 to 68 %–71 % under RCP2.6, indicating that mitigation substantially limits the spread and severity of drying conditions affecting transport networks. For river floods, the differences between scenarios are more modest but consistently positive. The newly exposed area declines from approximately 17 %–25 % under RCP6.0 to 13 %–21 % under RCP2.6, suggesting that even moderate mitigation efforts can reduce localized flood exposure (Fig. A10). For wildfires, the mitigation scenario leads to a reduction of up to 77 % in local maxima, though some variability is observed across transport modes (Fig. A12). The mitigation scenario helps reducing the spread of wildfires, particularly for airports, roads and rail networks. The newly exposed area decreases from 14 %–22 % under RCP6.0 to 11 %–17 % under RCP2.6. These results point to noticeable benefits in limiting extreme fire conditions, particularly in southern and western European regions.
Table 4 Summary of spatial statistics of the multi-model ensemble median Exposure Multiplication Factors (EMFs) for the Trans-European Transport Network (TEN-T) by transport mode and climate extremes under RCP6.0 by the middle (2040–2069) and end of the century (2070–2099), relative to the historical period (1980–2009). The percentage of network projected to experience an increase or decrease in exposure is referred as “EMF >1” and “EMF <1”, respectively. Newly exposed elements had no historical exposure but are projected to experience at least one event in the future period. EMF statistics (Median, Q10, 90, Max) are calculated based on the number of elements (N) with historical exposure.
4.1 Impacts and losses due to recent climate extremes on the transport infrastructure
Over the last fifteen years, all modes of transport have been affected by multiple climate hazards, with extreme temperatures, floods, and droughts posing the greatest threats due to their widespread impacts. The analysis of recent events emphasize the need for a comprehensive approach that considers all transport modes and hazards. Transport risk assessments should take into account that each mode can be affected by multiple hazards, with each hazard causing a specific set of impacts. Additionally, it is crucial to consider the potential cascading impacts. Without such a structured framework, risk assessments will be over-optimistic and our ability to manage and recover from climate extremes may be severely compromised.
To support such an approach, the construction of a comprehensive database mapping locations, damages, and economic losses specific to the transport sector is crucial, as such a resource is currently lacking. Historical archival data on types and causes of events/disruptions, responses to the event and the time to return to normal operations should be collected and analysed (Asghari et al., 2023). This would not only enhance our understanding of the impacts and losses across different transport modes, but also help track emerging challenges posed by changing climate conditions.
The increasing frequency of extremes in recent years is creating new challenges that did not arise under past climate conditions. These include structural failures like pavement and railway deformation, melting of signages, logistical strain on emergency services, and increased health risks for populations exposed to extreme heat and other hazards. This suggests that we are already experiencing the emergence of new impacts for which practitioners are unprepared, as transport sector operators have limited experience in managing such conditions.
The key finding is that all transport modes are being impacted by a wide range of climate hazards. All hazards should be considered for all transport modes, as all of them matter. Secondly, it is important to consider the direct or cascading effects that these events can generate. For example, extreme heat caused by heatwaves or wildfires can lead to dangerously high temperatures inside trains, requiring additional safety measures to protect passengers' health.
4.2 Future exposure of transport infrastructure
Transport infrastructure under the Trans-European Transport Network (TEN-T) is projected to face increased exposure to climate extremes across most of the considered hazard types. The Mediterranean region is emerging as a hotspot for multiple hazards, especially wildfires, for which models project a high local increase. The potential increase in burnt areas in this region, as also found by Rovithakis et al. (2025), could require a paradigm shift in wildfire management policies to account for climate change (Moreira et al., 2020; Burton et al., 2024).
Heatwaves and droughts are projected to have the largest spatial increase. The increase of soil moisture drought, the index considered in this analysis, could generate effects especially relevant for railways and roads (Palin et al., 2021). It can severely impact soil functionality, leading to swelling and shrinking, reduced soil stability, and an increased risk of landslides (Quintana et al., 2023). In fact, landslides generation are susceptible to long, dry periods followed by intense precipitation (Tichavský et al., 2019). This index can also serve as a proxy for prolonged periods of low precipitation, which may contribute to decreasing water levels (Pohle et al., 2024), a critical factor for IWWs. These low flows can be further exacerbated by increased evaporation due to the high temperatures (Rossi et al., 2023). Additionally, the increasing temperature can generate early snow melting that further diminishes water availability for late spring and summer months (Barnett et al., 2005; Etter et al., 2017). Overall, these low flows reduce water depth for vessels, having great impact on limiting navigability (Rossi et al., 2023).
River floods are also projected to increase, and although their spatial increase may be less evident compared to other extreme events, their impact should not be underestimated (Koks et al., 2019). In fact, the analysis of recent events shows that floods are currently responsible for the highest economic losses (van Ginkel et al., 2021), often causing total disruption of railway and road networks (Table A6). Western European ports are highly exposed to river floods, as well as the other hazards. This is consistent with the findings of Verschuur et al. (2023), which project that these ports rank among the top 50 globally with the highest expected port-specific risks.
The results of this study should be interpreted in light of several limitations. The projections rely on gridded data with a coarse spatial resolution (0.5°×0.5°), which may not capture localized phenomena. Further analyses using higher-resolution data for river floods and alternative indicators – such as hydrological rather than soil moisture drought indices – would refine results and strengthen local relevance for policy applications. Extending the ISIMIP initiative (Frieler et al., 2024) to include additional relevant extremes, such as mid-latitude windstorms, coastal floods and flash floods could also enhance systematics future assessments.
4.2.1 Hazard interrelations
It is important to note that the increasing occurrence of individual climate extremes raises the probability of: (i) experiencing multiple climate extremes simultaneously (ii) a single extreme covering multiple areas, (iii) a single extreme occurring consecutively over time, and (iv) different extremes affecting various parts simultaneously.
Examples of each type of compounding have already been observed or modelled in Europe: (i) The increasing frequency of heatwaves and droughts could make concurrent hot and dry conditions more common (Muheki et al., 2024; Messori et al., 2025; Zscheischler and Seneviratne, 2017), as recently demonstrated in Germany (Table A5). (ii) The potential increase of simultaneous wildfires in multiple locations (Pandey et al., 2023) could intensify the impact due to the limited capacity of rescue services to respond across affected areas (Arnell, 2022) (Table A8). (iii) Consecutive floods could further extend recovery times from one year to the next, reducing the system's overall resilience (Rahman and Kim, 2025) (Table A6). (iv) The potential failure of different parts of the network due to simultaneous and different hazards could increase the need to consider alternative routes (Iliopoulou and Makridis, 2023; Xie et al., 2023) (Table A6).
These types of connected events, referred to in the literature as compound events, have been extensively studied in literature (e.g. Zscheischler et al., 2020; Bevacqua et al., 2021), yet there is still limited focus on their specific implications for the transport sector. Based on the results of this analysis, it is evident that future research should investigate the potential consequences of interconnected climate extremes. Their direct effects on the overall functioning of the transport system should be integrated into transport risk analysis (Zscheischler and Seneviratne, 2017).
4.2.2 Other hazards
Climate change also influences other extremes that will have an impact on transport infrastructure and are not considered in this study. For example, coastal flooding and windstorms were identified in the literature review as particularly relevant. Existing studies provide insights into the potential future risks associated with these hazards:
-
Coastal floods. Coastal floods is one of the climate extremes that is projected to drastically increase the risk for the whole transport infrastructure. According to RCP8.5 projections, by 2100 more than 200 million additional tonnes of cargo will be handled annually in ports exposed to extreme sea levels exceeding 4.5 m, compared to 2010 (Christodoulou et al., 2019). Northern European ports such as Rotterdam, Antwerp, and Hamburg are projected to be among the most vulnerable (Christodoulou et al., 2019). Countries on the the North Sea, such as Germany, the Netherlands, and Belgium, have the highest number of airports that could potentially be fully flooded due to the high concentration of aerodromes in their coastal regions (Eurocontrol, 2021a). By 2090, under a lower intermediate emissions pathway (RCP4.5 for the study conducted by Eurocontrol, 2021a), the number of airports likely to face severe flooding (more than 50 % of the runway) or be fully flooded increases by 14 % and 16 %, respectively, compared to the year 2000. This indicates an escalating risk, even under a relatively optimistic socioeconomic scenario. Sea level rise will increase flooding risk for all transport elements close to the coast, having impacts also on coastal railways and roads (Koks et al., 2019; Guglielmo et al., 2024; Railway Technology, 2019). The most extreme condition is not only the sea level rise alone, but its combination with high tide, and episodic water level fluctuations due to climate extremes, such as wave or storm surge (Vousdoukas et al., 2016). A storm surge caused by storms, strong winds, or cyclones, occurring on top of an already elevated sea level, will lead to unprecedented water height in the flooded areas (Vousdoukas et al., 2016). Airports, ports, and transport infrastructure along the coast of Northen sea, parts of Ireland and Baltic sea are projected to face highest risk, also in 2050 under a lower intermediate emissions pathway (RCP4.5 in this case) (Vousdoukas et al., 2017).
-
Wind storms. Regarding mid-latitude wind storms, there is currently limited evidence that climate change is increasing their frequency or intensity beyond generating more heavy rainfall (Arias et al., 2021), and projections of windstorm impacts in Europe under climate change remain highly uncertain (Severino et al., 2024). Extratropical cyclones are a major driver of extreme winds in the Mediterranean region, with about two‐thirds of windstorms linked to Mediterranean cyclones and the remainder to Atlantic or Northern European systems (Khodayar et al., 2025). A class of Mediterranean cyclones, known as “Medicanes” (Mediterranean hurricanes), plays a central role in high‐impact weather, as these rare but intense tropical-like systems can produce compound rain-wind extremes (González-Alemán et al., 2019). Future projections suggest only minor changes in mean wind speeds over the basin, although a poleward shift in storm tracks may influence extremes. While some studies project a decrease in the frequency and intensity of Mediterranean windstorms (Donat et al., 2011; Nissen et al., 2013), others highlight regional contrasts, reporting a robust increase in cyclone‐related wind intensity in the central Mediterranean under high‐emission scenarios (Reale et al., 2022). Reale et al. (2022) found that, based on an ensemble of 7 Med-CORDEX Regional Climate System Model simulations, cyclone activity over the Mediterranean is projected to decrease in number and intensity across central Italy, the Tyrrhenian Sea, the Anatolian Peninsula, the Balkans, and parts of Northern Africa by the end of the 21st century (RCP8.5). At the same time, they identified a robust increase in cyclone-related precipitation and wind intensity in the central Mediterranean, with opposite changes in the southeastern part of the region. For Medicanes, González-Alemán et al. (2019) found that, although their frequency decreases under warming, storms become more hazardous-lasting longer and producing stronger winds and rainfall. Even under the intermediate RCP4.5 scenario, continued warming increases risks with severe natural and socioeconomic consequences.
This study also does not analyse hazards such as landslides and flash floods. Assessing the influence of climate change on these hazards remains challenging due to limitations in process representation and data availability (Lenderink et al., 2025; Peleg et al., 2025). Nevertheless, a growing body of evidence suggests that their frequency and intensity may increase in parts of Europe under climate change, for example in some Alpine areas (Marra et al., 2024), with potentially severe consequences for transport infrastructure (as exemplified by the recent disruption of the Fréjus Tunnel; see Fidanza, 2023). Landslide occurrence is highly location-specific and is controlled by a variety of physical mechanisms (e.g., heavy rainfall, snow melting, flash floods, deforestation, wildfires, earthquakes) (Shafizadeh-Moghadam et al., 2019; de Vilder et al., 2022; Deijns et al., 2024; Broeckx et al., 2018; Jacobs et al., 2018, 2016). Despite climate change affects precipitation, increasing the frequency of extreme events that drive the risk of landslides (Gariano and Guzzetti, 2016; Jemec Auflič et al., 2023), modelling these processes and isolating the direct impact of climate change on individual events remains highly challenging (Huang et al., 2024; Marechal, 2024). Flash floods are acute localised hazards for which the main weather driving mechanism is an intense and short precipitation event. While models generally agree on the increasing trends in heavy precipitation (Tabari, 2020), a driver of both landslides and flash floods, there are currently limited data sets available that allow for a systematic comparison landslides and flash floods to the other hazard categories considered in this study.
Other extremes that could be considered are extreme cold events. However, previous analyses show that the occurrence and severity of cold extremes have consistently diminished in line with global warming trends (Cattiaux et al., 2010). The frequency and intensity of these events are further projected to decrease in future (Seneviratne et al., 2012, 2016; Yao et al., 2020; Thiery et al., 2021a). The number of days with extreme cold temperatures has decreased by a factor of 2–3, with temperatures rising by more than 3 °C regionally, substantially more than the winter mean temperatures (Lorenz et al., 2019).
This study assesses the exposure of extreme climate events on European transport infrastructure by combining a review of reported damages and losses from recent events with projections of future exposure under different emissions scenarios. The analysis provides new insights into how hazards such as floods, heatwaves, droughts, and wildfires are affecting the Trans-European Transport Network (TEN-T), disrupting operations and causing economic losses, and how these exposures are expected to evolve over the middle and end of the century.
Our review of recent events reveals that climate extremes already exert considerable pressure on transport systems across Europe. These events not only damage critical infrastructure but also disrupt operations, increase costs, and negatively affect user experiences, leading to longer waiting times and health risks. Italy, France, and Germany show the highest levels of exposure between 2010 and 2018, with floods alone causing damages exceeding EUR 6 billion to railways and roads. However, a systematic assessment of impacts is constrained by the lack of a dedicated, harmonised database that captures geolocated impacts and economic losses specific to the transport sector. While existing sources such as the Global Georeferenced Disaster Dataset (GDIS) and the DRMKC Risk Data Hub offer valuable insights, they only partially cover the range of hazards and transport modes affected.
Projections under a medium-high emission scenario (RCP6.0) indicate that exposure to climate extremes will increase substantially by mid- and end-of-century. Heatwaves show the largest increase, with more than 90 % of the network expected to face an increasing in exposure by mid-century, followed by droughts, wildfires, and floods.
Heatwaves present the most severe increase in exposure, with projections indicating a potential increase of up to 20 times locally by mid-century and up to 30 times by century's end. The Mediterranean region faces the highest increase, where critical assets such as airports, ports, railways, and roads are expected to experience more frequent and severe disruptions.
Droughts represent the hazard that the highest fraction the transport network could experience for the first time. By mid-century, up to 45 % of railways and roads and 40 % of inland waterways (IWWs) are projected to face drought conditions, increasing to over 70 % of the IWW network by the end of the century. These findings underscore that even regions currently considered low-risk are likely to become exposed in the coming decades.
Wildfires are also projected to increase, especially in the Mediterranean region. Up to 19 % of the network is projected to experience wildfires for the first time by mid-century, with local exposures of up to 15 times by mid-century and up to 26 times by century's end. Roads and railways in southern and eastern Europe, as well as ports and airports along the coast, are expected to face the greatest exposure and disruption risks.
Although river floods can also be more localized phenomena, and do not always cover as large an area of the network as other extremes, their frequency is expected to increase up to 5 times locally for railways, roads, by mid-century, and up to 8 times locally by the end of the century.
The comparison between emission scenarios highlights the benefits of mitigation. Under a low-emission scenario (RCP2.6), projected exposure increases are smaller than under RCP6.0 already by mid-century, with the largest avoided exposure for heatwaves, droughts, and wildfires. Limiting emissions can therefore substantially reduce the future exposure for European transport infrastructure to extreme events.
Projections under the very high emissions scenario RCP8.5 consistently shows a stronger increase over Europe in mean and maximum values of EMF compared to RCP6.0, particularly for heatwaves and droughts, where some transport modes (especially railways, roads, and ports) experience a drastic intensification.
Beyond our analysis, existing literature provides insights into the potential future increase in exposure for other hazards. Coastal floods are expected to represent a major threat to the transport infrastructure along the coast. Many locations along the European coastlines have already witnessed an increase in sea levels and associated coastal flooding (EEA, 2024). The sea level is further projected to increase due to global warming, leading to the increase in the frequency of extreme high coastal water levels and posing risks to coastal airports and ports (Vousdoukas et al., 2017, 2016). Windstorms, in contrast, are generally not projected to increase in frequency, although extreme events may become more intense or hazardous.
In recent years, the accelerating pace of climate change has already become evident, with extremes occurring more frequently, more intensely, and often in combination. Events such as the concurrent heatwaves and droughts of 2018, the widespread floods of 2021, or the successive wildfires and floods in southern Europe in 2023 illustrate how multiple or consecutive extremes can strain the transport system's recovery capacity. These recent patterns highlight the growing vulnerability of Europe's transport networks to compounding and cascading events, and the need to develop integrated, multi-hazard and multi-modal approaches for risk assessment, policy design, and investment planning. Advancing this goal will require higher-resolution analyses and expanded databases covering multiple hazards that incorporate additional extremes and a selection of relevant indicators for the transport sector.
In conclusion, this study underscores that Europe's transport system appears not to be ready to face the increasing exposure to climate extremes. Without effective mitigation and adaptation, the reliability and safety of transport infrastructure will be increasingly compromised, with cascading effects on economies and societies. Protecting the TEN-T network is therefore vital to maintaining connectivity and mobility in Europe, and urgent action is needed to reduce emissions, enhance resilience, and prepare for the growing challenges posed by a changing climate.
Table A1 Example of recent disruptions to airport operations due to various hazards and their impacts.
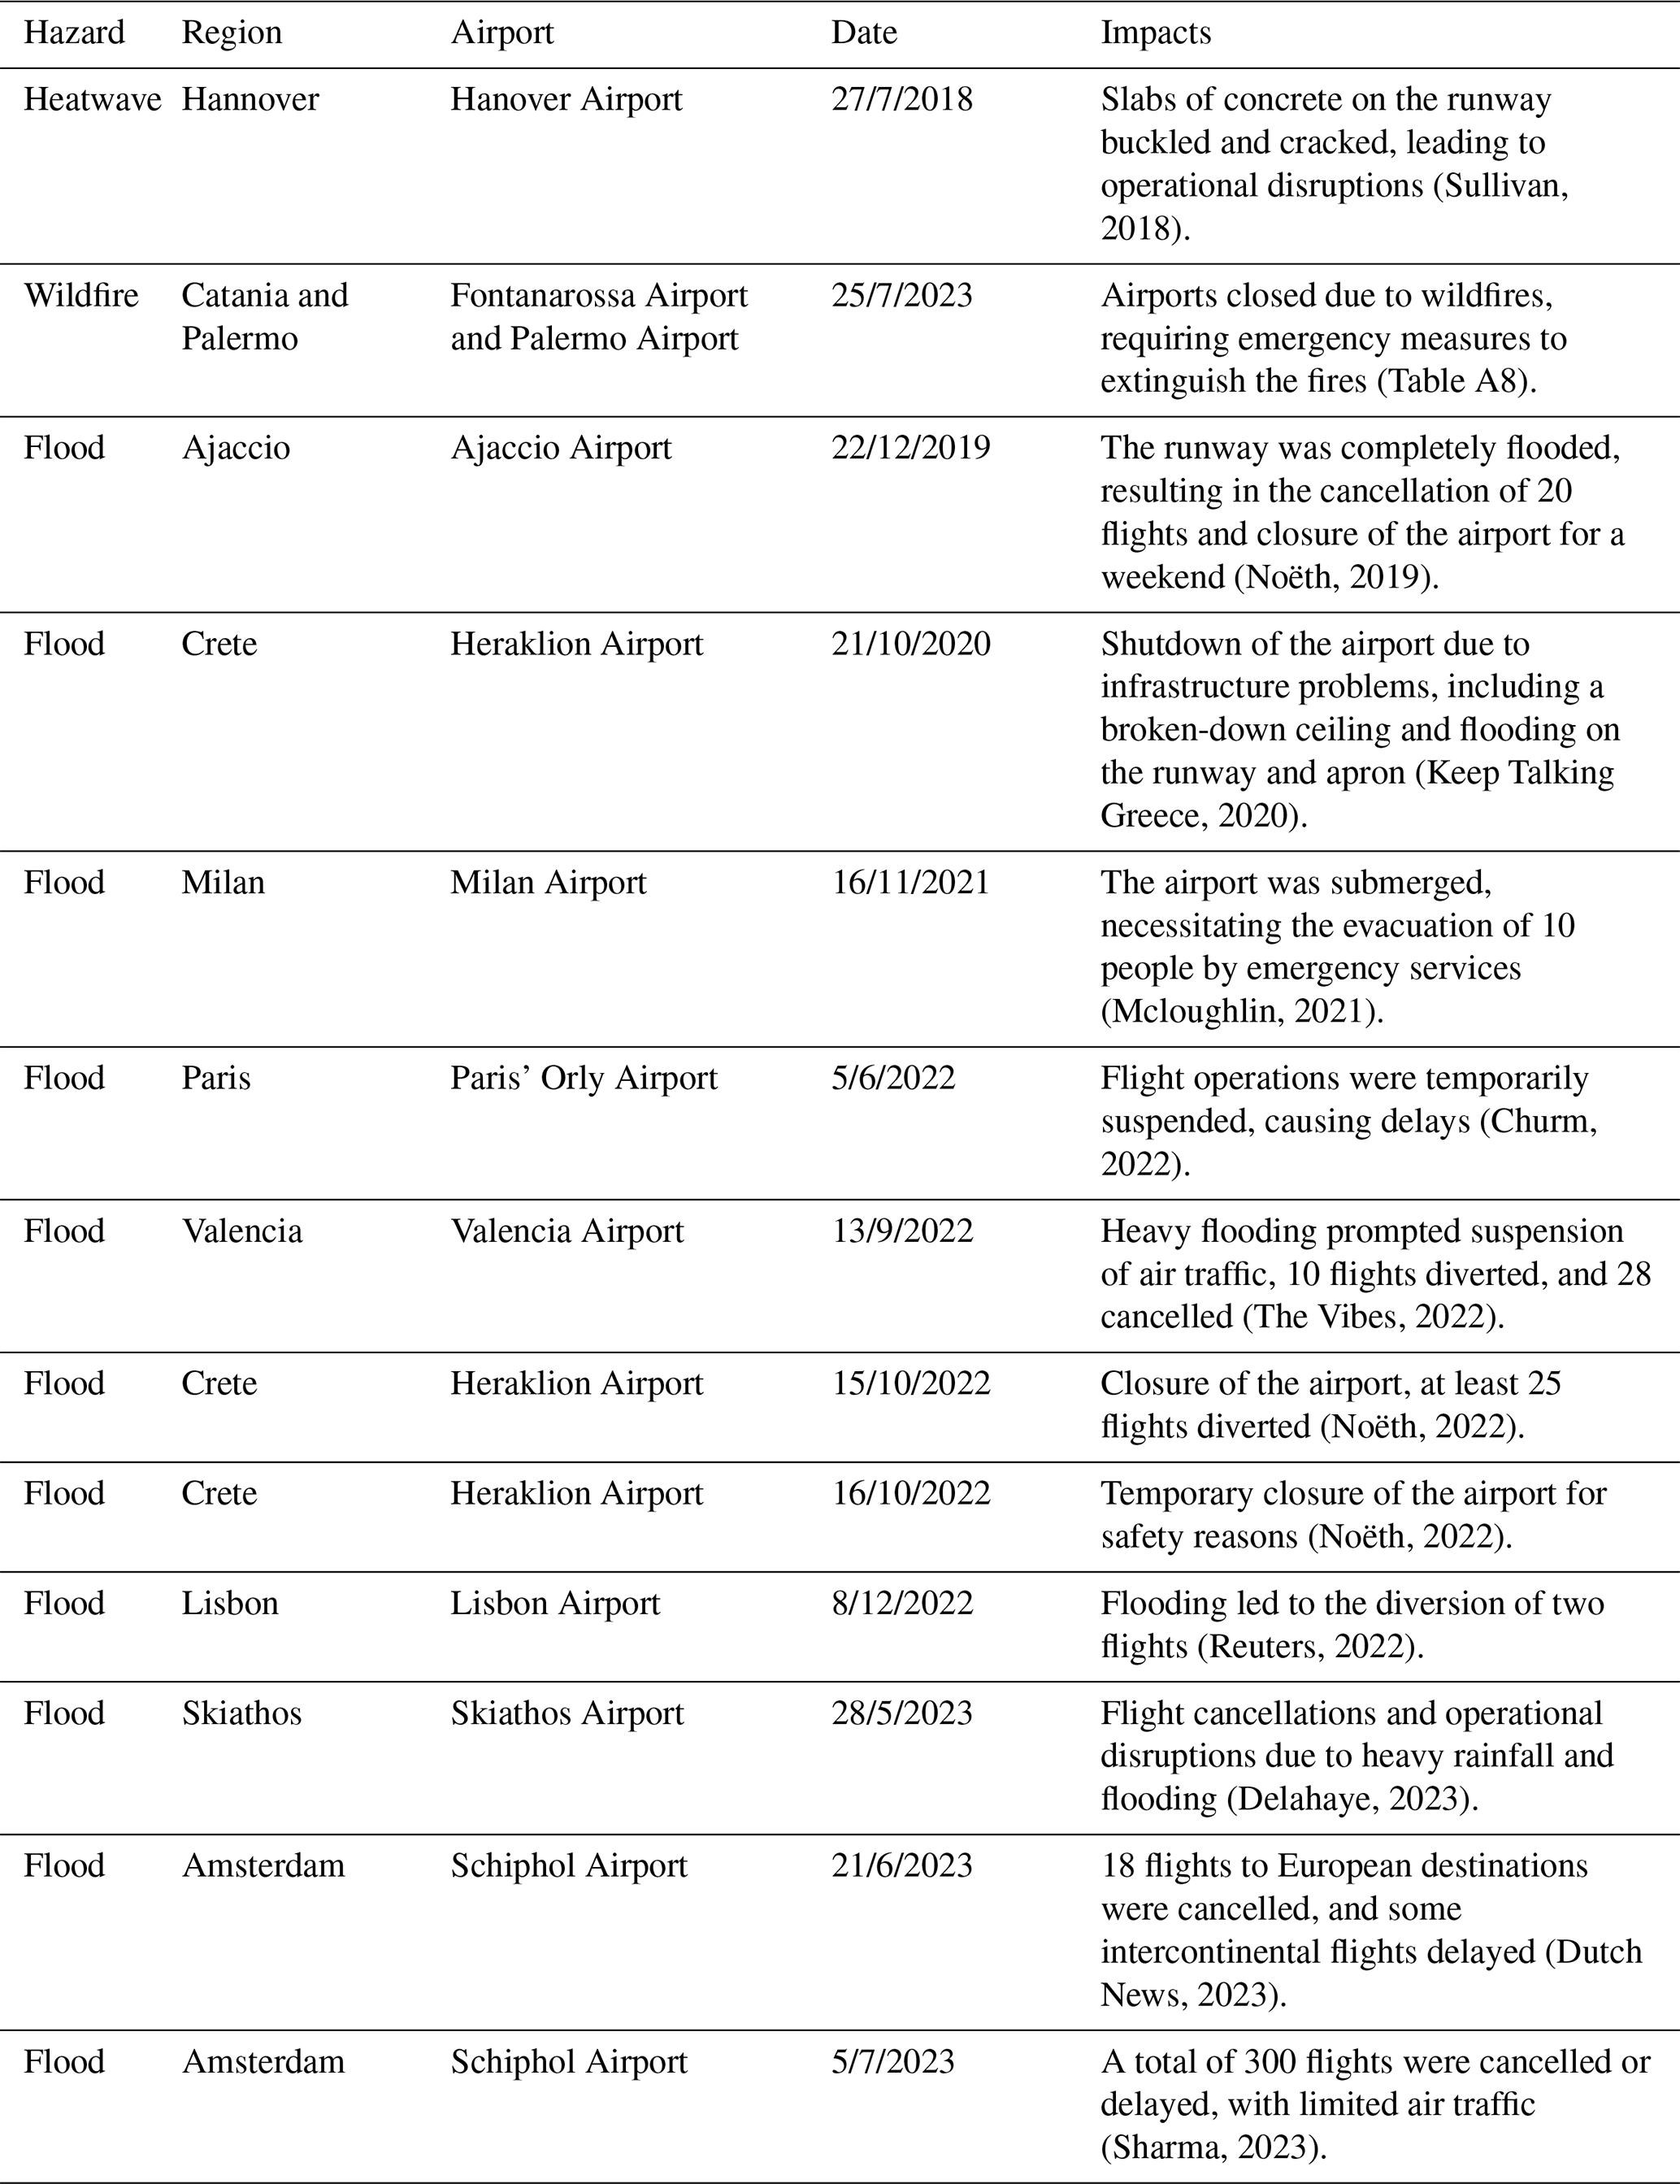
Table A2Examples of extreme weather events impacting maritime transport and port infrastructure.
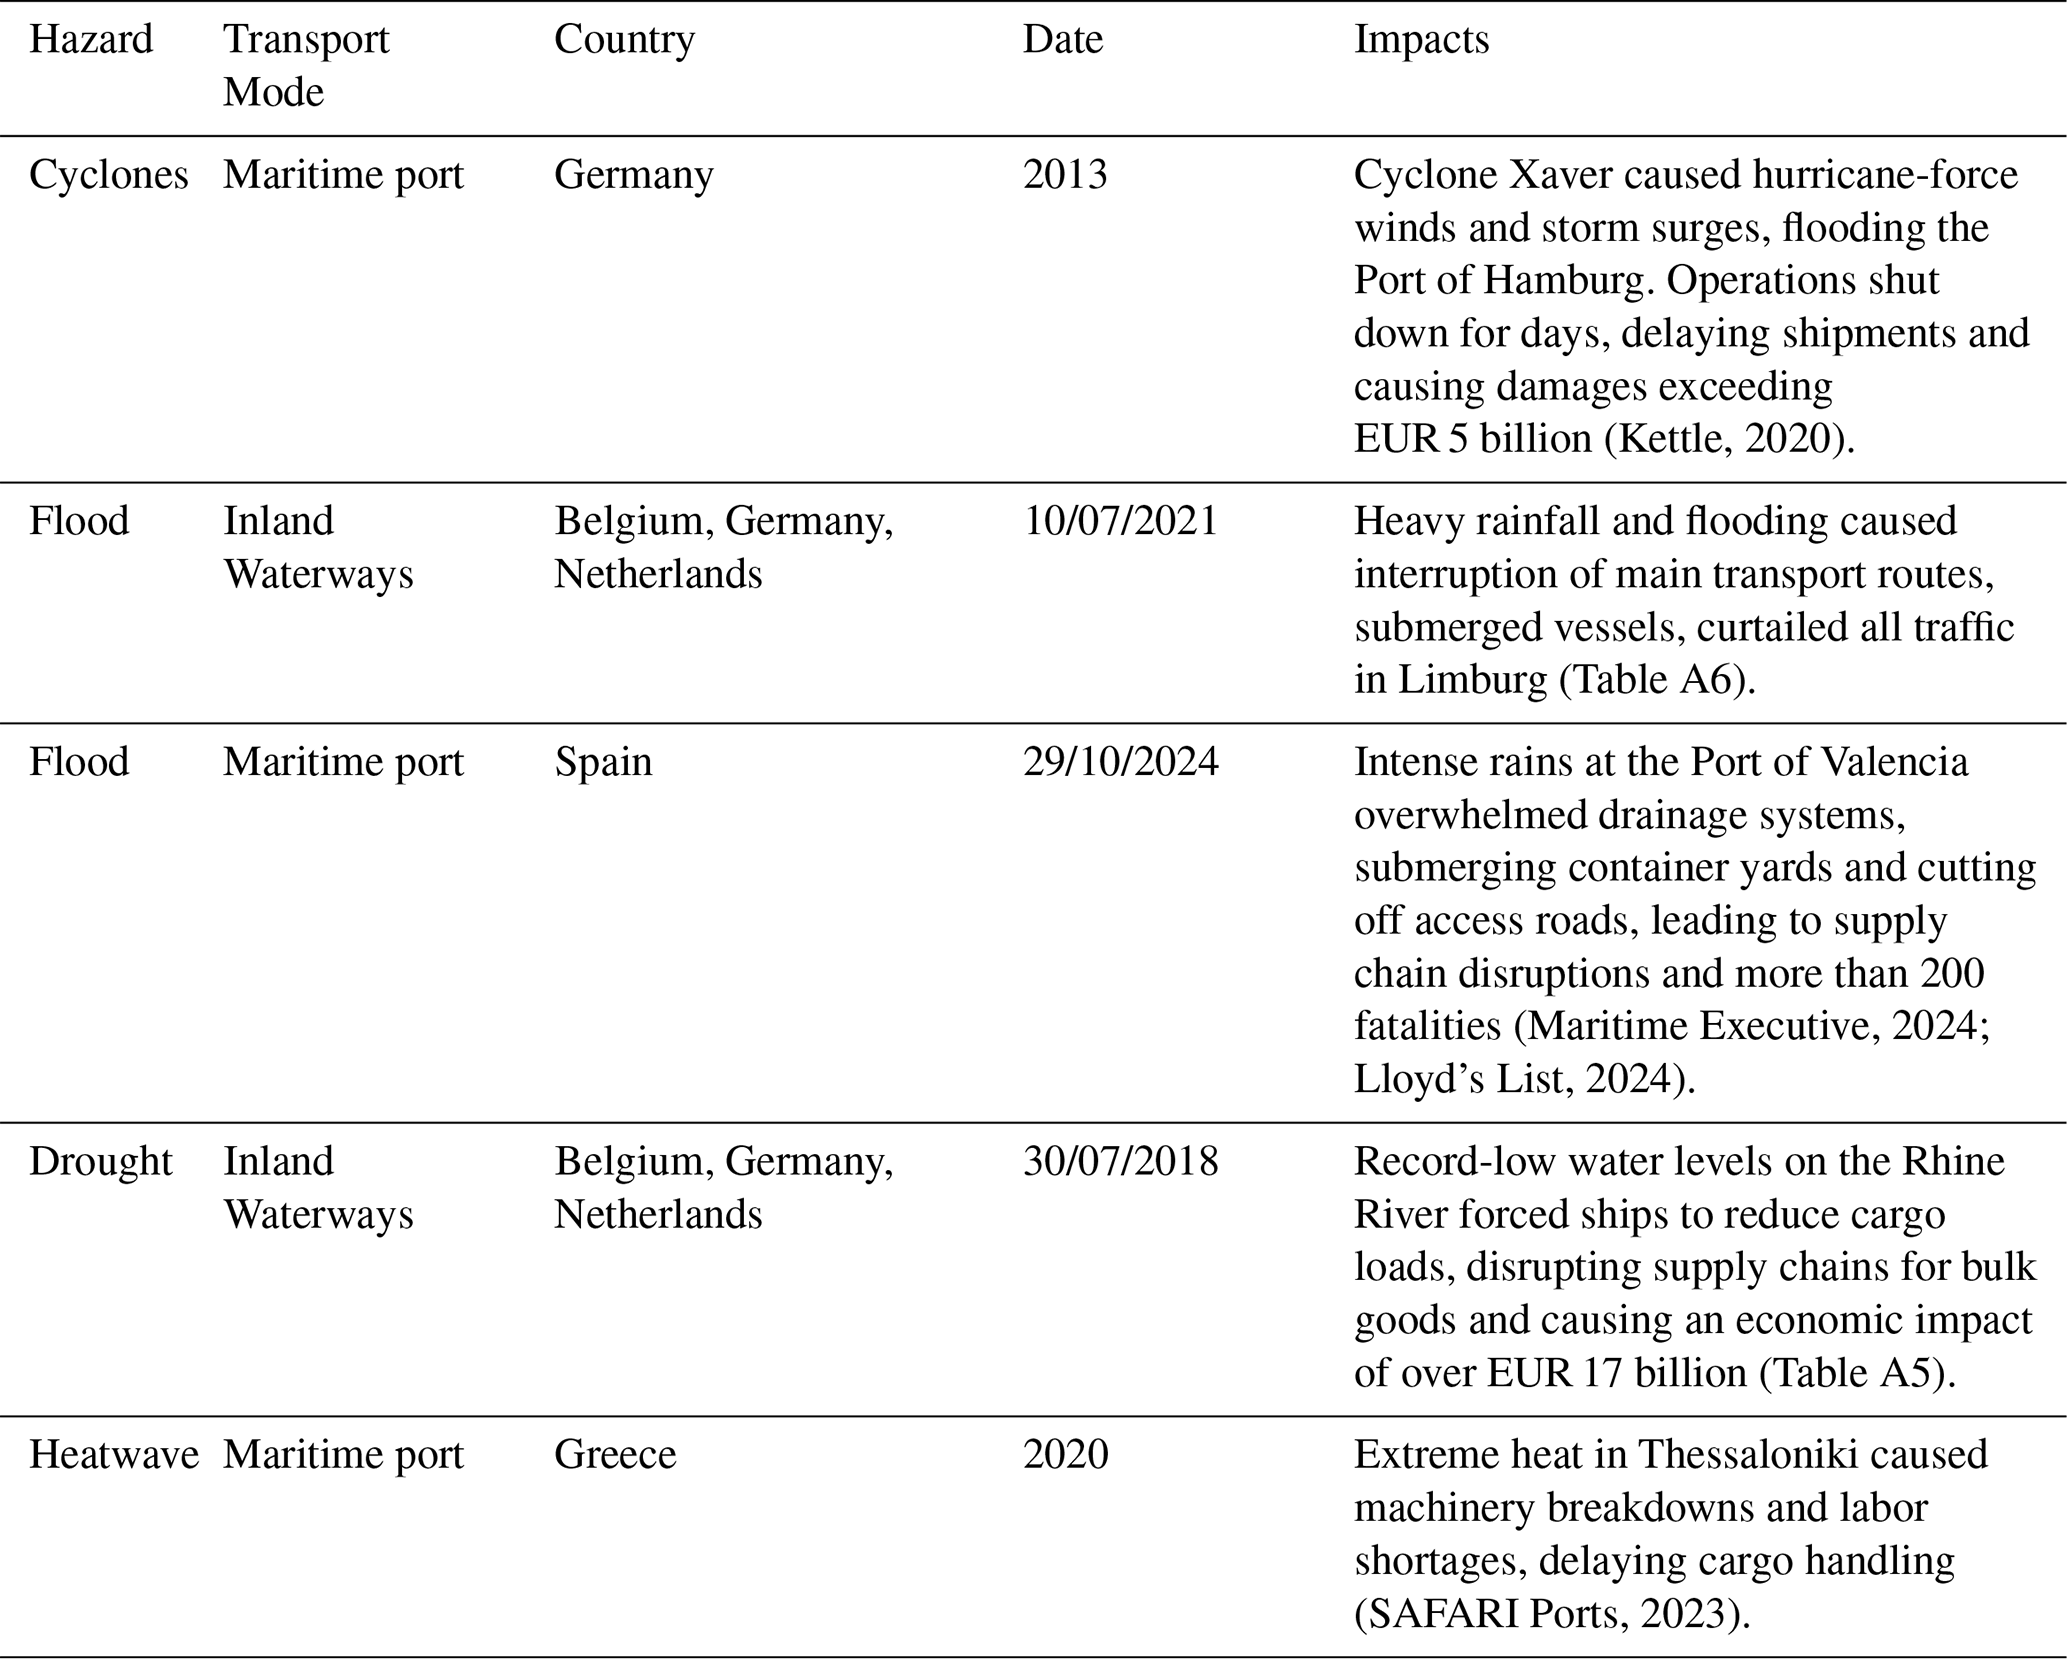
Table A3 Examples of recent transport disruptions to railway and road networks due to various hazards.
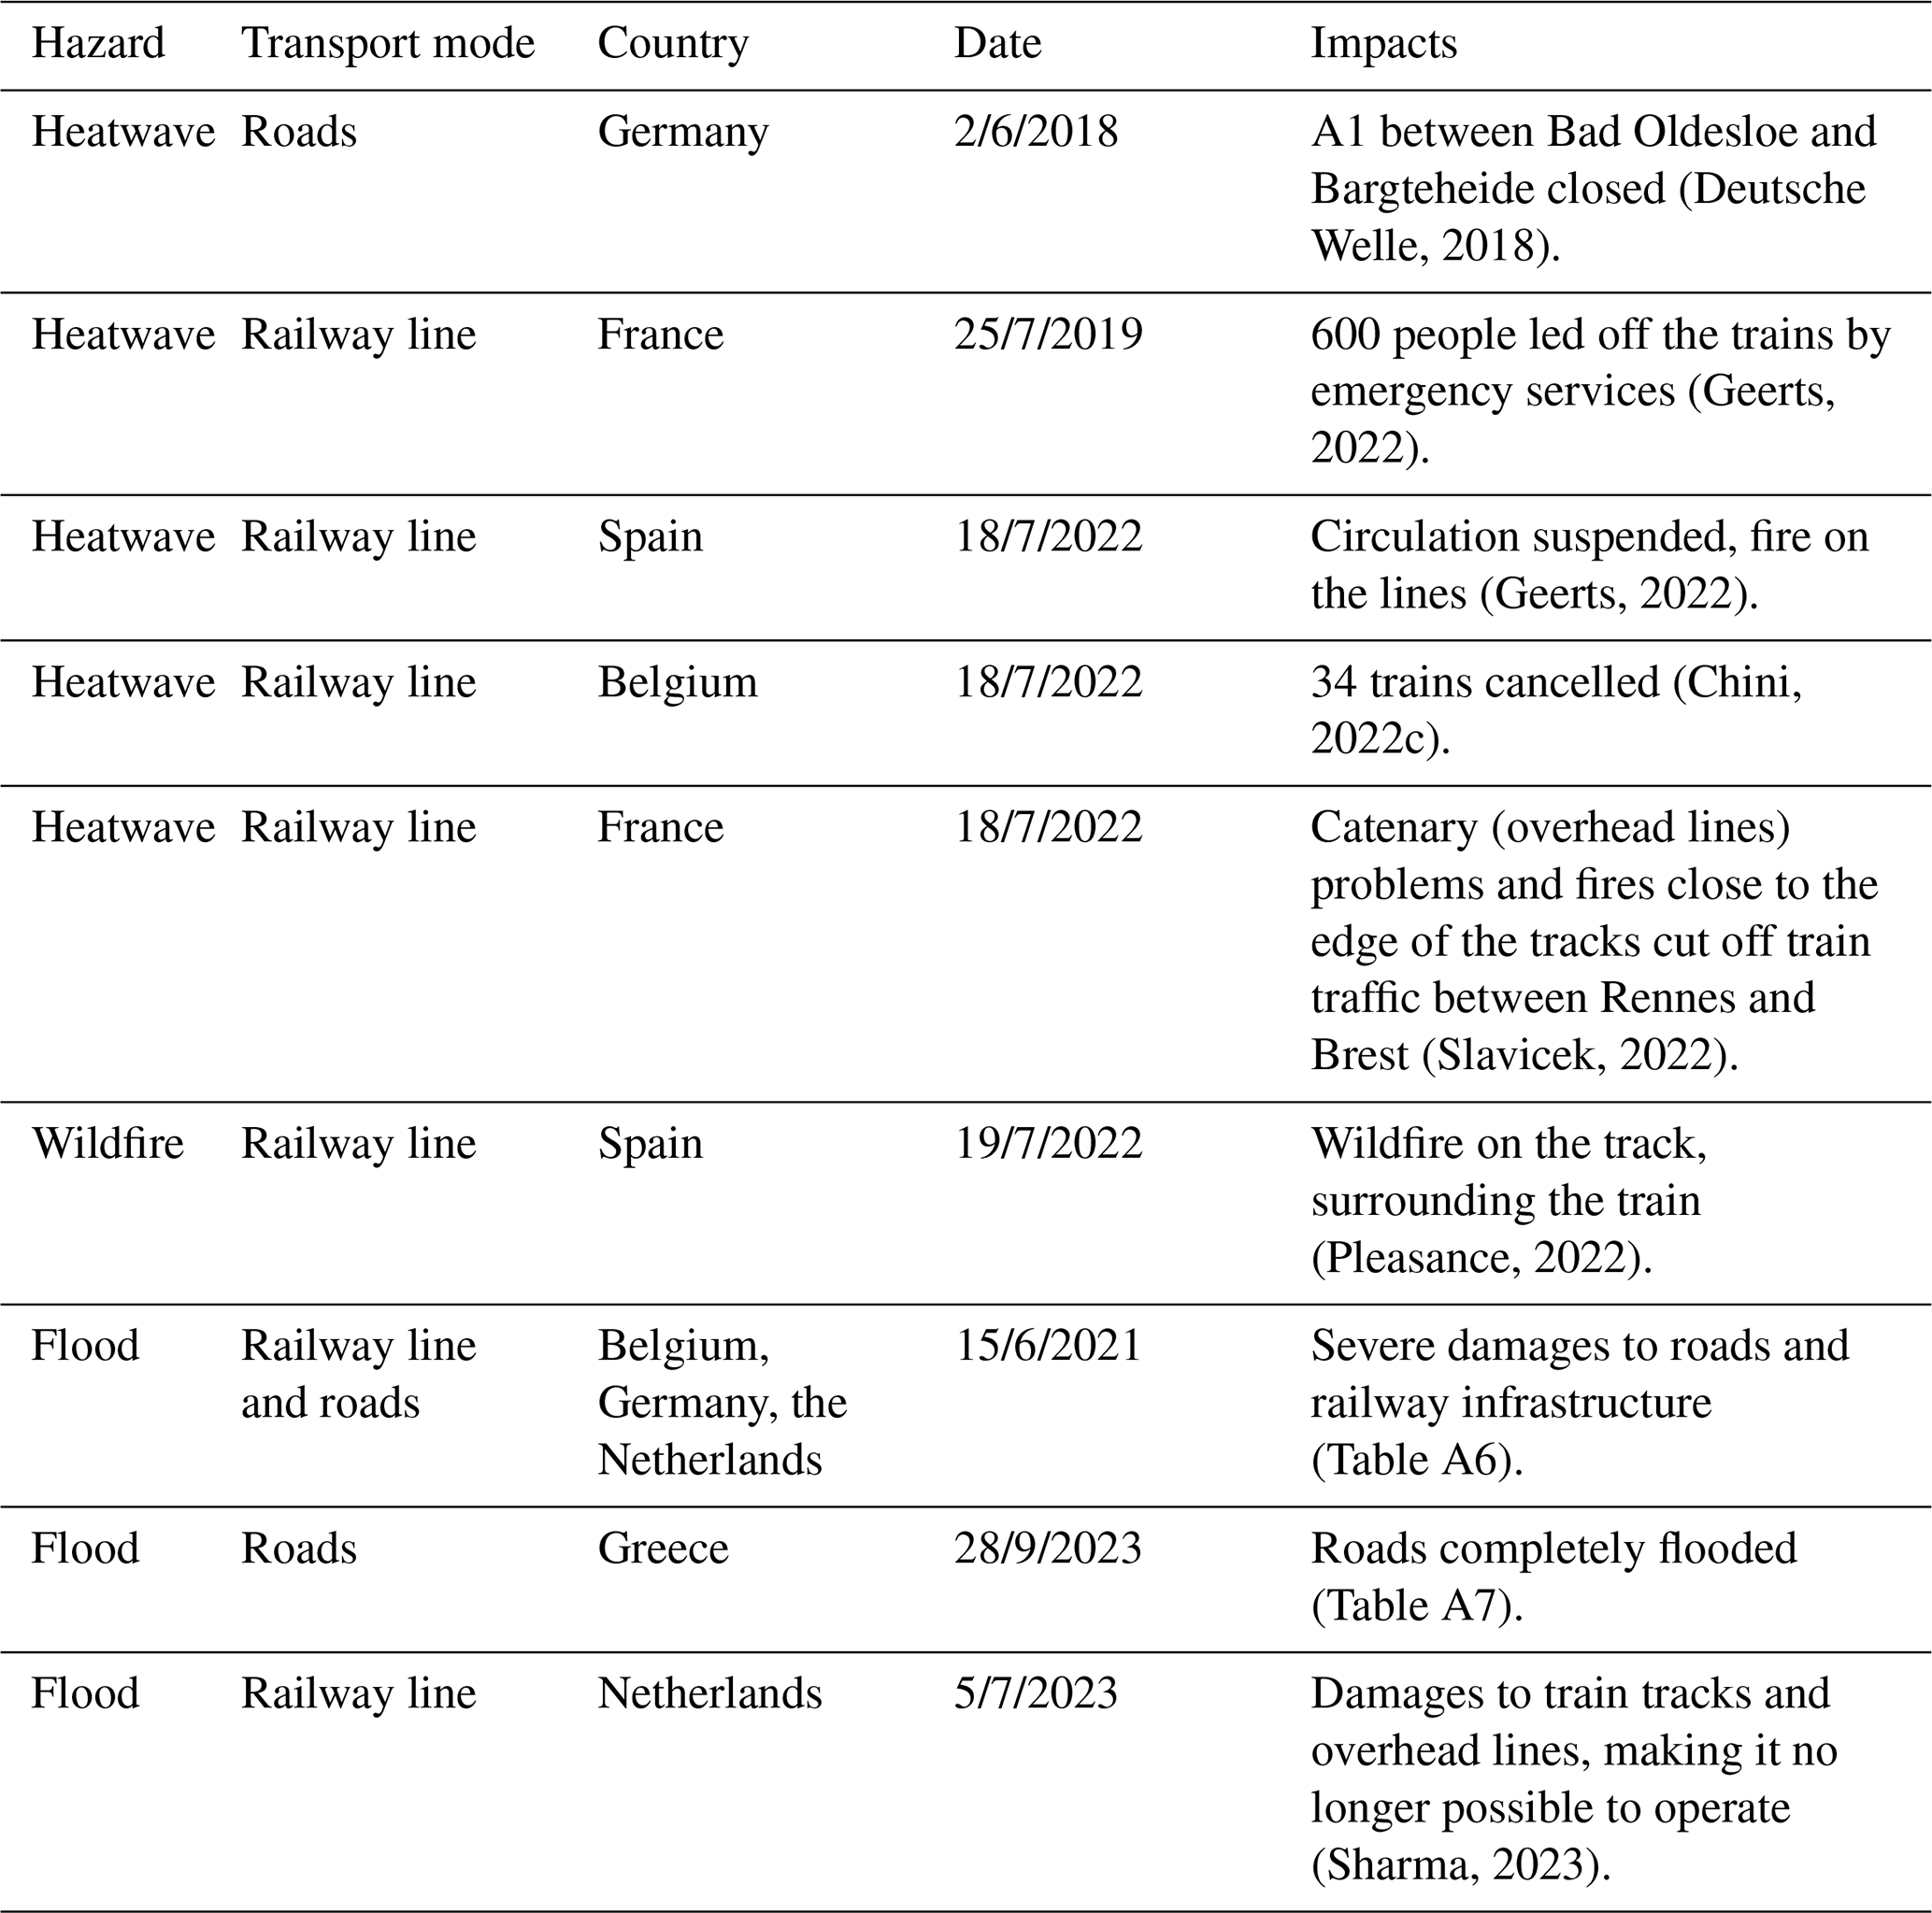
Table A4Summary of reported impacts of coastal floods, flash floods, landslides and windstorms on European transport infrastructure and operations.
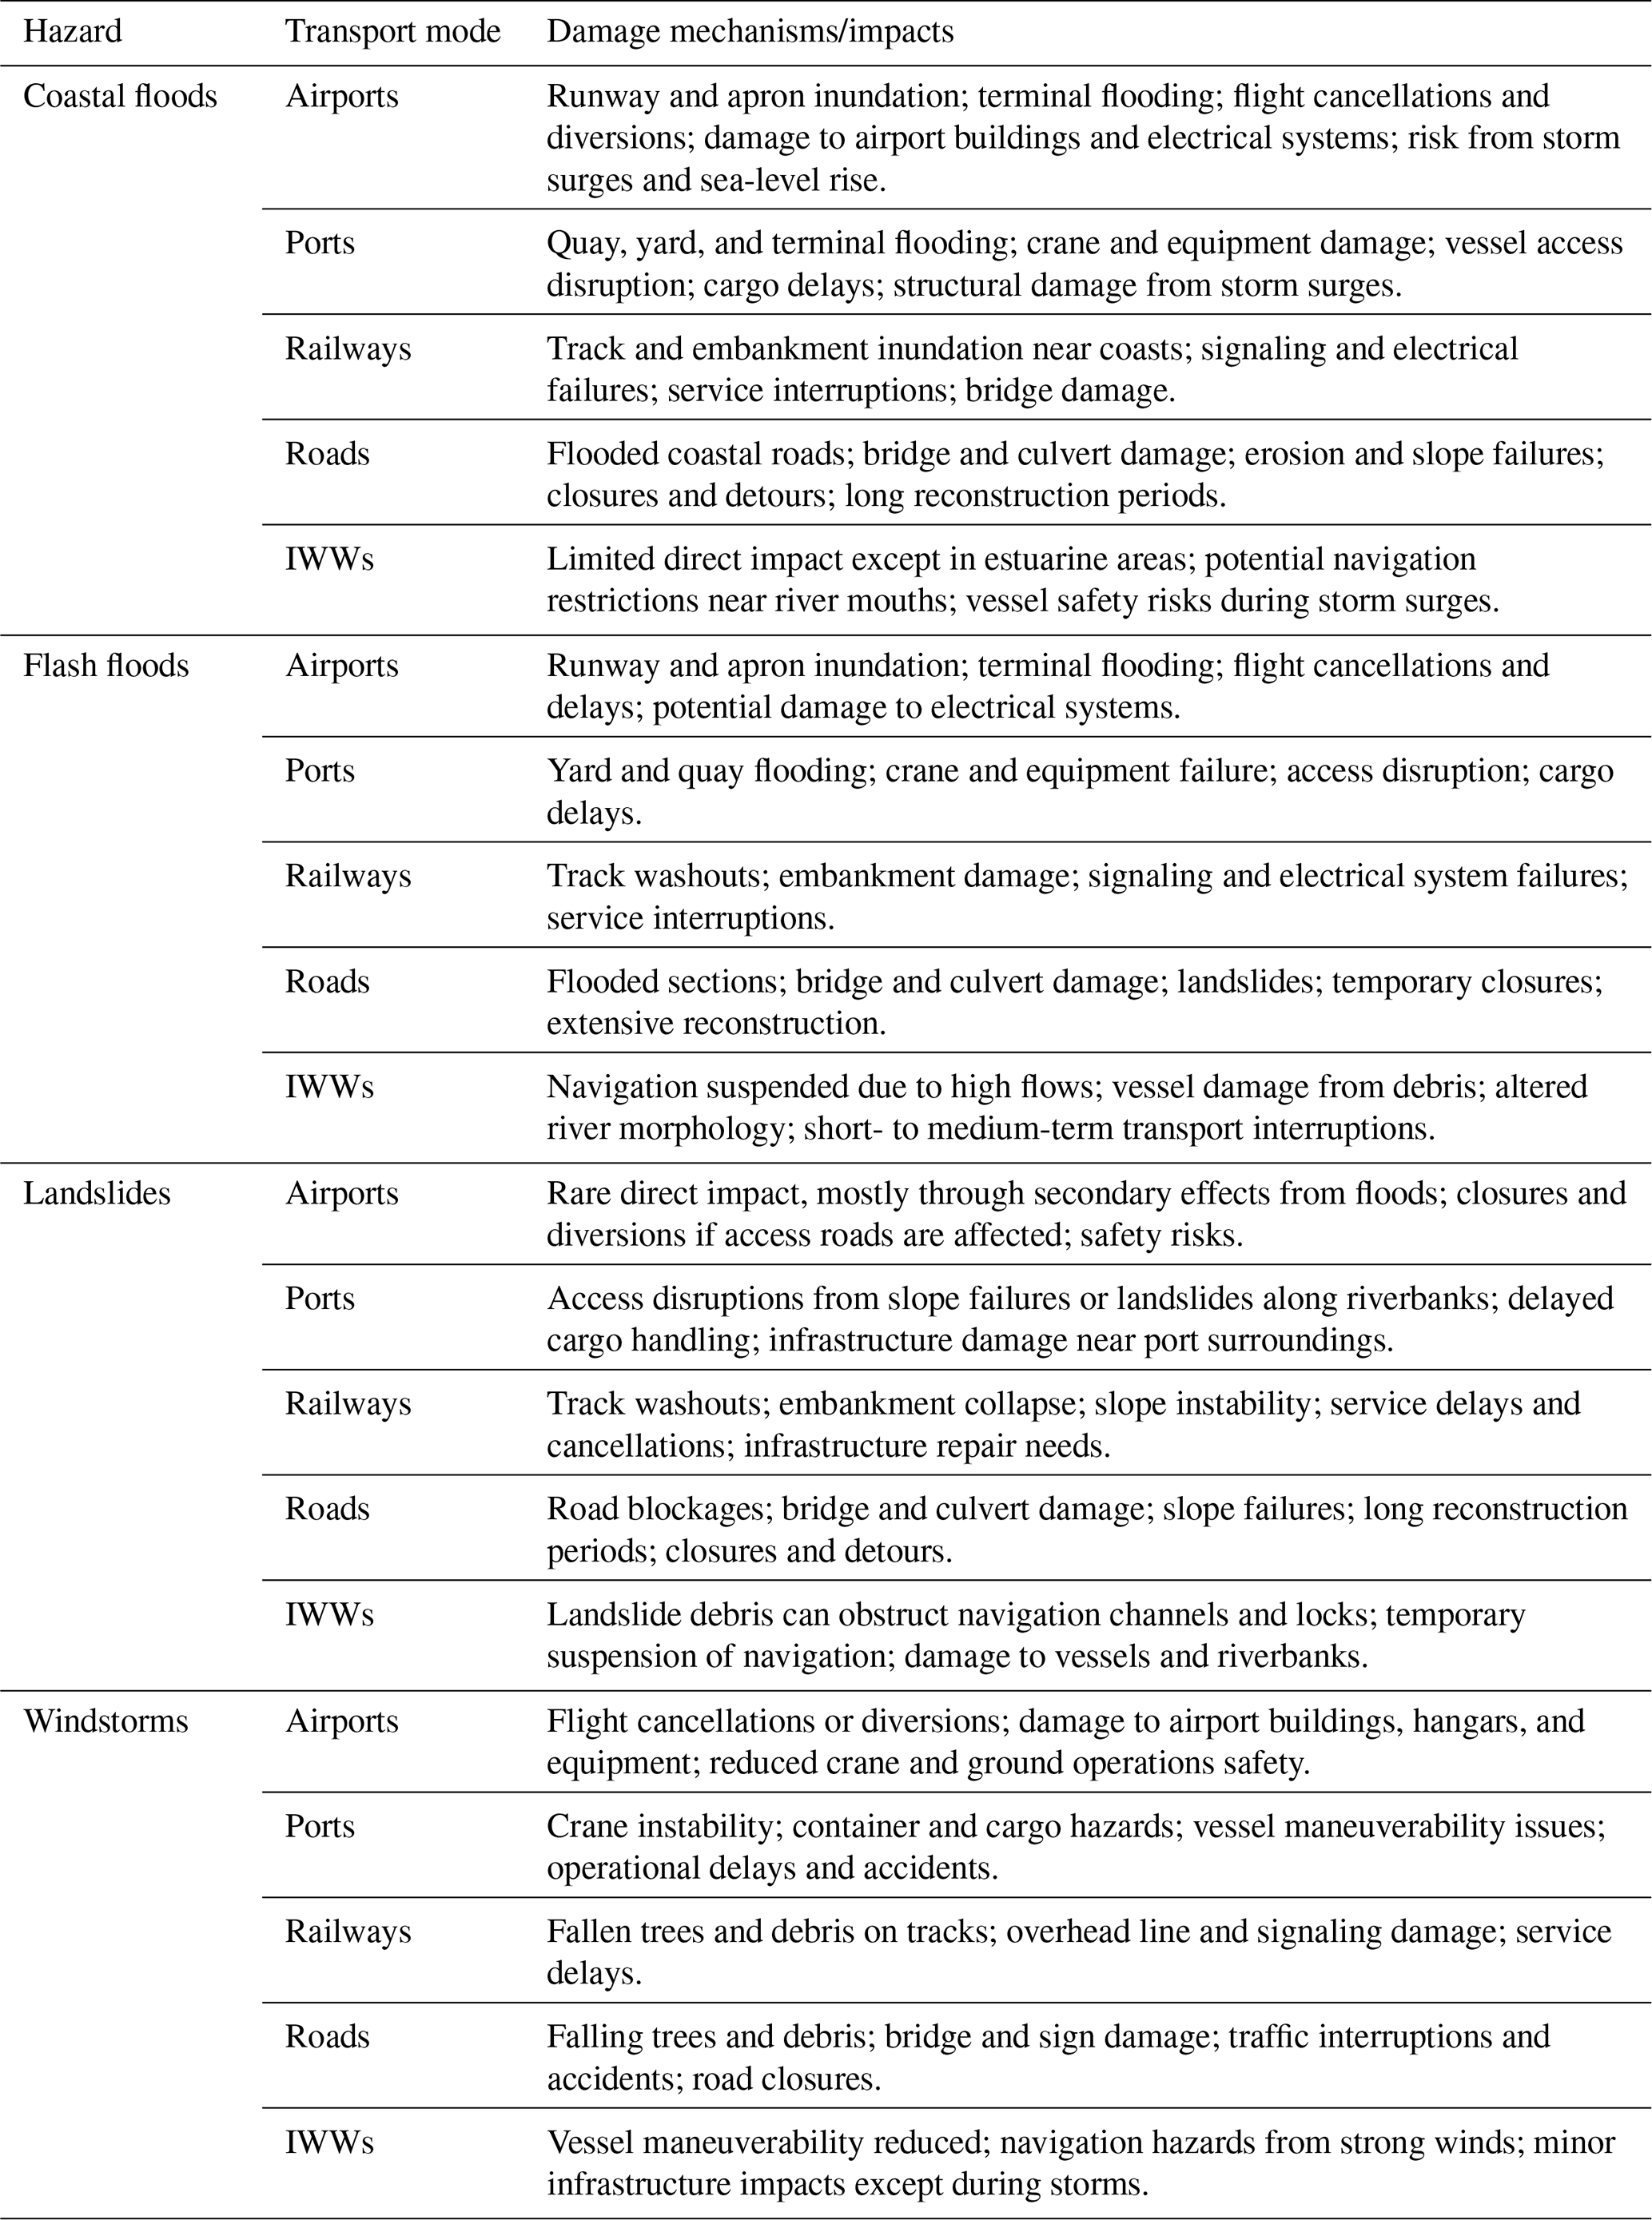
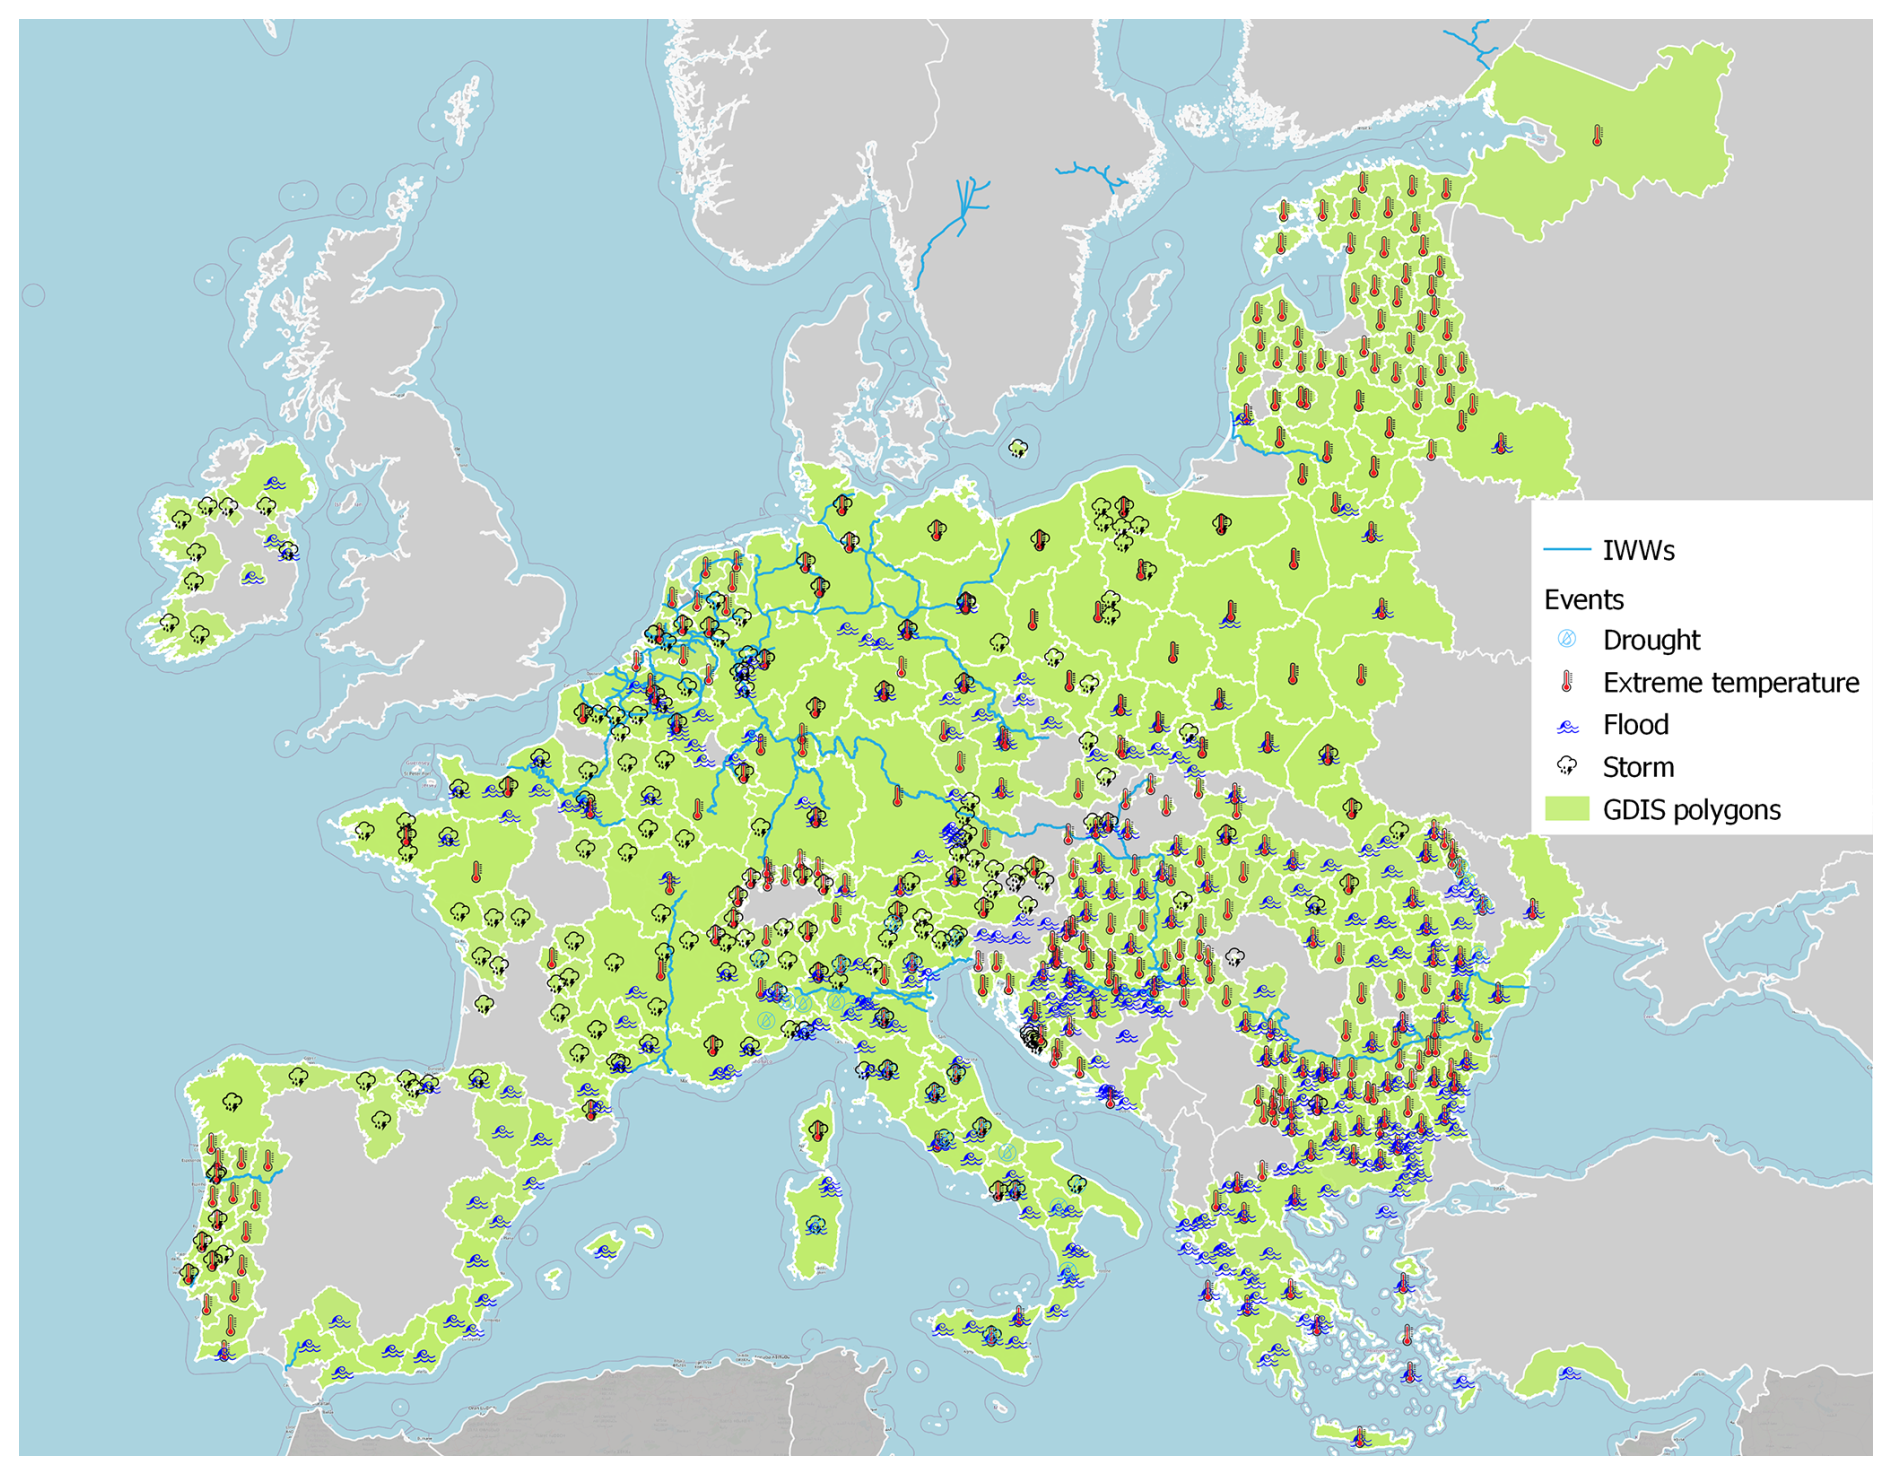
Figure A1 Drought, extreme temperature, flood, and storm events reported in the GDIS database from 2010 to 2018. In green are GDIS polygons of extreme events that fall within, or partially overlap with, EU NUTS regions. The map shows the TEN-T IWWs network.
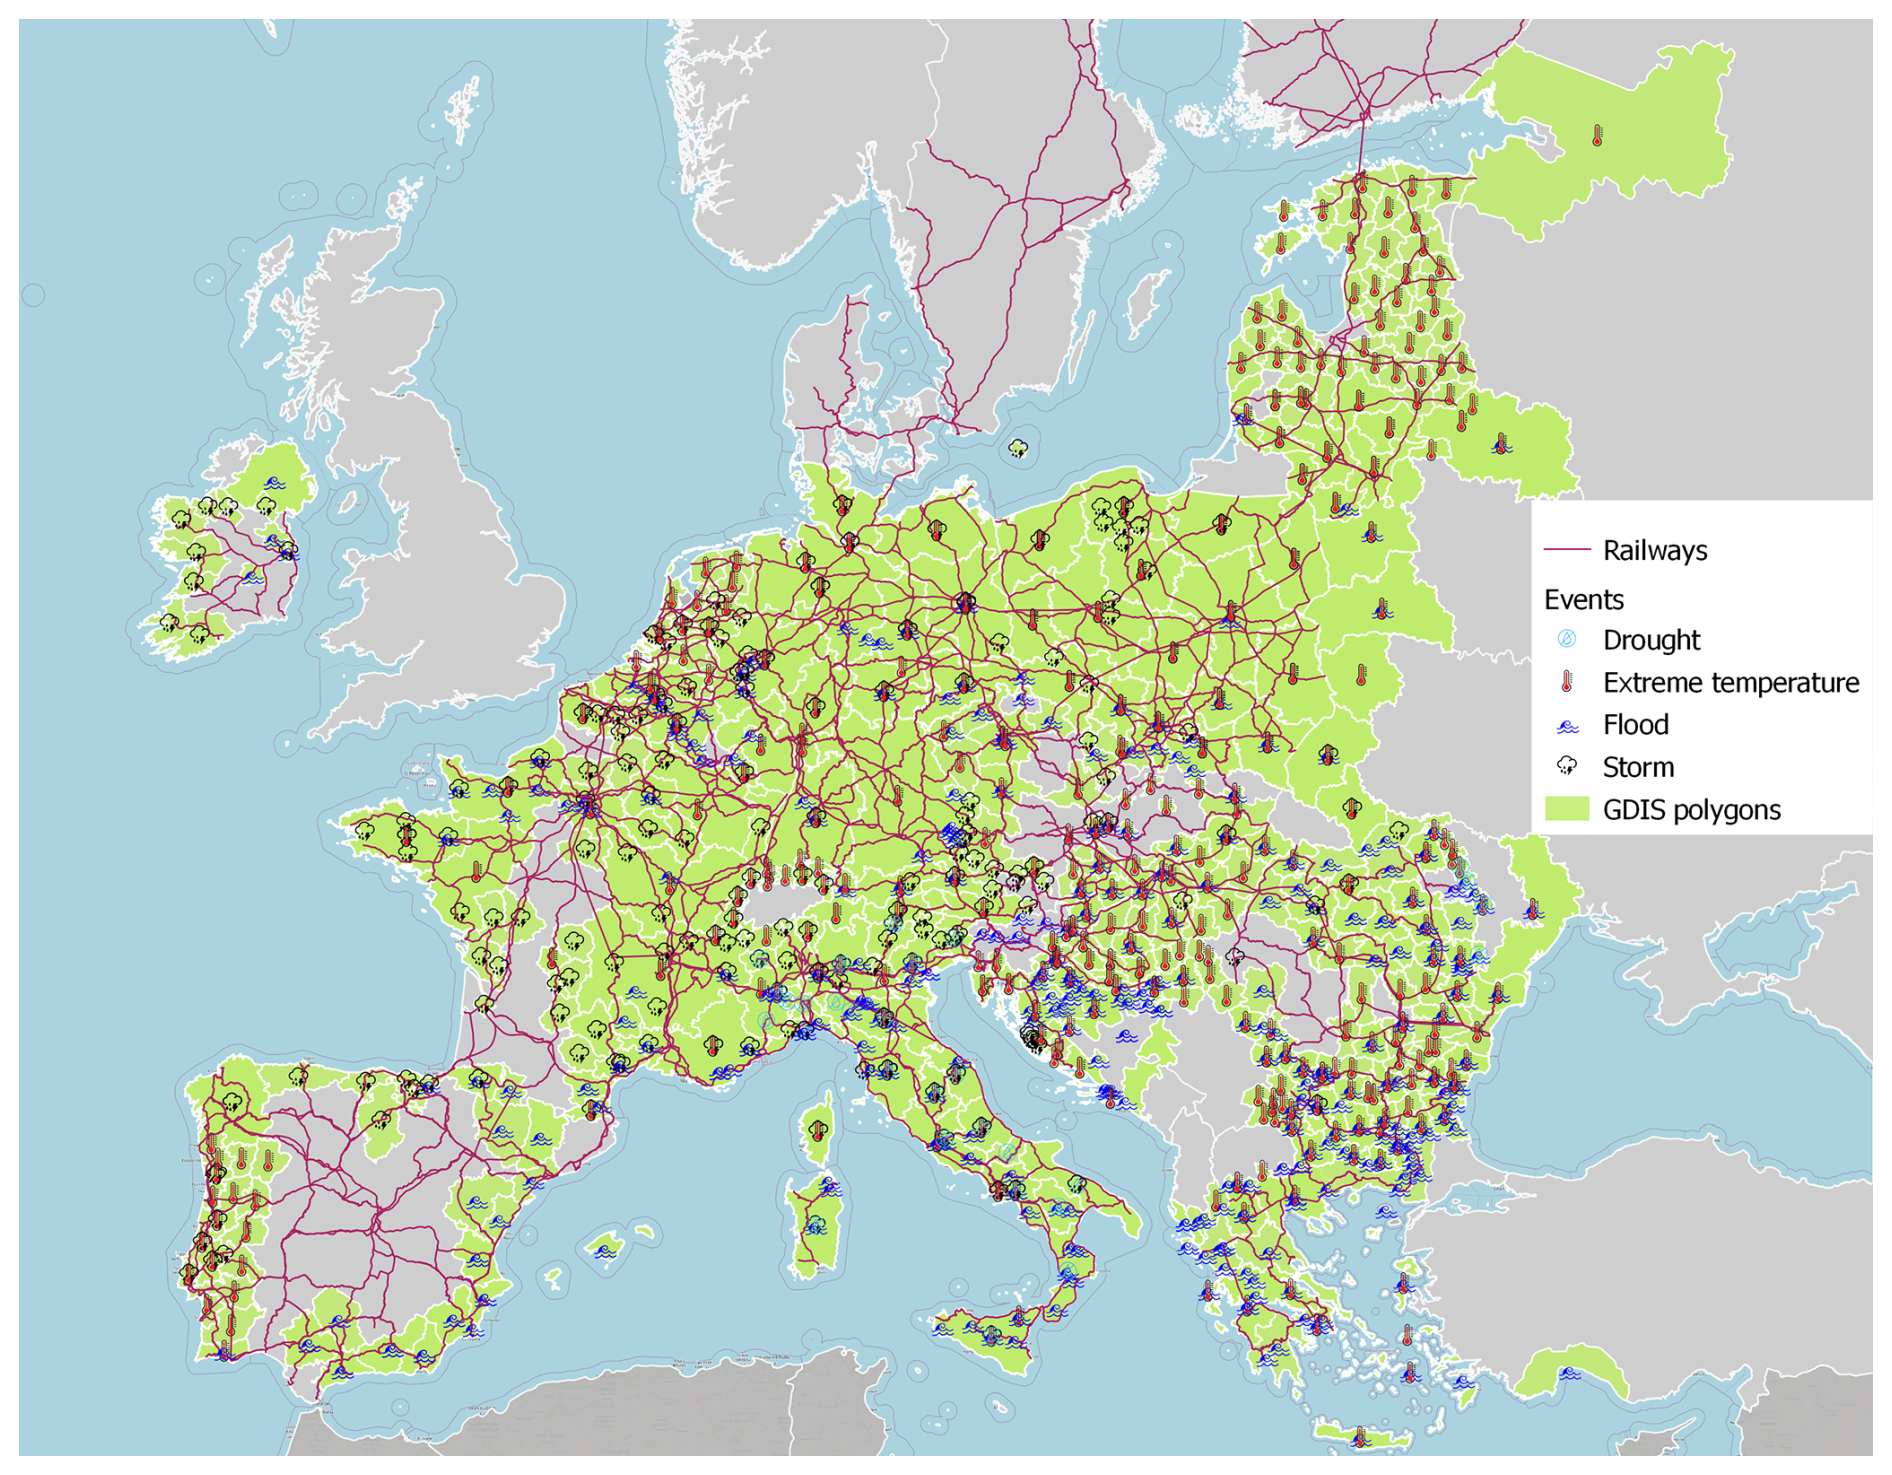
Figure A2 Drought, extreme temperature, flood, and storm events reported in the GDIS database from 2010 to 2018. In green are GDIS polygons of extreme events that fall within, or partially overlap with, EU NUTS regions. The map shows the TEN-T railways network.
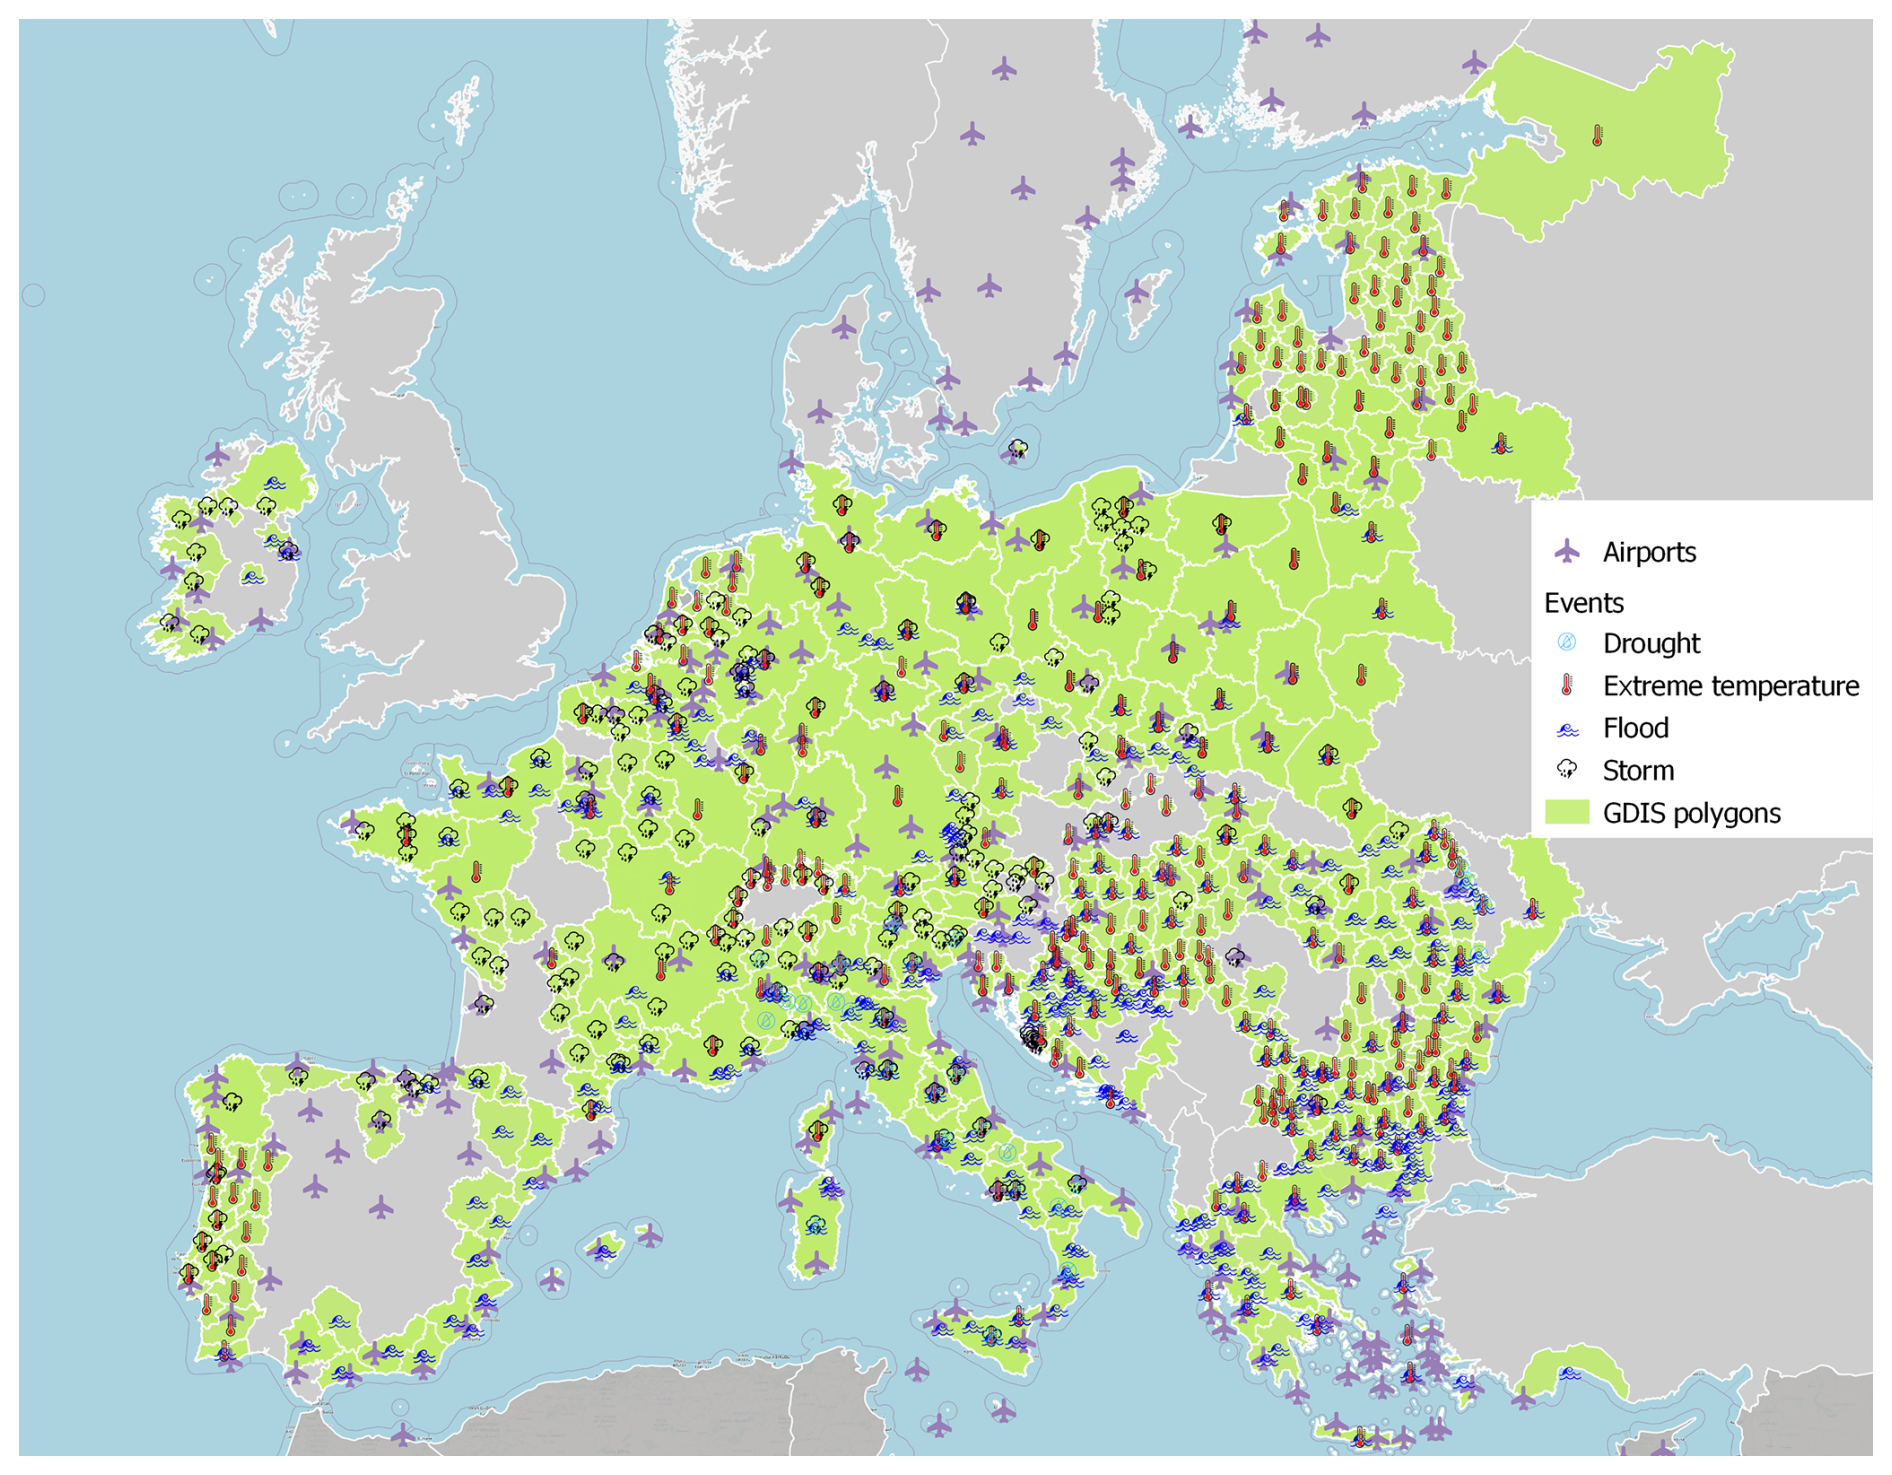
Figure A3 Drought, extreme temperature, flood, and storm events reported in the GDIS database from 2010 to 2018. In green are GDIS polygons of extreme events that fall within, or partially overlap with, EU NUTS regions. The map shows the TEN-T airports positions.
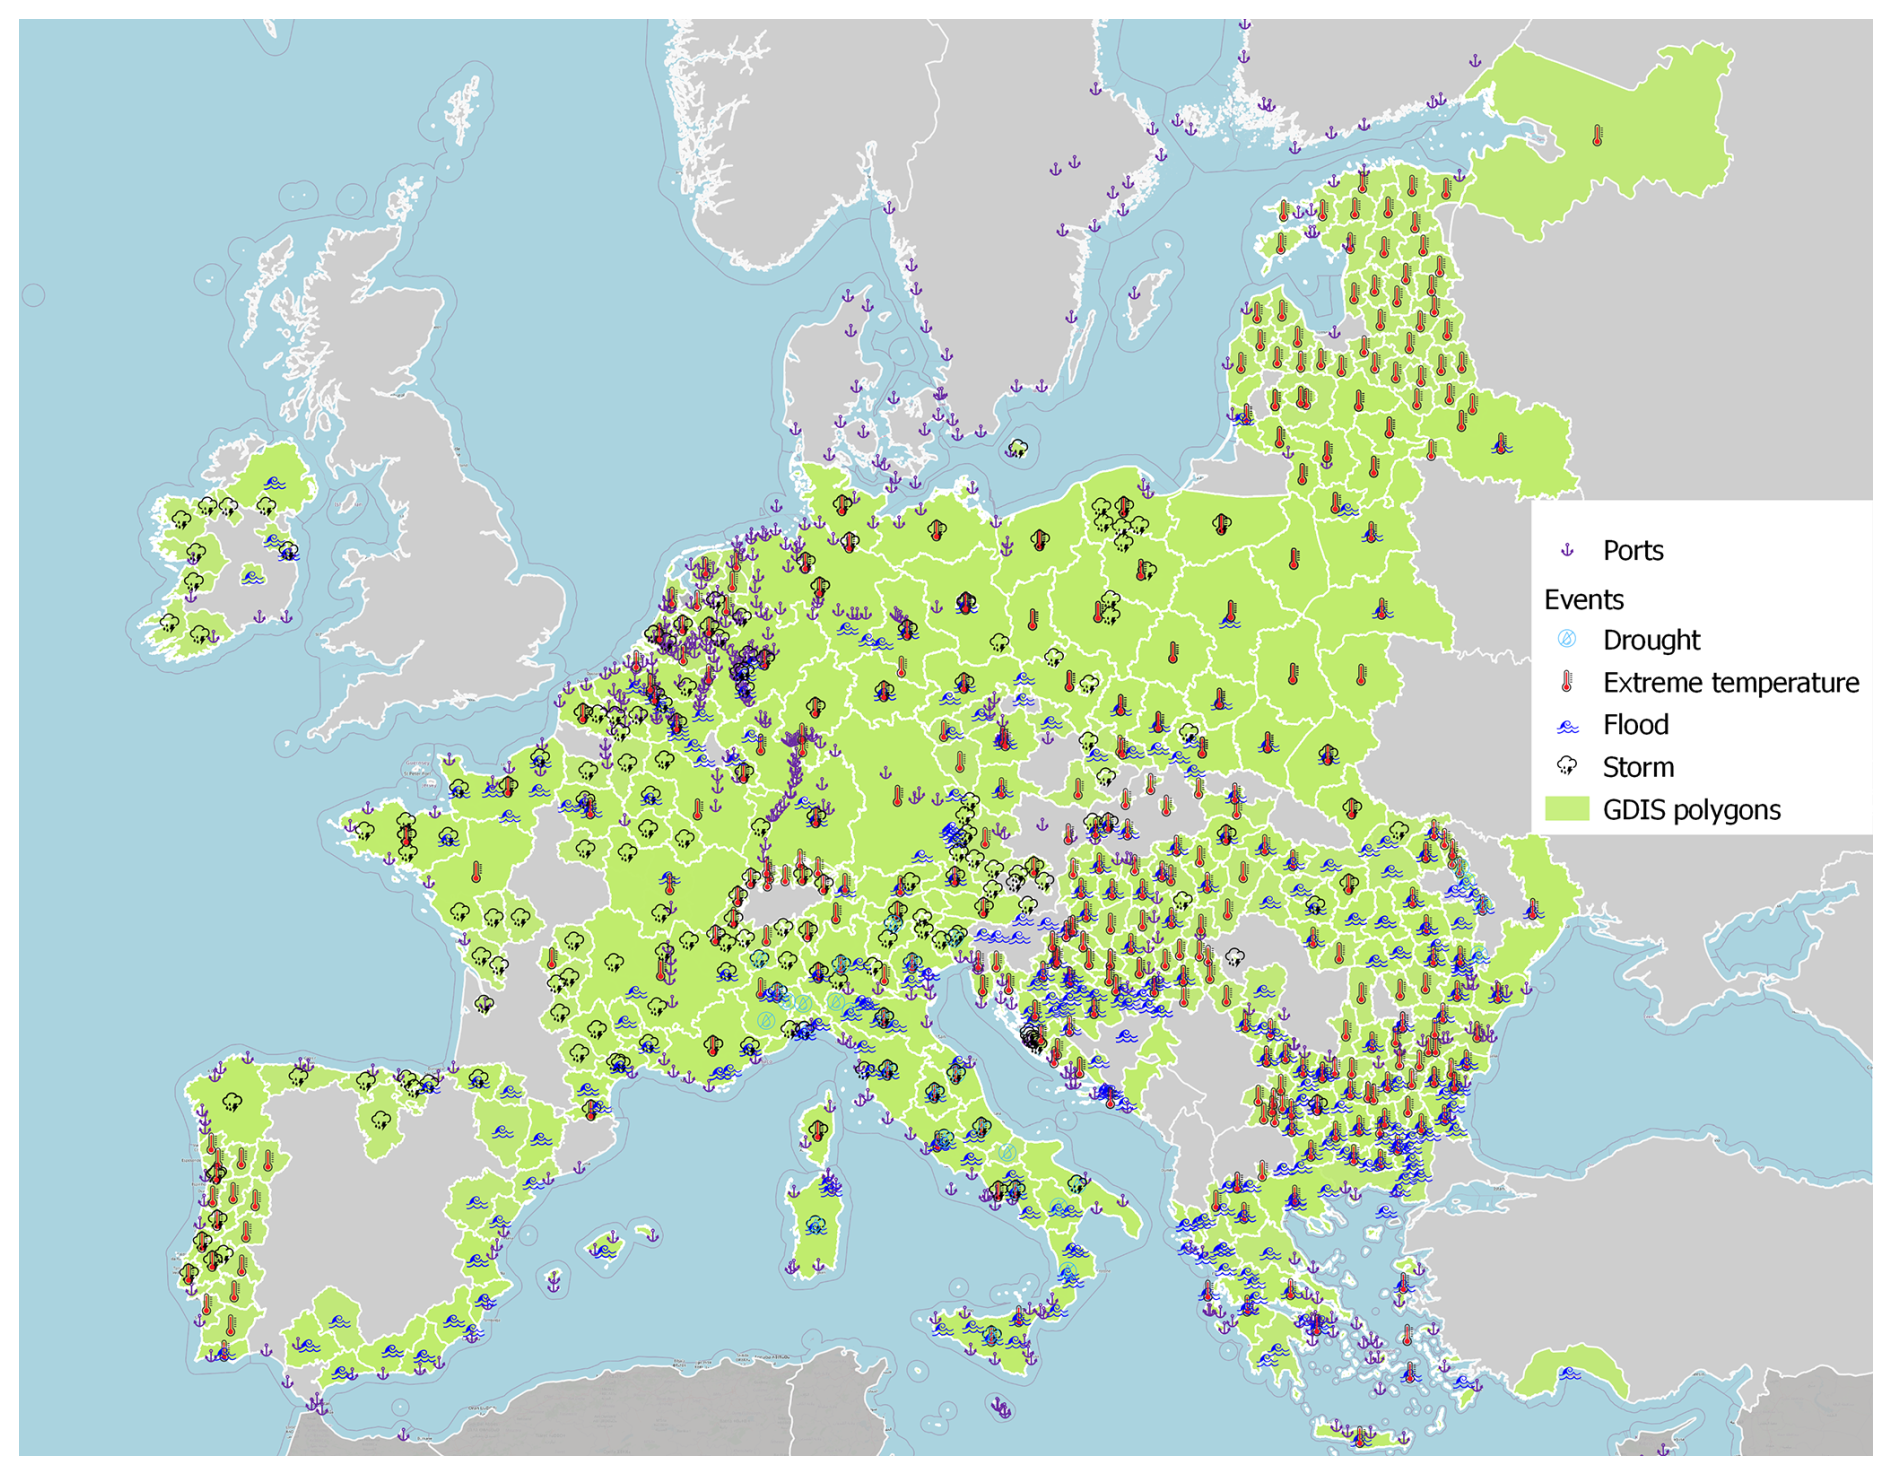
Figure A4 Drought, extreme temperature, flood, and storm events reported in the GDIS database from 2010 to 2018. In green are the polygons of events that intersect or fall within European boundaries. The map shows the TEN-T ports positions.
Table A5A detailed overview of the 2018 heat and drought event in Germany, including its impacts, economic losses, and contributing climate change factors.
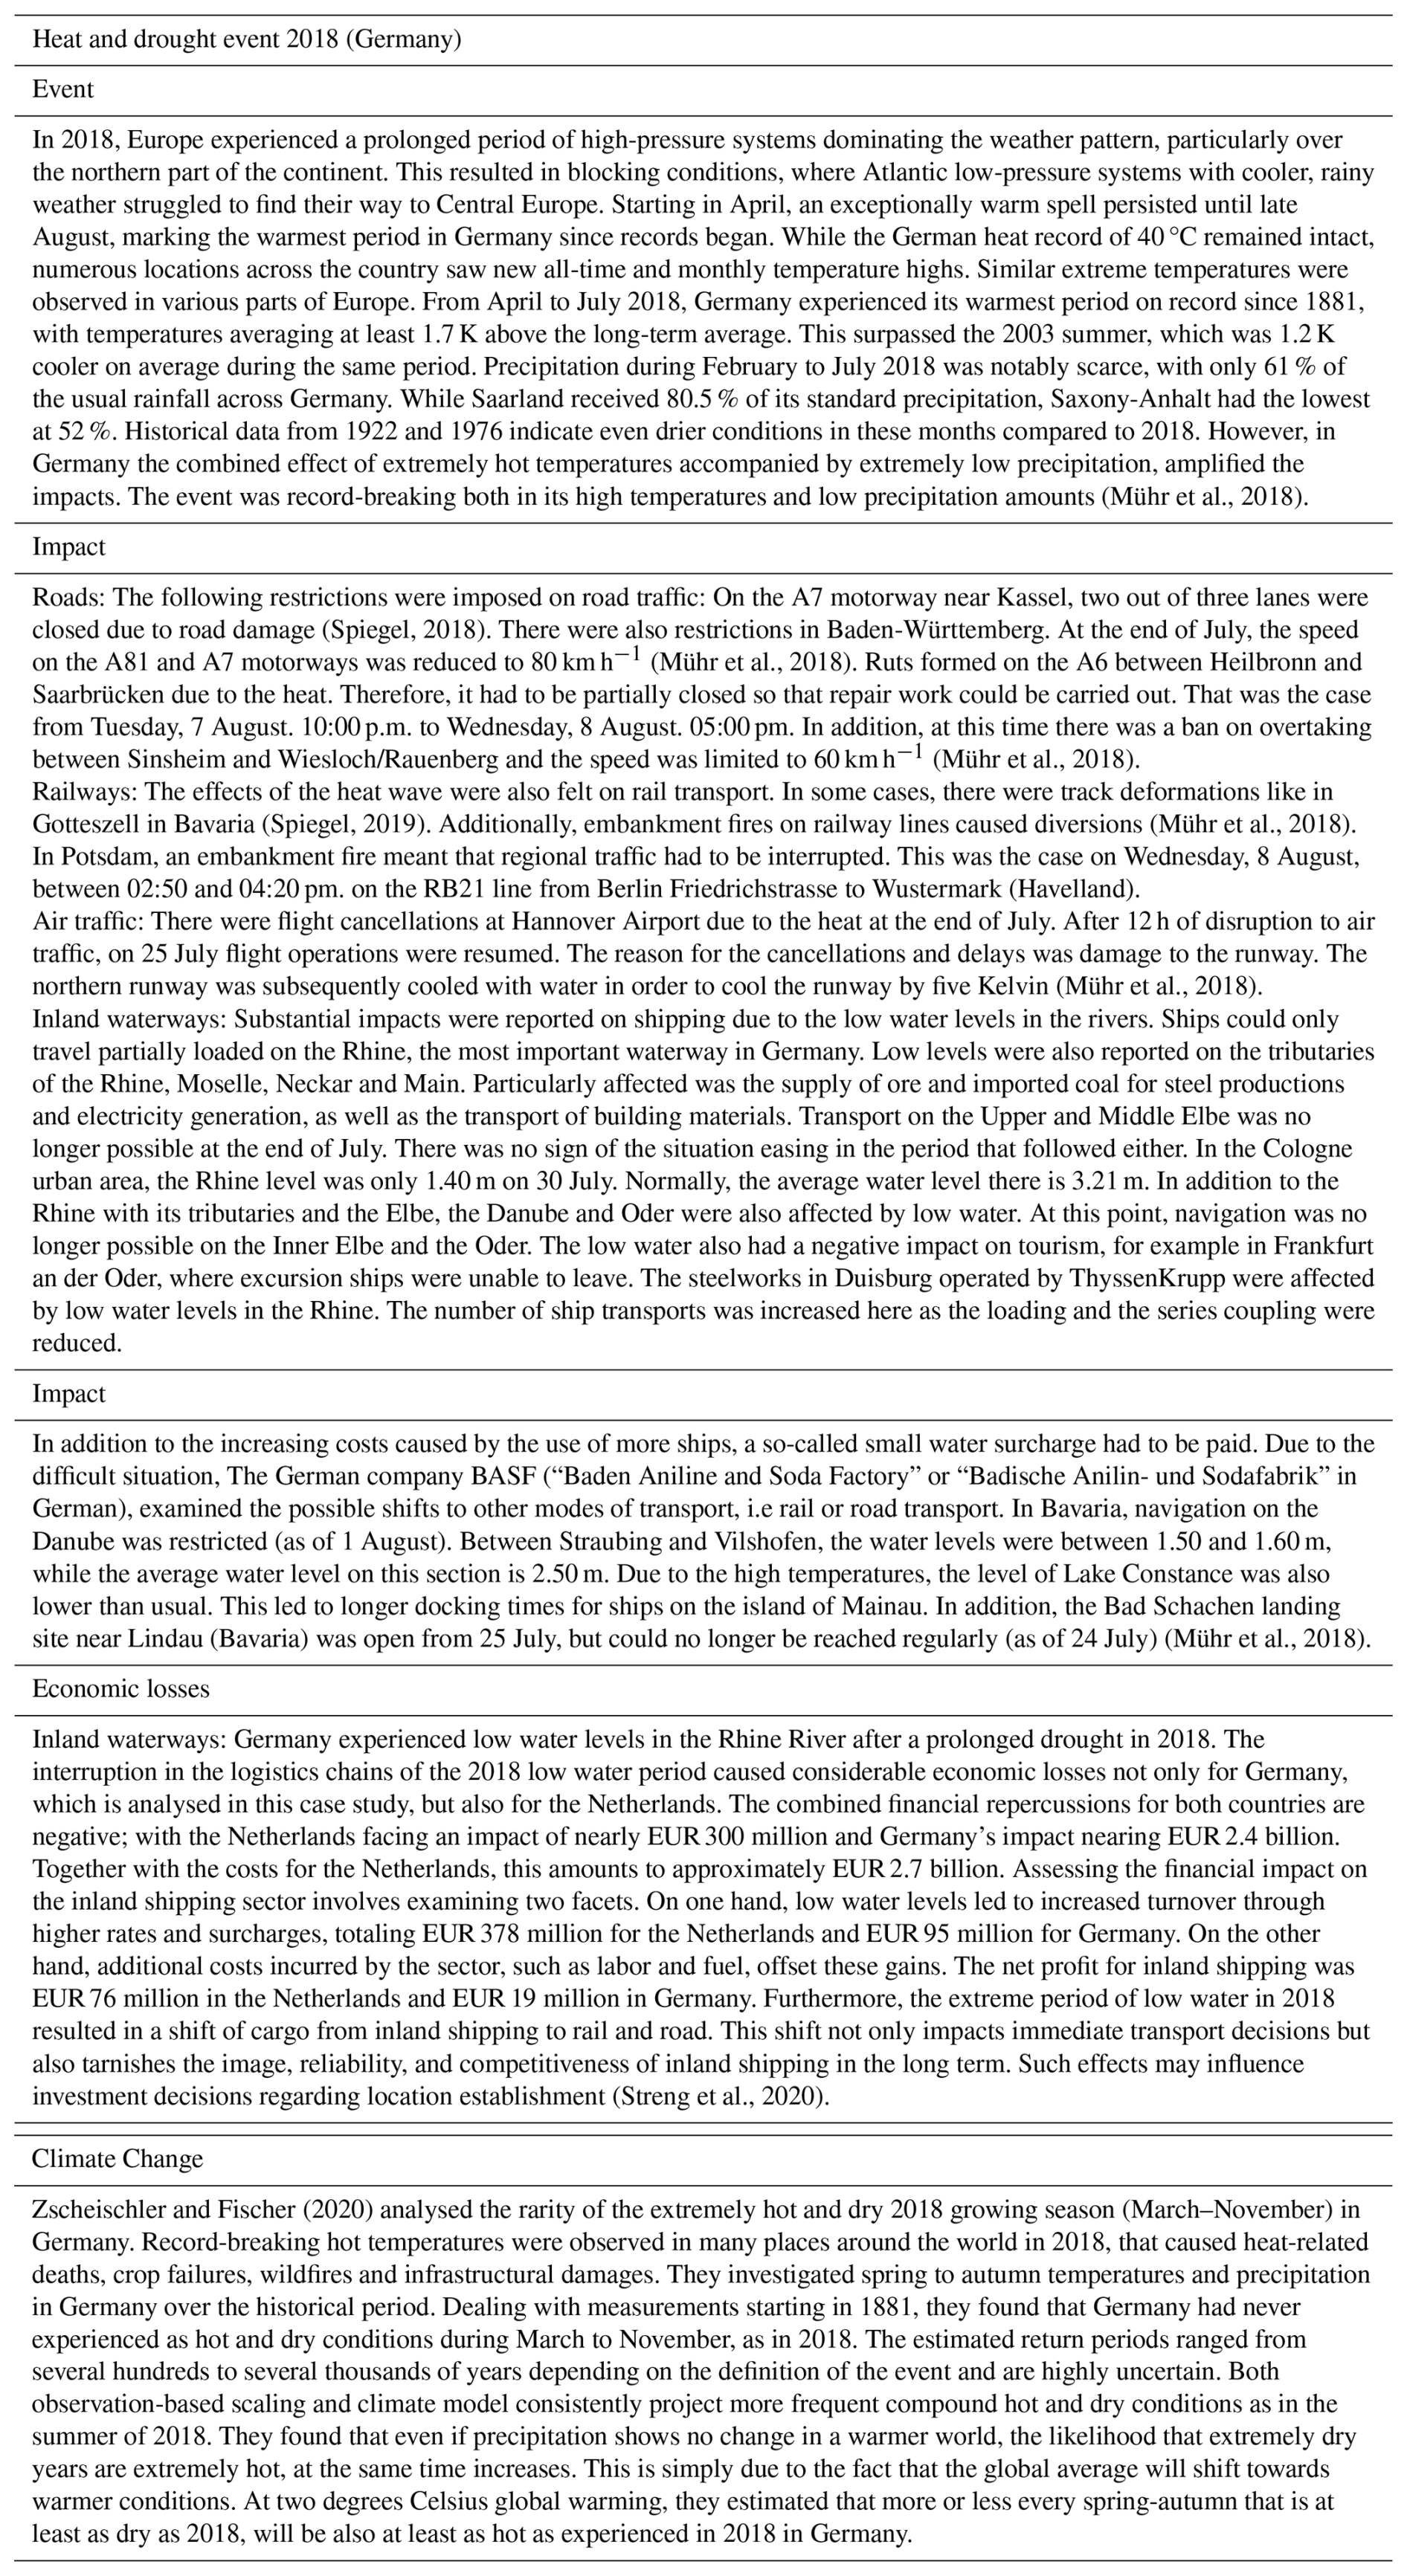
Table A6A detailed overview of the 2021 flood in Belgium, Germany, and the Netherlands, including its impacts, economic losses, and contributing climate change factors.
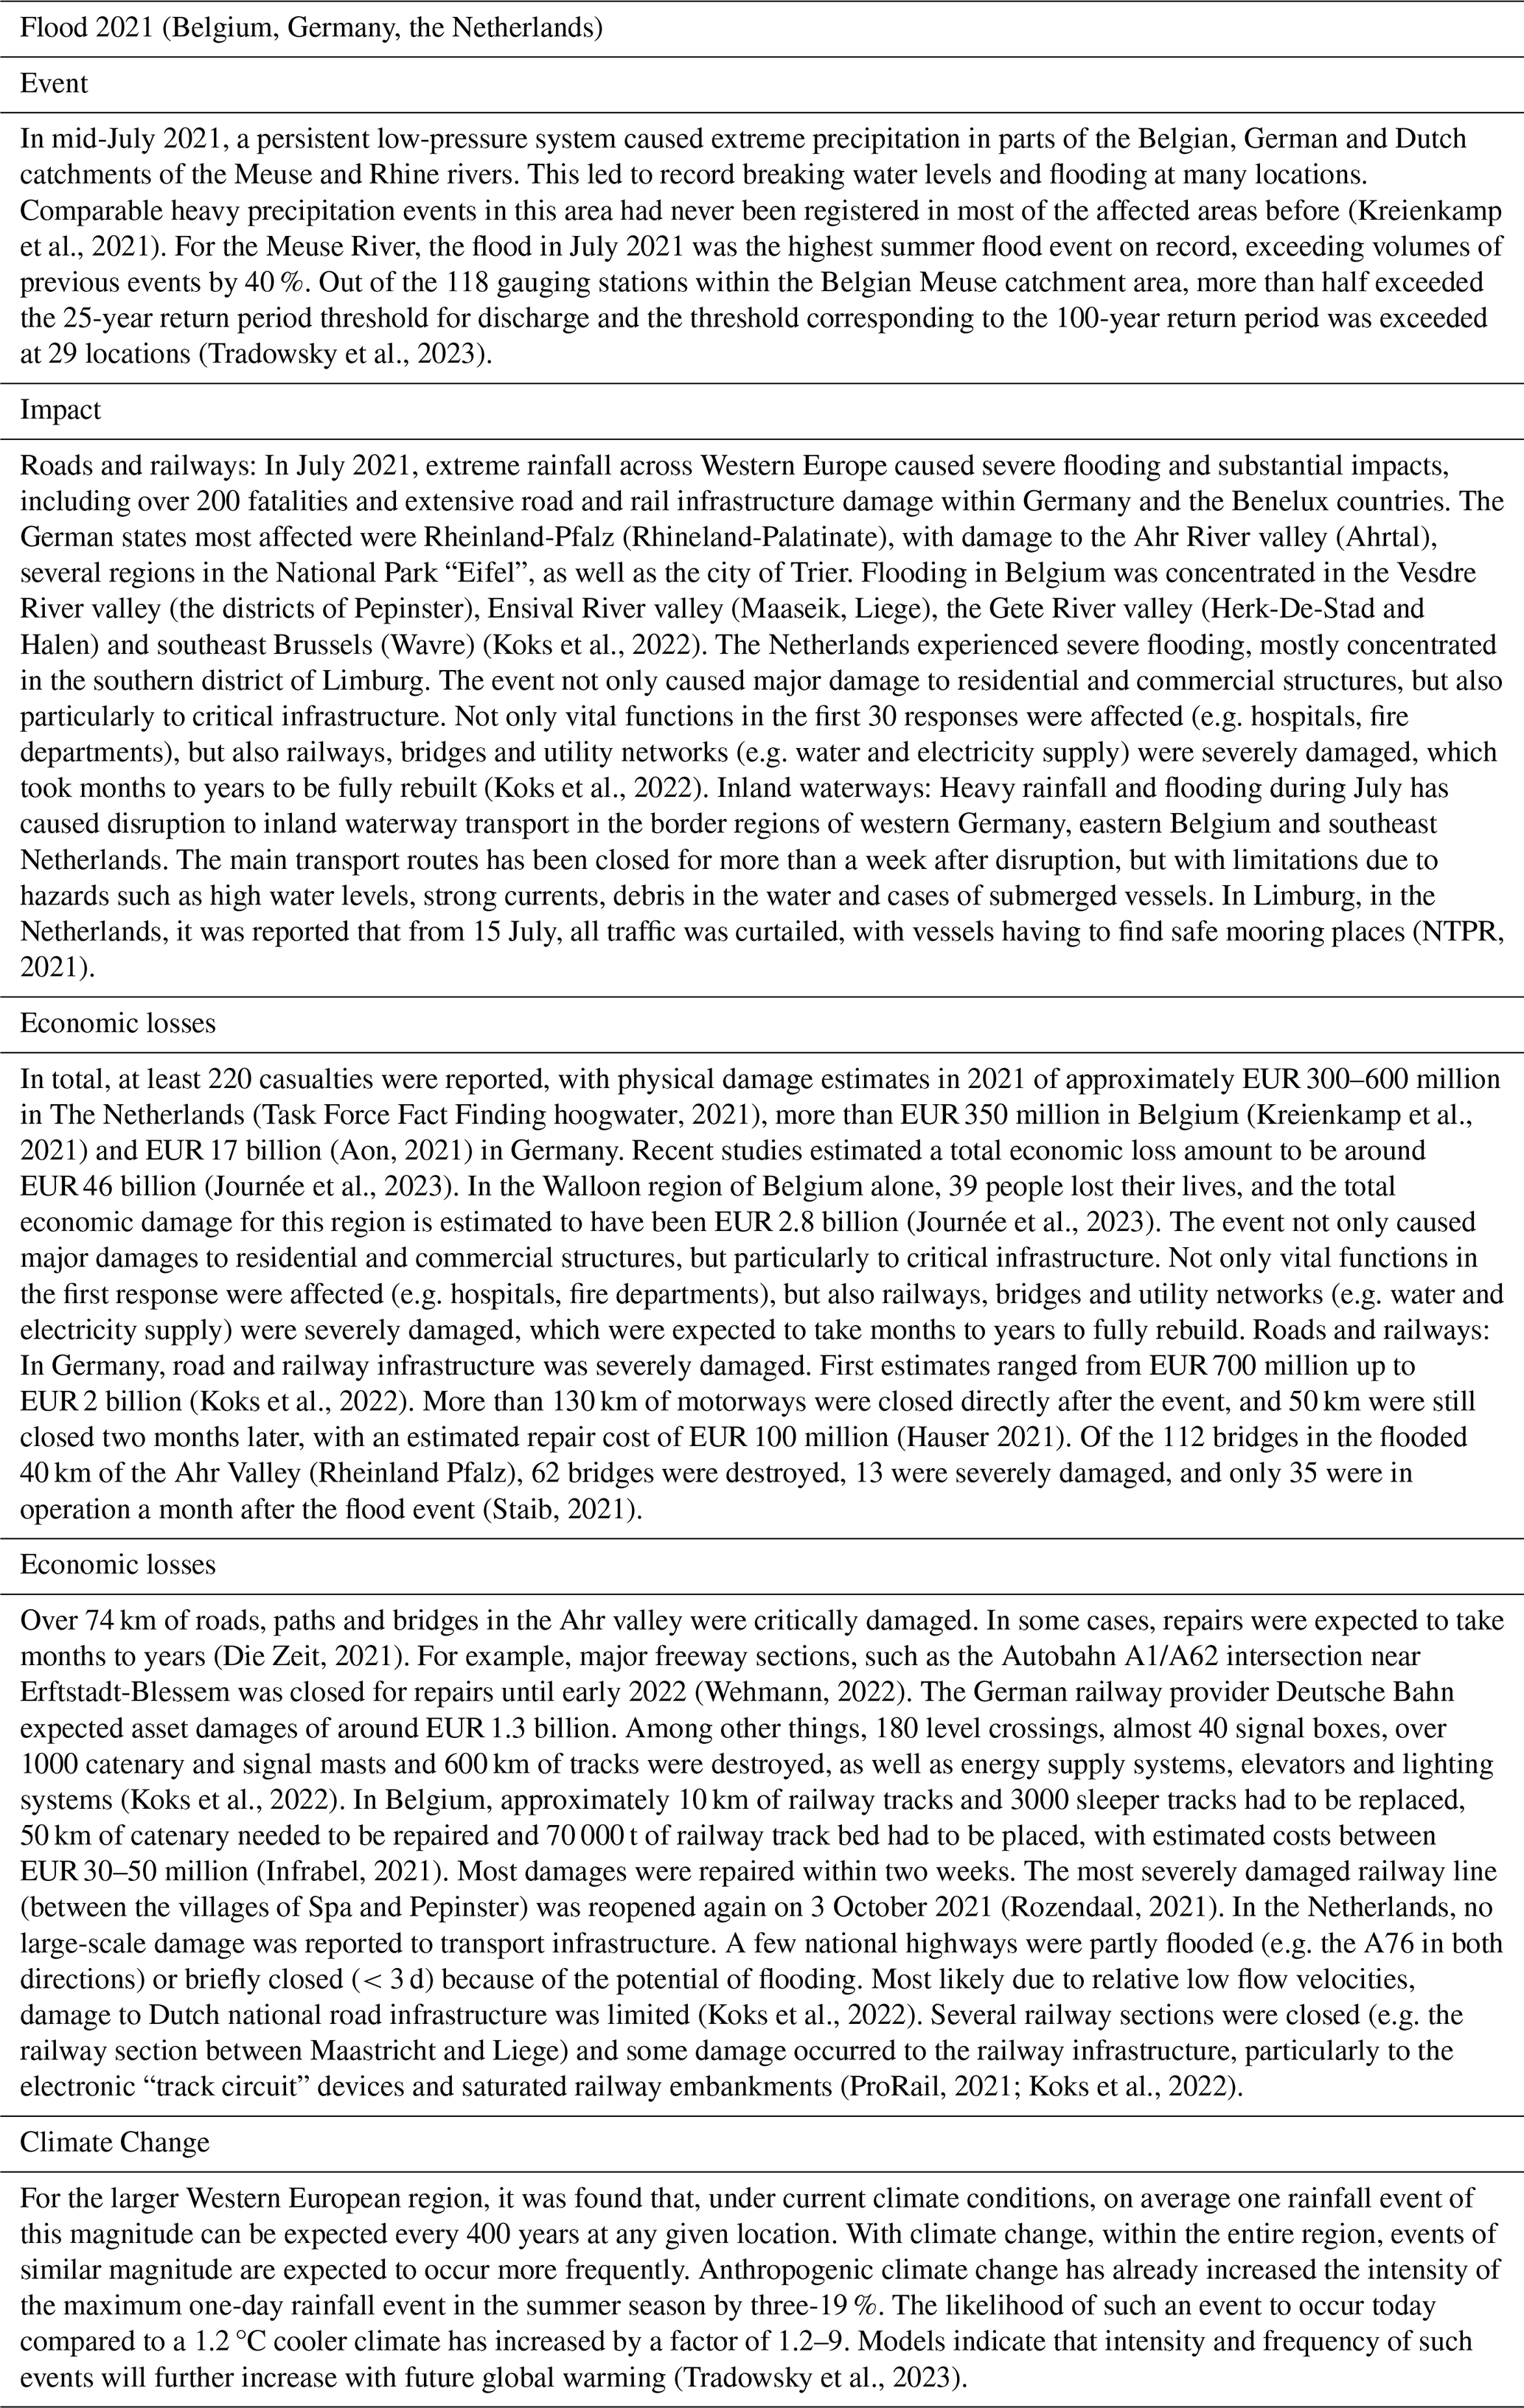
Table A7A detailed overview of the consecutive 2021–2022–2023 floods in Greece, including its impacts, economic losses, and contributing climate change factors.
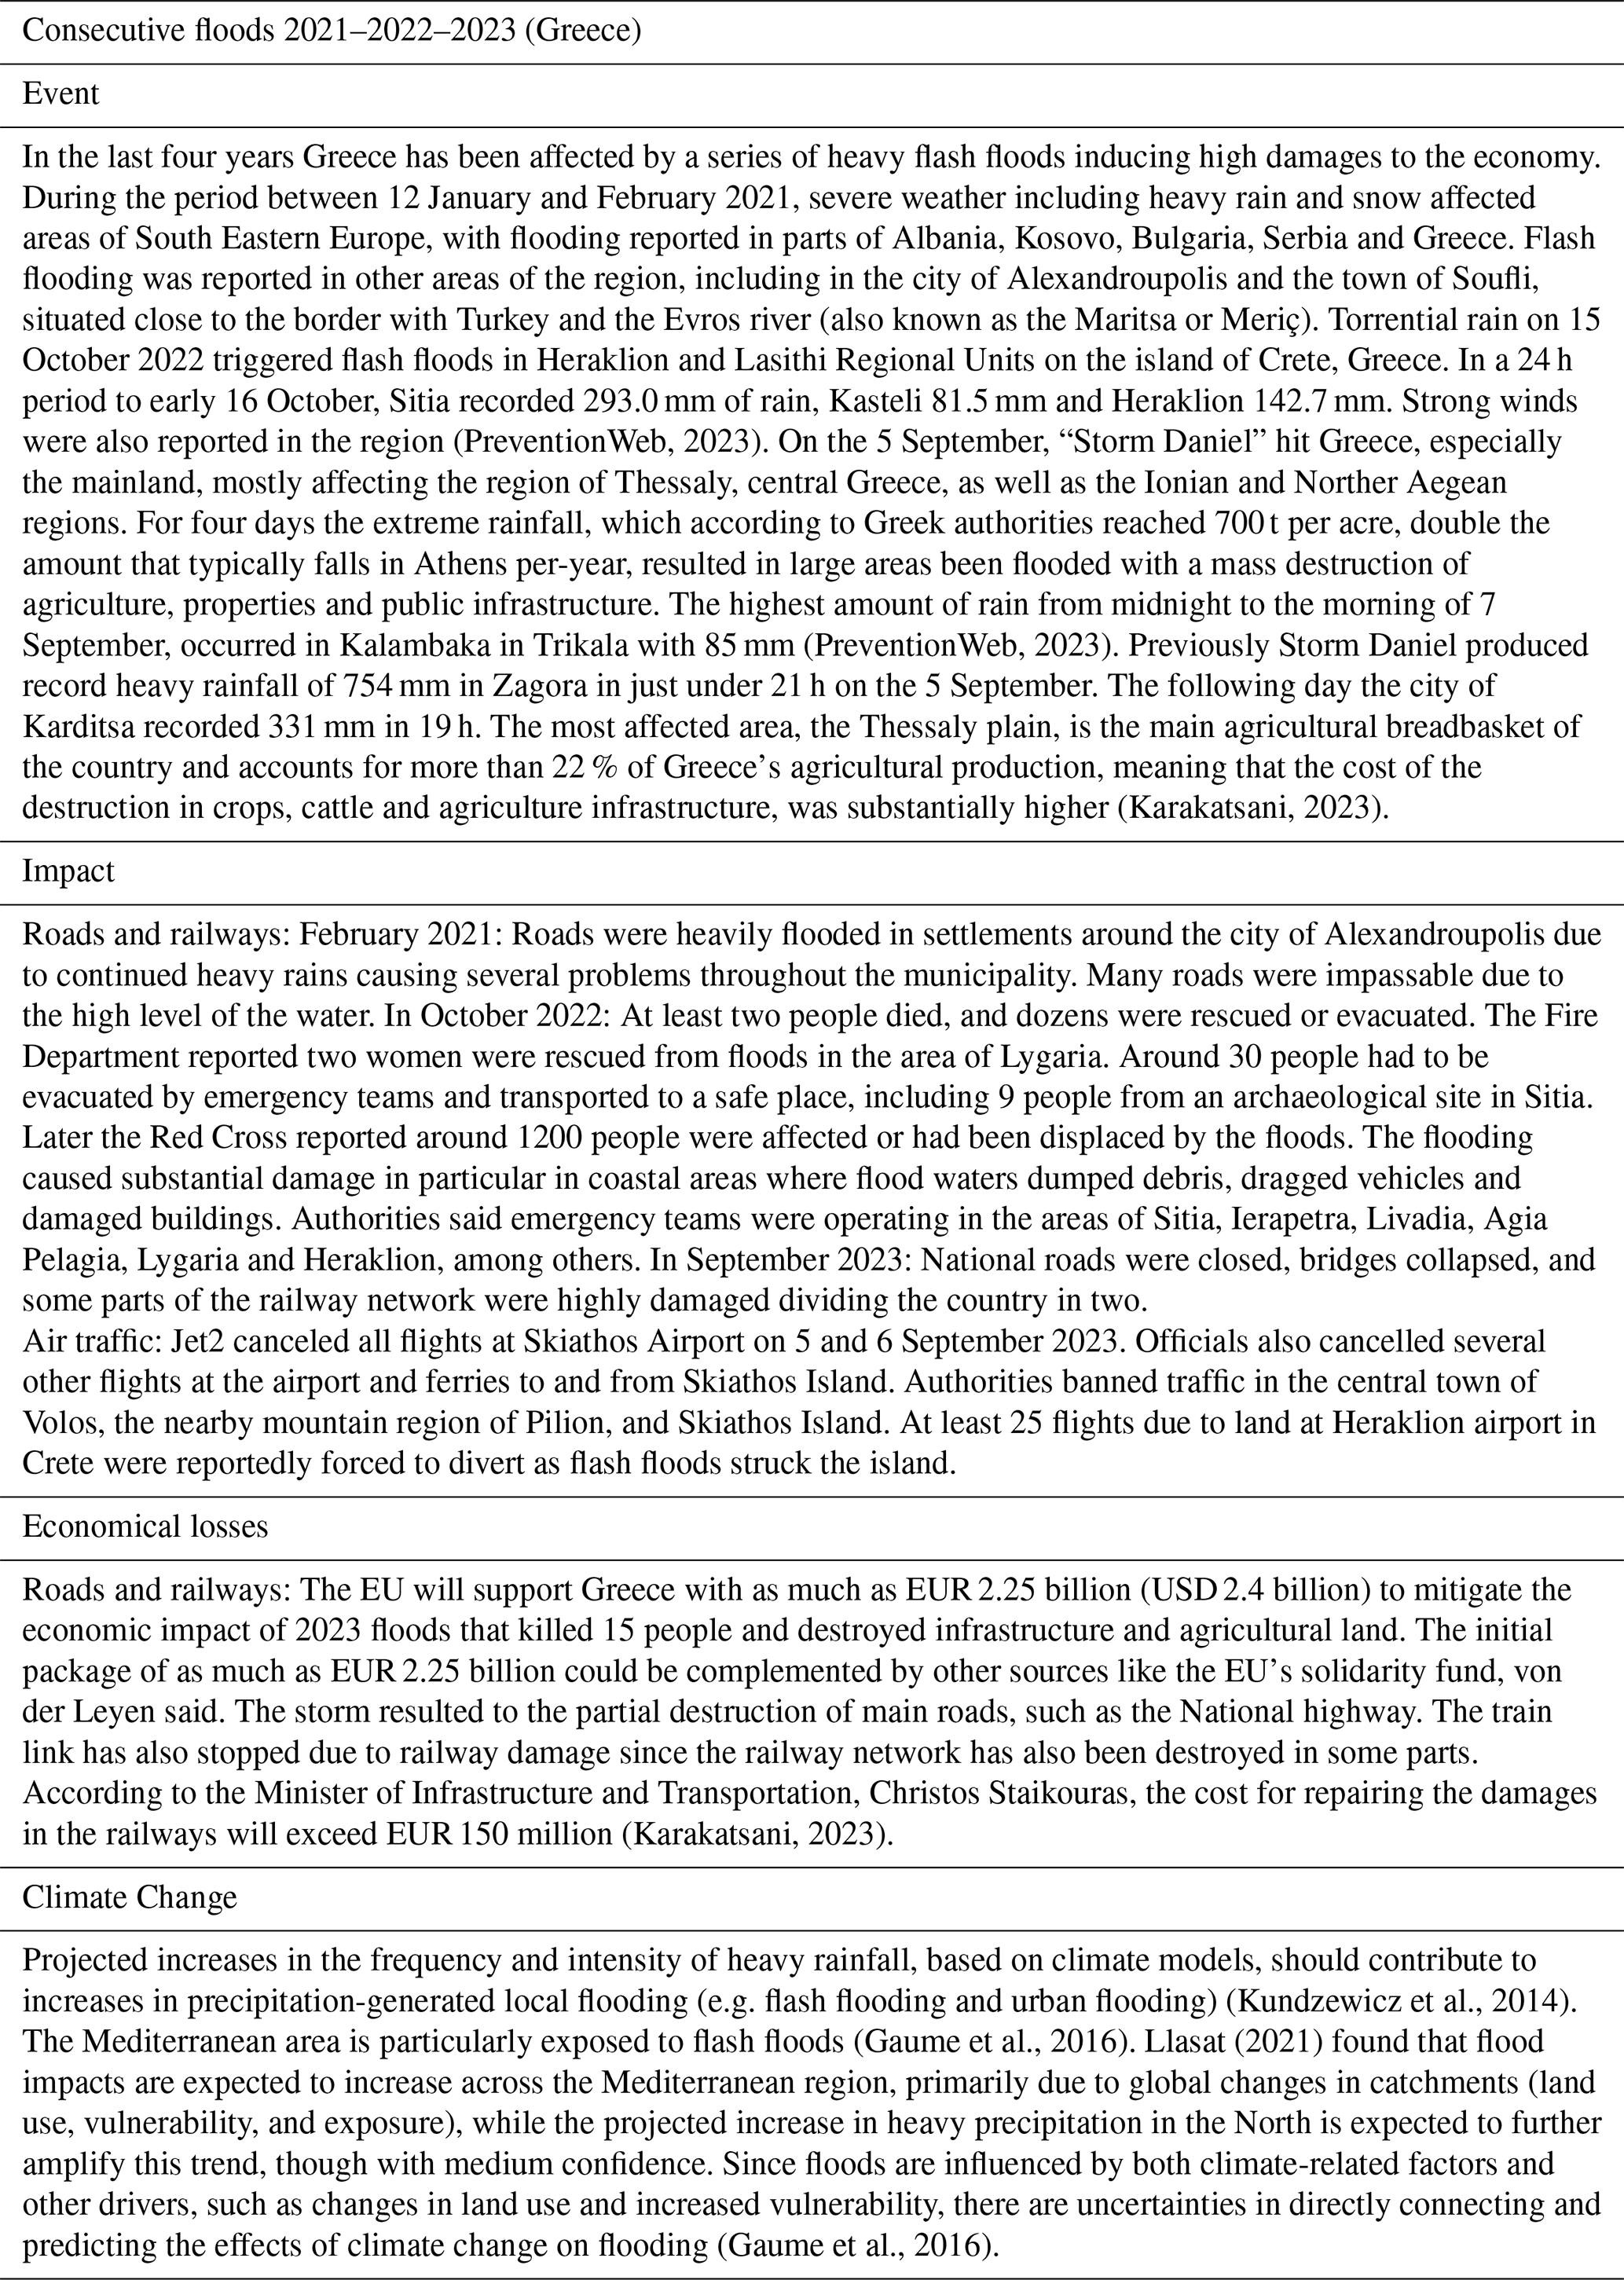
Table A8A detailed overview of the 2023 wildfire/heatwaves in Sicily, including its impacts, economic losses, and contributing climate change factors.
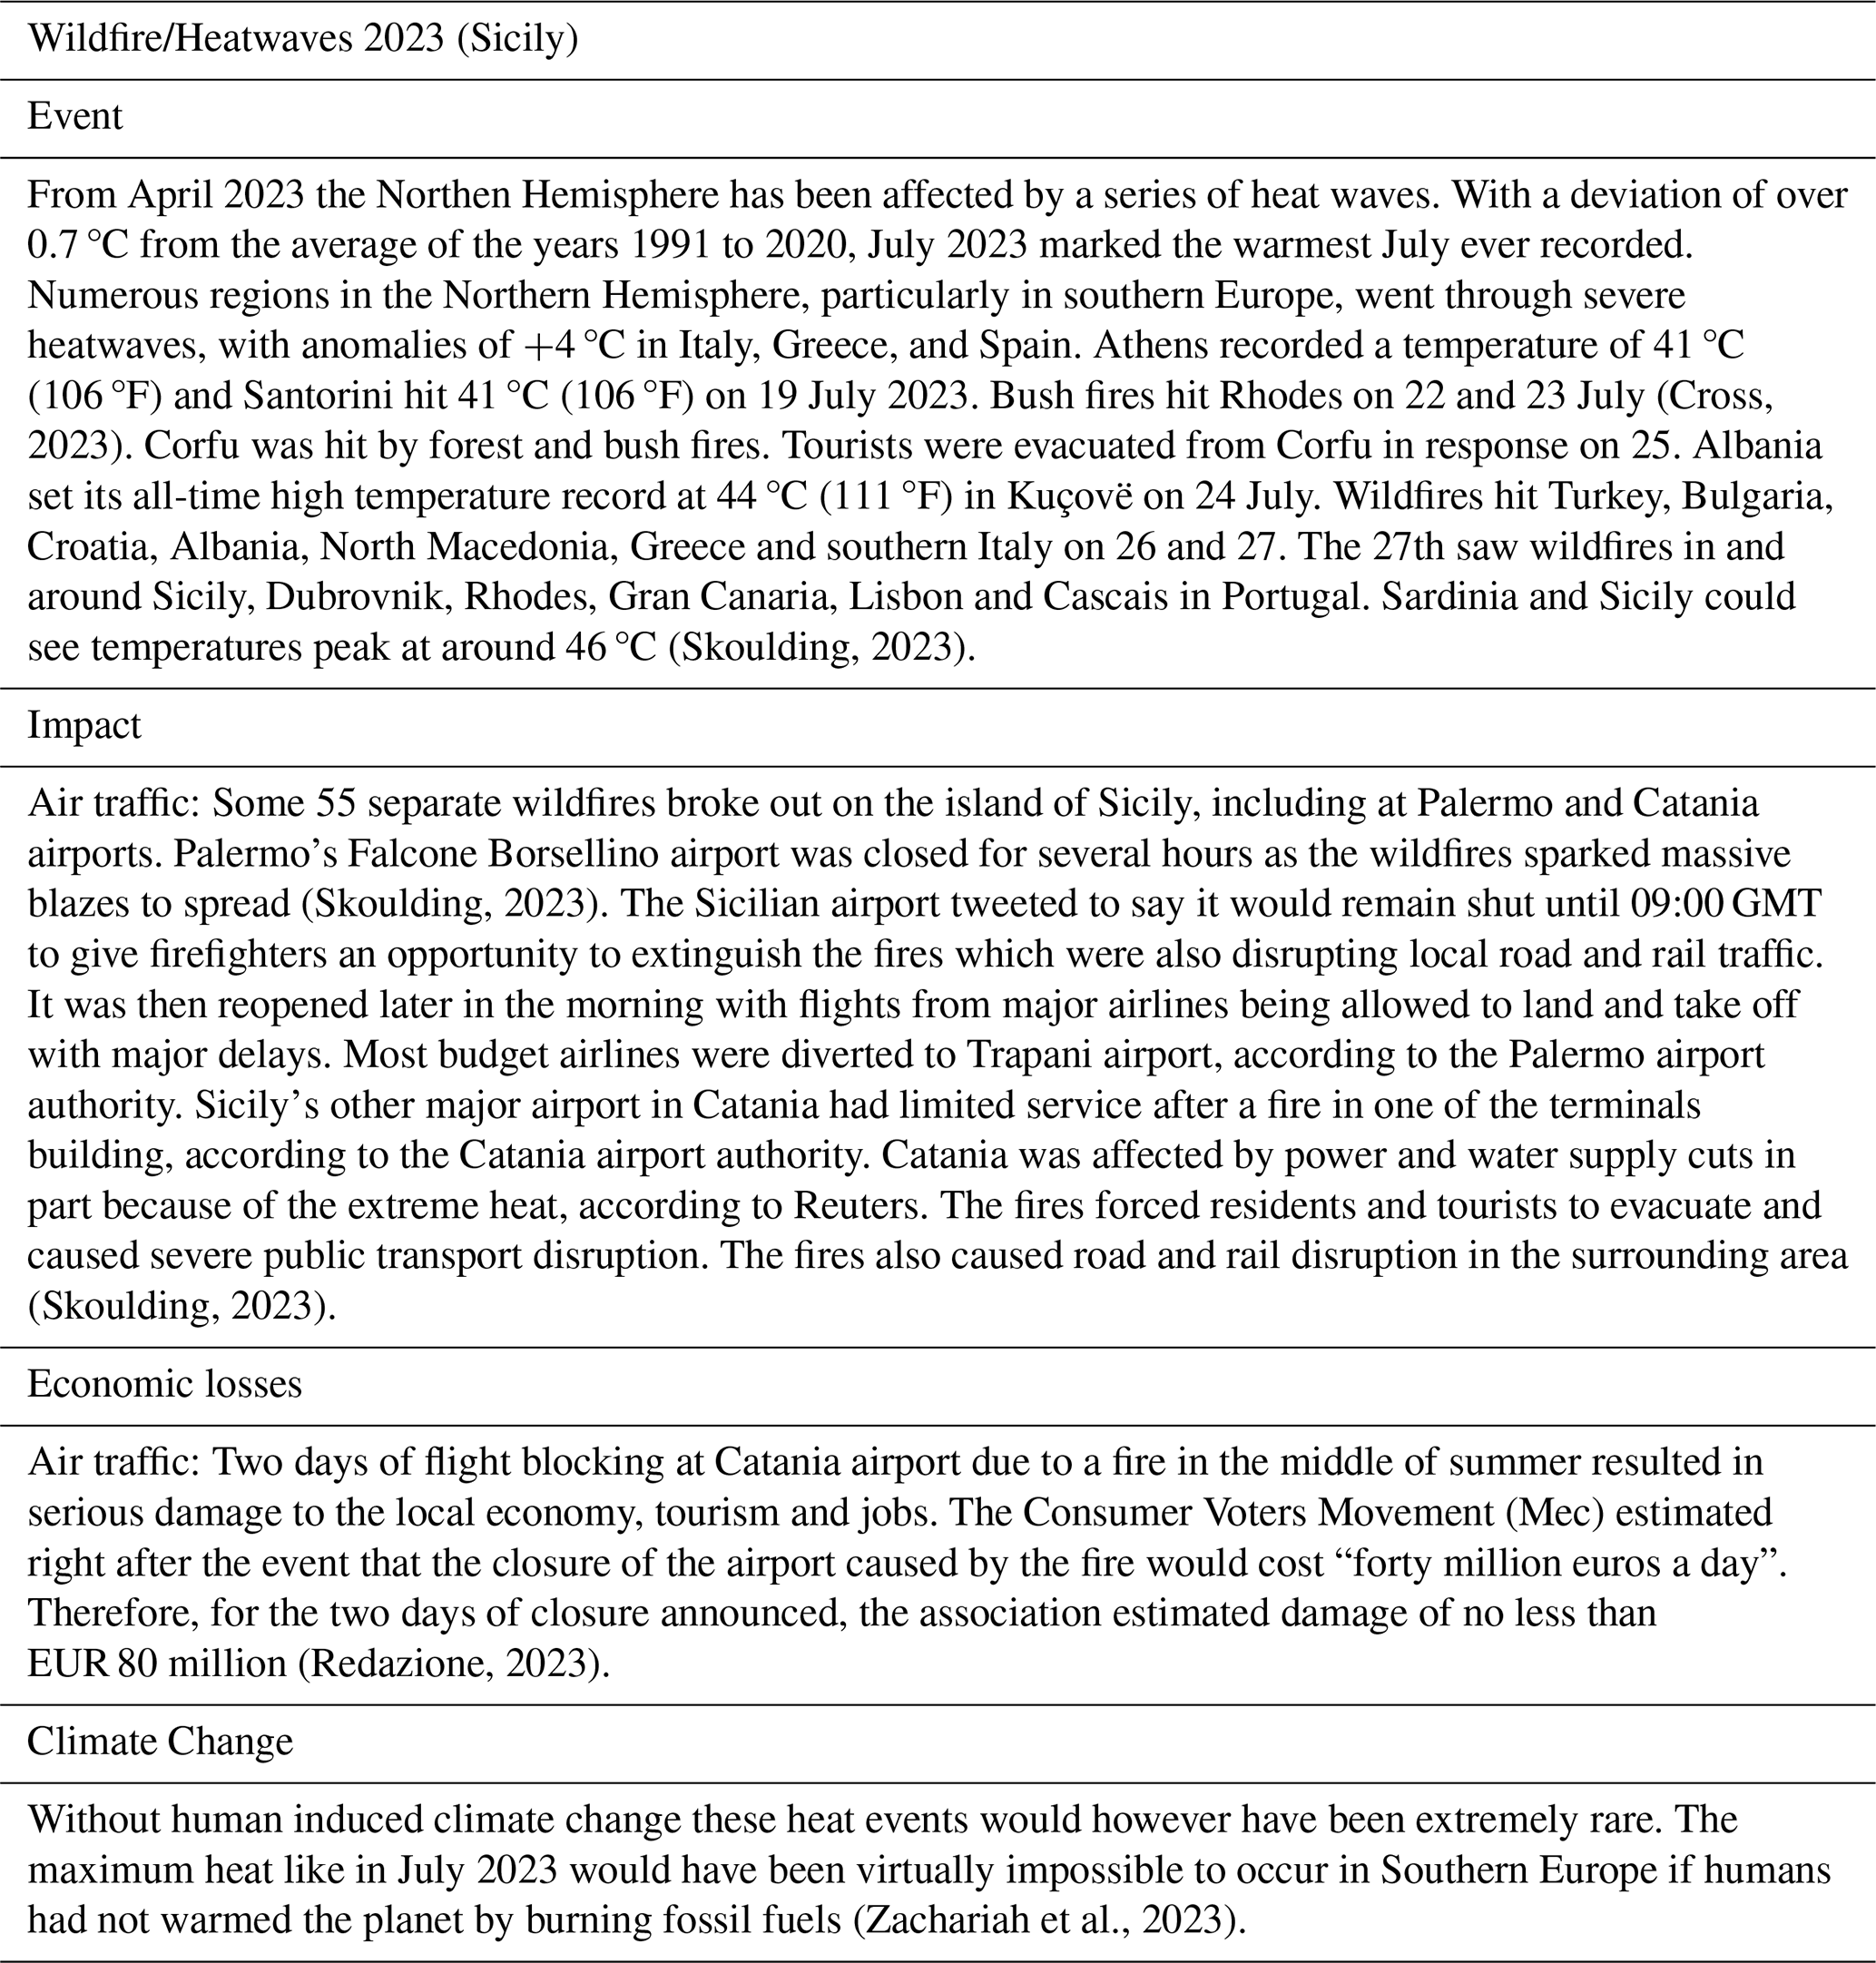
Table A9 Summary of spatial statistics of the multi-model ensemble median Exposure Multiplication Factors (EMFs) for the Trans-European Transport Network (TEN-T) by transport mode and climate extremes under RCP8.5 by the middle (2040–2069) and end of the century (2070–2099), relative to the historical period (1980–2009). Newly exposed elements had no historical exposure but are projected to experience at least one event in the future period. EMF statistics are calculated based on the number of elements (N) with historical exposure.
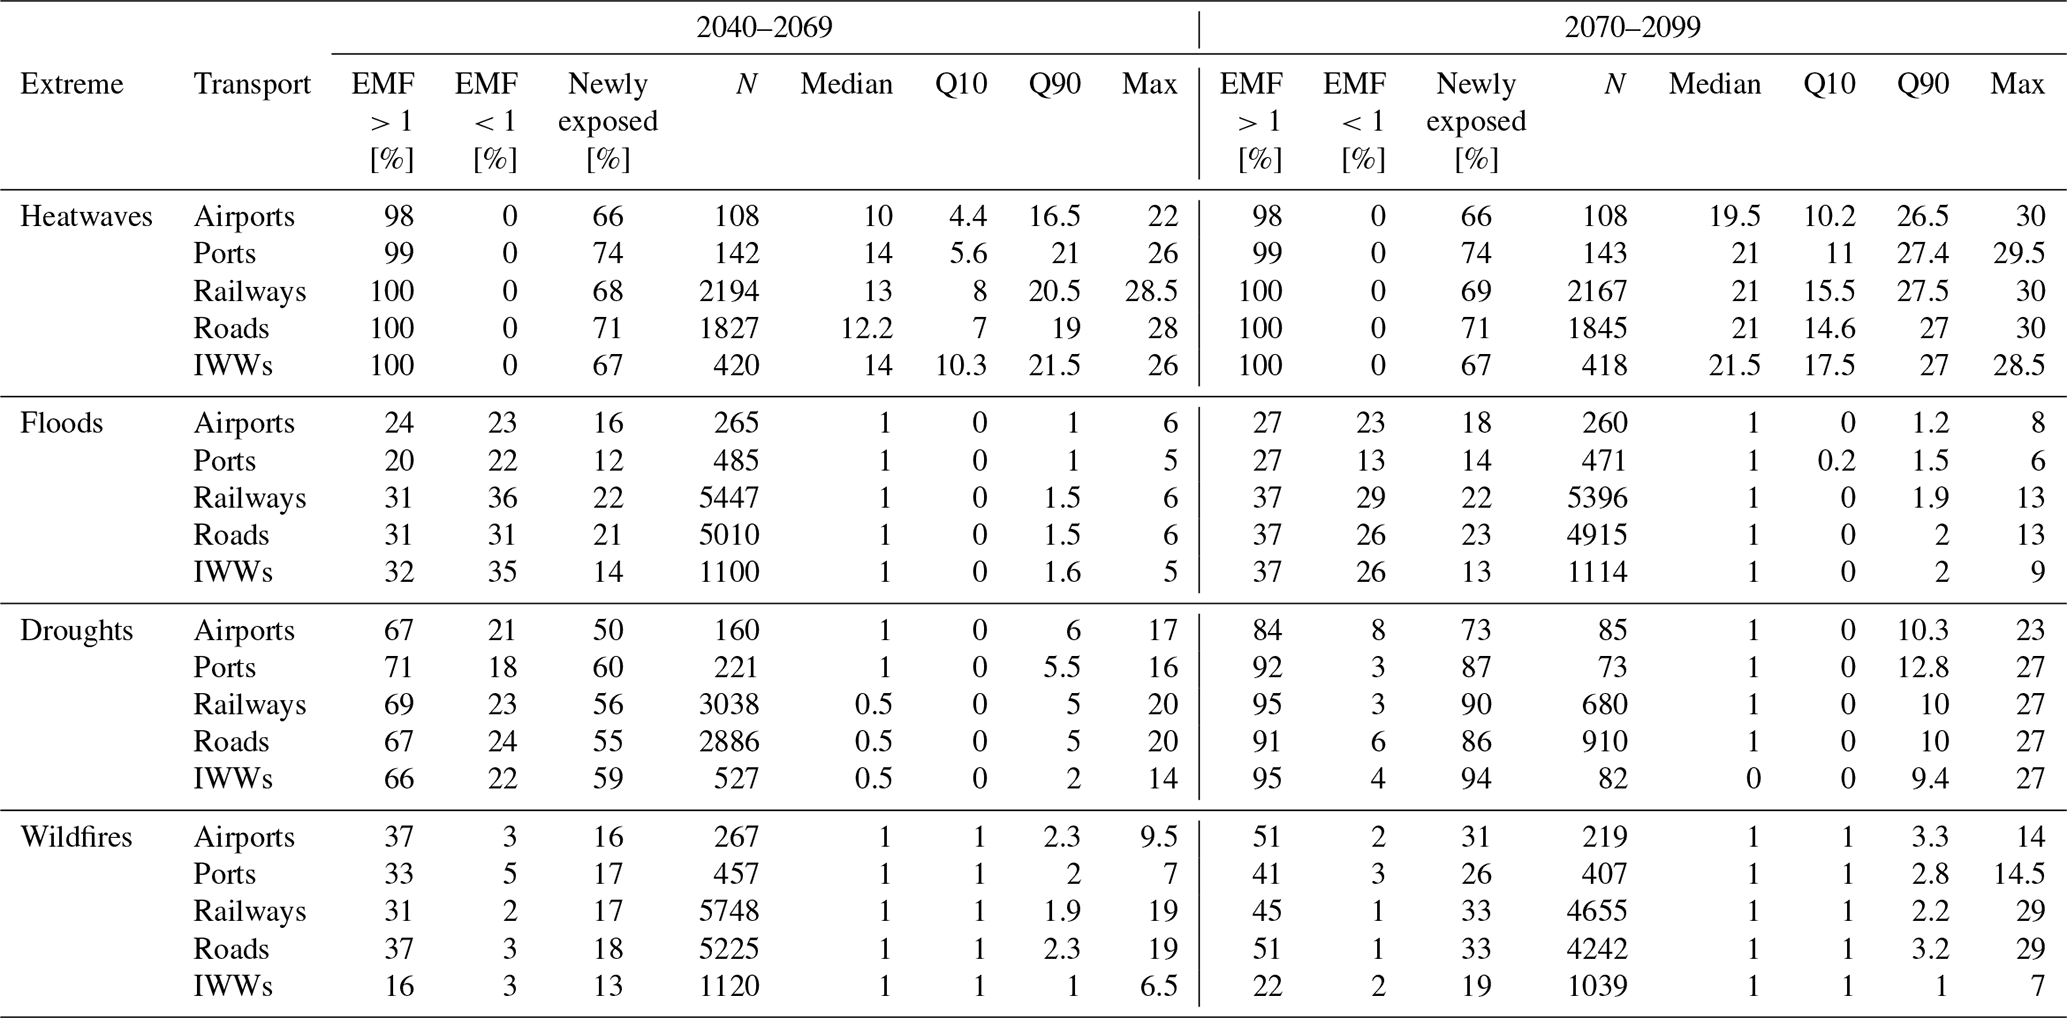
Table A10 Summary of spatial statistics of the multi-model ensemble median Exposure Multiplication Factors (EMFs) for the Trans-European Transport Network (TEN-T) by transport mode and climate extremes under RCP2.6 by the middle (2040–2069) and end of the century (2070–2099), relative to the historical period (1980–2009). Newly exposed elements had no historical exposure but are projected to experience at least one event in the future period. EMF statistics are calculated based on the number of elements (N) with historical exposure.
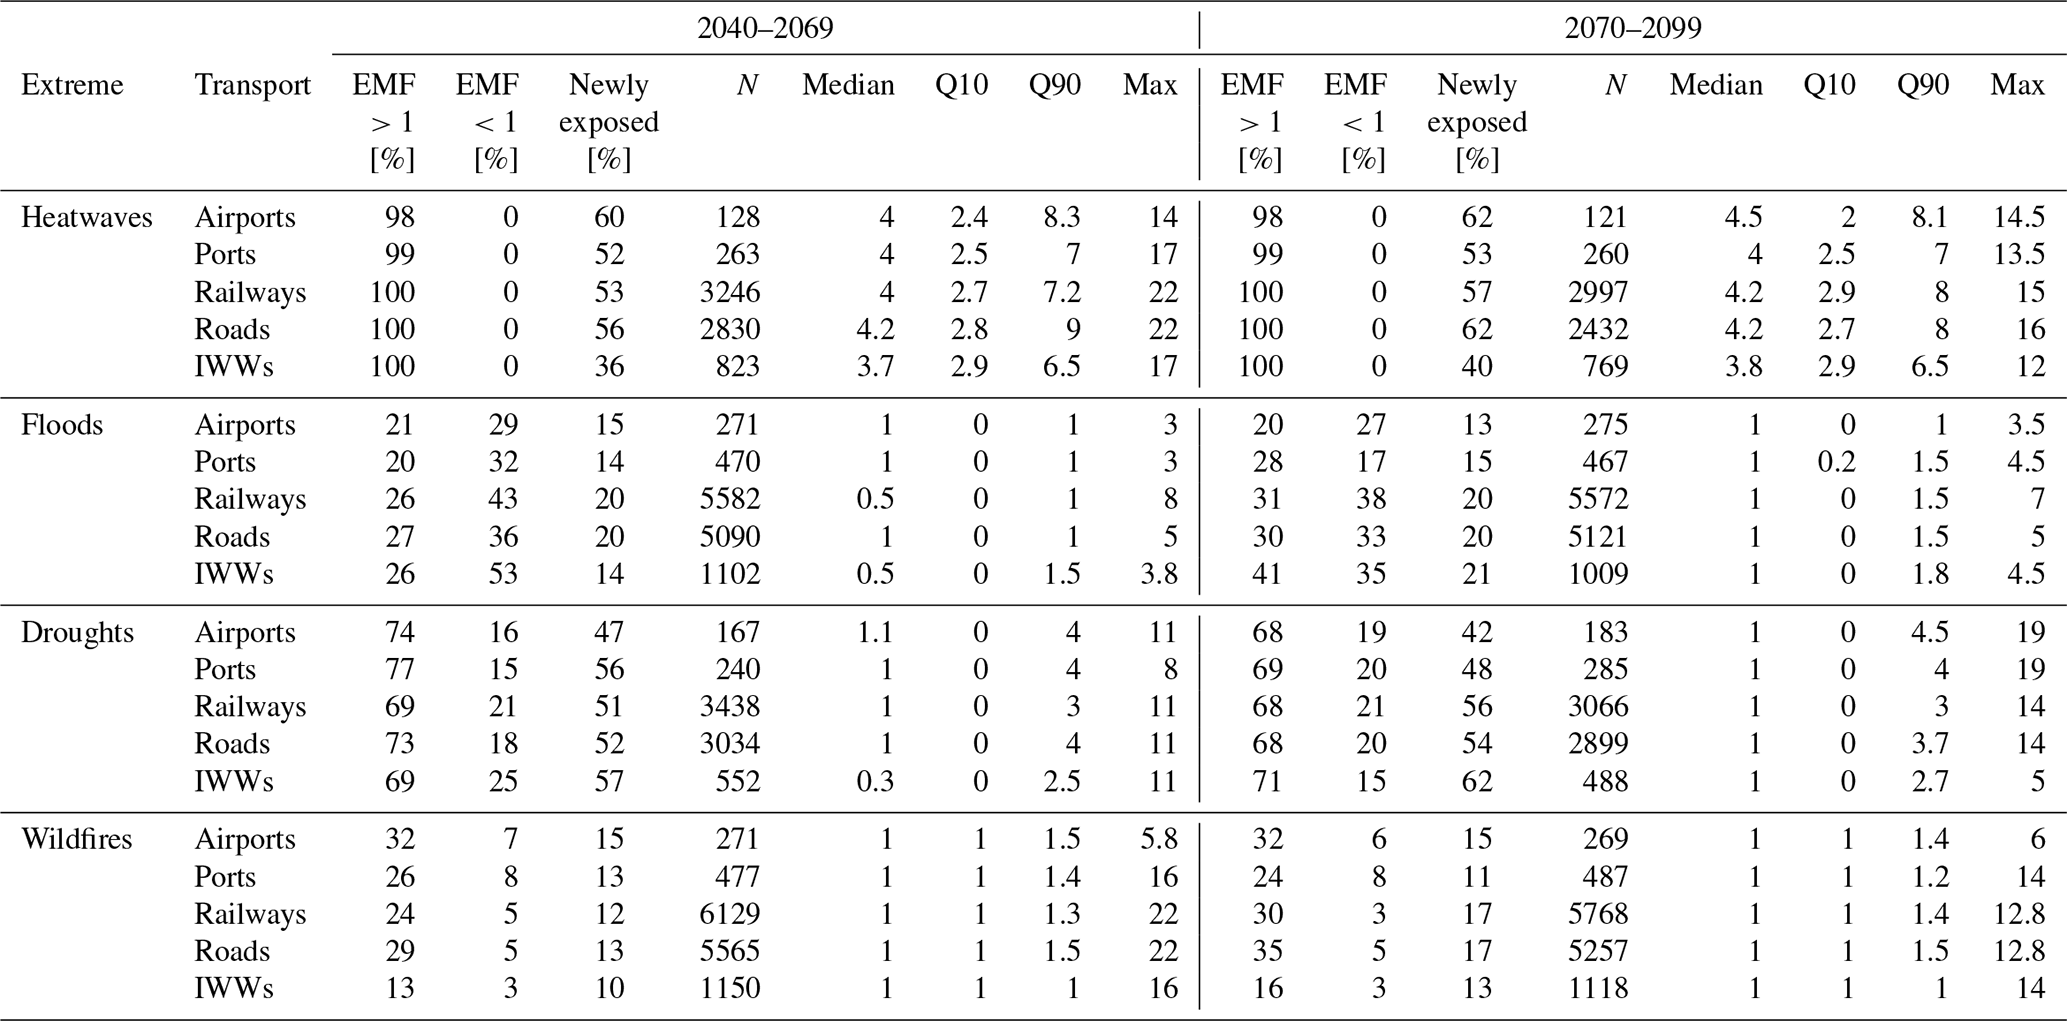
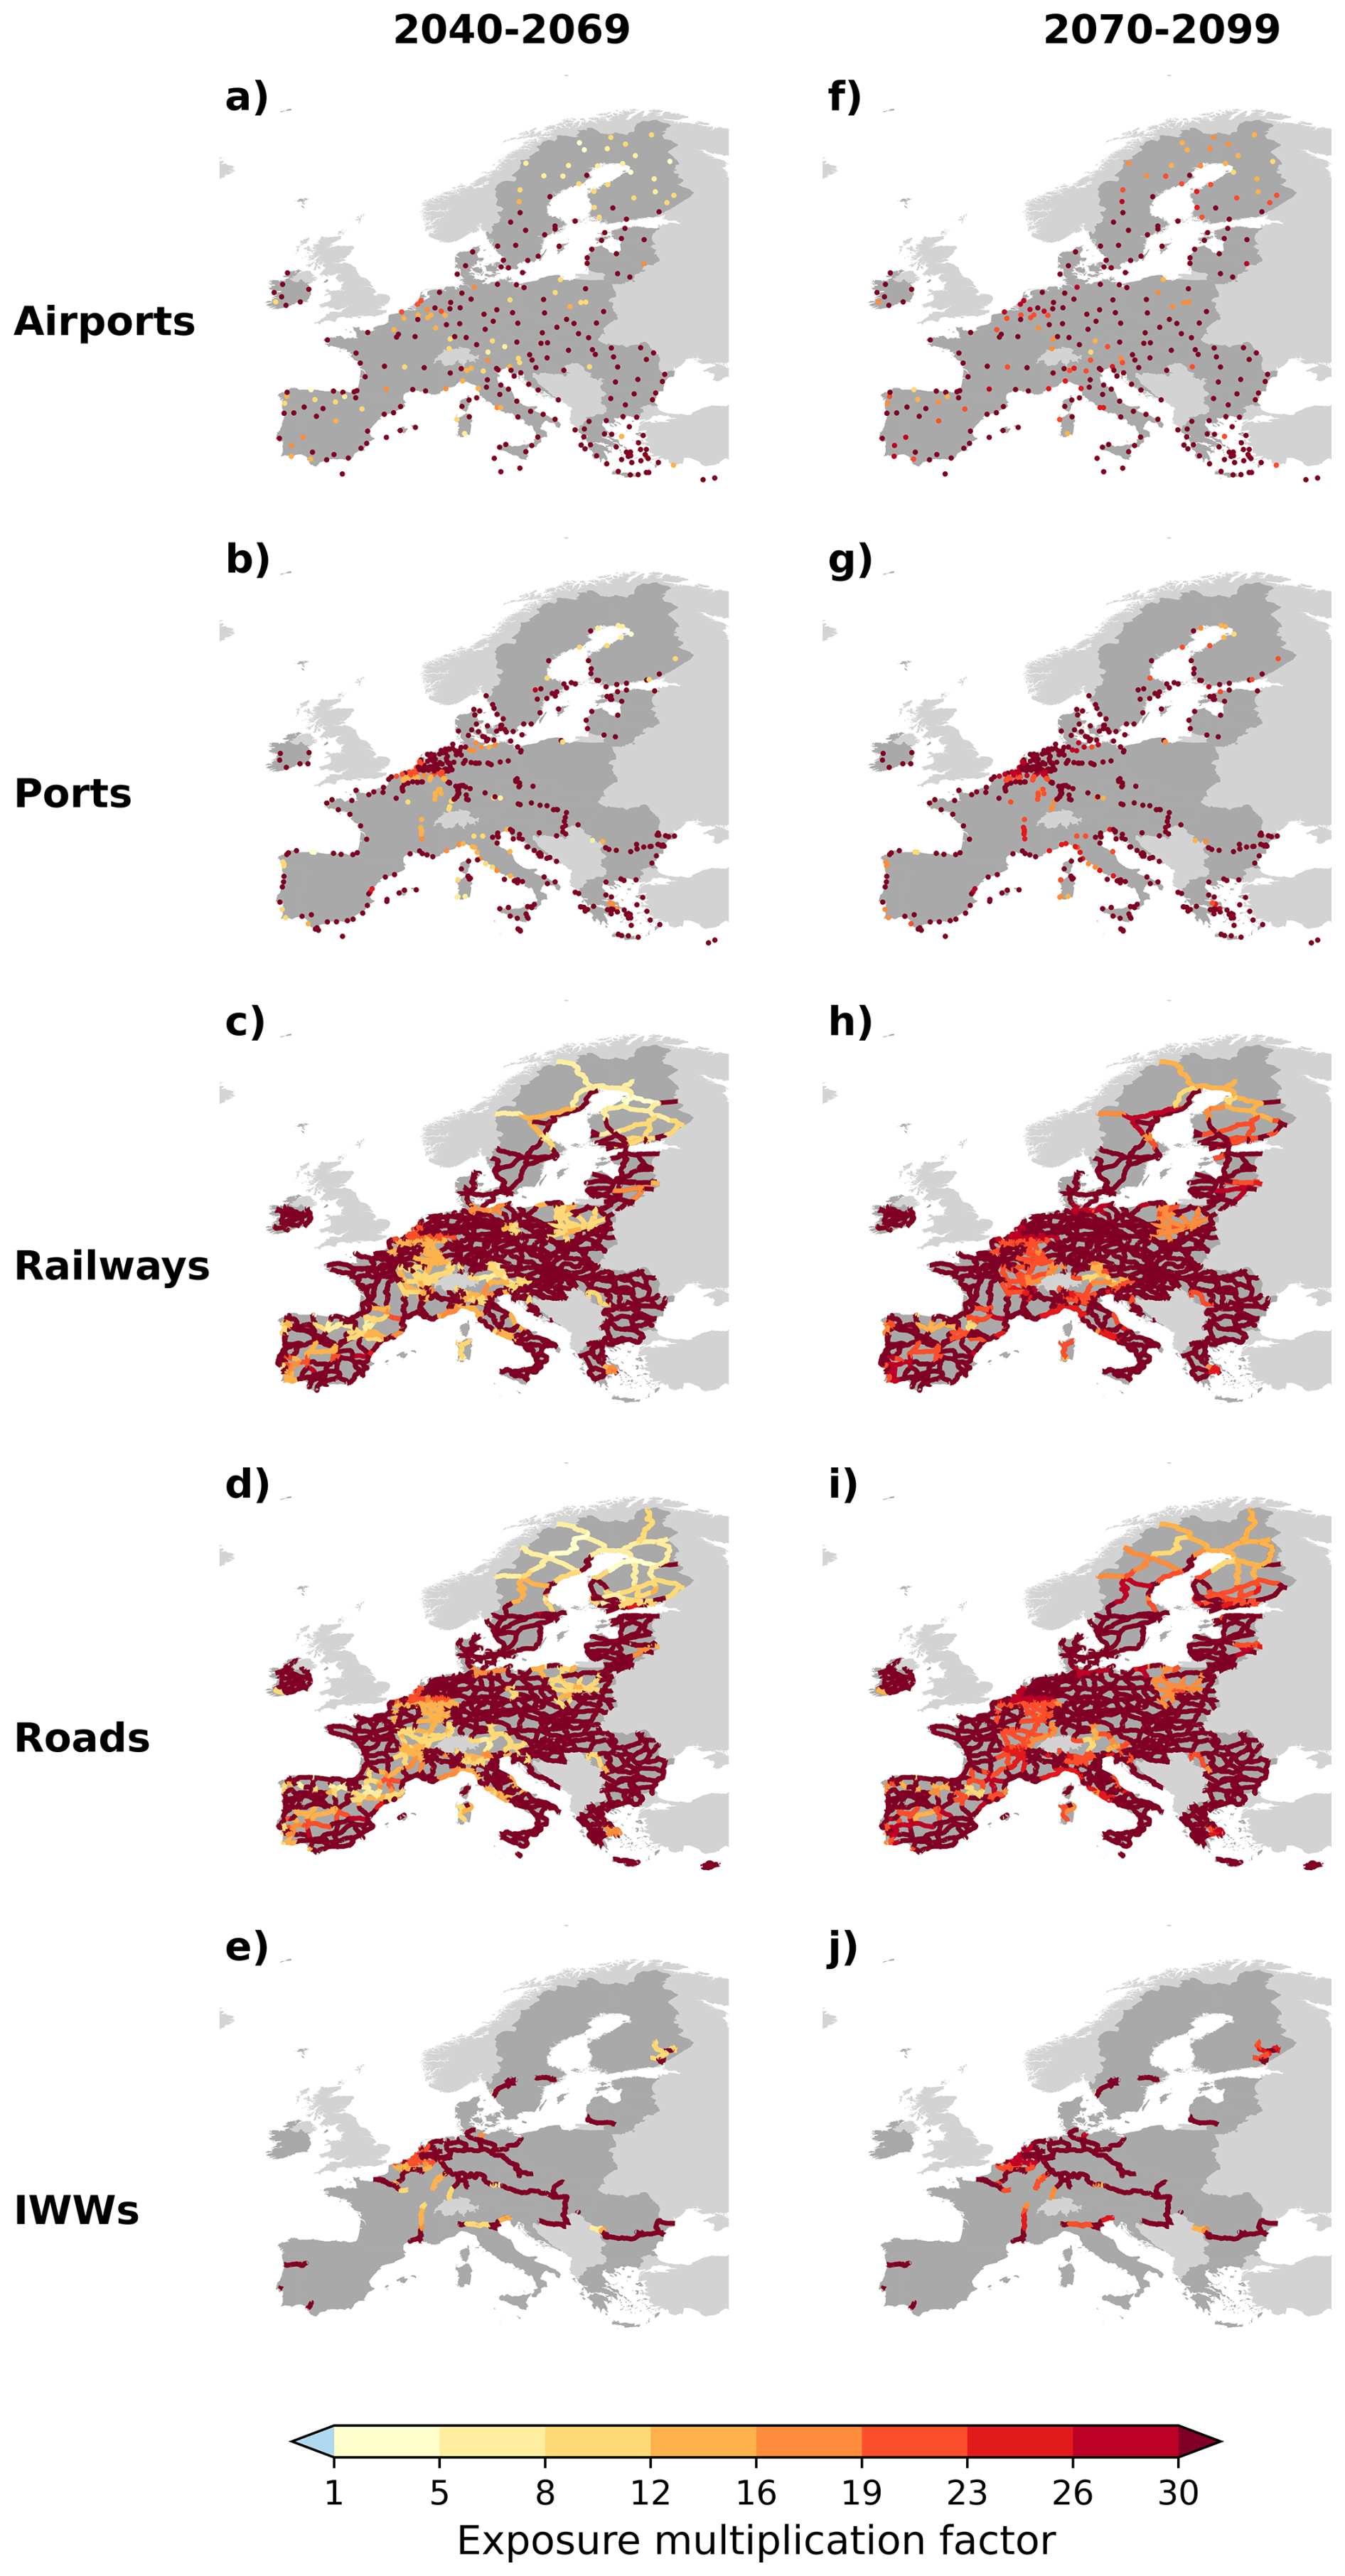
Figure A5 Maps of multi-model ensemble median exposure multiplication factors of the TEN-T by mode (rows) to heatwaves by the middle (2040–2069) and the end of the century (2070–2099) (columns) relative to historical climate conditions (1980–2009) under a high emission scenario (RCP8.5). The multi-model ensemble median is computed across all available combinations of impacts models and GCMs.
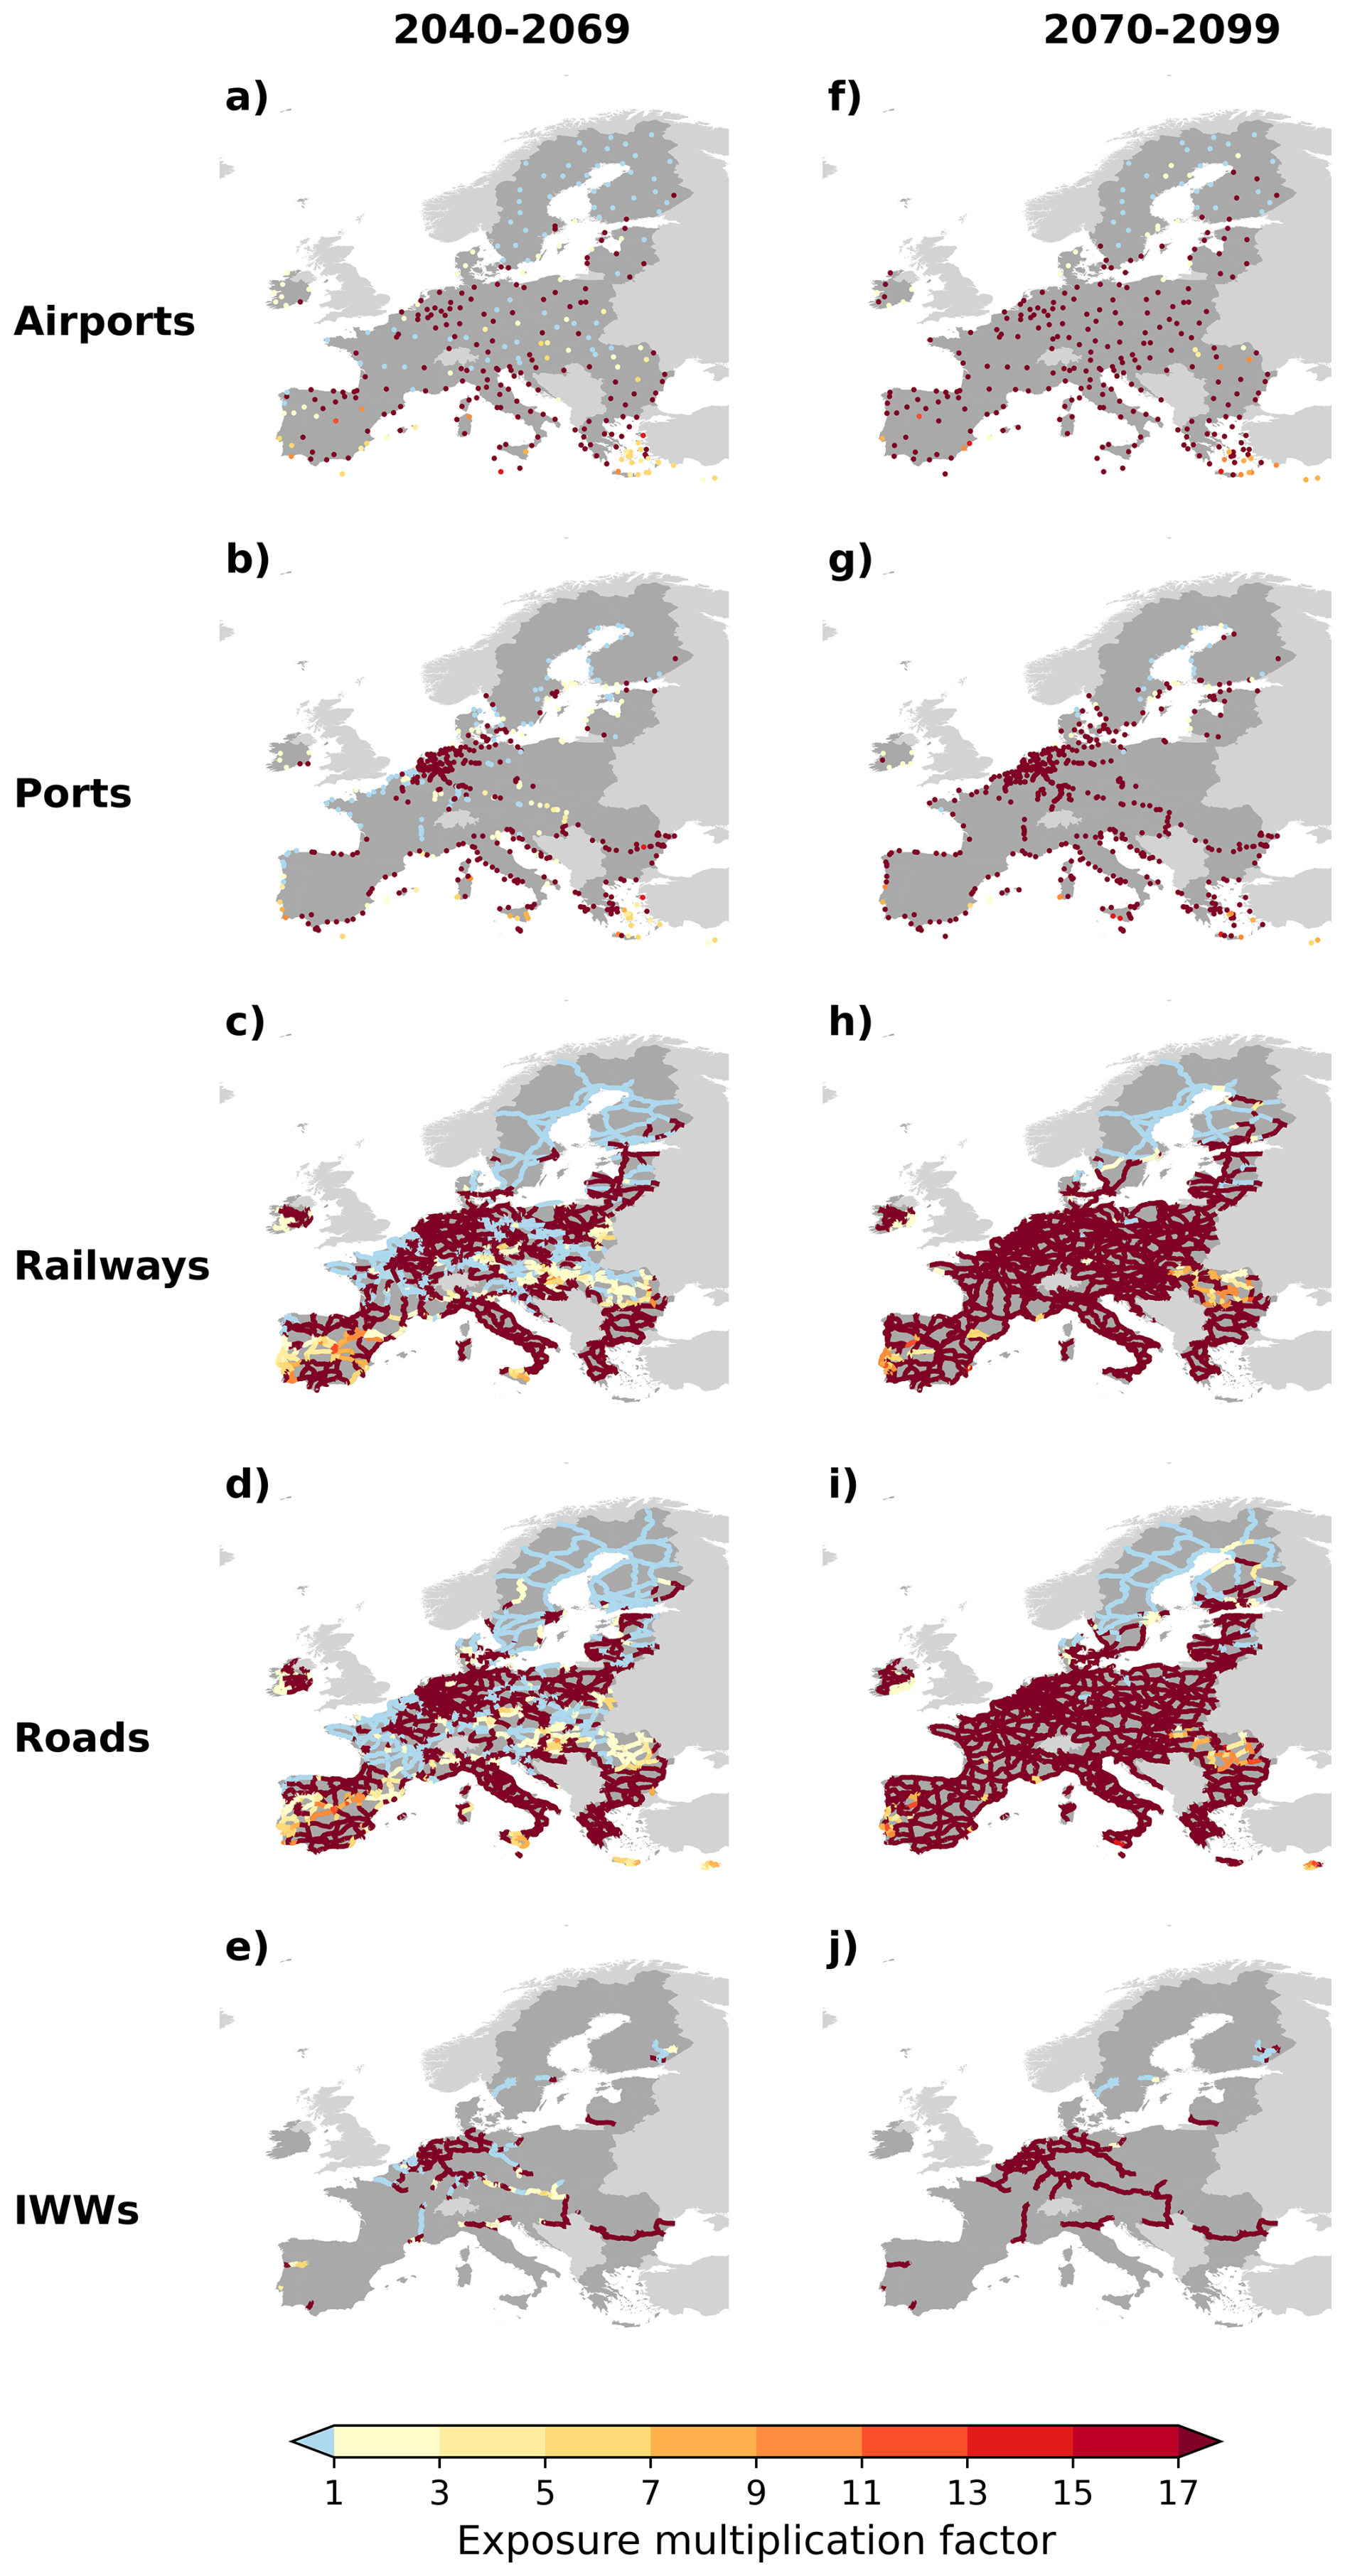
Figure A6 Maps of multi-model ensemble median exposure multiplication factors of the TEN-T by mode (rows) to droughts by the middle (2040–2069) and the end of the century (2070–2099) (columns) relative to historical climate conditions (1980–2009) under a high emission scenario (RCP8.5). The multi-model ensemble median is computed across all available combinations of impacts models and GCMs.
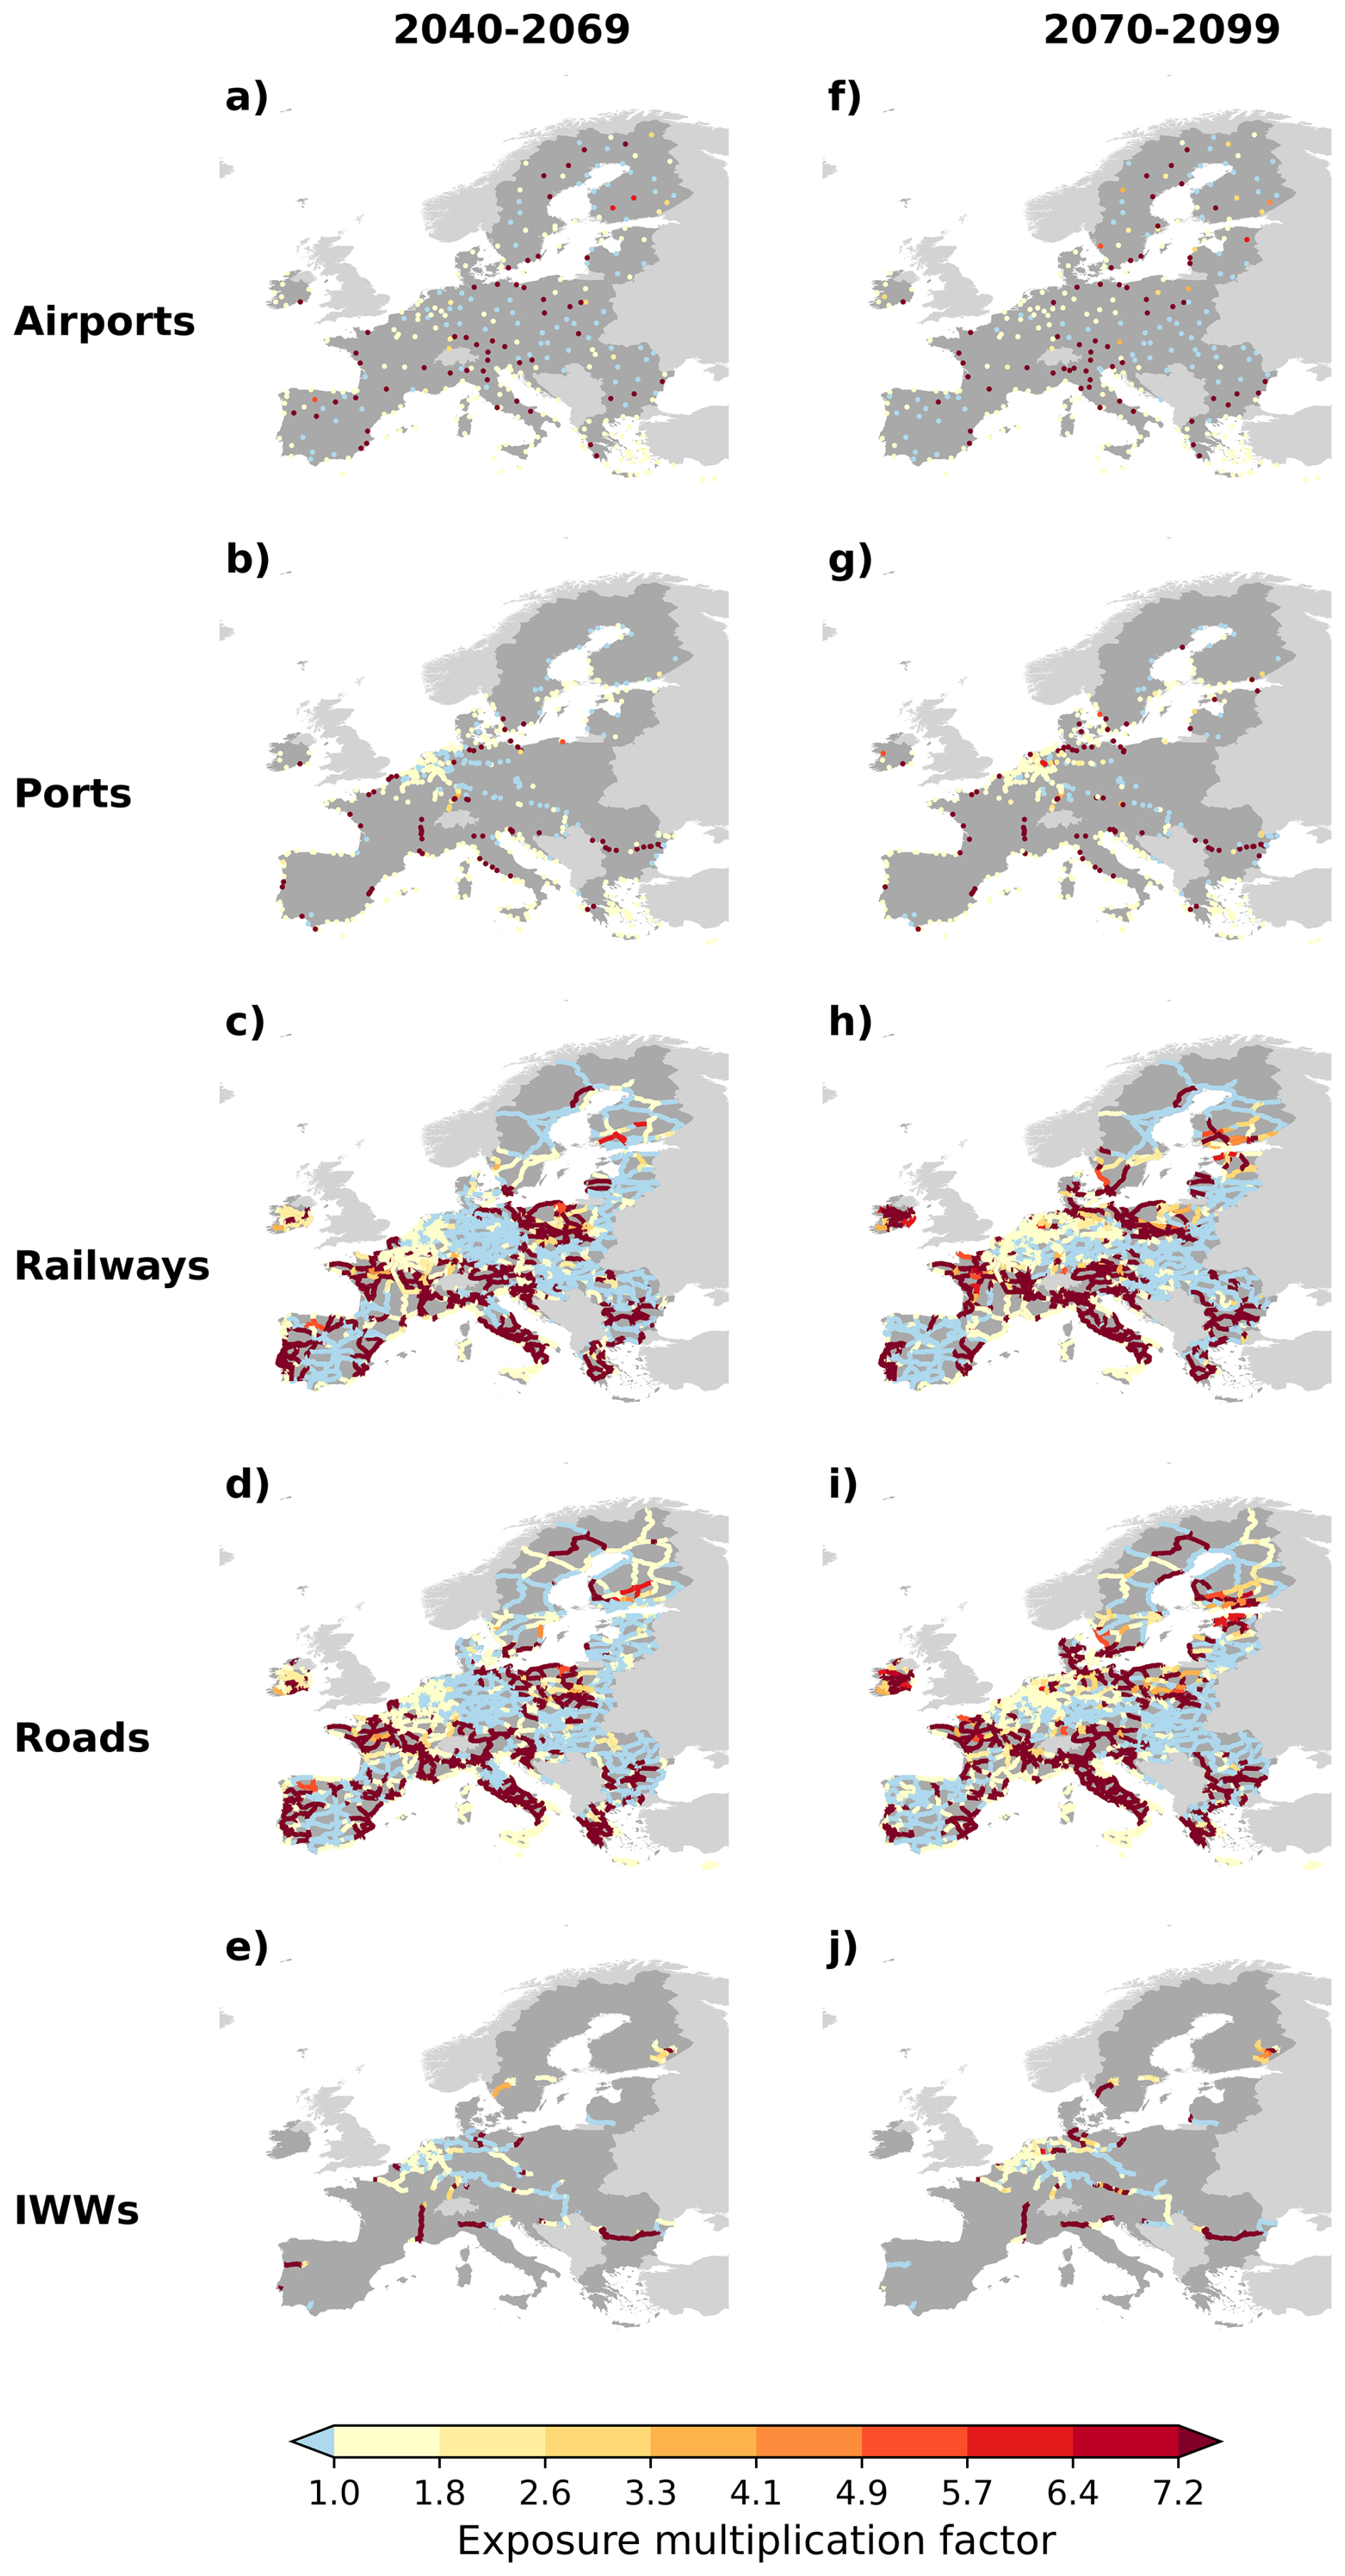
Figure A7 Maps of multi-model ensemble median exposure multiplication factors of the TEN-T by mode (rows) to floods by the middle (2040–2069) and the end of the century (2070–2099) (columns) relative to historical climate conditions (1980–2009) under a high emission scenario (RCP8.5). The multi-model ensemble median is computed across all available combinations of impacts models and GCMs.
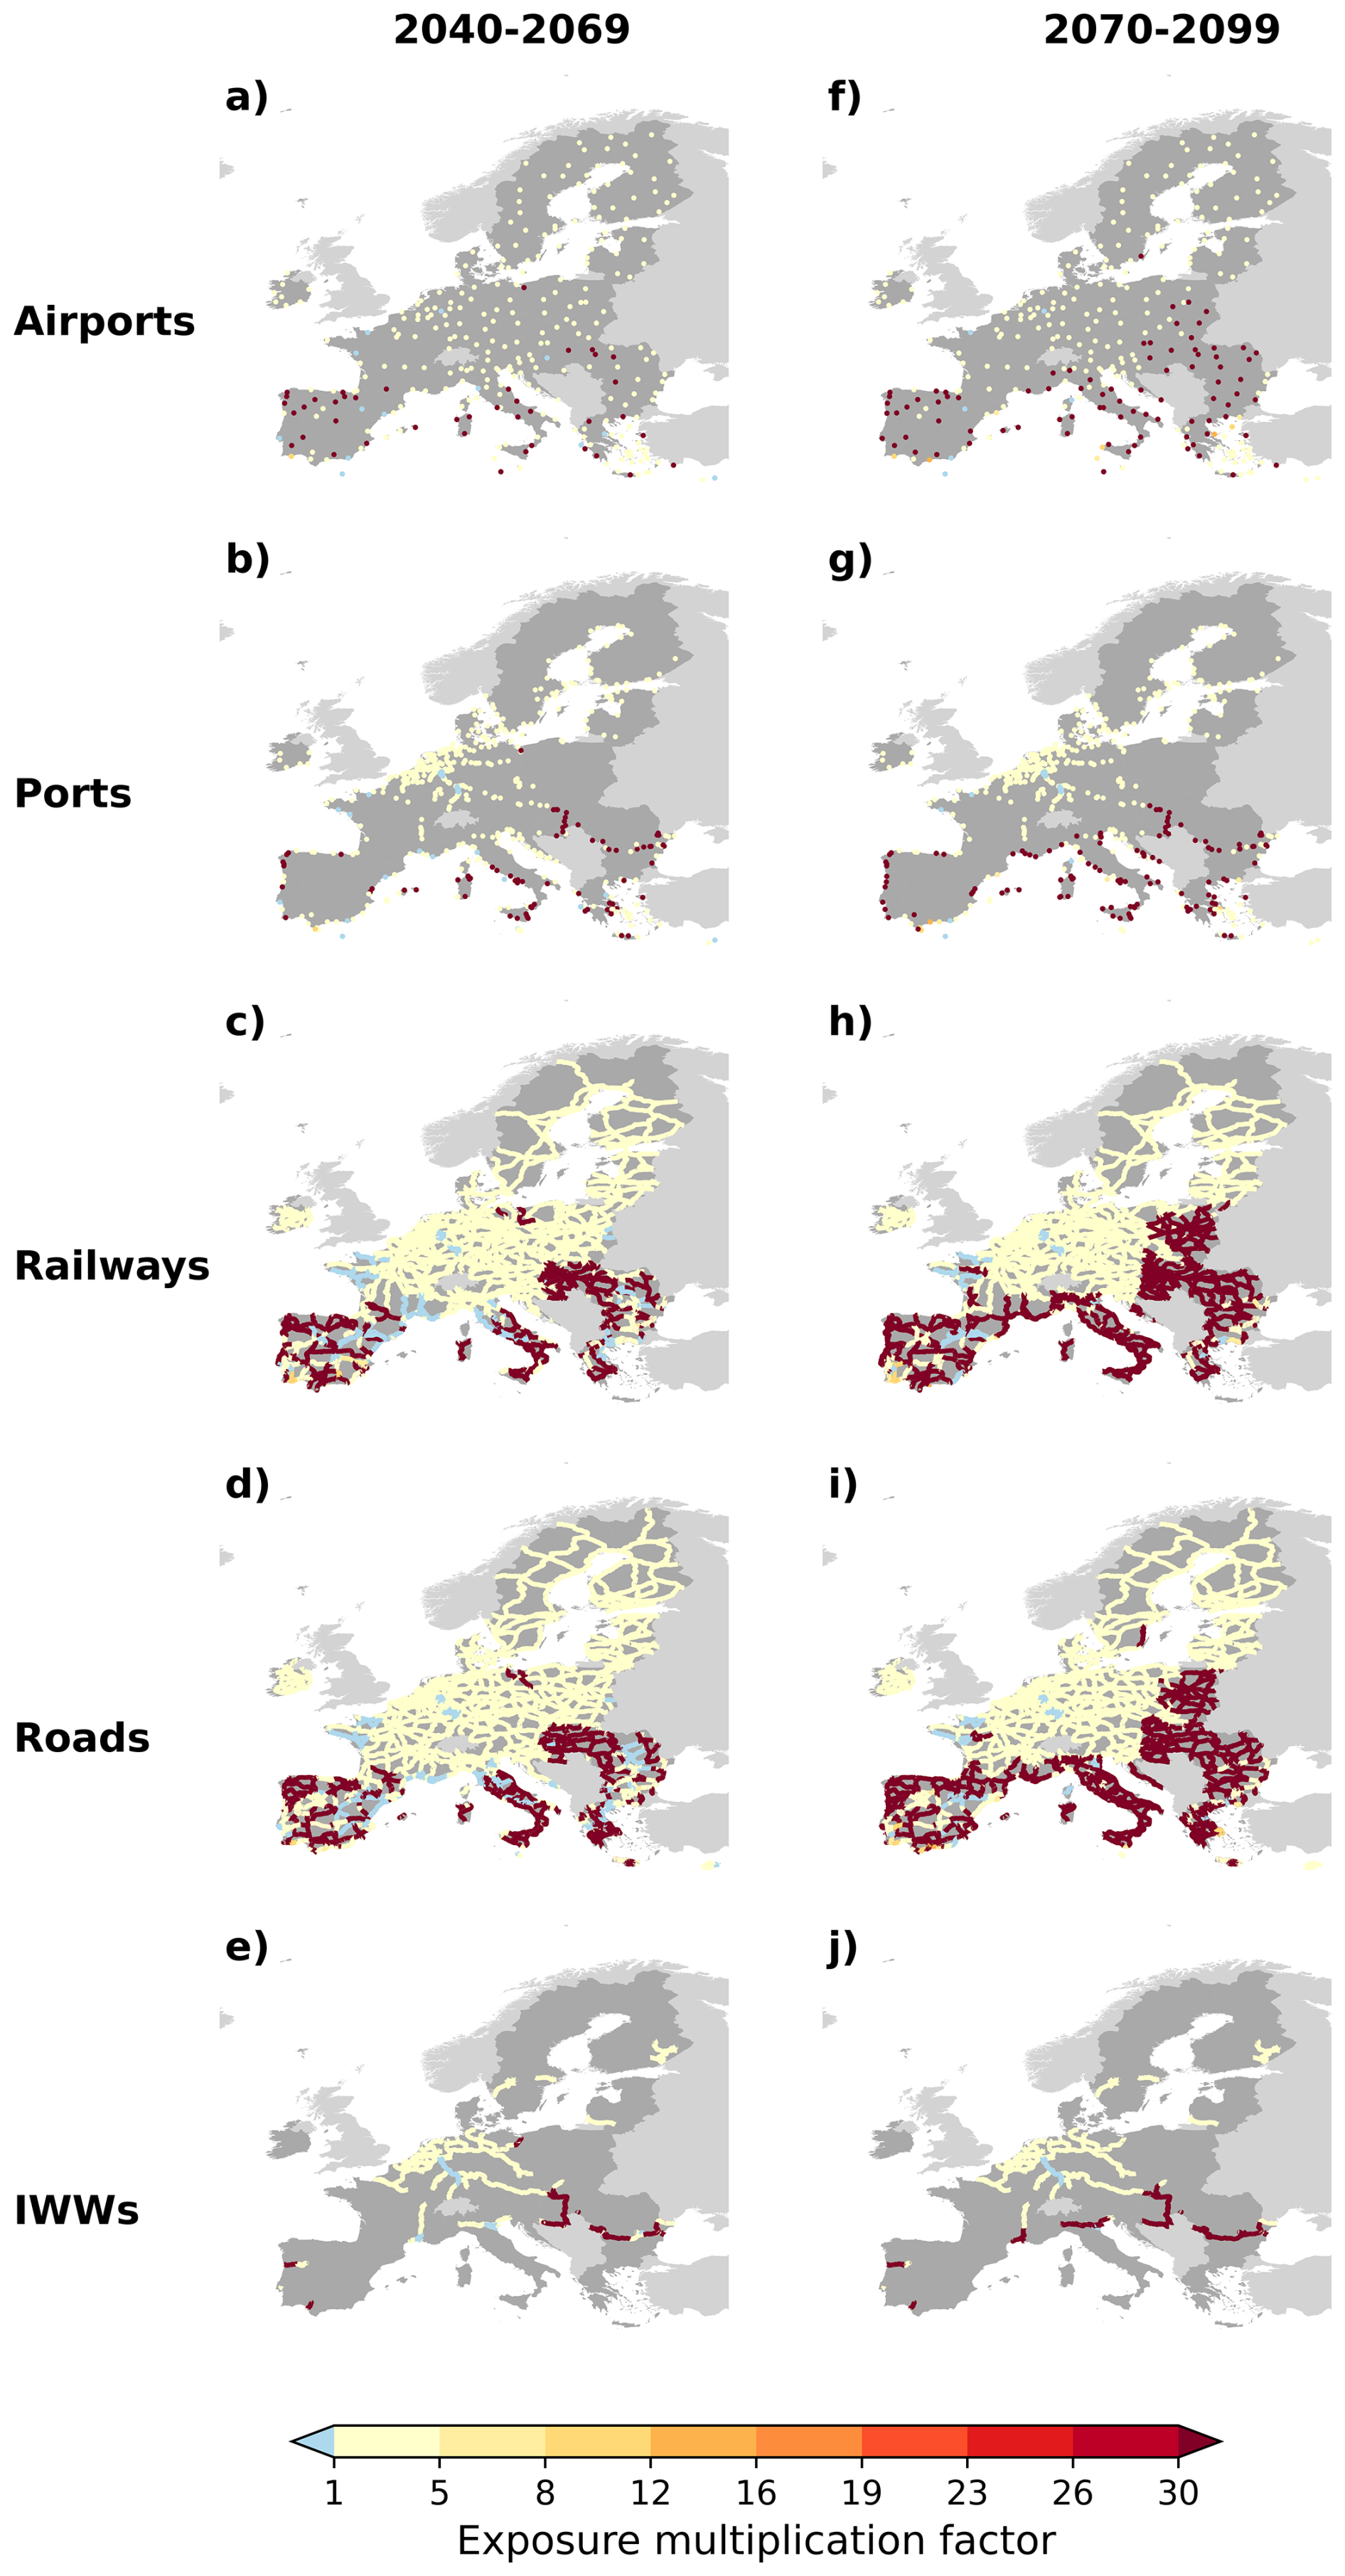
Figure A8 Maps of multi-model ensemble median exposure multiplication factors of the TEN-T by mode (rows) to wildfires by the middle (2040–2069) and the end of the century (2070–2099) (columns) relative to historical climate conditions (1980–2009) under a high emission scenario (RCP8.5).The multi-model ensemble median is computed across all available combinations of impacts models and GCMs.
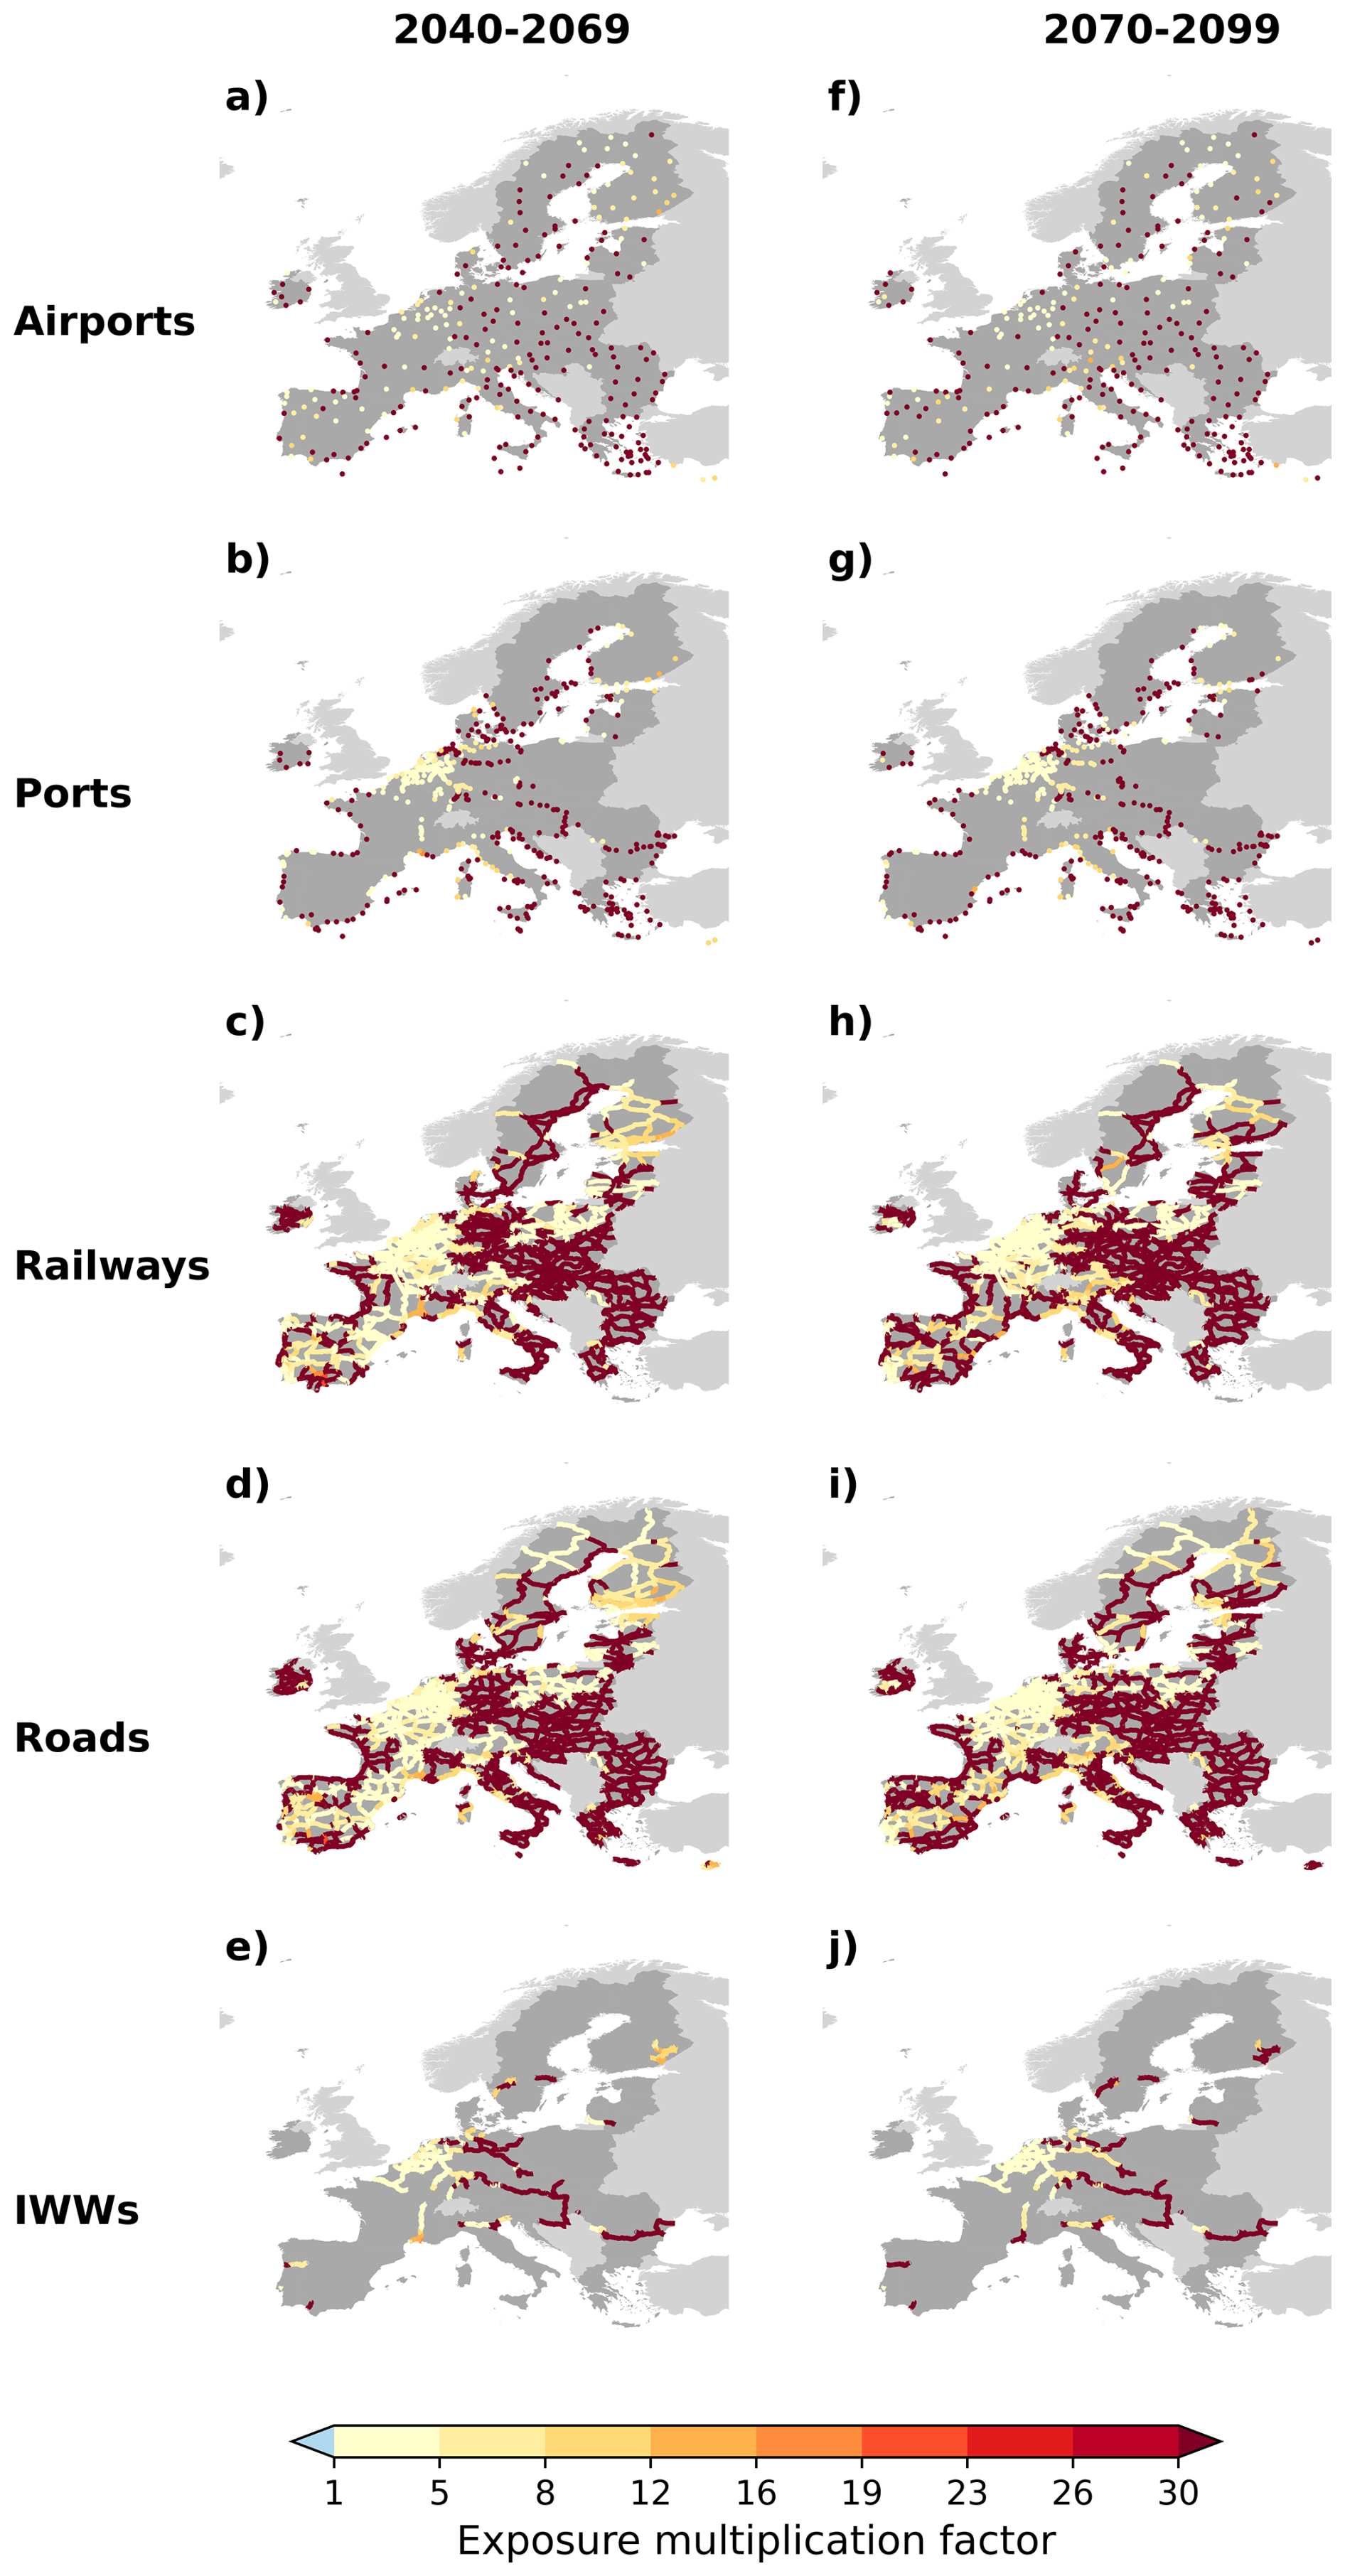
Figure A9 Maps of multi-model ensemble median exposure multiplication factors of the TEN-T by mode (rows) to heatwaves by the middle (2040–2069) and the end of the century (2070–2099) (columns) relative to historical climate conditions (1980–2009) under a low emission scenario (RCP2.6). The multi-model ensemble median is computed across all available combinations of impacts models and GCMs.
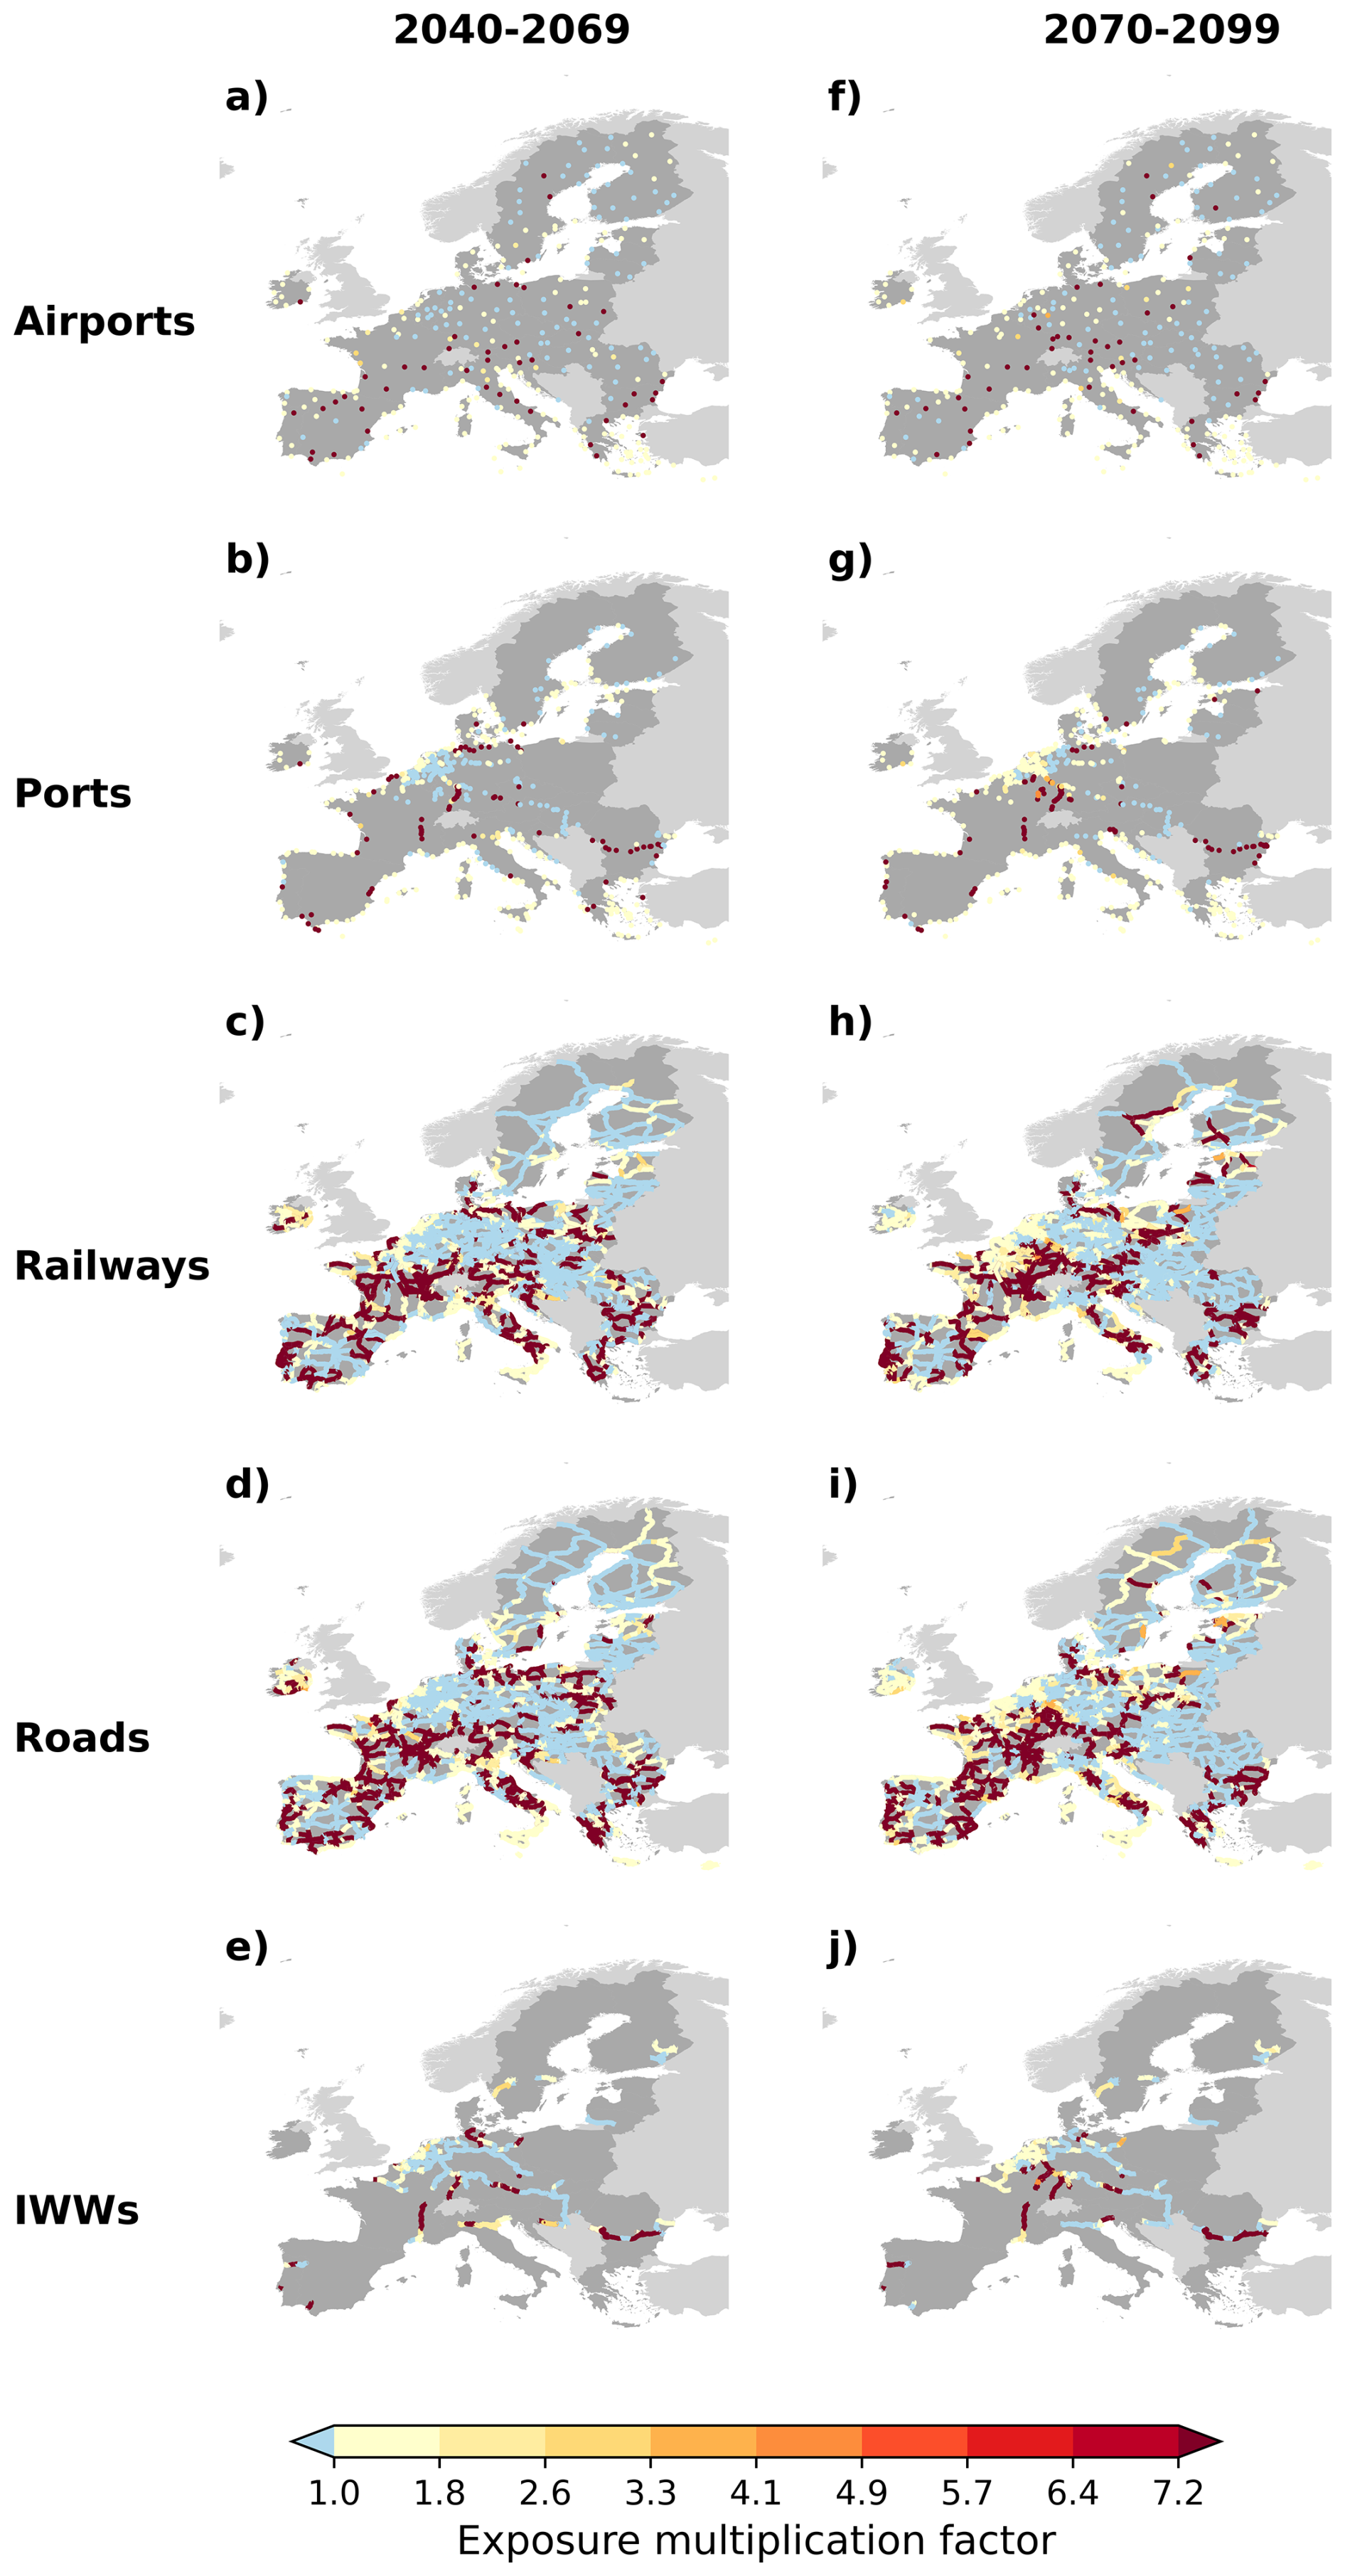
Figure A10 Maps of multi-model ensemble median exposure multiplication factors of the TEN-T by mode (rows) to floods by the middle (2040–2069) and the end of the century (2070–2099) (columns) relative to historical climate conditions (1980–2009) under a low emission scenario (RCP2.6). The multi-model ensemble median is computed across all available combinations of impacts models and GCMs.
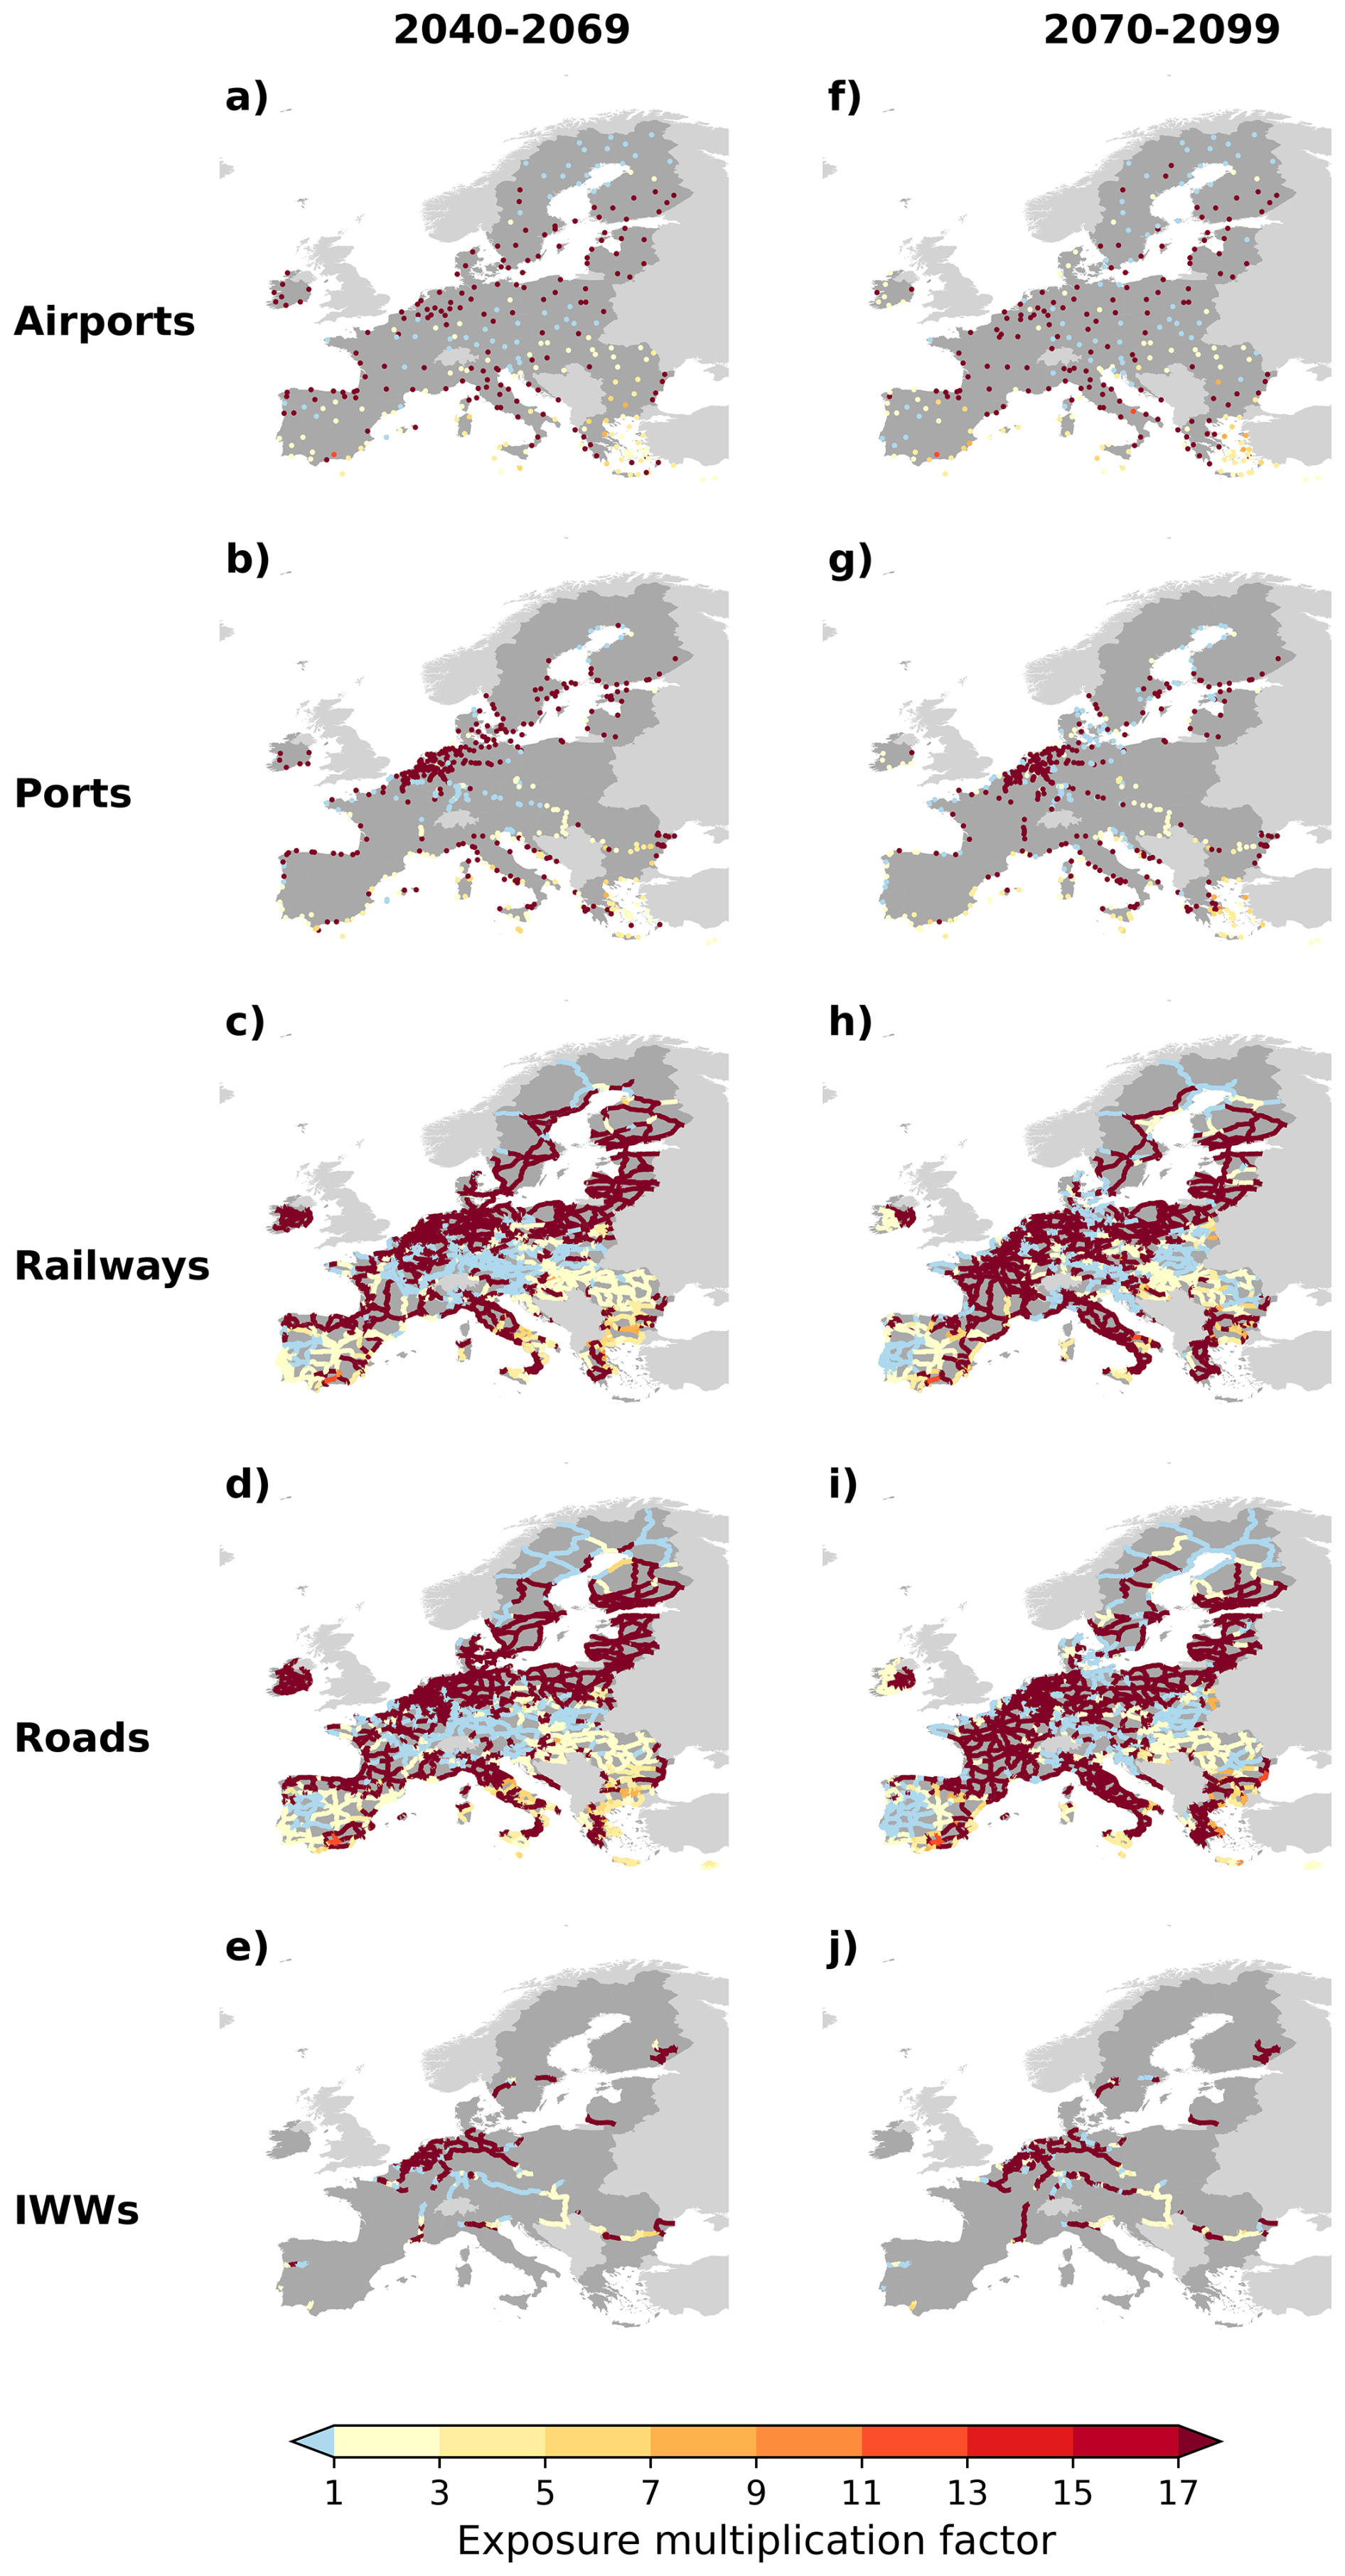
Figure A11 Maps of multi-model ensemble median exposure multiplication factors of the TEN-T by mode (rows) to droughts by the middle (2040–2069) and the end of the century (2070–2099) (columns) relative to historical climate conditions (1980–2009) under a low emission scenario (RCP2.6). The multi-model ensemble median is computed across all available combinations of impacts models and GCMs.
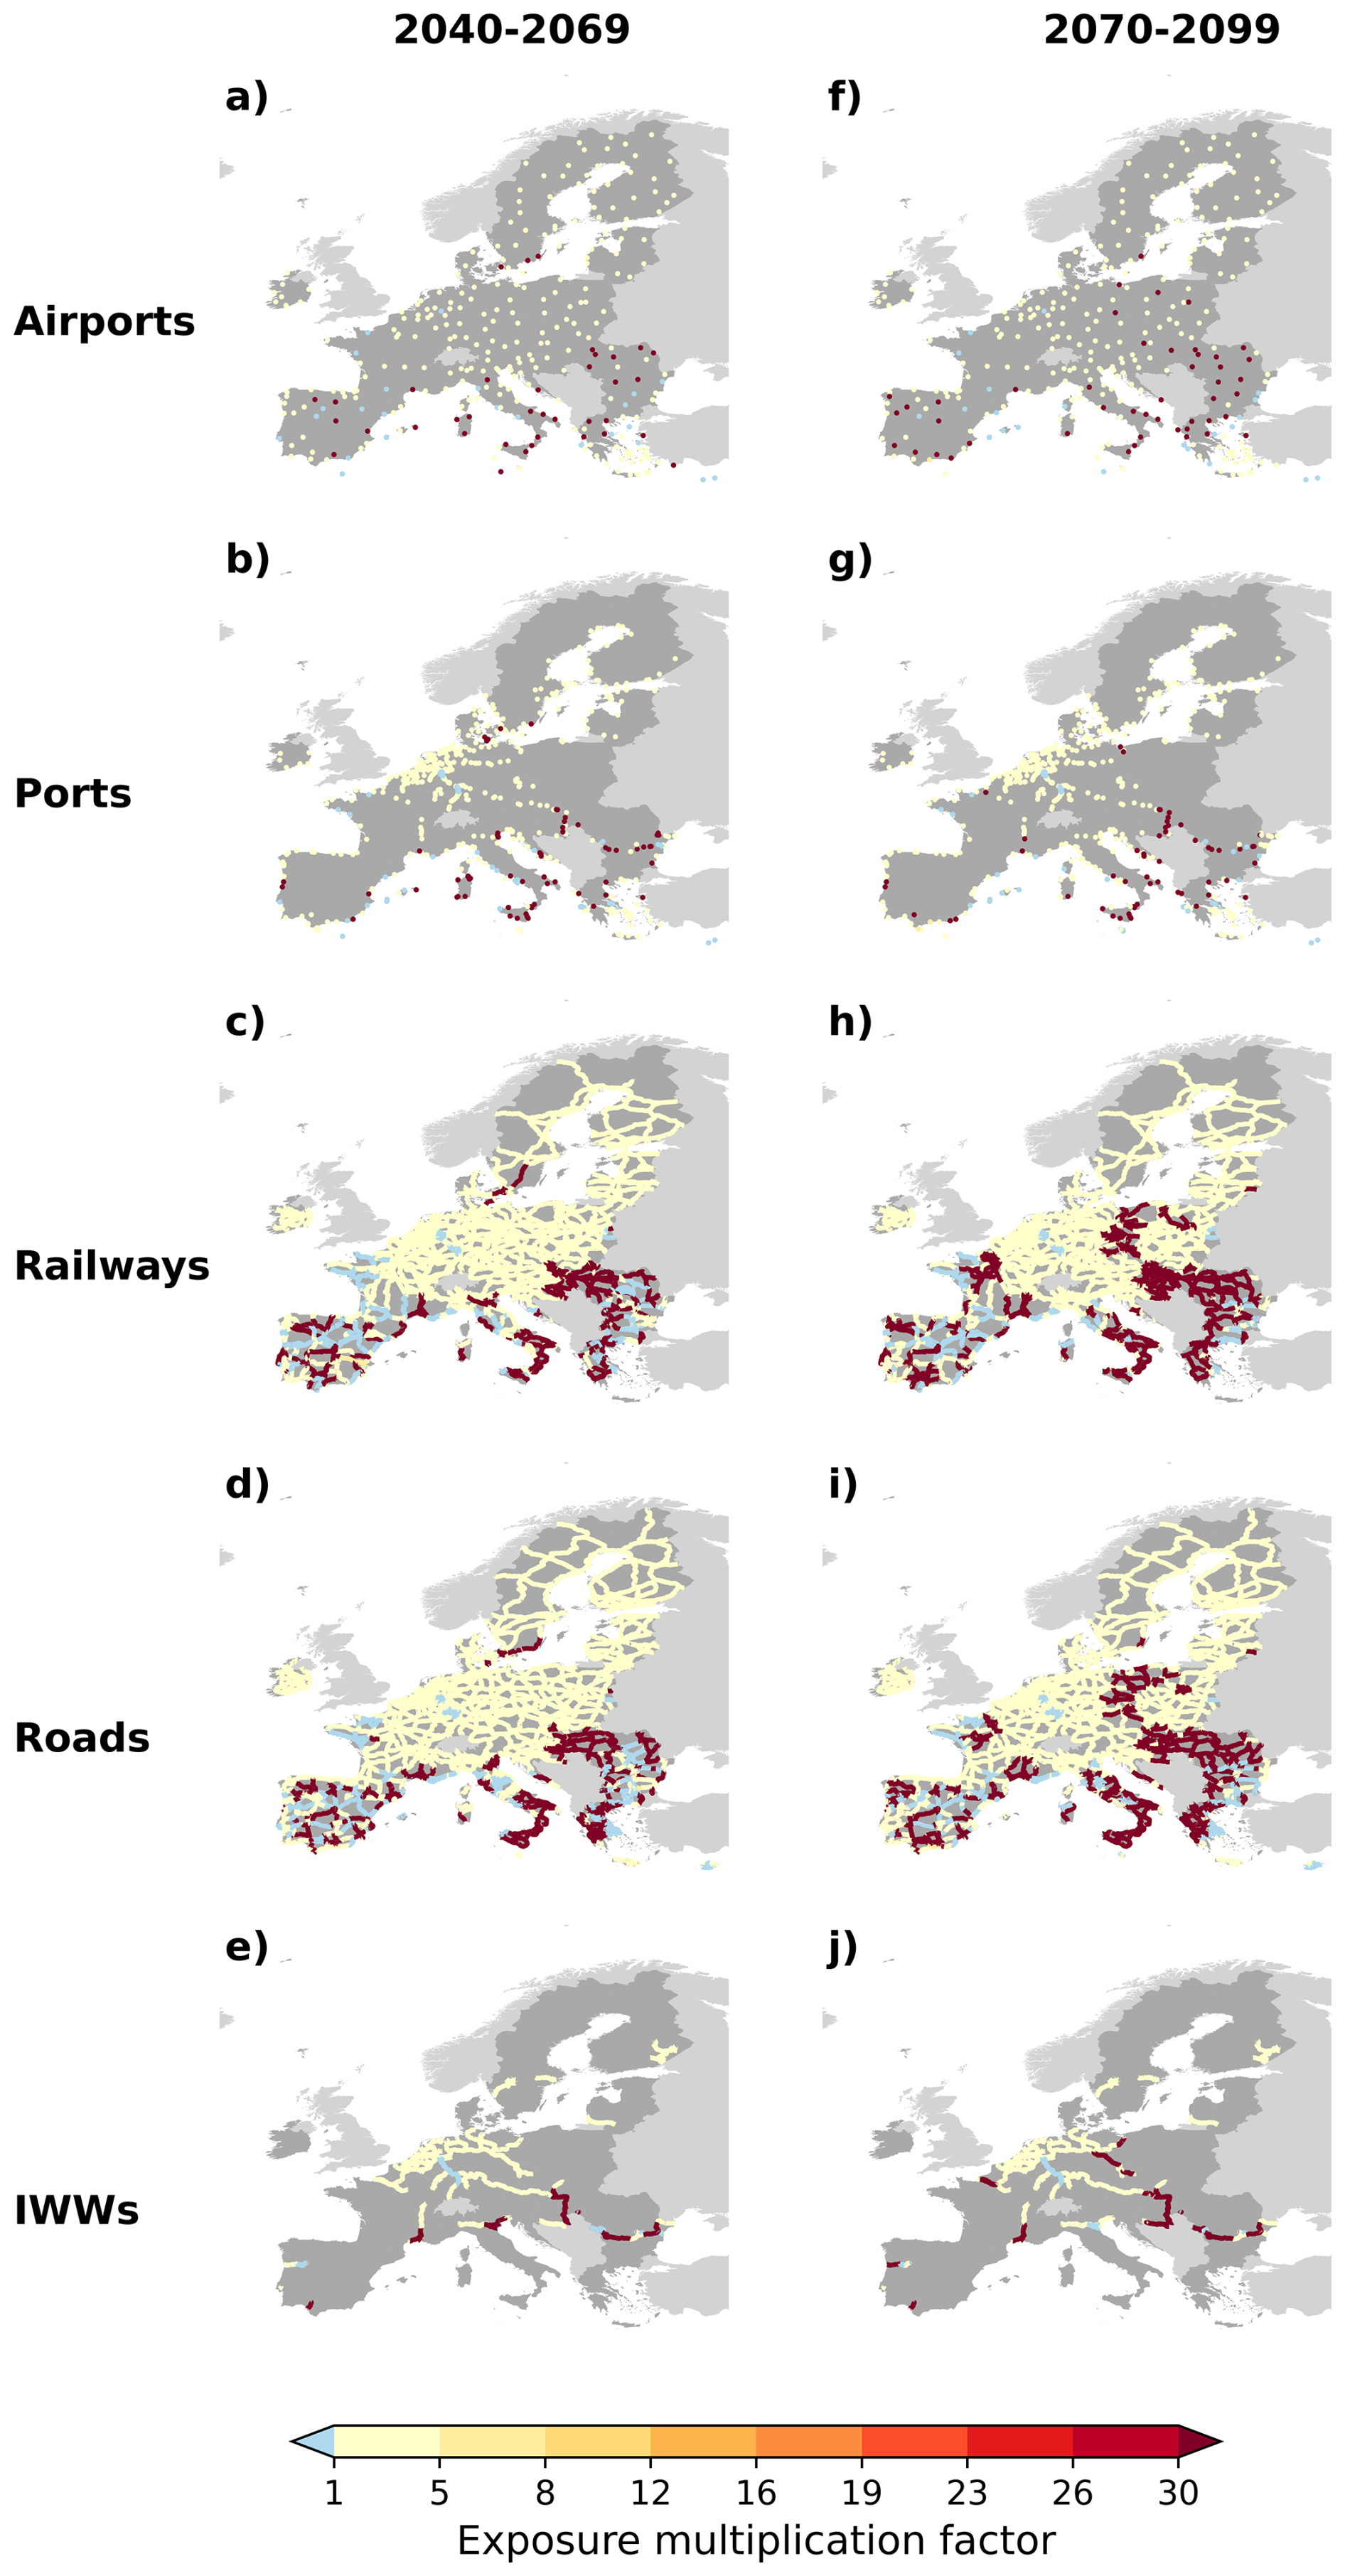
Figure A12 Maps of multi-model ensemble median exposure multiplication factors of the TEN-T by mode (rows) to wildfires by the middle (2040–2069) and the end of the century (2070–2099) (columns) relative to historical climate conditions (1980–2009) under a low emission scenario (RCP2.6). The multi-model ensemble median is computed across all available combinations of impacts models and GCMs.
The postprocessed ISIMIP2b dataset used is available on Zenodo at https://doi.org/10.5281/zenodo.5497633 (Thiery et al., 2021b). Correspondence and additional requests should be addressed to Cristina Deidda (cristina.deidda@vub.be). All scripts used for the analyses are available through the GitHub repository of the Department of Water and Climate at the Vrije Universiteit Brussel (https://github.com/VUB-HYDR/2025_Deidda_etal_NHESS, VUB-HYDR, 2025).
WT and CD conceived the analysis. CD performed the analysis, created the figures, and wrote the initial draft of the manuscript. AAK and WS managed the project, contributed to the writing of the manuscript. CS contributed to the manuscript revision. All authors reviewed the manuscript. WT supervised the project.
The contact author has declared that none of the authors has any competing interests.
Publisher's note: Copernicus Publications remains neutral with regard to jurisdictional claims made in the text, published maps, institutional affiliations, or any other geographical representation in this paper. The authors bear the ultimate responsibility for providing appropriate place names. Views expressed in the text are those of the authors and do not necessarily reflect the views of the publisher.
This article is part of the special issue “Methodological innovations for the analysis and management of compound risk and multi-risk, including climate-related and geophysical hazards (NHESS/ESD/ESSD/GC/HESS inter-journal SI)”. It is not associated with a conference.
We acknowledge the InterSectoral Impact Model Intercomparison Project (ISIMIP; https://www.isimip.org/, last access: 10 February 2025) for providing a multi-model database of climate impacts across several sectors at both global and regional scales under a range of emission scenario. ChatGPT was used to assist with English proofreading. Special thanks go to Lange et al. (2020) for their post-processed ISIMIP2b dataset, which was fundamental to this research. The authors thank Michalis Vousdoukas for the helpful discussions related to coastal floods.
This project has received funding from the European Union’s Horizon 2020 research and innovation programme under the Marie Skłodowska-Curie (grant agreement no. 945380). Additional funding comes from the “Support study on climate adaptation and cross-border investment needs to realise the TEN-T Network” (service contract no. MOVE/B.1/2023-47), commissioned by the European Commission’s Directorate-General for Mobility and Transport. Wim Thiery acknowledges funding from the European Research Council (ERC) under the European Union's Horizon Framework research and innovation programme (grant agreement no. 101076909; ERC Consolidator Grant “LACRIMA”). Wim Thiery acknowledges further funding from the European Union (grant agreement no. 101081369) (SPARCCLE).
This paper was edited by Aloïs Tilloy and reviewed by three anonymous referees.
Alcántara-Ayala, I.: Landslides in a changing world, Landslides, https://doi.org/10.1007/s10346-024-02451-1, 2025. a
Allen, T., Mcleod, G., and Hutt, S.: Sea level rise exposure assessment of U.S. East Coast cargo container terminals, Marit. Policy Manag., 49, 1–23, https://doi.org/10.1080/03088839.2021.1903597, 2021. a
Aon: Global Catastrophe Recap: July 2021, Aon, https://info.aon.de/wp-content/uploads/Aon-July-Global-Recap.pdf (last access: 11 June 2024), 2021. a
Arias, P., Bellouin, N., Coppola, E., Jones, R., Krinner, G., Marotzke, J., Naik, V., Palmer, M., Plattner, G.-K., Rogelj, J., Rojas, M., Sillmann, J., Storelvmo, T., Thorne, P., Trewin, B., Achuta Rao, K., Adhikary, B., Allan, R., Armour, K., Bala, G., Barimalala, R., Berger, S., Canadell, J., Cassou, C., Cherchi, A., Collins, W., Collins, W., Connors, S., Corti, S., Cruz, F., Dentener, F., Dereczynski, C., Di Luca, A., Diongue Niang, A., Doblas-Reyes, F., Dosio, A., Douville, H., Engelbrecht, F., Eyring, V., Fischer, E., Forster, P., Fox-Kemper, B., Fuglestvedt, J., Fyfe, J., Gillett, N., Goldfarb, L., Gorodetskaya, I., Gutierrez, J., Hamdi, R., Hawkins, E., Hewitt, H., Hope, P., Islam, A., Jones, C., Kaufman, D., Kopp, R., Kosaka, Y., Kossin, J., Krakovska, S., Lee, J.-Y., Li, J., Mauritsen, T., Maycock, T., Meinshausen, M., Min, S.-K., Monteiro, P., Ngo-Duc, T., Otto, F., Pinto, I., Pirani, A., Raghavan, K., Ranasinghe, R., Ruane, A., Ruiz, L., Sallée, J.-B., Samset, B., Sathyendranath, S., Seneviratne, S., Sörensson, A., Szopa, S., Takayabu, I., Tréguier, A.-M., van den Hurk, B., Vautard, R., von Schuckmann, K., Zaehle, S., Zhang, X., and Zickfeld, K.: Technical Summary, Cambridge University Press, Cambridge, United Kingdom and New York, NY, USA, 33–144, https://doi.org/10.1017/9781009157896.002, 2021. a, b
Arnell, N. W.: The implications of climate change for emergency planning, Int. J. Disast. Risk Re., 83, 103425, https://doi.org/10.1016/j.ijdrr.2022.103425, 2022. a
Asariotis, R., Benamara, H., and Mohos Naray, V.: Port Industry Survey on Climate Change Impacts and Adaptation, United Nations Conference on Trade and Development (UNCTAD), Geneva, Switzerland, https://doi.org/10.13140/RG.2.2.28176.66569, 2017. a, b, c, d
Asariotis, R., Monioudi, I., Mohos Naray, V., Velegrakis, A., Vousdoukas, M., Mentaschi, L., and Feyen, L.: Climate change and seaports: hazards, impacts and policies and legislation for adaptation, Anthropocene Coasts, 7, https://doi.org/10.1007/s44218-024-00047-9, 2024. a, b
Asghari, M., Jaber, M. Y., and Mirzapour Al-e-hashem, S.: Coordinating vessel recovery actions: Analysis of disruption management in a liner shipping service, Eur. J. Oper. Res., 307, 627–644, https://doi.org/10.1016/j.ejor.2022.08.039, 2023. a, b
Barnett, T., Adam, J., and Lettenmaier, D.: Potential Impacts of a Warming Climate on Water Availability in Snow-Dominated Regions, Nature, 438, 303–9, https://doi.org/10.1038/nature04141, 2005. a
Bauer, N., Keller, D., Garbe, J., Karstens, K., Piontek, F., Von Bloh, W., Thiery, W., Zeitz, M., Mengel, M., Strefler, J., Thonicke, K., and Winkelmann, R.: Exploring risks and benefits of overshooting a 1.5 °C carbon budget over space and time, Environ. Res. Lett., 18, 54015, https://doi.org/10.1088/1748-9326/accd83, 2023. a
Becker, A., Inoue, S., Fischer, M., and Schwegler, B.: Climate change impacts on international seaports: Knowledge, percep-tions, and planning efforts among port adminstrators, Clim. Change, 110, 5–29, https://doi.org/10.1007/s10584-011-0043-7, 2012. a
Bednar-Friedl, B., Biesbroek, R., Schmidt, D. N., Alexander, P., Børsheim, K. Y., Carnicer, J., Georgopoulou, E., Haasnoot, M., Le Cozannet, G., Lionello, P., Lipka, O., Möllmann, C., Muccione, V., Mustonen, T., Piepenburg, D., and Whitmarsh, L.: Europe, in: Climate Change 2022: Impacts, Adaptation and Vulnerability. Contribution of Working Group II to the Sixth Assessment Report of the Intergovernmental Panel on Climate Change, edited by: Pörtner, H.-O., Roberts, D. C., Tignor, M., Poloczanska, E. S., Mintenbeck, K., Alegría, A., Craig, M., Langsdorf, S., Löschke, S., Möller, V., Okem, A., and Rama, B., Cambridge University Press, Cambridge, UK and New York, NY, USA, 1817–1927, https://doi.org/10.1017/9781009325844.015, 2022. a
Best, M. J., Pryor, M., Clark, D. B., Rooney, G. G., Essery, R. L. H., Ménard, C. B., Edwards, J. M., Hendry, M. A., Porson, A., Gedney, N., Mercado, L. M., Sitch, S., Blyth, E., Boucher, O., Cox, P. M., Grimmond, C. S. B., and Harding, R. J.: The Joint UK Land Environment Simulator (JULES), model description – Part 1: Energy and water fluxes, Geosci. Model Dev., 4, 677–699, https://doi.org/10.5194/gmd-4-677-2011, 2011. a
Bevacqua, E., de michele, C., Manning, C., Couasnon, A., F S Ribeiro, A., Ramos, A., Vignotto, E., Bastos, A., Blesic, S., Durante, F., Hillier, J., Oliveira, S., Pinto, J., Ragno, E., Rivoire, P., Saunders, K., Wiel, K., Wu, W., Zhang, T., and Zscheischler, J.: Guidelines for Studying Diverse Types of Compound Weather and Climate Events, Earth's Future, 9, https://doi.org/10.1029/2021EF002340, 2021. a
Bevacqua, E., Rakovec, O., Schumacher, D., Kumar, R., Thober, S., Samaniego, L., Seneviratne, S., and Zscheischler, J.: Direct and lagged climate change effects strongly intensified the widespread 2022 European drought, Nat. Geosci., 17, 1100–1107, https://doi.org/10.1038/s41561-024-01559-2, 2024. a
Bles, T., Bessembinder, J., Chevreuil, M., Danielsson, P., Falemo, S., Venmans, A., Ennesser, Y., and Löfroth, H.: Climate Change Risk Assessments and Adaptation for Roads – Results of the ROADAPT Project, Transp. Res. Proc., 14, 58–67, https://doi.org/10.1016/j.trpro.2016.05.041, 2016. a
Britannia P&I: Climate Change: Severe Weather and Its Impact on Shipping Risks, https://britanniapandi.com/2025/01/climate-change-climate-change-severe-weather-and-its-impact-on-shipping-risks/#footnote1, last access: 4 March 2025. a, b
Broeckx, J., Maertens, M., Isabirye, M., Vanmaercke, M., Namazzi, B., Deckers, J., Tamale, J., Jacobs, L., Thiery, W., Kervyn, M., Vranken, L., and Poesen, J.: Landslide susceptibility and mobilization rates in the Mount Elgon region, Uganda, Landslides, 16, https://doi.org/10.1007/s10346-018-1085-y, 2018. a
Buluttan: Effects of Extreme Weather Events on Port Operations, https://www.buluttan.com/blog/severe-weather/effects-of-extreme-weather-events-on-port-operations, last acces: 4 March 2025. a, b, c
Burbidge, R.: Climate change risks and resilience for European aviation, Transp. Res. Proc., 72, 3276–3282, https://doi.org/10.1016/j.trpro.2023.11.860, 2023. a
Burbidge, R., Paling, C., and Dunk, R. M.: A systematic review of adaption to climate change impacts in the aviation sector, Transport Rev., 44, 8–33, https://doi.org/10.1080/01441647.2023.2220917, 2024. a
Burgen, S.: Spain wildfires: up to 20 injured after passengers break out of train engulfed by flames, https://www.theguardian.com/world/2022/aug/17/spain-wildfires-injured-after-passengers-break-out-of-train-engulfed-by-flames (last access: 30 October 2024), 2022. a, b
Burton, C., Lampe, S., Kelley, D. I., et al.: Global burned area increasingly explained by climate change, Nat. Clim. Change, 14, 1186–1192, https://doi.org/10.1038/s41558-024-02140-w, 2024. a
Cattiaux, J., Vautard, R., Cassou, C., Yiou, P., Masson-Delmotte, V., and Codron, F.: Winter 2010 in Europe: A cold extreme in a warming climate, Geophys. Res. Lett., 37, https://doi.org/10.1029/2010GL044613, 2010. a
Chen, X. and Wang, H.: Enhancement of roadway pavement resilience to flooding: impact assessment and mitigation strategies, Transport. Res. D-Tr. E., 148, 104946, https://doi.org/10.1016/j.trd.2025.104946, 2025. a
Chini, M.: Hundreds of passengers stuck for hours on scorching train to Brussels, https://www.brusselstimes.com/259056/hundreds-of-passengers-stuck-for-hours-on-scorching-train-to-brussels (last access: 30 October 2024), 2022a. a
Chini, M.: Compensation for passengers stuck for hours on train to Brussels, https://www.brusselstimes.com/259362/compensation-for-passengers-stuck-for-hours-on-train-to-brussels (last access: 30 October 2024), 2022b. a
Chini, M.: Belgian Rail Scraps Over 30 Trains Due to Extreme Heat on Tuesday, https://www.brusselstimes.com/256674/belgian-rail-scraps-over-30-trains-due-to-extreme-heat-on-tuesday (last access: 30 October 2024), 2022c. a
Christodoulou, A., Christidis, P., and Demirel, H.: Sea-level rise in ports: a wider focus on impacts, Marit. Econ. Logist., 21, 482–496, https://doi.org/10.1057/s41278-018-0114-z, 2019. a, b, c, d
Christopher, Barros, V., Mastrandrea, M., Katharine, Abdrabo, M., Adger, W., Federation, Y., Anisimov, O., Arent, D., Jonathon, Virginia, Cai, R., Monalisa, Cohen, S., Wolfgang, Dasgupta, P., Davidson, D., Denton, F., Doell, P., and Yohe, G.: Climate change 2014: impacts, adaptation, and vulnerability – IPCC WGII AR5 summary for policymakers, 1–32, https://doi.org/10.1017/CBO9781107415379.003, 2014. a
Churm, P. A.: Severe Weather in France Grounds Flights, Leaves Thousands Without Power, https://www.euronews.com/2022/06/05/severe-weather-in-france-grounds-flights-leaves-thousands-without-power (last access: 24 March 2025), 2022. a
Cross, B. R.: Europe heatwave 2023: What's happening and how to cope with extreme heat, British Red Cross, https://www.redcross.org.uk/stories/disasters-and-emergencies/world/europe-heatwave-2023 (last access: 10 March 2024), 2023. a
de Vilder, S., Massey, C., Lukovic, B., Taig, T., and Morgenstern, R.: What drives landslide risk? Disaggregating risk analyses, an example from the Franz Josef Glacier and Fox Glacier valleys, New Zealand, Nat. Hazards Earth Syst. Sci., 22, 2289–2316, https://doi.org/10.5194/nhess-22-2289-2022, 2022. a
De Vivo, C., Ellena, M., Capozzi, V., Budillon, G., and Mercogliano, P.: Risk assessment framework for Mediterranean airports: a focus on extreme temperatures and precipitations and sea level rise, Nat. Hazards, 111, https://doi.org/10.1007/s11069-021-05066-0, 2022. a
Deijns, A., Michéa, D., Déprez, A., Malet, J.-P., Kervyn, F., Thiery, W., and Dewitte, O.: A semi-supervised multi-temporal landslide and flash flood event detection methodology for unexplored regions using massive satellite image time series, ISPRS J. Photogramm., 215, 400–418, https://doi.org/10.1016/j.isprsjprs.2024.07.010, 2024. a
Delahaye, J.: Breaking: Jet2 cancels all holidays and flights to Skiathos amid severe flooding in Greece, Mirror, https://www.mirror.co.uk/travel/news/breaking-jet2-cancels-holidays-flights-30879303 (last access: 7 July 2026), 2023. a
Deutsche Welle: Germany's Autobahns Crumble in Early Summer Heat, https://www.dw.com/en/germanys-autobahns-crumble-in-early-summer-heat/a-44050774 (last access: 4 March 2025), 2018. a
Die Zeit: Reparatur von Straßen und Brücken kostet 700 Millionen Euro, Zeit Online, https://www.zeit.de/gesellschaft/zeitgeschehen/2021-07/hochwasser-reparatur-infrastruktur-finanzhilfen (last access: 12 June 2024), 2021. a
Dobney, K., Baker, C., Quinn, A., and Chapman, L.: Quantifying the effects of high summer temperatures due to climate change on buckling and rail related delays in south–east United Kingdom, Meteorol. Appl., 16, 245–251, https://doi.org/10.1002/met.114, 2009. a
Donat, M. G., Leckebusch, G. C., Wild, S., and Ulbrich, U.: Future changes in European winter storm losses and extreme wind speeds inferred from GCM and RCM multi-model simulations, Nat. Hazards Earth Syst. Sci., 11, 1351–1370, https://doi.org/10.5194/nhess-11-1351-2011, 2011. a
DRMKC: DRMKC Risk Data Hub, https://drmkc.jrc.ec.europa.eu/risk-data-hub#/ (last access: 28 August 2024), 2024. a
Dury, M., Hambuckers, A., Warnant, P., Henrot, A., Favre, E., Ouberdous, M., and Francois, L.: Responses of European forest ecosystems to 21st century climate: assessing changes in interannual variability and fire intensity, iForest – Biogeosciences and Forestry, 82–99, https://doi.org/10.3832/ifor0572-004, 2011. a
Dutch News: Storm Causes Flash Flooding, Cancelled Flights but Few Problems, https://www.dutchnews.nl/2023/06/storm-causes-flash-flooding-cancelled-flights-but-few-problems/ (last access: 4 March 2025), 2023. a
Earth Systems: Geotechnical Effects of Prolonged Drought, Website, https://www.earthsystems.com/geotechnical-effects-of-prolonged-drought/, (last access: 10 March 2024), 2024. a
EASA: Managing the impact of climate change on aviation, https://www.easa.europa.eu/en/en/domains/safety-management/managing-impact-climate-change-aviation (last access: 29 August 2025), 2025. a
ECRA: European Climate Risk Assessment – Executive summary, https://doi.org/10.2800/204249, 2024. a
EEA: EEA – European Environment Agency (2023) Economic losses from weather- and climate-related extremes in Europe, https://www.eea.europa.eu/en/analysis/indicators/economic-losses-from-climate-related#footnote-MSEXHN6Y (last access: 10 April 2024), 2023. a, b
EEA: European Environment Agency (2024) Extreme sea levels and coastal flooding in Europe, https://www.eea.europa.eu/en/analysis/indicators/extreme-sea-levels-and-coastal-flooding?activeAccordion=, (last access: 9 April 2025), 2024. a
Enei, R., Doll, C., Partzsch, I., and Panteia, J. K.: Vulnerability of transport systems, https://www.researchgate.net/publication/270571786 (last access: 21 June 2025), 2010. a, b
Etter, S., Addor, N., Huss, M., and Finger, D.: Climate change impacts on future snow, ice and rain runoff in a Swiss mountain catchment using multi-dataset calibration, J. Hydrol., 13, 222–239, https://doi.org/10.1016/j.ejrh.2017.08.005, 2017. a
Eurocontrol: Climate Change Risks for European Aviation: Annex 3: Impact of sea level rise on European airport operations, https://www.eurocontrol.int/sites/default/files/2021-09/eurocontrol-study-climate-change-risk-european-aviation-annex-3.pdf (last access: 11 June 2024), 2021a. a, b, c
Eurocontrol: Climate Change Risks for European Aviation: Summary Report, https://www.eurocontrol.int/sites/default/files/2021-09/eurocontrol-study-climate-change-risk-european-aviation-summary-report-2021.pdf (last access: 11 June 2024), 2021b. a, b, c, d, e
Euronews: Europe heatwave: Airport runways melt amid hottest day of the year in UK, https://www.euronews.com/2022/07/18/heatwave-red-alert-as-temperatures-soar-to-extreme-highs-across-europe (last access: 4 March 2025), 2022. a
Fernandez-Perez, A., Lara, J. L., Lucio, D., and Losada, I. J.: Compound climate change risk analysis for port infrastructures, Coast. Eng., 193, 104560, https://doi.org/10.1016/j.coastaleng.2024.104560, 2024. a
Fidanza, C.: Closure of the Frejus tunnel: a threat to the internal market and cross-border goods traffic – P-003740/2023, European Parliament, https://www.europarl.europa.eu/doceo/document/P-9-2023-003740_EN.html (last access: 28 August 2024), 2023. a
Fischer, E. and Knutti, R.: Anthropogenic contribution to global occurrence of heavy-precipitation and high-temperature extremes, Nat. Clim. Change, 5, https://doi.org/10.1038/NCLIMATE2617, 2015. a
Folberth, C., Gaiser, T., Abbaspour, K. C., Schulin, R., and Yang, H.: Regionalization of a large-scale crop growth model for sub-Saharan Africa: Model setup, evaluation, and estimation of maize yields, Agr. Ecosyst. Environ., 151, 21–33, https://doi.org/10.1016/j.agee.2012.01.026, 2012. a
Forzieri, G., Bianchi, A., Silva, F., Marin, M., Leblois, A., Lavalle, C., and Feyen, L.: Escalating impacts of climate extremes on critical infrastructures in Europe, Global Environ. Change, 48, 97–107, https://doi.org/10.1016/j.gloenvcha.2017.11.007, 2018. a
Frieler, K., Lange, S., Piontek, F., Reyer, C. P. O., Schewe, J., Warszawski, L., Zhao, F., Chini, L., Denvil, S., Emanuel, K., Geiger, T., Halladay, K., Hurtt, G., Mengel, M., Murakami, D., Ostberg, S., Popp, A., Riva, R., Stevanovic, M., Suzuki, T., Volkholz, J., Burke, E., Ciais, P., Ebi, K., Eddy, T. D., Elliott, J., Galbraith, E., Gosling, S. N., Hattermann, F., Hickler, T., Hinkel, J., Hof, C., Huber, V., Jägermeyr, J., Krysanova, V., Marcé, R., Müller Schmied, H., Mouratiadou, I., Pierson, D., Tittensor, D. P., Vautard, R., van Vliet, M., Biber, M. F., Betts, R. A., Bodirsky, B. L., Deryng, D., Frolking, S., Jones, C. D., Lotze, H. K., Lotze-Campen, H., Sahajpal, R., Thonicke, K., Tian, H., and Yamagata, Y.: Assessing the impacts of 1.5 °C global warming – simulation protocol of the Inter-Sectoral Impact Model Intercomparison Project (ISIMIP2b), Geosci. Model Dev., 10, 4321–4345, https://doi.org/10.5194/gmd-10-4321-2017, 2017. a
Frieler, K., Volkholz, J., Lange, S., Schewe, J., Mengel, M., del Rocío Rivas López, M., Otto, C., Reyer, C. P. O., Karger, D. N., Malle, J. T., Treu, S., Menz, C., Blanchard, J. L., Harrison, C. S., Petrik, C. M., Eddy, T. D., Ortega-Cisneros, K., Novaglio, C., Rousseau, Y., Watson, R. A., Stock, C., Liu, X., Heneghan, R., Tittensor, D., Maury, O., Büchner, M., Vogt, T., Wang, T., Sun, F., Sauer, I. J., Koch, J., Vanderkelen, I., Jägermeyr, J., Müller, C., Rabin, S., Klar, J., Vega del Valle, I. D., Lasslop, G., Chadburn, S., Burke, E., Gallego-Sala, A., Smith, N., Chang, J., Hantson, S., Burton, C., Gädeke, A., Li, F., Gosling, S. N., Müller Schmied, H., Hattermann, F., Wang, J., Yao, F., Hickler, T., Marcé, R., Pierson, D., Thiery, W., Mercado-Bettín, D., Ladwig, R., Ayala-Zamora, A. I., Forrest, M., and Bechtold, M.: Scenario setup and forcing data for impact model evaluation and impact attribution within the third round of the Inter-Sectoral Impact Model Intercomparison Project (ISIMIP3a), Geosci. Model Dev., 17, 1–51, https://doi.org/10.5194/gmd-17-1-2024, 2024. a
Gariano, S. L. and Guzzetti, F.: Landslides in a changing climate, Earth-Sci. Rev., 162, 227–252, https://doi.org/10.1016/j.earscirev.2016.08.011, 2016. a
Gaume, E., Borga, M., Llassat, M. C., Maouche, S., Lang, M., and Diakakis, M.: Mediterranean extreme floods and flash floods , in: The Mediterranean Region under Climate Change. A Scientific Update, Coll. Synthèses, 133–144, IRD Editions, https://hal.science/hal-01465740, 2016. a, b, c
Geerts, E.: Fires Near Tracks and Heat Complaints: Hot Spell Shakes Up European Railways, https://www.railtech.com/infrastructure/2022/07/19/fires-near-tracks-and-heat-complaints-hot-spell-shakes-up-european-railways/?gdpr=accept&gdpr=deny (last access: 4 March 2025), 2022. a, b
González-Alemán, J. J., Pascale, S., Gutierrez-Fernandez, J., Murakami, H., Gaertner, M. A., and Vecchi, G. A.: Potential Increase in Hazard From Mediterranean Hurricane Activity With Global Warming, Geophys. Res. Lett., 46, 1754–1764, https://doi.org/10.1029/2018GL081253, 2019. a, b
Guglielmo, R., Ellena, M., Giuliana, B., Alcaras, E., Parente, C., Carcasi, G., Zarelli, C., Franciosi, A., and Mercogliano, P.: Risk assessment of national railway infrastructure due to sea-level rise: an application of a methodological framework in Italian coastal railways, Environ. Monit. Assess., 196, https://doi.org/10.1007/s10661-024-12942-2, 2024. a
Guimberteau, M., Zhu, D., Maignan, F., Huang, Y., Yue, C., Dantec-Nédélec, S., Ottlé, C., Jornet-Puig, A., Bastos, A., Laurent, P., Goll, D., Bowring, S., Chang, J., Guenet, B., Tifafi, M., Peng, S., Krinner, G., Ducharne, A., Wang, F., Wang, T., Wang, X., Wang, Y., Yin, Z., Lauerwald, R., Joetzjer, E., Qiu, C., Kim, H., and Ciais, P.: ORCHIDEE-MICT (v8.4.1), a land surface model for the high latitudes: model description and validation, Geosci. Model Dev., 11, 121–163, https://doi.org/10.5194/gmd-11-121-2018, 2018. a
Hagemann, S. and Gates, L.: Improving a subgrid runoff parameterization scheme for climate models by the use of high resolution data derived from satellite observations, Clim. Dynam., 21, 349–359, https://doi.org/10.1007/s00382-003-0349-x, 2003. a
Haghighi, E., Kasraei, A., Famurewa, S., Strandberg, G., Sas, G., and Garmabaki, A.: Climate change risks on railway infrastructure: A systematic review and analysis, Sustain. Cities Soc., 129, 106504, https://doi.org/10.1016/j.scs.2025.106504, 2025a. a
Haghighi, E., Kasraei, A., Famurewa, S., Strandberg, G., Sas, G., and Garmabaki, A.: Climate change risks on railway infrastructure: A systematic review and analysis, Sustain. Cities Soc., 129, 106504, https://doi.org/10.1016/j.scs.2025.106504, 2025b. a, b
Hanasaki, N., Yoshikawa, S., Pokhrel, Y., and Kanae, S.: A global hydrological simulation to specify the sources of water used by humans, Hydrol. Earth Syst. Sci., 22, 789–817, https://doi.org/10.5194/hess-22-789-2018, 2018. a
Handwerger, A., Huang, M.-H., Fielding, E., Booth, A., and Burgmann, R.: A shift from drought to extreme rainfall drives a stable landslide to catastrophic failure, Sci. Rep., 9, https://doi.org/10.1038/s41598-018-38300-0, 2019. a
Harrison, A. M., Heaton, M., and Entwisle, D. C.: Increasing road network resilience to the impacts of ground movement due to climate change: a case study from Lincolnshire, UK, Q. J. Eng. Geol. Hydroge., 56, qjegh2023–002, https://doi.org/10.1144/qjegh2023-002, 2023. a
Hausfather, Z.: An assessment of current policy scenarios over the 21st century and the reduced plausibility of high-emissions pathways, Dialogues on Climate Change, 2, https://doi.org/10.1177/29768659241304854, 2025. a
Hausfather, Z. and Betts, R.: Analysis: How “carbon-cycle feedbacks” could make global warming worse, https://www.carbonbrief.org/analysis-how-carbon-cycle-feedbacks-could-make-global-warming-worse/ (last access: 28 August 2025), 2020. a
Huang, F., Mao, D., Jiang, S.-H., Zhou, C., Fan, X., Zeng, Z., Catani, F., Yu, C., Chang, Z., Huang, J., Jiang, B., and Li, Y.: Uncertainties in landslide susceptibility prediction modeling: A review on the incompleteness of landslide inventory and its influence rules, Geosci. Front., 15, 101 886, https://doi.org/10.1016/j.gsf.2024.101886, 2024. a
Iliopoulou, C. and Makridis, M. A.: Critical multi-link disruption identification for public transport networks: A multi-objective optimization framework, Physica A, 626, 129100, https://doi.org/10.1016/j.physa.2023.129100, 2023. a
Infrabel: Infrabel: schade spoor door overstromingen tientallen miljoenen euro's, https://www.spoorpro.nl/spoorbouw/2021/07/19/infrabel-schade-spoor-door-overstromingen-tientallen-miljoenen-euros/ (last access: 2024-08-28), 2021. a
IPCC: Summary for Policymakers, Tech. rep., Intergovernmental Panel on Climate Change (IPCC), https://doi.org/10.1017/9781009157988.001, 2019. a
ITV: Why Can't UK Roads and Rail Cope with the Heat?, https://www.itv.com/news/anglia/2022-07-19/why-cant-uk-roads-and-rail-cope-with-the-heat (last access: 4 March 2025), 2022. a
Jacobs, L., Maes, J., Mertens, K., Sekajugo, J., Thiery, W., Lipzig, N., Poesen, J., Kervyn, M., and Dewitte, O.: Reconstruction of a flash flood event through a multi-hazard approach: focus on the Rwenzori Mountains, Uganda, Nat. Hazards, 84, https://doi.org/10.1007/s11069-016-2458-y, 2016. a
Jacobs, L., Dewitte, O., Poesen, J., Sekajugo, J., Nobile, A., Rossi, M., Thiery, W., and Kervyn, M.: Field-based landslide susceptibility assessment in a data-scarce environment: the populated areas of the Rwenzori Mountains, Nat. Hazards Earth Syst. Sci., 18, 105–124, https://doi.org/10.5194/nhess-18-105-2018, 2018. a
Jemec Auflič, M., Bezak, N., Šegina, E., Frantar, P., Gariano, S. L., Medved, A., and Peternel, T.: Climate change increases the number of landslides at the juncture of the Alpine, Pannonian and Mediterranean regions, Sci. Rep., 13, https://doi.org/10.1038/s41598-023-50314-x, 2023. a
Jonkeren, O., Jourquin, B., and Rietveld, P.: Modal-split effects of climate change: The effect of low water levels on the competitive position of inland waterway transport in the river Rhine area, Transport. Res. A-Pol., 45, 1007–1019, https://doi.org/10.1016/j.tra.2009.01.004, 2011. a
Joughin, I., Abdalati, W., and Fahnestock, M.: Large fluctuations in speed on Greenland's Jakobshavn Isbræ glacier, Nature, 432, 608–610, https://doi.org/10.1038/nature03130, 2004. a
Journée, M., Goudenhoofdt, E., Vannitsem, S., and Delobbe, L.: Quantitative rainfall analysis of the 2021 mid-July flood event in Belgium, Hydrol. Earth Syst. Sci., 27, 3169–3189, https://doi.org/10.5194/hess-27-3169-2023, 2023. a, b
Karakatsani, E.: Greece economy briefing: The Economic Impact of the Recent Devastating Floods in Greece, China-CEE Institute, 65, https://china-cee.eu/wp-content/uploads/2023/10/2023e09_Greece.pdf (last access: 21 June 2025), 2023. a, b
Kasraei, A., Garmabaki, A., Odelius, J., Famurewa, S. M., Chamkhorami, K. S., and Strandberg, G.: Climate change impacts assessment on railway infrastructure in urban environments, Sustain. Cities Soc., 101, 105084, https://doi.org/10.1016/j.scs.2023.105084, 2024. a
Keep Talking Greece: Heavy rainstorm floods Crete, forces Heraklio airport to shut down, https://www.keeptalkinggreece.com/2020/10/21/crete-floods-airport-heraklio/ (last access: 4 March 2025), 2020. a
Kettle, A. J.: Storm Xaver over Europe in December 2013: Overview of energy impacts and North Sea events, Adv. Geosci., 54, 137–147, https://doi.org/10.5194/adgeo-54-137-2020, 2020. a
Khodayar, S., Kushta, J., Catto, J. L., Dafis, S., Davolio, S., Ferrarin, C., Flaounas, E., Groenemeijer, P., Hatzaki, M., Hochman, A., Kotroni, V., Landa, J., Láng-Ritter, I., Lazoglou, G., Liberato, M. L. R., Miglietta, M. M., Papagiannaki, K., Patlakas, P., Stojanov, R., and Zittis, G.: Mediterranean Cyclones in a Changing Climate: A Review on Their Socio-Economic Impacts, Rev. Geophys., 63, e2024RG000853, https://doi.org/10.1029/2024RG000853, 2025. a
Koks, E., Rozenberg, J., Zorn, C., Tariverdi, M., Vousdoukas, M., Fraser, S., Hall, J., and Hallegatte, S.: A global multi-hazard risk analysis of road and railway infrastructure assets, Nat. Commun., 10, https://doi.org/10.1038/s41467-019-10442-3, 2019. a, b
Koks, E. E., van Ginkel, K. C. H., van Marle, M. J. E., and Lemnitzer, A.: Brief communication: Critical infrastructure impacts of the 2021 mid-July western European flood event, Nat. Hazards Earth Syst. Sci., 22, 3831–3838, https://doi.org/10.5194/nhess-22-3831-2022, 2022. a, b, c, d, e, f, g, h
Kreienkamp, F., Philip, S. Y., Tradowsky, J. S., et al.: Rapid Attribution of Heavy Rainfall Events Leading to the Severe Flooding in Western Europe during July 2021, World Weather Attribution, https://www.worldweatherattribution.org/wp-content/uploads/Scientific-report-Western-Europe-floods-2021-attribution.pdf (last access: 4 March 2025), 2021. a, b
Kundzewicz, Kanae, Seneviratne, S., Handmer, Nicholls, N., Peduzzi, P., Mechler, R., Bouwer, L., Arnell, Mach, Muir-Wood, R., Brakenridge, R., Kron, W., Benito, G., Honda, Takahashi, and Sherstyukov, B.: Flood risk and climate change – Global and regional perspectives, Hydrolog. Sci. J., 59, https://doi.org/10.1080/02626667.2013.857411, 2014. a, b
Lange, S.: Bias correction of surface downwelling longwave and shortwave radiation for the EWEMBI dataset, Earth Syst. Dynam., 9, 627–645, https://doi.org/10.5194/esd-9-627-2018, 2018. a
Lange, S., Volkholz, J., Geiger, T., Zhao, F., Vega, I., Veldkamp, T., Reyer, C. P., Warszawski, L., Huber, V., Jägermeyr, J., Schewe, J., Bresch, D. N., Büchner, M., Chang, J., Ciais, P., Dury, M., Emanuel, K., Folberth, C., Gerten, D., Gosling, S. N., Grillakis, M., Hanasaki, N., Henrot, A. J., Hickler, T., Honda, Y., Ito, A., Khabarov, N., Koutroulis, A., Liu, W., Müller, C., Nishina, K., Ostberg, S., Müller Schmied, H., Seneviratne, S. I., Stacke, T., Steinkamp, J., Thiery, W., Wada, Y., Willner, S., Yang, H., Yoshikawa, M., Yue, C., and Frieler, K.: Projecting Exposure to Extreme Climate Impact Events Across Six Event Categories and Three Spatial Scales, Earth's Future, 8, https://doi.org/10.1029/2020EF001616, 2020. a, b, c, d, e, f
Laudani, A.: Incendio aeroporto Catania: costa 40 milioni al dì. Dubbi sulla manutenzione, https://focusicilia.it/incendio-aeroporto-catania-costa-40-milioni-al-di-dubbi-sulla-manutenzione/ (last access: 2024-08-28), 2023. a
Lawrence, D. M., Oleson, K. W., Flanner, M. G., Thornton, P. E., Swenson, S. C., Lawrence, P. J., Zeng, X., Yang, Z.-L., Levis, S., Sakaguchi, K., Bonan, G. B., and Slater, A. G.: Parameterization improvements and functional and structural advances in Version 4 of the Community Land Model, J. Adv. Model. Earth Sy., 3, https://doi.org/10.1029/2011MS00045, 2011. a
Lenderink, G., de Vries, H., van Meijgaard, E., de Rooy, W., van Ulft, L., Thompson, V., Qiu, X., and Fowler, H. J.: A pseudo global warming based system to study how climate change affects high impact rainfall events, Weather and Climate Extremes, 49, 100781, https://doi.org/10.1016/j.wace.2025.100781, 2025. a
Leviäkangas, P., Tuominen, A., Molarius, R., Schabel, J., Toivonen, S., Keränen, J., Törnqvist, J., Makkonen, L., Vajda, A., Tuomenvirta, H., Juga, I., Nurmi, P., Rauhala, J., Rehm, F., Mühlhausen, T., Gerz, T., Schweighofer, J., Michaelides, S., Papadakis, M., and Ludvigsen, J.: Review on Extreme Weather Impacts on Transport Systems, VTT Technical Research Centre of Finland, technical report, 2014. a
Li, S., Chen, Y., Wei, W., Fang, G., and Duan, W.: The increase in extreme precipitation and its proportion over global land, J. Hydrol., 628, 130456, https://doi.org/10.1016/j.jhydrol.2023.130456, 2024. a
Liu, W., Yang, H., Folberth, C., Wang, X., Luo, Q., and Schulin, R.: Global investigation of impacts of PET methods on simulating crop-water relations for maize, Agr. Forest Meteorol., 221, 164–175, https://doi.org/10.1016/j.agrformet.2016.02.017, 2016. a
Llasat, M.: Floods evolution in the Mediterranean region in a context of climate and environmental change, Cuadernos de Investigación Geográfica, 47, https://doi.org/10.18172/cig.4897, 2021. a, b
Lloyd's List: Port of Valencia Reopens After Devastating Floods, https://www.lloydslist.com/LL1151259/Port-of-Valencia-reopens-after-devastating-floods (last access: 4 March 2025), 2024. a
Lorenz, R., Stalhandske, Z., and Fischer, E. M.: Detection of a Climate Change Signal in Extreme Heat, Heat Stress, and Cold in Europe From Observations, Geophys. Res. Lett., 46, 8363–8374, https://doi.org/10.1029/2019GL082062, 2019. a
Ma, B., Liu, X., Tong, Z., Zhang, J., and Wang, X.: Coupled Effects of High Temperatures and Droughts on Forest Fires in Northeast China, Remote Sens., 16, https://doi.org/10.3390/rs16203784, 2024. a
Marechal, A.: By altering rainfall patterns, climate change has an impact on the risk of landslides, Polytechnique Insights, https://www.polytechnique-insights.com/en/columns/planet/by-altering-rainfall-patterns-climate-change-has-an-impact-on-the-risk-of-landslides/ (last access: 10 March 2024), 2024. a
Maritime Executive: A Week After Devastating Floods, Spain's Valencia Port is Restoring Service, https://maritime-executive.com/article/a-week-after-devastating-floods-spain-s-valencia-port-is-restoring-service (last access: 4 March 2025), 2024. a
Marra, F., Koukoula, M., Canale, A., and Peleg, N.: Predicting extreme sub-hourly precipitation intensification based on temperature shifts, Hydrol. Earth Syst. Sci., 28, 375–389, https://doi.org/10.5194/hess-28-375-2024, 2024. a, b
Mcloughlin, B.: Milan flood chaos: Airport underwater as dozens evacuated after horror storms ravage Italy, https://www.express.co.uk/news/world/1492452/Milan-floods-Malpensa-Airport-evacuated-storms-flooding-video-pictures-Italy-emergency (last access: 4 March 2025), 2021. a
Messori, G., Muheki, D., Batibeniz, F., Bevacqua, E., Suarez-Gutierrez, L., and Thiery, W.: Global Mapping of Concurrent Hazards and Impacts Associated With Climate Extremes Under Climate Change, Earth's Future, 13, e2025EF006325, https://doi.org/10.1029/2025EF006325, 2025. a, b
Moreira, F., Ascoli, D., Safford, H., Adams, M., Moreno, J., Pereira, J., Catry, F., Armesto, J., Bond, W., González, M., Curt, T., Koutsias, N., Mccaw, L., Price, O., Pausas, J., Rigolot, E., Stephens, S., Tavşanoǧlu, Ã., Vallejo, V., and Fernandes, P.: Wildfire management in Mediterranean-type regions: paradigm change needed, Environ. Res. Lett., 15, 011001, https://doi.org/10.1088/1748-9326/ab541e, 2020. a
Muheki, D., Deijns, A. A. J., Bevacqua, E., Messori, G., Zscheischler, J., and Thiery, W.: The perfect storm? Co-occurring climate extremes in East Africa, Earth Syst. Dynam., 15, 429–466, https://doi.org/10.5194/esd-15-429-2024, 2024. a, b
Müller Schmied, H., Eisner, S., Franz, D., Wattenbach, M., Portmann, F. T., Flörke, M., and Döll, P.: Sensitivity of simulated global-scale freshwater fluxes and storages to input data, hydrological model structure, human water use and calibration, Hydrol. Earth Syst. Sci., 18, 3511–3538, https://doi.org/10.5194/hess-18-3511-2014, 2014. a
Müller Schmied, H., Adam, L., Eisner, S., Fink, G., Flörke, M., Kim, H., Oki, T., Portmann, F. T., Reinecke, R., Riedel, C., Song, Q., Zhang, J., and Döll, P.: Variations of global and continental water balance components as impacted by climate forcing uncertainty and human water use, Hydrol. Earth Syst. Sci., 20, 2877–2898, https://doi.org/10.5194/hess-20-2877-2016, 2016. a
Mühr, B., Kubisch, S., Marx, A., Stötzer, J., Wisotzky, C., Latt, C., Siegmann, F., Glattfelder, M., Mohr, S., and Kunz, M.: CEDIM Forensic Disaster Analysis Group (FDA) – Dürre & Hitzewelle Sommer 2018 (Deutschland) – 18 August 2018 – Report No. 1, https://www.cedim.kit.edu/download/FDA_Duerre_Hitzewelle_Deutschland_report.pdf (last access: 28 August 2024), 2018. a, b, c, d, e, f, g, h, i
Nemry, F. and Demirel, H.: Impacts of climate change on transport – A focus on road and rail transport infrastructures, Publications Office of the European Union, https://doi.org/10.2791/15504, 2012. a
Nezval, V., Andrášik, R., and Bíl, M.: Vegetation fires along the Czech rail network, Fire Ecology, https://doi.org/10.1186/s42408-022-00141-8, 2022. a, b, c
Nissen, K., Leckebusch, G., Pinto, J., and Ulbrich, U.: Mediterranean cyclones and windstorms in a changing climate, Reg. Environ. Change, 14, https://doi.org/10.1007/s10113-012-0400-8, 2013. a
Noëth, B.: Ajaccio Airport Closed for the Weekend as Runway Gets Flooded, https://www.aviation24.be/airports/ajaccio-airport-aja/closed-for-the-weekend-as-runway-gets-flooded/ (last access: 4 March 2025), 2019. a
Noëth, B.: Heraklion Airport (Greece) closed due to torrential rain and flooding on the island; at least 25 flights divert, https://www.aviation24.be/airlines/closed-due-to-heavy-rainfalls-on-the-island-at-least-25-flights-divert/ (last access: 4 March 2025), 2022. a, b
NTPR: Flood Impact on Inland Waterway Transport (IWT), https://www.ntpr.nl/news/news/2021/07/21/Flood-Impact-IWT.html (last access: 4 March 2025), 2021. a
OECD: Infrastructure for a Climate-Resilient Future, OECD Publishing, Paris, https://doi.org/10.1787/a74a45b0-en, 2024. a
Palin, E. J., Stipanovic Oslakovic, I., Gavin, K., and Quinn, A.: Implications of climate change for railway infrastructure, WIREs Climate Change, 12, e728, https://doi.org/10.1002/wcc.728, 2021. a, b, c
Pandey, P., Huidobro, G., Lopes, L., Ganteaume, A., Ascoli, D., Colaço, M. C., Xanthopoulos, G., Giannaropoulos, T., Gazzard, R., Boustras, G., Steelman, T., Charlton, V., Ferguson, E., Kirschner, J., Little, K., Stoof, C., Nikolakis, W., Rodríguez Fernández-Blanco, C., Ribotta, C., and Dossi, S.: A global outlook on increasing wildfire risk: Current policy situation and future pathways, Trees, Forests and People, 14, 100431, https://doi.org/10.1016/j.tfp.2023.100431, 2023. a
Peleg, N., Koukoula, M., and Marra, F.: A 2 °C warming can double the frequency of extreme summer downpours in the Alps, npj Climate and Atmospheric Science, 8, https://doi.org/10.1038/s41612-025-01081-1, 2025. a
Pelz, S., Ganti, G., Lamboll, R., Grant, L., Smith, C., Pachauri, S., Rogelj, J., Riahi, K., Thiery, W., and Gidden, M. J.: Using net-zero carbon debt to track climate overshoot responsibility, P. Natl. Acad. Sci. USA, 122, e2409316122, https://doi.org/10.1073/pnas.2409316122, 2025. a
Pietroiusti, R., Vanderkelen, I., Otto, F. E. L., Barnes, C., Temple, L., Akurut, M., Bally, P., van Lipzig, N. P. M., and Thiery, W.: Possible role of anthropogenic climate change in the record-breaking 2020 Lake Victoria levels and floods, Earth Syst. Dynam., 15, 225–264, https://doi.org/10.5194/esd-15-225-2024, 2024. a
Pleasance: Spain Fires: Moment Passengers Terrorized as Train Surrounded by Wildfires, https://www.dailymail.co.uk/news/article-11023807/Spain-fires-Moment-passengers-terror-train-surrounded-wildfires.html (last access: 4 March 2025), 2022. a
Pohle, I., Zeilfelder, S., Birner, J., and Creutzfeldt, B.: The 2018–2023 drought in Berlin: impacts and analysis of the perspective of water resources management, Nat. Hazards Earth Syst. Sci., 25, 1293–1313, https://doi.org/10.5194/nhess-25-1293-2025, 2025. a
Portillo Juan, N., Negro Valdecantos, V., and del Campo, J. M.: Review of the Impacts of Climate Change on Ports and Harbours and Their Adaptation in Spain, Sustainability, 14, https://doi.org/10.3390/su14127507, 2022. a
Delahaye J.: Breaking: Jet2 cancels all holidays and flights to Skiathos amid severe flooding in Greece, https://www.mirror.co.uk/travel/news/breaking-jet2-cancels-holidays-flights-30879303 (last access: 7 July 2026), 2023.
PreventionWeb: Greece's record rainfall and flash floods are part of a trend across the Mediterranean with weather becoming more extreme, PreventionWeb, https://www.preventionweb.net/news/greeces-record-rainfall-and-flash-floods-are-part-trend-across-mediterranean-weather-becoming (last access: 10 March 2024), 2023. a, b
ProRail: Hoe is het met het spoor in Limburg?, ProRail, https://www.prorail.nl/nieuws/hoe-is-het-met-het-spoor-in-limburg (last access: 3 October 2025), 2021. a
Quintana, J. R., Martín-Sanz, J. P., Valverde-Asenjo, I., and Molina, J. A.: Drought differently destabilizes soil structure in a chronosequence of abandoned agricultural lands, CATENA, 222, 106871, https://doi.org/10.1016/j.catena.2022.106871, 2023. a, b
Rahman, M. U. and Kim, A. M.: Recovery times for highway disruptions due to natural hazard events, Transport. Res. D-Tr. E., 139, 104537, https://doi.org/10.1016/j.trd.2024.104537, 2025. a
Railway Technology: Sea change: protecting coastal railways from rising sea levels, Railway Technology, https://www.railway-technology.com/features/sea-level-impact-on-railways/?cf-view (last access: 2024-03-10), 2024. a
Reale, M., Cabos Narvaez, W. D., Cavicchia, L., Conte, D., Coppola, E., Flaounas, E., Giorgi, F., Gualdi, S., Hochman, A., Li, L., Lionello, P., Podrascanin, Z., Salon, S., Sanchez-Gomez, E., Scoccimarro, E., Sein, D., and Somot, S.: Future projections of Mediterranean cyclone characteristics using the Med-CORDEX ensemble of coupled regional climate system models, Clim. Dynam., 58, https://doi.org/10.1007/s00382-021-06018-x, 2022. a, b, c
Rebally, A., Valeo, C., He, J., and Saidi, S.: Flood Impact Assessments on Transportation Networks: A Review of Methods and Associated Temporal and Spatial Scales, Frontiers in Sustainable Cities, 3, https://doi.org/10.3389/frsc.2021.732181, 2021. a
Redazione, L.: Incendi in Sicilia: ecco cosa accade, La Redazione, https://www.laredazione.net/incendi-in-sicilia-ecco-cosa-accade/ (last access: 10 March 2024), 2023. a
Reuters: Heavy Rains Trigger Floods in Portugal's Capital, One Dead, https://www.reuters.com/world/europe/heavy-rains-trigger-floods-portugals-capital-one-dead-2022-12-08/ (last access: 4 March 2025), 2025. a
Ridder, N., Ukkola, A., Pitman, A., and Perkins-Kirkpatrick, S.: Increased occurrence of high impact compound events under climate change, npj Climate and Atmospheric Science, 5, https://doi.org/10.1038/s41612-021-00224-4, 2022. a
Rimi, A.: Overheating passengers abandon train stuck in tunnel and walk to platform along tracks, https://www.independent.co.uk/travel/news-and-advice/train-passengers-stuck-walk-tracks-heatwave-b2127185.html (last access: 30 October 2024), 2022. a, b
Rogelj, J., Fransen, T., den Elzen, M. G. J., Lamboll, R. D., Schumer, C., Kuramochi, T., Hans, F., Mooldijk, S., and Portugal-Pereira, J.: Credibility gap in net-zero climate targets leaves world at high risk, Science, 380, 1014–1016, https://doi.org/10.1126/science.adg6248, 2023. a
Rossi, L., Wens, M., Moel, H., Cotti, D., Siemons, A.-S., Toreti, A., Maetens, W., Masante, D., Loon, A., Hagenlocher, M., Rudari, R., Meroni, M., Avanzi, F., Isabellon, M., Naumann, G., and Barbosa, P.: European Drought Risk Atlas, Publications Office of the European Union, technical report, https://doi.org/10.2760/608737, 2023. a, b, c, d, e, f, g, h, i
Rosvold, E. L. and Buhaug, H.: GDIS, a global dataset of geocoded disaster locations, Sci. Data, 8, https://doi.org/10.1038/s41597-021-00846-6, 2021. a, b
Rovithakis, A., Burke, E., Burton, C., Kasoar, M., Grillakis, M. G., Seiradakis, K. D., and Voulgarakis, A.: Estimating future wildfire burnt area over Greece using the JULES-INFERNO model, Nat. Hazards Earth Syst. Sci., 25, 3185–3200, https://doi.org/10.5194/nhess-25-3185-2025, 2025. a
Rozendaal, J.: Treinverbinding Nessonvaux-Pepinster heropend na schade door overstromingen, RailTech, https://www.railtech.be/nl/infrastructuur/2021/09/13/volgende-waalse-lijn-heropend-nog-twee-te-gaan/ (last access: 13 June 2024), 2021. a
Russo, S., Sillmann, J., and Fischer, E. M.: Top ten European heatwaves since 1950 and their occurrence in the coming decades, Environ. Res. Lett., 10, 124003, https://doi.org/10.1088/1748-9326/10/12/124003, 2015. a
Russo, S., Sillmann, J., and Sterl, A.: Humid heat waves at different warming levels, Sci. Rep., 7, https://doi.org/10.1038/s41598-017-07536-7, 2017. a
SAFARI Ports: Facing the Storm: The Threat of Extreme Weather to European Ports, https://www.safariports.eu/journal-post/facing-the-storm-the-threat-of-extreme-weather-to-european-ports (last access: 4 March 2025), 2023. a
Sami, I. and Keith, L.: How do streetcar transit users and streetcar decision-makers perceive heat risk?, J. Public Transport., 25, 100045, https://doi.org/10.1016/j.jpubtr.2023.100045, 2023. a
Sánchez, M., Wang, D., Briaud, J.-L., and Douglas, C.: Typical geomechanical problems associated with railroads on shrink-swell soils, Transportation Geotechnics, 1, https://doi.org/10.1016/j.trgeo.2014.07.002, 2014. a
Schaphoff, S., Forkel, M., Müller, C., Knauer, J., von Bloh, W., Gerten, D., Jägermeyr, J., Lucht, W., Rammig, A., Thonicke, K., and Waha, K.: LPJmL4 – a dynamic global vegetation model with managed land – Part 2: Model evaluation, Geosci. Model Dev., 11, 1377–1403, https://doi.org/10.5194/gmd-11-1377-2018, 2018. a
Schlögl, M. and Matulla, C.: Potential future exposure of European land transport infrastructure to rainfall-induced landslides throughout the 21st century, Nat. Hazards Earth Syst. Sci., 18, 1121–1132, https://doi.org/10.5194/nhess-18-1121-2018, 2018. a
Schweighofer, J.: The impact of extreme weather and climate change on inland waterway transport, Nat. Hazards, 72, https://doi.org/10.1007/s11069-012-0541-6, 2014. a, b, c
Seneviratne, S., Nicholls, N., Easterling, D., Goodess, C., Kanae, S., Kossin, J., Luo, Y., Marengo, J., Mcinnes, K., Rahimi, M., Reichstein, M., Sorteberg, A., Vera, C., and Zhang, X.: Changes in climate extremes and their impacts on the natural physical environment, Cambridge University Press, Cambridge, UK, and New York, NY, USA, pp. 109–230, 2012. a
Seneviratne, S., Donat, M., Pitman, A., Knutti, R., and Wilby, R.: Allowable CO2 emissions based on regional and impact-related climate targets, Nature, 529, https://doi.org/10.1038/nature16542, 2016. a
Seneviratne, S., Zhang, X., Adnan, M., Badi, W., Dereczynski, C., Di Luca, A., Ghosh, S., Iskandar, I., Kossin, J., Lewis, S., Otto, F., Pinto, I., Satoh, M., Vicente-Serrano, S., Wehner, M., and Zhou, B.: Weather and Climate Extreme Events in a Changing Climate, in: Climate Change 2021: The Physical Science Basis. Contribution of Working Group I to the Sixth Assessment Report of the Intergovernmental Panel on Climate Change, edited by: Masson-Delmotte, V., Zhai, P., Pirani, A., Connors, S., Péan, C., Berger, S., Caud, N., Chen, Y., Goldfarb, L., Gomis, M., Huang, M., Leitzell, K., Lonnoy, E., Matthews, J., Maycock, T., Waterfield, T., Yelekçi, O., Yu, R., and Zhou, B., Cambridge University Press, Cambridge, United Kingdom and New York, NY, USA, 1513–1766, https://doi.org/10.1017/9781009157896.013, 2021. a
Severino, L. G., Kropf, C. M., Afargan-Gerstman, H., Fairless, C., de Vries, A. J., Domeisen, D. I. V., and Bresch, D. N.: Projections and uncertainties of winter windstorm damage in Europe in a changing climate, Nat. Hazards Earth Syst. Sci., 24, 1555–1578, https://doi.org/10.5194/nhess-24-1555-2024, 2024. a
Shafizadeh-Moghadam, H., Minaei, M., Shahabi, H., and Hagenauer, J.: Big Data in Geohazard; Pattern Mining and Large Scale Analysis of Landslides in Iran, Earth Sci. Inform., 12, https://doi.org/10.1007/s12145-018-0354-6, 2019. a
Sharma, S.: One dead and hundreds of flights cancelled at Schiphol airport as freak summer storm batters Netherlands, https://www.independent.co.uk/news/world/europe/storm-poly-schiphol-airport-netherlands-b2369712.html (last access: 4 March 2025), 2023. a, b
Skoulding, L.: Where are the Italy wildfires as temperatures rise to 47.6C on Sicliy?, https://www.independent.co.uk/climate-change/sicily-fires-weather-temperatures-italy-b2381940.html (last access: 28 August 2024), 2023. a, b, c, d, e
Slavicek, M.: How the Heat Wave is Damaging Rail Infrastructure and Forcing Trains to Run at Low Speed, https://www.lemonde.fr/en/economy/article/2022/07/25/how-the-heat-wave-is-damaging-rail-infrastructure-and-forcing-trains-to-run-at-low-speed_5991396_19.html (last access: 4 March 2025), 2022. a
Smith, B., Wårlind, D., Arneth, A., Hickler, T., Leadley, P., Siltberg, J., and Zaehle, S.: Implications of incorporating N cycling and N limitations on primary production in an individual-based dynamic vegetation model, Biogeosciences, 11, 2027–2054, https://doi.org/10.5194/bg-11-2027-2014, 2014. a
Spiegel: The Never-Ending Summer: Is Germany's Heat Wave a Preview of the Future?, https://www.spiegel.de/international/germany/the-never-ending-summer-is-germany-s-heat-wave-a-preview-of-the-future-a-1221557.html (last access: 4 March 2025), 2019. a
Stacke, T. and Hagemann, S.: Development and evaluation of a global dynamical wetlands extent scheme, Hydrol. Earth Syst. Sci., 16, 2915–2933, https://doi.org/10.5194/hess-16-2915-2012, 2012. a
Staib, J.: Ein kolossales, apokalyptisches ausmaß, https://www.faz.net/aktuell/politik/inland/hochwasser-in-rheinland-pfalz-roger-lewentz-zieht-erste-bilanz-17449104.html (last access: 2024-08-28), 2021. a
Streng, M., van Saase, N., and Kuipers, B.: Economische impact laagwater, UPT Erasmus Centre for Urban, Port, and Transport Economics, https://www.eur.nl/en/upt/media/87562 (last access: 7 July 2026), 2020. a, b, c
Sullivan, A.: Can German roads hold up against the heat?, https://www.dw.com/en/can-germanys-supposedly-crumbling-infrastructure-hold-up-against-extreme-heat/a-44854931 (last access: 4 March 2025), 2018. a, b
Sullivan, H. and Tondo, L.: “˜Like a blowtorch”: Mediterranean on fire as blazes spread across nine countries, https://www.theguardian.com/environment/2023/jul/26/northern-hemisphere-heatwaves-mediterranean-fires-croatia-portugal (last access: 28 August 2024), 2023. a
Tabari, H.: Climate change impact on flood and extreme precipitation increases with water availability, Sci. Rep., 10, 13768, https://doi.org/10.1038/s41598-020-70816-2, 2020. a
Task Force Fact Finding hoogwater: Hoogwater 2021: Feiten en Duiding, Expertise Netwerk Waterveiligheid, Expertise Netwerk Waterveiligheid, https://doi.org/10.4233/uuid:06b03772-ebe0-4949-9c4d-7c1593fb094e, 2021. a
TEN-T: Trans-European Transport Network (TEN-T), https://transport.ec.europa.eu/transport-themes/infrastructure-and-investment/trans-european-transport-network-ten-t_en (last access: 3 October 2024), 2024. a
The Vibes: Valencia Airport Briefly Shut as Lightning Hits Runway, https://www.thevibes.com/articles/world/77144/valencia-airport-briefly-shut-as-lightning-hits-runway (last access: 4 March 2025), 2022. a
Thiery, W., Davin, E. L., Lawrence, D. M., Hirsch, A. L., Hauser, M., and Seneviratne, S. I.: Present-day irrigation mitigates heat extremes, J. Geophys. Res.-Atmos., 122, 1403–1422, https://doi.org/10.1002/2016JD025740, 2017. a
Thiery, W., Visser, A. J., Fischer, E. M., Hauser, M., Hirsch, A. L., Lawrence, D. M., Lejeune, Q., Davin, E. L., and Seneviratne, S. I.: Warming of hot extremes alleviated by expanding irrigation, Nat. Commun., 11, https://doi.org/10.1038/s41467-019-14075-4, 2020. a
Thiery, W., Lange, S., Rogelj, J., Schleussner, C. F., Gudmundsson, L., Seneviratne, S. I., Andrijevic, M., Frieler, K., Emanuel, K., Geiger, T., Bresch, D. N., Zhao, F., Willner, S. N., Büchner, M., Volkholz, J., Bauer, N., Chang, J., Ciais, P., Dury, M., François, L., Grillakis, M., Gosling, S. N., Hanasaki, N., Hickler, T., Huber, V., Ito, A., Jägermeyr, J., Khabarov, N., Koutroulis, A., Liu, W., Lutz, W., Mengel, M., Müller, C., Ostberg, S., Reyer, C. P., Stacke, T., and Wada, Y.: Intergenerational inequities in exposure to climate extremes, Inter. Inequities Exp. Clim. Extrem., 374, https://doi.org/10.1126/science.abi7339, 2021a. a, b, c
Thiery, W., Lange, S., Rogelj, J., et al.: Age-dependent extreme event exposure – data accompanying journal publication, in: Science: Vol. in press (1.0), Zenodo [data set], https://doi.org/10.5281/zenodo.5497633, 2021b. a
Tichavský, R., Ballesteros-Canovas, J., Šilhán, K., and Tolasz, R.: Dry Spells and Extreme Precipitation are The Main Trigger of Landslides in Central Europe, Sci. Rep., 9, https://doi.org/10.1038/s41598-019-51148-2, 2019. a
Tradowsky, J. S., Philip, S. Y., Kreienkamp, F., Kew, S. F., Lorenz, P., Arrighi, J., Bettmann, T., Caluwaerts, S., Chan, S. C., Cruz, L. D., de Vries, H., Demuth, N., Ferrone, A., Fischer, E. M., Fowler, H. J., Goergen, K., Heinrich, D., Henrichs, Y., Kaspar, F., Lenderink, G., Nilson, E., Otto, F. E., Ragone, F., Seneviratne, S. I., Singh, R. K., Skålevåg, A., Termonia, P., Thalheimer, L., van Aalst, M., den Bergh, J. V., de Vyver, H. V., Vannitsem, S., van Oldenborgh, G. J., Schaeybroeck, B. V., Vautard, R., Vonk, D., and Wanders, N.: Attribution of the heavy rainfall events leading to severe flooding in Western Europe during July 2021, Clim. Change, 176, https://doi.org/10.1007/s10584-023-03502-7, 2023. a, b, c, d
van Ginkel, K. C. H., Dottori, F., Alfieri, L., Feyen, L., and Koks, E. E.: Flood risk assessment of the European road network, Nat. Hazards Earth Syst. Sci., 21, 1011–1027, https://doi.org/10.5194/nhess-21-1011-2021, 2021. a
Verschuur, J., Koks, E., and Hall, J.: Port disruptions due to natural disasters: Insights into port and logistics resilience, Transport. Res. D-Tr. E., 85, 102393, https://doi.org/10.1016/j.trd.2020.102393, 2020. a, b
Verschuur, J., Koks, E. E., Li, S., and Hall, J. W.: Multi-hazard risk to global port infrastructure and resulting trade and logistics losses, Commun. Earth Environ., 4, https://doi.org/10.1038/s43247-022-00656-7, 2023. a, b, c, d, e, f, g, h
Vidas, M.: Port of Manzanillo: Climate Risk Management, Inter-American Development Bank (IDB), https://doi.org/10.18235/0012813, 2015. a
Vinke, F., Turpijn, B., Gelder, P., and Koningsveld, M.: Inland shipping response to discharge extremes– A 10-years case study of the Rhine, Climate Risk Management, 43, 100578, https://doi.org/10.1016/j.crm.2023.100578, 2024. a
Vivo, C. D., Ellena, M., Barbato, G., Pugliese, A., Marinucci, F., Barilli, T., and Mercogliano, P.: A co-design matrix-based approach to evaluate the climate risks for airports: A case study of Bologna airport, Climate Services, 37, 100536, https://doi.org/10.1016/j.cliser.2024.100536, 2025. a
Voskaki, A., Budd, T., and Mason, K.: The impact of climate hazards to airport systems: a synthesis of the implications and risk mitigation trends, Transport Rev., 43, 652–675, https://doi.org/10.1080/01441647.2022.2163319, 2023. a
Vousdoukas, M. I., Voukouvalas, E., Mentaschi, L., Dottori, F., Giardino, A., Bouziotas, D., Bianchi, A., Salamon, P., and Feyen, L.: Developments in large-scale coastal flood hazard mapping, Nat. Hazards Earth Syst. Sci., 16, 1841–1853, https://doi.org/10.5194/nhess-16-1841-2016, 2016. a, b, c
Vousdoukas, M. I., Mentaschi, L., Voukouvalas, E., Verlaan, M., and Feyen, L.: Extreme sea levels on the rise along Europe's coasts, Earth's Future, 5, 304–323, https://doi.org/10.1002/2016EF000505, 2017. a, b
VUB-HYDR: 2025_Deidda_etal_NHESS, GitHub [code], https://github.com/VUB-HYDR/2025_Deidda_etal_NHESS (last access: 26 June 2025), 2025. a
Wada, Y., Wisser, D., and Bierkens, M. F. P.: Global modeling of withdrawal, allocation and consumptive use of surface water and groundwater resources, Earth Syst. Dynam., 5, 15–40, https://doi.org/10.5194/esd-5-15-2014, 2014. a
Wada, Y., de Graaf, I. E. M., and van Beek, L. P. H.: High-resolution modeling of human and climate impacts on global water resources, J. Adv. Model. Earth Sy., 8, 735–763, https://doi.org/10.1002/2015MS000618, 2016. a
Wang, D., Sánchez, M., and Briaud, J.-L.: Behavior of railroads on shrink-swell soils, E3S Web of Conferences, 9, 20007, https://doi.org/10.1051/e3sconf/20160920007, 2016. a
Wehmann, J.: A1, A61, A553 nach Flut: Engpässe zwischen Hürth und Dreieck Erfttal, 24rhein, https://www.24rhein.de/leben-im-westen/verkehr/freigabe-a1-a61-a553-sperrung-kreuz-kerpen-frei-bauarbeiten-planung-90985671.html (last access: 13 June 2024), 2022. a
Xie, C., Bao, Z., and Chen, A.: Disrupted transportation networks under different information availability and stochasticity situations, Transport. Res. C-Emer., 150, 104097, https://doi.org/10.1016/j.trc.2023.104097, 2023. a
Yao, Y., Thiery, W., and Sterl, S.: Winter is leaving: Reduced occurrence of extremely cold days in Belgium and implications for power system planning, Vrije Universiteit Brussel, https://researchportal.vub.be/en/publications/winter-is-leaving-reduced-occurrence-of-extremely-cold-days-in-be (last access: 26 June 2025), 2020. a
Zachariah, M., Philip, S., Pinto, I., Vahlberg, M., Singh, R., Otto, F., Barnes, C., and Kimutai, J.: Extreme heat in North America, Europe and China in July 2023 made much more likely by climate change, World Weather Attribution, https://www.worldweatherattribution.org/extreme-heat-in-north-america-europe-and-china-in-july-2023-made-much-more-likely-by-climate-change/ (last access: 10 March 2024), 2023. a, b, c
Zare, A. and Miller-Hooks, E.: A risk analysis approach to transportation infrastructure climate protection investment, Transport.Res. D-Tr. E., 104931, https://doi.org/10.1016/j.trd.2025.104931, 2025. a
Zscheischler, J. and Fischer, E. M.: The record-breaking compound hot and dry 2018 growing season in Germany, Weather and Climate Extremes, 29, 100270, https://doi.org/10.1016/j.wace.2020.100270, 2020. a, b, c, d
Zscheischler, J. and Seneviratne, S.: Dependence of drivers affects risks associated with compound events, Sci. Adv., 3, e1700263, https://doi.org/10.1126/sciadv.1700263, 2017. a, b
Zscheischler, J., Martius, O., Westra, S., Bevacqua, E., Raymond, C., Horton, R., Hurk, B., AghaKouchak, A., Jézéquel, A., Mahecha, M., Maraun, D., Ramos, A., Ridder, N., Thiery, W., and Vignotto, E.: A typology of compound weather and climate events, Nat. Rev. Earth Environ., 1, 1–15, https://doi.org/10.1038/s43017-020-0060-z, 2020. a