
the Creative Commons Attribution 4.0 License.
the Creative Commons Attribution 4.0 License.
 | 20 Jul 2026
Community-scale assessment of flood-related public health vulnerability using multi-criteria AHP in Northwestern Bangladesh
Tonoy Mahmud
Shamima Ferdousi Sifa
Md. Asif Rafsan
A. S. M. Maksud Kamal
Md. Shakhawat Hossain
Md. Zillur Rahman
Bangladesh is one of the worst victims of climate change that increases flood vulnerability, particularly in riverine areas (the central- northern part of Bangladesh), where health impacts are severe. This empirical study aims to estimate the public health vulnerability of Dimla Upazila (Nilphamari district) for flood hazards using the analytical hierarchy process (AHP), incorporating expert- weighted indicators: socio-demographics, WASH infrastructure, healthcare access, flood intensity, relief availability, and adaptation capacity. A total of 315 households from six unions were randomly selected and structured questionnaire survey were performed in 2019. Results reveal that the contribution of all indicators to public health vulnerability and flooding intensity has been the most influential factor, followed by relief accessibility, healthcare service accessibility, WASH infrastructure conditions, and the adoption of adaptation strategies. This study indicates that the Purba Chatnai and the Khoga Kharibari (northern part of the Upazila) exhibit the highest vulnerability due to their low socio-economic status and limited relief access. On the other hand, Tepa Kharibari, a centrally located union adjacent to the river, experiences frequent flooding but demonstrates moderate vulnerability for its robust DRR measures, underscoring that physical exposure alone does not determine health risks. By connecting household-level vulnerabilities, infrastructural robustness, and post-disaster responses, this study demonstrates that integrating reactive and proactive measures is essential for reducing public health vulnerability to floods, offering insights relevant to Bangladesh and other flood-prone settings. This study distinguishes among structural deficits, capacity gaps and coordination failures- which framework is also transferable to other flood- prone regions. This can enhance community health resilience and can offer a transformative approach to disaster management. Furthermore, the research can assist policymakers and other relevant stakeholders in identifying gaps and enable them to adopt targeted DRR interventions to foster healthier and more resilient communities.
- Article
(1611 KB) - Full-text XML
-
Supplement
(388 KB) - BibTeX
- EndNote


Climate change has significantly escalated the frequency and intensity of various hazards, among which floods regularly affect large populations and generate severe health crises through the proliferation of waterborne and vector-borne diseases (Achanta et al., 1998; Alam et al., 2018; Ramin and McMichael, 2009). Flooding not only results in mortality but also encompasses complex secondary impacts including mass displacement, food insecurity, respiratory diseases, and the destruction or incapacitation of health infrastructure, all of which can lead to extreme health consequences (Kovats et al., 2003; APFM, 2015). These challenges are further compounded by socio-economic factors that disproportionately affect vulnerable populations, creating intricate patterns of health vulnerability across different communities (Ahern et al., 2005; Du et al., 2010; Phung et al., 2016) . Bangladesh, which has a unique geographic position as a low-lying deltaic plain, combined with its extreme population density, makes it particularly vulnerable to recurrent flood disasters and their impacts (Hossain et al., 2011; Rahman and Salehin, 2013). Approximately 35 % of the whole country was flooded in 2020 (NAWG Bangladesh, 2020). The Sylhet flood of 2022 is termed as the worst flood in this region in 122 years (Rumpa et al., 2023). These floods caused damage not only due to their intensity, but other factors, such as exposure and vulnerability were also present.
The relationship between flood exposure and health outcomes has been demonstrated in various global contexts (Flores et al., 2024; KaTurner et al., 2019; Suhr and Steinert, 2022). For instance, as demonstrated in (Saulnier et al., 2018), a direct link between seasonal flooding and health risks, but the key influencing indicators remain understudied, limiting the clarity needed for future interventions. A critical review of (Lowe et al., 2013) on numerous PubMed studies were conducted, and it was found that while factors such as age, gender, socioeconomic status, and flood severity influence flood-related health outcomes, research remains limited on non-demographic risk factors. A research in Mombasa, Kenya revealed how household characteristics, WASH infrastructure, and environmental factors collectively influence health vulnerability during floods (Okaka and Odhiambo, 2019a). Floods are a pervasive hazard across South Asia, accounting for approximately 40 % of all disaster impacts. This hazard is associated with persistently high morbidity and mortality rates, as well as significant disruption to healthcare systems (Ahluwalia, 2025) and the situation can get exaggerated as climate projections (Christian et al., 2025). Similar dynamics are evident in Bangladesh, where studies have documented the catastrophic consequences of compromised WASH facilities during floods, including the widespread contamination of water sources and subsequent disease outbreaks (Shahid, 2010; Shimi et al., 2010). Historical evidence from the 1998 floods showed that economically disadvantaged populations suffered disproportionately from diarrheal diseases due to limited access to clean water (Kunii et al., 2002). This indicates that health vulnerability has been a major issue during floods. This is especially contrasting when compared to countries with a similar socioeconomic backdrop as Bangladesh (Vietnam, Sudan, etc.) has already performed household-level public health vulnerability inspection on the household level and found a lot more precise insight in this matter (Abbas and Routray, 2014a, b; Bich et al., 2011).
Several studies have employed methods other than AHP for vulnerability assessment, including the vulnerability composite index (Abbas and Routray, 2014b; Jha and Gundimeda, 2019; Rehmen et al., 2023), logistic regression models (Shah et al., 2020, 2024), other statistical models (Rehmen et al., 2023) and spatial modelling (Chen et al., 2021; Kader et al., 2024; Sharker et al., 2025; Sung and Liaw, 2020). In contrast, the AHP method has been applied to both household-level (Alam and Mondal, 2019; Batur et al., 2025; Hoque et al., 2019; Redwan and Shabur, 2025) and regional-level vulnerability assessment (Gao et al., 2022; Tran et al., 2020). AHP is particularly popular for determining overall vulnerability because it allows individual weighting of indicators, integrates both qualitative and quantitative data into the decision-making process, properly reflects stakeholders' opinions, which are absent in other methods. Moreover, for local-level data analysis, AHP is a suitable option, as vulnerability is a sensitive issue that can vary dramatically with individual characteristics (de Brito et al., 2018; Debnath et al., 2025; Truong et al., 2023).
Although AHP has been used in several studies in Bangladesh to assess spatial vulnerability to floods (Hossain and Adhikary, 2024; Kader et al., 2024; Sharker et al., 2025), distinguishing household-level public health vulnerability due to floods using the AHP method remains rare in public health vulnerability discourse, especially in the context of Bangladesh. While existing research has made valuable contributions to understanding flood-related health vulnerabilities, significant knowledge gaps remain. Previous studies have either focused on specific diseases (Hashizume et al., 2008; Nahar et al., 2014; Schwartz et al., 2006) or assessed the impact on public health (Kundzewicz and Takeuchi, 1999; Lee et al., 2021; Shahid, 2010) or employed aggregated district-level analyses (Lee et al., 2021), potentially obscuring important variations at the household level. Lee et al. (2021) identifies regional vulnerability patterns in north-western Bangladesh and acknowledges that district-level data cannot capture micro-scale disparities. More recently, (Hassan et al., 2025) followed the IPCC framework to assess the livelihood vulnerability index (LVI) for different climate- induced disasters and examines associations with health outcomes. However, the multi- hazard approach fails to isolate the flood effects, as DRR planning requires hazard-specific vulnerability assessments. The absence of household-level public health vulnerability assessments due to floods highlights the need for this study. Furthermore, the use of AHP accounts for the complex interplay of structural, economic, and environmental factors that determine health outcomes during floods.
This study addresses these research gaps through three primary objectives: (1) developing a comprehensive household-level vulnerability assessment framework that integrates hazard exposure, demographic characteristics, WASH infrastructure, healthcare access, and adaptive capacity; (2) identifying spatial patterns of health vulnerability within flood-prone communities; and (3) evaluating the effectiveness of existing disaster risk reduction strategies. Our research makes several novel contributions to the field, including the development of a micro-scale assessment methodology that reveals intra-community vulnerability variations and the demonstration of how combined proactive and reactive measures can significantly enhance health resilience. This study aims to assess general community flooding using data collected in 2019 via memory recall of prior floods. Policymakers can apply the findings to strengthen public health resilience in preparation for future floods such as the 2020 event, which inundated 35 % of the country (NAWG Bangladesh, 2020). This research can assist government agencies, policymakers, non-governmental organizations (NGOs), and health professionals in identifying, planning, and implementing effective, localized strategies to increase public health resilience. Furthermore, this study contributes a transferable methodological framework that creates a bridge between macro-level vulnerability and household-level realities, supporting effective multi-level DRR initiatives not only in Bangladesh but also other resource-constrained flood-prone regions.
This study employs a mixed-method approach combining expert judgments (AHP), structured household-level questionnaire survey, geospatial and statistical analysis to assess public health vulnerability in Bangladesh's Teesta River floodplain. 315 households were randomly surveyed in six unions of Dimla upazila, capturing all six indicators: capturing socio-demographic condition, WASH facilities, healthcare service accessibility, flood intensity, relief accessibility and adaptation indicators. The methodology integrates both quantitative and qualitative insights to evaluate flood-induced health risks and inform resilience-building strategies.
2.1 Study Area
A significant number of rivers flow through the northern region of Bangladesh. The Teesta floodplain is one of the largest basins in the north-western part of the country (Mondal et al., 2021a). This region is highly vulnerable to floods occurring almost yearly due to its geographical location. The Nilphamari district is located upstream of the Teesta Basin, with significant rivers named Teesta, Dharla, and Brahmaputra flowing on the right side of the basin (Mondal et al., 2020). The right banks of the rivers are highly vulnerable and regularly affected by flood events, river bank erosion, and drought (BBS, 2021). Floods in 1998, 2004, 2008, 2017, and 2020 are some of the significant and severe flood events that have devastated this area (Ahmed and Hussain, 2009; Aziz et al., 2022; Philip et al., 2019).
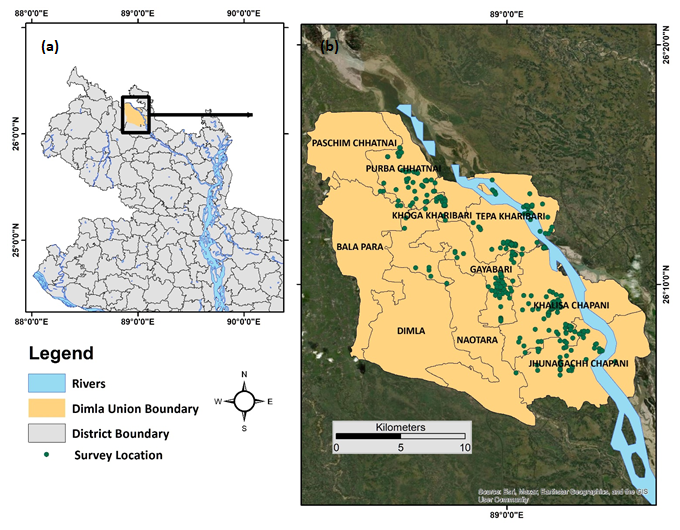
Figure 1Study Area location (a) the Dimla Upazila location in the Northwestern part of Bangladesh; and (b) the surveyed households in different unions of the Dimla Upazila (e.g. Sources: Field Survey, BMD, GSB, ESRI, GeoEye, GIS User Community; Powered by Esri) (illustrated by the author; field survey 2019).
This study has focused on a small area of the Teesta floodplain, i.e., the Dimla Upazila (sub-district) (Fig. 1) which is located in the north-eastern part of the Nilphamari District (Mondal et al., 2021b), with the Teesta River flowing through it (BBS, 2021). This Upazila is bordered by West Bengal, India on the north, Jaldhaka Upazila (under Nilphamari district) on the south, Hatibandha Upazila (under Lalmanirhat district) on the east, and Domar Upazila (under Nilphamari district) on the west (BBS, 2013). The Gozaldoba Teesta Barrage in West Bengal, India, established for irrigation purposes, is on the Northern side of the Dimla Upazila (Al-Hussain et al., 2021). The key informants during the field visit informed that when the rainfall increases in the adjacent part of India (of the study area), the probability of flooding rises there and therefore they open the sluice gates of the Gajoldoba Barriage to reduce their risk which results that the water flowing down to the northern part of Bangladesh through the Brahmaputra River and cause flooding along the riverbank areas. This condition worsens if the rainfall in Bangladesh continues as it increases the peak of the water level height. The Dimla Upazila is one of the worst affected regions considering the number of affected people in frequent disasters (Rahman et al., 2018). It has an area of 326.80 km2 and the male-female ratio of the area is 1.009 : 1 among the 283 438 population (BBS, 2014). This Upazila consists of 10 union parishads. Agriculture is the major livelihood option of the people of this area (BBS, 2014).
2.2 Sample size selection
Six unions named Jhunagachh Chapani, Khalisa Chapani, Khoga Kharibari, Purba Chhatnai, Gayabari and Tepa Kharibari of the Dimla Upazila (BBS, 2014) were selected purposely to capture the spectrum of flood impact (low, moderate, high) to make meaningful comparisons as: low, moderate and high flood-affected regions according to the key informants (Upazila Nirbahi Officer (UNO – the executive head of the Sub District administration) and local NGOs (BRAC, ASA, and RDRS)). Further, to ensure unbiased representation of households within each selected flood severity stratum, a total of 315 samples were randomly selected.
In this study, to estimate the sample size, firstly the population has been projected for 2019 (the study year). The following formula (Goodman, 1968) has been used to project the population.
Here, x(t) denotes the projected population. The data for x0 is the population of the Dimla upazila (283 438 in 2011) according to (BBS, 2013); r is the population growth rate (1 % as Chowdhury and Hossain, 2019) and t is the time period (8 years). The projected population number for 2019 is 306 923.
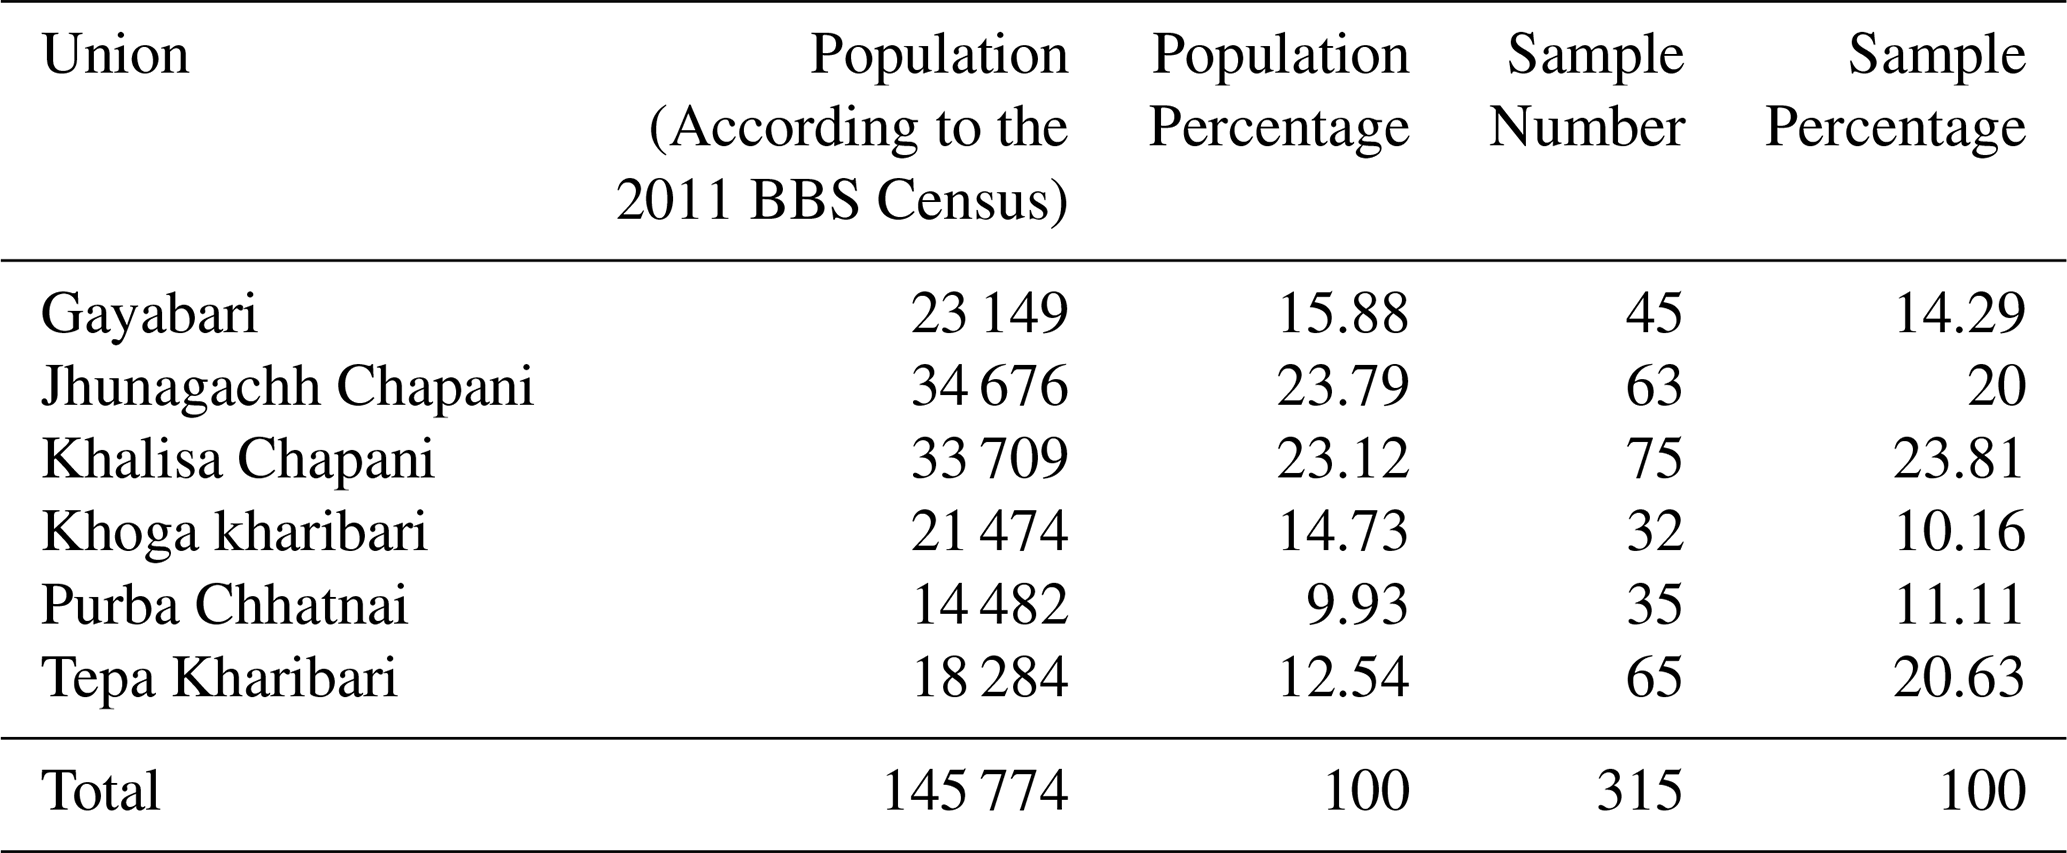
Table 1Survey numbers according to union (representation of the presentation) (Source: Illustrated by the author; field survey 2019).
After calculating the household number, the following equation (Cochran, 1977; Goodman, 1968) has been used for finite population to calculate the sample.
Here, N is the x(t), p = estimated proportion (or probability) of the characteristic of interest in the population as 0.5. A total sample size of 315 households was determined based on a 90 % confidence level (z = 1.645) and ±5 % margin of error (e), adjusted upward from the minimum of 271 to ensure representation across six unions. The sample was allocated proportionally to each union's population (Table 1). Minor variations in allocation reflect fieldwork accessibility.
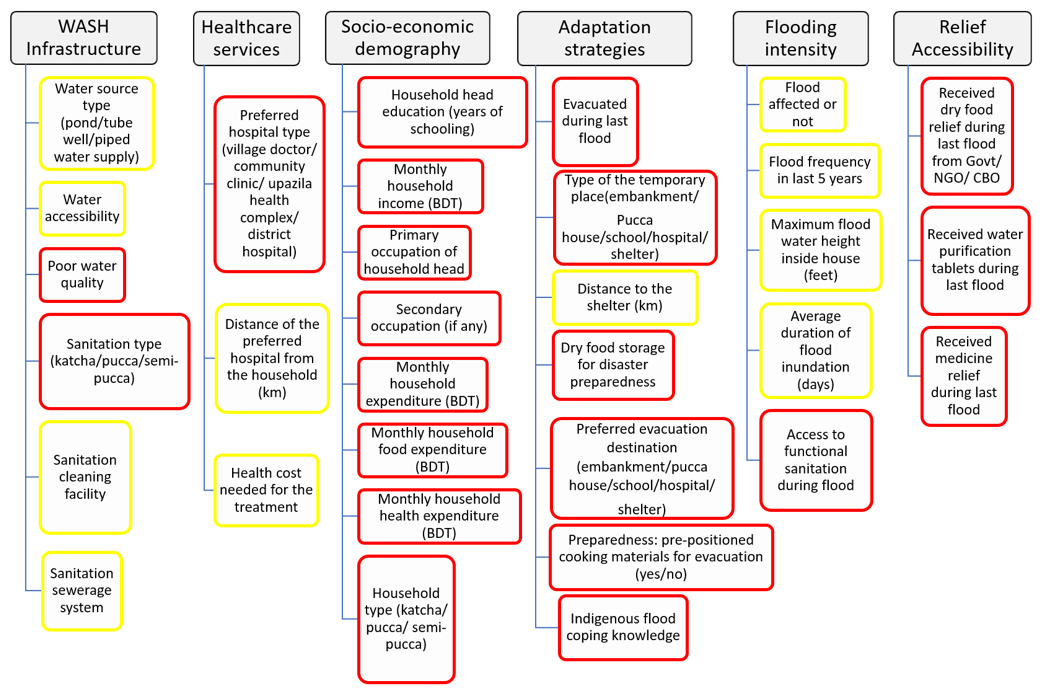
Figure 2The indicators under the major categories taken for the vulnerability assessment (the yellow one shows the benefit criteria and the red one shows the cost criteria based on the data collection and analysis) (illustrated by the author; field survey 2019).
2.3 Data collection
A field visit was conducted in October 2019 to collect household-level data through a structured questionnaire survey. Information related to socio-economic demography, WASH infrastructure availability, healthcare service accessibility, flood hazard intensity, relief accessibility and adaptation strategies (Fig. 2) has been collected from 315 households followed by simple random sampling in six Upazilas. The questions were asked in the native language (Bangla) and each questionnaire took around 30 min. Household data were collected using a structured questionnaire. Variables were measured on binary (yes/no, present/absent), nominal (e.g., occupation, sanitation type), and ordinal (e.g., income, education level) scales, as summarized in Table 2. Additional open-ended questions were also pursued to gain deeper insights into their perspectives and the broader circumstances of vulnerability. Participants were selected from each household, with preference given to the household head; alternatively, any adult family member aged 18 or older was included. The UNO, local NGOs (BRAC, ASA, RDRS) and Upazila Health & Family Planning Officer of the area were the key informants who provided the overview of the area in the initial phase of the survey.
Table 2Description and measurement scale of survey variables (Source: Illustrated by the author; field survey 2019).
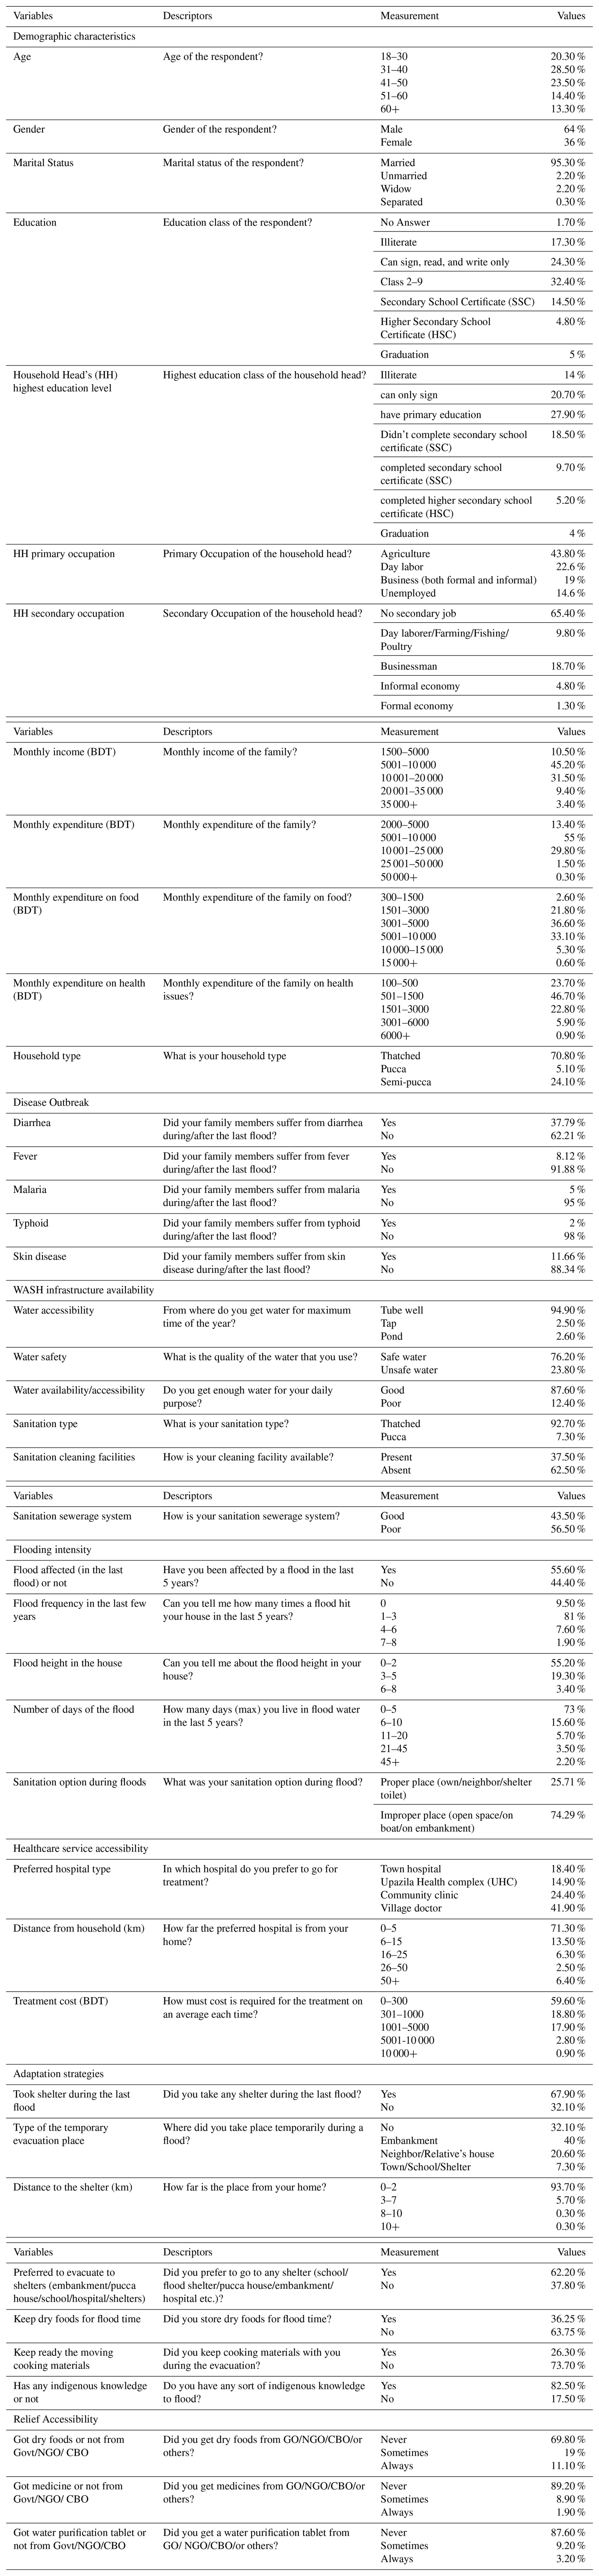
There are six categories and 32 indicators in total to assess the vulnerability. Primarily, the categories were selected after reviewing the literature (Acharya and Silori, 2024; Ahern and Kovats, 2006; Few and Matthies, 2006; Islam, 2017; Matsuyama et al., 2020; Okaka and Odhiambo, 2019b, a; Paterson et al., 2018; Phung et al., 2016; Shah et al., 2020; Shimi et al., 2010; Tascón-González et al., 2020). After that, the experts help to finalize the indicators under the six categories. One indicator can influence the vulnerability in two ways: some accelerate the vulnerability and some lessen the vulnerability such as: better WASH facilities will lessen the public health vulnerability and vice versa (Fig. 2).
In this analysis, several nominal variables were considered as ordinal based on their inherent characteristics to examine their dependency and relationship with health vulnerability. The categories were confirmed based on their attributes, quality, and specialization on their specific type. For instance, village doctors represent the least formal care, followed by community clinics, UHCs, and district hospitals as the most formal. Similarly, occupation (unemployed, day labour, agriculture, business), household and sanitation type (thatched, semi-pucca, pucca), water source (pond, common/personal tubewell/personal tap), temporary evacuation place (nowhere, embankment/closed one's house/others like shelters) are considered. These ordinal transformations were applied only where a clear and defensible ranking could be established based on prior literature and domain expertise. All ordinal variables were normalized to a 0–1 scale prior to aggregation, with the direction of vulnerability (i.e., whether a higher score represents higher or lower vulnerability) determined separately through the benefit/cost classification shown in Fig. 2.
2.4 Normalization of all indicators
In the pre-processing stage, raw indicator values for each household were normalized to a common scale to facilitate aggregation in the vulnerability assessment following multi-criteria analysis, as the factors are both quantitative and qualitative with different units, they need to be harmonized for better comparison. Therefore, the linear max-min dimensionless method for cost and benefit criteria has been used in this study as it has the advantage of removing the convertible units (Jahan and Edwards, 2015).
Benefit criteria:
Cost criteria:
The factors have been divided into two criteria based on their characteristics (Fig. 2). Those that are positively impacted by the vulnerability are considered as the benefit criteria i.e. poor water quality increases the vulnerability of the household to different health hazards. Similarly, the factors that are inversely related to public health vulnerability are considered as cost criteria i.e. the presence of proper sanitation facilities decreases the vulnerability related to public health.
2.5 AHP method
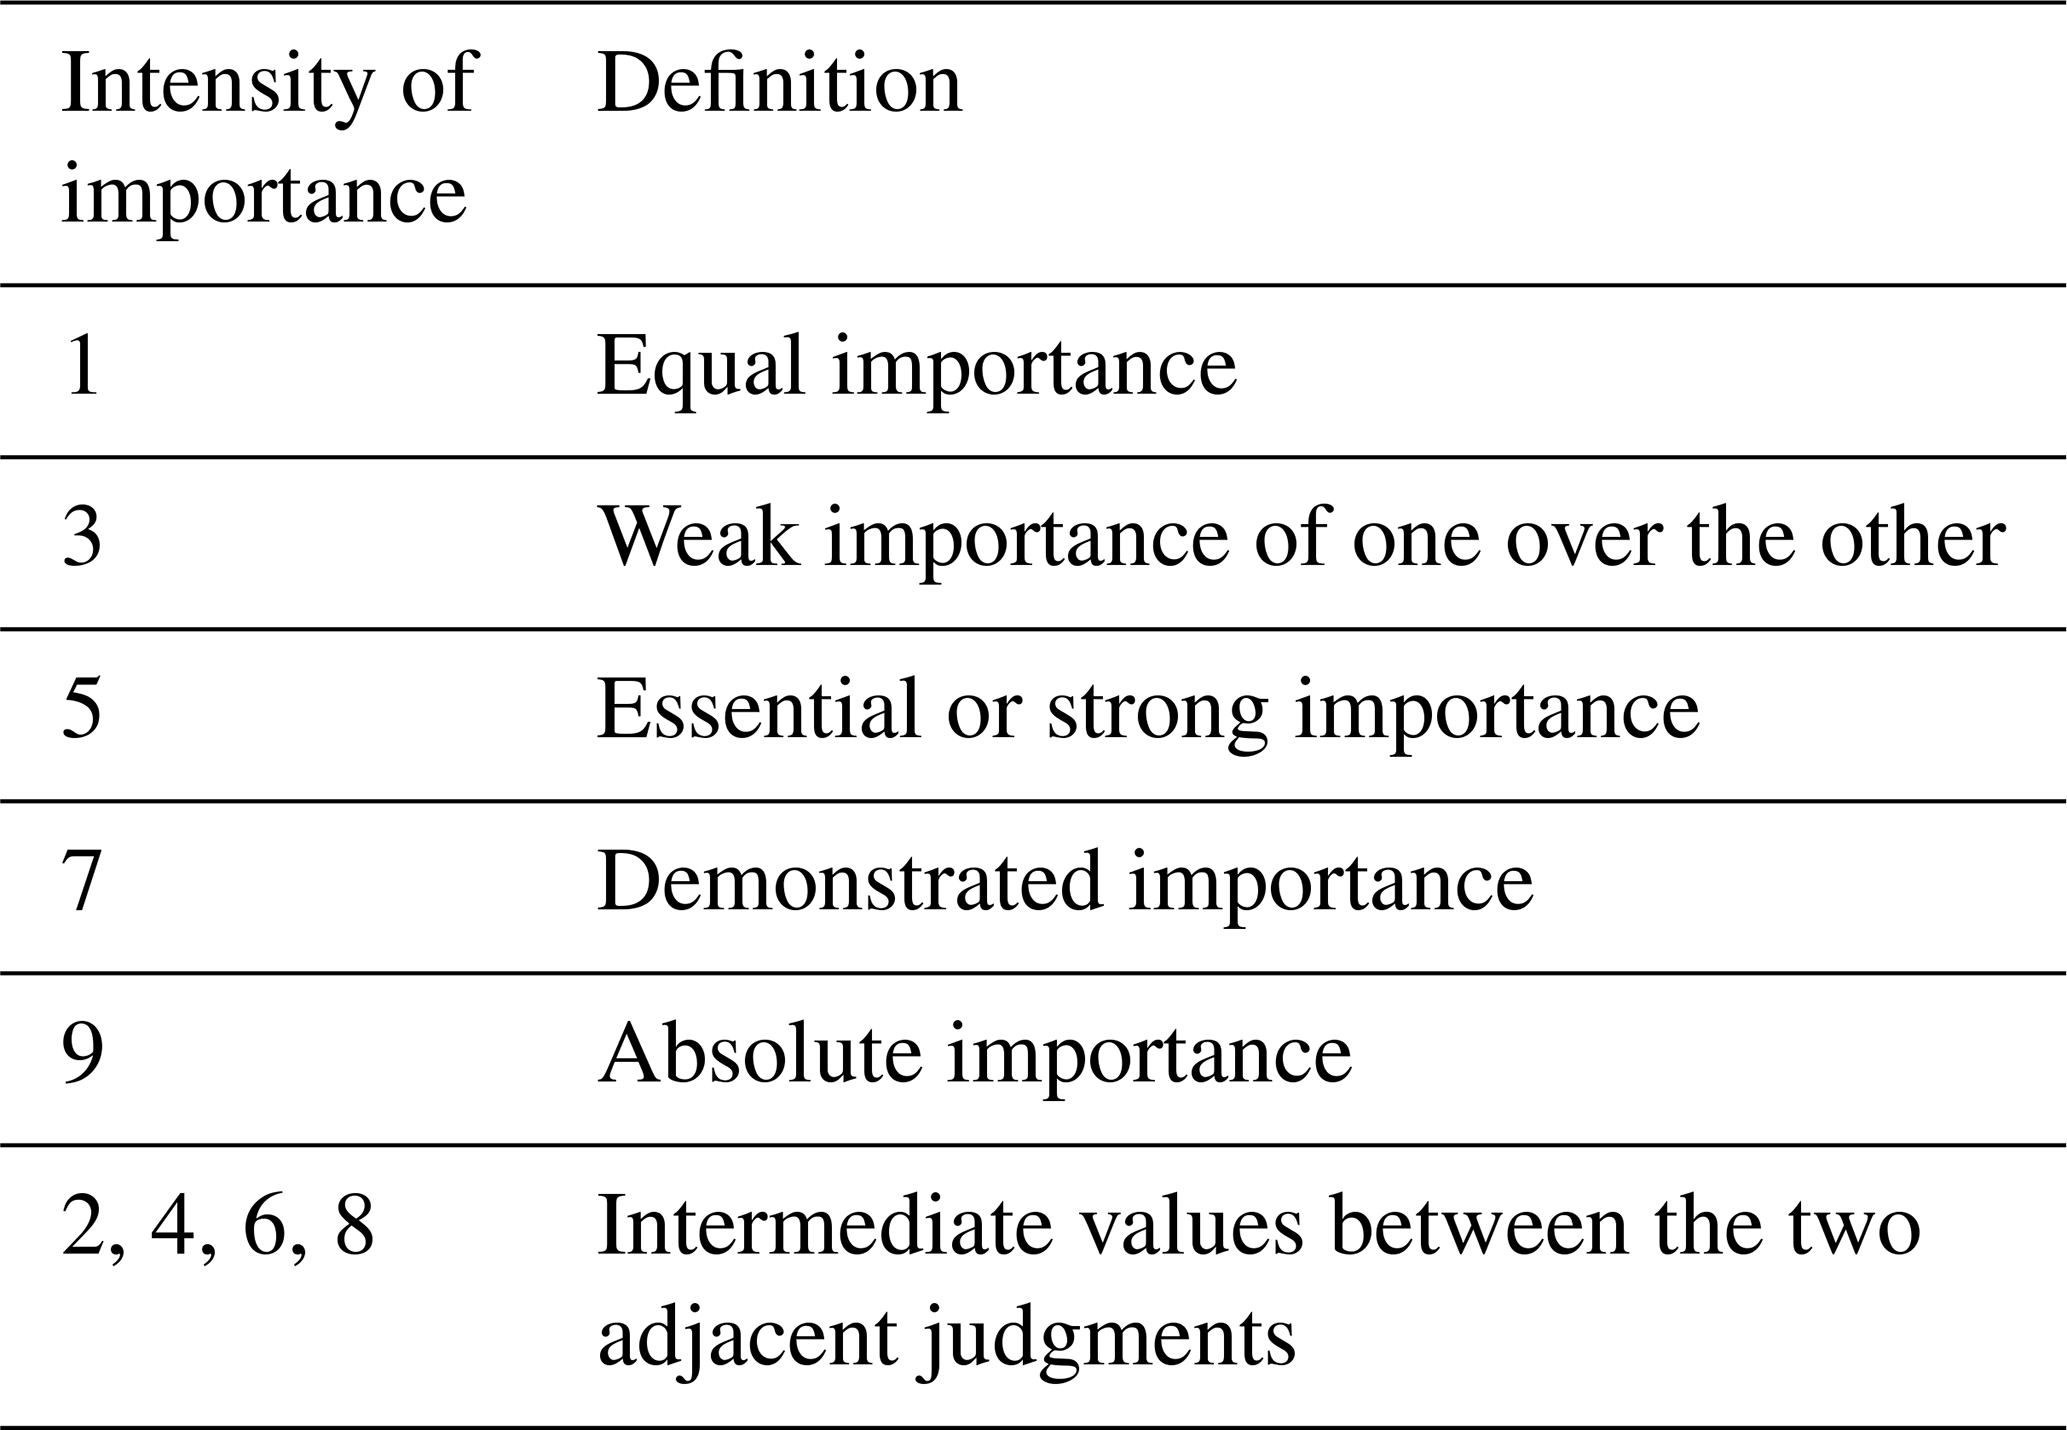
The AHP method is one of the most significant and widely used weighting methods in the multi-criteria decision-making process by decision-makers and researchers (Kara, 2019; Shim, 1989). This method is widely used in disaster management, specifically in vulnerability assessment, rather than other methods (Batur et al., 2025; Gao et al., 2022; Tran et al., 2020). AHP has been chosen as it is relatively better than other methods for vulnerability analysis for its systematic integration of expert judgements and provides a consistency ratio to correct illogical judgments and can incorporate both quantitative and qualitative indicators whereas methods like composite index presents equal weighting, principal component analysis (PCA) or factor analysis require large sample sizes and produce weights that are sample- specific limiting generalizability and interpretability, logistic regression model requires binary outcome variable and cannot incorporate stakeholder priorities (Batur et al., 2025; de Brito et al., 2018). AHP follows a detailed pairwise comparison of all the considered categories to measure relative importance using a 1–9 scale (Saaty scale) (Saaty, 2014) in the analysis where higher values indicate a stronger preference for Parameter i over j (an example matrix structure is shown in Table S1 in the Supplement) and it helps to improve judgment accuracy while enabling formal consistency checking. The eigenvector method was applied to convert pairwise comparisons (Table 3) into normalized criterion weights: for each expert, a square matrix AA was created, where elements aij represent Saaty-scale preferences of parameter i over j. This method was selected over alternative multi-criteria decision-making (MCDM) methods due to its unique suitability for integrating expert knowledge with hierarchical vulnerability dimensions.
Aggregation of expert judgments
A total of fifteen (15) experts from different relevant domains participated in this assessment. These experts are academicians and practitioners of disaster management, climate change, environmental science, health science, and the public health domain. These experts were chosen based on their educational background (relevant domain), work experience (academicians, NGO professionals, policymakers) in a suitable background (minimum 3 years), and their interests in the topic. This diversity reduces the risk that any single perspective (e.g., community representative or purely academic) disproportionately influences the final weights. They provided expert judgments by comparing each pair using Saaty's 1–9 scale (Table 3) as it is the most used and follows pairwise comparison comparing each criterion with another, individually (Afshari et al., 2010). Experts completed comparisons independently, without group discussion, to avoid conformity bias or dominance by senior participants.
Individual pairwise comparison matrices provided by each expert were aggregated using the geometric mean approach (Eq. 1), which preserves the reciprocal property of AHP matrices. For each pairwise comparison entry aij, the aggregated value was calculated as:
where E is the total number of experts (E=15). This method ensures that group consensus is derived while preserving matrix reciprocity and consistency.
The consistency ratio (CR) of all pairwise comparison judgments was kept within 10 % using Eq. (2) to indicate an acceptable level of consistency (Afshari et al., 2010; Chowdhury et al., 2021). The consistency ratio is defined as:
where, is the consistency index, where λmax is the principal eigenvalue of the pairwise comparison matrix, n is the number of criteria, and RI is the random index for the corresponding matrix size. If any expert's judgments produced CR > 0.10, the expert was asked to revise their comparisons until CR ≤ 0.10 was achieved.
2.6 Estimation of public health-related vulnerability
Vulnerability for each household was calculated using a weighted sum model (Eq. 3) following Tascón-González et al. (2020) across six categories: WASH infrastructure (C1), Healthcare services (C2), Socio- economic demography (C3), Adaptation strategies (C4), Flooding intensity (C5), and Relief accessibility (C6).
For each household h, the category-specific vulnerability score is calculated as:
where mi = number of indicators in category Ci, wij = AHP-derived weight of indicator j in category i (normalized to sum to 1 within category), = normalized value (0–1) of indicator j for household h.
The overall household vulnerability index V(h) is the arithmetic mean of the six category scores:
Finally, the union-level vulnerability VU is obtained by averaging V(h) across all households in union U:
where nU is the number of sampled households in union U.
2.7 Statistical Analysis
In this study, several statistical analyses such as correlation, regression, and frequency analysis were adopted. Frequency analysis has been performed to understand the overall scenario of the factors within the respondent groups. The regression analysis is performed in two types: one is between the individual union vulnerability value with their category value and another is between the public health vulnerability value and the categories (linear regression analysis).
The linear regression (Eq. 6) is analysed with the above equation, where y is termed as the dependent variable (the target variable on which the study is considering to imply) and X is termed as the independent or explanatory variable (the input datasets which are self-sustaining). β0 and β1 are the parameters of the model (these are the intercepts and reflect the relationship between the dependent and independent variables). The parameter β0 is termed as an intercept and β1 is termed as the slope parameter. The unobservable error component ε accounts for the failure of data (error) to lie on a straight line and represents the difference between the true and observed realization of y. In the analysis of public health vulnerability and the categories, the dependent variable is the vulnerability value and the independent variable is the six category values. In the other analyses (the regression has been run separately), the individual categories are the dependent variables and the individual union vulnerability value is the independent variable. In the linear regression analysis between the categories and the union-wise public health vulnerability value, the average value of the categories for the individual unions has been taken. Moreover, the correlation has been performed among the six categories.
2.8 Spatial Analysis
The study area map and the vulnerability map have been prepared in ArcGIS 10.8 environment. The union vulnerability is shown as the average value of the unions.
To quantitatively assess the relationship between household vulnerability and proximity to the Teesta River, multiple ring buffers were generated from the right-bank polyline at distances of 100, 500, 1000, 2500, and 8000 m creating five mutually exclusive distance bands (0–100, 101–500, 501–1000, 1001–2500, and 2501–7000+ m). Household survey points (n = 315) containing vulnerability index scores were spatially joined to the buffer polygons, and the mean vulnerability, standard deviation, and household count were calculated for each band using zonal statistics in ArcGIS 10.8. All analyses were conducted in a projected coordinate system (UTM Zone 46N) to ensure accurate distance calculations.
3.1 Demographic characteristics
Among the studied 315 households (Table 2), most of the household heads (64 %) were male, and the remaining (36 %) were female. The highest (28.5 %) number of respondents were in the age group of 31–40 years, followed by 23.5 % of 41–50 years and 14.4 % of 51–60 years. The rest were below 31 age or above 60 ages. Among the respondents, 95.3 % were married, 2.2 % were found unmarried, 2.2 % were widows and 0.3 % were separated. In terms of principal livelihood, the highest (43.8 %) were involved in agriculture (farming, fishing, and poultry), followed by 22.6 % of day labourers, 19 % were involved in business activities (both informal and formal altogether), 11.6 % were housewife and the remaining 3 % were unemployed. As regards the level of literacy, almost 28.2 % of them attended/completed secondary school education and 27.9 % had primary education. Also, 14 % of the household heads were illiterate, around 20.7 % could sign, read, and write only, 5.20 % passed the higher school certificate and only 4 % were graduated. The monthly average household income was found Tk. 13,803. The highest 45.2 % of the households' income was BDT 5001–10 000, followed by 31.5 % of BDT 10 001 to 20 000, 10.5 % BDT 1500–5000, 9.4 % of 20 001–35 000, and the lowest only 3.4 % had BDT 35 000+.
3.2 Disease outbreak after a flood in the study area and the surrounding factors that affect it
Different types of water-borne diseases are very common in flood-prone areas after any flood event. Among them, diarrhoea, typhoid, skin diseases, dysentery, cholera, and meningitis are very common (Shahid, 2010). Along with these, cold symptoms along with fever are regular during the flood. The impacts are not even limited to these; death from drowning, flash flooding, injuries and wounds, electric shocks, burns and explosions, hypothermia, and psychological effects are also some of the impacts of floods (Tascón-González et al., 2020). In the study area (Fig. 3a), the respondents reported that diarrhoea (> 35 %) is the most common phenomenon during and after flood occurrence. Skin diseases (> 10 %) and fever (∼ 9 %) were also found to be common in the area. Around 5 % and 1 % of respondents reported that they suffered from malaria and typhoid during the last flood, respectively. They visit doctors or other health complexes depending on the severity of the health situation.
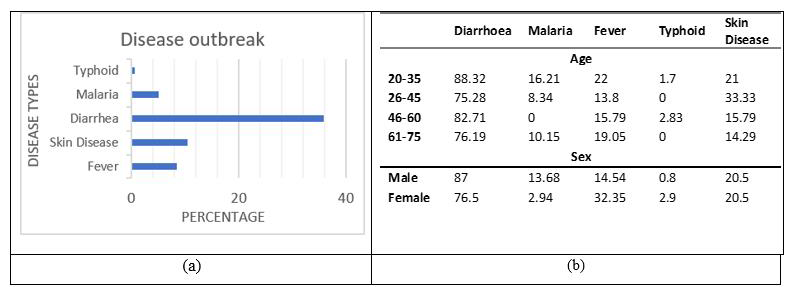
Figure 3(a) Percentage of diseases affected (based on the respondents' opinions). (b) Disease distribution among different demographic groups among the respondents (given in percentage) (Source: Illustrated by the author; field survey 2019).
Figure 3b summarizes the prevalence (%) of five diseases: diarrhoea, malaria, fever, typhoid, and skin disease across different age and sex groups. Diarrhoea was the most common ailment, particularly among individuals aged 20–35 (88.32 %) and males exhibited a higher prevalence of diarrhoea (87 % vs. 76.5 %). Malaria showed higher prevalence in the 20–35 age group (16.21 %) and was more frequent in males (13.68 %) than females (2.94 %). Fever was substantially greater in females (32.35 %) compared to males (14.54 %) and was common in all groups. Typhoid had low overall prevalence, with the highest rate in the 46–60 age group (2.83 %) and was rare in males (0.8 %) than females (2.9 %), while skin disease was most common in the 26–45 age group (33.33 %) but equally prevalent across genders (20.5 %). These findings suggest variations in disease susceptibility based on age and sex.
3.3 Inter-expert variability
Consistency ratios (CR) for individual experts ranged from 0.03 to 0.08, with a mean CR of 0.05 and a standard deviation of 0.017, indicating strong consensus and acceptable consistency across all experts (all CR < 0.10). The highest variability among experts was observed in the “Relief Accessibility” category (SD = 0.19), while “WASH infrastructure” showed the highest agreement (SD = 0.08). These results suggest that the aggregated priority vectors are robust and representative of the expert group.
The highest disagreement was observed (Table 4) for “relief accessibility” (CV = 1.62) and “flooding intensity” (CV = 1.29), reflecting divergent professional priorities among social scientists and public health professionals. Conversely, “WASH facilities” showed the strongest consensus (CV= 0.93) whereas “healthcare services” positioned second (CV = 0.31). Despite this variability, the aggregated geometric mean provides a balanced representation of group priorities, and the consistency ratios confirm acceptable judgment quality across all experts.
Table 4Variability in priority weights across experts differed by criterion.
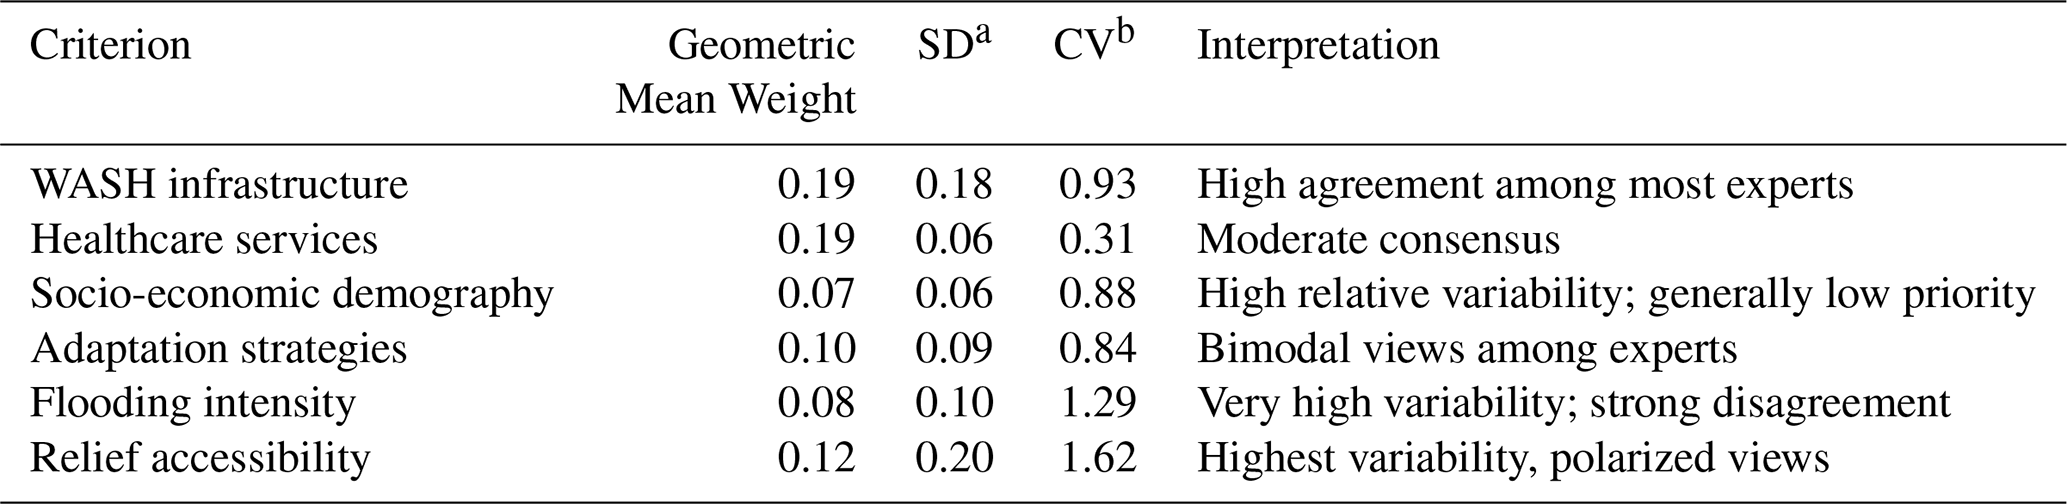
a SD = Standard Deviation. b CV = Coefficient of Variation.
3.4 Union-wise public health vulnerability condition
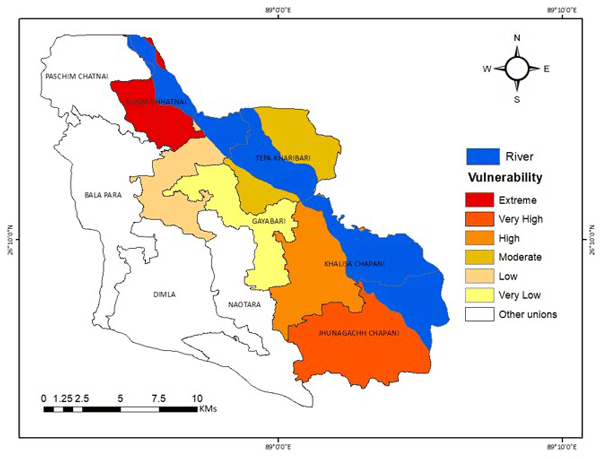
This study is an observational and cross-sectional study; therefore, all identified relationships between indicators and public health vulnerability are correlational, not causal. The results are presented as diagnostic associations that inform prioritization, not as proven causal chains. The union-level vulnerability assessment revealed unexpected findings, as illustrated in Fig. 4. Existing literature (Ferdous and Mallick, 2019) reports that the north-western bank of the Brahmaputra River is flood-prone, and key informants confirmed that Tepa Kharibari union is the most flood-affected as the river flows through it. Given this correlation, this union would be expected to show the highest public health vulnerability to floods. However, our analysis reveals a distinct pattern. Although Tepa Kharibari union experiences the most severe flooding due to its geographical position along the river, it showed only medium public health vulnerability, including among residents living on the opposite bank. Our results demonstrate that Purba Chhatnai, the northernmost studied union, exhibits the highest public health vulnerability whereas, Jhunagachh Chapani in the extreme south, holds the second position. Gayabari, the central union at a distance from the riverbank, showed the lowest vulnerability among the studied unions. This spatial distribution suggests that flood exposure alone does not fully determine health vulnerability, highlighting the importance of other contributing factors.
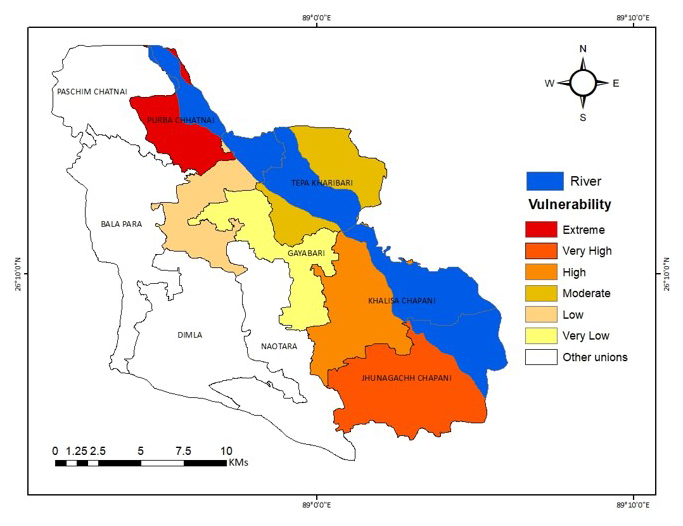
Figure 4Public Health Vulnerability map according to the studied unions (Source: Illustrated by the author: field survey 2019).
Table 5Comparative vulnerability metrics (in percentage) across study unions (Source: Illustrated by the author; field survey 2019).
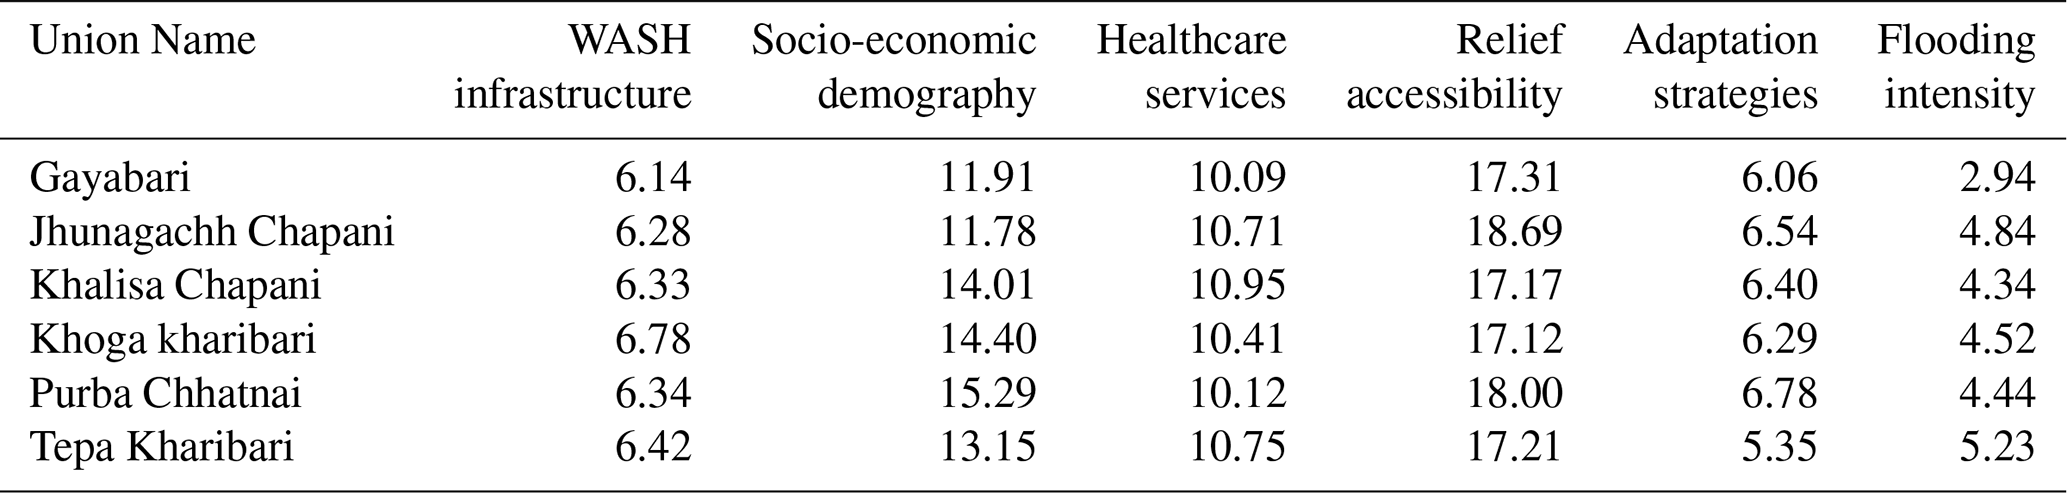
Purba Chhatnai emerges as the most vulnerable union, with strong interconnections among all six indicators (Table 5). Approximately 20 % of its residents live in extreme poverty (Ferdous and Mallick, 2019), which amplifies socio-economic challenges and directly contributes to inadequate housing and WASH facilities. Although literature and our findings confirm that various adaptation measures have been implemented across Dimla upazila by government and NGOs, Purba Chhatnai's adaptive capacity and relief accessibility remain notably weak, receiving less attention despite its high flood exposure; thereby exacerbating its public health vulnerability.
Jhunagachh Chapani's vulnerability status mirrors that of Purba Chhatnai, as the combination of severe flooding, minimal adaptive capacity, and restricted relief access has positioned it in second place. In contrast, Tepa Kharibari exemplifies how institutional support can mitigate vulnerability: despite being the most flood-affected union (Table 5), robust NGO interventions have enhanced its adaptation strategies and relief distribution, which together reduce its vulnerability. Gayabari offers a different lesson: economic advantage and social capital enable superior adaptation and relief access, even with lower baseline flood risk.
Table 5 provides empirical support for the observed vulnerability patterns, revealing notable variations across unions. Purba Chhatnai is identified as the most vulnerable area in public health, exhibiting the poorest socio-economic condition (15.29) and relatively lesser relief accessibility (18.00), despite reporting higher adaptation strategy scores (6.78), as the communities are compelled to rely on self-coping mechanisms despite their limited capacities. Literature further confirms that socioeconomic condition is a critical determinant of flood-related health difficulties (Hossain et al., 2025), while robust adaptation strategies significantly enhance resilience to flood impacts (Hoque, 2023). Tepa Kharibari presents an interesting case of resilience, maintaining only moderate vulnerability despite recording the most severe flooding conditions (5.23), which appears mitigated by better WASH facilities (6.42) and relief access (17.21). This underscores the role of NGO interventions namely, the augmentation of WASH infrastructure and the provision of relief supplies, as key mechanisms for decreasing community vulnerability also supported by (Cash et al., 2013; Sharma et al., 2025). Jhunagachh Chapani's position as second-most vulnerable aligns with its combination of extreme flooding (4.84) and limited relief access (18.69), and Gayabari's advantage becomes clear through its minimal flood exposure (2.94) but with superior relief accessibility (17.31). The data particularly highlights how relief distributions (ranging 17.12–18.69) and healthcare accessibility (10.09–10.95) show less variation among unions than household characteristics (11.78–15.29) or flood severity (2.94–5.23), suggesting these structural factors' importance beyond only disastrous conditions, and how they perform as critical equalizers in vulnerability mitigation. These findings reinforce that while flood intensity establishes baseline risk, the interplay of socio-economic conditions and institutional support systems is associated with health outcomes.
Table 6Mean household vulnerability index by distance from the right bank of the Brahmaputra River.
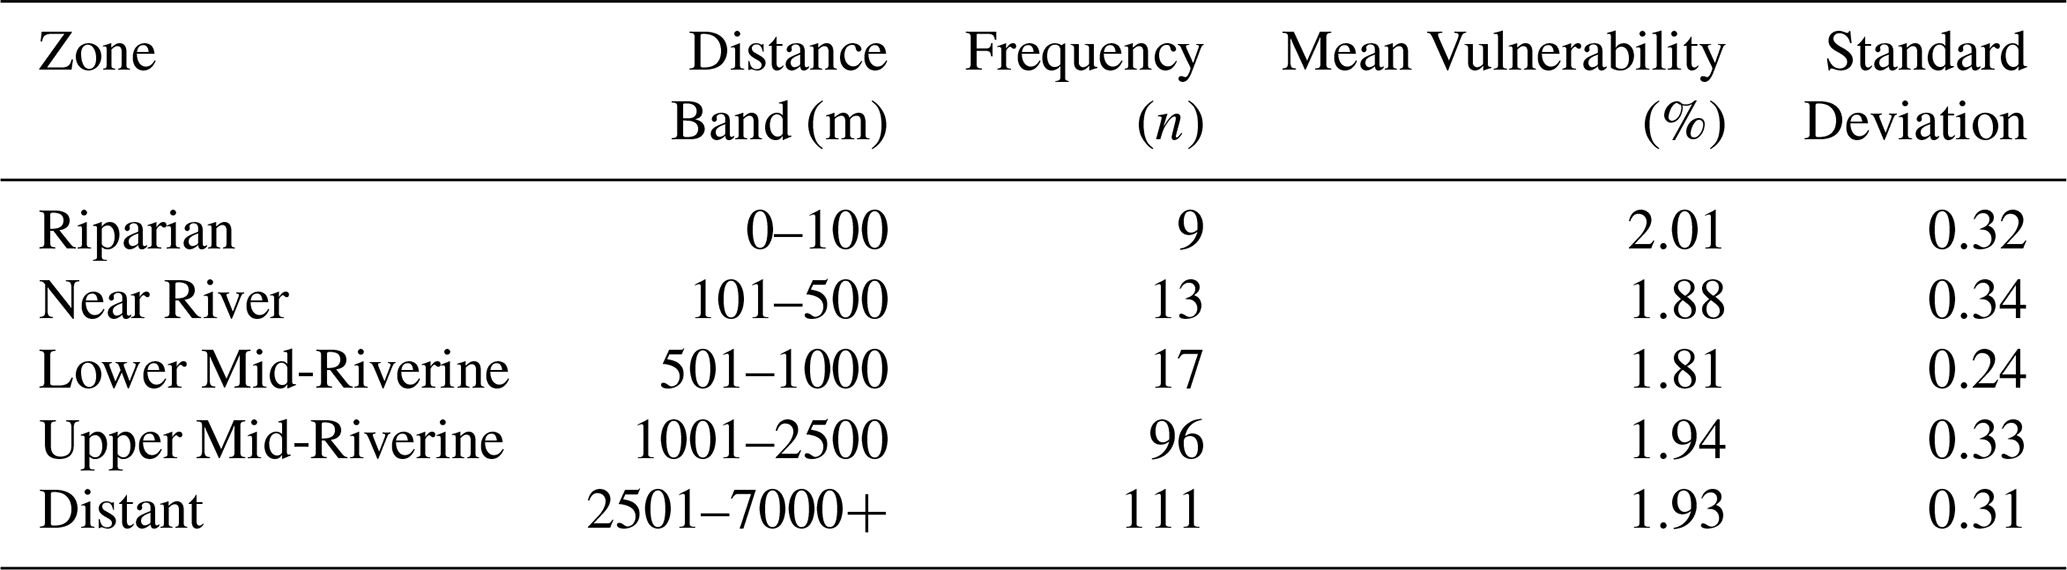
Another interesting finding is that vulnerability does not consistently decrease with distance from the river (Table 6). Although Tepa Kharibari has strong institutional support, its right-bank riverside areas exhibit significantly higher vulnerability than the left bank. Field interviews confirm this disparity, as residents on the right bank lack essential infrastructure, which increases their need for cross-river movement during floods and compounds their vulnerability to critical services. Furthermore, due to movement difficulties, NGO interventions are limited and relief accessibility is almost absent during flood periods. These spatial disparities underscore how geographic isolation can exacerbate vulnerability even within the same administrative boundaries, and how micro-level assessment can vary within the smallest regions. These findings highlight the need for targeted interventions in high-risk riverside settlements.
Analysis of household vulnerability by distance from the right river bank reveals a clear proximity gradient: the Riparian zone (0–100 m) exhibits the highest mean vulnerability at 2.01 % (SD = 0.32), which then declines to its lowest point of 1.81 % (SD = 0.24) in the 501–1000 m band: a 0.20 percentage point (11 %) decrease. Vulnerability rises again in the 1001–2500 m zone to 1.94 % (SD = 0.33), before stabilizing at a baseline of approximately 1.93 % beyond 2500 m. This pattern quantitatively confirms that the most acute risk is concentrated within the immediate riverside, directly supporting qualitative observations of heightened vulnerability along the right bank.
3.5 Relationship between the categories and public health vulnerability
In this study, the six categories have been examined and suggested that these can be distinguished into three disaster management phases: the pre-disaster or normal period, the disaster period, and the post-disaster recovery period (Fig. 5). This relationship is supported by the observed patterns in this study.
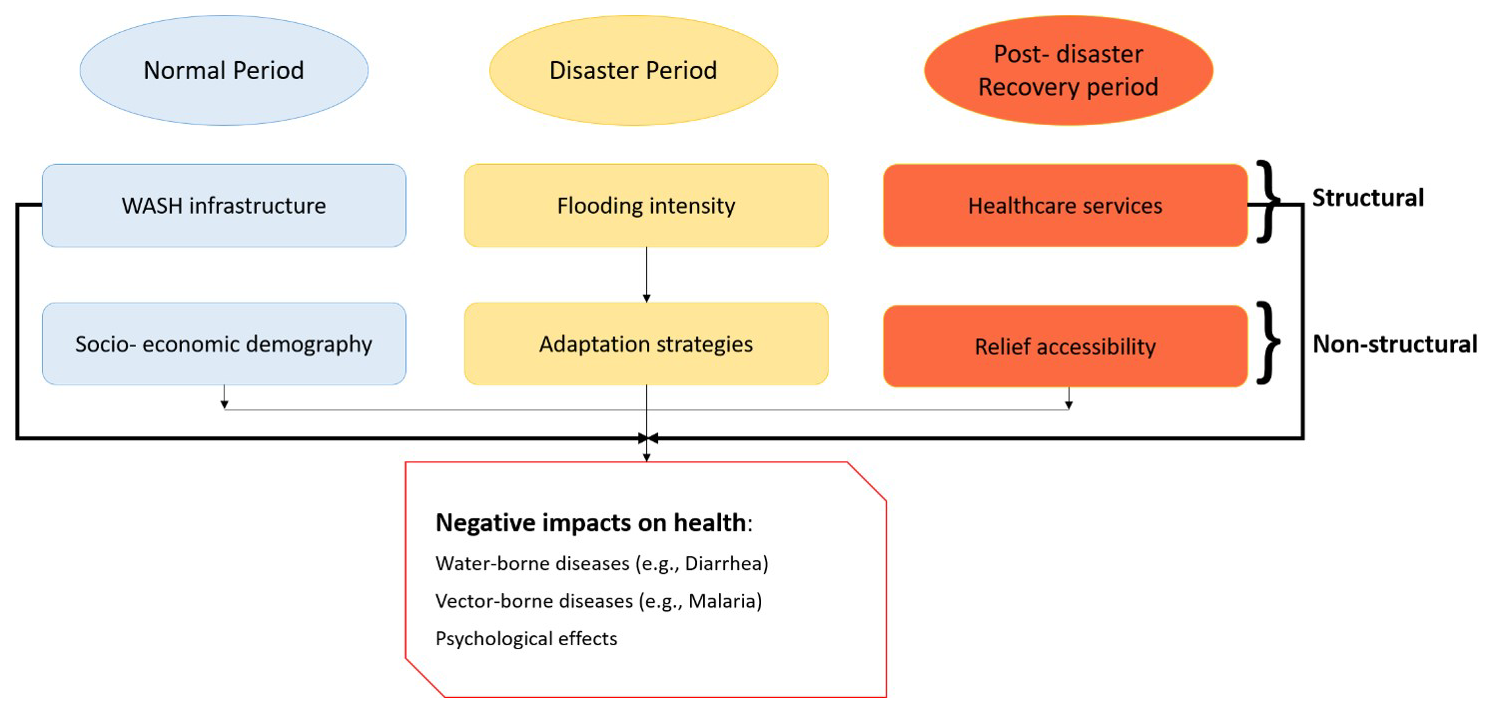
Figure 5Flow chart showing the categories affecting the health status (Source: Illustrated by the author; field survey 2019).
Various demographic characteristics of a household such as the educational level of the household head, occupational status, and monthly income and expenditure patterns, can play a critical role in their preparedness and response types across all phases of a disaster. For example, socio-economic status correlates with housing patterns, WASH facilities, and adaptation measures, which in turn affect health outcomes. During a flood, the flooding conditions a household face and its adaptation strategies can reduce the impacts. Moreover, in the post-flood period, the quality of emergency healthcare services and relief distribution can shape the overall health status of the community.
All these factors can greatly influence vulnerability and can be broadly categorized into structural and non-structural measures. Structural components include housing conditions that can be altered by flooding conditions, WASH facilities in both normal and disaster times, and the robustness of healthcare facilities, especially in emergency conditions. Non-structural factors encompass household demographic characteristics, adoption of adaptation strategies, and relief accessibility. The interaction between structural and non-structural factors is dynamic: improved socio-economic conditions enable better WASH infrastructure, and better housing infrastructure can minimize flooding intensity, thereby enhancing overall disaster resilience. Conversely, economic scarcity limits healthcare provisions and creates barriers to adaptive capacity.
The correlation analysis (Table 7) reveals significant relationships among factors. A weak but positive correlation exists between relief accessibility and adaptation strategies (r = 0.1, p = 0.03), suggesting that better relief access may slightly improve adaptive capacity. More notably, adaptation strategies show a moderate negative correlation with flooding intensity faced by any household (r = −0.25, p < 0.00), demonstrating their effectiveness in mitigating flood impacts. Socio-economic conditions also negatively correlate with flooding state (r = −0.12, p = 0.04), indicating that socioeconomically advantaged households experience less severe flood effects. Most prominently, WASH facilities are strongly associated with socio-economic demography (r = 0.03, p = 0.00), highlighting how better socioeconomic status enables improved WASH infrastructure, a crucial determinant of health resilience. These findings collectively emphasize the interconnectedness of structural and non-structural factors in shaping disaster resilience and health outcomes.
Table 7Correlation between the categories (Source: Illustrated by the author; field survey 2019).
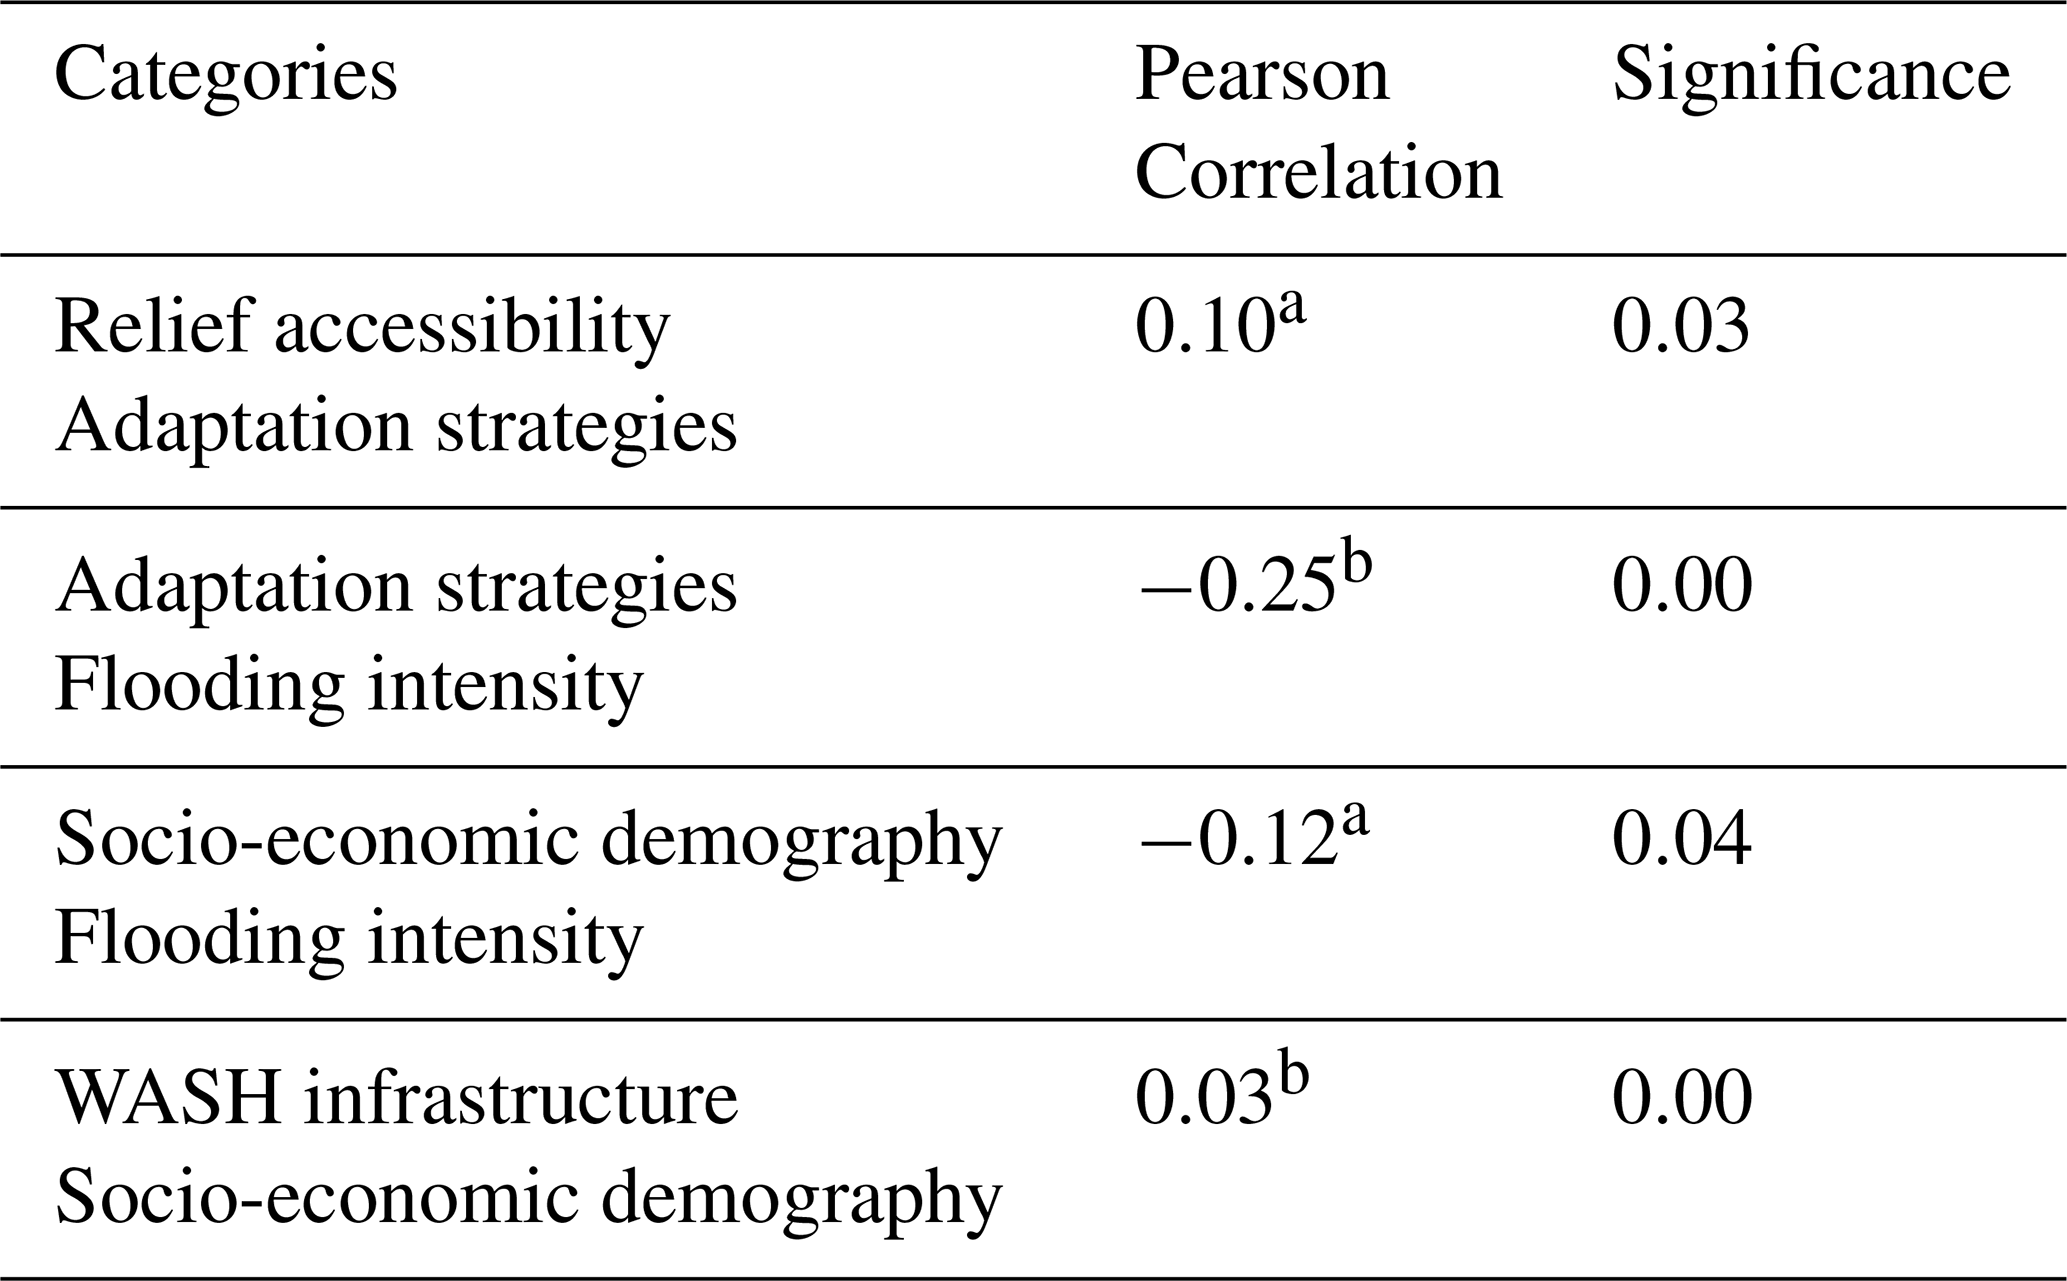
a Correlation is significant at the 0.05 level (2-tailed). b Correlation is significant at the 0.01 level (2-tailed).
4.1 Focus on Household- Level Assessment to Picturize Public Health Vulnerability for Risk Reduction Planning
Previous studies on floods in Northwestern Bangladesh have largely emphasized post-flood health impacts and their associations with socio-economic characteristics (Alam and Bera, 2024; Chakraborty et al., 2024; Matsuyama et al., 2020), whereas public health vulnerability assessment at the household level through a micro lens remains unexplored. While macro-level assessments have emphasized the biophysical and social dynamics influencing community health in Bangladesh, the extreme events arising from the climate-health nexus remain underexplored (Rahman et al., 2019). For instance, Lee et al. (2021) assessed public health vulnerability by compositing socio-economic, health, and coping capacity domains using macroeconomic data, revealing that the northwestern region is highly flood-prone. Their study employed both principal component analysis (PCA) and an equally-weighted method; in contrast, the present research utilizes expert opinions to assign individual weights based on the perceived importance and preferences of each component (Lee et al., 2021). Complementing this, (Hamidi et al., 2025) advocate for local-level empirical evidence to capture underrepresented contextual factors, including health conditions, disaster preparedness, and social connectedness. Micro-level assessments are necessary because geographical and socio-economic characteristics are critical in defining community vulnerability (Hassan et al., 2025; Snehashis and Kumar, 2024). Furthermore, studies have proposed an urgent need for resilient infrastructure, strengthened public health systems, improved health education, and enhanced WASH services to reduce public health vulnerability (Shah et al., 2024), all of which are incorporated into the present study as both reactive and proactive measures.
The household-level AHP-based public health vulnerability results offer clear insights that can strengthen multi-level DRR planning. For instance, whereas Purba Chhatnai is highly vulnerable due to its weak adaptive capacity and poor relief access, rather than flood exposure alone, this indicates that early warning systems (pre-disaster) must be coupled with last-mile relief distribution pipelines (post-disaster). Without this linkage, accurate early warning cannot translate into protective action. Furthermore, strengthening healthcare services to improve emergency care delivery and waterborne disease surveillance should be prioritized after a flood to reduce vulnerability. These findings illustrate that each household holds different vulnerabilities that require differentiated management, and this is precisely the focus of this research.
These micro-scale assessment results remarkably complement rather than replace regional or district-level vulnerability assessments. Large-scale assessments can identify hazard hotspots at the national or regional level using satellite imagery and GIS analysis (Kader et al., 2024), but they cannot resolve intra-district disparities, such as the difference between the right bank and left bank of Tepa Kharibari, or why Purba Chhatnai is the most vulnerable despite not being the most flood-exposed. Conversely, household-level AHP provides diagnostic depth but requires aggregation to inform policy. A pragmatic integration pathway could be a tiered approach combining these two assessment methods: regional analysis using satellite or secondary data, followed by household-level analysis to diagnose specific failure mechanisms.
4.2 The Interplay of Structural and Non-Structural Factors in Shaping Vulnerability
The conceptual framework (Fig. 5) illustrates a fundamental insight: vulnerability works as a dynamic process rather than a static one, where both structural and non-structural factors interplay across different phases from normalcy to disaster to recovery phases. This temporal understanding challenges static hazard-exposure models and reveals distinct intervention windows. Though all the phases and factors are theoretically distinct, their interdependency deepens to understand vulnerability. Whereas better socio- economic conditions enable households to invest in better WASH infrastructure that leads to better health management; conversely, economic constraints create cascading vulnerability as limited resources restrict adaptive capacity. This interdependence explains why investing only in infrastructure or only in awareness can lead to failure. Structural investments require non-structural capacity to be effective, for example, investment in healthcare facilities must be accompanied by proper emergency management. Conversely, non-structural capacity requires structural support to be sustained, for example, stockpiling requires a proper storage location, such as on the right bank of the Brahmaputra River in Tepa Kharibari.
4.3 Institutional Support as a Risk Modifier
Institutional support across all phases can modify risk to a greater extent. Evidence from Tepa Kharibari Union provides empirical validation of this: despite being the most flood-affected area (Table 5) and having lower structural support, the community exhibits lower public health vulnerability than others due to robust institutional interventions. Even financial constraints that limit structural interventions can be compensated by better non-structural institutional support, which can effectively decouple hazard exposure from health outcomes. Strong institutional capacity can disproportionately reduce health impacts even after a large-scale flood, a finding with significant implications for DRR policy. Both government and non-governmental organizations should focus on structural and non-structural measures that increase community resilience across all phases.
4.4 Scientific Contribution
This study can lead to three scientific contributions to public health vulnerability research:
-
First, vulnerability is temporal rather than static, as different contributing factors act differently across disaster phases. Relief accessibility, adaptation measures, and healthcare services each function differently during the normal, disaster, and post-disaster periods. For example, better stockpiling improves relief distribution during emergencies, while effective healthcare management requires proper planning in advance.
-
Second, this study empirically demonstrates the interplay between structural and non-structural factors. Neither alone structural nor non-structural can build resilience, as socio-economic conditions can either enable or constrain management effectiveness. However, even where socio-economic limitations exist, non-structural development can reduce vulnerability to a significant extent.
-
Third, this research contributes a transferable AHP-based framework that not only distinguishes between structural and non-structural factors but also proposes phase-specific pathways. The method is both generalizable and flexible, accommodating context-specific indicators, and can be easily applied in other flood-prone regions.
4.5 Policy Implications
While this study is focused on Dimla and it comprises AHP-based indicator weighting, household-level data collection, and indicators of diverse categories that can be designed for replicability. The AHP results provide empirical justification for policy prioritization as which indicators are the strongest drivers of household-level public health vulnerability in the study area. Researchers and practitioners in other flood-prone regions can adopt this framework by: (1) adapting the indicator list based on local geographical and social characteristics; (2) engaging local experts and stakeholders to derive their context- specific knowledge in the assessment process; (3) public health vulnerability assessment process with a minimal sample size but representation of various smallest (union-level) geographical areas. This study depicts that household-level is not solely determined by flood exposure, but the interaction of demographic, structural, economic and adaptive factors- and that AHP offers a transparent, participatory method to capture these interactions at the local scale.
As Bangladesh experiences recurrent flooding that substantially increases health vulnerability, integrating all six categories into national and local development plans is crucial for fostering resilience. The country's Climate Change Strategy and Action Plan (BCCSAP) already acknowledges climate-related health threats (Shahid, 2010), validating this policy direction. The phase-specific framework suggests targeted intervention windows based on the AHP results:
-
Normal Period: Investment in WASH infrastructure and healthcare facilities (both top tiers of vulnerability) should be implemented along with socio-economic development through diverse livelihood opportunities, educational initiatives for all, and even health financing.
-
Pre-Disaster Period: Adaptation strategies (high importance weights) can be increased through regular training, drill and awareness building, and proper implications of contingency planning, and efficient early warning dissemination can protect and prepare households before any flood occurs.
-
During-Disaster Period: It mainly focuses on the non-structural elements, such as pre-stockpiled supplies, mobile medical teams, and rapid and proper distribution of relief, which are under relief accessibility (a critical vulnerability- moderating factor), can reduce health impacts during the flood period.
-
Post-Disaster Period: Healthcare accessibility (among the most influential categories) as post-flood healthcare pressure management, and proper recovery strategies can improve or deteriorate the health conditions.
All these interventions across different periods are both cumulative and sequential. This means that while successes in one phase can generate cascading benefits, failures can compound vulnerability. Policymakers can understand that hard infrastructure alone cannot effectively build community resilience; rather, institutional strengthening and social protection may foster adaptive capacity. In a resource-constrained country like Bangladesh, where large-scale infrastructure is not immediately feasible, institutional strengthening including relief distribution, awareness campaigns, early warning dissemination, and adoption training to increase adaptive capacity, offers a time- and cost-effective pathway to resilience.
4.6 Transferability to Other Flood-Prone Contexts
This concept of the DRR framework can be extended beyond northwestern Bangladesh to the wider Ganges-Brahmaputra-Meghna delta and similar flood-prone regions (e.g., Kosi River basin, Indus basin, Mekong Delta, etc.) globally. For policymakers, it can work as a diagnostic tool for assessing where vulnerability originates, whether in structural deficits (inadequate infrastructure: poor housing or WASH), non-structural capacity gaps (limited household adaptive capacity), or institutional coordination failures (weak relief delivery); where mechanism diagnosis is transferable, even if rankings are context-specific. By identifying which phase-specific pathways are weakest, interventions can be targeted precisely rather than applied uniformly. Structural deficits manifest as high vulnerability across all phases because of their inherent conditions. Capacity gaps become significant when vulnerability exceeds what would be expected from flood exposure alone, Purba Chhatnai is a perfect example. Lastly, coordination failures are easily detectable when individual indicators score reasonably, but the composite vulnerability remains high. Overall, the framework presented here is context-dependent, yet its underlying mechanisms and analytical workflow are transferable to other settings.
4.7 Study Limitations
Several limitations should be considered when interpreting the findings. These are organized into two categories: methodological limitations and spatial/temporal scope. Acknowledging these limitations is crucial before treating the results as static or universally applicable.
4.7.1 Methodological Limitations
-
Self-reported recall method has its own limitations of social desirability biases, as respondents can over- or underreport vulnerability. The assessment might be towards underestimation, as households may minimize reported hardships with time.
-
Hydrological monitoring was absent and it may cause uncertainty to validate the flood height, duration or frequency that were reported by the households.
-
The robustness of vulnerability rankings against variations in indicator weights, which could be presented through formal sensitivity tests, is absent here. This limits confidence in the precision of ordinal rankings, though key findings (e.g., Purba Chhatnai as most vulnerable) align with field observations.
-
Subjective priorities of the experts on indicator weights, though it was mitigated by consistency ratio checks; however different expert panels might produce different weights, consequently, different vulnerability rankings. The direction of potential bias is unpredictable but may favor indicators perceived as politically or institutionally salient.
-
The categories can be extended to other vulnerability determinants such as social capital (e.g., community networks, trust), gender dynamics (e.g., female-headed household vulnerabilities), and political economy factors (e.g., access to power structures). Their absence may underestimate vulnerability for specific subpopulations.
4.7.2 Spatial and Temporal Scope
-
This cross-sectional study captures vulnerability at a single period, limiting the temporal dynamics. Since vulnerability is not static and it can evolve seasonally, infrastructure improvement and even with changes of household circumstances. The direction of this bias is unknown, as our study may not reflect vulnerability before or after the study period.
-
This research finding is focused on riverine Bangladesh, which may require reviewing before applying to urban, coastal, cultural or other governance contexts with several distinct indicators. Different contexts may require site-specific indicator adaptation.
-
Institutional context reflects the disaster management architecture (e.g., NGO involvement, government programs, relief systems) during the study period, which may change over time due to policy reforms, funding shifts, or political changes.
Bangladesh has progressed toward fulfilling its “Vision 2041” and “Bangladesh Delta Plan (BDP) 2100” development agendas, which aim to create a healthy community through basic health services and proper WASH facilities. However, as a disaster-prone country, Bangladesh faces substantial health-related losses from recurrent hazards. Therefore, assessing public health vulnerability to different disasters and identifying key factors for planning provisions is essential. This research proposes underlying factors of public health vulnerability, including WASH facilities, healthcare access, household characteristics, relief access, and adaptation strategies, all of which significantly affect flood-related health outcomes. These findings can help government agencies, NGOs, and other stakeholders integrate such factors into multi-level DRR planning through prioritizing inclusive policies, infrastructure hardening, and cross-sector coordination in both Bangladesh and other flood-prone regions facing similar data and resource constraints. This approach supports the full realization of a prosperous delta by 2100 by transforming vulnerability into resilience.
The research data has been shared publicly and it can be found in https://doi.org/10.6084/m9.figshare.32209548 (Islam, 2026).
The supplement related to this article is available online at https://doi.org/10.5194/nhess-26-3305-2026-supplement.
Nafisa Nuari Islam: conceptualization, methodology, data curation, analysis, investigation, writing – original draft. Tonoy Mahmud: methodology, data curation, investigation, writing – review, and editing. Shamima Ferdousi Sifa: methodology, data curation, writing – review, and editing. Md. Asif Rafsan: methodology, data curation, writing – review. A. S. M. Maksud Kamal: supervision, resources, conceptualization. Md. Shakhawat Hossain: supervision, resources, conceptualization. Md. Zillur Rahman: supervision, resources, conceptualization, writing – editing.
The contact author has declared that none of the authors has any competing interests.
The author ensures that the work described has been carried out following The Code of Ethics of the World Medical Association (Declaration of Helsinki) for experiments involving humans (Ref: ERC/FBST/JUST/2023-138: Faculty of Biological Science and Technology, Jashore University of Science and Technology).
Publisher's note: Copernicus Publications remains neutral with regard to jurisdictional claims made in the text, published maps, institutional affiliations, or any other geographical representation in this paper. The authors bear the ultimate responsibility for providing appropriate place names. Views expressed in the text are those of the authors and do not necessarily reflect the views of the publisher.
The field data collection for this research was conducted under systematic coordination of OXFAM Bangladesh. We acknowledge sincerely gratitude and wholehearted appreciation to all survey participants and the key stakeholders of the Dimla Upazila. The study's analytical rigor was made possible by fifteen dedicated experts who meticulously completed the pairwise comparison matrices, and their contributions are gratefully recognized. The authors acknowledge the use of AI tool solely for language editing and improving the writing clarity of this manuscript.
This paper was edited by Matthias Schlögl and reviewed by Tasnim Jerin Tusliha and two anonymous referees.
Abbas, H. B. and Routray, J. K.: Assessing factors affecting flood-induced public health risks in Kassala State of Sudan, Oper. Res. Health Care, 3, 215–225, https://doi.org/10.1016/j.orhc.2014.09.001, 2014a.
Abbas, H. B. and Routray, J. K.: Vulnerability to flood-induced public health risks in Sudan, Disaster Prev. Manag. Int. J., 23, 395–419, https://doi.org/10.1108/DPM-07-2013-0112, 2014b.
Achanta, A., Adhikary, S., Cruz, R. V., Tick, L. J., Purohit, A. N., Soegiarto, A., Soesanto, S., and Tingsabadh, C.: Tropical Asia, in: The Regional Impacts of Climate Change: An Assessment of Vulnerability, edited by: Watson, R. T., Zinyowera, M. C., and Moss, R. H., Cambridge University Press, Cambridge, UK, ISBN 0-521-634555, 1998.
Acharya, A. and Silori, R.: A probable framework for flood-induced risk evaluation for water supply, sanitation and hygiene, Water Sustain. Hydrol. Extrem. Quant. Qual. Secur., 237–253, https://doi.org/10.1016/B978-0-443-21499-8.00012-X, 2024.
Afshari, A., Mojahed, M., and Yusuff, R.: Simple additive weighting approach to personnel selection problem, Int. J. Innov. Manag. Technol., 1, 511–515, https://ijimt.org/papers/89-M474.pdf (last access: 2 July 2026), 2010.
Ahern, M. and Kovats, S.: The Health Impacts of Floods, in: Flood Hazards and Health: Responding to Present and Future Risks, edited by: Few, R., Routledge, London, 26, https://doi.org/10.4324/9781849771351, 2006.
Ahern, M., Kovats, R. S., Wilkinson, P., Few, R., and Matthies, F.: Global health impacts of floods: Epidemiologic evidence, Epidemiol. Rev., 27, 36–46, https://doi.org/10.1093/epirev/mxi004, 2005.
Ahluwalia, P. S.: Impacts of Floods on Health and Healthcare Systems in Asian Countries: A Comprehensive Analysis of Direct and Indirect Health Consequences, Economic Burden, and Healthcare Infrastructure Vulnerability, SHODH PRAKASHAN, 3, 72–102, 2025.
Ahmed, A. U. and Hussain, S. G.: Climate Chnage and Livelihood: An Analysis of Agro-Ecological Zones of Bangladesh, Centre For Global Change (CGC), 2009.
Alam, G. M. M., Alam, K., Mushtaq, S., Khatun, M. N., and Leal Filho, W.: Strategies and barriers to adaptation of hazard-prone rural households in Bangladesh, Clim. Change Manag., 11–24, https://doi.org/10.1007/978-3-319-64599-5_2, 2018.
Alam, M. S. and Mondal, M.: Assessment of sanitation service quality in urban slums of Khulna city based on SERVQUAL and AHP model: A case study of railway slum, Khulna, Bangladesh, J. Urban Manag., 8, 20–27, https://doi.org/10.1016/j.jum.2018.08.002, 2019.
Alam, S. and Bera, M. K.: Flood-Induced Health Vulnerability: A Case Study of Nirmal Char in Murshidabad District, West Bengal, Disaster Adv., 17, 9–16, https://doi.org/10.25303/176da09016, 2024.
Al-Hussain, Sk. J., Paul, S. K., and Hossain, Md. N.: Comparative Assessment of Vulnerability to Drought and Flood in the Lower Teesta River Basin: A SWOT Analysis, Asian J. Geogr. Res., 4, 20–33, https://doi.org/10.9734/ajgr/2021/v4i130124, 2021.
APFM: Health and Sanitation Aspects of Flood Management, Integrated Flood Management Tools Series, Issue 23, World Meteorological Organization (WMO) and Global Water Partnership (GWP), Geneva, https://www.floodmanagement.info/publications/tools/Tools_23_Health_and_Sanitation_Aspects_of_Flood_Management.pdf (last access: 2 July 2026), 2015.
Aziz, M. A., Moniruzzaman, M., Tripathi, A., Hossain, M. I., Ahmed, S., Rahaman, K. R., Rahman, F., and Ahmed, R.: Delineating Flood Zones upon Employing Synthetic Aperture Data for the 2020 Flood in Bangladesh, Earth Syst. Environ., 6, 733–743, 2022.
Batur, M., Karaman, H., and Metin, R.: Mapping Social Vulnerability to Nuclear Accidents: a Comparative Framework Using BWM and AHP Methods, Springer Nature Link, 18, 45, https://doi.org/10.1007/s12061-025-09649-3, 2025.
Bangladesh Bureau of Statistics (BBS): District Statistics 2011: Nilphamari, Bangladesh Bureau of Statistics, Dhaka, 2013.
BBS: Population & Housing Census-2011, Bangladesh Bur. Stat., 2, 163–164, 2014.
BBS: Statistical Yearbook Bangladesh 2020, 40th edn., Bangladesh Bureau of Statistics, Dhaka, 2021.
Bich, T. H., Quang, L. N., Ha, L. T. T., Hanh, T. T. D., and Guha-Sapir, D.: Impacts of flood on health: epidemiologic evidence from Hanoi, Vietnam, Glob. Health Action, 4, 6356, https://doi.org/10.3402/gha.v4i0.6356, 2011.
Cash, R. A., Halder, S. R., Husain, M., Islam, M. S., Mallick, F. H., May, M. A., and Rahman, M. A.: Reducing the health effect of natural hazards in Bangladesh, Lancet J., 382, 2094–2103, 2013.
Chakraborty, D., Mondal, K. P., Al Jubaer, Islam, S. T., and Talukder, B.: Health impacts of rapid-onset event: 2022 flash flood in Bangladesh, in: Living with Climate Change, edited by: Letcher, T. M., Elsevier, 199–212, https://doi.org/10.1016/B978-0-443-18515-1.00004-6, 2024.
Chen, Y., Ye, Z., Liu, H., Chen, R., Liu, Z., and Liu, H.: A GIS-Based Approach for Flood Risk Zoning by Combining Social Vulnerability and Flood Susceptibility: A Case Study of Nanjing, China, Int. J. Environ. Res. Public Health, 18, 11597, https://doi.org/10.3390/ijerph182111597, 2021.
Chowdhury, M. A., Sabrina, H., Zzaman, R. U., and Islam, S. L. U.: Green building aspects in Bangladesh: A study based on experts opinion regarding climate change, Environ. Dev. Sustain., https://doi.org/10.1007/s10668-021-01823-0, 2021.
Chowdhury, M. N. M. and Hossain, M. M.: Population Growth and Economic Development in Bangladesh: Revisited Malthus, arXiv [preprint], https://doi.org/10.48550/arXiv.1812.09393, 2019.
Christian, P. J., Dunsch, F., Heirman, J., Kelley, E., Kondylis, F., Lane, G., Waidler, J., Adusumalli, N., Batmunkh, O., and Malhotra, K.: Fast Action for Floods: RCT Evidence on Forecast-based Cash Transfers from Bangladesh and Nepal, Policy Research Working Paper, World Bank Group, Washington, D.C., https://doi.org/10.1596/1813-9450-11244, 2025.
Cochran, W. G.: Sampling Techniques, 3rd edn., John Wiley & Sons, New York, ISBN 0-471-16240-X, 1977.
Debnath, P., Biswas, A., and Jeong, G.: Review of the use of the analytical hierarchy process for flood risk assessment in Bangladesh, Nat. Hazards, 121, 19443–19472, https://doi.org/10.1007/s11069-025-07523-6, 2025.
de Brito, M. M., Evers, M., and Almoradie, A. D. S.: Participatory flood vulnerability assessment: a multi-criteria approach, Hydrol. Earth Syst. Sci., 22, 373–390, https://doi.org/10.5194/hess-22-373-2018, 2018.
Du, W., Fitzgerald, G. J., Clark, M., and Hou, X. Y.: Health impacts of floods, Prehospital Disaster Med., 25, 265–272, https://doi.org/10.1017/S1049023X00008141, 2010.
Ferdous, J. and Mallick, D.: Norms, practices, and gendered vulnerabilities in the lower Teesta basin, Bangladesh, Environ. Dev., 31, 88–96, https://doi.org/10.1016/j.envdev.2018.10.003, 2019.
Few, R. and Matthies, F.: Flood hazards and health: responding to present and future risks, Choice Rev. Online, 44, 1555, https://doi.org/10.5860/choice.44-1555, 2006.
Flores, A. B., Sullivan, J. A., Yu, Y., and Friedrich, H. K.: Health Disparities in the Aftermath of Flood Events: A Review of Physical and Mental Health Outcomes with Methodological Considerations in the USA, Curr. Environ. Health Rep., 11, 238–254, https://doi.org/10.1007/s40572-024-00446-7, 2024.
Gao, Z., Jiang, Y., He, J., Wu, J., Xu, J., and Christakos, G.: An AHP - based regional COVID-19 vulnerability model and its application in China, Model. Earth Syst. Environ., 8, 2525–2538, https://doi.org/10.1007/s40808-021-01244-y, 2022.
Goodman, L. A.: An elementary approach to the population projection-matrix, to the population reproductive value, and to related topics in the mathematical theory of population growth, Demography, 5, 382–409, https://doi.org/10.1007/BF03208583, 1968.
Hamidi, A. R., Novo, P., Paavola, J., and Ford, J. D.: Identifying gaps in research on social vulnerability to floods: a systematic review of indicators, indexes, and methodological approaches, Environ. Res. Lett., 20, 113006, https://doi.org/10.1088/1748-9326/ae1496, 2025.
Hashizume, M., Wagatsuma, Y., Faruque, A. S. G., Hayashi, T., Hunter, P. R., Armstrong, B., and Sack, D. A.: Factors determining vulnerability to diarrhoea during and after severe floods in Bangladesh, J. Water Health, 6, 323–332, https://doi.org/10.2166/wh.2008.062, 2008.
Hassan S. A., Jui, M. A., Al-Mahde, A. E., Islam, T., Juie, I. J., Habiba, U., Rana, M. M., Howlader, M. H., and Rahman, M. A.: Livelihood vulnerability and public health outcomes in south-west coastal regions in Bangladesh, Sustain. Earth Rev., 8, 1–15, 2025.
Hoque, M.: The impact of floods on the livelihood of rural women farmers and their adaptation strategies: insights, Nat. Hazards, 119, 1991–2009, https://doi.org/10.1007/s11069-023-06207-3, 2023.
Hoque, M. A.-A., Tasfia, S., Ahmed, N., and Pradhan, B.: Assessing Spatial Flood Vulnerability at Kalapara Upazila in Bangladesh Using an Analytic Hierarchy Process, Sensors, 19, 1302, https://doi.org/10.3390/s19061302, 2019.
Hossain, B., Sarker, N. I., and Sohel, S.: Flooded lives: socio - economic implications and adaptation challenges for riverine communities in Bangladesh, Int. J. Environ. Sci. Technol., 22, 4407–4422, https://doi.org/10.1007/s13762-024-05943-8, 2025.
Hossain, M. A., Reza, M. I., Rahman, S., and Kayes, I.: Climate Change and its Impacts on the Livelihoods of the Vulnerable People in the Southwestern Coastal Zone in Bangladesh, in: Climate Change and the Sustainable Use of Water Resources, edited by: Leal Filho, W., Springer, Berlin, Heidelberg, 237–258, https://doi.org/10.1007/978-3-642-22266-5_15, 2011.
Hossain, M. Z. and Adhikary, S. K.: Flood Susceptibility Assessment in Southwest Coastal Region of Bangladesh Using an AHP-GIS Based Approach, in: Proceedings of the 6th International Conference on Advances in Civil Engineering (ICACE 2022), edited by: Arthur, S., Saitoh, M., and Hoque, A., Lecture Notes in Civil Engineering, Vol. 368, Springer, Singapore, https://doi.org/10.1007/978-981-99-3826-1_7, 2024.
Islam, N. N.: Public health vulnerability assessment dataset_Dimla, Nilphamari, Bangladesh, figshare [data set], https://doi.org/10.6084/m9.figshare.32209548, 2026.
Islam, S.: An assessment of Women Vulnerability for Flooding Hazard and Socio Economic Condition: A Case Study on Char Gonai of Tepamadhapur Union, Kaunia, Rangpur, Bangladesh, Imp. J. Interdiscip. Res., 3, 211–231, 2017.
Jahan, A. and Edwards, K. L.: A state-of-the-art survey on the influence of normalization techniques in ranking: Improving the materials selection process in engineering design, Mater. Des., 65, 335–342, https://doi.org/10.1016/j.matdes.2014.09.022, 2015.
Jha, R. K. and Gundimeda, H.: An integrated assessment of vulnerability to floods using composite index – A district level analysis for Bihar, India, Int. J. Disast. Risk Re., 30, https://doi.org/10.1016/j.ijdrr.2019.101074, 2019.
Kader, Z., Islam, R., Aziz, T., Hossain, M., Islam, R., and Miah, M.: GIS and AHP - based flood susceptibility mapping: a case study of Bangladesh, Sustain. Water Resour. Manag., 10, 1–18, https://doi.org/10.1007/s40899-024-01150-y, 2024.
Kara, Y.: Measuring the Sustainability of Cities in Turkey with the Analytic Hierarchy Process, Open J. Soc. Sci., 07, 322–334, https://doi.org/10.4236/jss.2019.74025, 2019.
KaTurner, A., Lyle, S., and Tong, S.: Floods and human health: A systematic review, Environ. Int., 1, 37–47, 2019.
Kovats, S., Ebi, K. L., and Menne, B.: Methods of assessing human health vulnerability and public health adaptation to climate change, World Health Organization, Geneva, 111 pp., https://www.euro.who.int/globalchange (last access: 2 July 2026), 2003.
Kundzewicz, Z. W. and Takeuchi, K.: Flood protection and management: Quo vadimus?, Hydrol. Sci. J., 44, 417–432, https://doi.org/10.1080/02626669909492237, 1999.
Kunii, O., Nakamura, S., Abdur, R., and Wakai, S.: The impact on health and risk factors of the diarrhoea epidemics in the 1998 Bangladesh floods, Public Health, 116, 68–74, https://doi.org/10.1038/sj.ph.1900828, 2002.
Lee, D., Ahmadul, H., Patz, J., and Block, P.: Predicting social and health vulnerability to floods in Bangladesh, Nat. Hazards Earth Syst. Sci., 21, 1807–1823, https://doi.org/10.5194/nhess-21-1807-2021, 2021.
Lowe, D., Ebi, K. L., and Forsberg, B.: Factors increasing vulnerability to health effects before, during and after floods, Int. J. Environ. Res. Public Health, 10, 7015–7067, https://doi.org/10.3390/ijerph10127015, 2013.
Matsuyama, A., Khan, F. A., and Khalequzzaman, Md.: Bangladesh Public Health Issues and Implications to Flood Risk Reduction, in: Public Health and Disasters, edited by: Chan, E. Y. Y. and Shaw, R., Disaster Risk Reduction, Springer, Singapore, 115–128, https://doi.org/10.1007/978-981-15-0924-7_8, 2020.
Mondal, M. S. H., Murayama, T., and Nishikizawa, S.: Assessing the flood risk of riverine households: A case study from the right bank of the Teesta River, Bangladesh, Int. J. Disast. Risk Re., 51, 101758, https://doi.org/10.1016/j.ijdrr.2020.101758, 2020.
Mondal, M. S. H., Murayama, T., and Nishikizawa, S.: Determinants of household-level coping strategies and recoveries from riverine flood disasters: Empirical evidence from the right bank of teesta river, Bangladesh, Climate, 9, 1–18, https://doi.org/10.3390/cli9010004, 2021a.
Mondal, M. S. H., Murayama, T., and Nishikizawa, S.: Examining the determinants of flood risk mitigation measures at the household level in Floods are the most common hazard in Bangladesh adversely affecting the lives and livelihoods of millions of riverine people. Flood-affected households adopt a variety, Int. J. Disast. Risk Re., 64, https://doi.org/10.1016/j.ijdrr.2021.102492, 2021b.
Nahar, N., Blomstedt, Y., Wu, B., Kandarina, I., Trisnantoro, L., and Kinsman, J.: Increasing the provision of mental health care for vulnerable, disaster-affected people in Bangladesh, BMC Public Health, 14, https://doi.org/10.1186/1471-2458-14-708, 2014.
NAWG Bangladesh: Bangladesh: Monsoon Floods 2020 Coordinated Preliminary Impact and Needs Assessment, ReliefWeb, https://reliefweb.int/attachments/ff82d05b-09e7-3469-b1bb-507c4d925c9c/nawg_monsoon_flood_preliminary_impact_and_kin_20200725_final_draft.pdf (last access: 2 July 2026), 2020.
Okaka, F. O. and Odhiambo, B. D. O.: Health vulnerability to flood-induced risks of households in flood-prone informal settlements in the Coastal City of Mombasa, Kenya, Nat. Hazards, 99, 1007–1029, https://doi.org/10.1007/s11069-019-03792-0, 2019a.
Okaka, F. O. and Odhiambo, B. D. O.: Households' perception of flood risk and health impact of exposure to flooding in flood-prone informal settlements in the coastal city of Mombasa, Int. J. Clim. Change Strateg. Manag., 11, 592–606, https://doi.org/10.1108/IJCCSM-03-2018-0026, 2019b.
Paterson, D. L., Wright, H., and Harris, P. N. A.: Health risks of flood disasters, Clin. Infect. Dis., 67, 1450–1454, https://doi.org/10.1093/cid/ciy227, 2018.
Philip, S., Sparrow, S., Kew, S. F., van der Wiel, K., Wanders, N., Singh, R., Hassan, A., Mohammed, K., Javid, H., Haustein, K., Otto, F. E. L., Hirpa, F., Rimi, R. H., Islam, A. K. M. S., Wallom, D. C. H., and van Oldenborgh, G. J.: Attributing the 2017 Bangladesh floods from meteorological and hydrological perspectives, Hydrol. Earth Syst. Sci., 23, 1409–1429, https://doi.org/10.5194/hess-23-1409-2019, 2019.
Phung, D., Rutherford, S., Dwirahmadi, F., Chu, C., Do, C. M., Nguyen, T., and Duong, N. C.: The spatial distribution of vulnerability to the health impacts of flooding in the Mekong Delta, Vietnam, Int. J. Biometeorol., 60, 857–865, https://doi.org/10.1007/s00484-015-1078-7, 2016.
Rahman, M., Hiya, H., Auyon, S., and Islam, M.: Exploring the status of disaster risk reduction focusing coping strategies in Rangpur division of Bangladesh, Progress. Agric., 29, 195–204, https://doi.org/10.3329/pa.v29i3.40004, 2018.
Rahman, M. M., Ahmad, S., Mahmud, A. S., Hassan-uz-Zaman, M., Nahian, M. A., Ahmed, A. Nahar, Q., and Streatfield, P. K.: Health consequences of climate change in Bangladesh: An overview of the evidence, knowledge gaps and challenges, Wiley Interdiscip. Rev. Clim. Change, 10, https://doi.org/10.1002/wcc.601, 2019.
Rahman, R. and Salehin, M.: Flood Risks and Reduction Approaches in Bangladesh, in: Disaster Risk Reduction Approaches in Bangladesh, edited by: Shaw, R., Mallick, F., and Islam, A., Disaster Risk Reduction, Springer, Tokyo, https://doi.org/10.1007/978-4-431-54252-0_4, 2013.
Ramin, B. M. and McMichael, A. J.: Climate change and health in sub-Saharan Africa: a case-based perspective, EcoHealth, 6, 52–57, 2009.
Redwan, T. and Shabur, A.: Analyzing the socio-economic factors of adolescent malnutrition in Bangladesh using Best Worst Method, Discov. Sustain., https://doi.org/10.1007/s43621-025-01121-z, 2025.
Rehman, S., Rahaman,M. H., Masroor, M., Roshani, Sajjad, H., Ahmed, R., Yunus, A. P., and Sahana, M.: Analyzing vulnerability of communities to flood using composite vulnerability index: evidence from Bhagirathi Sub-basin, India, Nat. Hazards, 119, 1341–1377, https://doi.org/10.1007/s11069-023-06170-z, 2023.
Rumpa, N. T., Real, H. R. K., and Razi, M. A.: Disaster risk reduction in Bangladesh: A comparison of three major floods for assessing progress towards resilience, Int. J. Disast. Risk Re., 97, https://doi.org/10.1016/j.ijdrr.2023.104047, 2023.
Saaty, T. L.: Analytic Heirarchy Process, Wiley StatsRef Stat. Ref. Online, 1–11, https://doi.org/10.1002/9781118445112.stat05310, 2014.
Saulnier, D. D., Hanson, C., Ir, P., Alvesson, H. M., and von Schreeb, J.: The effect of seasonal floods on health: Analysis of six years of national health data and flood maps, Int. J. Environ. Res. Public. Health, 15, https://doi.org/10.3390/ijerph15040665, 2018.
Schwartz, B. S., Harris, J. B., Khan, A. I., LaRocque, R. C., Sack, D. A., Malek, M. A., Faruque, A. S., Qadri, F., Calderwood, S. B., Luby, S. P., and Ryan, E. T.: Diarrheal epidemics in Dhaka, Bangladesh, during three consecutive floods: 1988, 1998, and 2004, Am. J. Trop. Med. Hyg., 74, 1067–1073, https://doi.org/10.4269/ajtmh.2006.74.1067, 2006.
Shah, A. A., Ye, J., Shaw, R., Ullah, R., and Ali, M.: Factors affecting flood-induced household vulnerability and health risks in Pakistan: The case of Khyber Pakhtunkhwa (KP) Province, Int. J. Disast. Risk Re., 42, https://doi.org/10.1016/j.ijdrr.2019.101341, 2020.
Shah, A. A., Ullah, W., Khan, N. A., Alotaibi, B. A., and Xu, C.: Mapping Rural Household Vulnerability to Flood-Induced Health Risks in Disaster-Stricken Khyber Pakhtunkhwa, Pakistan, Sustain. Switz., 16, 1–21, https://doi.org/10.3390/su162310578, 2024.
Shahid, S.: Probable impacts of climate change on public health in Bangladesh, Asia-Pac. J. Public Health Asia-Pac. Acad. Consort. Public Health, 22, 310–319, https://doi.org/10.1177/1010539509335499, 2010.
Sharker, R., Islam, M. R., Hosen, M. B., Kader, Z., Aziz, M. T., Tahera-Tun-Humayra, U., Hossain, M. A., Pervin, R., Hasan, M., and Roy, A.: GIS-based AHP approach to flood susceptibility assessment in Tangail district, Bangladesh, J. Earth Syst. Sci., 134, https://doi.org/10.1007/s12040-024-02480-3, 2025.
Sharma, S., Das, A., and Bhattacharya, S. P.: Strengthening WASH resilience in flood-affected urban poor communities: Insights from Patna, Cities, 159, https://doi.org/10.1016/j.cities.2025.105758, 2025.
Shim, J. P.: Bibliographical research on the Analytic Hierarchy Process (AHP), Socioecon. Plann. Sci., 23, 161–167, https://doi.org/10.1016/0038-0121(89)90013-X, 1989.
Shimi, A. C., Parvin, G. A., Biswas, C., and Shaw, R.: Impact and adaptation to flood: A focus on water supply, sanitation and health problems of rural community in Bangladesh, Disaster Prev. Manag. Int. J., 19, 298–313, https://doi.org/10.1108/09653561011052484, 2010.
Snehashis, A. and Kumar, B. M.: Flood-Induced Health Vulnerability: A Case Study of Nirmal Char in Murshidabad District, West Bengal, Disaster Adv., 17, 9–16, https://doi.org/10.25303/176da09016, 2024.
Suhr, F. and Steinert, J. I.: Epidemiology of floods in sub-Saharan Africa: a systematic review of health outcomes, BMC Public Health, 22, 1–15, https://doi.org/10.1186/s12889-022-12584-4, 2022.
Sung, C.-H. and Liaw, S.-C.: A GIS-based approach for assessing social vulnerability to flood and debris flow hazards, Int. J. Disast. Risk Re., 46, https://doi.org/10.1016/j.ijdrr.2020.101531, 2020.
Tascón-González, L., Ferrer-Julià, M., Ruiz, M., and García-Meléndez, E.: Social Vulnerability Assessment for Flood Risk Analysis, Water, 12, 558, https://doi.org/10.3390/w12020558, 2020.
Tran, D. N., Doan, V. Q., Nguyen, V. T., Khan, A., Thai, P. K., Cunrui, H., Chu, C., Schak, E., and Phung, D.: Spatial patterns of health vulnerability to heatwaves in Vietnam, Int. J. Biometeorol., 64, 863–872, https://doi.org/10.1007/s00484-020-01876-2, 2020.
Truong, P. M., Le, N. H., Hoang, T. H. D., Nguyen, T. K. T., Nguyen, T. D., Kieu, T. K., Nguyen, T. N., Izuru, S., Le, V. H. T., Raghavan, V., Nguyen, V. L., and Tran, T. A.: Climate Change Vulnerability Assessment Using GIS and Fuzzy AHP on an Indicator – Based Approach, Int. J. Geoinformatics, 19, 39–53, 2023.