
the Creative Commons Attribution 4.0 License.
the Creative Commons Attribution 4.0 License.
 | 17 Jul 2026
Coupled simulation of landslide, tsunami, and ground displacement for the 2017 Nuugaatsiaq event in Greenland
Hideo Aochi
Masumi Yamada
Tung-Cheng Ho
Gonéri Le Cozannet
Arno Christian Hammann
Ruth Mottram
We investigated the entire sequence of the tsunami event caused by a large landslide that occurred on 17 June 2017, in Karrat Fjord near Nuugaatsiaq village in western Greenland, and clarified the sequential processes of this cascading phenomenon. The volume of the landslide was estimated about 44 × 106 m3 based on seismological analysis at seven observation stations across Greenland and an empirical relation. We conducted sequential simulations, consisting of (1) the landslide descent into the fjord based on topography, (2) tsunami generation and large-scale propagation, and (3) ground motion caused by water surface elevation due to the tsunami, considering both static and elasto-dynamic solutions. A 1 m water surface elevation causes ground displacement of up to 0.1–1.0 mm in coastal areas, and this can be detected by seismometers. This event provided a rare chance to verify the integrated model using only local seismic records in the case of no coastal tidal measurement. The timing of simulated processes agrees well with observations, but uncertainties in landslide volume remain a major factor affecting tsunami amplitude and coastal impact. The detailed seismic signals captured both near and far from the epicentre shed light on the multi-stage dynamics of such cascading phenomena. To monitor landslide occurrence and estimate potential tsunamis early, such analyses should be systematically conducted in real time and could be utilized in early warning systems.
- Article
(2434 KB) - Full-text XML
-
Supplement
(1183 KB) - BibTeX
- EndNote


As the climate is warming, coastal and marine-terminated glaciers in Greenland are retreating (e.g., Meredith et al., 2019; Constable et al., 2022). The retreat of marine-terminating glaciers in Greenland has various consequences for coastal biochemistry and ecosystems, including a reduction of nutrients and productivity once these glaciers have retreated inland (Meredith et al., 2019). Moreover, glacier retreat in general has exacerbated the hazards associated with tsunamis: the emergence of new water areas, the release of constraints on nearby unstable slopes, the degradation of permafrost, and reduced freezing conditions all contribute to increased tsunami hazards in fjords depending on the geological context (Higman et al., 2015; Svennevig et al., 2020). In Polar Regions such as Greenland, such hazards can have important social consequences, such as the temporary or permanent relocation of communities (Matti et al., 2023).
The 17 June 2017 landslide took place in the Karrat landslide complex, located on Ummiammakku Mountain in Karrat Fjord, which includes three landslide-prone areas (Schiermeier, 2017; Bessette-Kirton et al., 2018; see also map in Svennevig et al., 2020). The fjord includes several marine-terminating glaciers, but they are located upstream and did not play a role in this specific event. The 2017 event involved 58 million m3 of material, including 45 million m3 reaching the fjord and generating the tsunami (Gauthier et al., 2018). It is important to note that other events took place earlier; at least 3 rock avalanches were identified in 2009, 2016, and 2017 on the Karrat landslide complex using Sentinel 1 & 2, and Landsat imagery (Svennevig et al., 2020). Svennevig et al. (2020) suggest that permafrost thawing due to climate change favours landslides on this type of steep and unstable slope. This type of event represents a threat to human life and has important social consequences. The landslide of 17 June 2017 led to a tsunami, which devastated the village of Nuugaatsiaq 30 km away and subsequently led to the decision to relocate people after the event (Matti et al., 2023).
Greenland's fjords, shaped by glacial erosion, feature steep walls and deep basins, making them particularly vulnerable to landslides and subsequent tsunamis. Typical fjords in Greenland vary in width from a few hundred meters to several kilometres, with depths often exceeding 500 m and lengths of tens to hundreds of kilometres (e.g., Batchelor et al., 2019). The steep topography combined with permafrost degradation increases the likelihood of large-scale mass movements, as seen in the Karrat Fjord landslide of 2017. While detailed statistics on landslides in Greenland remain limited, the risk of similar events has been studied in the Uummannaq fjord system with retreating glaciers and unstable slopes (NGI, 2021). The first recorded tsunami triggered by a landslide is the 1952 Niiortuut landslide-tsunami event (Svennevig et al., 2023), which also had an associated single fatality and is attributed to permafrost degradation in western Greenland. More recently, a tsunamigenic landslide on 16 September 2023 in an uninhabited fjord in East Greenland was also recorded on seismic networks globally (Svennevig et al., 2024; Carrillo-Ponce et al., 2024), while more local records have been found in lake sediments (Korsgaard et al., 2024). Glaciers and permafrost in Greenland have been experiencing a growing mass deficit in response to warming temperatures (Otosaka et al., 2023). There are consequently growing risks associated with climate-induced changes in Greenland's coastal and fjord environments.
This paper aims to demonstrate the potential of seismic monitoring to enhance an alert system on tsunamis along coastal area including fjords. Seismic monitoring has a long history in Greenland (e.g., Dahl-Jensen et al., 2010; Clinton et al., 2014), and the technique has been particularly used for glaciology (Veitch and Nettles, 2012; Walter et al., 2013; Röösli et al., 2014). The calving of icebergs can be recorded and analysed through seismograms (e.g., Sergeant et al., 2016) and geodetic observations, for example (Nettles et al., 2008). Glacial earthquakes have also been detected seismically associated with both the abrupt sliding of fast-moving ice streams as well as icebergs (Joughin et al., 2008). A widespread seismic monitoring system can be used for the early detection of seismic waves brought by an earthquake or a tsunami if the data can be processed and correctly interpreted in near real-time, as the velocity of these seismic waves is faster than the tsunami wave propagation. However, the coastal measurements of seawater level change remain very few. To monitor the tsunami propagation, it is requested to make the most of the seismic data. In this paper, we first analyse the seismic data to estimate the volume of the landslide. Then we perform numerical modelling of the landslide and tsunami using the VolcFlow and FUNWAVE codes. Finally, we model the ground displacement induced by the modelled tsunami in order to compare with the seismic observation recorded at Nuugaatsiaq village (station NUUG). The whole forward modelling process from landslide, tsunami to ground motion will clarify the probable and detectable ground displacement level near the coastline according to the ongoing tsunami propagation. Overall, this paper aims to demonstrate the concept, yet there are limitations discussed in Sect. 4, and further research and developments would be needed before this concept can be effectively applied.
2.1 Seismic station at Nuugaatsiaq (NUUG)
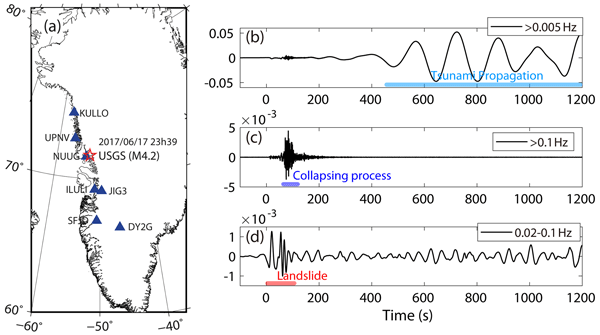
The 17 June 2007 landslide was detected as an earthquake (71.640° N, 52.344° W, 0 km depth) equivalent to a magnitude of 4.2 and the origin time of the event was 23:39:12 UTC (USGS, https://earthquake.usgs.gov/earthquakes/eventpage/us20009nlg/executive, last access: 18 June 2026) (Fig. 1a). The source mechanism has been seismologically studied using the waveform inversions (Poli, 2017; Chao et al., 2018; Xie et al., 2020), and tsunami simulation has been carried out (Chao et al., 2018; Paris et al., 2019). Although there is no direct measurement of water surface elevation during this tsunami event, several videos filmed by the inhabitants are available on YouTube (Underwood, 2017). It is estimated that the tsunami reached 1–1.5 m in height at Nuugaatsiaq and runup flooded up to 9 m in height (Strzelecki and Jaskólski, 2020). It is also reported from the field survey that tsunamis reached as high as 90 m along the coastline on the same side as the landslide and 50 m across the Karrat Fjord near the landslide point (Georgia Institute of Technology, 2017). The seismic station NUUG in Nuugaatisaq (https://ds.iris.edu/ds/nodes/dmc/specialevents/2017/06/22/nuugaatsiaq-greenland-landslide-and-tsunami/, last access: 18 June 2026) recorded the ground motions due to the landslide and probably the following tsunami (Fig. 1). We are particularly interested in the late oscillation (Fig. 1b) seen on a long period range. Chao et al. (2018) considered that this oscillation might have been generated due to the tsunami wave push applied to the coastline in the middle between the tsunami source and NUUG station. Paris et al. (2019) considered that this might have been caused by the quasi-static water surface elevation near NUUG station. In general, the seismographs are useful to detect distant events to determine the source parameters rapidly, as the seismic waves generally propagate with a velocity of 3 km s−1 or higher for S-waves in the crust. On the other hand, tsunami waves may propagate with a velocity of tens to hundreds of m s−1 according to the sea depth, briefly one-tenth of the elastic wave velocity. Thus, this difference in travel time is used to give early warning of tsunami propagation at other locations globally.
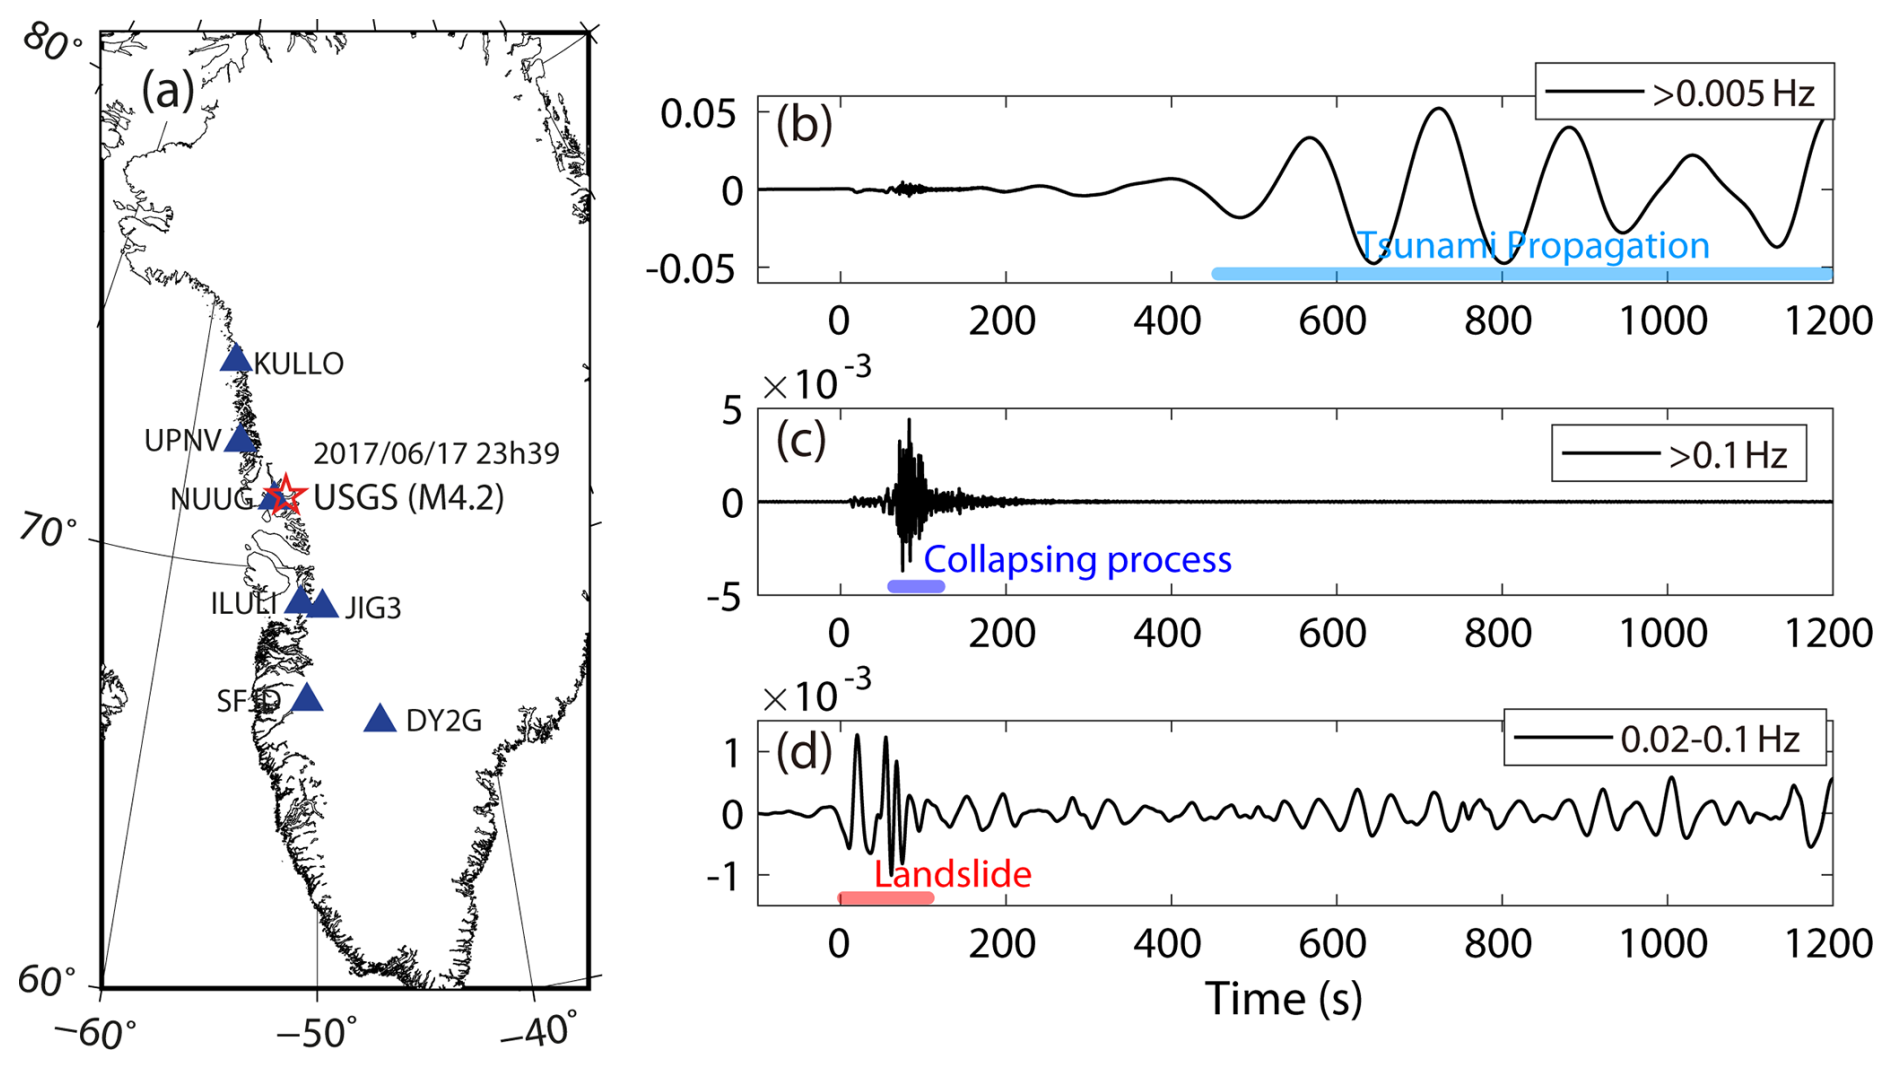
Figure 1Map of the seismic stations and the UD displacement (HHZ component in centimetres) at the NUUG station. The central time zero is set to the origin time (23:39:12 UTC). (a) Map of stations used in this study. The open star shows the epicentre location of the landslide event determined by USGS, and the grey triangles show the seismic stations. (b) high-pass filtered at 0.005 Hz, (c) high-pass filtered at 0.1 Hz, and (d) band-pass filtered at 0.02–0.1 Hz.
Figure 1b, c, and d show the UD displacement at the NUUG station with different frequency bands. We removed the DC offset and linear trend, and applied a taper to the segmented waveform, which included sufficient pre-event and post-event portions. We then corrected for the instrumental response so that the amplitude response becomes flat between 0.005 and 45 Hz. The sensor at the NUUG station is STS-2, which has a flat response between and 50 Hz, so we think that the frequency response after the instrumental correction is reliable. We applied a non-causal 4th order Butterworth filter with different frequency ranges. The top panel shows the high-pass filtered record at 0.005 Hz. It shows a harmonic signal with a period of 150 s starting about 400 s after the origin time of the landslide, which is interpreted as the main tsunami-induced response. The middle panel shows the high-pass filtered record at 0.1 Hz. The high-frequency ground motion succeeding the landslide block movement is commonly observed, but the source of the high-frequency waveforms is not well resolved. Yamada et al. (2013) suggested the internal collision with the returning mass and other complicated processes on the slipping surface, and Doi and Maeda (2020) as well as Yamada et al. (2020) suggested the slide and debris flow. Thus, we interpret this high-frequency waves may be generated by the interaction between the water and landslide mass dropping into the water. The bottom panel shows the band-pass filtered record at 0.02–0.1 Hz that includes the main movement of the landslide and a chain of vibrations of smaller amplitude, which is related to the tsunami propagation.
2.2 Simulation Procedure
The phenomena are complex, including the landslide, tsunami propagation, and seismic wave propagation. However, since each process occurs in distinct domains and time scales, these processes can be modelled sequentially. Figure 2 shows our simulation strategy for the whole phenomenon.
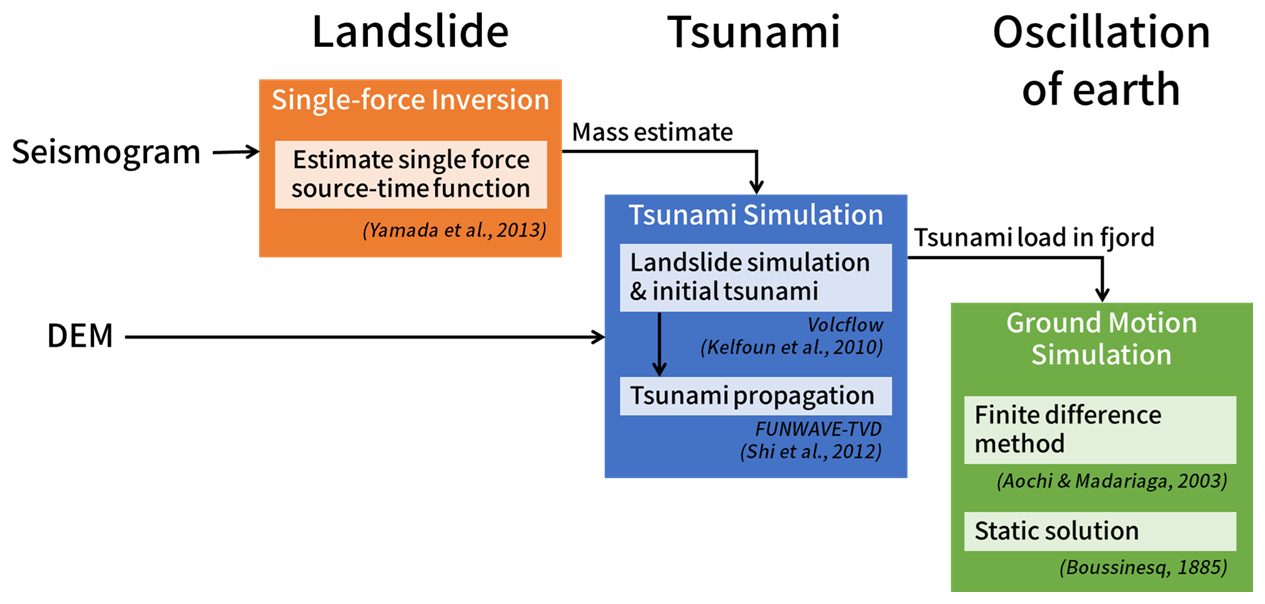
Figure 2Flowchart of the simulation strategy for the landslide-tsunami-ground motion phenomenon.
2.2.1 Single force inversion from seismograms
We start from a purely seismological approach of the single-force inversion with long-period seismic waveforms (e.g., Ekström and Stark, 2013; Yamada et al., 2013). We use the far-field six regional stations in Greenland (Fig. 1a) and then estimate the source time function and mass of the landslide. We removed the closest NUUG station from this inversion since it is too close to apply the point-source approximation. The inversion was performed in the frequency domain with a limited frequency window (Nakano et al., 2008). The source is assumed to be a point source at the location of the landslide (52.34° W, 71.64° N, Depth 0 km). We used the AK135 velocity structure to compute the Green's function (Kennett et al., 1995). The instrumental response was removed, and a 4th-order Butterworth filter with corner frequencies of 0.02–0.1 Hz was applied to the seismic records.
2.2.2 Landslide and tsunami generation and propagation
We perform a landslide tsunami simulation according to Mulia et al. (2020) by coupling the pyroclastic flow model, VolcFlow, with the Boussinesq wave model, FUNWAVE-TVD, using a 2-D numerical grid. We utilize the IBCAO v4.0 digital elevation model from the GEBCO database for both bathymetry and topography. The data are provided in the Polar Stereographic projection coordinates (EPSG:3996, units in meters) with a true scale at 75° N, referenced to the WGS 84 horizontal datum and Mean Sea Level vertical datums. The original 200 m spatial resolution is resampled to 100 m to suit our simulation requirements. We model the generation phase of the landslide tsunami applying VolcFlow, a 2-D depth-averaged numerical model. VolcFlow was originally developed to compute the dynamics and emplacement morphology of avalanches (Kelfoun and Druitt, 2005) and was extended to simulate the dynamics of both the landslide and water (Kelfoun et al., 2010). The model considers the landslide mass and water as two fluids and simulates the dynamics by solving the shallow water equations. This provides a more realistic landslide-induced tsunami initiation than prescribing a static initial water displacement or a rigid body slide. At each simulation time step, tsunami generation is simulated by accounting for the interaction between the landslide and water. The landslide displaces the water through momentum transfer and the elevation of the seafloor by its mass thickness, while the water affects the landslide by reducing the effective mass density underwater and exerting drag on the mass. VolcFlow has been widely applied in various landslide tsunami studies (Giachetti et al., 2011, 2012; Paris et al., 2011; Mulia et al., 2020).
VolcFlow is employed over a duration of 120 s to cover the entire process of landslide and initial tsunami generation. We assume an avalanche density of 2500 kg m−3 and a water density of 1027 kg m−3 to provide realistic environmental parameterization. The landslide source is horizontally covered by an area of 10 × 9 pixels on the 100 m grid, corresponding to a net surface of approximately 1200 m × 580 m along the major and minor axes. In total, 54 grid cells are assigned to the landslide. The numerical precision is influenced not only by the model resolution and grid spacing but also by the landslide source representation and local bathymetry. Considering the long-period nature of tsunami waves and the smoothly resampled topography, the inclusion of a finer grid is expected to have a negligible impact on the simulations.
To incorporate frequency dispersion effects during tsunami propagation, FUNWAVE-TVD is employed to model wave dynamics starting from 120 s onward. This transition time is selected to ensure the landslide-generated waves are fully developed, as VolcFlow results indicate the avalanche ceased at about 120 s. The output velocity field and water elevation from VolcFlow are implemented as boundary conditions in FUNWAVE-TVD. Unlike seismic tsunamis, nearshore landslide tsunamis have wavelengths in the intermediate water depth regime (e.g., wavelength-to-depth ratio ≈ 10). Therefore, frequency dispersion and non-hydrostatic effects should be considered. To resolve these dynamics, FUNWAVE-TVD (Shi et al., 2012) is a fully nonlinear Boussinesq wave model developed from the original FUNWAVE (Wei et al., 1995; Kirby et al., 1998). It resolves strongly nonlinear wave interactions (large wave-height-to-depth ratios) and improves linear dispersion in intermediate water depths by evaluating horizontal velocity at an optimized reference depth. Furthermore, the model employs robust numerical schemes, including wetting-drying treatment and shock-capturing (Shi et al., 2012), that enable stable and efficient simulations. The model has been extensively validated (Wei et al., 1995; Kirby et al., 1998; Shi et al., 2012) and is widely applied to wave propagation, nearshore wave transformation, tsunami inundation, and meteorological tsunamis (Abadie et al., 2012, 2020; Grilli et al., 2013; Kirby et al., 2013, 2016; Schambach et al., 2019; Paris and Ulvrova, 2019; Ho et al., 2023).
2.2.3 Ground motion due to seawater level change
Finally, we estimate the ground displacement at the NUUG station in Nuugaatsiaq. As shown in Fig. 2, we adopt two approaches. One is based on the Boussinesq problem (see Sects. S2 and S3 in the Supplement), which provides the analytical solution in a semi-finite elastic medium due to the vertical charge on the surface (Boussinesq, 1885). This solution or similar analytical solutions in the elastic medium are used for various geoscience applications to estimate the elastic displacement field due to the surface charge and discharge (for example, from ice sheets and glaciers, surface water reservoirs, mining exploitation, etc.) (e.g., Pinel et al., 2007; Bettinelli et al., 2008). On the other hand, we adopt a finite difference method (FDM) for calculating the ground motion in space and time in the elastodynamic equation, where the seismic waves are propagating (e.g., Aochi and Madariaga, 2003). The seismic waves usually propagate at a speed of a few kilometres per second, and the static displacement remains after the passage of the seismic waves. For both approaches, we assume a homogeneous elastic medium with a rigidity μ = 34.1 GPa, corresponding to the S-wave velocity of vs = 3530 m s−1, which is a typical value for crustal bedrock from CRUST1 Global Model of Earth's Crust (Laske et al., 2013). The Boussinesq solution is calculated once per second using the tsunami height at the same time, while the FDM simulation is carried out with a time step of 0.005 s continuously from the beginning of the landslide simulation. The synthetics obtained from FDM are integrated once with respect to time to obtain the displacement.
3.1 Single-force inversion from seismograms
Figure 3 compares the synthetic and observed waveforms at NUUG and JIG3 stations from the single force inversion from seismograms. The synthetic waveforms are computed from the source time function estimated from the waveform inversion, while the NUUG station is not used to constrain the model parameters during the inversion. The detailed result is shown in Sect. S1. The waveform agreement is good at station JIG3 and the other stations. The obtained source time function (top panels of Fig. 3) shows that the horizontal particle motion is dominant in the north-south direction, and the vertical component is larger than the horizontal ones. Based on the vertical component, the duration of the event is about 80 s. The maximum amplitude of the source time function is 0.2 × 10¹² N. According to the scaling law in Ekström and Stark (2013), the mass is estimated as 0.11 × 10¹² kg. Assuming an average rock density of 2.5 × 10³ kg m−3, the total volume is roughly 44 × 106 m3. According to Ekström and Stark (2013), the empirical relationships have a standard deviation of ±50 % in estimation between the maximum force and the mass.
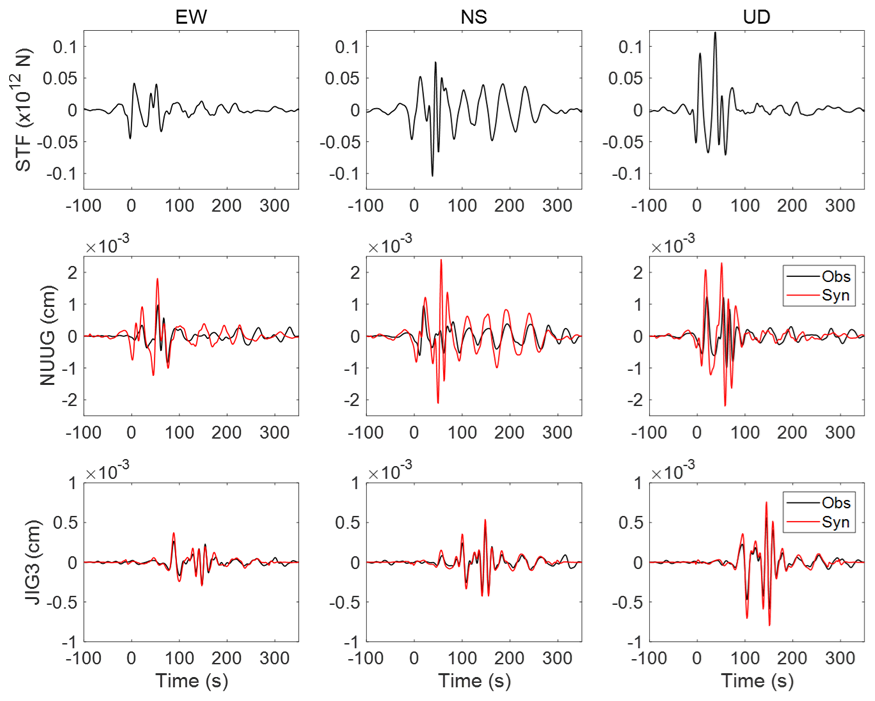
Figure 3Source time function and waveform fitting. The x-axis shows the time after the origin of the landslide. Columns show the EW, NS, and UD components from the left. Top: Source time function obtained from the waveform inversion with the frequency of 0.02–0.1 Hz. Middle: Comparison between the observed (black) and synthetic (red) waveforms at NUUG station, not included in the inversion. Note that the horizontal components at NUUG station were oriented to 79 and 169° from North, so they were rotated correctly. Bottom: Comparison for the JIG3 station used in the inversion.
The synthetic waveforms at the NUUG station also show a good fit. We note a long-period signal at 100–250 s in the NS component, similar to the obtained source time function. The landslide may have been finished in about 100 s, while the signal force inversion detected the beginning of the tsunami generation (100–250 s), which reached up to 90 m locally (Georgia Institute of Technology, 2017). The obtained source time function here is more complex than the previous analyses in the literature (Chao et al., 2018; Xie et al., 2020), inferring the complex process of landslide and tsunami generation.
3.2 Landslide and tsunami generation and propagation
We first used the bathymetry data used in Paris et al. (2019) to independently estimate the landslide volume, and we obtained an estimate of 49.7 × 10⁶ m3, hereafter called the AP model. This is consistent with our seismological estimate (44 × 106 m3) and the originally reported one (∼ 50 × 106 m3) by Paris et al. (2019). However, this is subject to uncertainty between 33.4 and 76 × 106 m3 (Bassette-Kirton et al., 2017; Chao et al., 2018; Gauthier et al., 2018; Paris et al., 2019). Figures 4 and 5 show snapshots of the landslide-induced tsunami generation until 120 s and the tsunami propagation after 120 s for the reference landslide volume (AP model). We observe that the first tsunami wave front arrives in front of NUUG station at about 500 s, and the long-period harmonic wave oscillates until 1000 s. The wave height in front of the NUUG station reaches about 0.7–0.8 m. Later, the tsunami wave field becomes more dissipative due to the multiple reflections, and the tsunami wavelength and width become smaller and more varied.
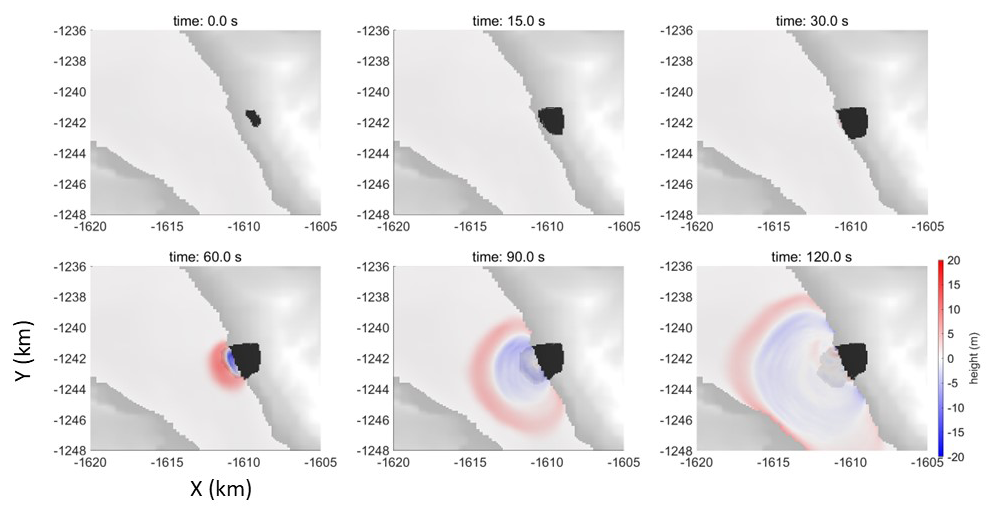
Figure 4Snapshot of the simulation of landslide and tsunami generation. The black area indicates an ongoing landslide on the target slope. The landslide arrives at the sea in around 30 s. The generated tsunami height is shown in the colour scale in meters. The map uses the Polar Stereographic projection coordinates (EPSG:3996, true scale set at 75° N). The map scale is in kilometres.
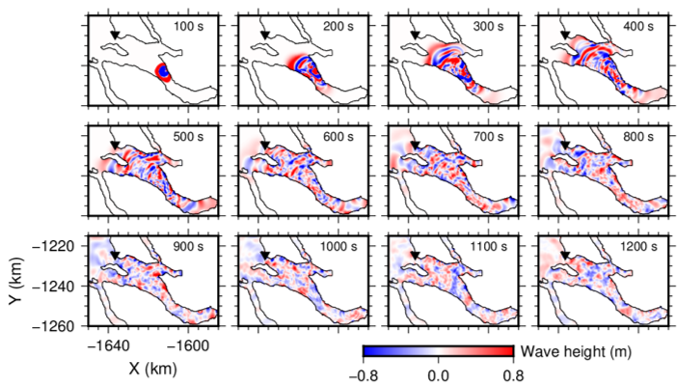
Figure 5Snapshot of tsunami generation and propagation. The white area corresponds to the land above sea level. The triangle shows the position of NUUG. The map coordinates are the same as in Fig. 4.
3.3 Ground displacement due to seawater level change
According to the water surface level change obtained in Fig. 5, we compute the displacement field in an elastic medium. Figure 6 compares the two approaches at the NUUG station position. Additional comparisons for simpler cases are given in Sect. S4. Without a filter, the two estimations are very similar in displacement, allowing to analyse the causality better (Fig. 6a). The travel time of the seismic body waves is about 5–10 s at the distance of 30 km, so the seismic response appears quickly. The first movement appears about 30–40 s, reflecting the timing of the tsunami generation due to the landslide. In the observation record (Fig. 6b), the long-period ground motion generated by the tsunami is much larger than the body waves associated to landslide mass movement. On the filtered ground motions (Fig. 6c), we observe an oscillation amplitude of the static solution (Boussinesq solution) is larger than the dynamic one (FDM), although the observed amplitude is much larger (Fig. 6d). The impact of the tsunami wave approaching the NUUG station becomes apparent after 400 s and periodic (mono frequency) oscillations are observed between 500 and 1200 s. These timings correspond to the passage of the tsunami wave near the station inferred from the snapshot of the tsunami propagation (Fig. 5). The phases between Fig. 6c and d may not be perfectly matched. This is because the time series are aligned at the origin time of the landslide, and the origin of the tsunami generation may not be sufficiently constrained.
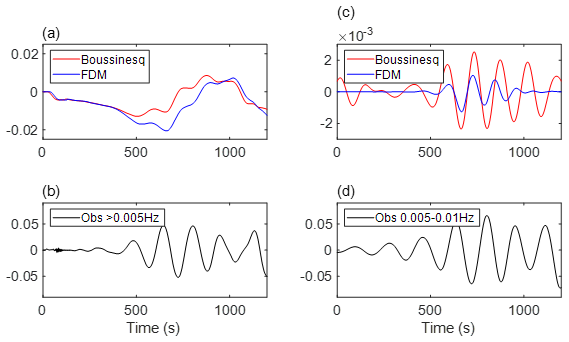
Figure 6Comparison of the surface displacement calculated at Nuugaatsiaq, (x,y) = (−1636.7 km, −1223.4 km). (a) Raw synthetic ground displacement in cm as calculated by the analytical Boussinesq solution and the FDM simulation. (b) Observed ground displacement in cm, lowpass filtered for 0.005 Hz. (c) Filtered synthetic ground displacement in cm from panel (a) at the bandpass window between 0.005 and 0.01 Hz. (d) Observed ground displacement in cm, filtered between 0.005 and 0.01 Hz. Note that the filtered records do not start from zero since we used a non-causal Butterworth filter.
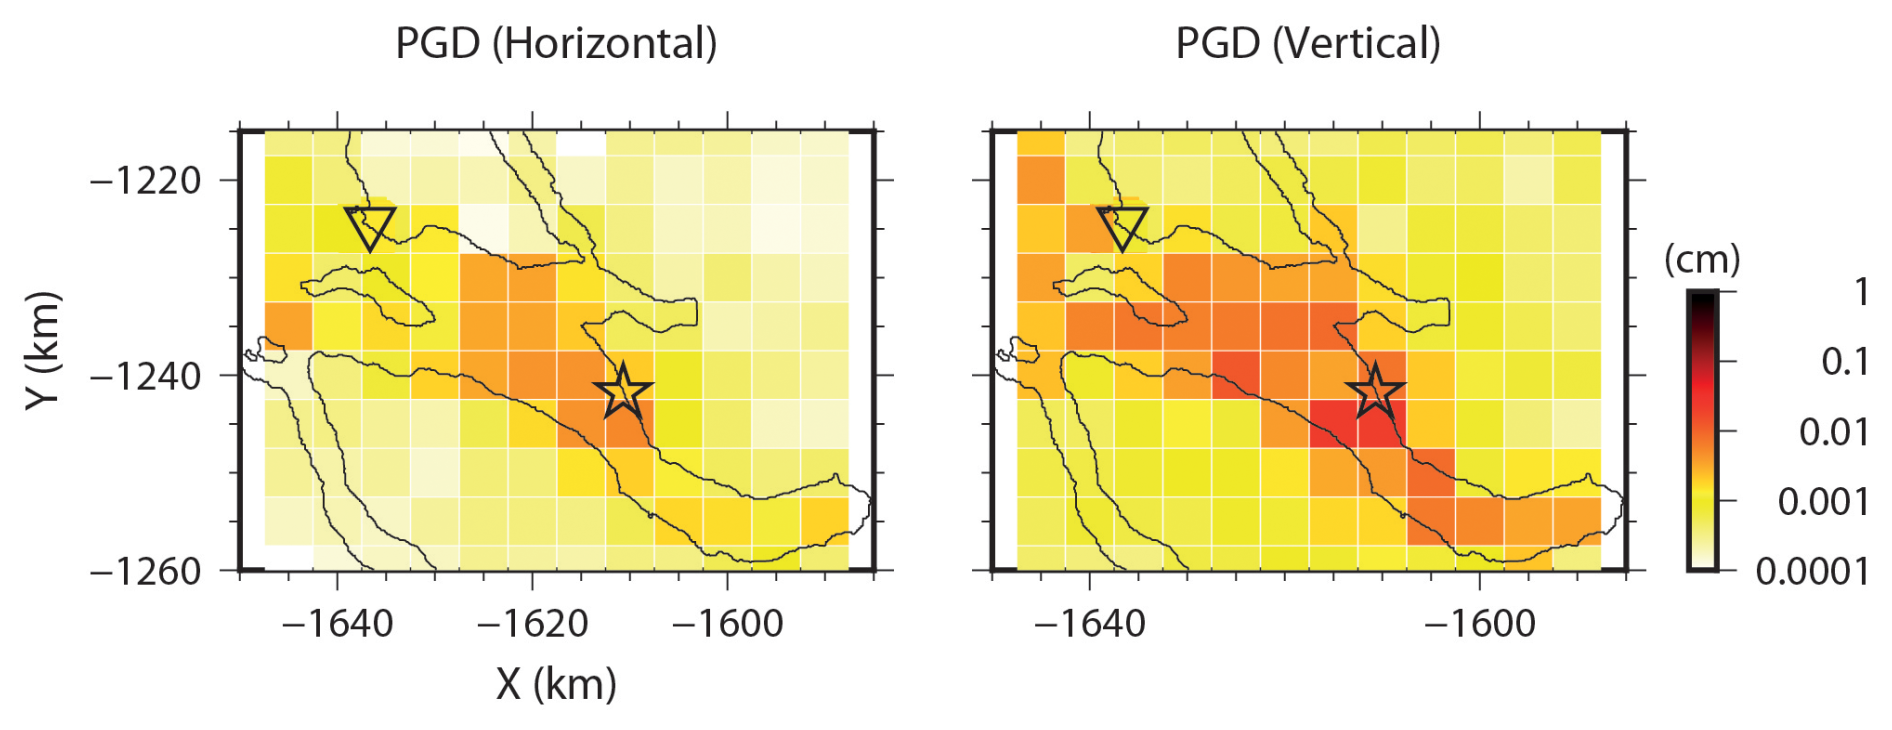
Figure 7Spatial distribution of peak ground displacement (PGD). The synthetics, calculated at the centre of each mesh, are filtered between 0.005 and 0.01 Hz. A star represents the landslide position, and a triangle indicates the position of NUUG. The left and right panels show the horizontal and vertical components, respectively.
Figure 7 presents the spatial distribution of the maximum displacement of the ground surface simulated by FDM. Here we apply a bandpass filter between 0.005 and 0.01 Hz (100–200 s). We find that the vertical component of the ground motion is dominant and larger than the horizontal components. We observe a displacement of up to 0.01 cm along the coastline, attenuating with distance from the coast. We demonstrated here that the tsunami can deform the surrounding solid earth and therefore, the tsunami movement is detectable from a seismic station near the coastline. It should be visible in such a fjord context in which the seawater level changes by an amplitude of 1 m with a wavelength of a few kilometres. The observed ground motions during the passage of the tsunami at NUUG were larger than the simulated ones. This may be due to frequency limitation in the numerical simulations and uncertainty in the model parameters (see next section).
4.1 Uncertainty in amplitude
We have conducted a chain of simulations that connect the occurrence of the landslide and the subsequent generation and propagation of the tsunami to the elastic ground displacement at the site of a seismic station (NUUG), located at a distance of 30 km from the landslide. While the simulated ground motions show good agreement in time with those recorded by the seismic station, the amplitude of the displacements is underestimated.
There are several possible reasons for this underestimation of ground motion amplitude. First, we assumed a quite high rigidity μ of the medium of 34.1 GPa. A lower rigidity is plausible, starting from 10 GPa, which corresponds to vs = 2000 m s−1. As the amplitude is proportional to (see Sect. S2), an up to three times larger response could be expected.
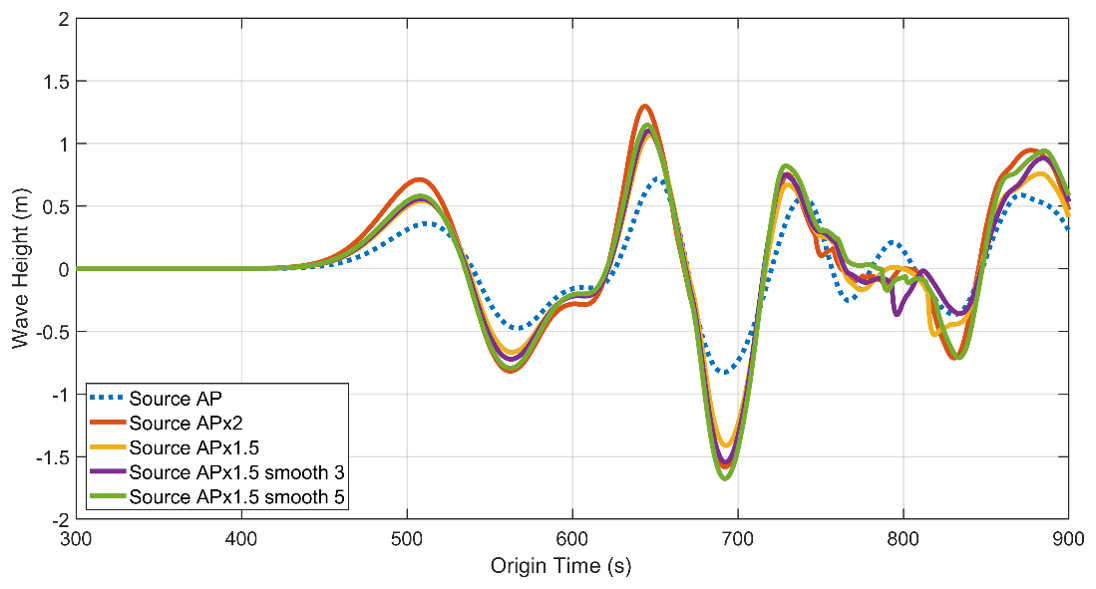
Figure 8Comparison of the simulated coastal water levels during the tsunami passage at Nuugaatsiaq for different model parameters. The parameters and main results of the simulations are given in Table 1.
Table 1Comparison of landslide models and main effects on the resulting simulated tsunamis at Nuugaatsiaq. It is worth noting that our seismological analysis gave an approximate estimation of 44 × 106 m3 for the landslide volume. Smooth 3 and smooth 5 are the averaged values over 3 × 3 or 5 × 5 grids over the original topography. Note that the Water-Reach Time indicates the time when the landslide mass reached the water, and the First-wave time indicates the time of the first negative wave amplitude appearing in the water. Since the tsunami wave height is first positive as seen in Fig. 4, the First wave time is the sum of the Water reach time and half-period of the tsunami.
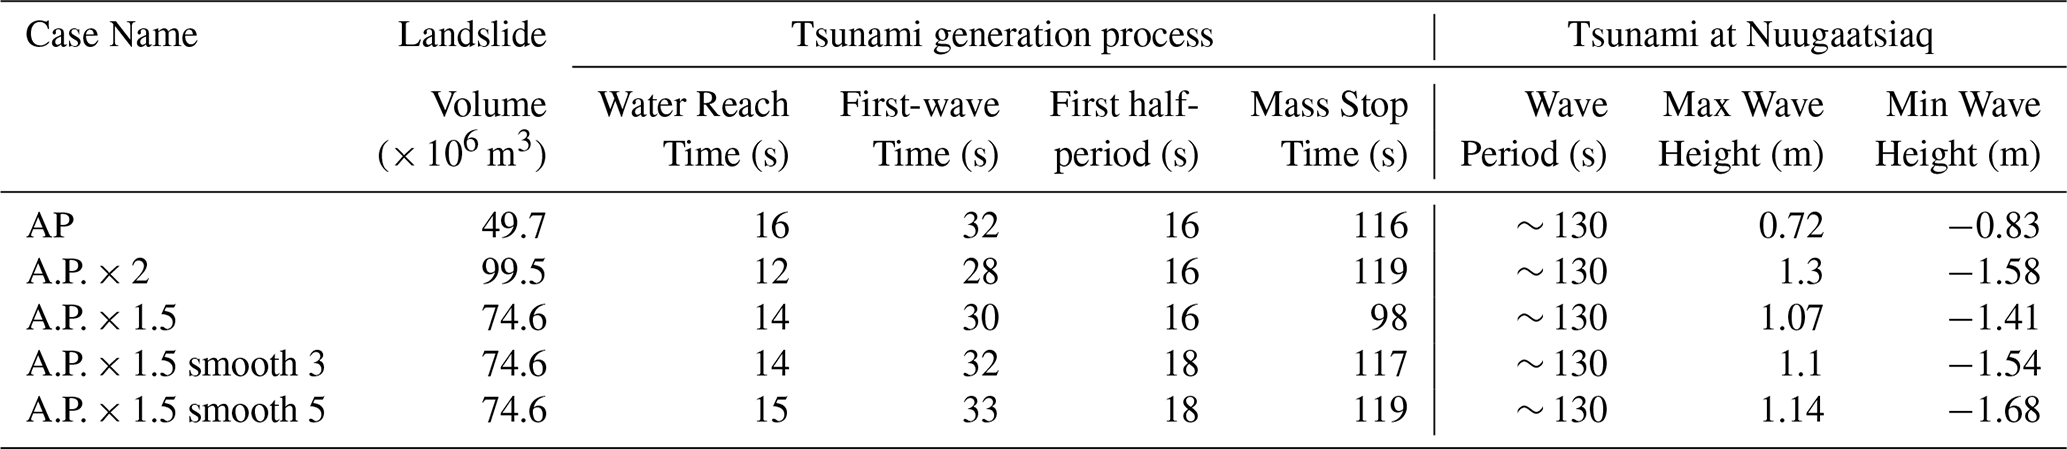
Secondly, the estimation of landslide volume may remain uncertain up to a factor of 2. Let us carry out parameter studies by changing the volume of the landslide (up to twice the AP model) and the topography where the mass slides. Figure 8 compares the seawater level change at Nuugaatsiaq during the tsunami passage for various landslide models (Table 1). The amplitude of water surface elevation at Nuugaatsiaq becomes approximately double (0.8 m in the AP model to 1.6 m in the AP × 2 model). On the other hand, the phase of the water level time series does not change significantly, since the timing of the tsunami generation process (the time when the landslide reaches the water and the first wave is generated) is unchanged. Since ground displacement is proportional to the instantaneous change in water level, an uncertainty factor of two in the water level amplitude implies an equal uncertainty factor in the ground displacement estimation. We also tested the smoothing effect on the topography model (smooth 3 and smooth 5), but found no significant differences in the resulting tsunami generation and propagation.
4.2 Comparison with other tsunami seismograms
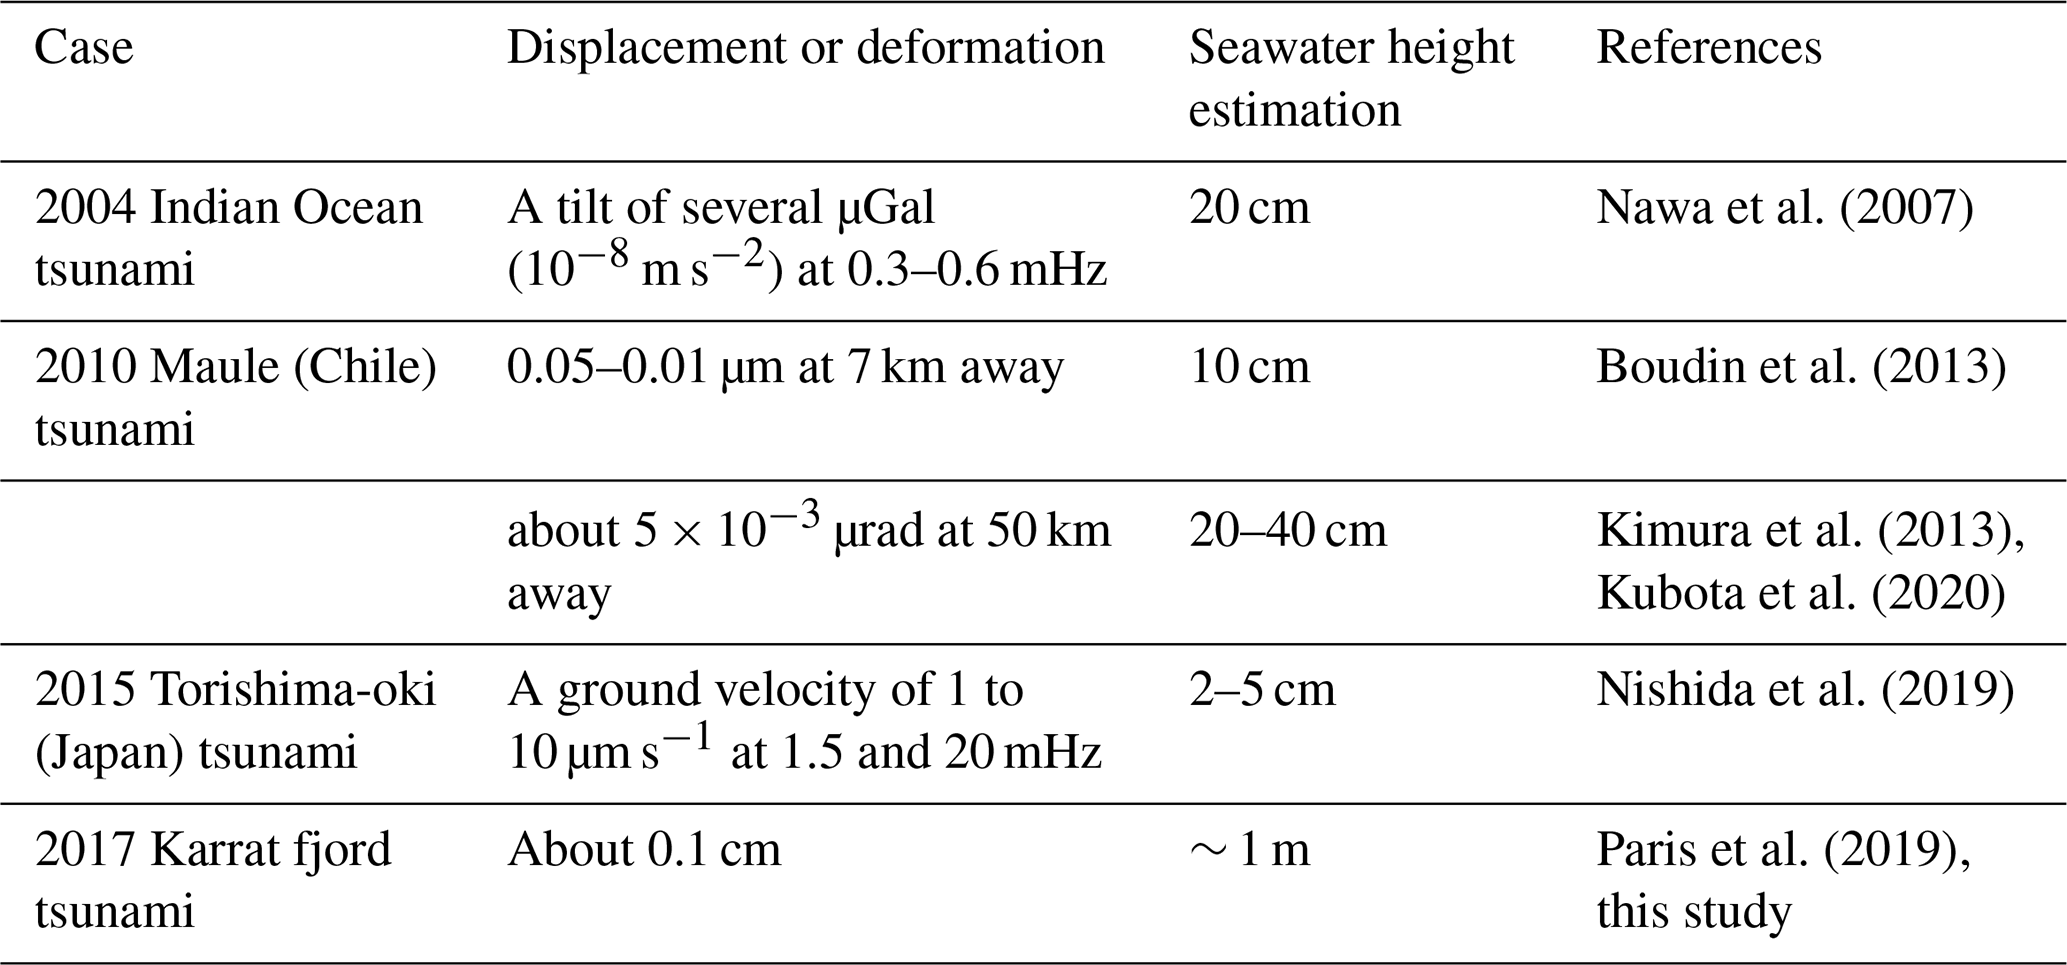
There have been several cases in which the terrestrial geophysical instruments could detect the tsunami propagation. Table 2 lists a few examples of tsunami (or seawater change) observations from the seismograms and tiltmeters. The tiltmeter is very sensitive to a small deformation, and the seawater change of tens of centimetres can be detected at a far distance (50 km). For example, Nawa et al. (2007) analysed the records from pressure gauges and broadband seismometers in Antarctica for signals from the 2004 Indian Ocean tsunami generated by an earthquake in Sumatra. A tilt effect of several µGal (10−8 m s−2) for about 0.2 m of seawater level change was observed at a frequency range between 0.3 and 0.6 mHz. During the 2010 Mw 8.8 earthquake in Maule, Chile, tsunami propagation was detected by tiltmeters along the Chilean coastline (Boudin et al., 2013). The tilt response was about 0.05–0.01 µm at 7 km from the coastline for a water surface elevation of about 10 cm. The same tsunami was observed even along the Japanese coastline (Kimura et al., 2013; Kubota et al., 2020), with water surface level anomalies of about 20–40 cm. This could be observed up to 50 km away from the coastline with about 5 × 10⁻³ µrad. Compared to the past observations, the estimated tsunami height of the 2017 Karrat Fjord event was locally higher, and the seismic station was closer to the coastline (< 1 km). Therefore, the ground oscillation could be clearly observed in broadband seismograms in velocity and displacement without the help of tiltmeters and gravimeters. Our parameter study (Sects. S3–S4) shows that the seawater level should change by 1 m in the surrounding of a few-kilometre area in order to measure a ground displacement of 1 mm or larger. Such a configuration is plausible in fjord environments.
Table 2Summary of tsunami observation by seismograms and tiltmeters.
4.3 Implications for risk management
Cascading risks induced by climate change are explicitly considered in the 6th assessment report (AR6) of the Intergovernmental Panel on Climate Change (IPCC), specifically in the Polar cross-chapter paper of the report of the working group II (Constable et al., 2022). However, the specific issue of tsunamis triggered by increasingly unstable slopes in a context of retreating glaciers is only implicitly considered, as part of a broad range of cascading impacts from climate change. We argue that it is important to recognize and assess this risk due to its potential to become a substantial threat to human life and key infrastructure, especially considering that these cascading risks are also well identified as a gap of knowledge in AR6. In Greenland, mapping of existing landslide deposits in Western Greenland and inhabited parts of eastern Greenland is already underway (Svennevig, 2019). In addition, climate model projections – particularly those identifying areas vulnerable to permafrost thaw, whether currently or in the future – and the location of large calving glaciers provide valuable insights for assessing future hazard risks.
Our results from the parameter studies and the case application demonstrate that the propagation of tsunamis in fjords can be effectively monitored in near real time using seismic data. Analysing the source mechanism of seismic wave radiation allows us to identify landslides and earthquakes (i.e., moment tensor and single force), even if the earthquake location includes uncertainty. This is relevant for Arctic communities living close to fjords as it paves the way for the development of tsunami alert systems. To realize this potential, the concepts presented here should evolve toward an operational system, which requires advanced demonstration in real environments and validation. For example, future applied research and development projects could consist of demonstrating the concept on local sites, including by deploying adequate optical-fibre cables along coastlines. Concurrently, a systematic identification of coastal settlements concerned by this hazard will be essential to assess its importance and the need for alert system deployments. Recent research has made substantial progress in the area of human settlements at risk from permafrost thaw and sea-level rise in the Arctic (Tanguy et al., 2024). Similar efforts could be undertaken to assess the potential of the threat from tsunamis to the settlements identified by Tanguy et al. (2024).
We conducted a comprehensive simulation chain of the cascading tsunami event that occurred on 17 June 2017 in Karrat Fjord, western Greenland. Using seismic records from seven stations across Greenland, we derived a source time function based on a single-force model and estimated the landslide volume (approximately 44 × 106 m3) using empirical relationships. This estimate lies within the range of previously reported values. We then simulated the descent process of the landslide and its interaction with the fjord water, and subsequently reproduced the generation and propagation of the resulting tsunami using available topography and bathymetry data. Ground displacement associated with sea-level changes caused by the tsunami was also modelled and compared with the seismic observations recorded at the NUUG station located along the fjord. This event provided a rare opportunity to validate an integrated modelling framework using only local seismic records, in the absence of direct coastal sea-level measurements. The results show good agreement between the timing of the simulated signals and the observed waveforms, indicating that both the landslide initiation and the subsequent tsunami propagation speed were accurately represented. These findings are consistent with the results of Paris et al. (2019), who analysed the same tsunami event. On the other hand, although the predominant tsunami period was successfully reproduced, the subsequent wave trains lost consistency due to multiple reflections within the fjord. Tsunami amplitudes remain sensitive to uncertainties in the initial landslide volume. Ground displacement calculated using both Boussinesq theory and the 3D finite-difference method showed consistent results, suggesting that the ground displacement response to the sea-level change was largely quasi-static. Simulated vertical displacements reached the millimetre scale for a water surface elevation of 1 m. It should also be noted that filtering seismic records is sensitive at low frequencies. To our best, the filtered observation shown in Fig. 6 seems correctly extracted. Therefore, there remains an important discrepancy, and this is likely because of uncertainties in subsurface rigidity and landslide parameters. Finally, this study demonstrated that tsunami propagation can be traced along the coastline via seismic observations. Coupled modelling – from landslide dynamics to tsunami propagation and seismic response – offers detailed insights into the spatiotemporal evolution of such events. The dominant period between 100 and 200 s is similarly found both in the observation and simulation. The direct observation implies propagating tsunami without inverting any source parameters, so that the target-oriented placement of the captor is reliable for this period. Such an approach can potentially enhance tsunami hazard assessment in fjord environments and contribute to early warning capabilities in the future. Seismic data can constrain not only the landslide parameters but also the tsunami progression in near real-time. Looking ahead, the deployment of the new seismic observation techniques, such as optical-fibre sensing along coastlines or the seafloor, could significantly improve our ability to monitor and understand similar cascading hazards, including glacier-related seismic activity.
Seismic data are available on Orfeus-EPOS (https://www.orfeus-eu.org/data/eida/, last access: 28 January 2025). DEM data are available on GEBCO (https://www.gebco.net/data_and_products/gridded_bathymetry_data/arctic_ocean/, last access: 28 January 2025). VolcFlow is available on https://lmv.uca.fr/volcflow/ (last access: 23 December 2025). FUNWAVE and FUNWAVE-TVD are available on https://fengyanshi.github.io/build/html/index.html (last access: 23 December 2025). The FDM code (Aochi and Madariaga, 2003) is available as https://doi.org/10.5281/zenodo.10225172 (Aochi, 2020).
The supplement related to this article is available online at https://doi.org/10.5194/nhess-26-3291-2026-supplement.
HA, MY, TCH, GLC brought principal conceptualization, and GLC ACH and RM brought the perspective of study. HA, MY and TCH brought data curation, analysis, methodology and validation, and HA and MY finalized visualization. GLC worked for funding acquisition and project administration. HA, MY and GLC prepared the manuscript with contributions from all co-authors. The technical revision was mainly contributed by HA, MY and TCH and the revised manuscript was checked by all the co-authors.
The contact author has declared that none of the authors has any competing interests.
Publisher's note: Copernicus Publications remains neutral with regard to jurisdictional claims made in the text, published maps, institutional affiliations, or any other geographical representation in this paper. The authors bear the ultimate responsibility for providing appropriate place names. Views expressed in the text are those of the authors and do not necessarily reflect the views of the publisher.
This study is a contribution to the PROTECT project in the framework of the European Union's Horizon 2020 research and innovation program under grant agreement 869304. We thank for all the collaborators especially from Asiaq Greenland Survey and Danish Meteorological Institute. We also thank many colleagues from the Geological Survey of Denmark and Greenland (GEUS). We thank Dr. Paris for the use of the dataset and advice on the technical issues and the manuscript. We also thank Dr. Steven Gibbons for his very helpful comments to verify the data and improve the paper. A part of the numerical study has been carried out on the French national supercomputing centre GENCI/TGCC and GENCI/Idris under grants A0150406700 and A0170406700.
This research has been supported by the European Commission, Horizon 2020 Framework Programme (grant no. 869304). The simulations benefit the computational resources from the French national computing center GENCI/TGCC under grants A0150406700 and A0170406700.
This paper was edited by Rachid Omira and reviewed by Alexandre Paris and one anonymous referee.
Abadie, S., Paris, A., Ata, R., Le Roy, S., Arnaud, G., Poupardin, A., Clous, L., Heinrich, P., Harris, J., Pedreros, R., and Krien, Y.: La Palma landslide tsunami: calibrated wave source and assessment of impact on French territories, Nat. Hazards Earth Syst. Sci., 20, 3019–3038, https://doi.org/10.5194/nhess-20-3019-2020, 2020.
Abadie, S. M., Harris, J. C., Grilli, S. T., and Fabre, R.: Numerical modeling of tsunami waves generated by the flank collapse of the Cumbre Vieja Volcano (La Palma, Canary Islands): Tsunami source and near field effects, J. Geophys. Res., 117, C05030, https://doi.org/10.1029/2011JC007646, 2012.
Aochi, H.: Finite difference method code in C for 3D seismic wave propagation by Aochi and Madariaga (2003) (Version v1), Zenodo [code], https://doi.org/10.5281/zenodo.10225172, 2020.
Aochi, H. and Madariaga, R.: The 1999 Izmit, Turkey, earthquake: Non-planar fault structure, dynamic rupture process and strong ground motion, Bull. Seism. Soc. Am., 93, 1249–1266, https://doi.org/10.1785/0120020167, 2003.
Batchelor, C. L., Dowdesell, J. A., Rignot, E., and Millan, R.: Submarine moraines in Southeast Greenland fjords reveal contrasting outlet-glacier behaviour since the last glacial maximum, Geophys. Res. Lett., 46, 3279–3286, https://doi.org/10.1029/2019GL082556, 2019.
Bessette-Kirton, E., Allstadtn K., Pursley, J., and Godt, J.: Preliminary analysis of satellite imagery and seismic observations of the Nuugaatsiaq landslide and tsunami, Greenland, USGS on-line report, https://www.usgs.gov/programs/landslide-hazards/science/preliminary-analysis-satellite-imagery-and-seismic-observations (last access: 18 June 2026), 2017.
Bessette-Kirton, E., Allstadt, K., Pursley, J., and Godt, J.: Preliminary analysis of satellite imagery and seismic observations of the Nuugaatsiaq landslide and tsunami, USGS Landslide Hazards Program, Preliminary Assessments, https://www.usgs.gov/natural-hazards/landslide-hazards/science/preliminary-analysis-satellite-imagery-and-seismic (last accessed: 26 March 2025), 2018.
Bettinelli, P., Avouac, J.-P., Flouzat, M., Bollinger, L., Ramillien, G., Rajeure, S., and Sapkota, S.: Seasonal variations of seismicity and geodetic strain in Himalaya induced by surface hydrology, Earth Planet Sci. Lett., 266, 332–344, https://doi.org/10.1016/j.epsl.2007.11.021, 2008.
Boudin, F., Allgeyer, S., Bernard, P., Hébert, H., Olcay, M., Madariaga, R., El-Madani, M., Vilotte, J.-P., Peyrat, S., Nercessian, A., Schurr, B., Esnoult, M.-F., Asch, G., Nunez, I., and Kammenthaler, M.: Analysis and modelling of tsunami-induced tilt for the 2007, M = 7.6, Tocopilla and the 2010, M = 8.8 Maule earthquakes, Chile, from long-base tiltmeter and broadband seismometer records, Geophys. J. Int., 194, 269–288, https://doi.org/10.1093/gji/ggt123, 2013.
Boussinesq, M. J.: Application des potentiels à l'etude de l'equilibre et du mouvement des solides elastiques – Gauthier-Villars, Paris, 721 pp., 1885.
Carrillo-Ponce, A., Heimann, S., Peterse, G. M., Walter, T. R., Cesca, S., and Dahm, T.: The 16 September 2023 Greenland Megatsunami: Analysis and modeling of the source and a week-long monochromatic seismic signal, Seismic Record, 4, 172–183, https://doi.org/10.1785/0320240013, 2024.
Chao, W.-A., Wu, T. R., Ma, K.-F., Kuo, Y.-T., Wu, Y.-M., Zhao, L., Chung, M. J., Wu, H., and Tsai, Y. L.: The Large Greenland Landslide of 2017: Was a Tsunami Warning Possible?, Seismol. Res. Lett., 89, 1335–1344, https://doi.org/10.1785/0220170160, 2018.
Clinton, J. F., Nettles, M., Walter, F., Anderson, K., Dahl-Jensen, T., Giardini, D., Govoni, A., Hanka, W., Lasocki, S., Lee, W. S., McCormack, D., Mykkeltveit, S., Stutzmann, E., and Tsuboi, S.: Seismic Network in Greenland Monitors Earth and Ice System, Eos, 95, 13–14, https://doi.org/10.1002/2014EO020001, 2014.
Constable, A. J., Harper, S., Dawson, J., Holsman, K., Mustonen, T., Piepenburg, D., and Rost, B.: Cross-Chapter Paper 6: Polar Regions, in: Climate Change 2022: Impacts, Adaptation and Vulnerability. Contribution of Working Group II to the Sixth Assessment Report of the Intergovernmental Panel on Climate Change, edited by: Pörtner, H.-O., Roberts, D. C., Tignor, M., Poloczanska, E. S., Mintenbeck, K., Alegría, A., Craig, M., Langsdorf, S., Löschke, S., Möller, V., Okem, A., and Rama, B., Cambridge University Press, Cambridge, UK and New York, NY, USA, 2319–2368, https://doi.org/10.1017/9781009325844.023, 2022.
Dahl-Jensen, T., Larsen, T. B., and Voss, P. H.: Greenland ice sheet monitoring network (GLISN): a seismological approach, GEUS Bulletin, 20, 55–58, https://doi.org/10.34194/geusb.v20.4956, 2010.
Doi, I. and Maeda, T.: Landslide Characteristics Revealed by High-Frequency Seismic Waves from the 2017 Landslide in Central Japan, Seismol. Res. Lett., 91, 2719–2729, https://doi.org/10.1785/0220200032, 2020.
Ekström, G. and Stark, C. P.: Simple scaling of catastrophic landslide dynamics, Science, 339, 1416–1419, https://doi.org/10.1126/science.1232887, 2013.
Gauthier, D., Anderson, S. A., Fritz, H. M., and Giachetti, T.: Karrat Fjord (Greenland) tsunamigenic landslide of 17 June 2017: initial 3D observations, Landslides, 15, 327–332, https://doi.org/10.1007/s10346-017-0926-4, 2018.
Georgia Institute of Technology: After recon trip, researchers say Greenland tsunami in June reached 300 feet high, https://www.ce.gatech.edu/news/after-recon-trip-researchers-say-greenland-tsunami-june-reached-300-feet-high (last access: 26 March 2025), 2017.
Giachetti, T., Paris, R., Kelfoun, K., and Pérez-Torrado, F. J.: Numerical modelling of the tsunami triggered by the Güimar debris avalance, Tenerife (Canary Islands): Comparison with field-based data, Mar. Geol., 284, 189–202, https://doi.org/10.1016/j.margeo.2011.03.018, 2011.
Giachetti, T., Paris, R., Kelfoun, K., and Ontowirjo, B.: Tsunami hazard related to a flank collapse of Anak Krakatau volcano, Sunda Strait, Indonesia, Geol. Soc. London., 361, 79–90, https://doi.org/10.1144/SP361.7, 2012.
Grilli, S. T., Harris, J. C., Tajalli Bakhsh, T., Masterlark, T. L., Kyriakopoulos, C., Kirby, J. T., and Shi, F.: Numerical simulation of the 2011 Tohoku tsunami based on a new transient FEM co-seismic source: Comparison to far- and near-field observations, Pure Appl. Geophys., 170, 1333–1359, https://doi.org/10.1007/s00024-012-0528-y, 2013.
Higman, B., Shugar, D. H., Stark, C. P., Ekström, G., Koppes, M. N., Lynett, P., Dufresne, A., Haeussler, P. J., Geertsema, M., Gulick, S., and Mattox, A.: The 2015 landslide and tsunami in Taan Fiord, Alaska, Sci. Rep., 8, 12993, https://doi.org/10.1038/s41598-018-30475-w, 2015.
Ho, T. C., Mori, N., and Yamada, M.: Ocean gravity waves generated by the meteotsunami at the Japan Trench following the 2022 Tonga volcanic eruption, Earth Planets Space, 75, 25, https://doi.org/10.1186/s40623-023-01775-x, 2023.
Joughin, I., Howat, I., Alley, R. B., Ekstrom, G., Fahnestock, M., Moon, T., Nettles, M., Truffer, M., and Tsai, V. C.: Ice-front variation and tidewater behavior on Helheim and Kangerdlugssuaq Glaciers, Greenland, J. Geophys. Res., 113, https://doi.org/10.1029/2007JF000837, 2008.
Kelfoun, K. and Druitt, T. H.: Numerical modeling of the emplacement of Socompa rock avalanche, Chile, J. Geophys. Res., 110, B12202, https://doi.org/10.1029/2005JB003758, 2005.
Kelfoun, K., Giachetti, T., and Labazuy, P.: Landslide-generated tsunamis at Réunion Island, J. Geophys. Res., 115, F04012, https://doi.org/10.1029/2009JF001381, 2010.
Kennett, B. L. N., Engdahl, E. R., and Buland, R.: Constraints on seismic velocities in the Earth from traveltimes, Geophys. J. Int., 122, 108–124, https://doi.org/10.1111/j.1365-246X.1995.tb03540.x, 1995.
Kimura, T., Tanaka, S., and Saito, T.: Ground tilt changes in Japan caused by the 2010 Maule, Chile, earthquake tsunami, J. Geophys. Res., 118, https://doi.org/10.1029/2012JB009657, 2013.
Kirby, J. T., Wei, G., Chen, Q., Kennedy, A. B., and Dalrymple, R. A.: FUNWAVE 1.0: fully nonlinear Boussinesq wave model-Documentation and user's manual. CACR-98-06, University of Delaware Center for Applied Coastal Research, Newark, DE, https://csdms.colorado.edu/w/images/Cacr-98-06.pdf (last access: 24 June 2026), 1998.
Kirby, J. T., Shi, F., Tehranirad, B., Harris, J. C., and Grilli, S. T.: Dispersive tsunami waves in the ocean: Model equations and sensitivity to dispersion and Coriolis effects, Ocean Model., 62, 39–55, https://doi.org/10.1016/j.ocemod.2012.11.009, 2013.
Kirby, J. T., Shi, F., Nicolsky, D., and Misra, S.: The 27 April 1975 Kitimat, British Columbia, submarine landslide tsunami: a comparison of modeling approaches, Landslides, 13, 1421–1434, https://doi.org/10.1007/s10346-016-0682-x, 2016.
Korsgaard, N. J., Svennevig, K., Søndergaard, A. S., Luetzenburg, G., Oksman, M., and Larsen, N. K.: Evidence of Middle Holocene landslide-generated tsunamis recorded in lake sediments from Saqqaq, West Greenland, Nat. Hazards Earth Syst. Sci., 24, 757–772, https://doi.org/10.5194/nhess-24-757-2024, 2024.
Kubota, T., Saito, T., Chikasada, N. Y., and Suzuki, W.: Ultrabroadband seismic and tsunami wave observation of high-sampling ocean-bottom pressure gauge covering periods from seconds to hours, Earth Space Science, 7, e2020EA001197, https://doi.org/10.1029/2020EA001197, 2020.
Laske, G., Masters, G., Ma, Z., and Pasyanos, M.: Update on CRUST1.0 – A 1-degree Global Model of Earth's Crust, Geophys. Res. Abstracts, 15, Abstract EGU2013-2658, https://meetingorganizer.copernicus.org/EGU2013/EGU2013-2658.pdf (last access: 24 June 2026), 2013.
Matti, S., Cullen, M., Reichardt, U., and Vigfúsdóttir, A.: Planned relocation due to landslide-triggered tsunami risk in recently deglaciated areas, Int. J. Disast. Risk Re., 86, 103536, https://doi.org/10.1016/j.ijdrr.2023.103536, 2023.
Meredith, M., Sommerkorn, M., Cassotta, S., Derksen, C., Ekaykin, A., Hollowed, A., Kofinas, G., Mackintosh, A., Melbourne-Thomas, J., Muelbert, M. M. C., Ottersen, G., Pritchard, H., and Schuur, E. A. G.: Polar Regions, in: IPCC Special Report on the Ocean and Cryosphere in a Changing Climate, edited by: Pörtner, H.-O., Roberts, D. C., Masson-Delmotte, V., Zhai, P., Tignor, M., Poloczanska, E., Mintenbeck, K., Alegría, A., Nicolai, M., Okem, A., Petzold, J., Rama, B., Weyer, N. M., Cambridge University Press, Cambridge, UK and New York, NY, USA, 203–320, https://doi.org/10.1017/9781009157964.005, 2019.
Mulia, I. E., Watada, S., Ho, T.-C., Satake, K., Wang, Y., and Aditiya, A.: Simulation of the 2018 tsunami due to the flank failure of Anak Krakatau volcano and implication for future observing systems, Geophys. Res. Lett., 47, e2020GL087334, https://doi.org/10.1029/2020GL087334, 2020.
Nakano, M., Kumagai, H., and Inoue, H.: Waveform inversion in the frequency domain for the simultaneous determination of earthquake source mechanism and moment function, Geophys. J. Int., 173, 1000–1011, https://doi.org/10.1111/j.1365-246X.2008.03783.x, 2008.
Nawa, K., Suda, N., Satake, K., Fujii, Y., Sato, T., Doi, K., Kanao, M., Shibuya, K., and Shibuya, K., Loading and gravitational effects of the 2004 Indian Ocean tsunami at Syowa Station, Antarctica, B. Seismol. Soc. Am., 97, S271–S278, https://doi.org/10.1785/0120050625, 2007.
Nettles, M., Larsen, T. B., Elósegui, Hamilton, G. S., Steams, L. A., Ahlstrøm, A. P., Davis, J. L., Andersen, M. L., de Juan, J. Khan, S. A., Stenseng, L., Ekström, G., and Forsberg, R.: Step-wise changes in glacier flow speed coincide with calving and glacial earthquakes at Helheim Glacier, Greenland, Geophys. Res. Lett., 35, L24503, https://doi.org/10.1029/2008GL036127, 2008.
NGI: Hazard scenario simulations and 2017 event hindcast, project report for GEUS, No. 20200823-01-R, https://www.geus.dk/Media/638140441113026078/NGI_20200823-01-R_Tsunami_Karrat.pdf (last access: 26 March 2025), 2021.
Nishida, K., Maeda, T., and Fukao, Y.: Seismic observation of tsunami at Island broadband stations, J. Geophys. Res., 124, 1910–1928, https://doi.org/10.1029/2018JB016833, 2019.
Otosaka, I. N., Shepherd, A., Ivins, E. R., Schlegel, N.-J., Amory, C., van den Broeke, M. R., Horwath, M., Joughin, I., King, M. D., Krinner, G., Nowicki, S., Payne, A. J., Rignot, E., Scambos, T., Simon, K. M., Smith, B. E., Sørensen, L. S., Velicogna, I., Whitehouse, P. L., A, G., Agosta, C., Ahlstrøm, A. P., Blazquez, A., Colgan, W., Engdahl, M. E., Fettweis, X., Forsberg, R., Gallée, H., Gardner, A., Gilbert, L., Gourmelen, N., Groh, A., Gunter, B. C., Harig, C., Helm, V., Khan, S. A., Kittel, C., Konrad, H., Langen, P. L., Lecavalier, B. S., Liang, C.-C., Loomis, B. D., McMillan, M., Melini, D., Mernild, S. H., Mottram, R., Mouginot, J., Nilsson, J., Noël, B., Pattle, M. E., Peltier, W. R., Pie, N., Roca, M., Sasgen, I., Save, H. V., Seo, K.-W., Scheuchl, B., Schrama, E. J. O., Schröder, L., Simonsen, S. B., Slater, T., Spada, G., Sutterley, T. C., Vishwakarma, B. D., van Wessem, J. M., Wiese, D., van der Wal, W., and Wouters, B.: Mass balance of the Greenland and Antarctic ice sheets from 1992 to 2020, Earth Syst. Sci. Data, 15, 1597–1616, https://doi.org/10.5194/essd-15-1597-2023, 2023.
Paris, A., Okal, E. A., Guérin, C., Heinrich, Ph., Schindelé, F., and Hébert, H.: Numerical modeling of the June 17, 2017 Landslide and Tsunami Events in Karrat Fjord, West Greenland, Pageoph, 176, 3035–3057, https://doi.org/10.1007/s00024-019-02123-5, 2019.
Paris, R. and Ulvrova, M.: Tsunamis generated by subaqueous volcanic explosions in Taal Caldera Lake, Philippines, B. Volcanol., https://doi.org/10.1007/s00445-019-1272-2, 2019.
Paris, R., Giachetti, T., Chevalier, J., Guillou, H., and Frank, N.: Tsunami deposits in Santiago Island (Cape Verde archipelago) as possible evidence of a massive flank failure of Fogos volcano, Sediment. Geol., 239, 129–145, https://doi.org/10.1016/j.sedgeo.2011.06.006, 2011.
Pinel, V., Sigmundsson, F., Sturkell, E., Geirsson, H., Einarsson, P., Gudmundsson, M. T., and Högnadóttir, T.: Discriminating volcano deformation due to magma movements and variable surface loads: Application to Katla subglacial volcano, Iceland, Geophys. J. Int., 169, 325–338, https://doi.org/10.1111/j.1365-246X.2006.03267.x, 2007.
Poli, P: Creep and slip: Seismic precursors to the Nuugaatsiaq landslide (Greenland), Geophys. Res. Lett., 44, 8832–8836, https://doi.org/10.1002/2017GL075039, 2017.
Röösli, C., Walter, F., Husen, S., Andrews, L. C., Lüthi, M. P., Catania, G. A., and Kissling, E.: Sustained seismic tremors and icequakes detected in the ablation zone of the Greenland ice sheet, J. Glaciol., 60, 563–575, https://doi.org/10.3189/2014JoG13J210, 2014.
Schambach, L., Grilli, S. T., Kirby, J. T., and Shi, F.: Landslide Tsunami Hazard Along the Upper US East Coast: Effects of Slide Deformation, Bottom Friction, and Frequency Dispersion, Pure Appl. Geophys, 176, 3059–3098, https://doi.org/10.1007/s00024-018-1978-7, 2019.
Schiermeier, Q.: Huge landslide triggered rare Greenland mega-tsunami, Nature, https://doi.org/10.1038/nature.2017.22374, 2017.
Sergeant, A., Mageney, A., Stutzmann, E., Montagner, J.-P., Walter, F., Moretti, L., and Castelnau O.: Complex force history of a calving-generated glacial earthquake derived from broadband seismic inversion, Geophys. Res. Lett., 43, https://doi.org/10.1002/2015GL066785, 2016.
Shi, F., Kirby, J. T., Harris, J. C., Geiman, J. D., and Grilli, S. T.: A high-order adaptive time-stepping TVD solver for Boussinesq modeling of breaking waves and coastal inundation, Ocean Model., 43, 36–51, https://doi.org/10.1016/j.ocemod.2011.12.004, 2012.
Strzelecki, M. C. and Jaskólski, M. W.: Arctic tsunamis threaten coastal landscapes and communities – survey of Karrat Isfjord 2017 tsunami effects in Nuugaatsiaq, western Greenland, Nat. Hazards Earth Syst. Sci., 20, 2521–2534, https://doi.org/10.5194/nhess-20-2521-2020, 2020.
Svennevig, K.: Preliminary landslide mapping in Greenland, GEUS Bulletin, 43, https://doi.org/10.34194/GEUSB-201943-02-07, 2019.
Svennevig, K., Dahl-Jensen, T., Keiding, M., Merryman Boncori, J. P., Larsen, T. B., Salehi, S., Munck Solgaard, A., and Voss, P. H.: Evolution of events before and after the 17 June 2017 rock avalanche at Karrat Fjord, West Greenland – a multidisciplinary approach to detecting and locating unstable rock slopes in a remote Arctic area, Earth Surf. Dynam., 8, 1021–1038, https://doi.org/10.5194/esurf-8-1021-2020, 2020.
Svennevig, K., Keiding, M., Korsgaard, N. J., Lucas, A., Owen, M., Poulsen, M. D., Priebe, J., Sørensen, E. V., and Morino, C.: Uncovering a 70-year-old permafrost degradation induced disaster in the Arctic, the 1952 Niiortuut landslide-tsunami in central West Greenland, Sci. Total Environ., 859, 160110, https://doi.org/10.1016/j.scitotenv.2022.160110, 2023.
Svennevig, K., Hicks, S. P., Forbriger, T., Lecocq, T., Widmer-Schnidrig, R., Mangeney, A., Hibert, C., Korsgaard, N. J., Lucas, A., Satriano, C., Anthony, R. E., Mordret, A., Schippkus, S., Rysgaard, S., Boone, W., Gibbons, S. J., Cook, K. L., Glimsdal, S., Løvholt, F., Van Noten, K., Assink, J. D., Marboeuf, A., Lomax, A., Vanneste, K., Taira, T., Spagnolo, M., De Plaen, R., Koelemeijer, P., Ebeling, C., Cannata, A., Harcourt, W. D., Cornwell, D. G., Caudron, C., Poli, P., Bernard, P., Larose, E., Stutzmann, E., Voss, P. H., Lund, B., Cannavo, F., Castro-Díaz, M. J., Chaves, E., Dahl-Jensen, T., De Pinho Dias, N., Déprez, A., Develter, R., Dreger, D., Evers, L. G., Fernández-Nieto, E. D., Ferreira, A. M. G., Funning, G., Gabriel, A. A., Hendrickx, M., Kafka, A. L., Keiding, M., Kerby, J., Khan, S. A., Dideriksen, A. K., Lamb, O. D., Larsen, T. B., Lipovsky, B., Magdalena, I., Malet, J. P., Myrup, M., Rivera, L., Ruiz-Castillo, E., Wetter, S., and Wirtz, B: A rockslide-generated tsunami in a Greenland fjord rang Earth for 9 days, Science, 385, 1196–1205, https://doi.org/10.1126/science.adm9247, 2024.
Tanguy, R., Bartsch, A., Nitze, I., Irrgang, A., Petzold, P., Widhalm, B., von Baeckmann, C., Boike, J., Martin, J., Efimova, A. Vieira, G., Whalen, D., Heim, B., Wieczorek, M., and Grosse, G.: Pan-Arctic assessment of coastal settlements and infrastructure vulnerable to coastal erosion, sea-level rise, and permafrost thaw, Earths Future, 12, e2024EF005013, https://doi.org/10.1029/2024EF005013, 2024.
Underwood, E.: What precursors foretold Greenland's recent 100-meter tsunami?, Eos, 98, https://doi.org/10.1029/2017EO085499, 2017.
Veitch, S. A. and Nettles, M.: Spatial and temporal variations in Greenland glacial-earthquake activity, 1993–2010, J. Geophys. Res.-Earth, 117, https://doi.org/10.1029/2012JF002412, 2012.
Walter, F., Olivieri, M., and Clinton, J. F.: Calving event detection by observation of seiche effects on the Greenland fjords, J. Glaciol., 59, 162–178, https://doi.org/10.3189/2013JoG12J118, 2013.
Wei, G., Kirby, J. T., Grilli, S. T., and Subramanya, R.: A fully nonlinear Boussinesq model for surface waves. part 1. Highly nonlinear unsteady waves, J. Fluid Mech., 294, 71–92, 1995.
Xie, H. J., Chu, R., and Ni, S.: Relocation of the 17 June 2017 Nuugaatsiaq (Greenland) Landslide based on Green's functions from ambient seismic noises, J. Geophys. Res., 125, e2019JB018947, https://doi.org/10.1029/2019JB018947, 2020.
Yamada, M., Kumagai, H., Matsushi, Y., and Matsuzawa, T.: Dynamic Landslide Processes Revealed by Broadband Seismic Records, Geophys. Res. Lett., 40, 2998–3002, https://doi.org/10.1002/grl.50437, 2013.
Yamada, M., Matsushi, Y., and Matsuzawa, T.: Dynamic movement history of the Iiyama slope failure revealed from seismic data, Eng. Geol., 274, 105696, https://doi.org/10.1016/j.enggeo.2020.105696, 2020.