
the Creative Commons Attribution 4.0 License.
the Creative Commons Attribution 4.0 License.
 | 21 Jul 2026
Marine heatwave amplifies extreme multi-hazards of extratropical cyclone Babet
Piyali Goswami
Ségolène Berthou
Theodore G. Shepherd
Ambrogio Volonté
Sana Mahmood
Juan Manuel Castillo
Anne-Christine Péquignet
Yong-June Park
Mark Worsfold
Regina Rodrigues
Magdalena A. Balmaseda
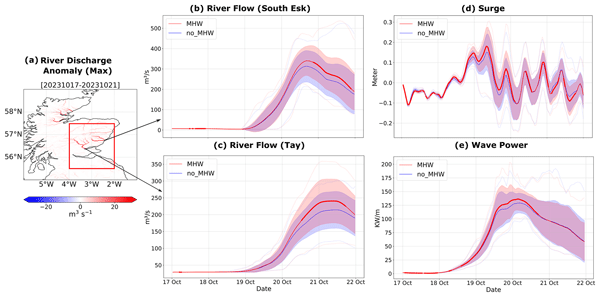
Climate change is increasing marine heatwave (MHW) frequency and intensity and intensifying rainfall from extratropical cyclones. Storm Babet, the United Kingdom's most impactful 2023 extratropical cyclone, followed ∼ 7 weeks of MHW conditions in the North Sea and cooled it by ∼ 1 °C. The storm produced extreme rainfall, widespread flooding, and severe coastal erosion across northern regions of the UK. Its prolonged southeasterly winds generated above 8 m significant wave heights and up to 60 cm surge in the North Sea coastline of the UK. We show the MHW was generated at the surface by persistent anticyclonic conditions: clearer skies boosted shortwave heating, weaker winds reduced mixing and latent cooling. Subsequent short spells of cyclonic conditions allowed heat to penetrate at depth and be retained throughout the depth of the shallow North Sea. Using a state-of-the-art regional coupled model, we assess how pre-existing MHW conditions influenced the storm’s evolution and associated hazards. The warm shelf seas boosted evaporation, energised the boundary layer and deepened the cyclone. Indeed, the fast, relatively dry and cold southeasterly low-level jet saw amplified latent and sensible heat fluxes over the MHW. These extremely intense air-sea fluxes led to the decay of the MHW whilst loading the storm with additional moisture. Relative to a cooler ocean counterfactual, the MHW amplified multihazard outcomes across the Northeast of the UK, increasing river discharge (12 %–18 %), coastal wave power (∼ 9 %), and storm surge (∼ 20 %). These results highlight the role of MHWs as amplifiers of multi-hazard storm impacts over the shallow Northwest European Shelf, where extra ocean heat cannot escape to depth.
- Article
(11384 KB) - Full-text XML
-
Supplement
(10099 KB) - BibTeX
- EndNote


The works published in this journal are distributed under the Creative Commons Attribution 4.0 License. This license does not affect the Crown copyright work, which is re-usable under the Open Government Licence (OGL). The Creative Commons Attribution 4.0 License and the OGL are interoperable and do not conflict with, reduce or limit each other.
© Crown copyright 2026.
Marine heatwaves (MHWs) are periods of anomalously high sea surface temperature (SST) lasting from days to months (Hobday et al., 2016). Their frequency, duration, and intensity have increased significantly over recent decades due to anthropogenic climate change (Frölicher et al., 2018). These events have major consequences for marine ecosystems and fisheries, often triggering habitat loss and species redistribution (Smale et al., 2019; Smith et al., 2023) and sometimes co-occurring with other oceanic extremes such as high acidity and low chlorophyll (Rodrigues et al., 2025). Beyond their ecological effects, MHWs influence the atmosphere by enhancing surface heat and moisture fluxes (Berthou et al., 2024), modifying boundary-layer stability, and altering the development and intensity of weather systems (Choi et al., 2024). While the impacts of MHWs on tropical cyclones and Mediterranean cyclones are increasingly documented (Frölicher et al., 2018; Dzwonkowski et al., 2020; Choi et al., 2024; Jangir et al., 2024), their role in fueling extratropical cyclones, especially at the end of the North Atlantic extratropical track region, remains poorly understood.
The northwest European shelf (NWES) is a shallow continental shelf (depth < 250 m) and has experienced recurrent MHWs in recent years (Chen and Staneva, 2024), raising concerns about their influence for marine ecosystems and regional climate hazards. Observations show that SST around the UK has increased by approximately 0.3 °C per decade since the early 1980s, with the strongest trends exceeding 0.4 °C per decade in the southern North Sea (Cornes et al., 2023a). The frequency of MHWs around the British Isles has also increased by about four additional events per year relative to the late twentieth century, with the highest rise in northern waters. Projections under a high-emission scenario (RCP8.5) indicate that mean SST over the North Sea could be about 3 °C warmer by the end of the century (Cornes et al., 2023a). Recent studies documented the unprecedented MHW of June 2023 over the NWES, linked to persistent anticyclonic conditions and strong solar heating (Berthou et al., 2024; Atkins et al., 2025). Such events highlight the potential for shallow shelf seas to accumulate heat and enhances the potential for MHWs to interact with overlying storms and modify regional climate hazards.
Extratropical cyclones are the primary drivers of winter precipitation, wind, and coastal flooding in northwest Europe (Hawcroft et al., 2018). Rapid attribution studies show that winter storms affecting northwest Europe during the 2023/2024 season produced more precipitation per event due to anthropogenic warming (Kew et al., 2024), consistent with projections from both global and regional climate models. Recent modelling studies indicate that precipitation associated with extratropical cyclones will intensify in a warmer climate, even if the total number of storms declines. Both global and regional simulations show that rainfall in intense cyclones increases with near-surface air temperature at rates close to the Clausius-Clapeyron relation (about 7 % K−1), driven mainly by enhanced atmospheric moisture rather than stronger storm dynamics (Hawcroft et al., 2018; Kodama et al., 2019). Convection-permitting models further suggest an increase in convective activity and heavier rainfall within extratropical cyclones over northern Europe (Berthou et al., 2022).
Despite these advances, most studies have focused on the atmospheric component of storm intensification, while the role of oceanic anomalies, particularly MHWs, remains poorly constrained. The NWES, with its shallow bathymetry and rapid ocean-atmosphere feedbacks, provides a natural testbed for exploring this coupling. Warm sea anomalies can modify surface fluxes and boundary-layer structure, potentially influencing cyclone development, intensity, and precipitation. Understanding these interactions is critical for assessing how current MHWs, representative of future average warming levels, may amplify compound hazards such as extreme rainfall, storm surge, and coastal flooding.
In October 2023, an exceptional MHW persisted over the North Sea for nearly seven weeks before the arrival of Storm Babet, a high-impact extratropical cyclone that caused widespread flooding, coastal erosion, and infrastructure damage across the UK. Storm Babet was among the most intense autumn storms on record for the region, providing a clear case to examine ocean-atmosphere coupling under extreme conditions. This co-occurrence offers an opportunity to quantify the influence of a pre-existing MHW on storm evolution and its associated hazards using a storyline approach (Shepherd, 2016). In this study, we use the Regional Coupled System UKC4 (Berthou et al., 2026) in two modes: first as a constrained regional coupled hindcast system to identify the causal factors leading to the development of the autumn 2023 MHW over the northwest European shelf; and second, as a 5 d regional forecast system run under factual and counterfactual conditions to quantify how the MHW affected the multi-hazard characteristics of Storm Babet. We use the term “counterfactual” here in the causal-inference sense, to refer to a paired experiment without the specific marine heatwave anomaly. Section 2 describes the model configuration, experimental design, and methods used followed by an analysis of the MHW and Storm Babet evolution in Sect. 3. Section 4 quantifies the influence of the MHW on storm intensity and associated hazards, and Sect. 5 discusses the broader implications for compound climate risks.
2.1 Observations
We use in-situ observations from river gauges in Scotland from the Scottish Environment Protection Agency, and significant wave height and wind data from the WAVENET network, oil rigs and buoys maintained by other European countries. Surge data came from the UK National Tide Gauge Network owned and maintained by the Environment Agency. We use the SST data from Operational Sea Surface Temperature and Ice Analysis (OSTIA; Good et al., 2020) for the calculation of MHW and National Climate Information Centre (NCIC; Hollis et al., 2019) daily gridded data for precipitation.
2.2 Backward trajectories in deterministic global forecasts
To determine the origin of air parcels, we use global operational Met Office forecasts starting on the day before the air parcels are started from. The global model allows us to use the Lagrangian Analysis Tool (LAGRANTO, Wernli and Davies, 1997; Sprenger and Wernli, 2015), to compute forward and backward parcel trajectories from gridded winds. LAGRANTO integrates parcel positions with a three-time iterative forward-Euler scheme and an internal step equal to 1/12 of the input interval; we use 3 h inputs (15 min interval), which are standard for synoptic-scale trajectory analyses (Volonté et al., 2020; Rai and Raveh-Rubin, 2023; Deoras et al., 2024). Winds and scalars are linearly interpolated in space and time between forecast fields. The model outputs parcel positions and interpolated diagnostics (e.g. pressure, temperature, specific humidity, potential temperature) at a user-defined (hourly in our case) sampling interval.
2.3 Met Office Regional Coupled System: UKC4
This study utilises the fourth generation of km-scale regional atmosphere-ocean-wave coupled system, as documented in a parallel paper (Berthou et al., 2026), originally described by Lewis et al. (2019). A detailed description of the coupled model can be found in these papers; we summarize the main characteristics here. The domain is centered on the United Kingdom and covers all the Northwest European continental shelf seas, spanning approximately 46–63° N and 19° W–13° E. It operates on a rotated pole coordinate system, with the pole origin positioned at 177.5° longitude and 37.5° latitude. The system is fully coupled, facilitating two-way feedback between its components, which include the Met Office Unified Model (UM) for the atmosphere (Brown et al., 2012), the Joint UK Land Environment Simulator (JULES) for land surface with additional river routing provided by the River Flow Model (Lewis and Dadson, 2021; Berthou et al., 2026), the Nucleus for European Modelling of the Ocean (NEMO) for the ocean (Madec and the NEMO team, 2016), and WAVEWATCH III® for the wave component (Tolman and the WWIII development group, 2014).
2.3.1 UM Regional Atmosphere and JULES Land Component
The regional atmosphere and land configuration RAL2 is used, documented in Bush et al. (2023). This configuration was chosen as it was operational for weather forecasts issued by the Met Office for Storm Babet. The domain is a rotated pole curvilinear grid with variable-resolution, with horizontal grid lengths ranging from 2.2 km in the central domain to 4.4 km in the outer domain, named ENUK domain (Porson et al., 2020).
2.3.2 NEMO Regional Oceanic Component
The ocean component uses the Atlantic Margin Model 1.5 km domain (AMM15) with the Coastal Ocean 8 (CO8) configuration (Graham et al., 2018; Tonani et al., 2019) and employs NEMO version 4.0.4 on a 1.5 km resolution on a curvilinear grid with the same rotated pole as the atmosphere. The vertical discretisation consists of 51 hybrid z-s levels, which means fixed depth levels in the deeper part of the domain, and terrain-following levels in the shallower part, with a transition zone on the shelf-break.
2.3.3 WAVEWATCH III Regional Wave Component
The wave component is based on WAVEWATCH III (WWIII) version 7.12, which has been modified to support coupling exchanges (Castillo et al., 2022). The model grid has a two-tier Spherical Multiple-Cell grid refinement. In the open ocean, grid resolution is approximately 3 km, whereas in coastal regions where the water depth is less than 40 m, resolution increases to 1.5 km to better capture nearshore processes. The timestep for WWIII is 600 s. Wave dynamics are parameterised using the Source Term 4 package (Ardhuin et al., 2010), which accounts for wind-wave interactions, whitecapping dissipation, and swell attenuation.
2.3.4 Coupling Framework
Coupling between these components is achieved through the Ocean-Atmosphere-Sea Ice-Soil (OASIS-MCT) coupler (Valcke, 2013). The atmosphere sends 10 m neutral winds to the wave model and pressure and heat fluxes to the ocean model. The waves then send the surface stress, significant wave height, mean period and Stokes drift to the ocean. The ocean feeds back the temperature and currents to the atmosphere, and the currents and total water depth to the waves. The waves send the Charnock parameter back to the atmosphere. The model is configured with a 1 h coupling frequency. Note the rivers are not fed into the ocean in this particular case; this capability is currently under development.
2.4 Forecast Set Ups for UKC4
In this article, we use UKC4 in two modes: (i) 2 month hindcasts started at 00:00 UTC 21 August 2023 and 21 August 2020, with atmosphere and ocean Lateral Boundaries (LBCs) reset to day 1 global forecasts every day to diagnose the drivers of the 2023 North Sea MHW by following the observed synoptic evolution and contrasting with a near climatological year (2020); (ii) 5 d ensemble forecasts started 00:00 UTC 17 October 2023, with atmospheric LBCs coming from MOGREPS-G global forecasts, and deterministic ocean LBCs from the global Marine Forecasting Centre (GLO-MFC) global ocean model PSY4 for the Atlantic and BAL-MFC for the Baltic Sea boundaries. The ensemble forecasts are used to quantify how the pre-existing MHW modified Storm Babet and its multi-hazards under identical large-scale forcing via a factual (ocean initialised 17 October 2023) and counterfactual (ocean initialised 17 October 2020) pair.
The ensemble setup consists of the 18-member Ensemble-Regional Coupled Suite framework, which integrates the Met Office Global and Regional Ensemble Prediction System over the United Kingdom (MOGREPS-UK, Hagelin et al., 2017; Porson et al., 2020) atmosphere-land ensemble forecast with the regional ocean-wave system. It includes one unperturbed reference simulation and 17 perturbed members, where atmospheric initial and lateral boundary conditions are generated by downscaling perturbations from the global MOGREPS-G system. While the atmospheric component is ensemble-based, the ocean and wave components use deterministic initial and boundary conditions, with coupling handled consistently across all members. The ensemble spread in ocean and waves therefore only grows through coupling. SST perturbations are applied from MOGREPS-G SST perturbations through the OASIS coupler, and only seen by the atmospheric system. They are kept fixed for the whole forecast and they are applied so that their average across all ensemble members is 0 and their maximum amplitude is 2 °C (Tennant and Beare, 2014). These member-indexed SST perturbations are used operationally to correct under-dispersion of near-surface air temperature; they act as spread inflation rather than representing observational SST uncertainty. They are fixed in time and zero-mean across members so that reliability of 2 m temperature is improved without biasing the ensemble mean. It was chosen to keep these perturbations in the coupled system to stay as close as possible to the operational set-up, and to provide a test of robustness. Further technical detail on the ensemble set up is available in Gentile et al. (2022).
Two ensemble 5 d forecast simulations were triggered for Storm Babet, both starting on 17 October 2023. In the MHW experiment, the ocean initial conditions were taken from 17 October 2023, two days before the storm. In the no_MHW experiment, the ocean initial conditions were instead taken from 17 October 2020, chosen as a non-MHW reference state for the same calendar date, while the atmospheric initial conditions and simulation start date remained 17 October 2023. 2020 is chosen as the near-climatological baseline since its SST is closest to the long-term and 2003–2022 climatology across the North Sea region, providing a representative, dynamically consistent ocean state for the no_MHW run (Fig. 1a), and is a year for which an operational forecast is available (2018–now). A prescribed daily climatological SST baseline would represent a different experimental design and was not used here because the coupled forecast requires a physically coherent three-dimensional ocean initial state, which is not available from a climatological reference. The MHW is slightly underestimated compared to the observed anomaly in the North Sea (Fig. 1b, c). We can therefore consider the coupled experiment as a lower estimate of the MHW signal on the storm.
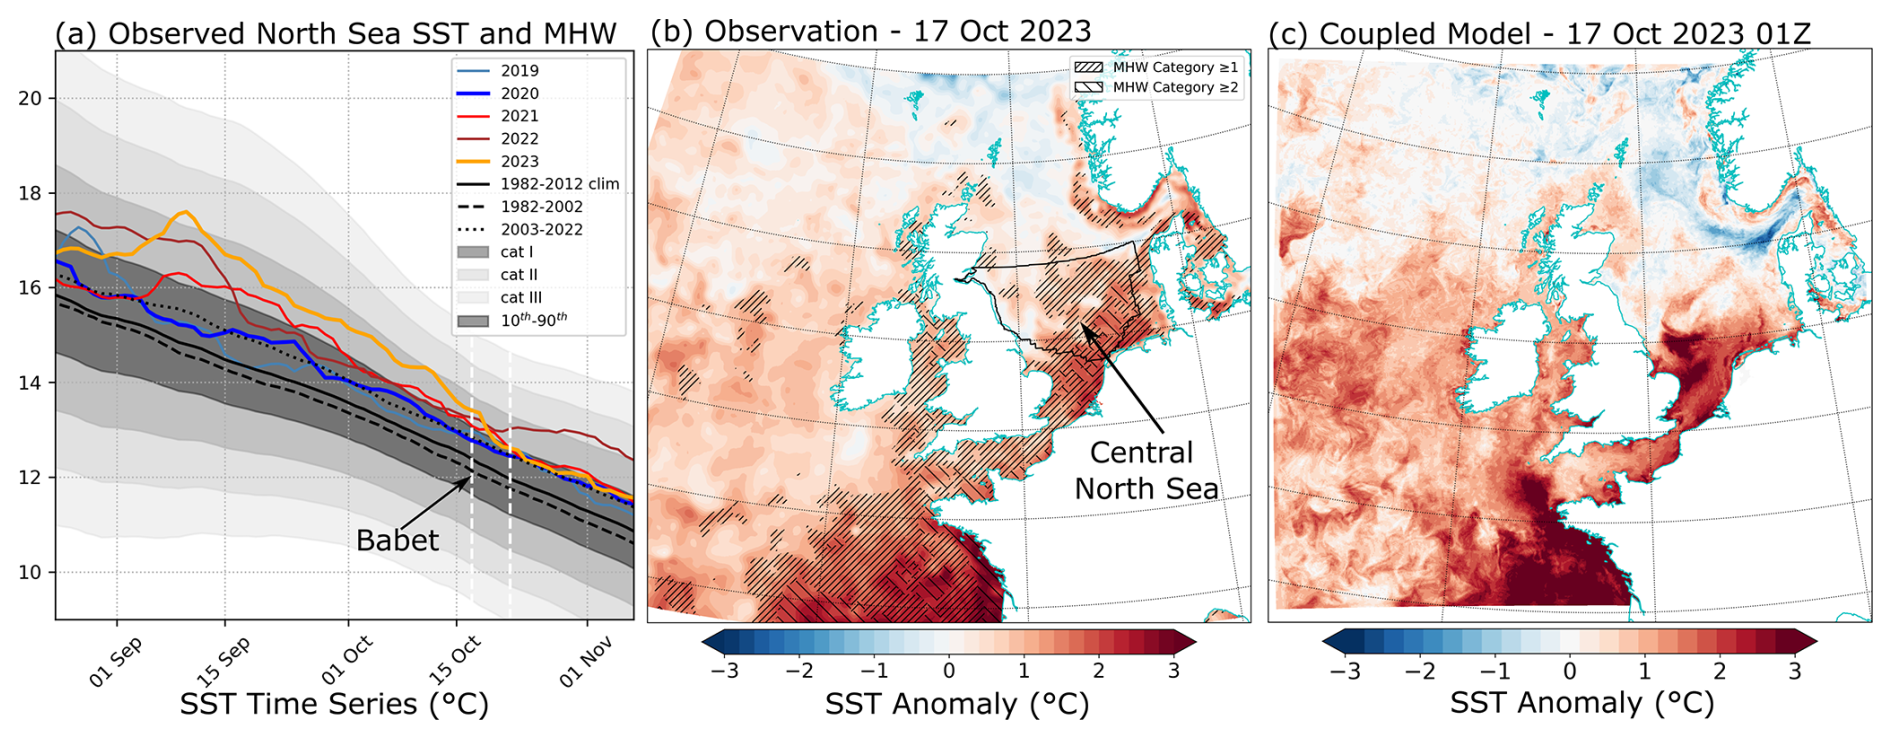
Figure 1(a) SST time series (°C) from the OSTIA dataset averaged over the North Sea. The solid black line is the long term climatology (1982–2012), dashed black line is the climatology of 1982–2002, dotted black line is recent climatology (2003–2022) which is more close to SST of 2020. The white dashed lines show the time window of Storm Babet (b) SST anomaly from 1982–2022 climatology from OSTIA, the black polygon represents Central North Sea (c) SST difference between the 17 October 2023 and 17 October 2020 ocean restarts used in the coupled run.
Although SST perturbations are applied to these runs in order to stay as close as possible to the operational set-up, individual members are perturbed in the exact same way between MHW and no_MHW ensembles, so that the SST difference seen by the atmosphere and shown in Fig. 1c is the same for each member pair, as the inter-ensemble differences reflect only the ocean initialisation.
We analyse two regions: the Central North Sea region (black polygon outlined in Fig. 1b) for the ocean response, and a fixed rectangular precipitation box in northeast Scotland (red rectangle in Fig. 4). Hereafter we refer to this as the Eastern Scotland box [4.0° W, 55.5° N, 2.0° W, 57.5° N].
2.5 Marine heatwave detection
MHWs were detected following Hobday et al. (2016). We use OSTIA daily SST with a fixed climatology over 1982–2011 to compute the seasonally varying 90th-percentile threshold using a ± 11 d moving window. A MHW is defined as ≥ 5 consecutive days above this threshold, with gaps of ≤ 2 d merged. We use the Hobday et al. (2018) scheme to assign categories which reflect event intensity. For category maps (Fig. 1b) we use a rolling 7 d majority (5-of-7) rule: for each grid cell, check the most recent seven days. If at least five of those days show a MHW (category 1 or higher), we plot the cell as MHW and use the category from the most recent day; otherwise we plot category 0.
2.6 Mixed-layer heat budget
To quantify how atmospheric forcing translates into ocean warming, we compute a mixed-layer heat budget on hourly output from the 2023 and 2020 hindcast regional coupled simulations over the Central North Sea (Fig. 2). This region was chosen as a region of homogeneous hydrodynamic regime (Wakelin et al., 2012). For every grid cell in the box, we formed the budget terms and then averaged them over the region. The mixed layer temperature tendency can be expressed as a balance between surface heat fluxes, shortwave radiation penetrating below the surface, entrainment at the base of the mixed layer, and residual processes (advection, diffusion, and unresolved terms) as in Berthou et al. (2024). The governing equation is:
here, the term on the left, , represents the temperature tendency of the surface mixed layer (SML) averaged over hour t. The terms on the right-hand side represent the physical processes driving this change. The first two terms represent the net surface heat flux normalized by the thermal inertia of the SML (ρCph) where ρ is the seawater density (1027 kg m−3), Cp is the specific heat capacity of seawater (3850 JKg−1 °C−1) and h(t) is the SML depth (m). The first term accounts for the depth-dependent absorption of penetrating shortwave (QSW) represented using an exponential decay with an e-folding depth ξsw (15 m) following Paulson and Simpson (1977), and the second term combines the non-penetrating surface fluxes: latent heat (QLH), sensible heat (QSH), and longwave radiation (QLW). The third term quantifies the temperature change due to entrainment at the base of the mixed layer; this term is active only when the SML deepens (), as governed by the Heaviside function, ϵ. It depends on the temperature difference between the SML at the previous timestep, T(t−1), and the temperature of the water being entrained from below, Tdh(t−1). R is a residual term that includes all other processes, such as advection, diffusion and other non-resolved processes.
3.1 Drivers of the autumn 2023 Marine heatwave
To identify the physical drivers responsible for the formation of the 2023 MHW, we contrast the atmospheric and oceanic conditions of that year with the same period in 2020, a year that did not experience a MHW and serves as a near-climatological reference. The analysis is focused on the Central North Sea region, which the storm air streams crossed before hitting Scotland.
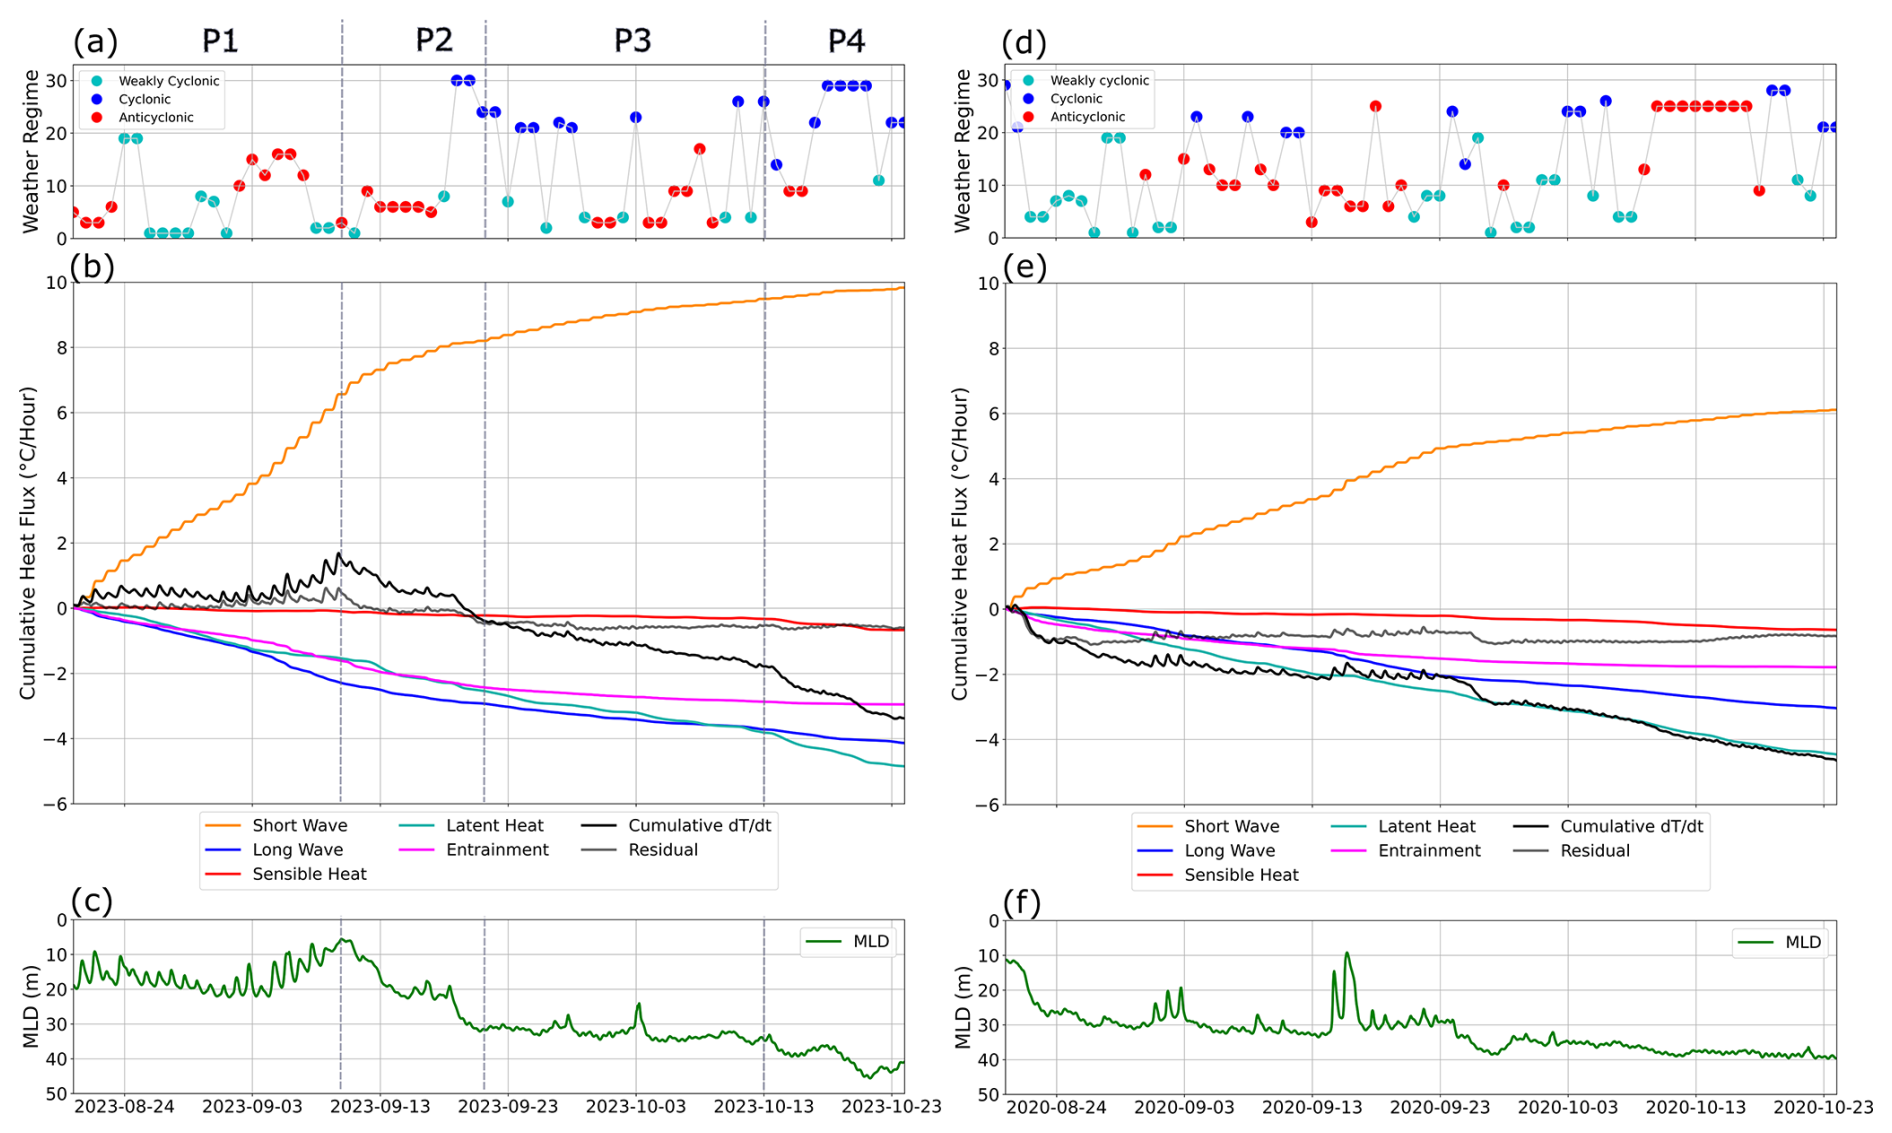
Figure 2Atmospheric and oceanic drivers of 2023 MHW (left column, a–c) contrasted with conditions during the same period in the non-MHW year of 2020 (right column, d–f). The top panels show the evolution of the synoptic weather regime using a 30 regime classification for Northwest Europe (Neal et al., 2016); coloured by regime category: Weak (cyan), Low (blue), and High (red) (a, d). The middle panels show the cumulative heat flux tendency components in °C h−1 (b, e), including Shortwave (orange), Longwave (blue), Sensible Heat (red), Latent Heat (cyan), Entrainment (magenta), and a Residual (grey) term. The net cumulative temperature tendency (Cumulative ) is shown in black. The bottom panels show the MLD in m (c, f).
The primary catalyst for the MHW was a sequence of persistent atmospheric anticyclonic weather regimes in September 2023. Weather regimes between 1 and 10 correspond to weak circulation, more typical of summer, while regimes between 20 and 30 represent strong circulation, more typical in winter, and regimes 10–20 are intermediate, most frequent in autumn and spring (Neal et al., 2016). As shown in Fig. 2a, the period leading up to and during the MHW's peak (20 August–20 September) was dominated by regimes 1, 3, 6, 12, 16 which are all characterised by weak winds, and most with anticyclonic conditions over the North Sea. High-pressure systems (anticyclonic conditions) suppress cloud formation and reduce wind speeds, favouring MHWs (Berthou et al., 2024). The prolonged presence of these regimes created an extended window of clear skies and calm seas, maximizing the amount of solar radiation reaching the ocean surface. In contrast to 2023, the atmospheric conditions in 2020 (Fig. 2d) were characterised by variable weather regimes, with many occurrences of weather regimes above 10 and 20, with stronger winds. The frequent shifts between different patterns resulted in more unsettled weather with greater cloud cover and higher wind speeds, which intermittently limited the solar energy input to the surface mixed layer of the ocean.
The heat budget analysis of the two periods shows that the 2023 MHW was driven by a strong and sustained net heat gain in a shallow mixed layer. The event's evolution can be broken down into four distinct phases which are labeled P1–P4 in Fig. 2.
The initial phase of rapid formation (P1), occurring from approximately late August to September 8th, was initiated by persistent high-pressure weather regimes (3, 6, 16) or a weak circulation weather regime (1). This delivered an intense accumulation of shortwave radiation (orange line), creating a potential warming of +7 °C over the event's full duration. This forcing was critically amplified by a pre-conditioned shallow mixed layer depth (MLD) of only 5–20 m (Fig. 2c). The MLD, shown in panels (c) and (f), represents the upper ocean layer where temperature, salinity and density are relatively uniform due to turbulent mixing. It acts as the ocean's immediate heat reservoir, determining the volume of water over which the net surface heat gain or loss is distributed. This shallow layer concentrated the heat gain near the surface, and with minimal entrainment cooling during this period, the cumulative temperature tendency rose sharply (+1.8 °C).
The second phase (P2), lasting until 21 September, marked a transition where the rate of warming decelerated, as the anomaly deepened. Although strong solar input continued, significant cooling fluxes began to more effectively counteract it. The most critical change was the onset of substantial entrainment cooling (magenta line) as the mixed layer deepened from 8 to 30 m, which worked in concert with slow ongoing latent heat and longwave radiation losses. The mixed layer deepening was due to stormy conditions (weather regime 30) on 19–20 September. This mixing phase culminated around 21 September, when the heat budget was momentarily balanced (Cumulative ). This caused the reduction in intensity of the surface MHW in mid-September when the SST anomaly was approximately +1.5 °C above the climatological mean (Fig. 1a), but more importantly, it meant that the excess-heat anomaly deepened, storing heat below the surface in the North Sea and increasing the upper-ocean heat content available later in the season. This behaviour is consistent with glider observations (Figs. S1–S2 in the Supplement), supporting confidence in the model's vertical temperature structure.
Subsequently, the MHW transitioned into a prolonged phase of persistence (P3), lasting from late September through mid-October. This stage was characterized by a slow but steady net heat loss, as indicated by the gentle downward slope of the cumulative temperature tendency (Fig. 2b). This stability occurred as the deep mixed layer prevented entrainment cooling from below, while changes in weather pattern simultaneously suppressed the primary heating from solar radiation. With both major heating and cooling dynamics neutralized, the MHW's very slow decay was governed primarily by the persistent surface cooling from latent and longwave fluxes, allowing it to maintain a high intensity for nearly a month.
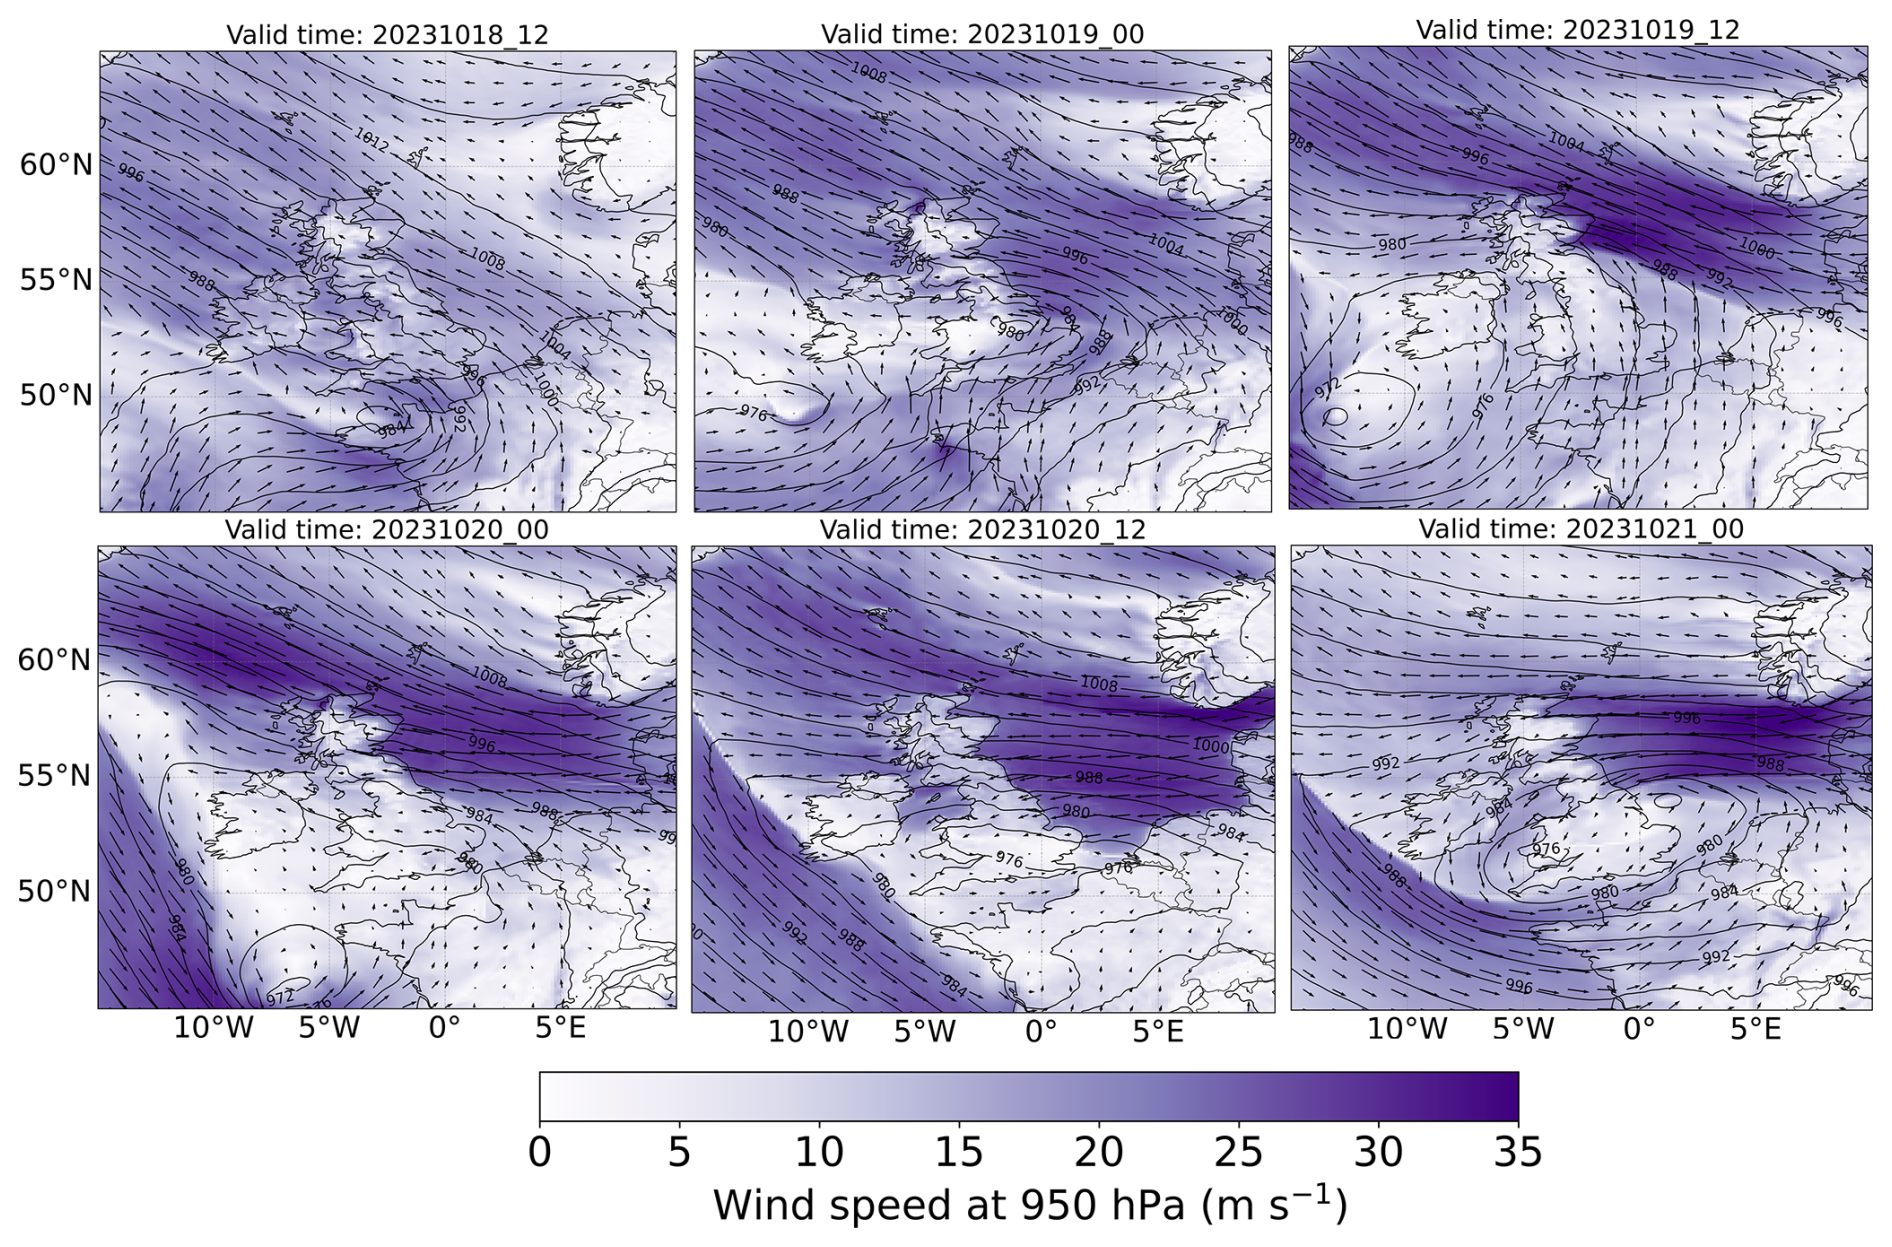
Figure 3Synoptic evolution of Storm Babet shown via 12 h forecast fields at selected times from 18 to 21 October 2023. Shading shows wind speed at 950 hPa (m s−1), arrows show wind direction, and contours show mean sea-level pressure (hPa). The figure highlights the development of the storm and the persistent southeasterly flow over the North Sea prior to the heaviest rainfall over eastern Scotland.
The prolonged period of persistence in P3 was brought to an abrupt end by Storm Babet around 20 October. It was triggered by a rapid cooling dominated by surface heat fluxes. In the shallow (40–50 m) Central North Sea, the water column was already well-mixed in P2, making entrainment a negligible factor. Instead, the storm’s intense winds drove a large increase in latent heat flux, forcing a rapid loss of heat from the sea surface to the atmosphere. This efficient heat extraction quickly dissipated the remaining thermal anomaly throughout the water column, bringing the MHW to a conclusion.
The 2020 period provides a climatological example. The weaker shortwave radiation input provided a more modest potential warming of only +4.5 °C for the same period. This energy gain was more than compensated for by the combined cooling effects of latent heat (−2.5 °C), longwave radiation (−2 °C), and entrainment (−1.5 °C) resulting in a net cooling of approximately −2 °C.
In summary, the 2023 MHW was the result of a synergistic combination of factors: persistent high-pressure weather regimes delivered an anomalous amount of solar radiation to the ocean, and anomalously weak winds favoured a shallow mixed layer, which trapped this heat at the surface, amplifying the increased solar radiation effect. The absence of this atmospheric forcing and oceanic susceptibility in 2020 prevented MHW formation and instead led to a net cooling of the surface ocean, more typical of September and October in this region.
3.2 Storm Babet multi-hazards and performance of the coupled ensemble forecast
The synoptic development of Storm Babet (Fig. 3) was characterized by the interaction of two low-pressure systems and a blocking high-pressure area over Scandinavia. This configuration prevented the storm from progressing eastwards, resulting in a strong pressure gradient and sustained southeasterly flow over the North Sea lasting over 48 h.
The storm brought exceptional rainfall to parts of eastern Scotland, with 150 to 200 mm falling in the wettest areas (Fig. 4a). This was favoured by the persistent southeasterly flow (Fig. 3), which transported moist air across the North Sea towards eastern Scotland and its topography. The Met Office issued two red warnings for rain (Kendon, 2023; Kendon et al., 2024). Heavy, persistent and widespread rain also affected much of England, Wales and Northern Ireland from 18–20 October, with 100 mm falling fairly widely across the UK (Fig. 4a). The storm also brought some very strong winds, with gusts over 50 Knots (58 mph) across north-east England and much of Scotland.
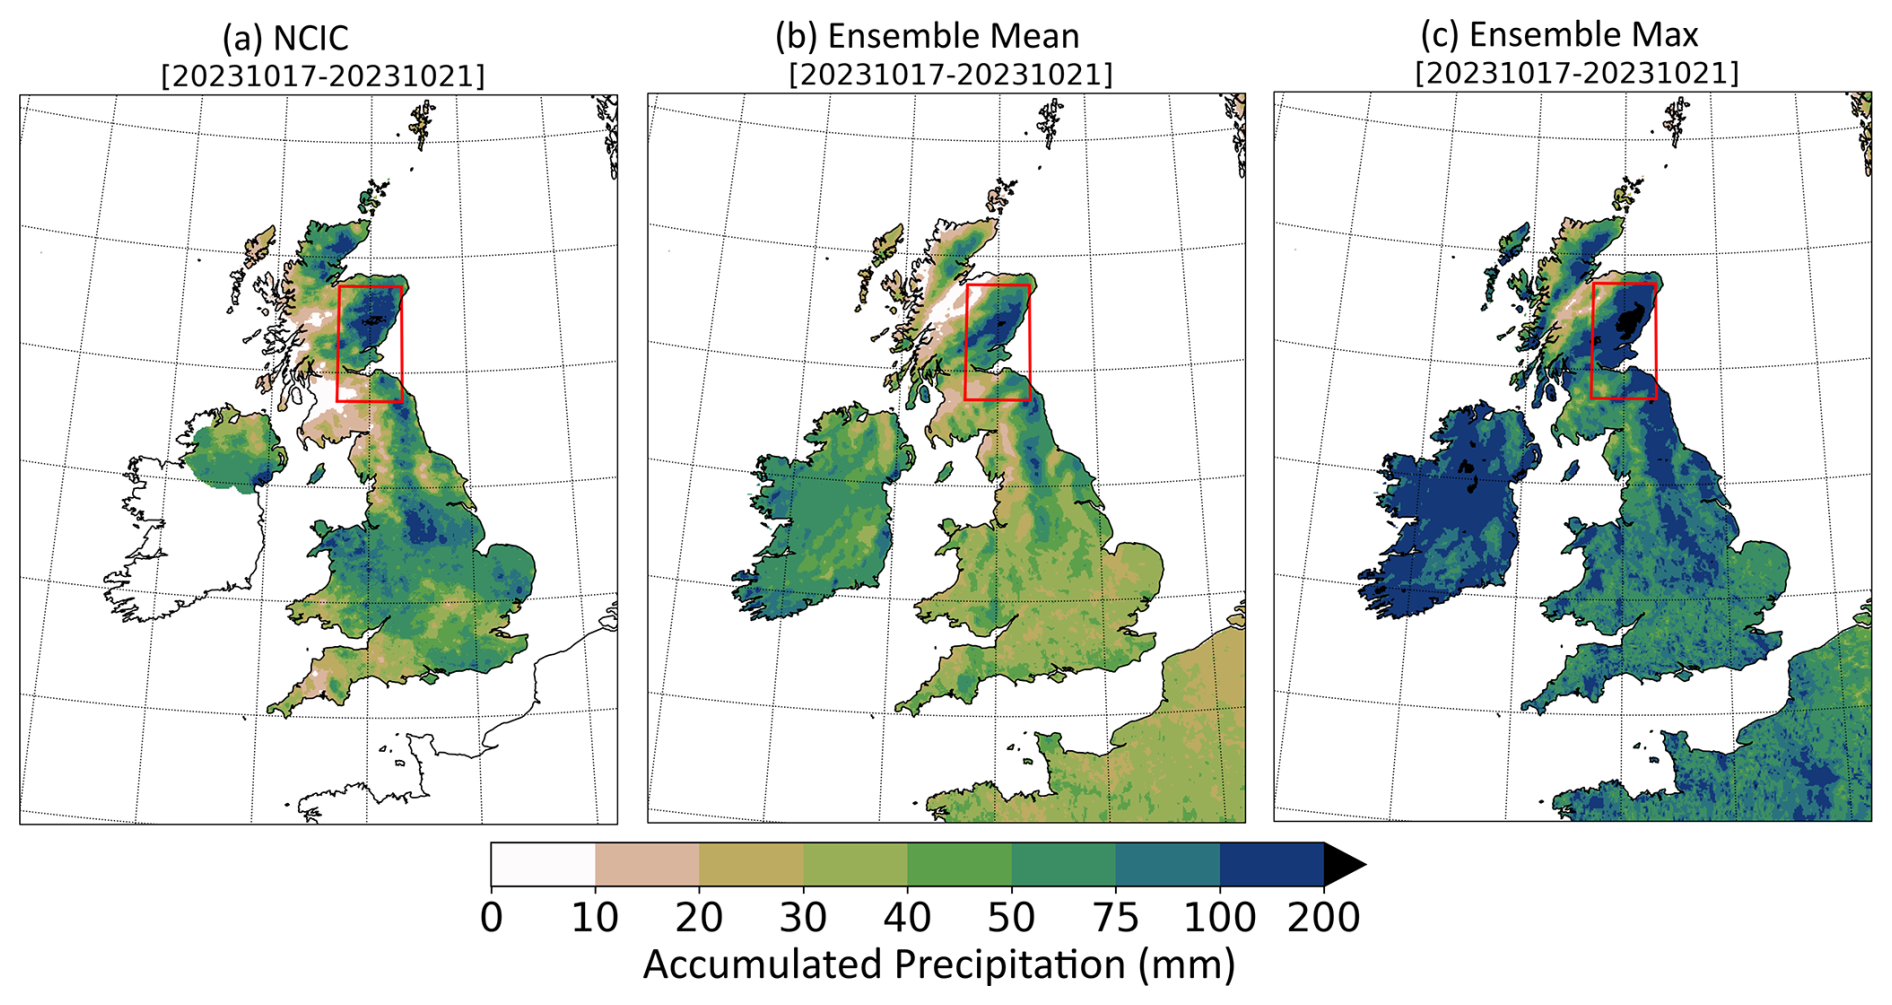
Figure 4Accumulated precipitation (mm) during 17–21 October 2023: (a) NCIC daily gridded observations, (b) 5 d coupled forecasts (ensemble mean), and (c) ensemble maximum across members. The red box marks Eastern Scotland, the focus area with highest precipitation.
Storm Babet brought a combination of in-land and coastal damage; the river Tay and South Esk burst their banks; beaches in Musselburgh saw the equivalent of a 5-year erosion rate (3 m retreat in Montrose, near the mouth of river South Esk); harbour walls in North Berwick collapsed in sections; a North Sea drilling platform lost anchors; and the storm resulted in 7 deaths. Despite the storm occurring during neap tide, the persistence of the wind field led to a prolonged surge lasting for several tidal cycles.
Figure 4 shows that the ensemble forecast performs well over eastern Scotland for 5 d accumulated precipitation, the region where the red warning was in place. As this is a single case, formal quantitative verification is not meaningful, so we restrict ourselves to a qualitative assessment. In this region the forecast behaved near-deterministically. Elsewhere, higher observed totals fall within the ensemble envelope (seen in Fig. 4c), indicating the system can produce such amounts, but those regions are outside our scope. We therefore focus on the Eastern Scotland box in Fig. 4, the primary impact area with concurrent inland and coastal hazards; the forecast there is sufficiently accurate for the process analysis that follows.
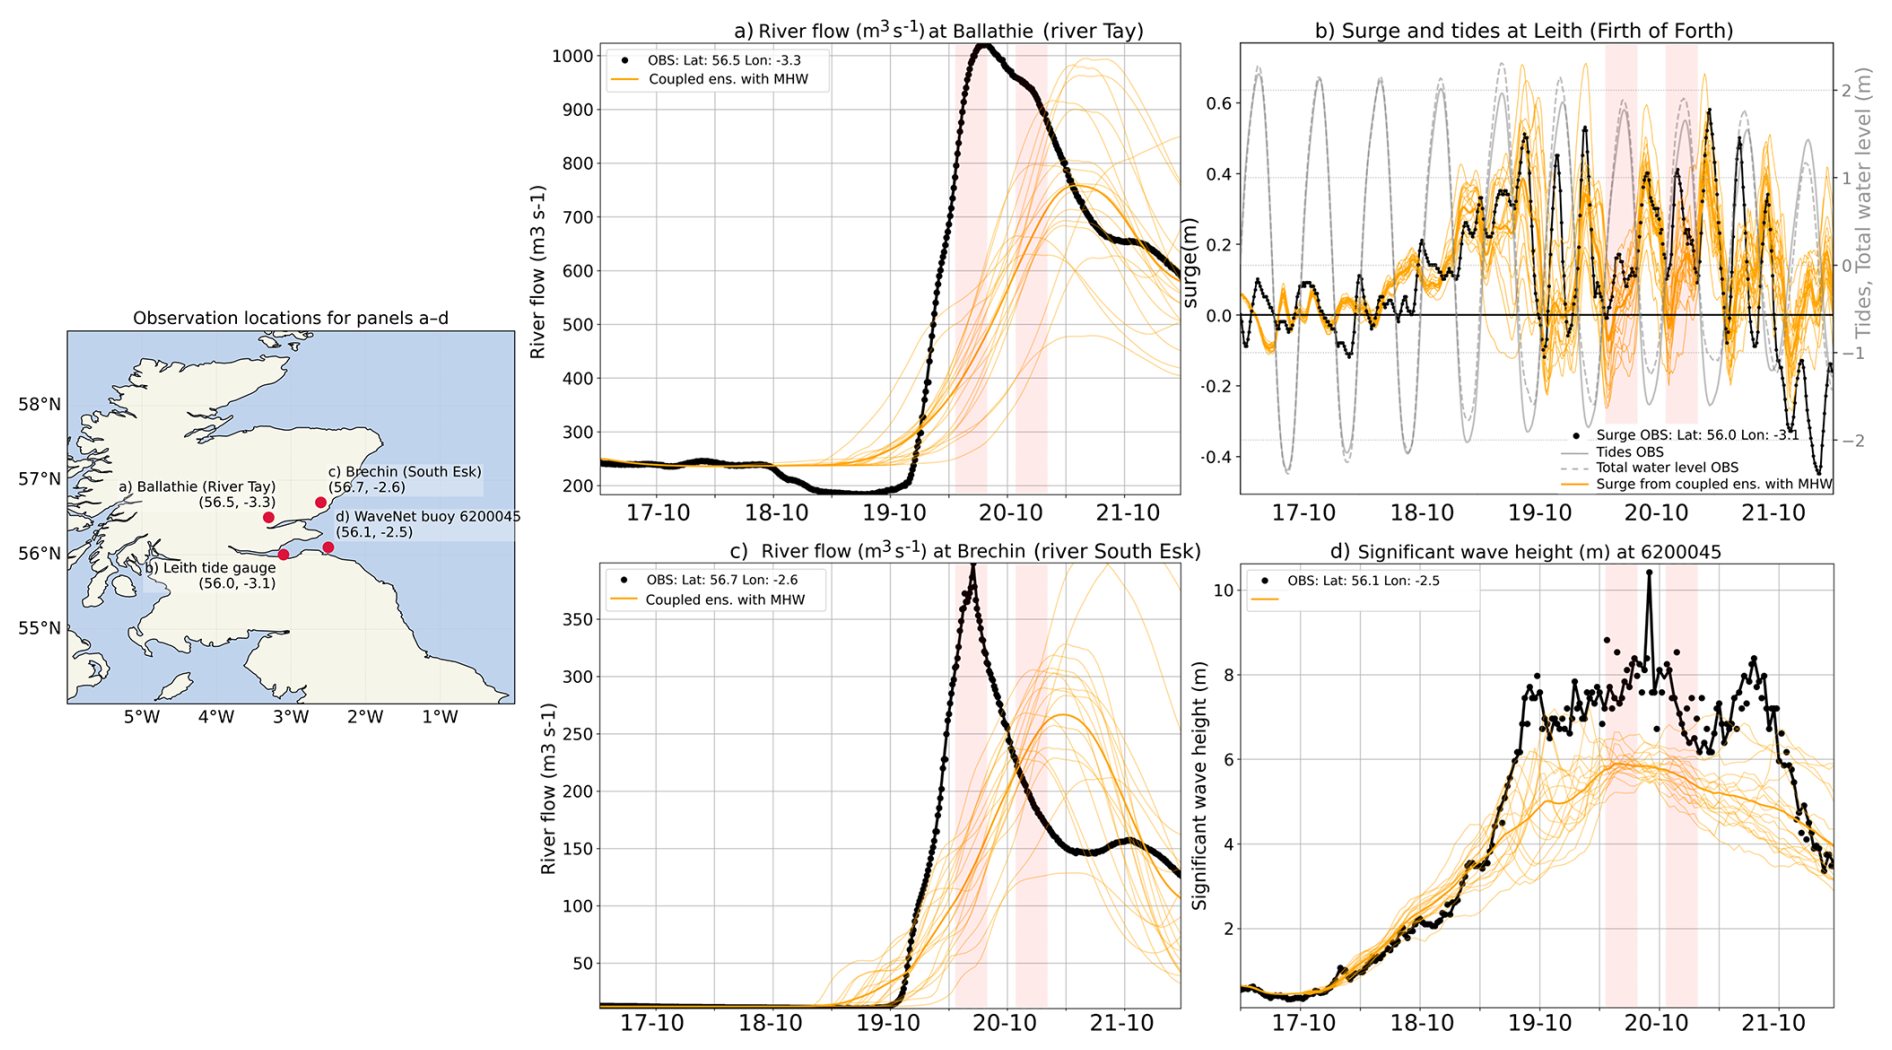
Figure 5Multi-hazard time series for Storm Babet comparing observations (black) with the coupled ensemble forecast including MHW (orange; thin = members, thick = ensemble mean). Panels: (a) river flow (m3 s−1) at River Tay (closest available gauge to sea); (b) Leith tide-gauge water level (m) showing observed total (black), astronomical tide (grey), and modelled surge (orange); (c) river flow (m3 s−1) at River South Esk (closest available gauge to sea); (d) significant wave height (m) at the Firth of Forth WaveNet buoy. In panels (a)–(c), model-observation mean of the first day of the run was removed from the model data to remove the model bias in pre-storm conditions and account for different reference levels (sea surface height). Red vertical bands mark intervals when hazards coincide.
Figure 5 presents a comparison between observations (black) and the coupled ensemble forecast (orange) for multiple hazards associated with Storm Babet. The panels show river discharge for the river Tay, surge and tide at Leith tide gauge, river discharge for the South Esk, and significant wave height at the Firth of Forth WaveNet buoy. In both the Tay and South Esk catchments (panels a and c), observed river discharge shows a rapid increase during the storm, consistent with the heavy rainfall. While the ensemble forecast reproduces the overall rising trend in river discharge, it lags 18 h behind the observations in capturing the peak. For each river, a few members capture the correct amplitude of river discharge increase generated by the storm, which shows good skill two days before the storm starts. Upstream observations show better model/observation agreement, which suggests the river speed is too slow in the coupled system (not shown).
At Leith (panel b), the tide gauge provides measurements of total water level, which can be decomposed into tidal and surge components. Although the event's occurrence during neap tide limited the overall hazard compared to a spring tide scenario, both high and low tides were higher relative to climatology by 0.3–0.6 m, reflecting the influence of storm surge. This storm surge was likely caused by the combined effect of low atmospheric pressure, which raises sea level, and strong winds that drove water toward the coast. Overall, some ensemble members of the coupled ensemble capture the surge amplitude of 0.3–0.6 m, although the ensemble mean shows a 0.1–0.2 m underestimation.
On the East Coast of Scotland, in a southeasterly wind regime, the significant wave height (panel d) is directly linked to wind forcing in the North Sea. Observations show significant wave heights exceeding 8 m, whereas the coupled ensemble mean peaks at around 6–7 m. Nevertheless, the timing of the wave peak is well captured. Figure S6 confirms this wave underestimation also against Central North Sea oil rig observations. Figure S5 indicates that the strongest winds (in the range of 20–25 m s−1) off the coasts of Denmark are underestimated by 3–5 m s−1 in all model members. Sensitivity studies conducted by Berthou et al. (2026) showed the wave amplitude could be increased to some extent by changing the coupling strength between wind and waves. However, this deteriorated the winds. Therefore, the origin of the problem is thought to be a lack of free-tropospheric momentum entrainment into the unstable boundary layer. Further work is needed to improve this in the next atmosphere and land configuration of this model.
The highlighted red areas in Fig. 5 represent times when elevated river discharge, high tide, strong waves, and storm surge occurred simultaneously. It is this temporal overlap that produced the severe multi-hazard coastal impacts of Storm Babet. The coupled ensemble is more successful at capturing multi-hazard on the afternoon of 20/10 than in the morning, given its delay in river peak.
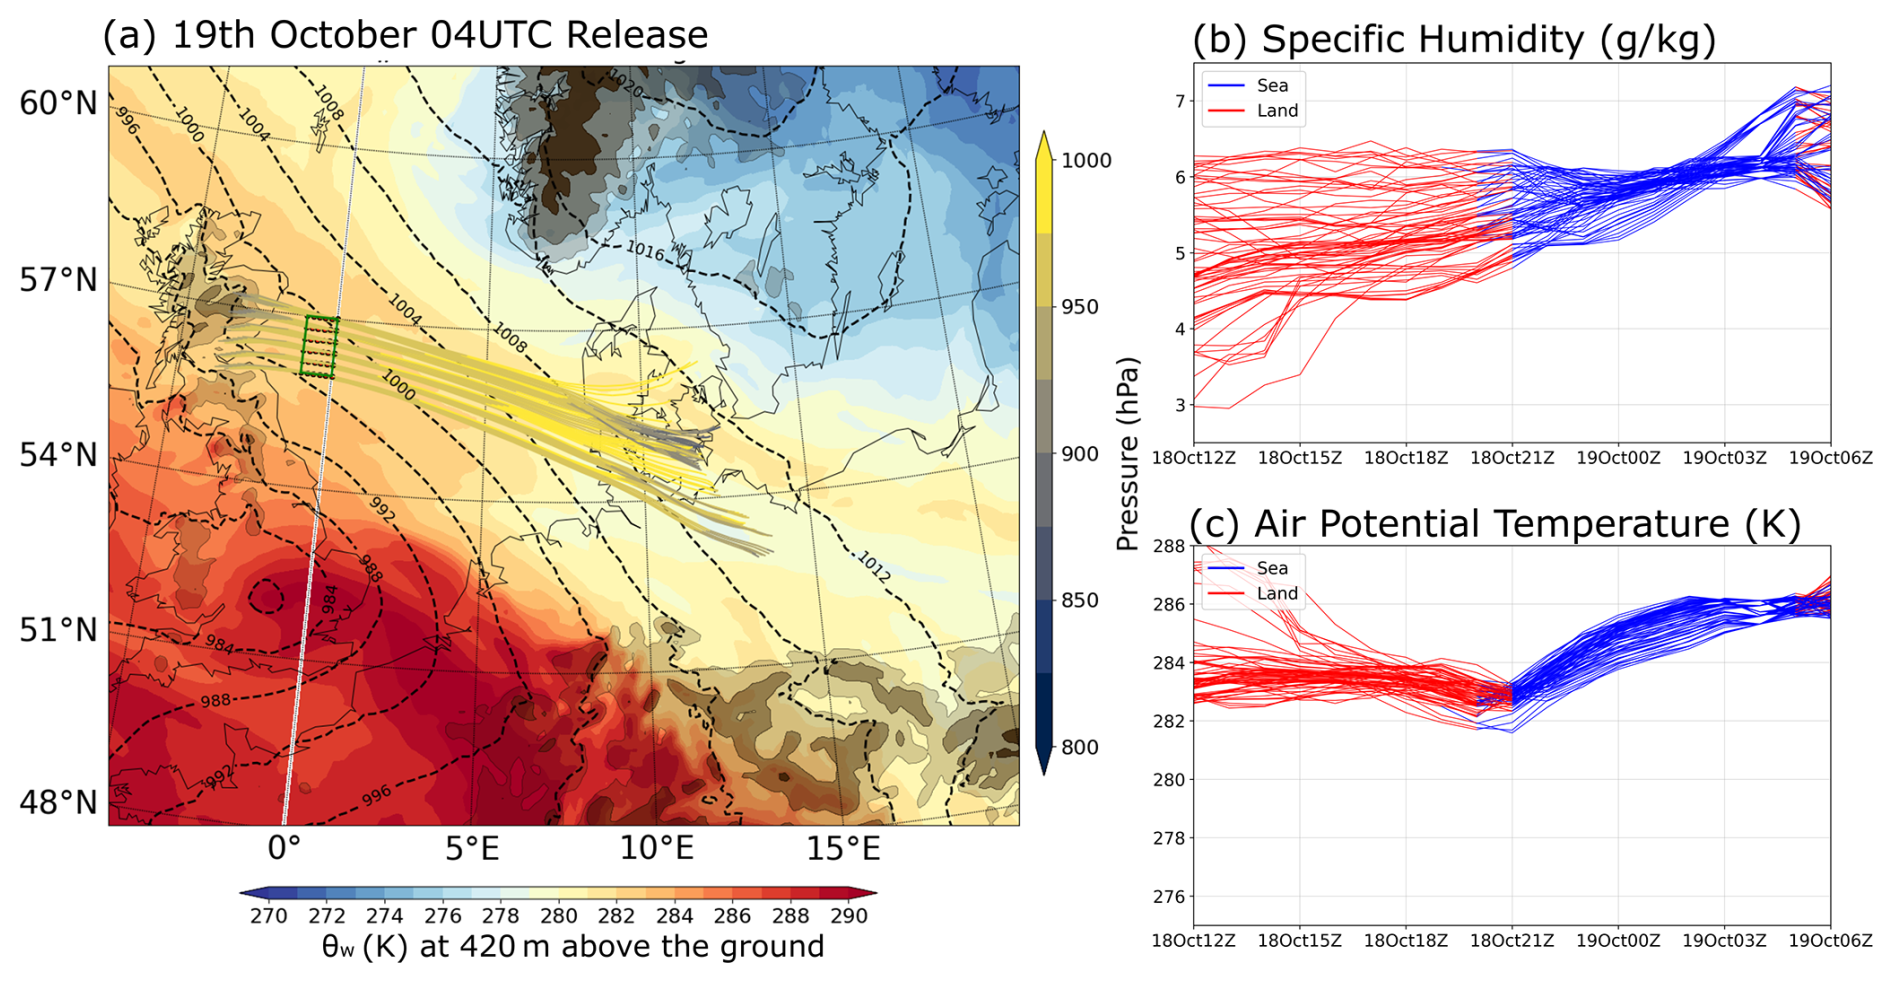
Figure 6Air parcel trajectories and thermodynamic evolution for the 19 October 2023 04:00 UTC release. (a) Wet-bulb potential temperature (θw) at 420 m above ground level, overlaid with sea-level pressure (hPa) valid on 18 October 21:00 UTC (midpoint of the trajectory) and 18 h trajectories (16 h backward +2 h forward) released from 56.0–57.0° N, 1.0° W–0.0° E at 925–970 hPa. (b) Specific humidity (g kg−1) along the trajectories. (c) Air potential temperature (K). Red: Parcels over land; Blue: Parcels over the ocean.
3.3 Air mass trajectories and moisture origin
To explain the origins of the multi-hazard in Storm Babet, we performed air mass Lagrangian trajectories (Sect. 2.2) using the Met Office global deterministic forecasts to provide insight into the pathways and moisture history of air parcels feeding precipitation during Storm Babet. Backward trajectory analyses were conducted for two trajectory release times on 19 October at 04:00 UTC (Fig. 6) and at 22:00 UTC (Fig. 7), chosen to represent two different stages of the precipitation event and to examine whether the pathways and thermodynamic evolution of the air parcels varied through time. Air parcels were released from near-surface levels (950–970 hPa) over the target region (56.0–57.0° N, 1.0° W–0.0° E), with a spatial resolution of 0.2° in both latitude and longitude. Each parcel was tracked 16 h backward and 2 h forward in time, providing a continuous reconstruction of their pathways and thermodynamic history.
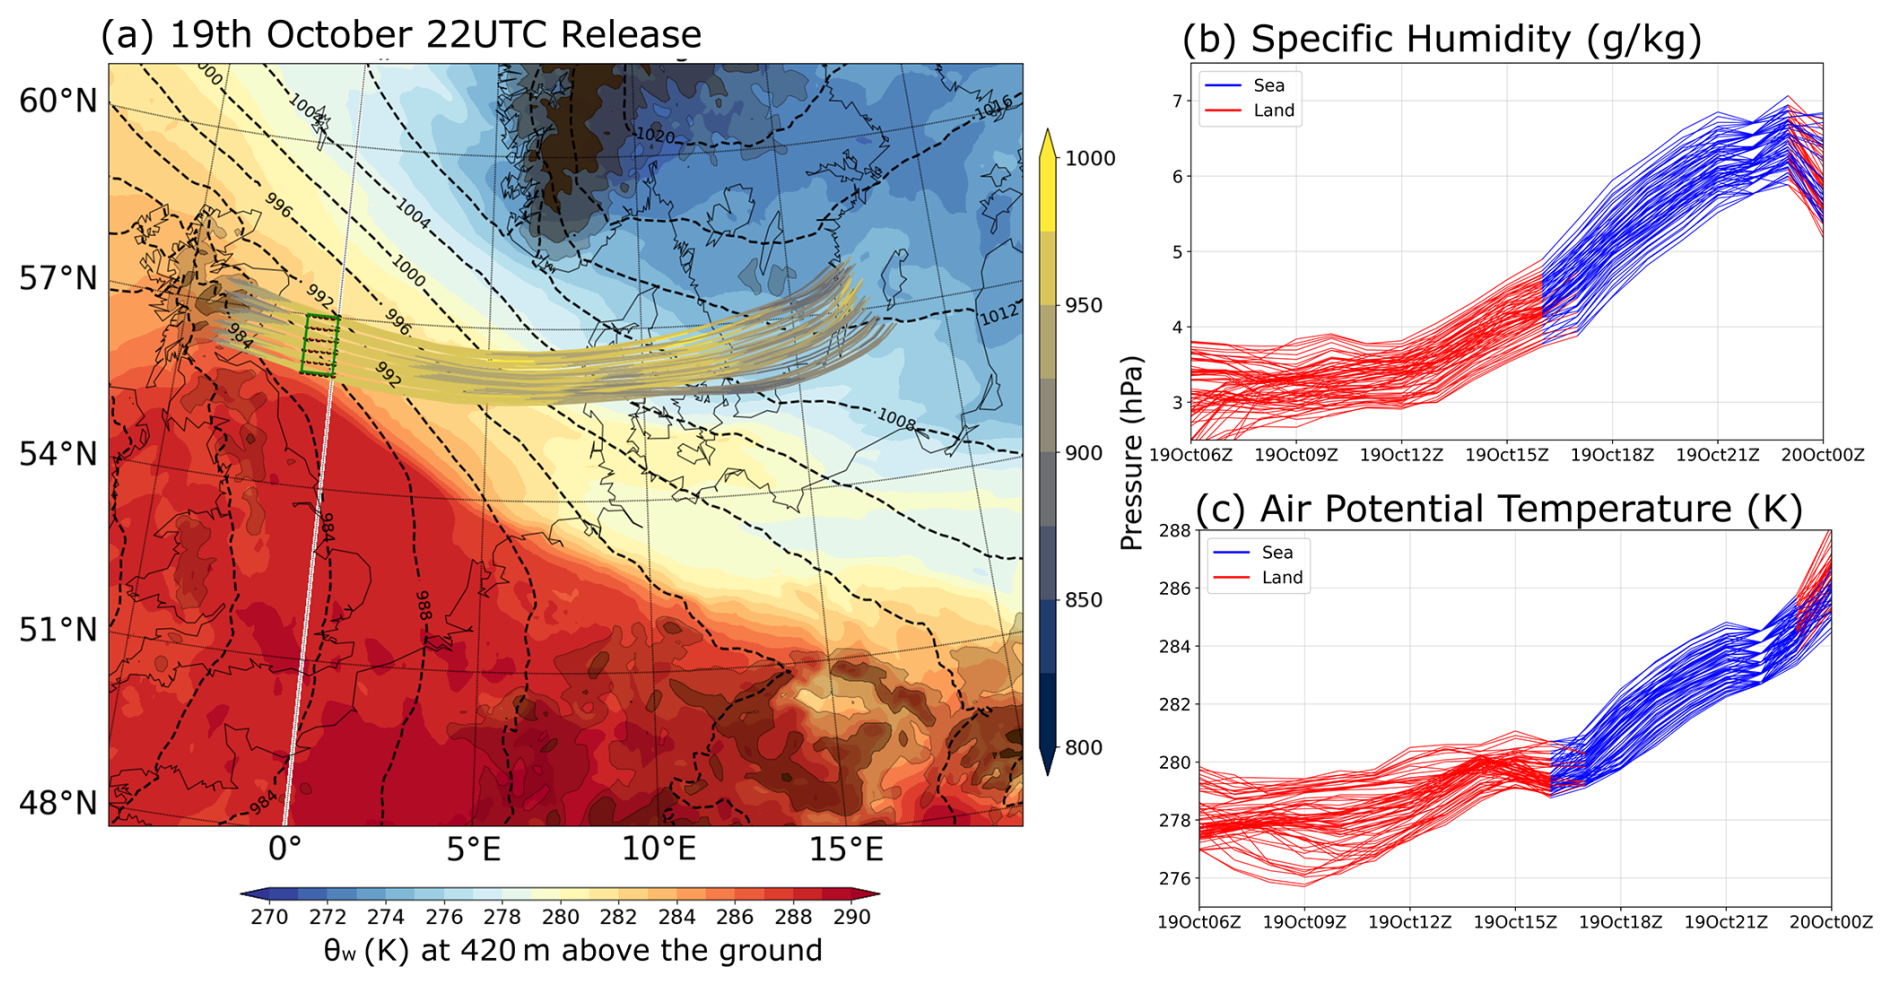
Figure 7Same as Fig. 6, but for trajectories released at 19 October 2023 22:00 UTC. In panel (a), θw at 420 m and the sea-level pressure (hPa) field is valid at 19 October 2023 15:00 UTC.
At 04:00 UTC on 19 October (Fig. 6a), air parcels originate from the southeast and cross Denmark before entering the North Sea. They accelerate over the sea: the longer marine segment is covered in comparable time to the land crossing (Fig. 6b, c). The specific-humidity time series shows the parcels are already moist on entering the marine domain. The small air potential temperature increase (+2.5 K) reflects limited turbulent heat uptake during the sea crossing, due to limited air/sea temperature difference (Figs. S3–S4).
By 22:00 UTC on 19 October (Fig. 7), the air parcels originated from the east, from cooler and drier land areas before arriving over the North Sea. Initially, these parcels contained lower moisture content, but as they passed over the MHW region, the specific humidity roughly doubles over the sea and potential temperature rises by 5–6 K, indicating respectively intense latent heat and sensible heat flux. This behaviour points to strong air-sea interaction later on 19 October: the North Sea provided an abundant moisture source that primed the atmosphere for heavy rainfall.
These trajectory analyses show distinct pathways and thermodynamic histories, pointing to the North Sea as a source of moisture for precipitation in Eastern Scotland on the evening of 19 and 20 October. Section 4 examines how the MHW preconditioning led to precipitation extremes and multi-hazard amplification.
Following the analysis of the MHW and of Storm Babet in Sect. 3, this section quantifies the direct impact of the MHW, demonstrating how the anomalously warm North Sea served as an amplification factor for an extreme multi-hazard storm event. In this section we first examine the storm's atmospheric intensification (Sect. 4.1), followed by an assessment of the resulting coastal and hydrological hazards (Sect. 4.2).
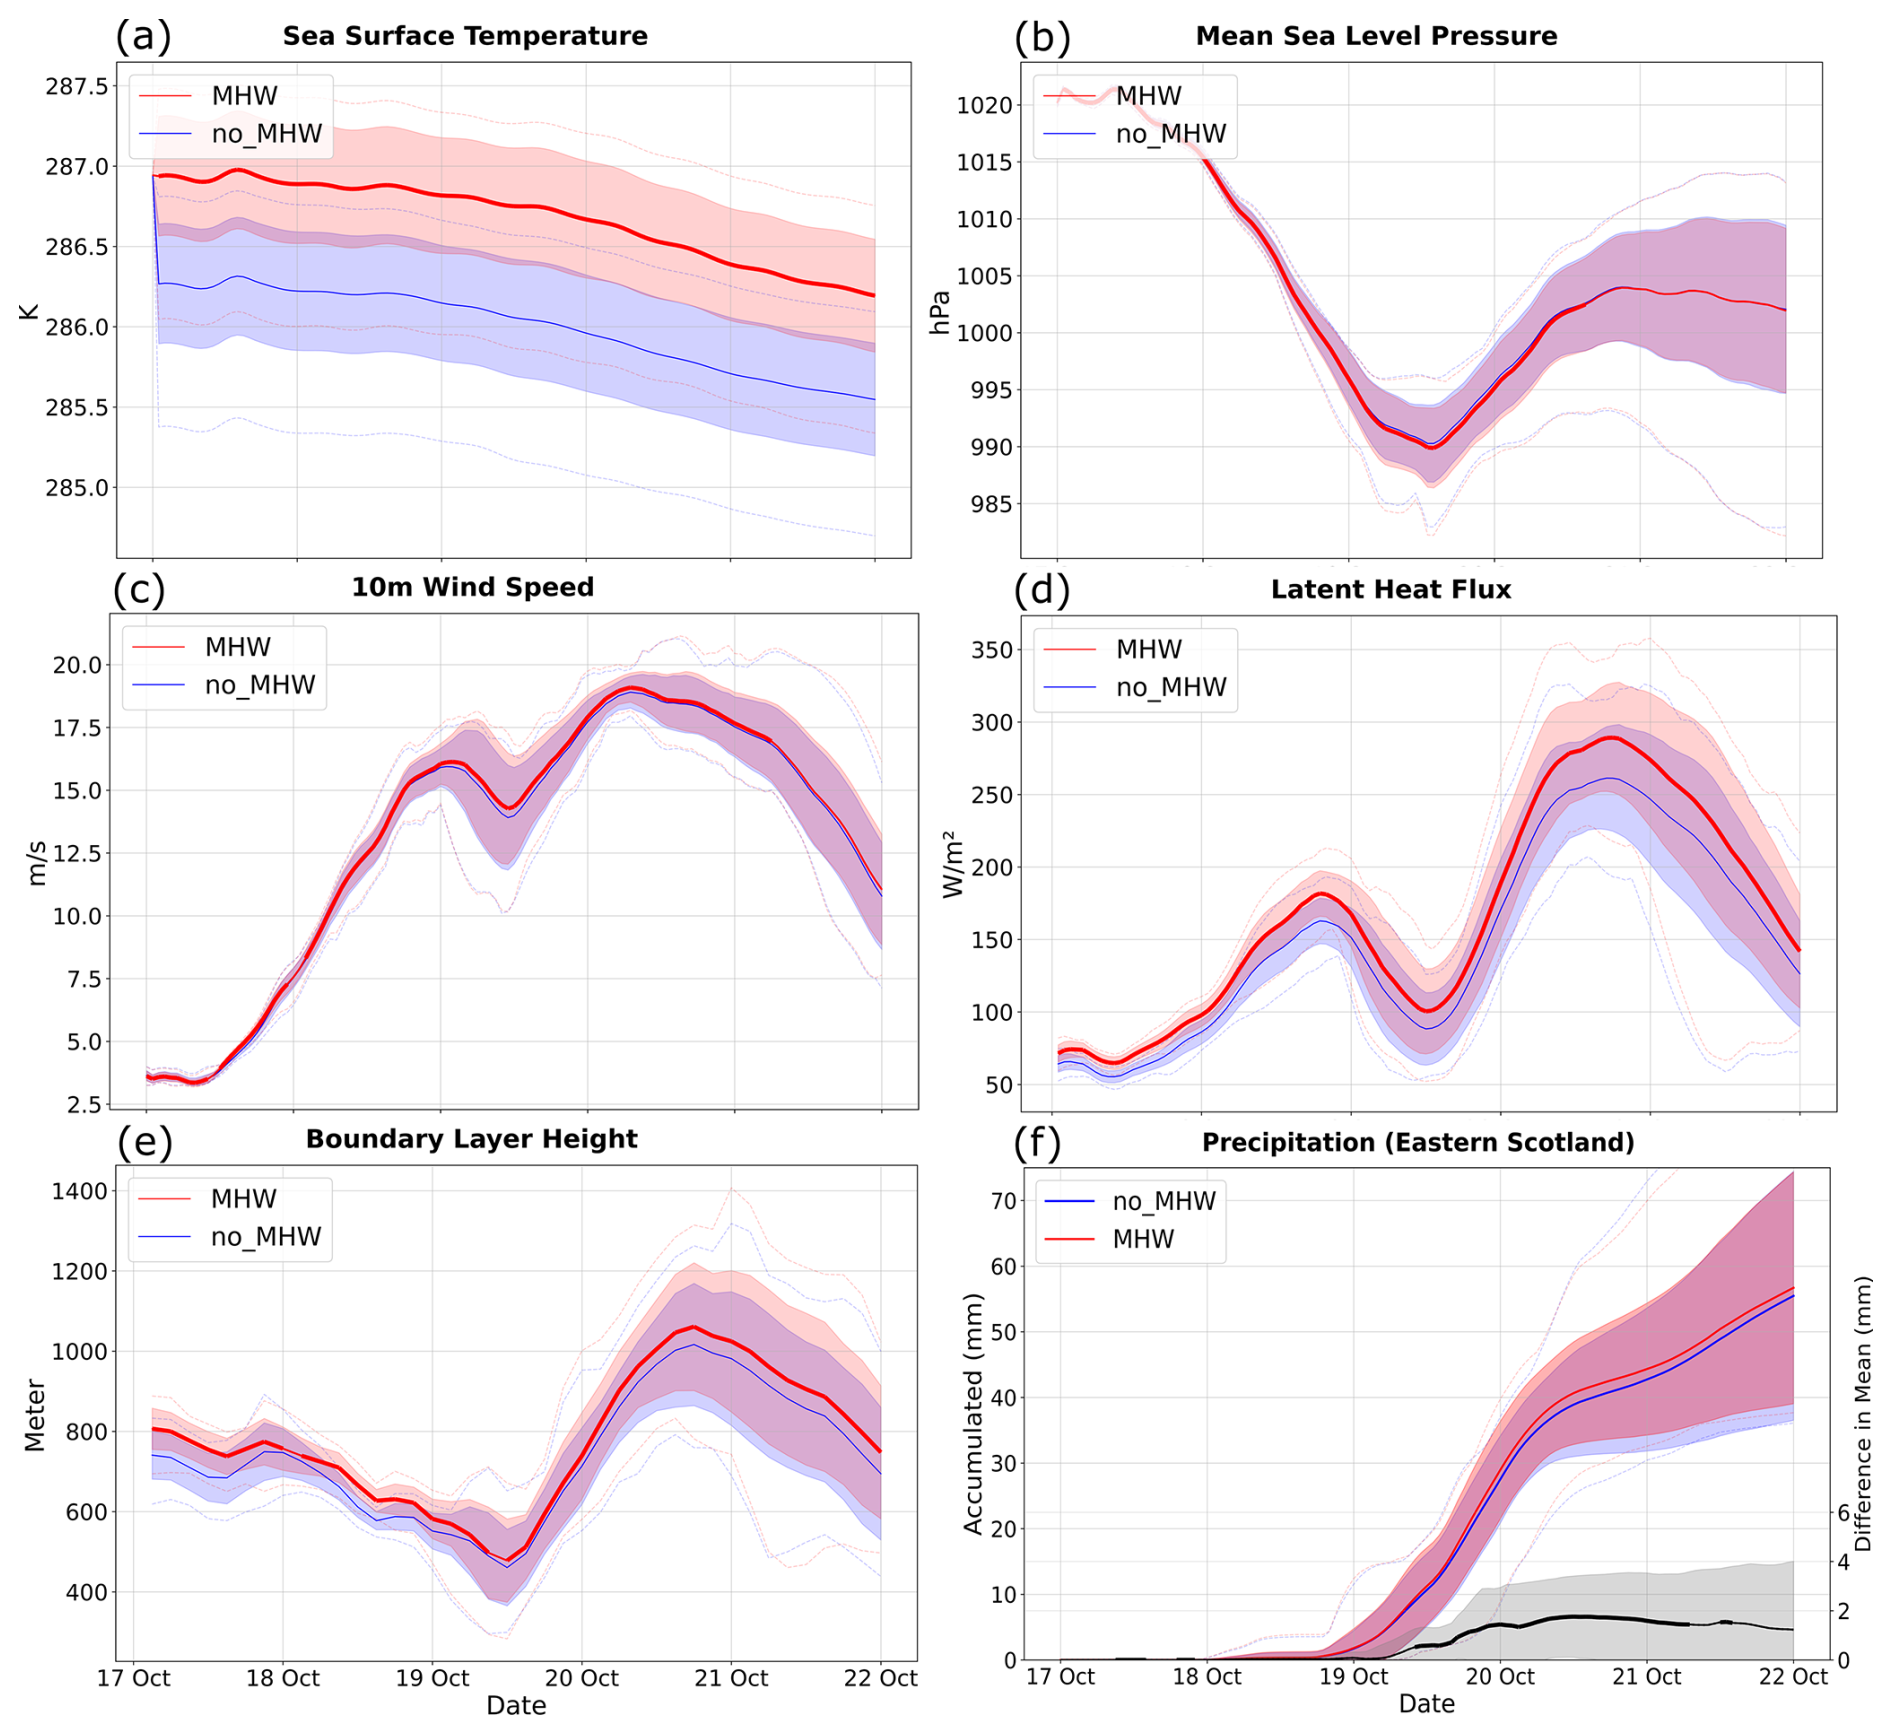
Figure 8Time series comparing the MHW (red) and no_MHW (blue) 18-member ensemble simulations over the 5 d forecast period from 17–21 October. For each panel, solid lines represent the mean, dashed lines show the full ensemble range (minimum and maximum), and the shaded areas denote ±1 standard deviation. The panels display: (a) sea surface temperature (K), (b) mean sea level pressure (hPa), (c) 10 m wind speed (m s−1), (d) surface latent heat flux (W m2), and (e) planetary boundary layer height (m), with each variable averaged over the Central North Sea. Panel (f) shows the accumulated precipitation over Eastern Scotland (red box in Fig. 4, mm, left axis) and the difference between the ensemble means (MHW – no_MHW, black line, right axis). Thicker segments of the MHW line indicate statistical significance at the 99 % confidence level (p<0.01) based on a paired t-test between corresponding ensemble members (MHWi−no_MHWi). For precipitation in f, the significance is highlighted by a thick line on the difference plot (black line) for visibility.
4.1 Atmospheric Response and Storm Intensification
To assess the atmospheric response to the MHW, a counterfactual analysis was performed between two 18-member ensemble simulations over the 5 d forecast window from 17–21 October. As detailed in Sect. 2.4, these experiments represent the observed 2023 event with the marine heatwave (MHW) and a counterfactual scenario where the observed 2023 event occurred over near-climatological sea conditions from 2020 (no_MHW). This approach isolates the impact of the anomalously warm Northwest European Shelf sea on the stor's development. Figure 8 presents the temporal evolution of key meteorological variables, and clearly shows that the presence of the MHW led to a systematic intensification of the storm system.
The MHW simulation maintained consistently higher SST throughout the 17–22 October period (Figure 8a), by about 0.8–1 °C. This anomaly was spread throughout the 40–50 m of the Central North Sea.
A consistent atmospheric response to this anomalous warmth is evident in mean sea-level pressure (MSLP) (panel b). The MHW ensemble shows a slightly deeper low-pressure centre, with reductions of 1–2 hPa around 19 October. Although small, this difference is statistically significant and reflects a modest but systematic enhancement of storm intensity. These results align with the synoptic-scale pressure patterns discussed earlier (Sect. 3.1), where a blocking anticyclone over Scandinavia confined Babet over the North Sea and allowed the low-pressure system to intensify locally. This intensification is likely linked with increased latent heat release from increased precipitation (panel f).
The MHW run consistently produced slightly stronger 10 m wind speeds, with an increase of about 1 %, especially during the wind decay phase. The model evaluation (Fig. S5) showed a realistic temporal evolution of winds, supporting confidence in these results. The trajectory analyses (Sect. 3.2) and the model evaluation of sea and air temperature (Figs. S3 and S4 respectively) showed the air parcels over the North Sea were always cooler than the sea, and in particular on 20 October, meaning the boundary layer was both thermally and (given high wind speed) dynamically unstable. In these conditions, convective downdrafts bring free-tropospheric momentum near the surface, enhancing wind speed. We hypothesise that the warmer sea in the MHW experiment contributed to a higher boundary layer (panel e): an increase of 30–50 m relative to the no_MHW case, which means more momentum likely to be carried to the surface. Storm MSLP deepening, and the associated strengthening of the cross-basin pressure gradient (Fig. S7), may also have contributed to stronger wind speeds.
The most direct atmospheric signal of the MHW is seen in latent heat flux (panel d). Fluxes in the MHW simulation were 15 %–20 % higher than in the no_MHW case, especially during 20 October when the storm reached peak intensity. The ensemble mean shows a statistically significant enhancement across much of the storm’s evolution. This amplification reflects the greater air-sea humidity contrast provided by the warm MHW waters, but its strength depended strongly on air-mass origin. As shown in the trajectory analysis (Sect. 3.1), early on 19 October the air parcels were already moisture-laden, winds were weaker, and little additional moisture was taken up. By contrast, later on 19 October, the air arrived drier and under stronger winds, enabling vigorous evaporation from the MHW region. This led to a sharp increase in latent heat flux and set the stage for enhanced precipitation over Eastern Scotland.
Figure 8f shows the accumulated precipitation in Eastern Scotland. Both ensembles reproduce the extreme rainfall totals associated with Babet, but the MHW run yields a consistent enhancement of 5 %. While small relative to the storm total, the increase is statistically significant and occurs mainly on the afternoon of 19 October and on 20 October, coinciding with the period when dry air parcels crossed the warm North Sea and acquired substantial additional moisture. In contrast, the MHW exerted little influence on 19 October, when incoming air masses were already humid. Importantly, the timing of the enhancement corresponds to the period of strongest latent heat flux and boundary layer deepening, reinforcing the link between the ocean anomaly and atmospheric intensification. The magnitude of the moisture increase aligns with Clausius-Clapeyron expectations for the observed SST anomaly (7 % more moisture per degree of warming), but its manifestation depended on the interplay between the MHW and the evolving air-mass origin. This is consistent with De Leeuw et al. (2017) who emphasise that air-mass pathways and origin humidity, rather than background SST alone, are key controls on precipitation over the UK. For Storm Babet, amplification of the precipitation was confined to periods when dry continental air masses crossed the warm basin under strong winds.
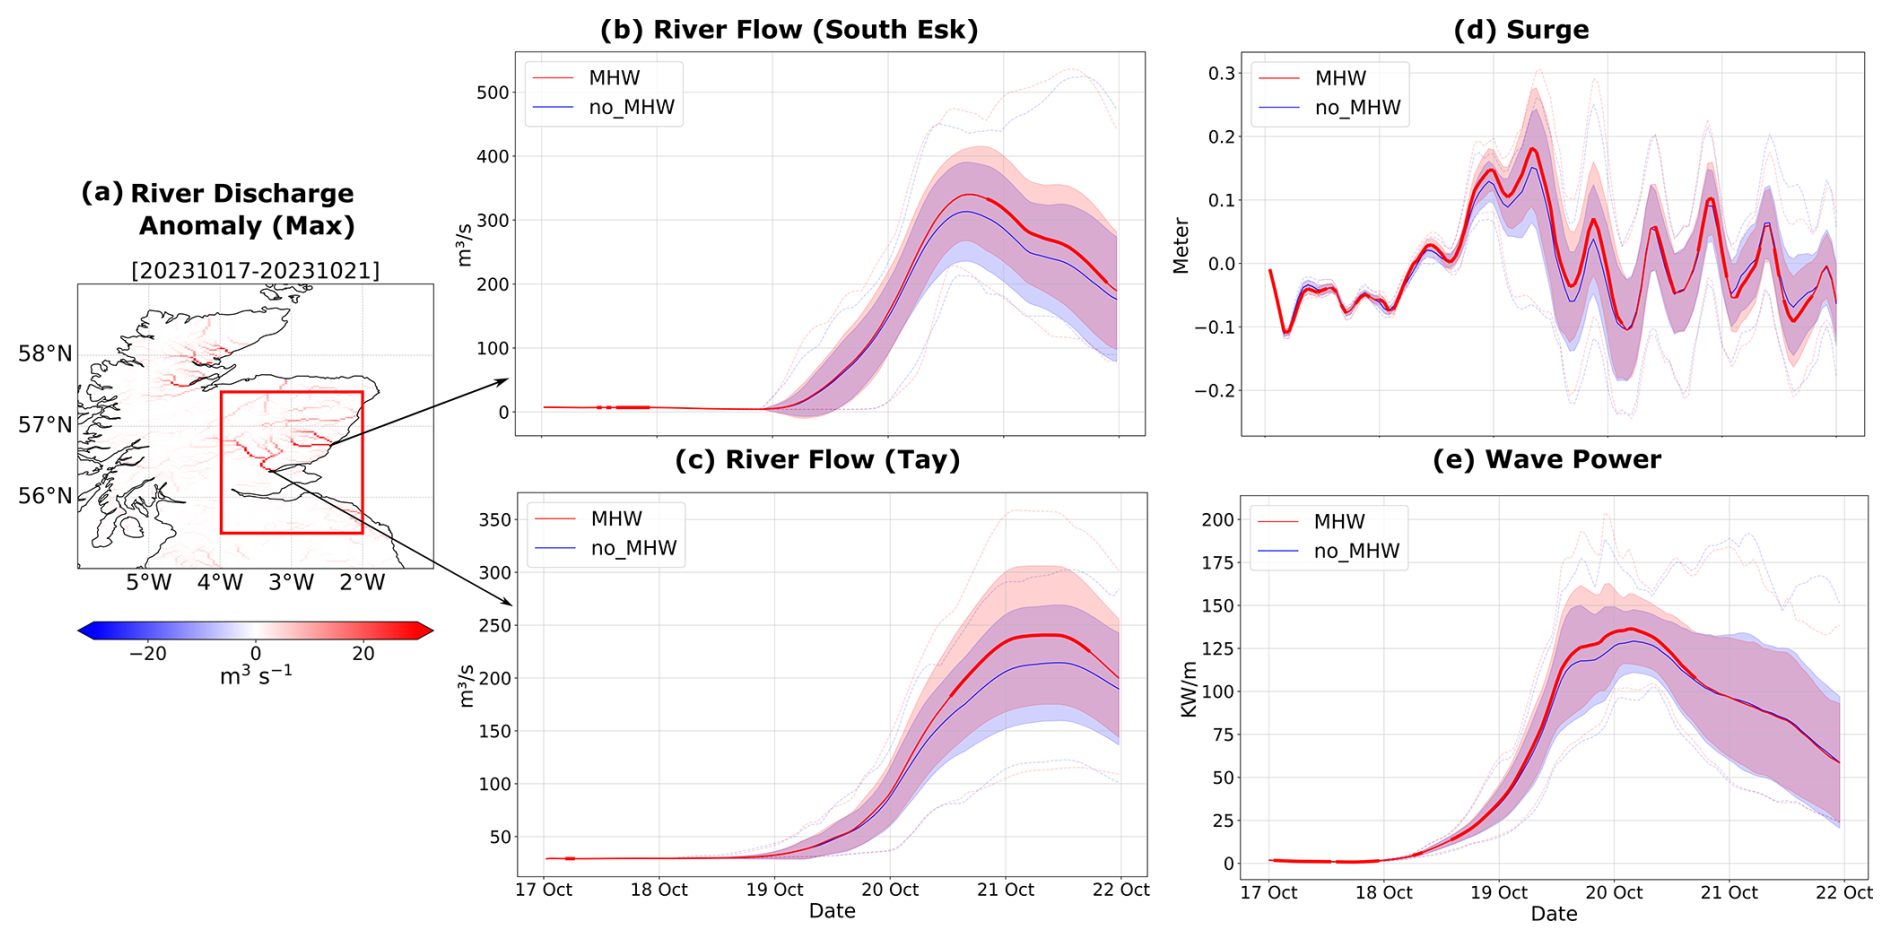
Figure 9(a) Maximum river discharge anomaly (MHW−no_MHW) (b) river flow in the mouth of river South Esk, (c) river flow in River Tay, (d) surge on the Eastern Scotland red box (sea only), surge is computed using ocean model total water level – tide-only run, (e) wave power in Eastern Scotland red box (sea only). Thicker segments of the MHW line indicate statistical significance at the 99 % confidence level (p<0.01) based on a paired t-test between corresponding ensemble members (MHWi−no_MHWi).
4.2 Coastal and Hydrological Hazards
The increases in precipitation, near-surface wind speed, and cyclone deepening associated with the North Sea MHW extended into the hydrological and coastal hazards, amplifying river discharge, surge, and wave power. To quantify these impacts, we analyse the same pair of 18-member ensemble forecasts described in Sect. 2.4, spanning 17–21 October. Figure 9 presents the temporal evolution of these hazard indicators: river discharge at river mouths, wave power and surge averaged over the red box of Fig. 4 highlighting the role of anomalously warm SSTs in amplifying multi-hazard risk.
Figure 9b, c show that both the river South Esk and Tay experienced a systematic increase in flow in the MHW ensemble. By 20–21 October, flows were enhanced by around 12 %–18 % (∼ 30 m3 s−1). The South-Esk peaked earlier, on 20 October, whereas the Tay catchment peaked later, on 21 October, reflecting different basin response times. This response is not expected to scale linearly with rainfall, because runoff also depends on antecedent soil moisture, rainfall intensity, and catchment saturation. Importantly, both rivers burst their banks during Storm-Babet, and the model indicates that the MHW amplified the peak flows, thereby raising the probability of fluvial flooding.
The coastal storm surge Fig. 9d was amplified by about 20 % in the MHW ensemble on 19 October (∼ 3 cm averaged on the Eastern Scotland box), consistent with slightly stronger near-surface winds (+1 %) and a deeper storm core (widespread ∼ 2 hPa mean sea-level pressure anomaly) on this day. The persistence of the anomaly nonetheless illustrates how MHW-driven intensification can increase the frequency of hazardous water levels, even when tidal phasing mitigates the outcome.
Finally, Fig. 9e shows that wave power, defined as the energy flux carried by waves (proportional to wave height squared times wave period), was elevated in the MHW case by about 9 % on 19–20 October. This enhancement is consistent with the ∼ 1 % increase in wind speeds, arising from greater boundary-layer depth and enhanced thermal instability over warmer waters. Indeed, waves are an integrator of wind speed, and a 1 % increase in wind speed in our case leads to 3 % wave height increase, and therefore 9 % wave power increase. Stronger and more energetic waves increase the risk of coastal erosion and overtopping of sea defences.
At the end of 19 October, the MHW run shows that wave power was increasing while the surge had already started to go down. Even though the surge was smaller than earlier, it was still higher than in the no_MHW case. This means that the peaks of surge and waves did not fully happen at the same time, but the MHW still made both hazards larger than they would have been otherwise. If these waves happen at the same time as high water levels, they can also make it harder for rivers to empty into the sea, which can worsen flooding in estuaries. Our model does not link the rivers directly with the sea, but this kind of interaction is well known, and it shows why it is important to look at all the hazards together.
These diagnostics demonstrate how modest SST anomalies can propagate through multiple pathways to amplify storm impacts. Even a small increase in wind, precipitation and decrease in pressure can integrate over time and space and generate much larger river, surge and wave power increases. The MHW systematically raised all components, thereby increasing the overall hazard envelope and amplifying the multi-hazard events (river, surge, tide, wave) shown in the observations on 20 October (Fig. 5). This highlights the potential for MHWs to act as multi-hazard amplifiers: even relatively small SST anomalies (∼ 1 °C) can trigger a chain of processes that lead to greater and longer-lasting riverine, coastal, and wave impacts.
5.1 Limitations of the study
This study has several limitations that should be considered when interpreting the results. The analysis focuses on a single case study, Storm Babet, meaning that the identified processes cannot yet be assumed to apply to all extratropical cyclones. Every storm has unique synoptic characteristics, so generalisation requires a larger event set. In addition, the experimental design relies on the Met Office regional coupled prediction system which, although state-of-the-art for UK forecasting, represents only one model configuration and is subject to biases. The difference between 2023 and 2020 sea states used in the coupled model tends to underestimate the MHW amplitude relative to observations (Fig. 1), implying that the simulated anomaly represents a conservative estimate of the true MHW signal (it corresponds to an anomaly with a 2003–2022 baseline, rather than 1982–2012). Indeed, repeating this study with an atmosphere-only ensemble prescribing the observed MHW anomaly showed a 6 %–7 % increase in precipitation, slightly higher than the 5 % of the coupled system (not shown). Although the coupled system remarkably captured individual hazards, and the timing of their increase, it did underestimate most of them, so it is possible that the MHW amplification of these hazards may also be underestimated. Nevertheless, the coupled system captured very well the SST cooling (Fig. S3), giving confidence in how much energy was extracted from the North Sea by the storm in the coupled forecast. Furthermore, the regional model setup focuses on the Northwest European shelf and surrounding regions, so feedbacks on larger-scale circulation features influencing the storm may not be fully represented. Regarding the seasonal context, a previous NWES MHW also occurred in June 2023, raising the question of whether cumulative seasonal heat storage may have contributed to the autumn event. However, Berthou et al. (2024) suggest that much of the excess heat content associated with the June event was removed during the very stormy conditions of July 2023. We therefore do not have clear evidence that the June event directly contributed to the atmospheric response examined here, although possible seasonal persistence or subsurface memory effects remain an open question for future work.
5.2 Implications for predictability and risk
Despite these limitations, the results highlight important implications for understanding and predicting the effect of MHWs for mid-latitude storm impacts. The results show that MHWs can intensify multiple hazards associated with extratropical cyclones. In this case, the warm anomaly in the North Sea enhanced latent heat fluxes, which in turn supported greater atmospheric instability and additional precipitation over Eastern Scotland. However, the expected thermodynamic effects alone do not explain the response; the amplification also depended on a shift in the air-mass origins, showing that local and large-scale factors acted together. While De Leeuw et al. (2017) show that background SST alone does not explain precipitation variability over the UK, our results illustrate that, for this event, the anomalously warm North Sea provided locally significant additional moisture when initially dry air crossed the basin. The model experiments also showed consistent increases in river discharge, storm surge, and wave power under MHW conditions, suggesting that the influence of the ocean surface extended across several components of the hazard chain. These findings highlight that even a modest SST anomaly was sufficient to produce systematic differences, underlining the sensitivity of shallow seas to air-sea coupling. In this sense, the MHW influence should be understood as a causal amplifier operating through enhanced air-sea fluxes, boundary-layer moisture and heat supply, and their interaction with the evolving storm dynamics, rather than as a uniform direct effect on all hazards.
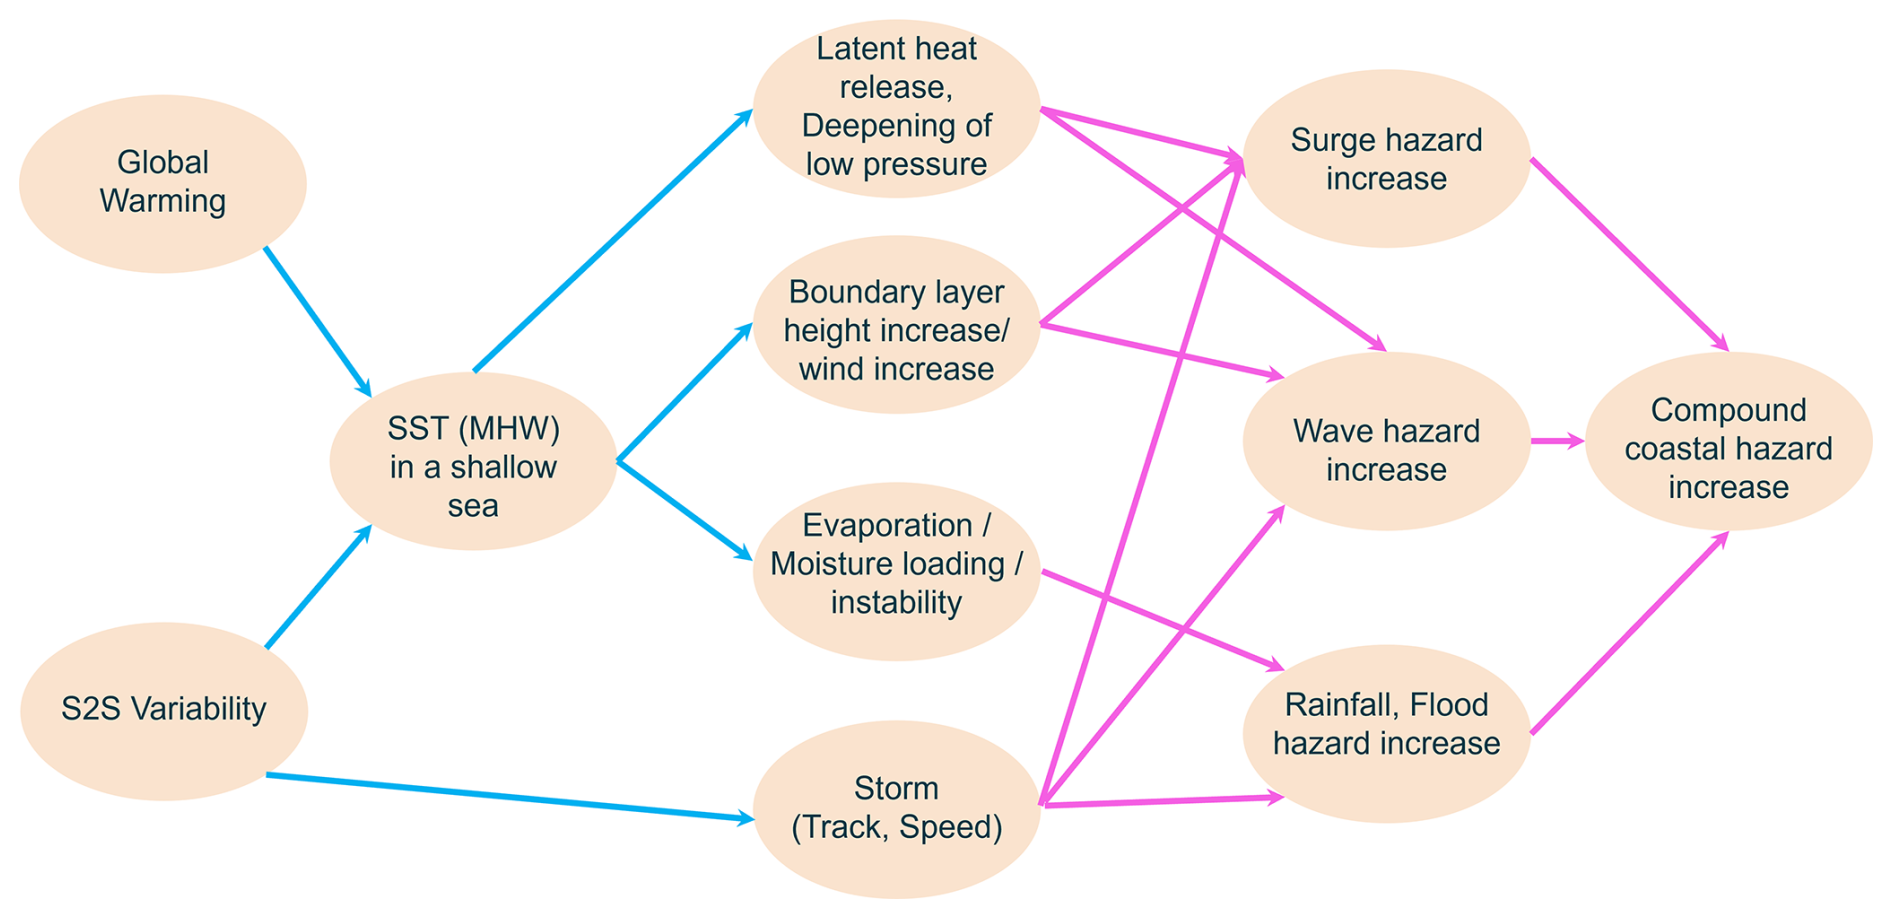
Figure 10Causal network showing physical linkages between MHWs in shallow seas and multiple hazard components. Arrows represent proposed causal relationships informed by the Storm Babet case study. Blue arrows denote process links up to the storm and atmospheric responses. Magenta arrows denote integrating responses where small atmospheric changes amplify when accumulated over space and time.
We can formalise these pathways, in a causal network that links the pre-existing warm shelf-sea state and anomalous ocean heat content to surface fluxes, storm intensity, and downstream hazards (Fig. 10). This framework provides a structure for attributing observed responses to specific drivers within a causal explanatory framework, and for testing whether similar connections appear in other cases. In the conditional framework used here, the counterfactual experiments indicate that the pre-existing MHW amplified the hazards under the observed broad storm setup. With a larger event set, the approach could establish more robust relationships between North Sea heat content and storm severity, allowing generalisation beyond single events.
These findings have broader implications for both predictability and risk assessment. In this case, the anomaly was not confined to the surface but extended through much of the shallow water column helping to sustain warm surface conditions that supported enhanced air-sea fluxes to persist during the storm. Ocean heat content is an observable quantity that can be monitored and predicted at sub-seasonal to seasonal (S2S) timescales. If storms with similar characteristics to Babet occur during periods of elevated heat content in the North Sea, they are likely to be amplified in a comparable way. This provides a physical basis for using ocean heat content as a precursor variable in forecasts of storm impacts. It also shows that the interaction between MHWs and storms is not a rare coincidence, but rather a systematic process that should be integrated into risk management frameworks. Storms tend to always end MHWs, and this example shows that MHWs can amplify the storms that end them.
5.3 Implications for climate projections
The MHW that coincided with Storm Babet represents both internal variability and the influence of long-term climate change. The observed North Sea anomaly can be viewed as representative of warming levels that may become typical in future mean conditions. Indeed, the North Sea warms faster than the global warming trend, and warmed by 1 °C between 2003–2022 and 1982–2002 (Fig. 1), and 2023 was 0.9 °C warmer than 2003–2022, which, if the past trend continues, would be close to a 2023–2042 average. Increases of up to 4.1 °C for the Central North Sea and 4.5 °C for the Southern North Sea are possible for the last two decades of the century compared to the first two (Tinker et al., 2024). From this perspective, Babet is not only an example of present-day hazard amplification, but also a prototype of how storms may evolve as mean ocean temperatures rise. A key part of this amplification is the preconditioning of the shallow North Sea, with excess heat stored before the storm maintaining a warm shelf-sea state that supported enhanced air-sea fluxes during the event. When such warming becomes the baseline rather than an extreme, the amplification observed here would apply to a much larger set of storms. This interpretation assumes, to a first approximation, that the relevant internal variability and circulation patterns remain structurally similar, even as the thermodynamic background shifts in a warmer climate. At the same time, the large-scale background in which such events occur may also be influenced by changes in baroclinicity, jet variability, and North Atlantic internal variability. Assessing the role of these wider-scale drivers is beyond the scope of the present event-based study, which focuses on the conditional influence of the pre-existing MHW within the observed Storm Babet setup.
Nevertheless, to establish whether these mechanisms are general or case-specific, it is important to extend the analysis beyond Babet. Different storms are likely to show distinct balances of response; for instance, larger changes in mean sea-level pressure but smaller changes in precipitation. Analysing a broader set of events will make it possible to test whether the causal pathways identified here recur across storms, or whether they depend on particular synoptic configurations. This comparative approach will provide a more robust basis for linking MHW conditions to storm impacts.
This study examined how the prolonged autumn 2023 marine heatwave (MHW) in the North Sea affected the evolution and multi-hazard impacts of the storm which ended the MHW: Storm Babet. Using a high-resolution regional coupled atmosphere-ocean-wave model (UKC4), we ran ensemble forecasts comparing the observed event (MHW) with a counterfactual simulation initialised with ocean conditions representative of the last 20-year climatology (no_MHW).
The pre-existing MHW was generated by persistent anticyclonic conditions a month and a half before the storm happened, and acted as a local amplifier of storm hazards. Indeed, the North Sea was anomalously warm by 0.8–1 °C throughout its shallow depth, meaning no cold water could be entrained from deeper layers like in deeper parts of the ocean. The long-lasting (>48 h) cold and dry low-level jet generated by the storm over the North Sea was energised by the MHW which raised surface latent heat flux by about 15 %–20 % and increased atmosphere instability, increasing wind speed by 1 %. This produced a modest but statistically significant 5 % increase in rainfall over eastern Scotland and a 1–2 hPa deepening of the cyclone. This atmospheric intensification translated into stronger hydrological and coastal impacts. Higher rainfall increased peak river discharge by 12 %–18 %, stronger winds increased coastal wave power by ∼ 9 %, and stronger winds in combination with cyclone deepening increased the storm surge by ∼ 20 %. The MHW supplied excess heat and moisture that broadened the storm's multi-hazard footprint, especially when drier air masses crossed the basin. Future work should test these mechanisms across more storms and modelling systems to assess generality and sensitivity.
This case identifies a clear physical pathway linking prior increased ocean heat content in a shallow shelf sea to the severity of the impacts of an extratropical cyclone. This finding has implications for operational forecasting, suggesting that regional MHWs can serve as a valuable conditional precursor for S2S predictions of extreme storm impacts.
This event is a prototype for storms in a warmer climate: the warming level of the North Sea SST at the time of Storm Babet was representative of a 2023–2042 average, if warming from the last 40 years is extrapolated. As anthropogenic warming makes the North Sea MHWs more frequent and intense (Cornes et al., 2023b; Tinker et al., 2024), the compound amplification of rainfall, surge, and waves seen during Storm Babet may become systematic for storms with similar characteristics.
This argues for integrating coupled ocean-atmosphere processes into adaptation planning and multi-hazard risk assessments. Indeed, the Met Office and Environmental Agency operational forecasting system at the time of Storm Babet used inconsistent forcing between atmospheric, river, ocean/wave and surge systems, and each hazard was analysed independently. A coupled system with good skill across multiple earth system components, as illustrated is this paper, would enable a consistent approach to multi-hazard forecasting, and a whole-system understanding of storm hazards, also including impacts on marine ecosystems (Berthou et al., 2025; Partridge et al., 2026).
Glider data are available from the BODC Deployment Catalogue at https://platforms.bodc.ac.uk/deployment-catalogue/, observed river data is available from https://timeseriesdoc.sepa.org.uk/, observed wave data from https://wavenet.cefas.co.uk/ and observed surge data from https://ntslf.org/. Coupled model output is available in https://doi.org/10.5281/zenodo.20457718 (Goswami, 2026). Code used to generate the figures of this article is available from https://doi.org/10.5281/zenodo.17609382 (Goswami and Berthou, 2026).
The supplement related to this article is available online at https://doi.org/10.5194/nhess-26-3213-2026-supplement.
PG: Conceptualization, Methodology, Formal analysis, Investigation, Data curation, Visualization, Writing – Original Draft, Writing – Review & Editing. SB: Conceptualization, Methodology, Formal analysis, Investigation, Data curation, Visualization, Supervision, Writing – Original Draft, Writing – Review & Editing. TGS: Conceptualization, Methodology, Investigation, Supervision, Writing – Review & Editing. AV: Methodology, Software, Investigation, Writing – Review & Editing. SM: Software, Validation, Resources, Writing – Review & Editing. JMC: Software, Resources, Writing – Review & Editing. ACP: Resources, Validation, Writing – Review & Editing. YJP: Resources, Writing – Review & Editing. RR: Supervision, Writing – Review & Editing. MAB: Supervision, Writing – Review & Editing.
The contact author has declared that none of the authors has any competing interests.
Publisher's note: Copernicus Publications remains neutral with regard to jurisdictional claims made in the text, published maps, institutional affiliations, or any other geographical representation in this paper. The authors bear the ultimate responsibility for providing appropriate place names. Views expressed in the text are those of the authors and do not necessarily reflect the views of the publisher.
We thank the Met Office for access to the Regional Coupled System (UKC4) through the MONSooN2 platform, and JASMIN for data processing and storage. We also acknowledge the Met Office Supercomputer Observations Programme for providing the glider data.
PG has been supported by the AFESP research fund at the University of Reading (award no. A3720300). SB, SM, and JMC have been supported by the Met Office Hadley Centre Climate Programme funded by DSIT. AV has been funded by the UKRI-NERC project “Diabatic influences on current and future hazardous Mediterranean cyclones” (grant no. NE/Z000092/1).
This paper was edited by Marleen de Ruiter and reviewed by Thibault Guinaldo and one anonymous referee.
Ardhuin, F., Rogers, E., Babanin, A., Filipot, J.-F., Magne, R., Roland, A., Westhuysen, A. V. D., Queffeulou, P., Lefevre, J.-M., Aouf, L., and Collard, F.: Semiempirical Dissipation Source Functions for Ocean Waves. Part I: Definition, Calibration, and Validation, J. Phys. Oceanogr., 40, 1917–1941, https://doi.org/10.1175/2010JPO4324.1, 2010. a
Atkins, J. R., Scaife, A. A., Graham, J. A., Tinker, J., and Halloran, P. R.: Recent European marine heatwaves are unprecedented but not unexpected, Commun. Earth Environ., 6, 792, https://doi.org/10.1038/s43247-025-02802-3, 2025. a
Berthou, S., Roberts, M. J., Vannière, B., Ban, N., Belušić, D., Caillaud, C., Crocker, T., de Vries, H., Dobler, A., Harris, D., Kendon, E. J., Landgren, O., and Manning, C.: Convection in future winter storms over Northern Europe, Environ. Res. Lett., 17, https://doi.org/10.1088/1748-9326/aca03a, 2022. a
Berthou, S., Renshaw, R., Smyth, T., Tinker, J., Grist, J.P., Wihsgott, J.U., Jones, S., Inall, M., Nolan, G., Berx, B., and Arnold, A.: Exceptional atmospheric conditions in June 2023 generated a northwest European marine heatwave which contributed to breaking land temperature records, Commun. Earth Environ., 5, 287, https://doi.org/10.1038/s43247-024-01413-8, 2024. a, b, c, d, e
Berthou, S., Siddorn, J., Fraser-Leonhardt, V., Le Traon, P.-Y., and Hoteit, I.: Towards Earth system modelling: coupled ocean forecasting, in: Ocean prediction: present status and state of the art (OPSR), edited by: Álvarez Fanjul, E., Ciliberti, S. A., Pearlman, J., Wilmer-Becker, K., and Behera, S., Copernicus Publications, State Planet, 5-opsr, 20, https://doi.org/10.5194/sp-5-opsr-20-2025, 2025. a
Berthou, S., Castillo, J. M., Fraser-Leonhardt, V., Mahmood, S., Makrygianni, N., Arnold, A., Sanchez, C., Lewis, H. W., Partridge, D., Best, M., Bricheno, L., Davies, H., Clark, D., Clark, J. R., Polton, J., Saulter, A., Short, C. J., Tinker, J., and Tucker, S.: Km-scale regional coupled system for the Northwest European shelf for weather and climate applications: RCS-UKC4, EGUsphere [preprint], https://doi.org/10.5194/egusphere-2025-6216, 2026. a, b, c, d
Brown, A., Milton, S., Cullen, M., Golding, B., Mitchell, J., and Shelly, A.: Unified modeling and prediction of weather and climate: A 25-year journey, B. Am. Meteor. Soc., 93, 1865–1877, 2012. a
Bush, M., Boutle, I., Edwards, J., Finnenkoetter, A., Franklin, C., Hanley, K., Jayakumar, A., Lewis, H., Lock, A., Mittermaier, M., Mohandas, S., North, R., Porson, A., Roux, B., Webster, S., and Weeks, M.: The second Met Office Unified Model–JULES Regional Atmosphere and Land configuration, RAL2, Geosci. Model Dev., 16, 1713–1734, https://doi.org/10.5194/gmd-16-1713-2023, 2023. a
Castillo, J. M., Lewis, H. W., Mishra, A., Mitra, A., Polton, J., Brereton, A., Saulter, A., Arnold, A., Berthou, S., Clark, D., Crook, J., Das, A., Edwards, J., Feng, X., Gupta, A., Joseph, S., Klingaman, N., Momin, I., Pequignet, C., Sanchez, C., Saxby, J., and Valdivieso da Costa, M.: The Regional Coupled Suite (RCS-IND1): application of a flexible regional coupled modelling framework to the Indian region at kilometre scale, Geosci. Model Dev., 15, 4193–4223, https://doi.org/10.5194/gmd-15-4193-2022, 2022. a
Chen, W. and Staneva, J.: Characteristics and trends of marine heatwaves in the northwest European Shelf and the impacts on density stratification, in: 8th edition of the Copernicus Ocean State Report (OSR8), edited by: von Schuckmann, K., Moreira, L., Grégoire, M., Marcos, M., Staneva, J., Brasseur, P., Garric, G., Lionello, P., Karstensen, J., and Neukermans, G., Copernicus Publications, State Planet, 4-osr8, 7, https://doi.org/10.5194/sp-4-osr8-7-2024, 2024. a
Choi, H.-Y., Park, M.-S., Kim, H.-S., and Lee, S.: Marine heatwave events strengthen the intensity of tropical cyclones, Commun. Earth Environ., 5, 69, https://doi.org/10.1038/s43247-024-01239-4, 2024. a, b
Cornes, R., Tinker, J., Hermanson, L., Oltmanns, M., Hunter, W., Lloyd-Hartley, H., Kent, E., Rabe, B., and Renshaw, R.: The impacts of climate change on sea temperature around the UK and Ireland, MCCIP Science Review 2025, 24 pp., https://doi.org/10.14465/2025.reu08.tem, 2023a. a, b
Cornes, R., Tinker, J., Hermanson, L., Oltmanns, M., Hunter, W., Lloyd-Hartley, H., Kent, E., Rabe, B., and Renshaw, R.: Climate change impacts on temperature around the UK and Ireland, MCCIP Science review 2023, 1, 18, https://doi.org/10.14465/2023.reu08.tem, 2023b. a
De Leeuw, J., Methven, J., and Blackburn, M.: Physical factors influencing regional precipitation variability attributed using an airmass trajectory method, J. Climate, 30, 7359–7378, 2017. a, b
Deoras, A., Turner, A. G., Volonté, A., and Menon, A.: The role of midlatitude dry air during the withdrawal of the Indian summer monsoon, Q. J. Roy. Meteor. Soc., 150, 5094–5112, 2024. a
Dzwonkowski, B., Coogan, J., Fournier, S., Lockridge, G., Park, K., and Lee, T.: Compounding impact of severe weather events fuels marine heatwave in the coastal ocean, Nat. Commun., 11, 4623, https://doi.org/10.1038/s41467-020-18339-2, 2020. a
Frölicher, T. L., Fischer, E. M., and Gruber, N.: Marine heatwaves under global warming, Nature, 560, 360–364, 2018. a, b
Gentile, E. S., Gray, S. L., and Lewis, H. W.: The sensitivity of probabilistic convective-scale forecasts of an extratropical cyclone to atmosphere–ocean–wave coupling, Q. J. Roy. Meteor. Soc., 148, 685–710, https://doi.org/10.1002/qj.4225, 2022. a
Good, S., Fiedler, E., Mao, C., Martin, M.J., Maycock, A., Reid, R., Roberts-Jones, J., Searle, T., Waters, J., While, J., and Worsfold, M.: The current configuration of the OSTIA system for operational production of foundation sea surface temperature and ice concentration analyses, Remote Sens., 12, 720, https://doi.org/10.3390/rs12040720, 2020. a
Goswami, P. and Berthou, S.: Data and code for “Marine heatwave amplifies extreme multi-hazards of extratropical cyclone Babet” In Natural Hazards and Earth System Sciences (NHESS), Zenodo [code, data set], https://doi.org/10.5281/zenodo.20427490, 2026. a
Goswami, P.: Data and code for “Marine heatwave amplifies extreme multi-hazards of extratropical cyclone Babet” in Natural Hazards and Earth System Sciences (NHESS), Zenodo [code, data set], https://doi.org/10.5281/zenodo.20457718, 2026. a
Graham, J. A., O'Dea, E., Holt, J., Polton, J., Hewitt, H. T., Furner, R., Guihou, K., Brereton, A., Arnold, A., Wakelin, S., Castillo Sanchez, J. M., and Mayorga Adame, C. G.: AMM15: a new high-resolution NEMO configuration for operational simulation of the European north-west shelf, Geosci. Model Dev., 11, 681–696, https://doi.org/10.5194/gmd-11-681-2018, 2018. a
Hagelin, S., Roberts, N., Thompson, S. A., Beare, R., and Bush, M.: The Met Office convective-scale ensemble, MOGREPS-UK, Q. J. Roy. Meteor. Soc., 143, 2846–2861, https://doi.org/10.1002/qj.3135, 2017. a
Hawcroft, M., Walsh, E., Hodges, K., and Zappa, G.: Significantly increased extreme precipitation expected in Europe and North America from extratropical cyclones, Environ. Res. Lett., 13, 124006, https://doi.org/10.1088/1748-9326/aaed59, 2018. a, b
Hobday, A. J., Alexander, L. V., Perkins, S. E., Smale, D. A., Straub, S. C., Oliver, E. C., Benthuysen, J. A., Burrows, M. T., Donat, M. G., Feng, M., and Holbrook, N. J.: A hierarchical approach to defining marine heatwaves, Prog. Oceanogr., 141, 227–238, https://doi.org/10.1016/j.pocean.2015.12.014, 2016. a, b
Hobday, A. J., Oliver, E. C., Gupta, A. S., Benthuysen, J. A., Burrows, M. T., Donat, M. G., Holbrook, N. J., Moore, P. J., Thomsen, M. S., Wernberg, T., and Smale, D. A.: Categorizing and naming marine heatwaves, Oceanography, 31, 162–173, https://doi.org/10.5670/oceanog.2018.205, 2018. a
Hollis, D., McCarthy, M., Kendon, M., Legg, T., and Simpson, I.: HadUK-Grid – A new UK dataset of gridded climate observations, Geosci. Data J., 6, 151–159, 2019. a
Jangir, B., Mishra, A. K., and Strobach, E.: The interplay between medicanes and the Mediterranean Sea in the presence of sea surface temperature anomalies, Atmos. Res., 310, 107625, https://doi.org/10.1016/j.atmosres.2024.107625, 2024. a
Kendon, M.: Storm Babet, 18 to 21 October 2023, Report, Met Office National Climate Information Centre, Met Office, Exeter, UK, https://www.metoffice.gov.uk/binaries/content/assets/metofficegovuk/pdf/weather/learn-about/uk-past-events/interesting/2023/2023_08_storm_babet.pdf (last access: 30 October 2025), 2023. a
Kendon, M., Doherty, A., Hollis, D., Carlisle, E., Packman, S., McCarthy, M., Jevrejeva, S., Matthews, A., Williams, J., Garforth, J., and Sparks, T.: State of the UK Climate 2023, Int. J. Climatol., 44, 1–117, https://doi.org/10.1002/joc.8553, 2024. a
Kew, S. F., McCarthy, M., Ryan, C., Pirret, J. S., Murtagh, E., Vahlberg, M., Amankona, A., Pope, J. O., Lott, F., Claydon, O., Coonan, B., Pinto, I., Barnes, C., and Philip, S.: Autumn and Winter storms over UK and Ireland are becoming wetter due to climate change, Report, Grantham Institute for Climate Change, https://doi.org/10.25561/111577, 2024. a
Kodama, C., Stevens, B., Mauritsen, T., Seiki, T., and Satoh, M.: A new perspective for future precipitation change from intense extratropical cyclones, Geophys. Res. Lett., 46, 12435–12444, 2019. a
Lewis, H. W. and Dadson, S. J.: A regional coupled approach to water cycle prediction during winter 2013/14 in the United Kingdom, Hydrol. Process., 35, e14438, https://doi.org/10.1002/hyp.14438, 2021. a
Lewis, H. W., Castillo Sanchez, J. M., Arnold, A., Fallmann, J., Saulter, A., Graham, J., Bush, M., Siddorn, J., Palmer, T., Lock, A., Edwards, J., Bricheno, L., Martínez-de la Torre, A., and Clark, J.: The UKC3 regional coupled environmental prediction system, Geosci. Model Dev., 12, 2357–2400, https://doi.org/10.5194/gmd-12-2357-2019, 2019. a
Madec, G. and the NEMO team: NEMO Ocean Engine, Paris, France, version 3.6 stable, https://www.nemo-ocean.eu/doc/ (last access: 27 June 2026), 2016. a
Neal, R., Fereday, D., Crocker, R., and Comer, R. E.: A flexible approach to defining weather patterns and their application in weather forecasting over Europe, Meteorol. Appl., 23, 389–400, 2016. a, b
Partridge, D., Berthou, S., Millington, R., Clark, J. R., Bricheno, L., Castillo, J. M., Rulent, J., and Lewis, H.: Impact of waves on phytoplankton activity on the Northwest European Shelf: insights from observations and km-scale coupled models, Ocean Sci., 22, 345–366, https://doi.org/10.5194/os-22-345-2026, 2026. a
Paulson, C. A. and Simpson, J. J.: Irradiance measurements in the upper ocean, J. Phys. Oceanogr., 7, 952–956, 1977. a
Porson, A. N., Carr, J. M., Hagelin, S., Darvell, R., North, R., Walters, D., Mylne, K. R., Mittermaier, M. P., Willington, S., and Macpherson, B.: Recent upgrades to the Met Office convective-scale ensemble: An hourly time-lagged 5-day ensemble, Q. J. Roy. Meteor. Soc., 146, 3245–3265, https://doi.org/10.1002/qj.3844, 2020. a, b
Rai, D. and Raveh-Rubin, S.: Enhancement of Indian summer monsoon rainfall by cross-equatorial dry intrusions, NPJ Climate and Atmospheric Science, 6, 43, https://doi.org/10.1038/s41612-023-00374-7, 2023. a
Rodrigues, R. R., Artana, C., Neto, A. G., Frölicher, T. L., Keenlyside, N., Hobday, A. J., Burger, F. A., Bernardo, P. S., and Araújo, J.: Extreme compound events in the equatorial and South Atlantic, Nat. Commun., 16, 3183, https://doi.org/10.1038/s41467-025-58238-y, 2025. a
Shepherd, T. G.: A common framework for approaches to extreme event attribution, Current Climate Change Reports, 2, 28–38, 2016. a
Smale, D. A., Wernberg, T., Oliver, E. C., Thomsen, M., Harvey, B. P., Straub, S. C., Burrows, M. T., Alexander, L. V., Benthuysen, J. A., Donat, M. G., and Feng, M.: Marine heatwaves threaten global biodiversity and the provision of ecosystem services, Nat. Clim. Change, 9, 306–312, https://doi.org/10.1038/s41558-019-0412-1, 2019. a
Smith, K. E., Burrows, M. T., Hobday, A. J., King, N. G., Moore, P. J., Sen Gupta, A., Thomsen, M. S., Wernberg, T., and Smale, D. A.: Biological impacts of marine heatwaves, Annu. Rev. Mar. Sci., 15, 119–145, 2023. a
Sprenger, M. and Wernli, H.: The LAGRANTO Lagrangian analysis tool – version 2.0, Geosci. Model Dev., 8, 2569–2586, https://doi.org/10.5194/gmd-8-2569-2015, 2015. a
Tennant, W. and Beare, S.: New schemes to perturb sea-surface temperature and soil moisture content in MOGREPS, Q. J. Roy. Meteor. Soc., 140, 1150–1160, https://doi.org/10.1002/qj.2202, 2014. a
Tinker, J., Palmer, M. D., Harrison, B. J., O'Dea, E., Sexton, D. M. H., Yamazaki, K., and Rostron, J. W.: Twenty-first century marine climate projections for the NW European shelf seas based on a perturbed parameter ensemble, Ocean Sci., 20, 835–885, https://doi.org/10.5194/os-20-835-2024, 2024. a, b
Tolman, H. L. and the WWIII development group: User Manual and System Documentation of WAVEWATCH III® Version 4.18, College Park, MD, USA, mMAB Contribution No. 316, https://polar.ncep.noaa.gov/waves/wavewatch/manual.v4.18.pdf (last access: 27 June 2026), 2014. a
Tonani, M., Sykes, P., King, R. R., McConnell, N., Péquignet, A.-C., O'Dea, E., Graham, J. A., Polton, J., and Siddorn, J.: The impact of a new high-resolution ocean model on the Met Office North-West European Shelf forecasting system, Ocean Sci., 15, 1133–1158, https://doi.org/10.5194/os-15-1133-2019, 2019. a
Valcke, S.: The OASIS3 coupler: a European climate modelling community software, Geosci. Model Dev., 6, 373–388, https://doi.org/10.5194/gmd-6-373-2013, 2013. a
Volonté, A., Turner, A. G., and Menon, A.: Airmass analysis of the processes driving the progression of the Indian summer monsoon, Q. J. Roy. Meteor. Soc., 146, 2949–2980, 2020. a
Wakelin, S., Holt, J., Blackford, J., Allen, J., Butenschön, M., and Artioli, Y.: Modeling the carbon fluxes of the northwest European continental shelf: Validation and budgets, J. Geophys. Res., 117, C05020, https://doi.org/10.1029/2011JC007402, 2012. a
Wernli, H. and Davies, H. C.: A Lagrangian-based analysis of extratropical cyclones. I: The method and some applications, Q. J. Roy. Meteor. Soc., 123, 467–489, 1997. a
- Abstract
- Copyright statement
- Introduction
- Methods
- Marine heatwave state and Storm Babet description
- Multi-Hazard Amplification by the MHW
- Discussion
- Conclusions
- Code and data availability
- Author contributions
- Competing interests
- Disclaimer
- Acknowledgements
- Financial support
- Review statement
- References
- Supplement
- Abstract
- Copyright statement
- Introduction
- Methods
- Marine heatwave state and Storm Babet description
- Multi-Hazard Amplification by the MHW
- Discussion
- Conclusions
- Code and data availability
- Author contributions
- Competing interests
- Disclaimer
- Acknowledgements
- Financial support
- Review statement
- References
- Supplement