
the Creative Commons Attribution 4.0 License.
the Creative Commons Attribution 4.0 License.
 | 09 Jul 2026
Usage of normalized soil moisture for improving the performance of rainfall thresholds along transportation corridors
Abraham Alvarez Reyna
Jack Montgomery
Frances O'Donnell
Landslides along transportation corridors pose substantial risks to infrastructure and public safety, necessitating accurate prediction and mitigation strategies. Many early warning systems for landslides are based on rainfall thresholds derived from historical data that distinguish landslide triggering from non-triggering events. However, it is widely recognized that antecedent moisture conditions have a major impact on the likelihood that a rainfall event will trigger a landslide. We aim to improve existing rainfall thresholds for landslides along highways by incorporating antecedent soil moisture conditions. The landslide inventory for this study was compiled from inclinometer data at suspected landslide sites and from landslide reports following major storm events along Alabama highways. This inventory was combined with precipitation data from the National Oceanic and Atmospheric Administration (NOAA) and soil moisture data from NASA's Soil Moisture Active Passive (SMAP) satellite. We evaluated the accuracy of rainfall thresholds from previous studies for forecasting landslides along highways in Alabama. Additionally, we investigated the potential of reducing the number of non-landslide events that exceed the thresholds (false positives) by utilizing soil moisture data derived from SMAP. This study demonstrates that sites with multiple inclinometers in a landslide region produce more robust datasets compared to those with a single inclinometer, enabling more effective differentiation between landslide and non-landslide events. Furthermore, using normalized soil moisture in the development of rainfall thresholds shows potential for reducing false positives, as approximately 75 % of the false positive cases in this study occurred when the soil moisture was at or below average conditions. Our proposed normalized soil moisture-dependent threshold framework will support decision-making systems by enabling users to weigh the trade-offs between potential false alarms and missed alarms, based on the relative costs or risks of each for a given project. The findings will aid transportation authorities and civil engineers in making informed decisions about potential interventions or preventive maintenance.
- Article
(3751 KB) - Full-text XML
- BibTeX
- EndNote


Landslides are frequent geohazards in many parts of the world. Transportation corridors like highways, railways, and tunnels are particularly vulnerable to landslides due to slope modification during construction and the potential for construction on pre-existing landslides. Comprehensive regional and global landslide databases are scarce, though a conservative estimate indicates that around 11.7 % of all landslides in a global database of non-seismically triggered events between 2004 and 2016 impacted road networks (Taylor et al., 2020). Cost estimates for landslides along transportation corridors typically include only direct expenses related to repairs, but landslides also lead to large indirect costs associated with traffic disruptions and road closures (Klose, 2015; Knights et al., 2020). Winter et al. (2016) stated that although landslide-affected transportation corridors rarely result in large fatalities, the social and economic impacts can be severe. These include delays and detours on transportation networks, and disruptions to remote communities' access to services, markets, employment, healthcare, education, and social activities. The range of financial losses attributed to landslides is considerable, with estimates spanning from USD 400 million in 1971 to USD 2.5 billion in 2019 in the United States (Mirus et al., 2020). Small landslides, though less documented, make up 96 % of the events impacting roads and railways in Switzerland, resulting in an annual cost of CHF 6 million (USD 6.5 million) (Voumard et al., 2018). The impact of landslide-induced damage on transportation corridors can be severe and long-lasting, especially when a strategic transportation route is affected. In such cases, the indirect costs (or consequential economic impacts) can be as large as the direct costs (Winter et al., 2016).
Rainfall is one of the most common triggers of landslides (Santangelo et al., 2023; Cepeda et al., 2010) and many warning systems for rainfall-triggered landslides rely on case history-based thresholds to determine whether a given rainfall event is likely to lead to a landslide or not (Conrad et al., 2021). These thresholds are commonly developed by analyzing landslide databases from past rainfall events, with many studies using the power-law equation proposed by Caine (1980) to separate events that triggered a landslide from those that did not. Guzzetti et al. (2007, 2008) compiled internationally developed thresholds prior to 2008, highlighting the key rainfall variables used in various studies to establish rainfall thresholds. Most studies used a combination of cumulated rainfall from an event (E), rainfall intensity (I), and rainfall event duration (D). The most widely applied threshold combinations include intensity–duration (I–D), cumulated rainfall–duration (E–D), and cumulated rainfall–intensity (E–I), typically represented on semi-logarithmic, logarithmic, or Cartesian coordinate systems. A review of 115 thresholds developed between 2008 and 2016 (Segoni et al., 2018a) revealed that nearly 50 % of the defined thresholds were based on I–D relationships, 16 % were based on cumulated rainfall, and 27 % relied on antecedent rainfall. The remaining thresholds fell into other categories (Segoni et al., 2018a).
Rainfall thresholds can be categorized based on their geographical extent as either global (e.g., Kirschbaum et al., 2010, 2015), national (e.g., Lin et al., 2021; Millán-Arancibia and Lavado-Casimiro, 2023; Uwihirwe et al., 2020; Baum and Godt, 2010; Mirus et al., 2020), regional (e.g., Valenzuela et al., 2018; Roccati et al., 2020; Martelloni et al., 2012), or local (D'Ippolito et al., 2023). Limited regional and local studies have specifically focused on rainfall thresholds along transportation corridors. For example, Mandal and Sarkar (2021) divided a 54.8 km-long highway into four sections and established four rainfall intensity (I) and event duration (D) thresholds in a landslide-prone region of the Himalayas. Ray et al. (2010) defined a threshold based solely on in situ and remotely sensed soil moisture for the Highway 50 corridor in the Sierra Nevada Mountains, California, USA, covering an area of 616 km2. Other studies focused on mechanisms of landslide occurrence along highways without introducing thresholds (Fayaz et al., 2022; Sepúlveda et al., 2023; Zhao et al., 2024). Abraham et al. (2021) used a two-dimensional Bayesian approach for landslide occurrence in Idukki, a hilly area in the Western Ghats of the Indian Peninsula, where landslides triggered by heavy rainfall frequently disrupt the transportation network. Mirus et al. (2018a) investigated landslides along the Seattle–Everett railway corridor and established thresholds based on the relationship between 3 d cumulative rainfall and 1 d antecedent soil saturation. Mirus et al. (2018b) had extensive monitoring data from the railway that allowed for accurate analysis of antecedent rainfall and soil moisture conditions during the critical period leading up to the failure. Unlike railroads, roads and highways are often less rigorously monitored, resulting in limited data on the precise timing of landslide occurrences. The lack of temporal precision presents a notable challenge in defining reliable thresholds for landslide prediction.
Bogaard and Greco (2018) and Segoni et al. (2018b) highlighted the absence of a thorough hydro-meteorological analysis in empirically based rainfall I–D thresholds for landslide initiation. Rainfall serves as the final “push” to initiate landslides, while other factors, such as soil moisture, infiltration, and storage and drainage capacity, play vital roles (Gain et al., 2022). Recent studies have employed hydro-meteorological thresholds, which differ from traditional intensity–duration (I–D) plots by incorporating not only rainfall variables, such as cumulative rainfall and maximum intensity, but also soil moisture or volumetric water content (e.g., Marino et al., 2020; Oorthuis et al., 2023). Lazzari et al. (2020) employed two regression models to analyze landslide occurrences, focusing on saturation degrees below and above 0.7 to identify the most critical conditions for landslide initiation. However, their study only focused on landslide events and did not consider non-landslide events. Wicki et al. (2020) utilized a soil moisture model based on soil hydrological properties and found that the success of thresholds depends on the distance between the measurement station, where the soil hydrological properties are derived, and the landslide location. Due to the inherent uncertainty and spatial variability in soil moisture models, especially in poorly instrumented regions, applying thresholds can lead to substantial inaccuracies in predicting landslide initiation.
Remote sensing-based soil moisture datasets have become increasingly common in landslide studies, as they allow for measurements over a much larger area than instrument-based measurements (Brocca et al., 2012; Rodríguez-Fernández et al., 2017; Skulovich and Gentine, 2023; Stanley et al., 2021). Zhuo et al. (2019) revealed that using the remotely sensed soil moisture product from the ESA Climate Change Initiative (CCI-SM) showed that more than 80 % of landslides happened when soil moisture was in the top half of the wetness range. However, Yang et al. (2023) found that the use of remotely sensed soil moisture data did not meaningfully enhance the performance of rainfall thresholds in Jiangjia Gully (China), primarily due to its coarse spatial resolution. Abancó et al. (2024) utilized root-zone soil moisture data from SMAP L4 to assess landslide susceptibility. However, they found that in tropical regions, the critical layer for landslide triggering during the wet season is the unsaturated layer beneath the root zone, which cannot be captured using remotely sensed data. These studies highlight the challenges of using remotely sensed products, as their effectiveness can vary across different regions depending on topography and climate.
This study aims to answer the following questions: (1) What empirical rainfall thresholds can be established to assess the timing of rainfall-triggered landslides along highways in Alabama, where previous events have resulted in substantial roadway damage and traffic disruption (Montgomery et al., 2019; Knights et al., 2020)? (2) How does incorporating normalized soil moisture into rainfall threshold formulations affect their regional predictive performance, particularly with respect to reducing false positives and improving correspondence with observed landslide occurrences? To our knowledge, no previous studies have systematically evaluated the effectiveness of rainfall thresholds for landslide prediction in Alabama or the surrounding states. The objective of this study is to provide a regional assessment of landslide timing at previously identified unstable sites using hydrologic indicators, recognizing that detailed geotechnical characterization remains essential for site-specific stability analysis and design. Accordingly, the proposed thresholds are intended to complement, rather than replace, site-specific geotechnical slope stability evaluations
Landslide data were compiled from two primary sources. The first dataset consists of inclinometer measurements collected at unstable highway sites by the Alabama Department of Transportation (ALDOT) over a 20-year period (2001–2021). Inclinometer readings were collected manually during scheduled inspections as part of routine monitoring of sites previously identified as having stability concerns. All measurements were obtained with the same probe and collected by the same trained geologists with more than 10 years of experience in landslide monitoring in Alabama, ensuring consistency in instrumentation and data collection procedures.
The inclinometer datasets included quarterly readings and captured both major landslides and smaller deformation events that may not have resulted in visible damage or formal documentation. Landslide events were identified based on displacement thresholds that distinguish measurable slope movement from background deformation (discussed in Sect. 3.1). The resulting inclinometer-based inventory includes 87 landslides, of which 48 occurred after 31 March 2015, when the satellite-based soil moisture data used in this study became available. A preliminary version of this inventory was presented by Rahimikhameneh et al. (2024) for nine sites; the present study expands and refines that work by including additional locations and updated monitoring records.
The second dataset consists of landslides documented along Alabama highways following federally declared disasters between 2009 and 2015, as reported by Knights et al. (2020). These events were submitted to the Federal Highway Administration (FHWA) for federal repair funding and were each attributed to a specific disaster declaration, allowing for clear identification of the associated triggering rainfall event. This inventory includes 164 landslides, 64 of which occurred after 31 March 2015. Unlike the inclinometer-based dataset, this inventory does not include non-landslide cases, as only damaged sites were reported.
Daily precipitation data were obtained from the CPC Unified Gauge-Based Analysis of Daily Precipitation (Xie et al., 2007), provided by the National Oceanic and Atmospheric Administration (NOAA PSL, 2024). Soil moisture data were derived from NASA's Soil Moisture Active Passive Level 4 (SMAP-L4) dataset (Reichle et al., 2018). The rainfall–soil moisture analysis period spans 2015–2021, corresponding to the availability of consistent SMAP observations. SMAP was selected because it provides publicly available, continuous, spatially consistent, and long-term observations that are appropriate for regional-scale assessments where finer-scale moisture measurements are unavailable. Products with high temporal resolution for soil moisture were selected, given the dynamic nature of landslide events and the objective of moving towards a threshold suitable for landslide prediction. However, products with high temporal resolution generally have a coarser spatial resolution. Gridded precipitation and soil moisture data were extracted for the grid cells containing the inclinometer locations.
This study evaluates the applicability of rainfall I–D thresholds for rainfall-triggered landslides along highway corridors in Alabama and investigates whether incorporating antecedent soil moisture conditions improves predictive performance. The methodological framework consists of landslide event identification, rainfall threshold evaluation, soil moisture normalization, and performance assessment. Landslide events were identified using inclinometer displacement records. An event was defined as measurable subsurface movement exceeding background deformation levels, allowing clear differentiation between landslide and non-landslide conditions. Each identified event was temporally matched with corresponding daily precipitation data to characterize the triggering rainfall conditions. Rainfall events were defined following standard I–D formulations, and cumulative rainfall and duration were calculated for each event window. Previously published I–D thresholds were applied to the compiled event dataset to evaluate their predictive performance. For each rainfall event, observed rainfall intensity and duration were compared against the selected threshold curves to determine exceedance. Events were subsequently classified into true positives, false positives, false negatives, and true negatives.
3.1 Inclinometer Processing
An inclinometer monitors deformation perpendicular to the casing axis, providing measurements of subsurface horizontal deformation. The most common analysis approach for inclinometer data involves plotting the relative shape of the casing compared to its initial condition. These cumulative lateral deformation plots are commonly used to identify potential shear zones (Machan and Bennett, 2008; Stark and Choi, 2008). ALDOT utilized biaxial inclinometers at the sites considered in this study, which provide measurements in both the A- and B-directions with a reading interval of 2 ft (0.61 m). In ALDOT practice, the A-direction aligns with the direction of the maximum displacement. We extracted the displacements along the inclinometers from the reading files and created CSV files for subsequent processing. We generated cumulative lateral deformation versus depth plots for all dates in a single profile for each A-direction and B-direction using Python 3.10. and the following libraries: pandas (McKinney, 2010), NumPy (Harris et al., 2020), and matplotlib (Hunter, 2007).
The cumulative lateral deformation profiles for each inclinometer reading were processed to identify potentially erroneous readings and to identify the depth of the top of the shear zone at each site. Inclinometers without any movement events during the monitoring period were removed from the inventory, as we are focusing on sites that are susceptible to landslides. We filtered erroneous readings by removing those with notable changes in displacement (> 2.5 mm) between consecutive readings at the bottom of the casing, and those with spikes in displacement at a single depth without corresponding movements at other depths. Quantifying other potential sources of error in inclinometer readings can be more challenging. Mikkelsen (2003) reviewed errors in inclinometer measurements and estimated that the random error in inclinometer readings is approximately ±0.16 mm for an individual reading. This random error accumulates at a constant rate over the entire length of the casing. Therefore, the accumulated random error for a 30 m casing with readings taken every 0.5 m would be approximately ±1.24 mm at the top of the casing. Random errors cannot be detected and removed, but understanding their magnitude offers a potential threshold to separate potential noise in the inclinometer data from true movements. Allasia et al. (2020) also investigated potential sources of error in inclinometer measurements by repeatedly performing double readings under stable (undeformed) conditions. Their analysis quantified the random error inherent in the measurement process. For cumulative displacements (over the entire borehole and multiple measurement cycles), they found that the accuracy, expressed as the standard deviation of cumulative displacement when no actual deformation occurred, ranged from approximately 0.10 to 0.38 mm for A groove direction (in tubes about 60 m long) and from about 0.41 to 1.43 mm for B groove direction. These studies demonstrate that measuring displacements of less than 1 mm can be challenging with traditional inclinometer systems.
Figure 1 presents examples of cumulative lateral deformation profiles from three different inclinometers in the ALDOT database. After removing erroneous readings, each deformation profile was manually reviewed to identify potential shear zones. Profile A is an example of a site with no movement and was not included in the analysis because it did not represent a location susceptible to landslides. Additionally, inclinometers with deformations extending to the bottom of the casing (indicating the casing does not extend past the unstable mass) were excluded from the inventory. These were excluded because movements originating beyond the bottom of the casing make it difficult to reliably determine the location and characteristics of the actual shear zone. Profile B exhibits two distinct zones of concentrated displacement, each corresponding to a separate shear surface within the sliding mass. This configuration indicates the presence of multiple active shear zones, suggesting that movement occurred along more than one failure plane. In contrast, Profile C shows major deformation localized along a single, well-defined shear zone, reflecting movement concentrated on one failure surface. For the profile types represented by B and C, displacement values were extracted from the top of the shallowest shear zone in each reading.
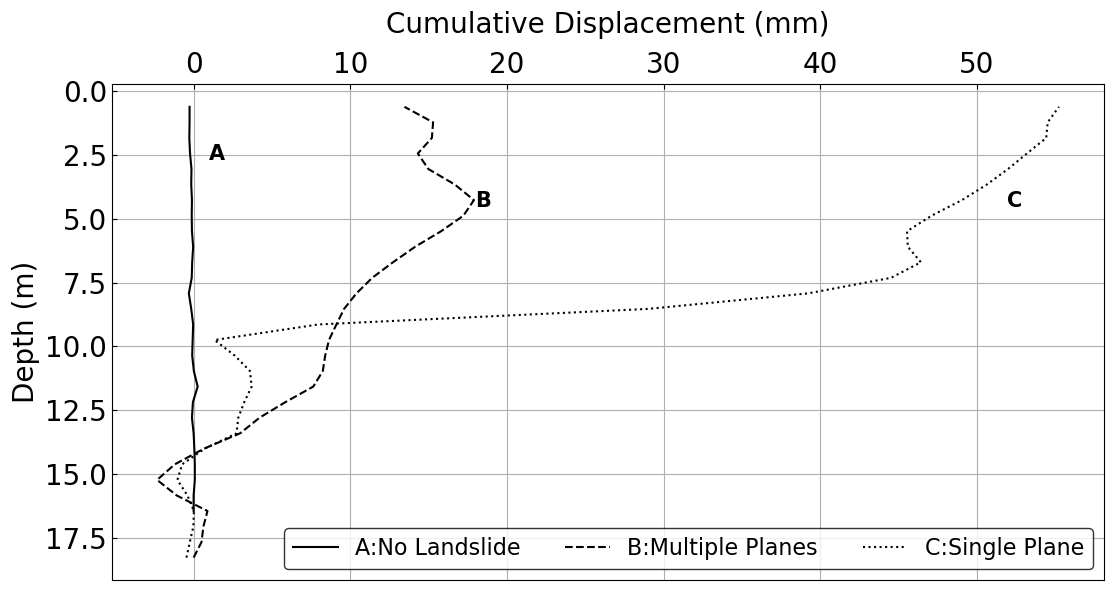
Figure 1Examples of cumulative lateral displacement profiles of inclinometer casings relative to the initial position.
If the reading interval showed a change in displacement of less than 1 mm, all storms in that reading interval were considered non-landslide events, as no detectable movement occurred during that reading interval. When a landslide event was detected between two inclinometer readings, we assumed the event with the largest cumulative precipitation during the reading period triggered the landslide. The other storm events during that reading interval were excluded from the analysis, as there is uncertainty in which event (or combination of events) caused the movement. For this reason, our database has more reliable estimates of non-triggering storm events, but uncertainty in the magnitude of precipitation for triggering events from the inclinometer data.
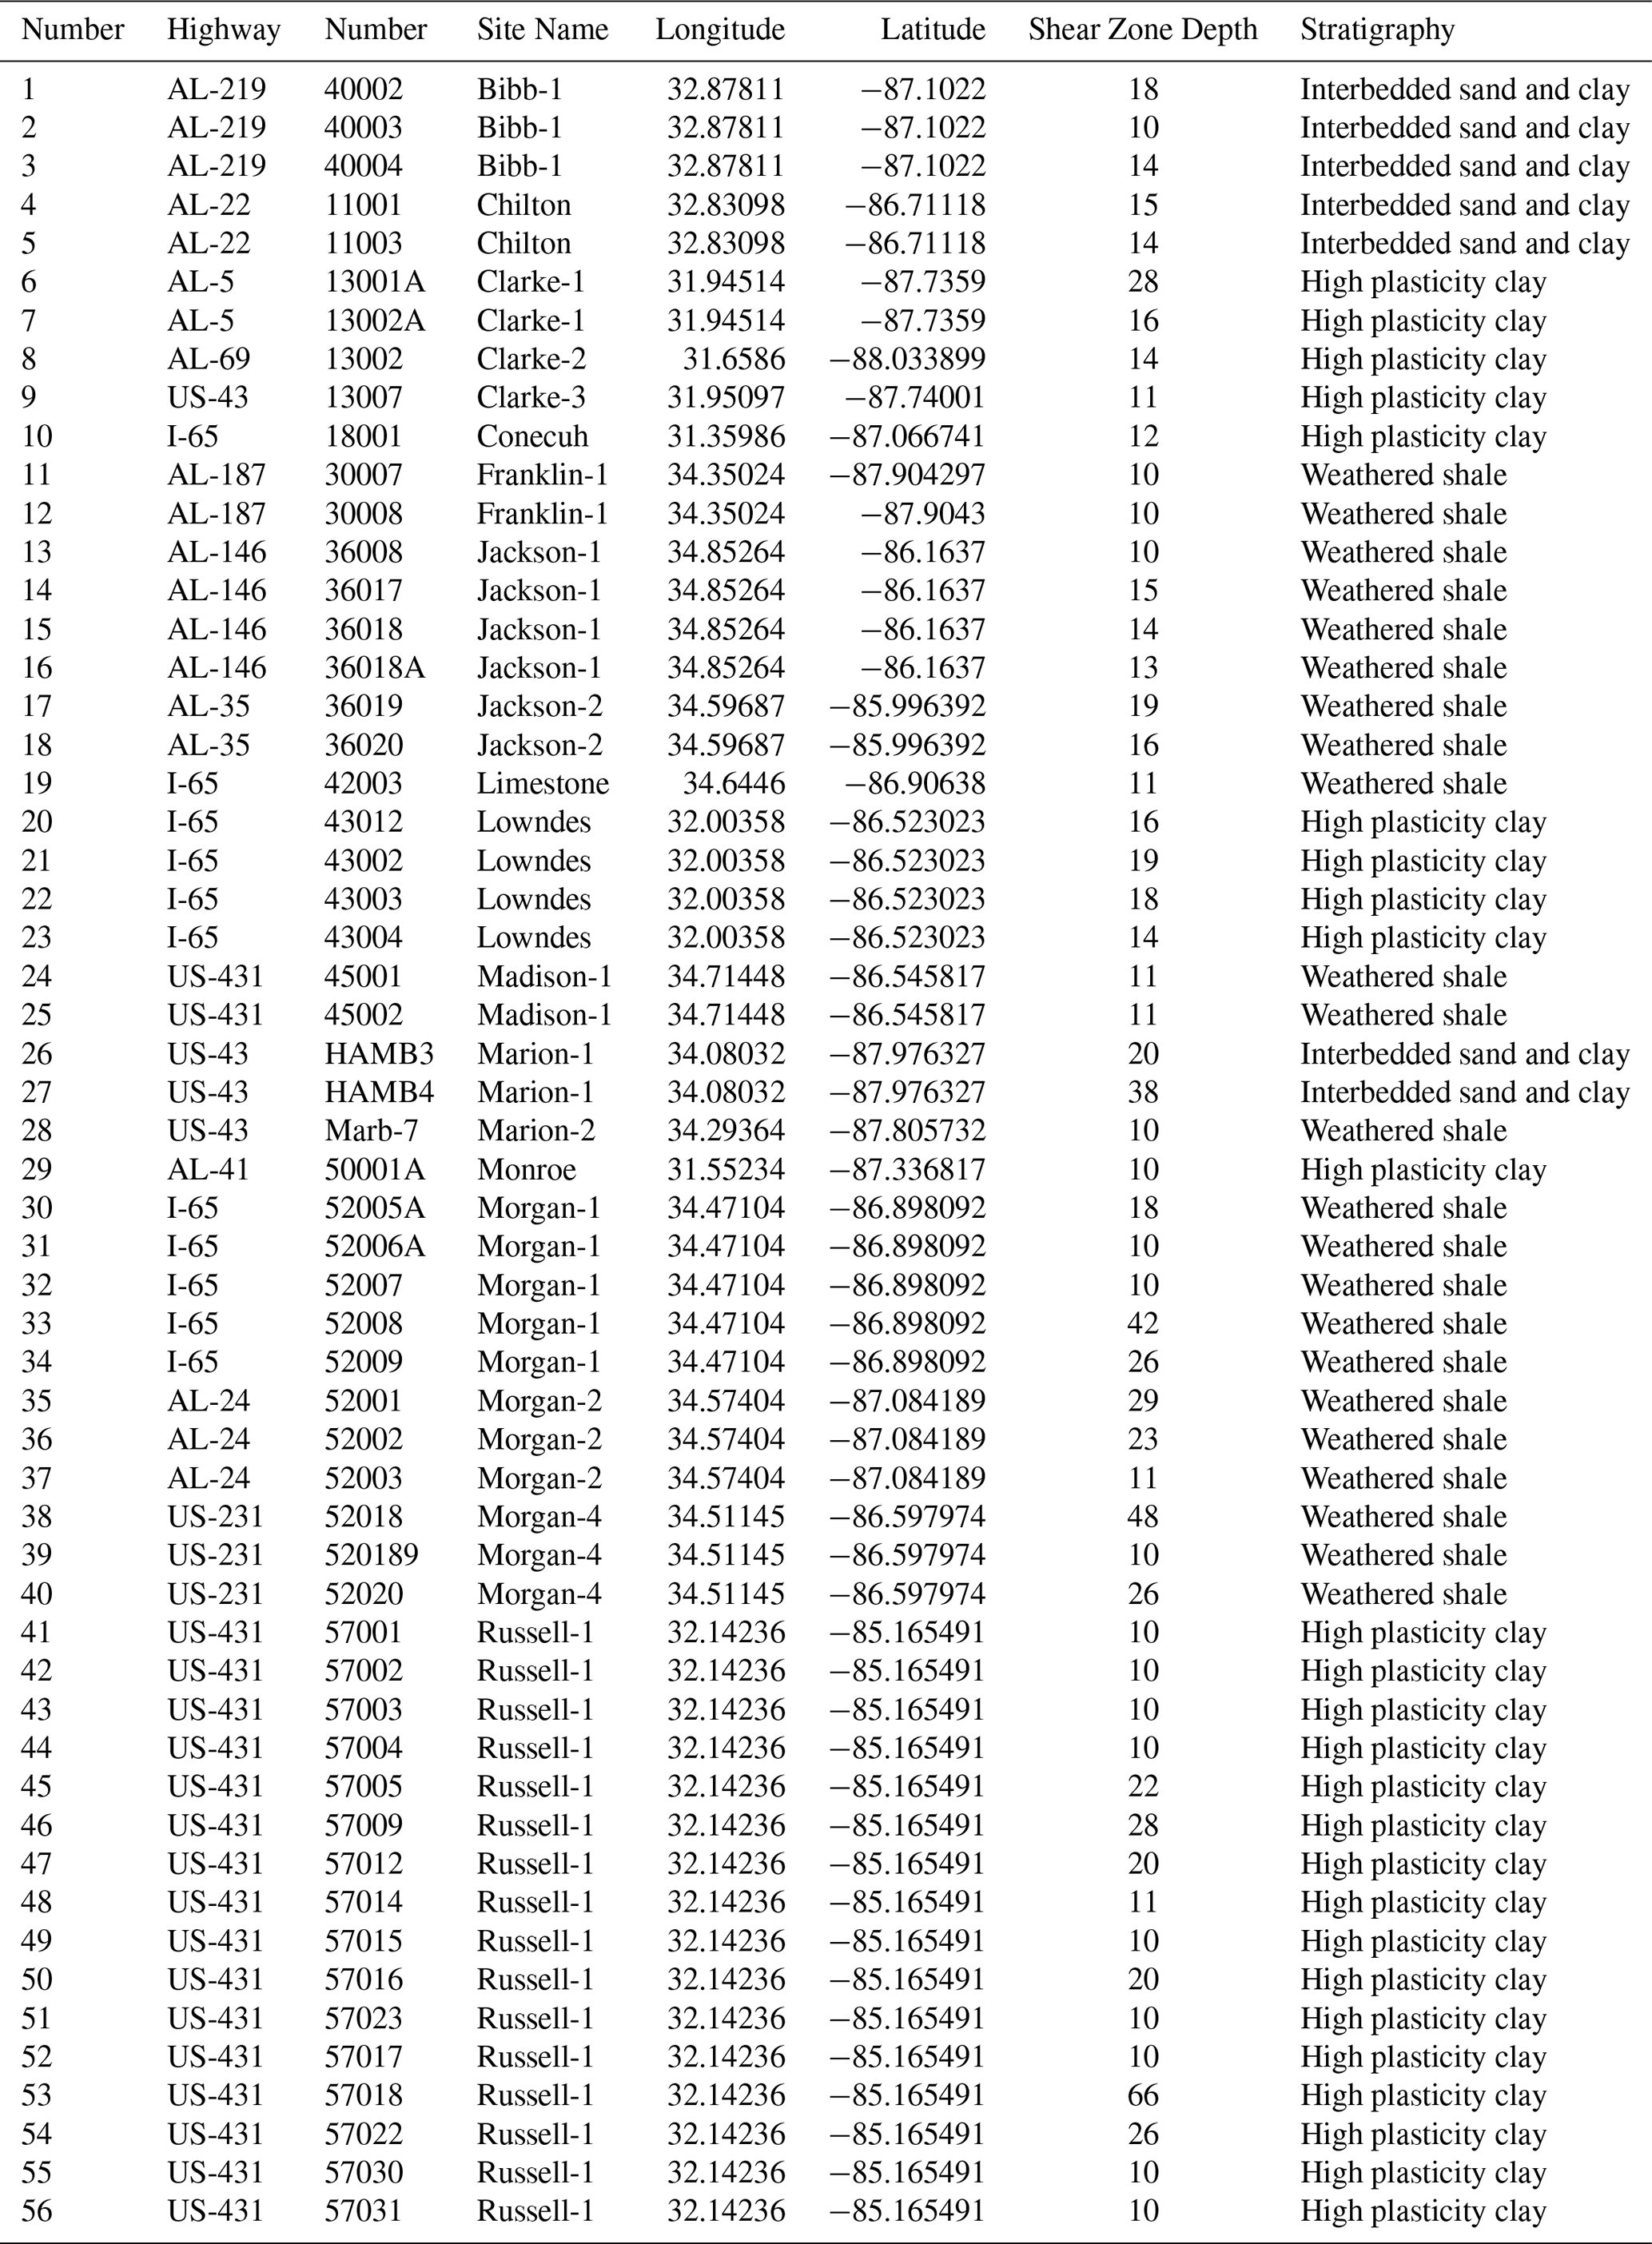
Following this screening process, the final inventory included 56 inclinometers with identifiable shear zones distributed across 19 sites. The list of inclinometers with the latitude and longitude, site name, and depth of shear zone is shown in Table A1 (Appendix A). We also categorized each site based on the stratigraphy near the shear zone as either weathered shale, interbedded sands and clays, or high-plasticity clay using the geologic map from Szabo et al. (1988) and boring logs from the inclinometer installations when available. Of the 19 sites, seven are located in geologic units consisting primarily of high-plasticity clay, nine had failures in weathered shale layers, and three were in units with interbedded sand and clay layers (Table A1). The inventory includes six sites with only a single inclinometer and 13 sites with multiple inclinometers. Figure 2 shows the landslide locations from the two inventories in the study region: the inclinometer-based inventory (this study) and the landslide inventory compiled by Knights et al. (2020).
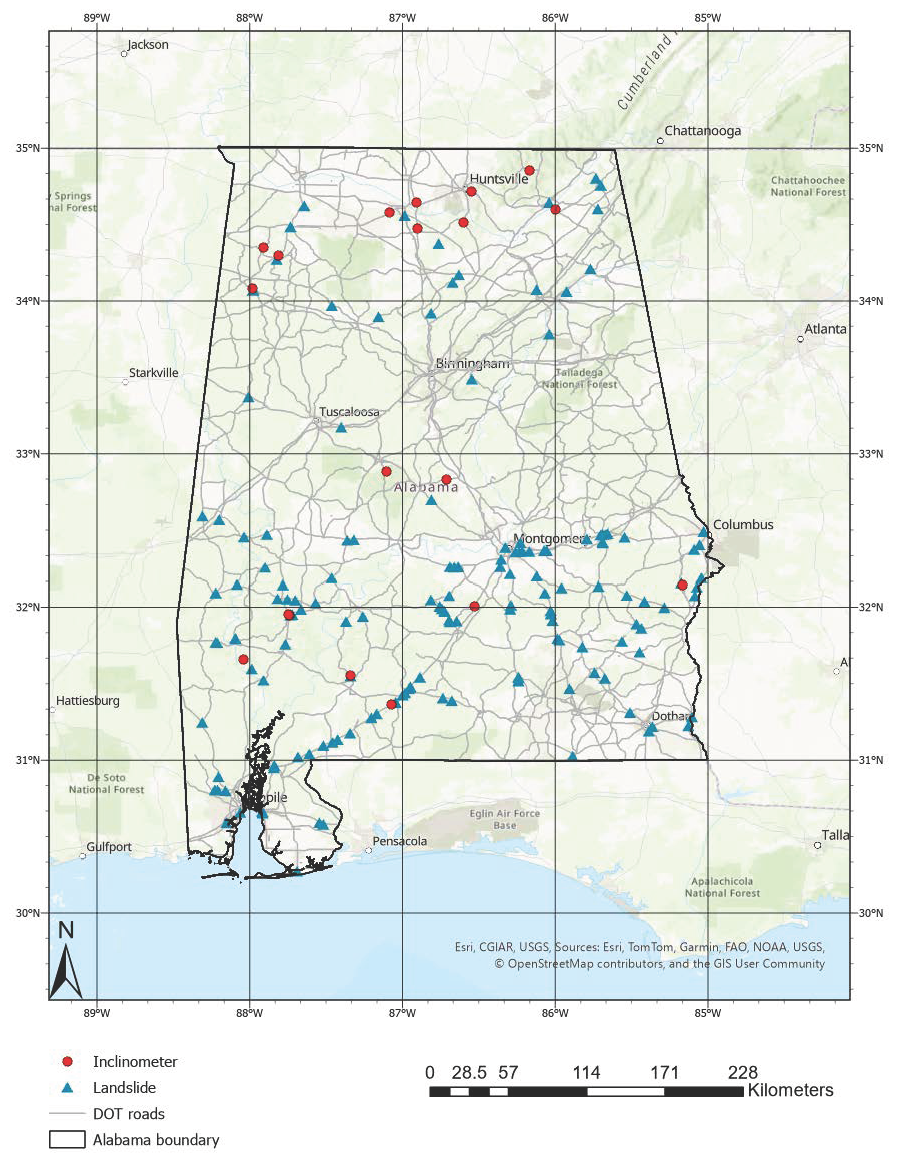
Figure 2Spatial distribution of landslide sites from the processed inclinometer and landslide inventory compiled by Knights et al. (2020) (Esri, CGIAR, USGS, Sources: Esri, TomTom, Garmin, FAO, NOAA, USGS, ©OpenStreetMap contributors, and the GIS User Community | Powered by Esri).
The cumulative distribution of displacement changes at the top of the slide plane for all readings was extracted and plotted as a cumulative histogram of displacement variations at that depth. As shown by Rahimikhameneh et al. (2024), this distribution indicates that approximately 50 % of the readings exhibit displacement changes of less than 1 mm, likely within the instrument's measurement uncertainty, while about 13 % show displacements greater than 5 mm. These two thresholds were consequently adopted to distinguish between landslide events (≥ 5 mm of movement between consecutive readings) and periods of negligible movement (< 1 mm of movement between consecutive readings). These thresholds are also used in this study. Events with displacements between 1 and 5 mm pose a challenge as they could indicate small landslide events or measurement errors. As no clear method exists to distinguish between these possibilities, such readings were excluded from this analysis to focus only on confirmed landslide and non-landslide events. It is important to emphasize that the ≥ 5 mm criterion represents renewed displacement along pre-existing shear zones at sites already identified as unstable. The inclinometer casings are installed in known landslide areas, and the recorded movements reflect reactivation of established failure surfaces rather than the initiation of new landslides. Accordingly, the defined threshold is intended to identify periods of renewed movement at previously unstable highway slopes, not to detect first-time failures at sites without a history of instability.
3.2 Precipitation and Soil Moisture Processing
We used Python (v3.11) and ArcGIS Pro (v3.0, ESRI) to process precipitation and soil moisture data. Daily precipitation from the CPC Unified Gauge-Based Analysis (NOAA PSL, Boulder, CO; 28 × 28 km resolution) was divided into storm events using a 1 mm rainy-day (Leonarduzzi et al., 2017) threshold. Rainfall intensity was computed as total event rainfall divided by event duration. Because annual precipitation is relatively uniform across Alabama (127–152 cm yr−1), no normalization by mean annual precipitation was applied. We defined an independent rainfall event as a sequence of consecutive days with more than 1 mm d−1 of precipitation. This 1 mm d−1 threshold ensures that annual rainfall totals are not unrealistically reduced and that multiday storm durations remain physically meaningful. Under this definition, a dry period of at least 24 h (i.e., a day with < 1 mm of rainfall) indicates the end of one event and the beginning of another, meaning that consecutive storms separated by a full dry day are treated as separate events. Using this event-separation algorithm, all rainy days without a dry period in between were grouped into the same storm. For each identified storm, cumulative rainfall was computed by summing all daily precipitation within the event, the number of rainy days was taken as the event duration, and rainfall intensity was calculated as cumulative rainfall divided by event duration. This provided a consistent metric for rainfall intensity across all events.
Soil moisture data were obtained from NASA's SMAP Level 4 root-zone product (9 × 9 km resolution), which is considered most suitable for shallow landslides (Marino et al., 2020). Given this shallow depth and coarse resolution, the root zone soil moisture is considered as a regional indicator of average wetness in this study and not a site-specific measure of soil moisture, nor a proxy for the matric suction at the depth of the shear zone.
An example of the processed data is shown in Fig. 3 for landslide sites on Alabama Highway 69 (AL-69) and Alabama Highway 5 (AL-5). The inclinometer readings indicating landslide events are shown as stars. Figure 3 shows that these landslide events are most prevalent when soil moisture levels are higher than average. In other words, rainfall of the same intensity that previously did not trigger landslides could induce landslides if the soil moisture condition is sufficiently elevated. The two sites exhibit different ranges and average values of soil moisture, highlighting the challenge of comparing data between sites. To address this challenge, we used normalized soil moisture values based on monthly moving averages on the first day of the storm in the prediction thresholds. We normalized the value using the long-term average, and the same average was used to normalize all readings for a given location, thereby avoiding obscuring extreme values. Normalized soil moisture is used as an index of moisture conditions near the slide area relative to average conditions at the same location. A normalized soil moisture of 1.0 represents an average condition for that location, while a value less than 1.0 is drier than average and greater than 1.0 is wetter than average. This normalization was performed in order to compare soil moisture conditions across the state using a single, consistent metric. The use of normalized soil moisture reduces bias associated with spatial heterogeneity by expressing moisture conditions relative to each grid cell's long-term soil moisture average and also helps minimize the influence of local baseline differences in soil properties and hydroclimatic conditions, thereby enabling more consistent comparisons across the study area.
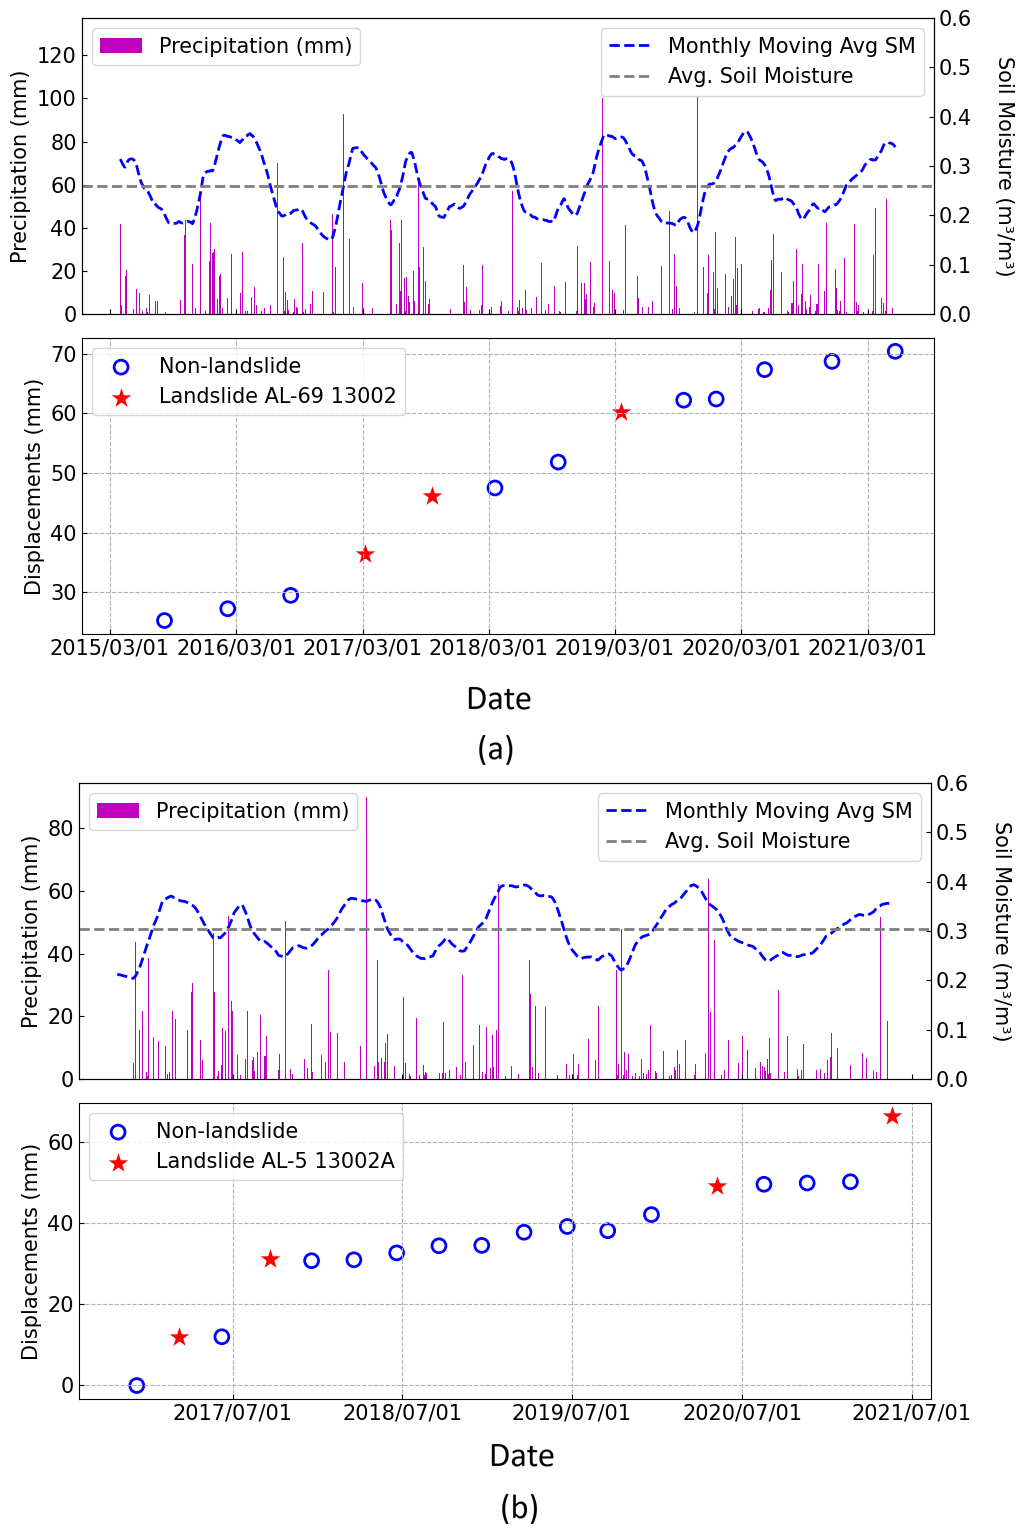
Figure 3Time series of inclinometer displacement (red star indicates landslide and open circle indicates non-landslide), daily rainfall (purple bars), and soil moisture (SMAP L4, blue line) for (a) AL-69 Inclinometer 13002 and (b) AL-5 Inclinometer 13002A.
3.3 Relating landslides and storm events
As previously mentioned, most sites were instrumented with multiple inclinometers. Instead of analysing each inclinometer independently, inclinometers at the same site were grouped to determine a failure status for the entire site. If a landslide was detected by at least one inclinometer (change in displacement > 5 mm) at a monitoring site, the entire site was considered to have experienced failure during that reading interval, designating the associated storm as a triggering event. A non-landslide event was defined as such if the change in displacement for the entire group of inclinometers at a site was less than 1 mm during that reading interval. For sites with a single inclinometer, we used the same threshold to identify triggering events (movements greater than 5 mm). We excluded the non-triggering events from single inclinometer sites in our analysis, as we observed that it was common at multiple inclinometer sites for one inclinometer to exceed the threshold (indicating the site had failed) while others did not. This leads to uncertainty in non-triggering events for sites with only a single inclinometer.
The processing steps described above are illustrated in this section using the landslide site on Alabama Highway 219 (AL-219) as an example. This site is located within the Gordo formation of the Tuscaloosa group, near the boundary with the Coker formation (Szabo et al., 1988). The Gordo formation mainly consists of cross-bedded sand, gravelly sand, and lenticular clay beds, with the lower part dominated by gravelly sand containing chert and quartz pebbles. The Coker formation is composed of micaceous sand and clay with some gravel layers containing quartz and chert pebbles. Figure 4 illustrates the distribution of the four inclinometers at the landslide site. It is common practice to install multiple inclinometers at varying distances across a landslide site to monitor ground movement in different zones of the affected area. Consequently, these inclinometers often show non-uniform patterns of movement despite all being within the same landslide.
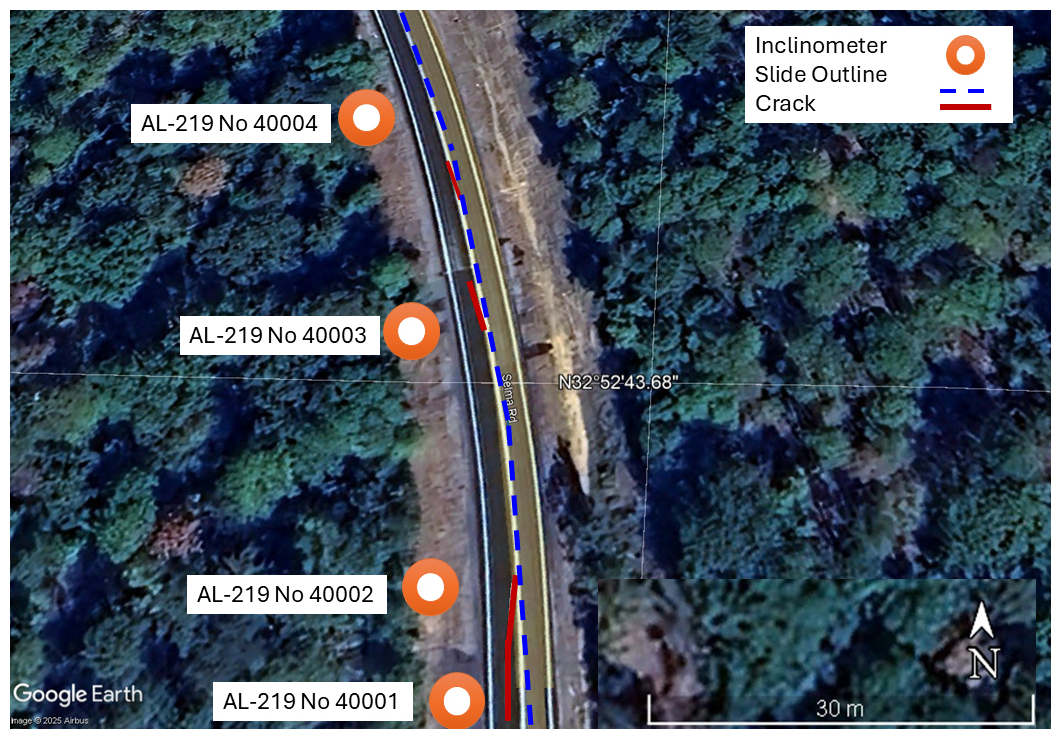
Figure 4Location of four inclinometers at the AL-219 site in Centerville, Alabama, and cracks caused by the landslide (base map: Image © 2025 Airbus; Google Earth).
The displacement recorded by inclinometers at AL-219, along with the rainfall and normalized soil moisture, is shown in Fig. 5. Inclinometers AL-219 40003 and AL-219 40004 recorded landslide events during the study period, but not always in the same reading interval. For example, AL-219 40003 detected movement on 23 January 2017 while no movement was observed in the other inclinometers. Both AL-219 40003 and AL-219 40004 recorded movement on 31 May 2018, indicating activity at different locations of the same landslide. AL-219 40001 and AL-219 40002 did not show any movement during the study period and therefore were not used in the analysis. These observations emphasize the importance of using a cluster of displacement recordings to monitor and capture movements across an affected area during a landslide event.
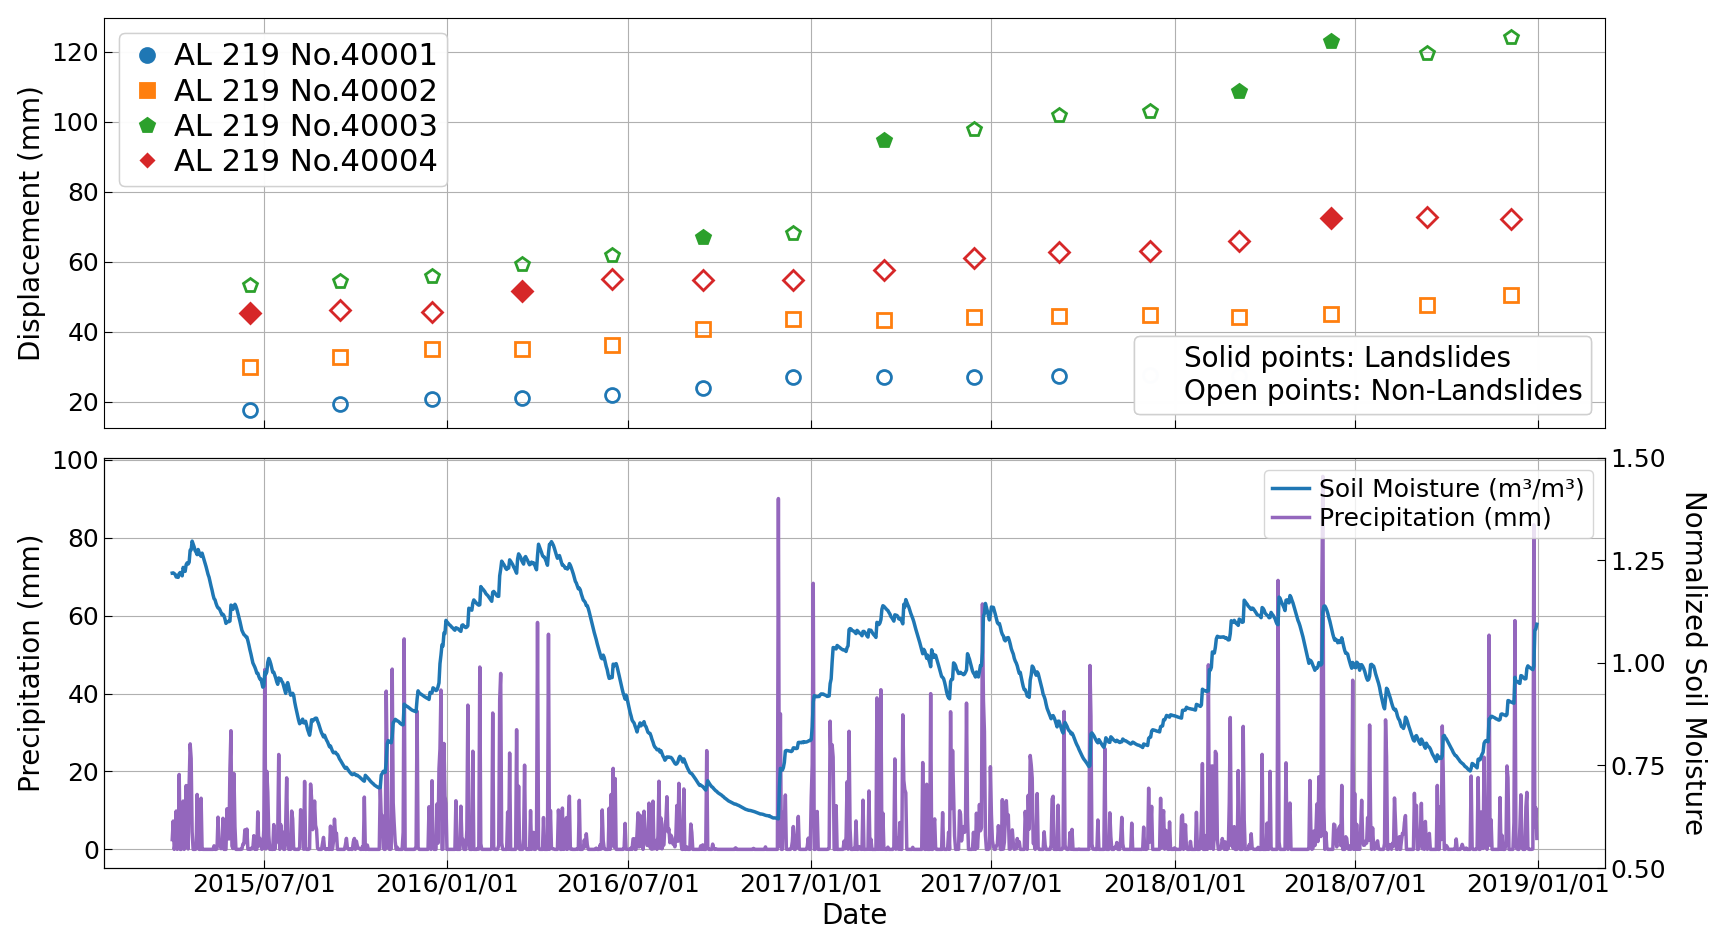
Figure 5Time series showing landslide events and displacements of four inclinometers of a monitoring site (solid symbol indicates landslide events and open symbols indicate non-landslide events) integrating with precipitation and normalized soil moisture.
3.4 Assessing threshold performance
The performance of each threshold was evaluated using a confusion matrix (also called a contingency table). A true positive (TP) corresponds to an I–D pair, representing rainfall intensity (I) and duration (D), that exceeds the threshold and is associated with an observed landslide event. A false positive (FP) refers to an I–D pair that exceeds the threshold without a corresponding landslide occurrence, representing a potential false alarm. A false negative (FN) occurs when the I–D pair falls below the threshold, yet a landslide is recorded, indicating that the threshold failed to capture an event. A true negative (TN) is an I–D pair below the threshold for which no landslide is observed, correctly identifying a non-landslide event (Piciullo et al., 2017).
To quantify the performance of each threshold, the performance metrics used by Piciullo et al. (2017) were applied. The Probability of Detection (POD), also known as the true positive rate (TPR) (Eq. 1), represents the proportion of actual positive cases correctly identified. The Probability of False Detection (POFD), also called the false positive rate (FPR) (Eq. 2), refers to the proportion of non-landslides incorrectly predicted as landslides. The Probability of False Alarm (POFA), also known as the false discovery rate (Eq. 3), represents the proportion of predicted landslide events that are actually false alarms. Lastly, the Hanssen and Kuipers Skill Score (HK) (Hanssen and Kuipers 1965), also referred to as the True Skill Statistic (Eq. 4), reflects how well the threshold distinguishes between positive and negative cases:
TPR measures the proportion of actual positive cases correctly identified and ranges from 0 (no positives detected) to 1 (all positives detected), with higher values indicating better sensitivity. In contrast, FPR quantifies the proportion of negative cases incorrectly classified as positive, and lower FPR values are desirable as they reflect fewer false alarms. POFA represents the proportion of predicted positive events that are actually false; thus, lower POFA values indicate greater precision in the model's predictions. The HK score, defined as the difference between TPR and FPR, evaluates the model's ability to distinguish between positive and negative cases. HK scores closer to 1 suggest strong discriminatory power, while values near 0 imply that the model performs no better than random guessing.
To provide a more balanced evaluation of threshold performance, the Matthews Correlation Coefficient (MCC) was also calculated (Eq. 5). MCC measures the correlation between observed and predicted classifications using all elements of the confusion matrix (true positives, true negatives, false positives, and false negatives). Unlike metrics that focus on only one aspect of performance, MCC provides a single summary statistic that accounts for both correct and incorrect classifications. It is particularly useful when the dataset is imbalanced, which is common in landslide occurrence datasets where non-landslide cases significantly outnumber landslide events. MCC ranges from −1 to +1, where +1 represents perfect prediction, 0 indicates performance equivalent to random prediction, and −1 reflects complete disagreement between observations and predictions.
Higher MCC values indicate stronger agreement between predicted and observed outcomes, reflecting better overall classification performance.
We evaluated the applicability of previously established rainfall intensity–duration (I–D) thresholds to unstable highway sites in Alabama by comparing storm events associated with landslides in our compiled inventory to the empirical thresholds proposed by Godt et al. (2006), Guzzetti et al. (2008), and Marino et al. (2020). The analysis included the full landslide inventory spanning 2001–2021. The influence of antecedent soil moisture conditions was examined separately using a subset of the inventory (post-2015) that aligned with the availability of SMAP data. Threshold performance was assessed using confusion matrix–based metrics described in Sect. 3.4 (Table 1). As shown in Figure 6a and Figure 6b, the Godt et al. (2006) threshold provides the best overall balance, with a high TPR (0.85), low FPR (0.11), and the highest HK of 0.75, indicating strong discriminatory power. Marino's model is less conservative, yielding the lowest FPR (0.03) and a relatively low POFA (0.35), but at the cost of lower sensitivity (TPR = 0.64) because many landslide events fall below the threshold. In contrast, the Guzzetti model achieves the highest sensitivity (TPR = 0.94) but with a high FPR (0.34) and POFA (0.79), indicating a tendency to overpredict landslide occurrence relative to our inventory. MCC values provide an additional measure of overall classification performance by considering all four components of the confusion matrix simultaneously. As shown in Table 1, the Godt et al. (2006) threshold yields the highest MCC value (0.61), indicating the strongest overall agreement between predicted and observed landslide events in the Alabama dataset. Marino et al. (2020) shows a slightly lower MCC (0.57), reflecting its conservative nature, which reduces false alarms but also results in a larger number of missed landslide events. In contrast, the Guzzetti et al. (2008) threshold produces a substantially lower MCC (0.36), primarily due to the large number of false positives associated with this model. These results reinforce the conclusions drawn from the HK metric, suggesting that the Godt threshold provides the most balanced predictive performance for the study area when only rainfall-based thresholds are considered.
Table 1Comparison of performance metrics for previously developed thresholds for the inclinometer inventory.

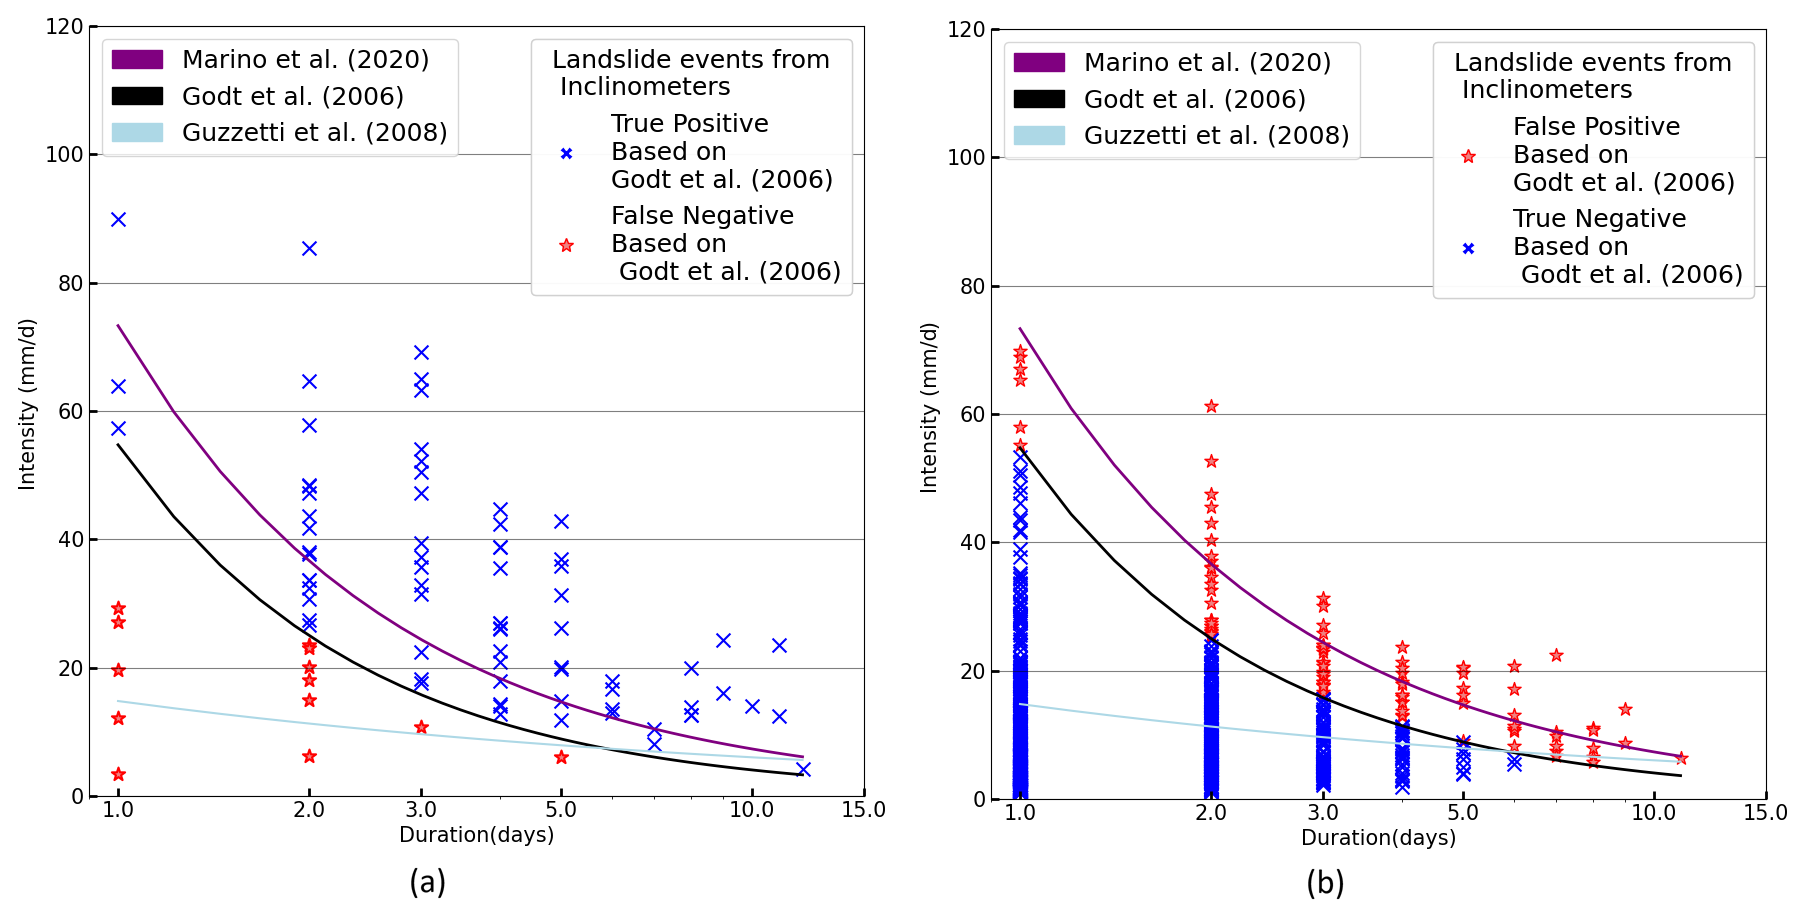
Figure 6Comparison of the (a) landslide events and (b) non-landslide events with previously developed rainfall thresholds for the inclinometer-based inventory from this study.
We also compared all three thresholds with the landslide inventory compiled by Knights et al. (2020), as shown in Fig. 7. We did not compute statistics for this inventory as it does not include any non-landslide points. The Godt et al. (2006) threshold correctly identified 156 of the 164 (95.1 %) landslide events with only eight false negatives. The Guzzetti et al. (2008) and Marino et al. (2020) thresholds had similar performances to Fig. 6 with the Guzzetti et al. (2008) being the most conservative and therefore having the fewest number of false negatives. These comparisons demonstrate that the Godt et al. (2006) threshold provides the most balanced fit for our inventory, and we will focus on this threshold in the remaining sections.
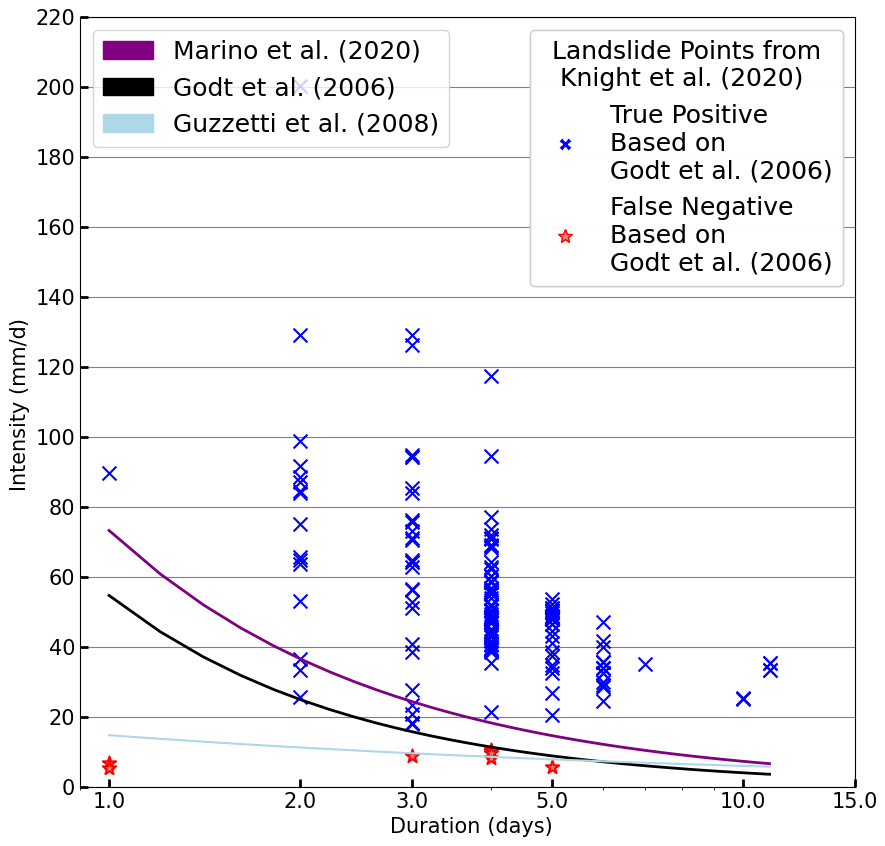
Figure 7Comparison of the landslide events with previously developed rainfall thresholds for the landslide inventory compiled by Knights et al. (2020).
4.1 Landslide Events Considering Soil Moisture
The large number of false positives in the previous section led us to examine whether including normalized soil moisture alongside precipitation data could help separate events that were more or less likely to cause a landslide. Both landslide-triggering and non-landslide-triggering events were assigned a normalized soil moisture value by taking the soil moisture on the first day of the storm event and normalizing it by the average over the study period (2015–2021). The normalized soil moisture values for the storm events ranged from 0.2 to 2.15. We chose to bin the values symmetrically with an interval of 0.1, and the outermost bins (below 0.75 and above 1.25) were extended to ensure sufficient data in each bin. Normalized soil moistures between 0.95 and 1.05 represent approximately average conditions, values below 0.95 represent drier-than-average conditions, and values greater than 1.05 represent wetter-than-average conditions. The inclinometer-based inventory is shown with these bins in Fig. 8 and the Knights et al. (2020) inventory is shown in Fig. 9. The number of events has been reduced compared to Figs. 6 and 7, as SMAP data are only available after 31 March 2015.
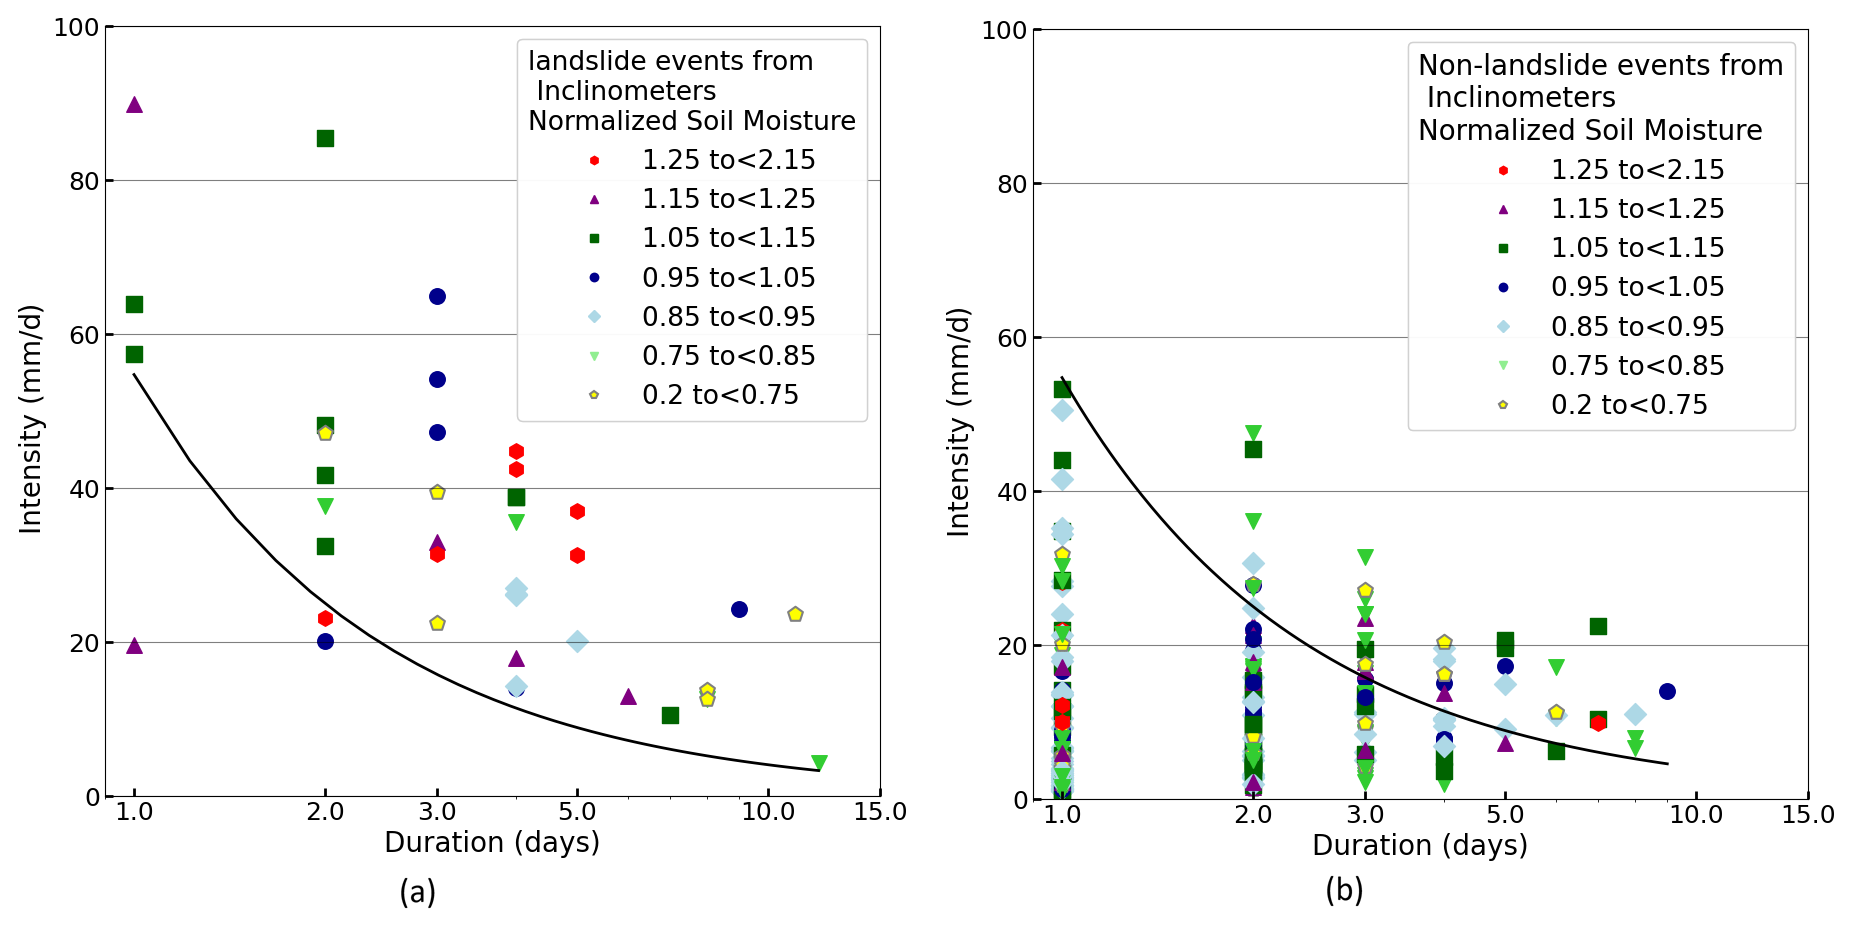
Figure 8Comparison of the (a) landslide events and (b) non-landslide events grouped by normalized soil moisture with previously developed rainfall thresholds for the inclinometer database from this study compared to Godt et al. (2006).
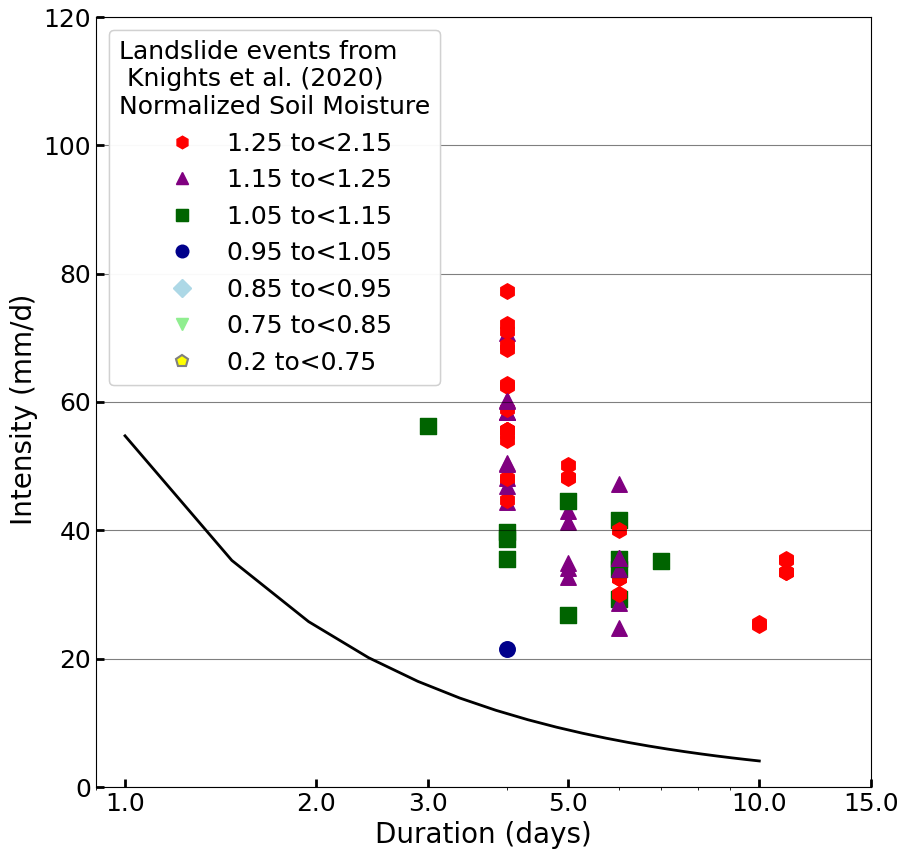
Figure 9Comparison of the landslide events grouped by normalized soil moisture with previously developed rainfall thresholds for the landslide inventory compiled by Knights et al. (2020).
Figure 8a shows the results for the landslide events binned by the normalized soil moisture measured on the first day of the storm. Three landslide events from the inclinometer-based inventory fell below the threshold established by Godt et al. (2006), indicating false negatives. These three points had either average (0.95–1.05) or above-average (greater than 1.05) normalized soil moisture values. The comparison for the non-landslide events (less than 1 mm) is shown in Fig. 8b. The Godt et al. (2006) threshold had 44 false positives out of 363 total non-landslide events (12 %). Approximately 75 % of these false positive events had a moisture content at or below average (less than 1.05). The inventory compiled by Knights et al. (2020) is shown in Fig. 9, with all landslides falling above the threshold. Only the landslides from the December 2015 storms in the Knights et al. (2020) inventory overlapped with the availability of SMAP data and all the landslides from these storms had at or above average moisture conditions.
Histograms of normalized soil moisture for true positive (landslide events above the Godt et al., 2006 threshold) and false positive events (non-landslide events above the Godt et al., 2006 threshold) from the inclinometer-based inventory and the inventory compiled by Knights et al. (2020) are shown in Fig. 10. Figure 10a shows that 60 % of the true positive events for the inclinometer-based inventory occurred at times of average or above average moisture conditions. More than 65 % of the false positive events (Fig. 10b) had normalized soil moisture values lower than 0.95 (drier than average conditions). Only 2.3 % of the false positive events have normalized soil moisture values greater than 1.25 compared with 13 % of landslide events. For the Knights et al. (2020) inventory, all events were above the Godt et al. (2006) threshold, and the average normalized soil moisture was 1.3 (Fig. 10c). Taken together, Figs. 8–10 suggest that threshold curves that incorporate moisture conditions may offer improved capability to distinguish between storms that are more or less likely to trigger a landslide by separating true and false positive events. This is further explored in the next section.
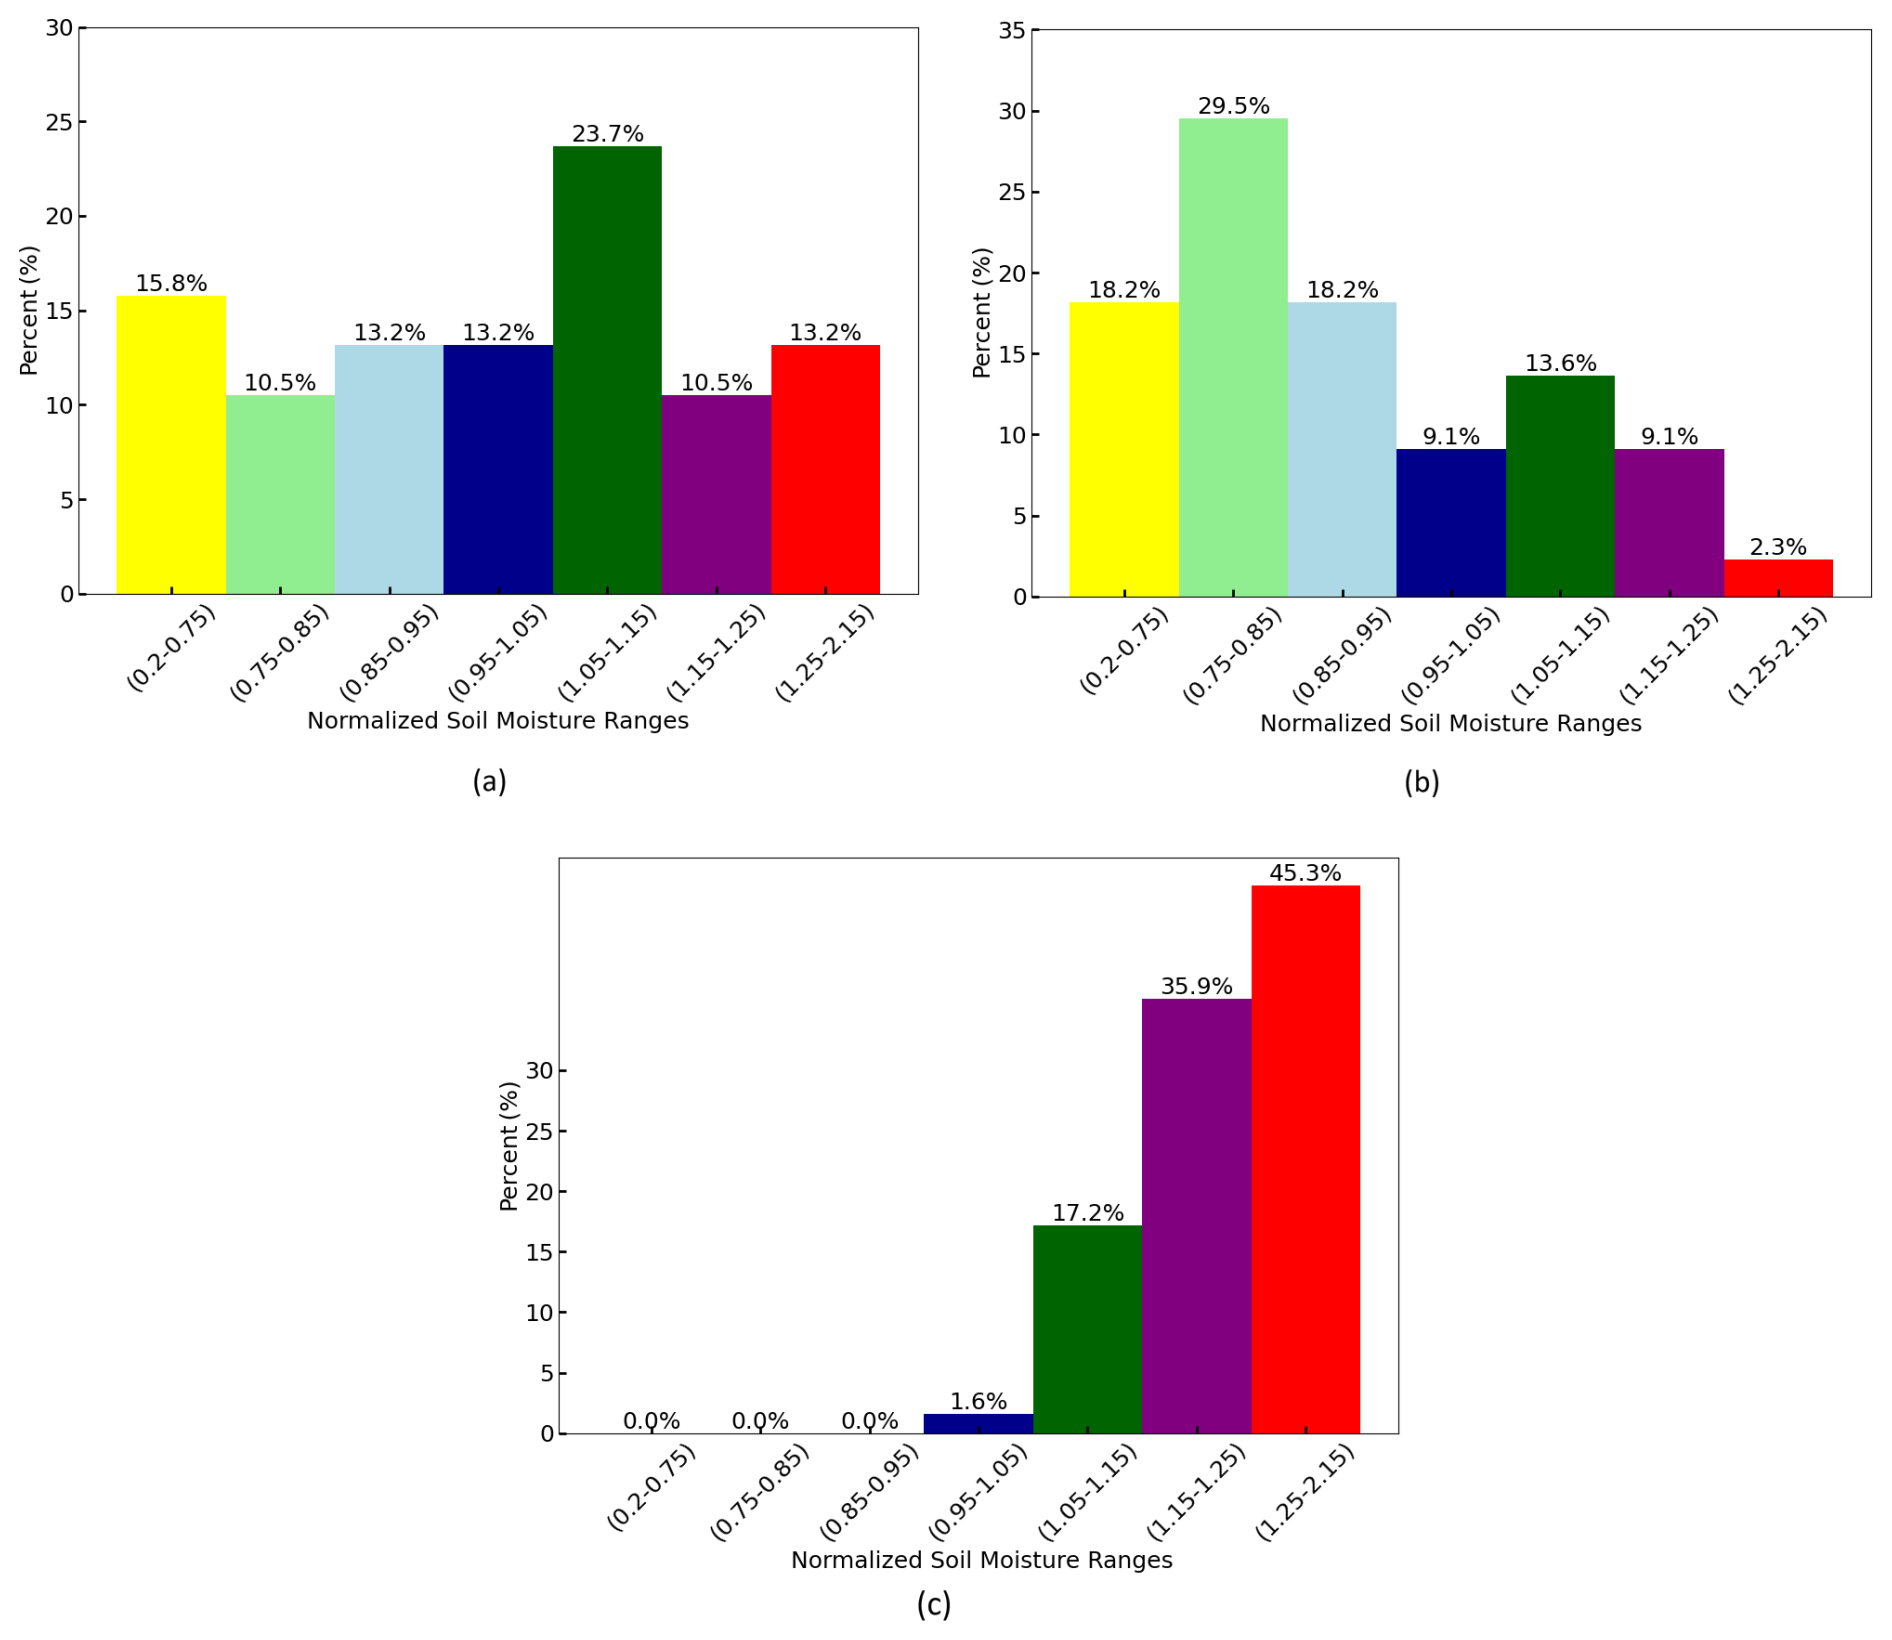
Figure 10Histogram of normalized soil moisture values based on the threshold developed by Godt et al. (2006), showing: (a) true positive events, (b) false positive events from the inclinometer database used in this study, and (c) true positive events from the landslide inventory compiled by Knights et al. (2020).
4.2 Proposed approach to integrate normalized soil moisture into landslide thresholds
The I–D threshold proposed by Godt et al. (2006) effectively predicts the landslides in our inventory (approximately 90 %) but also shows many false positives (Fig. 8b). As previously discussed, all the non-landslide events in our inventory are from sites with a history of instability, so these false positives cannot be attributed to a lack of susceptibility. Our analysis in the previous section showed that more than half of the false-positive events occurred when normalized soil moisture was drier than average, suggesting that incorporating normalized soil moisture may improve the threshold by reducing false positives. To investigate this further, we combined the events from the two landslide inventories and grouped them into five classes based on normalized soil moisture values: three classes ranging from 0.75 to 1.05 in 0.1 increments, and two additional classes for values below 0.75 or above 1.05, respectively. This classification follows the same approach used previously for soil moisture binning, but we combined all above-average soil moisture values (NSM > 1.05) into a single bin, as we did not detect a trend among the wetter-than-average points.
To develop our NSM-dependent thresholds, we used the threshold proposed by Godt et al. (2006) as a baseline. The Godt et al. (2006) threshold is defined by the power law shown in Eq. (6):
where I is the rainfall intensity in mm per hour, and D is the duration in hours. For consistency with our inventory, we modified Eq. (6) to convert the rainfall intensity to mm per day and duration to days and added a new NSM-dependent fitting parameter (α) in Eq. (7):
where I is the rainfall intensity in mm per day, D is the duration in days, and α is a fitting parameter that depends on the normalized soil moisture (NSM). Two different NSM-dependent thresholds were fit by prioritizing either reducing false positives (NSM-dependent Threshold A) or reducing false negatives (NSM-dependent Threshold B). The selected α value for each NSM bin is shown in Table 2.
Table 2Equations of lines and corresponding scaling factors for normalized soil moisture (NSM)-dependent thresholds A, B.

Figure 11 compares the NSM-Dependent Threshold A and the landslide and non-landslide events, alongside the original threshold proposed by Godt et al. (2006). As expected, higher normalized soil moisture levels correspond to lower rainfall intensity thresholds, indicating that landslides may be triggered by lower rainfall intensities over the same durations when the normalized soil moisture conditions are higher. Table 3 summarizes the performance of the evaluated thresholds using the same classification metrics previously introduced (Table 1). The NSM-Dependent Threshold A matches the sensitivity (TPR) of the Godt et al. (2006) threshold reasonably well (0.952 vs. 0.971), indicating a comparable ability to identify actual landslide events. However, it reduces the FPR from 0.121 to 0.077 and lowers the POFA from 0.301 to 0.219. This improvement is also reflected in the HK score, which increases from 0.850 to 0.875, suggesting enhanced overall discriminative performance. This analysis demonstrates that the NSM-Dependent Threshold A provides improved performance over the threshold proposed by Godt et al. (2006) by reducing both the false positive rate and the probability of false alarm, leading to an overall enhancement in discriminative capability. The Matthews Correlation Coefficient (MCC) shown in Table 3, which accounts for class imbalance and incorporates all four elements of the confusion matrix, further confirms this improvement. Threshold A achieves an MCC of 0.824, exceeding the value obtained for the Godt et al. (2006) threshold (0.765) and substantially outperforming the Guzzetti et al. (2008) model (0.549). Although the Marino et al. (2020) threshold produces the highest MCC (0.843), this occurs alongside a lower true positive rate (TPR = 0.895), indicating reduced landslide detection relative to the NSM-dependent models.
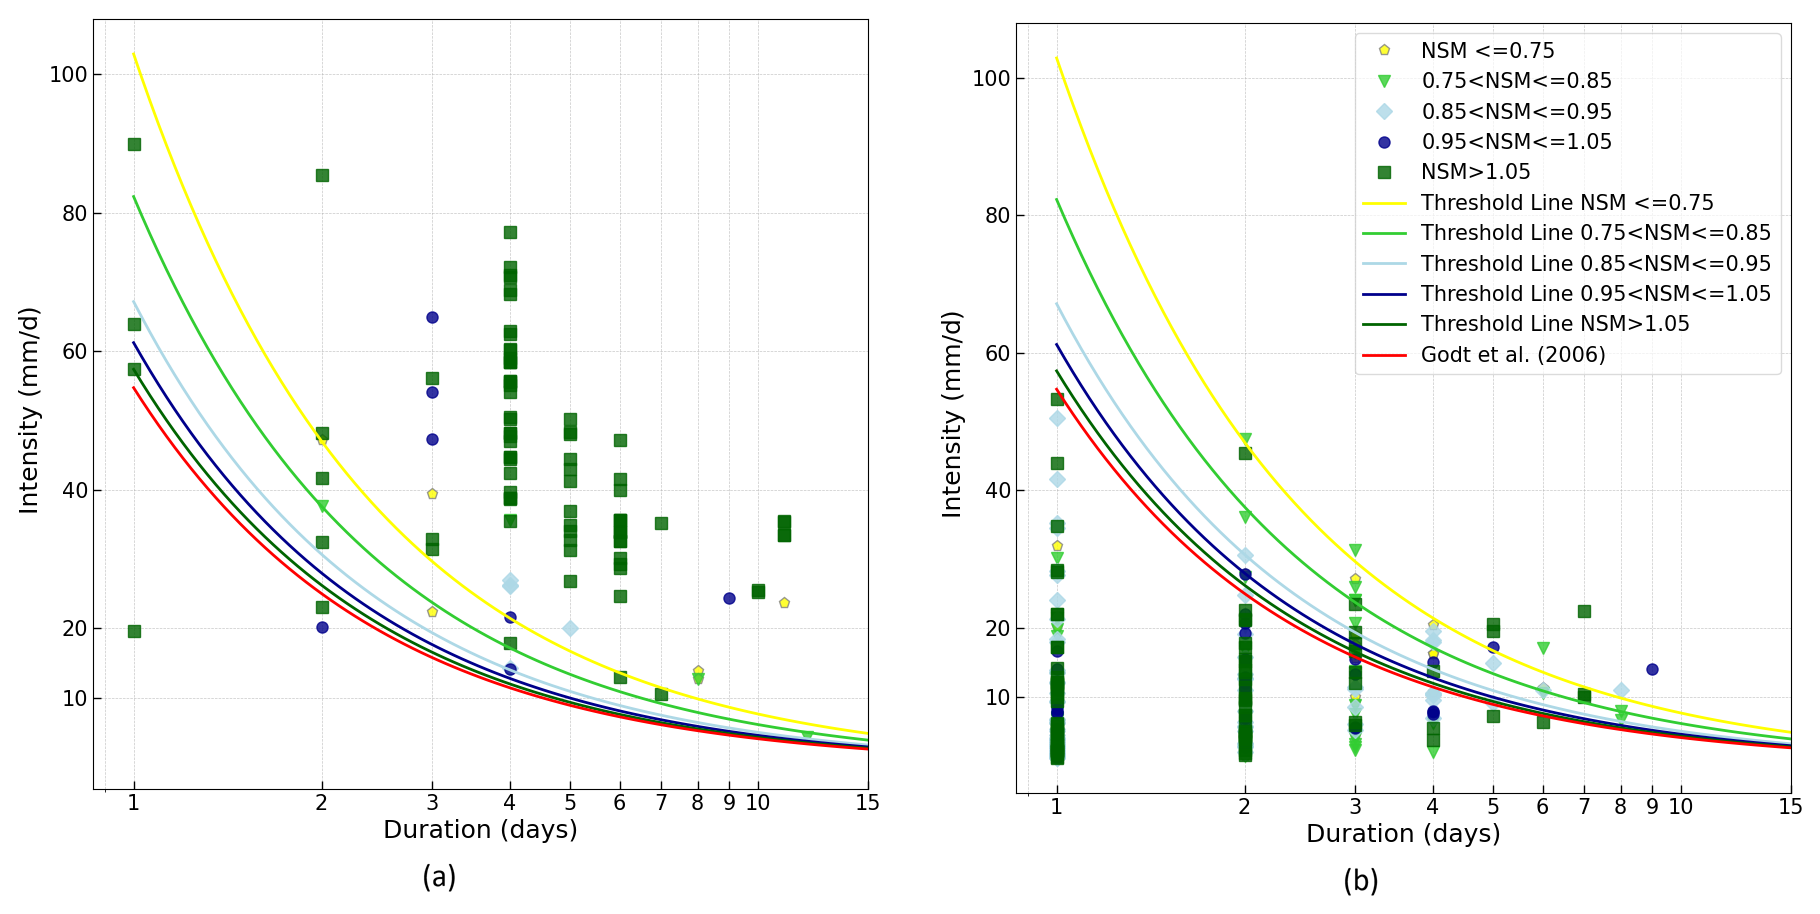
Figure 11NSM-Dependent I–D threshold A lines for the rainfall-triggering landslide fitted to events within each normalized soil moisture classification for (a) landslide events and (b) non-landslide events.
Table 3Comparison of performance metrics for Godt et al. (2006), Marino et al. (2020), Guzzetti et al. (2008) and the NSM-Dependent Threshold A, B.
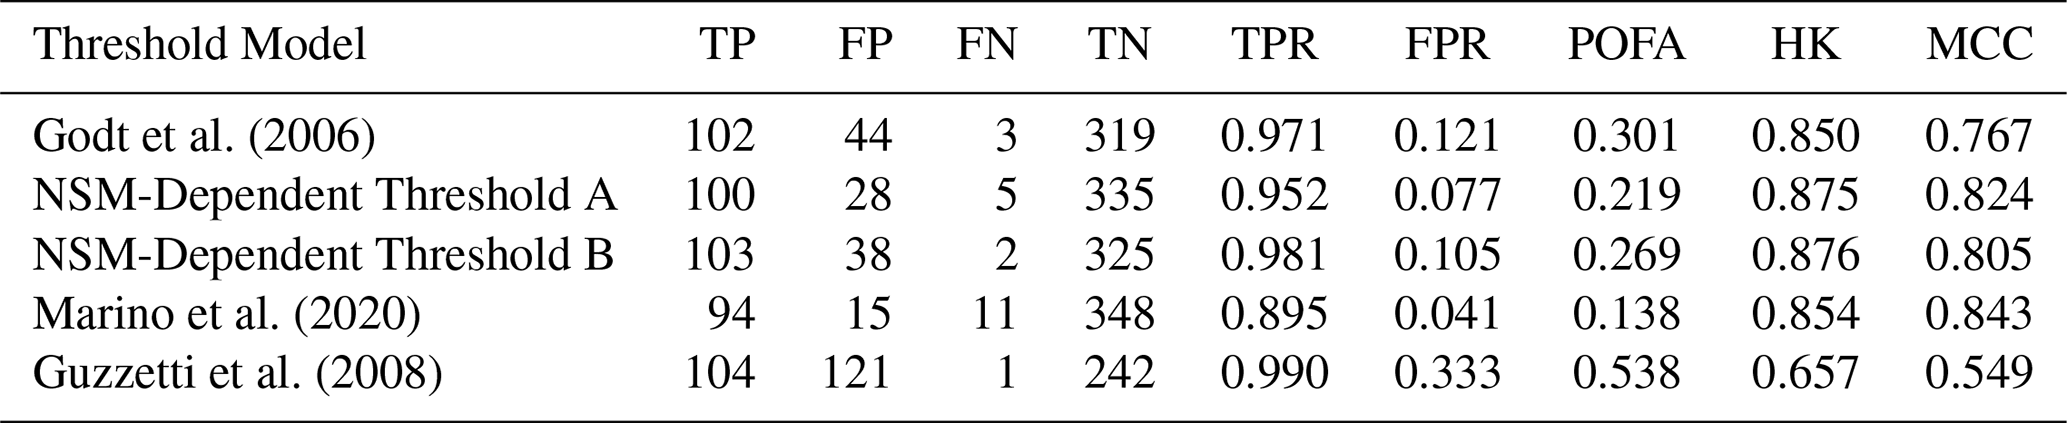
To further investigate the trade-off between sensitivity and false alarms, NSM-Dependent Threshold B was developed with the objective to reduce the number of false negatives and thereby enhance the sensitivity of the threshold model, while accepting a moderate increase in false positives compared with Threshold A. The threshold lines are illustrated in Fig. 12, where the line corresponding to the class of NSM > 1.05 lies below the Godt et al. (2006) threshold, indicating that under wetter than average conditions, smaller storms may be sufficient to trigger instability. The performance metrics for Threshold B are also shown in Table 3. When compared to the Godt et al. (2006) threshold, Threshold B demonstrates an improvement in detection capability, achieving a higher TPR (0.981 vs. 0.971) and a lower number of false negatives (FN = 2 vs. 3). Although this improvement in sensitivity is accompanied by a slight increase in FPR compared with Threshold A, there are still fewer false positives than the original relationship. These results suggest that Threshold B may be more suitable for applications where the cost of missed events outweighs the consequences of increased false alarms. The MCC value for Threshold B (0.805) also exceeds that of the Godt threshold, confirming improved overall classification performance.
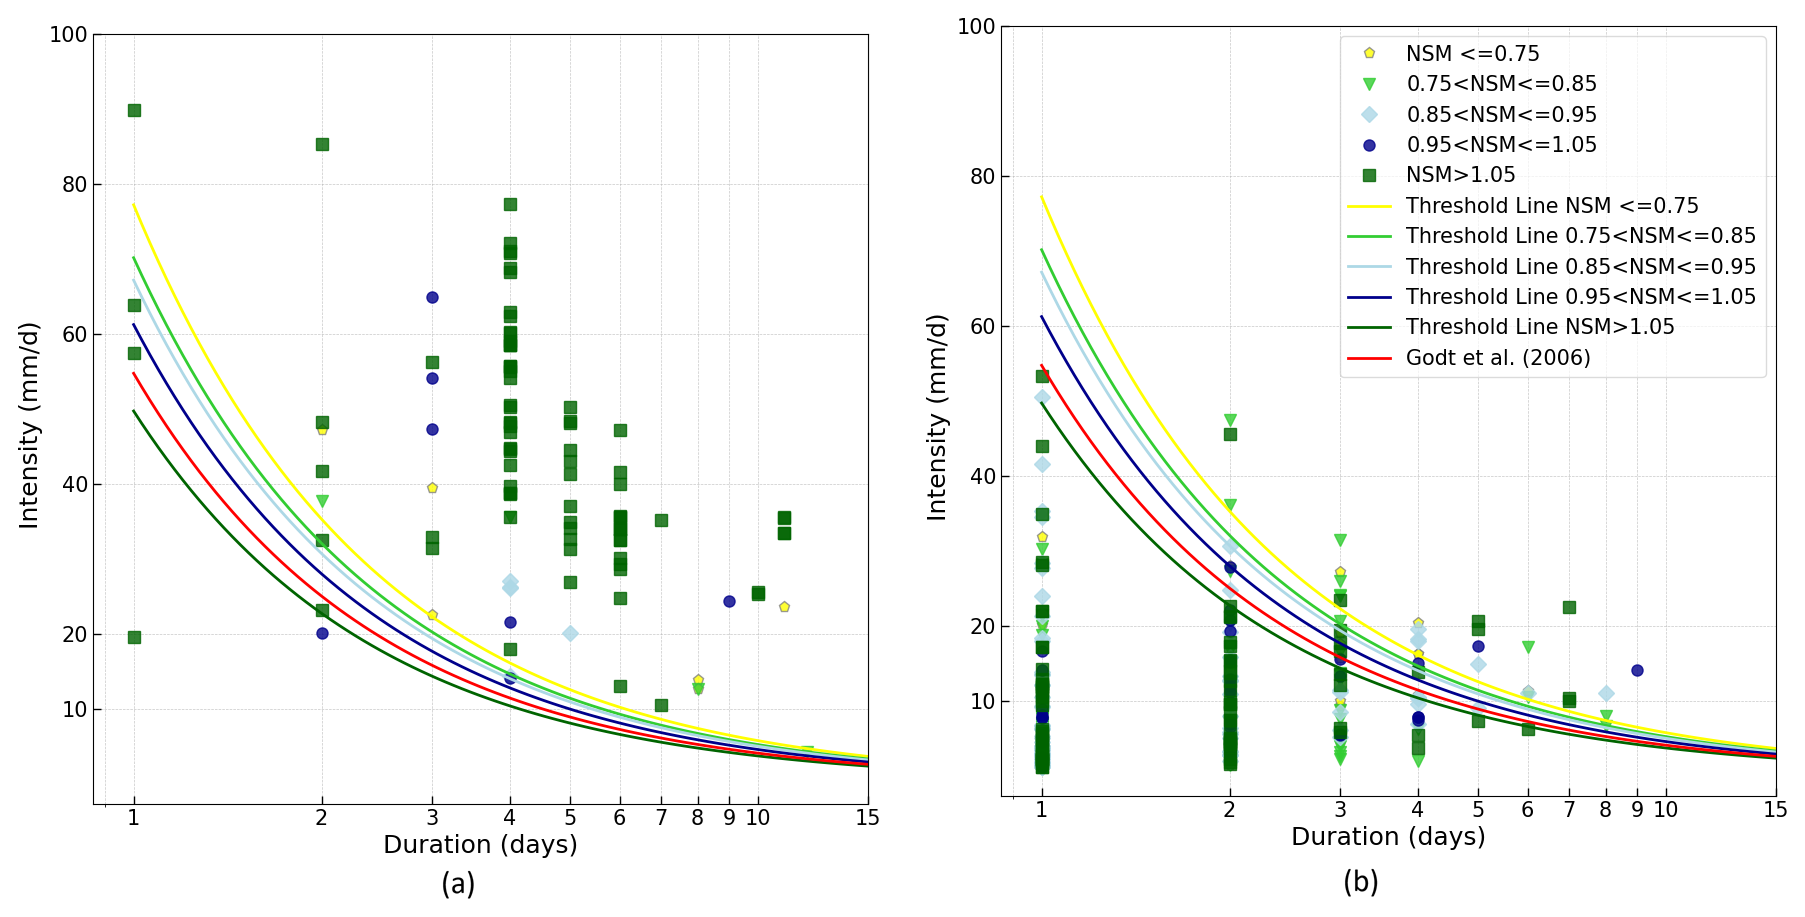
Figure 12NSM-Dependent I–D threshold B lines for the rainfall-triggering landslide fitted to events within each normalized soil moisture classification (Reducing One False Negative) for (a) landslide events and (b) non-landslide events.
The receiver operating characteristic (ROC) curve is a graphical tool used to evaluate the ability of a prediction model to distinguish between positive and negative events. The ROC curve is generated by plotting the true positive rate (TPR) against the false positive rate (FPR) for different threshold values. This representation illustrates the trade-off between correctly identifying landslide events and incorrectly issuing false alarms.
The area under the ROC curve (AUC) provides a quantitative summary of the model's overall discrimination capability. AUC values range from 0 to 1, where a value of 1 indicates perfect discrimination, 0.5 represents performance equivalent to random guessing, and values closer to 1 indicate stronger predictive performance. Therefore, higher AUC values reflect a greater ability of the threshold model to correctly distinguish between landslide-triggering and non-triggering rainfall conditions.
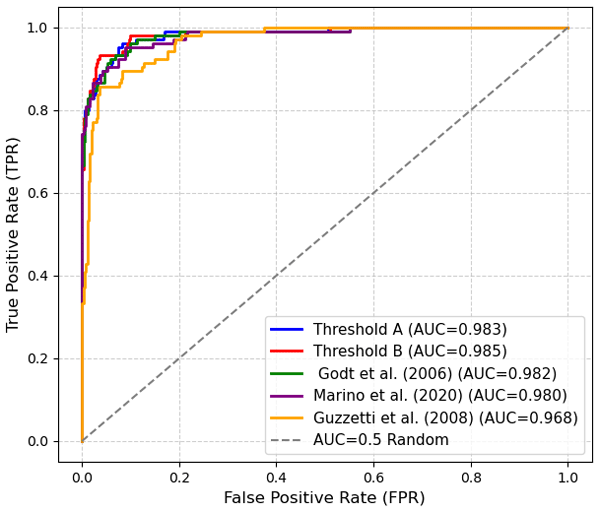
To quantitatively compare the performance of the proposed NSM-dependent thresholds against existing rainfall-only thresholds, we evaluated five models using receiver operating characteristic (ROC) analysis and several classification performance metrics (Table 3, Fig. 13). The area under the ROC curve (AUC) indicates that both NSM-dependent thresholds demonstrate strong discrimination ability. Threshold B achieved the highest AUC (0.985), followed closely by Threshold A (0.983). These values exceed those of the rainfall-only thresholds proposed by Godt et al. (2006) (AUC = 0.980), Marino et al. (2020) (AUC = 0.980), and Guzzetti et al. (2008) (AUC = 0.968). Although the differences in AUC among the top-performing models are modest, the NSM-dependent thresholds consistently provide equal or improved overall separability between landslide and non-landslide events.
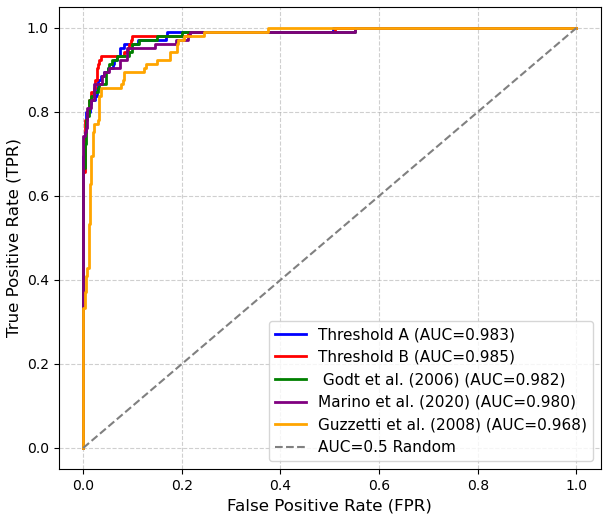
Figure 13Receiver operating characteristic (ROC) comparison of NSM-dependent and rainfall-only landslide thresholds. Both NSM-dependent thresholds demonstrate superior discrimination (AUC = 0.983–0.985) relative to existing models. While differences among the highest-performing thresholds are modest, the NSM-dependent models consistently achieve improved separation between landslide and non-landslide events. The dashed line denotes the random classifier (AUC = 0.5).
Overall, the combined evaluation using AUC, MCC, HK, and false alarm metrics demonstrates that incorporating normalized soil moisture enhances both discrimination capability and operational stability. The NSM-dependent thresholds provide a more balanced and practically reliable framework compared to existing rainfall-duration thresholds.
Previous studies have reported mixed results regarding the use of remotely sensed soil moisture in landslide prediction. While some showed limited improvement due to spatial resolution issues, others noted that landslides often occur under extremely wet conditions. In this study, we addressed these challenges by normalizing soil moisture data, which reduced site-specific variability and enabled more consistent threshold development. Unlike raw soil moisture values, which can vary widely across regions, normalized soil moisture effectively captures relative wetness levels that contribute to slope failure risk. These results suggest that normalized soil moisture may be a more robust and transferable methodology for identifying landslide-prone conditions. However, this finding needs to be confirmed with other data sources and in other regions. While the methodological approach can be implemented in different geographic and climatic settings, the resulting threshold values should be interpreted as region-specific, reflecting local soil properties, climatic conditions, geomorphology, and hydrologic responses.
Our results demonstrate that incorporating normalized soil moisture (NSM) derived from SMAP L4 Root Zone moisture improves the statistical performance of rainfall-based landslide thresholds. The events from the two inventories were combined and binned into five NSM classes. Threshold lines were fit to each class under the constraint of maintaining or improving classification performance relative to the Godt et al. (2006) threshold. NSM-Dependent Threshold A focused on reducing false positives at the expense of increasing the number of false negatives, while Threshold B prioritized sensitivity by reducing false negatives in wetter conditions at the expense of a controlled increase in false positives. NSM-Dependent Threshold B demonstrated the highest sensitivity, with a true positive rate (TPR) of 0.981 and the lowest number of false negatives (FN = 2), making it particularly suitable for scenarios where missing a positive case could lead to critical consequences. Threshold A had the lowest false positive rate (FPR = 0.077) and the lowest probability of false alarm (POFA = 0.219), making it more appropriate for applications where minimizing false alarms is essential, such as automated alert systems or contexts prone to alert fatigue. Both NSM-Dependent Thresholds outperformed the original Godt et al. (2006) model, suggesting that incorporating normalized soil moisture can improve the reliability and practicality of rainfall-induced landslide early warning systems. The Matthews Correlation Coefficient (MCC), which summarizes overall classification performance while accounting for class imbalance, further supports the improved performance of the NSM-dependent thresholds. Threshold A achieved an MCC of 0.824 and Threshold B an MCC of 0.805, both exceeding the value obtained for the Godt et al. (2006) threshold (MCC = 0.765). These results indicate improved overall agreement between predicted and observed landslide events when antecedent soil moisture conditions are incorporated into the threshold framework.
Both NSM-dependent thresholds (A and B) achieved higher discrimination ability (as evidenced by the AUC values) and improved operational performance under a fixed decision rule (as represented by the MCC values) than the rainfall-only models. This study presents a regional, data-driven framework for evaluating the timing of rainfall-triggered landslides along monitored highway slopes in Alabama. Several limitations and sources of uncertainty should be considered when interpreting the results.
A primary limitation relates to the temporal uncertainty of landslide occurrence. Many regional landslide inventories, including those used in this study, rely on periodic field inspections or post-event documentation rather than continuous monitoring. Consequently, the exact timing of slope movement is often uncertain, and the specific triggering rainfall event cannot always be identified with confidence. This limitation is common in regional-scale landslide studies and may reduce the strength of statistical relationships between rainfall thresholds and observed failures.
Uncertainty also arises from the spatial and temporal resolution of the hydroclimatic datasets. The SMAP root-zone soil moisture product, with a spatial resolution of approximately 9 × 9 km, represents average wetness conditions over relatively large grid cells and does not capture fine-scale variability at individual slopes. A seasonal pattern was observed in the SMAP dataset, with higher values during winter months, which is consistent with regional hydroclimatic conditions characterized by increased rainfall and reduced evapotranspiration. However, the possibility of seasonal bias in satellite-derived soil moisture products cannot be fully evaluated due to the absence of ground-based calibration data at the study sites. Similarly, the use of daily precipitation data does not resolve short-duration, high-intensity rainfall bursts or the independence of brief dry periods that may influence slope response. These resolution constraints reflect tradeoffs between data availability and regional applicability, as higher-resolution datasets are not consistently available across the study area and time period.
The thresholds developed in this study are empirical in nature and are derived from observable relationships between rainfall, soil moisture, and slope movement. As such, they do not explicitly incorporate hydro-geomechanical processes or site-specific material properties, such as permeability, cohesion, or shear strength, that govern slope stability at the individual slope scale. The results should therefore be interpreted as regional indicators of instability timing rather than mechanistic predictions of failure.
Finally, there is an inherent scale mismatch between regional hydrologic indicators and localized slope movements measured by inclinometers. Rainfall and satellite-derived soil moisture represent spatially averaged conditions, whereas slope failures occur at highly localized scales controlled by site-specific stratigraphy and drainage conditions. While normalization of soil moisture reduces bias associated with spatial heterogeneity, this scale disparity influences interpretability and transferability of the thresholds.
Despite these limitations, the framework provides a transparent and reproducible regional assessment tool. Future work could integrate higher-resolution rainfall and soil moisture datasets, continuous slope monitoring, and site-specific hydro-geotechnical characterization to improve process representation and strengthen the linkage between regional indicators and local slope response. Future research could incorporate spatial statistical methods, such as variogram analysis, or probabilistic frameworks, such as Bayesian modeling, to better quantify spatial variability, uncertainty propagation, and predictive sensitivity across heterogeneous landscapes.
Additional studies in regions with different geological, hydrological, and climatic conditions are needed to evaluate the wider applicability of the proposed NSM-dependent thresholds. Furthermore, the analysis focuses on movements at slopes with a known history of instability along highways and does not address the potential triggering of first-time landslides at previously stable sites.
This study created a new inventory of landslide and non-landslide events based on inclinometer readings collected at sites with unstable slopes around Alabama. Extensive processing was done on the inclinometer data to eliminate erroneous or unreliable readings and to extract changes in displacement at the shear zones. After processing, landslide events were defined by a change in displacement exceeding 5 mm between two inclinometer readings, while non-landslide events were identified by changes in displacement less than 1 mm. Readings falling between these two limits were not considered in the analysis as they could not be definitively categorized as either landslide or non-landslide with the available information. The landslide inventory compiled by Knights et al. (2020) was also included in the analysis to increase the number of landslide points.
The two inventories were compared with measured precipitation data from NOAA and soil moisture from NASA's SMAP Level 4 dataset. To allow for a uniform metric for comparison across the sites, the actual soil moisture values were normalized by the average measured at that site over the study period to create a normalized soil moisture (NSM), which serves as an index of the average moisture conditions in the vicinity of the landslide site. A comparison of data at selected sites showed that landslides tended to occur during periods of higher NSM. The two inventories were compared with previously developed rainfall thresholds and the threshold proposed by Godt et al. (2006) was found to accurately predict approximately 92 % of the landslide events across the two inventories. Using the Godt et al. (2006) threshold to predict landslide events resulted in approximately 12 % false positives. These false positive events had an average NSM of 0.896, indicating conditions at the start of the storm were drier than the overall average for that location. Examining the full inventory showed that 75 % of the inclinometer-based landslides and 100 % of the inventory from Knights et al. (2020) had NSM values above 1, indicating wetter than average conditions were common when landslides occurred. This suggests that incorporating NSM into the threshold formulation could be a promising approach to reduce false positives.
Our results demonstrate that incorporating normalized soil moisture derived from SMAP root-zone moisture improves the statistical performance of rainfall-based landslide thresholds. By grouping events into normalized soil moisture classes and fitting tailored threshold relationships, the proposed framework enhances the balance between landslide detection and false alarm reduction compared with traditional rainfall-only thresholds. The NSM-dependent thresholds provide improved discrimination capability and overall classification performance, showing the importance of antecedent soil moisture conditions in controlling rainfall-triggered slope instability. These findings emphasize the value of integrating soil moisture information into regional landslide early warning systems to improve reliability and operational usefulness.
However, the results should be interpreted in light of several limitations, including uncertainties in landslide timing, the coarse spatial resolution of satellite-derived soil moisture data, and the empirical nature of the rainfall–soil moisture thresholds. As such, the thresholds should be viewed as regional indicators of instability timing rather than mechanistic predictors of individual slope failure, and further research using higher-resolution monitoring data and expanded landslide inventories across diverse geological and climatic settings is needed to evaluate and refine the broader applicability of the framework.
The landslide inventories are available through the DesignSafe Data Repository (https://doi.org/10.17603/ds2-xs04-th22, Rahimikhameneh et al. 2025).
L.R. conducted data analysis, prepared figures, and contributed to writing and revising the manuscript. A.A.R. processed the precipitation data and prepared Fig. 2. J.M. and F.O. supervised the research, contributed to the study design, and reviewed and edited the manuscript. All authors reviewed and approved the final manuscript.
The contact author has declared that none of the authors has any competing interests.
Publisher's note: Copernicus Publications remains neutral with regard to jurisdictional claims made in the text, published maps, institutional affiliations, or any other geographical representation in this paper. The authors bear the ultimate responsibility for providing appropriate place names. Views expressed in the text are those of the authors and do not necessarily reflect the views of the publisher.
This material is based upon work funded by the Alabama Department of Transportation under grant number 931-054 and the National Science Foundation under grant number CMMI 2047402. Inclinometer data was provided by Brannon McDonald (ALDOT). Any opinions, findings, conclusions, or recommendations are those of the author(s) and do not necessarily reflect the views of ALDOT or the National Science Foundation.
This research has been supported by the Alabama Department of Transportation (grant no. 931-054) and the National Science Foundation (grant no. CMMI-2047402).
This paper was edited by Mihai Niculita and reviewed by Li Li, Yichuan Zhu, and one anonymous referee.
Abancó, C., Asurza, F. A., Medina, V., Hürlimann, M., and Bennett, G. L.: Modelling antecedent soil hydrological conditions to improve the prediction of landslide susceptibility in typhoon-prone regions, Landslides, 21, 1531–1547, https://doi.org/10.1007/s10346-024-02242-8, 2024.
Abraham, M. T., Satyam, N., Rosi, A., Pradhan, B., and Segoni, S.: Usage of antecedent soil moisture for improving the performance of rainfall thresholds for landslide early warning, Catena, 200, 105147, https://doi.org/10.1016/j.catena.2021.105147, 2021.
Allasia, P., Godone, D., Giordan, D., Guenzi, D., and Lollino, G.: Advances on measuring deep-seated ground deformations using robotized inclinometer system, Sensors, 20, 1–20, https://doi.org/10.3390/s20133769, 2020.
Baum, R. L. and Godt, J. W.: Early warning of rainfall-induced shallow landslides and debris flows in the USA, Landslides, 7, 259–272, https://doi.org/10.1007/s10346-009-0177-0, 2010.
Bogaard, T. and Greco, R.: Invited perspectives: Hydrological perspectives on precipitation intensity-duration thresholds for landslide initiation: proposing hydro-meteorological thresholds, Nat. Hazards Earth Syst. Sci., 18, 31–39, https://doi.org/10.5194/nhess-18-31-2018, 2018.
Brocca, L., Ponziani, F., Moramarco, T., Melone, F., Berni, N., and Wagner, W.: Improving landslide forecasting using ASCAT-derived soil moisture data: A case study of the torgiovannetto landslide in central Italy, Remote Sens., 4, 1232–1244, https://doi.org/10.3390/rs4051232, 2012.
Caine, N.: The rainfall intensity–duration control of shallow landslides and debris flows, Geogr. Ann. A, 62, 23–27, https://doi.org/10.1080/04353676.1980.11879996, 1980.
Cepeda, J., Höeg, K., and Nadim, F.: Landslide-triggering rainfall thresholds: A conceptual framework, Q. J. Eng. Geol. Hydroge., 43, 69–84, https://doi.org/10.1144/1470-9236/08-066, 2010.
Conrad, J. L., Morphew, M. D., Baum, R. L., and Mirus, B. B.: HydroMet: A new code for automated objective optimization of hydrometeorological thresholds for landslide initiation. Water, 13, 1752, https://doi.org/10.3390/w13131752, 2021.
D'Ippolito, A., Lupiano, V., Rago, V., Terranova, O. G., and Iovine, G.: Triggering of Rain-Induced Landslides, with Applications in Southern Italy, Water, 15, 277, https://doi.org/10.3390/w15020277, 2023.
Fayaz, M., Meraj, G., Khader, S. A., and Farooq, M.: ARIMA and SPSS statistics based assessment of landslide occurrence in western Himalayas, Environmental Challenges, 9, 100624, https://doi.org/10.1016/j.envc.2022.100624, 2022.
Gain, A. K., Bühler, Y., Haegeli, P., Molinari, D., Parise, M., Peres, D. J., Pinto, J. G., Schröter, K., Trigo, R. M., Llasat, M. C., and Kreibich, H.: Brief communication: Key papers of 20 years in Natural Hazards and Earth System Sciences, Nat. Hazards Earth Syst. Sci., 22, 985–993, https://doi.org/10.5194/nhess-22-985-2022, 2022.
Godt, J. W., Baum, R. L., and Chleborad, A. F.: Rainfall characteristics for shallow landsliding in Seattle, Washington, USA, Earth Surf. Proc. Land., 31, 97–110, https://doi.org/10.1002/esp.1237, 2006.
Guzzetti, F., Peruccacci, S., Rossi, M., and Stark, C. P.: Rainfall thresholds for the initiation of landslides in central and southern Europe, Meteorol. Atmos. Phys., 98, 239–267, https://doi.org/10.1007/s00703-007-0262-7, 2007.
Guzzetti, F., Peruccacci, S., Rossi, M., and Stark, C. P.: The rainfall intensity-duration control of shallow landslides and debris flows: An update, Landslides, 5, 3–17, https://doi.org/10.1007/s10346-007-0112-1, 2008.
Harris, C. R., Millman, K. J., van der Walt, S. J., Gommers, R., Virtanen, P., Cournapeau, D., Wieser, E., Taylor, J., Berg, S., Smith, N. J., Kern, R., Picus, M., Hoyer, S., van Kerkwijk, M. H., Brett, M., Haldane, A., del Río, J. F., Wiebe, M., Peterson, P., Gérard-Marchant, P., Sheppard, K., Reddy, T., Weckesser, W., Abbasi, H., Gohlke, C., and Oliphant, T. E.: Array programming with NumPy, Nature, 585, 357–362, https://doi.org/10.1038/s41586-020-2649-2, 2020.
Hunter, J. D.: Matplotlib: A 2D Graphics Environment, Comput. Sci. Eng., 9, 90–95, https://doi.org/10.1109/MCSE.2007.55, 2007.
Kirschbaum, D., Stanley, T., and Zhou, Y.: Spatial and temporal analysis of a global landslide catalog, Geomorphology, 249, 4–15, https://doi.org/10.1016/j.geomorph.2015.03.016, 2015.
Kirschbaum, D. B., Adler, R., Hong, Y., Hill, S., and Lerner-Lam, A.: A global landslide catalog for hazard applications: Method, results, and limitations, Nat. Hazards, 52, 561–575, https://doi.org/10.1007/s11069-009-9401-4, 2010.
Klose, M.: Landslide Databases as Tools for Integrated Assessment of Landslide Risk, Springer Theses, Springer, Cham, https://doi.org/10.1007/978-3-319-20403-1, 2015.
Knights, M. J., Montgomery, J., and Carcamo, P. S.: Development of a slope failure database for Alabama highways, B. Eng. Geol. Environ., 79, 423–438, https://doi.org/10.1007/s10064-019-01543-w, 2020.
Lazzari, M., Piccarreta, M., Ray, R. L., and Manfreda, S.: Modeling antecedent soil moisture to constrain rainfall thresholds for shallow landslides occurrence, in: Landslides – Investigation and Monitoring, edited by: Ray, R. and Lazzari, M., IntechOpen, London, https://doi.org/10.5772/intechopen.92730, 2020.
Leonarduzzi, E., Molnar, P., and McArdell, B. W.: Predictive performance of rainfall thresholds for shallow landslides in Switzerland from gridded daily data, Water Resour. Res., 53, 6612–6625, https://doi.org/10.1002/2017WR021044, 2017.
Lin, Q., Lima, P., Steger, S., Glade, T., Jiang, T., Zhang, J., Liu, T., and Wang, Y.: National-scale data-driven rainfall induced landslide susceptibility mapping for China by accounting for incomplete landslide data, Geosci. Front., 12, https://doi.org/10.1016/j.gsf.2021.101248, 2021.
Machan, G. and Bennett, V. G.: Use of Inclinometers for Geotechnical Instrumentation on Transportation Projects: State of the Practice, Transportation Research Circular E-C129, Transportation Research Board, Washington, D.C., 1–92, https://onlinepubs.trb.org/onlinepubs/circulars/ec129.pdf (last access: 15 June 2026), 2008.
Mandal, P. and Sarkar, S.: Estimation of rainfall threshold for the early warning of shallow landslides along National Highway-10 in Darjeeling Himalayas, Nat. Hazards, 105, 2455–2480, https://doi.org/10.1007/s11069-020-04407-9, 2021.
Marino, P., Peres, D. J., Cancelliere, A., Greco, R., and Bogaard, T. A.: Soil moisture information can improve shallow landslide forecasting using the hydrometeorological threshold approach, Landslides, 17, 2041–2054, https://doi.org/10.1007/s10346-020-01420-8, 2020.
Martelloni, G., Segoni, S., Fanti, R., and Catani, F.: Rainfall thresholds for the forecasting of landslide occurrence at regional scale, Landslides, 9, 485–495, https://doi.org/10.1007/s10346-011-0308-2, 2012.
McKinney, W.: Data Structures for Statistical Computing in Python, in: Proceedings of the 9th Python in Science Conference, edited by: van der Walt, S. and Millman, J., Austin, Texas, 56–61, https://doi.org/10.25080/Majora-92bf1922-00a, 2010.
Mikkelsen, P. E.: Advances in inclinometer data analysis, in: Field Measurements in Geomechanics: Proceedings of the 6th International Symposium on Field Measurements in Geomechanics, Oslo, Norway, 23–26 September 2003, edited by: Myrvoll, F., A. A. Balkema, Lisse, the Netherlands, ISBN 9789058096029, 555–567, 2003.
Millán-Arancibia, C. and Lavado-Casimiro, W.: Rainfall thresholds estimation for shallow landslides in Peru from gridded daily data, Nat. Hazards Earth Syst. Sci., 23, 1191–1206, https://doi.org/10.5194/nhess-23-1191-2023, 2023.
Mirus, B. B., Morphew, M. D., and Smith, J. B.: Developing hydro-meteorological thresholds for shallow landslide initiation and early warning, Water, 10, 1274, https://doi.org/10.3390/W10091274, 2018a.
Mirus, B. B., Becker, R. E., Baum, R. L., and Smith, J. B.: Integrating real-time subsurface hydrologic monitoring with empirical rainfall thresholds to improve landslide early warning, Landslides, 15, 1909–1919, https://doi.org/10.1007/s10346-018-0995-z, 2018b.
Mirus, B. B., Jones, E. S., Baum, R. L., Godt, J. W., Slaughter, S., Crawford, M. M., Lancaster, J., Stanley, T., Kirschbaum, D. B., Burns, W. J., Schmitt, R. G., Lindsey, K. O., and McCoy, K. M.: Landslides across the USA: occurrence, susceptibility, and data limitations, Landslides, 17, 2271–2285, https://doi.org/10.1007/s10346-020-01424-4, 2020.
Montgomery, J., Knights, M., Xuan, M., and Carcamo, P.: Evaluation of landslides along Alabama highways, ALDOT Research Report, Project 930-931, Highway Research Center, Auburn University, Auburn, Alabama, https://www.eng.auburn.edu/research/centers/hrc/hrc-files/930-931final-montgomery.pdf (last access: 15 June 2026), 2019.
NOAA Physical Sciences Laboratory (PSL): CPC Global Unified Gauge-Based Analysis of Daily Precipitation, NOAA PSL [data set], Boulder, Colorado, USA, https://psl.noaa.gov/data/gridded/data.cpc.globalprecip.html (last access: 15 June 2026), 2024.
Oorthuis, R., Hürlimann, M., Vaunat, J., Moya, J., and Lloret, A.: Monitoring the role of soil hydrologic conditions and rainfall for the triggering of torrential flows in the Rebaixader catchment (Central Pyrenees, Spain): Role of soil hydrologic conditions and rainfall for torrential flows in the Rebaixader catchment, Landslides, 20, 249–269, https://doi.org/10.1007/s10346-022-01975-8, 2023.
Piciullo, L., Gariano, S. L., Melillo, M., Brunetti, M. T., Peruccacci, S., Guzzetti, F., and Calvello, M.: Definition and performance of a threshold-based regional early warning model for rainfall-induced landslides, Landslides, 14, 995–1008, https://doi.org/10.1007/s10346-016-0750-2, 2017.
Rahimikhameneh, L., Reyna, A. A., Montgomery, J., and O'Donnell, F.: Integrating precipitation and soil moisture 535 measurements to understand landslide movements along Alabama highways, Geo-Congress 2024, 613–622, https://doi.org/10.1061/9780784485316.063, 2024.
Rahimikhameneh, L., Montgomery, J., Knights, M., Reyna, A. A., O'Donnell, F., and Carcamo, P.: Inventory of Landslides Along Alabama Highways, DesignSafe-CI [data set], https://doi.org/10.17603/ds2-xs04-th22, 2025.
Ray, R. L., Jacobs, J. M., and Cosh, M. H.: Landslide susceptibility mapping using downscaled AMSR-E soil moisture: A case study from Cleveland Corral, California, US, Remote Sens. Environ., 114, 2624–2636, https://doi.org/10.1016/j.rse.2010.05.033, 2010.
Reichle, R., De Lannoy, G., Koster, R. D., Crow, W. T., Kimball, J. S., and Liu, Q.: SMAP L4 Global 3-hourly 9 km EASE-Grid Surface and Root Zone Soil Moisture Geophysical Data, Version 4, NASA National Snow and Ice Data Center Distributed Active Archive Center (NSIDC DAAC) [data set], https://doi.org/10.5067/KPJNN2GI1DQR, 2018.
Roccati, A., Paliaga, G., Luino, F., Faccini, F., and Turconi, L.: Rainfall threshold for shallow landslides initiation and analysis of long-term rainfall trends in a mediterranean area, Atmosphere, 11, 1367, https://doi.org/10.3390/atmos11121367, 2020.
Rodríguez-Fernández, N. J., Muñoz Sabater, J., Richaume, P., de Rosnay, P., Kerr, Y. H., Albergel, C., Drusch, M., and Mecklenburg, S.: SMOS near-real-time soil moisture product: processor overview and first validation results, Hydrol. Earth Syst. Sci., 21, 5201–5216, https://doi.org/10.5194/hess-21-5201-2017, 2017.
Santangelo, M., Althuwaynee, O., Alvioli, M., Ardizzone, F., Bianchi, C., Bornaetxea, T., Brunetti, M. T., Bucci, F., Cardinali, M., Donnini, M., Esposito, G., Gariano, S. L., Grita, S., Marchesini, I., Melillo, M., Peruccacci, S., Salvati, P., Yazdani, M., and Fiorucci, F.: Inventory of landslides triggered by an extreme rainfall event in Marche-Umbria, Italy, on 15 September 2022, Sci. Data, 10, https://doi.org/10.1038/s41597-023-02336-3, 2023.
Segoni, S., Piciullo, L., and Gariano, S. L.: A review of the recent literature on rainfall thresholds for landslide occurrence, Landslides, 15, 1483–1501, https://doi.org/10.1007/s10346-018-0966-4, 2018a.
Segoni, S., Rosi, A., Lagomarsino, D., Fanti, R., and Casagli, N.: Brief communication: Using averaged soil moisture estimates to improve the performances of a regional-scale landslide early warning system, Nat. Hazards Earth Syst. Sci., 18, 807–812, https://doi.org/10.5194/nhess-18-807-2018, 2018b.
Sepúlveda, S. A., Ward, B. C., Cosman, S. B., and Jacobs, R.: Preliminary investigations of ground failures triggered during the mid-November 2021 atmospheric river event along the southwestern British Columbia highway corridors, Can. Geotech. J., 60, 580–586, https://doi.org/10.1139/cgj-2022-0093, 2023.
Skulovich, O. and Gentine, P.: A Long-term Consistent Artificial Intelligence and Remote Sensing-based Soil Moisture Dataset, Sci. Data, 10, https://doi.org/10.1038/s41597-023-02053-x, 2023.
Stanley, T. A., Kirschbaum, D. B., Benz, G., Emberson, R. A., Amatya, P. M., Medwedeff, W., and Clark, M. K.: Data-Driven Landslide Nowcasting at the Global Scale, Front. Earth Sci., 9, 640043, https://doi.org/10.3389/feart.2021.640043, 2021.
Stark, T. D. and Choi, H.: Slope inclinometers for landslides, Landslides, 5, 339–350, https://doi.org/10.1007/s10346-008-0126-3, 2008.
Szabo, E. W., Osborne, W. E., Copeland, C. W., Jr., and Neathery, T. L.: Geologic map of Alabama, Special Map 220, scale 1:250,000, Geological Survey of Alabama, Tuscaloosa, Alabama, https://ngmdb.usgs.gov/Prodesc/proddesc_55859.htm (last access: 15 June 2026), 1988.
Taylor, F. E., Tarolli, P., and Malamud, B. D.: Preface: Landslide–transport network interactions, Nat. Hazards Earth Syst. Sci., 20, 2585–2590, https://doi.org/10.5194/nhess-20-2585-2020, 2020.
Uwihirwe, J., Hrachowitz, M., and Bogaard, T. A.: Landslide precipitation thresholds in Rwanda, Landslides, 17, 2469–2481, https://doi.org/10.1007/s10346-020-01457-9, 2020.
Valenzuela, P., Domínguez-Cuesta, M. J., Mora García, M. A., and Jiménez-Sánchez, M.: Rainfall thresholds for the triggering of landslides considering previous soil moisture conditions (Asturias, NW Spain), Landslides, 15, 273–282, https://doi.org/10.1007/s10346-017-0878-8, 2018.
Voumard, J., Derron, M.-H., and Jaboyedoff, M.: Natural hazard events affecting transportation networks in Switzerland from 2012 to 2016, Nat. Hazards Earth Syst. Sci., 18, 2093–2109, https://doi.org/10.5194/nhess-18-2093-2018, 2018.
Wicki, A., Lehmann, P., Hauck, C., Seneviratne, S. I., Waldner, P., and Stähli, M.: Assessing the potential of soil moisture measurements for regional landslide early warning, Landslides, 17, 1881–1896, https://doi.org/10.1007/s10346-020-01400-y, 2020.
Winter, M. G., Shearer, B., Palmer, D., Peeling, D., Harmer, C., and Sharpe, J.: The Economic Impact of Landslides and Floods on the Road Network, Procedia Engineer., 143, 1425–1434, https://doi.org/10.1016/j.proeng.2016.06.168, 2016.
Xie, P., Yatagai, A., Chen, M., Hayasaka, T., Fukushima, Y., Liu, C., and Yang, S.: A gauge-based analysis of daily precipitation over East Asia, J. Hydrometeorol., 8, 607–626, https://doi.org/10.1175/JHM583.1, 2007.
Yang, H., Hu, K., Zhang, S., and Liu, S.: Feasibility of satellite-based rainfall and soil moisture data in determining the triggering conditions of debris flow: the Jiangjia Gully (China) case study, Eng. Geol., 315, 107041, https://doi.org/10.1016/j.enggeo.2023.107041, 2023.
Zhao, S., Zeng, R., Zhang, Z., Meng, X., Qi, T., Long, Z., Guo, W., and Si, G.: Landslide mapping and causes of landslides in the China–Nepal transportation corridor based on remote sensing technology, Remote Sens., 16, 356, https://doi.org/10.3390/rs16020356, 2024.
Zhuo, L., Dai, Q., Han, D., Chen, N., Zhao, B., and Berti, M.: Evaluation of remotely sensed soil moisture for landslide hazard assessment, IEEE J. Sel. Top. Appl., 12, 162–173, https://doi.org/10.1109/JSTARS.2018.2883361, 2019.