the Creative Commons Attribution 4.0 License.
the Creative Commons Attribution 4.0 License.
 | 26 Jun 2026
Review article: Harnessing data-driven methods for climate multi-hazard and multi-risk assessment
Davide Mauro Ferrario
Marcello Sanò
Margherita Maraschini
Silvia Torresan
In recent years, interest in data-driven methods, such as machine learning and multivariate statistics for multi-hazard and multi-risk assessment has surged, due to their ability to integrate vast amounts of data in modelling complex non-linear relationships between hazard and risk factors. This review explores data-driven methods in climate multi-hazard and risk assessment, focusing on four themes: (i) data processing and collection; (ii) hazard identification, prediction and analysis; (iii) risk assessment; and (iv) future risk scenarios under climate change. Key findings highlight the extensive use of machine learning to combine Earth observations and climate data for downscaling and land use and land cover characterisation; the application of deep learning for hazard prediction; the use of ensemble methods for risk assessment; and the growing emphasis on explainable AI frameworks. Supervised machine learning approaches trained on historical impact data to project future climate risks have also emerged as a significant research area. Future research in this area should focus on modelling multi-hazard interactions, particularly triggering and cascading effects, integrating dynamic vulnerability and exposure factors, and addressing uncertainties associated with using machine learning for extrapolation. Advancements in Earth observations and textual data integration, alongside the development of open-access disaster catalogues, will also be crucial for improving multi-risk assessments and supporting AI-driven early warning systems tailored to regional needs.
- Article
(4397 KB) - Full-text XML
- BibTeX
- EndNote


The growing interconnectedness between socio-economic and natural systems, coupled with the escalating challenges presented by climate change, has led to increased complexities in climate risk analysis. At the same time, a wider availability of data on multiple risk drivers, including weather observations, Earth observations (EO), climate reanalyses and projections, socio-economic indicators, and social media, coupled with advances in machine learning (ML) and statistical methods, are increasing the potential of data-driven methodologies, which promise to revolutionise climate risk assessment (Kashinath et al., 2021; Reichstein et al., 2019). To unlock the full potential of this data, it is crucial to develop and apply advanced methods for processing, harmonizing, and integrating heterogeneous datasets. These efforts enable the generation of actionable insights essential for effective multi-hazard and multi-risk assessments, by leveraging the accessibility of large datasets to be explored with advanced ML and statistical techniques.
Complex dynamics characterize socio-environmental and climate risk: applications may underestimate impacts if they do not take into account the compounding, cascading and amplifying interactions of hazards and their effect on vulnerability and exposure factors. In fact, (i) compounding hazards (co-occurring in the same location and at the same time) can lead to impacts which may be substantially higher than the sum of the single events taken in isolation (Arosio et al., 2020; Zscheischler et al., 2018), (ii) the occurrence of one hazard itself can modify vulnerability or resilience of the system, exposing assets or communities to higher risks, such as in the case of consecutive hazards (de Ruiter and van Loon, 2022), and (iii) impacts and risks can propagate across multiple scales and sectors, extending far beyond the area initially hit and affecting whole systems (Arosio et al., 2021; Pescaroli and Alexander, 2018), such as in the case of high-impact and low-probability events (Linkov et al., 2022). For these reasons, the international community (Intergovernmental Panel on Climate Change (IPCC), 2023; UNDRR, 2020) has recently pledged for a paradigm shift from single hazard towards a more comprehensive representation of multiple and interconnected climatic risks (AghaKouchak et al., 2020; De Angeli et al., 2022; Gallina et al., 2020; Šakić Trogrlić et al., 2024; Terzi et al., 2019; Tilloy et al., 2019; Ward et al., 2022). To achieve this shift, it is essential to develop data-driven methodologies that can analyse and predict the interactions and dependencies between multiple hazards, enabling a more accurate characterisation of their compounding and cascading effects.
To better navigate the many definitions surrounding multi-hazard risk concepts, this paper adopts the terminology used in Zschau (2017), where multi-layer single hazards refers to applications focussing on more than one hazard, without considering hazard interactions; multi-hazard focuses on hazards interaction; multi-hazard risk refers to applications considering risks in a multi-hazard framework, without discussing interactions at vulnerability level, and finally multi-risk refers to the most complex analysis comprising interactions at both hazard and vulnerability level.
The complex nature of multi-hazard events presents significant challenges to existing risk assessment methodologies, which treat hazards and risks singularly and often struggle to handle the non-linear interactions and feedback loops between multiple risk drivers (Tilloy et al., 2019). ML techniques have recently gained traction in climate science and risk analysis for their ability to process and integrate large, heterogeneous datasets from sources such as weather observations, Earth observations, climate reanalyses and projections, socio-economic indicators, and even social media. By learning from historical data, they can uncover non-linear risk patterns and detect correlations across spatial and temporal scales, driving their growing use in climate risk assessment (Reichstein et al., 2019; Zennaro et al., 2021).
Integrating these heterogeneous data sources can help in capturing multi-hazard interactions and characterise their impacts on social, economic, and natural systems, especially thanks to the introduction of new Deep Learning (DL) architectures and models, specialized in capturing both spatial and temporal non-linear interactions (Park et al., 2023). As ML models have become more complex, attention has shifted toward making these models more interpretable and explainable (Carvalho et al., 2019). This is especially important for applications focussing on risk, where it is crucial to quantify the contribution of each input feature to the model's prediction, making it easier to assess how different risk variables impact the overall risk. In this context, explainability frameworks improve the robustness of risk assessments and enhance trust in the model's outputs by providing insights into how the model arrives at specific conclusions (Jiang et al., 2024; McGovern et al., 2019), supporting transparency and accountability for stakeholders.
In addition to ML methods, this review briefly considers the role of copulas as multivariate statistical tools in multi-risk assessment. Copulas enable explicit modelling of the dependence structure between variables, making them particularly valuable for analysing compound events in which multiple hazards occur simultaneously or sequentially (see, for example, Agrawal, 2022; Hochrainer-Stigler et al., 2019). They have, for instance, been used to characterise the joint occurrence of droughts and heatwaves, yielding insights into their combined impacts on agriculture and water resources (see e.g. Ribeiro et al., 2020). Although their application is more specialised than most ML approaches, copulas provide critical information about inter-hazard dependencies, supporting a deeper understanding of compounding and interacting risks. Their inclusion in this review therefore highlights their importance in contexts requiring precise statistical modelling of hazard interactions and underscores how they complement broader ML-based strategies in climate-risk analysis. To advance this field, there is a critical need for predictive frameworks that can leverage these advanced methods to forecast long-term future multi-hazard and multi-risk scenarios, addressing uncertainties and guiding adaptive risk management strategies under changing climatic conditions.
To support implementation, the development of a wide range of open-source libraries (e.g., scikit-learn, TensorFlow, Keras, PyTorch, VineCopulas (Claassen et al., 2024), etc.), allows users to implement, train, validate, and deploy models with minimal programming expertise, making it possible for non-experts or domain specialists with limited knowledge to efficiently apply advanced techniques to risk modelling. This democratization of tools reduces the technical barriers for researchers and practitioners, enabling more interdisciplinary collaborations and accelerating the adoption of data-driven methods in climate risk management (Rolnick et al., 2019).
This paper aims to provide a comprehensive review of data-driven methods, with a specific focus on ML approaches, for multi-hazard and multi-risk assessment, exploring ongoing applications, current limitations and future perspectives, while also addressing the use of copulas, a non-ML statistical method, to highlight its role in modelling dependencies in compound hazard events. Unlike other recent reviews that have focused on ML (particularly DL) for specific hazards or sectors – such as extreme events (Salcedo-Sanz et al., 2022), hydrology (Tripathy and Mishra, 2024), geophysics (Yu and Ma, 2021), wildfires (Jain et al., 2020), and climate risk (Zennaro et al., 2021) – this paper takes a cross-cutting perspective on multi-hazard and multi-risk assessment. By structuring the discussion around successive stages of risk analysis – data processing, hazard prediction, risk assessment, and future scenarios – we connect climate risk and data-driven methods while also identifying critical gaps, particularly in linking hazard interactions with vulnerability.
The review is structured as follows: Sect. 2 outlines the research questions, and the search methodology employed. Section 3 summarises the literature review findings and discusses key insights related to each of the research questions. Section 4 provides a summary of the key insights and outlines the next steps for research in this field. The Appendices provide an abbreviation dictionary as well as the summary tables of main articles collected for each research question.
This paper follows a systematic review process based on the Preferred Reporting Items for Systematic Reviews and Meta-Analyses (PRISMA) methodology, which ensures a standardized, systematic, and transparent framework for analysing and synthesizing existing literature (O'Dea et al., 2021). The method involves several steps, among which the main ones are: defining of the research questions; developing a protocol detailing the search methodology (including database to search, keywords, timeframe and selection criteria); collecting and screening relevant literature; synthesizing and interpreting the findings. Such a stepwise process ensures a thorough search for relevant studies, consistent criteria for the selection of papers, and clear documentation of the review process, therefore reducing the risk of bias and enhancing the robustness and replicability of the analysis (Sarkis-Onofre et al., 2021).
2.1 Research questions
Each of the four research questions (Fig. 1) is focussed on a specific topic and presents several sub-topics, offering a structured framework to explore current applications, address challenges, and pinpoint future opportunities. These research questions are:
-
Data: How can Machine Learning improve data collection and processing?
-
Multi-Hazard: How can Machine Learning and statistical tools be used to analyse extreme events, and model hazard interactions?
-
Multi-Risk: How can Machine Learning applications integrate vulnerability and exposure in multi-risk analysis?
-
Future: How can Machine Learning and statistical tools be used to predict long-term future multi-hazard and multi-risk?
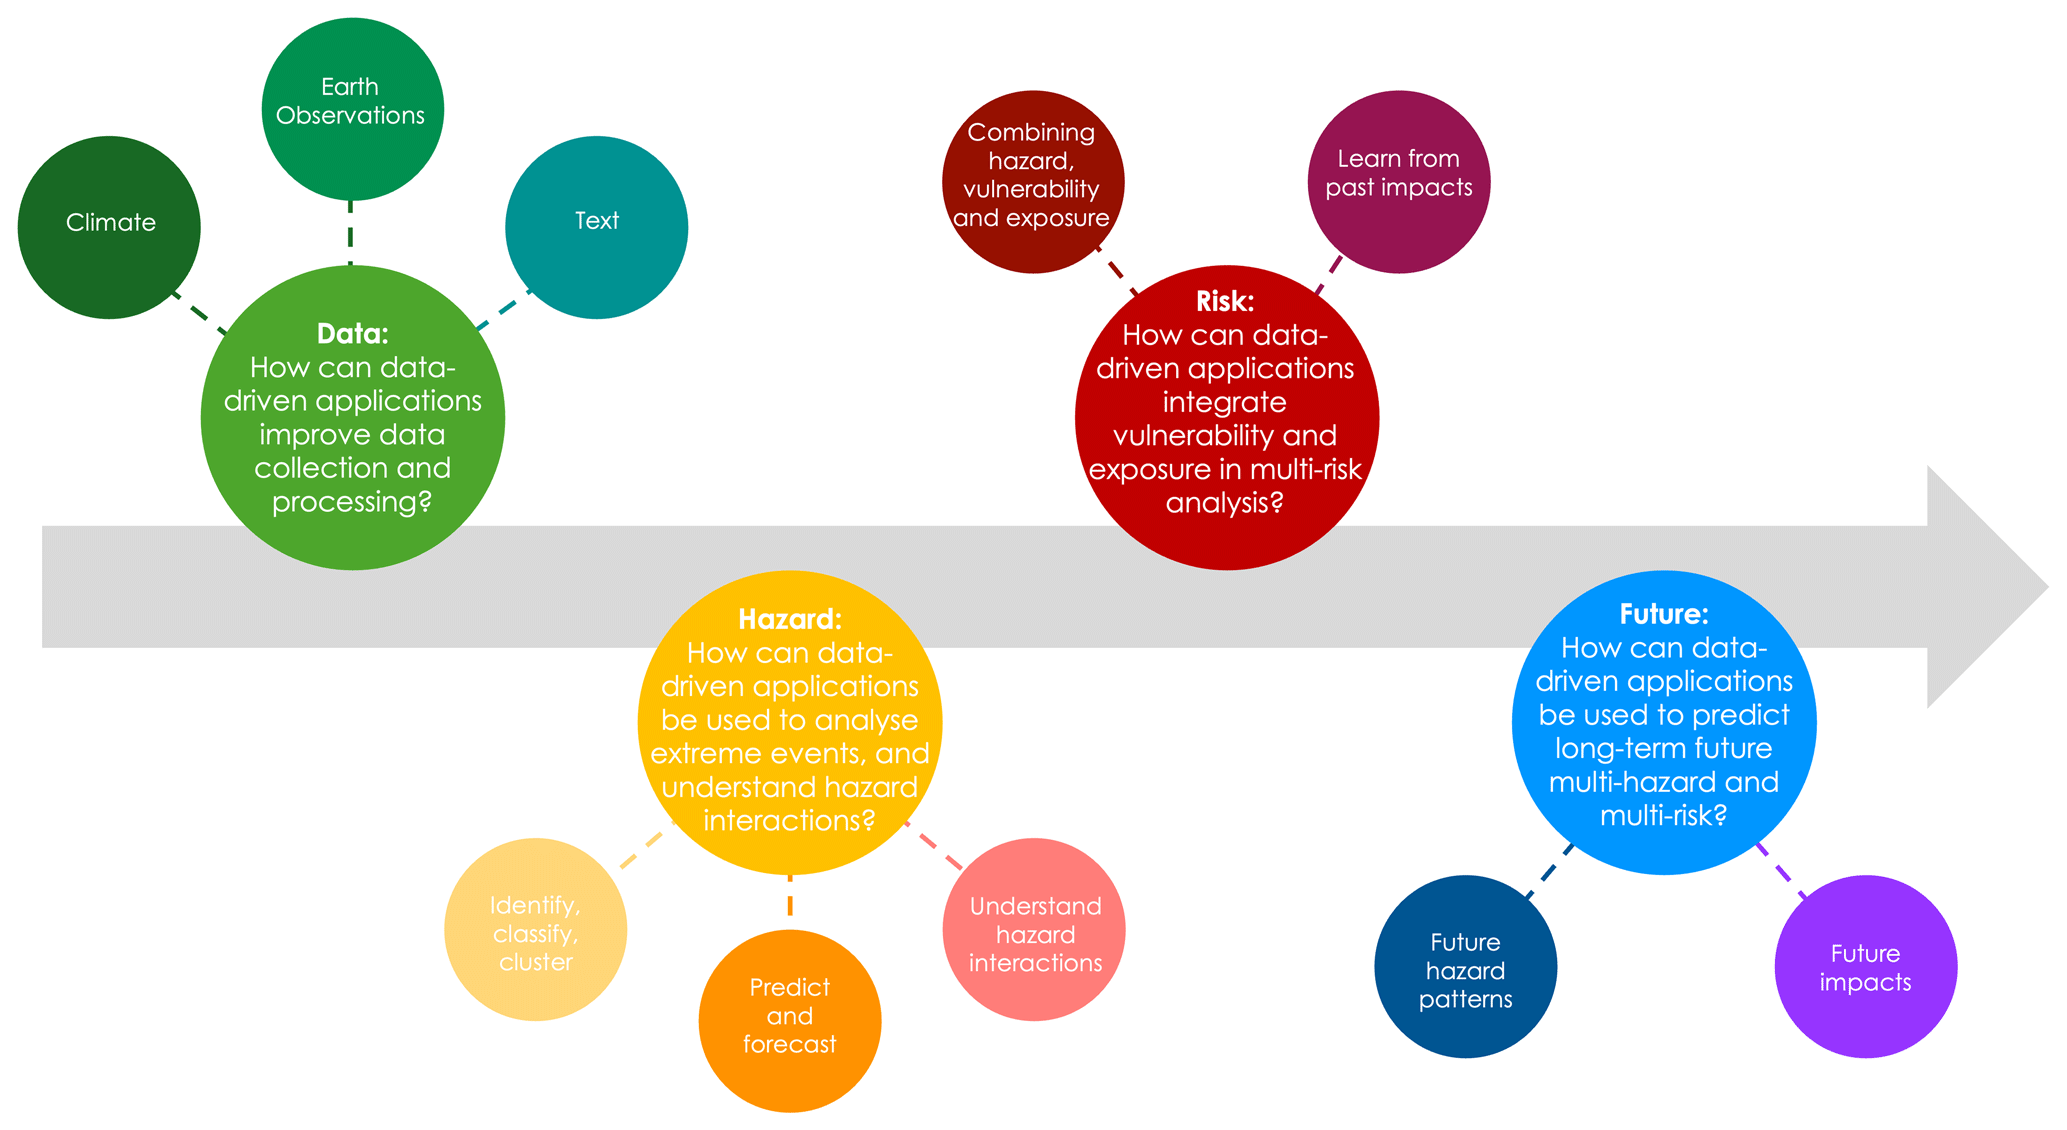
The first research question examines how ML can help process diverse types of data, extracting and harmonising the information needed to analyse multi-hazard and multi-risk by addressing current gaps such as data sparsity, inconsistency across sources, and the lack of harmonised formats. This contributes to improving the quality and comparability of risk assessments by enabling integrated use of climate, EO, and textual datasets. In particular, the sub-themes are divided based on the type of data analysed:
- i.
Climate data (time series of geospatial climate data), which describe the characteristics of climate-related hazards across space and time. Preparing this data for multi-hazard and multi-risk applications often requires ML methods (i.e. feature engineering) to increase spatial and temporal resolution, harmonise and extend the time coverage of the datasets or correct for biases (Schneider et al., 2023).
- ii.
EO, which can be used to characterise hazard, exposure and vulnerability layers and extract information on impacts (Ghaffarian and Emtehani, 2021; Novellino et al., 2024).
- iii.
Textual data, such as newspapers or social media, which in the last years have been leveraged for extracting information on diverse impacts (Sodoge et al., 2023).
The second research question investigates how ML and statistical tools improve the identification and modelling of hazard dynamics by capturing complex spatio-temporal patterns, compounding effects, and non-linear interactions that traditional approaches often overlook. This helps advance multi-hazard and multi-risk analysis by providing more accurate detection, classification, and modelling of extreme events. In particular, the key sub-themes are:
- i.
Analyse which methods can be used to identify, classify and cluster extreme events, producing spatio-temporal footprints of multi-hazard events (Yu et al., 2022).
- ii.
The prediction of (multi-)hazard events, for example through early warning systems or seasonal predictions (Bhowmik et al., 2023).
- iii.
The analysis of hazard interactions, for example characterising joint distributions through copulas (Bevacqua et al., 2021) or multi-hazard susceptibility maps (Pourghasemi et al., 2019).
The third research question concerns the application of ML for the integration of vulnerability and exposure into multi-risk analysis addressing the current gap where vulnerability and exposure are often treated as static or secondary layers rather than dynamic drivers of risk. This integration strengthens the ability of multi-risk assessments to capture how socio-economic conditions and adaptation measures interact with hazards to shape overall risk. In particular, the key themes are:
- i.
Multi-hazard exposure and vulnerability assessments, integrating susceptibility mapping with information on specific exposure layers, such as buildings and population (Rusk et al., 2022).
- ii.
Modelling risk from past impacts data, often through supervised ML approaches that use hazard, vulnerability and exposure indicators as predictors (Dal Barco et al., 2024).
The fourth research question investigates the possible contribution of ML and statistical tools into the analysis of (long-term) future multi-hazard and multi-risk, where uncertainty associated with the representation of future extremes in climate projections further complicates risk modelling, highlighting a critical gap in existing approaches, which often fail to adequately capture compound and cascading extremes under changing climate conditions This research question clarifies how ML can enhance scenario building, improve uncertainty quantification, and support more robust long-term multi-risk assessments. In particular, the key sub-themes are:
- iii.
Modelling future multi-hazard trends and spatial patterns using statistical methods, in particular for compound and consecutive events (Zscheischler et al., 2018).
- iv.
Assessing future impacts based on climate change projections, often using methods trained on historical data and applied to ensembles of RCP projections (Park and Lee, 2020).
2.2 Methodological framework: search methodology, screening, reporting and interpreting
The search was performed on Scopus, focusing on articles published in English. Since the analysis focuses on ML applications and multi-risk, the timeframe 2010–2024 was chosen because both areas of research are recent and other reviews have addressed earlier periods, highlighting that most applications in ML and climate risk have been published only in the last few years (Zennaro et al., 2021). For each research question, a dedicated search was performed. Each search string was generated by the combination of a set of method-related keywords (e.g. those related to ML or statistical methods), common across all questions, and a set of thematic keywords, specific to each research question (Fig. 2).
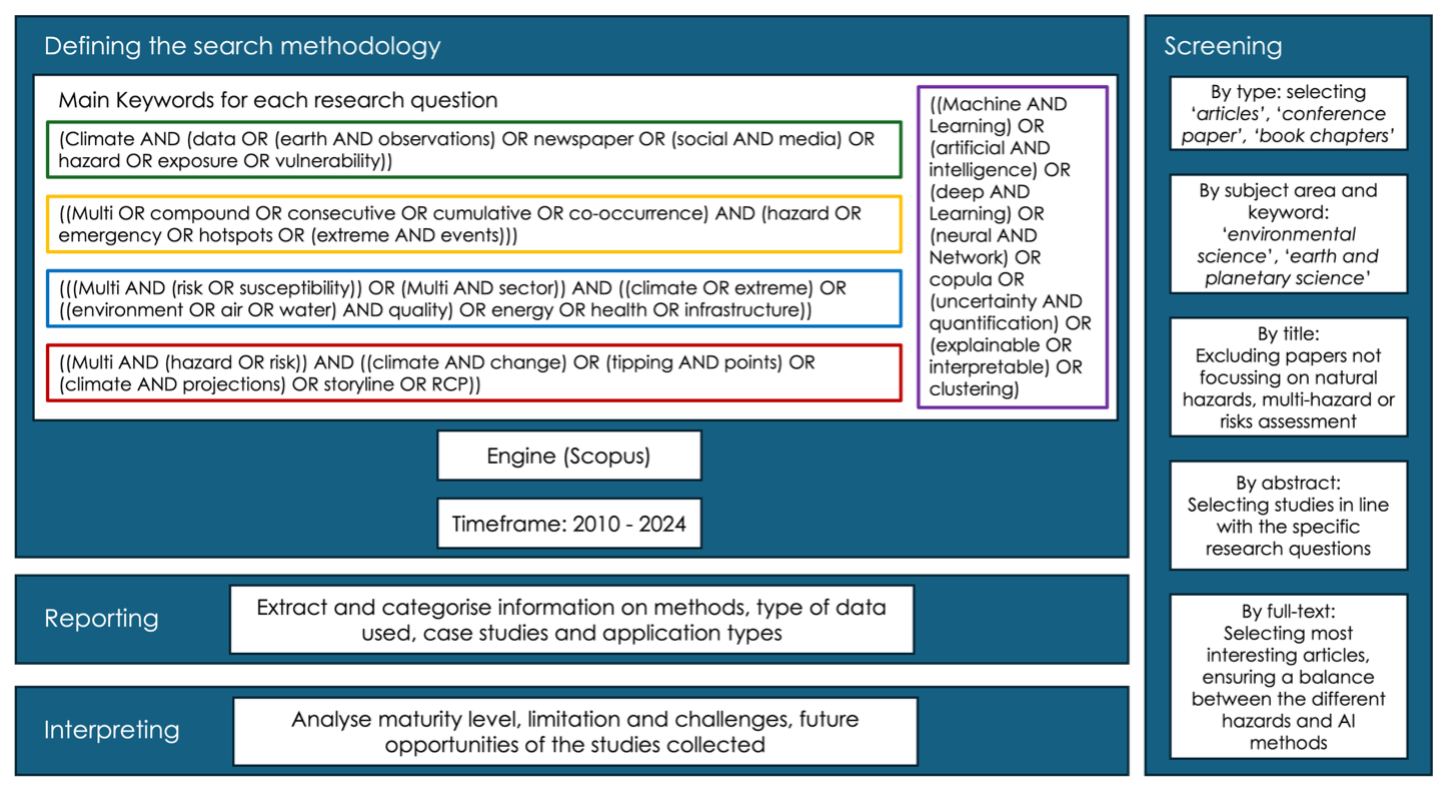
After collecting articles for each research question, the papers were first filtered by following typologies: “journal articles”, “conference papers”, and “book chapters”. Afterwards, for each research question, the papers were screened by title, then by abstract, and finally by full text. The final screening selected 153 key papers to be analysed in the literature review. This information was then summarised into tables, identifying the type of applications, the type of data used, the case study and the methods used. Finally, for each research questions, the results were discussed to understand the maturity level of the applications, their limitations and possible future developments.
2.3 Limitations and scope of the review
While this review follows the PRISMA guidelines for search strategy, screening, and reporting, a formal numerical quality scoring of individual studies was not applied, consistent with standard practice in PRISMA-based reviews of computational methods in geoscience and climate risk (e.g., Zennaro et al., 2021; Salcedo-Sanz et al., 2022; Ghaffarian et al., 2023). Instead, quality and relevance were assessed qualitatively during full-text screening based on three criteria: methodological rigour (evaluated through the presence and type of model validation, e.g., cross-validation, independent test sets, or benchmark comparisons), relevance to the research questions, and diversity across data sources, geographical coverage, hazard types, and ML approaches. The latter criterion was applied explicitly to avoid over-representation of any single method or region in the final corpus, and is documented in Appendix B.
Another limitation concerns terminological consistency. Although this review adopts the Zschau (2017) framework to reclassify papers during full-text screening, the terms multi-hazard, multi-risk, compound, and cascading are used with considerable inconsistency across the reviewed literature, a well-documented feature of the field (Gill and Malamud, 2014; Tilloy et al., 2019). Because paper selection was based on keyword matching against author-assigned terminology, the corpus necessarily reflects this heterogeneity, and the thematic categories used in the synthesis should be understood as analytical conveniences rather than sharp taxonomic boundaries.
Moreover, while this review focuses on ML and copula-based methods as the primary data-driven approaches for multi-hazard and multi-risk assessment, it is important to acknowledge that several complementary quantitative frameworks exist and have been the subject of dedicated reviews that fall outside the scope of the present work. Bayesian networks (BNs) provide a probabilistic framework for multi-hazard causal modelling, capturing conditional dependencies between risk drivers through directed acyclic graphs and propagating uncertainty in a transparent, interpretable way; they are particularly valuable in data-sparse contexts where causal structure can be informed by expert knowledge, and their application to climate multi-risk assessment has been reviewed in depth by Sperotto et al. (2017). Agent-based models (ABMs) simulate the adaptive behaviour of individuals and institutions under hazard scenarios, making them suited to capturing dynamic vulnerability, evacuation dynamics, and community resilience processes that purely data-driven models cannot represent; comprehensive reviews of their application in disaster management are provided by Zhuo and Han (2020) and Anshuka et al. (2022). More broadly, the full landscape of quantitative methods for modelling hazard interrelationships, including stochastic, empirical, and mechanistic approaches, is systematically covered by Tilloy et al. (2019), providing a valuable complement to the ML-focused perspective of the present review.
Finally, some considerations need to be taken on the geographical distribution of the 153 papers included in this review, which reveal a marked concentration in a small number of regions. In terms of lead authorship, Europe (35.5 %) and East Asia (27.0 %) together account for nearly two thirds of the corpus, followed by North America (21.1 %), while the Global South is substantially underrepresented: Africa, South America, and Oceania collectively contribute less than 5 % of lead authors. A similar pattern holds for co-authorship, though with a slight broadening of participation: South/SE Asia rises to 6.4 % and Middle East to 7.3 %, suggesting that researchers from these regions participate more frequently as collaborators than as lead investigators. The most pronounced shift occurs in the case study column: Global studies account for 14.9 % of the corpus, and South/SE Asia (10.6 %), Middle East (6.8 %), and Africa (5.0 %) are more represented as study areas than as sources of authorship, indicating that data-driven methods developed in high-income regions are frequently applied to, rather than developed within, lower-income contexts. The full breakdown of lead author institution country, co-author countries, and case study regions, together with a Sankey diagram illustrating the flows between these three dimensions, is provided in Appendix B. These geographical imbalances should be borne in mind when interpreting the findings of this review, as the methods, datasets, and risk priorities that dominate the literature inevitably reflect the institutional contexts in which the research was produced.
3.1 Data
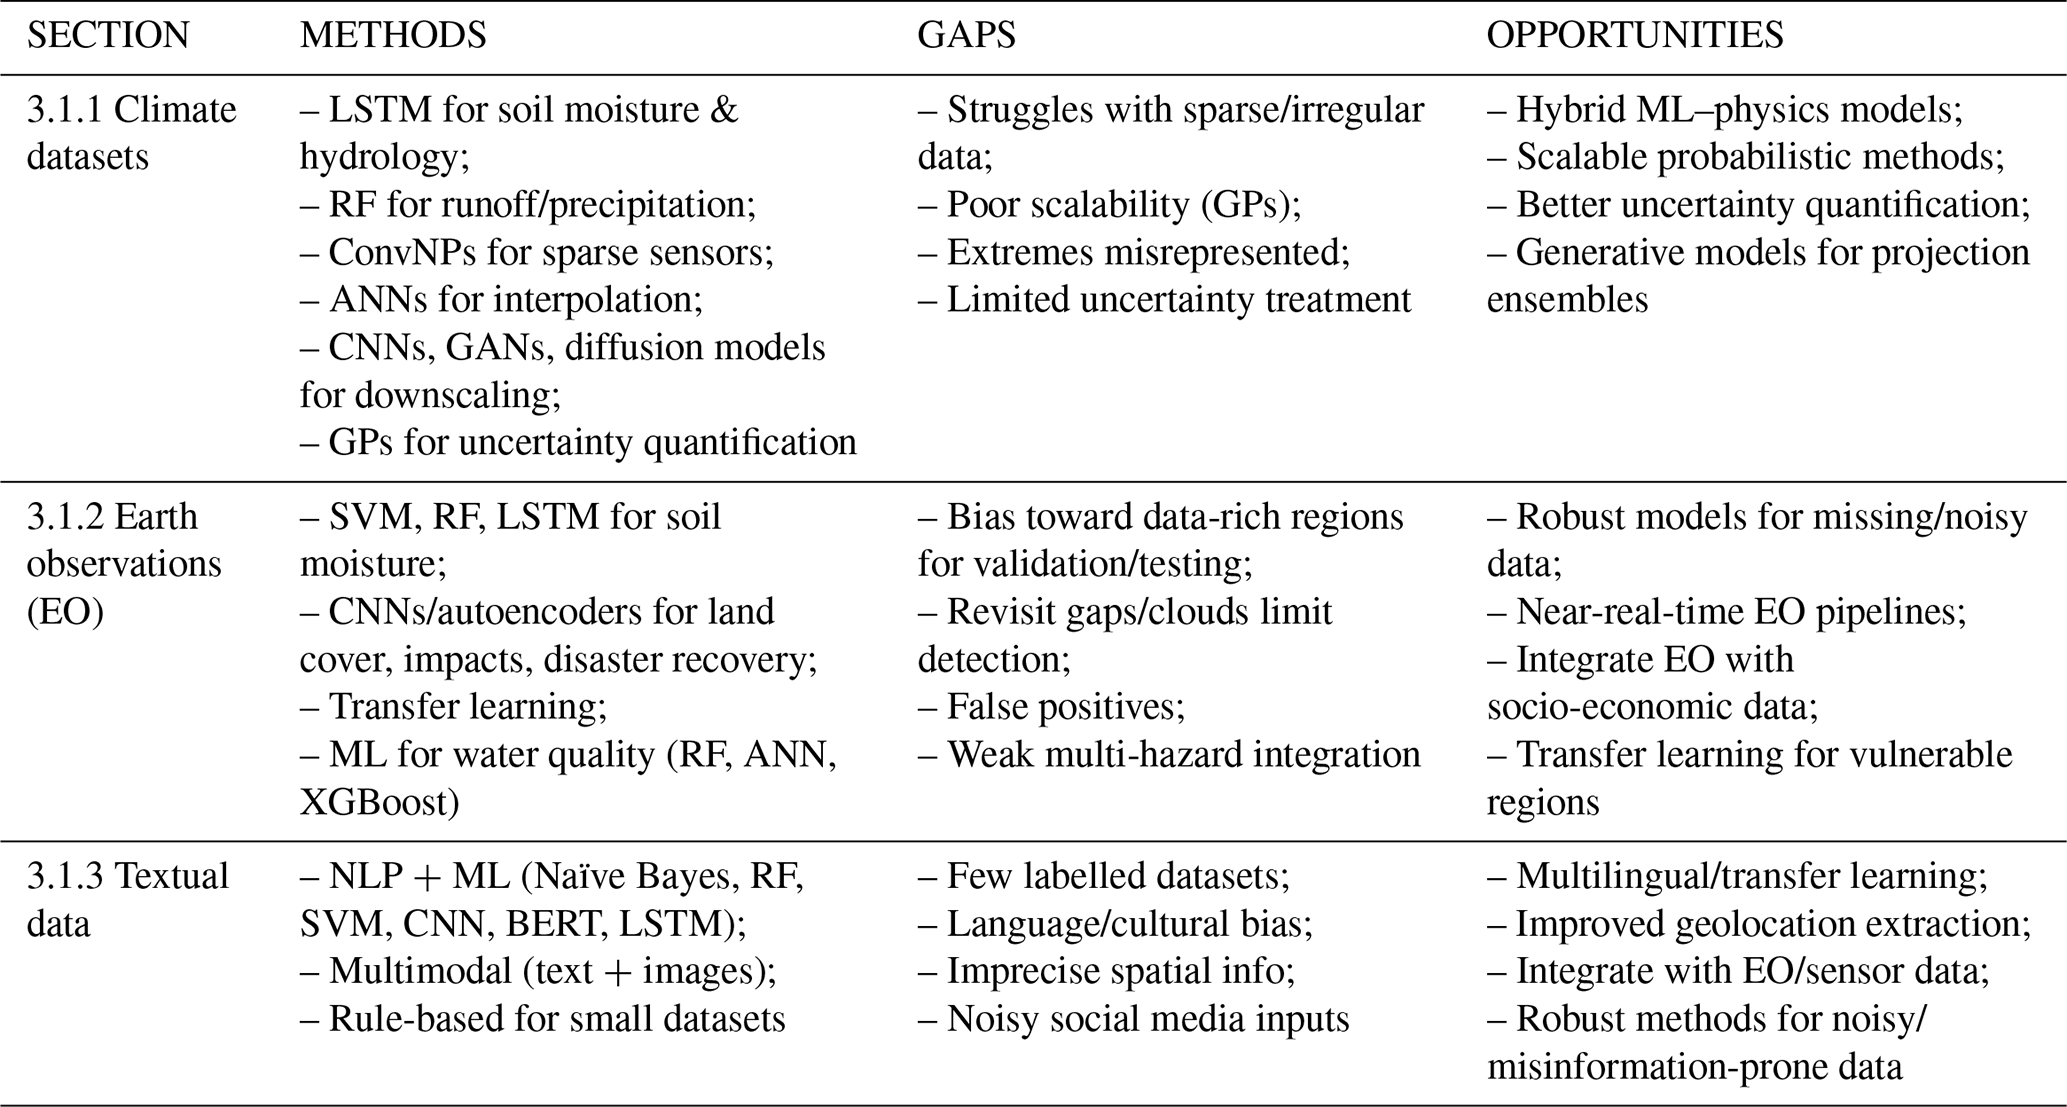
This section contributes to the field of multi-hazard and multi-risk analysis by showing how ML applications to climate datasets, Earth observations, and textual data can overcome data sparsity and heterogeneity (Table 1), thereby enabling the generation of more complete, high-resolution, and multi-source datasets that are essential for capturing hazard interactions and cascading risks.
3.1.1 Climate datasets
The application of ML methods to produce new, complete, or high-resolution hazard datasets (either from meteorological observations, climate reanalyses or future projection) is quite established, and mainly focuses on data with sparse and irregular measurements. A typical indicator which is derived with ML methodologies is soil moisture: in-situ measurements are usually scarce and not uniformly distributed, satellite images (which will be discussed later) often presents temporal gaps and can only provide information on the first layer and struggles in complex topographies and it presents a complex dynamic that is influenced by many different drivers (similarly to multi-risk prediction) such as precipitation, temperature, evaporation, topography and land use. For example, Kang et al. (2018) and O and Orth, (2021) investigate the complex interactions at different soil levels and temporal scales with a Long-Short Term Memory (LSTM) model that takes as inputs the topography, vegetation and atmospheric conditions and predicts each soil moisture layer in succession, using ERA-5 reanalysis as assessment endpoint. LSTM is widely applied to model the behaviour of other hydrological variables, such as snow, run-off and river catchments. Entity-Aware LSTM was used for rainfall-runoff modelling by Kratzert et al. (2018, 2019b), to include both static and dynamic inputs allowing the algorithm to explicitly differentiate the two different types. Ghiggi et al. (2019) applies Random Forest (RF) regression to predict monthly runoff rates in the timeframe 1902–2020, based on antecedent precipitation and temperature from an atmospheric reanalysis, validating the results with in-situ streamflow observations. Other research focuses on different variables and in particular investigate the irregular distribution of sensors: Amato et al. (2020) introduces a multi-step methodology to interpolate irregularly distributed spatio-temporal timeseries, first decomposing the signal and then learning stochastic spatial coefficients which can be spatially modelled and mapped on a regular grid with Artificial Neural Networks (ANN), allowing the reconstruction of the complete spatio-temporal signal.
ML methods have been applied also to climate reanalyses and models. Early applications, such as He et al. (2016), tested RF regression to statistically downscale spatially precipitation data, using few covariates and demonstrating how this approach is able to catch the non-linear relations between variables, minimising overfitting and collinearity issues between predictors. However, the algorithm struggled with skewed datasets and even the final model, which is the combination of two different RF models, trained respectively on high-precipitation and low-precipitation values, fails to detect the complex spatial and temporal complexity of precipitation data, overestimating the intensity and spatial distribution of low precipitation and underestimating high precipitation. Other applications are focussing on Deep Learning models: CNNs are used to downscale many variables from future climate models (among which, air temperature, precipitation, 10 m wind speed, 2 m relative humidity, downward shortwave radiation) (Lin et al., 2023). Generative models particularly Generative Adversarial Networks (GAN) and diffusion models, are widely used for this task. GANs consist of two neural networks – a generator and a discriminator – that are trained simultaneously in a competitive process. The generator attempts to create realistic fake data that can fool the discriminator, while the discriminator works to distinguish between real and fake data. For example, specific GANs based on Convolutional Neural Networks (CNNs) have been applied to post-process weather forecast outputs. These models can enhance the resolution of precipitation data by a factor of ten, producing more realistic and spatially coherent forecasts compared to the original input data (Harris et al., 2022). Diffusion models, on the other hand, learn to reverse a noise process: first the model adds sequentially noise to input data, then the model learns how to predict the noise at each step, and once trained, it can start with noisy data and work backwards, progressively removing the noise to generate a new, realistic dataset. Diffusion models are related to variational inference, where the forward process defines a probabilistic trajectory from data to noise, and the reverse process defines a generative path from noise back to data. Unlike other generative models like GANs, which learn through a “discriminative” process (trying to fool a discriminator network), diffusion models learn through this smooth diffusion and denoising process (Yeğin and Amasyalı, 2024). For example, diffusion models are applied to downscale multiple climate models, also providing information on the uncertainty downscaling, by generating a large number of ensemble members based on probability distribution sampling (Ling et al., 2024). DL approaches are often used to downscale low-resolution future models to Convection Permitting (CP) climate models, where the main advantage of these techniques is their reduced computational costs compared to the development of a CP climate models (Bretherton et al., 2022; Clark et al., 2022). The role of Artificial Intelligence (AI) in climate predictions is discussed in Schneider et al. (2023). This study advocates for the development of global models at 10–50 km resolution, harnessing AI and EO for the calibration and development of higher-resolution regional simulations.
In recent years, there has been growing interest in hybrid modelling: approaches that combine data-driven ML methods with physical or process-based models or constraints, as a way to benefit from both high flexibility and physical realism. Such hybrid/physics-informed ML methods help address several limitations of pure data-driven models: they can enforce conservation laws, reduce overfitting to noise, improve generalization especially under conditions outside the training domain, and provide more interpretable insights into underlying drivers. For instance, He et al. (2023) integrates ML corrections into a land-surface/atmospheric model using data assimilation, remote sensing LAI and soil moisture to improve climate simulations. Similarly, Huynh et al. (2025) combines process-based hydrological flux models with neural networks to correct for scale mismatches and to better capture spatial heterogeneity. Also, Yu et al. (2024) provides benchmarks for ML emulators that mimic nested high-resolution physical simulations. Despite their promise, hybrid models also face important limitations. They often require substantial domain and physical knowledge to be formulated appropriately and to ensure physical consistency (Willard et al., 2022). Moreover, coupling ML architectures with numerical process models can remain computationally demanding, particularly for high-resolution simulations or large spatio-temporal domains (Reichstein et al., 2019). Calibration and validation can also be complex, as balancing the contributions of the physical and data-driven components often involves ad hoc or case-specific tuning (Read et al., 2019). Finally, interpretability may still be reduced when the ML component acts as a black box, obscuring how physical constraints shape predictions (Kashinath et al., 2021). These challenges are also relevant for hazard prediction, where process dynamics such as land–atmosphere feedback play central roles and require models that are both physically credible and statistically robust. Thus, hybrid models represent an emerging frontier at the interface of ML, process-based modeling, and data assimilation, particularly relevant for both climate data reconstruction and hazard modelling and deserve explicit consideration in future reviews and benchmarking efforts.
Machine learning applications for climate and environmental datasets have greatly improved the reconstruction and downscaling of variables from sparse and irregular observations. However, a critical yet often under-addressed aspect in this field is uncertainty quantification (UQ), which is particularly relevant when these datasets are later used for hazard or risk assessments (Beven, 2018). Uncertainty in ML-based models arises from multiple sources: Aleatoric uncertainty stems from the intrinsic variability and noise in the underlying measurements, such as sensor errors, missing satellite observations, or inconsistent temporal coverage; epistemic uncertainty originates from limited or biased training data and model structural choices (Xu et al., 2022). Several probabilistic approaches have been explicitly designed to represent spatial data uncertainty by learning distributions rather than deterministic predictions, mainly involving Bayesian Networks (BN) and Gaussian Processes (GP) (Siddique et al., 2022). For example, Multi-fidelity Gaussian Processes with a Matern kernel in particular, were used to downscale precipitation data from ERA-5 over high mountain terrain. Multi fidelity models combine low-fidelity observations (which are usually more numerous and less expensive to obtain) with high-fidelity ones. This makes the model more suited than other state-of-the-art machine learning methods for smaller datasets and able to quantify and narrow the uncertainty associated with the precipitation estimates, which is especially needed over ungauged areas and can be used to estimate the likelihood of extreme events that lead to floods or droughts (Tazi et al., 2024). Andersson et al. (2023) applies Convolutional Neural Processes (ConvNPs), to suggest informative sensor placements by finding sites that maximally reduce prediction uncertainty, testing it for air temperature anomalies measurements in Antarctica. Convolutional Neural Processes (ConvNPs) extend the probabilistic framework of Gaussian Processes by learning flexible, data-driven covariance structures through neural networks. While traditional GPs provide robust uncertainty estimates but suffer from scalability and stationarity constraints (Jiang et al., 2022a), ConvNPs maintain a probabilistic foundation while scaling linearly with data size and accommodating irregular spatial inputs (Garnelo et al., 2018). DeepSensor (https://github.com/alan-turing-institute/deepsensor, last access: 24 June 2026), a specific GitHub python package, was developed to facilitate the application of Neural Processes in environmental sciences, especially for downscaling, interpolation, sensor placement and data imputation. Monte Carlo Dropout (MCD) enhances epistemic uncertainty quantification in climate data and was tested on neural networks for probabilistic medium-range weather forecasting (Garg et al., 2022). Deep generative models such as diffusion or GAN frameworks can further approximate uncertainty by generating ensembles of plausible realisations that sample the predictive probability space (Ling et al., 2024; Saha and Ravela, 2022). Despite these advances, most studies still focus primarily on improving resolution and accuracy, while systematic approaches to quantifying and propagating uncertainty through the modelling chain, from data to hazard and risk estimates, remain limited (Beven, 2018). Addressing this challenge is crucial, as downstream risk assessments rely heavily on the reliability of the climate inputs that feed them.
3.1.2 Earth observations
EO data, when combined with ML is increasingly recognised for its critical role in supporting actionable multi-hazard and multi-risk assessment, as evidenced by new initiatives from ESA and NOOA's Centre for AI, where particular attention is devoted to the use of EO for discovering impacts in remote areas and developing early warning systems.
Remote sensing images are used to improve climate datasets, for example increasing the spatial coverage in areas with sparse measurements or providing real data to bias-correct/downscale modelled data. Multiple AI methods, such as Support Vector Machine (SVM) (Ahmad et al., 2010; Jing et al., 2016a), Ridge Regression (Kang et al., 2018), RF (Han et al., 2023; Jing et al., 2016b) and LSTM (Fang et al., 2017) are applied for developing soil moisture datasets.
EO provides consistent, near-real time observations of environmental conditions that are critical for early warning and hazard characterisation. For instance, indicators such as vegetation stress (Miyoshi et al., 2020; Schiefer et al., 2020; Veras et al., 2022), surface temperature anomalies can enable the early detection of droughts (Barrett et al., 2020), floods (Dasgupta et al., 2022) or wildfires (Jain et al., 2020) especially in remote and data scarce areas. DL and Physics Informed Neural Networks can leverage radar (e.g., Sentinel-1 SAR), to estimate water levels for flood forecasting (Dasgupta et al., 2022; Gierszewska and Berezowski, 2024) or fused into predictive models that refine hazard forecasts for severe weather and anticipate cascading impacts (Flora et al., 2021). Remote sensing plays a crucial role in hazard dataset development by helping mitigate bias that may be inherited by ML-based risk models. These models are often trained on datasets calibrated with data from resource-rich regions, where the majority of weather stations are located. As a result, they may struggle to generalize effectively to underdeveloped areas, which are frequently the most vulnerable to extreme events (McGovern et al., 2019, 2022).
EO combined with ML is also used in assessing environmental quality, such as water quality (Sagan et al., 2020; Sit et al., 2020). These applications mainly showcase simpler models, such as short neural networks and SVM (Nazeer et al., 2017), Decision Trees (DT), RF, Cubist Regression and Extreme Gradient Boosting (XGBoost), due to their ease of implementation and relative scarcity of ground measurement data (Liu et al., 2023b). They focus on optically parameters, such as chlorophyll-a, turbidity and suspended solids, but also others such as of nutrients and other non-optical parameter) can be predicted relying on models integrating meteorological and hydrological variables (Chen et al., 2022).
A central application of EO is in supporting impact and damage assessments: change detection techniques that compare pre- and post-event imagery are used to estimate physical impacts (Bai et al., 2023; Wang et al., 2018). This includes building damage (Bai et al., 2018), infrastructure collapse (Sublime and Kalinicheva 2019) due to earthquakes or tsunamis (Ji et al., 2018), but also flood extent (Munawar et al., 2021), landslides (Lei et al., 2019) and wildfire scars (Bo et al., 2022; Tran et al., 2020). The main challenges encountered in these applications are due to the return periods of satellites, which may limit their ability to detect fast changing impacts; to the presence of clouds, which can hamper visibility especially during the occurrence of extreme events likely to cause damages; and to changes in luminosity or season (Faiza et al., 2012).
Moreover, EO enables long-term recovery tracking and vulnerability/exposure monitoring, with applications using proxies such as night-time lights to measure recovery trajectories (Kabiru et al., 2023; Qiang et al., 2020). For examples, studies have used EO and ML to track how rapidly services return to urban slums post disaster, highlighting which population remain exposed and underserved (Ghaffarian and Emtehani, 2021). Similarly, UNET-based CNNs are used to identify deprivation pockets from satellite images and track during their recovery process (Wang et al., 2019a), or to derive proxy indicators for poverty from satellite night lights (Jean et al., 2016), in combination with transfer learning to overcome scarcity of labelled data (Pan and Yang, 2010). At longer timescales, techniques like K-Nearest Neighbour (KNN), SVM, ANN and RF are used to classify urban and rural land cover, detect land use changes or informal settlements (Adam et al., 2014; Yuh et al., 2023; Zerrouki et al., 2019).
In summary, the integration of EO with ML and statistical techniques offers a powerful toolkit for multi-hazard and multi-risk assessment, supporting early warning, targeted preparedness, rapid impact estimation, and recovery monitoring.
3.1.3 Textual data
In addition to remote sensing, textual data from sources such as social media and newspapers offer valuable information for impact assessment. Natural Language Processing (NLP) algorithms can harness this textual data, facilitating applications across various hazard types, including landslides, volcanoes, drought, earthquakes, floods, and wildfires. In general, the procedure typically consists in several steps, in which the textual sources are first screened based on metadata (such as location or the presence of disaster-related words in titles); then NLP or semantic algorithms (Angelov, 2020) are used to extract keywords from the main text and convert the textual data into tabular/numeric; then a classification algorithm is applied to choose between impact/no impact data or link the impacts to a specific sector or hazard. Additional steps may also involve the retrieval of spatial information from textual data. Many different algorithms can be employed, with logistic/lasso regression (Genkin et al., 2007), Naïve Bayes Classifiers (Jiang et al., 2016), KNNs (Shah et al., 2020) and ANNs (Nam et al., 2014), being the most common. In the field of disaster mapping, SVM are tested by Asinthara et al. (2022), while Powers et al. (2023) compares CNN and specific pre-trained language models; Koshy and Elango (2023) tests a multi-modal method leveraging text and images from social media, employing the language models BERT; Mehrotra et al. (2022) test SVM, DT, RF, Adaboost, Gradient Boosting, XGBoost, LSTM in combination with language models. Twitter (now X) was the main social media that has been used to detect impacts, while newspaper articles have also been used, in particular for slow onset hazards, such as droughts. For example, Sodoge et al. (2023) apply several NLP and ML methods to automatize the detection of drought impacts from newspaper articles; the procedure classifies impacts into 25 classes, based on the sector (e.g., forestry, livestock, forestry, transport etc.) by using different Supervised ML models (Naïve Bayes, Lasso Regression, RF, ANN). In general, rule-based methods are preferred to ML models when the number of samples is limited (Liu et al., 2018b).
3.2 Multi-hazard
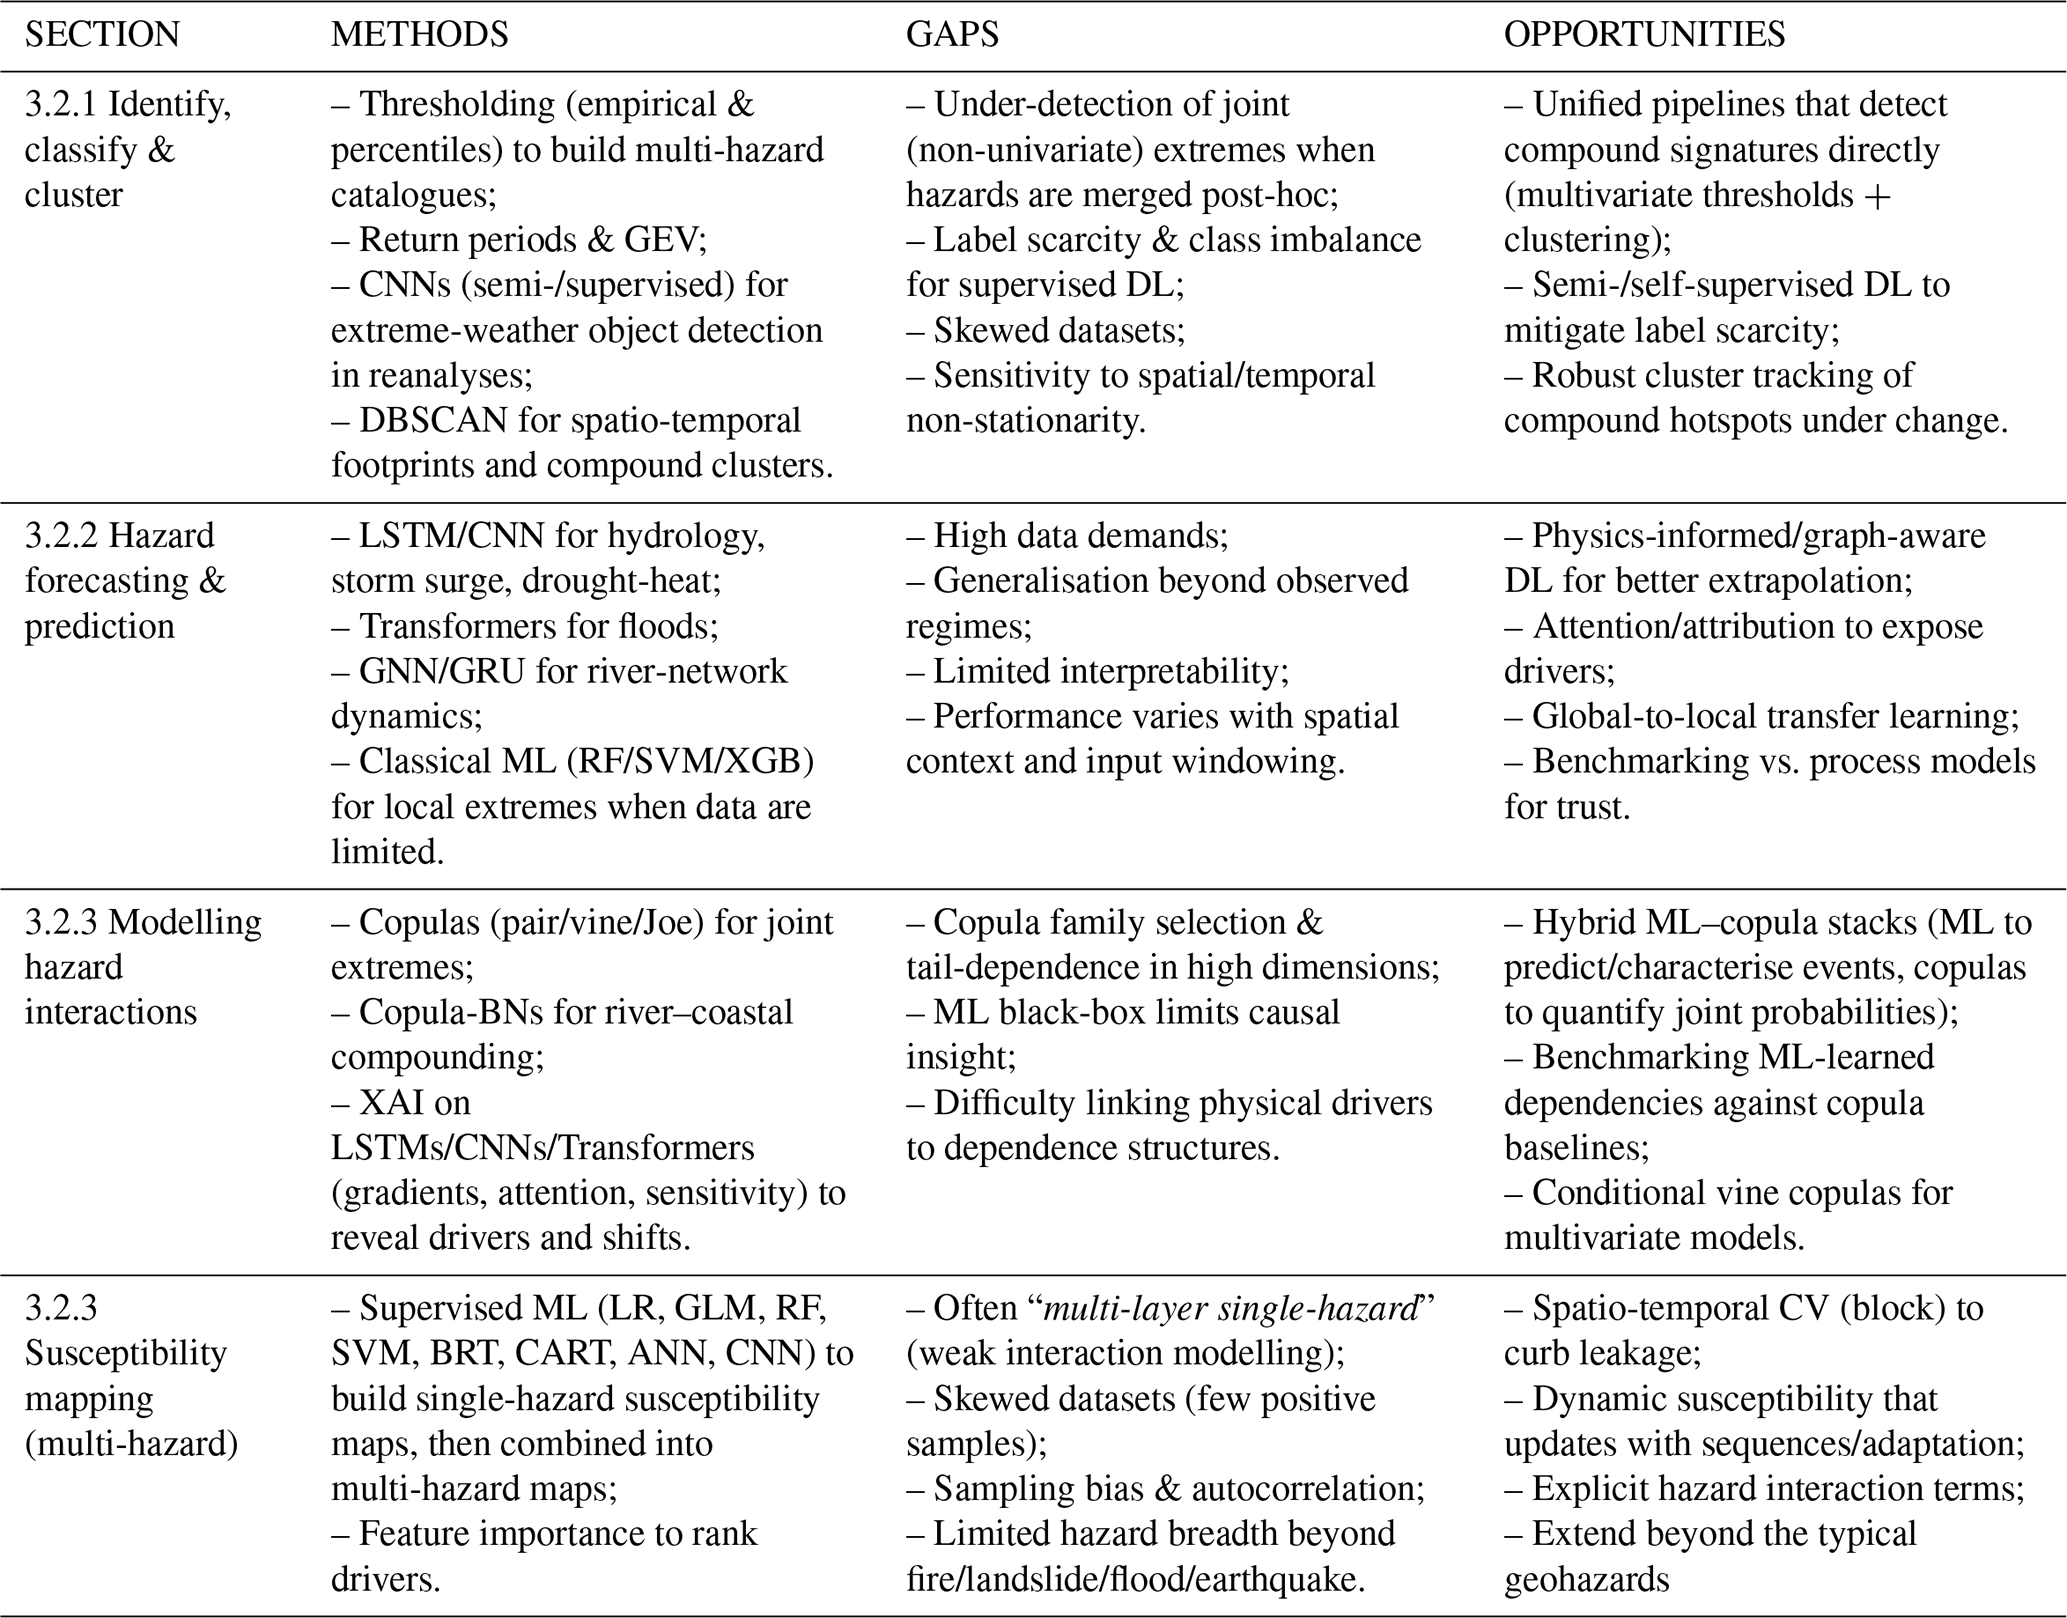
This section contributes to the field of multi-hazard and multi-risk analysis by reviewing methods for identifying, classifying, and clustering hazard events from diverse datasets, highlighting how threshold-based approaches, clustering algorithms, deep learning models, and copulas can capture the spatio-temporal footprints and interactions of hazards (Table 2), thereby advancing the ability to detect, forecast, and model compound and cascading events.
3.2.1 Identify, classify and cluster
The initial step in conducting a comprehensive multi-risk assessment involves a thorough analysis of hazard factors, which is critical for effective climate risk evaluation and enhancing disaster preparedness. In this context, identifying various hazards, classifying them into distinct categories, and extracting their spatio-temporal footprints through clustering techniques are fundamental processes.
The identification of impacts from satellite images to discover hazard footprints, such as for landslides, earthquakes, floods was discussed in the previous section because it is mainly an image processing task, where the goal is to identify differences between two images. This section focuses on the identification of extreme events from climate datasets, which require specific considerations on the typology of hazards and risk considered and is subject to different definitions and multiple interpretations. The most common approach to identify multiple hazards from climate datasets is to use thresholds to identify univariate extreme events and then combine them at a later stage into a multi-hazard database. In order to identify the thresholds, two methods are applied: empirical thresholds (e.g., defining a max temperature over which an event is considered extreme) or statistical thresholds (e.g., calculating a pixel-wise and/or day-wise percentile to identify events that exceeds a threshold that can vary spatially and temporally). Empirical thresholds are usually fine-tuned to link extreme events to impacts on specific sectors or local applications, and many applications focus on temperature extremes and health (Ray et al., 2021; Sun et al., 2014). Statistical thresholds are preferred when analysing global trends and merging multi-hazard extremes because they allow a more consistent and probabilistic robust comparison between different hazards. Percentiles can be easily adapted to model spatial and temporal variations in data and are ideal for global application that cover multiple landscapes where a unique empirical threshold cannot be univocally determined. For example, in Ionita et al. (2021), specific percentiles are used to identify heatwaves and drought from temperature and SPI indicators respectively, before applying Empirical Orthogonal Functions to investigate their drivers and their centre of actions over Europe; Similarly, Sutanto et al. (2020) is using percentiles to identify heatwaves, droughts and wildfires from temperature, soil moisture and Fire Weather Index (FWI), analysing spatial overlaps of the daily binary hazard maps to identify simultaneously occurrences of dry hazards and then investigating cascading events by looking at different combinations of hazard sequences. Claassen et al. (2023), proposes a methodology to identify multi-hazard events combining static footprints derived from the processing of satellite images (e.g. for landslides, floods, tsunamis) with dynamic footprints (based on statistical percentiles) of climate hazards (e.g., heatwaves, droughts, extreme precipitation, extreme wind, etc.), proposing a methodology to identify consecutive events using a specific time lag and analysing the global distribution of the various multi-hazard events.
Return periods are another statistical technique used to identify extreme events, studying the likelihood of an event of a certain magnitude occurring in a chosen timeframe (Liao et al., 2021). Return periods are most often applied in hydrology, when dealing with flooding and storm surge events (Liu et al., 2020, 2023a; Mattei et al., 2021; Zanini et al., 2020). These applications fit a probability distribution (typically a Generalised Extreme Value Distribution, calculated over the number exceeding of a threshold or over maxima) which allow for an estimation of the uncertainty of the threshold. Percentile thresholds, returns periods and Generalised Extreme Value (GEV) distributions are also used conjunctly, such as in Orth et al. (2022), where different hydrological hazards (floods, frost, heat waves, droughts, and storms) and their contrasting impacts are analysed against multiple sectoral assessment endpoints (Gross Primary Productivity for vegetation, crop yields, human mortality, damages to properties and public attention).
It is important to note that these approaches focus initially on univariate extremes, and only at a second stage, the identified events are merged to produce multi-hazard events, checking for overlapping in time and space. This can lead to the underestimation of compound joint-extreme events which arise as a combination of multiple indicators not individually extreme.
Other approaches focus on identifying and classifying extreme events from climate reanalyses using DL, especially in case of cyclones or other hazards that are characterised by the interaction of multiple atmospheric drivers. Liu et al. (2016) was one of the first to apply CNN based on AlexNet to detect and classify tropical cyclones, atmospheric rivers and weather fronts from climate datasets, such as ERA-5, CAM5.1. One of the main challenges in this domain is the scarcity of labelled data for training supervised ML models. This is discussed by Racah et al. (2016), who expanded the previous approach, developing a semi-supervised CNN model to overcome the lack of labelled data and created an extreme weather dataset as benchmark. In general, the skewness of datasets is another common challenge for identifying climate anomalies with supervised approaches: often data on which the ML models are trained on present very few samples of conditions leading to impacts (Dal Barco et al., 2024).
Other studies focus on the identification of the spatio-temporal footprints of the climate hazards, in particular with algorithms such as Density Based Spatial Clustering Applications with Noise (DBSCAN; Ester et al., 1996), grouping single point anomalies into clusters in time and space. These approaches are applied in single hazards, such as droughts (Cammalleri and Toreti, 2023), heatwaves (Wang and Yan, 2021) or earthquakes (Di Martino et al., 2018). With regard to multi-hazards applications, DBSCAN is used by Tilloy et al. (2022) to cluster compound precipitation and wind compound extreme events in Great Britain and by Yu et al. (2022) to investigate droughts, heatwaves, cold-waves, extreme wind and extreme precipitation in Eurasian Drylands, studying how the coordinates of the centroid of the clusters are shifting hot and dry events to northern latitudes due to climate change.
3.2.2 Hazard forecasting and prediction
Before delving into more risk-based applications, it is worth noting that in the last few years, the application of DL models such as Transformers (Vaswani et al., 2017), Graph Neural Networks (GNN) (Veličković et al., 2017) and Physics Informed Neural Networks (Kashinath et al., 2021; Lütjens et al., 2021) has prompted a revolution in weather forecasting. Early applications of AI models, primarily using RF and SVM, were largely aimed at replacing specific steps within numerical weather forecasts. More recently, DL tools have gained prominence due to their ability to capture long-range dependencies, handle complex and irregular data structures and integrate the solutions of equations of physical systems into a unified framework, enabling DL to be successfully employed for modelling the whole medium range weather forecasting process (Bi et al., 2022; Chen et al., 2023; Keisler, 2022).
Applications that focus on predicting or forecasting hazards are still mainly focussed on single hazard approaches. However, some single hazard approaches were included in this review because their multi-variate approach includes the combination of different static (as land use, topography, socio-economic data) and dynamic (e.g., atmospheric and marine data) parameters and implicitly deal with multi-hazard interactions (e.g., a wildfire may be more probable when dry and hot conditions are present, a drought can be influenced by temperature and soil moisture, etc.). For example, Haggag et al. (2021) propose an ANN prediction model in a multi-hazard perspective, but then test it on past disaster records to predict only floods in Ontario using indices for climate extremes inputs. Monte Carlo dropout techniques have been employed to quantify epistemic uncertainty, for example in surge forecasts (Macdonald et al., 2025) and flood modelling (Nguyen et al., 2024).
One of the main algorithms applied to forecast hazards is LSTM: Kratzert et al. (2019a) apply adapted LSTM to disentangle static and dynamic inputs and analyse both high and low extremes in river flows, considering climate susceptibility and integrating static and dynamic inputs. Tiggeloven et al. (2021) propose a LSTM/CNN architecture to predict global storm surge residuals based on atmospheric conditions, investigating how the model's performance varied based on changes of the spatial area input into the convolutional model. With regard to vegetation, long-range temporal dependencies from several climate variables are investigated with a LSTM model (Kraft et al., 2019). Many applications focus on forecasting of air quality hazards, especially in urban areas: compared to other types of environmental impacts, such as water quality, the network of air quality monitoring stations offers hourly data at a high spatial resolution, enabling the training of AI models to dynamically forecast at short lead times. Applications include the short-term prediction of ozone levels in Kuwait (Freeman et al., 2018), the development of a daily air quality index in Beijing and Guilin (Wu and Lin, 2019), or the prediction of concentration of micro particular matter in the air of Seoul (Chang-Hoi et al., 2021).
Another popular DL architecture is GNN, applied in weather forecasting (Keisler, 2022; Lam et al., 2022) and river networks/flooding predictions (Bentivoglio et al., 2023; Kazadi et al., 2024; Sun et al., 2021). The key advantage of GNNs over CNNs is their ability to capture complex relationships in non-Euclidean data. While CNNs are limited by fixed sliding windows and may miss correlations between adjacent pixels or non-adjacent zones, GNNs excel in modelling graph-structured data, allowing for more accurate representations (Kipf and Welling, 2016). In particular, Kazadi et al. (2024) apply a combination of GNN and Gated Recurrent Unit (GRU, a type of recurrent neural network), for spatio-temporal flood prediction, accounting for spatially distributed precipitation data, as well as static features such as bathymetry and topography, comparing its performances against a LISFLOOD-FP simulation of Hurricane Harvey (2017) in Houston, Texas and showing improvements in terms of accuracy and faster training (100 ×) and testing (1000 ×) times. Similarly, Transformers are applied for river flood prediction, outperforming other RNNs in terms of computational costs and performances, also increasing the interpretability of the model (Castangia et al., 2023).
CNN, ANN, LSTM are still popular for drought and heat events, which are characterised by longer scale spatio-temporal dynamics. For example, Bonino et al. (2024) compare the performances of CNN, LSTM and RF for the prediction of marine heatwaves; Patil et al. (2023) employ CNN to predict drought in East Africa 3 or 4 season ahead, analysing the contribution of different climate drivers at multiple spatial and temporal scales; ANN are used for forecasting drought risk at near real time in India, using Artificial Neural Network models (Singh et al., 2021). Other algorithms (SVM, Random Forest, XGBoost, Extra Trees) are still often applied to analyse low probability extreme events in specific locations, where the lack of data constrains the training of Deep Neural Networks, such as the storm surge height caused by tropical cyclones in New York (Ayyad et al., 2022).
3.2.3 Modelling hazard interaction
Recent work has applied interpretable ML frameworks to hazard modelling, aiming not only at prediction but also at identifying key drivers. For instance, Jiang et al. (2022b, c) used LSTMs to study river flooding in Europe, combining feature attribution methods such as Expected Gradients (Erion et al., 2021) and Additive Decomposition (Du et al., 2019) to disentangle the roles of snowmelt and precipitation. By running models across decades, they revealed shifts in dominant flood drivers, with precipitation becoming increasingly important. Other studies have applied gradient-based methods (Sun et al., 2021), CNN heatmaps (Patil et al., 2023), attention mechanisms (Castangia et al., 2023), and sensitivity analysis (Bentivoglio et al., 2023; Bonino et al., 2024; Kratzert et al., 2019b). These advances improve interpretability, yet ML approaches remain limited by high data demands, sensitivity to training biases, and the difficulty of generalising beyond observed conditions (Bentivoglio et al., 2023). Their strength lies in prediction and uncovering nonlinear relationships, but the black-box nature of many models complicates causal modelling (Freeman et al., 2018).
While most ML studies focus on univariate hazards, compound events require methods that capture joint extremes. Copulas offer a flexible statistical framework to model dependence structures between variables, such as the co-occurrence of high river discharge, intense rainfall, and coastal surges (Hao and Singh, 2016; Nelsen, 2006). By decoupling marginal distributions from their dependence structure, copulas can assess joint probabilities of rare events with more precision than traditional multivariate models (Tilloy et al., 2019) Applications include pair copulas for compound flooding in Italy (Bevacqua et al., 2017), Joe copulas for concurrent river–coastal extremes (Sadegh et al., 2017), and copula-based Bayesian networks for flood–drought interactions (Couasnon et al., 2018). However, several challenges remain: selecting appropriate copula families is non-trivial (since different families imply different tail dependencies, yet many common families assume simplistic dependency or exchangeability) (Oh and Patton, 2015); capturing joint tail dependence becomes increasingly difficult in high dimensions (vines, mixtures, or hierarchical copulas may help but bring computational and inference burdens) (Simpson et al., 2020); physical drivers (e.g. precipitation skew, changing climate forcings, watershed characteristics) are often only indirectly represented through marginal or covariate models (Hochrainer-Stigler et al., 2019). Therefore, while copulas are powerful for probabilistic risk quantification, they are less suited to dynamic forecasting or process-based understanding without additional model structure or ensembles (Tootoonchi et al., 2022).
Comparison and complementarities
ML and copula methods approach hazard interactions from distinct perspectives. ML excels at prediction and feature discovery but struggles with transparency and extrapolation, while copulas provide interpretable dependence structures and joint probability estimates but scale poorly with dimensionality and lack causal interpretability. ML can identify critical hazard predictors and generate inputs, while copulas rigorously quantify their joint occurrence. Yet, few studies combine these strengths; most rely on either predictive ML or probabilistic copulas in isolation. For example, an LSTM may forecast river discharge under given precipitation and snowmelt conditions, while a copula model can then quantify the probability that extreme discharge co-occurs with extreme rainfall or sea-level rise. Together, ML and copulas can provide a more complete picture: ML enables forecasting and driver attribution, while copulas ensure rigorous treatment of dependence structures and joint extremes (Sadegh et al., 2017; Tilloy et al., 2019). Combining both approaches offers a promising pathway for advancing compound risk assessments. Some approaches, such as, Jiang et al. (2023) used a hybrid ML-copula method to estimate the probability of consecutive drought events (in particular from meteorological to ecological droughts), combining several ML classifiers (KNN, RF, SVM, …) to estimate the propagation probability of meteorological drought given its characteristics , and C-vine copulas to model conditional probability model of the paired meteorological and ecological drought events. Closing this gap, for instance, by integrating ML-derived drivers into copula frameworks, or benchmarking ML-learned dependencies against copula-based models, represents a promising but underexplored direction for compound risk assessment.
Susceptibility mapping
Susceptibility in the context of natural hazards refers to the predisposition of an area to experience a specific hazard and considers different factors (usually categorised into hazard or vulnerability in risk assessment), such as topography, geology, hydrology, land use and vegetation and highlights “territorial characteristics”, disregarding the more dynamic and time-dependent component of risks (Wubalem, 2022). The methodology for creating multi-hazard susceptibility maps using ML usually consists in three steps: first, for each hazard, the susceptibility factors are identified; then, supervised ML techniques are employed to create single hazards susceptibility maps, considering the different conditioning factors as predictors and the areas impacted by the analysed hazards in the past as assessment endpoints; finally, the single hazard maps are combined to produce the final multi-hazard susceptibility map. Eventually, feature importance techniques are applied as a fourth step to extract the most susceptible factors for each hazard or multi-hazard combination.
ML has been applied extensively to derive multi-hazard susceptibility maps, which can identify areas prone to multiple disaster and help disaster management planning. However, these applications are typically trained on average, static climatic conditions and do not consider temporal interactions between risk factors (such as the cumulative impacts of a series of successive extreme rain events, the duration of a heatwave or changes in vulnerability caused by wildfires). Moreover, the type of multi-hazard events for which they are applied is often limited to wildfires, landslides, floods, and earthquakes (Abu El-Magd et al., 2021; Ahmadlou et al., 2021; Cao et al., 2020): in fact, these methods rely on the presence of catalogues of past clearly defined hazard spatial footprint: for other climate hazards, such as extreme winds, hails, or heatwaves susceptibility is not investigated. Furthermore, input data for susceptibility mapping are aggregated over long time frames, in order to ensure robustness of the analysis. However, changes in vulnerability and exposure parameters occurring in the analysed periods, for example due to newly implemented adaptation measures, are overlooked, potentially leading to overestimation (or underestimation) of areas at risks.
The most common approach for integrating susceptibility parameters into multi-risk assessment is by producing multi-hazard susceptibility mapping, where susceptibility to multiple hazard (including factors for hazard, such as yearly precipitation, but also vulnerability parameters, such as slope) can provide a valuable point of reference for decision makers in sustainable land-use planning or infrastructure development. A number of studies are focusing on mountainous regions, using a range of ML models, including Logistic Regression, ANN, DT, SVM, RF, Boosted Regression Trees (BRT), or Generalised Linear Models (GLM) (Javidan et al., 2021; Karakas et al., 2023; Kariminejad et al., 2022; Nguyen et al., 2023; Pourghasemi et al., 2019, 2020; Pouyan et al., 2021; Yousefi et al., 2020) The multi-hazard combination usually covers floods, landslides, avalanches and forest fires, which have clear footprints that can be used to train single hazard susceptibility, and integrate other risks which can be assessed through already available risk maps, such as seismic risk maps at a later stage (Bordbar et al., 2022). Different hazards are included by Piao et al. (2022), who test BRT, RF and Classification And Regression Trees (CART) in the Gangwon-do region in South Korea (an area rich in forests and ecological diversity) to establish a multi-hazard probability map for forest fires and droughts; in this study the multi-hazard interactions are investigated, considering drought as an amplifying hazard for forest fires. Mandal et al. (2022) focus instead on coastal areas, in particular in West Bengal (India), considering tropical cyclones, embankment breaching, storm and tidal surge, inundations, extreme rainfall, salinization and erosion; RF and ANN are applied to produce multi-hazard susceptibility maps. Ullah et al. (2022) test a CNN to produce flash floods, landslides and debris flow multi-hazard susceptibility mapping, comparing its performances with Logistic Regression and KNN methods in terms of accuracy, coefficient of determination, Mean Absolute Error and Root Mean Squared Error. The input data consist of field surveys, topography, hydrology, and environmental data, while the locations of historical flash flood, debris flow and landslide locations are extracted from Google Earth images. The feature importance scores are derived using a Random Forest model and are used to enhance the analysis of the multi-hazard maps. It is interesting to note that in this case, the CNN layer is 1-dimensional and is not used to analyse the spatial context of the pixels, but it runs across the 14 layers of predicting variables, producing an independent output pixel by pixel.
While the literature on this topic is quite established, most of these applications propose a multi-layer single hazard risk, rather than a full multi-hazard or multi-risk approach: in fact, the single hazard maps are often combined linearly or via a matrix considering combined risk categories, without elaborating further on the hazard interactions. Another common challenge in the development of susceptibility maps is the skewness of the training dataset, which are characterized by a predominance of areas with no damage. These greatly affects the training and testing of the models, and specific sampling procedures are often applied, rather than relying on balancing weights when training the ML model. Most often, all the positive samples (e.g., where some impact was recorded) are included; a buffer area is applied to the positive samples and subtracted from the whole dataset to exclude areas near recorded impacts; a number of points of comparable magnitude to the positive ones is sampled from the difference dataset to ensure that the final training dataset includes a balanced representation of impacted and non-impacted areas. This is a key step of the susceptibility mapping and can potentially add biases to the model, if the selected samples are not representative of the whole dataset or if there is a high autocorrelation. Spatial or temporal autocorrelation needs to be considered when splitting between training, validation and test data: random splitting methods assume data is independent and identically distributed. Specific techniques, such as spatio-temporal block cross validation (Zanetti et al., 2022) need to be considered to account for this. For example, a recent paper by Sweet et al. (2023) shows the impact of different validation techniques in a RF model for the prediction of agricultural yield, and their implications on performances and robustness of the interpretation of the model.
3.3 Multi-risk
This section contributes to the field of multi-hazard and multi-risk analysis by examining how ML and statistical approaches combine hazard, exposure, and vulnerability layers or directly predict impacts (Table 3), highlighting opportunities and challenges in capturing dynamic vulnerability, addressing data limitations, and improving the interpretability of risk models across health, food security, environmental, economic, and infrastructure sectors.
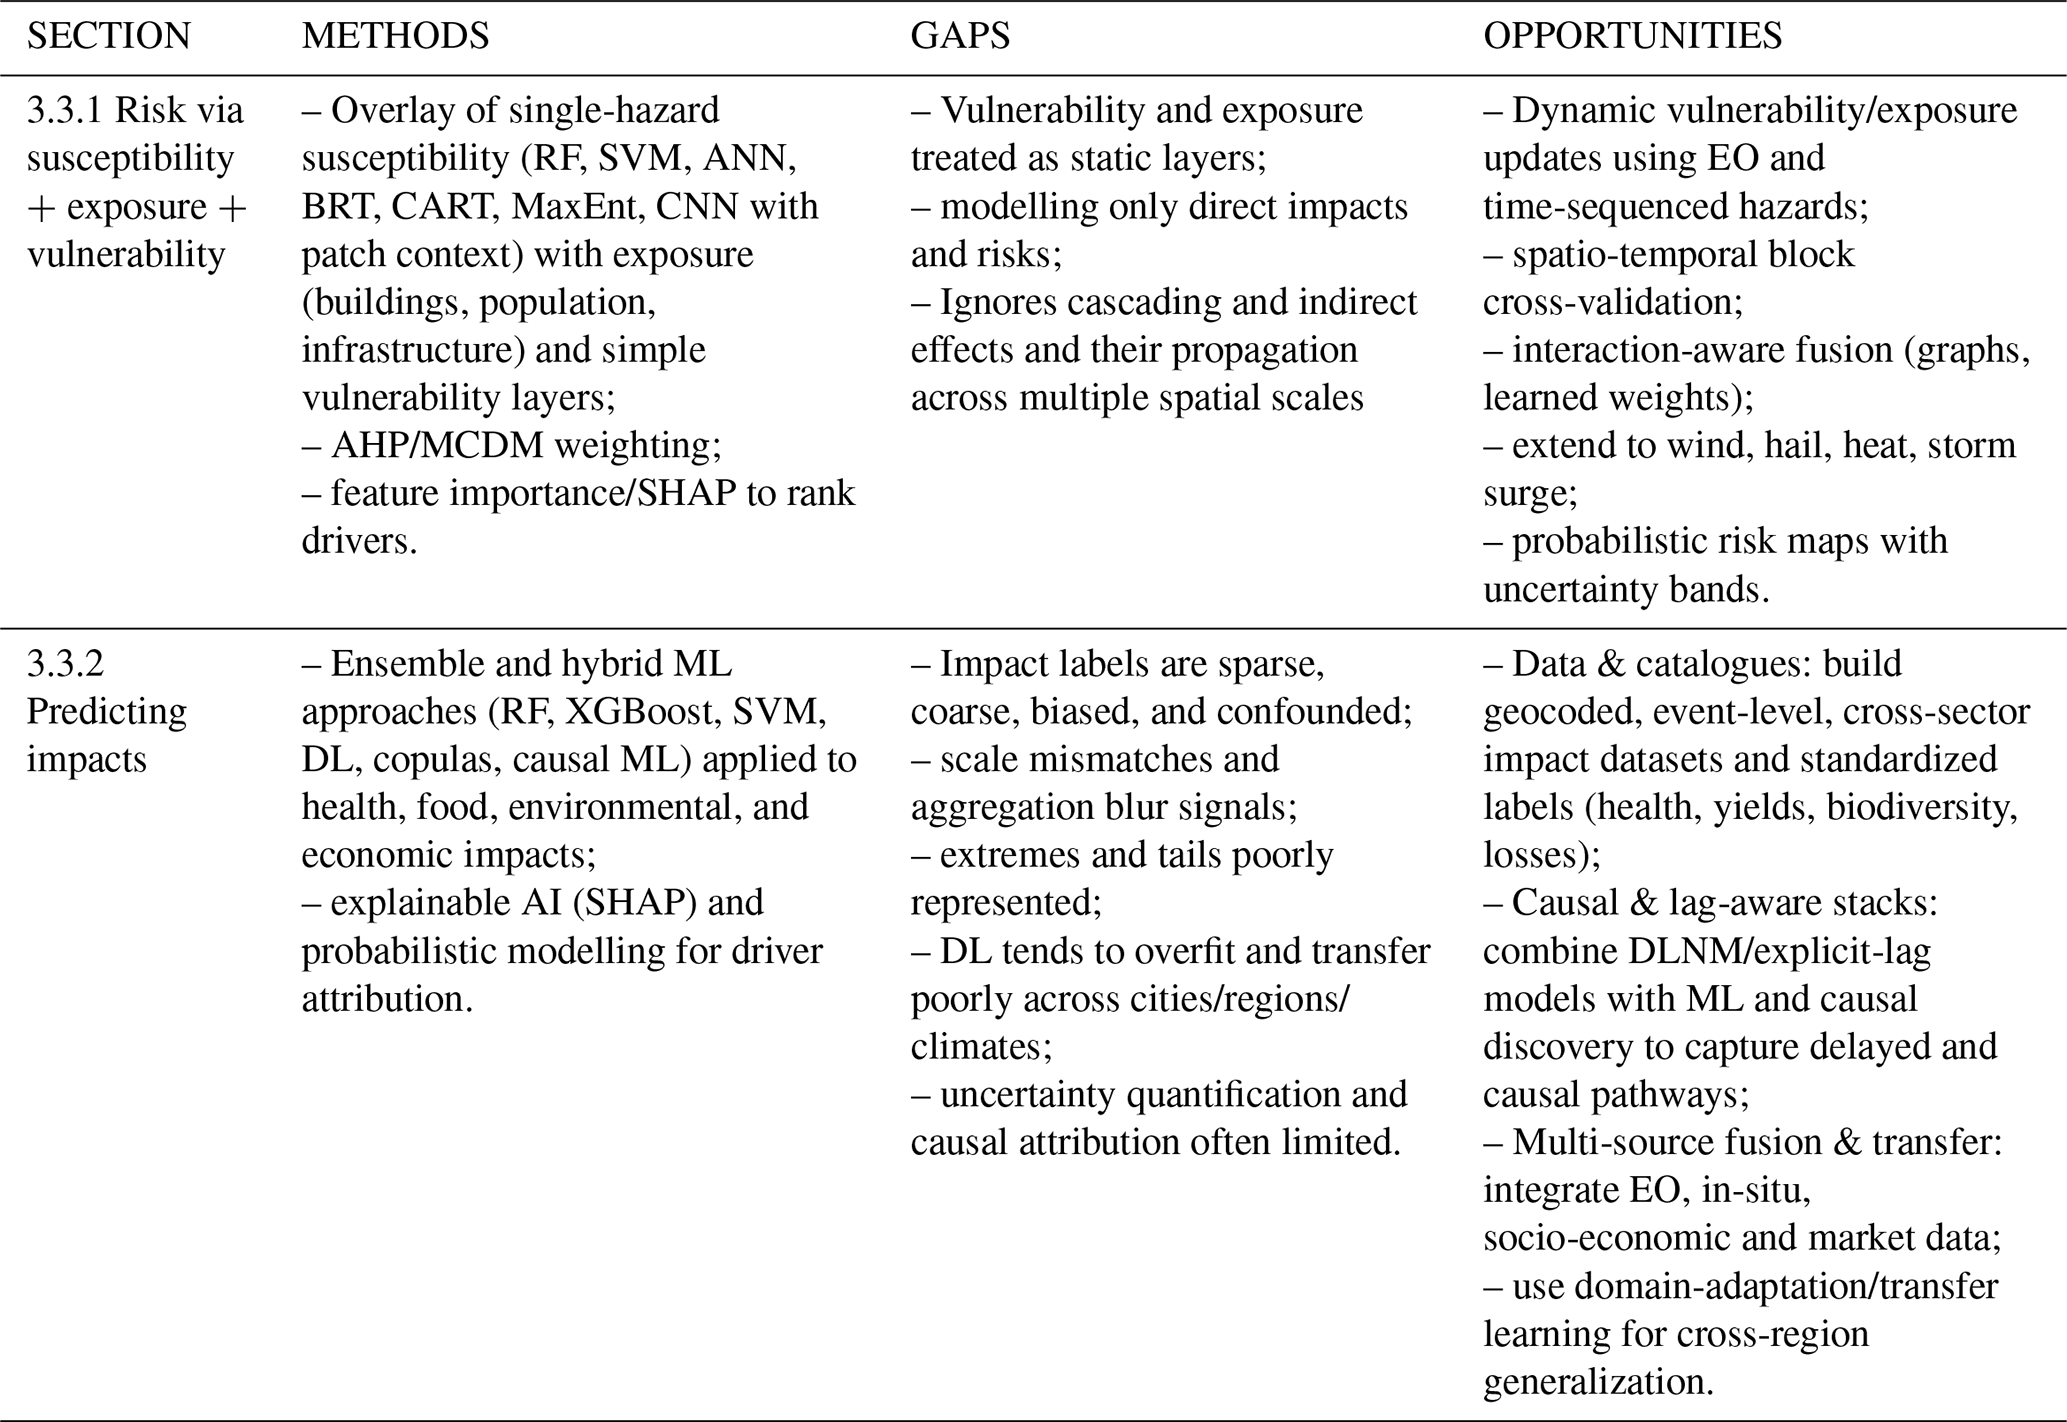
3.3.1 Modelling risk combining susceptibility, exposure and vulnerability
Many studies are found to focus on modelling risk by combining hazard maps, produced via ML-based susceptibility mapping, with vulnerability and exposure layers. Single hazards such as wildfires, floods and landslides are often considered, and buildings, population and infrastructures are the typically included exposure elements. Kotaridis and Lazaridou (2022) consider flooding risk in Tuscany and applied a 2D CNN to produce an urban flooding susceptibility map. Differently from Ullah et al. (2022) the CNN applied here makes use of the spatial context of each pixel, considering a 5 × 5 patch centred on a specific pixel (an area of 50 × 50 m2 since the pixel size is 10 m), creating 20 000 different samples from the initial map, each one with a 5 × 5 × 9 size, where the last number corresponds to the different predictors of the susceptibility mapping that are considered as channels in the CNN architecture. Thus, not only the selection of the initial samples, but also the selection of the size of the patch is a key hyperparameter to be considered: in this case, a cross validation is used to choose the best patch size. The vulnerability maps are created dividing the land use into 5 classes, which are then multiplied with the hazard layer to calculate the final risk map. Convolutional Neural Networks (CNNs) offer significant advantages over traditional algorithms in spatial analysis due to their ability to process areas as 2D maps. This enables the model to leverage Max Pooling layers to capture and simplify the spatial context of events. Unlike models that focus on individual point characteristics, CNNs can better model and integrate the broader spatial relationships. For example, Zhao et al. (2020) test CNN for urban flood susceptibility too but instead of producing separate maps for hazard and vulnerability, anthropogenic factors were used as predictors for the susceptibility map. The study compares the performances of different ML models: a simple (with 1 convolutional layer) CNN architecture, LeNet5 (Lecun et al., 1998), a slightly deeper CNN (with 2 convolutional layers), SVM and RF models. Different input strategies are tested: a point based strategy that only considers input at a given site; a partial spatial strategy that considers the surrounding pixels, flattening the 2D image to a 1D vector, thus loosing partially the spatial context, but allowing the neighbouring pixels to be fed to SVM and RF models as additional predictors; a patch strategy, similar to the one described before for the CNN models, which granted the best performances. This study also discusses the use of Deep CNNs, which is discouraged since the typical sample size and model is too small to tune the high number of parameters required by Deep CNNs.
Rusk et al. (2022) analyse population risk in the Hindu-Kush and Himalaya region, producing a multi-hazard map for landslides, floods and wildfire with the MaxEnt (Maximum Entropy) algorithm, which is then overlayed with population distribution. The paper also produces a matrix of multi-hazard interactions, dividing them into three types: when hazards are directly linked (e.g., flooding causing a landslide), when their linkage is mediated by an environmental condition (e.g., land use changes caused by wildfires increasing the probability of a landslide), or when their linkage is mediated by infrastructure or urban processes (e.g., a landslide damaging a dam, triggering a flood). However, a quantitative assessment of these multi-hazard interactions is not provided and only the records of these events are used to complement the multi-risk map. A similar approach is used in Austria (Fuchs et al., 2015), considering river flooding, torrential flooding and snow avalanches as hazards and buildings as assets. In this case, buildings vulnerability is investigated, categorising them based on location, size, building category and the construction period. The different urbanisation patterns, very high in mountainous terrain of the Hindu-Kush-Himalaya (HKH) and quite low for Austria, influenced the final risk score assessment, with the HKH showing more areas at higher risk (Rusk et al., 2022). Sammonds et al. (2023) analyse hurricane, flood and landslide risk on population, producing single hazard susceptibility maps with statistical methods and discussing the vulnerability of population, considering gender, age, and population density; the final multi-hazard hurricane risk is obtained as a product of the single hazard susceptibility scores, overlayed with weights determined with Analytic Hierarchy Process (AHP), and the vulnerability score. Other applications focus on Vietnam, where RF is applied to derive risk for buildings and population against multi-hazard susceptibility maps for floods and wildfires (Luu et al., 2024). RF is applied to calculate single and multi-hazard susceptibility maps for China for flooding, landslides, and debris flows and the railway infrastructure was overlayed to analyse present and future risk, considering newly planned railway links (Liu et al., 2018a). In general, a number of studies are found to apply non-ML approaches, including multi-criteria decision-making and expert judgements methods to calculate susceptibility and vulnerability layers, such as in Arvin et al. (2023), that focuses on infrastructure resilience in Iran, considering flooding, landslides and earthquake as hazards, and 25 indicators at the county level and Khatakho et al. (2021), focussing on population exposed to flooding, earthquakes and wildfires near Kathmandu (Nepal).
A critical limitation of the studies reviewed in this section is the static treatment of vulnerability. Most applications use fixed proxies – building footprints, land-use classifications, census-derived population density – that do not evolve in response to hazard occurrence, adaptation measures, or broader socio-economic change (Haer et al., 2019; de Ruiter and van Loon, 2022). This static framing can substantially underestimate risk in contexts where vulnerability is shaped by governance failures, structural inequalities, or rapid urban expansion (Ward et al., 2022; Šakić Trogrlić et al., 2024). A particularly underexplored challenge in multi-hazard risk assessment is that vulnerabilities do not simply add up across hazards: they interact. Synergies and asynergies between vulnerabilities mean that the combination of hazards can fundamentally alter how exposed elements are affected. For instance, adaptation measures designed to reduce risk from one hazard may increase vulnerability to another, and damage caused by a first hazard event can leave a system more vulnerable to a subsequent one (Albulescu and Armaș, 2024; de Ruiter and van Loon, 2022). Stolte et al. (2024) further demonstrate through a global systematic review of urban vulnerability that the drivers of vulnerability differ substantially across hazard types, and explicitly call for research into multi-hazard vulnerability dynamics as a necessary step beyond the current dominant paradigm of treating multiple hazards in parallel rather than in interaction. Despite growing conceptual recognition of this problem, it remains essentially unaddressed in the data-driven literature reviewed in this study, where vulnerability interactions are neither modelled nor discussed. Social justice dimensions also remain largely absent from the reviewed multi-risk literature: only few of the papers analysed explicitly consider vulnerability dimensions such as gender, while the question of how ML-based risk maps might inherit biases from historically underinvested impact datasets remains largely unaddressed (McGovern et al., 2022).
Another aspect to consider is uncertainty and its propagation across the risk modelling chain: attempts to propagate it formally across the hazard–exposure–vulnerability–risk chain are rare even in single-hazard contexts: Kropf et al. (2022) introduced a sensitivity and uncertainty analysis framework within the CLIMADA platform that varies hazard, exposure, and vulnerability inputs simultaneously, and Dawkins et al. (2023) extended this to formally quantify uncertainty contributions from each component, with an application using GAM for heat-stress risk assessment, but neither study addresses multi-hazard interactions. However, no study in the reviewed corpus achieves end-to-end UQ in a multi-hazard risk context, propagating uncertainty from input data through hazard modelling and ML or statistical methods to the final risk estimate.
3.3.2 Modelling risk predicting impacts
Another popular approach to model multi-risk with ML is to use impacts as a proxy and training supervised ML models on past impacts. Examples of possible impacts are excess mortality for health risks, economic damages and monetary losses, number of emergency signals or specific environmental indicators, such as ecological status. With regard to ML methodology, approaches are similar to the ones applied for predicting hazard values, considering multiple predictors covering climate, topography, land use and anthropogenic factors, but the final assessment endpoint, impact data, is very different from typically hazard data, having a coarser resolution in time and space and resulting in much smaller datasets. Thus, most of the studies focus on simpler and more interpretable ML methods like ensemble methods, rather than the DL approaches which are popular for hazard prediction. Moreover, more attention is dedicated to the interpretation of the factors and the explainability of methods (Ghaffarian et al., 2023), with most applications presenting some form of feature importance analysis, either as a built-in feature of the model, such as for RF, or as a a-posteriori analysis with SHAP values. In this section, studies are grouped based on the sectors and type of impact considered, considering health, food security and crops, environmental quality and biodiversity, physical damages and economic losses.
Health
Studies focussing on environmental-health risks often analyse the combination of heat and air quality stressors and use excess mortality as predicant variable. These applications aim at disentangling complex temporal patterns, consisting of a long-term trend, driven by multiple (and often unknown) factors, and short-term peaks, mainly driven by summer heatwaves; moreover, time-lags needs to be considered. Thus, statistical methods, such as Distributed Lag non-linear models have been widely applied (Gasparrini, 2014) to model exposure lag-response of mortality to environmental stressors. More recently, RF has been applied, analysing the role of humidity in urban mortality during heatwaves at the global scale (Guo et al., 2024) or predicting heat-stroke occurrence in China (Wang et al., 2019b), while SVM is applied for analysing previous diseases, population density and urbanisation (Wang et al., 2021b). One of the most interesting papers, Boudreault et al. (2023) test 9 different ML, DL and statistical methods (such as Generalised Additive Models – GAMs) in the Metropolitan City of Montreal, considering weekly all-cause mortality as predictand and air temperature, humidity, wind, Particle Matter (PM) 2.5, Ozone (O3), Nitrogen Dioxide (NO2), Sulphur Dioxide (SO2), Carbon Monoxide (CO) as predictors. Among the methods tested, Tree based methods (RF, XGBoost) usually perform better overall, while statistical methods (and GAM in particular) are more accurate in predicting the mortality peaks; Deep Learning approaches, such as MLP and LSTM have instead the worst performances. This is partially explained by the limited size of the dataset and the inclusion of non-climate causes in the predictand, likely to cause overfitting in the DL models. Another study also focussing on Canada proposes an AI-based framework to extrapolate vulnerability from health-heat relationship: Côté et al. (2024) test this approach considering two steps: first, a model to predict daily mortality from mean temperature for 3 days, age, income and period of the year as predictors and then a second model predicting annual mortality over aggregated areas with specific socio-economic and environmental (air quality, vegetation, …) characteristics. The model tested are AutoGluon (an automatic ML framework allowing to train and test ML models without expert knowledge; https://auto.gluon.ai/stable/index.html, last access: 24 June 2026), GP and Deep Gaussian Process (Deep GP). The results shows that GP are able to model better the daily mortality trends, especially during extreme temperature, while AutoGluon is slightly better for the annual analysis. GP with non-linear (e.g., Matern Kernel; Pan et al., 2021) are in fact able to better handle noise and small data samples (Wang, 2023), and their limit is their computational costs (Jiang et al., 2022a); on the other hand, the more complex Deep GP handed the worst outcomes, highlighting the challenges in tuning more complex Deep GPs (Tazi et al., 2023). Other studies focus on predicting the influence of water quality parameters, such as turbidity, on the risk of cholera disease outbreaks in Indian Coastal municipalities using a RF predictor (Campbell et al., 2020).
Food security and crops
The second group of reviewed studies focus on the nexus between food production, food security and migrations. For instance, Busker et al. (2024) apply XGBoost to predict food insecurity in the Horn of Africa. This model, takes as input several factors, integrating climatological variables, biological hazards, food and fuel prices, macroeconomic indicators, conflicts and humanitarian assistance, aggregating data on the administrative units for which the assessment endpoint variable (food security) was available. The model is tested for its ability to predict the onset of crises up to 12 months in advance, demonstrating superior performance in agro-pastoral areas compared to croplands. SHAP values are employed to analyse the key risk drivers. The findings of this study highlight its potential application in operational early warning systems, such as FEWS NET.
Tárraga et al. (2024) also investigate the dynamic relationships between droughts, conflicts and food security, focussing on their impact on population displacement. In this case, ML is not used to predict displacement, but causal discovery methods are tested to retrieve its drivers within Somalia from 2016 to 2023. In particular, Granger Causality and Peter and Clark Momentary Conditional Independence (PCMCI) are tested to generate plausible causal graphs of drought displacement, showing limitations for Granger causality due to the high dimensionality and autocorrelation of the time series, while the PCMCI method is able to disentangle the intertwined vulnerabilities and different leading times connecting drought impacts, water and food security systems along with episodes of violent conflict. The reliability of the causal model depends on the quality of training data and several assumptions are required, such as causal sufficiency (i.e., all possible driving variables of drought displacement need to be considered in the analysis), no contemporaneous causal effects and causal stationarity. Note that although causal sufficiency is valid, the associations between the other variables (e.g., SPEI, market prices, fatalities) may be influenced by confounding factors rather than direct causality.
Different types of copulas (Normal, Student's t, Archimedean with different distributions) are tested to model risk by linking bivariate return periods of temperature and precipitation to crop yields, analysing the impact of dry and hot, dry and cold, wet and hot, wet and cold conditions (Zscheischler et al., 2017). Nested Archimedean copulas were used to model the tri-variate dependence between maximum temperature and spring precipitation on crop yields, estimating the impact differences between single and compound hazards, using combinations of heat and precipitation stress (Ribeiro et al., 2020).
Environmental quality and biodiversity
Numerous studies focus directly on environmental impacts, such as the influence of land use and urban planning on water quality. For example, Wang et al. (2021a) apply RF with SHAP values to model stream water quality and specific pollutants based on four different urban planning scenarios in Texas. The model allows to correlate urban sprawl to water quality degradation and was used to forecast environmental impacts under different urban development pattern scenarios. In Li et al. (2022) the ensemble model XGBoost is used to predict water quality in beach locations in lake Eyre, paired with SHAP for increased explainability. Other studies focus on ecosystem and biodiversity: for example, RF and Logistic regressions are tested to predict forest loss in Borneo from topographical and anthropogenic variables (distance to urban areas, population, etc,), highlighting the advantages of RF for modelling multi-scale spatial relationships between risk drivers (Cushman et al., 2017). Similarly, in Islam et al. (2021), the spatio-temporal dynamics of wetlands in Bangladesh and their negative effects on biodiversity are analysed using Decision trees, RF and SVM. RF and SVM are the best performing algorithms and in general, the papers highlighted the role of remote sensing, for mapping wetlands variations in time. Species distribution is also investigated, with many applications discussing the different spatial approaches for river network modelling. For example, Schmidt et al. (2020) test the MaxEnt algorithm with two representations of rivers, highlighting how a high-resolution model based on river reaches is better at discovering individual local habitat features, whereas lower resolution sub-catchment scale models better account for more general drivers in fish distribution. Teichert et al. (2016) apply a RF model to identify the dominant stressors for fish presence in estuaries, investigating the interactions among stressors evaluating ecological benefits expected from reducing pressure. In particular, an RF model is trained to predict ecological status in 90 locations using 17 predictors describing the different stressors (urbanisation, flow changes, water pollution, oxygen depletion, etc.). Then, simulations are run to analyse the benefit of restorations comparing the difference between the baseline model and a model where the intensity of stressors was varied. The difference between single and multiple restoration action is analysed, highlighting the importance of combined restoration schemes and the non-linearity of their effects.
Economic losses and physical damages
This final category focus on studies modelling economic losses or physical impacts: Dal Barco et al. (2024) model the occurrence of impacts due to extreme weather events in the Veneto coastal municipalities, with a combination of two ML models: first a classifier (RF, SVM, ANN) is trained to predict the probability of daily impacts in coastal municipalities using meteorological data as predictors and a Boolean variable based on impact reports from the Regional Authorities as predictand; then a Linear Regression is used to predict the yearly occurrences of damages based on the outcome of the first model. However, the coarse resolution of the impact data, the biases in human collected impact catalogues, and the skewedness of the dataset can pose significant challenges to the training of a ML-model predicting direct physical impacts. Other studies focus on modelling tropical cyclones along the East Coast of the US with ANN: Pilkington and Mahmoud (2017) investigate the complex connections between all meteorological factors (wind, pressure, storm surge, and precipitation resulting in inland flooding) of a tropical cyclone and how those interact with the location of landfalls to produce a certain level of economic damage. The vulnerability and resilience of the different coastal locations are investigated essentially using the model to predict losses with varying meteorological factors taken from past historical events but switching their landfall location. Other approaches, such as Mukherjee et al. (2018) test SVM and RF to analyse impacts on the energy sector in the US caused by extreme weather events, leveraging the records of disruptions from outage data of the Department of Energy in the US and using as predictors a set of climatic and socio-economic variables aggregated at state level. In this study, two different models are trained, in order to account for the differences in the risk drivers between the more frequent energy disruptions and the extreme events, which are separated based on their quantile. Finally, other studies focus on the impacts on specific economic sectors, such as finance and tourism: Carannante et al. (2024) propose a pricing model for climate change risk, particularly physical risk, developing a type of climate risk-insured loan, based on a bioclimatic composite indicator developed with ML. In particular, a temporal dynamic RF (considering variables at different lag-times) is used to produce a monthly risk index, based on atmospheric variables (wind, precipitation, temperature) obtained mainly from remote sensing datasets, which is used to model impacts on beach resorts in Italy and inform the subsequent climate-risk loan mechanism.
3.4 Future
This section contributes to the field of multi-hazard and multi-risk analysis by reviewing how ML and statistical methods are applied to predict future hazards and impacts, highlighting the importance of bias correction, climate ensembles, SMILEs, and storyline methods, as well as the integration of socio-economic and land use projections (Table 4). It emphasizes how these approaches can improve the robustness of long-term risk scenarios, support adaptation planning, and guide strategies to address uncertainties in future multi-risk patterns.
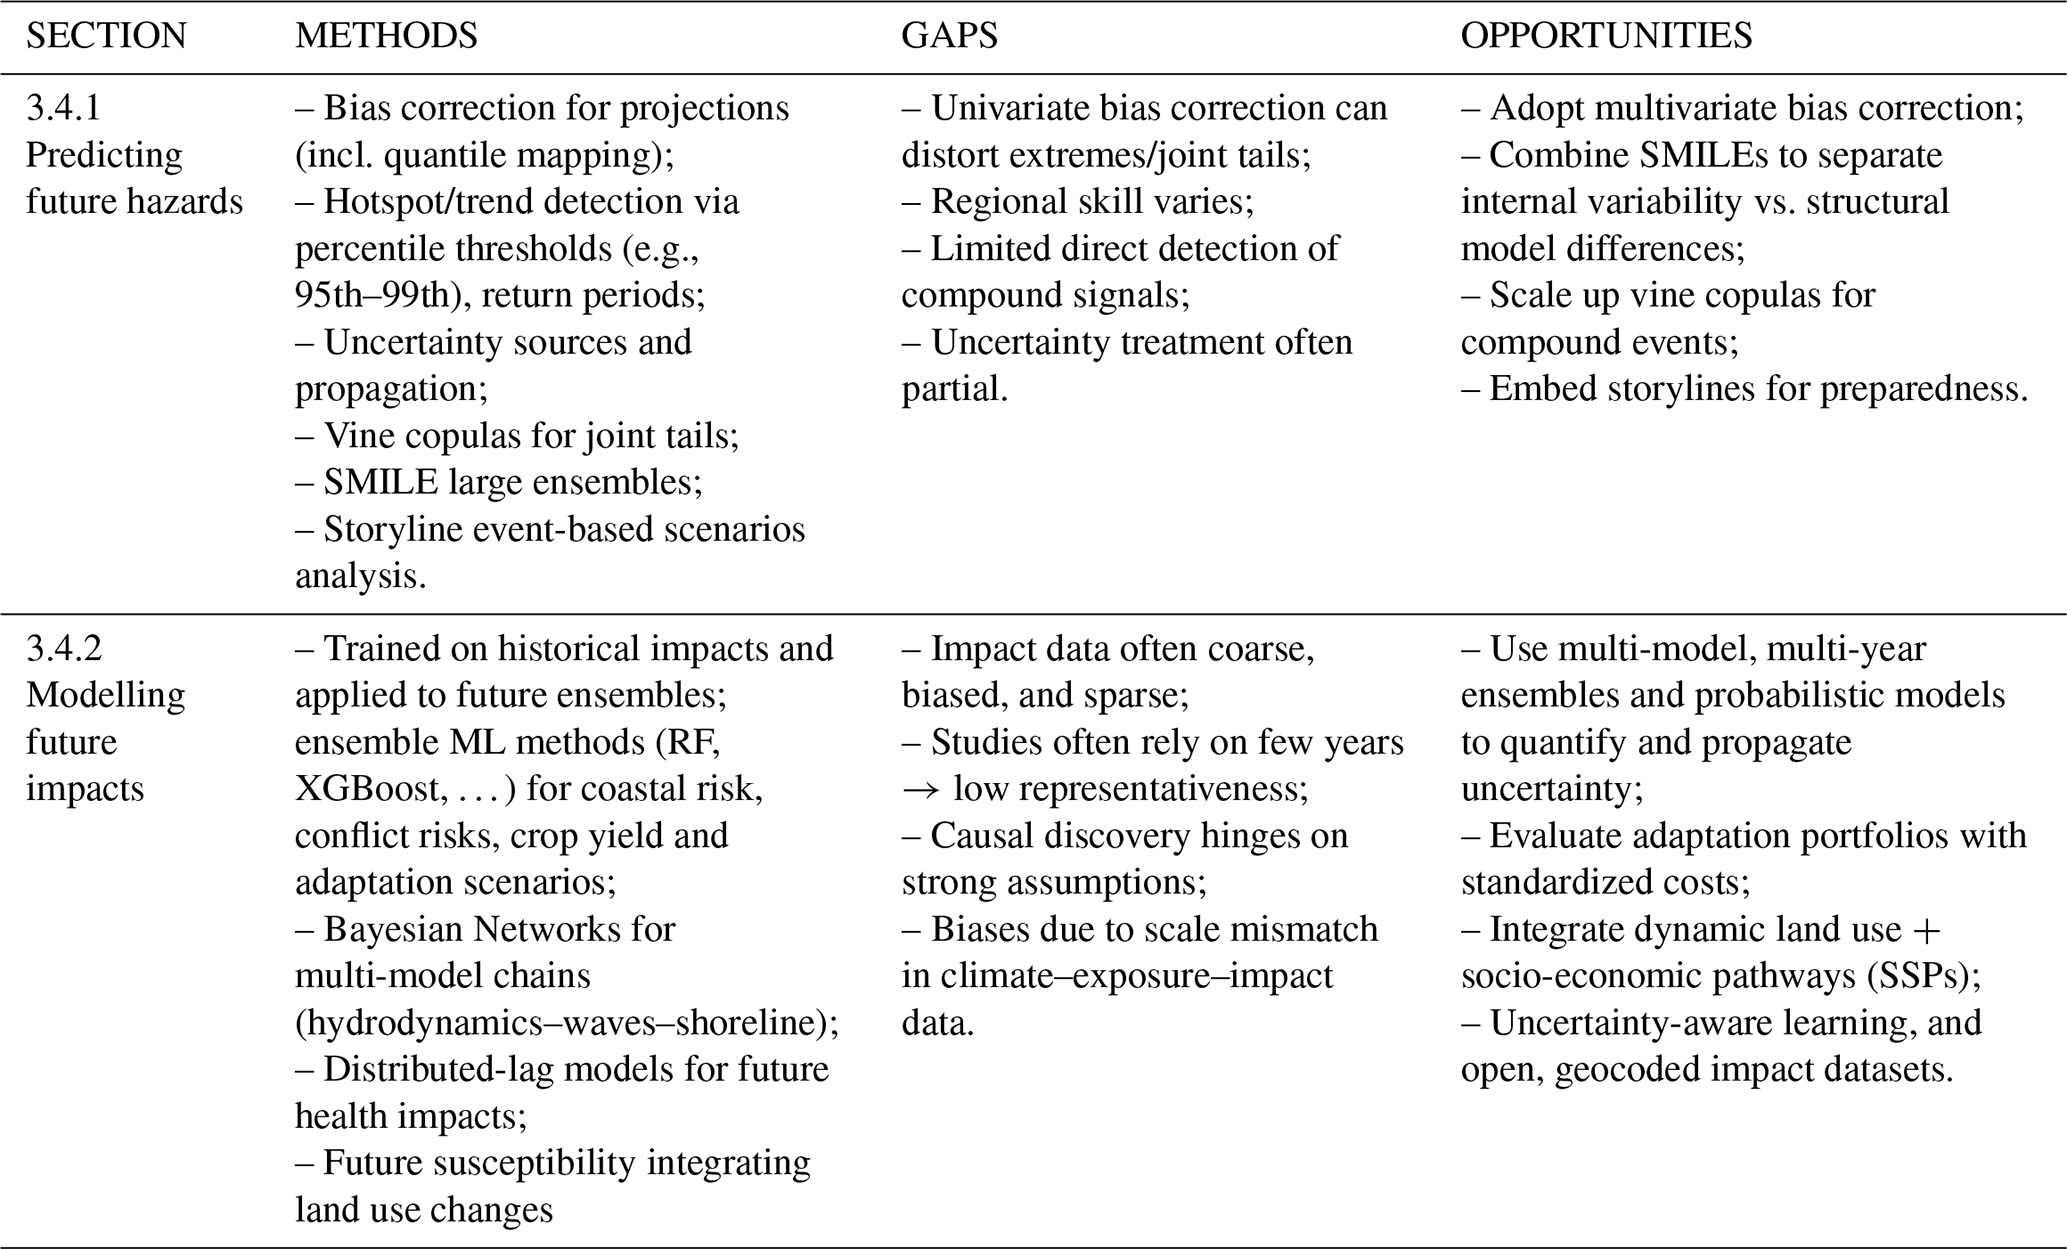
3.4.1 Predicting future hazards
Several studies focus on data-driven methods to predict long-term future multi-hazard and multi-risk scenarios. Zscheischler et al. (2018) discuss the importance of compound events for future risk assessment and presents several approaches and discusses the main challenges related to the use of future climate projections and weather simulations to analyse future compound events. The role of bias correction and its connection to multi-hazard events and impact models is analysed: future projections are often bias corrected to align the distribution of the modelled variables to the distribution of the observed ones, in the reference timeframe. However, some issues can arise: the simplest approaches focus on adjusting the averages of the variables and do not correct the tails of the distributions, thus modifying the behaviour of extreme events. Methods such as quantile mapping, are needed to align the historical and future datasets before the application of any statistical or ML methods. Sensitivity analysis can be performed to analyse how the model reacts to changes in inputs and the robustness of future scenarios (Kim et al., 2023). Moreover, bias corrections are often univariate, and do not consider the effects on joint tail distributions and consequently impact models based on these inputs are affected; multivariate bias correction models are then encouraged (Sippel et al., 2016).
When dealing with the future of multi-hazard events, statistical methods are most often applied to identify hotspots and test trends, similarly to the applications focussing on historical data. For example, Ridder et al. (2022) consider hot, dry, wet and windy compound events by selecting cells which exceed the 99th percentile for wind and precipitation in the same day. Then results are presented in changes in return period and annual event density, where the latter is a measure for how often an event affects a region and how much of the region is affected, calculated from the number of grid cells affected. Similarly, Zhu et al. (2023) investigate future compound wind and precipitation extreme at the global scale, analysing 14 CMIP6 models, identifying compound events through the 95th percentile and discussing the sources of uncertainties via the HS09 statistical method (Hawkins and Sutton, 2009) splitting between internal variability, model uncertainty and scenario uncertainty. Further analyses discuss the spatial and temporal performances of future projections: Ridder et al. (2021) find good performances in CMIP6 simulation for precipitation and wind compound extremes over North America, Europe and Asia, but poor performances over Australia, probably linked to the limits in the modelling of tropical and extratropical cyclones and local convection systems. Also, copulas are used to analyse spatial complementary patterns of compound events, such as in Ghanbari et al. (2021), which analyse the joint return period of compound floods along the US coast, incorporating sea level rise and peak river flows for future climate change risk scenarios with copulas. Wu et al. (2023, 2024), employ Vine copulas to analyse hot & dry and pluvial & hot events in future scenarios, using a Single Model Initial Conditions Large Ensemble (SMILE).
Bevacqua et al. (2023) stress the importance of SMILE for a robust analysis of future compound climate events. In fact, a SMILE consists of many simulations from a single climate model, each starting from slightly different initial states (differently from classical model ensembles, like CMIP6, which consists of many different runs from different models). Each realization differs solely due to internal climate variability and ensures a better quantification of future uncertainties, and at the same time it provides a much larger dataset to analyse statistically compound events. Multiple SMILEs can then be combined to identify model differences and distinguish between internal climate variability and structural model differences. Sometimes, especially when dealing with unprecedented, High-Impact, Low-Probability events, climate projections or even SMILE or statistical weather generation are not sufficient: in these cases, storyline approaches are often used as alternative to explore future multi-risk patterns (Moezzi et al., 2017; Shepherd et al., 2018). These approaches fit well within common practices in disaster risk management, which consider event-based scenarios for emergency preparedness, allowing for interaction with local stakeholders to evaluate the effectiveness of selected measures (Sillmann et al., 2021) and to explore low-likelihood and high impact plausibility events (Bevacqua et al., 2021).
3.4.2 Modelling future impacts
A common approach to estimate future risks involves using future climate projections as input data for ML models that have been trained on historical data of past impacts, similar to applications that focus on assessing current risks by leveraging past impacts. For example, the study of future cyclone impacts in New York and New Jersey, is feeding four General Circulation models as input for a SVM/AdaBoost risk model (Ayyad et al., 2023). Park and Lee (2020) test the performances of three algorithms, K-NN, RF and SVM to analyse coastal risks in South Korea, considering rainfall, tides, topography and land use, training the model on past floodings and then predicting future risks using monthly averages of rainfall and tidal values from RCP 4.5 and 8.5 ensembles. Future risk scenarios are calculated aggregating the risk model outcomes for each decade from 2030s to 2080s. In a successive publication, Park et al. (2023) apply a similar ML methodology to investigate adaptation strategies for coastal flooding: in this case, the ML model is trained on historical data with two different adaptation strategies, seawalls or green spaces, and then the future adaptation models are implemented, either maintaining current adaptation infrastructures or increasing one specific strategy. To ensure comparability between the adaptation scenarios, infrastructure construction costs are standardized, guaranteeing that the two distinct adaptation pathways incurred equal expenses.
In general, it is considered good practice to use ensemble projections and values calculated over multiple years, in order to increase the robustness of the future scenarios; however, some risk analyses focus on just a few selected years: Lim and Kim (2022) test RF for future rainfall induced landslides, also analysing different adaptation pathways and considering an increase in forested or urban areas. Instead of using monthly or daily values for the ML model, yearly values are used in the model, for specific years (2050, 2092), which are considered significative for representing future scenarios. This approach is valuable for analysing specific extreme events that may be overlooked when averaging across multiple models or years, and it reduces computational demands. However, it carries the risk of biasing the analysis, as the selection of specific years may result in outcomes that are not fully representative of the broader range of future scenarios. Bayesian Networks were tested by Pham et al. (2023) in a multi-model chain approach combining ocean hydrodynamics models, wind-wave models, and shoreline extraction models to analyse sea water quality impacts and shoreline erosion under different RCP projections (4.5 and 8.5). Bayesian Networks are applied due to their ability to integrate heterogeneous data sources, including quantitative and qualitative inputs and several data fusion steps to harmonise different spatial coverage, temporal resolutions and data formats, with a final risk assessment conducted at municipality level and yearly/decadal scale.
With regard to the water-food nexus, ML is being progressively employed as an alternative to process or statistical methods for future crop yield estimation, showing increased performances and higher computational efficiency: Leng and Hall (2020) test a RF model for annual yield prediction in the US for a 2 °C global warming scenario; while Khan et al. (2024) select Gradient Boosting to model the relationships between daily climate variables, hazard indicators, such as Consecutive dry days (CDD) and crop production with CMIP6 data. Tabari and Willems (2023) carry out a global risk assessment from hot and dry events, employing Copulas and integrating data from Shared Socio-economic Pathways (SSP) scenarios, future land use patterns population and governance. ML methods are used also to predict the risk of increased conflicts due to climate stressors: a RF classifier is applied by Hoch et al. (2021) to predict water-related conflicts in Africa using different SSP future projections, integrating socio-economic predictors (population, education, GDP, governance) and climate predictors (precipitation, evaporation, flood volume, soil water). The model is trained on historical data up to 2015 and tested with projections from 2016 to 2050. Future temperature-related mortality in different European regions is analysed by García-León et al. (2024) considering 4 scenarios of global warming (1.5, 2, 3, 4 °C) with an ensemble of CMIP5 models, analysing disparities between cold-related deaths and heat-related deaths and analysing the role of age, health infrastructure and climate change with a Distributed Lag Non-Linear model. In particular, different scenarios are discussed: present climate and present population, present climate with future population from EUROPOP 2019; future climate under different warming level with future population exposure.
Future risk patterns are also calculated implementing future multi-hazard susceptibility maps: for example, Rahman et al. (2024) analyse future coastal multi-hazard risks in Bangladesh, implementing an LSTM algorithm, in combination with RF feature selection and a Genetic Algorithm (GA) optimiser. In particular, GA is used to identify optimal or near-optimal solutions, searching the space of LSTM parameters through a process of selection, crossover and mutation. The combination of the LSTM's ability to capture sequential patterns and long-term dependencies and GA's efficiency in navigating complex search spaces, is proved to achieve better convergence, avoid local minima, and optimise both the architecture and parameters of the LSTM model (Al-Selwi et al., 2024). Other future multi-hazard susceptibility approaches include Ya et al. (2023), who analyse future risks in the Tibetan plateau considering climate and land use changes. Logistic Regression is used to produce susceptibility maps, while future climate scenarios were taken from CMIP6 future projections. In order to create future land use, this paper focus on PLUS, a RF-based model analysing the relationship between influencing factors and land use changes (Liang et al., 2021). Another approach for future land use is applied by Saha et al. (2021), which focuses on modelling cultural heritage site future multi-hazard susceptibility in the Sikkim state in India, considering different climate scenarios from CMIP5 and land use from an empirical model (Dyna-CLUE) incorporating spatial logistic regression (Jiang et al., 2015). Bayesian Additive Regression Trees and Bayesian Generalised Linear models are applied to produce multi-hazard susceptibility maps, considering extreme rainfall, landslides and earthquakes. Another dynamical model, a Cellular Automata- Markov model (Clarke et al., 1997) is used to predict future land use changes in Iran to investigate flood risks, testing RF, XGBoost and Gradient Boosting as algorithms for producing susceptibility maps (Janizadeh et al., 2021).
3.5 Limitations and future research directions
Figure 3 summarises the distribution of ML methods across the ten research sub-topics identified in this review, providing a synthetic overview of the methodological landscape documented in the preceding sections. The figure reveals several patterns: CNNs and DL architectures dominate Earth observation processing tasks; LSTM and sequence-based models concentrate in hazard prediction, where temporal dynamics and memory effects are critical. Random Forest, ensemble methods, and simpler regression approaches prevail in risk and impact assessments and future scenario analysis, consistent with their interpretability, robustness to overfitting, and compatibility with tabular socio-environmental predictor sets. Statistical methods, including copulas and return period approaches, appear primarily in compound event characterisation. Taken together, these patterns confirm that data-driven methods have achieved meaningful penetration across the full multi-hazard risk assessment chain, with distinct methodological communities converging on appropriate tools for each sub-problem. At the same time, the figure shows that methods natively designed for multi-hazard interaction modelling, such as graph neural networks, remain marginal across all sub-topics, and no architecture yet bridges the full modelling chain in an integrated way.
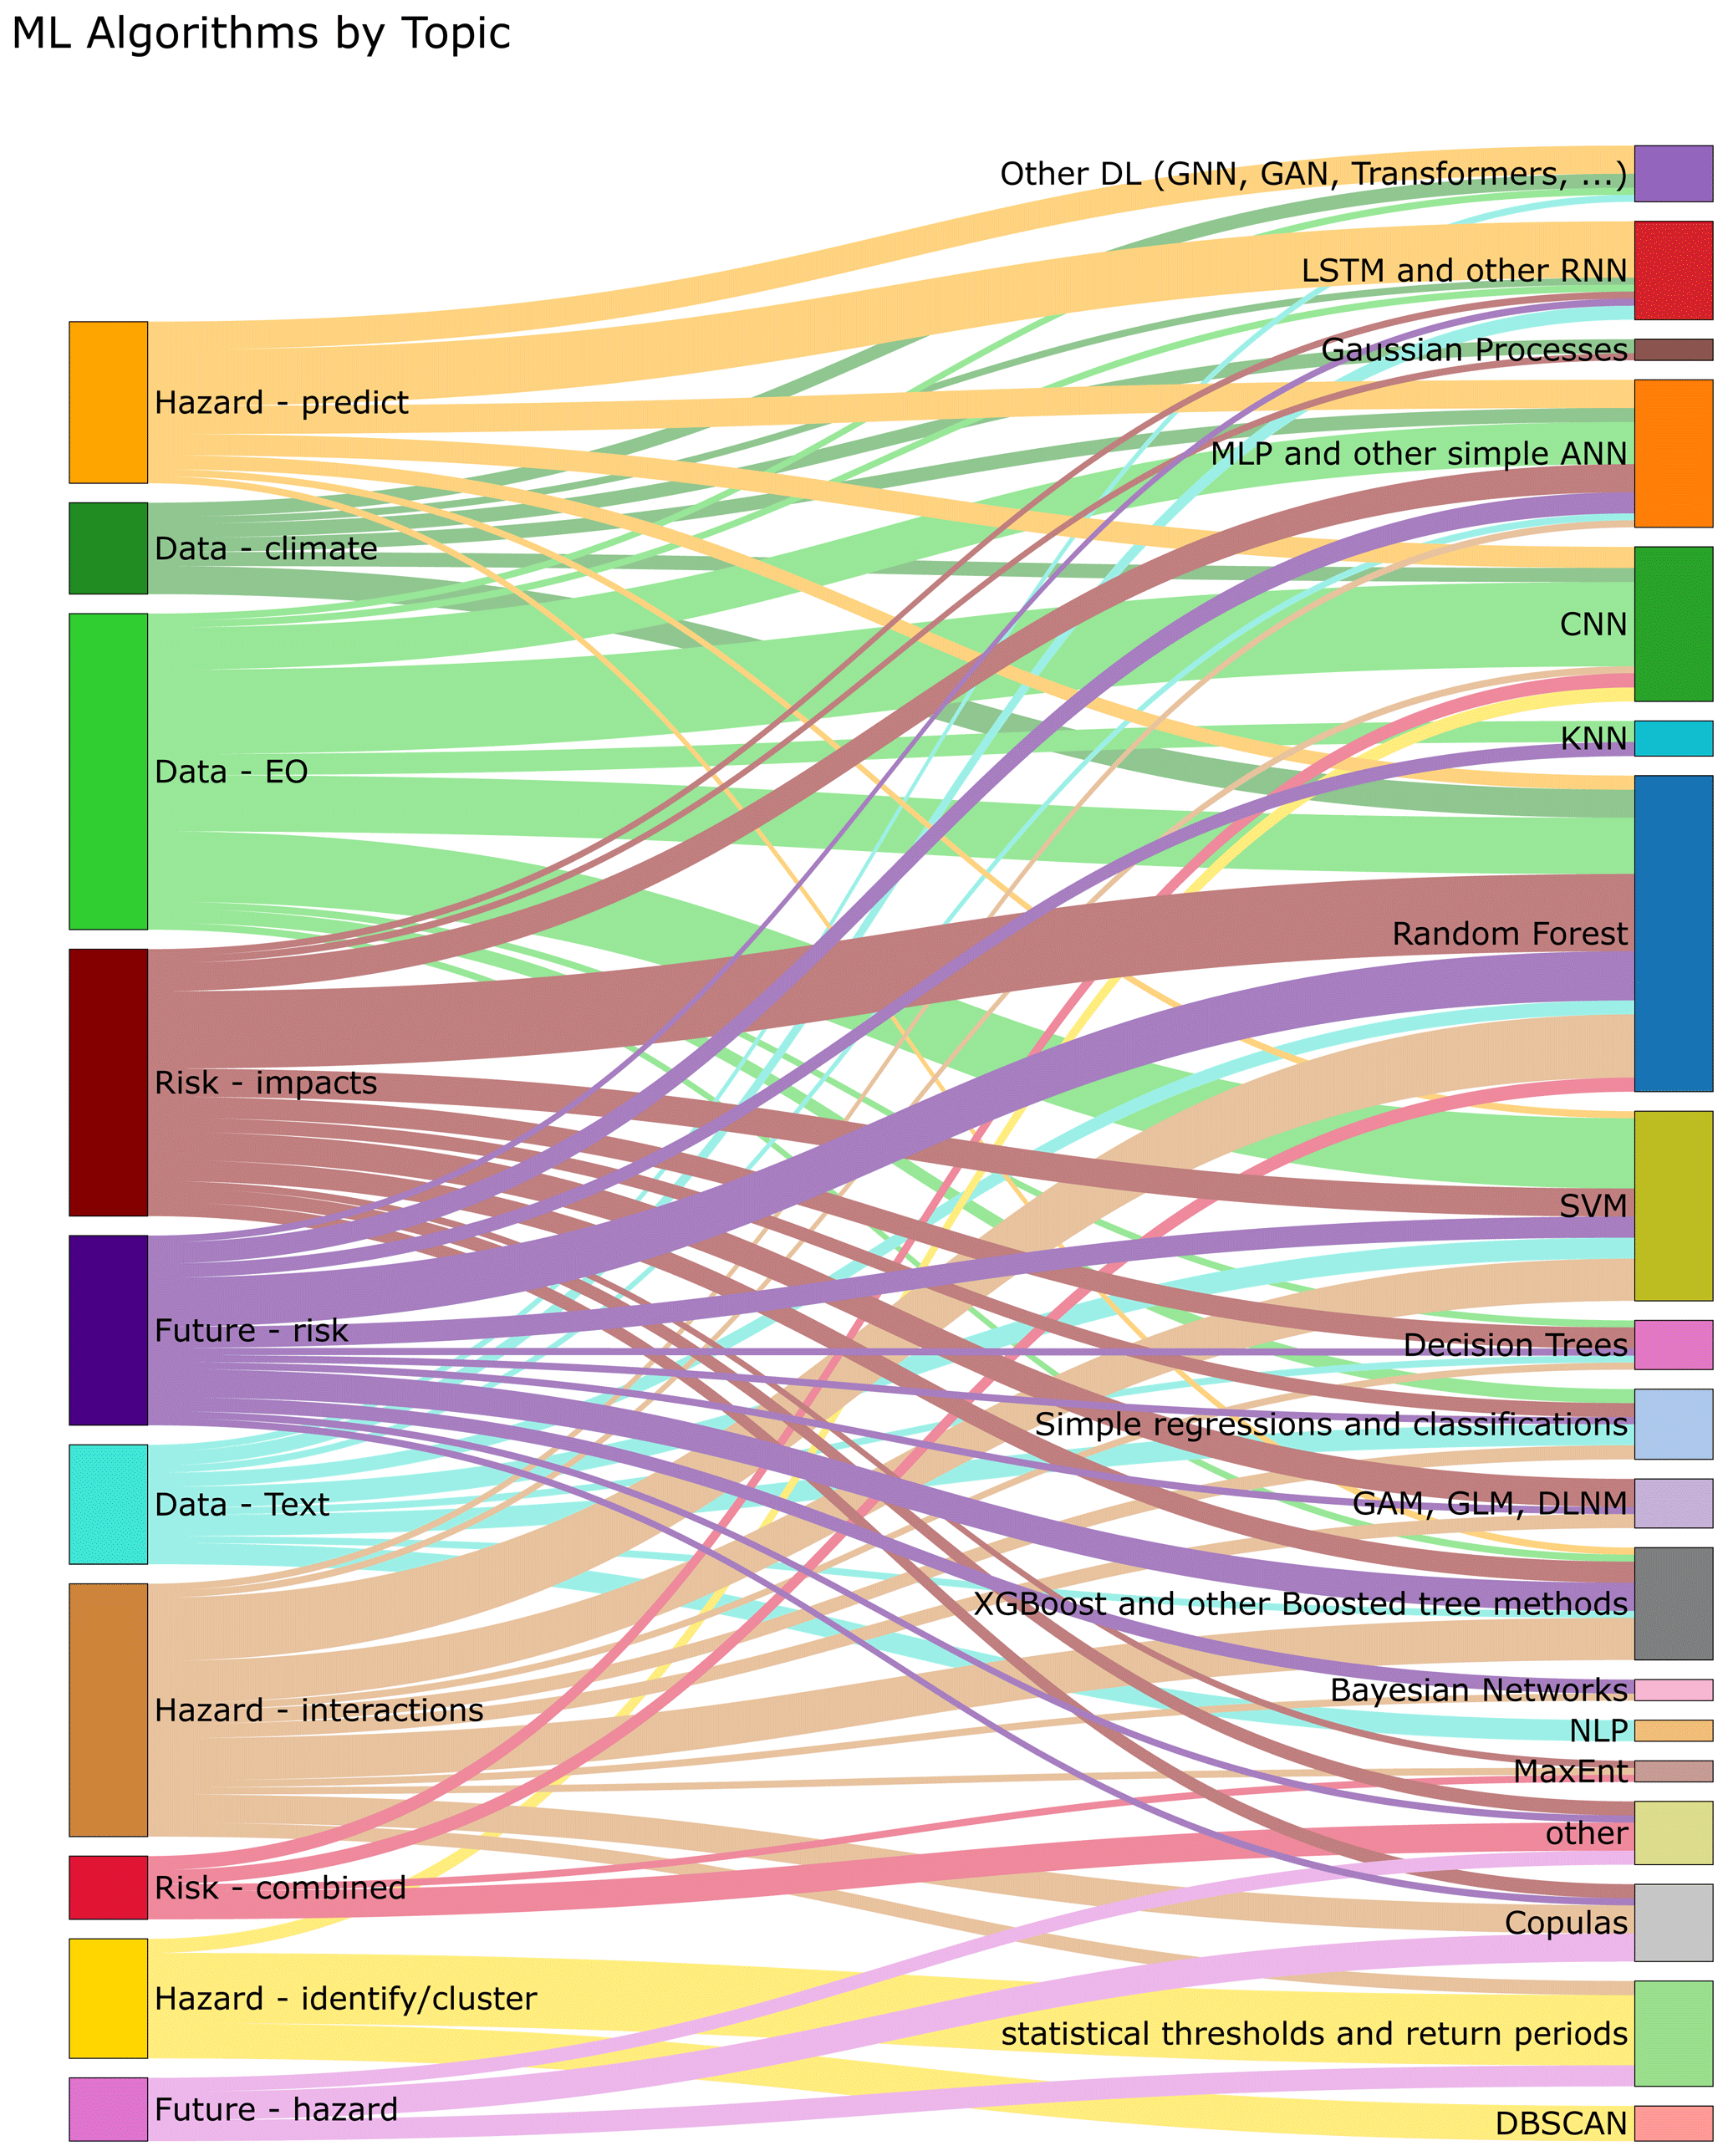
These gaps point to the limitations of the current ML applications and open research directions relevant to the operational uptake of data-driven approaches in multi-hazard risk management. A first and fundamental limitation is climate non-stationarity, as highlighted in Sect. 3.4: ML models trained on historical hazard records implicitly assume that the statistical relationships between predictors and outcomes will remain stable into the future. As Reichstein et al. (2025) argue in the context of early warning systems, relying on past norms and training distributions will prove inappropriate under non-stationary risk conditions, where projected increases in hazard frequency and severity, combined with shifting exposure and vulnerability, create conditions that fall outside the range of any historical training set. This is particularly acute for compound and cascading events, which are by definition rare in the historical record yet are precisely the configurations that climate change is projected to intensify.
A second limitation is the gap between hazard prediction and impact prediction. Most ML applications reviewed optimise for hazard or susceptibility metrics, but impact prediction requires integrating physical hazard outputs with dynamic exposure and vulnerability data at sub-kilometre scales, a challenge that the reviewed papers largely sidestep by using static proxies. This gap between technical model performance and actionable risk information represents one of the most important unresolved challenges in translating ML-based risk assessment into operational decision-making (Tiggeloven et al., 2025; Reichstein et al., 2025).
A third set of concerns relates to interpretability and trust. The black-box nature of deep learning models creates well-recognised barriers to adoption in high-stakes regulatory and emergency management contexts, where stakeholders need not only a prediction but a justification they can interrogate and contest. However, current XAI applications remain predominantly proof-of-concept and are rarely integrated into operational early warning or risk assessment workflows (Ghaffarian et al., 2023). Moreover, reproducibility and validation remain a persistent concern. In geoscientific applications, spatial autocorrelation means that random train-test splits routinely inflate apparent model skill relative to genuinely independent spatial holdouts (Sweet et al., 2023), and the reviewed literature shows limited adoption of spatially blocked cross-validation or independent regional test sets. These limitations do not invalidate the contributions reviewed here, but they do underscore the need for more rigorous validation protocols, realistic appraisal of out-of-sample performance, and explicit discussion of the conditions under which ML approaches can be expected to generalise beyond their training contexts.
Another methodological gap identified by this review is the absence of end-to-end uncertainty quantification frameworks for multi-hazard risk assessment. Current practice addresses UQ in fragments: aleatory uncertainty in input data is handled at the start of the chain, epistemic uncertainty in ML models is occasionally addressed through Bayesian or ensemble methods at the hazard stage, and copula-based approaches characterise joint uncertainty for statistically correlated hazard pairs, but these efforts are rarely connected, and they do not extend to the full multi-hazard concept, which encompasses cascading and triggered hazards beyond the reach of shared statistical distributions. A genuinely integrated framework would propagate both aleatory and epistemic uncertainty continuously from input data through multi-hazard interactions, ML and statistical model outputs, and exposure and vulnerability components, to the final risk estimate (Beven, 2018).
A further methodological consideration for future research is the development of data-driven frameworks that move beyond static representations of vulnerability and exposure. The reviewed literature overwhelmingly treats these components as fixed spatial layers, with limited engagement with their dynamic, socially differentiated, and governance-mediated dimensions. Addressing this gap will require closer integration of ML and statistical methods with approaches capable of representing how vulnerability evolves over time, including agent-based modelling, participatory data collection, and socially-informed frameworks that explicitly account for adaptive behaviour, equity, and governance processes. Progress in this direction would not only improve the realism of multi-risk assessments but also strengthen their relevance for policy and decision-making in contexts where social vulnerability is itself a driver of risk (Cannon, 2017; Bankoff and Hilhorst, 2022).
Finally, the geographical distribution of the reviewed studies, visualised in the Sankey diagram in Appendix B, points to an imbalance that is worth acknowledging explicitly. Europe, North America and East Asia together account for more than 80 % of lead authorships, while Africa and South America contribute less than 5 %. This pattern partly reflects the Scopus, English-only, 2010–2024 scope of the search strategy, which may systematically underrepresent research published in other languages or in regional journals not indexed by Scopus. At the same time, the decoupling between authorship geography and case study geography, with South/SE Asia, the Middle East, and Africa appearing more frequently as study areas than as sources of authorship, suggests that data-driven methods are in several cases developed in data-rich institutional contexts and subsequently applied to regions with different risk dynamics, data availability, and governance structures (Tiggeloven et al., 2025). While drawing strong conclusions about data colonialism or algorithmic bias from a bibliometric analysis alone would go beyond the scope of this review, these patterns do raise questions that the community should engage with: whether training datasets and validation benchmarks are representative of the contexts in which models are ultimately deployed, and whether the priorities shaping methodological innovation reflect the needs of the most exposed populations. Future work in this area should pay closer attention to the transferability of data-driven multi-risk frameworks across different socio-economic and data environments (Tiggeloven et al., 2025), and collaborative initiatives fostering locally-grounded research in currently underrepresented regions would strengthen both the scientific robustness and the equity dimensions of the field (Naudé and Vinuesa, 2021).
This paper presents a comprehensive review of data-driven applications aimed at modelling and enhancing our understanding of climate-related multi-hazard and multi-risk events. Based on the selection and in-depth analysis of 153 key papers, the review addresses four research areas: (i) data processing and collection, (ii) hazard analysis, (iii) risk analysis, and (iv) future risk scenarios, each divided into several sub-topics. The results highlight the strong connections between Earth observations processing and ML techniques like CNN; on the other hand, RF, other ensemble methods and GAM are mostly applied for risk impacts and future risk assessment, while LSTM, ANN and other DL approaches are most common for hazard prediction, reflecting a growing trend toward leveraging sophisticated AI architectures for climate and hazards applications, and a focus on simpler, more interpretable models for risk applications. Despite the current prevalence of single-hazard applications in ML research, there is growing recognition of the importance of multi-risk strategies. Notable advancements include copula-based compound event analyses and ML-driven multi-hazard susceptibility maps. Future research should prioritize a more comprehensive understanding of multi-risk interactions – such as triggering, cascading, or amplifying effects – by considering the interplay between hazard factors, vulnerability, and exposure dynamics, which are often overlooked or treated independently in current studies. DL methods, with their capacity to capture complex, non-linear interactions across spatio-temporal dimensions, offer promising avenues for progress, yet remain underexplored in operational multi-risk contexts. However, these methods require high-resolution impact data, which remains a significant challenge due to limited availability, inconsistency across regions, and issues of data quality and standardization. While EO and textual data can aid in generating new multi-risk disaster catalogues, traditional sensor-based and human-curated disaster catalogues remain essential for validation, representing a major bottleneck that constrains model validation, transferability, and ultimately the uptake of these methods in practice. By addressing these methodological and data gaps, the field can move toward more robust, interpretable, and actionable multi-risk assessments, ultimately strengthening the integration of machine learning into climate services that support adaptation, resilience, and disaster risk reduction.
The gap between hazard prediction and impact prediction remains largely unresolved and bridging it will demand closer integration of data-driven model outputs with dynamic representations of exposure and vulnerability, including human behaviour, adaptive responses, and the social and governance dimensions that determine how risk is distributed across communities. Explainability is a further priority: XAI methods need to move beyond their current role as exploratory tools and be embedded into operational early warning and risk assessment workflows, where their ability to illuminate driver interactions and build stakeholder trust is most consequential. End-to-end uncertainty quantification across the full modelling chain remains absent and developing integrated frameworks that propagate both aleatory and epistemic uncertainty from inputs through multi-hazard interactions to the final risk estimate is one of the most important open methodological challenges for the field. Underlying all of these challenges is the problem of non-stationarity: as climate change intensifies hazard frequency and severity, shifts exposure and vulnerability, and increases the likelihood of compound and cascading configurations that fall outside any historical training set, the assumption that past conditions are a reliable guide to future risk becomes increasingly untenable, with direct consequences for the validity of ML-based projections of multi-risk evolution.
Addressing these gaps, alongside the geographic and equity imbalances documented in this review, will require not only methodological innovation but also more inclusive research practices: collaborative frameworks that bring together physical scientists, social scientists, and communities in currently underrepresented regions, co-producing knowledge that is robust, transferable, and genuinely relevant to those most exposed to the evolving risks of a changing climate.
A1 Acronyms of methods (in alphabetical order)
| AI | Artificial Intelligence |
| ANN | Artificial Neural Network |
| BRT | Boosted Regression Trees |
| CART | Classification and Regression Trees |
| CNN | Convolutional Neural Network |
| ConvNP | Convolutional Neural Process |
| DBSCAN | Density Based Spatial Clustering Application with Noise |
| DeepGP | Deep Gaussian Process |
| DL | Deep Learning |
| DT | Decision Tree |
| EG | Expected Gradient |
| GA | Genetic Algorithm |
| GAM | Generalised Additive Models |
| GAN | Generative Adversarial Network |
| GLM | Generalised Linear Models |
| GNN | Graph Neural Network |
| GP | Gaussian Process |
| GRU | Gated Recurrent Unit |
| IG | Integrated Gradient |
| KNN | K Nearest Neighbour |
| LSTM | Long Short Term Memory |
| MaxEnt | Maximum Entropy |
| ML | Machine Learning |
| NLP | Natural Language Processing |
| PCMCI | Peter and Clark Momentary Conditional Independence |
| RF | Random Forest |
| SHAP | Shapley Values |
| SVM | Support Vector Machine |
| XGBoost | Extreme Gradient Boosting |
A2 Other acronyms (in alphabetical order)
| AHP | Analytical Hierarchy Processes |
| CO | Carbon Monoxide |
| CDD | Consecutive Dry Days |
| CMIP | Coupled Model Intercomparison Project |
| DynaCLUE | Dynamic Conversion of Land Use and its Effect |
| EO | Earth observations |
| FWI | Fire Weather Index |
| GEV | Generalised Extreme Value (distributions) |
| HKH | Hindu-Kush and Himalaya (Region) |
| NO2 | Nitrogen Dioxide |
| O3 | Ozone |
| RCP | Representative Concentration Pathways |
| PLUS | Patch-generating Land Use Simulation |
| PM | Particle Matter |
| SO2 | Sulphur dioxide |
| SMILE | Single Model Initial-condition Large Ensemble |
| SPEI | Standardised Precipitation and Evapotranspiration Index |
| SPI | Standardised Precipitation Index |
The literature review followed the PRISMA guidelines to ensure transparency and reproducibility in the identification, screening, and selection of studies. The process is summarized in the PRISMA flow diagram and detailed as follows.
First, records were retrieved from major scientific databases (Scopus) and filtered by type, retaining only articles, conference papers, and book chapters and language (English). Next, documents were filtered by subject area and keyword, selecting only those classified under Environmental Science and Earth and Planetary Science as subjects and considering machine learning, climate change, risk assessments (and their synonyms and variations) as keywords.
In the third step (title screening stage), studies not focusing on natural hazards, multi-hazard, or risk assessment were excluded. During the abstract screening stage, each paper was evaluated for its relevance to the review's research questions, focusing particularly on the use of machine learning (ML) techniques and their application to multi-hazard or multi-risk contexts. Studies were retained if they explicitly applied ML, AI, or statistical learning methods to the modelling, characterization, or assessment of natural hazards, or if they addressed interactions between multiple hazard types (e.g., cascading or compound events) and their associated risks. Papers focusing solely on single hazards without methodological innovation or on unrelated environmental modelling were excluded. This step ensured that the final selection captured studies advancing methodological understanding of ML-driven hazard analysis, as well as those integrating multiple hazard processes or risk dimensions. Finally, the full-text review identified the most relevant and representative papers, ensuring balanced coverage across different hazard types and AI methodologies. The final selections were based on diversity in data sources, geographical coverage, hazard types and machine learning methods used. This process ensured that the resulting corpus reflects the breadth of current research at the intersection of AI, Earth observation, and multi-hazard risk assessment.
The number of studies retained at each step is summarized in Table B1 (numbers correspond to the four main research questions).
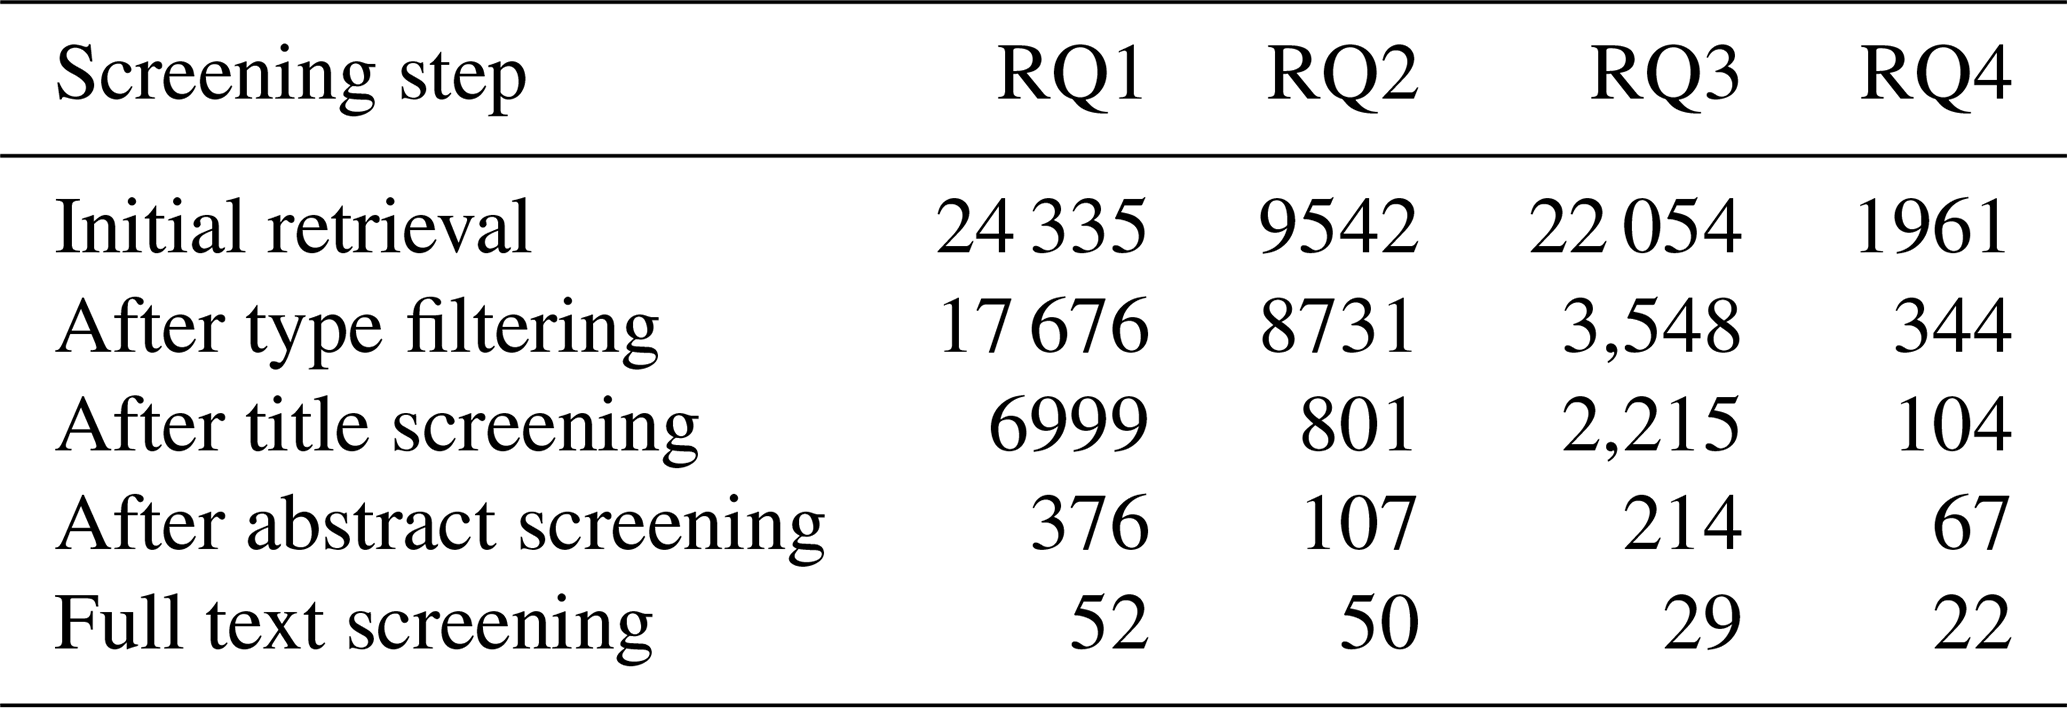
Figures B1 and B2 provide an overview of the geographic characteristics of the reviewed literature and together contextualise some of the limitations discussed in the main text. Figure B1 illustrates the geographic distribution of reviewed papers across lead author country, all author countries, and case study region, revealing that research output is heavily concentrated in China, the USA, and Western Europe. Figure B2 further summarises this regional imbalance: Europe and North America together account for over 55 % of lead authorships, while regions such as Africa, South/SE Asia, and South America remain substantially underrepresented both as producers and subjects of research. This geographic skew has direct methodological implications: the predominance of country-level aggregated indicators, and the limited availability of sub-national spatially resolved datasets, partly reflects the data infrastructure of the regions where most studies are conducted and may systematically underrepresent the vulnerability dynamics of lower-income contexts where disaster impacts are most severe.
Figure B1Geographic distribution of reviewed papers: Sankey diagrams between main authors countries, co-author countries and analysed case studies.
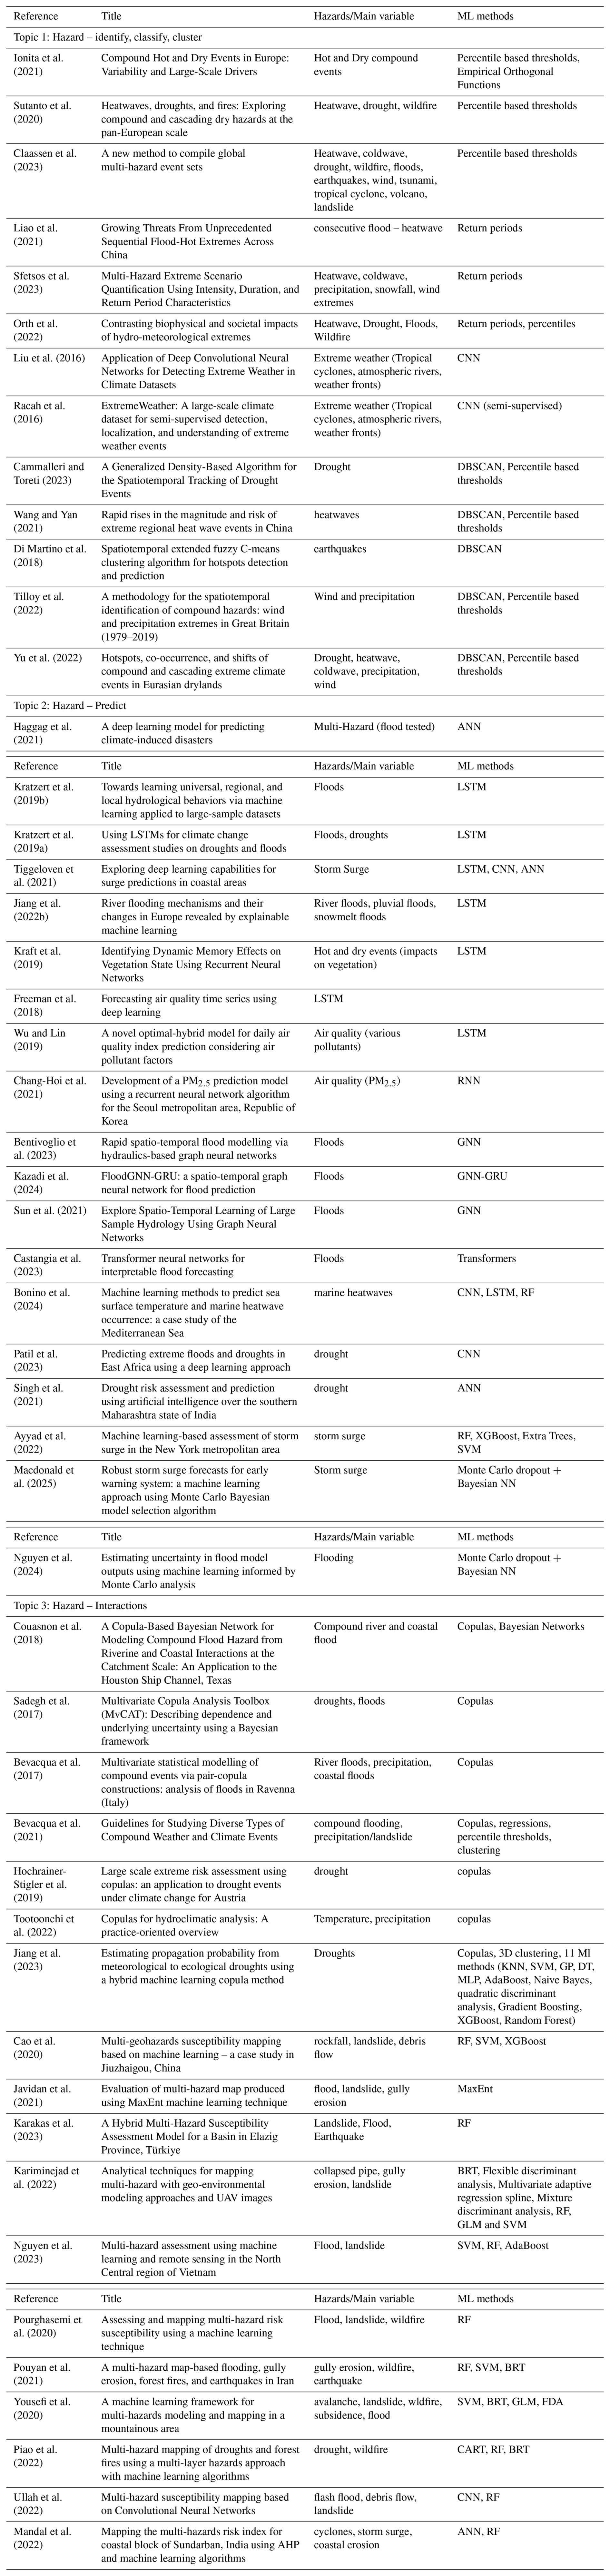
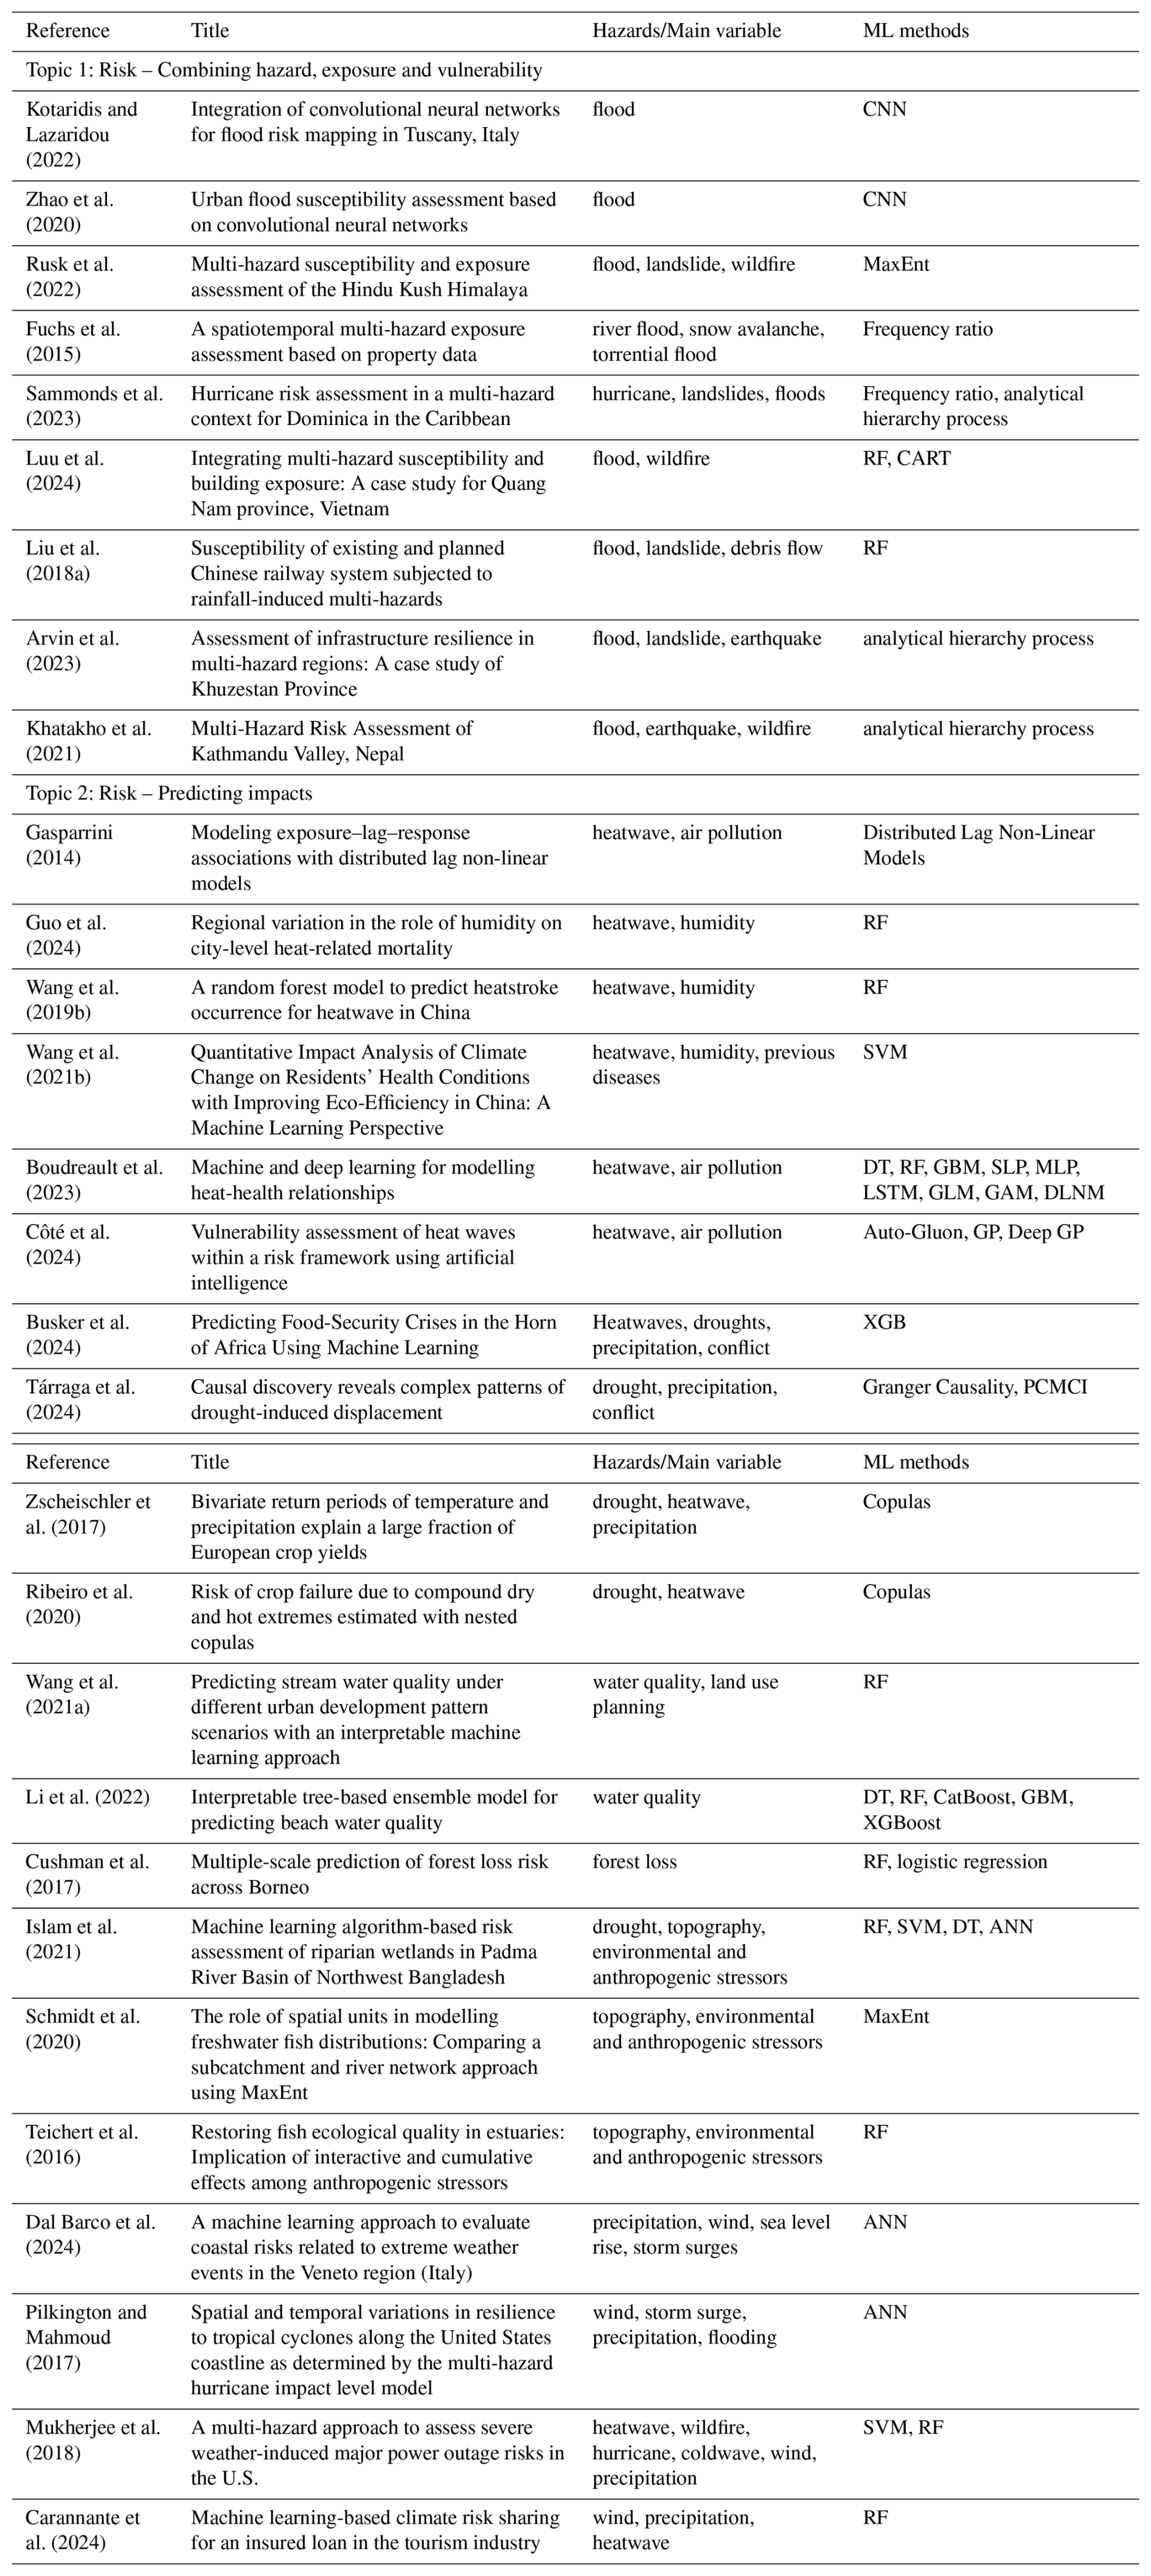
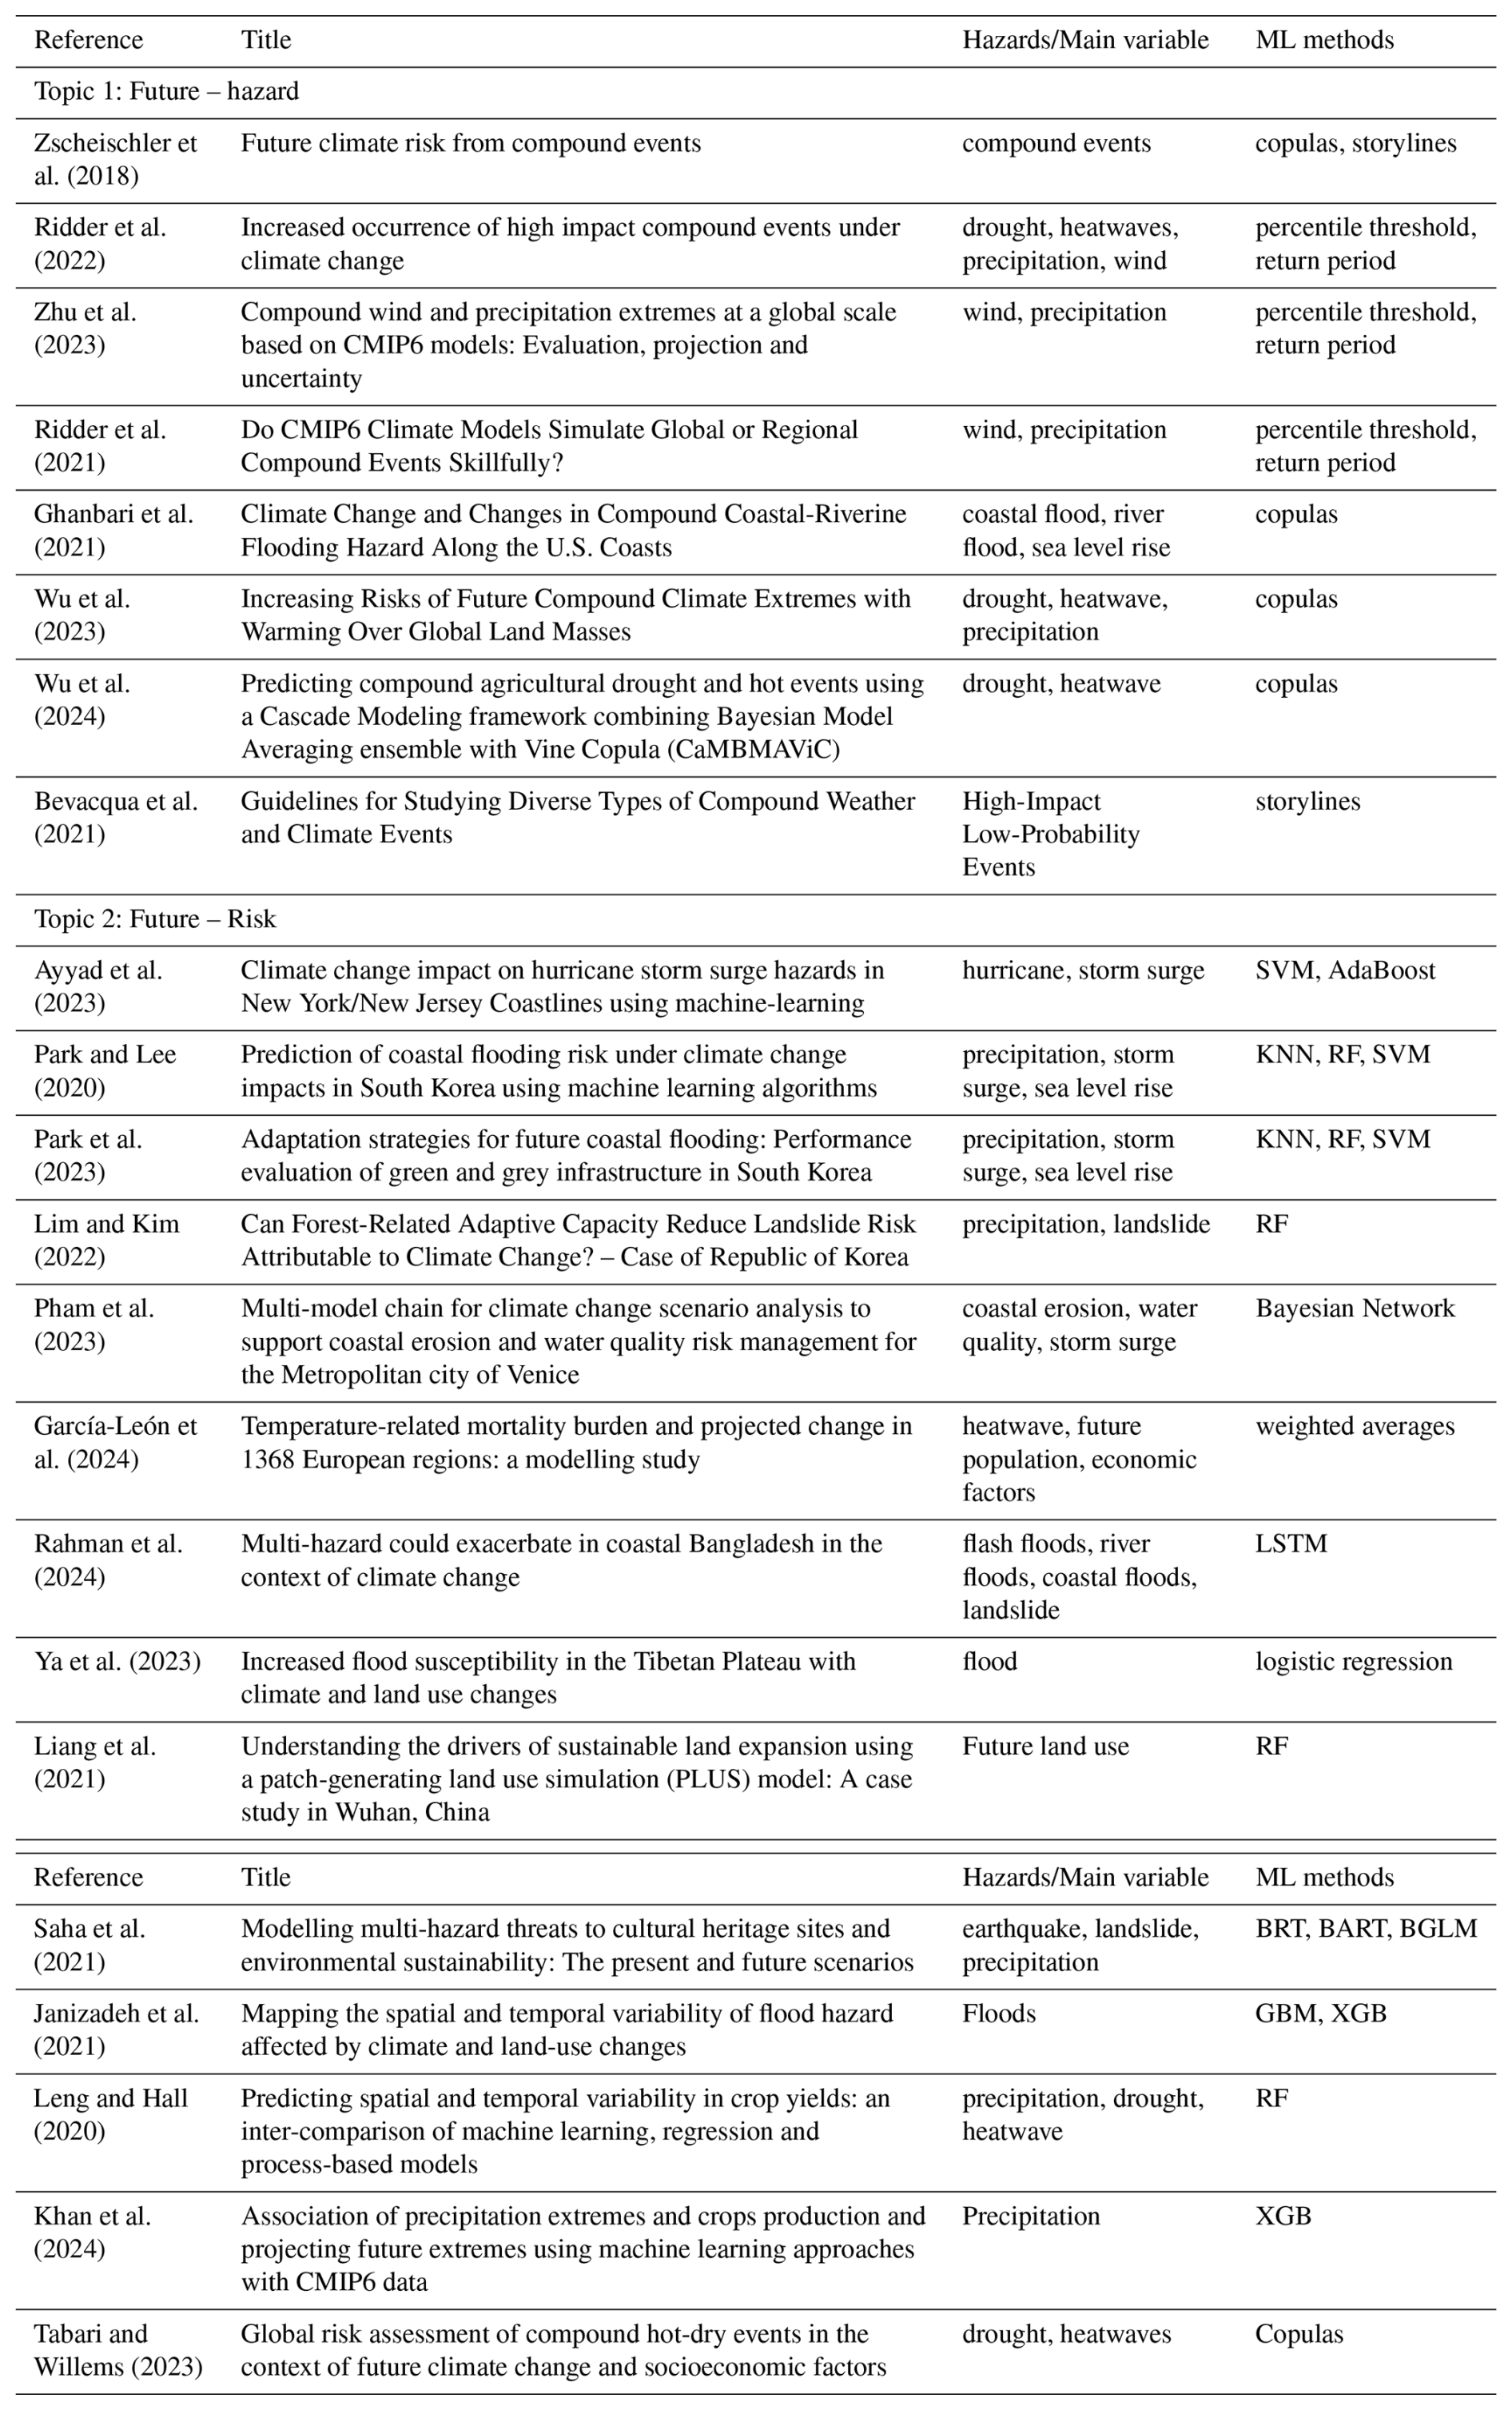
No data sets were used in this article.
DMF: Conceptualisation, Methodology, Formal analysis, Investigation, Data curation, Visualisation, Writing – original draft. MS: Conceptualisation, Methodology, Validation, Writing – review and editing. MM: Conceptualisation, Data curation, Writing – review and editing. AC: Funding acquisition, Supervision, Conceptualisation, Writing – review and editing. ST: Funding acquisition, Supervision, Conceptualisation, Project administration.
The contact author has declared that none of the authors has any competing interests.
Publisher's note: Copernicus Publications remains neutral with regard to jurisdictional claims made in the text, published maps, institutional affiliations, or any other geographical representation in this paper. The authors bear the ultimate responsibility for providing appropriate place names. Views expressed in the text are those of the authors and do not necessarily reflect the views of the publisher.
This article is part of the special issue “Methodological innovations for the analysis and management of compound risk and multi-risk, including climate-related and geophysical hazards (NHESS/ESD/ESSD/GC/HESS inter-journal SI)”. It is not associated with a conference.
The research was carried out within the frame of Myriad_EU project (https://www.myriadproject.eu/, last access: 24 June 2026), which has received funding from the European Union's Horizon 2020 research and innovation programme call H2020-LC-CLA-2018-2019-2020 under grant agreement number 101003276 and within the frame of EXPEDITE (https://cordis.europa.eu/project/id/101067784, last access: 24 June 2026), which has received funding from the European Union's (HORIZON TMA MSCA Postdoctoral Fellowships – European Fellowships) under grant agreement number 101067784.
This research has been supported by the European Commission, Horizon 2020 Framework Programme (grant no. 101003276) and within the frame of EXPEDITE (https://cordis.europa.eu/project/id/101067784), which has received funding from the European Union's (HORIZON TMA MSCA Postdoctoral Fellowships – European Fellowships) under grant agreement number 101067784.
This paper was edited by Aloïs Tilloy and reviewed by three anonymous referees.
Abu El-Magd, S. A., Ali, S. A., and Pham, Q. B.: Spatial modeling and susceptibility zonation of landslides using random forest, naïve bayes and K-nearest neighbor in a complicated terrain, Earth Sci. Inform., 14, 1227–1243, https://doi.org/10.1007/s12145-021-00653-y, 2021.
Adam, E., Mutanga, O., Odindi, J., and Abdel-Rahman, E. M.: Land-use/cover classification in a heterogeneous coastal landscape using RapidEye imagery: evaluating the performance of random forest and support vector machines classifiers, Int. J. Remote Sens., 35, 3440–3458, https://doi.org/10.1080/01431161.2014.903435, 2014.
AghaKouchak, A., Chiang, F., Huning, L. S., Love, C. A., Mallakpour, I., Mazdiyasni, O., Moftakhari, H., Papalexiou, S. M., Ragno, E., and Sadegh, M.: Climate Extremes and Compound Hazards in a Warming World, Annu. Rev. Earth Pl. Sc., 48, 519–548, https://doi.org/10.1146/annurev-earth-071719-055228, 2020.
Agrawal, S.: The Effectiveness of Copulas for Modeling Compound Climate Extreme Events in Boulder County, Colorado, ProQuest ID: Agrawal_ucla_0031N_21275, Merritt ID: ark:/13030/m59m1m6w, https://escholarship.org/uc/item/92p410ff (last access: 24 June 2026), 2022.
Ahmad, S., Kalra, A., and Stephen, H.: Estimating soil moisture using remote sensing data: A machine learning approach, Adv. Water Resour., 33, 69–80, https://doi.org/10.1016/j.advwatres.2009.10.008, 2010.
Ahmadlou, M., Al-Fugara, A., Al-Shabeeb, A. R., Arora, A., Al-Adamat, R., Pham, Q. B., Al-Ansari, N., Linh, N. T. T., and Sajedi, H.: Flood susceptibility mapping and assessment using a novel deep learning model combining multilayer perceptron and autoencoder neural networks, J. Flood Risk Manage., 14, https://doi.org/10.1111/jfr3.12683, 2021.
Albulescu, A.-C. and Armaș, I.: An impact-chain-based exploration of multi-hazard vulnerability dynamics: the multi-hazard of floods and the COVID-19 pandemic in Romania, Nat. Hazards Earth Syst. Sci., 24, 2895–2922, https://doi.org/10.5194/nhess-24-2895-2024, 2024.
Al-Selwi, S. M., Hassan, M. F., Abdulkadir, S. J., Muneer, A., Sumiea, E. H., Alqushaibi, A., and Ragab, M. G.: RNN-LSTM: From applications to modeling techniques and beyond – Systematic review, Journal of King Saud University – Computer and Information Sciences, 36, 102068, https://doi.org/10.1016/j.jksuci.2024.102068, 2024
Amato, F., Guignard, F., Robert, S., and Kanevski, M.: A novel framework for spatio-temporal prediction of environmental data using deep learning, Sci. Rep., 10, 22243, https://doi.org/10.1038/s41598-020-79148-7, 2020.
Andersson, T. R., Bruinsma, W. P., Markou, S., Requeima, J., Coca-Castro, A., Vaughan, A., Ellis, A.-L., Lazzara, M. A., Jones, D., Hosking, S., and Turner, R. E.: Environmental sensor placement with convolutional Gaussian neural processes, Environmental Data Science, 2, e32, https://doi.org/10.1017/eds.2023.22, 2023.
Angelov, D.: Top2Vec: Distributed Representations of Topics, arXiv [preprint], https://doi.org/10.48550/arXiv.2008.09470, 2020.
Anshuka, A., Van Ogtrop, F. F., Sanderson, D., and Leao, S. Z.: A systematic review of agent-based model for flood risk management and assessment using the ODD protocol, Nat. Hazards, 112, 2739–2771, https://doi.org/10.1007/s11069-022-05286-y, 2022.
Arosio, M., Martina, M. L. V., and Figueiredo, R.: The whole is greater than the sum of its parts: a holistic graph-based assessment approach for natural hazard risk of complex systems, Nat. Hazards Earth Syst. Sci., 20, 521–547, https://doi.org/10.5194/nhess-20-521-2020, 2020.
Arosio, M., Cesarini, L., and Martina, M. L. V.: Assessment of the Disaster Resilience of Complex Systems: The Case of the Flood Resilience of a Densely Populated City, Water, 13, 2830, https://doi.org/10.3390/w13202830, 2021.
Arvin, M., Beiki, P., Hejazi, S. J., Sharifi, A., and Atashafrooz, N.: Assessment of infrastructure resilience in multi-hazard regions: A case study of Khuzestan Province, Int. J. Disast. Risk Re., 88, 103601, https://doi.org/10.1016/j.ijdrr.2023.103601, 2023.
Asinthara, K., Jayan, M., and Jacob, L.: Classification of Disaster Tweets using Machine Learning and Deep Learning Techniques. 2022 International Conference on Trends in Quantum Computing and Emerging Business Technologies (TQCEBT), 1–5, https://doi.org/10.1109/TQCEBT54229.2022.10041629, 2022.
Ayyad, M., Hajj, M. R., and Marsooli, R.: Machine learning-based assessment of storm surge in the New York metropolitan area, Sci. Rep., 12, 19215, https://doi.org/10.1038/s41598-022-23627-6, 2022.
Ayyad, M., Hajj, M. R., and Marsooli, R.: Climate change impact on hurricane storm surge hazards in New York/New Jersey Coastlines using machine-learning, Npj Clim. Atmos. Sci., 6, 88, https://doi.org/10.1038/s41612-023-00420-4, 2023.
Bai, T., Wang, L., Yin, D., Sun, K., Chen, Y., Li, W., and Li, D.: Deep learning for change detection in remote sensing: a review, Geo-Spatial Information Science, 26, 262–288, https://doi.org/10.1080/10095020.2022.2085633, 2023.
Bai, Y., Mas, E., and Koshimura, S.: Towards Operational Satellite-Based Damage-Mapping Using U-Net Convolutional Network: A Case Study of 2011 Tohoku Earthquake-Tsunami, Remote Sens., 10, 1626, https://doi.org/10.3390/rs10101626, 2018.
Bankoff, G. and Hilhorst, H.: Why Vulnerability Still Matters: The Politics of Disaster Risk Creation, Routledge, https://doi.org/10.4324/9781003219453, 2022.
Barrett, A. B., Duivenvoorden, S., Salakpi, E. E., Muthoka, J. M., Mwangi, J., Oliver, S., and Rowhani, P.: Forecasting vegetation condition for drought early warning systems in pastoral communities in Kenya, arXiv [preprint], https://doi.org/10.48550/arXiv.1911.10339, 2020.
Bentivoglio, R., Isufi, E., Jonkman, S. N., and Taormina, R.: Rapid spatio-temporal flood modelling via hydraulics-based graph neural networks, Hydrol. Earth Syst. Sci., 27, 4227–4246, https://doi.org/10.5194/hess-27-4227-2023, 2023.
Bevacqua, E., Maraun, D., Hobæk Haff, I., Widmann, M., and Vrac, M.: Multivariate statistical modelling of compound events via pair-copula constructions: analysis of floods in Ravenna (Italy), Hydrol. Earth Syst. Sci., 21, 2701–2723, https://doi.org/10.5194/hess-21-2701-2017, 2017.
Bevacqua, E., De Michele, C., Manning, C., Couasnon, A., Ribeiro, A. F. S., Ramos, A. M., Vignotto, E., Bastos, A., Blesić, S., Durante, F., Hillier, J., Oliveira, S. C., Pinto, J. G., Ragno, E., Rivoire, P., Saunders, K., Wiel, K., Wu, W., Zhang, T., and Zscheischler, J.: Guidelines for Studying Diverse Types of Compound Weather and Climate Events, Earths Future, 9, https://doi.org/10.1029/2021EF002340, 2021.
Bevacqua, E., Suarez-Gutierrez, L., Jézéquel, A., Lehner, F., Vrac, M., Yiou, P., and Zscheischler, J.: Advancing research on compound weather and climate events via large ensemble model simulations, Nat. Commun., 14, 2145, https://doi.org/10.1038/s41467-023-37847-5, 2023.
Beven, K.: Environmental Modelling, CRC Press, https://doi.org/10.1201/9781482288575, 2018.
Bhowmik, R. T., Jung, Y. S., Aguilera, J. A., Prunicki, M., and Nadeau, K.: A multi-modal wildfire prediction and early-warning system based on a novel machine learning framework, J. Environ. Manage., 341, 117908, https://doi.org/10.1016/j.jenvman.2023.117908, 2023.
Bi, K., Xie, L., Zhang, H., Chen, X., Gu, X., and Tian, Q.: Pangu-Weather: A 3D High-Resolution Model for Fast and Accurate Global Weather Forecast, arXiv [preprint], https://doi.org/10.48550/arXiv.2211.02556, 2022.
Bo, W., Liu, J., Fan, X., Tjahjadi, T., Ye, Q., and Fu, L.: BASNet: Burned Area Segmentation Network for Real-Time Detection of Damage Maps in Remote Sensing Images, IEEE T. Geosci. Remote, 60, 1–13, https://doi.org/10.1109/TGRS.2022.3197647, 2022.
Bonino, G., Galimberti, G., Masina, S., McAdam, R., and Clementi, E.: Machine learning methods to predict sea surface temperature and marine heatwave occurrence: a case study of the Mediterranean Sea, Ocean Sci., 20, 417–432, https://doi.org/10.5194/os-20-417-2024, 2024.
Bordbar, M., Aghamohammadi, H., Pourghasemi, H. R., and Azizi, Z.: Multi-hazard spatial modeling via ensembles of machine learning and meta-heuristic techniques, Sci. Rep., 12, 1451, https://doi.org/10.1038/s41598-022-05364-y, 2022.
Boudreault, J., Campagna, C., and Chebana, F.: Machine and deep learning for modelling heat-health relationships, Sci. Total Environ., 892, 164660, https://doi.org/10.1016/j.scitotenv.2023.164660, 2023.
Bretherton, C. S., Henn, B., Kwa, A., Brenowitz, N. D., Watt-Meyer, O., McGibbon, J., Perkins, W. A., Clark, S. K., and Harris, L.: Correcting Coarse-Grid Weather and Climate Models by Machine Learning From Global Storm-Resolving Simulations, J. Adv. Model. Earth Syst., 14, https://doi.org/10.1029/2021MS002794, 2022.
Busker, T., van den Hurk, B., de Moel, H., van den Homberg, M., van Straaten, C., Odongo, R. A., and Aerts, J. C. J. H.: Predicting Food-Security Crises in the Horn of Africa Using Machine Learning, Earths Future, 12, https://doi.org/10.1029/2023EF004211, 2024.
Cammalleri, C. and Toreti, A.: A Generalized Density-Based Algorithm for the Spatiotemporal Tracking of Drought Events, J. Hydrometeorol., 24, 537–548, https://doi.org/10.1175/JHM-D-22-0115.1, 2023.
Campbell, A. M., Racault, M.-F., Goult, S., and Laurenson, A.: Cholera Risk: A Machine Learning Approach Applied to Essential Climate Variables, Int. J. Env. Res. Pub. He., 17, 9378, https://doi.org/10.3390/ijerph17249378, 2020.
Cannon, T.: Social Vulnerability and Environmental Hazards, International Encyclopedia of Geography, Wiley, https://doi.org/10.1002/9781118786352.wbieg0845, 2017.
Cao, J., Zhang, Z., Du, J., Zhang, L., Song, Y., and Sun, G.: Multi-geohazards susceptibility mapping based on machine learning – a case study in Jiuzhaigou, China, Nat. Hazards, 102, 851–871, https://doi.org/10.1007/s11069-020-03927-8, 2020.
Carannante, M., D'amato, V., Fersini, P., and Forte, S.: Machine learning-based climate risk sharing for an insured loan in the tourism industry, Quality and Quantity, https://doi.org/10.1007/s11135-024-01958-y, 2024.
Carvalho, D. V., Pereira, E. M., and Cardoso, J. S.: Machine Learning Interpretability: A Survey on Methods and Metrics, Electronics, 8, 832, https://doi.org/10.3390/electronics8080832, 2019.
Castangia, M., Grajales, L. M. M., Aliberti, A., Rossi, C., Macii, A., Macii, E., and Patti, E.: Transformer neural networks for interpretable flood forecasting, Environ. Model. Softw., 160, 105581, https://doi.org/10.1016/j.envsoft.2022.105581, 2023.
Chang-Hoi, H., Park, I., Oh, H.-R., Gim, H.-J., Hur, S.-K., Kim, J., and Choi, D.-R.: Development of a PM2.5 prediction model using a recurrent neural network algorithm for the Seoul metropolitan area, Republic of Korea, Atmos. Environ., 245, 118021, https://doi.org/10.1016/j.atmosenv.2020.118021, 2021.
Chen, K., Han, T., Gong, J., Bai, L., Ling, F., Luo, J.-J., Chen, X., Ma, L., Zhang, T., Su, R., Ci, Y., Li, B., Yang, X., and Ouyang, W.: FengWu: Pushing the Skillful Global Medium-range Weather Forecast beyond 10 Days Lead, arXiv [preprint], https://doi.org/10.48550/arXiv.2304.02948, 2023.
Chen, S., Zhang, Z., Lin, J., and Huang, J.: Machine learning-based estimation of riverine nutrient concentrations and associated uncertainties caused by sampling frequencies, PLOS ONE, 17, e0271458, https://doi.org/10.1371/journal.pone.0271458, 2022.
Claassen, J. N., Ward, P. J., Daniell, J., Koks, E. E., Tiggeloven, T., and de Ruiter, M. C.: A new method to compile global multi-hazard event sets, Sci. Rep., 13, 13808, https://doi.org/10.1038/s41598-023-40400-5, 2023.
Claassen, J. N., Koks, E. E., de Ruiter, M. C., Ward, P. J., and Jäger, W. S.: VineCopulas: an open-source Python package for vine copula modelling, Journal of Open Source Software, 9, 6728, https://doi.org/10.21105/joss.06728, 2024.
Clark, S. K., Brenowitz, N. D., Henn, B., Kwa, A., McGibbon, J., Perkins, W. A., Watt-Meyer, O., Bretherton, C. S., and Harris, L. M.: Correcting a 200 km Resolution Climate Model in Multiple Climates by Machine Learning From 25 km Resolution Simulations, J. Adv. Model. Earth Syst., 14, https://doi.org/10.1029/2022MS003219, 2022.
Clarke, K. C., Hoppen, S., and Gaydos, L.: A self-modifying cellular automaton model of historical urbanization in the San Francisco Bay area, Environ. Plann. B, 24, 247–261, https://doi.org/10.1068/b240247, 1997.
Côté, J.-N., Germain, M., Levac, E., and Lavigne, E.: Vulnerability assessment of heat waves within a risk framework using artificial intelligence, Sci. Total Environ., 912, 169355, https://doi.org/10.1016/j.scitotenv.2023.169355, 2024.
Couasnon, A., Sebastian, A., and Morales-Nápoles, O.: A Copula-Based Bayesian Network for Modeling Compound Flood Hazard from Riverine and Coastal Interactions at the Catchment Scale: An Application to the Houston Ship Channel, Texas, Water, 10, 1190, https://doi.org/10.3390/w10091190, 2018.
Cushman, S. A., Macdonald, E. A., Landguth, E. L., Malhi, Y., and Macdonald, D. W.: Multiple-scale prediction of forest loss risk across Borneo, Landscape Ecol., 32, 1581–1598, https://doi.org/10.1007/s10980-017-0520-0, 2017.
Dal Barco, M. K., Maraschini, M., Ferrario, D. M., Nguyen, N. D., Torresan, S., Vascon, S., and Critto, A.: A machine learning approach to evaluate coastal risks related to extreme weather events in the Veneto region (Italy), Int. J. Disast. Risk Re., 108, 104526, https://doi.org/10.1016/j.ijdrr.2024.104526, 2024.
Dasgupta, A., Hybbeneth, L., and Waske, B.: Towards Daily High-resolution Inundation Observations using Deep Learning and EO, arXiv [preprint], https://doi.org/10.48550/arXiv.2208.09135, 2022.
Dawkins, L. C., Bernie, D. J., Pianosi, F., Lowe, J. A., and Economou T.: Quantifying Uncertainty and Sensitivity in Climate Risk Assessments: Varying Hazard, Exposure and Vulnerability Modelling Choices, Climate Risk Management, 40, 100511, https://doi.org/10.1016/j.crm.2023.100511, 2023.
De Angeli, S., Malamud, B. D., Rossi, L., Taylor, F. E., Trasforini, E., and Rudari, R.: A multi-hazard framework for spatial-temporal impact analysis, Int. J. Disast. Risk Re., 73, 102829, https://doi.org/10.1016/j.ijdrr.2022.102829, 2022.
de Ruiter, M. C. and van Loon, A. F.: The challenges of dynamic vulnerability and how to assess it, IScience, 25, 104720, https://doi.org/10.1016/j.isci.2022.104720, 2022.
Di Martino, F., Pedrycz, W., and Sessa, S.: Spatiotemporal extended fuzzy C-means clustering algorithm for hotspots detection and prediction, Fuzzy Set. Syst., 340, 109–126, https://doi.org/10.1016/j.fss.2017.11.011, 2018.
Du, M., Liu, N., Yang, F., Ji, S., and Hu, X.: On Attribution of Recurrent Neural Network Predictions via Additive Decomposition, The World Wide Web Conference, 383–393, https://doi.org/10.1145/3308558.3313545, 2019.
Erion, G., Janizek, J. D., Sturmfels, P., Lundberg, S. M., and Lee, S.-I.: Improving performance of deep learning models with axiomatic attribution priors and expected gradients, Nature Machine Intelligence, 3, 620–631, https://doi.org/10.1038/s42256-021-00343-w, 2021.
Ester, M., Kriegel, H.-P., Sander, J., and Xu, X.: A Density-Based Algorithm for Discovering Clusters in Large Spatial Databases with Noise, Proceedings of the Second International Conference on Knowledge Discovery and Data Mining, AAAI Press, 226–231, https://dl.acm.org/doi/10.5555/3001460.3001507 (last access: 24 June 2026), 1996.
Faiza, B., Yuhaniz, S. S., Hashim, S. Z. M., and AbdulRahman, K. K.: A Review and Analysis of Image Misalignment Problem in Remote Sensing, International Journal of Scientific and Engineering Research, 3, 82–86, 2012.
Fang, K., Shen, C., Kifer, D., and Yang, X.: Prolongation of SMAP to Spatiotemporally Seamless Coverage of Continental U.S, Using a Deep Learning Neural Network, Geophys. Res. Lett., 44, https://doi.org/10.1002/2017GL075619, 2017.
Flora, M. L., Potvin, C. K., Skinner, P. S., Handler, S., and McGovern, A.: Using Machine Learning to Generate Storm-Scale Probabilistic Guidance of Severe Weather Hazards in the Warn-on-Forecast System, Mon. Weather Rev., 149, 1535–1557, https://doi.org/10.1175/MWR-D-20-0194.1, 2021.
Freeman, B. S., Taylor, G., Gharabaghi, B., and Thé, J.: Forecasting air quality time series using deep learning, J. Air Waste Manage. Assoc., 68, 866–886, https://doi.org/10.1080/10962247.2018.1459956, 2018.
Fuchs, S., Keiler, M., and Zischg, A.: A spatiotemporal multi-hazard exposure assessment based on property data, Nat. Hazards Earth Syst. Sci., 15, 2127–2142, https://doi.org/10.5194/nhess-15-2127-2015, 2015.
Gallina, V., Torresan, S., Zabeo, A., Critto, A., Glade, T., and Marcomini, A.: A multi-risk methodology for the assessment of climate change impacts in coastal zones, Sustainability, 12, https://doi.org/10.3390/su12093697, 2020.
García-León, D., Masselot, P., Mistry, M. N., Gasparrini, A., Motta, C., Feyen, L., and Ciscar, J.-C.: Temperature-related mortality burden and projected change in 1368 European regions: a modelling study, The Lancet Public Health, 9, e644–e653, https://doi.org/10.1016/S2468-2667(24)00179-8, 2024.
Garg, S., Rasp, S., and Thuerey, N.: WeatherBench Probability: A benchmark dataset for probabilistic medium-range weather forecasting along with deep learning baseline models, arXiv [preprint], https://doi.org/10.48550/arXiv.2205.00865, 2022.
Garnelo, M., Schwarz, J., Rosenbaum, D., Viola, F., Rezende, D. J., Eslami, S. M. A., and Teh, Y. W.: Neural Processes, arXiv [preprint], https://doi.org/10.48550/arXiv.1807.01622, 2018.
Gasparrini, A.: Modeling exposure–lag–response associations with distributed lag non-linear models, Stat. Med., 33, 881–899, https://doi.org/10.1002/sim.5963, 2014.
Genkin, A., Lewis, D. D., and Madigan, D.: Large-Scale Bayesian Logistic Regression for Text Categorization, Technometrics, 49, 291–304, https://doi.org/10.1198/004017007000000245, 2007.
Ghaffarian, S. and Emtehani, S.: Monitoring Urban Deprived Areas with Remote Sensing and Machine Learning in Case of Disaster Recovery, Climate, 9, 58, https://doi.org/10.3390/cli9040058, 2021.
Ghaffarian, S., Taghikhah, F. R., and Maier, H. R.: Explainable artificial intelligence in disaster risk management: Achievements and prospective futures, Int. J. Disast. Risk Re., 98, 104123, https://doi.org/10.1016/j.ijdrr.2023.104123, 2023.
Ghanbari, M., Arabi, M., Kao, S., Obeysekera, J., and Sweet, W.: Climate Change and Changes in Compound Coastal-Riverine Flooding Hazard Along the U.S, Coasts, Earths Future, 9, https://doi.org/10.1029/2021EF002055, 2021.
Ghiggi, G., Humphrey, V., Seneviratne, S. I., and Gudmundsson, L.: GRUN: an observation-based global gridded runoff dataset from 1902 to 2014, Earth Syst. Sci. Data, 11, 1655–1674, https://doi.org/10.5194/essd-11-1655-2019, 2019.
Gierszewska, M. and Berezowski, T.: A physics-guided neural network for flooding area detection using SAR imagery and local river gauge observations, arXiv [preprint], https://doi.org/10.48550/arXiv.2410.08837, 2024.
Gill, J. C. and Malamud, B. D.: Reviewing and visualizing the interactions of natural hazards, Rev. Geophys., 52, 680–722, https://doi.org/10.1002/2013RG000445, 2014.
Guo, Q., Mistry, M. N., Zhou, X., Zhao, G., Kino, K., Wen, B., Yoshimura, K., Satoh, Y., Cvijanovic, I., Kim, Y., Ng, C. F. S., Vicedo-Cabrera, A. M., Armstrong, B., Urban, A., Katsouyanni, K., Masselot, P., Tong, S., Sera, F., Huber, V., Bell, M. L., Kyselý, J., Gasparrini, A., Hashizume, M., and Oki, T.: Regional variation in the role of humidity on city-level heat-related mortality, PNAS Nexus, 3, https://doi.org/10.1093/pnasnexus/pgae290, 2024.
Haer, T., Botzen, W. J. W., and Aerts, J. C. J. H.: Advancing disaster policies by integrating dynamic adaptive behaviour in risk assessments using an agent-based modelling approach, Environ. Res. Lett., 14, 044022, https://doi.org/10.1088/1748-9326/ab0770, 2019.
Haggag, M., Siam, A. S., El-Dakhakhni, W., Coulibaly, P., and Hassini, E.: A deep learning model for predicting climate-induced disasters, Nat. Hazards, 107, 1009–1034, https://doi.org/10.1007/s11069-021-04620-0, 2021.
Han, Q., Zeng, Y., Zhang, L., Wang, C., Prikaziuk, E., Niu, Z., and Su, B.: Global long term daily 1 km surface soil moisture dataset with physics informed machine learning, Scientific Data, 10, 101, https://doi.org/10.1038/s41597-023-02011-7, 2023.
Hao, Z. and Singh, V. P.: Review of dependence modeling in hydrology and water resources, Progress in Physical Geography: Earth and Environment, 40, 549–578, https://doi.org/10.1177/0309133316632460, 2016.
Harris, L., McRae, A. T. T., Chantry, M., Dueben, P. D., and Palmer, T. N.: A Generative Deep Learning Approach to Stochastic Downscaling of Precipitation Forecasts, J. Adv. Model. Earth Syst., 14, https://doi.org/10.1029/2022MS003120, 2022.
Hawkins, E. and Sutton, R.: The Potential to Narrow Uncertainty in Regional Climate Predictions, B. Am. Meteorol. Soc., 90, 1095–1108, https://doi.org/10.1175/2009BAMS2607.1, 2009.
He, X., Chaney, N. W., Schleiss, M., and Sheffield, J.: Spatial downscaling of precipitation using adaptable random forests, Water Resour. Res., 52, 8217–8237, https://doi.org/10.1002/2016WR019034, 2016.
He, X., Li, Y., Liu, S., Xu, T., Chen, F., Li, Z., Zhang, Z., Liu, R., Song, L., Xu, Z., Peng, Z., and Zheng, C.: Improving regional climate simulations based on a hybrid data assimilation and machine learning method, Hydrol. Earth Syst. Sci., 27, 1583–1606, https://doi.org/10.5194/hess-27-1583-2023, 2023.
Hoch, J. M., de Bruin, S. P., Buhaug, H., Von Uexkull, N., van Beek, R., and Wanders, N.: Projecting armed conflict risk in Africa towards 2050 along the SSP-RCP scenarios: a machine learning approach, Environ. Res. Lett., 16, 124068, https://doi.org/10.1088/1748-9326/ac3db2, 2021.
Hochrainer-Stigler, S., Balkovič, J., Silm, K., and Timonina-Farkas, A.: Large scale extreme risk assessment using copulas: an application to drought events under climate change for Austria, Computational Management Science, 16, 651–669, https://doi.org/10.1007/s10287-018-0339-4, 2019.
Huynh, N. N. T., Garambois, P.-A., Renard, B., Colleoni, F., Monnier, J., and Roux, H.: A distributed hybrid physics–AI framework for learning corrections of internal hydrological fluxes and enhancing high-resolution regionalized flood modeling, Hydrol. Earth Syst. Sci., 29, 3589–3613, https://doi.org/10.5194/hess-29-3589-2025, 2025.
Ionita, M., Caldarescu, D. E., and Nagavciuc, V.: Compound Hot and Dry Events in Europe: Variability and Large-Scale Drivers, Front. Clim., 3, https://doi.org/10.3389/fclim.2021.688991, 2021.
Islam, A. R. Md. T., Talukdar, S., Mahato, S., Ziaul, S., Eibek, K. U., Akhter, S., Pham, Q. B., Mohammadi, B., Karimi, F., and Linh, N. T. T.: Machine learning algorithm-based risk assessment of riparian wetlands in Padma River Basin of Northwest Bangladesh, Environ. Sci. Pollut. Res., 28, 34450–34471, https://doi.org/10.1007/s11356-021-12806-z, 2021.
Jain, P., Coogan, S. C. P., Subramanian, S. G., Crowley, M., Taylor, S., and Flannigan, M. D.: A review of machine learning applications in wildfire science and management, Environ. Rev., https://doi.org/10.1139/er-2020-0019, 2020.
Janizadeh, S., Chandra Pal, S., Saha, A., Chowdhuri, I., Ahmadi, K., Mirzaei, S., Mosavi, A. H., and Tiefenbacher, J. P.: Mapping the spatial and temporal variability of flood hazard affected by climate and land-use changes in the future, J. Environ. Manage., 298, 113551, https://doi.org/10.1016/j.jenvman.2021.113551, 2021.
Javidan, N., Kavian, A., Pourghasemi, H. R., Conoscenti, C., Jafarian, Z., and Rodrigo-Comino, J.: Evaluation of multi-hazard map produced using MaxEnt machine learning technique, Sci. Rep., 11, 6496, https://doi.org/10.1038/s41598-021-85862-7, 2021.
Jean, N., Burke, M., Xie, M., Davis, W. M., Lobell, D. B., and Ermon, S.: Combining satellite imagery and machine learning to predict poverty, Science, 353, 790–794, https://doi.org/10.1126/science.aaf7894, 2016.
Ji, Y., Sri Sumantyo, J., Chua, M., and Waqar, M.: Earthquake/Tsunami Damage Assessment for Urban Areas Using Post-Event PolSAR Data, Remote Sens., 10, 1088, https://doi.org/10.3390/rs10071088, 2018.
Jiang, L., Li, C., Wang, S., and Zhang, L.: Deep feature weighting for naive Bayes and its application to text classification, Eng. Appl. Artif. Intell., 52, 26–39, https://doi.org/10.1016/j.engappai.2016.02.002, 2016.
Jiang, M., Pedrielli, G., and Ng, S. H: Gaussian Processes for High-Dimensional, Large Data Sets: A Review, 2022 Winter Simulation Conference (WSC), 49–60, https://doi.org/10.1109/WSC57314.2022.10015416, 2022a.
Jiang, S., Bevacqua, E., and Zscheischler, J.: River flooding mechanisms and their changes in Europe revealed by explainable machine learning, Hydrol. Earth Syst. Sci., 26, 6339–6359, https://doi.org/10.5194/hess-26-6339-2022, 2022b.
Jiang, S., Zheng, Y., Wang, C., and Babovic, V.: Uncovering Flooding Mechanisms Across the Contiguous United States Through Interpretive Deep Learning on Representative Catchments, Water Resour. Res., 58, https://doi.org/10.1029/2021WR030185, 2022c.
Jiang, S., Sweet, L., Blougouras, G., Brenning, A., Li, W., Reichstein, M., Denzler, J., Shangguan, W., Yu, G., Huang, F., and Zscheischler, J.: How Interpretable Machine Learning Can Benefit Process Understanding in the Geosciences, Earths Future, 12, https://doi.org/10.1029/2024EF004540, 2024.
Jiang, T., Su, X., Zhang, G., Zhang, T., and Wu, H.: Estimating propagation probability from meteorological to ecological droughts using a hybrid machine learning copula method, Hydrol. Earth Syst. Sci., 27, 559–576, https://doi.org/10.5194/hess-27-559-2023, 2023.
Jiang, W., Chen, Z., Lei, X., Jia, K., and Wu, Y.: Simulating urban land use change by incorporating an autologistic regression model into a CLUE-S model, J. Geogr. Sci., 25, 836–850, https://doi.org/10.1007/s11442-015-1205-8, 2015.
Jing, W., Yang, Y., Yue, X., and Zhao, X.: A Comparison of Different Regression Algorithms for Downscaling Monthly Satellite-Based Precipitation over North China, Remote Sens., 8, 835, https://doi.org/10.3390/rs8100835, 2016a.
Jing, W., Yang, Y., Yue, X., and Zhao, X.: A Spatial Downscaling Algorithm for Satellite-Based Precipitation over the Tibetan Plateau Based on NDVI, DEM, and Land Surface Temperature, Remote Sens., 8, 655, https://doi.org/10.3390/rs8080655, 2016b.
Kabiru, P., Kuffer, M., Sliuzas, R., and Vanhuysse, S.: The relationship between multiple hazards and deprivation using open geospatial data and machine learning, Nat. Hazards, 119, 907–941, https://doi.org/10.1007/s11069-023-05897-z, 2023.
Kang, J., Jin, R., Li, X., Zhang, Y., and Zhu, Z.: Spatial Upscaling of Sparse Soil Moisture Observations Based on Ridge Regression, Remote Sens., 10, 192, https://doi.org/10.3390/rs10020192, 2018.
Karakas, G., Kocaman, S., and Gokceoglu, C.: A Hybrid Multi-Hazard Susceptibility Assessment Model for a Basin in Elazig Province, Türkiye, Int. J. Disast. Risk Sc., 14, 326–341, https://doi.org/10.1007/s13753-023-00477-y, 2023.
Kariminejad, N., Pourghasemi, H. R., and Hosseinalizadeh, M.: Analytical techniques for mapping multi-hazard with geo-environmental modeling approaches and UAV images, Sci. Rep., 12, 14946, https://doi.org/10.1038/s41598-022-18757-w, 2022.
Kashinath, K., Mustafa, M., Albert, A., Wu, J.-L., Jiang, C., Esmaeilzadeh, S., Azizzadenesheli, K., Wang, R., Chattopadhyay, A., Singh, A., Manepalli, A., Chirila, D., Yu, R., Walters, R., White, B., Xiao, H., Tchelepi, H. A., Marcus, P., Anandkumar, A., Hassanzadeh, P., and Prabhat: Physics-informed machine learning: case studies for weather and climate modelling, Philos. T. Roy. Soc. A, 379, 20200093, https://doi.org/10.1098/rsta.2020.0093, 2021.
Kazadi, A., Doss-Gollin, J., Sebastian, A., and Silva, A.: FloodGNN-GRU: a spatio-temporal graph neural network for flood prediction, Environmental Data Science, 3, e21, https://doi.org/10.1017/eds.2024.19, 2024.
Keisler, R.: Forecasting Global Weather with Graph Neural Networks, arXiv [preprint], https://doi.org/10.48550/arXiv.2202.07575, 2022.
Khan, F., Spöck, G., Liou, Y.-A., and Ali, S.: Association of precipitation extremes and crops production and projecting future extremes using machine learning approaches with CMIP6 data, Environ. Sci. Pollut. Res., 31, 54979–54999, https://doi.org/10.1007/s11356-024-34652-5, 2024.
Khatakho, R., Gautam, D., Aryal, K. R., Pandey, V. P., Rupakhety, R., Lamichhane, S., Liu, Y.-C., Abdouli, K., Talchabhadel, R., Thapa, B. R., and Adhikari, R.: Multi-Hazard Risk Assessment of Kathmandu Valley, Nepal, Sustainability, 13, 5369, https://doi.org/10.3390/su13105369, 2021.
Kim, Y., Evans, J. P., and Sharma, A.: Correcting biases in regional climate model boundary variables for improved simulation of high-impact compound events, IScience, 26, 107696, https://doi.org/10.1016/j.isci.2023.107696, 2023.
Kipf, T. N. and Welling, M.: Semi-Supervised Classification with Graph Convolutional Networks, arXiv [preprint], https://doi.org/10.48550/arXiv.1609.02907, 2016.
Koshy, R. and Elango, S.: Multimodal tweet classification in disaster response systems using transformer-based bidirectional attention model, Neural Comput. Appl., 35, 1607–1627, https://doi.org/10.1007/s00521-022-07790-5, 2023.
Kotaridis, I. and Lazaridou, M.: Integration of convolutional neural networks for flood risk mapping in Tuscany, Italy, Nat. Hazards, 114, 3409–3424, https://doi.org/10.1007/s11069-022-05525-2, 2022.
Kraft, B., Jung, M., Körner, M., Requena Mesa, C., Cortés, J., and Reichstein, M.: Identifying Dynamic Memory Effects on Vegetation State Using Recurrent Neural Networks, Frontiers in Big Data, 2, https://doi.org/10.3389/fdata.2019.00031, 2019.
Kratzert, F., Klotz, D., Brenner, C., Schulz, K., and Herrnegger, M.: Rainfall–runoff modelling using Long Short-Term Memory (LSTM) networks, Hydrol. Earth Syst. Sci., 22, 6005–6022, https://doi.org/10.5194/hess-22-6005-2018, 2018.
Kratzert, F., Klotz, D., Brandstetter, J., Hoedt, P.-J., Nearing, G., and Hochreiter, S.: Using LSTMs for climate change assessment studies on droughts and floods, arXiv [preprint], https://doi.org/10.48550/arXiv.1911.03941, 2019a.
Kratzert, F., Klotz, D., Shalev, G., Klambauer, G., Hochreiter, S., and Nearing, G.: Towards learning universal, regional, and local hydrological behaviors via machine learning applied to large-sample datasets, Hydrol. Earth Syst. Sci., 23, 5089–5110, https://doi.org/10.5194/hess-23-5089-2019, 2019b.
Kropf, C. M., Ciullo, A., Otth, L., Meiler, S., Rana, A., Schmid, E., McCaughey, J. W., and Bresch, D. N.: Uncertainty and sensitivity analysis for probabilistic weather and climate-risk modelling: an implementation in CLIMADA v.3.1.0, Geosci. Model Dev., 15, 7177–7201, https://doi.org/10.5194/gmd-15-7177-2022, 2022.
Lam, R., Sanchez-Gonzalez, A., Willson, M., Wirnsberger, P., Fortunato, M., Pritzel, A., Ravuri, S., Ewalds, T., Alet, F., Eaton-Rosen, Z., Hu, W., Merose, A., Hoyer, S., Holland, G., Stott, J., Vinyals, O., Mohamed, S., and Battaglia, P.: GraphCast: Learning skillful medium-range global weather forecasting, arXiv [preprint], https://doi.org/10.48550/arXiv.2212.12794, 2022.
Lecun, Y., Bottou, L., Bengio, Y., and Haffner, P.: Gradient-based learning applied to document recognition, P. IEEE, 86, 2278–2324, https://doi.org/10.1109/5.726791, 1998.
Lei, T., Zhang, Q., Xue, D., Chen, T., Meng, H., and Nandi, A. K.: End-to-end Change Detection Using a Symmetric Fully Convolutional Network for Landslide Mapping, ICASSP 2019 – 2019 IEEE International Conference on Acoustics, Speech and Signal Processing (ICASSP), 3027–3031, https://doi.org/10.1109/ICASSP.2019.8682802, 2019.
Leng, G. and Hall, J. W.: Predicting spatial and temporal variability in crop yields: an inter-comparison of machine learning, regression and process-based models, Environ. Res. Lett., 15, 044027, https://doi.org/10.1088/1748-9326/ab7b24, 2020.
Li, L., Qiao, J., Yu, G., Wang, L., Li, H.-Y., Liao, C., and Zhu, Z.: Interpretable tree-based ensemble model for predicting beach water quality, Water Res., 211, 118078, https://doi.org/10.1016/j.watres.2022.118078, 2022.
Liang, X., Guan, Q., Clarke, K. C., Liu, S., Wang, B., and Yao, Y.: Understanding the drivers of sustainable land expansion using a patch-generating land use simulation (PLUS) model: A case study in Wuhan, China, Computers, Environment and Urban Systems, 85, 101569, https://doi.org/10.1016/j.compenvurbsys.2020.101569, 2021.
Liao, Z., Chen, Y., Li, W., and Zhai, P.: Growing Threats From Unprecedented Sequential Flood-Hot Extremes Across China, Geophys. Res. Lett., 48, https://doi.org/10.1029/2021GL094505, 2021.
Lim, C.-H. and Kim, H.-J.: Can Forest-Related Adaptive Capacity Reduce Landslide Risk Attributable to Climate Change? – Case of Republic of Korea, Forests, 13, 49, https://doi.org/10.3390/f13010049, 2022.
Lin, H., Tang, J., Wang, S., Wang, S., and Dong, G.: Deep learning downscaled high-resolution daily near surface meteorological datasets over East Asia, Scientific Data, 10, 890, https://doi.org/10.1038/s41597-023-02805-9, 2023.
Ling, F., Lu, Z., Luo, J.-J., Bai, L., Behera, S. K., Jin, D., Pan, B., Jiang, H., and Yamagata, T.: Diffusion model-based probabilistic downscaling for 180-year East Asian climate reconstruction, Npj Clim. Atmos. Sci., 7, 131, https://doi.org/10.1038/s41612-024-00679-1, 2024.
Linkov, I., Trump, B., Trump, J., Pescaroli, G., Mavrodieva, A., and Panda, A.: Stress-test the resilience of critical infrastructure, Nature, 603, 578–578, https://doi.org/10.1038/d41586-022-00784-2, 2022.
Liu, G., Gao, Z., Chen, B., Fu, H., Jiang, S., Wang, L., Wang, G., and Chen, Z.: Extreme values of storm surge elevation in Hangzhou Bay, Ships Offshore Struc., 15, 431–442, https://doi.org/10.1080/17445302.2019.1661618, 2020.
Liu, G., Yang, B., Nong, X., Kou, Y., Wu, F., Zhao, D., and Yu, P.: Risk Level Assessment of Typhoon Hazard Based on Loss Utility, Journal of Marine Science and Engineering, 11, 2177, https://doi.org/10.3390/jmse11112177, 2023a.
Liu, J., Qiu, Z., Feng, J., Wong, K. P., Tsou, J. Y., Wang, Y., and Zhang, Y.: Monitoring Total Suspended Solids and Chlorophyll-a Concentrations in Turbid Waters: A Case Study of the Pearl River Estuary and Coast Using Machine Learning, Remote Sens., 15, 5559, https://doi.org/10.3390/rs15235559, 2023b.
Liu, K., Wang, M., Cao, Y., Zhu, W., and Yang, G.: Susceptibility of existing and planned Chinese railway system subjected to rainfall-induced multi-hazards, Transport. Res. A-Pol., 117, 214–226, https://doi.org/10.1016/j.tra.2018.08.030, 2018a.
Liu, X., Guo, H., Lin, Y., Li, Y., and Hou, J.: Analyzing Spatial-Temporal Distribution of Natural Hazards in China by Mining News Sources, Nat. Hazards Rev., 19, https://doi.org/10.1061/(ASCE)NH.1527-6996.0000291, 2018b.
Liu, Y., Racah, E., Prabhat, Correa, J., Khosrowshahi, A., Lavers, D., Kunkel, K., Wehner, M., and Collins, W.: Application of Deep Convolutional Neural Networks for Detecting Extreme Weather in Climate Datasets, arXiv [preprint], https://doi.org/10.48550/arXiv.1605.01156, 2016.
Lütjens, B., Crawford, C. H., Veillette, M., and Newman, D.: PCE-PINNs: Physics-Informed Neural Networks for Uncertainty Propagation in Ocean Modeling, arXiv [preprint], https://doi.org/10.48550/arXiv.2105.02939, 2021.
Luu, C., Forino, G., Yorke, L., Ha, H., Bui, Q. D., Tran, H. H., Nguyen, D. Q., Duong, H. C., and Kervyn, M.: Integrating susceptibility maps of multiple hazards and building exposure distribution: a case study of wildfires and floods for the province of Quang Nam, Vietnam, Nat. Hazards Earth Syst. Sci., 24, 4385–4408, https://doi.org/10.5194/nhess-24-4385-2024, 2024.
Macdonald, E., Tubaldi, E., and Patelli, E.: Robust storm surge forecasts for early warning system: a machine learning approach using Monte Carlo Bayesian model selection algorithm, Stoch. Env. Res. Risk A., 39, 2789–2816, https://doi.org/10.1007/s00477-025-02993-3, 2025.
Mandal, P., Maiti, A., Paul, S., Bhattacharya, S., and Paul, S.: Mapping the multi-hazards risk index for coastal block of Sundarban, India using AHP and machine learning algorithms, Tropical Cyclone Research and Review, 11, 225–243, https://doi.org/10.1016/j.tcrr.2023.03.001, 2022.
Mattei, G., Di Luccio, D., Benassai, G., Anfuso, G., Budillon, G., and Aucelli, P.: Characteristics and coastal effects of a destructive marine storm in the Gulf of Naples (southern Italy), Nat. Hazards Earth Syst. Sci., 21, 3809–3825, https://doi.org/10.5194/nhess-21-3809-2021, 2021.
McGovern, A., Lagerquist, R., John Gagne, D., Jergensen, G. E., Elmore, K. L., Homeyer, C. R., and Smith, T.: Making the Black Box More Transparent: Understanding the Physical Implications of Machine Learning, B. Am. Meteorol. Soc., 100, 2175–2199, https://doi.org/10.1175/BAMS-D-18-0195.1, 2019.
McGovern, A., Ebert-Uphoff, I., Gagne, D. J., and Bostrom, A.: Why we need to focus on developing ethical, responsible, and trustworthy artificial intelligence approaches for environmental science, Environmental Data Science, 1, e6, https://doi.org/10.1017/eds.2022.5, 2022.
Mehrotra, H., Mishra, A., and Pal, S.: A Multi-stage Classification Framework for Disaster-Specific Tweets, SN Computer Science, 3, 24, https://doi.org/10.1007/s42979-021-00930-z, 2022.
Miyoshi, G. T., Arruda, M. dos S., Osco, L. P., Marcato Junior, J., Gonçalves, D. N., Imai, N. N., Tommaselli, A. M. G., Honkavaara, E., and Gonçalves, W. N.: A Novel Deep Learning Method to Identify Single Tree Species in UAV-Based Hyperspectral Images, Remote Sens., 12, 1294, https://doi.org/10.3390/rs12081294, 2020.
Moezzi, M., Janda, K. B., and Rotmann, S.: Using stories, narratives, and storytelling in energy and climate change research, Energy Research and Social Science, 31, 1–10, https://doi.org/10.1016/j.erss.2017.06.034, 2017.
Mukherjee, S., Nateghi, R., and Hastak, M.: A multi-hazard approach to assess severe weather-induced major power outage risks in the U.S, Reliab. Eng. Syst. Safe., 175, 283–305, https://doi.org/10.1016/j.ress.2018.03.015, 2018.
Munawar, H. S., Ullah, F., Qayyum, S., Khan, S. I., and Mojtahedi, M.: UAVs in Disaster Management: Application of Integrated Aerial Imagery and Convolutional Neural Network for Flood Detection, Sustainability, 13, 7547, https://doi.org/10.3390/su13147547, 2021.
Nam, J., Kim, J., Loza Mencía, E., Gurevych, I., and Fürnkranz, J.: Large-Scale Multi-label Text Classification – Revisiting Neural Networks, Proceedings ECML/PKDD, 437–452, https://doi.org/10.1007/978-3-662-44851-9_28, 2014.
Naudé, W. and Vinuesa, R.: Data Deprivations, Data Gaps and Digital Divides: Lessons from the COVID-19 Pandemic, Big Data and Society, 8, 20539517211025545, https://doi.org/10.1177/20539517211025545, 2021.
Nazeer, M., Bilal, M., Alsahli, M., Shahzad, M., and Waqas, A.: Evaluation of Empirical and Machine Learning Algorithms for Estimation of Coastal Water Quality Parameters, ISPRS Int. Geo-Inf., 6, 360, https://doi.org/10.3390/ijgi6110360, 2017.
Nelsen, R.: An Introduction to Copulas, Springer New York, https://doi.org/10.1007/0-387-28678-0, 2006.
Nguyen, H. D., Dang, D., Bui, Q., and Petrisor, A.: Multi-hazard assessment using machine learning and remote sensing in the North Central region of Vietnam, T. GIS, 27, 1614–1640, https://doi.org/10.1111/tgis.13091, 2023.
Nguyen, M., Wilson, M., Lane, E., Brasington, J., and Pearson, R.: Estimating uncertainty in flood model outputs using machine learning informed by Monte Carlo analysis, 2024 International Conference on Machine Intelligence for GeoAnalytics and Remote Sensing (MIGARS), 1–3, https://doi.org/10.1109/MIGARS61408.2024.10544837, 2024.
Novellino, A., Pennington, C., Leeming, K., Taylor, S., Alvarez, I. G., McAllister, E., Arnhardt, C., and Winson, A.: Mapping landslides from space: A review, Landslides, 21, 1041–1052, https://doi.org/10.1007/s10346-024-02215-x, 2024.
O, S. and Orth, R.: Global soil moisture data derived through machine learning trained with in-situ measurements, Scientific Data, 8, 170, https://doi.org/10.1038/s41597-021-00964-1, 2021.
O'Dea, R. E., Lagisz, M., Jennions, M. D., Koricheva, J., Noble, D. W. A., Parker, T. H., Gurevitch, J., Page, M. J., Stewart, G., Moher, D., and Nakagawa, S.: Preferred reporting items for systematic reviews and meta-analyses in ecology and evolutionary biology: a PRISMA extension, Biol. Rev., 96, 1695–1722, https://doi.org/10.1111/brv.12721, 2021.
Oh, D. H. and Patton, A. J.: Modelling Dependence in High Dimensions with Factor Copulas, Finance and Economics Discussion Series, 2015.0, 1–41, https://doi.org/10.17016/feds.2015.051, 2015.
Orth, R., O, S., Zscheischler, J., Mahecha, M. D., and Reichstein, M.: Contrasting biophysical and societal impacts of hydro-meteorological extremes, Environ. Res. Lett., 17, 014044, https://doi.org/10.1088/1748-9326/ac4139, 2022.
Pan, S. J. and Yang, Q.: A Survey on Transfer Learning, IEEE T. Knowl. Data En., 22, 1345–1359, https://doi.org/10.1109/TKDE.2009.191, 2010.
Pan, Y., Zeng, X., Xu, H., Sun, Y., Wang, D., and Wu, J.: Evaluation of Gaussian process regression kernel functions for improving groundwater prediction, J. Hydrol., 603, 126960, https://doi.org/10.1016/j.jhydrol.2021.126960, 2021.
Park, S., Sohn, W., Piao, Y., and Lee, D.: Adaptation strategies for future coastal flooding: Performance evaluation of green and grey infrastructure in South Korea, J. Environ. Manage., 334, 117495, https://doi.org/10.1016/j.jenvman.2023.117495, 2023.
Park, S. J. and Lee, D. K.: Prediction of coastal flooding risk under climate change impacts in South Korea using machine learning algorithms, Environ. Res. Lett., 15, https://doi.org/10.1088/1748-9326/ABA5B3, 2020.
Patil, K. R., Doi, T., and Behera, S. K.: Predicting extreme floods and droughts in East Africa using a deep learning approach, Npj Clim. Atmos. Sci., 6, 108, https://doi.org/10.1038/s41612-023-00435-x, 2023.
Pescaroli, G. and Alexander, D.: Understanding Compound, Interconnected, Interacting, and Cascading Risks: A Holistic Framework, Risk Anal., 38, 2245–2257, https://doi.org/10.1111/risa.13128, 2018.
Pham, H. V., Dal Barco, M. K., Cadau, M., Harris, R., Furlan, E., Torresan, S., Rubinetti, S., Zanchettin, D., Rubino, A., Kuznetsov, I., Barbariol, F., Benetazzo, A., Sclavo, M., and Critto, A.: Multi-model chain for climate change scenario analysis to support coastal erosion and water quality risk management for the Metropolitan city of Venice, Sci. Total Environ., 904, 166310, https://doi.org/10.1016/j.scitotenv.2023.166310, 2023.
Piao, Y., Lee, D., Park, S., Kim, H. G., and Jin, Y.: Multi-hazard mapping of droughts and forest fires using a multi-layer hazards approach with machine learning algorithms, Geomatics, Natural Hazards and Risk, 13, 2649–2673, https://doi.org/10.1080/19475705.2022.2128440, 2022.
Pilkington, S. and Mahmoud, H.: Spatial and temporal variations in resilience to tropical cyclones along the United States coastline as determined by the multi-hazard hurricane impact level model, Palgrave Communications, 3, 14, https://doi.org/10.1057/s41599-017-0016-1, 2017.
Pourghasemi, H. R., Gayen, A., Panahi, M., Rezaie, F., and Blaschke, T.: Multi-hazard probability assessment and mapping in Iran, Sci. Total Environ., 692, 556–571, https://doi.org/10.1016/j.scitotenv.2019.07.203, 2019.
Pourghasemi, H. R., Kariminejad, N., Amiri, M., Edalat, M., Zarafshar, M., Blaschke, T., and Cerda, A: Assessing and mapping multi-hazard risk susceptibility using a machine learning technique, Sci. Rep., 10, 3203, https://doi.org/10.1038/s41598-020-60191-3, 2020.
Pouyan, S., Pourghasemi, H. R., Bordbar, M., Rahmanian, S., and Clague, J. J.: A multi-hazard map-based flooding, gully erosion, forest fires, and earthquakes in Iran, Sci. Rep., 11, 14889, https://doi.org/10.1038/s41598-021-94266-6, 2021.
Powers, C. J., Devaraj, A., Ashqeen, K., Dontula, A., Joshi, A., Shenoy, J., and Murthy, D.: Using artificial intelligence to identify emergency messages on social media during a natural disaster: A deep learning approach, International Journal of Information Management Data Insights, 3, 100164, https://doi.org/10.1016/j.jjimei.2023.100164, 2023.
Qiang, Y., Huang, Q., and Xu, J.: Observing community resilience from space: Using nighttime lights to model economic disturbance and recovery pattern in natural disaster, Sustain. Cities Soc., 57, 102115, https://doi.org/10.1016/j.scs.2020.102115, 2020.
Racah, E., Beckham, C., Maharaj, T., Kahou, S. E., Prabhat, and Pal, C.: ExtremeWeather: A large-scale climate dataset for semi-supervised detection, localization, and understanding of extreme weather events, arXiv [preprint], https://doi.org/10.48550/arXiv.1612.02095, 2016.
Rahman, M., Shufeng, T., Tumon, M. S. H., Hossain, M. A., Kim, H.-J., Islam, M. M., Alam, M., Sadiq, S., Ningsheng, C., Ullah, K., Zafor, M. A., and Raju, M. R.: Multi-hazard could exacerbate in coastal Bangladesh in the context of climate change, J. Clean. Prod., 457, 142289, https://doi.org/10.1016/j.jclepro.2024.142289, 2024.
Ray, K., Giri, R. K., Ray, S. S., Dimri, A. P., and Rajeevan, M.: An assessment of long-term changes in mortalities due to extreme weather events in India: A study of 50 years' data, 1970–2019, Weather and Climate Extremes, 32, 100315, https://doi.org/10.1016/j.wace.2021.100315, 2021.
Read, J. S., Jia, X., Willard, J., Appling, A. P., Zwart, J. A., Oliver, S. K., Karpatne, A., Hansen, G. J. A., Hanson, P. C., Watkins, W., Steinbach, M., and Kumar, V.: Process-Guided Deep Learning Predictions of Lake Water Temperature, Water Resour. Res., 55, 9173–9190, https://doi.org/10.1029/2019WR024922, 2019.
Reichstein, M., Camps-Valls, G., Stevens, B., Jung, M., Denzler, J., Carvalhais, N., and Prabhat: Deep learning and process understanding for data-driven Earth system science, Nature, 566, 195–204, https://doi.org/10.1038/s41586-019-0912-1, 2019.
Reichstein, M., Benson, V., Blunk, J., Camps-Valls, G., Creutzig, F., Fearnley, C. J., Han, B., Kornhuber, K., Rahaman, N., Schölkopf, B., Tárraga, J. M., Vinuesa, R., Dall, K., Denzler, J., Frank, D., Martini, G., Nganga, N., Maddix, D. C., and Weldemariam, K.: Early warning of complex climate risk with integrated artificial intelligence, Nat. Commun., 16, 2564, https://doi.org/10.1038/s41467-025-57640-w, 2025.
Ribeiro, A. F. S., Russo, A., Gouveia, C. M., Páscoa, P., and Zscheischler, J.: Risk of crop failure due to compound dry and hot extremes estimated with nested copulas, Biogeosciences, 17, 4815–4830, https://doi.org/10.5194/bg-17-4815-2020, 2020.
Ridder, N. N., Pitman, A. J., and Ukkola, A. M.: Do CMIP6 Climate Models Simulate Global or Regional Compound Events Skillfully?, Geophys. Res. Lett., 48, https://doi.org/10.1029/2020GL091152, 2021.
Ridder, N. N., Ukkola, A. M., Pitman, A. J., and Perkins-Kirkpatrick, S. E.: Increased occurrence of high impact compound events under climate change, Npj Clim. Atmos. Sci., 5, 3, https://doi.org/10.1038/s41612-021-00224-4, 2022.
Rolnick, D., Donti, P. L., Kaack, L. H., Kochanski, K., Lacoste, A., Sankaran, K., Ross, A. S., Milojevic-Dupont, N., Jaques, N., Waldman-Brown, A., Luccioni, A., Maharaj, T., Sherwin, E. D., Mukkavilli, S. K., Kording, K. P., Gomes, C., Ng, A. Y., Hassabis, D., Platt, J. C., Creutzig, F., Chayes, J., and Bengio, Y.: Tackling Climate Change with Machine Learning, arXiv [preprint], https://doi.org/10.48550/arXiv.1906.05433, 2019.
Rusk, J., Maharjan, A., Tiwari, P., Chen, T.-H. K., Shneiderman, S., Turin, M., and Seto, K. C.: Multi-hazard susceptibility and exposure assessment of the Hindu Kush Himalaya, Sci. Total Environ., 804, 150039, https://doi.org/10.1016/j.scitotenv.2021.150039, 2022.
Sadegh, M., Ragno, E., and AghaKouchak, A.: Multivariate Copula Analysis Toolbox (MvCAT): Describing dependence and underlying uncertainty using a Bayesian framework, Water Resour. Res., 53, 5166–5183, https://doi.org/10.1002/2016WR020242, 2017.
Sagan, V., Peterson, K. T., Maimaitijiang, M., Sidike, P., Sloan, J., Greeling, B. A., Maalouf, S., and Adams, C.: Monitoring inland water quality using remote sensing: potential and limitations of spectral indices, bio-optical simulations, machine learning, and cloud computing, Earth-Sci. Rev., 205, 103187, https://doi.org/10.1016/j.earscirev.2020.103187, 2020.
Saha, A. and Ravela, S.: Downscaling Extreme Rainfall Using Physical-Statistical Generative Adversarial Learning, arXiv [preprint], https://doi.org/10.48550/arXiv.2212.01446, 2022.
Saha, A., Pal, S. C., Santosh, M., Janizadeh, S., Chowdhuri, I., Norouzi, A., Roy, P., and Chakrabortty, R.: Modelling multi-hazard threats to cultural heritage sites and environmental sustainability: The present and future scenarios, J. Clean. Prod., 320, 128713, https://doi.org/10.1016/j.jclepro.2021.128713, 2021.
Šakić Trogrlić, R., Reiter, K., Ciurean, R. L., Gottardo, S., Torresan, S., Daloz, A. S., Ma, L., Padrón Fumero, N., Tatman, S., Hochrainer-Stigler, S., de Ruiter, M. C., Schlumberger, J., Harris, R., Garcia-Gonzalez, S., García-Vaquero, M., Arévalo, T. L. F., Hernandez-Martin, R., Mendoza-Jimenez, J., Ferrario, D. M. Geurts, D., Stuparu, D., Tiggeloven, T., Duncan, M. J., and Ward, P. J.: Challenges in assessing and managing multi-hazard risks: A European stakeholders perspective, Environ. Sci. Policy, 157, 103774, https://doi.org/10.1016/j.envsci.2024.103774, 2024.
Salcedo-Sanz, S., Pérez-Aracil, J., Ascenso, G., Del Ser, J., Casillas-Pérez, D., Kadow, C., Fister, D., Barriopedro, D., García-Herrera, R., Restelli, M., Giuliani, M., and Castelletti, A.: Analysis, Characterization, Prediction and Attribution of Extreme Atmospheric Events with Machine Learning: a Review, arXiv [preprint], https://doi.org/10.48550/arXiv.2207.07580, 2022.
Sammonds, P., Alam, A., Day, S., Stavrianaki, K., and Kelman, I.: Hurricane risk assessment in a multi-hazard context for Dominica in the Caribbean, Sci. Rep., 13, 20565, https://doi.org/10.1038/s41598-023-47527-5, 2023.
Sarkis-Onofre, R., Catalá-López, F., Aromataris, E., and Lockwood, C.: How to properly use the PRISMA Statement, Systematic Reviews, 10, 117, https://doi.org/10.1186/s13643-021-01671-z, 2021.
Schiefer, F., Kattenborn, T., Frick, A., Frey, J., Schall, P., Koch, B., and Schmidtlein, S.: Mapping forest tree species in high resolution UAV-based RGB-imagery by means of convolutional neural networks, ISPRS J. Photogramm., 170, 205–215, https://doi.org/10.1016/j.isprsjprs.2020.10.015, 2020.
Schmidt, H., Radinger, J., Teschlade, D., and Stoll, S.: The role of spatial units in modelling freshwater fish distributions: Comparing a subcatchment and river network approach using MaxEnt, Ecol. Model., 418, 108937, https://doi.org/10.1016/j.ecolmodel.2020.108937, 2020.
Schneider, T., Behera, S., Boccaletti, G., Deser, C., Emanuel, K., Ferrari, R., Leung, L. R., Lin, N., Müller, T., Navarra, A., Ndiaye, O., Stuart, A., Tribbia, J., and Yamagata, T.: Harnessing AI and computing to advance climate modelling and prediction, Nat. Clim. Change, 13, 887–889, https://doi.org/10.1038/s41558-023-01769-3, 2023.
Sfetsos, A., Politi, N., and Vlachogiannis, D.: Multi-Hazard Extreme Scenario Quantification Using Intensity, Duration, and Return Period Characteristics, Climate, 11, 242, https://doi.org/10.3390/cli11120242, 2023.
Shah, K., Patel, H., Sanghvi, D., and Shah, M.: A Comparative Analysis of Logistic Regression, Random Forest and KNN Models for the Text Classification, Augmented Human Research, 5, 12, https://doi.org/10.1007/s41133-020-00032-0, 2020.
Shepherd, T. G., Boyd, E., Calel, R. A., Chapman, S. C., Dessai, S., Dima-West, I. M., Fowler, H. J., James, R., Maraun, D., Martius, O., Senior, C. A., Sobel, A. H., Stainforth, D. A., Tett, S. F. B., Trenberth, K. E., van den Hurk, B. J. J. M., Watkins, N. W., Wilby, R. L., and Zenghelis, D. A.: Storylines: an alternative approach to representing uncertainty in physical aspects of climate change, Climatic Change, 151, 555–571, https://doi.org/10.1007/s10584-018-2317-9, 2018.
Siddique, T., Mahmud, M., Keesee, A., Ngwira, C., and Connor, H.: A Survey of Uncertainty Quantification in Machine Learning for Space Weather Prediction, Geosciences, 12, 27, https://doi.org/10.3390/geosciences12010027, 2022.
Sillmann, J., Shepherd, T. G., van den Hurk, B., Hazeleger, W., Martius, O., Slingo, J., and Zscheischler, J.: Event-Based Storylines to Address Climate Risk, Earths Future, 9, https://doi.org/10.1029/2020EF001783, 2021.
Simpson, E. S., Wadsworth, J. L., and Tawn, J. A.: A geometric investigation into the tail dependence of vine copulas, J. Multivariate Anal., https://doi.org/10.1016/j.jmva.2021.104736, 2020.
Singh, T. P., Nandimath, P., Kumbhar, V., Das, S., and Barne, P.: Drought risk assessment and prediction using artificial intelligence over the southern Maharashtra state of India, Modeling Earth Systems and Environment, 7, 2005–2013, https://doi.org/10.1007/s40808-020-00947-y, 2021.
Sippel, S., Otto, F. E. L., Forkel, M., Allen, M. R., Guillod, B. P., Heimann, M., Reichstein, M., Seneviratne, S. I., Thonicke, K., and Mahecha, M. D.: A novel bias correction methodology for climate impact simulations, Earth Syst. Dynam., 7, 71–88, https://doi.org/10.5194/esd-7-71-2016, 2016.
Sit, M., Demiray, B. Z., Xiang, Z., Ewing, G. J., Sermet, Y., and Demir, I.: A comprehensive review of deep learning applications in hydrology and water resources, Water Sci. Technol., 82, 2635–2670, https://doi.org/10.2166/wst.2020.369, 2020.
Sodoge, J., Kuhlicke, C., and de Brito, M. M.: Automatized spatio-temporal detection of drought impacts from newspaper articles using natural language processing and machine learning, Weather and Climate Extremes, 41, 100574, https://doi.org/10.1016/j.wace.2023.100574, 2023.
Sperotto, A., Molina, J. L., Torresan, S., Critto, A., and Marcomini, A.: Reviewing Bayesian Networks potentials for climate change impacts assessment and management: A multi-risk perspective, J. Environ. Manage., 202, 320–331, https://doi.org/10.1016/j.jenvman.2017.07.044, 2017.
Stolte, T. R., Koks, E. E., de Moel, H., Reimann, L., van Vliet, J., de Ruiter, M. C., and Ward, P. J.: VulneraCity – drivers and dynamics of urban vulnerability based on a global systematic literature review, Int. J. Disast. Risk Re., 108, 104535, https://doi.org/10.1016/j.ijdrr.2024.104535, 2024.
Sublime, J. and Kalinicheva, E.: Automatic Post-Disaster Damage Mapping Using Deep-Learning Techniques for Change Detection: Case Study of the Tohoku Tsunami, Remote Sens., 11, 1123, https://doi.org/10.3390/rs11091123, 2019.
Sun, A. Y., Jiang, P., Mudunuru, M. K., and Chen, X.: Explore Spatio-Temporal Learning of Large Sample Hydrology Using Graph Neural Networks, Water Resour. Res., 57, https://doi.org/10.1029/2021WR030394, 2021.
Sun, X., Sun, Q., Zhou, X., Li, X., Yang, M., Yu, A., and Geng, F.: Heat wave impact on mortality in Pudong New Area, China in 2013, Sci. Total Environ., 493, 789–794, https://doi.org/10.1016/j.scitotenv.2014.06.042, 2014.
Sutanto, S. J., Vitolo, C., Di Napoli, C., D'Andrea, M., and Van Lanen, H. A. J.: Heatwaves, droughts, and fires: Exploring compound and cascading dry hazards at the pan-European scale, Environ. Int., 134, 105276, https://doi.org/10.1016/j.envint.2019.105276, 2020.
Sweet, L., Müller, C., Anand, M., and Zscheischler, J.: Cross-Validation Strategy Impacts the Performance and Interpretation of Machine Learning Models, Artificial Intelligence for the Earth Systems, 2, https://doi.org/10.1175/AIES-D-23-0026.1, 2023.
Tabari, H. and Willems, P.: Global risk assessment of compound hot-dry events in the context of future climate change and socioeconomic factors, Npj Clim. Atmos. Sci., 6, 74, https://doi.org/10.1038/s41612-023-00401-7, 2023.
Tárraga, J. M., Sevillano-Marco, E., Muñoz-Marí, J., Piles, M., Sitokonstantinou, V., Ronco, M., Miranda, M. T., Cerdà, J., and Camps-Valls, G.: Causal discovery reveals complex patterns of drought-induced displacement, IScience, 27, 110628, https://doi.org/10.1016/j.isci.2024.110628, 2024.
Tazi, K., Lin, J. A., Viljoen, R., Gardner, A., John, S., Ge, H., and Turner, R. E.: Beyond intuition, a Framework for Applying GPs to Real-World Data, ICML Workshop on Structured Probabilistic Inference and Generative Modelling, arXiv [preprint], https://doi.org/10.48550/arXiv.2307.03093, 2023.
Tazi, K., Orr, A., Hernandez-González, J., Hosking, S., and Turner, R. E.: Downscaling precipitation over High-mountain Asia using multi-fidelity Gaussian processes: improved estimates from ERA5, Hydrol. Earth Syst. Sci., 28, 4903–4925, https://doi.org/10.5194/hess-28-4903-2024, 2024.
Teichert, N., Borja, A., Chust, G., Uriarte, A., and Lepage, M.: Restoring fish ecological quality in estuaries: Implication of interactive and cumulative effects among anthropogenic stressors, Sci. Total Environ., 542, 383–393, https://doi.org/10.1016/j.scitotenv.2015.10.068, 2016.
Terzi, S., Torresan, S., Schneiderbauer, S., Critto, A., Zebisch, M., and Marcomini, A.: Multi-risk assessment in mountain regions: A review of modelling approaches for climate change adaptation, J. Environ. Manage., 232, 759–771, https://doi.org/10.1016/j.jenvman.2018.11.100, 2019.
Tiggeloven, T., Couasnon, A., van Straaten, C., Muis, S., and Ward, P. J.: Exploring deep learning capabilities for surge predictions in coastal areas, Sci. Rep., 11, 17224, https://doi.org/10.1038/s41598-021-96674-0, 2021.
Tiggeloven, T., Pfeiffer, S., Matanó, A., van den Homberg, M., Thalheimer, L., Reichstein, M., and Torresan, S.: The Role of Artificial Intelligence for Early Warning Systems: Status, Applicability, Guardrails, and Ways Forward, iScience, 28, https://doi.org/10.1016/j.isci.2025.113689, 2025.
Tilloy, A., Malamud, B. D., Winter, H., and Joly-Laugel, A.: A review of quantification methodologies for multi-hazard interrelationships, Earth-Sci. Rev., 196, 102881, https://doi.org/10.1016/j.earscirev.2019.102881, 2019.
Tilloy, A., Malamud, B. D., and Joly-Laugel, A.: A methodology for the spatiotemporal identification of compound hazards: wind and precipitation extremes in Great Britain (1979–2019), Earth Syst. Dynam., 13, 993–1020, https://doi.org/10.5194/esd-13-993-2022, 2022.
Tootoonchi, F., Sadegh, M., Haerter, J. O., Räty, O., Grabs, T., and Teutschbein, C.: Copulas for hydroclimatic analysis: A practice-oriented overview, WIREs Water, 9, https://doi.org/10.1002/wat2.1579, 2022.
Tran, D. Q., Park, M., Jung, D., and Park, S.: Damage-Map Estimation Using UAV Images and Deep Learning Algorithms for Disaster Management System, Remote Sens., 12, 4169, https://doi.org/10.3390/rs12244169, 2020.
Tripathy, K. P. and Mishra, A. K., Deep learning in hydrology and water resources disciplines: Concepts, methods, applications, and research directions, J. Hydrol., 628, 130458, https://doi.org/10.1016/j.jhydrol.2023.130458, 2024.
Ullah, K., Wang, Y., Fang, Z., Wang, L., and Rahman, M.: Multi-hazard susceptibility mapping based on Convolutional Neural Networks, Geosci. Front., 13, 101425, https://doi.org/10.1016/j.gsf.2022.101425, 2022.
UNDRR: UNDRR Annual Report 2019, https://www.undrr.org/publication/undrr-annual-report-2019 (last access: 24 June 2026), 2020.
Vaswani, A., Shazeer, N., Parmar, N., Uszkoreit, J., Jones, L., Gomez, A. N., Kaiser, L., and Polosukhin, I.: Attention Is All You Need, arXiv [preprint], https://doi.org/10.48550/arXiv.1706.03762, 2017.
Veličković, P., Cucurull, G., Casanova, A., Romero, A., Liò, P., and Bengio, Y.: Graph Attention Networks, arXiv [preprint], https://doi.org/10.48550/arXiv.1710.10903, 2017.
Veras, H. F. P., Ferreira, M. P., da Cunha Neto, E. M., Figueiredo, E. O., Corte, A. P. D., and Sanquetta, C. R.: Fusing multi-season UAS images with convolutional neural networks to map tree species in Amazonian forests, Ecol. Inform., 71, 101815, https://doi.org/10.1016/j.ecoinf.2022.101815, 2022.
Wang, J.: An Intuitive Tutorial to Gaussian Process Regression, Comput. Sci. Eng., 25, 4–11, https://doi.org/10.1109/MCSE.2023.3342149, 2023.
Wang, J. and Yan, Z.: Rapid rises in the magnitude and risk of extreme regional heat wave events in China, Weather and Climate Extremes, 34, 100379, https://doi.org/10.1016/j.wace.2021.100379, 2021.
Wang, J., Kuffer, M., Roy, D., and Pfeffer, K.: Deprivation pockets through the lens of convolutional neural networks, Remote Sens. Environ., 234, 111448, https://doi.org/10.1016/j.rse.2019.111448, 2019a.
Wang, Q., Zhang, X., Chen, G., Dai, F., Gong, Y., and Zhu, K.: Change detection based on Faster R-CNN for high-resolution remote sensing images, Remote Sens. Lett., 9, 923–932, https://doi.org/10.1080/2150704X.2018.1492172, 2018.
Wang, R., Kim, J.-H., and Li, M.-H.: Predicting stream water quality under different urban development pattern scenarios with an interpretable machine learning approach, Sci. Total Environ., 761, 144057, https://doi.org/10.1016/j.scitotenv.2020.144057, 2021a.
Wang, X., Ma, Z., and Dong, J.: Quantitative Impact Analysis of Climate Change on Residents' Health Conditions with Improving Eco-Efficiency in China: A Machine Learning Perspective, Int. J. Env. Res. Pub. He., 18, 12842, https://doi.org/10.3390/ijerph182312842, 2021b.
Wang, Y., Song, Q., Du, Y., Wang, J., Zhou, J., Du, Z., and Li, T.: A random forest model to predict heatstroke occurrence for heatwave in China, Sci. Total Environ., 650, 3048–3053, https://doi.org/10.1016/j.scitotenv.2018.09.369, 2019b.
Ward, P. J., Daniell, J., Duncan, M., Dunne, A., Hananel, C., Hochrainer-Stigler, S., Tijssen, A., Torresan, S., Ciurean, R., Gill, J. C., Sillmann, J., Couasnon, A., Koks, E., Padrón-Fumero, N., Tatman, S., Tronstad Lund, M., Adesiyun, A., Aerts, J. C. J. H., Alabaster, A., Bulder, B., Campillo Torres, C., Critto, A., Hernández-Martín, R., Machado, M., Mysiak, J., Orth, R., Palomino Antolín, I., Petrescu, E.-C., Reichstein, M., Tiggeloven, T., Van Loon, A. F., Vuong Pham, H., and de Ruiter, M. C.: Invited perspectives: A research agenda towards disaster risk management pathways in multi-(hazard-)risk assessment, Nat. Hazards Earth Syst. Sci., 22, 1487–1497, https://doi.org/10.5194/nhess-22-1487-2022, 2022.
Willard, J., Jia, X., Xu, S., Steinbach, M., and Kumar, V.: Integrating Scientific Knowledge with Machine Learning for Engineering and Environmental Systems, arXiv [preprint], https://doi.org/10.48550/arXiv.2003.04919, 2022.
Wu, H., Su, X., and Singh, V. P.: Increasing Risks of Future Compound Climate Extremes With Warming Over Global Land Masses, Earths Future, 11, https://doi.org/10.1029/2022EF003466, 2023.
Wu, H., Su, X., Singh, V. P., and Niu, J.: Predicting compound agricultural drought and hot events using a Cascade Modeling framework combining Bayesian Model Averaging ensemble with Vine Copula (CaMBMAViC), J. Hydrol., 642, 131901, https://doi.org/10.1016/j.jhydrol.2024.131901, 2024.
Wu, Q. and Lin, H.: A novel optimal-hybrid model for daily air quality index prediction considering air pollutant factors, Sci. Total Environ., 683, 808–821, https://doi.org/10.1016/j.scitotenv.2019.05.288, 2019.
Wubalem, A.: Landslide Inventory, Susceptibility, Hazard and Risk Mapping, In Landslides, IntechOpen, https://doi.org/10.5772/intechopen.100504, 2022.
Xu, L., Chen, N., Yang, C., Yu, H., and Chen, Z.: Quantifying the uncertainty of precipitation forecasting using probabilistic deep learning, Hydrol. Earth Syst. Sci., 26, 2923–2938, https://doi.org/10.5194/hess-26-2923-2022, 2022.
Ya, R., Wu, J., Tang, R., and Zhou, Q.: Increased flood susceptibility in the Tibetan Plateau with climate and land use changes, Ecol. Indic., 156, 111086, https://doi.org/10.1016/j.ecolind.2023.111086, 2023.
Yeğin, M. N. and Amasyalı, M. F: Theoretical research on generative diffusion models: an overview, Neurocomputing, 608, 128373, https://doi.org/10.1016/j.neucom.2024.128373, 2024.
Yousefi, S., Pourghasemi, H. R., Emami, S. N., Pouyan, S., Eskandari, S., and Tiefenbacher, J. P.: A machine learning framework for multi-hazards modeling and mapping in a mountainous area, Sci. Rep., 10, 1–14, https://doi.org/10.1038/s41598-020-69233-2, 2020.
Yu, H., Lu, N., Fu, B., Zhang, L., Wang, M., and Tian, H.: Hotspots, co-occurrence, and shifts of compound and cascading extreme climate events in Eurasian drylands, Environ. Int., 169, 107509, https://doi.org/10.1016/j.envint.2022.107509, 2022.
Yu, S. and Ma, J.: Deep Learning for Geophysics: Current and Future Trends, Rev. Geophys., 59, https://doi.org/10.1029/2021RG000742, 2021.
Yu, S., Hu, Z., Subramaniam, A., Hannah, W., Peng, L., Lin, J., Bhouri, M. A., Gupta, R., Lütjens, B., Will, J. C., Behrens, G., Busecke, J. J. M., Loose, N., Stern, C. I., Beucler, T., Harrop, B., Heuer, H., Hillman, B. R., Jenney, A., Liu, N., White, A., Zheng, T., Kuang, Z., Ahmed, F., Barnes, E., Brenowitz, N. D, Bretherton, C., Eyring, V., Ferretti, S., Lutsko, N., Gentine, P., Mandt, S., Neelin, J. D., Yu, R., Zanna, L., Urban, N., Yuval, J., Abernathey, R., Baldi, P., Chuang, W., Huang, Y., Iglesias-Suarez, F., Jantre, S., Ma, P. L., Shamekh, S., Zhang, G., and Pritchard, M.: ClimSim-Online: A Large Multi-scale Dataset and Framework for Hybrid ML-physics Climate Emulation, arXiv [preprint], https://doi.org/10.48550/arXiv.2306.08754, 2024.
Yuh, Y. G., Tracz, W., Matthews, H. D., and Turner, S. E.: Application of machine learning approaches for land cover monitoring in northern Cameroon, Ecol. Inform., 74, 101955, https://doi.org/10.1016/j.ecoinf.2022.101955, 2023.
Zanetti, M., Allegri, E., Sperotto, A., Torresan, S., and Critto, A.: Spatio-temporal cross-validation to predict pluvial flood events in the Metropolitan City of Venice, J. Hydrol., 612, 128150, https://doi.org/10.1016/j.jhydrol.2022.128150, 2022.
Zanini, E., Eastoe, E., Jones, M. J., Randell, D., and Jonathan, P.: Flexible covariate representations for extremes, Environmetrics, 31, https://doi.org/10.1002/env.2624, 2020.
Zennaro, F., Furlan, E., Simeoni, C., Torresan, S., Aslan, S., Critto, A., and Marcomini, A.: Exploring machine learning potential for climate change risk assessment, Earth-Sci. Rev., 220, 103752, https://doi.org/10.1016/j.earscirev.2021.103752, 2021.
Zerrouki, N., Harrou, F., Sun, Y., and Hocini, L.: A Machine Learning-Based Approach for Land Cover Change Detection Using Remote Sensing and Radiometric Measurements, IEEE Sens. J., 19, 5843–5850, https://doi.org/10.1109/JSEN.2019.2904137, 2019.
Zhao, G., Pang, B., Xu, Z., Peng, D., and Zuo, D: Urban flood susceptibility assessment based on convolutional neural networks, J. Hydrol., 590, 125235, https://doi.org/10.1016/j.jhydrol.2020.125235, 2020.
Zhu, X., Yang, Y., and Tang, J.: Compound wind and precipitation extremes at a global scale based on CMIP6 models: Evaluation, projection and uncertainty, Int. J. Climatol., 43, 7588–7605, https://doi.org/10.1002/joc.8281, 2023.
Zhuo, L. and Han, D.: Agent-based modelling and flood risk management: A compendious literature review, J. Hydrol., 591, 125600, https://doi.org/10.1016/j.jhydrol.2020.125600, 2020.
Zschau, J.: Where are we with multihazards, multirisks assessment capacities?, Science for disaster risk management 2017: knowing better and losing less, edited by: Poljansek, K., Marin Ferrer, M., De Groeve, T., and Clark, I., European Union, Brussels, Belgium, https://drmkc.jrc.ec.europa.eu/knowledge/science-for-drm/science-for-disaster-risk-management-2017 (last access: 24 June 2026), 2017.
Zscheischler, J., Orth, R., and Seneviratne, S. I.: Bivariate return periods of temperature and precipitation explain a large fraction of European crop yields, Biogeosciences, 14, 3309–3320, https://doi.org/10.5194/bg-14-3309-2017, 2017.
Zscheischler, J., Westra, S., van den Hurk, B. J. J. M., Seneviratne, S. I., Ward, P. J., Pitman, A., AghaKouchak, A., Bresch, D. N., Leonard, M., Wahl, T., and Zhang, X.: Future climate risk from compound events, Nat. Clim. Change, 8, 469–477, https://doi.org/10.1038/s41558-018-0156-3, 2018.
- Abstract
- Introduction
- Methodology
- Results and discussions
- Conclusion
- Appendix A: Abbreviations
- Appendix B: Summary tables of the collected studies
- Data availability
- Author contributions
- Competing interests
- Disclaimer
- Special issue statement
- Acknowledgements
- Financial support
- Review statement
- References