the Creative Commons Attribution 4.0 License.
the Creative Commons Attribution 4.0 License.
 | 12 Jun 2026
Unravelling wind-driven impact of storm clusters, a case study for the insurer Generali France
Pascal Yiou
Quentin Hénaff
Laurent Boissier
Arthur Perringaux
Winter windstorms are the most damaging natural hazard in Europe in terms of insured losses, with impacts often arising from storm clusters rather than isolated events. In reinsurance practice, losses are aggregated over sequences of storms affecting the same region within a limited time window. Yet, attributing individual damages to specific storm events remains challenging. The distribution of costs between insurance and reinsurance companies critically depends on this attribution, making robust and transparent criteria essential for a fair allocation of losses. This study introduces a method to systematically link individual insurance claims to extra-tropical cyclones, enabling event-based attribution of damages. The method is applied to the Generali France loss portfolio to build a catalogue linking individual claims to storm events. The resulting catalogue provides a foundation for risk assessment, loss modelling, and reinsurance applications. We focus on storm clusters, defined as successive storms affecting the same region within a 96 h period. We show that damaging storms within clusters are more intense than isolated events, with lower minimum sea-level pressure and higher vorticity. Losses within clusters are dominated by a single storm, accounting on average for about 70 % of total cluster losses, while the remaining storms collectively contribute to the residual losses. Overall, 85 % of windstorm-related losses over the 1998–2024 period are associated with clustered events, and damaging storms occur in clusters more frequently than expected from the complete extratropical cyclone sample. These results highlight the importance of explicitly accounting for storm clustering in insurance and reinsurance risk management.
- Article
(6145 KB) - Full-text XML
-
Supplement
(619 KB) - BibTeX
- EndNote


Extratropical cyclones (ETCs) are a dominant meteorological phenomenon in the mid-latitudes, serving as key drivers of day-to-day weather and accounting for the majority of high-wind and precipitation events across Europe (Hawcroft et al., 2012). Windstorms are intense ETC associated with extreme wind events. In Europe, they rank among the costliest natural hazards with EUR billions of economic and insured losses per winter (ECMWF, 2024). Given their significant societal and economic impacts, windstorms have gathered considerable attention in meteorology and climate sciences, while also being of central importance to the insurance and reinsurance sectors.
While the primary drivers of damage are the intensity and duration of surface wind gusts, quantifying the intensity of a windstorm itself requires considering the large-scale atmospheric environment in which the storm develops. Synoptic-scale conditions, such as the presence and configuration of a strong upper-level jet stream (Hillier et al., 2025), as well as key characteristics of the storm life cycle (e.g. explosive cyclogenesis), also influence the spatial extent and intensity of damaging winds (Ludwig et al., 2015; Ginesta et al., 2023). These large-scale conditions shape local wind gusts and ultimately control the severity and distribution of impacts at the surface. Therefore, a comprehensive understanding of windstorm damage requires considering not only peak wind metrics but also the full temporal evolution of storms and their synoptic environment.
In addition to individual storm characteristics, the temporal succession of ETCs plays a crucial role in shaping impacts. In Europe, the number of ETCs affecting a given location over a specific period (ranging from an entire season to just a few days) can vary substantially, from seasons with no events to days or weeks experiencing multiple occurrences. The temporal concentration of ETCs at a given location is called serial clustering (Dacre and Pinto, 2020). Variations in ETC counts can be attributed to large-scale atmospheric dynamics or interaction between ETCs. Persistent conditions, e.g. intense and zonal jet stream, can favour repeated cyclogenesis and storm propagation along similar tracks (Pinto et al., 2014; Priestley et al., 2017b). Regions such as Western Europe, located at the exit and flanks of the North Atlantic storm track, are particularly susceptible to storm clustering (Dacre and Pinto, 2020). The concept of “cyclone families,” first introduced by Bjerknes and Solberg (1922), further explains how the trailing conditions of a primary ETCs can facilitate secondary cyclogenesis through moist processes. Recent studies (e.g. Pinto et al., 2014; Priestley et al., 2020) have also demonstrated that ETCs formed by secondary cyclogenesis are more numerous during clustered periods over Western Europe.
ETC clustering has important implications for impacts. Previous studies have shown that the most intense ETCs tend to exhibit stronger over-dispersion than the complete ETC sample, making high-impact storms more likely to occur within storm sequences (Vitolo et al., 2009). Notable examples include the winters of 1989/90, with storms Daria, Herta, Nana, Judith, Ottilie, Hilie, Polly, Vivian, and Wiebke; 1999/2000, with storms Kurt, Lothar, and Martin (Rivière et al., 2010); and 2013/14 with storms Christian, Xavier, Dirk, Anne, and Christina (Priestley et al., 2017a). These episodes illustrate that the cumulative effects of successive storms can substantially amplify losses, beyond what would be expected from isolated events.
Serial clustering can be quantified using various metrics, depending on the temporal scale considered, from a few days to an entire season. One commonly used metric is the dispersion, defined as , where μ and σ denote the mean and variance of ETC counts over a given time interval. This metric was introduced based on the observation that storm occurrences do not follow a Poisson distribution with constant intensity, corresponding to a one-dimensional random series, and that some regions can experience over- or under-dispersion (Mailier et al., 2006). While this relative frequency metric has the advantage of not being dependent on the local storm frequency, it does not provide comparable information suitable for impact assessment. In contrast, absolute frequency metrics, such as the count of ETCs over a fixed region and period, offer globally comparable information but are sensitive to the specific set of storm tracks used (Pinto et al., 2014, 2016). The choice of metrics depends on the research objectives. From an impact perspective, an absolute definition with a 96 h window is particularly relevant for capturing the temporal clustering of extreme events, as it matches the event definitions commonly used in the reinsurance sector.
For the insurance sector, serial clustering represents an important risk. Insurers and reinsurers rely on the definition of climatic events, typically spanning 72–96 h, which determine the temporal windows over which claims are aggregated, and losses are reimbursed (William, 2023; APREF, 2014). Reinsurance contracts typically specify that losses are reimbursed only if the total claims accumulated within a defined event window exceed a contractual threshold. In situations of storm clustering, individual storms may produce losses below this threshold, yet the accumulation of successive events can still trigger coverage (Lloyd's of London, 2026). However, some contracts explicitly prohibit the aggregation of losses arising from distinct storm hazards, even when they occur simultaneously or in close succession, requiring them to be treated separately (William, 2023). Consequently, periods of closely spaced windstorms demand a precise attribution of claims to individual storm events, making the correct identification and separation of clustered storms essential for insurance and reinsurance applications. In practice, climatic events are usually defined based on reported claim dates and aggregated impacts rather than on the physical characteristics of the storms. Since claim dates can differ from the actual date of damage (Fonseca Cerda et al., 2024), such definitions may fail to capture the true timing and structure of storms, and claims falling outside the predefined temporal window may be excluded or trigger alternative, less favourable compensation mechanisms, further amplifying financial uncertainty associated with clustered events. This mismatch between physical storm events and insurance-based event definitions has important consequences for risk management and regulatory compliance. Under Solvency II regulations, insurers are required to hold sufficient capital to ensure that insolvency occurs no more than once every 200 years (European Parliament and Council of the European Union, 2009). Reliable estimation of such rare loss distributions, therefore, requires an accurate quantification of storm clustering and its effect on aggregated losses (Cusack, 2016). Linking insurance claims directly to meteorological storm events offers a pathway to correct erroneous claim dates, improve the definition of climatic events, and better align loss modelling with the actual drivers of damage.
Estimating storm impacts also requires understanding the interplay between hazard, exposure, and vulnerability (Intergovernmental Panel On Climate Change, 2023). Traditionally, storms are often defined using aggregated surface wind metrics over fixed time windows (Moemken et al., 2024a; Severino et al., 2024; Jaison et al., 2024; Cusack, 2023). While useful for constructing damage models and vulnerability curves, which are essential tools for estimating expected losses (Prahl et al., 2015; Fonseca Cerda et al., 2024), this approach does not capture the full storm life-cycle or key dynamical properties, or the compounding effects of successive storms. As a result, aggregating wind data over fixed time windows can mask the contributions of individual storms within clusters. This complicates the distinction between impacts caused by a single, exceptionally damaging storm and those arising from the combined effects of multiple storms occurring in rapid succession. Consequently, traditional models often struggle to represent clustered events accurately, as overlapping or sequential storms produce complex loss patterns that are not easily captured by standard approaches.
Several institutes provide datasets linking damage and meteorological events, such as the Extreme Wind Storms Catalogue (Roberts et al., 2014), PERILS (PERILS, 2025), the Copernicus Climate Change Service (Copernicus Climate Change Service, 2020) and Munich RE (Munich RE, 2025). While these datasets provide valuable insights, they often differ in the identified storms as well as in their loss estimates (Moemken et al., 2024b; Flynn et al., 2024). Moreover, they often focus on the most impactful storms and report spatially or temporally smoothed loss estimates, limiting their suitability for detailed analyses of localised damage and storm clustering effects. In contrast, primary insurance data, such as Generali France claims, provide a more granular view of damage patterns, capturing a broader range of storm-related claims. Nonetheless, using such data raises the fundamental challenge of objectively defining storm events based on impact records alone (Kron et al., 2012). Stucki et al. (2014), Gall (2015) demonstrate that temporally aggregated impacts can be extracted from such databases, though they are subject to biases, particularly those stemming from historical reporting practices and exposure variations. Despite these challenges, leveraging high-resolution claims data enables a precise damage assessment, distinguishing not only major storms but also individual members within storm clusters, offering a more refined perspective on impact patterns.
This study presents a method for systematically linking high-resolution insurance claims to physically identified ETCs. The proposed approach enables an attribution of damage to individual storm events, including within clustered periods. From a meteorological perspective, it improves the characterisation of storms and storm clusters, defined using their physical characteristics. From an insurance perspective, it provides a physically consistent basis for defining storm events, estimating storm-related losses, improving risk assessment for rare but high-impact storm sequences and calibrating vulnerability curves for different exposure scenarios. This paper addresses the following key questions:
-
How can insurance claims data be linked to ETCs?
-
How can impact data be leveraged to distinguish the impacts of successive storms?
-
What is the impact of short-duration storm clusters on insurance losses incurred by Generali France?
-
How is damage distributed within clustered storm events?
-
Do damaging storms embedded within clusters exhibit different intensities compared to isolated storms?
The paper is structured as follows. Section 2 characterises the dataset of Generali France's Property and Casualty (P&C) claims, ETC tracks, and the method to define clusters. The association method is described in Sect. 3 and evaluated by comparison with other datasets. Section 4 analyses the results of the claim–storm association through the lens of serial clustering. It characterises the physical properties of storms responsible for damage, with particular attention to those occurring within clusters, and examines how losses differ between isolated and clustered events, including how damage is distributed among successive storms in a sequence. The section also includes two detailed case studies of storms Lothar and Martin (December 1999) and storm Klaus (January 2009), which illustrate the ability of the method to disentangle losses from temporally adjacent events. Section 5 presents a discussion about future perspectives, and Sect. 6 showcases the conclusion of this study.
2.1 Constructing a storm database
Storms are physically characterised by a storm track that follows the trajectory of the ETC. While various tracking algorithms effectively capture the general patterns of storm tracks, the choice of methodology significantly influences the number and characteristics of detected ETCs (Neu et al., 2013). Each tracking algorithm is developed based on a specific conceptualisation of what best defines a cyclone, such as mean sea level pressure (MSLP) or relative vorticity at 850 hPa (ζ850). Additional criteria on the total length of the track, duration or intensity of the storms are also applied to constrain the set of tracks detected. Tracking algorithms typically yield consistent results for intense cyclones and during phases of intense development within their life cycle. However, larger discrepancies arise during the genesis and lysis stages of ETC (Raible et al., 2008). Differences in the representation of the life cycle are particularly pronounced for weaker, slower-moving, and short-lived ETCs (Flaounas et al., 2023). Additionally, absolute cyclone counts are highly sensitive to the chosen tracking methodology, which can lead to differences across studies (Neu et al., 2013). We use the object-oriented TRACK algorithm to obtain tracks over the Northern Hemisphere from ERA5 data (Hodges, 1994, 1999). The ERA5 dataset has a horizontal resolution of 0.25°×0.25°, corresponding to 18 km at 50° N, and we use data covering the 1979–2024 period from October to March.
To track ETCs, the input data is smoothed over a T42 resolution (approximately 2.8°) to filter out noise. ETCs are then identified based on 6-hourly values of ζ850 connected with nearest neighbour search. No conditions are set on the total length of the trajectories or on the minimum value of the maximum vorticity along the track, . We apply a spatial constraint to retain only storms that could have an impact on France. This is done by selecting the storms for which the track has at least one tracked point within 1300 km from the territory of metropolitan France. The radius of 1300 km ensures that the largest depressions, which can have an impact, distant from the centre of maximal vorticity, are not discarded. The choice of the footprint radius was motivated by previous studies (Hawcroft et al., 2018; Sinclair and Catto, 2023), who used a radius of 10° around the centre of minimal pressure. Similarly, Copernicus C3S (2025) defined their footprints with a 1000 km radius. Although this radius may appear large for weaker depressions, we conducted several sensitivity tests using smaller radii and a variable radius conditioned on the minimum pressure observed throughout the ETC life cycle. Similar results were found with these additional tests (cf. Appendix. A). Additionally, only depressions for which the tracks lasted more than 24 h are kept. This leads to a set of 4439 storms over the period ranging from March 1979 (included) until March 2024 (excluded).
For each identified track, we define the storm occurrence date (dstorm) as the time when the storm centre, defined by the location of maximum ζ850, is at its minimum longitudinal distance from the reference meridian at 7.5° W. This corresponds to the time step at which the Euclidean distance between the storm centre and the 7.5° W longitude line is minimal. This reference point along the track is used to assign a unique identifier to each storm. Storms are named using dstorm together with the latitude and longitude of the storm centre at this time. For example, Storm Lothar reached its minimum distance to the 7.5° W meridian on 26 December 1999 at 12:00 UTC, when its centre was located at 4.2° W and 51.5° N. It is therefore labelled as “1999-12-26 12h [-4.2; 51.5]”. This naming convention uniquely identifies storms, even when multiple storms crossed the 7.5° W longitude on the same date. An example of two storms, their occurrence area and their naming with respect to the 7.5° W longitude line, is illustrated in Fig. 1. Storm footprints are defined using hourly 10 m wind gust with a circular spatial mask of 1300 km radius around the centre of maximal vorticity and a temporal window of ±12 h around each tracked point. Alternatively other footprint areas can be used, such as for the definition of storm clusters. We will note the rkm-footprint areas, the footprint area of a given storm with a radius of r km moving with the centre of maximal vorticity.
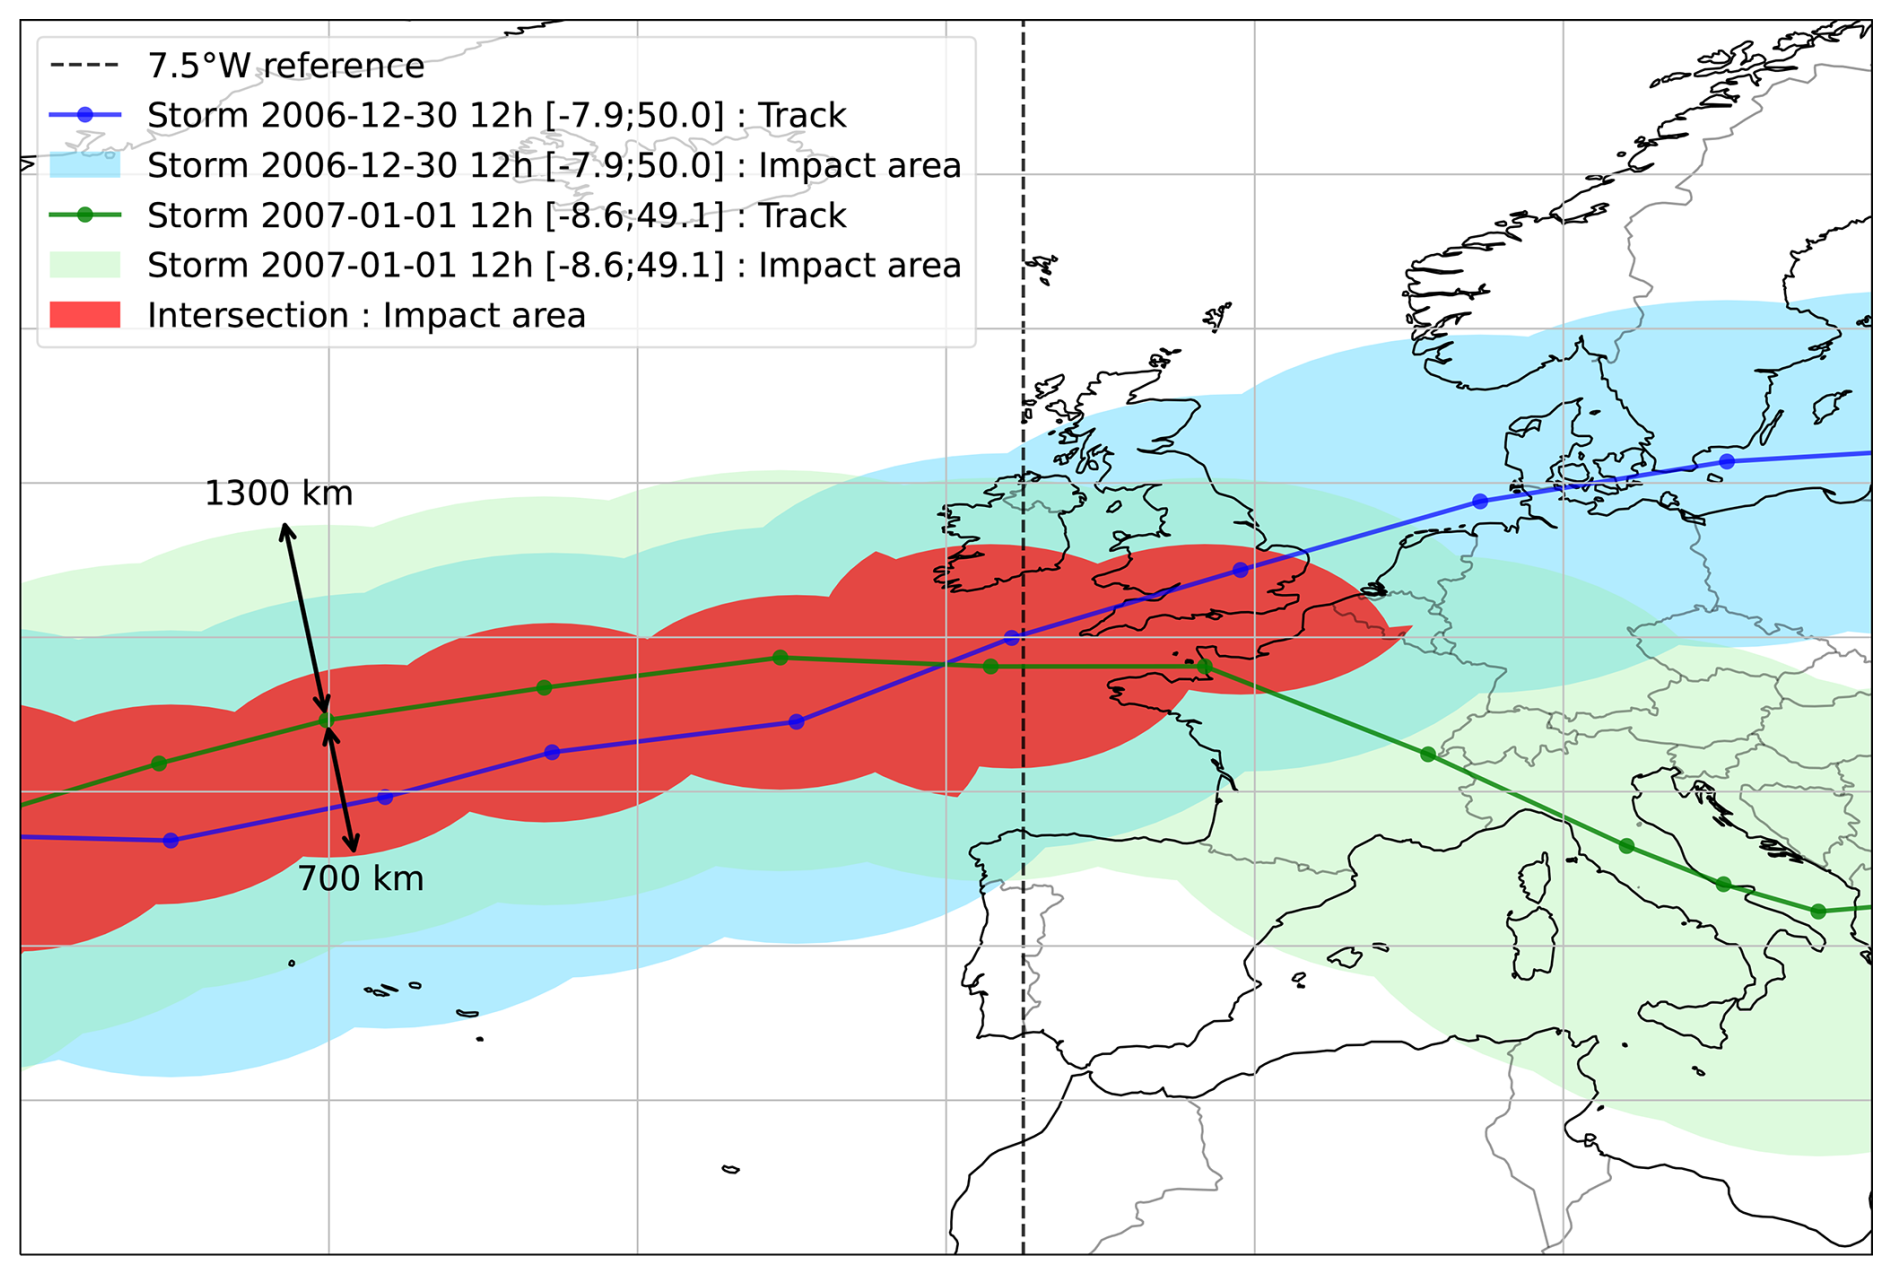
Figure 1Example of clustering with two storms. The green and blue lines represent the storm tracks of storms 1 and 2, with 6-hourly time increments. The green and blue shadings represent, respectively, the impact area of storms 1 and 2, defined with a radius of 1300 km around the centre of the track. The red shading illustrates the intersection of “high-impact” areas, defined by a radius of 700 km around the storm tracks.
The TRACK scheme has been shown to effectively represent ETCs and is well-suited for impact analyses (e.g. Priestley et al., 2024). However, we applied less restrictive thresholds on cyclone duration and intensity compared to other studies (e.g. Priestley et al., 2024; Lockwood et al., 2022) which required a minimal cyclone duration of 48 h, a minimum track length of 1000 km and a minimal threshold of 10−5 s−1. This was done to ensure the inclusion of more ETCs, particularly fast-moving and weaker storms, which can be responsible for significant damage locally. Priestley et al. (2020) also showed the importance of secondary cyclogenesis in serial clustering, which are often small-scale storms. Capturing storms of all scales is thus key to understanding damage during clustered events.
The analysis is performed using a single storm tracking algorithm, which can present some limitations, as different tracking schemes can produce differences in cyclone detection, track structure, and life-cycle representation (Neu et al., 2013). Restricting the set of storm tracks to only intense systems would introduce a selection bias in the association procedure, as claims could then only be linked to intense storms while impacts from weaker or shorter-lived ETCs would be excluded. Including depressions of all intensities allows for a more exhaustive representation of the ETCs that may contribute to observed damage.
2.2 Serial clustering of storms
Definitions of storm clusters vary across the literature and depend on both temporal and spatial criteria. Previous studies have employed a range of approaches, including absolute frequency metrics (Pinto et al., 2014; Karwat et al., 2023; Hauser et al., 2023), relative frequency metrics (Mailier et al., 2006; Economou et al., 2015; Pinto et al., 2016), and different temporal windows (Dacre and Pinto, 2020). In this study, we adopt an absolute frequency-based approach, complemented by a spatial criterion. Specifically, two or more storms are considered part of the same cluster if their 700 km-footprint areas intersect, and their impact dates are separated by no more than 96 h. The choice of a 700 km radius is based on the 6° angular distance around the centre of maximum vorticity, which has previously been used to define the region of strongest wind impacts (Zappa et al., 2013; Gramcianinov et al., 2020; Cornér et al., 2025). The radius is intentionally smaller than the one used to define the storm footprint in Sect. 2.1, as the goal here is to capture regions exposed to the most intense wind gusts from multiple ETCs. Figure 1 illustrates an example of a cluster of storms with the tracks of the two ETCs, their own footprints (defined in Sect. 2.1) and the intersection of their 700 km footprint areas. The 96 h temporal window is consistent with storm definitions used in Generali France's reinsurance contracts. To focus on events relevant to the French territory, we further require that the footprint area intersection occur over France. In cases where one identified cluster is entirely contained within another, the smaller (subset) cluster is discarded. We conducted a sensitivity analysis (Appendix B) on both the temporal and spatial criteria to assess how the clustering definition influences the number of detected events, as well as the share of claims and losses. Although we adopted a 96 h window specific to Generali France, rather than the 72 h window commonly used in reinsurance practice, this choice mainly affects the number of storms grouped within clusters. Importantly, the main conclusions regarding the proportion of losses and claims remain robust to those parameters.
Under this definition, a single storm can be part of several clusters. Among the 4439 storms affecting France over the 1979–2024 period, 1283 are part of at least one cluster. While one storm is found to participate in as many as 4 distinct clusters, the average is 1.18 clusters per storm. In total, 517 storm clusters are identified, with an average of 2.7 storms per cluster and a maximum of 13 storms in a single cluster.
2.3 Insurance data
Generali France's (P&C) claims portfolio, spanning from 1998 to 2024, is used as the impact dataset. All impact analyses involving these insurance losses are restricted to the 1998–2024 period. From the most recent analysis of building insurance in France, the market share of Generali can be estimated at 3 % in France (Fédération France Assureurs, 2024a, b), which corresponds to contracts. In France, residential property insurance is mandatory, and coverage reaches nearly 99 %. Consequently, Generali France's P&C claims portfolio provides a meaningful representation of storm-related residential property insurance impact. The analysis focuses on windstorm claims recorded during the extended winter season (September–April). Each claim is characterised by the geographical location of the damaged property, the date of declaration and the date of damage. In this study, we refer to the estimated date of damage as the claim date (dclaim), which can differ from the actual date of damage. Damage intensity is quantified by the net insured loss, over which deductibles and coverage limits are truncated. As a result, some values may be zero or negative; these entries are excluded from the analysis. In addition, claims exceeding EUR 150 000 in net insured loss at the date of damage, which correspond to “severe damage”, are treated through a separate process and are also excluded. To ensure consistency across years, all monetary losses are detrended and converted to constant EUR 2015, written “EURcst2015”, using inflation indices provided by the Institut National de la Statistique et des Etudes Economiques (INSEE, 2025). Claims can be categorised as “closed”, “open” or “out of order”. Closed claims have been paid based on the reported loss. Open claims are still under assessment, with losses subject to revision. Claims labelled as “out of order”, meaning not attributable to the relevant hazard, are excluded from the dataset. The full dataset was extracted on 10 December 2025 and contains approximately 2 % of opened claims, primarily corresponding to events in March and April 2024, at the end of the 2023–2024 winter season. After applying the filtering mentioned above, the cleaned dataset contains about 200 000 entries.
The geographical locations of insured properties are derived from textual addresses and converted into latitude and longitude using the Base Adresse Nationale (2025), the national authoritative reference for French addresses. The geocoding tool from the Environmental Systems Research Institute (ESRI, 2025) is used to match addresses to this reference. Among the reported claims, 75 % have a point level location match, meaning that the exact building is identified. For 18 % of cases, only the street or hamlet name is identified. Lastly, ≈7 % have locations only determined at the postcode level.
To characterise the financial impact of individual storm events, we define a set of metrics commonly used in the insurance sector. Let denote the number of claims and the total cost at location (i,j) attributed to a storm s. From these quantities, we compute the total cost, ; the total number of claims, ; and the mean cost per claim, for a given storm s. Together, these metrics describe not only the overall financial impact of each storm but also the average severity of individual claims. They are widely used in insurance practice to interpret recorded losses (Mission Risques Naturels, 2021; Fédération France Assureurs, 2024b).
3.1 Association method
Claim dates filled in the damage dataset are inherently uncertain as they are reported by policyholders based on their perception and interpretation of the hazard. This reporting bias, often referred to as historical perception, leads the raw claim dataset to over-represent intense windstorms and under-represent weaker events (Stucki et al., 2014). As a result, claim dates (dclaim) may differ from the actual dates on which damage occurred. To mitigate this issue, a common approach is to aggregate the damage over several days (e.g. Stucki et al., 2014; Fonseca Cerda et al., 2024). However, such aggregation can mask the contribution of smaller-scale storms when multiple events occur in close succession, and it implicitly assumes that a single storm is responsible for all damage within the aggregation window. This limitation is illustrated by Fig. 2a, which shows the daily number of declared claims. Claims appear nearly every day, a pattern that is inconsistent with the actual frequency of damaging storms and instead reflects reporting dispersion rather than true event occurrence. To address this data quality issue while still capturing the impact of all ETC events, we propose an association method that maps the claims and the storms. This approach reassigns claims to specific storm events, thereby correcting claim dates and improving their consistency with the timing of the underlying storm hazard.
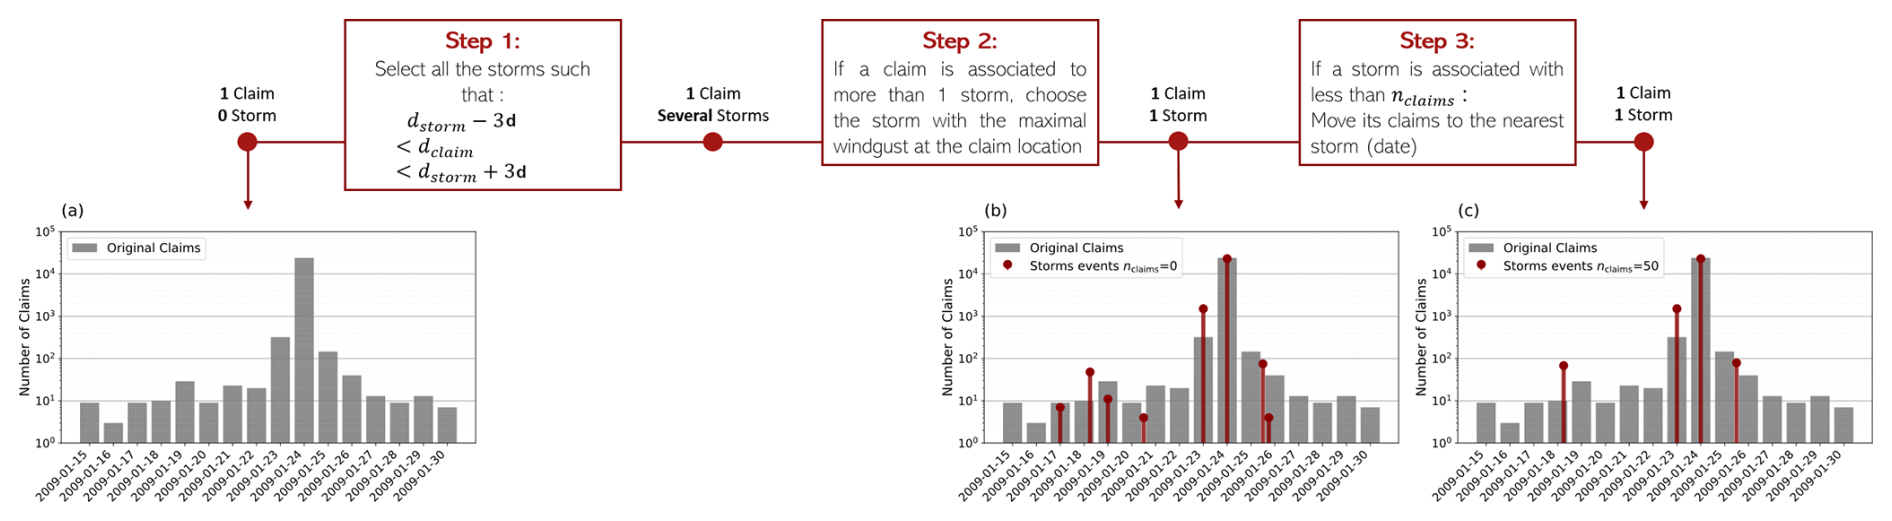
Figure 2Illustration of the claim–storm association procedure described in Sect. 3.1, applied to the period 15–30 January 2009 (case study in Sect. 4.2) with parameters d and nclaims=50. The upper panels show the successive steps of the association process. At each stage, the number of candidate storms and linked claims indicated before and after the operation illustrates how the association evolves for a representative claim. For example, before Step 1, a claim is not linked to any storm, whereas after Step 1 it may be associated with several candidate storms falling within the temporal window. The lower panels (a–c) present time series as bar charts. Grey bars represent the daily number of reported claims, while dark red markers indicate storm events located at their occurrence date dstorm, with marker height proportional to the number of claims associated with each storm. These panels illustrate how the method progressively transforms the daily distribution of claims into an event-based distribution of claims per storm: panel (a) shows the raw daily claim counts before any association, panel (b) displays the same distribution together with all identified storms and their associated claim numbers after Step 2, and panel (c) shows the final event-based distribution including only the storms retained at the end of the association procedure.
Step 1 links each claim to all storms for which the storm date (dstorm) is close to the claim date dclaim. This closeness is determined by a temporal window defined by several days before (Xb) and after (Xa)dstorm. Concretely, storms are selected so that dstorm verifies (in days).
Since the ultimate goal is to associate each claim with a single storm, the storm most likely responsible for the damage is selected following a method based on wind gust value. In Step 2, each claim is assigned to the storm producing the highest wind gust at the claim location. Figure 2b illustrates the resulting storm-claim associations after Step2, showing 8 storms and the number of claims attributed to each of them. For the events on the 23 and 24 January 2009, dstorm of the identified storms corresponds well to the days on which the maximal number of claims are reported. However, during periods with fewer reported claims per day, between the 17 and 21 January 2009, up to four candidate storms are identified, each associated with at most 50 claims, and in some cases fewer than 10. Given that storm events are associated with substantial impacts, and that Generali France's exposure is broadly representative of the French market, it is unlikely that a storm occurrence would result in so few claims. To account for this, we introduce a minimum-claim threshold, denoted nclaims, which is later optimised to better match the observed impact. In Step 3, any storm associated with fewer claims than this threshold has its claims reassigned to the temporally closest storm. This procedure is applied iteratively, increasing the threshold by increments of 10 claims at each time, until stable results are obtained. Figure 2c shows the storm events identified after the last step of this association strategy.
The proposed association depends on three parameters Xb,Xa and nclaims, respectively corresponding to the number of days before dstorm, the number of days after dstorm and the minimal number of claims associated with a storm. These parameters help fine-tune the association between claims and storms. The performance of the association is evaluated with three metrics that compare the characteristics of the identified storms (date dstorm, number of storm events, number of associated claims) with the raw temporal distribution of claims. Claim maxima are identified by maxima in the time series of claim counts (Fig. 2a), computed by aggregating claims over the entire French territory. Tuning the association parameters relies on the assumption that the identified storms adequately capture both the timing and magnitude of the highest daily claim intensities, despite potential temporal shifts between storm occurrence and reported damages. The local maxima identified using the distribution of the number of claims as a function of time represent the target of the association. The constructed metrics evaluate whether the number of storms identified by the association methods corresponds to the number of claims maxima and whether the dates of the claim maxima are not too far from the dstorm dates. The precision metric (Mdays), in number of days, is computed as the maximal difference between dstorm and its closest local maximum. The smaller this difference, the better the association. The frequency metric (Δf), in number of events, is defined as the difference between the number of storms associated with claims and the number of local maxima. Lastly, the completeness metric (Pclaims), in percentage, corresponds to the percentage of claims associated with a storm event. These metrics collectively provide an overall assessment of how effectively the association strategy links claims to storm events. No spatial performance is evaluated at this stage. It is assumed that the association with the storm producing the highest wind gust should already capture the spatial claim distribution.
In mathematical terms, let be the dates of the n storms identified and the dates of the m claims local maxima. Then the frequency difference is defined as . The precision metric can be written as . The difference between the dates is expressed in days, as the local maxima computed over the claim dates are at the day level. The sensitivity and the optimisation of these metrics are detailed in the Supplement. The retained optimal values are d and Nmin_claims=50. These values will be kept for the remainder of the study. The resulting aggregation window of 7 d exceeds the 5 d used by Fonseca Cerda et al. (2024) and the 3 d considered by Cusack (2023). We expect that such large windows better account for the potential postponed impact of a windstorm, but also for the error made by the insured person when declaring the damage date. Additionally, the linking strategy based on the maximal wind-gust value should ensure the association with the correct storm driver.
3.2 Representativity of the catalogue
Assessing the representativeness of the resulting catalogues remains a methodological challenge due to the variety of available approaches. In a comparison between academic and insurance-based catalogues, Moemken et al. (2024b) highlights significant discrepancies in storm frequencies, major event identification, and estimated losses. These differences stem from the primary objectives of each catalogue but may have important implications for risk assessment. The proposed approach, specifically tailored to Generali France's exposure, produces a more robust event catalogue in which individual claims are systematically linked to ETCs along with their associated characteristics.
A key consideration is the catalogue's ability to accurately capture the most severe historical events. When the association method described above is applied, 322 storms are associated with an impact for Generali France over the 1998–2024 period. We call these events “impactful storms”. Among these, the 40 costliest events are presented in Fig. 3. Storms Kurt, Lothar, Martin, Klaus, Xynthia, Eunice, and Ciaran were the costliest for Generali, with losses exceeding EUR 10 million per event. Figure 3 illustrates that our method successfully captures high-impact storms documented in global datasets (PERILS, 2025; Flynn et al., 2024; Copernicus Climate Change Service, 2020). Further comparison with Météo France's catalogue, produced using the Storm Severity Index (SSI), reveals a strong agreement over the period 1998–2024 (Meteo France, 2023). Only the storms of 16–17 December 2019 (storm Andrea and Calvann) rank among the most intense in Météo France's analysis, but do not appear in the top 40 costliest events from Generali France. This discrepancy would require further investigation, with one plausible explanation being the influence of Generali France's portfolio.
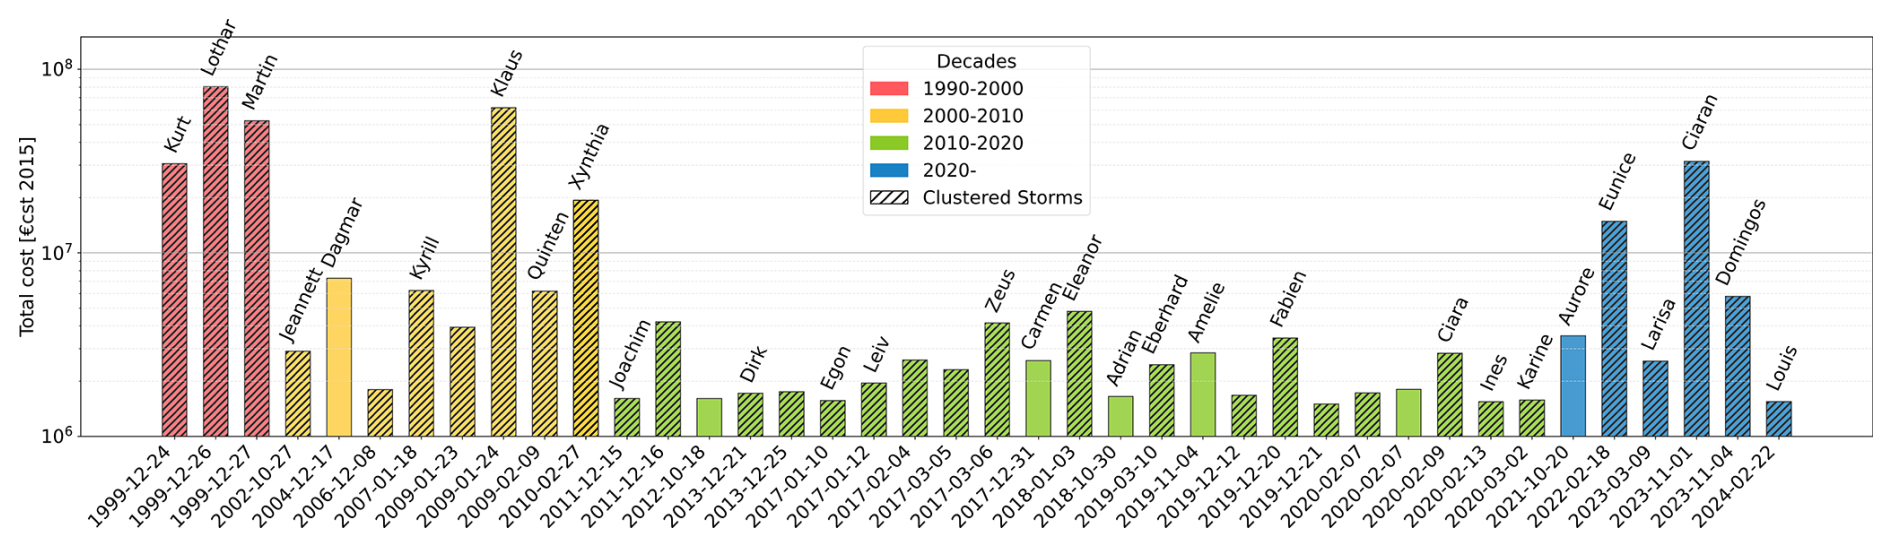
Figure 3Losses of the 40 costliest storms for Generali France over the period 1998–2024. Storm dates are indicated in the x axis and Storm names over the bar plot of each event. Colours indicate the decade during which the storm event occurred. Dashed bars indicate storms being part of a cluster.
The resulting catalogue exhibits pronounced interannual variability, both in the number of storms associated with damage and in the corresponding loss amounts. On average, 6.7 damaging storms are identified per year (standard deviation 3.9), while annual losses have a median value of EUR 4 million and a much larger standard deviation of EUR 35 million, reflecting the strong year-to-year variability of impacts. Figure 4 underlines that the costliest winter seasons do not always correspond to the year with the most numerous storms or clusters of storms. This is the case for the winter 1999/2000 with only 7 storms associated with damage, but corresponding to the costliest winter. The winter 2013/14 is also notable with 14 storms identified with damage, but a total loss for the season close to the average. This high number of storms associated with moderate losses can come from the diversity of our storm tracks. As small and fast-moving depressions were kept in the set of storm tracks, it is more likely to encounter small storms associated with little losses. The variation of losses can be explained by both the intensity of the storms and the vulnerability of the exposed areas. This underscores the complex interplay between meteorological variability and socioeconomic vulnerability.
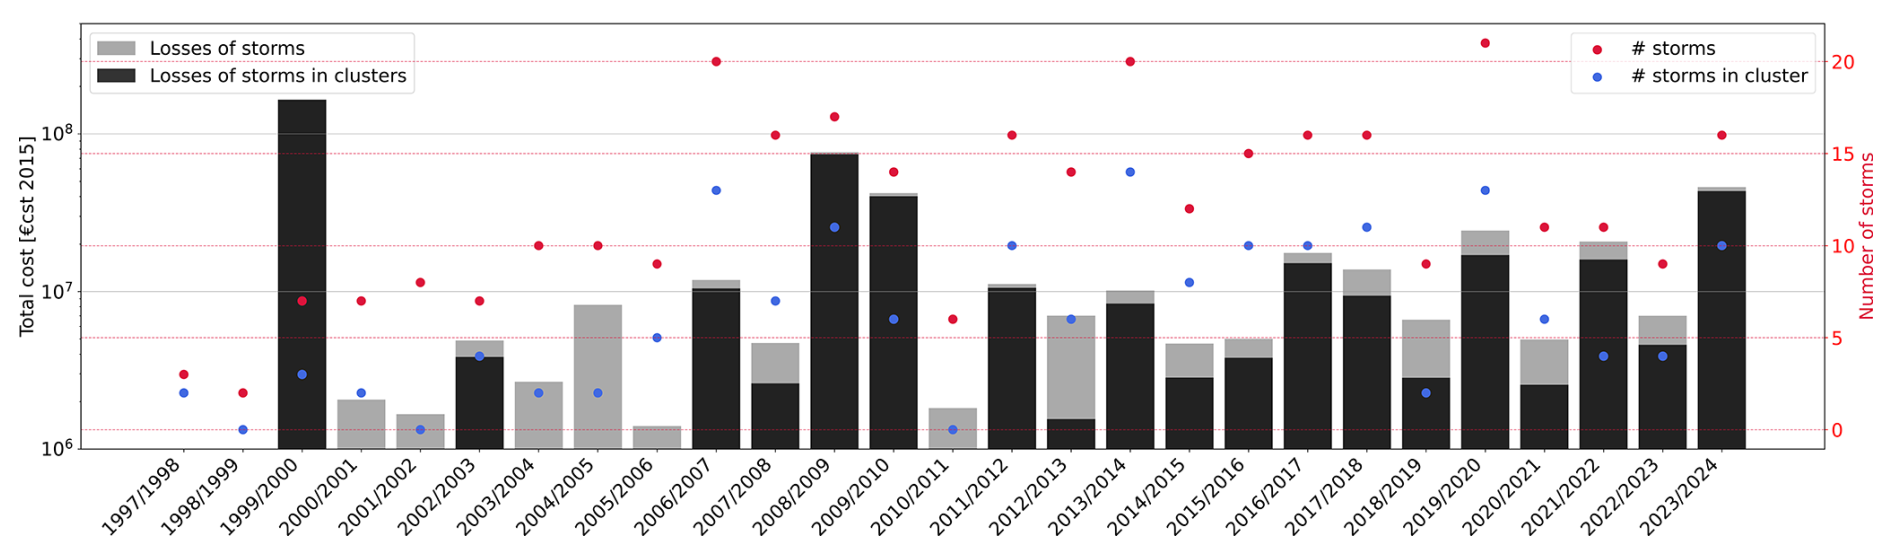
Figure 4Yearly insured losses and storm occurrences. Light gray bars represent the total losses in constant EUR 2015 per winter season; darker bars indicate the amount linked to clusters of storms. The points represent the number of storms (red) and the number of storms being part of clusters (blue) per winter season. Winter y to y+1 starts from September of year y and ends in March of year y+1.
The pronounced interannual variability in the number of ETCs reflects year-to-year changes in storm intensity and track density (Feser et al., 2015). Beyond storm occurrence alone, Moemken et al. (2024b) and Cusack (2023) show that variability in storm-related losses is further amplified by the interaction between storm frequency and the spatial distribution of exposed assets. Consequently, years with comparable numbers of storms can produce very different loss outcomes depending on storm intensity and the regions affected by their tracks. The patterns of interannual variability in both storm counts and associated losses shown in Fig. 4 underscore the combined role of meteorological variability and exposure in shaping windstorm losses.
The quality of our catalogue of claims and storm events can be assessed using the insurance-based metrics defined in Sect. 2.3. For the set of impacting storms, the mean and median costs per storm are EUR 1 million and EUR 0.27 million, respectively. The marked difference between these values reflects a highly skewed distribution of losses across events: most storms generate relatively moderate losses, while a small number of damaging storms contribute disproportionately to the total loss. This concentration of losses in a few extreme events corresponds to a heavy upper tail in the distribution of costs per storm. A comparable skewness is observed in the distribution of the number of claims per storm. Although the mean number of claims reaches 591, the median is only 102, again reflecting the dominant influence of a limited number of very costly events. Such heavy-tailed behaviour is a well-documented feature of windstorm insurance data and arises from the combined effect of storm intensity, storm footprint, and the spatial distribution and vulnerability of exposed assets. As a consequence, summary statistics such as means are strongly driven by a few extreme storms, making the statistical characterisation of storm-related losses particularly challenging. Similar findings have been reported in previous studies for both claim counts and loss amounts (Moemken et al., 2024a, b; Prahl et al., 2015), which consistently show that cumulative losses are typically dominated by a small subset of high-impact events.
Regarding the mean cost per claim, Fédération France Assureur (2025) report values ranging from EUR1530 to 2335 in 2023 (in constant EUR) for residential properties, corresponding to EUR 1285 and 1962 in 2015 constant EUR. These estimates are lower than the mean cost per claim of approximately EUR 2700 obtained in this study from Generali France's insured losses. Mission Risques Naturels (2021) also showed, based on an in-depth analysis of the 2018/19 winter season, that the average cost per claim strongly depends on the type of infrastructure affected. The higher mean losses found in our dataset can therefore be partly explained by Generali France's specific exposure and portfolio composition, as well as by the longer historical record considered here. Generali France's portfolio is concentrated in densely urbanised areas such as Paris, Lyon, Lille, and Bordeaux, as well as in the south-east and northern regions of France, where higher asset values likely contribute to larger average claim costs.
To further assess the implications of the storm–claim association, we analyse the differences between reported claim dates and the actual dates of the associated storm events. Linking claims to storms allows us to compare the declared claim date (dclaim) with the corresponding storm date (dstorm). Figure 5 shows the probability distribution of absolute difference between these two dates. We find that 77 % of claims were reported within 24 h of the storm occurrence date, while 96 % were reported within a 7 d window.
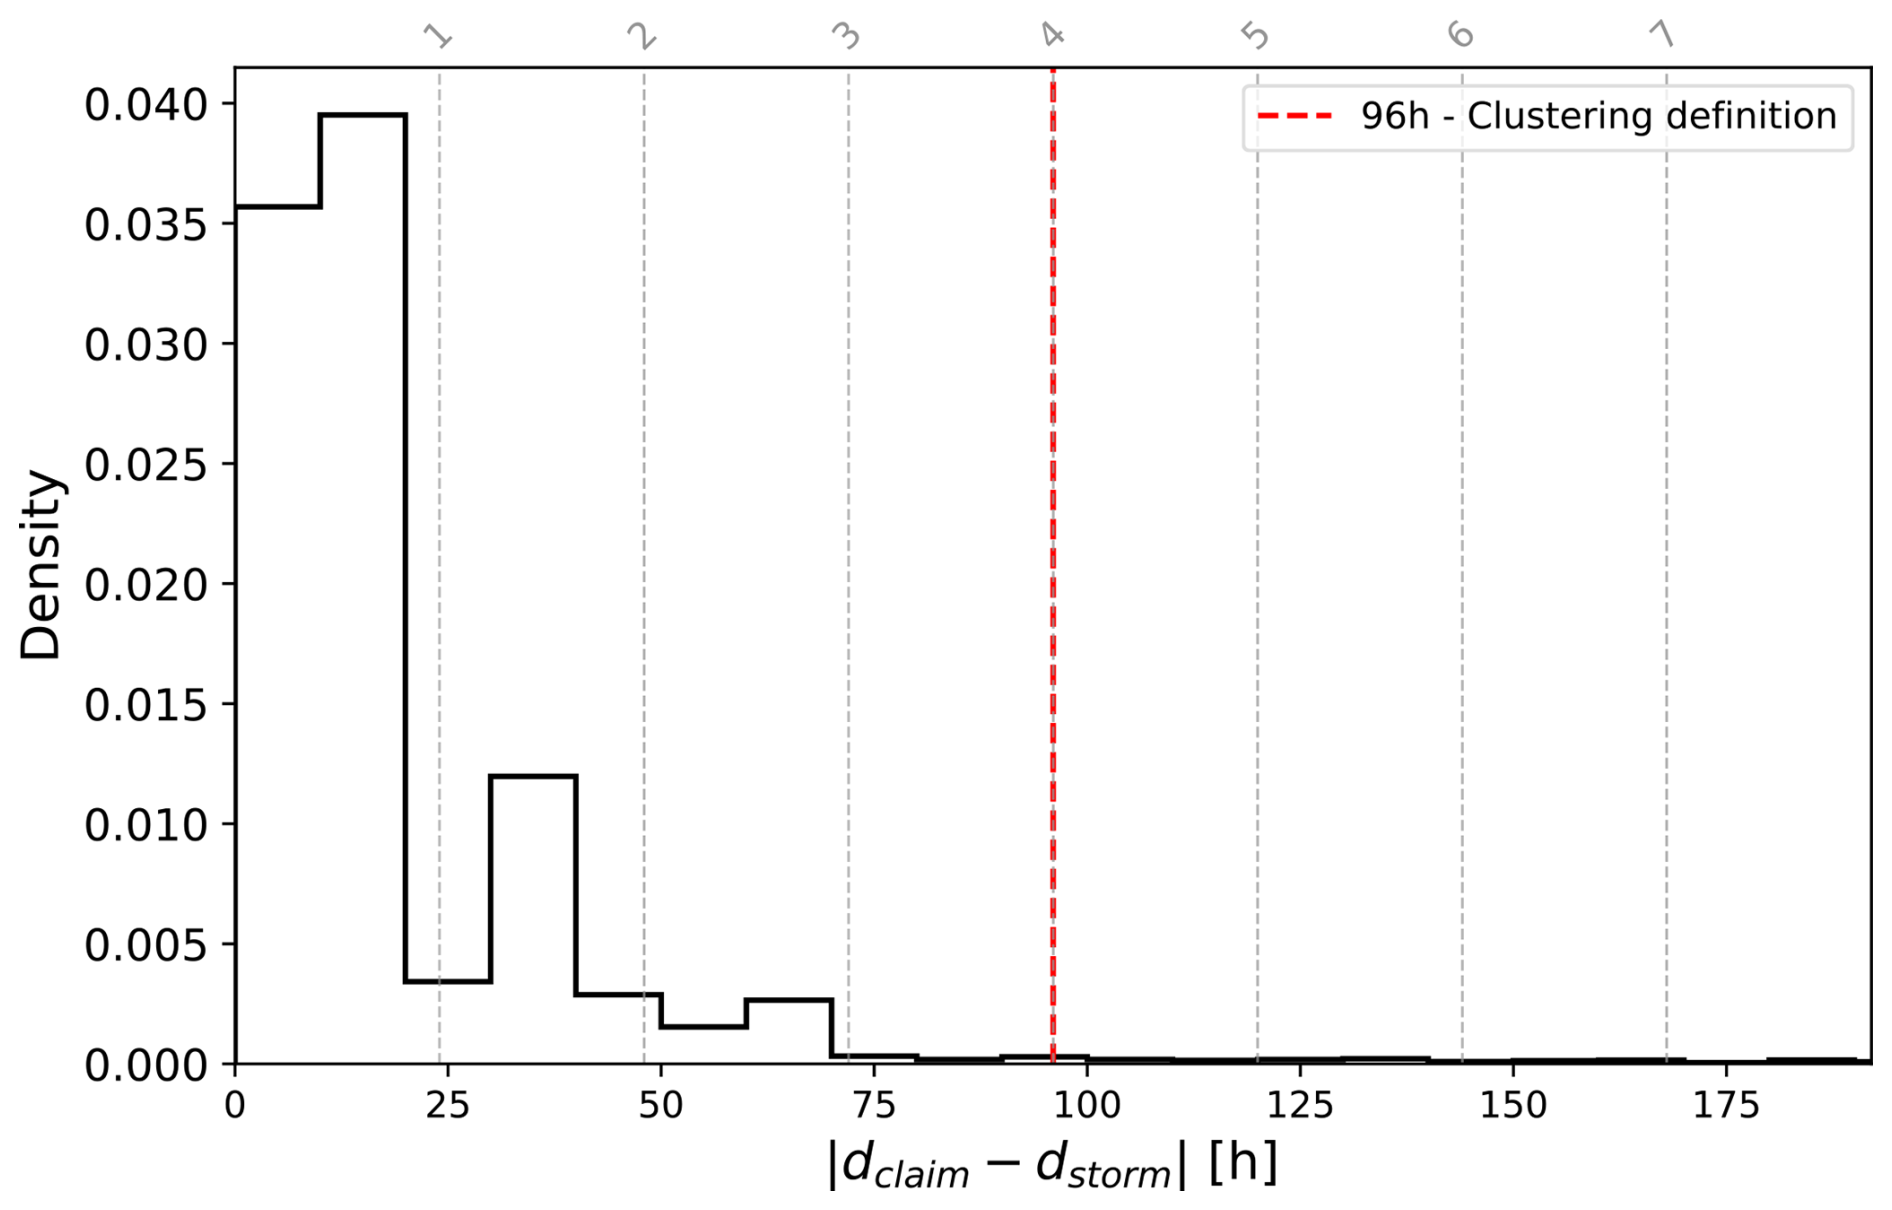
Figure 5Empirical probability density of the absolute difference between dclaim and dstorm in Generali France's claim portfolio. The vertical redlines indicate the temporal windows used for the clustering definition. Vertical dashed grey lines indicate the corresponding number of days, with the value shown above each line.
Comparing this distribution with the 96 h temporal window used to define storm clusters highlights the limitations of relying solely on fixed aggregation periods. While most claims are reported close to the actual storm date, delays exceeding 24 h already introduce the possibility that losses from different successive storms become temporally mixed in the claims record. In periods of enhanced storm activity, where multiple events affect the same region within a few days, such reporting lags can blur the boundaries between individual storms. When delays accumulate over several temporally compounded events, the effective spread of reported claim dates may exceed the 96 h clustering window. Without an explicit association between each claim and its corresponding physical storm, losses may therefore be attributed to the wrong event or artificially distributed across multiple storms. This temporal misalignment complicates the attribution of damage to individual storm and makes it more difficult to disentangle true meteorological clustering from variability introduced purely by reporting practices. By contrast, the method developed in this study, which links each claim directly to identified storm tracks, helps restore a physically consistent timeline of impacts. This approach improves the separation between successive events and enables a clearer interpretation of loss patterns during clustered storm periods.
4.1 Case Study of December 1999: Storms Kurt, Lothar and Martin
The winter of 1999 represented a significant challenge for the insurance sector in Europe, particularly in France, due to the successive storms Kurt, Lothar and Martin on 24, 26, and 27 December 1999. Storm Kurt had a northern trajectory, causing severe damage across Scandinavia (Kettle, 2021). Lothar, meanwhile, brought widespread destruction to France, Switzerland (Bründl and Rickli, 2002), Germany (Schmoeckel and Kottmeier, 2008; Schindler et al., 2009), and Belgium. Storm Martin followed a path similar to that of Storm Lothar, leading to an exacerbated impact in the regions mentioned previously (Bresch et al., 2000).
The strength and positioning of the upper-level zonal jet provided the primary large-scale forcing that triggered the explosive deepening of storm Lothar (Wernli et al., 2002; Rivière et al., 2010). With only 24 h separating Storm Lothar from Storm Martin, their impacts are difficult to distinguish in aggregated data. At the time, the reinsurance hour clause was loosened for recovery purposes and allowed for separating some losses (Risk Management Solutions, Inc, 2019). Nonetheless, this distinction was made solely for economic constraints and was not based on the actual damage caused by each storm. As a result, most studies treat Lothar and Martin as single events when evaluating their collective impacts (Michèle Lai, 2019; Welker et al., 2021).
Studies have underlined difficulties in disentangling the individual impacts of these storms. Figure 6 illustrates the spatial distribution of claims around the dates of both storm events. We underline that claims were declared for each of the days and over the whole of France during the subset period. For cities such as Paris, claims were identified each day. Without more information about the intensity and location of the storms, it is thus impossible to differentiate between the successive events.
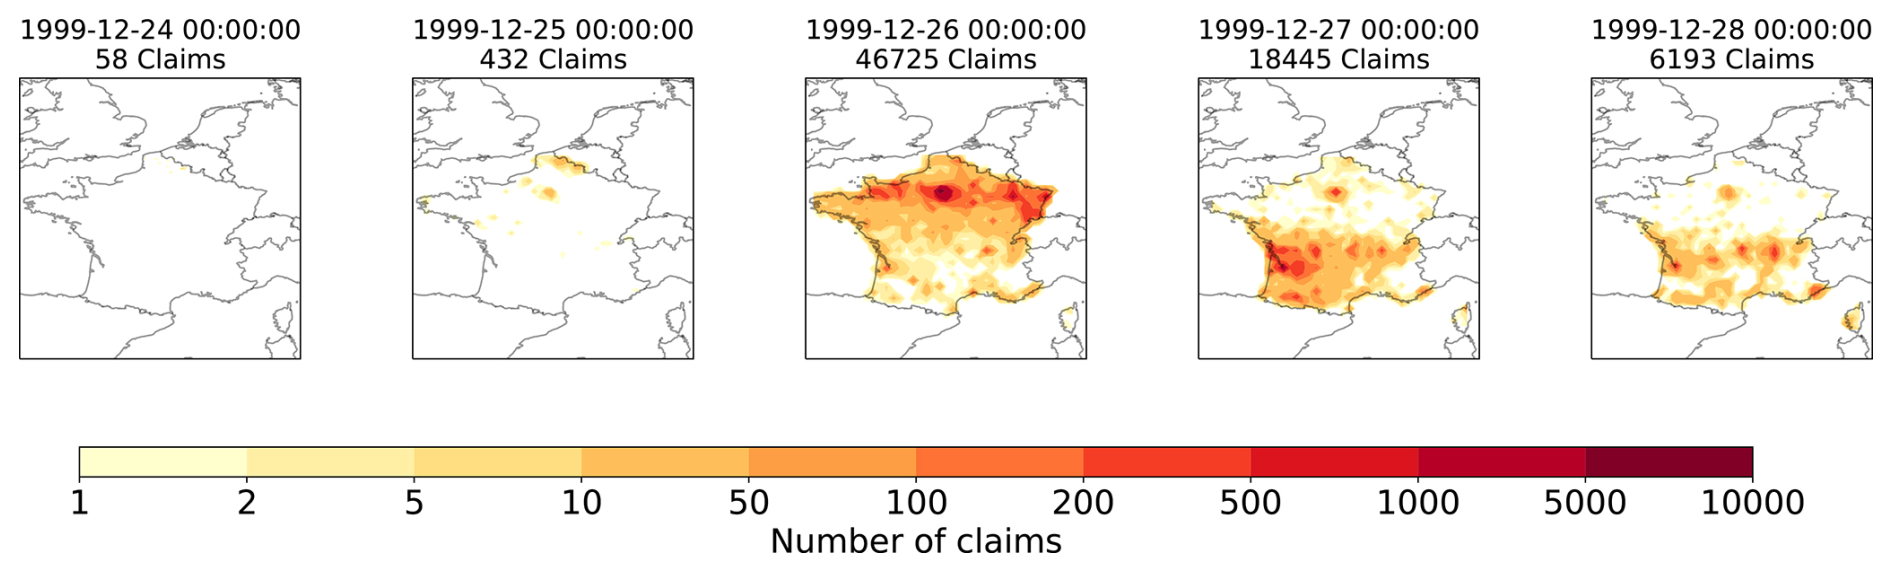
Figure 6Map of the number of claims per day from 24 until the 28 December 1999.
Storms Kurt, Lothar and Martin respectively had an impact on 24, 26, and 27 December 1999. However, no claims were declared on the 24, and the impact of Lothar and Martin is likely mixed with the claims declared between the 26 and the 28. Restricting the analysis to claims reported strictly on the date of each storm would risk misattributing impacts and linking damages to incorrect meteorological conditions. Furthermore, attributing claims to the wrong event and date may affect the proper aggregation of losses under the 96 h reinsurance clause.
We applied our association method using the maximum wind gust speed of the three storms and the insurance claims for the period between 20 and 30 December 1999 ( d). 1514 claims (out of 73 605) cannot be attributed to any of the three storms. Figure 7 shows the footprints of storms Kurt, Lothar and Martin along with their associated claims. The distinction between their estimated impacts is particularly evident over central France and corresponds well to the shift of the highest wind gust. Our association procedure leads to a better focus on the impact regions of successive events, allowing us to distinguish their effects even when storms share a common impact area. Hence, the claim patterns in Fig. 6 can be refined to those in Fig. 7.
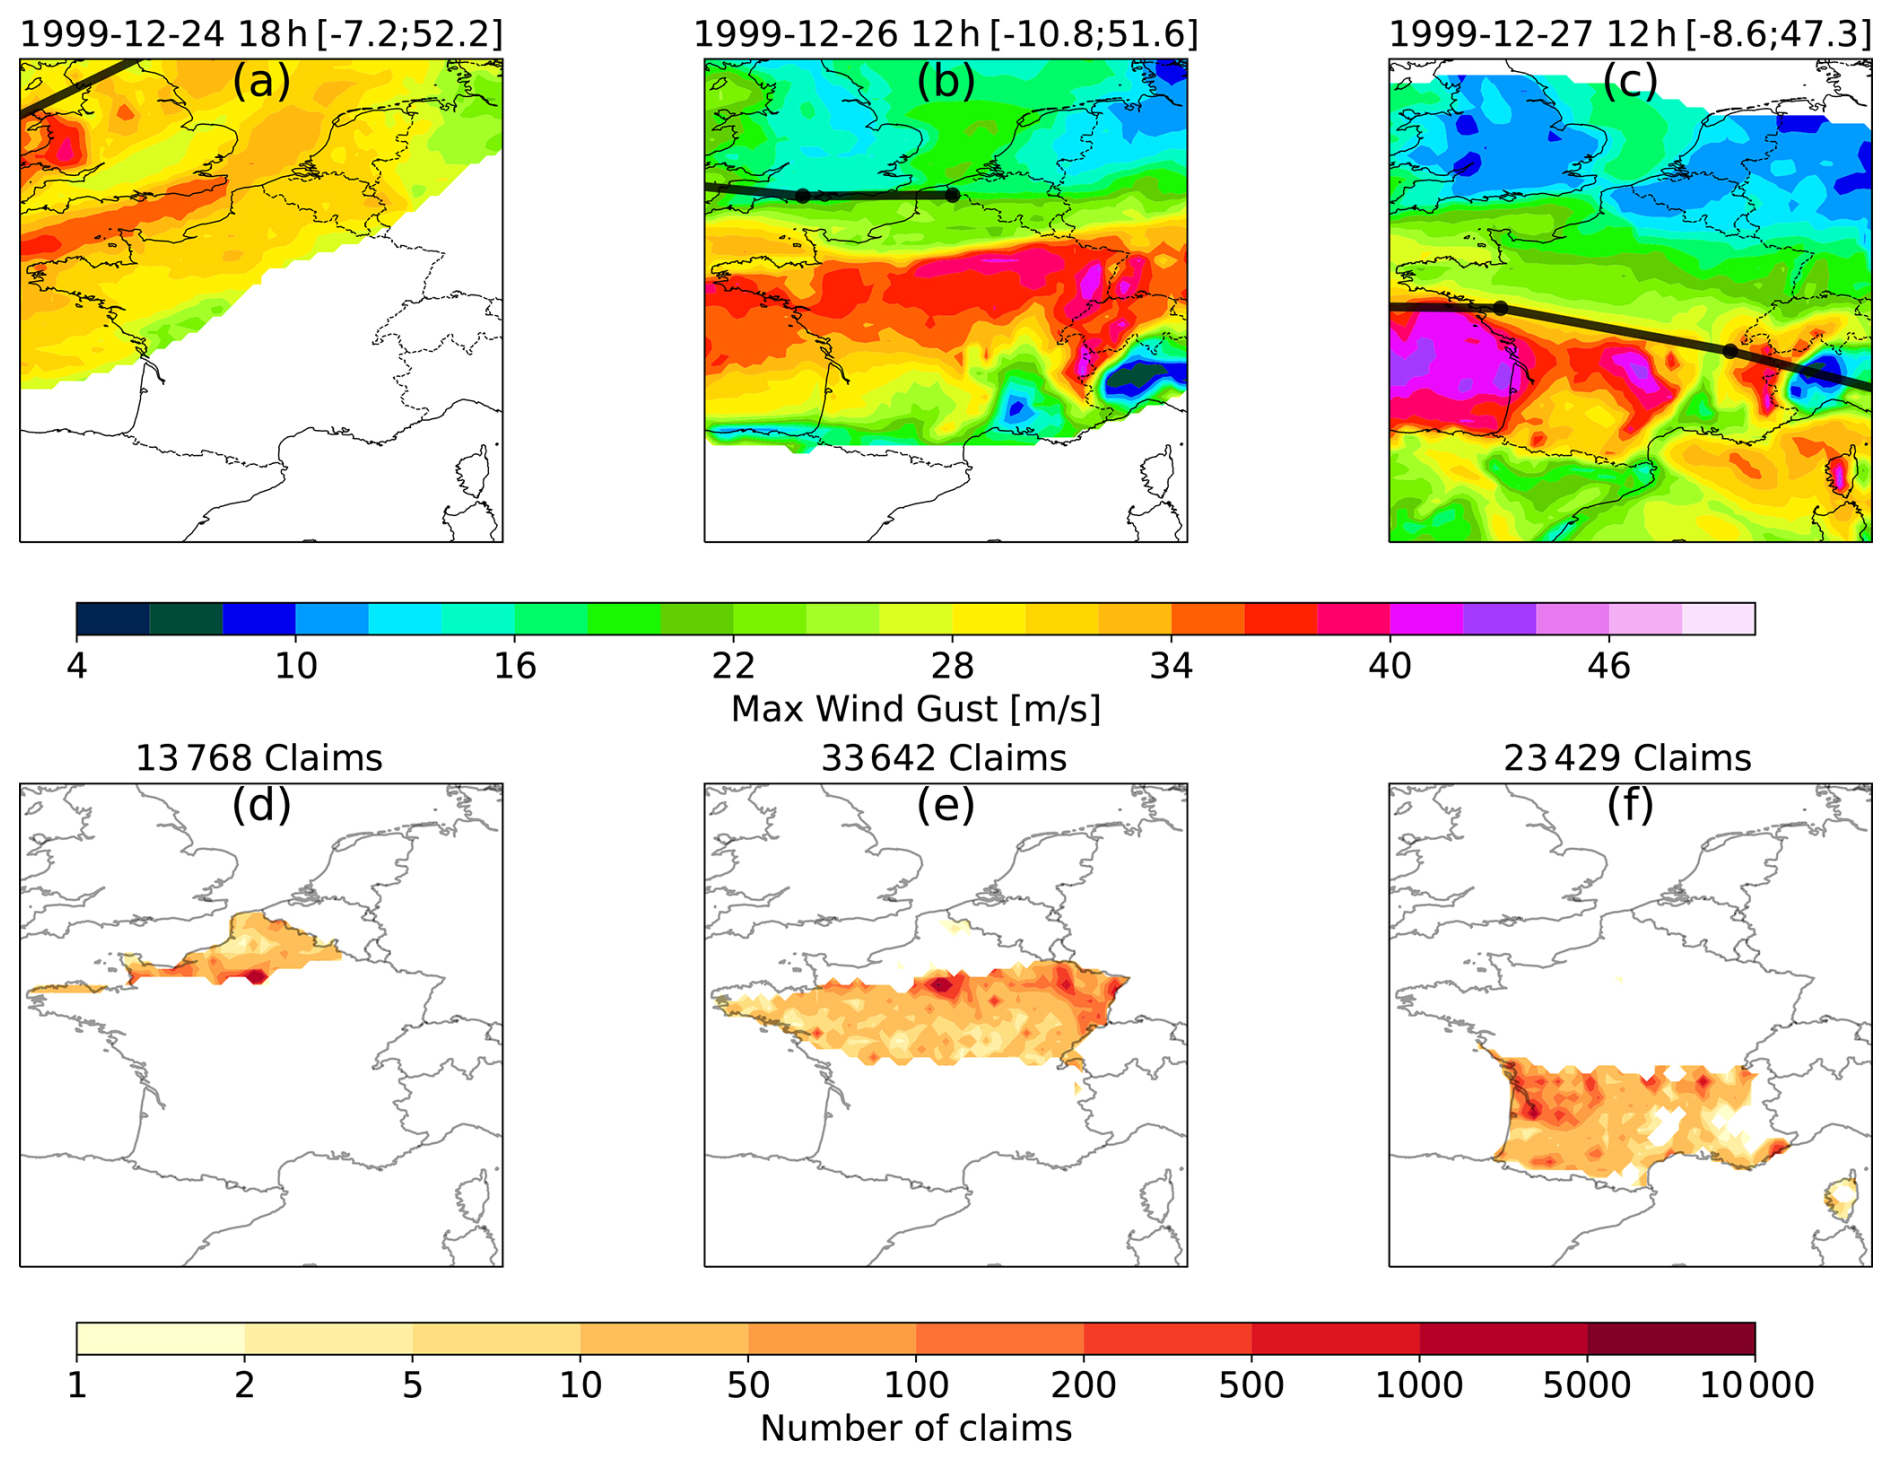
Figure 7Association of claims to storms. Each column contains the maximum wind gust speed and the number of claims associated with a storm in December 1999. Panels (a) and (d) show 1300 km-footprint obtained for storm Kurt (”1999-12-24 18h [-7.1;52.1]”), (b) and (e) for storm Lothar (”1999-12-26 12h [-4.2;51.6]”), and (c) and (f) for storm Martin (”1999-12-27 12h [-5.2;49.4]”). Panels (a), (b), and (c) show wind-gust footprints and the storm trajectories (thick black lines), panels (d), (e), and (f) show the spatial distribution of the number of claims associated with each storm, while titles indicate the total number of claims for the whole event.
We underline that the three storms have resulted in some damage in Paris. Although Storm Lothar had the highest windgust in the Paris area, the claim date played a key role in the distinction. This means that the claims observed in Paris and attributed to storm Kurt must have had a claim date earlier than 23 December 1999 (Xb=3 d before the impact date of storm Lothar). Similarly, the claims observed in Paris and attributed to storm Martin must have been declared later than Xa=3 d after storm Lothar, so later than 29 December 1999.
We highlight that damage is separated solely by the most intense wind gust. Our approach does not account for the persistence of strong wind gusts or the possibility that damage may result from the last storm, even if it did not produce the highest wind gust. This represents the primary limitation of the method. An alternative approach could involve using a different association method, such as linking events based on the closest track in terms of distance. However, for clustered storms affecting the same region, this may not be ideal. As illustrated in Fig. 7, weaker wind gusts can be observed near the centre of maximum vorticity. This suggests that some damage could be incorrectly attributed to areas with relatively low local wind gusts.
Although reinsurance practice typically aggregates windstorm losses within fixed temporal windows of 72 or 96 h, major events such as storms Lothar and Martin illustrate that a finer temporal separation may be required to distinguish the impacts of successive storms. The claim–storm association method enables this separation by attributing losses to individual storm tracks rather than to a predefined time window. At the same time, it successfully captures delayed damage, with claims that are reported several days after the physical event still being correctly assigned to the responsible storm.
4.2 Case Study: Storm Klaus
The storm–claim association also underlines the relative contribution of smaller storms, which are usually discarded. As discussed in Sect. 2.1, it is crucial to account for all storms, as fast-moving systems or smaller depressions can generate strong surface winds. If these storms are not captured, all the damage may be attributed to the strongest storm, which might not be the one responsible for the strong winds at the given location. The example of Storm Klaus, represented in Fig. 8 serves to illustrate the importance of including small depressions and accurately distinguishing their impacts.
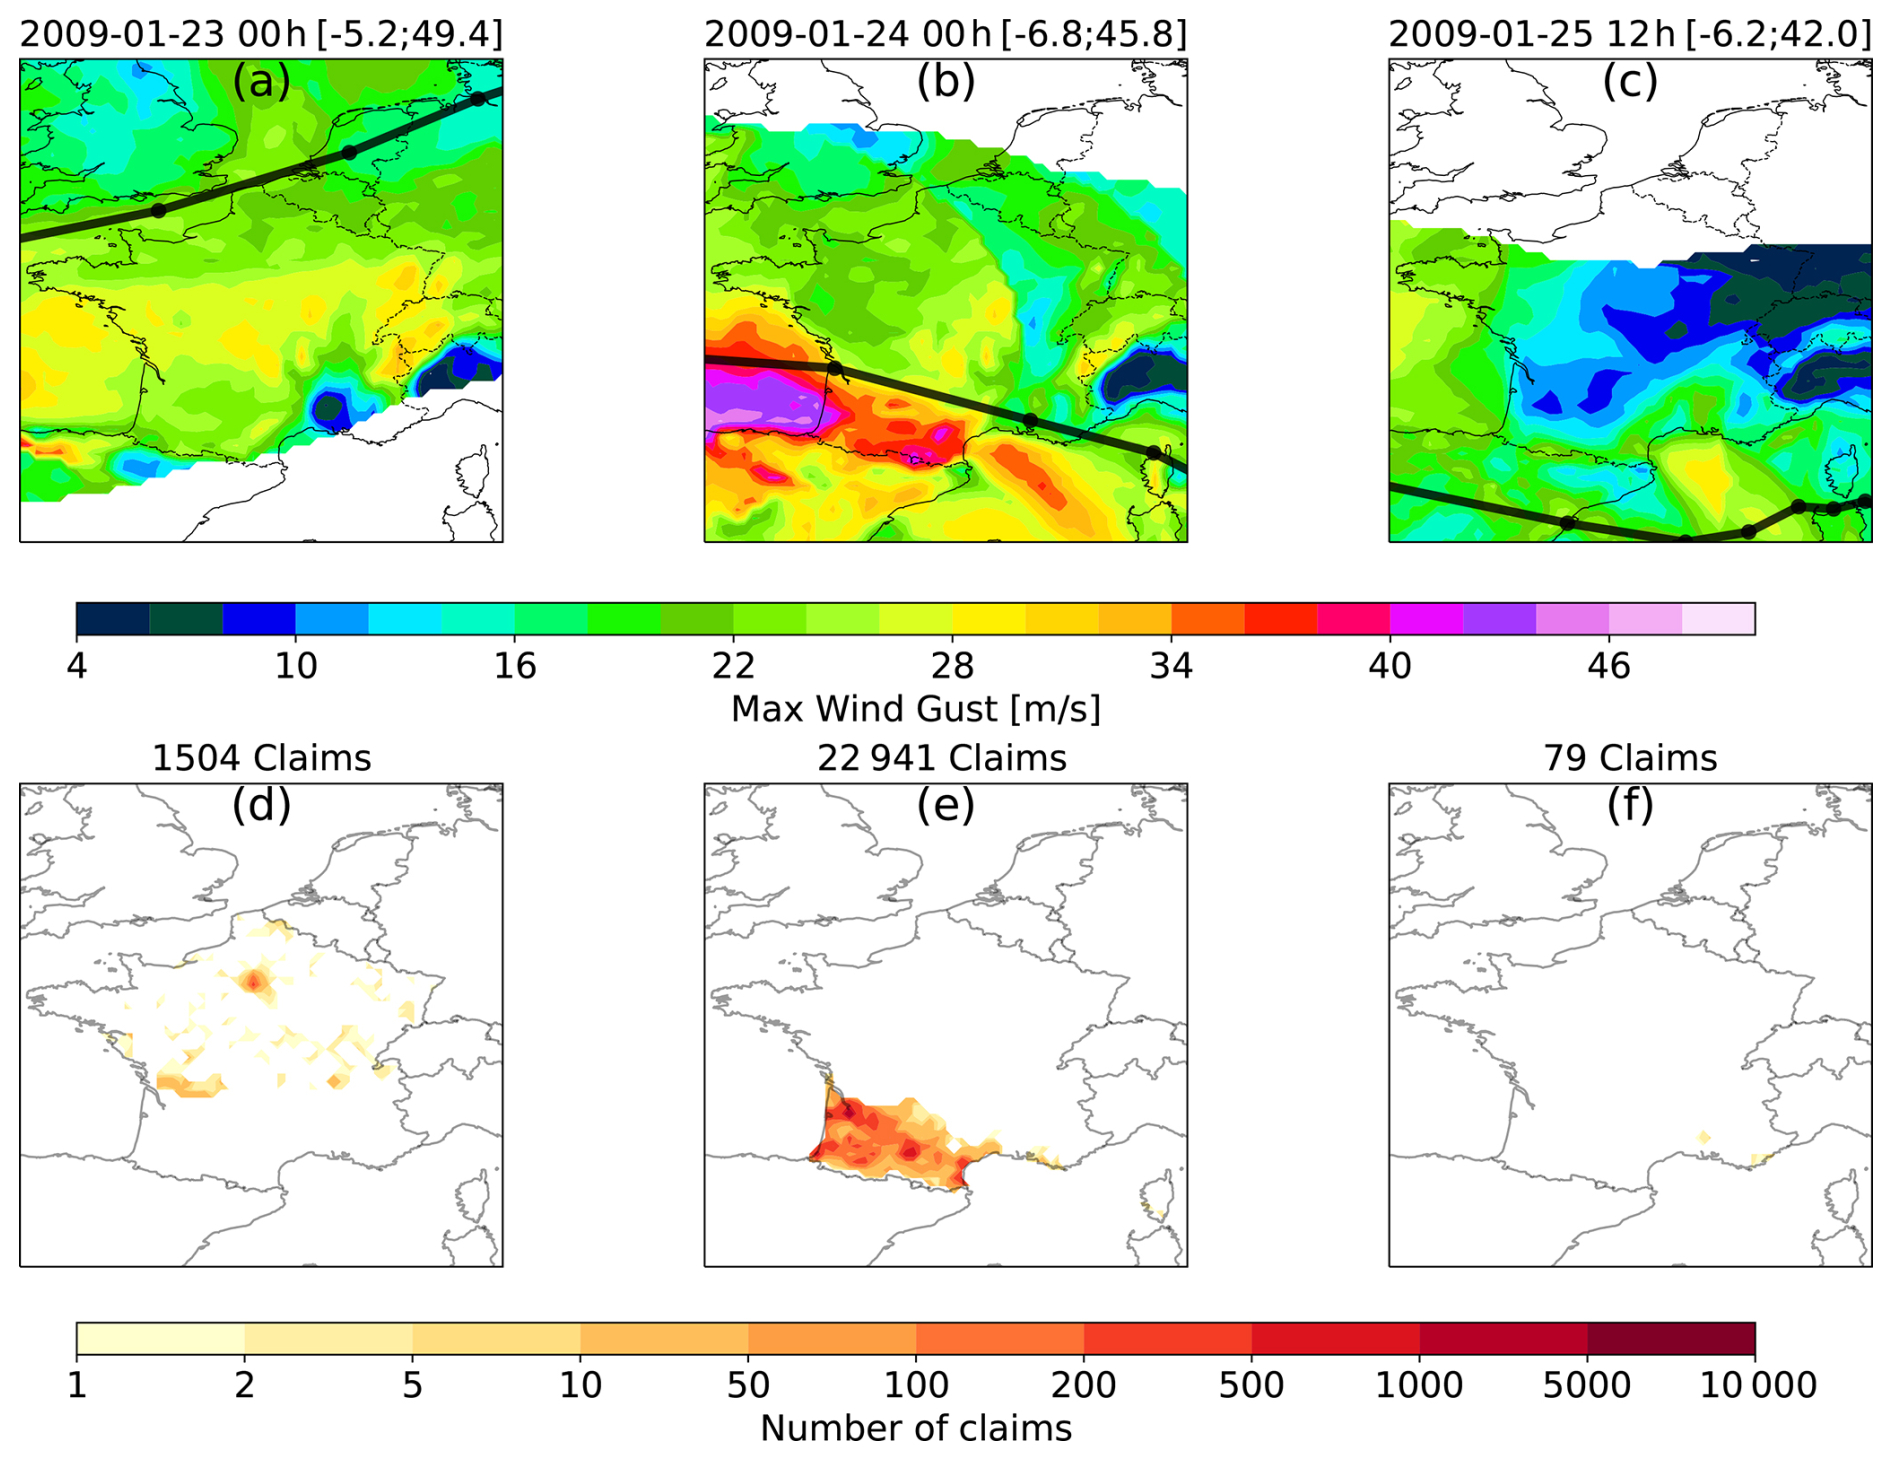
Figure 8Same as Fig. 7 with storm A (”2009-01-23 00h [-5.2;49.4]”) in panels (a) and (d), storm Klaus (”2009-01-24 00h [-6.8;45.8]”) in panels (b) and (e), and storm B ”2009-01-25 12h [-6.2;42.0]” in panels (c) and (f).
Storm Klaus affected Southern France and Northern Iberia between 23–24 January 2009. It was characterised by an explosive deepening of 37 hPa within 24 h, which is relatively uncommon for this latitude (Liberato et al., 2011). This rapid intensification was driven by an extended and intense polar jet at upper levels. At the surface, strong wind gusts caused significant damage to infrastructure and forests (AIR, 2009).
Storm Klaus is often treated as a standalone event by many insurers (Roberts et al., 2014; PERILS, 2025). Claims filed within a 72 or 96 h window around 24 January 2009, are typically attributed solely to Klaus. However, our association results reveal that Storm Klaus was part of a broader storm cluster. The tracking algorithm identified a preceding depression, which we here name Storm A, crossing Northern France on 23 January 2009, which produced significant wind gusts exceeding 20 m s−1 in central and northern France. Additionally, a secondary low-pressure system developed on 25 January 2009, that we name Storm B, was potentially responsible for claims in the South-West of France. As illustrated in Fig. 8, wind gusts generated by the 23 January and 25 January ETCs exceeded those generated by Klaus in several regions. This suggests that damages in northern and central France may not be attributable to Klaus alone. These findings demonstrate the added value of our storm-claim association method and highlight the importance of including smaller depressions in storm databases.
This example demonstrates the importance of the accurate storm–claim association, especially in cases of clustering. Attributing all impacts to Storm Klaus neglects the influence of smaller depressions. The relative contribution of these small systems within a 96 h cumulative sum is essential for understanding the role of serial storm clustering. This study highlights potential pitfalls in the interpretation of clustered events, as aggregated losses, claims, or impacts over a period as large as 72 or 96 h often encompass damage from multiple storm events. It remains unclear whether Klaus alone would have caused similar levels of damage had it not been preceded by another low-pressure system. This consideration is critical for understanding compound and cascading impacts.
4.3 Statistics over the whole catalogue
The clustering method described in Sect. 2.2 can be applied to the subset of storms that produced insured losses. This allows us to identify high-impact clusters, defined as clusters for which at least two storms are associated with damage, such as Lothar and Martin in 1999. Among the 322 storms associated with impacts for Generali, 161 belong to 72 high-impact clusters. This represents nearly 50 % of damaging storms, compared with only 29 % when clustering is applied to the full set of tracked storms. It means that the impactful storms are more frequently part of clusters.
Although clustered storms are not the most numerous, they account for the majority of losses. Figure 3 already shows that 82 % of the 40 costliest storms for Generali occurred within clusters. Extending this analysis to the full dataset reveals that clustered storms are responsible for 85 % of total windstorm losses and claims. This share far exceeds their physical occurrence frequency. Therefore, storms in clusters appear not only more likely to cause impacts, but also more likely to be associated with the most damaging events.
Section 3.2 highlighted the strong interannual variability in both storm frequency and losses. A similar variability is found in storm clustering. The period from 2000 to 2005, for example, is characterised by few impactful storms for Generali (less than 10 storms) and correspondingly moderate losses. In contrast, the decade 2013–2023 is associated with important storm losses and a prominent storm clustering. Interestingly, the number of clustered storms in a season is not, by itself, the main driver of seasonal losses. Winter 2021/22 illustrates this: although only three storms are classified as clustered, they accounted for most of the seasonal losses. As discussed in Sect. 3.2, this indicates that the method also captures the contribution of smaller depressions embedded within active periods, whose cumulative impacts can be substantial.
For the costliest winters on record for Generali France, including 1999/2000, 2008/09, 2009/10, 2019/20, and 2023/24, nearly all losses are associated with clustered storms. These seasons were dominated by well-known major events, such as Storms Kurt, Lothar, and Martin in 1999/2000; Storm Klaus in 2008/09; Storm Xynthia in 2009/10; Storms Amélie, Fabien, Ciara, Ines, and Karine in 2019/20; and Storms Ciarán, and Domingos in 2023/24. This confirms that the most damaging seasons tend to be characterised not only by intense individual storms, but also by the close temporal succession of multiple impactful systems.
Consistent with Sect. 3.2, we use the same insurance-based metrics (defined in Sect. 2.3) derived from the claim–storm association, but here we distinguish between individual storms and storms occurring within clusters (Fig. 9). Although both samples contain a similar number of events, clustered storms show a much wider distribution of total cost per storm (Cs). They include the most damaging events, resulting in higher mean and median losses, but also a larger share of low-cost storms, reflected in a lower first quartile. This broad spread highlights the heterogeneous nature of clustered periods, which combine one or more high-impact storms with several weaker yet still damaging systems. A similar pattern emerges for the number of claims per storm (Fig. 9c). Clustered storms generate more claims on average, but with greater variability, spanning both very active and relatively minor events. As a consequence, clustered periods tend to be more costly overall, primarily because the most damaging storms, both in terms of total losses and claim counts, are more often embedded within clusters. The distribution of impacts among successive storms within clusters is examined in more detail in Sect. 4.4. In contrast, the mean cost per claim (; Fig. 9b) is similar for clustered and individual storms (EUR 2786 vs. EUR 2687). This indicates that clustering influences total losses mainly through the number of claims and their allocation across successive storms, rather than through substantial differences in the average severity of individual claims.
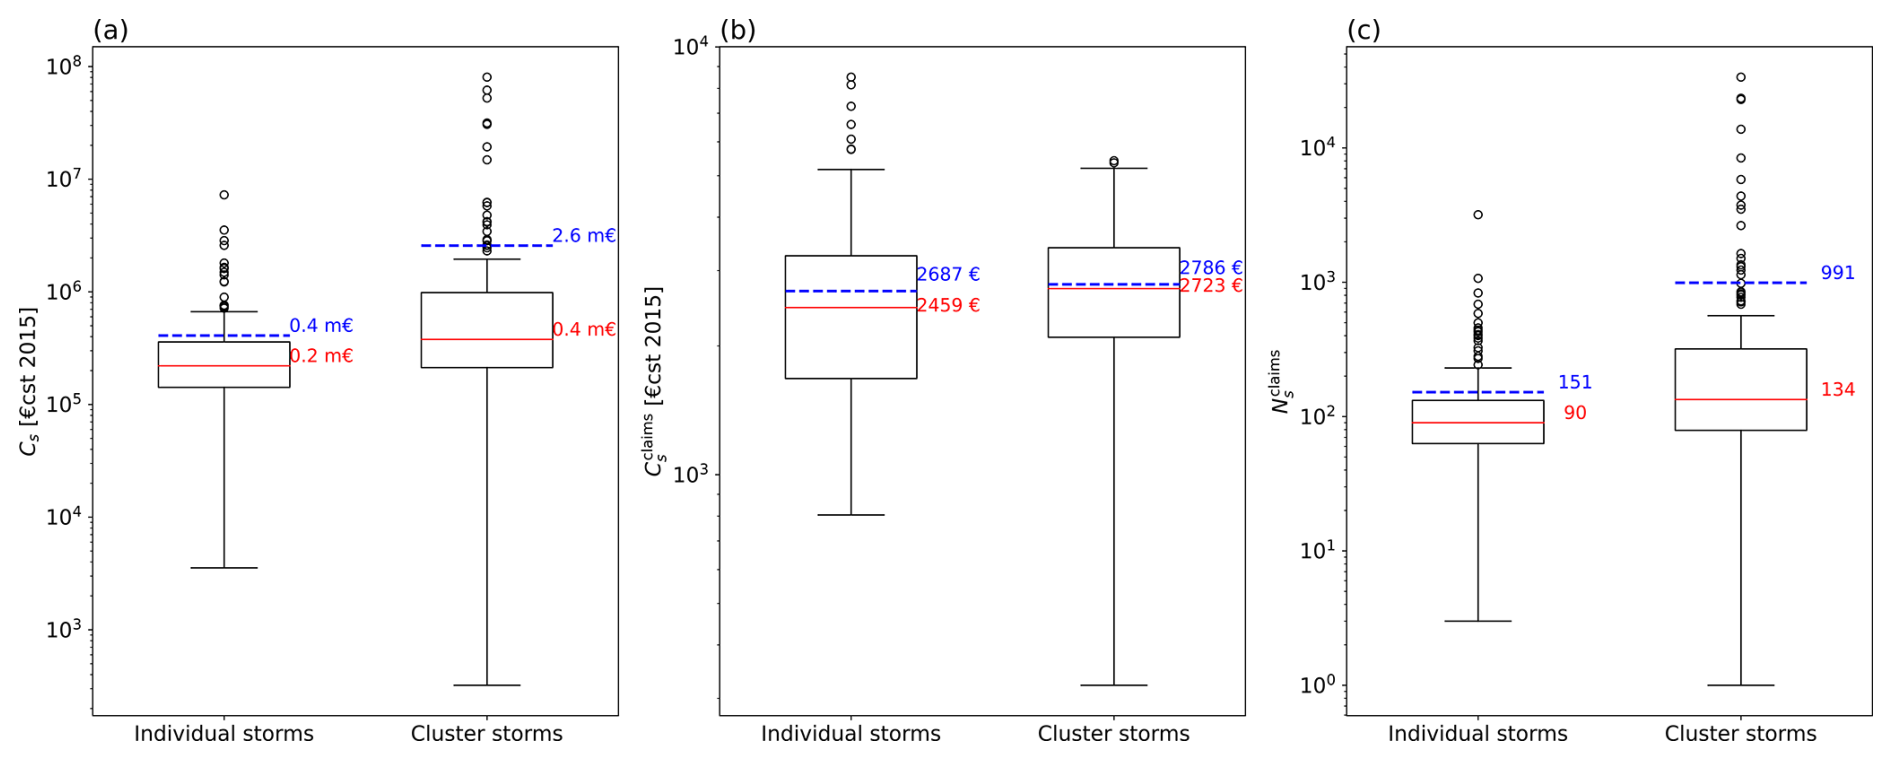
Figure 9Distribution of the total cost per storm Cs in constant EUR 2015 (a), the mean cost per claim in constant EUR 2015 (b), and the number of claims per storm (c). Left bar plots show the statistics for the individual events and right ones for the storms being part of a cluster. Red solid lines indicate the median while blue dashed ones the mean.
Individual and clustered impactful storms also differ in intensity. Figure 10 presents the distributions of minimum MSLP, maximum ζ850, and storm duration. Storms associated with damage exhibit lower minimum MSLP and higher maximum vorticity than the full set of potentially impacting storms, with these contrasts being even more pronounced for storms embedded in clusters. Consistent with Mailier et al. (2006), the most intense storms affecting Generali France are therefore more likely to occur as part of storm sequences. In terms of duration, individual and clustered storms show broadly similar distributions. However, impactful storms, whether isolated or clustered, tend to persist longer than the complete ETC sample, suggesting that longer-lived systems have a greater potential to generate substantial damage. The spatial distribution of storm tracks, including all storms as well as individual and clustered impactful storms, is shown in Appendix C.
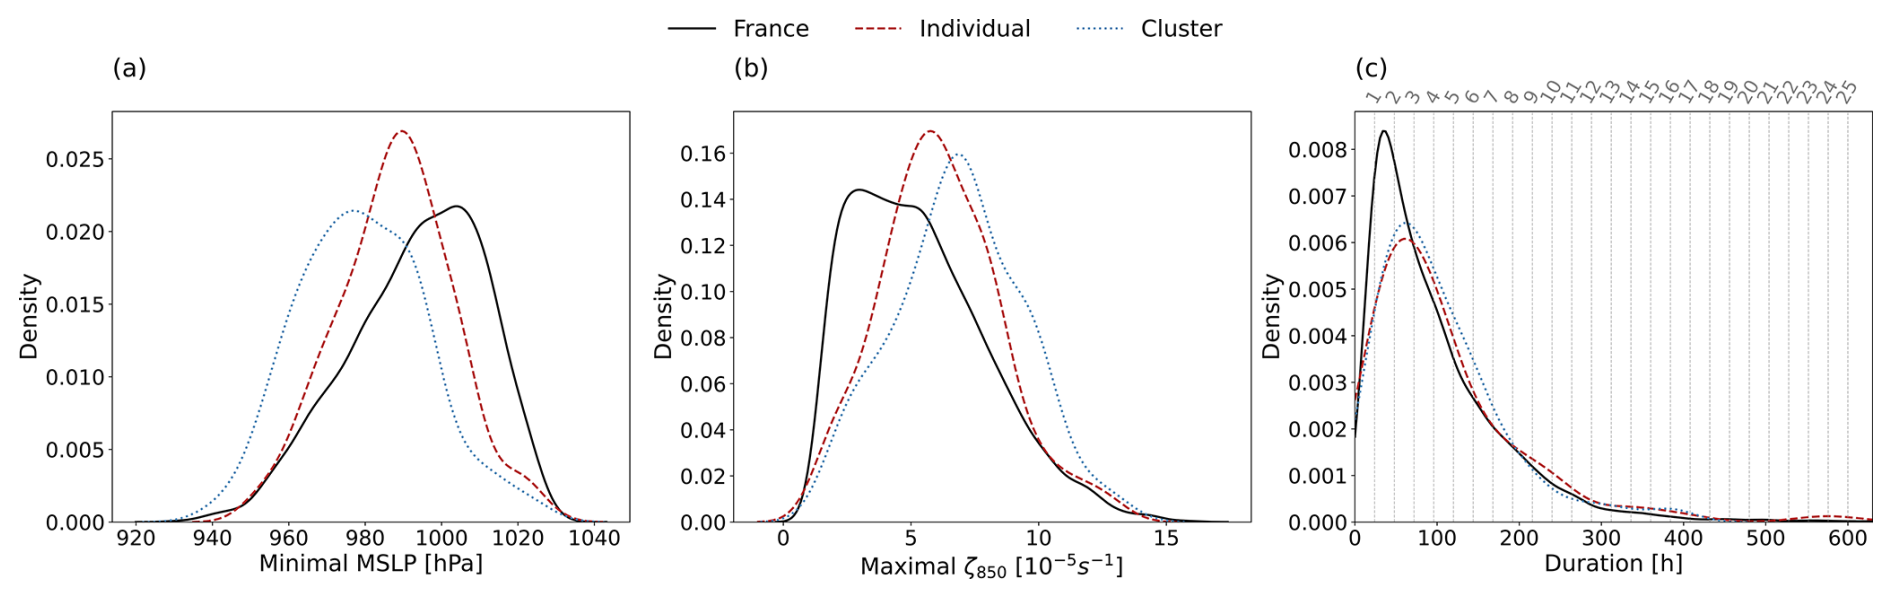
Figure 10Distribution of storm characteristics: (a) minimal MSLP, (b) maximal ζ850, and (c) storm duration. Vertical dashed grey lines indicate the corresponding number of days, with the value shown above each line. Black solid lines show the distribution for all tracks potentially impacting France (4439 storms; Sect. 2.1), blue dotted lines correspond to impactful storms that are part of clusters (167 storms), and red dashed lines correspond to individual impactful storms (168 storms).
These physical differences explain the patterns observed in the insurance metrics (Fig. 9). Clustered storms concentrate the most intense systems, corresponding to the highest costs and largest numbers of claims, while also including less severe events whose losses are distributed across the cluster. The greater depth, higher vorticity, and longer duration of clustered storms drive their overall amplified financial impact.
4.4 Intra-Cluster Analysis
Figures 3 and 4 together emphasise the importance of an event-based analysis, showing that losses are driven not only by the clustering phenomenon but also by the characteristics of individual storms. Section 4.3 shows that clustered storms are the most intense and are associated with amplified financial impacts, but the total loss within a clustered event is not necessarily concentrated over a single storm. To better understand how damage is distributed within clusters, we examine the contribution of each storm member to the overall cluster loss. For each storm within a cluster, we compute its share of the loss as the total cost of that storm divided by the total cost of the cluster. This share is then compared to the storm's loss and occurrence rank, where a loss rank of 1 corresponds to the costliest storm and an occurrence rank of 1 corresponds to the earliest storm in the cluster.
From the 75 identified cluster events, Fig. 11 shows the share of the loss as a function of these ranks. Figure 11a highlights a wide spread of the loss within the several clusters, the costliest storm can account for between 41 %–99 % of the total cluster losses. On average, we found that the costliest storm of the cluster represents 70 % of the cluster's total cost, indicating that a single storm often dominates the overall loss. Nonetheless, the remaining share of losses still reflects a significant contribution from additional storms within the same cluster, underlining the need for insurance of grouping claims around clusters. This further demonstrates that the total observed damage often arises from the temporal clustering of multiple storms.
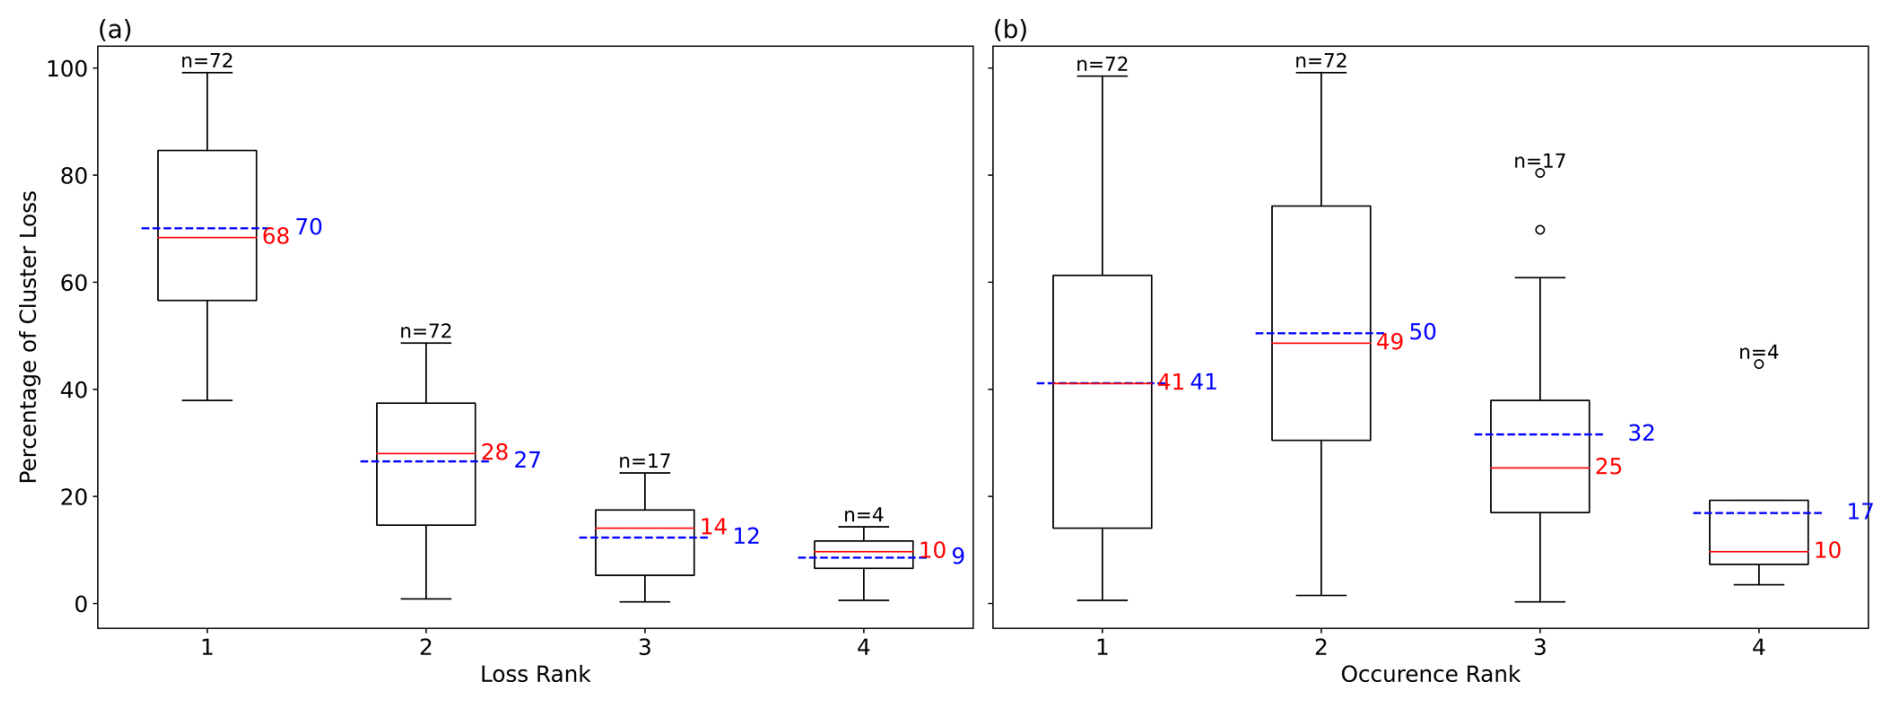
Figure 11Distribution of the loss within the members of the cluster as a function of the loss (a) and occurrence rank (b). Solid red lines indicate the median, and blue dashed ones the mean. The numbers above each box correspond to the number of clusters used for each box plot.
Figure 11b shows that the order of arrival is not a systematic driver of loss. On average, the first storm contributes 41 % of the cluster loss, but this value varies widely, from nearly zero to nearly the total impact of the cluster. Similar variability is observed for the second storm, while the third and fourth storms generally contribute less. Few clusters contain more than two storms, and for clusters with three or four members, an equally split loss corresponds to roughly 30 % and 25 % of the total cluster loss, respectively. This can explain the loss values observed for clusters with more storm members.
Finally, the near-equality of the medians and means in the box plots suggests that the distribution of cluster losses, by both loss and occurrence rank, is approximately Gaussian. Unlike the event-based analysis shown in Fig. 9, the cluster-based perspective indicates that the most extreme storms do not systematically account for the entirety of cluster losses. If they did, the distribution of losses at the cluster scale would be as strongly skewed as the distributions of cost and number of claims per storm. Instead, losses are more evenly distributed among the storms composing each cluster.
A similar analysis can be applied to the claim frequency (Appendix. D), represented by the number of claims per event. The results are comparable: on average, the most impactful storm accounts for 68 % of the total claims, with substantial variability in the share of claims across different claim ranks. Figure D1 also indicates that the order in which storms occur within a cluster does not appear to influence how claims are distributed among the storms.
Extracting quantitative impact information from insurance claims presents significant challenges. While such data provide a direct measure of socioeconomic impact, it is often influenced by variations in insurance exposure, both spatially and temporally. Moreover, uncertainties inherent to claim reporting and perception-based declaration processes can lead to quality issues in the raw records. Reported damages depend on the awareness of policyholders and claims managers, who may be influenced by external factors such as media coverage of the event. This leads to an under-representation of smaller or moderate windstorms. This phenomenon is referred to as “historical perception bias” (Stucki et al., 2014; Gall, 2015). Additionally, the occurrence and severity of damage cannot be fully explained by physical storm variables alone, because socio-economic factors and inherent randomness also play roles (Birkmann et al., 2013). Careful post-processing is therefore essential to extract meaningful signals from claim databases.
This study introduces a pragmatic methodology to associate individual claims data with ETCs, enabling a more accurate attribution of damages. The method is based on three tunable parameters: a temporal window around storm occurrence date (Xb days before and Xa after) and a minimum claim threshold (nclaims) to identify impactful events. Applied to windstorm claims from Generali France, the optimal window of 3 d before and after storm events and a gathering around storms with at least 50 claims effectively captures the storm-related damage signal. The association procedure also adjusts the declared dates of damage, improving their consistency with the storm occurrence date, and shows that the vast majority of claims fall within the defined temporal window. While the method was tested on the claim data from a single insurer in France, its design is adaptable to other perils, portfolios, and regions. The simplicity of the tuning parameters makes the method highly transposable to other hazards (e.g. flood, convective storms) as well as other types of damage (e.g. hail, water infiltration). The method can also be adjust to align more closely with different association perspectives.
The resulting claim–storm associations reveal coherent spatial structures and a strong correlation between local wind gust intensity and damage, validating the physical basis of the approach. The 40 most damaging events identified for 1998–2024 match well with existing storm databases, and cost metrics per storm align with previous findings from the insurance literature (Fédération France Assureur, 2025; Mission Risques Naturels, 2021). This highlights the method's robustness and its potential for systematic storm impact identification.
This paper investigated the impact of clusters of storms using ERA5 data, which can be a limitation when focusing on historical storm events. Discrepancies between reanalysis and observational datasets in terms of wind gust values are well documented (Flynn et al., 2024). The proposed method is based not only on the date of the storm but also on the wind-gust value observed at the claim location. It can thus be expected that with different meteorological input data, different impacting storms and consequently clusters could be identified. Exploring the sensitivity of outcomes to different meteorological sources would be a valuable step in testing the method's robustness.
Although assumptions were necessary to attribute claims to storms, direct attribution remains inherently uncertain. In particular, it was assumed that the damage resulted from the storm generating the highest local wind gust. Our method was built to overcome the issue of not knowing the driver of the loss. As windgust is known to be one of the primary drivers of damage, this variable was used to disaggregate claims associated with overlapping events. Incorporating alternative variables, such as sustained 10 m wind or upper-level wind, could lead to the detection of different impacting storms (Deroche et al., 2014). However, recent research shows that claim behaviour aligns similarly with various wind metrics (Fonseca Cerda et al., 2024). In the context of storm clustering, attributing damage to a single event becomes especially challenging, as multiple storms with high wind intensity are observed at the same time. In such situations, damage may not be attributable to a single storm but rather to the cumulative effect of multiple high-wind events occurring in close temporal succession. Because wind gusts are relatively localised, the method can distinguish between storm events when high-intensity winds occur in distinct areas (e.g. Storm Klaus, Sect. 4.2). Conversely, in cases like Lothar and Martin (Sect. 4.1), where the same locations experienced high wind gusts from multiple events, further analysis would be required to compare the observed damage with what would be expected if each storm came outside of a cluster.
Clusters of storms were defined from an impact-centric perspective, using Generali France's claim data. The choice of a 96 h window reflects Generali France's reinsurance aggregation policy, but this duration could be adjusted depending on in-place reinsurance policies. Larger aggregation windows could amplify clustering effects. While statistical metrics such as event dispersion could also define clusters, they do not easily support event-based attribution as required by impact modelling.
Accurate event attribution has direct implications for both insurance and reinsurance practice. From an insurance perspective, losses are typically aggregated within a fixed temporal window, most commonly 72 h, and extended to 96 h in our case. As this aggregation window increases, temporally close events are more likely to be grouped into a single loss event, thereby reducing the number of reimbursable occurrences and potentially lowering overall reinsurance costs. Our analysis shows that claims may be reported up to 3 d before or after the actual storm date. By reassigning claims to their causative storm and using storm occurrence dates rather than reported claim dates, losses can be grouped more consistently according to the underlying physical events. In practice, a 96 h reinsurance window centred on storm dates could therefore encompass claims spanning a total period of up to 240 h when reporting delays are taken into account. This storm-based association provides greater flexibility and physical consistency in the definition of insurance events. It also offers a framework that could support reinsurance contract design, where aggregation periods are intended to reflect single meteorological events. By correcting for reporting inaccuracies, the association helps ensure that distinct physical storms correspond to separate reinsurance events, in line with the principles underlying reinsurance aggregation clauses (William, 2023). Understanding historical storm clustering and comparing these patterns to those simulated in catastrophe models is essential for refining reinsurance structures and improving financial preparedness (Kaas, 2009; Khare et al., 2015).
Storm clustering also raises fundamental questions about how vulnerability evolves under successive impacts. Most catastrophe models assume static vulnerability and event independence, neglecting potential changes in exposure or structural integrity caused by preceding storms (Dorland et al., 1999; Klawa and Ulbrich, 2003; Heneka et al., 2006; Schwierz et al., 2010; Prahl et al., 2015; Pardowitz et al., 2016). In clustered situations, however, assets weakened by an initial event may become more susceptible to subsequent storms, amplifying damage even if later hazards are weaker. Recent work by Van Ederen et al. (2025) demonstrates that vulnerability curves conditioned on compound wind–precipitation extremes differ substantially from single-hazard relationships, highlighting how prior or concurrent stressors can modify damage responses. The physically consistent attribution of claims to individual storm events proposed here provides a necessary foundation for extending such approaches to temporally compounded windstorms by separating meteorological forcing from evolving asset susceptibility.
More broadly, these findings highlight the relevance of a compound-event perspective, which has recently emerged as a framework for understanding impacts arising from interacting or temporally compounding hazards (Fehlman et al., 2025; Zscheischler et al., 2018, 2020). Applied to windstorms, this perspective emphasises that both hazard characteristics and vulnerability may interact across successive events. It also raises open questions regarding how losses should be attributed and partitioned among storms within a cluster. Addressing these issues is essential for improving our physical understanding of storm impacts and for interpreting damage patterns during clustered periods, particularly when multiple events contribute jointly to observed losses.
A key aspect of this work lies in its ability to disentangle and attribute damage within storm clusters. Case studies of storms Kurt, Lothar and Martin (Sect. 4.1), as well as storm Klaus (Sect. 4.2), demonstrate that simple date-based attribution is insufficient to separate the impacts of temporally or spatially overlapping events. Our analysis shows that the most damaging storms are frequently embedded within clusters, consistent with earlier findings by Vitolo et al. (2009), Cusack (2016), who highlighted the tendency for intense ETCs to occur in series. We further show that impactful storms exhibit distinct physical characteristics depending on whether they occur individually or as part of a cluster. In particular, clustered storms are more intense, with lower minimum mean sea level pressure and higher maximum vorticity, providing a plausible physical explanation for their larger associated losses.
While this study primarily quantifies losses from a damage-based perspective, a major avenue for future research is to investigate the physical mechanisms underlying these impacts, especially within clustered sequences. Priestley et al. (2020) reported that seasons marked by temporally concentrated storm activity tend to feature a higher proportion of secondary cyclogenesis. Exploring this process during clustered periods could illuminate the mechanisms driving amplified damage. Similarly, the case studies of Lothar (in 1999) and Klaus (in 2009) highlight the role of explosive cyclogenesis, which produces severe impacts due to rapid pressure deepening (Ginesta et al., 2023). Understanding how clustering interacts with such dynamical processes, whether it coincides with, enhances, or even triggers extreme intensification, would require analysing complete ETC tracks alongside large-scale atmospheric conditions. Therefore we provided simple statistical diagnostics that outline physical features of clustered storms, vs. single storms. A complete physical analysis would be beyond the scope of our paper.
The association method presented in this paper offers a framework for improving our understanding of storm-related damage by proposing a better association of storm occurrence and insurance claims. We underline that a temporal window of a few days before and after, as well as a threshold over the minimal number of claims per event, was essential to capture all the impacts. This method enhances the attribution of damage to specific physical events, which is key for risk assessment, loss estimation and prevention strategies. It also supports the identification of storm clusters and provides a foundation for assessing compounded risk. The information that is obtained on the claim attribution with this method allows a better share of incurring costs between insurance and reinsurance companies.
The study highlights an exacerbated impact linked to clusters of storms, which are responsible for 85 % of the total losses over the period 1998–2024 for Generali France. We further show that storms causing damage occur in more frequently in clustered sequences than the full set of potential ETCs affecting France. Additionally, damaging storms within these clusters tend to be more intense than those occurring in isolation. Within clustered periods, the share of losses attributable to the most costly storm varies widely, with an average contribution of 70 % of total losses. Notably, this share is not influenced by the storm order of arrival. Case studies of well-known high-impact storms further validated the method ability to disentangle the damages caused by successive storms. Overall, these results contribute to a more comprehensive understanding of how the interaction between hazard characteristics and exposure dynamics contributes to storm-related losses, supporting the development of more physically and event-consistent approaches managing compound weather risks.
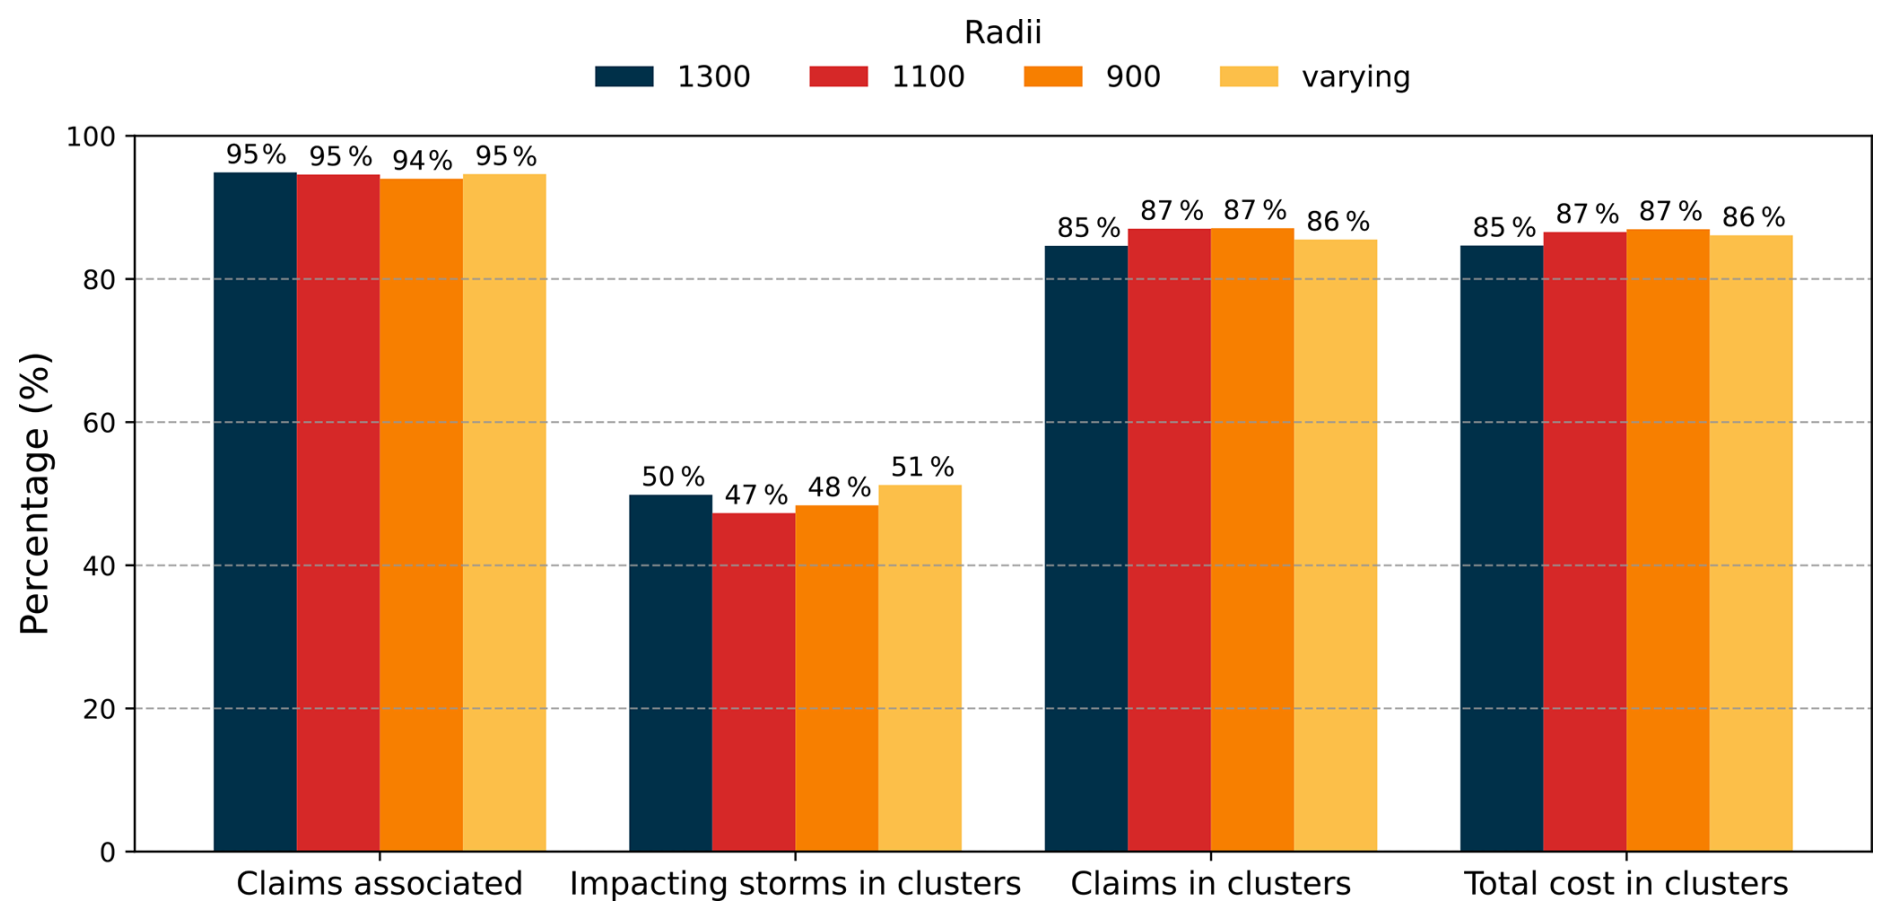
Figure A1Percentage of claims from the raw data associated with a storm event, of storms in clusters, claims in clusters and the total cost associated with cluster events. Dark blue bars are the results of the associated used in the paper, red, orange and yellow bars are the results of perturbed associated performed using a radius of, respectively, 1100, 900 km and a varying radius.
The outcome of the association procedure depends on the definition of storm footprints and is therefore influenced by both the tracking algorithm and the definition of storm impact area. In this study, we adopted a broad characterisation of ETC, encompassing short-lived and localised depressions. Moreover, no distinction among depressions was made when constructing the storm footprints: a uniform radius of 1300 km was applied to all ETC throughout their entire life cycle. Since this choice can strongly affect the association between storm events and insurance claims, we tested alternative footprint definitions. Specifically, we reduced the constant radius to 1100 and 900 km, and we further implemented a variable-radius approach conditioned on storm intensity, represented by the minimum sea-level pressure (MSLP) observed during the cyclone's life cycle. In this latter case, the radius was defined as follows:
Using these alternative footprint definitions, the number of storms associated with impact was 332, 339, and 330 for the 1100, 900 km, and variable-radius cases, respectively. Figure A1 shows the corresponding results across several statistical indicators. Overall, the total number of claims associated with storms remained unchanged across the different configurations. Among storms linked to impacts, the proportion of those forming clusters is similar, ranging from 47 % with the 1100 km radius to 51 % with the variable radius. Likewise, both the number of claims and the total losses attributed to clustered storms remain of comparable magnitude regardless of the radius specification.
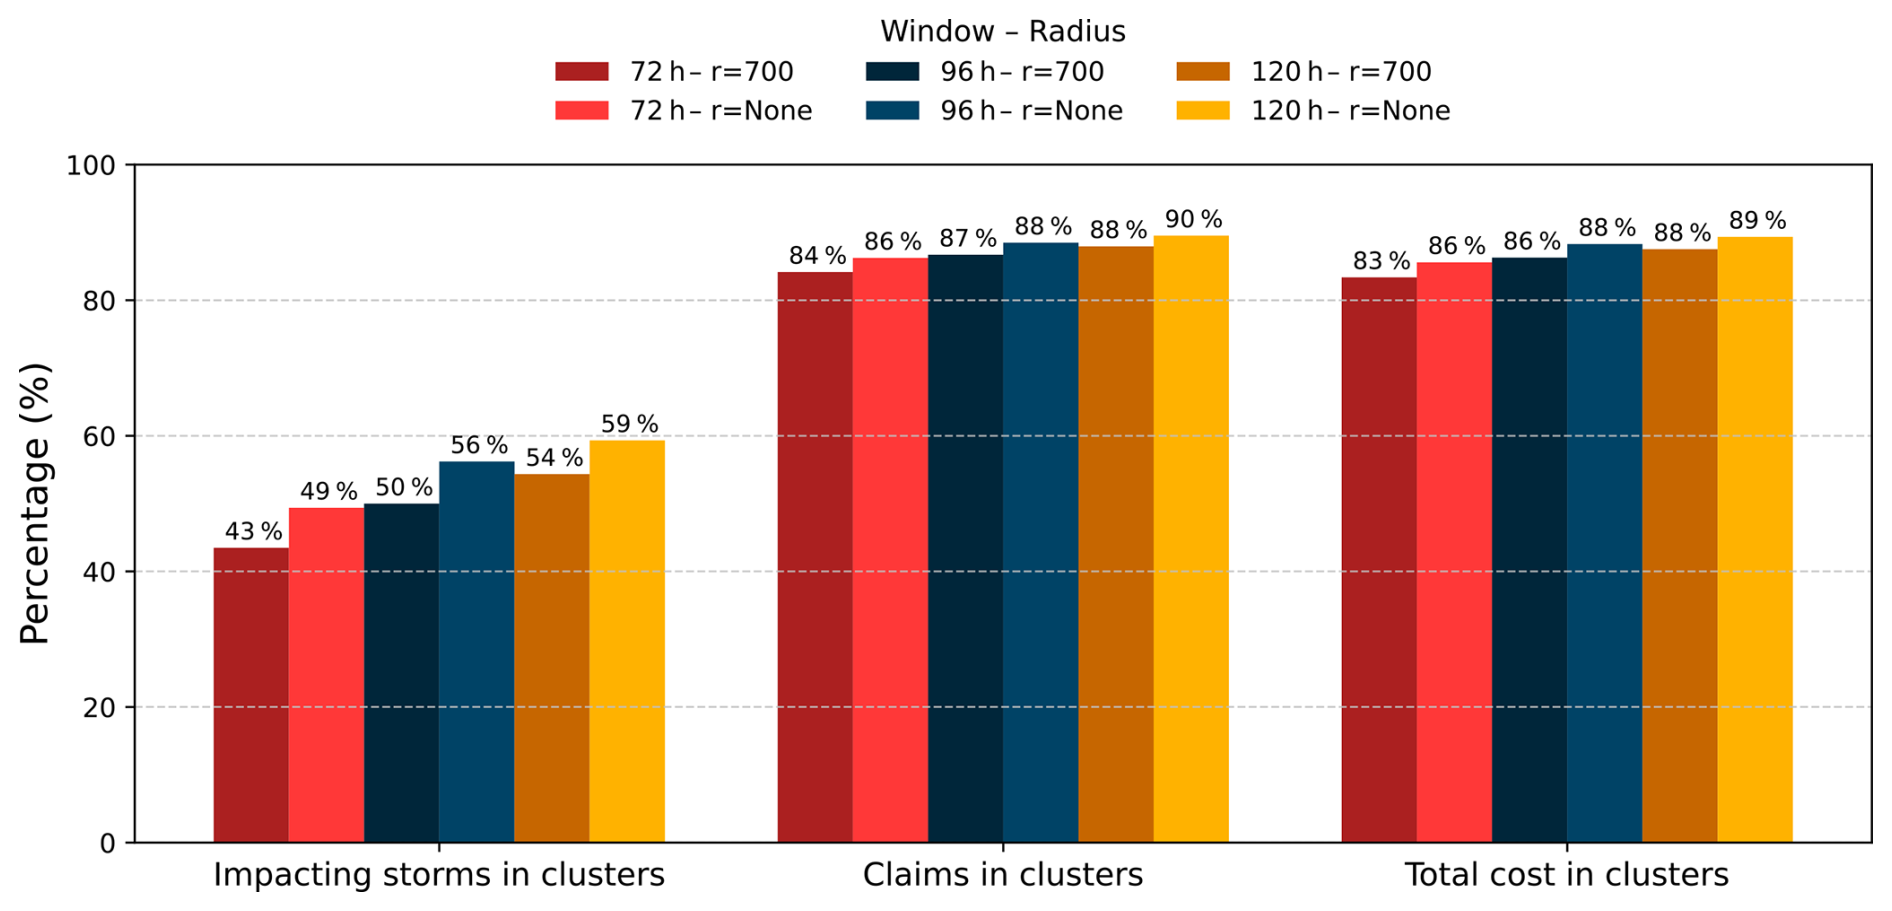
Figure B1Percentage of storms assigned to clusters, percentage of claims occurring in clusters, and the total cost associated with clustered events. Dark blue bars show the results from the association method used in the main analysis. Red, orange, and yellow bars correspond to sensitivity tests using alternative temporal windows for the clustering definition (72 and 120 h, respectively). Lighter shades of each colour indicate results obtained when the spatial criterion is not applied.
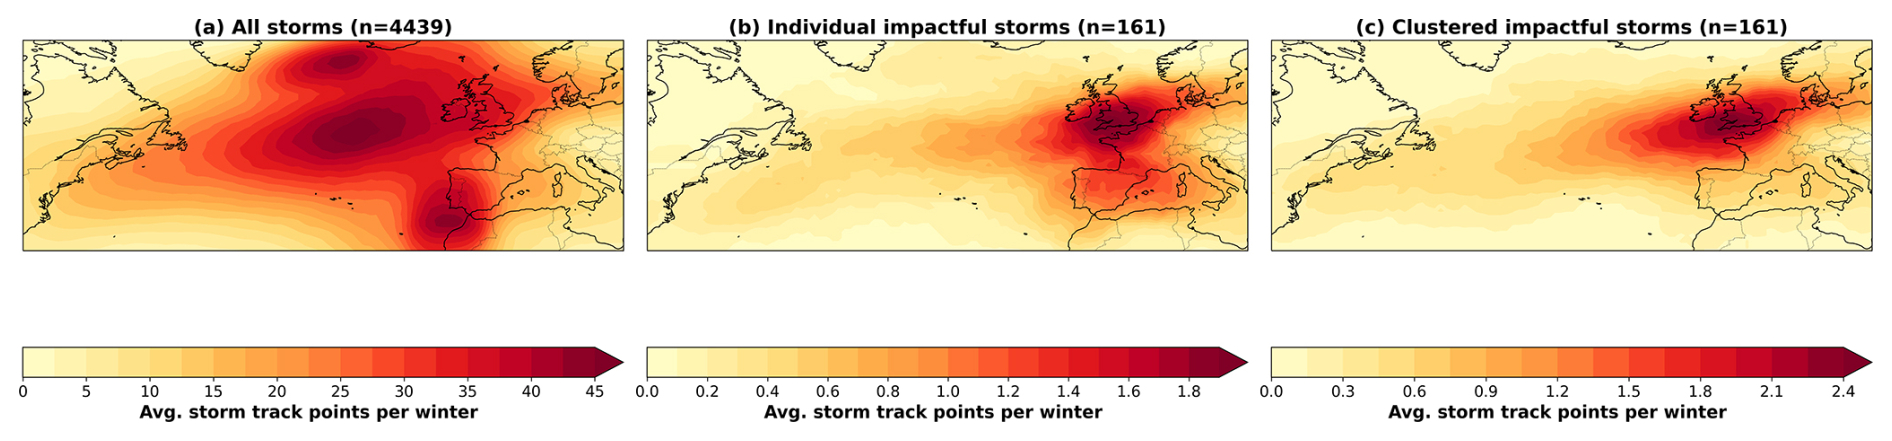
Figure C1Distribution of storm tracks with an impact radius of 1300 km for the set of all storms (a), isolated impactful storms resulting (b) and clustered impactful storms (c).
Figure D1 shows the share of the claim intensity as a function of the claim and occurrence rank. A claims rank of 1 corresponds to the member of the cluster with the most number of claims.
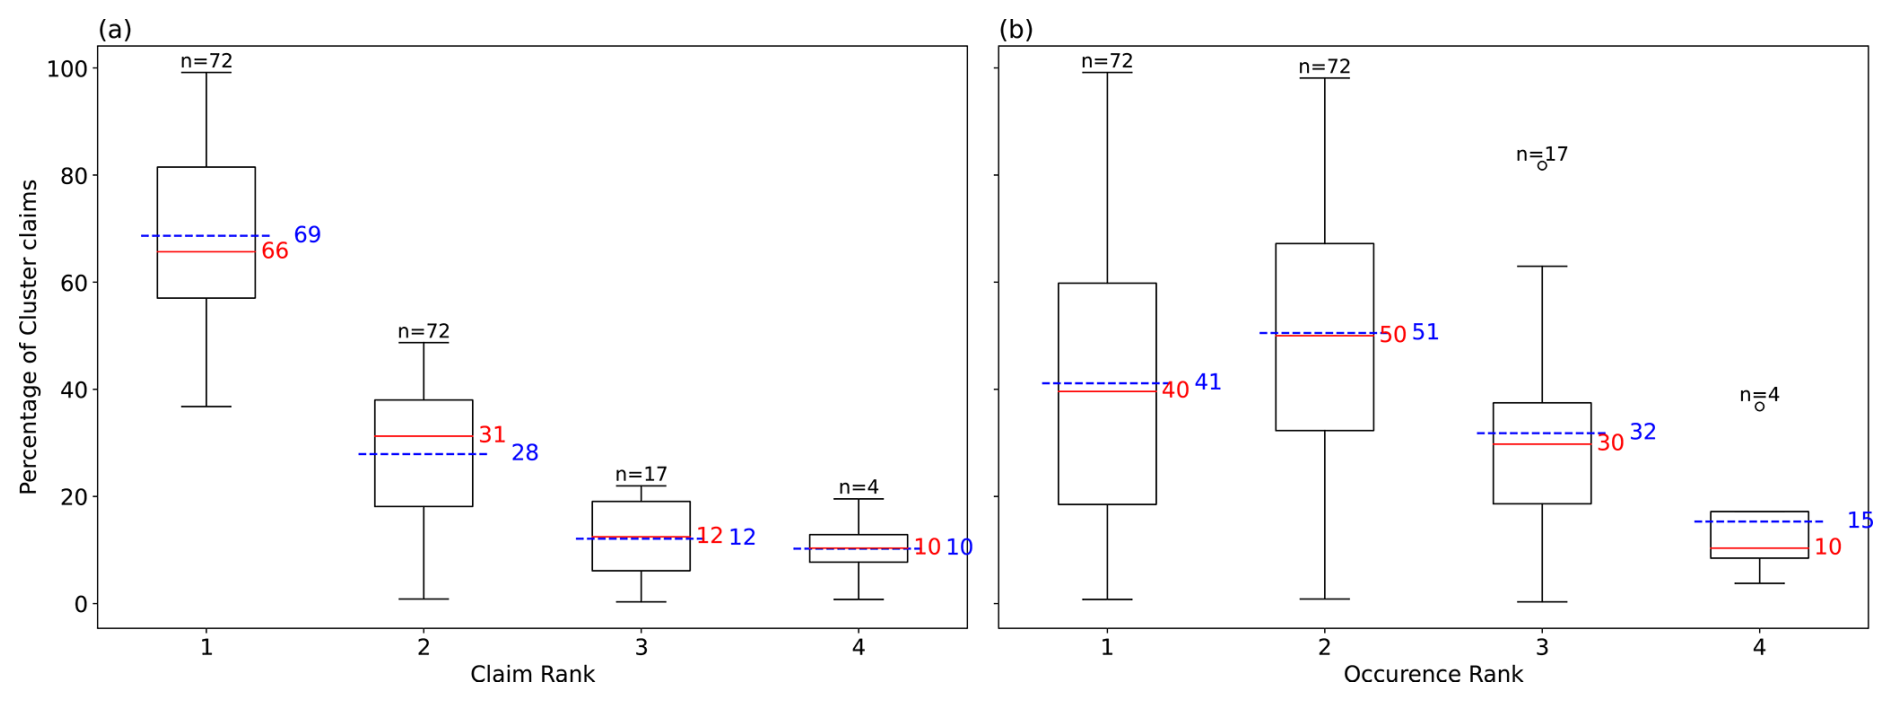
Figure D1Distribution of the number of claims within the members of the cluster as a function of the claim rank (a) and occurrence rank (b). Thick red lines indicate the median, and blue dashed ones the mean. The numbers above each box correspond to the number of members used for each box plot.
Scripts to reproduce the main results of this publication are available at https://doi.org/10.5281/zenodo.15771837 (Hasbini, 2025).
ETC tracks were provided by Matthew Priestley. ERA5 data is openly available in Copernicus Climate Change Service Climate Data Store at https://doi.org/10.24381/cds.bd0915c6 (Copernicus Climate Change Service, 2026). Generali claims datasets analysed in the current study are not publicly available as they are proprietary to the company.
The supplement related to this article is available online at https://doi.org/10.5194/nhess-26-2817-2026-supplement.
LH: Conceptualisation, Methodology, Software, Validation, Formal analysis, Data Curation, Writing – Original Draft; Visualisation; PY: Conceptualisation, Supervision, Writing – Review and Editing; QH: Conceptualisation, Supervision, Data Curation; AP: Conceptualisation, Supervision,; LB: Conceptualisation, Supervision.
The contact author has declared that neither of the authors has any competing interests. Authors Laura Hasbini, Laurent Boissier, and Arthur Perringaux are employed by Generali France.
Publisher's note: Copernicus Publications remains neutral with regard to jurisdictional claims made in the text, published maps, institutional affiliations, or any other geographical representation in this paper. The authors bear the ultimate responsibility for providing appropriate place names. Views expressed in the text are those of the authors and do not necessarily reflect the views of the publisher.
This work was supported by Generali France, which funded Laura Hasbini's PhD thesis. We thank Matthew Priestley (U Exeter, UK) for useful discussions on the storm tracking algorithm.
This research has been supported by the Association Nationale de la Recherche et de la Technologie (grant no. 2023/0594).
This paper was edited by Joaquim G. Pinto and reviewed by four anonymous referees.
AIR: European Winter Storm Klaus, https://alert.risksolutions.verisk.com/extratropical-cyclone/2009/european-winter-storm-klaus/update-3/#summary (last access: 1 June 2026), 2009. a
APREF: Réassurance des événements naturels : problématique de la définition de l'événement, Note, APREF, https://www.apref.org/wp-content/uploads/2020/10/3._note_apref_septembre_2014_-_reassurance_des_evenements_naturels_-_problematique_de_la_definition_de_levenement.pdf (last access: 12 May 2026), 2014. a
Base Adresse Nationale: Base Adresse Nationale (BAN), https://www.data.gouv.fr/datasets/base-adresse-nationale/informations (last access: 12 May 2026), 2025. a
Birkmann, J., Cardona, O. D., Carreño, M. L., Barbat, A. H., Pelling, M., Schneiderbauer, S., Kienberger, S., Keiler, M., Alexander, D., Zeil, P., and Welle, T.: Framing vulnerability, risk and societal responses: the MOVE framework, Nat. Hazards, 67, 193–211, https://doi.org/10.1007/s11069-013-0558-5, 2013. a
Bjerknes, J. and Solberg, H.: Life Cycle of Cyclones and the Polar Front Theory of Atmospheric Circulation, Geophys. Publik., 3, 3–18, https://geofysikk.org/NGF/GeoPub/NGF_GP_Vol03_no1.pdf (last access: 12 May 2026), 1922. a
Bresch, D. N., Bispig, M., and Lemcke, G.: Storm over Europe: An underestimated risk, Technical report, Swiss Re Publishing, https://www.ipcc.ch/apps/njlite/srex/njlite_download.php?id=6598 (last access: 12 May 2026), 2000. a
Bründl, M. and Rickli, C.: The storm Lothar 1999 in Switzerland–an incident analysis, Forest Snow and Landscape Research, 77, 207–216, 2002. a
Copernicus C3S: Windstorm tracks and footprints derived from reanalysis over Europe between 1940 to present, Copernicus Climate Change Service (C3S) Climate Data Store (CDS) [data set], https://doi.org/10.24381/BF1F06A9, 2025. a
Copernicus Climate Change Service: Winter windstorm indicators for Europe from 1979 to 2021 derived from reanalysis, Copernicus Climate Change Service (C3S) Climate Data Store (CDS) [data set], https://doi.org/10.24381/CDS.9B4EA013, 2020. a, b
Copernicus Climate Change Service: ERA5 hourly data on pressure levels from 1940 to present, Copernicus Climate Change Service (C3S) Climate Data Store (CDS) [data set], https://doi.org/10.24381/cds.bd0915c6, 2026. a
Cornér, J., Bouvier, C., Doiteau, B., Pantillon, F., and Sinclair, V. A.: Classification of North Atlantic and European extratropical cyclones using multiple measures of intensity, Nat. Hazards Earth Syst. Sci., 25, 207–229, https://doi.org/10.5194/nhess-25-207-2025, 2025. a
Cusack, S.: The observed clustering of damaging extratropical cyclones in Europe, Nat. Hazards Earth Syst. Sci., 16, 901–913, https://doi.org/10.5194/nhess-16-901-2016, 2016. a, b
Cusack, S.: A long record of European windstorm losses and its comparison to standard climate indices, Nat. Hazards Earth Syst. Sci., 23, 2841–2856, https://doi.org/10.5194/nhess-23-2841-2023, 2023. a, b, c
Dacre, H. F. and Pinto, J. G.: Serial clustering of extratropical cyclones: a review of where, when and why it occurs, npj Climate and Atmospheric Science, 3, 48, https://doi.org/10.1038/s41612-020-00152-9, 2020. a, b, c
Deroche, M.-S., Choux, M., Codron, F., and Yiou, P.: Three variables are better than one: detection of european winter windstorms causing important damages, Nat. Hazards Earth Syst. Sci., 14, 981–993, https://doi.org/10.5194/nhess-14-981-2014, 2014. a
Dorland, C., Tol, R. S. J., and Palutikof, J. P.: Vulnerability of the Netherlands and Northwest Europe to storm damage under climate change, Climatic Change, 43, 513–535, https://doi.org/10.1023/A:1005492126814, 1999. a
ECMWF: Insurance impacts of European windstorms, https://stories.ecmwf.int/insurance-impacts-of-european-windstorms/index.html (last access: 13 February 2025), 2024. a
Economou, T., Stephenson, D. B., Pinto, J. G., Shaffrey, L. C., and Zappa, G.: Serial clustering of extratropical cyclones in a multi model ensemble of historical and future simulations, Q. J. Roy. Meteor. Soc., 141, 3076–3087, https://doi.org/10.1002/qj.2591, 2015. a
ESRI: Geocode Addresses (Geocoding), https://pro.arcgis.com/en/pro-app/latest/tool-reference/geocoding/geocode-addresses.htm (last access: 12 May 2026), 2025. a
European Parliament and Council of the European Union: Directive 2009/138/EC of 25 November 2009 on the taking-up and pursuit of the business of Insurance and Reinsurance (Solvency II) (recast) (text with EEA relevance), Official Journal of the European Union, L 335/1, Document 32009L0138, http://data.europa.eu/eli/dir/2009/138/oj (last access: 12 May 2026), 2009. a
Fédération France Assureurs: L'assurance habitation en 2023, https://www.franceassureurs.fr/nos-chiffres-cles/ assurance-de-dommages-et-responsabilite/lassurance-habitation-en-2023/ (last access: 12 May 2026), 2024a. a
Fédération France Assureurs: L'assurance de dommages aux biens des professionnels en 2023, https://www.franceassureurs.fr/nos-chiffres-cles/assurance-de-dommages-et-responsabilite/lassurance-habitation-en-2023/ (last access: 12 May 2026), 2024b. a, b
Fédération France Assureur: L'assurance des évènements naturels en 2023, https://www.franceassureurs.fr/nos-chiffres-cles/assurance-de-dommages-et-responsabilite/lassurance-des-evenements-naturels-en-2023/ (last access: 12 May 2026), 2025. a, b
Fehlman, C. A., Ryan, S. C., Lysne, K. G., Rundgren, Q. M., Spurlock, T. J., Orbison, R. O., Runkle, J. D., and Sugg, M. M.: Scoping review of the societal impacts of compound climate events, Discover Environment, 3, 2, https://doi.org/10.1007/s44274-025-00185-y, 2025. a
Feser, F., Barcikowska, M., Krueger, O., Schenk, F., Weisse, R., and Xia, L.: Storminess over the North Atlantic and northwestern Europe – a review, Q. J. Roy. Meteor. Soc., 141, 350–382, https://doi.org/10.1002/qj.2364, 2015. a
Flaounas, E., Aragão, L., Bernini, L., Dafis, S., Doiteau, B., Flocas, H., Gray, S. L., Karwat, A., Kouroutzoglou, J., Lionello, P., Miglietta, M. M., Pantillon, F., Pasquero, C., Patlakas, P., Picornell, M. Á., Porcù, F., Priestley, M. D. K., Reale, M., Roberts, M. J., Saaroni, H., Sandler, D., Scoccimarro, E., Sprenger, M., and Ziv, B.: A composite approach to produce reference datasets for extratropical cyclone tracks: application to Mediterranean cyclones, Weather Clim. Dynam., 4, 639–661, https://doi.org/10.5194/wcd-4-639-2023, 2023. a
Flynn, C. M., Moemken, J., Pinto, J. G., Schutte, M. K., and Messori, G.: CLIMK–WINDS: a new database of extreme European winter windstorms, Earth Syst. Sci. Data, 17, 4431–4453, https://doi.org/10.5194/essd-17-4431-2025, 2025. a, b, c
Fonseca Cerda, M. D. S., De Moel, H., Van Ederen, D., Aerts, J. C. J. H., Botzen, W. J. W., and Haer, T.: Empirical evaluation of windstorm losses and meteorological variables over the Netherlands, Nat. Hazards, https://doi.org/10.1007/s11069-024-07024-y, 2024. a, b, c, d, e
Gall, M.: The suitability of disaster loss databases to measure loss and damage from climate change, Int. J. Global Warm., 8, 170, https://doi.org/10.1504/IJGW.2015.071966, 2015. a, b
Ginesta, M., Yiou, P., Messori, G., and Faranda, D.: A methodology for attributing severe extratropical cyclones to climate change based on reanalysis data: the case study of storm Alex 2020, Clim. Dynam., 61, 229–253, https://doi.org/10.1007/s00382-022-06565-x, 2023. a, b
Gramcianinov, C., Campos, R., De Camargo, R., Hodges, K., Guedes Soares, C., and Da Silva Dias, P.: Analysis of Atlantic extratropical storm tracks characteristics in 41 years of ERA5 and CFSR/CFSv2 databases, Ocean Eng., 216, 108111, https://doi.org/10.1016/j.oceaneng.2020.108111, 2020. a
Hasbini, L.: Unravelling the wind impact of clusters of storms, a case study over the French insurer Generali – Scripts, Zenodo [code], https://doi.org/10.5281/zenodo.15771837, 2025. a
Hauser, S., Mueller, S., Chen, X., Chen, T., Pinto, J. G., and Grams, C. M.: The linkage of serial cyclone clustering in Western Europe and weather regimes in the North Atlantic European region in boreal winter, Geophys. Res. Lett., 50, e2022GL101900, https://doi.org/10.1029/2022GL101900, 2023. a
Hawcroft, M., Walsh, E., Hodges, K., and Zappa, G.: Significantly increased extreme precipitation expected in Europe and North America from extratropical cyclones, Environ. Res. Lett., 13, 124006, https://doi.org/10.1088/1748-9326/aaed59, 2018. a
Hawcroft, M. K., Shaffrey, L. C., Hodges, K. I., and Dacre, H. F.: How much Northern Hemisphere precipitation is associated with extratropical cyclones?, Geophys. Res. Lett., 39, 2012GL053866, https://doi.org/10.1029/2012GL053866, 2012. a
Heneka, P., Hofherr, T., Ruck, B., and Kottmeier, C.: Winter storm risk of residential structures – model development and application to the German state of Baden-Württemberg, Nat. Hazards Earth Syst. Sci., 6, 721–733, https://doi.org/10.5194/nhess-6-721-2006, 2006. a
Hillier, J. K., Bloomfield, H. C., Manning, C., Garry, F., Shaffrey, L., Bates, P., and Kumar, D.: Increasingly seasonal jet stream raises risk of co occurring flooding and extreme wind in Great Britain, Int. J. Climatol., 45, e8763, https://doi.org/10.1002/joc.8763, 2025. a
Hodges, K. I.: A general method for tracking analysis and its application to meteorological data, Mon. Weather Rev., 122, 2573–2586, https://doi.org/10.1175/1520-0493(1994)122<2573:AGMFTA>2.0.CO;2, 1994. a
Hodges, K. I.: Adaptive constraints for feature tracking, Mon. Weather Rev., 127, 1362–1373, https://doi.org/10.1175/1520-0493(1999)127<1362:ACFFT>2.0.CO;2, 1999. a
INSEE: Coefficient de transformation de l'euro ou du franc d'une année, en euro ou en franc d'une autre année – Base 2015, https://www.insee.fr/fr/statistiques/serie/010605954 (last access: 12 May 2026), 2025. a
Intergovernmental Panel On Climate Change: Climate Change 2021 – The Physical Science Basis: Working Group I Contribution to the Sixth Assessment Report of the Intergovernmental Panel on Climate Change, Cambridge University Press, 1st edn., https://doi.org/10.1017/9781009157896, 2023. a
Jaison, A., Sorteberg, A., Michel, C., and Breivik, Ø.: Assessment of wind–damage relations for Norway using 36 years of daily insurance data, Nat. Hazards Earth Syst. Sci., 24, 1341–1355, https://doi.org/10.5194/nhess-24-1341-2024, 2024. a
Kaas, R.: Modern actuarial risk theory: using R, Springer, Berlin [New York], 2nd edn., https://doi.org//10.1007/978-3-540-70998-5, 2009. a
Karwat, A., Franzke, C. L. E., Pinto, J. G., Lee, S.-S., and Blender, R.: Northern Hemisphere extra-tropical cyclone clustering in ERA5 reanalysis and the CESM2 large ensemble, J. Climate, https://doi.org/10.1175/JCLI-D-23-0160.1, 2023. a
Kettle, A. J.: Storm Anatol over Europe in December 1999: impacts on societal and energy infrastructure, Adv. Geosci., 56, 141–153, https://doi.org/10.5194/adgeo-56-141-2021, 2021. a
Khare, S., Bonazzi, A., Mitas, C., and Jewson, S.: Modelling clustering of natural hazard phenomena and the effect on re/insurance loss perspectives, Nat. Hazards Earth Syst. Sci., 15, 1357–1370, https://doi.org/10.5194/nhess-15-1357-2015, 2015. a
Klawa, M. and Ulbrich, U.: A model for the estimation of storm losses and the identification of severe winter storms in Germany, Nat. Hazards Earth Syst. Sci., 3, 725–732, https://doi.org/10.5194/nhess-3-725-2003, 2003. a
Kron, W., Steuer, M., Löw, P., and Wirtz, A.: How to deal properly with a natural catastrophe database – analysis of flood losses, Nat. Hazards Earth Syst. Sci., 12, 535–550, https://doi.org/10.5194/nhess-12-535-2012, 2012. a
Liberato, M. L. R., Pinto, J. G., Trigo, I. F., and Trigo, R. M.: Klaus – an exceptional winter storm over northern Iberia and southern France, Weather, 66, 330–334, https://doi.org/10.1002/wea.755, 2011. a
Lloyd's of London: Catastrophe Modelling and Climate Change – Lloyd's, https://www.lloyds.com/insights/risk-reports/catastrophe-modelling-and-climate-change (last access: 12 May 2026), 2026. a
Lockwood, J. F., Guentchev, G. S., Alabaster, A., Brown, S. J., Palin, E. J., Roberts, M. J., and Thornton, H. E.: Using high-resolution global climate models from the PRIMAVERA project to create a European winter windstorm event set, Nat. Hazards Earth Syst. Sci., 22, 3585–3606, https://doi.org/10.5194/nhess-22-3585-2022, 2022. a
Ludwig, P., Pinto, J. G., Hoepp, S. A., Fink, A. H., and Gray, S. L.: Secondary cyclogenesis along an occluded front leading to damaging wind gusts: windstorm Kyrill, January 2007, Mon. Weather Rev., 143, 1417–1437, https://doi.org/10.1175/MWR-D-14-00304.1, 2015. a
Mailier, P. J., Stephenson, D. B., Ferro, C. A. T., and Hodges, K. I.: Serial clustering of extratropical cyclones, Mon. Weather Rev., 134, 2224–2240, https://doi.org/10.1175/MWR3160.1, 2006. a, b, c
Meteo France: Tempêtes et changement climatique, https://meteofrance.com/changement-climatique/observer/tempetes-et-changement-climatique (last access: 12 May 2026), 2023. a
Michèle Lai: Twenty years after storms Anatol, Lothar and Martin: Memories from the end of the millennium, https://www.moodys.com/web/en/us/insights/insurance/twenty-years-after-storms-anatol-lothar-and-martin-memories-from-the-end-of-the-millennium.html (last access: 19 February 2025), 2019. a
Mission Risques Naturels: Lettre d'information de la mission risques naturels #36, https://www.mrn.asso.fr/wp-content/uploads/2021/07/lettre-n36_vf.pdf (last access: 12 May 2026), 2021. a, b, c
Moemken, J., Alifdini, I., Ramos, A. M., Georgiadis, A., Brocklehurst, A., Braun, L., and Pinto, J. G.: Insurance loss model vs. meteorological loss index – how comparable are their loss estimates for European windstorms?, Nat. Hazards Earth Syst. Sci., 24, 3445–3460, https://doi.org/10.5194/nhess-24-3445-2024, 2024a. a, b
Moemken, J., Messori, G., and Pinto, J. G.: Windstorm losses in Europe – What to gain from damage datasets, Weather and Climate Extremes, 44, 100661, https://doi.org/10.1016/j.wace.2024.100661, 2024b. a, b, c, d
Munich RE: Data on natural disasters since 1980 – Munich RE's NatCatSERVICE, https://www.munichre.com/en/solutions/for-industry-clients/natcatservice.html, last access: 20 February 2025. a
Neu, U., Akperov, M. G., Bellenbaum, N., Benestad, R., Blender, R., Caballero, R., Cocozza, A., Dacre, H. F., Feng, Y., Fraedrich, K., Grieger, J., Gulev, S., Hanley, J., Hewson, T., Inatsu, M., Keay, K., Kew, S. F., Kindem, I., Leckebusch, G. C., Liberato, M. L. R., Lionello, P., Mokhov, I. I., Pinto, J. G., Raible, C. C., Reale, M., Rudeva, I., Schuster, M., Simmonds, I., Sinclair, M., Sprenger, M., Tilinina, N. D., Trigo, I. F., Ulbrich, S., Ulbrich, U., Wang, X. L., and Wernli, H.: IMILAST: a community effort to intercompare extratropical cyclone detection and tracking algorithms, B. Am. Meteorol. Soc., 94, 529–547, https://doi.org/10.1175/BAMS-D-11-00154.1, 2013. a, b, c
Pardowitz, T., Osinski, R., Kruschke, T., and Ulbrich, U.: An analysis of uncertainties and skill in forecasts of winter storm losses, Nat. Hazards Earth Syst. Sci., 16, 2391–2402, https://doi.org/10.5194/nhess-16-2391-2016, 2016. a
PERILS: Event loss information, https://www.perils.org/losses?year=&classification=1012&status=#event-losses, last access: 20 February 2025. a, b, c
Pinto, J. G., Gómara, I., Masato, G., Dacre, H. F., Woollings, T., and Caballero, R.: Large scale dynamics associated with clustering of extratropical cyclones affecting Western Europe, J. Geophys. Res.-Atmos., 119, https://doi.org/10.1002/2014JD022305, 2014. a, b, c, d
Pinto, J. G., Ulbrich, S., Economou, T., Stephenson, D. B., Karremann, M. K., and Shaffrey, L. C.: Robustness of serial clustering of extratropical cyclones to the choice of tracking method, Tellus A, 68, 32204, https://doi.org/10.3402/tellusa.v68.32204, 2016. a, b
Prahl, B. F., Rybski, D., Burghoff, O., and Kropp, J. P.: Comparison of storm damage functions and their performance, Nat. Hazards Earth Syst. Sci., 15, 769–788, https://doi.org/10.5194/nhess-15-769-2015, 2015. a, b, c
Priestley, M. D. K., Pinto, J. G., Dacre, H. F., and Shaffrey, L. C.: The role of cyclone clustering during the stormy winter of 2013/2014, Weather, 72, 187–192, https://doi.org/10.1002/wea.3025, 2017a. a
Priestley, M. D. K., Pinto, J. G., Dacre, H. F., and Shaffrey, L. C.: Rossby wave breaking, the upper level jet, and serial clustering of extratropical cyclones in western Europe, Geophys. Res. Lett., 44, 514–521, https://doi.org/10.1002/2016GL071277, 2017b. a
Priestley, M. D. K., Dacre, H. F., Shaffrey, L. C., Schemm, S., and Pinto, J. G.: The role of secondary cyclones and cyclone families for the North Atlantic storm track and clustering over western Europe, Q. J. Roy. Meteor. Soc., 146, 1184–1205, https://doi.org/10.1002/qj.3733, 2020. a, b, c
Priestley, M. D. K., Stephenson, D. B., Scaife, A. A., Bannister, D., Allen, C. J. T., and Wilkie, D.: Forced trends and internal variability in climate change projections of extreme European windstorm frequency and severity, Q. J. Roy. Meteor. Soc., 150, 4933–4950, https://doi.org/10.1002/qj.4849, 2024. a, b
Raible, C. C., Della-Marta, P. M., Schwierz, C., Wernli, H., and Blender, R.: Northern Hemisphere extratropical cyclones: a comparison of detection and tracking methods and different reanalyses, Mon. Weather Rev., 136, 880–897, https://doi.org/10.1175/2007MWR2143.1, 2008. a
Risk Management Solutions, Inc: Modeling Fundamentals: Accounting for the Hours Clause, https://www.verisk.com/blog/modeling-fundamental--accounting-for-the-hours-clause/ (last access: 6 January 2026), 2019. a
Rivière, G., Arbogast, P., Maynard, K., and Joly, A.: The essential ingredients leading to the explosive growth stage of the European wind storm Lothar of Christmas 1999, Q. J. Roy. Meteor. Soc., 136, 638–652, https://doi.org/10.1002/qj.585, 2010. a, b
Roberts, J. F., Champion, A. J., Dawkins, L. C., Hodges, K. I., Shaffrey, L. C., Stephenson, D. B., Stringer, M. A., Thornton, H. E., and Youngman, B. D.: The XWS open access catalogue of extreme European windstorms from 1979 to 2012, Nat. Hazards Earth Syst. Sci., 14, 2487–2501, https://doi.org/10.5194/nhess-14-2487-2014, 2014. a, b
Schindler, D., Grebhan, K., Albrecht, A., and Schönborn, J.: Modelling the wind damage probability in forests in Southwestern Germany for the 1999 winter storm “Lothar”, Int. J. Biometeorol., 53, 543–554, https://doi.org/10.1007/s00484-009-0242-3, 2009. a
Schmoeckel, J. and Kottmeier, C.: Storm damage in the Black Forest caused by the winter storm ”Lothar” – Part 1: Airborne damage assessment, Nat. Hazards Earth Syst. Sci., 8, 795–803, https://doi.org/10.5194/nhess-8-795-2008, 2008. a
Schwierz, C., Köllner-Heck, P., Zenklusen Mutter, E., Bresch, D. N., Vidale, P.-L., Wild, M., and Schär, C.: Modelling European winter wind storm losses in current and future climate, Climatic Change, 101, 485–514, https://doi.org/10.1007/s10584-009-9712-1, 2010. a
Severino, L. G., Kropf, C. M., Afargan-Gerstman, H., Fairless, C., de Vries, A. J., Domeisen, D. I. V., and Bresch, D. N.: Projections and uncertainties of winter windstorm damage in Europe in a changing climate, Nat. Hazards Earth Syst. Sci., 24, 1555–1578, https://doi.org/10.5194/nhess-24-1555-2024, 2024. a
Sinclair, V. A. and Catto, J. L.: The relationship between extra-tropical cyclone intensity and precipitation in idealised current and future climates, Weather Clim. Dynam., 4, 567–589, https://doi.org/10.5194/wcd-4-567-2023, 2023. a
Stucki, P., Brönnimann, S., Martius, O., Welker, C., Imhof, M., von Wattenwyl, N., and Philipp, N.: A catalog of high-impact windstorms in Switzerland since 1859, Nat. Hazards Earth Syst. Sci., 14, 2867–2882, https://doi.org/10.5194/nhess-14-2867-2014, 2014. a, b, c, d
Van Ederen, D., Fonseca-Cerda, M. D. S., Botzen, W. J. W., Aerts, J. C. J. H., Lupi, V., Scussolini, P., and Gubbels, K. B.: A high-resolution compound vulnerability function for European winter storm losses, npj Natural Hazards, 2, 43, https://doi.org/10.1038/s44304-025-00091-6, 2025. a
Vitolo, R., Stephenson, D. B., Cook, I. M., and Mitchell-Wallace, K.: Serial clustering of intense European storms, Meteorol. Z., 18, 411–424, https://doi.org/10.1127/0941-2948/2009/0393, 2009. a, b
Welker, C., Röösli, T., and Bresch, D. N.: Comparing an insurer's perspective on building damages with modelled damages from pan-European winter windstorm event sets: a case study from Zurich, Switzerland, Nat. Hazards Earth Syst. Sci., 21, 279–299, https://doi.org/10.5194/nhess-21-279-2021, 2021. a
Wernli, H., Dirren, S., Liniger, M. A., and Zillig, M.: Dynamical aspects of the life cycle of the winter storm “Lothar” (24–26 December 1999), Q. J. Roy. Meteor. Soc., 128, 405–429, https://doi.org/10.1256/003590002321042036, 2002. a
William, O. D.: Event-based aggregation in focus, Chap. 4, Contemporary Commercial Law Series, Taylor and Francis Group, Milton, https://doi.org/10.4324/9781003080480, 2023. a, b, c
Zappa, G., Shaffrey, L. C., and Hodges, K. I.: The ability of CMIP5 models to simulate North Atlantic extratropical cyclones, J. Climate, 26, 5379–5396, https://doi.org/10.1175/JCLI-D-12-00501.1, 2013. a
Zscheischler, J., Westra, S., Van Den Hurk, B. J. J. M., Seneviratne, S. I., Ward, P. J., Pitman, A., AghaKouchak, A., Bresch, D. N., Leonard, M., Wahl, T., and Zhang, X.: Future climate risk from compound events, Nat. Clim. Change, 8, 469–477, https://doi.org/10.1038/s41558-018-0156-3, 2018. a
Zscheischler, J., Martius, O., Westra, S., Bevacqua, E., Raymond, C., Horton, R. M., Van Den Hurk, B., AghaKouchak, A., Jézéquel, A., Mahecha, M. D., Maraun, D., Ramos, A. M., Ridder, N. N., Thiery, W., and Vignotto, E.: A typology of compound weather and climate events, Nature Reviews Earth and Environment, 1, 333–347, https://doi.org/10.1038/s43017-020-0060-z, 2020. a
- Abstract
- Introduction
- Data and preprocessing
- Catalogue of claims and storm events
- Results: Impact of storm clustering on Generali France's portfolio
- Discussions and perspectives
- Conclusions
- Appendix A: Sensitivity to storm impact radius
- Appendix B: Sensitivity to the clustering definition
- Appendix C: Storm track density
- Appendix D: Distribution of claim intensity within clusters
- Code availability
- Data availability
- Author contributions
- Competing interests
- Disclaimer
- Acknowledgements
- Financial support
- Review statement
- References
- Supplement