the Creative Commons Attribution 4.0 License.
the Creative Commons Attribution 4.0 License.
 | 11 Jun 2026
Multi-hazard susceptibility mapping in a karst context using a machine-learning method (MaxEnt)
Hedieh Soltanpour
Kamal Serrhini
Joel C. Gill
Sven Fuchs
Solmaz Mohadjer
In this study, we extend the application of the Maximum Entropy model (MaxEnt), traditionally applied to ecological research and less explored in natural hazard studies, to a novel context by characterising a multi-hazard scenario (i.e., flood-triggered sinkholes) in the Orléans karst region (Val d'Orléans) of France. Many regions of the world exhibit complex hazard landscapes where networks of multi-hazard interrelationships (cascades) pose challenges due to the potential interactions between hazards and the different temporal and spatial scales of hazard events. While mountainous, coastal and volcanic regions have been recognised as multi-hazard forming zones, karst terrains have received little attention despite being prone to multi-hazard events due to their distinct geology, geomorphology, hydrogeology and other environmental characteristics. Incorporating karst-specific multi-hazard scenarios into resilience planning processes supports disaster risk reduction efforts by raising the awareness of citizens, protecting elements at risk and facilitating decisions on disaster prevention. To support this aim, we developed a multi-hazard susceptibility map for the karst region of Val d'Orléans that characterises flood-triggered sinkholes. We applied MaxEnt, a machine learning method, to forecast the spatial probability distribution of flood-triggered sinkholes. Model inputs included the location of past sinkhole occurrences and geo-environmental factors contributing to sinkhole formation (e.g., topography, local geology, hydrology and flood hazard). We validated the performance of the model by initially using 70 % of the sinkhole inventory data and keeping the remaining 30 % for testing. This validation process assessed the model's performance using the Area Under the Curve of the Receiver Operating Characteristic (AUC-ROC). The resulting map reveals areas located up to 1 km south of the Loire River and areas with lowest elevation with highest susceptibility to flood-triggered sinkholes. We conclude that our approach to producing this type of multi-hazard scenario and map is useful for identifying flood-triggered sinkholes in Val d'Orléans and other karst areas around the globe, supporting effective land use planning.
- Article
(6468 KB) - Full-text XML
- BibTeX
- EndNote


The identification and characterisation of multi-hazard regions (i.e., contexts affected by multiple, interrelating hazards) and the delineation of potential multi-hazards scenarios can support forward-looking approaches to risk reduction (Liu et al., 2016; Ward et al., 2022). The effectiveness of hazard mitigation measures partly depends on the capacity to collectively consider, visualise, and evaluate the complexity of hazards (Fuchs et al., 2009; Pourghasemi et al., 2019). As emphasised in the Sendai Framework for Disaster Risk Reduction (UNDRR, 2015), multi-hazard approaches are critical for a range of stakeholders including local developers, urban planners, and local and national authorities.
Across the globe, there are several types of geographical regions affected by multiple natural hazards, which can interrelate, and therefore, have the intrinsic potential to form a network of hazard interrelationships. Mountainous, coastal and volcanic regions are commonly recognised multi-hazard-forming zones, where hazards interact with each other in different forms such as simultaneously, cascadingly or cumulatively (Kappes et al., 2012; Gill and Malamud, 2016; de Ruiter et al., 2020; Gallina et al., 2020). Several studies have mapped out the typical multi-hazard scenarios in mountainous regions (see Yousefi et al., 2020; Tsereteli et al., 2019; Pourghasemi et al., 2019; Terzi et al., 2019). In mountain environments, an earthquake or heavy rainfall can trigger flooding, landslides or debris flows, which then by blocking a river or breaching a river's dam can generate further hazards, such as flooding (Kappes et al., 2012; van den Bout et al., 2022). For example, the 2015 Gorkha earthquake event in the Himalayan-nation of Nepal triggered more than 24 000 landslides adding to a death toll of nearly 9000 people (Collins and Jibson, 2015; Hülssiep et al., 2021).
In coastal environments, there have been several attempts to characterise and map coastal multi-hazards (see Marignani et al., 2017; Gallina et al., 2020). In such settings, a hurricane can cause strong wind and storm surges, which trigger flooding, mudslides and landslides (Appelquist and Balstrøm, 2015; López-Saavedra and Martí, 2023). For example, on 14 September 2022, in Puerto Rico, hurricane Fiona (Category 1) unleased more than 76 cm of rain resulting in widespread flooding. Consequently, this flooding triggered numerous mudslides and landslides (Pasch et al., 2023).
Similarly, in volcanic regions, several multi-hazard scenario identification and mapping tools for volcanic settings can be found in the literature (Neri et al., 2013; López-Saavedra and Martí, 2023).
Volcanic eruptions can cause a range of hazards (e.g., tephra fall, pyroclastic density currents, lava flows, and gas emissions) that can combine with other hazards to trigger new hazards (e.g., rainfall mobilising tephra deposits as lahars). Volcanic unrest may trigger landslides or earthquakes, and in some cases tsunamis (Gill et al., 2020). The eruption of Mount Pinatubo in the Philippines in 1991 can be a notable example, which was accompanied by earthquake-triggered lahars. The combination of these events led to over 300 casualties, displacement of more than 2 million people, and damaged 800 houses (de Ruiter et al., 2020).
Another multi-hazard landscape context, often overlooked in the multi-hazard literature, is karst terrain. Karst terrain is created from the dissolution of soluble rocks (carbonates and/or evaporites) and is characterised by distinct landforms such as springs, caves and sinkholes (Waltham et al., 2005). These landscapes, with their distinct geology, geomorphology, hydrogeology, and other environmental characteristics, are prone to multi-hazard events (Gill and Malamud, 2014; Parise et al., 2018). While previous studies recognise the potential for heavy rainfall events and flooding to trigger sinkholes in karst environments and emphasise the need to include karst landscapes in multi-hazard discussions (Lei et al., 2013, 2016; Xiao et al., 2016; Xiao et al., 2018; Kwak et al., 2020), sinkhole mapping in karst areas has predominantly focused on single hazards (Subedi et al., 2019; Kim et al., 2022).
Methods used for mapping sinkhole hazard can be broadly categorised into qualitative, quantitative, and hybrid/semi-quantitative approaches (Galve et al., 2008, 2009). Qualitative methods typically encompass descriptive representations that rely on the expertise of local specialists such as the Analytical Hierarchy Process (AHP), which may introduce subjective biases (Taheri et al., 2015; Subedi et al., 2019; Qiu et al., 2020). Hybrid/semi-quantitative approaches often combine expert judgment with spatial pattern analyses such as the Nearest Neighbour Index and kernel density estimation, and field observations. Both of these methods are data-limited and rely on interpretive perspectives of the experts involved (Clark and Evans, 1954; Hyatt and Jacobs, 1996; Galve et al., 2009).
Quantitative approaches, however, rely on numerical data and statistical analysis to explain phenomena. The most applied ones are the frequency ratio (Ozdemir, 2015), multivariate statistical methods such as logistic regression, artificial neural network, and support vector machine (Taheri et al., 2015; Kim et al., 2018; Kim et al., 2022) and weight-of evidence (Perrin et al., 2015). Recently Machine Learning (ML) approaches have advanced prediction techniques, resulting in enhanced and more effective solutions (Taheri et al., 2019; Nachappa et al., 2020; Tehrani et al., 2022). Different ML algorithms have been applied to sinkhole mapping including decision trees (Gao and Alexander, 2008), Random Forest which is an extension to decision trees promising less overfitting models compared to the traditional decision tree models (Breiman, 2001; Elmahdy et al., 2020), and Bayes-based machine learning algorithms (e.g., Naïve Bayes, Bayes Net), Logistic Regression, and Bayesian Logistic Regression (Taheri et al., 2019; Tehrani et al., 2022). In this study, we use Maximum Entropy Model (MaxEnt), an ML algorithm, originally introduced by ecologists (Phillips et al., 2006) with wide applications in natural, social and computational sciences. Bianchini et al. (2022) carried out one of the first applications of MaxEnt to sinkhole mapping, demonstrating its potential in karst contexts. Here, we build on the work of Bianchini et al. (2022) to explore the use of MaxEnt in mapping flood-triggered sinkholes multi-hazard.
We applied the MaxEnt method to Val d'Orléans in France with an area of 260 km2 and about 70 000 inhabitants belonging to 31 municipalities (Serrhini et al., 2023). In 2016, Val d'Orléans experienced a multi-hazard event where a flood triggered by rainfall resulted in the collapse of more than 100 sinkholes (Noury et al., 2018). This impacted the main highway between Orléans and Paris, four small towns, and an industrial park, and resulted in financial loss of over EUR 20 million (Luu et al., 2019). It remains unclear if the flood directly triggered sinkhole formations or triggered the collapse of pre-existing sinkholes. Therefore, here we use the term “flood-triggered sinkholes” for both scenarios.
Previous research in the region can be divided to before and after the 2016 event. Perrin et al. (2014) mapped the karst hazard, assessing five criteria contributing to sinkhole formation (proximity to the Loire River, density of sinkholes, thickness of alluvium, presence of paleochannels, and the presence of drainage axes in the Beauce Aquifer). Perrin et al. (2015) produced a karst susceptibility map applying the statistical “weight-of-evidence theory” method using four factors (thickness of low permeability and saturated layers, distance to streams, and alluvium thickness). Their resulting map indicated that nearly the entire region falls into high hazard zones, challenging its usability in land use planning, management and decision-making. Following the 2016 flood and sinkhole collapses event, Noury et al. (2018) and Luu et al. (2019) focused on simulating the internal soil erosion during floods (including the 2016 flood in Val d'Orléans). Noury et al. (2018) found that intense rainfall and floods significantly increased sinkhole formation in this region with rates up to 24 000 times higher than normal. In a subsequent study aiming to understand how different erosion regimes accelerated internal erosion during the 2016 flood, which led to various sinkhole shapes (hourglass and inverted bowl sinkholes), Luu et al. (2019) applied different hydraulic pressures, underground conduit sizes, and the particle cohesion of granular media. They identified two distinct erosion processes: the upward growth of cavities (resulting in dropout sinkholes) and the downward flow of granules (resulting in subsidence sinkholes) in cohesive soil.
In the context of increasing momentum and demand for a shift from single layer multi-hazard approaches to more comprehensive multi-hazard assessments that consider hazard interrelationships (e.g., see Kappes et al., 2012; Gill and Malamud, 2014; Ward et al., 2022), this study has three main objectives: (1) to enhance the recognition of karst terrains as multi-hazard forming area, (2) to advocate for a shift in multi-hazard assessment methodologies, moving from a multi-layer single hazards to a multi-hazard approach (see Gill and Malamud, 2014, 2016), considering the interconnected effects between floods and sinkholes, and (3) to explore the applicability of the MaxEnt model for representing a multi-hazard susceptibility scenario in a karst environment, specifically flood-triggered sinkholes.
2.1 Exploring a potential multi-hazard scenario
Given the definition of the multi-hazard term as “the specific contexts where hazardous events may occur simultaneously, cascadingly or cumulatively over time” (UNDRR, 2017), multi-hazard forming environments are where different geophysical processes have the potential to overlap in various ways (adopted from UNDRR, 2017). It can, therefore, be argued that karst landscapes, covering about 20 % to 25 % of the land surface (Waltham et al., 2005), exhibit such properties. In karst terrains, meteorological events could act as a trigger to activate a cascade of hazards. The existing body of literature extensively explores the impact of severe rainfall and flood events on sinkhole collapses (Hyatt and Jacobs, 1996; Brinkmann et al., 2008; Martinotti et al., 2017; Parise et al., 2018; Noury et al., 2018; Xiao et al., 2018; Luu et al., 2019; Kwak et al., 2020). For instance, the flooding of the Flint River in 1994 triggered 312 sinkholes in the karst Dougherty Plain at Albany, Georgia, with 88 % of these collapses occurring within the spatial extent affected by flooding (Hyatt and Jacobs, 1996). In Florida, the tropical storm Debby in June 2012 caused a prolonged rainfall event followed by a period of drought. The flood caused by the storm triggered hundreds of sinkholes collapsing, damaging infrastructure, buildings and forcing the inhabitants to evacuate their homes (Brinkmann, 2013). Similarly, during a 2012 heavy rainfall in Liuzhou city of Guangxi province, south China, a cascade of sinkhole collapse events occurred with an initial sinkhole collapse resulting in 37 further sinkholes within a span of 5 d (Lei et al., 2016).
In a karst terrain (Fig. 1), the slightly acidic rainwater stored in subterranean soluble rocks percolate down through the existing cracks. The exposure of groundwater to easily eroded rocks (carbonate and evaporate rocks) results in the rock dissolution creating small cavities or voids deep underground (Lewin and Woodward, 2009; Xiao et al., 2016). Over time, those cavities grow larger and the overlying surficial soils move downwards to fill in the cavities, resulting in upward/downward erosion of soil particles beginning from base/above of the overlying surficial soils (to know more about this process please see Noury et al., 2018; Luu et al., 2019). Eventually, when surface soils fall into the subterranean voids due to a loss of compaction, a sinkhole, the most common hazard in karst areas, occurs (Waltham et al., 2005).
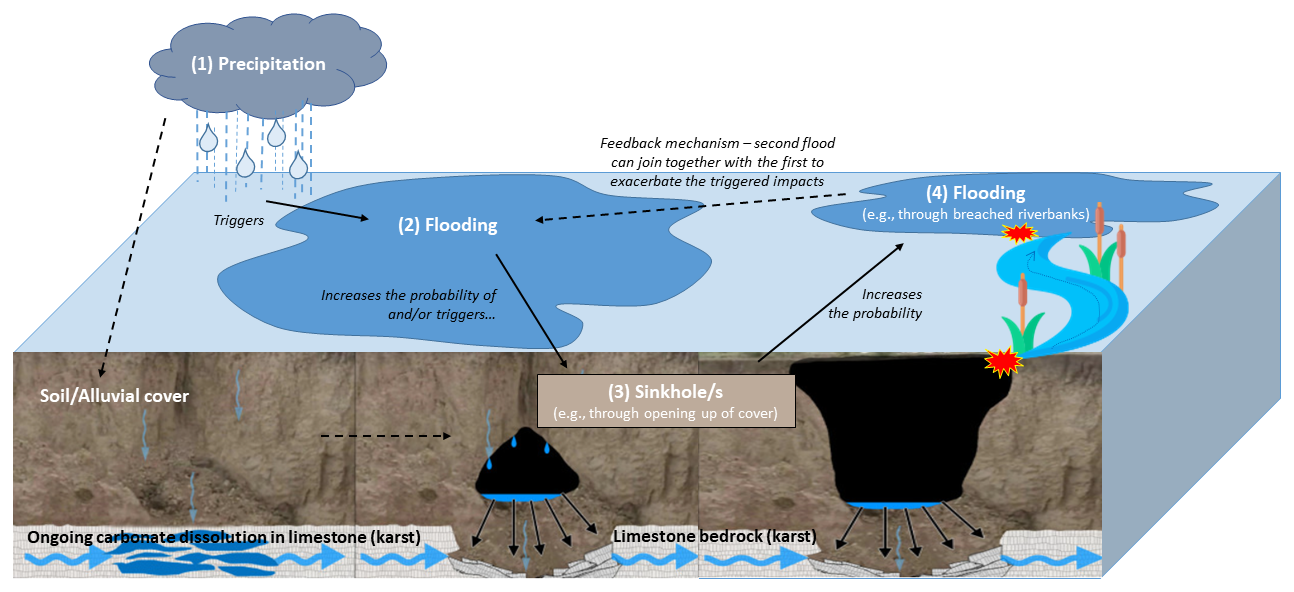
Figure 1A simplified sequential diagram of the potential multi-hazard interactions in karst covered terrains. The diagram illustrates the sequence of events starting with (1) Precipitation, which triggers (2) Flooding (solid arrow). Flooding increases the likelihood of or trigger (3) Sinkhole formation due to the dissolution of soluble bedrock by acidic water (dashed arrow from precipitation to dissolution, an ongoing process over time). Sinkhole collapses can then lead to (4) Secondary flooding (e.g., through breached riverbanks, indicated by the solid arrow from sinkholes to flooding). The dashed bidirectional arrow between stages (4) and (2) shows the feedback mechanism where initial flooding can exacerbate subsequent flooding events. The arrows underneath the sinkholes depict the flow of water into underground cavities, contributing to the dissolution process and potential further collapse.
As illustrated in Fig. 1, intense rainfall and flooding can apply load to underground cavities that are close to the surface through saturating and liquefying overburden (Hyatt and Jacobs, 1996) and can accelerate the internal erosion processes by a sudden massive infiltration of water (Noury et al., 2018; Luu et al., 2019). The failure happens when the applied stress by flood or hydraulic load is sufficient to overcome the resisting forces of the material covering up the cavities structure. Additionally, in a hypothetical scenario, where multiple cavities exist close to each other, the collapse of one could cause a cascade effect for others, creating bigger sinkhole collapses. Depending on the location of sinkholes, the collapses can increase the probability for another hazard. For example, if the collapse of a sinkhole breaks a river's dykes, another flood could be triggered, adding to the hazard chain. In multi-hazard literature, this relationship is called a bi-directional relationship or feedback mechanism where a primary hazard can produce itself (Gill and Malamud, 2016; Ciurean et al., 2018). Furthermore, this chain of hazards can potentially continue if debris produced by a flood blocks the sinkholes' conduits, resulting in water not being able to infiltrate into the ground at sufficient speed, and therefore, causing flooding (Zhou, 2007; Xiao et al., 2016).
2.2 Study area: the region of Orléans (Val d'Orléans)
Val d'Orléans is located in the Loiret department, within the Centre-Val de Loire region of France. The geography of Val d'Orléans is characterised by an extended basin that stretches for approximately 36 km from east to west and spans 7 km from north to south (Blanchard, 1903) (Fig. 2). This basin is bordered by the Forest of Orléans to the north and the plateau of Sologne to the south. The Loire River, the longest river in France with a length of 1012 km (Auterives et al., 2014), meanders with sinuous curves through the region. It extends over a distance of 33 km, from Sigloy in the east to the confluence of the Loire-Loiret in the west within this larger basin. The Val d'Orléans is a large depression and an alluvial plain within the major bed of the Loire River (Desprez, 1967).
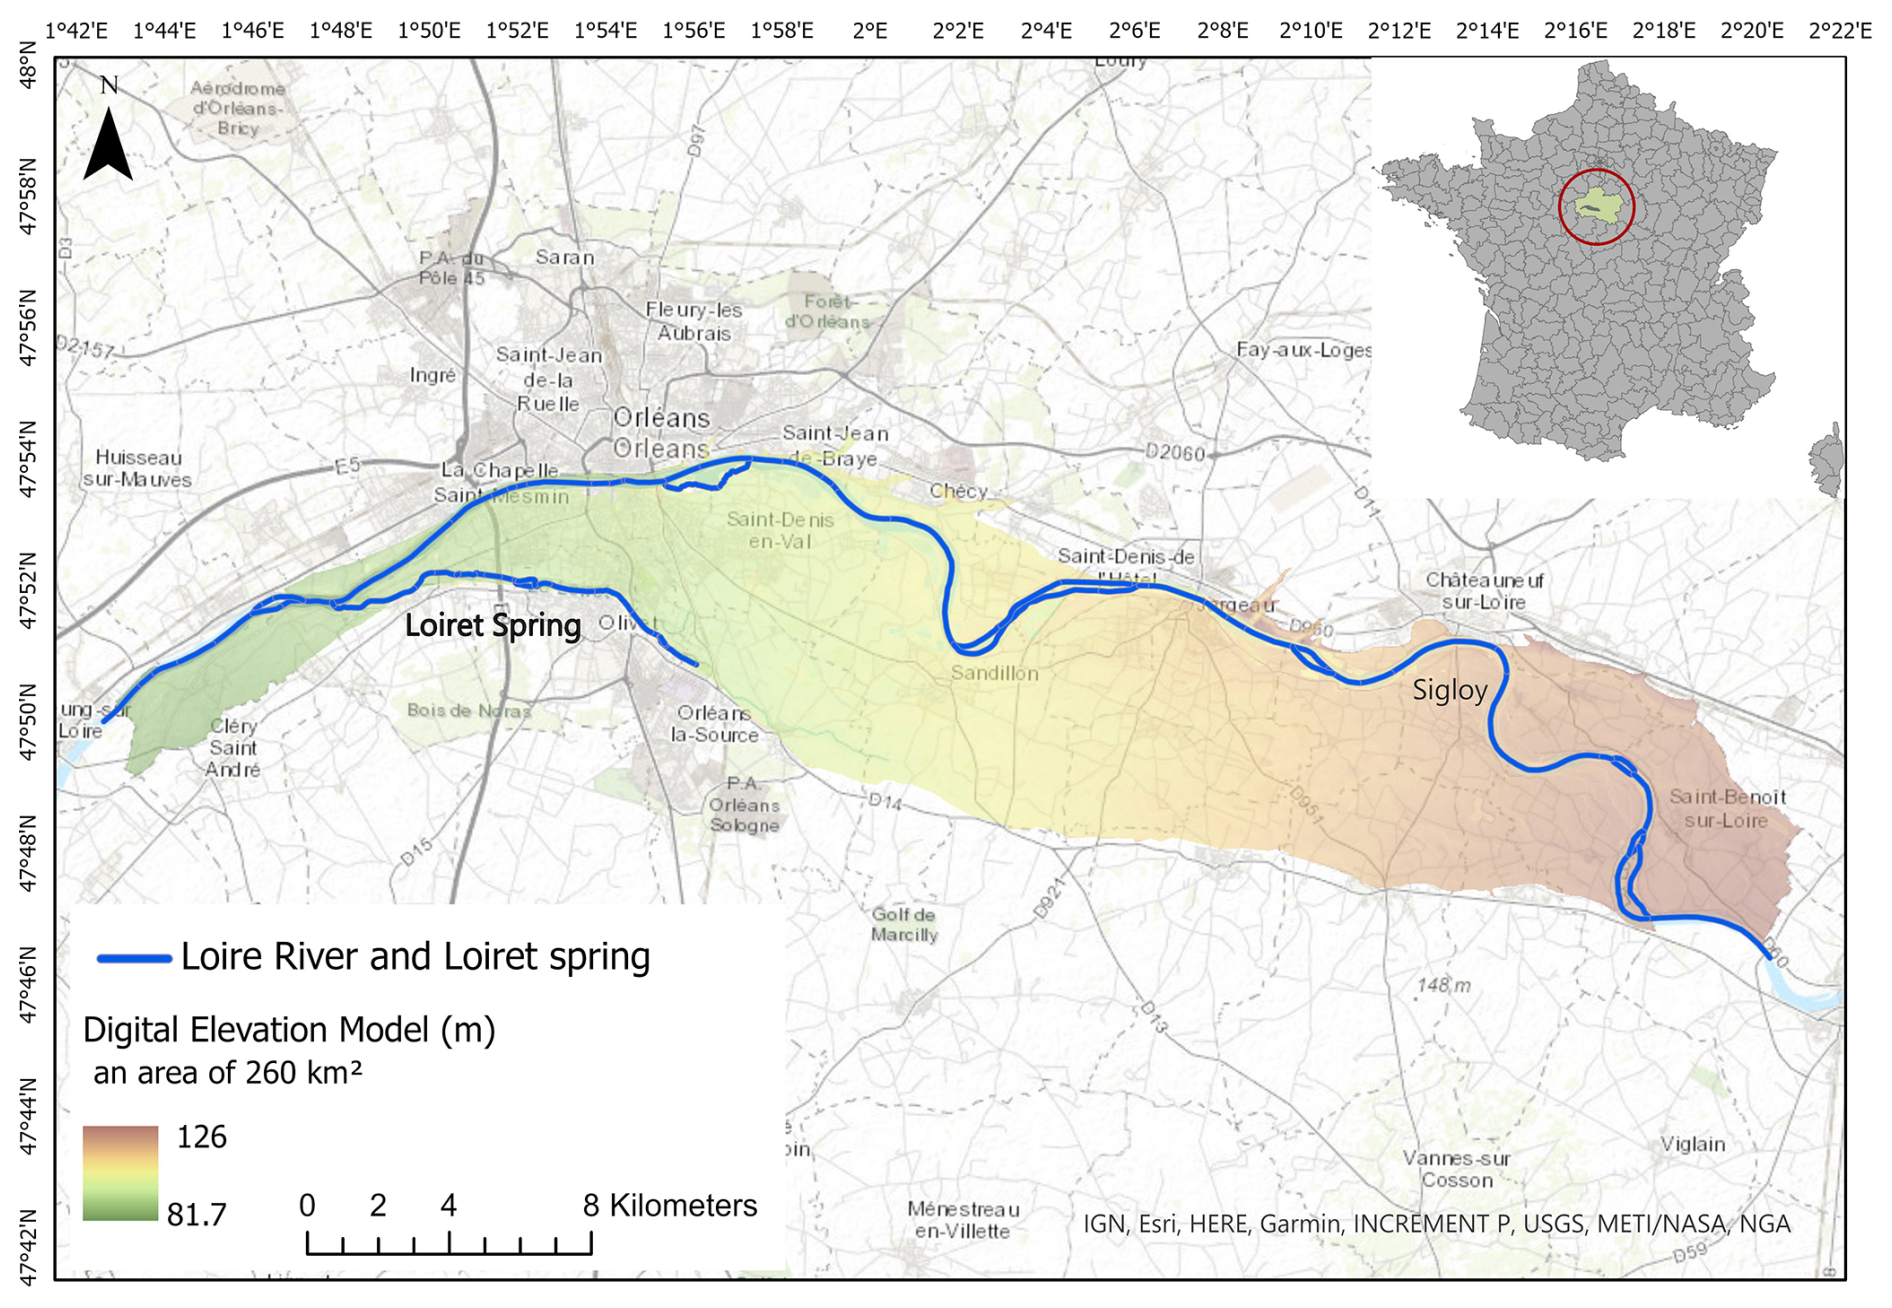
Figure 2Geographical location of the study area situated within the Loiret department, France. The inset map shows the location of the study area (red circle) in France. Sources: IGN (BD ALTI®, https://geoservices.ign.fr/bdalti, last access: 5 June 2024); basemap: IGN, Esri, HERE, Garmin, INCREMENT P, USGS, METI/NASA, NGA | Powered by Esri.
The bedrock in this region is composed of highly fissured karstic limestone called Beauce limestone (“Calcaire de Beauce”), a carbonate lacustrine deposit, with a thickness ranging from 50 to 90 m and situated at a depth of up to 10 m below the surface (Jozja et al., 2010). This geological structure is overlaid with alluvial sediments originating from the Loire River. The intensive karstification of the Beauce limestone in this region is attributed to the subterranean water flows of the Loire. Consequently, the formation of voids frequently results in the appearance of sinkholes and subsidence on the valley's surface (Cerema, 2014). The process of karstification in the region likely started during the Würm glacial period (approximately 115 000 to 11 700 years ago) when the recession of the sea triggered increased erosion activities; leading to the gradual erosion of the less permeable sediments covering the limestone in Val d'Orléans. This erosion event caused a significant influx of water from the Loire River and its tributaries into the limestone formations (Perrin et al., 2015). The karst aquifer overlain by the Quaternary Alluvium of the Loire River (Auterives et al., 2014) is characterised by a complex geological setting, which consists of a multi-layered system of clay interbedded with limestone (Lepiller, 2006).
The region of Orléans experienced a multi-hazard event in 2016. Five consecutive days of heavy rainfall led to flooding across a 30 km area including the overflow of an artificial canal near the Loire River spreading the flood over a 1 km2 area (Noury et al., 2018; Luu et al., 2019). The floodwater as a primary hazard triggered more than 100 sinkhole collapses, which were mainly attributed to karst collapses as opposed to anthropogenic, with 12 sinkholes observed within a 1 km2 area during a 10 d flood period (Noury et al., 2018; Luu et al., 2019). The flood-induced sinkholes occurred near the Loire River, breaching the river dyke, and causing another flooding.
This section outlines the application of the MaxEnt model to multi-hazard susceptibility assessment, discussing its advantages, limitations, and the steps taken to address common issues such as model variability and collinearity among variables. Additionally, we provide an overview of the data sources and variables used in our analysis.
3.1 Multi-hazard susceptibility assessment (MaxEnt application)
We applied the MaxEnt method to identify the spatial distribution of flood-triggered sinkholes and represent these in the form of a multi-hazard susceptibility map. Susceptibility assessment denotes the relative probability of a hazard event without reference to any specific time interval (Gutiérrez et al., 2008). As post-event sinkhole surveys often cannot provide the necessary information to precisely support hazard modelling, for example, the exact occurrence time (Parise et al., 2018), this study adopts a susceptibility assessment approach as opposed to hazard assessment.
Over the past decade, many studies have assessed the MaxEnt model in addressing various single natural hazards including landslides (Park, 2015; Mokhtari and Abedian, 2019; Liu et al., 2022), floods (Siahkamari et al., 2018; Mobley et al., 2019), gully erosion (Pournader et al., 2018; Azareh et al., 2019) and more recently, sinkholes (Bianchini et al., 2022). MaxEnt model has also been used to explore multi-hazards, including flood, landslides, wildfire and gully erosion (Javidan et al., 2021; Rusk et al., 2022). Previous work suggests that the MaxEnt model can generate outcomes useful for identifying areas that are susceptible to given natural hazards. Some key advantages of MaxEnt include: (1) a solid mathematical foundation avoiding the black box nature of many machine leaning models, (2) an open-source software for public users, and (3) robust multivariate analyses enabling data iteration for enhancing the model's predictive accuracy (Phillips et al., 2006; Sillero et al., 2021). Note that in the context of this research, the term “prediction” refers to the process of forecasting the potential future trends or outcomes based on current data and models.
A notable limitation in using MaxEnt and other machine learning methods arises from the inherent variability of model outputs when the same dataset is applied repeatedly (Phillips et al., 2006, 2017; Sillero and Barbosa, 2021) and the issue of collinearity among variables used in the model (Sillero and Barbosa, 2021; Sillero et al., 2021). The former can be addressed by running the model multiple times, ideally a minimum of 10 to higher numbers like 50 or 100 times, depending on the available computer time and storage; Phillips et al., 2006; Sillero and Barbosa, 2021), on the same dataset and calculating the average and standard deviation of the results to evaluate if outcomes are consistent across datasets. The latter (variables collinearity) can occur when a wide range of variables is used in the model without assessing the potential collinearity among them. High collinearity among variables can lead to unstable estimates of the model parameters, making it difficult to distinguish the individual effect of each predictor on the response variable. Yet, these crucial steps are frequently overlooked in the literature. In the current research, we have addressed these common issues by both calculating the collinearity among variables and replicating the model 50 times.
A methodological flowchart (Fig. 3) summarises the workflow used to generate and analyse the MaxEnt outputs. The following sub-sections describe the MaxEnt framework, the selected contributing factors, and the application of the model for multi-hazard susceptibility assessment.
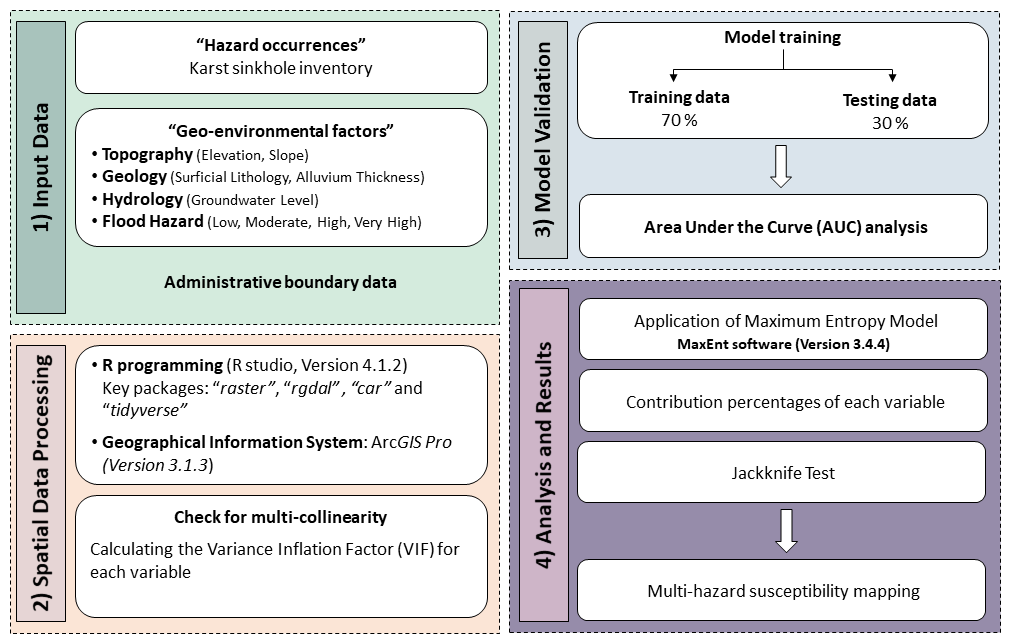
Figure 3The methodological flowchart. The modelling process is divided into four stages: (1) input data (data collection); (2) spatial data processing, (3) model validation; and (4) model application (analysis and results).
3.2 Maximum Entropy Model (MaxEnt)
When there is incomplete and unknown information about a system's probability distribution, Jaynes (1957) suggests that the best estimation is to choose the distribution that maximizes entropy, given the constraints (i.e., environmental variables). This concept is known as the maximum-entropy principle (Phillips et al., 2006). Maximum Entropy Model (MaxEnt) is a statistical–probabilistic machine learning algorithm which quantitatively estimates the probability distribution (P) of target occurrences over the set locations/pixels (X) within the study area based on known contributing factors (Elith et al., 2011) using the Bayesian rule (Rahmati et al., 2016; Shi, 2022). MaxEnt achieves this by dividing the study area into locations or pixels X, each representing a computing unit with a probability value (π(x)) indicating the relative chance of a target event occurrence. The distribution π allocates a positive probability π(x) to every point x, and the sum of these probabilities equals 1.
The response variable (y) represents whether a computing unit experiences a target event (e.g., flood-triggered sinkholes) (y = 1) or not (y = 0). To calculate the probability of a given event occurring at a particular point (), Rahmati et al. (2016) summarises the main aspect of the model extracted from Phillips et al. (2006) and Elith et al. (2011) as follows:
where is the probability of a hazard at a specific point, P(y=1) is the probability of event y being equal to 1, without considering any other variables. It is the marginal probability of variable y taking the specific value 1. is the conditional probability of event x occurring, given that event y is equal to 1. P(x) is the probability of event x occurring without considering any other variables. It is the marginal probability of variable x. The MaxEnt algorithm estimates Φ(x) as equivalent to a Gibbs probability distribution. The Gibbs probability distribution is denoted as Eq. (2):
Zλ(x) and λi represent a normalisation constant (ensuring qλ(x) sums to one across the study area) and the vector of weights assigned to the features, respectively. During the estimation phase of qλ(x), MaxEnt modeling seeks to pinpoint the distribution that follows closely to the constraints. To prevent overfitting, it utilizes l1 regularisation is a penalty term used in the MaxEnt model to reduce overfitting by constraining model complexity (Elith et al., 2011). Therefore, the MaxEnt model aims to discover the Gibbs probability distribution that maximizes penalised log-likelihood values.
Additionally, if there are m occurrences in the study area, the difference between regularisation and log-likelihood, which should be maximized, is denoted as:
where βj represents the regularisation parameter for the jth feature (fj). All input conditioning factors are treated as random variables in the model, following the MaxEnt algorithm.
3.3 Natural sinkhole inventory
The first step in sinkhole-related hazard mapping is to create a sinkhole inventory map showing the locations of the previously identified sinkholes (Kim aet al., 2018). In France, sinkhole events under the title of ground movements (BD Cavité, BDMVT database) are recorded by the French Geological Survey (BRGM) and are publicly available on the national cavity database website (https://www.georisques.gouv.fr/, last access: 5 June 2024). In this study, 915 sinkhole locations with natural origins are considered. Even though it is unclear how many are triggered by floods, the location of sinkholes suggests that about 58 % of sinkholes have occurred within approximately 1 km of the Loire River (Fig. 4). This observation raises concern about the occurrence of more collapses in case of a flood event.
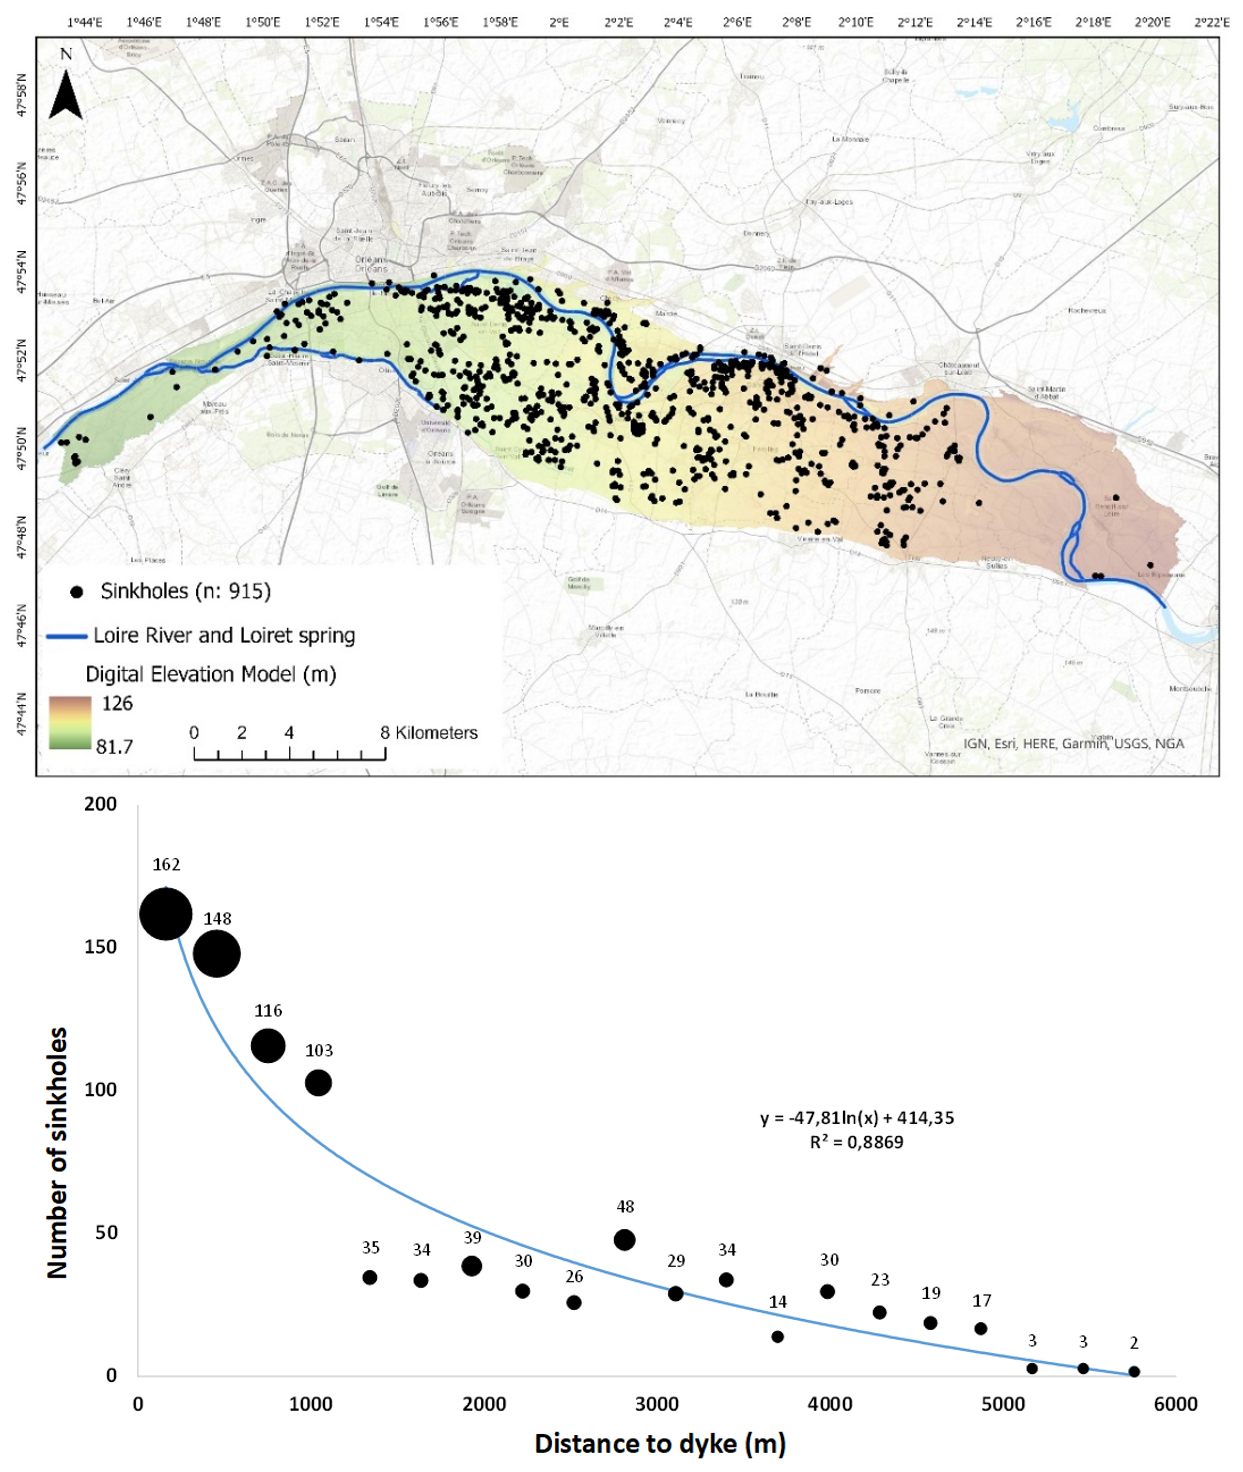
Figure 4(Top) The location of past sinkhole events shown in black circles (915 events). (Bottom) Number of sinkholes and their distance from Loire River's dyke. Sources: BRGM (BD Cavité database, https://www.georisques.gouv.fr/, last access: 5 June 2024); basemap: IGN, Esri, HERE, Garmin, USGS, NGA | Powered by Esri.
3.4 Geo-environmental factors for flood-triggered sinkholes
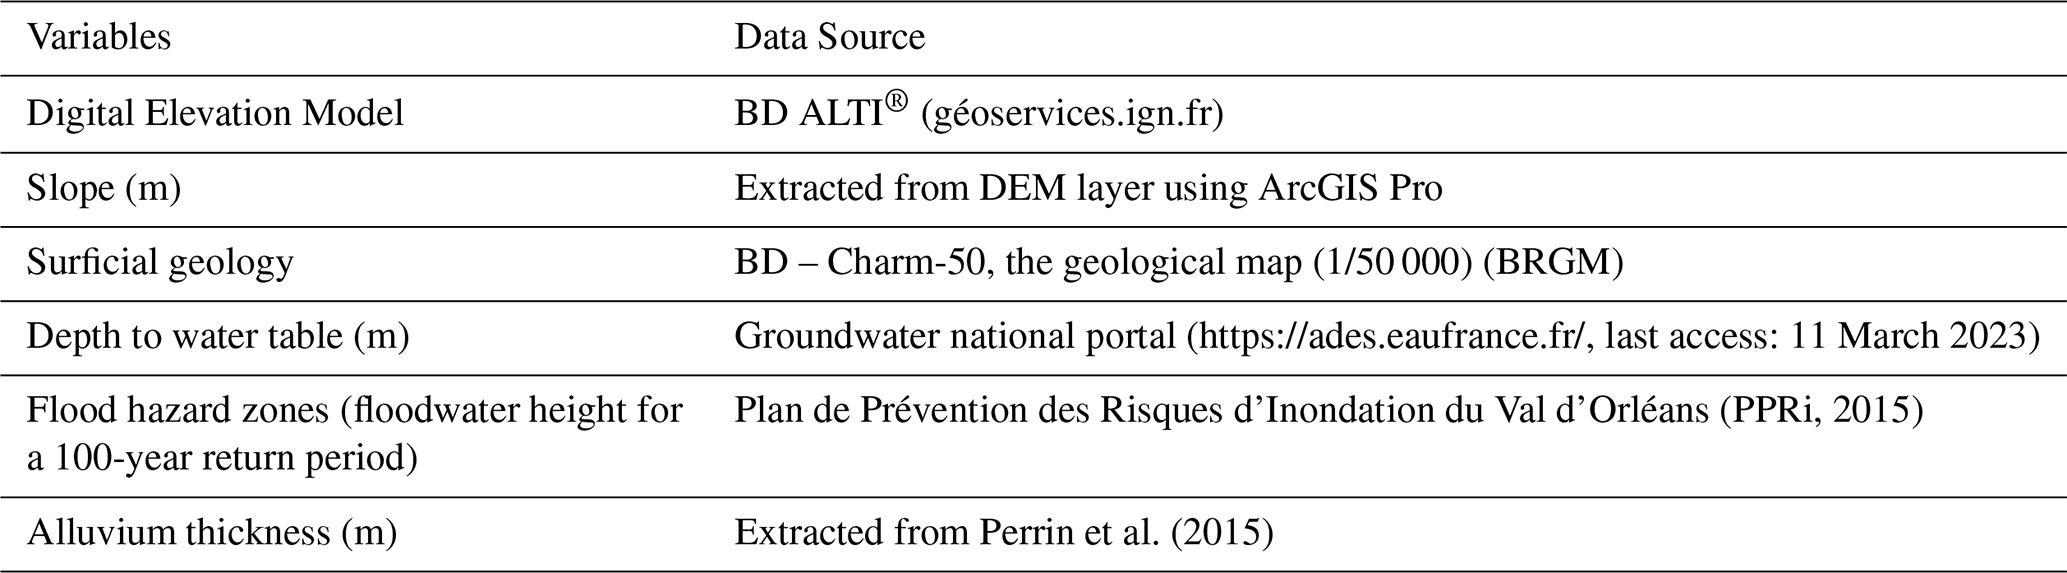
The process of selection of geo-environmental factors was driven by the principle of parsimony, aiming to strike a balance between model simplicity and explanatory power. The concept of parsimonious models, rooted in Occam's razor, emphasises the importance of using the fewest necessary elements to explain a phenomenon effectively (Baker, 2003; Shatz, 2019). We selected six primary factors (Table 2), with the ability to provide substantial explanatory and predictive capabilities while minimizing unnecessary complexity. These factors are topography (elevation and slope), geology (surficial geology and alluvium thickness) and hydrology (depth to water table and flood hazard zones). The selection process was informed by previous studies including geotechnical work carried out in the Val d'Orléans area (Cerema, 2014; Noury et al., 2018; Luu et al., 2019). For each factor, a map was generated using Arc GIS Pro 3.1.3 software (Fig. 5). Below, we explain each factor and the datasets used in map generation.
Table 1Geo-environmental factors included in the MaxEnt model and data sources.
3.4.1 Topography (Elevation and Slope)
Both floods and sinkholes typically occur in low-elevation areas. Low-elevation karst landscapes facilitate water accumulation during intense rainfall events. This may result in a reduced depth to water table (i.e., a rise in groundwater level), which can increase hydraulic pressures within subsurface voids and potentially enhance instability (Kovačič and Ravbar, 2010). These combined effects can increase the risk of sinkhole formation and collapse during flooding events. The elevation data used in this study were obtained from the Digital Elevation Model (DEM) available on the national website BD ALTI® (géoservices.ign.fr, last access: 5 June 2024). The region of Orléans is a relatively low-lying region with the elevation ranging from nearly 82 to 126 m (Fig. 5a). The elevation decreases from east to west in the area where more sinkholes are concentrated. The terrain is characterised by a low to moderate slope gradient (0–71°), with noticeable variation observed alongside the river, where the slope becomes relatively steeper (above 20°) (Fig. 5b).
3.4.2 Surficial geology
In most karst areas, sinkholes do not result from the collapse of the soluble bedrock. Instead, they predominantly occur due to ground failure where soil rapidly washes into bedrock cavities that have developed over geological timescales (Waltham et al., 2005). For this reason, we used surficial geological data instead of the underlying bedrock (limestone) in our analysis. The spatial data were extracted from the geological map of the area, published by BRGM at 1/50 000 scale, using the BD-charm-50 database available on the BRGM official website (https://infoterre.brgm.fr/, last access: 5 June 2024) (Fig. 5c). The area is mainly covered by permeable Holocene and Pleistocene alluvium.
3.4.3 Alluvium thickness
The accumulation of river sediments over time contributes to the increased thickness of alluvium in the central part of the region (2°2′–2°10′ E), which also has a low elevation (81 to 95 m). In these areas, the Beauce limestone is covered by Quaternary alluvial deposits with a thickness of up to 20 m. Noury et al. (2018) note that sinkholes in this region mainly occur due to suffosion (i.e., down washing of the cover material). Therefore, it is reasonable to expect that the thinner the alluvium is, the more likely that cavities are exposed at the surface. Originally generated by BRGM, the alluvium thickness data were extracted from Perrin et al. (2015) by applying the Inverse Distance Weighting (IDW) method to create a raster map (Fig. 5d). Sinkholes in the area mainly occur in the alluvial deposits ranging from 1 to 5 m in diameter (median 2.8 m) and between 1 and 4 m (median 2 m) in depth (Perrin et al., 2015).
3.4.4 Depth to water table
Subsurface cavities in karst systems may enlarge due to groundwater circulation, which enhances dissolution processes in soluble bedrock (Pazzi et al., 2018; Intrieri et al., 2018; Xiao et al., 2018). Variations in hydraulic head can influence internal erosion processes and the mechanical stability of overlying materials (Kim et al., 2018). In this study, we used depth to water table (metres below ground surface, m b.g.s.) as a proxy for groundwater conditions. Depth to water represents the vertical distance between the ground surface and the water table. Smaller values indicate shallower groundwater conditions.
In Val d'Orléans, seasonal hydraulic head differences are relatively limited (approximately 1 m; Desprez, 1967). Therefore, we used the annual average depth to water over an 11-year period (2012–2023) to represent typical groundwater conditions in the area.
Groundwater data were obtained from the national groundwater portal (https://ades.eaufrance.fr/, last access: 23 April 2023). Five active piezometers are located within the study area. To improve spatial representation, five additional nearby stations were included. Depth to water values were interpolated using the Inverse Distance Weighting (IDW) method in ArcGIS Pro (Fig. 5e).
3.4.5 Flood hazard map
We used the official flood hazard map for a 100-return period produced by Plan de Prévention des Risques d'Inondation du Val d'Orléans (PPRi, 2015) (Fig. 5f). The map has been built based on topographical data from the airborne laser digital terrain model (i.e., represents only the bare ground surface) and the analysis of past floods for frequency and intensity calculations. Three major floods from the 19th century (1846, 1856, and 1866) were chosen as the reference floods (PPRi, 2015). The hazard zones represent the floodwater height. There are four hazard zones, each separately incorporated into the MaxEnt model: Zone 1: Low (0 to 0.5 m), Zone 2: Moderate (0.5 to 1 m), Zone 3: High (1 to 2.5 m), and Zone 4: Very high (greater than 2.5 m).
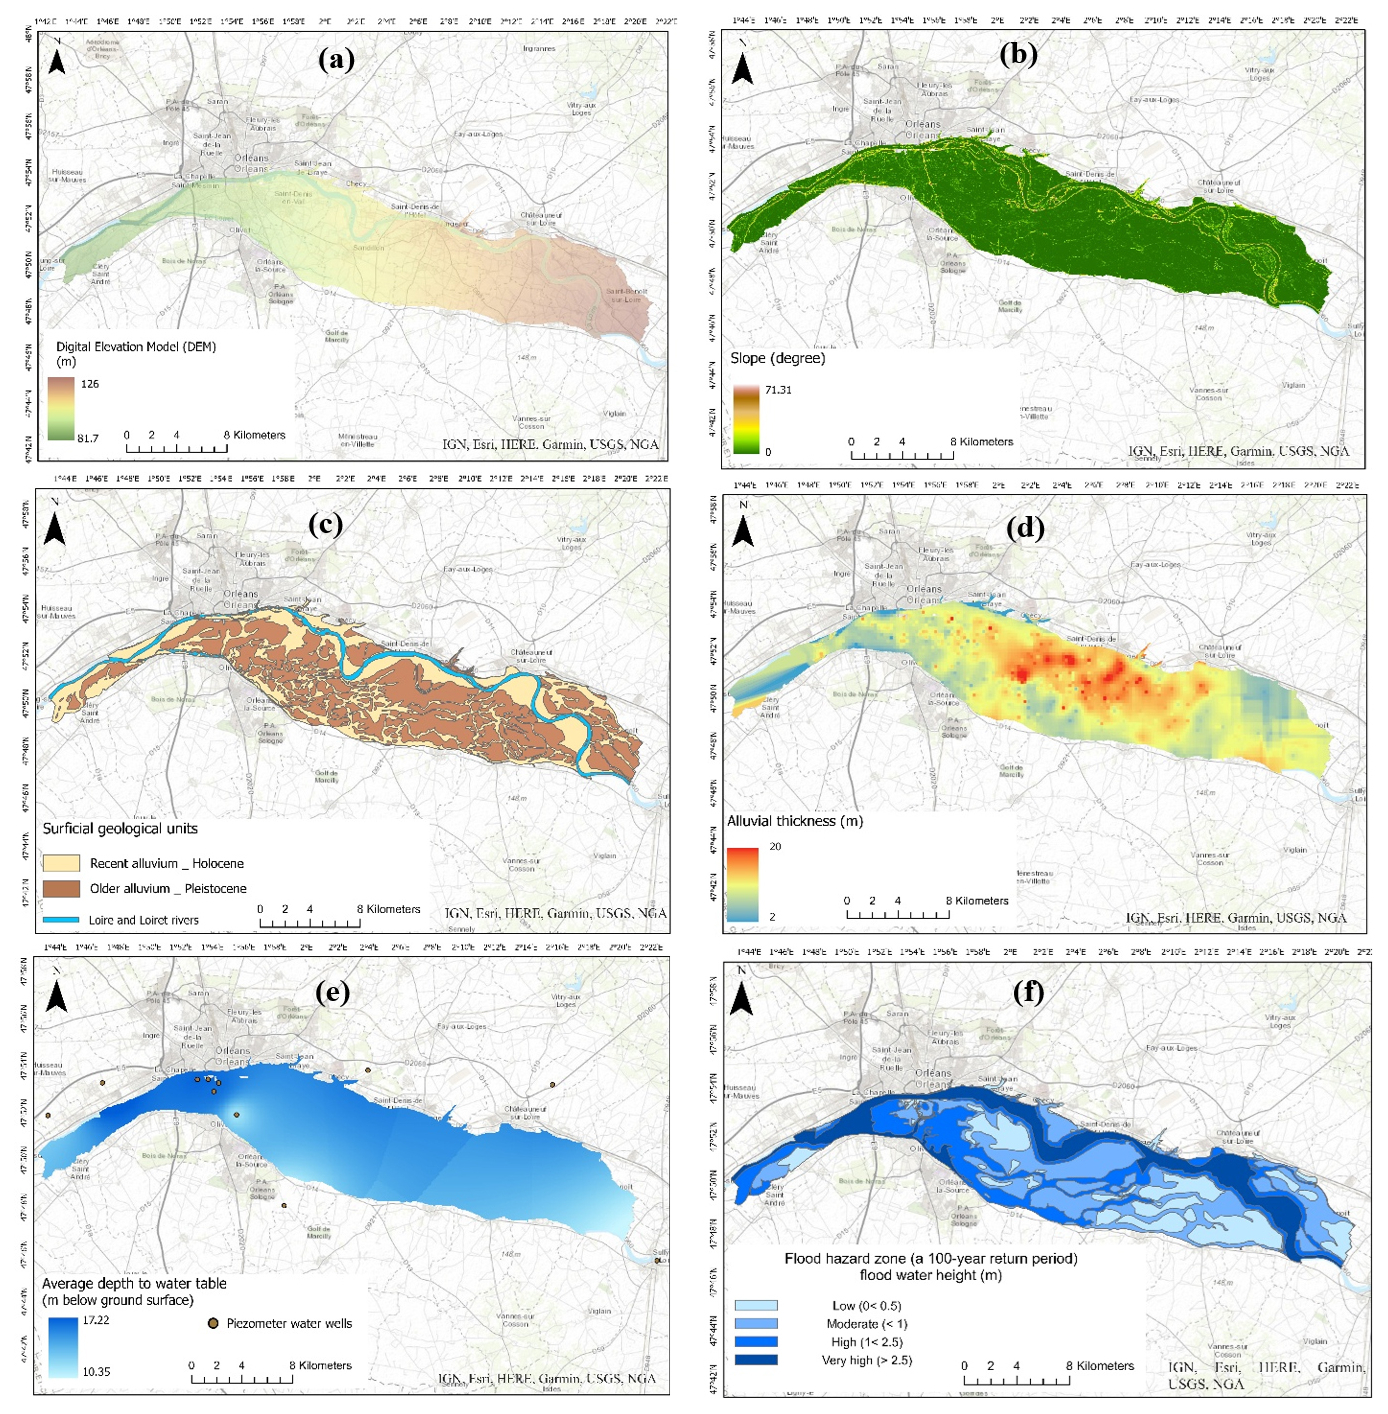
Figure 5The six thematic maps of geo-environmental factors for assessing the spatial distribution of flood-triggered sinkholes over the study are; (a) Elevation: showing a low-lying area with elevations ranging from 81.7 to 126 m; (b) Slope: depicting a degree of slopes from 0 to 71; (c) Surficial geology: consisting of new and old alluvium layers; (d) Alluvium thickness: Quaternary alluvial deposits with a thickness up to 20 m; (e) Average depth to water table (m b.g.s.): interpolated annual mean values based on 11 years of piezometric data (2012–2023), ranging from approximately 10 to 17 m; (f) Official flood hazard map: classified into four levels of hazard (low, moderate, high and very high). Sources: IGN (BD ALTI®, géoservices.ign.fr); BRGM (BD Charm-50, BD Cavité); Eaufrance (https://ades.eaufrance.fr/); PPRi (2015); Perrin et al. (2015); basemap: IGN, Esri, HERE, Garmin, USGS, NGA | Powered by Esri.
3.5 Data processing and parameter setting
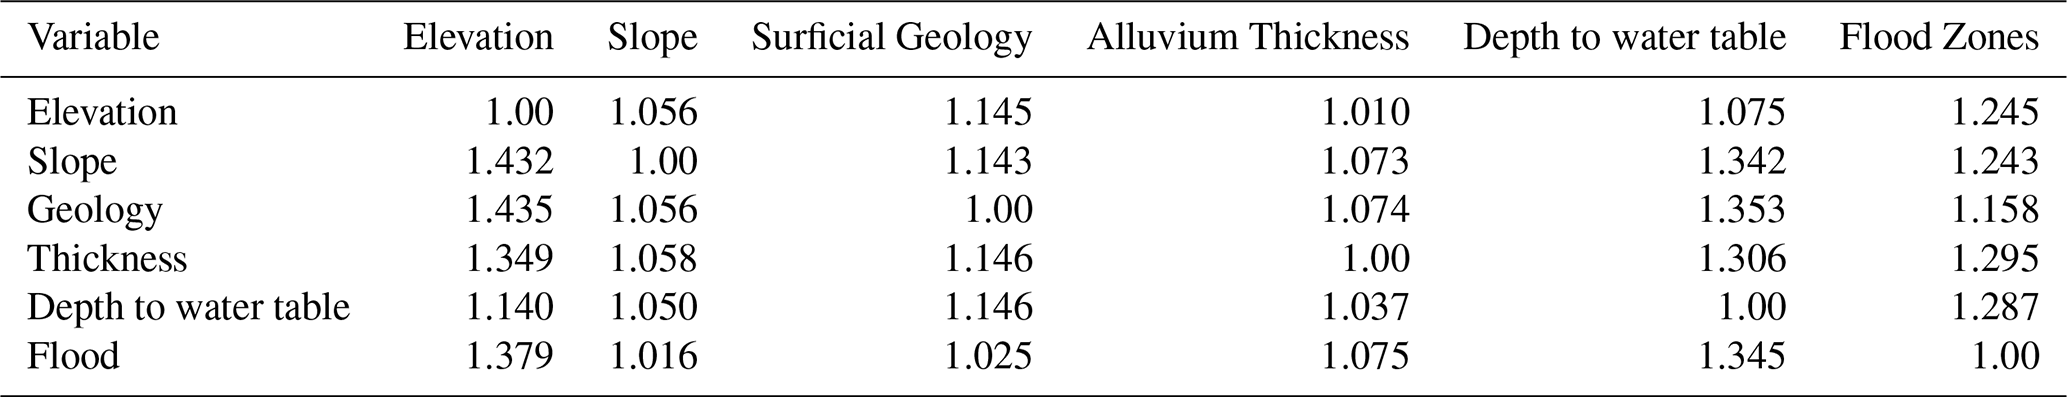
To prepare the input data, we used MS Excel©, Arc GIS Pro 3.1.3, and R Studio program version 4.1.2. MaxEnt software version 3.4.4 was then used to generate the model and the susceptibility map. Using R Studio, we rasterised all the geo-environmental layers so that they have the same geographic boundary, cell size (10 m pixel), and map projection (French coordinate system RGF 1993 Lambert-93). The collinearity test was then applied to all the rasterised layers by calculating Variance Inflation Factor (VIF) using the “car” package in R Studio. As discussed in Sect. 3.1, many modelling algorithms are affected by high correlation among predictor variables, with the following consequences: (i) over-fitted results, and (ii) dependent response curves (Sillero and Barbosa, 2021; Sillero et al., 2021). The VIF measures the extent to which each variable is correlated with a combination of all other variables within the model (Sillero et al., 2021). According to Chatterjee and Hadi (2013), VIF values are interpreted as shown below:
-
VIF = 1. There is no correlation between the variable in question and the other variables.
-
1 < VIF 5. This range suggests a moderate correlation among predictors, which is generally not problematic.
-
VIF ≥ 5. A VIF value in this range signals a high level of multi-collinearity, potentially problematic, and might require further analysis or corrective measures.
The VIF for each variable is less than 1.50 (Table 3), suggesting there is no significant multi-collinearity among the variables.
Table 2The VIF matrix for the six variables calculated by the “car” package in R.
From the sinkhole occurrence dataset, we randomly allocated 70 % as training data to calculate the model, while the remaining 30 % was set aside for independent testing of model performance.. This ratio is commonly used in machine learning methods, striking a balance between avoiding overfitting and model accuracy (Rahmati et al., 2016; Yousefi et al., 2020; Rusk et al., 2022). Because sinkholes are spatially clustered along the Loire River, the random split may not fully ensure spatial independence between training and testing datasets. Therefore, the reported AUC primarily reflects within-area discrimination rather than fully spatially independent predictive performance. To ensure the convergence of our model towards an optimal solution, we set the maximum iterations parameter to 1000. This iteration number allowed the MaxEnt algorithm sufficient opportunity to adjust its parameters iteratively, seeking to minimise prediction error and accurately reflect the observed distribution patterns of the data. To assess the reliability, stability, and uncertainty of predictions, we employed 50 replicates in our MaxEnt analysis considering the available computational resources.
MaxEnt has four output formats (raw, cumulative, logistic and cloglog). Each has different theoretical justifications, with the choice of selecting one being highly dependent on the specific objectives of the analysis and data characteristics (Phillips et al., 2017). For this research, the logistic output was chosen which provides interpretable probability values (ranging from 0 to 1). This choice allows for the setting of thresholds that are consistent with the binary nature of presence/absence data, making the threshold settings clear and directly related to the probability values. Additionally, MaxEnt controls model complexity and prevents overfitting through regularisation (Radosavljevic and Anderson, 2014). For an in-depth understanding of the different tuning processes, refer to Radosavljevic and Anderson (2014).
In this section, we present the outcomes of the MaxEnt modeling analysis, which include assessing model performance using the Receiver Operating Characteristic (ROC) test, generating a forecasted multi-hazard susceptibility map, and producing response curves for six flood-triggered sinkhole susceptibility factors. Additionally, we assess the importance of each factor using a jackknife test. Finally, we compare the existing flood hazard data with the resultant multi-hazard susceptibility map.
4.1 Model performance assessment
The Receiver Operating Characteristic (ROC) graph is a commonly used method for quantitatively assessing the performance (discriminatory power) of a diagnostic test. To assess the model's discriminatory power, we examine the relative trade-offs between the true positive rate (Sensitivity) and the false positive rate (1-Specificity) across all potential classification thresholds (Fawcett, 2006). This relationship is captured by the Area Under the Curve (AUC) metric, which ranges from 0 to 1. An AUC value of 0.5 signifies a model's performance that is no better than random discrimination, serving as a critical benchmark. Thus, any AUC value above 0.5 indicates a model that discriminates between presence and absence more effectively than random guessing, demonstrating its predictive accuracy (Fawcett, 2006; Phillips et al., 2006; Sillero et al., 2021). The reported AUC (Fig. 6) corresponds to the mean test AUC (30 % withheld presence data) averaged over 50 replicate runs. In MaxEnt, AUC measures discrimination between presence locations and randomly sampled background (pseudo-absence) points rather than true presence–absence classification.
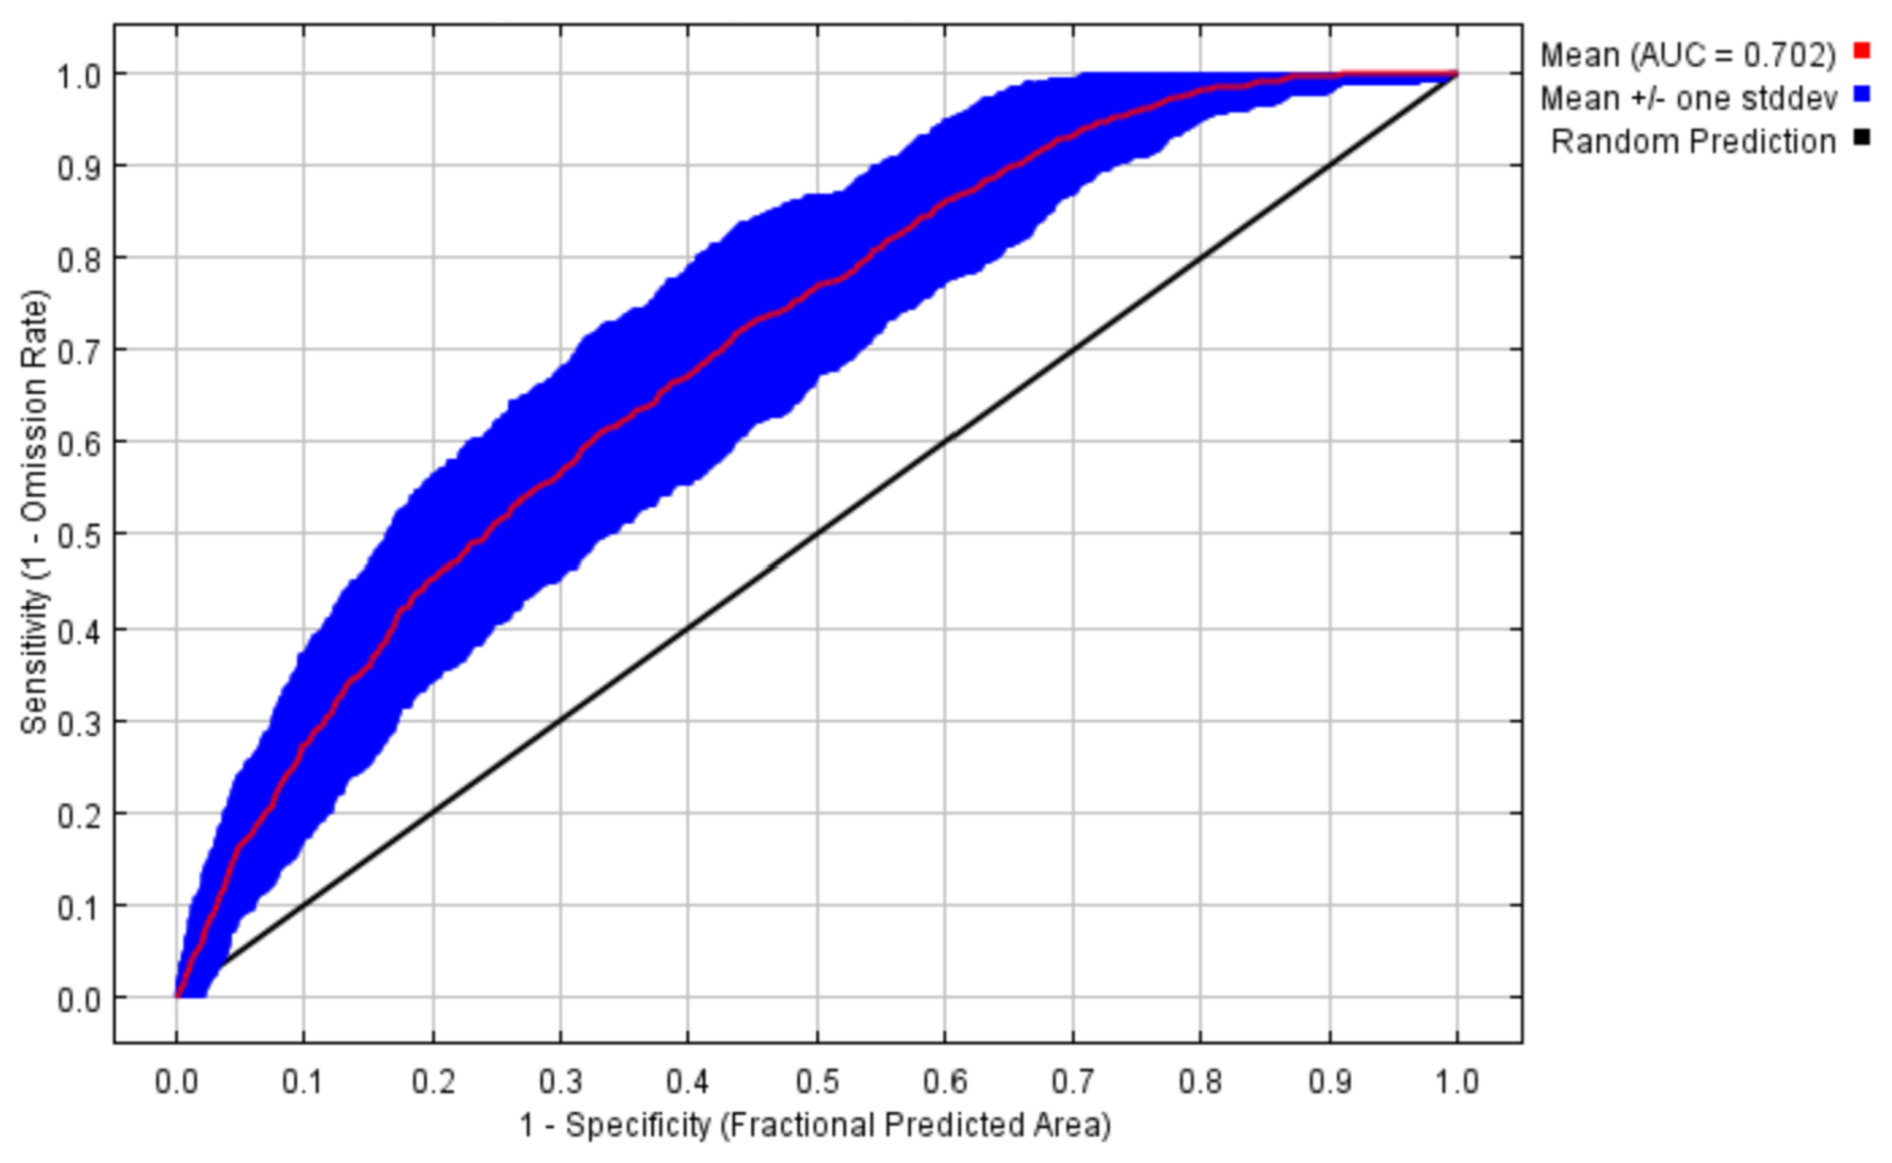
Figure 6Receiver Operating Characteristic (ROC) curve and Area Under the Curve (AUC) results based on the test dataset (30 % withheld presence records) averaged over 50 MaxEnt replicate runs. The black diagonal line represents random discrimination (AUC = 0.5). The red curve shows the mean ROC curve (mean test AUC = 0.702). The shaded blue area represents ±1 standard deviation across the 50 replicate runs.
The average test AUC is 0.702 (standard deviation 0.055), indicating a satisfactory predictive performance of the model (to better understand the threshold performance, see Fawcett, 2006 and Phillips et al., 2006). This AUC value reflects moderate discrimination ability; therefore, the results should be interpreted in terms of relative susceptibility patterns rather than deterministic prediction.
4.2 Multi-hazard susceptibility mapping
Based on MaxEnt logistic output, the calculated value of the model ranges from 0 to 1, with higher values indicating a higher probability of multi-hazard susceptibility. The map generated by MaxEnt model was reclassified into four susceptible zones: “Low”, “Moderate”, “High”, and “Very high” using the Natural Breaks (Jenks classification) method, in ArcGIS Pro 3.1.3. Considering the actual distribution in the hazard data, this method, which is commonly used for hazard data classification, proves useful for datasets that are not evenly distributed. It is particularly effective in identifying natural groupings of similar values, highlighting outliers (Herries, 2018).
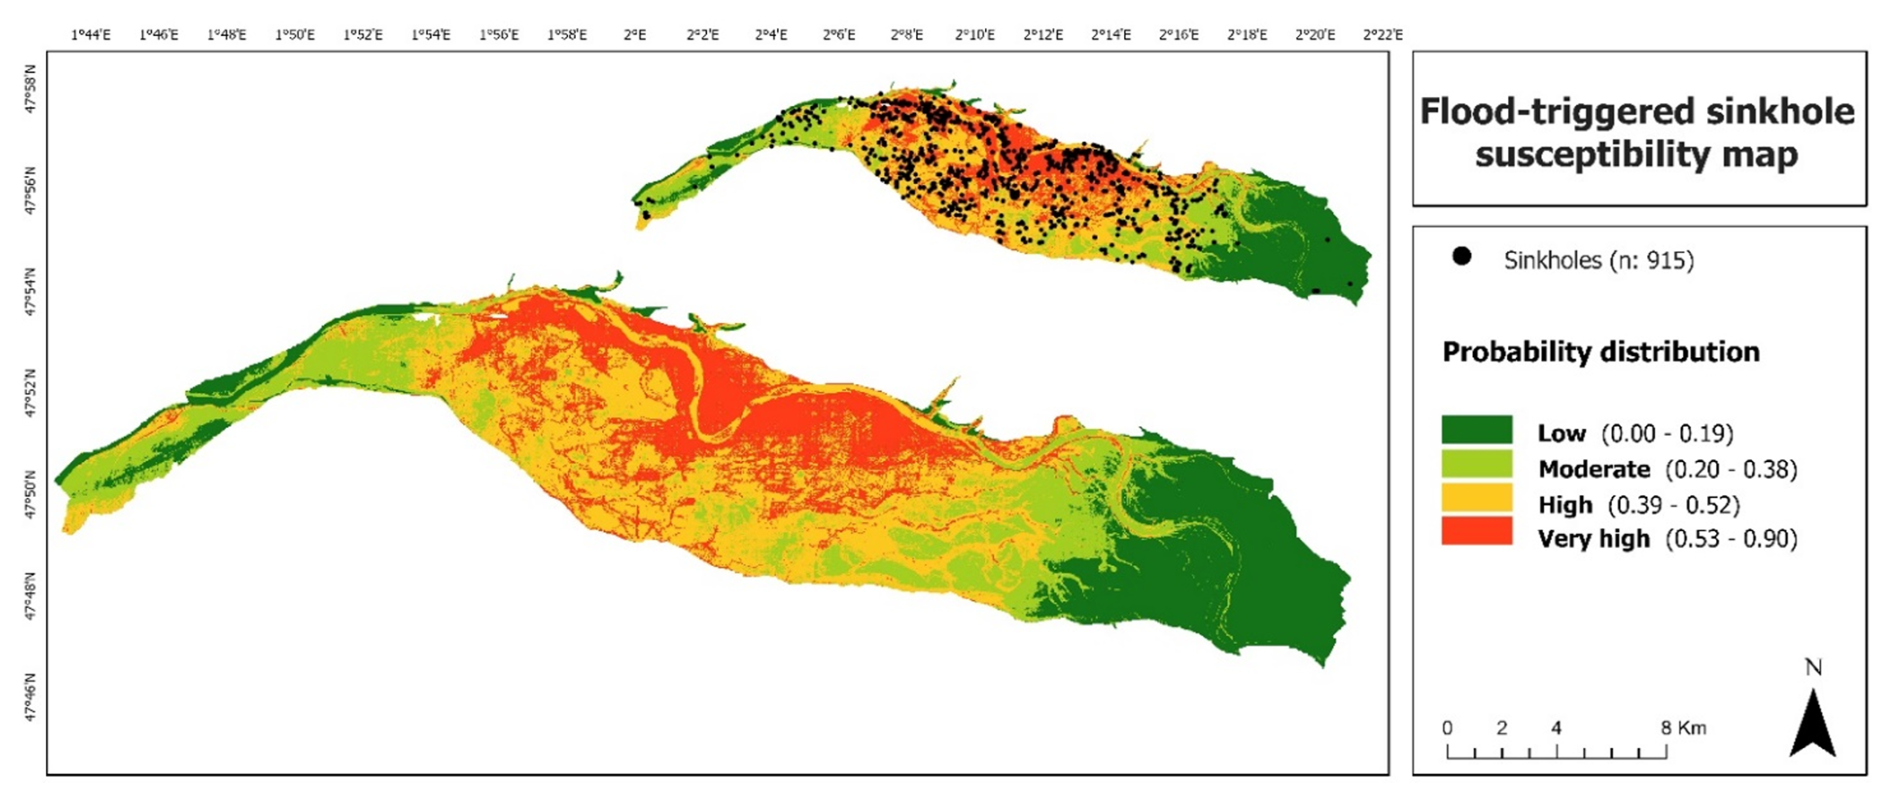
Figure 7Classified multi-hazard susceptibility map generated by MaxEnt model using the natural breaks method. The map on top is the same map overlaid with the sinkhole locations. Dark green indicates comparatively low hazard susceptibility, with a relative index of probability distribution ranging from 0.00 to 0.19. Light green corresponds to a moderate hazard level ranging from 0.29 to 0.38. The orange and red colors represent the high and very high susceptible areas with probability distribution of 0.39 to 0.52 and 0.53 to 0.90, respectively.
The classification of the multi-hazard susceptibility map into four distinct classes aligns strategically with the map classification guidelines outlined in PPRi (2015), the official French document for flood risk prevention planning. Figure 7 illustrates the potential spatial distribution of the flood-triggered sinkholes across Val d'Orléans, presented as a raster surface with a resolution of 10 m per cell. The red-coloured areas denote a “very high” level of susceptibility, covering 21.7 % of the region with the relative probability distribution quantified from (0.53–0.90). Additionally, the distribution of susceptibility levels includes “high” in orange (33.5 %, probability 0.39–0.52), “moderate” in light green (21.6 %, probability 0.20–0.38), and “low” in dark green (23.2 %, probability 0.00–0.19). Most of the area is classified as High to Very high (∼ 55 %, about 146 km2) where the majority of sinkholes are located. The western and most of the eastern parts are classified as Low to Moderate.
4.3 Model-specific response curves and variable contributions
Model-specific response curves (Fig. 8) are generated from MaxEnt models using one variable at a time to capture the influence of that variable in the presence of its correlations with other variables. The probability distribution of the flood-triggered sinkhole occurrences across six contributing factors can be summarised as follows.
-
The elevation response curve (Fig. 8a) shows low predicted susceptibility at the lowest elevations, with a clear peak between 90 and 105 m. Within the model, this range corresponds to the highest relative probability of flood-triggered sinkhole occurrence. Above 105 m, the predicted probability declines markedly and remains low beyond approximately 110 m, indicating lower modelled susceptibility at higher elevations. The slope curve (Fig. 8b) exhibits a typical logistic (S-shaped) pattern, indicating an increasing probability of sinkhole occurrences with increasing slope steepness. Slopes with steepness of up to 10° show a very low probability of flood-triggered sinkhole occurrences. Between approximately 10 to 50°, there is a sharp, consistent increase in the probability. Between 50 and 71°, the probability of sinkhole occurrence remains relatively high.
-
The geological response histogram (Fig. 8c), presented as a categorical layer, indicates that the highest probability value corresponds to the recent alluvium (Holocene in age). The predominant surficial geological layers in the area consist of both recent and older alluvium (Holocene and Pleistocene, respectively).
-
The alluvial thickness curve (Fig. 8d) shows a very low probability of flood-triggered sinkhole occurrences where the alluvial thickness is minimal (close to 0). Probability increases sharply up to approximately 10 m and continues to increase more gradually toward 20 m.
-
The response curve for depth to water (Fig. 8e) indicates relatively low predicted susceptibility at very shallow groundwater conditions.
-
The model suggests increasing susceptibility at intermediate depth-to-water values (approximately 14–16 m below ground surface), followed by a decline at greater depths. This pattern may reflect spatial associations between groundwater conditions and other geo-environmental factors rather than a direct mechanistic threshold. Therefore, the observed peak around ∼ 15 m should be interpreted as a statistical tendency within the model rather than evidence of a specific hydrogeological optimum for sinkhole formation.
-
The curve of flood hazard zones (Fig. 8f) shows that as the flood hazard level increases, suggesting a higher probability of sinkholes occurring in areas with more severe flood hazards where the level of floodwater during a 100-year flood event could reach up to 2.5 m. This observation aligns with the empirical data, as about 58 % of the sinkholes were recorded within 1 km from the river (Fig. 4).
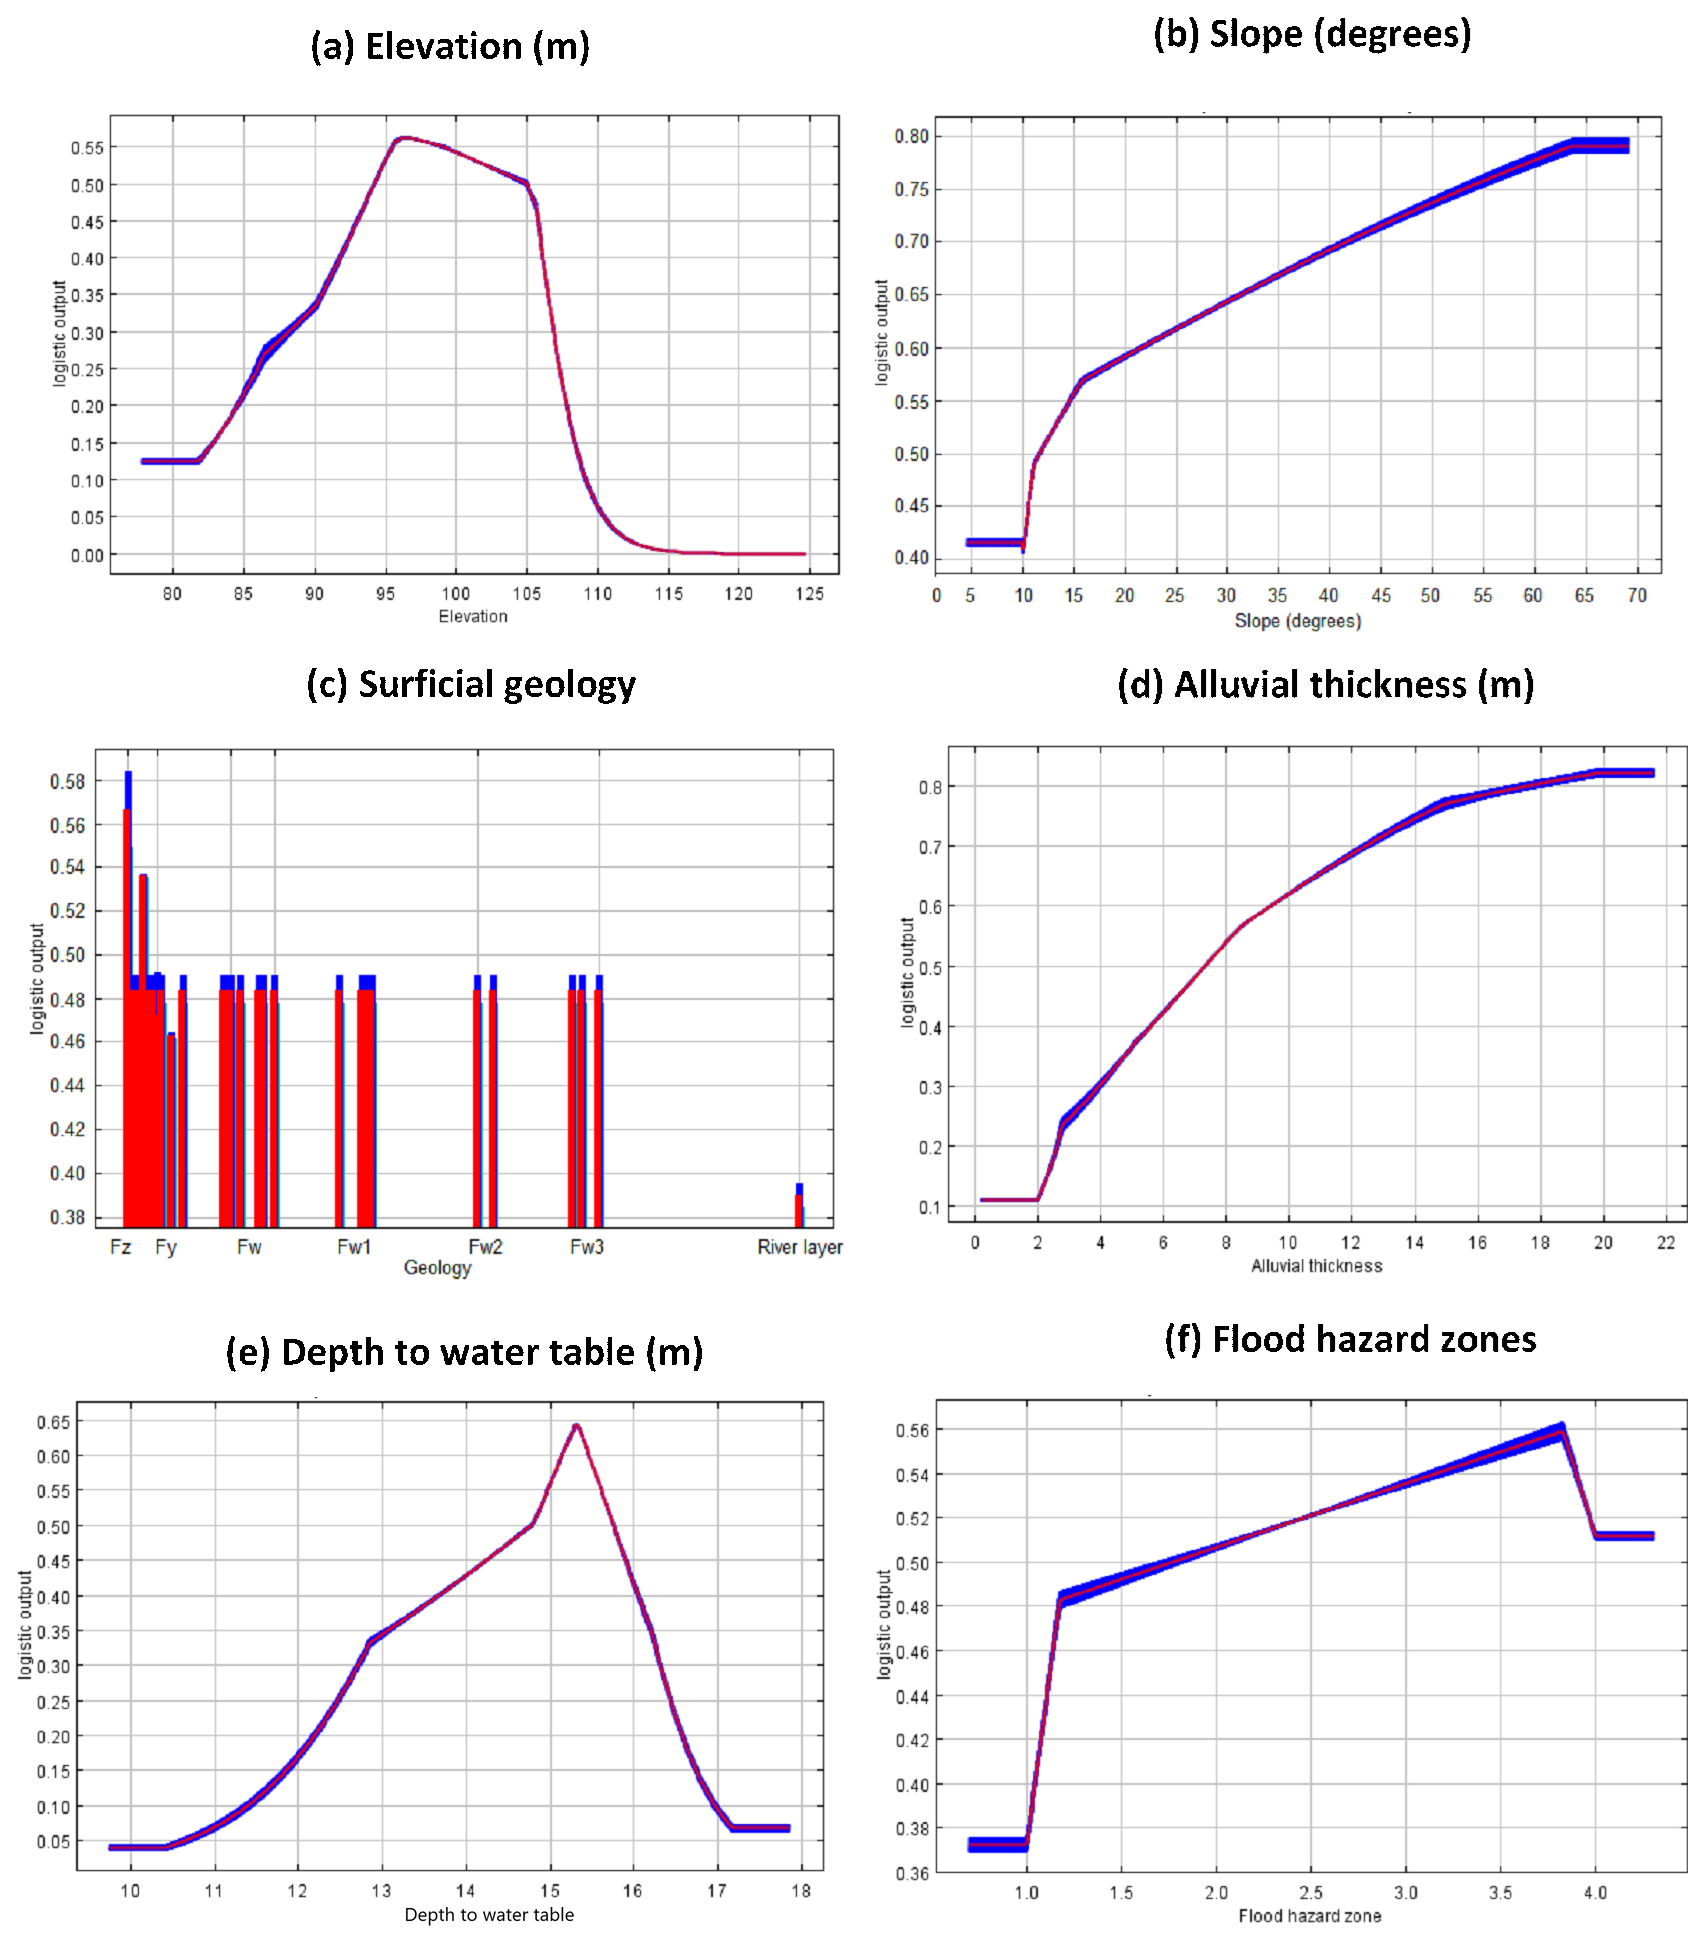
Figure 8MaxEnt model response curves and histogram for flood-triggered sinkhole susceptibility factors. The curves and the histogram show the mean response of the 50 replicate MaxEnt runs (red) and the mean ±1 standard deviation (blue); each graph provides information of the impact of each factor and their correlations with other variables. (a) Elevation Response Curve: Indicates a peak sinkhole occurrence probability between elevations of 90 to 105 m. (b) Slope Response Curve: Indicates that, within the model, higher slopes correspond to higher predicted probability. (c) Geology Histogram: Displays the distribution of sinkhole probability across different geological units, highlighting that the highest value corresponds to the recent alluvium deposits (Holocene) signified the letter “Fz and Fy”; the letters “Fw, Fw1,2,3” are associated with layers of older alluvium deposits (Pleistocene). (d) Alluvial Thickness Response Curve: Shows a steady increase in the suitability of the occurrences as the thickness increases. (e) Average depth to water table: shows a peak in predicted susceptibility at intermediate depth-to-water values (around 15 m below ground surface). (f) Flood Hazard Response Curve: shows a positive correlation between flood hazard and sinkhole formation potential.
The jackknife test graph (Fig. 9) illustrates the influence of each contributing variable on the model's AUC in two scenarios: with the variable (blue bar) and without it (green bar). The jackknife test, a resampling technique recognised for its efficacy in assessing variable importance within a model (Phillips et al., 2006), systematically omits one variable at a time from the dataset to re-evaluate the model's predictive performance (Phillips et al., 2006). Results from the jackknife test reveal that elevation yields the highest AUC value when used as the sole predictor, highlighting its strong contribution to overall model performance. The second significant AUC value belongs to depth to water followed by alluvial thickness and slope. Meanwhile, “Flood hazard zones” and “Geology”, although contributory to the overall AUC, shows a reduced impact when considered in isolation.
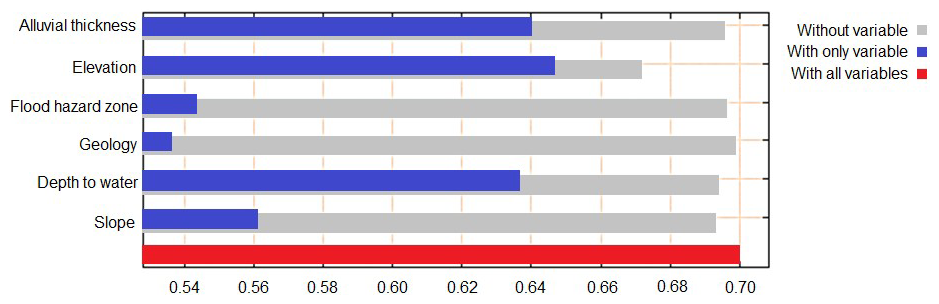
Figure 9The plot of the jackknife test results of the averages over 50 replicate runs contributing factor importance. The grey bar represents the AUC of the model without the corresponding variable, while the blue bar shows the AUC processed with only the corresponding variable. The longer the blue bar, the more important is the variable for model probability distribution. The red bar represents the AUC of the final model considering all the variables.
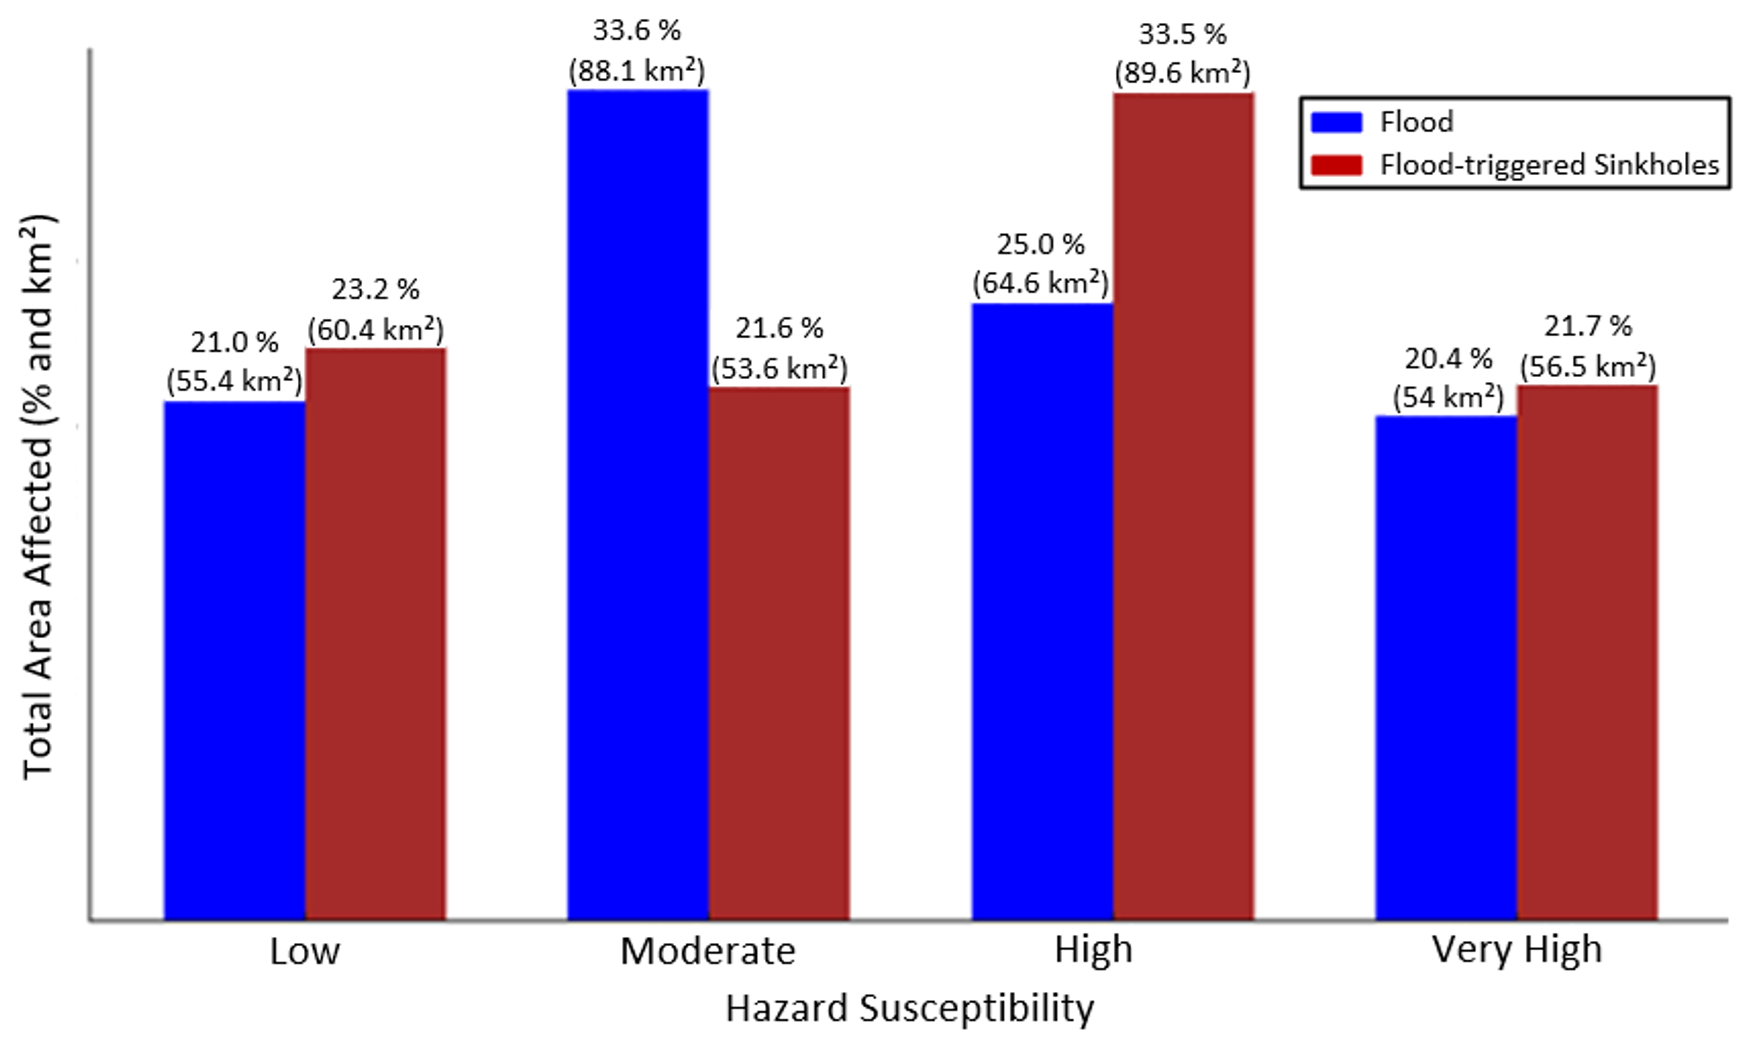
Figure 10Spatially comparing areas covered by different susceptibility classes for two related yet distinct hazards in the study area: flood and flood-triggered sinkholes. The blue bars show the total areas affected by flood in both percentage and kilometre square. The red bars illustrate the total areas affected by flood-triggered sinkholes in both percentage and kilometre square.
For the purpose of land use planning and natural hazard mitigation measures in Val d'Orléans, we compared and visualised the spatial extents affected by flooding as a single hazard and those susceptible to flood-induced sinkholes, representing a complex multi-hazard scenario. It is important to acknowledge the inherent differences in the nature and methodologies employed in hazard mapping (considering magnitude and frequency) and susceptibility assessments (spatial probability distribution). However, we have focused on comparing the spatial overlaps by means of a classification approach representing an effort towards standardisation to partially overcome the existing challenges in comparison of hazards within multi-hazard studies (Kappes et al., 2012). Figure 10 shows the extent to which different areas are affected by flood as a single hazard (the official map produced by PPRi, 2015, see Fig. 5f) and susceptible to sinkholes triggered by flooding as a multi-hazard (Fig. 7). The areas classified as having a “Low” flood hazard and flood-triggered sinkholes account for 21 % and 23.2 %, respectively. The “Moderate” flood hazard areas cover 33.6 % of the region, whereas the areas susceptible to flood-triggered sinkholes constitute significantly less, at 21.6 %. This 12 % discrepancy suggests that the factors contributing to flooding do not uniformly increase the risk for sinkholes, indicating that the other factors also are involved in flood-triggered sinkholes. The “High” susceptibility class shows a considerable difference between the two hazards, with a higher percentage of areas susceptible to flood-triggered sinkholes (33.5 %) than to flooding (25 %). For areas of “Very high” susceptibility, there is a notable spatial overlap between the flood hazard, which cover 20.4 % of the area, and flood-triggered sinkholes, which cover 21.7 %. This suggests the spatial overlap of these two hazards.
The MaxEnt method was applied to model susceptibility to flood-triggered sinkholes, achieving satisfactory discriminatory performance (mean test AUC = 0.702). The model's spatial distribution of relative probabilities indicates that approximately 55 % of the study area (about 146 km2) falls within the High and Very high susceptibility categories. Elevation shows the highest relative contribution to overall model performance, with the 90 to 105 m range corresponding to the highest predicted susceptibility values. Additionally, areas with depth to water table of about 15 m appear to be relatively more prone to sinkholes. This underlines that in the Val d'Orléans, characterised by its flood plains overlying karstic bedrock, factors such as elevation and depth to water table are strongly associated with higher modelled susceptibility and a greater likelihood of sinkholes occurring during flood events. Furthermore, areas within the region that have relatively steeper slopes (above 20°), greater alluvial thickness (about 10 to 20 m), covered by recent alluvial (Holocene) units, and higher flood hazard scores, which correspond to higher water levels are more susceptible to flood-triggered sinkholes. The low predicted probability at minimal alluvial thickness is consistent with the dominant cover-collapse and cover-suffosion mechanisms documented in the Val d'Orléans, where sinkholes typically develop within alluvial deposits overlying karstified limestone (Noury et al., 2018; Luu et al., 2019). The region is largely characterised by mantled karst conditions, and the sinkhole inventory is dominated by collapse features within alluvial cover. While isolated solution sinkholes in areas of minimal cover cannot be excluded, they are not the predominant type represented in the inventory used for model calibration. Therefore, the susceptibility map primarily reflects the spatial controls on cover-collapse processes in this specific geomorphological context.
The jackknife results should be interpreted cautiously, as they provide relative importance values within a correlative modelling framework. The comparatively low standalone contribution of flood hazard zones should not be interpreted as evidence that flooding is unimportant in sinkhole formation. Rather, it reflects the distinction between triggering mechanisms and spatial susceptibility conditions. In the Val d'Orléans, flood-prone areas spatially overlap with low elevations, depth to water table around 15 m, and specific geological units. Consequently, much of the spatial signal associated with flood exposure is already represented by these conditioning variables. Within a static susceptibility model, triggering processes may therefore exhibit lower standalone discriminatory power, even though they remain critical in the temporal activation of collapse events.
Our findings reveal that areas with the highest susceptibility are primarily located along the Loire River and close to the Loiret spring, pinpointing these zones as critical regions of concern for potential multi-hazard occurrences. This pattern of susceptibility is underpinned by historical hydrological events; notably, Martin et al. (2003) document a significant event in 1907 where flooding led to the Loire River's backflow into the Loiret. Consequently, the spatial analysis delineates the historically affected areas by this backflow between the Loire and Loiret as areas with High to Very high susceptibility. Meanwhile, the western sections of the study area (approximately ranging from longitude 1°43′ to 1°54′ E) are classified as having Low to Moderate susceptibility, although sporadic areas of High and Very high susceptibility exist near the Loire River, suggesting localized areas of susceptibility. In contrast, the eastern parts (approximately ranging from longitude 2°14′ to 2°20′ E) are characterised by relatively Low susceptibility (areas in dark green), largely attributed to higher elevations (about 110 to 126 m), which are associated with lower modelled susceptibility. The highest susceptibility probability in the most susceptible areas is a relative probability value of 9 and the lowest susceptibility probability is a relative value of 0.0001 suggesting that the model forecast a very low, but not necessarily zero of susceptibility. This information has relevance for policymakers and disaster risk management officials when prioritising resources and efforts for areas with the highest risk, while not neglecting the lower risk areas.
Our comparison of the existing flood hazard map and the new multi-hazard susceptibility map (this study) reveals that areas exhibiting both Very high and High overlaps in flood hazard and flood-triggered sinkhole susceptibility, such as those observed along the Loire River (from 1°54′ to 2°12′ E), require close evaluation for their potential sinkhole susceptibility. This underscores the necessity for integrated hazard assessments and mitigation strategies that consider both surface (i.e., floods) and subsurface (i.e., sinkholes) conditions. Furthermore, it becomes evident that areas prone to flood hazard do not always directly correlate with those susceptible to flood-triggered sinkholes, suggesting a spatially non-linear relationship, as seen in the eastern part (2°14′ to 2°20′ E) and western part (1°43′ to 1°54′ E). This indicates that although the two hazards are related, their spatial distributions are not fully coincident. This information can be used to enhance emergency planning and public awareness campaigns, ensuring they address specific risks presented by both hazards and support efforts to advance multi-hazard understanding and frameworks in risk assessment and disaster preparedness.
There are some limitations that introduce uncertainties into the modelling of susceptibility in this study. The quality of predictive models depends heavily on the completeness and representativeness of the sinkhole inventory (epistemic uncertainty) (Galve et al., 2009; Taheri et al., 2019). Specifically, for mapping the susceptibility of flood-triggered sinkholes, having an inventory that documents only sinkhole collapses triggered by flood events might yield more accurate results. Nevertheless, obtaining this information typically presents challenges, such as data scarcity and potential limitations in coverage. This also underscores the importance of recording sinkhole triggers along with their respective locations, itself requiring sufficient monitoring to support identification of newly triggered sinkholes. In addition, the limited elevation variability within the study area and its systematic east–west gradient mean that elevation may partly function as a spatial proxy variable in the modelling framework. Therefore, its high contribution to model performance should not be interpreted as evidence of a strictly causal elevation–sinkhole mechanism but rather as reflecting broader spatial and geomorphological patterns.
Another limitation is that in an area characterised by a high flood hazard, particularly in the context of flood-triggered sinkholes, it becomes evident that there exist localised geological features that pose significant challenges for inclusion in modelling efforts. These localised factors are primarily related to the complex geological characteristics of the region. For instance, certain areas may exhibit distinct lines of geological weakness and fractures that facilitate the movement of water. Consequently, water is more likely to erode materials in these areas, increasing the risk of sinkhole formation. Integrating such fine-scale geological information into a model can be challenging, as it requires highly detailed geological maps with fine resolution. These features represent specific susceptibilities that may not be adequately accounted for in standard modelling approaches like MaxEnt. As a result, a more in-depth investigation, such as detailed mapping and site-specific assessments, becomes essential for gaining a comprehensive understanding of the likelihood and precise locations of flood-triggered sinkhole occurrences, especially in areas with complex geological characteristics. We also acknowledge that despite our careful and informed approach in choosing parameters for the MaxEnt model, there remains an inherent uncertainty associated with tuning the model parameter settings.
The multi-hazard susceptibility map generated through this study may serve as a communication tool to support decision makers involved in resource allocation and risk mitigation efforts. Additionally, it can be used for raising awareness among the public about the diverse risks they may encounter, fostering a culture of preparedness and resilience within the community. While the probability of simultaneous occurrences of sinkholes triggered by flood events may be low, the consequences could be disproportionately high, requiring a proactive and preventive approach to community safety and disaster risk reduction. Since multi-hazard maps are a relatively recent addition to disaster risk management practices, further research is essential to seek stakeholders' perspectives on the utility of multi-hazard maps, ensuring that generated maps support decision-making processes.
In this study, we focus on a typical multi-hazard scenario prevalent in karst environments, specifically flood-induced sinkholes, using the Orléans region (Val d'Orléans), France, as a case study. We develop a multi-hazard susceptibility map that recognises the spatial interrelationships of flooding and sinkhole occurrences, which to our best knowledge is the first attempt in producing multi-hazard susceptibility map in karst area of Val d'Orléans and in the multi-hazard literature. This map incorporates the official flood hazard map as a factor influencing sinkhole formation/collapses in the area. Using the MaxEnt model, we find elevation (90 to 105 m) to be the variable with the highest relative contribution for flood-triggered sinkholes, followed by depth to water table (at or near 15 m) and alluvial thickness (10 to 20 m). Our findings indicate that the middle parts of the study area and areas along the Loire River are highly susceptible to the combined flood/sinkhole hazard. Additionally, our comparison of existing single flood hazard map and the multi-hazard susceptibility map reveals a spatially non-linear relationship between the locations prone to flood hazards and sinkhole development. This finding indicates that while flood management is essential, it must be coupled with an understanding and anticipation of secondary hazards, such as sinkholes in kart terrains that may be triggered or exacerbated by flooding. This is particularly crucial in areas of High and Very high flood hazard zone, where the susceptibility to sinkholes is increased. This research demonstrates the applicability of MaxEnt for representing flood-triggered sinkhole susceptibility within a multi-hazard framework in a karst environment.
The application of the MaxEnt model and its 50 times replications in our study yielded results with the satisfactory forecasting outcomes meaning that the model could fitted well into the data. However, it is essential to approach MaxEnt findings with caution due to several limitations of the model at its current stage. Specifically, the model is sensitive to the extent of the study area, which can lead to inflation in the AUC score, and it is highly dependent on the choice of geo-environmental variables. MaxEnt is relatively new in the field of natural hazard and there is a need to explore this model further. Future research may benefit from comparative benchmarking against alternative modelling frameworks, implemented under consistent predictor selection and spatial resolution.Our study also provides a framework that can serve as guidance for multi-hazard scenarios in other karst environments, and motivate further work aimed at improving our forecasting of flood-triggered sinkholes.
The flood-triggered sinkhole susceptibility map was developed using publicly available datasets: Sinkhole inventory is available on https://www.georisques.gouv.fr/ (last access: 5 June 2024) in BD Cavité, BDMVT database. The Digital Elevation Model (DEM) was sourced from BD ALTI® (https://geoservices.ign.fr/bdalti, last access: 5 June 2024), and the slope data were extracted from the DEM layer using GIS Pro. Surficial geology information was obtained from BD – Charm-50, the geological map () provided by BRGM available on https://infoterre.brgm.fr/ (last access: 5 June 2024). Groundwater data were sourced from the Groundwater National Portal (https://ades.eaufrance.fr/, last access: 23 April 2023). Flood hazard zones were provided by PPRi (2015). Finally, data on alluvium thickness were extracted from Perrin et al. (2015, https://doi.org/10.1016/j.enggeo.2015.09.001).
All authors contributed to the preparation of this paper. HS: conceptualisation, formal analysis, visualisation, methodology, and writing (original draft preparation). KS: supervision, methodology and reviewing. JCG: supervision, visualisation, formal analysis, writing and editing. SF and SM: reviewing and editing.
At least one of the (co-)authors is a member of the editorial board of Natural Hazards and Earth System Sciences. The peer-review process was guided by an independent editor, and the authors also have no other competing interests to declare.
Publisher's note: Copernicus Publications remains neutral with regard to jurisdictional claims made in the text, published maps, institutional affiliations, or any other geographical representation in this paper. The authors bear the ultimate responsibility for providing appropriate place names. Views expressed in the text are those of the authors and do not necessarily reflect the views of the publisher.
The authors thank Andreas Wunsch and one anonymous reviewer, and the NHESS handling editor (Paolo Tarolli), for their constructive engagement with this manuscript. We also thank Gildas Noury, Auterives Chrystelle, and José Serrano for discussions during the early stages of this research, and Jerome Perrin for providing the alluvial thickness data.
This paper was edited by Paolo Tarolli and reviewed by Andreas Wunsch and one anonymous referee.
Appelquist, L. R. and Balstrøm, T.: Application of a new methodology for coastal multi-hazard-assessment and management on the state of Karnataka, India, J. Environ. Manage., 152, 1–10, https://doi.org/10.1016/j.jenvman.2014.12.017, 2015.
Auterives, C., Binet, S., and Albéric, P.: Inferred conduit network geometry from geological evidences and water-head in a fluvio-karstic system (Val d'Orleans, France), in: H2Karst Research in Limestone Hydrogeology, edited by: Mudry, J., Zwahlen, F., Bertrand, C., and LaMoreaux, J., Springer, Cham, 49–58, https://doi.org/10.1007/978-3-319-06139-9_3, 2014.
Azareh, A., Rahmati, O., Rafiei-Sardooi, E., Sankey, J. B., Lee, S., Shahabi, H., and Ahmad, B. B.: Modelling gully-erosion susceptibility in a semi-arid region, Iran: Investigation of applicability of certainty factor and maximum entropy models, Sci. Total Environ., 655, 684–696, https://doi.org/10.1016/j.scitotenv.2018.11.235, 2019.
Baker, D.: Quantitative parsimony and explanatory power, Brit. J. Philos. Sci., 54, 245–259, 2003.
Bianchini, S., Confuorto, P., Intrieri, E., Sbarra, P., Di Martire, D., Calcaterra, D., and Fanti, R.: Machine learning for sinkhole risk mapping in Guidonia-Bagni di Tivoli plain (Rome), Italy, Geocarto Int., 37, https://doi.org/10.1080/10106049.2022.2113455, 2022.
Blanchard, R.: Le Val d'Orléans, Ann. Geogr., 12, 307–323, https://doi.org/10.3406/geo.1903.6348, 1903.
Breiman, L.: Random forests, Mach. Learn., 45, 5–32, https://doi.org/10.1023/A:1010933404324, 2001.
Brinkmann, R.: Florida sinkholes: Science and policy, University Press of Florida, ISBN: 978-0-8130-4495-8, 2013.
Brinkmann, R., Parise, M., and Dye, D.: Sinkhole distribution in a rapidly developing urban environment: Hillsborough County, Tampa Bay area, Florida, Eng. Geol., 99, 169–184, https://doi.org/10.1016/j.enggeo.2007.11.020, 2008.
Cerema (Direction Territoriale Normandie-Centre): L'aléa effondrement lié à des phénomènes karstiques dans le Val d'Orléans _Approche bibliographique, Cerema DDT45, Rapport no. 131320/A, 2014.
Chatterjee, S. and Hadi, A. S.: Regression Analysis by Example, John Wiley & Sons, Hoboken, New Jersey, 5th edn., https://doi.org/10.1002/9781118532843, 2013.
Ciurean, R., Gill, J., Reeves, H. J., O'grady, S., and Aldridge, T.: Review of environmental multihazards research and risk assessments, British Geological Survey Open Report, OR/18/057, 86 pp., https://nora.nerc.ac.uk/id/eprint/524399/1/OR18057.pdf (last access: 16 May 2026), 2018.
Clark, P. J. and Evans, F. C.: Distance to nearest neighbor as a measure of spatial relationships in populations, Ecology, 35, 445–453, https://doi.org/10.2307/1931034, 1954.
Collins, B. D. and Jibson, R. W.: Assessment of existing and potential landslide hazards resulting from the April 25, 2015 Gorkha, Nepal earthquake sequence, US Geological Survey, No. 2015-1142, https://doi.org/10.3133/ofr20151142, 2015.
de Ruiter, M. C., Couasnon, A., van den Homberg, M. J. C., Daniell, J. E., Gill, J. C., and Ward, P. J.: Why we can no longer ignore consecutive disasters, Earth's Future, 8, e2019EF001425, https://doi.org/10.1029/2019EF001425, 2020.
Desprez, N.: Inventaire et étude hydrogéologique du Loiret, Report DSGR 67 A21, BRGM, https://infoterre.brgm.fr/rapports/67-DSGR-A-021.pdf (last access: 20 May 2026), 1967.
Elith, J., Phillips, S. J., Hastie, T., Dudík, M., Chee, Y. E., and Yates, C. J.: A statistical explanation of MaxEnt for ecologists, Divers. Distrib., 17, 43–57, https://doi.org/10.1111/j.1472-4642.2010.00725.x, 2011.
Elmahdy, S. I., Mohamed, M. M., Ali, T. A., Abdalla, J. E. D., and Abouleish, M.: Land subsidence and sinkholes susceptibility mapping and analysis using random forest and frequency ratio models in Al Ain, UAE, Geocarto Int., 37, 315–331, https://doi.org/10.1080/10106049.2020.1716398, 2020.
Fawcett, T.: An introduction to ROC analysis, Pattern Recogn. Lett., 27, 861–874, https://doi.org/10.1016/j.patrec.2005.10.010, 2006.
Fuchs, S., Spachinger, K., Dorner, W., Rochman, J., and Serrhini, K.: Evaluating cartographic design in flood risk mapping, Environmental Hazards, 8, 52–70, https://doi.org/10.3763/ehaz.2009.0007, 2009.
Gallina, V., Torresan, S., Zabeo, A., Critto, A., Glade, T., and Marcomini, A.: A multi-risk methodology for the assessment of climate change impacts in coastal zones, Sustainability, 12, 3697, https://doi.org/10.3390/su1209369, 2020.
Galve, J. P., Bonachea, J., Remondo, J., Gutiérrez, F., Guerrero, J., Lucha, P., Cendrero, A., Gutiérrez, M., and Sánchez, J. A.: Development and validation of sinkhole susceptibility models in mantled karst settings: A case study from the Ebro valley evaporite karst (NE Spain), Eng. Geol., 99, 185–197, https://doi.org/10.1016/j.enggeo.2007.11.011, 2008.
Galve, J. P., Gutierrez, F., Lucha, P., Guerrero, J., Bonachea, J., Remondo, J., and Cendrero, A.: Probabilistic sinkhole modelling for hazard assessment, Earth Surf. Proc. Land., 34, 437–452, https://doi.org/10.1002/esp.1753, 2009.
Gao, Y. and Alexander, E. C.: Sinkhole hazard assessment in Minnesota using a decision tree model, Environ. Geol., 54, 945–956, https://doi.org/10.1007/s00254-007-0897-1, 2008.
Gill, J. C. and Malamud, B. D.: Reviewing and visualizing the interactions of natural hazards, Rev. Geophys., 52, 680–722, https://doi.org/10.1002/2013RG000445, 2014.
Gill, J. C. and Malamud, B. D.: Hazard interactions and interaction networks (cascades) within multi-hazard methodologies, Earth Syst. Dynam., 7, 659–679, https://doi.org/10.5194/esd-7-659-2016, 2016.
Gill, J. C., Malamud, B. D., Barillas, E. M., and Guerra Noriega, A.: Construction of regional multi-hazard interaction frameworks, with an application to Guatemala, Nat. Hazards Earth Syst. Sci., 20, 149–180, https://doi.org/10.5194/nhess-20-149-2020, 2020.
Gutiérrez, F., Guerrero, J., and Lucha, P.: A genetic classification of sinkholes illustrated from evaporite paleokarst exposures in Spain, Environ. Geol., 53, 993–1006, https://doi.org/10.1007/s00254-007-0727-5, 2008.
Herries, J.: Better Breaks Define Your Thematic Map's Purpose, ESRI ArcGIS Blog, https://www.esri.com/arcgis-blog/products/arcgis-online/mapping/better-breaks-define-your-thematic-maps-purpose?rsource=https://links.esri.com/better-breaks (last access: 13 May 2026), 26 June 2018.
Hülssiep, M., Thaler, T., and Fuchs, S.: The influence of humanitarian assistance on post-disaster social vulnerabilities: Early reflection on the Nepal earthquake 2015, Disasters, 45, 577–603, https://doi.org/10.1111/disa.12437, 2021.
Hyatt, J. A. and Jacobs, P. M.: Distribution and morphology of sinkholes triggered by flooding following Tropical Storm Alberto at Albany, Georgia, USA, Geomorphology, 17, 305–316, https://doi.org/10.1016/0169-555X(96)00014-1, 1996.
Intrieri, E., Fontanelli, K., Bardi, F., Marini, F., Carlà, T., Pazzi, V., Di Filippo, M., and Fanti, R.: Definition of sinkhole triggers and susceptibility based on hydrogeomorphological analyses, Environ. Earth Sci., 77, https://doi.org/10.1007/s12665-017-7179-3, 2018.
Javidan, N., Kavian, A., Pourghasemi, H. R., Conoscenti, C., Jafarian, Z., and Rodrigo-Comino, J.: Evaluation of multi-hazard map produced using MaxEnt machine learning technique, Sci. Rep., 11, 6496, https://doi.org/10.1038/s41598-021-85862-7, 2021.
Jaynes, E. T.: Information theory and statistical mechanics, Phys. Rev., 106, 620–630, https://doi.org/10.1103/PhysRev.106.620, 1957.
Jozja, N., Maget P., Défarge C., Mouget C., and Pidon A.: Apport des traçages à la connaissance du système karstique du Val d'Orléans. Historique et nouvelles avancées, Géologues, 1–5, https://hal-insu.archives-ouvertes.fr/insu-00558114 (last access: 16 May 2026), 2010.
Kappes, M. S., Keiler, M., von Elverfeldt, K., and Glade, T.: Challenges of analyzing multi-hazard risk: a review, Nat. Hazards, 64, 1925–1958, https://doi.org/10.1007/s11069-012-0294-2, 2012.
Kim, K., Kim, J., Kwak, T.-Y., and Chung, C.-K.: Logistic regression model for sinkhole susceptibility due to damaged sewer pipes, Nat. Hazards, 93, 765–785, https://doi.org/10.1007/s11069-018-3323-y, 2018.
Kim, Y. J., Nam, B. H., Jung, Y. H., Liu, X., Choi, S., Kim, D., and Kim, S.: Probabilistic spatial susceptibility modeling of carbonate karst sinkhole, Eng. Geol., 306, 106728, https://doi.org/10.1016/j.enggeo.2022.106728, 2022.
Kovačič, G. and Ravbar, N.: Extreme hydrological events in karst areas of Slovenia, the case of the Unica River basin, Geodinam. Acta, 23, 89–100, https://doi.org/10.3166/ga.23.89-100, 2010.
Kwak, T.-Y., Woo, S.-I., Chung, C.-K., and Kim, J.: Experimental assessment of the relationship between rainfall intensity and sinkholes caused by damaged sewer pipes, Nat. Hazards Earth Syst. Sci., 20, 3343–3359, https://doi.org/10.5194/nhess-20-3343-2020, 2020.
Lei, M., Gao, Y., Jiang, X., and Guan, Z.: Emergency investigation of extremely large sinkholes, Maohe, Guangxi, China, in: Proceedings of the Thirteenth Multidisciplinary Conference on Sinkholes and the Engineering and Environmental Impacts of Karst, 293–297, https://doi.org/10.5038/9780979542275.1139, 2013.
Lei, M., Gao, Y., Jiang, X., and Guan, Z.: Mechanism analysis of sinkhole formation at Maohe village, Liuzhou city, Guangxi province, China, Environ. Earth Sci., 75, 1–11, https://doi.org/10.1007/s12665-015-5100-5, 2016.
Lepiller, M.: Hydrogéologie du Val d'Orléans, in: les aquifères de France, edited by: Roux, J.-C., BRGM – AIH 2006, 956 pp., 2006.
Lewin, J. and Woodward, J. C.: Karst geomorphology and environmental change, in: The physical geography of the mediterranean, Oxford University Press, 287–317, https://doi.org/10.1093/oso/9780199268030.003.0022, 2009.
Liu, B., Siu, Y. L., and Mitchell, G.: Hazard interaction analysis for multi-hazard risk assessment: a systematic classification based on hazard-forming environment, Nat. Hazards Earth Syst. Sci., 16, 629–642, https://doi.org/10.5194/nhess-16-629-2016, 2016.
Liu, Y., Zhao, L., Bao, A., Li, J., and Yan, X.: Chinese High Resolution Satellite Data and GIS-Based Assessment of Landslide Susceptibility along Highway G30 in Guozigou Valley Using Logistic Regression and MaxEnt Model, Remote Sens., 14, 3620, https://doi.org/10.3390/rs14153620, 2022.
López-Saavedra, M. and Martí, J.: Reviewing the multi-hazard concept. Application to volcanic islands, Earth-Sci. Rev., 236, 104286, https://doi.org/10.1016/j.earscirev.2022.104286, 2023.
Luu, L. H., Noury, G., Benseghier, Z., and Philippe, P.: Hydro-mechanical modeling of sinkhole occurrence processes in covered karst terrains during a flood, Eng. Geol., 260, 105249, https://doi.org/10.1016/j.enggeo.2019.105249, 2019.
Marignani, M., Bruschi, D., Garcia, D. A., Frondoni, R., Carli, E., Pinna, M. S., Cumo, F., Gugliermetti, F., Saatkamp, A., and Doxa, A.: Identification and prioritization of areas with high environmental risk in Mediterranean coastal areas: A flexible approach, Sci. Total Environ., 590, 566–578, https://doi.org/10.1016/j.scitotenv.2017.02.221, 2017.
Martin, J. C., Amraoui, N., and Pathirana, N.: Caractérisation du risque d'inondation par remontée de nappe sur le val d'Orléans, BRGM/RP-52121-FR, BRGM, 90 pp., https://infoterre.brgm.fr/rapports/RP-52121-FR.pdf (last access: 20 May 2026), 2003.
Martinotti, M. E., Pisano, L., Marchesini, I., Rossi, M., Peruccacci, S., Brunetti, M. T., Melillo, M., Amoruso, G., Loiacono, P., Vennari, C., Vessia, G., Trabace, M., Parise, M., and Guzzetti, F.: Landslides, floods and sinkholes in a karst environment: the 1–6 September 2014 Gargano event, southern Italy, Nat. Hazards Earth Syst. Sci., 17, 467–480, https://doi.org/10.5194/nhess-17-467-2017, 2017.
Mobley, W., Sebastian, A., Highfield, W., and Brody, S. D.: Estimating flood extent during Hurricane Harvey using maximum entropy to build a hazard distribution model, J. Flood Rist Manag., 12, e12549, https://doi.org/10.1111/jfr3.12549, 2019.
Mokhtari, M. and Abedian, S.: Spatial prediction of landslide susceptibility in Taleghan basin, Iran, Stoch. Environ. Res. Risk Assess., 33, 1297–1325, https://doi.org/10.1007/s00477-019-01696-w, 2019.
Nachappa, T. G., Piralilou, S. T., Gholamnia, K., Ghorbanzadeh, O., Rahmati, O., and Blaschke, T.: Flood susceptibility mapping with machine learning, multi-criteria decision analysis and ensemble using Dempster Shafer Theory, J. Hydrol., 590, 125275, https://doi.org/10.1016/j.jhydrol.2020.125275, 2020.
Neri, M., Le Cozannet, G., Thierry, P., Bignami, C., and Ruch, J.: A method for multi-hazard mapping in poorly known volcanic areas: an example from Kanlaon (Philippines), Nat. Hazards Earth Syst. Sci., 13, 1929–1943, https://doi.org/10.5194/nhess-13-1929-2013, 2013.
Noury, G., Perrin, J., Luu, L. H., Philippe, P., and Gourdier, S.: Role of floods on sinkholes occurrence in covered karst terrains: case study of Orléans area (France) during the 2016 meteorological event and perspectives for other karst environments, in: 15th Multidisciplinary Conference on Sinkholes and the Engineering and Environmental Impacts of Karst, Shepherdstown, West Virginia, 2–6 April 2018, https://doi.org/10.5038/9780991000982.1014, 2018.
Ozdemir, A.: Sinkhole susceptibility mapping using a frequency ratio method and GIS technology near Karapınar, Konya-Turkey, Proced. Earth Plan. Sc., 15, 502–506, https://doi.org/10.1016/j.proeps.2015.08.059, 2015.
Parise, M., Pisano, L., and Vennari, C.: Sinkhole clusters after heavy rainstorms, J. Cave Karst Stud., 80, 28–38, https://www.academia.edu/52670096/Sinkhole_clusters_after_heavy_rainstorms (last access: 13 May 2026), 2018.
Park, N. W.: Using maximum entropy modeling for landslide susceptibility mapping with multiple geoenvironmental data sets, Environ. Earth Sci., 73, 937–949, https://doi.org/10.1007/s12665-014-3442-z, 2015.
Pasch, R. J., Reinhart, B. J., and Alaka, L.: HURRICANE FIONA, National Hurricane Center, https://www.nhc.noaa.gov/data/tcr/AL072022_Fiona.pdf (last access: 13 May 2026), 2023.
Pazzi, V., Ceccatelli, M., Gracchi, T., Masi, E. B., and Fanti, R.: Assessing subsoil void hazards along a road system using H/V measurements, ERTs and IPTs to support local decision makers, Near Surf. Geophys., 16, 282–297, https://doi.org/10.3997/1873-0604.2018002, 2018.
Perrin, J., Noury, G., and Cartannaz, C.: ALEA-Karst : vers une approche multicritères de l'aléa lié aux cavités karstiques en contexte calcaire. Volume 1: Trame méthodologique, Rapport BRGM/RP-63771-FR, 77 pp., https://infoterre.brgm.fr/rapports/RP-63771-FR.pdf (last access: 18 May 2026), 2014.
Perrin, J., Cartannaz, C., Noury, G., and Vanoudheusden, E.: A multicriteria approach to karst subsidence hazard mapping supported by weights-of-evidence analysis, Eng. Geol., 197, 296–305, https://doi.org/10.1016/j.enggeo.2015.09.001, 2015.
Phillips, S. J., Anderson, R. P., and Schapire, R. E.: Maximum entropy modeling of species geographic distributions, Ecol. Model., 190, 231–259, https://doi.org/10.1016/j.ecolmodel.2005.03.026, 2006.
Phillips, S. J., Anderson, R. P., Dudík, M., Schapire, R. E., and Blair, M.: Opening the black box: an open-source release of Maxent, Ecography, 40, https://doi.org/10.1111/ecog.03049, 2017.
Pourghasemi, H. R., Gayen, A., Panahi, M., Rezaie, F., and Blaschke, T.: Multi-hazard probability assessment and mapping in Iran, Sci. Total Environ., 692, 556–571, https://doi.org/10.1016/j.scitotenv.2019.07.203, 2019.
Pournader, M., Ahmadi, H., Feiznia, S., Karimi, H., and Peirovan, H. R.: Spatial prediction of soil erosion susceptibility: an evaluation of the maximum entropy model, Earth Sci. Inform., 11, 389–401, https://doi.org/10.1007/s12145-018-0338-6, 2018.
PPRi (Plan de Prévention des Risques d'Inondation du Val d'Orléans): approuvé par arrêté préfectoral du 20 janvier 2015, https://www.loiret.gouv.fr/contenu/telechargement/39868/285153/file/1- Note-pr%C3%A9sentation.pdf (last access: 13 May 2026), 2015.
Qiu, X., Wu, S.-S., and Chen, Y.: Sinkhole susceptibility assessment based on morphological, imagery, and contextual attributes derived from GIS and imagery data, J. Cave Karst Stud., 82, 1–17, https://caves.org/wp-content/uploads/Publications/JCKS/v82/82_1_1.pdf (last access: 15 May 2026), 2020.
Radosavljevic, A. and Anderson, R. P.: Making better Maxent models of species distributions: complexity, overfitting and evaluation, J. Biogeogr., 41, 629–643, https://doi.org/10.1111/jbi.12227, 2014.
Rahmati, O., Pourghasemi, H. R., and Melesse, A. M.: Application of GIS-based data driven random forest and maximum entropy models for groundwater potential mapping: a case study at Mehran Region, Iran, Catena, 137, 360–372, https://doi.org/10.1016/j.catena.2015.10.010, 2016.
Rusk, J., Maharjan, A., Tiwari, P., Chen, T. H. K., Shneiderman, S., Turin, M., and Seto, K. C.: Multi-hazard susceptibility and exposure assessment of the Hindu Kush Himalaya, Sci. Total Environ., 804, 150039, https://doi.org/10.1016/j.scitotenv.2021.150039, 2022.
Serrhini, K., Moy, Y., Noury, G., Serrano, J., and Soltanpour, H.: Vulnérabilité non-structurelle et résilience territoriale en situation de multi-risque. Perception et préférences cartographiques des aléas effondrement et inondation (val d'Orléans, Loiret, France), Can. J. Regional Sci., 46, 73–84, https://doi.org/10.7202/1100216ar, 2023.
Shatz, I.: Parsimony. Why you should prefer simpler explanations, https://effectiviology.com/parsimony/ (last access: 13 May 2026), 25 June 2019.
Shi, J.: Engineering Application of Landslide Susceptibility Mapping in Linear Engineering Optimization, Front. Earth Sci. 10, 861057, https://doi.org/10.3389/feart.2022.861057, 2022.
Siahkamari, S., Haghizadeh, A., Zeinivand, H., Tahmasebipour, N., and Rahmati, O.: Spatial prediction of flood-susceptible areas using frequency ratio and maximum entropy models, Geocarto Int., 33, 927–941, https://doi.org/10.1080/10106049.2017.1316780, 2018.
Sillero, N. and Barbosa, A. M.: Common mistakes in ecological niche models, Int. J. Geogr. Inf. Sci., 35, 213–226, https://doi.org/10.1080/13658816.2020.1798968, 2021.
Sillero, N., Arenas-Castro, S., Enriquez-Urzelai, U., Gomes Vale, C., Sousa-Guedes, D., Martínez-Freiría, F., Real, R., and Barbosa, A. M.: Want to model a species niche? A step-by-step guideline on correlative ecological niche modelling, Ecol. Model., 456, 109671, https://doi.org/10.1016/j.ecolmodel.2021.109671, 2021.
Subedi, P., Subedi, K., Thapa, B., and Subedi, P.: Sinkhole susceptibility mapping in Marion County, Florida: Evaluation and comparison between analytical hierarchy process and logistic regression-based approaches, Sci. Rep., 9, 7140, https://doi.org/10.1038/s41598-019-43705-6, 2019.
Taheri, K., Gutierrez, F., Mohseni, H., Raeisi, E., and Taheri, M.: Sinkhole susceptibility mapping using the analytical hierarchy process (AHP) and magnitude–frequency relationships: a case study in Hamadan province, Iran, Geomorphology, 234, 64–79, https://doi.org/10.1016/j.geomorph.2015.01.005, 2015.
Taheri, K., Himan Shahabi, Kamran Chapi, Ataollah Shirzadi, Francisco Gutiérrez, and Khabat Khosravi: Sinkhole susceptibility mapping: A comparison between Bayes-based machine learning algorithms, Land Degrad. Dev., 30, 730–745, https://doi.org/10.1002/ldr.3255, 2019.
Tehrani, F. S., Calvello, M., Liu, Z., Zhang, L., and Lacasse, S.: Machine learning and landslide studies: Recent advances and applications, Nat. Hazards, 114, 1197–1245, https://doi.org/10.1007/s11069-022-05423-7, 2022.
Terzi, S., Torresan, S., Schneiderbauer, S., Critto, A., Zebisch, M., and Marcomini, A.: Multi-risk assessment in mountain regions: A review of modelling approaches for climate change adaptation, J. Environ. Manag., 232, 759–771, https://doi.org/10.1016/j.jenvman.2018.11.100, 2019.
Tsereteli, E., Gaprindashvili, G., Gaprindashvili, M., Bolashvili, N., and Gongadze, M.: Hazard risk of debris/mud flow events in Georgia and methodological approaches for management, in: IAEG/AEG Annual Meeting Proceedings, San Francisco, California, 2018, Springer, Cham, 5, 153–160, https://doi.org/10.1007/978-3-319-93136-4_19, 2019.
UNDRR: Sendai Framework for Disaster Risk Reduction 2015–2030, https://www.undrr.org/publication/sendai-framework-disaster-risk-reduction-2015-2030 (last access: 12 May 2026), 2015.
UNDRR: Terminology, https://www.undrr.org/terminology (last access: 12 January 2023), 2017.
van den Bout, B., Tang, C., van Westen, C., and Jetten, V.: Physically based modeling of co-seismic landslide, debris flow, and flood cascade, Nat. Hazards Earth Syst. Sci., 22, 3183–3209, https://doi.org/10.5194/nhess-22-3183-2022, 2022.
Waltham, T., Bell, F. G., Culshaw, M. G., Knez, M., and Slabe, T.: Sinkholes and subsidence: karst and cavernous rocks in engineering and construction, Springer, Berlin, Vol. 382, ISBN: 978-3-540-20725-2, 2005.
Ward, P. J., Daniell, J., Duncan, M., Dunne, A., Hananel, C., Hochrainer-Stigler, S., Tijssen, A., Torresan, S., Ciurean, R., Gill, J. C., Sillmann, J., Couasnon, A., Koks, E., Padrón-Fumero, N., Tatman, S., Tronstad Lund, M., Adesiyun, A., Aerts, J. C. J. H., Alabaster, A., Bulder, B., Campillo Torres, C., Critto, A., Hernández-Martín, R., Machado, M., Mysiak, J., Orth, R., Palomino Antolín, I., Petrescu, E.-C., Reichstein, M., Tiggeloven, T., Van Loon, A. F., Vuong Pham, H., and de Ruiter, M. C.: Invited perspectives: A research agenda towards disaster risk management pathways in multi-(hazard-)risk assessment, Nat. Hazards Earth Syst. Sci., 22, 1487–1497, https://doi.org/10.5194/nhess-22-1487-2022, 2022.
Xiao, H., Kim, Y. J., Nam, B. H., and Wang, D.: Investigation of the impacts of local-scale hydrogeologic conditions on sinkhole occurrence in East-Central Florida, USA, Environ. Earth Sci., 75, 1274, https://doi.org/10.1007/s12665-016-6086-3, 2016.
Xiao, H., Li, H., and Tang, Y.: Assessing the effects of rainfall, groundwater downward leakage, and groundwater head differences on the development of cover-collapse and cover-suffosion sinkholes in Central Florida (USA), Sci. Total Environ., 644, 274–286, https://doi.org/10.1016/j.scitotenv.2018.06.273, 2018.
Yousefi, S., Pourghasemi, H. R., Emami, S. N., Pouyan, S., Eskandari, S., and Tiefenbacher, J. P.: A machine learning framework for multi-hazards modelling and mapping in a mountainous area, Scientific Reports, 10, 12144, https://doi.org/10.1038/s41598-020-69233-2, 2020.
Zhou, W.: Drainage and flooding in karst terranes, Environ. Geol., 51, 963–973, https://doi.org/10.1007/s00254-006-0365-3, 2007.