the Creative Commons Attribution 4.0 License.
the Creative Commons Attribution 4.0 License.
 | 03 Jun 2026
Multi-level assessment of flood risk perception and flood behaviour
Rocío Coloma
Vicente Saenger
Felipe Link
Understanding the relationships between flood risk perception and flood behaviour is crucial for effective risk management and risk communication strategies, but quantitative research in this area remains challenging. Based on a survey of 1007 residents in four different localities of Chile exposed to river floods, this study builds and applies a framework for assessing flood risk perception and flood behaviour at the individual, household, neighbourhood, and municipality levels. Results show that almost all respondents were aware of flood risk. Economic and personal resources strongly influence worry and preparedness: households in better economic situations were less worried about floods, lower economic resources at the municipal and neighbourhood levels prompted households to adopt cautionary measures. Experiences where the flood passed outside the household increased worry and preparedness. Worry decreased as trust in the neighbours increased. Overall, worry and preparedness in the study area were intermediate, with an increasing dispersion from the municipality to the individual level. Increasing worry did not necessarily translate into higher preparedness. Municipalities exhibited different flood behaviours, and some neighbourhoods exhibited flood behaviours different to those of their municipalities, evidencing important differences across the analysed levels. The results suggest that risk communication and risk management strategies should be tailored to the needs of specific neighbourhoods exposed to flooding.
- Article
(4546 KB) - Full-text XML
- BibTeX
- EndNote


Floods are well recognised as among the most damaging natural hazards worldwide, and their damage is increasing (Adikari and Yoshitani, 2009; Blöschl, 2022). Absolute flood prevention or protection is unattainable, and flood risk management is the only practicable way forward (Birkholz et al., 2014). However, risk is a complex concept that is usually quantified through technical evaluations. In contrast, risk perception can differ from risk quantification, as perception can be dominated by hazardousness or biased by factors such as misinformation, affecting people's behaviours before, during, and after a flood, including preparedness, reaction, and adaptations, and thus resilience. Flood risk perception, adaptation, and resilience of exposed communities have been recognised as crucial for flood risk management (Rufat et al., 2020). However, the relationships between flood risk perception and flood behaviour remain poorly explored, even though they are crucial for risk management (Kuhlicke et al., 2020; Bin-Husayn et al., 2024). Flood risk is commonly conceptualised as the product of hazard, vulnerability, and the value of exposed elements (Kron, 2005). For a given discharge, hazard is defined as the product of the probability of exceedance and the magnitude of the event. The probability of occurrence of a given flood is typically assumed to be equivalent to that of its peak discharge and is commonly estimated through frequency analysis. The corresponding hazard magnitude varies spatially and is computed locally as a function of flow depth and velocity (e.g. Martín-Vide, 2009; Díez-Herrero et al., 2009; Bodoque et al., 2016; Link et al., 2019). Vulnerability encompasses both physical and social dimensions. Physical vulnerability includes the susceptibility of buildings (e.g. Mazzorana et al., 2014; Stephenson and D'Ayala, 2014), vehicles (Xia et al., 2011), and people (Jonkman and Penning-Rowsell, 2008) a.o. Social vulnerability is a more complex construct and is often assessed using simplified indicators such as social vulnerability indices (SVIs) (e.g. Cutter et al., 2003; Cutter et al., 2013; Koks et al., 2015). Exposure, commonly represented by the proximity of assets to the hazard (e.g. distance to water bodies), links these components by determining which elements are subject to potential damage (O'Neill et al., 2016).
The perception of risk is shaped by the social, political, cultural, religious, and historical contexts (Lechowska, 2022), determining the attitude, i.e. the level of preparation for a flood, and the possible behaviour of the residents when facing a flood (Bradford et al., 2012; Lechowska, 2018). Risk evaluation and risk perception can differ significantly, which can challenge flood risk management. Raaijmakers et al. (2008) identified three key elements of flood risk perception: awareness, worry, and preparedness, and Lechowska (2018) distinguished between relationships among these elements, that are clearly established and those that remain uncertain. Worry and awareness show a clear relationship with flood risk perception, whereas the relationship between preparedness and risk perception remains unclear. Similarly, the relationships between preparedness and worry, and between preparedness and awareness, are not well established. Preparedness can take the form of specific cautionary measures at different spatial levels (Veloso et al., 2022), such as personal protective equipment at the individual level, electrical adaptations above flood depth at the household level, sandbag barriers at the neighbourhood level, and shelters at the municipal level. However, at each of these levels, preparedness is not necessarily directly associated with risk perception. Indeed, Scolobig et al. (2012) showed that the relationship between awareness and preparedness is not straightforward. In the Italian Alps, residents reported being only slightly worried about flood risk and only slightly prepared to face an event. Moreover, a clear discrepancy was observed between the actual adoption of household preparedness measures and the stated willingness to undertake self-protection actions. These findings highlight the complex and non-linear nature of the relationship between risk perception and preparedness, as well as the influence of underlying social vulnerability factors. In this context, the long-term interactions between human and social systems have been studied in the context of socio-hydrology (Sivapalan et al., 2012; Sivapalan and Blöschl, 2015). Socio-hydrological systems are complex systems and thus, exhibit emergent properties due to the interactions between elements of the lower levels (Damper, 2000; Georgiou, 2003; Reuter et al., 2005), e.g., interactions between individuals produce emergent properties at the neighbourhood level, interactions between neighbourhoods produce emergent properties at the municipality level, etc. Such interactions have been studied through three methodological approximations (Di Baldassarre et al., 2015): one of the most common in the social sciences is based on the statistical analysis of empirical research data, such as surveys and interviews, combining the strengths of qualitative and quantitative data. This method relies on extensive and robust empirical data, which can be expensive and time-consuming to collect. A second method is agent-based modelling, which operates by prescribing rules for how individuals and/or institutions (the agents) interact, thereby allowing heterogeneity to be included. They compute the interactions at the microlevel, which leads to observed behaviour at higher levels. The disadvantage of these models is that they can become extremely complex, results might be difficult to interpret, and they are often not generalizable. In a third method, several hypotheses about the fundamental processes and interactions driving the system's behaviour are explicitly formalised using a set of differential equations. This type of modelling has proved useful when empirical data are limited. Moreover, differential equations for dynamic modelling have been recognised as appropriate for understanding complex systems and have been widely used in neoclassical economic models. In particular, the socio-hydrology of floods has already recognised different flood behaviour types that emerge from the interactions between the social and the hydrological system during floods, such as the so-called “forgetting or levee effect” and the “learning or adaptation effects”. The forgetting effect refers to the observation that rare flooding events (possibly caused by protective measures such as levees) are often associated with increased vulnerability. In the learning effect, frequent flooding is often associated with decreased vulnerability. It can be attributed to enhanced coping or adaptation capacities gained by individuals and communities during their flood experience (Di Baldassarre, 2017). Moreover, Barendrecht et al. (2017) reviewed long-term feedbacks between humans and floods that may lead to complex phenomena such as coping strategies, levee effects, call effects, adaptation effects, and poverty traps. Notably, in addition to the well-known adaption effect and the levee effect, Leong (2018) proposed the existence of the status quo or path dependency effect (e.g. Mendoza Leal et al., 2024) and a fourth, unnamed effect when communities undertake adaptive measures against floods even when they do not experience floods frequently, i.e. mainly motivated by external information, which will called here the “proactive effect”. Further, Leong (2018) proposed that the four mentioned effects depend on two dimensions: flood magnitude and community adaptive capacity. Similarly, Mazzoleni et al. (2024) identified four stylised types of attitudes towards risk to characterise societies or social groups: risk-neglecting, risk-controlling, risk-downplaying, and risk-monitoring. An operationalisation of Leong's (2018) diagram with the typologies of flood behaviours is still pending, as a clear distinction between “small” and “large” floods, as well as a proxy for flood resilience allowing to distinguish between non-adaptive and adaptive groups has not been proposed.
Clearly, flood risk perception and flood behaviour are interlinked, but the intuitive progression from awareness to worry to preparedness is not realistic in many cases (see e.g. Wachinger et al., 2013; Lin et al., 2008; Lechowska, 2022), as elements such as trust in the institutions (e.g. in some Alpine areas of Italy reported by Scolobig et al., 2012), previous flood experiences (see e.g. Veloso et al., 2022), social networks (Haer et al., 2016; Karunarathne and Lee, 2020; Abunyewah et al., 2023), and minor economic and personal resources can generate situations without worry but with preparedness, or with high worry but without preparedness. Moreover, the urban and neighbourhood scales, and more specifically the built environment's characteristics, play a decisive role in shaping both community life and perceptions of risk. A growing body of evidence shows that spatial configurations affect social interaction, cohesion, and the capacity for collective action, generating differentiated forms of community (Blokland, 2017; Krellenberg et al., 2014) and, therefore, unequal vulnerabilities to hazards. In this study, variables such as housing quality, hazard proximity, neighbourhood socioeconomic composition, and the territorial socio-material index (ISMT) illustrate how material conditions of the habitat are directly linked to subjective worry and preparedness. Following Bourdieu (1999), the relationship between habitat and habitus highlights how the physical and social environment moulds dispositions, shaping not only everyday sociability but also the capacity to anticipate, interpret, and respond to flood risk. Thus, the built environment is not a neutral background but an active determinant that conditions the articulation between worry and preparedness, reinforcing the need to analyse risk perception and behaviour from a spatially sensitive perspective. Particularly in contexts of significant historical urban and territorial inequalities, such as in Latin America.
The spatial scale is crucial for understanding the relationship between risk and behaviour, as both worry and preparedness vary significantly across territories, while flood hazardousness is strongly conditioned by local factors (De Moel et al., 2015). Previous research has examined flood risk and behaviours mainly at the local scale, such as neighbourhoods (Al Assi et al., 2023) or municipalities (Becker et al., 2014; Santos et al., 2020). This article goes further by incorporating individual and household characteristics, allowing us to capture the multilevel complexity of space and its consequences for flood risk perception and adaptive behaviours.
Our hypothesis is that flood behaviour varies across spatial scales as a function of the components of flood risk perception. Specifically, the relationships between worry, preparedness, and flood behaviour are expected to differ across individual, household, neighbourhood, and municipal scales. To test this hypothesis, this study analyses the dimensions and variables that explain worry and preparedness at multiple levels: individual, household, neighbourhood, and municipality, and examines the relationships between worry and preparedness, as well as the resulting flood behaviours. The analysis is conducted across four municipalities in Chile that represent different forms of urban agglomeration, ranging from small localities to intermediate cities within the national context.
Accordingly, the main objectives of this study are: (1) to identify the variables that explain the key elements of flood risk perception, namely worry and preparedness; (2) to analyse the relationships between worry and preparedness across different spatial levels; and (3) to investigate the types of flood behaviour that emerge from the interaction between social and hydrological systems in the studied localities.
The next section describes the study area, the materials and the statistical analysis. Section 3 presents the results on the variables explaining worry and preparedness, their correlations, and their distribution across neighbourhoods and municipalities. The advantages of the combined statistical approach are discussed, and the local findings are interpreted in relation to evidence from other contexts. The flood behaviour at the different levels is discussed to enhance flood risk communication and management. The paper concludes with final remarks on the role of spatial and social conditions in shaping local preparedness and worry.
2.1 Study area
The study area corresponds to four Chilean municipalities that experienced flood events between 2000 and 2025: San Pedro de Atacama (2001, 2012, 2013, 2015, 2017, 2019, 2023), San Fernando (2000, 2006, 2015, 2023), Hualqui (2001, 2003, 2006, 2023, 2024), and Arauco (2001 [twice], 2003, 2006, 2008, 2019, 2023, 2024). Figure 1 shows the study area and the surveyed households.
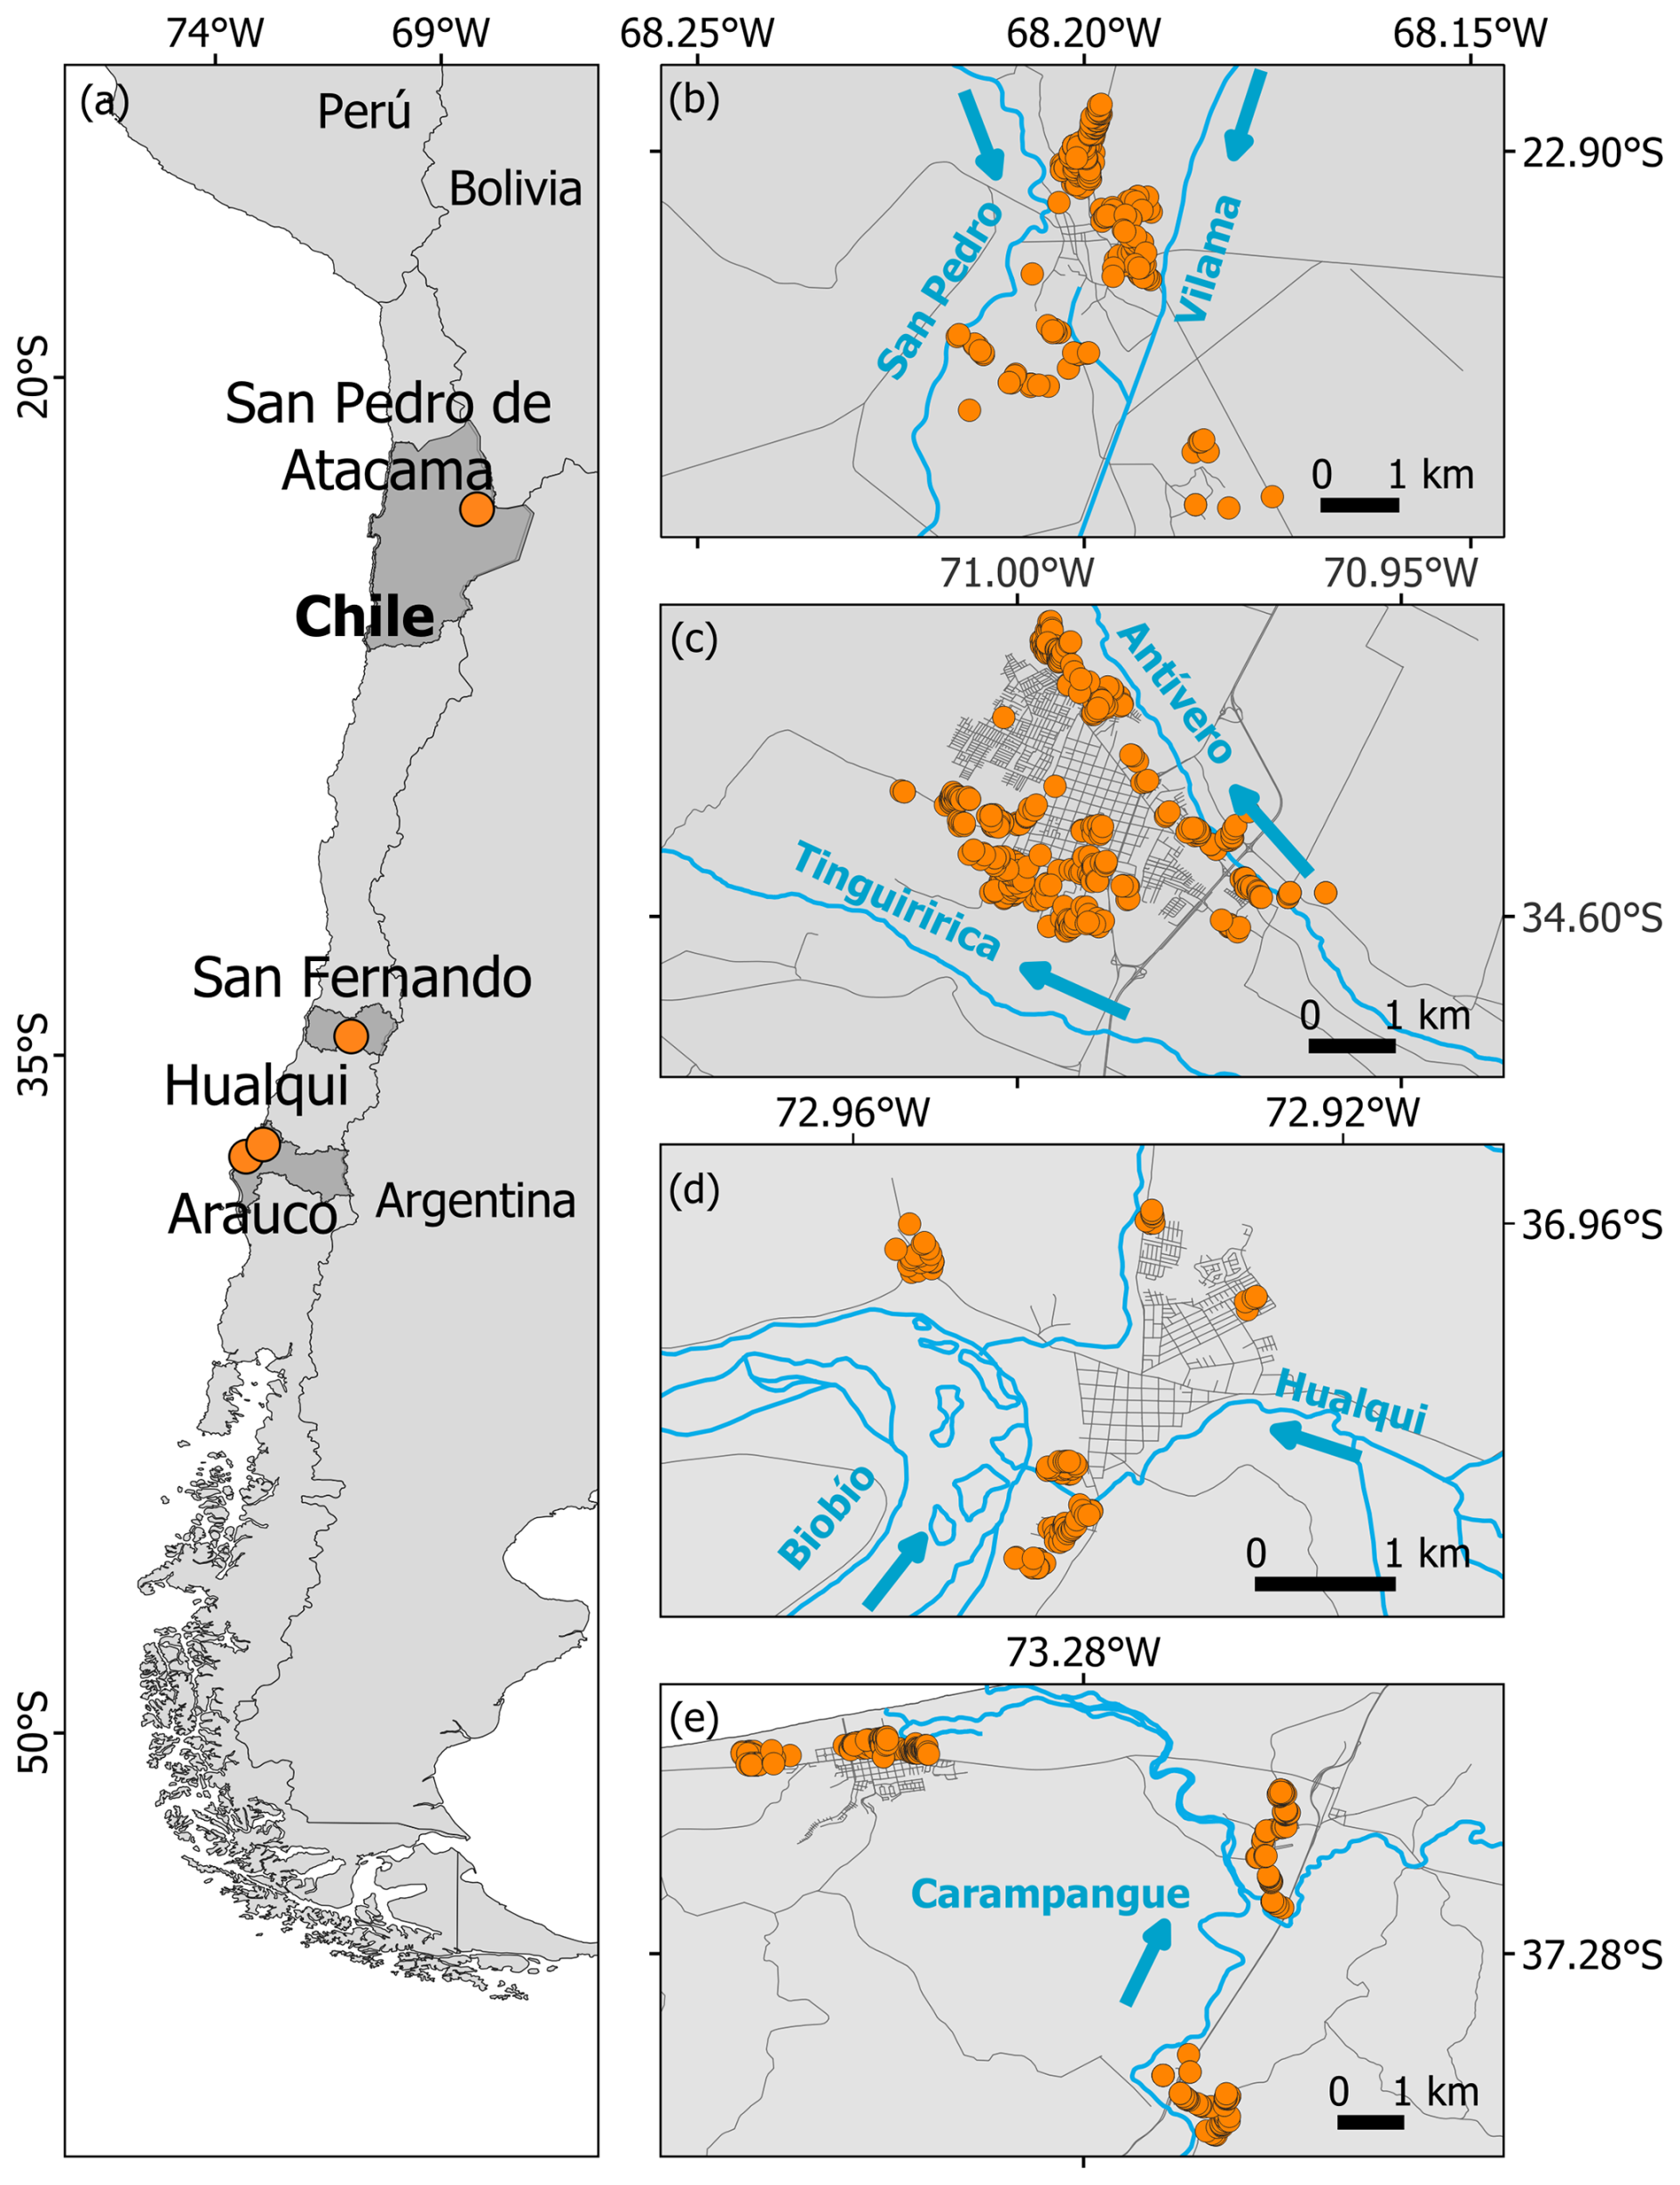
Figure 1Location of the study area showing in (a) the four municipalities under study in Chile, and the surveyed households marked with orange dots in (b) San Pedro de Atacama, (c) San Fernando, (d) Hualqui, and (e) Arauco, together with the rivers causing floods in blue.
According to the modified Köppen-Geiger climate classification by Sarricolea et al. (2017), the predominant climate in San Pedro de Atacama is a cold desert climate with dry winters (BWk(w)) where the “w” indicates a precipitation regime dominated by summer rainfall, influenced by the South American monsoon system and locally known as the “invierno boliviano” (Houston, 2006; Sarricolea et al., 2017), in San Fernando and Hualqui the climate is mediterranean with winter rainfall (Csb), characterized by dry summers and moderate precipitation concentrated in the colder months. In Arauco, the climate is Mediterranean with winter rainfall (Csb(i)), where “i” denotes the coastal influence, which reduces temperature extremes and increases atmospheric humidity due to proximity to the Pacific Ocean (Sarricolea et al., 2017).
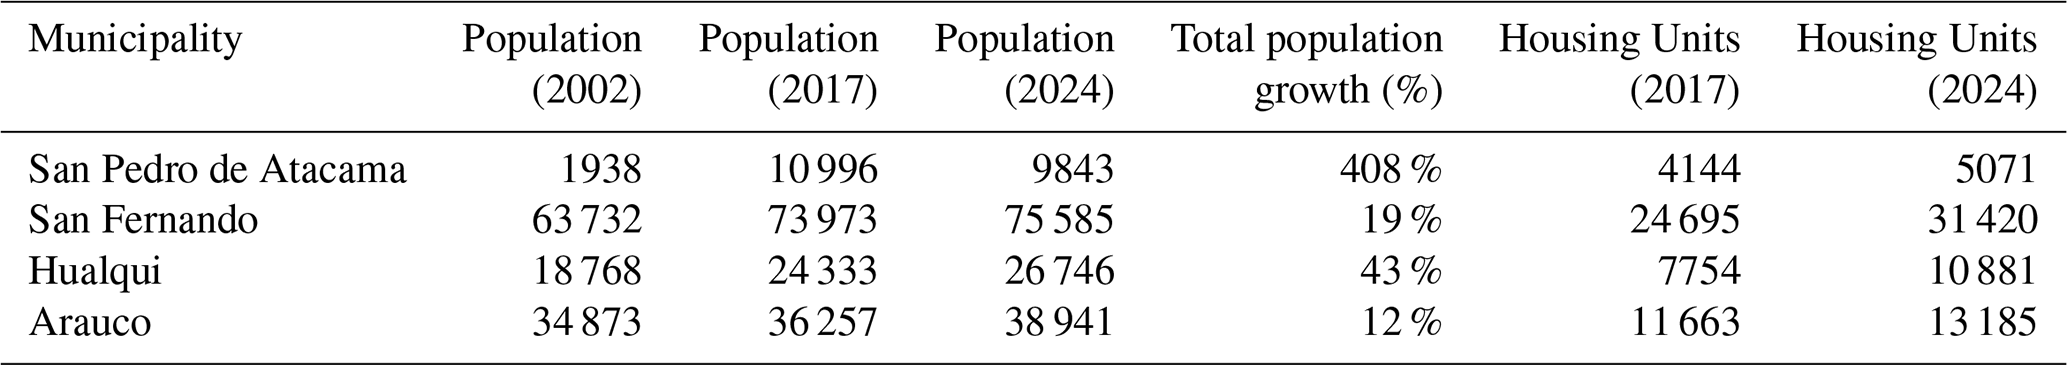
Table 1 shows the average annual precipitation in the analysed municipalities, as well as the rivers prone to flooding, their respective watershed areas, and their average annual flows, based on data from the Chilean National Water Agency (Dirección General de Aguas, DGA, 2014, 2021) and complementary hydrometeorological records. Table 2 summarises demographic and housing data from 2002 to 2024 based on the Chilean Population and Housing Census (INE, 2002, 2017, 2024).
Table 1Average annual precipitation, flood-prone rivers, watershed areas, and average annual discharge by municipality.
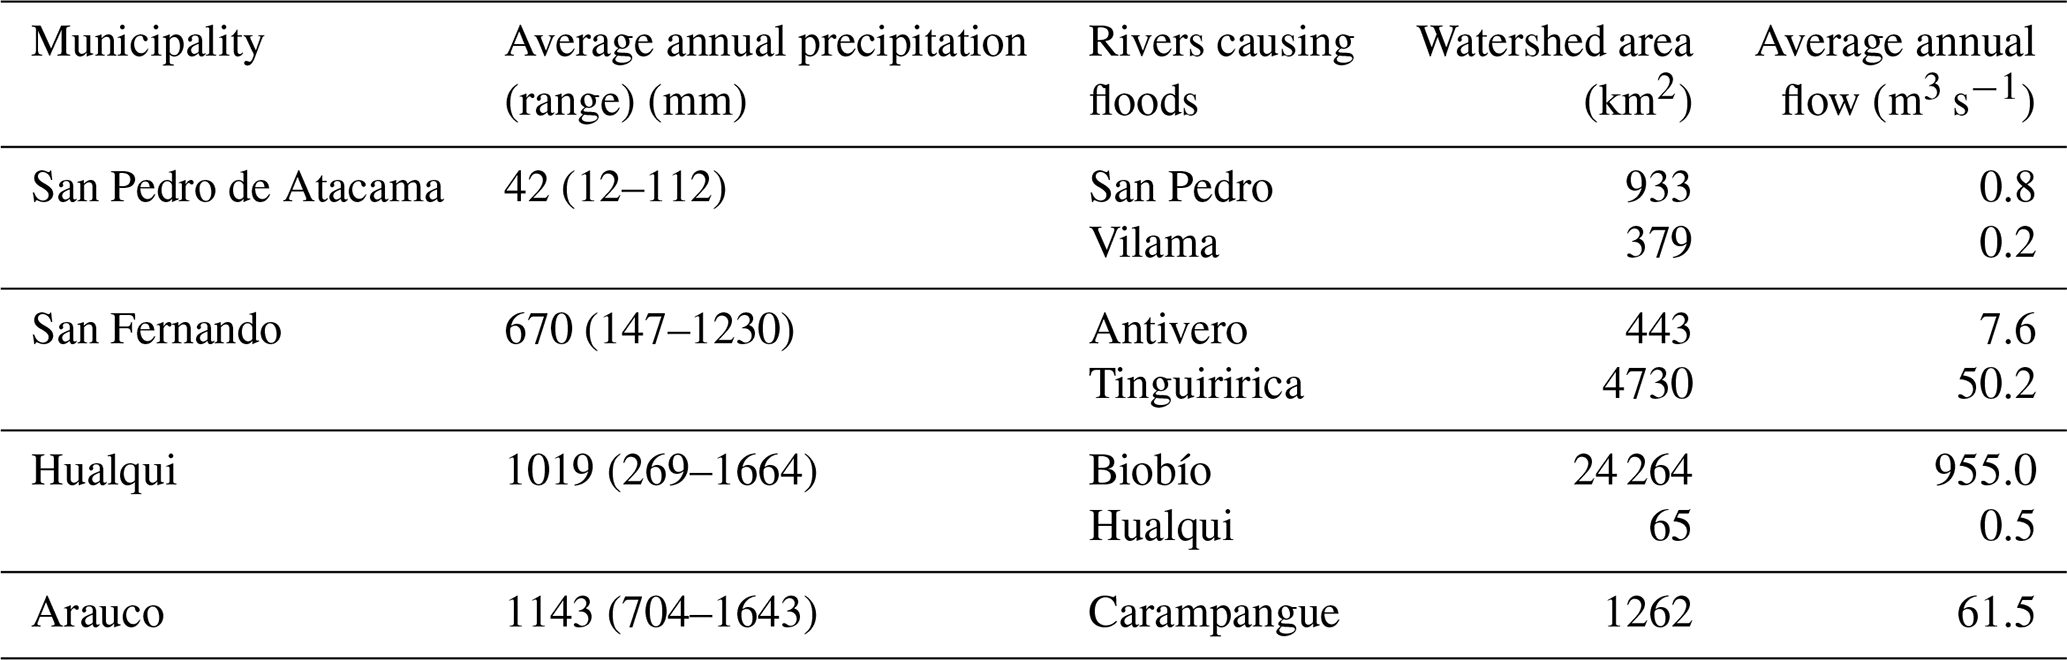
Table 2Population, growth rate and housing units by municipality
2.2 Survey
The survey consisted of both open- and closed-ended questions. It was structured around nine thematic dimensions: respondent characteristics, household characteristics, housing characteristics, location of the social network, experience during the most recent flood event, perception and knowledge of flood risk, collaboration networks, flood preparedness, and head-of-household characteristics.
Within the four municipalities composing the study area, zones for survey application were pre-selected based on their flooding exposure. The household was defined as the unit of analysis. Households were selected using a spatially distributed fieldwork strategy within predefined flood-exposed zones, with surveyors approaching dwellings where an adult resident agreed to participate, typically following a non-consecutive sampling pattern.
The questionnaire was administered in 2024 using Pen and Paper Personal Interviews (PAPI). A total of 1015 surveys, each comprising 80 questions, were conducted across four flood-prone municipalities in Chile. After data cleaning and validation, 1007 responses were retained for analysis. The final sample distribution was as follows: 252 households in San Pedro de Atacama, 380 in San Fernando, 100 in Hualqui, and 275 in Arauco. Considering the population size and the homogeneity of residents aged 18 and over in each municipality, the sample design ensured a 95 % confidence level with a maximum margin of error of 5 %.The total sample size was determined assuming a 95 % confidence level and a maximum margin of error of 5 %, using a conservative population proportion (p=0.5) to maximise variance. Given the size of the adult population in each municipality, the achieved sample enables statistically robust municipal-level estimates and supports multilevel analyses across individual, household, neighbourhood, and municipal scales.
In this study, neighbourhoods were defined using an official Geographic Information System (GIS) layer of Chile's unidades vecinales (neighbourhood units). These units constitute the geographical counterpart of juntas de vecinos (neighbourhood councils), which are the legally recognised base of local social organisation in the country. As such, neighbourhood units represent administratively recognised territorial subdivisions that also function as socially meaningful spaces for community organisation, participation, and local governance. To integrate statistical information available at the census-block level (manzanas censales), neighbourhood boundaries were spatially adjusted through a GIS overlay procedure. Census blocks were aggregated according to the limits of the corresponding neighbourhood units, ensuring consistency between socio-demographic statistical data and territorially recognised neighbourhood areas. This approach combines two complementary logics: the administrative community definition embedded in neighbourhood units, particularly relevant for variables related to social cohesion, trust, and local interaction and the statistical robustness provided by census-block data, which offer detailed socio-material information. In the Chilean context and more broadly in the urban studies literature, there is no single, universally accepted definition of “neighbourhood.” Rather, neighbourhoods are typically conceptualised as hybrid constructs that combine administrative delimitation and community-based recognition. The operationalisation adopted in this study follows this combined perspective, aligning territorial-administrative boundaries with socio-spatial meaning.
2.3 Other data sources
In addition to survey-based data, external sources were incorporated to complement the analysis, including: the distance from the household to the water, the territorial socio-material index (ISMT), the multidimensional poverty index (MPI), the income poverty rate (IPR) and the municipal common fund dependency (MCFD). Each of these indicators enables the integration of socio-economic and socio-spatial variables to interpret results derived from primary data, as the structural characteristics of Latin American societies and territorial inequalities contribute to understand the complexity of the relationship between flooding, preparedness, and worry.
The distance from each household to the nearest overflowing river was computed from the QGIS v3.40.0 georeferenced location of the household, as the shortest straight distance to the nearest perennial water body.
The ISMT considers the education level of the head of household, overcrowding (people per bedroom), cohabitation (number of households sharing a dwelling), and housing material quality (walls, roof, and flood conditions). Each variable was normalised, and the final ISMT score was derived using principal component analysis (PCA), with the first principal component capturing the main axis of variance across the four indicators. The resulting score reflects the relative socio-material vulnerability of each zone. The ISMT was computed using data from the 2017 Chilean population and housing Census (INE, 2017), following the methodology implemented in the “ismtchile” R package (Rosas Araya, 2025), which operationalises the approach developed by the Observatorio de Ciudades UC (2019). The ISMT used in this study was obtained as a GIS layer from the Observatorio de Ciudades UC's data platform. The index is provided at the block level (manzana) across the national territory. To assign an ISMT value to each household in the survey, the coordinates of the surveyed homes were spatially joined with the ISMT block-level layer using a point-in-polygon operation. This spatial matching allowed us to attribute the corresponding ISMT score to each surveyed household based on its location. While the ISMT is based on the 2017 Census, which is the most recent dataset available at the required spatial resolution, it captures relatively stable structural conditions (e.g., housing quality, overcrowding, and education level of the head of household). In contrast, population figures reported for 2024 correspond to the most recent official projections from the National Institute of Statistics (INE) and are used only for descriptive purposes. This combination ensures both temporal relevance and methodological consistency.
The MPI considers five dimensions: education, health, employment and social security, housing and environment, and social networks and cohesion. Each dimension consists of one or more indicators, each with a specific weight. The calculation follows the Alkire and Foster (2007) methodology, which involves constructing a binary deprivation matrix and applying indicator weights. These weights correspond to the official values used to construct the MPI for the CASEN survey and are not estimated or modified in this study. The MPI considers the incidence (H) and intensity (A) of poverty according to Eq. (1):
The MPI ranges from 0 to 1. Higher values indicate that households face greater disadvantages across education, health, employment, housing, and social support.
The IPR was calculated by comparing a household's per capita disposable income with the official national poverty line. A household was classified as income-poor if its per capita income falls below this threshold, which was calculated based on the cost of a basic basket of food and essential services, adjusted by household size and geographic location. Formally, the IPR was defined by Eqs. (2) and (3):
The IPR ranges from 0 to 1. At the household level, it takes the value 1 if the household's per capita income is below the poverty line, and 0 otherwise. The subscript “i” refers to a specific household in the sample. This indicates that the poverty indicator and rate are computed for each household before they are aggregated into the overall poverty rate. At the municipal or national level, the IPR represents the proportion of households classified as income poor. Higher values indicate a greater share of households living below the minimum income required to meet basic needs.
The MPI and the IPR used in this study were obtained from the 2022 CASEN Survey (Ministry of Social Development and Family, 2023), which provides disaggregated estimates at the municipality level.
The MCFD measures what proportion of a municipality's funding comes from the FCM, i.e., how much the municipality depends on nationally redistributed resources rather than generating its own revenue. MCFD considers the number of transfers received from the common fund and the total municipal revenue, as specified in Eq. (4):
Higher MCFD values indicate greater financial dependence on the FCM, while lower values suggest greater self-financing capacity. The MCFD was computed using data from the Chilean sub-secretariat for regional and administrative development (SUBDERE, 2022).
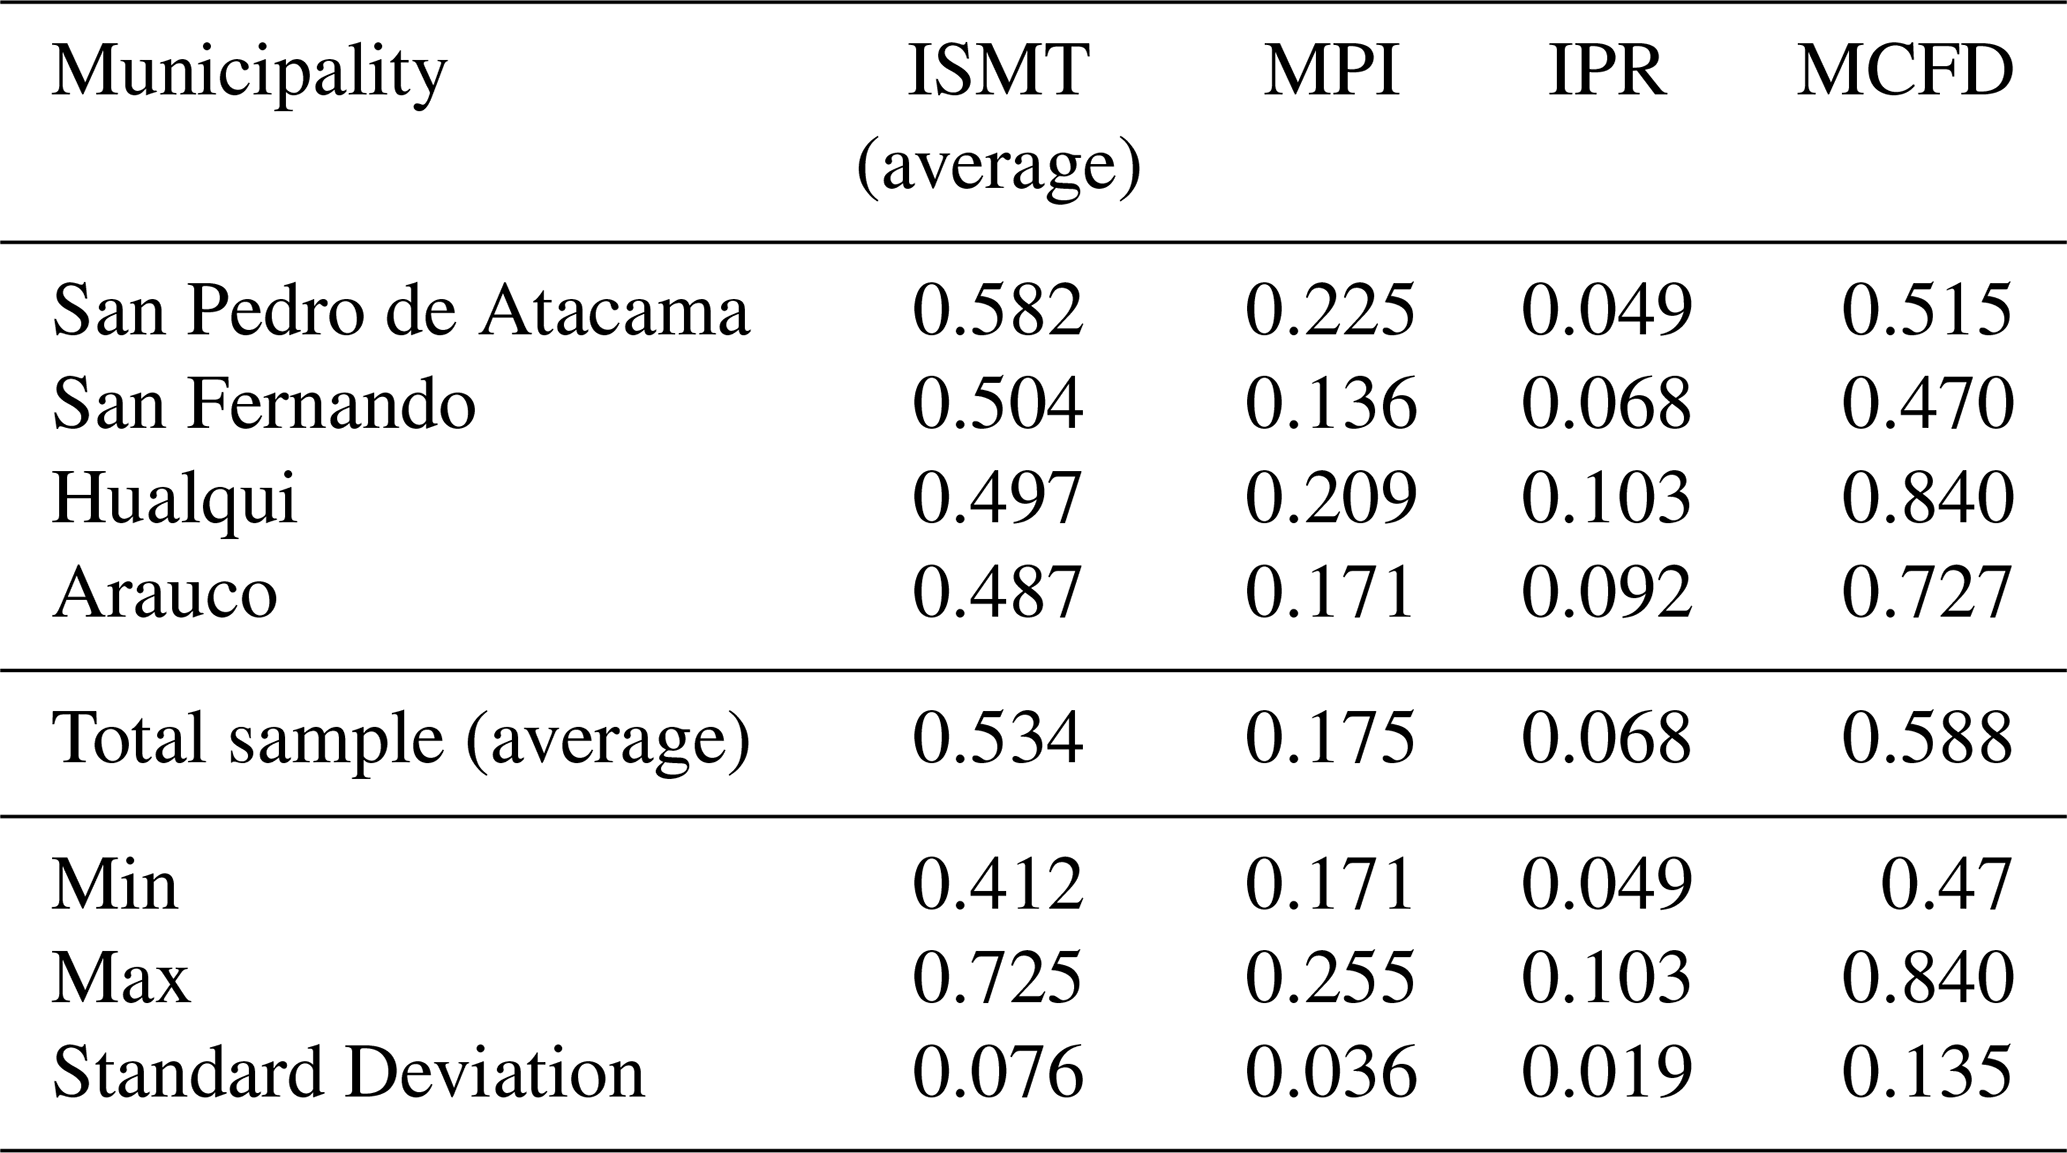
Table 3 shows the ISMT, MPI, IPR and MCFD for each municipality and the average for the whole sample.
Table 3ISMT, MPI, IPR and MCFD for each municipality and for the whole sample.
To estimate the recurrence of flood events in each municipality, a review of national and regional news reports was conducted for the period 2000–2025. This search aimed to identify significant flooding over the last 25 years and to calculate the frequency of damaging floods, i.e., floods reported in the news. Additionally, the flood dates reported in the literature were verified against available discharge measurements at gauge stations.
2.4 Statistical analysis
The survey answers related to flood risk perception, preparedness, worry, and sociodemographic characteristics, together with complementary data, were analysed through multiple methods, namely univariate analysis, regressions by level, multilevel regression, principal coordinates and cluster analysis, and contingency tables. All statistical analyses and visualisations were conducted in R-4.4.3. A value of p<0.05 was interpreted as statistically significant. Variables were organised into four hierarchical levels: individual, household, neighbourhood, and municipality.
The logic of the hierarchical multilevel analysis lies in explicitly recognising the nested structure of the data: individuals are embedded in households, households in neighbourhoods, and neighbourhoods in municipalities. This implies that responses regarding flood risk perception and preparedness are not independent observations but are influenced by contextual conditions operating at higher levels of aggregation. Multilevel modelling allows separating the variance attributable to each level, while simultaneously estimating the effects of explanatory variables at the individual, household, neighbourhood, and municipal scales. In this way, it becomes possible to distinguish, for example, whether worry is mainly explained by individual attributes (such as age or trust in neighbours), by household conditions (housing quality, direct exposure), or by broader spatial contexts (socioeconomic composition of the neighbourhood, municipal financial autonomy). This hierarchical logic is essential for analysing risk perception, since, as Bourdieu's notions suggest, spatial and social structures exert systematic influences that shape dispositions, experiences and behaviours across scales. In this sense, space across different scales operates as a structuring force of social relations and emerges as a distinctive analytical dimension, enabling a deeper understanding of the socio-spatial configuration within socio-hydrological dynamics.
This study focuses on two key elements of flood risk perception, namely worry and preparedness. Worry refers to the individual concern or emotional response associated with the perceived risk of flooding, reflecting the subjective perception of flood risk (Raaijmakers et al., 2008; Lechowska, 2018). It was measured using the survey question: “On a scale from 1 to 3, where 1 means `Low' and 3 means `High', what do you think is the level of flood risk in your home?” The variable was treated as ordinal (1= low, 2= medium, 3= high).
Preparedness refers to the adoption of precautionary measures against flooding, their continuity over time, and the perceived effectiveness of those measures (Raaijmakers et al., 2008; Lechowska, 2018). In this study, preparedness captures actual behaviour, as it is based on reported actions taken during or immediately after the last flood event. Respondents who did not adopt any measures were therefore classified as not prepared, regardless of their perceived confidence. Preparedness was constructed as a composite index combining: (i) the type of measures adopted (permanent and/or non-permanent), and (ii) their perceived effectiveness. A score (Sm) was assigned based on the combination of measures: 1.0 when both permanent and non-permanent measures were implemented, when only permanent measures were adopted, when only non-permanent measures were adopted, and 0 when no measures were taken. This score was combined with the perceived effectiveness (E), reported on a scale from 1 to 7, and normalised according to Eq. (5):
The resulting index ranges from 0 to 1, where higher values indicate greater preparedness. For interpretation and modelling purposes, the index was categorised into four ordinal levels: 0 (no preparedness), 1 (low), 2 (medium), and 3 (high).
The difference in the ordinal scales of worry (1–3) and preparedness (0–3) reflects their distinct nature. Worry is derived from a direct perception-based question and therefore does not include a zero category, whereas preparedness is a behaviour-based index that explicitly distinguishes households that did not adopt any measures (value =0).
2.4.1 Univariate analysis
A univariate analysis was conducted to describe the sample's characteristics, using derived variables from the survey and complementary external data sources. Descriptive statistics were calculated, including frequencies for categorical variables and means with standard deviations for continuous variables. The analysis was performed on the full sample and disaggregated by municipality, enabling comparisons of each municipality's characteristics.
The analysis was based on a set of variables obtained from both the household survey and complementary external sources. The survey data included variables representing socio-demographic characteristics, housing conditions, and social networks. As well as variables related to experience during the most recent flood, perception and knowledge of flood risk, flood preparedness, and flood risk awareness. Some of these variables were taken directly from individual survey questions (e.g., gender, occupation, age group), while others were constructed as composite indicators (e.g., housing quality, perceived closeness to the neighbourhood, social vulnerability, preparedness level). Table 4 lists the variables used in the univariate analysis, including their hierarchical level, scales and brief descriptions.
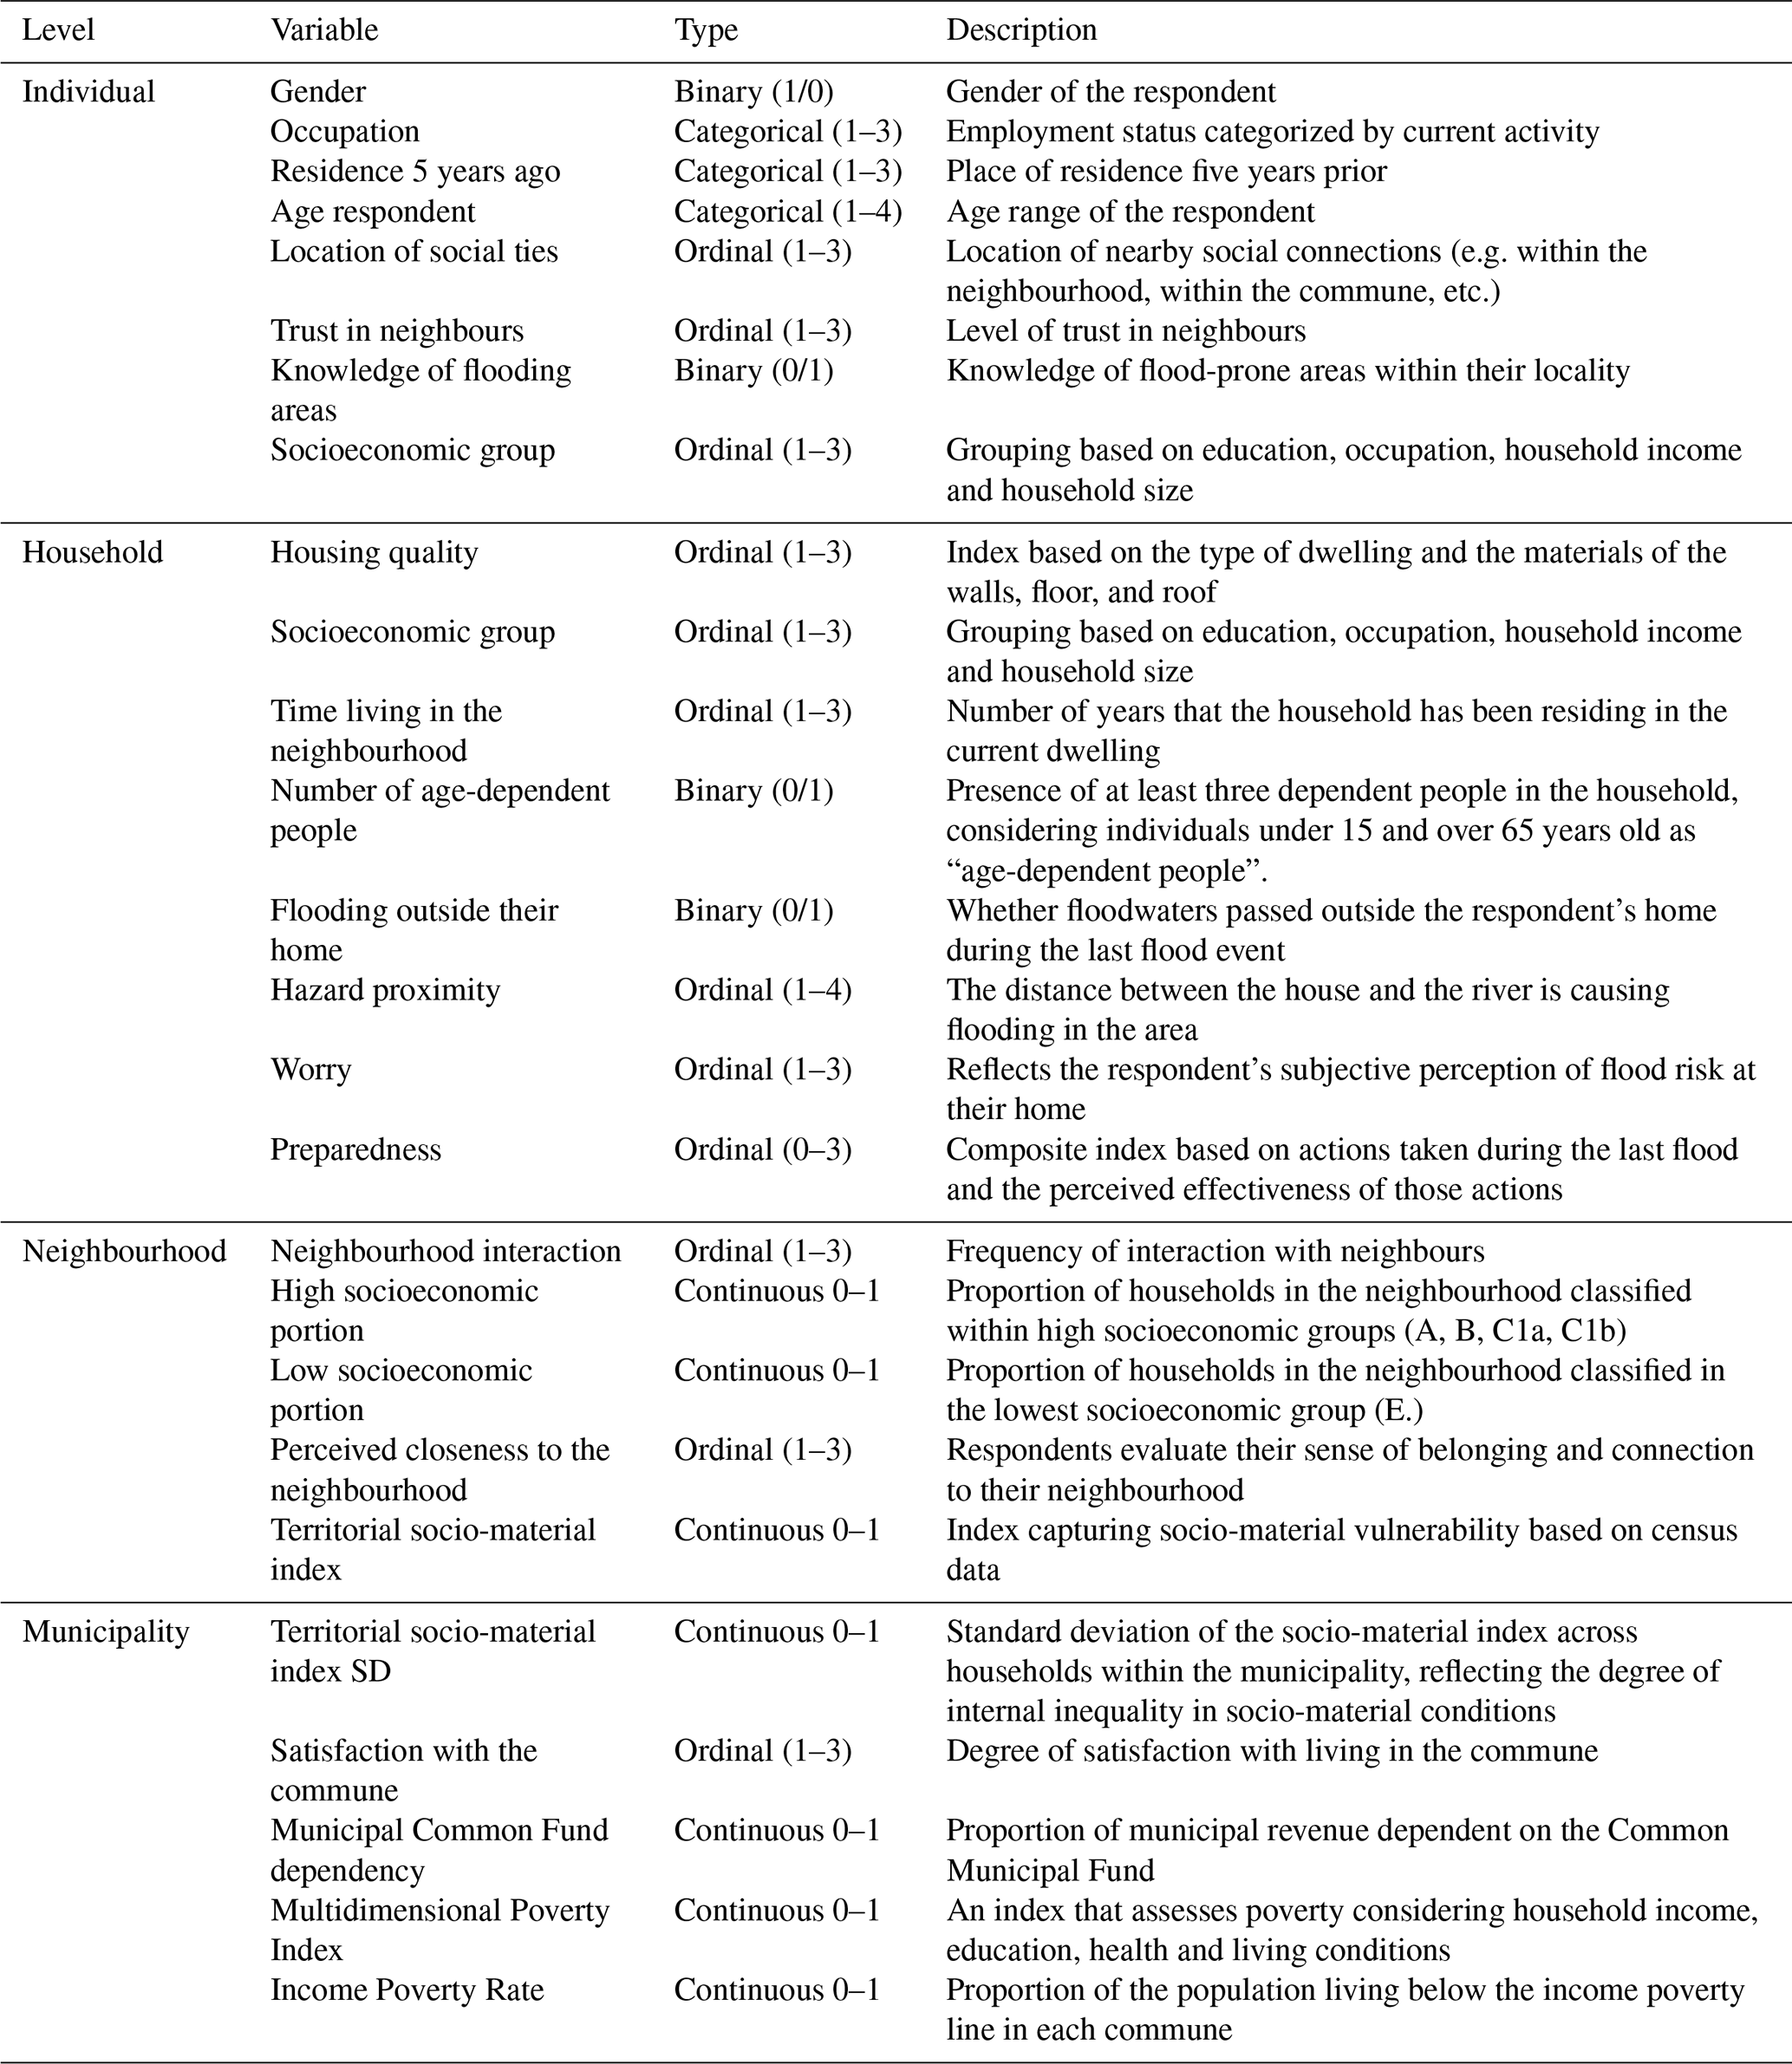
The assignment of variables to different hierarchical levels reflects their conceptual role within the multilevel framework. In some cases, similar variables were included at multiple levels to capture distinct mechanisms operating at different scales. For example, the socioeconomic group appears at both the individual level, where it reflects the respondent's socio-educational and occupational position, and at the household level, where it represents the material resources available to implement preparedness measures. Similarly, the ISMT was incorporated at different levels using distinct indicators: its average value characterises neighbourhood-level socio-material vulnerability, while its standard deviation at the municipal level captures intra-municipal inequality.
For analyses at the neighbourhood and municipality levels, variables originally measured at the individual and household levels (e.g., worry and preparedness) were aggregated within each spatial unit using mean values. These aggregated measures represent the collective characteristics of households rather than the perspectives of institutional decision-makers. In addition, contextual variables inherently defined at higher levels (e.g., ISMT, MPI, IPR, and MCFD) were directly incorporated into the multilevel framework based on their spatial definition.
2.4.2 Ordinal regression by level
Ordinal regression models were used to examine the relationships between the explanatory variables and the dependent variables, worry and preparedness. To assess the contribution of variables operating at different contextual scales, separate models were estimated for each level of analysis. This stepwise approach allowed an independent evaluation of the effects at each level, without conflating them with broader contextual influences. A backward selection procedure based on p-values was applied to retain only those variables with a statistically significant contribution to each model.
2.4.3 Multi-level ordinal regression
A multilevel ordinal regression model was estimated to assess the combined effects of explanatory variables from different contextual levels (individual, household, neighbourhood, and municipality) on flood risk worry and preparedness. This modelling approach accounts for the hierarchical structure of the data, i.e. with individuals nested within households, households within neighbourhoods, and neighbourhoods within municipalities. Unlike the regression models by level, which analysed each context separately, the multilevel model incorporates all levels simultaneously. The models correspond to cumulative ordinal logistic regressions, in which the ordinal categories of the dependent variables define a set of ordered thresholds. The model estimates the cumulative probability of an individual belonging to a given category or a lower category (i.e. P(Y≤k)) and relates the explanatory variables to the log-odds of these cumulative probabilities. The probability of belonging to each specific category is then derived from these cumulative estimates, thereby explicitly accounting for the ordinal structure of the dependent variables. Most explanatory variables included in the models were specified as categorical or ordinal (e.g., age range, socioeconomic group, housing quality, and trust in neighbours). As such, the model does not impose a strictly linear relationship between these variables and the outcome but rather estimates category-specific effects. Variable selection was performed using a backward stepwise procedure based on p-values. Interaction terms between variables were not included in the final models, as the multilevel structure already captures variability across hierarchical levels, and their inclusion would substantially increase model complexity and reduce interpretability. Moreover, some variables (e.g., preparedness and the Territorial Socio-Material Index, ISMT) are composite indicators that already integrate multiple dimensions. Therefore, the analysis focused on estimating the independent contribution of variables at different levels rather than modelling complex interaction effects. In addition, the models were used to estimate the predicted average level of worry and preparedness in each locality, based on the explanatory variables considered.
2.4.4 Multilevel analysis
To explore similarities between neighbourhoods and municipalities based on the explanatory variables of worry and preparedness, a principal coordinates analysis (PCO) was computed using the Gower distance, which allows the combination of ordinal and continuous data. This method enabled the projection of multivariate dissimilarities into a reduced two-dimensional space while preserving the pairwise distances between observations as accurately as possible (Abdi and Williams, 2010). Subsequently, hierarchical clustering using Ward's method was conducted on the same distance matrix to identify groups of similar neighbourhoods and municipalities. For both spatial levels, the input data were aggregated to the neighbourhood or municipality level, averaging the relevant variables obtained from the multilevel regressions. This was combined with biplots that displayed visualisations of score plots (data points) and a loading plot (variable vectors) to simultaneously analyse row-sample relationships and column-variable contributions (Gower and Hand, 1996).
2.4.5 Contingency tables
The relationship between worry and preparedness was explored using contingency tables and ordinal correlation analysis. Contingency tables were used to visualise the joint distribution, and Pearson's χ2 test was applied to assess the null hypothesis of independence between variables. The direction and magnitude of the association were quantified using Spearman's rank correlation (ρ), which is appropriate for ordinal data and ranges from −1 to 1 (positive values indicate a direct relationship). These methods were selected because both variables are ordinal. Spearman's rank correlation does not assume a linear relationship but rather evaluates monotonic associations between variables based on their ranks. Similarly, Pearson's χ2 test assesses statistical independence between categorical variables and does not rely on linearity assumptions. For these reasons, the applied methods are suitable for capturing non-linear relationships in ordinal data, and additional non-linear modelling approaches were not considered. Analyses were conducted for the full sample separately by municipality and at the neighbourhood level.
3.1 Sociodemographic, social networks and flood experience characteristics
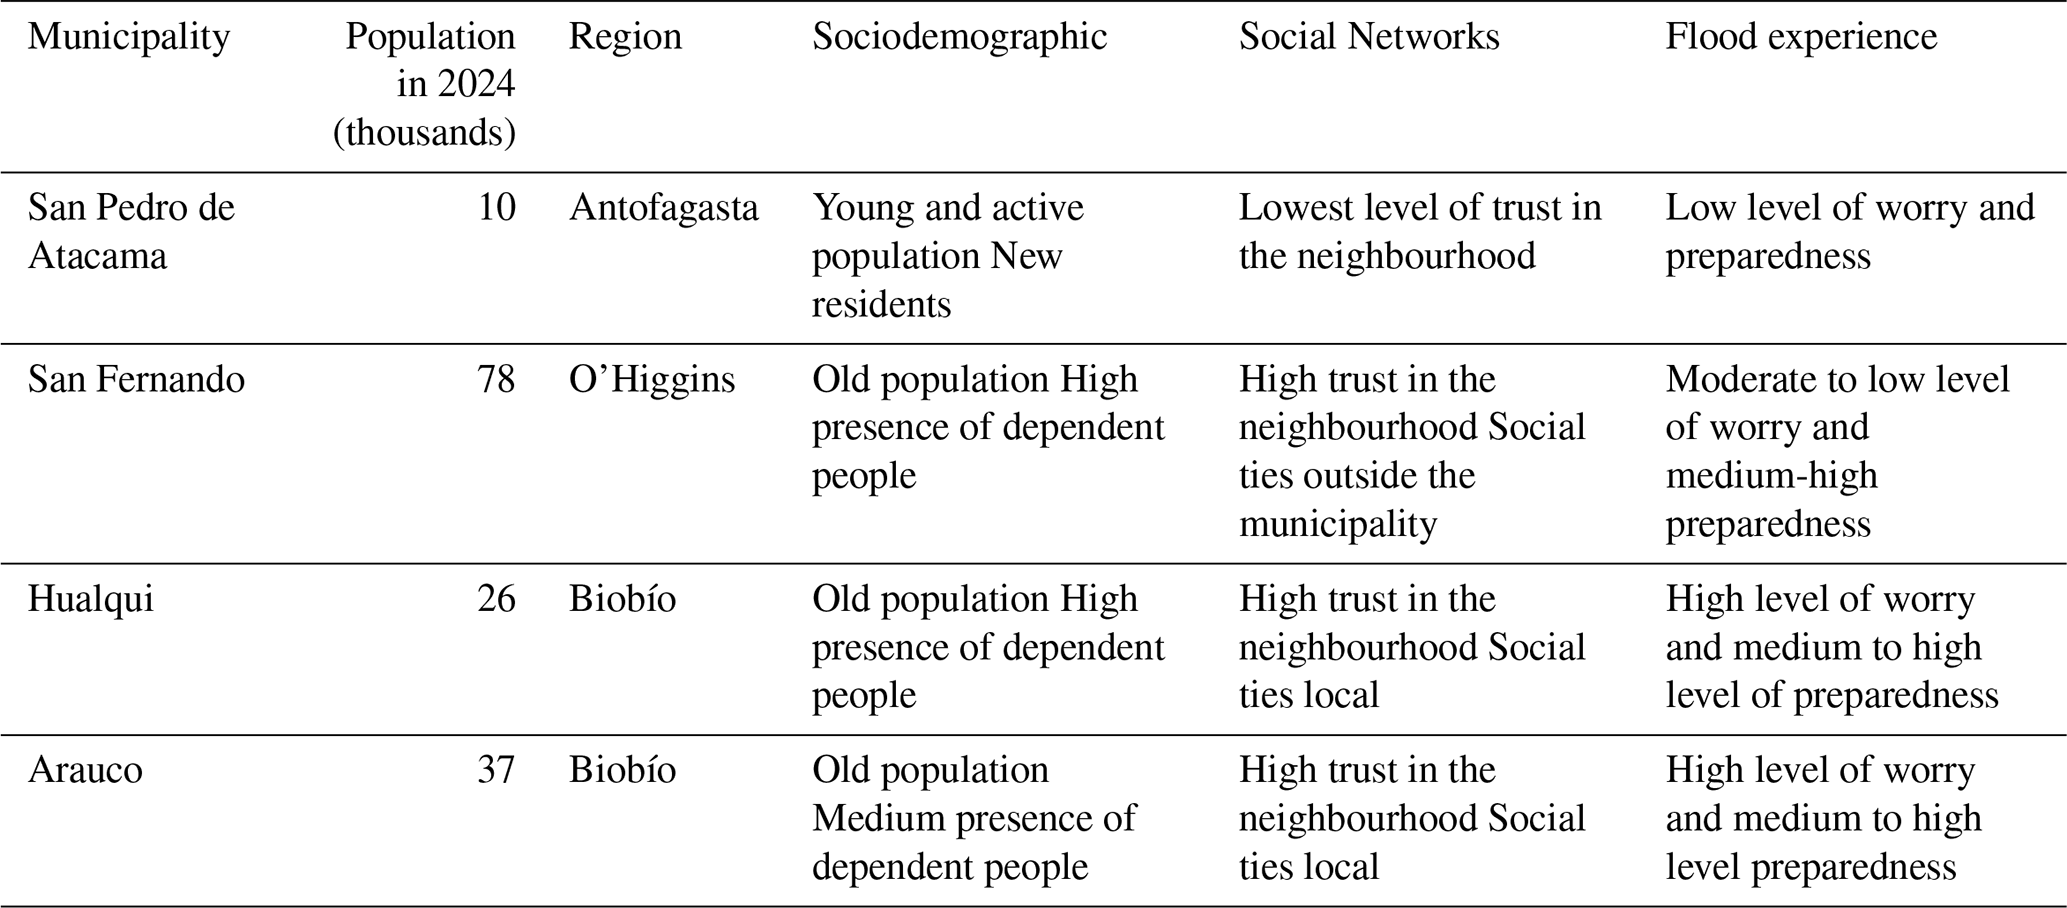
Appendix A presents the univariate analysis at the municipality level. Table 5 summarises the main findings of the univariate analysis of the study municipalities, highlighting sociodemographic, social network, and flood-experience variables.
Table 5Characteristics of the municipalities included in this study.
In this study, we distinguish between awareness and worry as components of flood risk perception. However, awareness was not analysed further, as it showed very limited variability across the sample. Specifically, 57.9 % of respondents live within 750 m of a river, i.e. in areas with high exposure to flooding; 84.7 % reported knowing the flood-prone areas; and 55.4 % had experienced a flood passing outside their home. Overall, 96.2 % of respondents met at least one of these conditions, indicating widespread awareness of flood risk. Therefore, awareness was assumed to be uniformly high across the sample and was not included as a variable in the subsequent analysis. Similarly, the survey included a variable capturing the perceived importance of climate change as a driver of flooding. Respondents were asked to rate, on a scale from 1 to 5, the importance of climate change in increasing precipitation and the frequency of flood events. A large majority of respondents (88 %) attributed high importance to climate change as a contributing factor to flooding. However, this variable also showed limited variability across respondents and therefore had low discriminatory power in explaining differences in individual flood worry. For this reason, it was not included in the regression models. Nevertheless, the overall high attribution suggests that climate change forms part of the broader interpretative framework through which residents understand flood risk.
3.2 Variables and dimensions explaining flood risk perception
3.2.1 Worry
The multilevel ordinal regression model predicts the probability that an individual i, living in neighbourhood j and municipality k, reports a level of worry equal to or below a given ordinal category. The linear predictor reveals the hierarchical structure of the data in Eq. (6):
where ηijk estimates the probability that a person belongs to a given worry category. X1 is the age range of the respondent, X2 is trust in the neighbourhood, X3 is the knowledge of flooding areas, X4 is housing quality, X5 is flooding outside their home, and X6 is the high socioeconomic portion in the neighbourhood. The terms uk and vkj are random effects that capture differences between municipalities and between neighbourhoods that are not explained by the model's variables. Specifically, uk represents the deviation of municipality k from the overall average, while vkj captures the deviation of neighbourhood j within municipality k. These random effects are assumed to follow a normal distribution with mean zero and variances estimated by the model, allowing it to account for unobserved contextual influences that affect the level of worry across geographic units. Table 6 presents the explanatory variables for worry from the multilevel regression, including the regression parameters.
Table 6Explanatory variables of worry according to the multi-level regression.
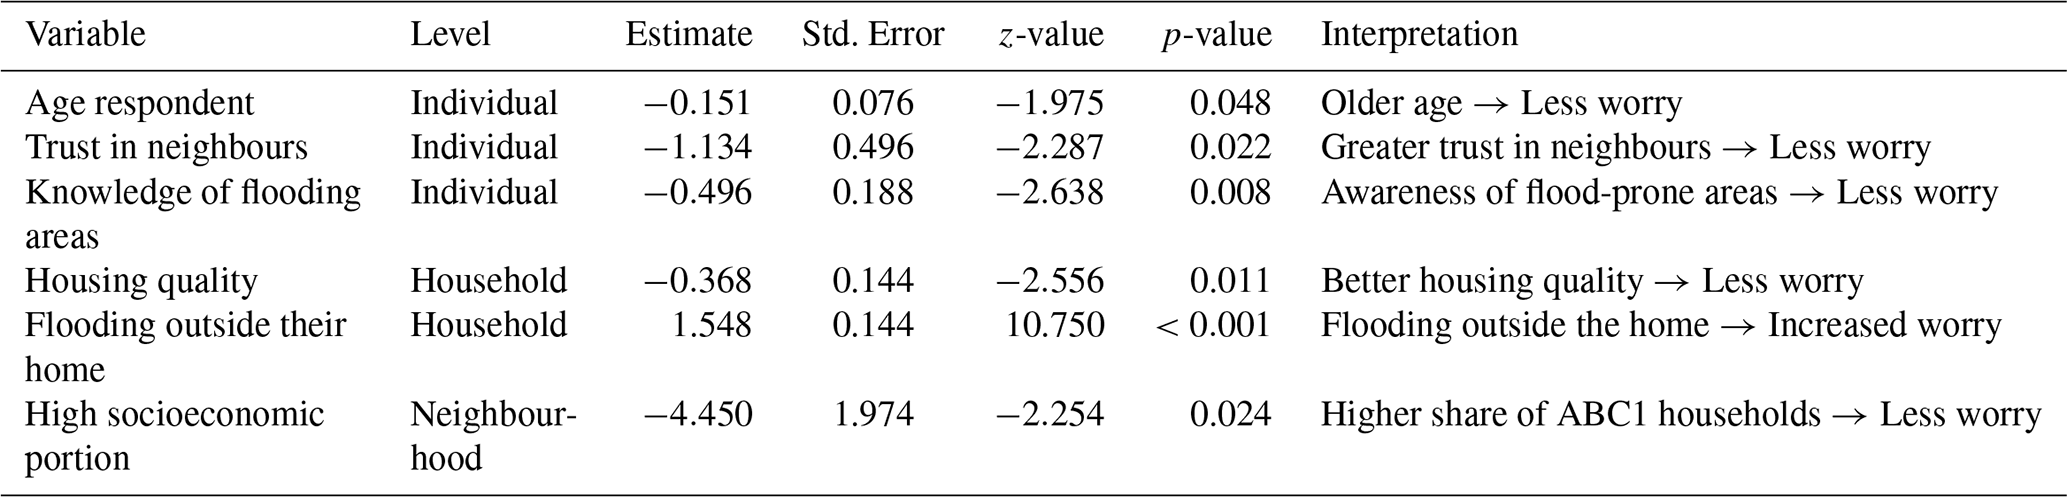
At the individual level, older respondents, those with greater trust in neighbours, and those aware of flood-prone areas consistently reported lower levels of worry. At the household level, better housing quality was associated with reduced worry, while having experienced flooding outside the home remained a strong predictor of elevated worry. At the neighbourhood level, living in areas with a higher proportion of high-socioeconomic-status households was associated with lower worry about flooding. Notably, no municipal-level variables were found to be statistically significant. The most important variables were those associated with the higher levels, neighbourhood and household.
Ordinal regression models for each level are included in Appendix B. A comparison between the ordinal regression by level and the multi-level regression reveals that at the individual level, three variables: age, trust in neighbours, and knowledge of flooding areas are significant in both models, i.e. the key dimensions of demographic characteristics (age), social cohesion (trust), and awareness of risk (flood-prone areas) are robust predictors of worry. In contrast, gender, occupation, and socioeconomic group were only significant in the regression by level. Their exclusion from the multilevel model and thus, their effects, are either moderated or better captured by other variables when all levels are analysed simultaneously. At the household level, the variable' flooding outside the home' was significant in both models, highlighting the importance of direct exposure to flood events in explaining increased worry. This variable reflects experience with the “past-flooding” dimension. Housing quality appeared as significant only in the multilevel regression, suggesting that better physical living conditions are associated with lower worry. At the neighbourhood level, the proportion of households classified within high socioeconomic groups was significant in both models. This variable represents the neighbourhood's socioeconomic composition and is associated with lower levels of worry: residents of higher-income neighbourhoods are less worried about floods. In contrast, variables such as the low socioeconomic portion, neighbourhood interaction, perceived closeness to the neighbourhood, and the territorial socio-material index were only significant in the regression by level. At the municipal level, the income poverty rate was significant in the ordinal regression, and none of the variables was statistically significant in the multilevel regression. Overall, according to Eq. (6), worry in the study area was 1.874 (intermediate), with greater dispersion at lower levels, ranging from 1.817 (intermediate) to 2.338 (high) across municipalities and from 1.040 (low) to 2.520 (high) across neighbourhoods.
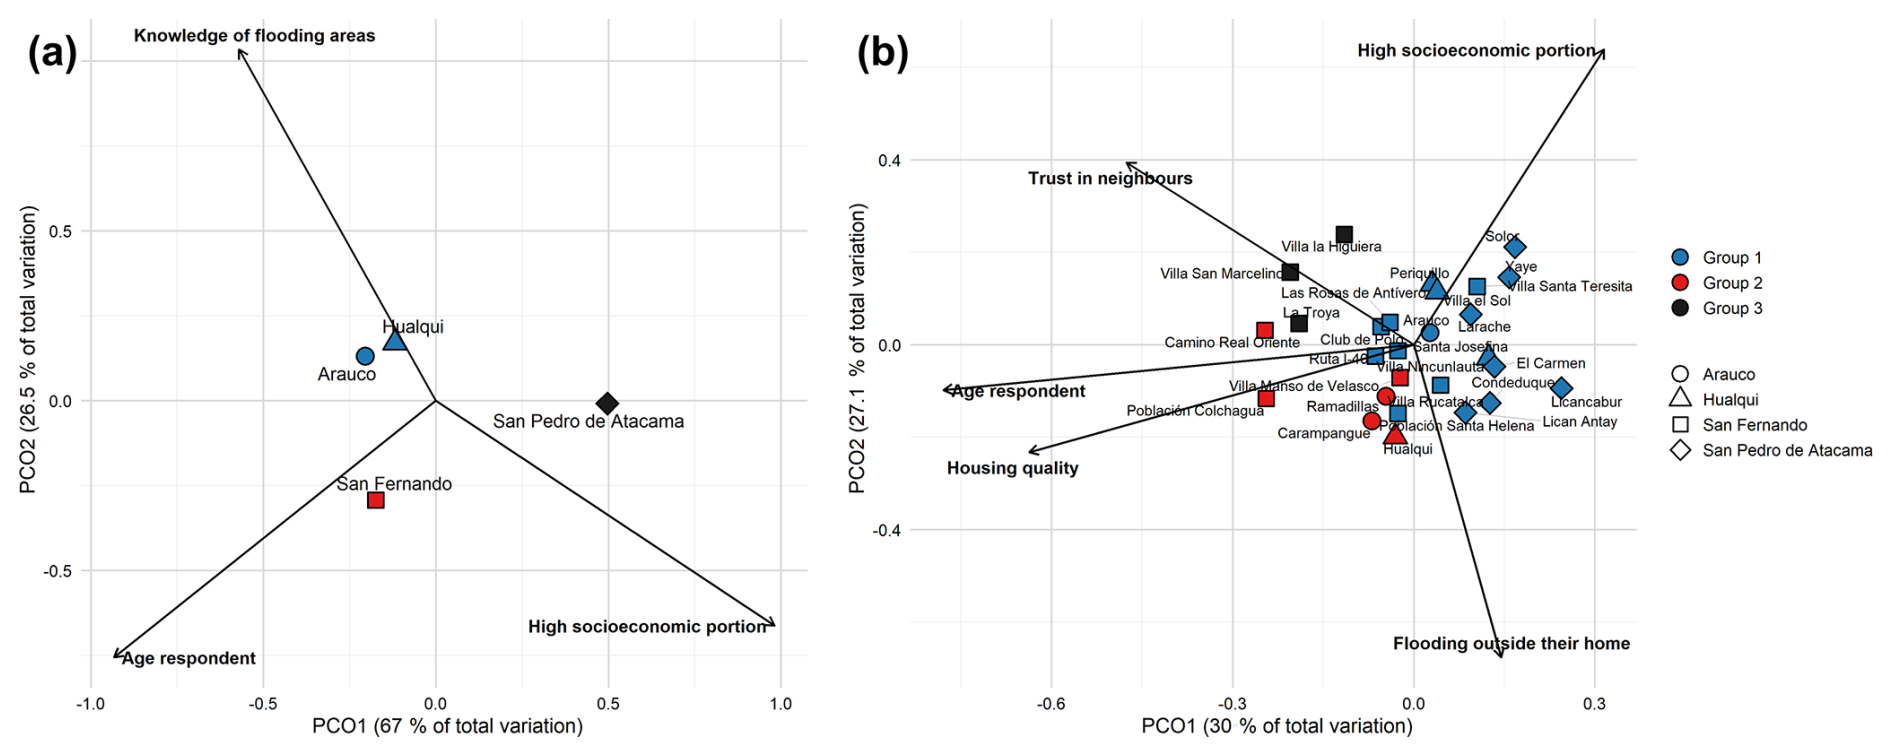
Figure 2Principal Coordinate Analysis (PCO) of worry based on the significant variables from the multilevel regression models, with biplot vectors showing the direction and relative influence of each variable (a) the municipal level and (b) the neighbourhood level.
Figure 2 presents the Principal Coordinate Analysis (PCO) based on the variables significant in the multilevel regression for worry at the municipal and neighbourhood levels. The biplots include vectors indicating the direction and relative contribution of the significant variables.
At the municipal level, both axes capture 67.0 % and 26.5 % of the total variation in worry, explaining 93.5 % of the data's variability. The biplot shows that three variables capture worry, namely age of the respondent, knowledge of flooding areas, and a high socioeconomic proportion. Figure 2a shows that the municipalities are grouped into 3 groups. Hualqui and Arauco groups together, showing similar characteristics of worry. Both municipalities are aligned with the vectors for age respondents and knowledge of flooding areas, indicating that worry in these municipalities is mainly associated with older respondents and greater awareness of flood-prone zones. San Fernando forms a separate group, although it is not completely distant from Hualqui and Arauco, as it also shares the influence of the age respondent. However, it is less associated with knowledge of flood-prone areas and, conversely, is associated with socioeconomic factors. San Pedro de Atacama appears clearly separated from the other municipalities and is primarily associated with a high socioeconomic proportion, indicating that worry in this municipality is linked to socioeconomic characteristics.
At the neighbourhood level (Fig. 2b), the PCO shows that both axes capture 30.0 % and 27.1 % of the total variation in worry, explaining 57.1 % of the data's variability. The biplot shows that five variables capture worry: Age of respondent, trust in neighbours, housing quality, flooding outside their home, and high socioeconomic portion. Three different groups are formed. Group 1 comprises neighbourhoods from all municipalities, indicating that neighbourhoods across municipalities can share similar worry-related characteristics. One part of the group has a high socioeconomic status. The other part of the group is mostly associated with variable flooding outside their homes, suggesting that worry in these neighbourhoods is linked to direct flooding experience. Group 2 comprises neighbourhoods in San Fernando, Hualqui, and Arauco. Worry in these neighbourhoods is related to flooding outside their homes, their experience of flooding, housing quality, and the age of the residents. Group 3 consists of neighbourhoods located only in San Fernando. In this group, worry is mainly associated with trust in neighbours and the respondent's age. There is also an association with a high socioeconomic portion, suggesting that socioeconomic characteristics play a secondary role in terms of the worry for this group. Neighbourhoods located near the centre of the plot are not strongly related to any specific variable. This central position indicates that worry is related to a combination of factors, without a single dominant variable structuring its pattern.
3.2.2 Preparedness
The multilevel ordinal regression model predicts the probability that an individual i, living in neighbourhood j and municipality k, reports a level of preparedness. The multilevel model reveals the hierarchical structure of the data in Eq. (7).
where ηijk estimates the probability that a person belongs to a preparedness category. X1 is the gender of the respondent, X2 is the knowledge of flooding areas, X3 is the socio-economic group, X4 is the housing quality, X5 is the time living in the neighbourhood, X6 is flooding outside their home, X7 is the low socioeconomic portion, and X8 is the municipal common found dependency. The terms uk and vjk are random effects that capture differences between municipalities and between neighbourhoods that are not explained by the model's variables. Specifically, uk represents the deviation of municipality k from the overall average, while vjk captures the deviation of neighbourhood j within municipality k. Table 7 presents the explanatory variables of preparedness from the multilevel regression, along with the regression parameters.
Table 7Explanatory variables of preparedness according to the multi-level regression.
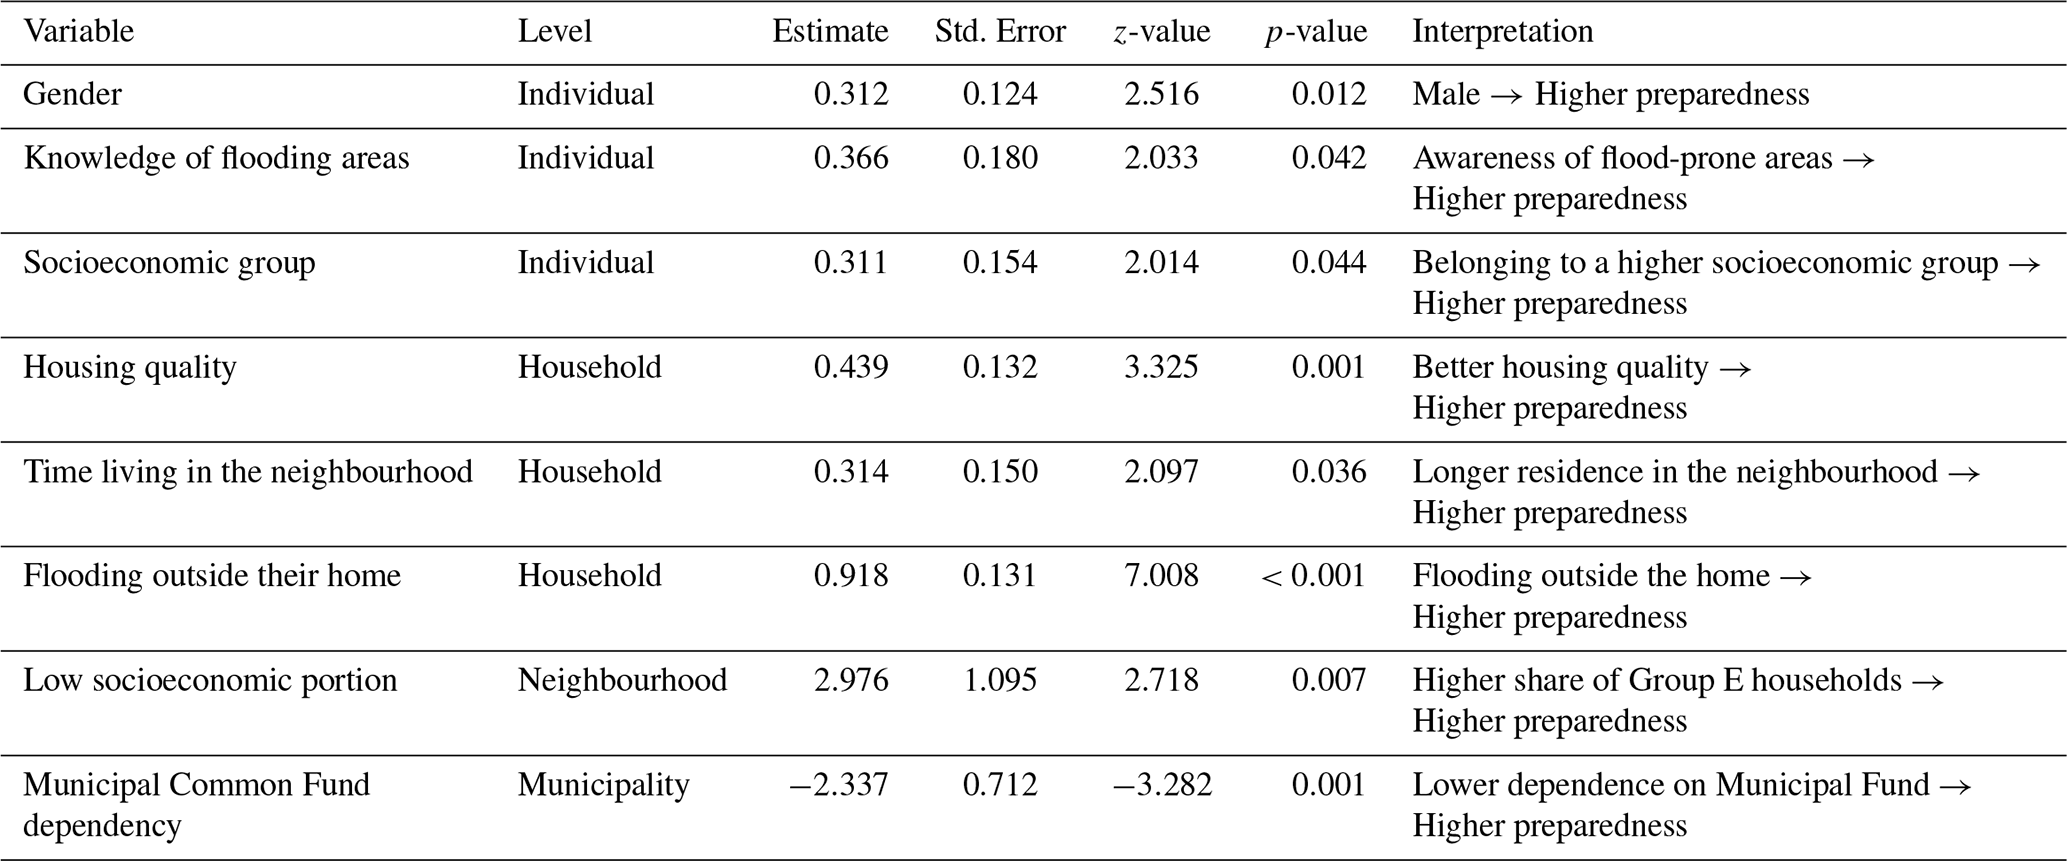
At the individual level, being male, knowledge of flood-prone areas, and higher socioeconomic group were positively associated with greater preparedness. At the household level, living in a higher-quality dwelling, having resided longer in the same home, and experiencing flooding outside the home were all linked to higher levels of preparedness. At the neighbourhood level, a greater proportion of households in low socioeconomic groups was associated with greater preparedness. At the municipal level, lower dependence on the Municipal Common Fund was positively related to preparedness, suggesting that residents in less financially dependent municipalities tend to report higher levels of readiness for future flood events. Notably, the most important variables explaining preparedness were those associated with the higher levels, municipality and neighbourhood.
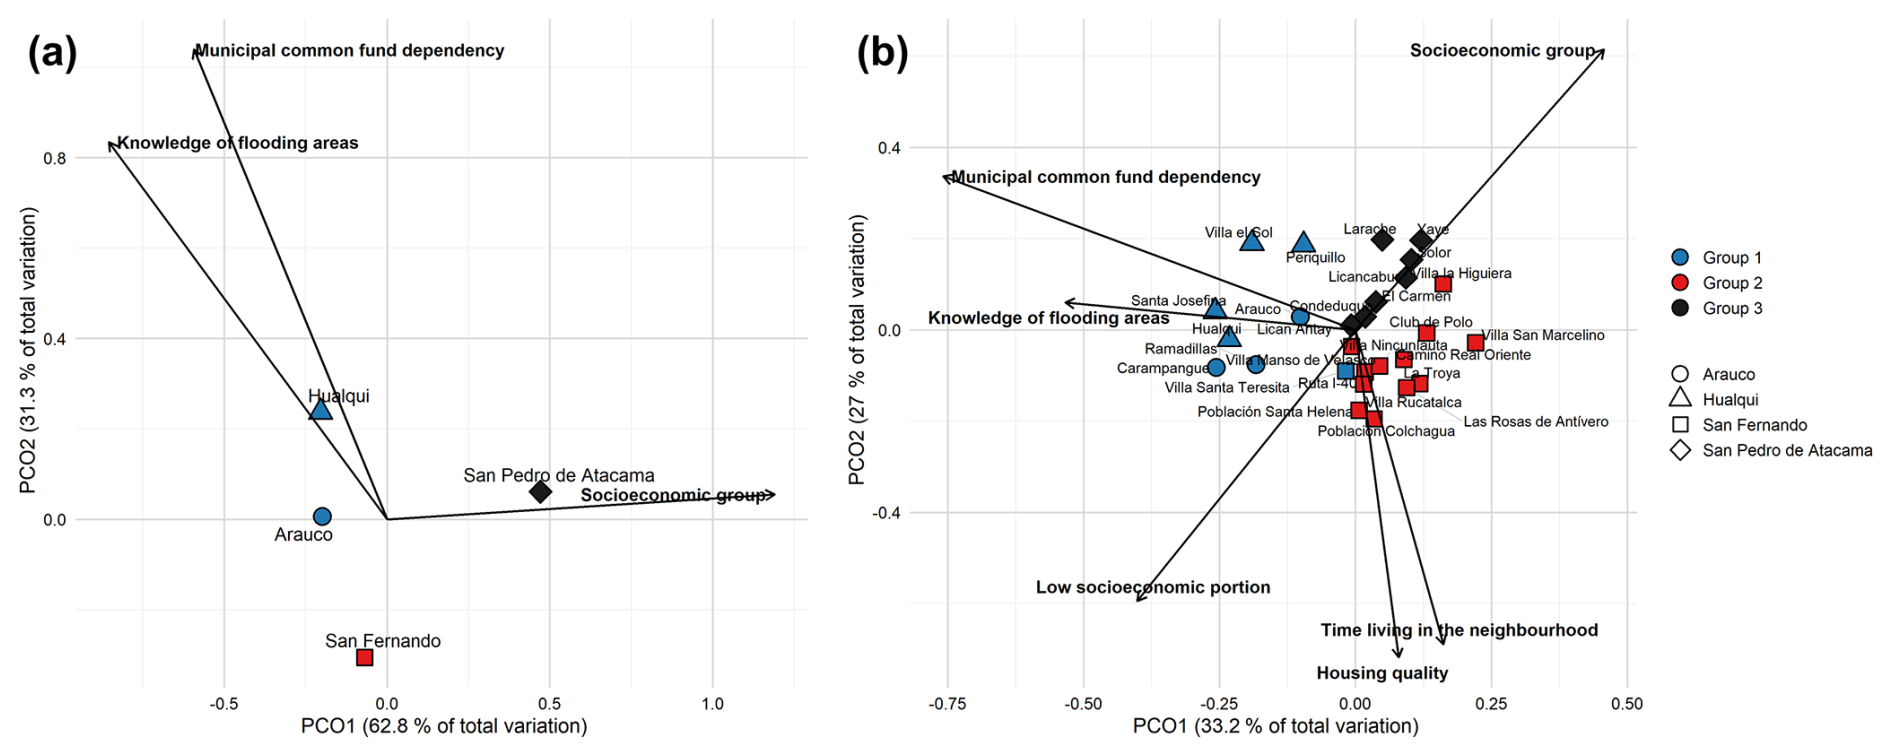
Figure 3Principal Coordinate Analysis (PCO) of preparedness based on the significant variables from the multilevel regression models, with biplot vectors showing the direction and relative influence of each variable (a) the municipal level and (b) the neighbourhood level.
Ordinal regression models for each level are included in Appendix B. A comparison between ordinal regression by level and multilevel regression reveals that knowledge of flood-prone areas and socioeconomic group were significant in both models, highlighting the relevance of risk awareness and socioeconomic status to preparedness. Preparedness increased with knowledge of flood-prone areas and with higher socio-economic status. Age and place of residence five years ago were significant in the regression by level, but were not in the multilevel model. At the household level, housing quality, time living in the neighbourhood, and the occurrence of flooding directly outside the home were significant in both models, i.e., preparedness at the household level depends on housing quality and past experiences with flooding. The socioeconomic group and the number of age-dependent people in the household were significant only in the regression by level. Only belonging to the lower socioeconomic portion was significant at the neighbourhood level, i.e., more vulnerable neighbourhoods exhibit greater preparedness. Neighbourhood interaction was only significant in the regression by level. Only one variable at the municipal level was significant in both regression models, namely Municipal Common Fund dependency. This suggests that living in economically more autonomous municipalities is associated with greater preparedness among residents. Overall, according to Eq. (7), preparedness in the study area was 1.920 (intermediate), with greater dispersion at lower levels: ranging from 1.088 (intermediate) to 2.356 (high) across municipalities and from 0.605 (low) to 2.745 (high) across neighbourhoods.
Figure 3 presents the Principal Coordinate Analysis (PCO) performed using the variables significant in the multilevel regression for preparedness at the municipal and neighbourhood levels. The biplots include vectors indicating the direction and relative contribution of the significant variables.
At the municipal level, the first and second PCO axes explain 62.8 % and 31.3 %, respectively, accounting for 94.1 % of the data's variability. The biplot shows that three variables capture preparedness: Knowledge of flooding areas, socioeconomic group, and municipal common fund dependency. Figure 3a shows that the municipalities are grouped into three groups. Hualqui and Arauco group together, showing similar characteristics of preparedness. Both municipalities align with knowledge of flooding areas and municipal common fund dependency, indicating that preparedness in these municipalities is mainly associated with a greater understanding of the municipality's flood-prone areas and its economic dependence on the municipal common fund.
At the neighbourhood level (Fig. 3b), the PCO shows that both axes capture 33.2 % and 27.0 % of the total preparedness variation, explaining 60.2 % of the data variability. Six variables characterise the preparedness of the neighbourhoods: Knowledge of flooding areas, time living in the neighbourhood, housing quality, socioeconomic group, low socioeconomic portion and municipal common fund dependency. The neighbourhoods are grouped into three groups. Group 1 consists of neighbourhoods from Hualqui and Arauco, and one from San Fernando. Preparedness in these neighbourhoods is mainly related to knowledge of flood-prone areas and to dependence on the municipal common fund. Their proximity to the vector's socioeconomic group and low socioeconomic portion indicates that preparedness in this group is also structured by socioeconomic factors. Group 2 includes only neighbourhoods from San Pedro de Atacama. This group is primarily determined by socioeconomic status, demonstrating that preparedness in the neighbourhoods of San Pedro de Atacama depends mainly on their socioeconomic condition. Group 3 comprises neighbourhoods in San Fernando and is mainly characterised by housing quality and the length of time residents have lived in their neighbourhoods. This indicates that preparedness in these neighbourhoods is due to better housing quality and longer residence time.
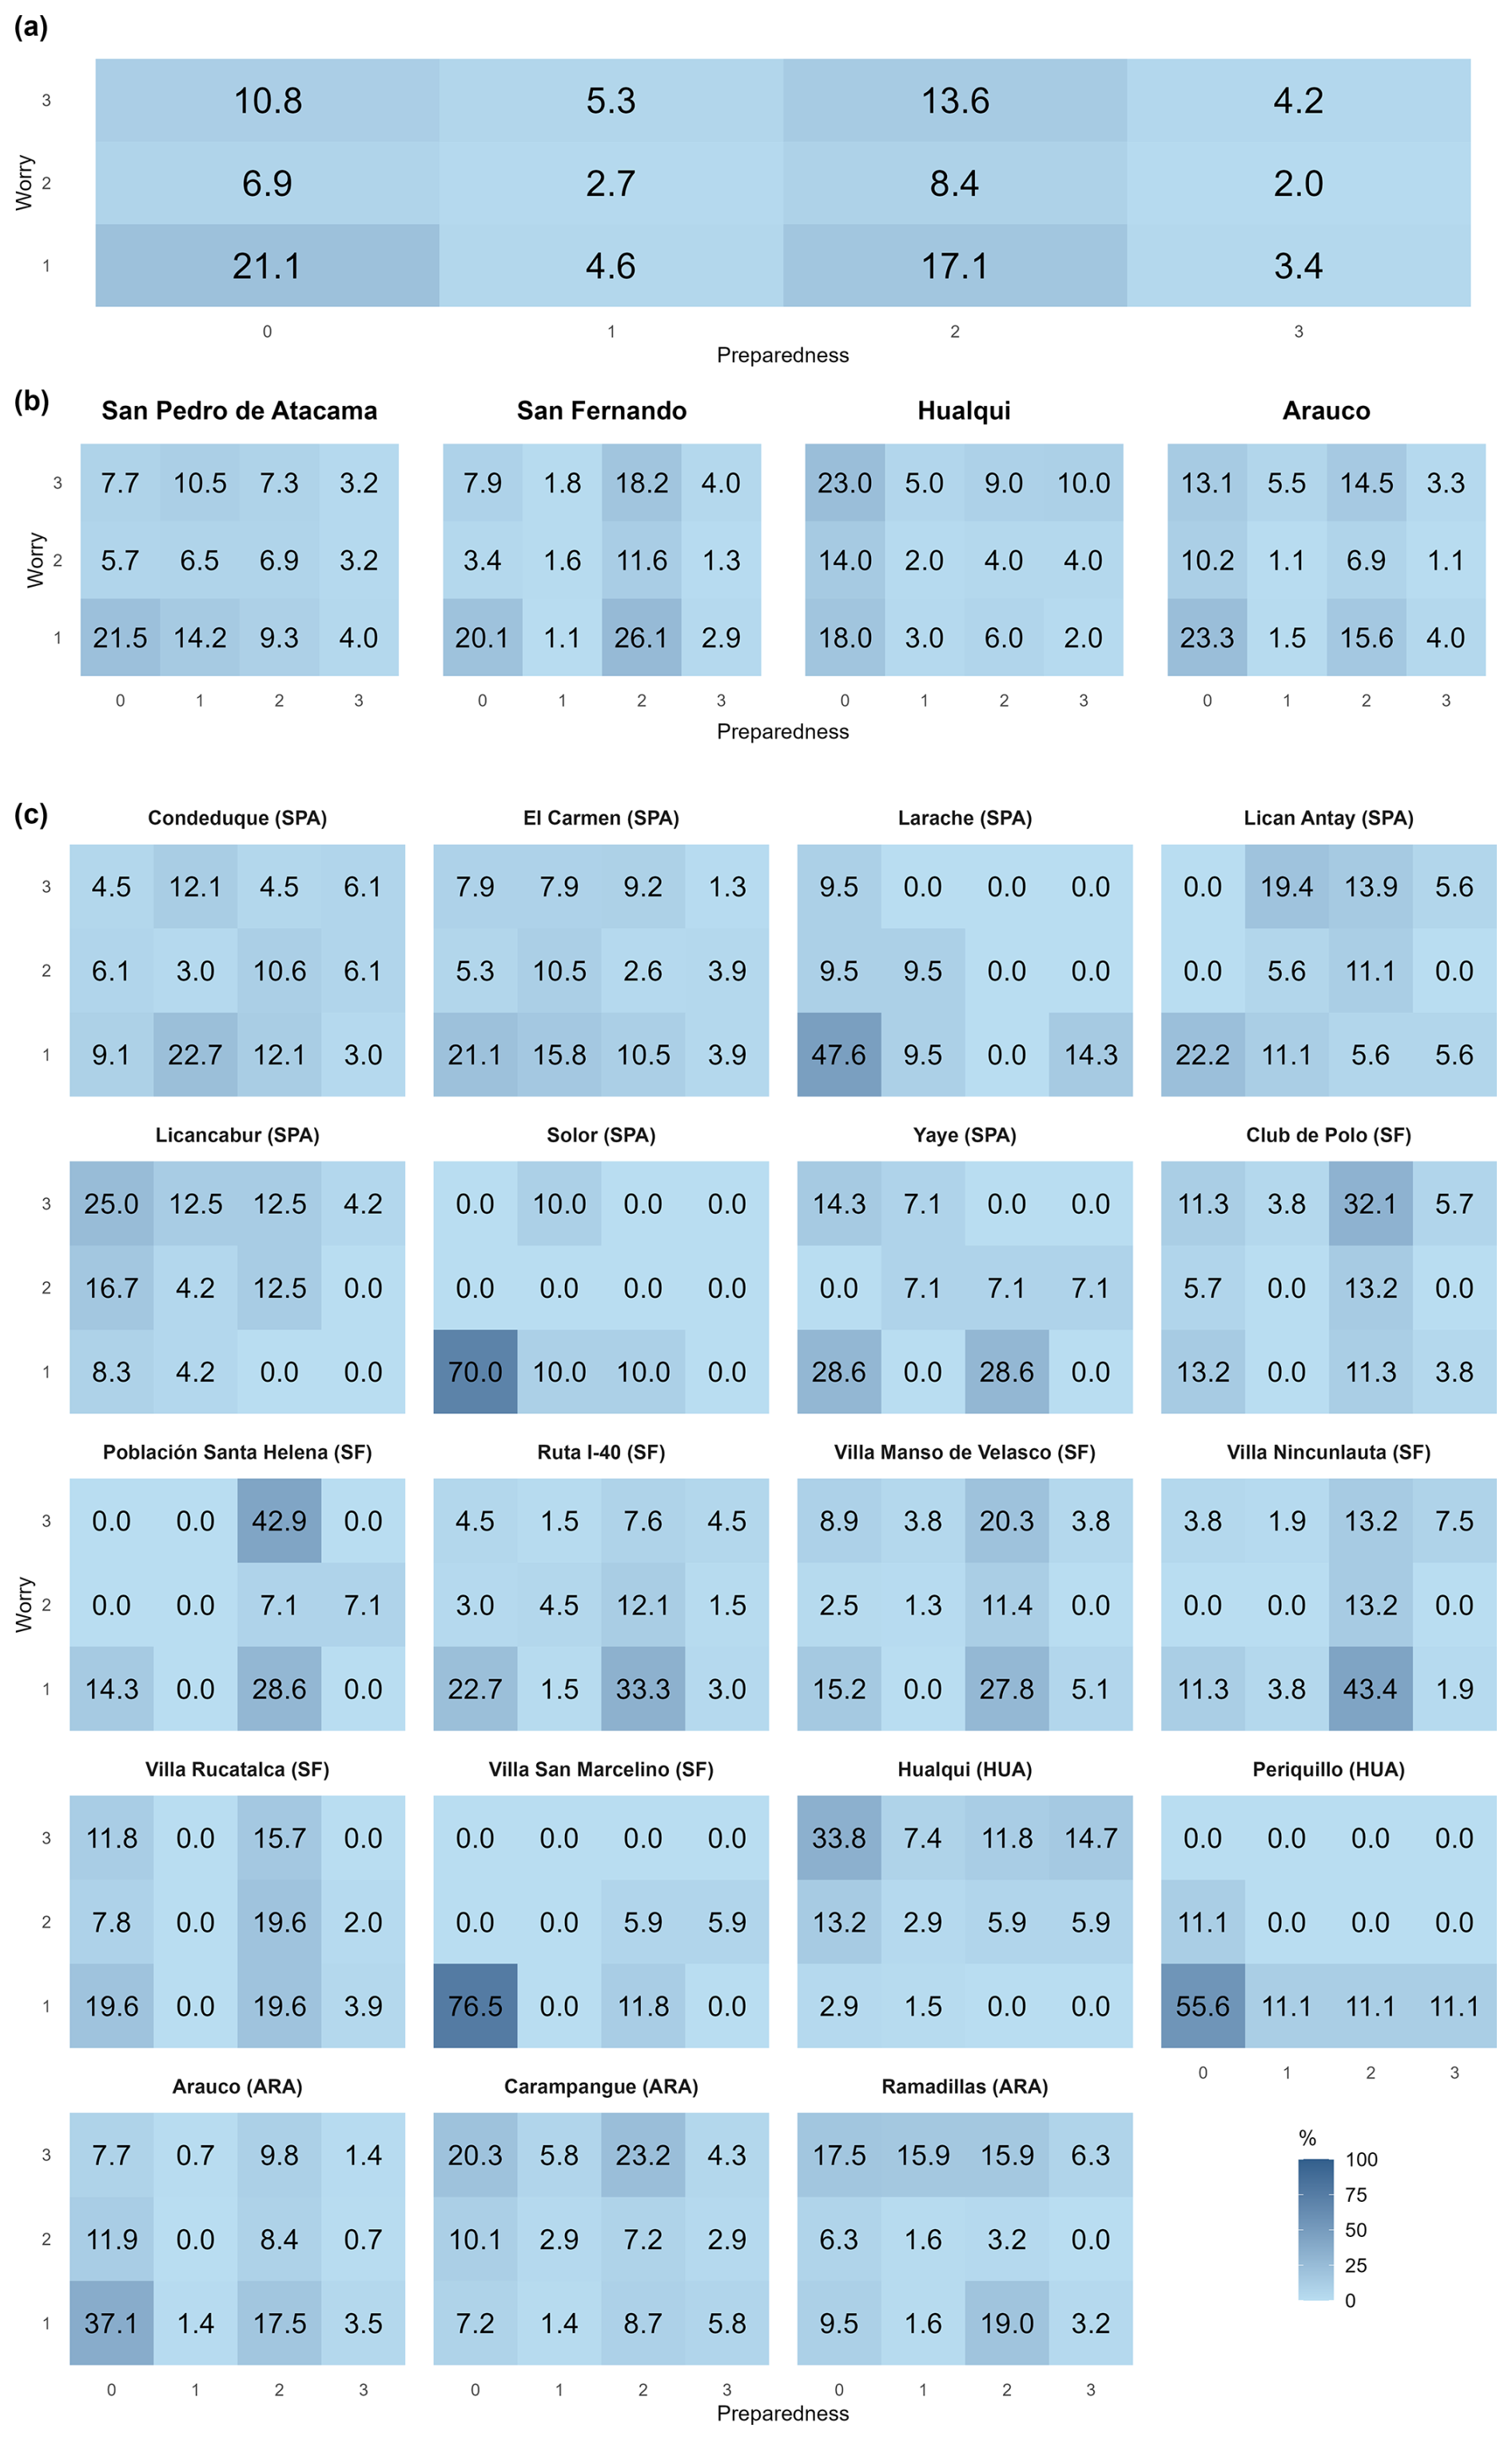
Figure 4Heatmaps derived from contingency tables between worry and preparedness, visualising the cross-frequency of the different preparedness (0–3) and worry (1–3) levels for (a) the whole study area, (b) the municipalities, and (c) the neighbourhoods. The cross-frequency can vary from 0 % to 100 %. A darker colour corresponds to a higher cross-frequency.
3.3 Correlation between worry and preparedness
Figure 4 shows the heatmaps, derived from contingency tables between worry and preparedness, which visualise the cross-frequency of both variables for the total sample, and at the municipality and neighbourhood levels. Table 8 presents the results of the Spearman coefficient analysis and Pearson's χ2 test.
Table 8Correlation and independence test of worry and preparedness at different levels.
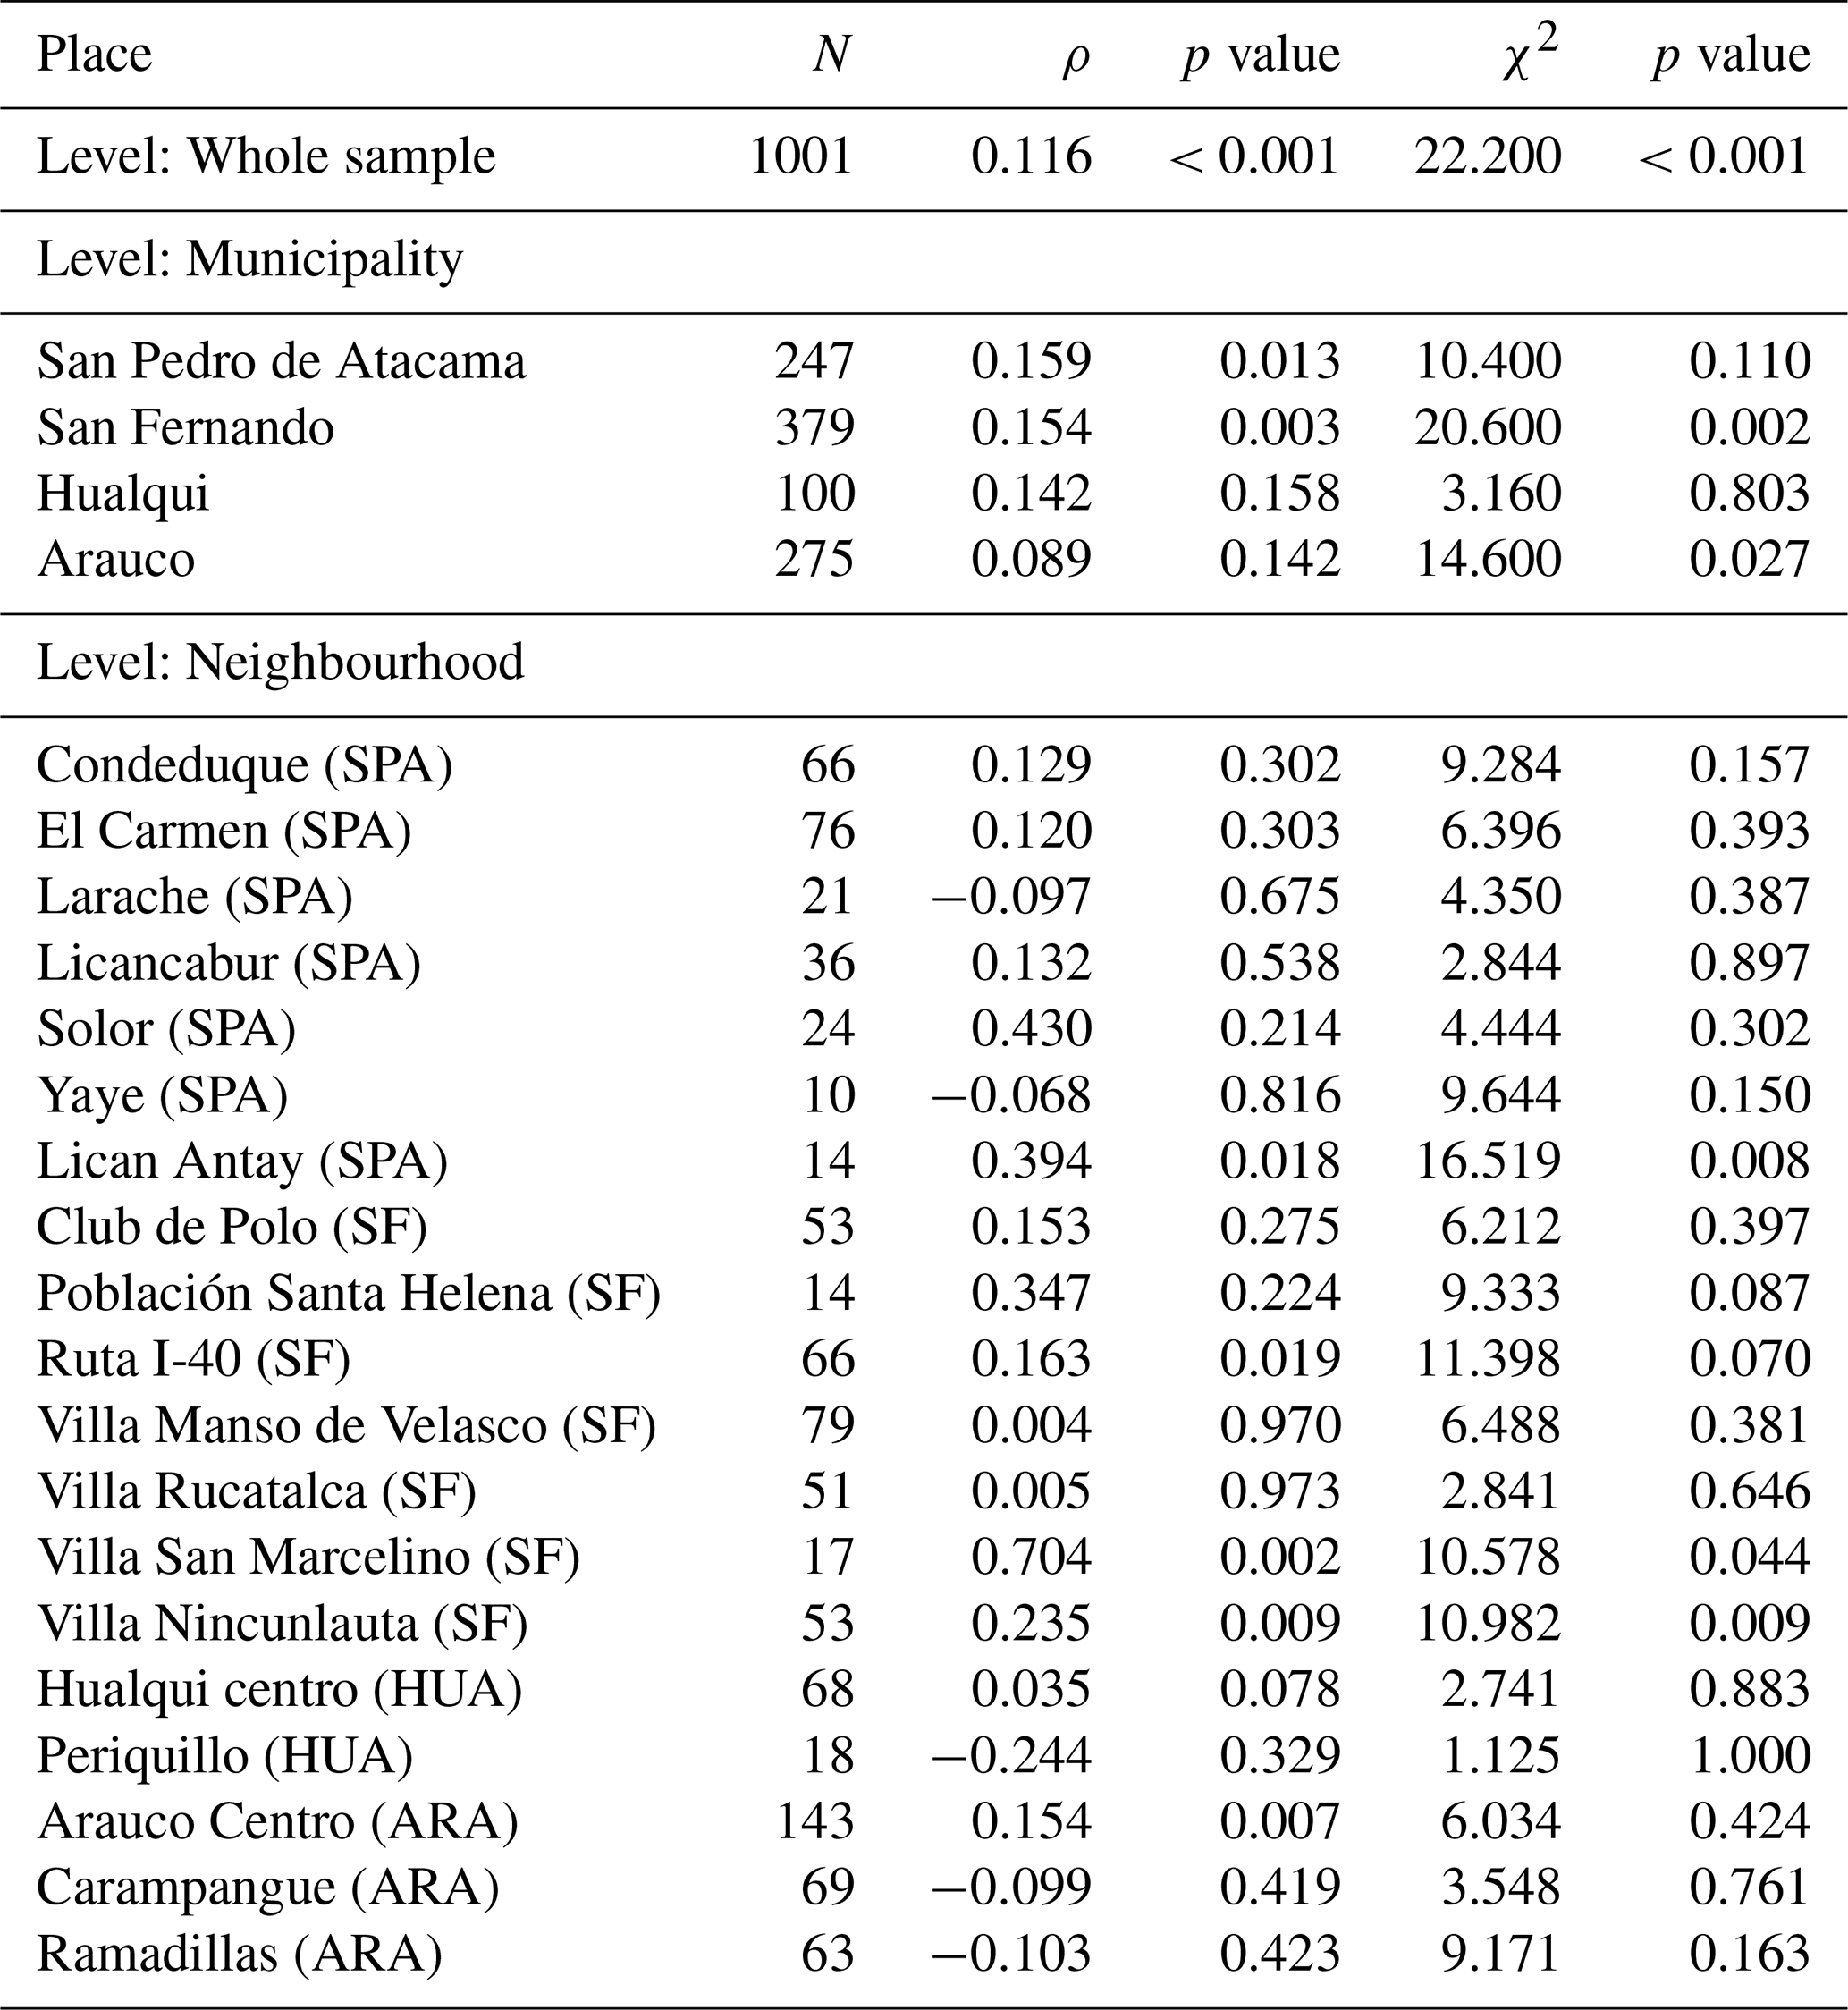
In the whole sample, the highest frequencies are concentrated in the combinations of low worry with non-preparedness and medium-high worry with medium-high preparedness, indicating that preparedness increases with worry. However, mixed results are observed at the municipality level, without consistent patterns to conclude meaningful correlations between worry and preparedness. Moreover, the relationship between worry and preparedness was analysed in only 19 of the 27 neighbourhoods, as the remaining eight lacked sufficient variation in responses or had very few cases. Most neighbourhoods of San Pedro de Atacama showed weak, non-significant correlations between worry and preparedness, except for Lican Antay, which showed a statistically significant positive relationship: preparedness increased with worry. In San Fernando, Villa San Marcelino is the only neighbourhood with a statistically significant, strong positive correlation, indicating an increase in preparedness with worry. However. The sample size in this neighbourhood is small, which warrants cautious interpretation. Villa Nincunlauta stands out for having a high proportion of respondents with medium preparedness who are not worried. This pattern may reflect prior flood experience, leading to the adoption of precautionary measures without a corresponding increase in perceived risk or concern. In Hualqui and Arauco, neighbourhoods showed weak and non-significant correlations between worry and preparedness, with no cases reaching statistical significance.
3.4 Flood behaviour
The review of news reports between 2000 and 2025 revealed that San Pedro de Atacama experienced seven significant flood events, in years 2001, 2012, 2013, 2015, 2017, 2019, and 2023; San Fernando experienced four major flood events in years 2000, 2006, 2015, and 2023; Hualqui experienced five floods in years 2001, 2003, 2006, 2023, and 2024, and Arauco experienced eight flood events in years 2001 (twice), 2003, 2006, 2008, 2019, 2023, and 2024. Table 9 summarises the flood events recorded for each municipality, including the frequency of damaging flood events (floods per year) and the corresponding mean recurrence interval (years). In this context, recurrence refers to the occurrence of significant floods that caused observable impacts, as identified through news and media reports.
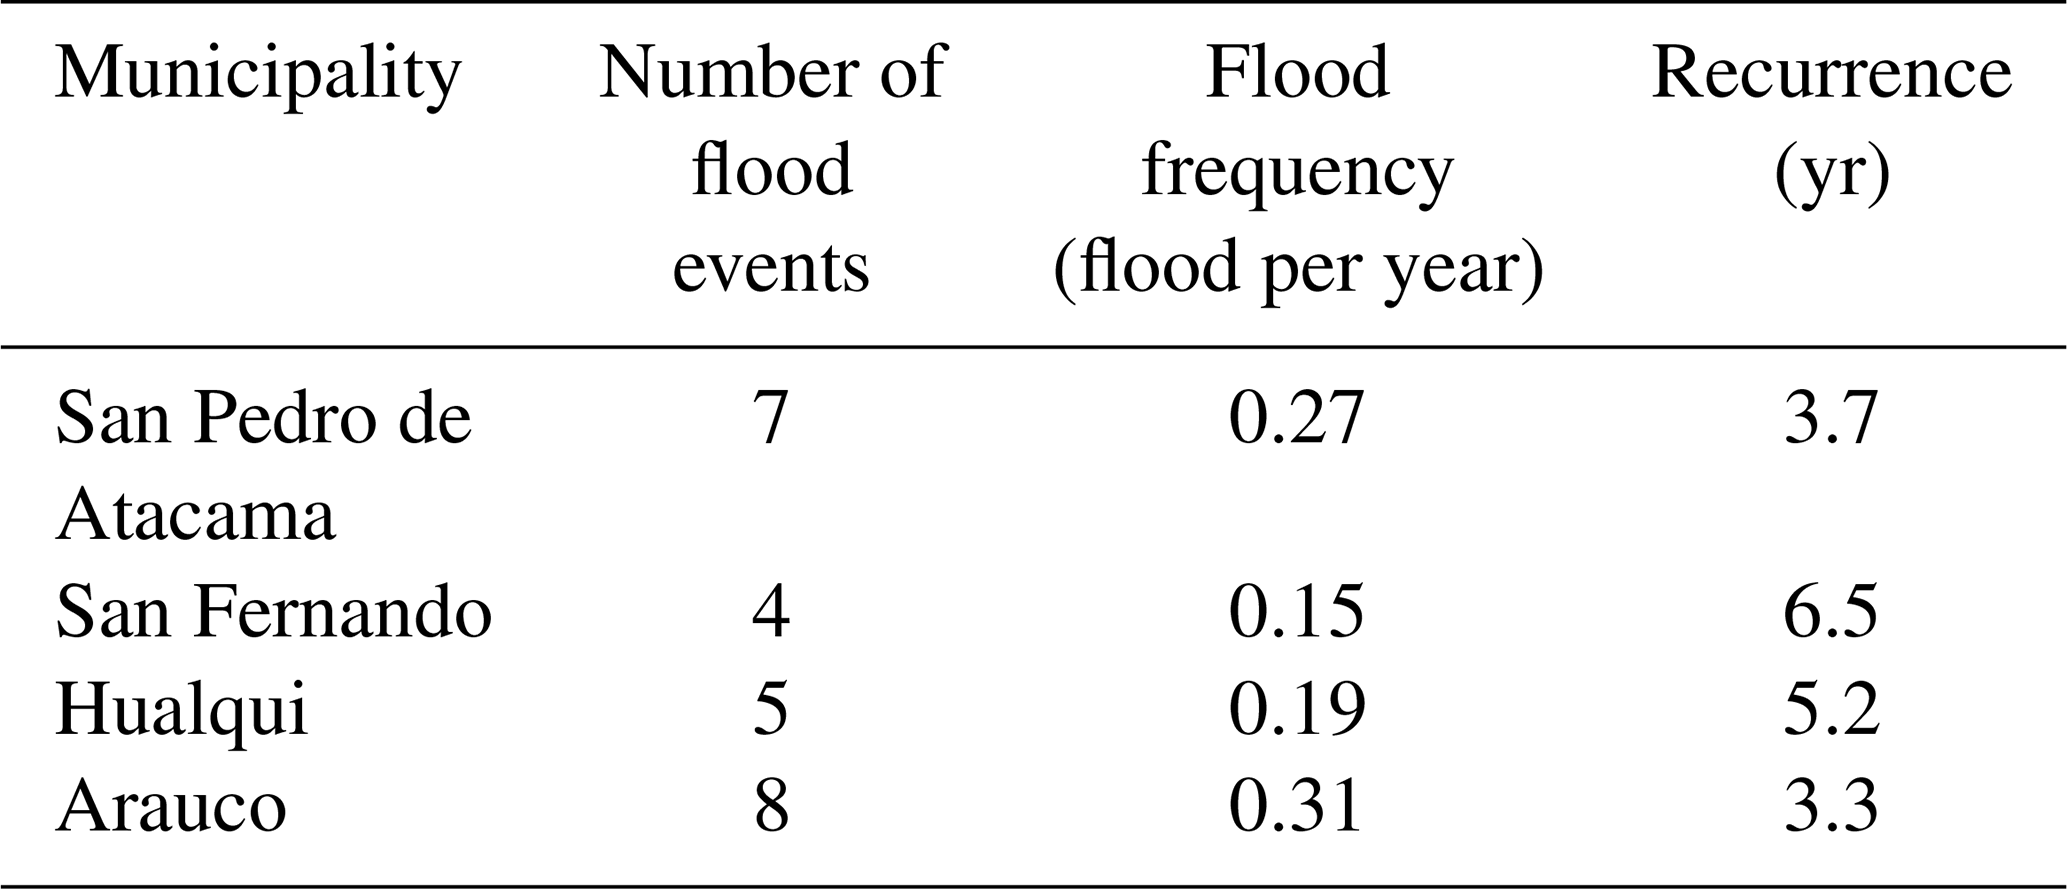
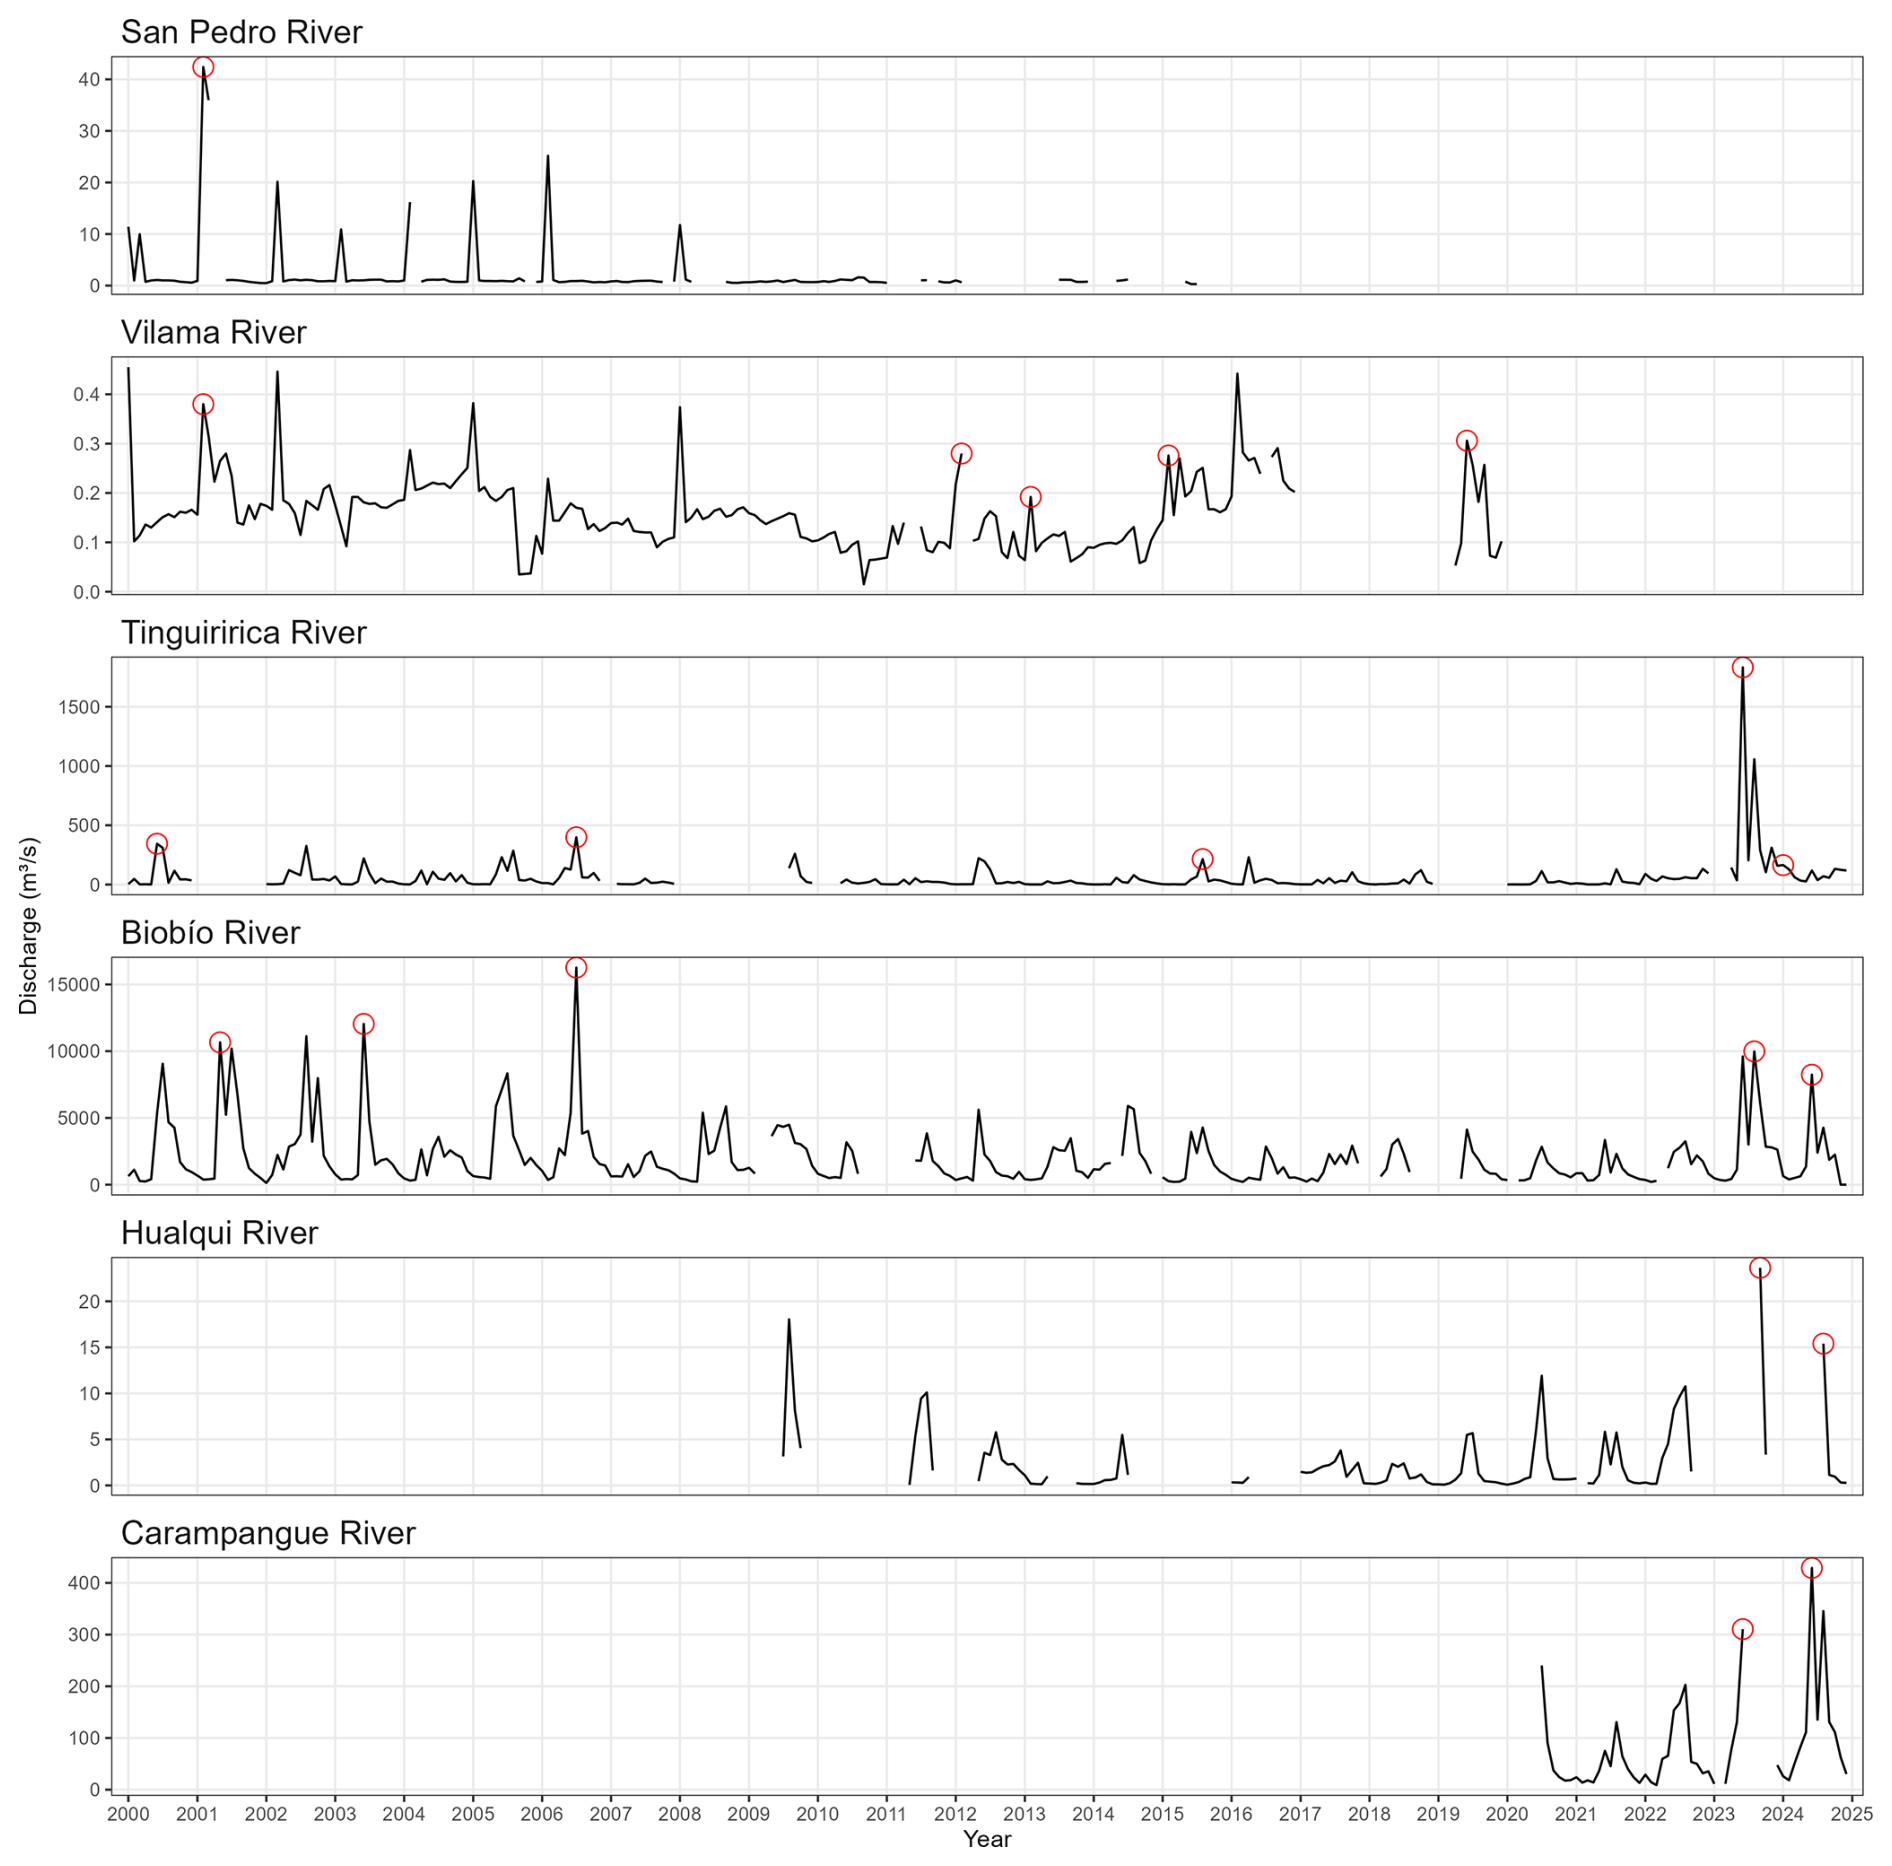
Figure 5Maximum instantaneous discharge recorded each month between years 2000 and 2025 measured at gauge stations San Pedro@San Pedro de Atacama, Vilama@San Pedro de Atacama, Tinguiririca@San Fernando, Biobío@Hualqui, Hualqui@Hualqui, and Carampangue@Arauco. Red circles highlight events reported in the news and social media as damaging floods.
Figure 5 shows the maximum instantaneous discharges for each month between years 2000 and 2025 measured at gauge stations in rivers San Pedro@San Pedro de Atacama, Vilama@San Pedro de Atacama, Tinguiririca@San Fernando, Biobío@Hualqui, Hualqui@Hualqui, and Carampangue@Arauco. Red circles indicate the maximum discharge in the years when floods were reported in the news. Not all discharge peaks were highlighted, as only those corresponding to flood events reported in the news were considered. Some high-discharge events did not result in reported flooding, while some reported flood events may be associated with floods caused by adjacent river systems or by surface runoff from intense rainfall. Due to limitations in the available hydrological records, which contain gaps and do not allow for a consistent frequency analysis of extreme discharges across all municipalities, flood magnitude was not explicitly modelled as a continuous variable. Instead, flood events were classified based on their reported impacts, distinguishing between damaging floods identified through national and regional news sources and less significant events without reported damage. This approach captures the occurrence of relevant flood events affecting communities while maintaining consistency across the study areas. The identified events were cross-checked with available discharge records (Fig. 5) to verify consistency between reported impacts and hydrological observations.
Even when the discharge series has significant data gaps, very good consistency between the measured maximum discharges and the reported floods in the news is observed. The preparedness varied across localities and neighbourhoods, as revealed by the clusters in Fig. 3. Table 10 presents the average predicted preparedness level for each municipality, estimated by the multi-level ordinal regression model. The outcome variable is measured on an ordinal scale from 0 (non-preparedness) to 3 (high preparedness).
Table 10Level of preparedness per municipality, computed using the multilevel regression model.
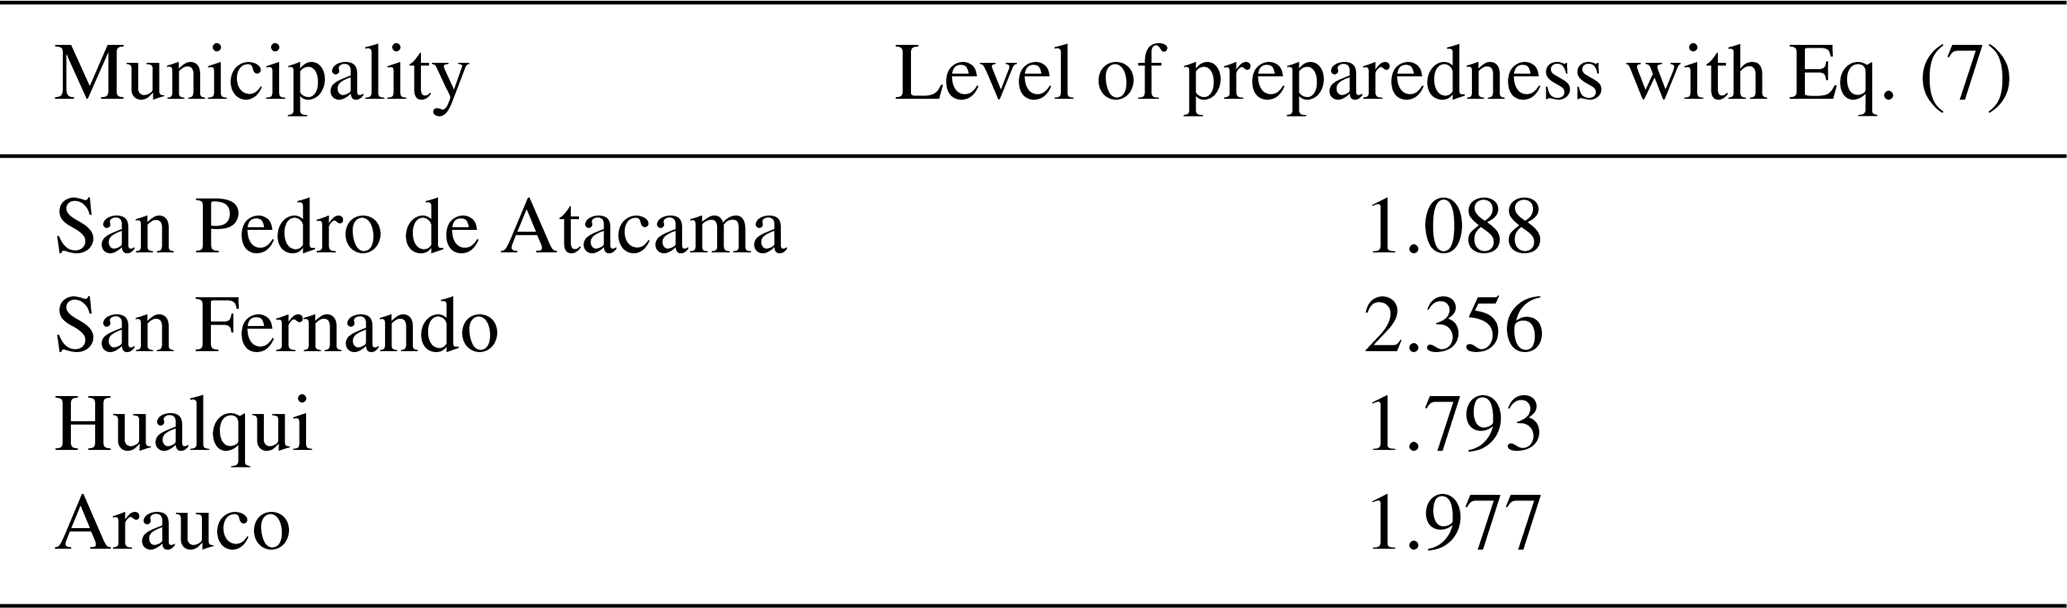
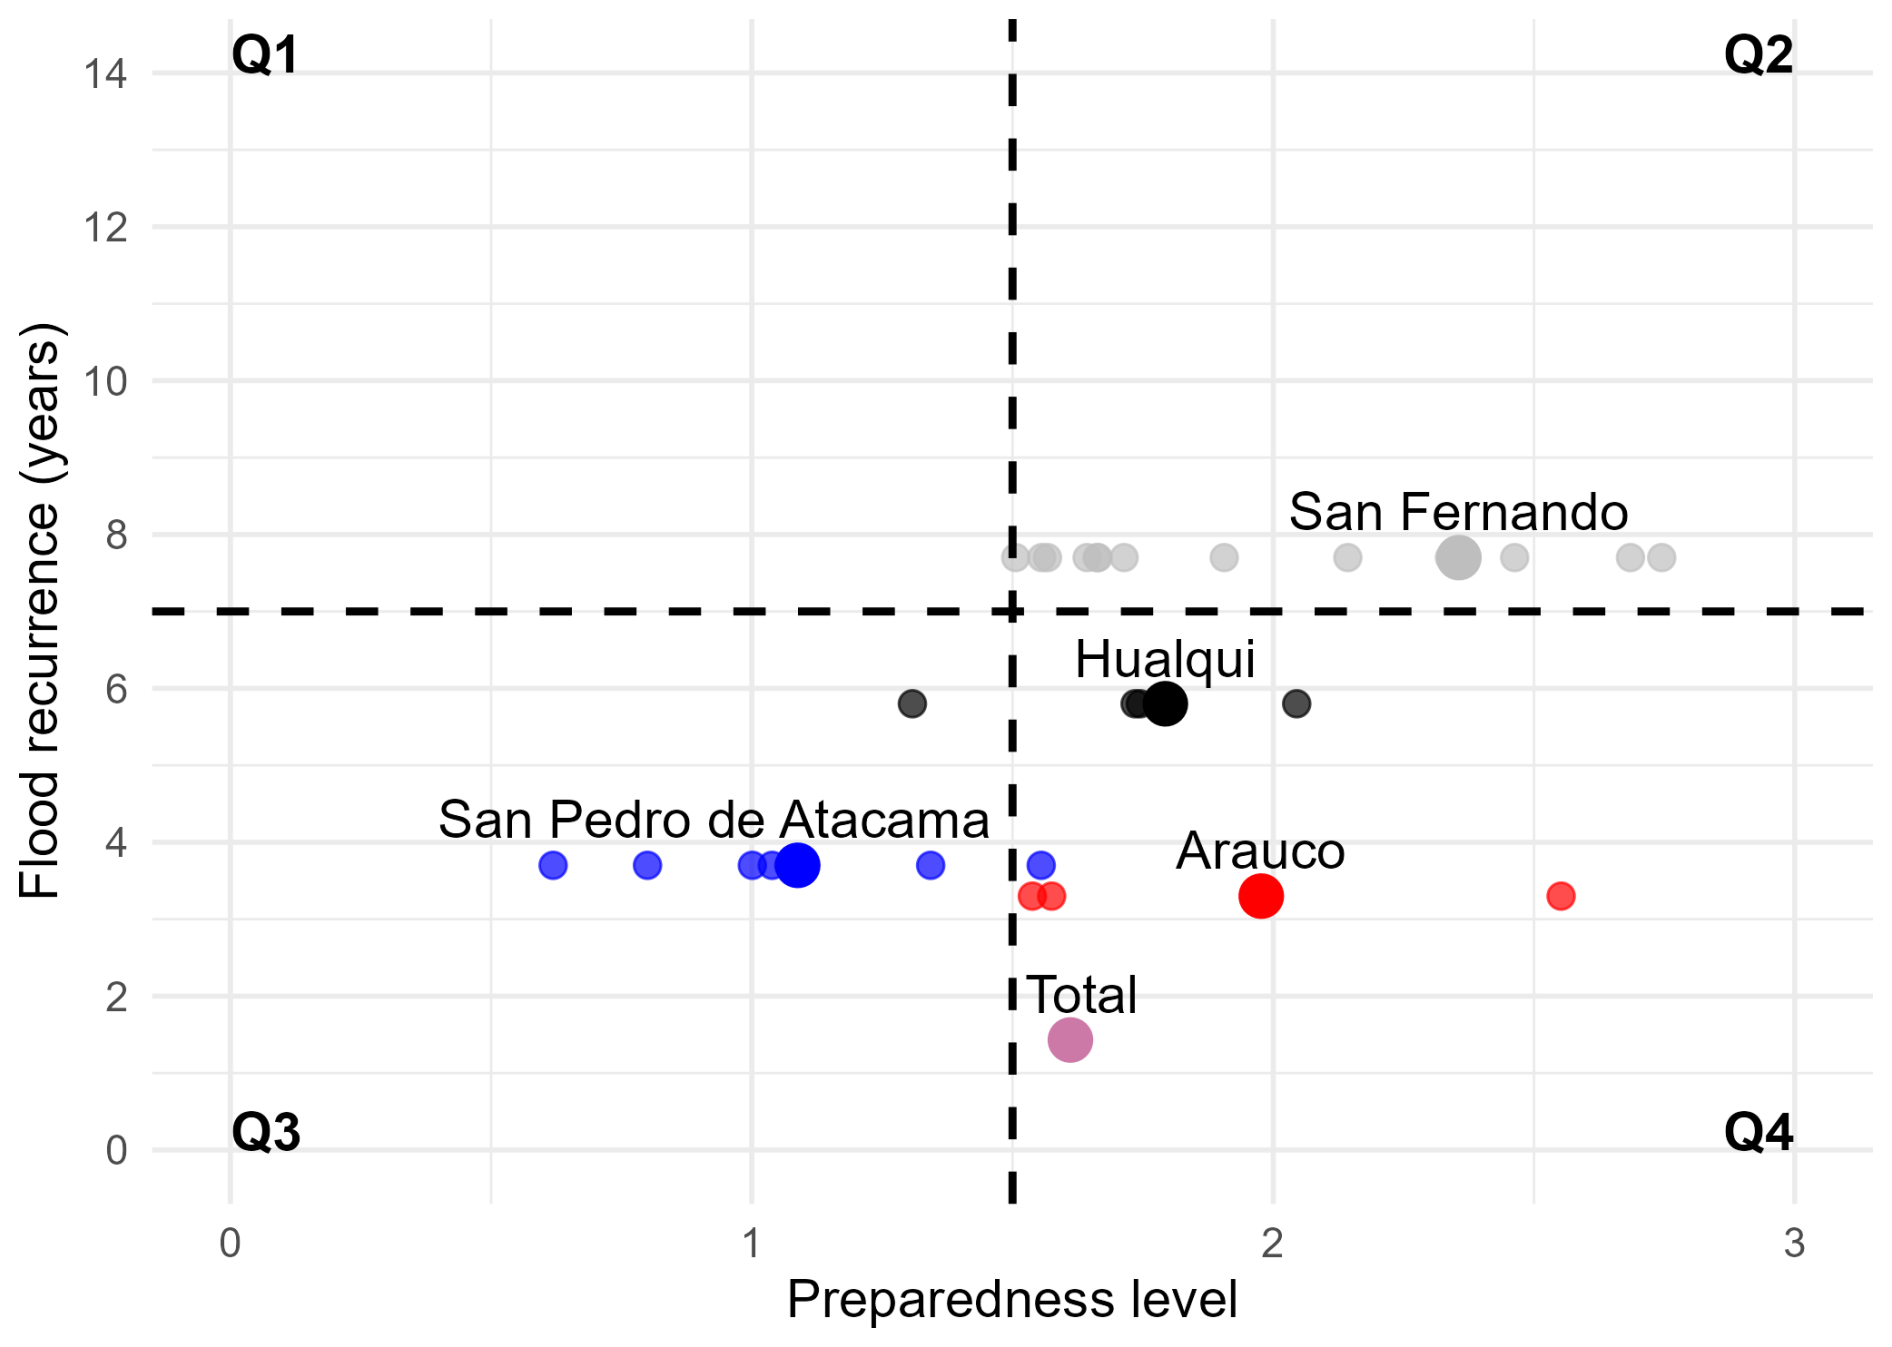
Figure 6Flood behaviour according to flood recurrence and preparedness level, adapted from Leong (2018). The flood behaviours are Q1: forgetting effect; Q2: proactive effect; Q3: status quo effect; and Q4: learning effect. Big dots correspond to municipalities. Small dots correspond to neighbourhoods. Purple dot represents the study area; red is for Arauco, blue is for San Pedro de Atacama, black is for Hualqui, and grey is for San Fernando.
San Fernando exhibits the highest level of preparedness, followed by Arauco, Hualqui and San Pedro de Atacama. Obtained results on flood recurrence and preparedness allow a quantitative classification of flood behaviour across municipalities and neighbourhoods.
Figure 9 presents flood behaviour according to flood recurrence and preparedness within the framework proposed by Leong (2018). To operationalise the temporal dimension of flood experience, a threshold of 7 years was adopted as the time required for communities to “forget” a flood event. This assumption is supported by previous studies indicating that flood risk perception tends to decrease several years after an event (Lechowska, 2018). In particular, evidence compiled by the International Commission for the Protection of the Rhine suggests that risk awareness declines approximately seven years after flooding, while the influence of past experiences on preparedness behaviours weakens over time (Egli and Wehner, 2002). Similarly, Barendrecht et al. (2019) adopted a range of 7 to 10 years to represent the decay of risk awareness, referring to this process as flood memory loss or forgetfulness.
Overall, the studied area exhibited an intermediate preparedness level, with a high flood recurrence and, consequently, a learning effect. At the municipality level, Hualqui and Arauco are grouped as municipalities exhibiting a learning effect. Interestingly, Hualqui and Arauco share similarities in terms of municipal size and socioeconomic level, which differ from those of the other localities studied. San Pedro de Atacama presented a status quo effect. San Fernando has a proactive effect. Even when there are insufficient data to evaluate flooding recurrence at lower scales, i.e., neighbourhoods and households, the flood behaviour across neighbourhoods was evaluated assuming that a neighbourhood's flood recurrence is the same as that of the corresponding municipality. Interestingly, two neighbourhoods: Solor at San Pedro de Atacama and Hualqui centre exhibited a flood behaviour different to that of the corresponding municipality.
4.1 Variables and dimensions explaining flood risk perception
In the present study, people were assumed to be aware of flood risk, as almost all respondents live close to the river, declared they knew the flooding areas, or had experienced flooding outside their home. In this context, “close to the river” refers to households located within 750 m of the main river prone to overflow. This distance was used as a proxy for exposure and visibility of the hazard, as proximity to rivers has been associated with increased awareness due to greater hazard visibility (Gray-Scholz et al., 2019; Ali et al., 2022). Moreover, knowledge of flood-prone areas is widely accepted as a direct indicator of awareness (Mondino et al., 2020; Bradford et al., 2012). Households located closer to the river are therefore assumed to have greater exposure to flood dynamics and a higher likelihood of awareness. In addition, previous experience with flooding, either through direct impacts on the household or through observing flooding in the surrounding area, further reinforces awareness, as even in the absence of direct damage, exposure to flood events in the neighbourhood has been shown to increase risk perception (Bradford et al., 2012). Our results show that economic and personal resources strongly influence worry and preparedness: households in better economic situations are less worried about floods, while households with limited economic resources at the municipal and neighbourhood levels are more cautious. At the individual (household) level, higher socioeconomic status is positively associated with preparedness, likely reflecting greater access to financial and material resources that enable the implementation of more permanent and effective measures. In contrast, at the neighbourhood level, areas characterised by lower socioeconomic conditions show higher levels of preparedness. This pattern may be explained by greater exposure to flood risk and more frequent flood experience, which can promote collective adaptation practices and increase overall preparedness among residents. The difference between individual- and neighbourhood-level results highlights the importance of the multilevel structure of the analysis, where preparedness reflects both individual capacity and contextual exposure. This finding aligns with Bronfman et al. (2019), who link socioeconomic advantage to increased resources and perceived control, and with Działek et al. (2019), who showed that low-income groups may express higher worry but lower preparedness due to structural constraints. Similarly, Takao et al. (2004) and Shah et al. (2017) found that poor housing conditions can increase both perceived risk and urgency to act.
Knowledge of flooding areas decreased worry and increased preparedness, in line with previous findings by Scolobig et al. (2012), Ashenefe et al. (2017), Cao et al. (2020), and Veloso et al. (2022). However, experiences in which the flood passed outside the household increased both worry and preparedness, suggesting that, as with awareness, worry is linked to experiencing flooding in the neighbourhood or seeing others affected.
Higher trust in neighbours was associated with lower levels of worry, in line with Scolobig et al. (2012) and Kerstholt et al. (2017), who suggest that stronger social trust or neighbourhood networks may reduce risk perception, possibly because individuals feel they can rely on their community in the event of a flood.
Older individuals reported both higher preparedness and lower worry. Prior studies offer mixed findings: while some associate older age with vulnerability, others link it to accumulated knowledge or more proactive behaviour (Shah et al., 2017; Bronfman et al., 2019). Similarly, extended residence in the same location has been associated with increased preparedness, possibly due to stronger place attachment or accumulated local knowledge (Poussin et al., 2014; Mavhura et al., 2022). A further possibility in our case concerns better housing for older people, as it was the case of San Fernando.
4.2 Correlation between worry and preparedness
Four variables partly explained worry and preparedness: knowledge of flooding areas, housing quality, flooding outside their home, and the neighbourhood's socioeconomic class. Contingency tables and ordinal correlation analysis showed that, in general, worry and preparedness are positively correlated. However, patterns were heterogeneous within municipalities, and in many cases, the distribution of responses across categories was balanced or dispersed, without a clear alignment between the two variables. Moreover, most neighbourhoods showed weak, non-significant correlations between worry and preparedness, suggesting that higher worry does not necessarily translate into greater preparedness at the neighbourhood level. This is in line with findings from Poussin et al. (2014), Cao et al. (2020), and Scolobig et al. (2012), who, although not measuring this correlation directly, emphasise that emotional and cognitive components such as worry, awareness, or perceived risk do not automatically lead to preparatory actions, and that previous experience may lead to preparedness without necessarily increasing levels of concern.
4.3 Flood behaviour
The classification of flood behaviours proposed by Leong (2018) allowed us to develop a quantitative assessment of the flood behaviour observed in the study area. A critical issue was determining the threshold to distinguish between small and large floods. Terpstra (2011) suggests that the positive influence of experiences on private mitigating behaviours may disappear several years after the flood. Lechowska (2018) found that, according to Egli and Wehner (2002), flood risk perception decreases 7 years after flooding, whereas catastrophic disasters are remembered much longer. Consequently, Barendrecht et al. (2019) assumed the half-time of awareness, i.e., the time after which awareness is halved, is 7 to 10 years after a flood. A threshold of 7 years was adopted in the present study to distinguish between “small” and “large” floods. Notably, floods in San Fernando have a recurrence of 7.7 years, and thus, this municipality could also fall beyond the threshold value. Overall, the studied area exhibited a learning effect with intermediate preparedness and high flood recurrence. At the municipal level, obtained flood behaviour for Arauco was consistent with findings by Veloso et al. (2022), who studied the relations between preparedness and psycho-social attributes of people and communities exposed to river floods in a nearly pristine socio-hydrological system, applying a hydrological and hydraulic analysis of flood risk in combination with results from a survey, social cartography, semistructured non-participant observation, and semi-structured interviews. The flood behaviour for San Pedro de Atacama was consistent with findings by Mendoza Leal et al. (2024), who conducted fieldwork to reconstruct a flood event, hydrological analysis and semistructured interviews with key informants to characterize people's responses to floods and showed evidence that the so-called status quo effect, i.e. when communities do not learn and adapt to prevent damage even when exposed to frequent floods was present at the riparian community scale. A possible reason for this behaviour is the particular convective storms that occur in Atacama (Alcayaga et al., 2025). San Fernando exhibited a proactive effect, which might be related to housing quality and time living in the neighbourhood. Two neighbourhoods -Solor at San Pedro de Atacama and Hualqui centre- exhibited characteristics different from those of the corresponding municipalities. The results clearly show an increase in dispersion as the level of analysis of flood behaviour is lowered. It is worth noting that Fig. 6 shows only images of the surveyed neighbourhoods in 2024. But flood risk perception changes after a flood experience, and thus, dynamic flood behaviours are expected at the different levels, which merits further investigation.
4.4 Improving preparedness against floods
The obtained results allowed us to identify which population groups and spatial units are most relevant for improving flood preparedness. As evidenced in Table 8 and Fig. 4, the correlation between worry and preparedness is not straightforward; however, in Fig. 6, three out of four possible flood behaviours proposed by Leong (2018) were identified in the study area as a function of preparedness and flood recurrency, namely the status quo, the learning, and the proactive effects. Dispersion in the observed behaviour increased as the level decreased. The variables controlling preparedness and flood behaviour in critical areas were related to knowledge of flood-prone areas and the economic resources available to implement measures to prevent flood damage.
This information suggests that the neighbourhood is the appropriate spatial scale at which preparedness should be promoted in the frame of risk management. Similarly, risk communication should focus on the neighbourhood level to inform residents of the precise flood-prone areas, especially in neighbourhoods exhibiting a status quo effect, such as those pertaining to San Pedro de Atacama. The aim should be to provide households with the necessary financial resources to improve precautionary measures, especially in neighbourhoods with low preparedness, such as those in San Pedro de Atacama, Arauco and Hualqui.
More broadly, these findings highlight that flood risk management strategies should be adapted to the specific characteristics of different neighbourhoods. For example, neighbourhoods exhibiting a status quo effect may benefit from improved risk communication and targeted institutional support to encourage the adoption of precautionary measures. In contrast, in areas exhibiting a proactive or learning effect, strategies should reinforce existing adaptive behaviours while emphasising the persistence of flood hazard. Overall, these results support the need for context-specific, multilevel approaches to flood risk management that target both individual capacities and collective dynamics within neighbourhoods.
A multi-level assessment of flood risk perception (worry and preparedness) and flood behaviour at the individual, household, neighbourhood, and municipality levels was proposed and applied to a survey of 1007 residents in four localities in Chile exposed to river floods.
Almost all respondents were aware of flood risk and attributed high importance to climate change as a contributing factor to flooding. Economic and personal resources strongly influenced worry and preparedness: households with better economic situations were less worried about floods, while households with limited economic resources at the municipal and neighbourhood levels were more likely to adopt cautionary measures. Experiences where the flood passed outside the household increased worry and preparedness. Worry decreased as trust in the neighbours increased. Overall, worry and preparedness in the study area were intermediate, with greater dispersion at lower levels.
The correlation patterns between worry and preparedness were heterogeneous, with no clear alignment between the two variables. In many cases, correlations were statistically non-significant, and thus, higher worry did not necessarily translate into higher preparedness.
Flood risk perception and flood behaviour were analysed in relation to past damaging floods reported in the news and on social media. Municipalities exhibited different flood behaviours, and flood behaviours in some neighbourhoods differed from those of the corresponding municipalities, evidencing important differences across the analysed levels. The obtained results suggest that flood risk perception and flood behaviour should be analysed at the neighbourhood level. Consequently, risk communication and risk management strategies should be tailored to the needs of specific neighbourhoods exposed to flooding. Future research could further examine the effects of flood magnitude on behavior.
Figures A1, A2, and A3 show the socio-economic characteristics, social networks, and flood experience characteristics for each municipality and for the whole sample.
Regarding respondent and household characteristics, the gender distribution was balanced across all localities. The proportion of individuals not living in the same residence was higher in San Pedro de Atacama and similar in Hualqui. San Pedro de Atacama also had the youngest respondents, while the other localities concentrated older populations.
The dominant occupation in all localities is paid work, with San Pedro de Atacama having the largest proportion. A similar proportion of dependent people was observed across all localities. San Fernando, Arauco, and Hualqui displayed similar distributions of socioeconomic groups, with lower-income groups predominating. In contrast, the middle-income groups predominate in San Pedro de Atacama.
The time living in the neighbourhood was highest in San Fernando and Arauco, while the largest proportion of recent arrivals was in San Pedro de Atacama. Housing quality was highest in San Fernando, intermediate in Hualqui and Arauco, and lowest in San Pedro de Atacama.
High levels of trust in neighbours were observed across all localities, and satisfaction with the municipality was also predominantly high, with the lowest level in Hualqui. In all localities, social ties were predominantly located in the municipality, but in another neighbourhood.
The predominant level of interaction between neighbours is medium in all cases, with slightly lower values for low interaction in San Pedro de Atacama and Arauco. Perceptions of neighbourhood closeness were predominantly high across all localities.
In San Pedro de Atacama, most respondents reported flooding outside their homes. Less than half of the people in San Fernando reported flooding outside their homes. Close to half of the people in Arauco and Hualqui experienced flooding outside their homes.
Knowledge of flooding areas is high across all municipalities, with levels above 78 % in every case. Low levels of worry are observed in San Pedro de Atacama and San Fernando, while medium to high levels are more prevalent in Hualqui and Arauco.
Preparedness varies considerably between localities. In San Pedro de Atacama, no preparedness and low preparedness predominates. In San Fernando, medium levels of preparedness prevail. In Hualqui and Arauco, a significant portion reports medium to high preparedness.
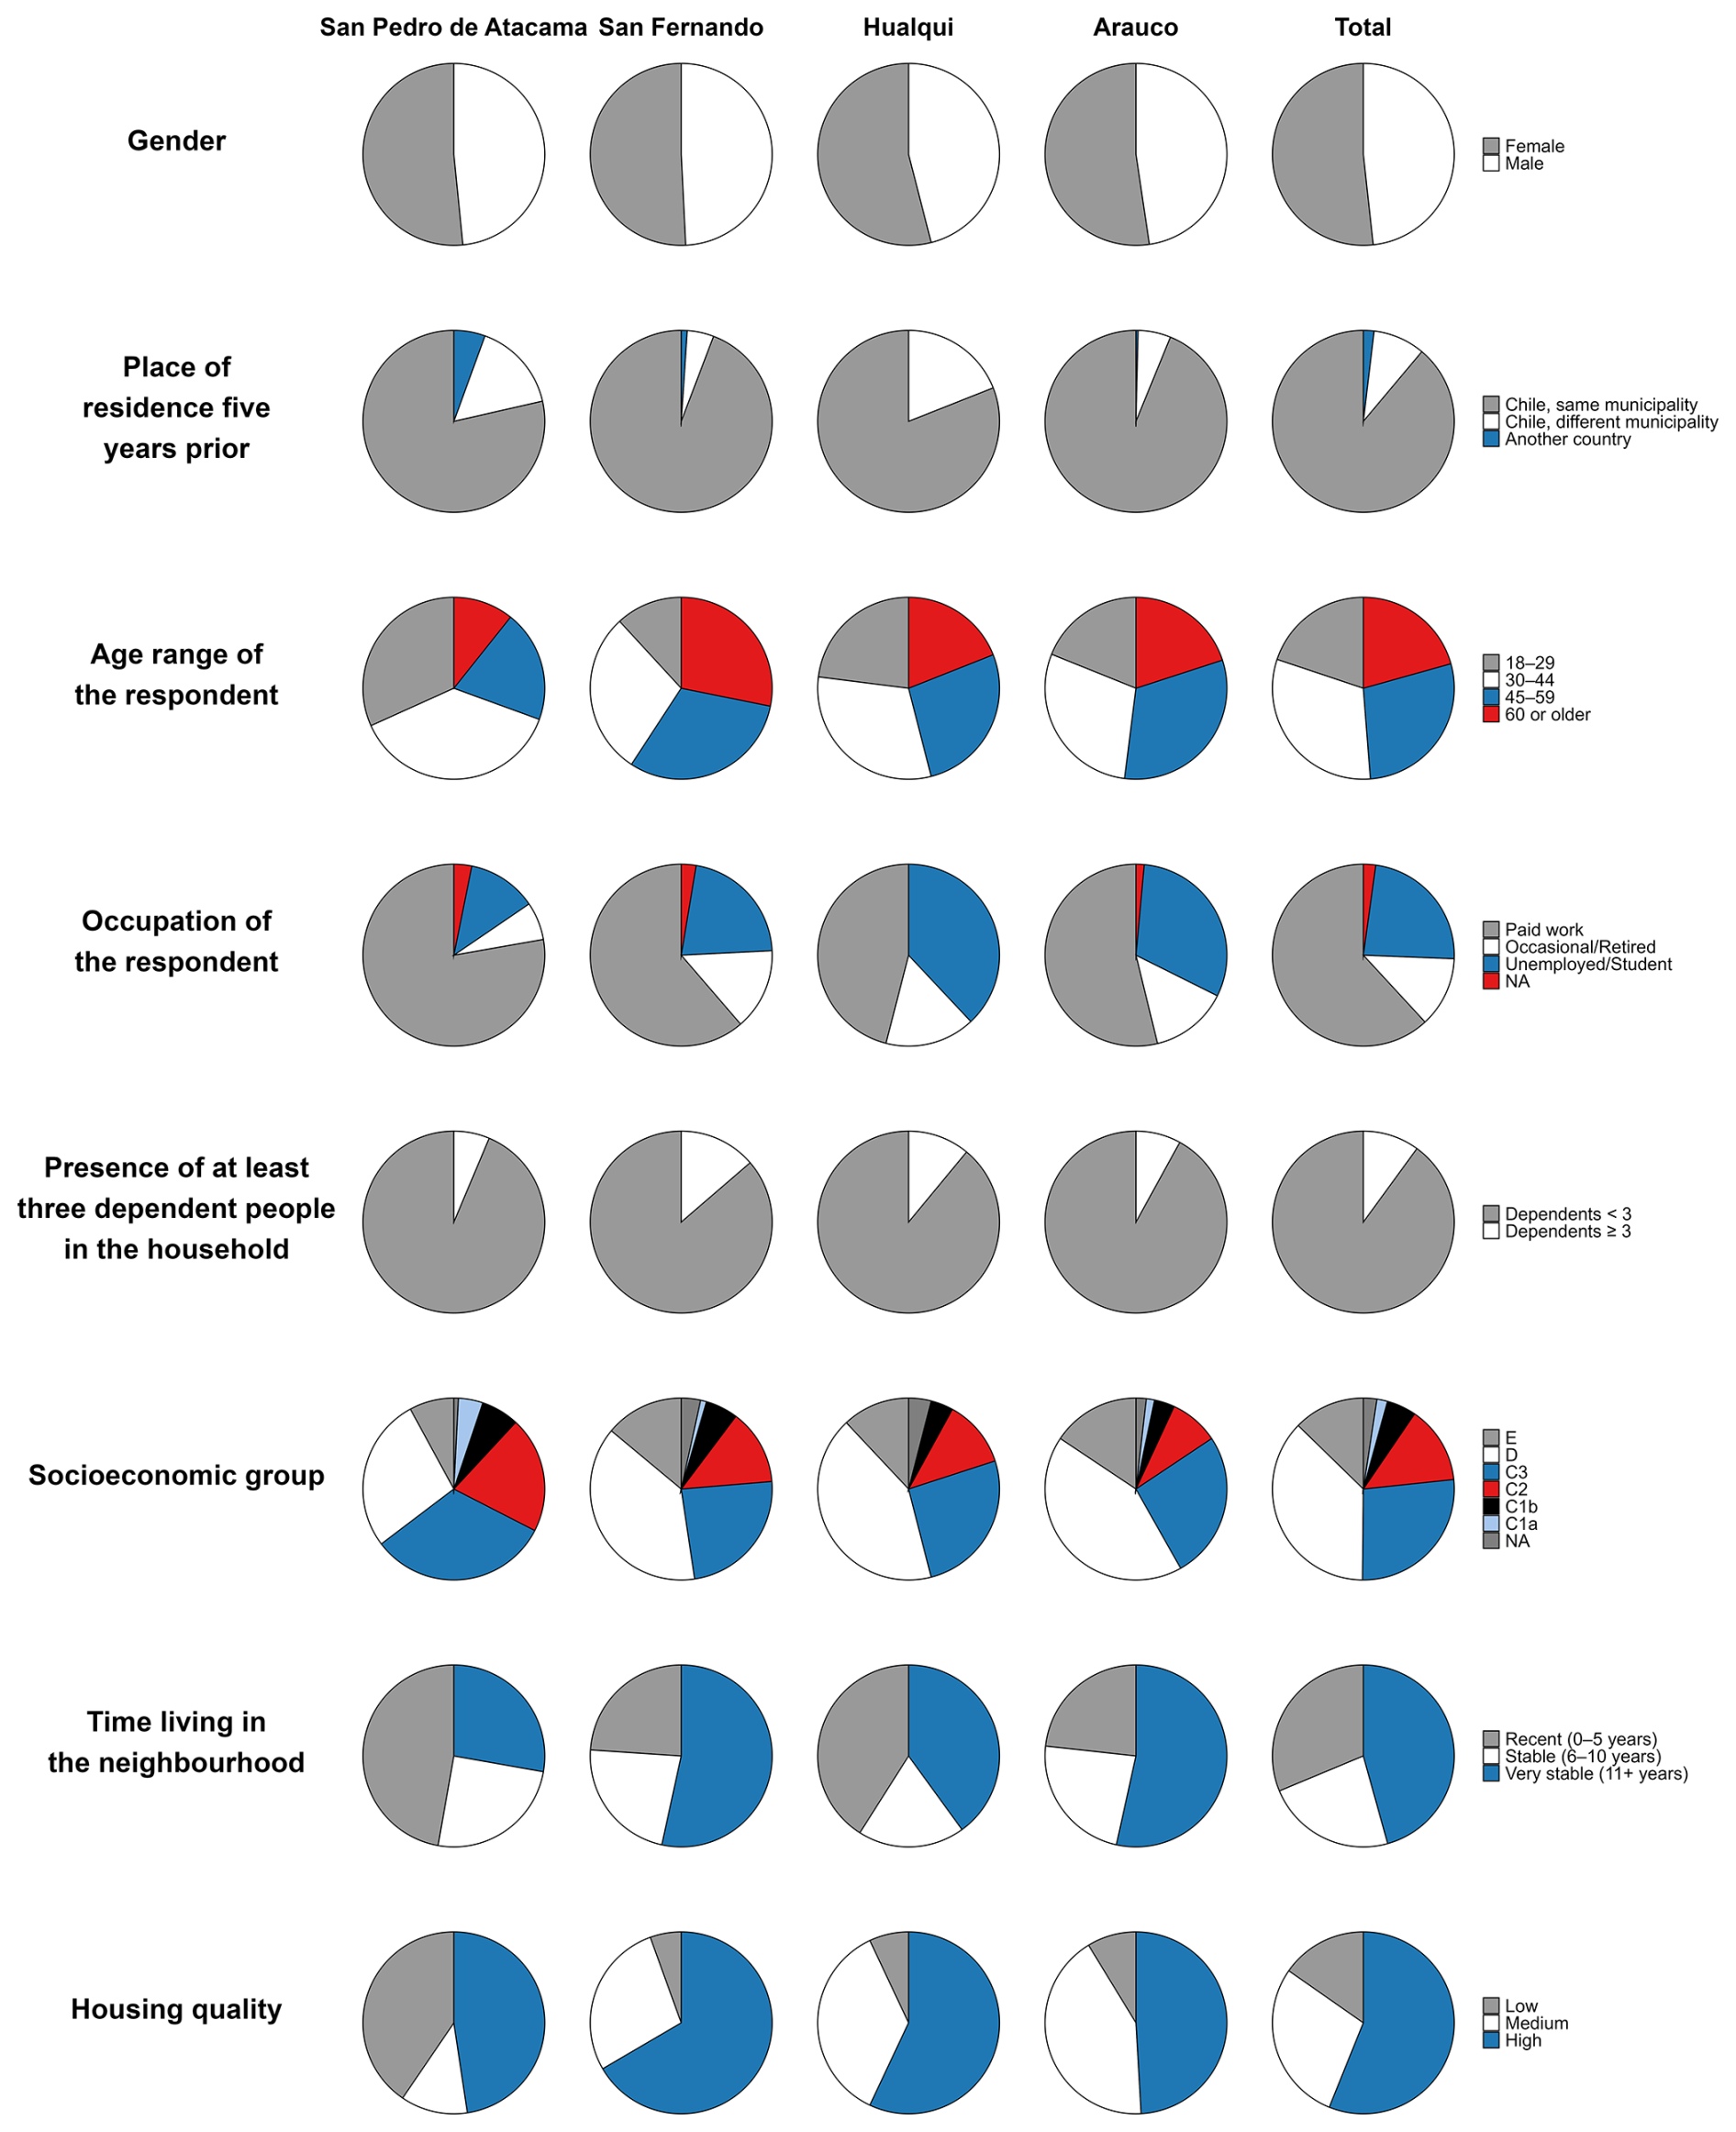
Figure A1Gender, place of residence five years prior, respondent age range, occupation, and the number of dependent people in the household, together with socioeconomic group, time living in the neighbourhood, and housing quality, for each municipality and for the whole study area.
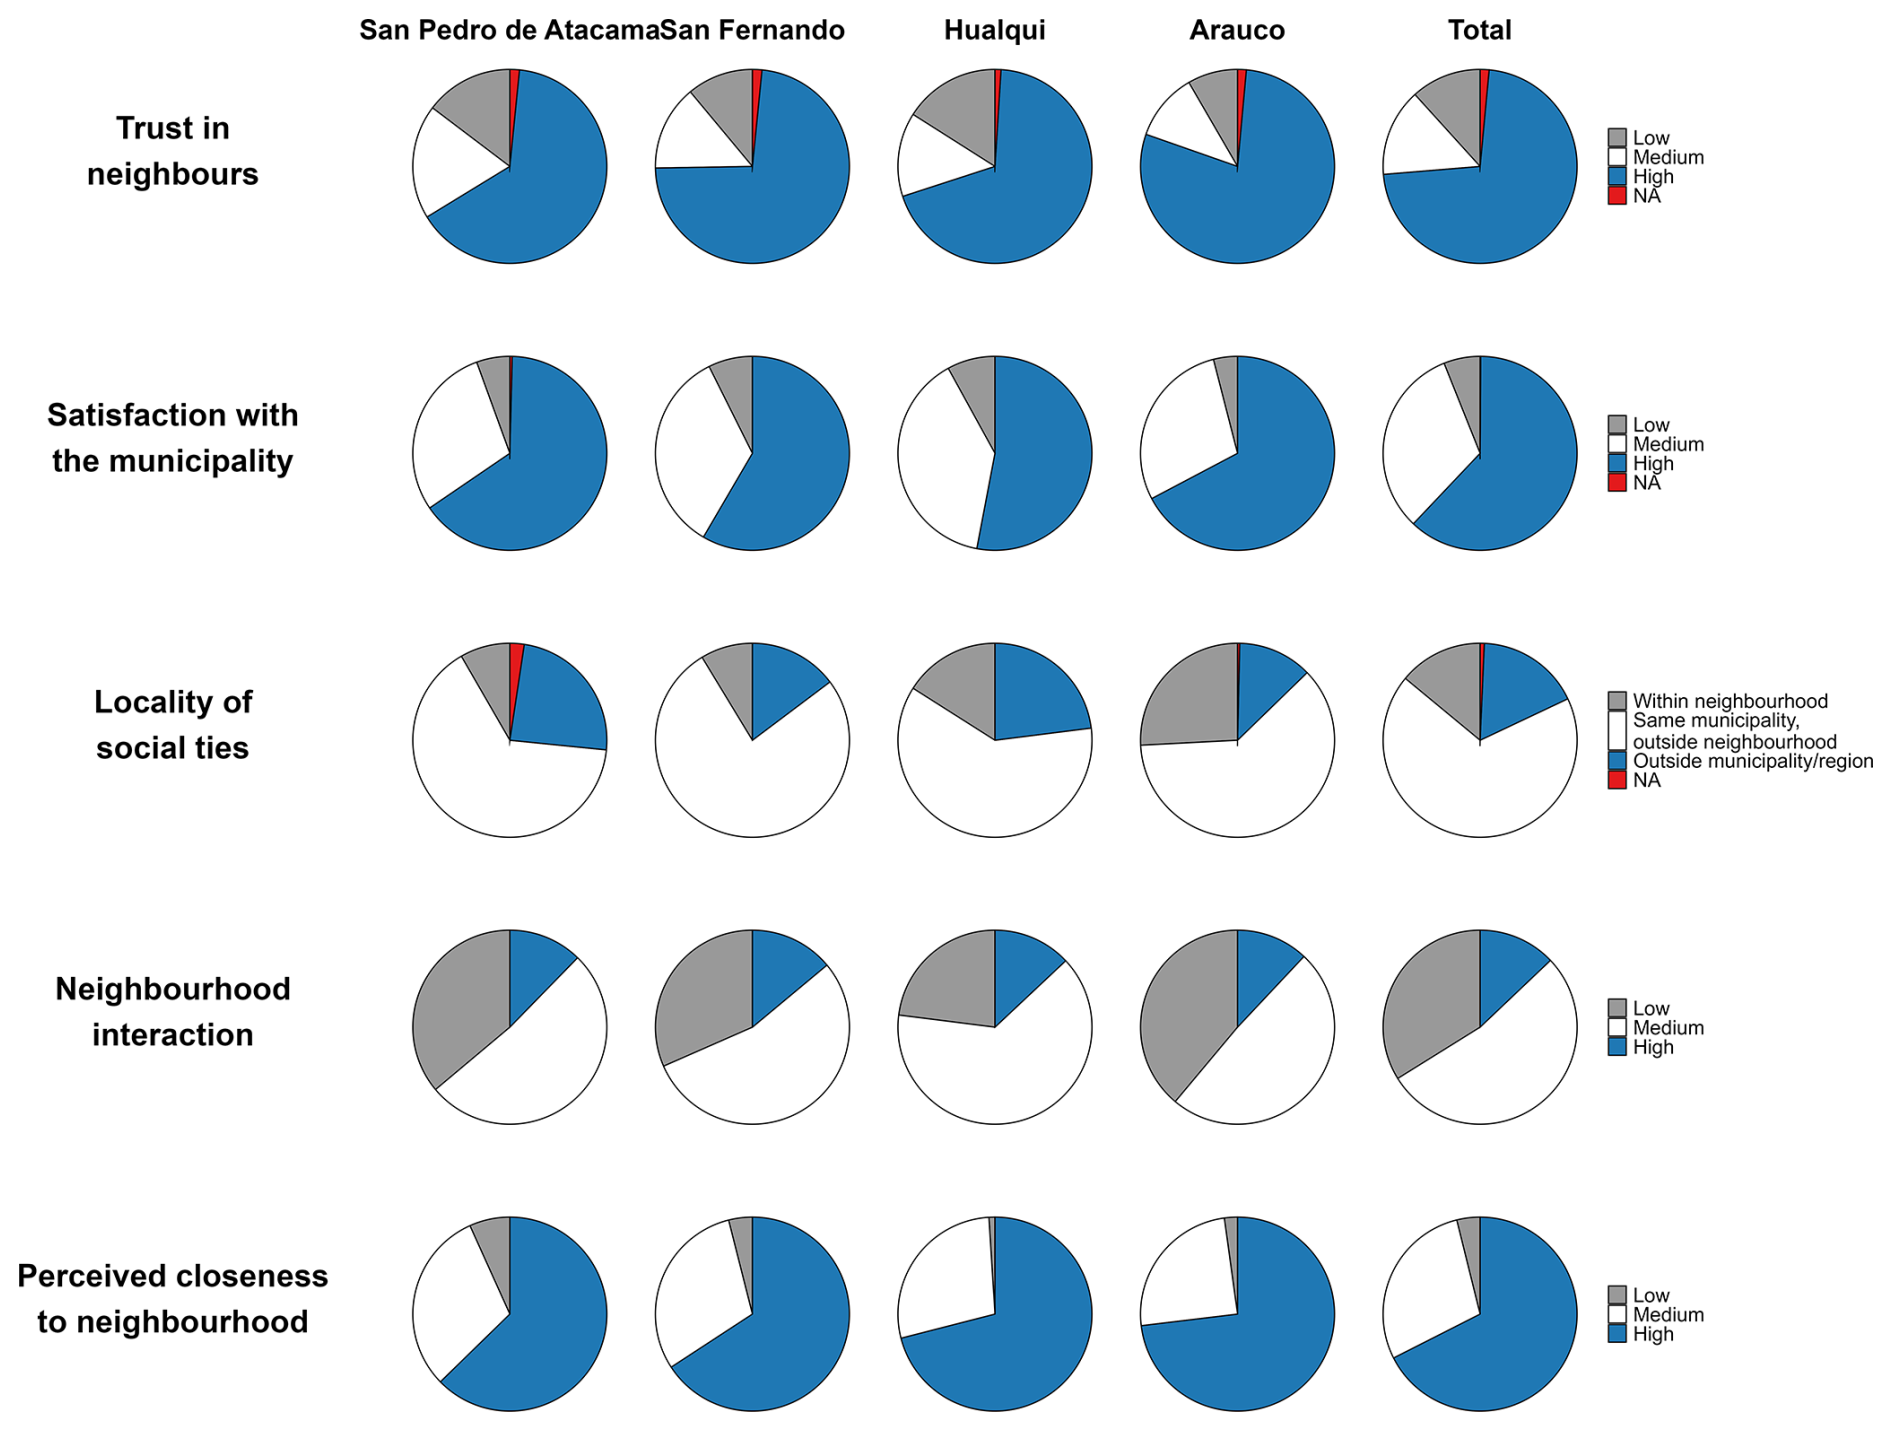
Figure A2Trust in neighbours, satisfaction with the municipality, location of social ties, neighbourhood interactions and perceived closeness to neighbours.
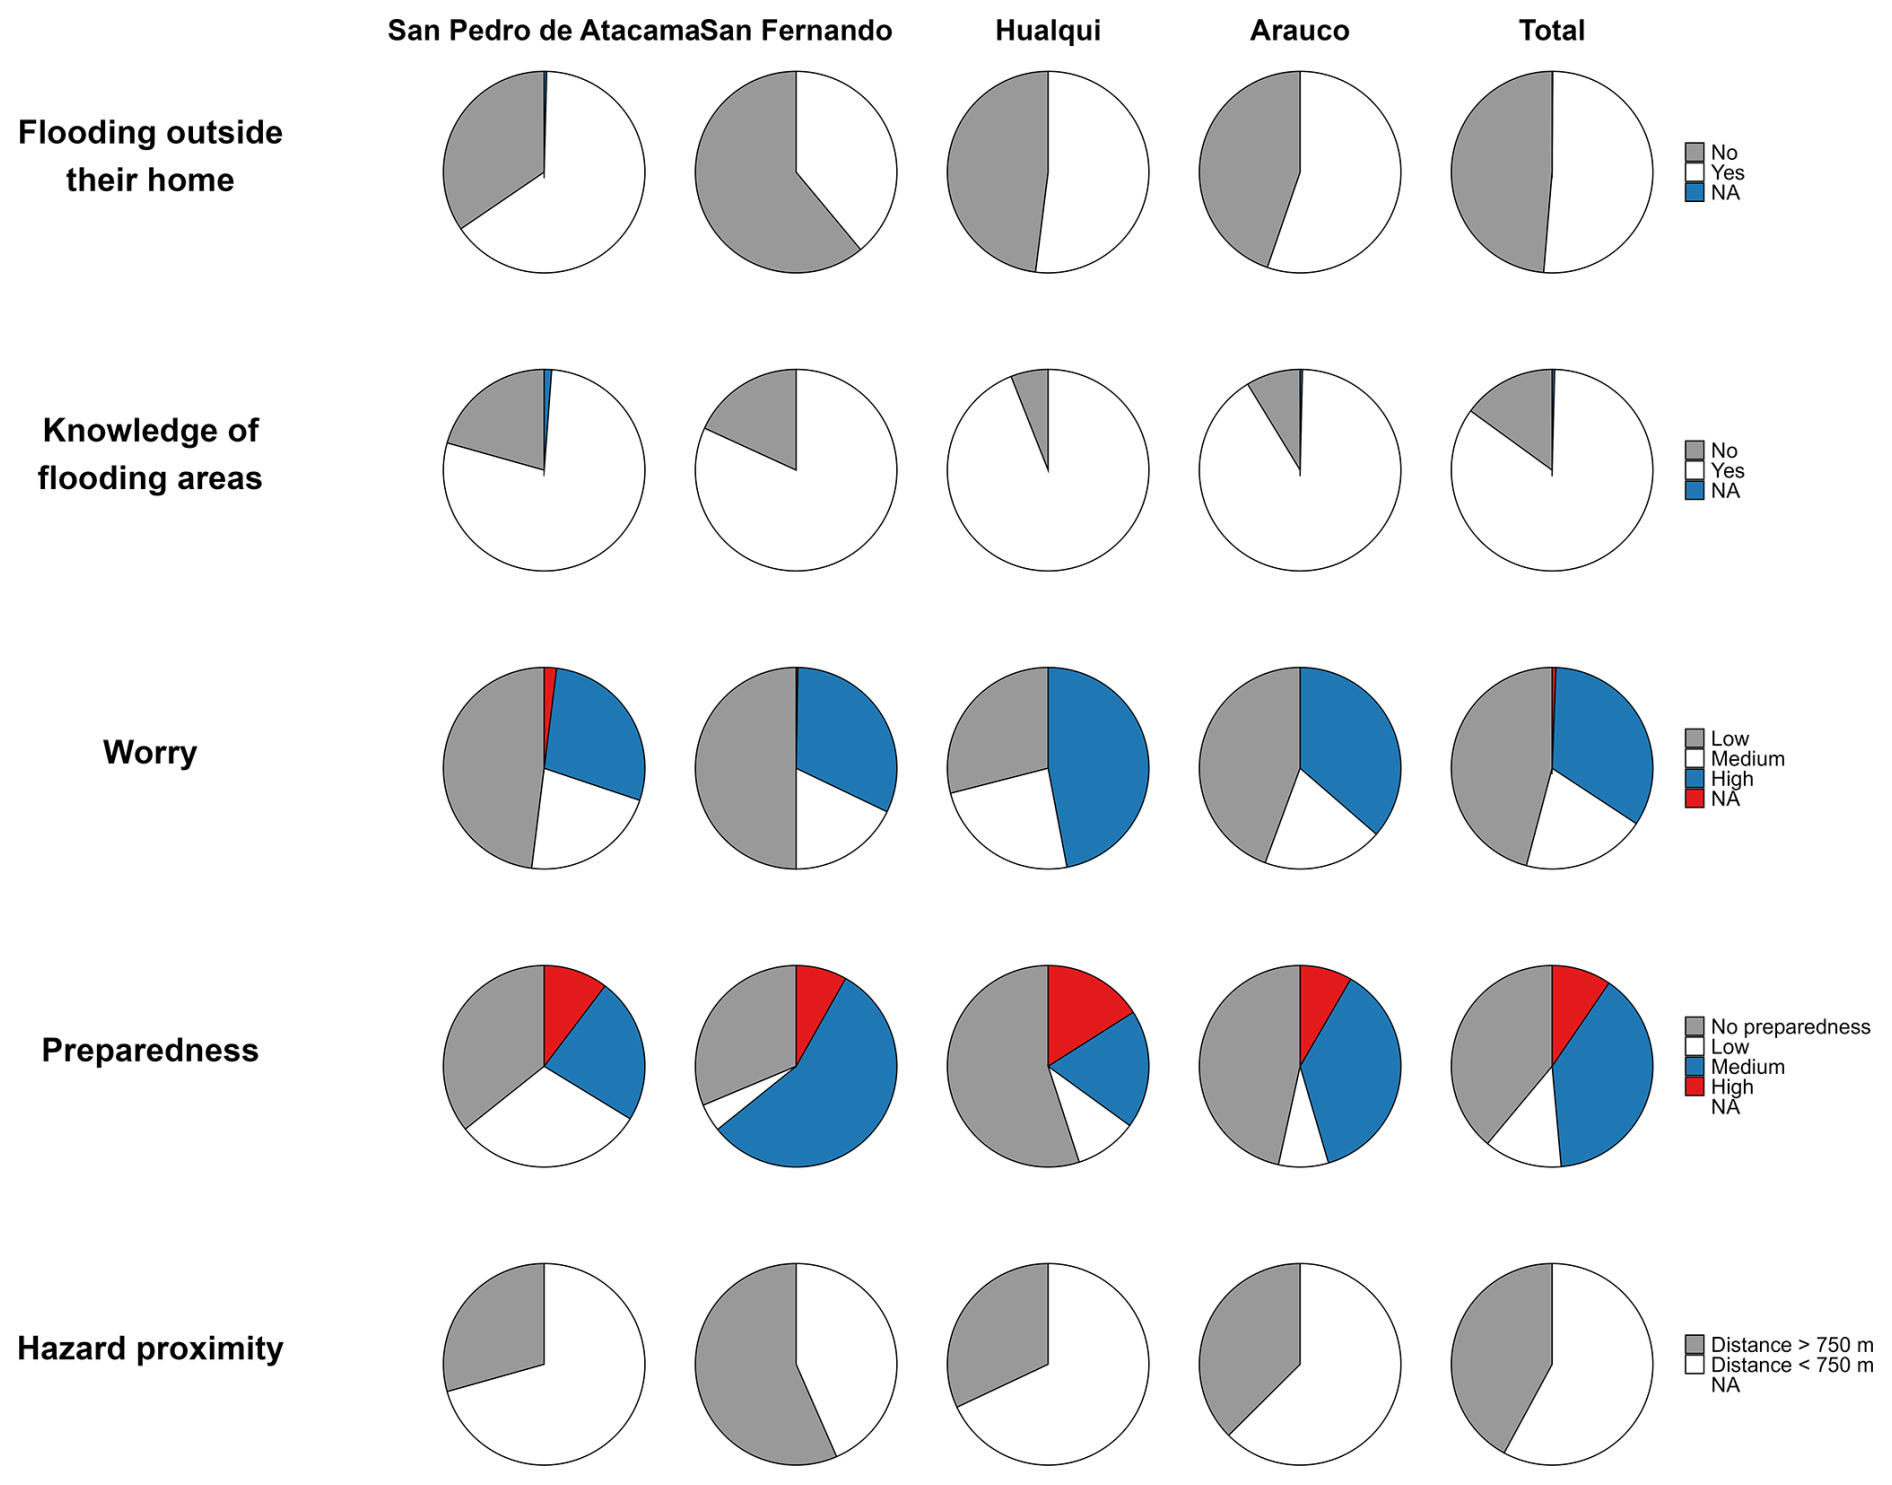
Figure A3Flooding outside their homes, knowledge of flood-prone areas, worry about flood risk, flood preparedness, and proximity to hazards.
Worry
Equations (B1) to (B4) include the significant predictors of worry for the different levels:
where η(1) is the level of worry for the individual level. X1 is gender, X2 is occupation of the householder, X3 is age of the responder, X4 is the level of trust in neighbours, X5 is the knowledge of flooding areas, and X6 is the socioeconomic group of the respondent.
where η(2) is the level of worry for the household level. X7 is the occurrence of flooding outside their home, and X8 is the distance between the household and the nearest water body.
where η(3) is the level of worry for the neighbourhood level. X9 is the proportion of ABC1 (high socioeconomic status) households in the neighbourhood, X10 is the low socioeconomic portion in the neighbourhood, and X11 is the territorial socio-material index ISMT.
where η(4) is the level of worry for the municipality level, X12 indicates the proportion of people living in poverty.
At the individual level, being unemployed or retired was associated with greater worry, while older age, greater trust in neighbours and knowledge of flood-prone areas were associated with lower levels of worry. In addition, individuals from higher socio-economic groups tended to perceive less worry.
At the household level, having experienced flooding outside the home during the most recent event emerged as the strongest predictor of increased worry. A greater distance from the river was also associated with reduced concern.
At the neighbourhood level, residing in areas with a higher proportion of low-income households was positively associated with worry. Conversely, living in areas with a greater share of high-income residents or a higher territorial socio-material index was related to lower levels of worry.
At the municipal level, only the income poverty rate was a statistically significant predictor of worry, suggesting that residents in economically poorer municipalities have higher worry about flood risk perception.
Preparedness
The ordinal regression model identified the variables that explain preparedness. Equations (B5) to (B8) include the significant predictors for the different levels of preparedness.
where h(1) is the level of preparedness for the individual level, X1 is having lived outside of the municipality five years ago, X2 is the age of the responder, X3 is the knowledge of flooding areas, and X4 is the socioeconomic group of the responder.
where η(2) is the level of preparedness for the household level, X5 is housing quality, X6 is the socioeconomic group, X7 is the time living in the neighbourhood, X8 is the presence of at least three dependent people in the household and X9 is flooding outside their home.
where η(3) is the level of preparedness for the neighbourhood level, X10 represents neighbourhood interaction, and X11 indicates the proportion of low socioeconomic portion in the neighbourhood.
where η(4) is the level of preparedness for the municipality level, X12 indicates the Territorial socio-material index, and X13 indicates municipal common fund dependency.
At the individual level, older respondents, those who reported knowledge of flood-prone areas, and individuals from higher socioeconomic groups demonstrated greater preparedness. These variables reflect the dimensions of demographic characteristics (age), risk awareness (knowledge of flooding areas), and socioeconomic status (socioeconomic group). In contrast, having lived in a different municipality five years prior was associated with lower preparedness, suggesting that recent movers may be less familiar with flooding risk in the locality.
At the household level, improved housing quality, longer time living in the neighbourhood, and the presence of dependent individuals were all positively associated with preparedness. Additionally, experiencing flooding outside the home during the most recent event emerged as a strong predictor of higher preparedness, indicating that experience with flooding is an important variable that increases preparedness in the householders.
At the neighbourhood level, greater interaction with neighbours and a higher proportion of households classified in the lowest socio-economic group (GSE E) were associated with greater preparedness. These results suggest that social cohesion and economic vulnerability may foster greater community-level action.
At the municipal level, two variables were significant: greater heterogeneity in socio-material conditions (as measured by the ISMT's standard deviation) and lower dependence on the Municipal Common Fund. The first may reflect how internal inequality increases risk perception and motivation, while the second points to the role of local economic autonomy in fostering better preparedness infrastructure or support.
At the municipality level, greater heterogeneity in socio-material conditions (as measured by the ISMT standard deviation) was associated with higher preparedness. Additionally, a lower dependence on the Municipal Common Fund was associated with greater preparedness among residents.
All data can be provided by the corresponding author upon request.
RC and VS analysed the data; FL and OL conceptualised the MS; OL and RC wrote the MS draft; VS and FL reviewed and edited the manuscript.
The contact author has declared that none of the authors has any competing interests.
Publisher's note: Copernicus Publications remains neutral with regard to jurisdictional claims made in the text, published maps, institutional affiliations, or any other geographical representation in this paper. The authors bear the ultimate responsibility for providing appropriate place names. Views expressed in the text are those of the authors and do not necessarily reflect the views of the publisher.
The Chilean national research and development agency, ANID, is acknowledged for Grant Anillo ATE220021: Climate Change and the Sociohydrology of Floods and for Grant ANID/CIN250023 Center for Interdisciplinary Research on Disaster Risk, Resilience and Recovery, CIGIDEN R+.
This research has been supported by the Agencia Nacional de Investigación y Desarrollo (grant nos. ATE220021 and ANID/CIN250023).
This paper was edited by Mihai Niculita and reviewed by five anonymous referees.
Abdi, H. and Williams, L. J.: Principal component analysis, Wiley Interdiscip. Rev. Comput. Stat., 2, 433–459, 2010.
Abunyewah, M., Erdiaw-Kwasie, M. O., Okyere, S. A., Thayaparan, G., Byrne, M., Lassa, J., Zander, K. K., Fatemi, M. N., and Maund, K.: Influence of personal and collective social capital on flood preparedness and community resilience: Evidence from Old Fadama, Ghana, Int. J. Disast. Risk Re., 94, 103790, https://doi.org/10.1016/j.ijdrr.2023.103790, 2023.
Adikari, Y. and Yoshitani, J.: Global trends in water-related disasters: An insight for policymakers, UNESCO: United Nations Educational, Scientific and Cultural Organisation, France, COI: 20.500.12592/zgkjrp, https://coilink.org/20.500.12592/zgkjrp (last access: 28 May 2026), 2009.
Alcayaga, H., Link, O., Mendoza Leal, C., and Arriagada, P.: The practically ungaugeable and damaging storms of the Atacama Desert, Chile, Nat. Hazards, https://doi.org/10.1007/s11069-025-07337-6, 2025.
Ali, A., Rana, I. A., Ali, A., and Najam, F. A.: Flood risk perception and communication: The role of hazard proximity, J. Environ. Manage., 316, 115309, https://doi.org/10.1016/j.jenvman.2022.115309, 2022.
Alkire, S. and Foster, J.: Counting and multidimensional poverty measurement, OPHI Working Paper No. 7, Oxford Poverty and Human Development Initiative, University of Oxford, Oxford, UK, 2007.
Ashenefe, B., Wubshet, M., and Shimeka, A.: Household flood preparedness and associated factors in the flood-prone community of Dembia district, Amhara National Regional State, northwest Ethiopia, Risk Manag. Healthc. Policy, 10, 95–106, https://doi.org/10.2147/RMHP.S127511, 2017.
Barendrecht, M. H., Viglione, A., and Blöschl, G.: A dynamic framework for flood risk, Water Secur., 1, 3–11, 2017.
Barendrecht, M. H., Viglione, A., Kreibich, H., Merz, B., Vorogushyn, S., and Blöschl, G.: The value of empirical data for estimating the parameters of a sociohydrological flood risk model, Water Resour. Res., 55, 1312–1336, https://doi.org/10.1029/2018WR024128, 2019.
Becker, G., Aerts, J. C., and Huitema, D.: Influence of flood risk perception and other factors on risk-reducing behaviour: a survey of municipalities along the Rhine, J. Flood Risk Manag., 7, 16–30, 2014.
Bin-Husayn, A. R., Abdullah, M., and Rimmel, G.: The relationship between risk perception and risk management: a systematic literature review, J. Risk Res., 27, 1290–1307, 2024.
Birkholz, S., Muro, M., Jeffrey, P., and Smith, H. M.: Rethinking the relationship between flood risk perception and flood management, Sci. Total Environ., 478, 12–20, 2014.
Blokland, T.: Community as urban practice, Polity Press, Cambridge, UK, ISBN 978-1-5095-0481-7, ISBN 978-1-5095-0482-4, 2017.
Blöschl, G.: Three hypotheses on changing river flood hazards, Hydrol. Earth Syst. Sci., 26, 5015–5033, https://doi.org/10.5194/hess-26-5015-2022, 2022.
Bodoque, J. M., Guardiola-Albert, C., Aroca-Jiménez, E., Eguibar, M. A., and Martinez-Chenoll, L.: Flood damage analysis: First floor elevation uncertainty resulting from LiDAR-derived digital surface models, Remote Sens., 8, 604, https://doi.org/10.3390/rs8070604, 2016.
Bourdieu, P.: La miseria del mundo, Fondo de Cultura Económica, México, ISBN 978-950-557-270-0, 1999.
Bradford, R. A., O'Sullivan, J. J., van der Craats, I. M., Krywkow, J., Rotko, P., Aaltonen, J., Bonaiuto, M., De Dominicis, S., Waylen, K., and Schelfaut, K.: Risk perception – issues for flood management in Europe, Nat. Hazards Earth Syst. Sci., 12, 2299–2309, https://doi.org/10.5194/nhess-12-2299-2012, 2012.
Bronfman, N. C., Cisternas, P. C., Repetto, P. B., and Castañeda, J. V.: Natural disaster preparedness in a multi-hazard environment: Characterizing the sociodemographic profile of those better (worse) prepared, PLoS One, 14, e0214249, https://doi.org/10.1371/journal.pone.0214249, 2019.
Cao, W., Yang, Y., Huang, J., Sun, D., and Liu, G.: Influential factors affecting protective coping behaviors of flood disaster: A case study in Shenzhen, China, Int. J. Environ. Res. Pub. He., 17, 5945, https://doi.org/10.3390/ijerph17165945, 2020.
Cutter, S. L., Boruff, B. J., and Shirley, W. L.: Social vulnerability to environmental hazards, Soc. Sci. Quart., 84, 242–261, 2003.
Cutter, S. L., Emrich, C. T., Morath, D. P., and Dunning, C. M.: Integrating social vulnerability into federal flood risk management planning, J. Flood Risk Manage., 6, 332–344, 2013.
Damper, R. I.: Editorial for the special issue on “Emergent Properties of Complex Systems”: Emergence and levels of abstraction, Kybernetes, 29, 1440–1453, https://doi.org/10.1080/002077200406543, 2000.
De Moel, H., Jongman, B., Kreibich, H., Merz, B., Penning-Rowsell, E., and Ward, P. J.: Flood risk assessments at different spatial scales, Mitig. Adapt. Strat. Gl., 20, 865–890, 2015.
Dirección General de Aguas (DGA): Inventario de cuencas, subcuencas y sub–subcuencas de Chile, http://sad.dga.cl (last access: 28 May 2026), 2014.
Dirección General de Aguas (DGA): Streamflow gauges (SFG), https://dga.mop.gob.cl/servicioshidrometeorologicos/Paginas/default.aspx (last access: 28 May 2026), 2021.
Di Baldassarre, G., Viglione, A., Carr, G., Kuil, L., Yan, K., Brandimarte, L., and Blöschl, G.: Debates – Perspectives on socio-hydrology: Capturing feedbacks between physical and social processes, Water Resour. Res., 51, 4770–4781, 2015.
Di Baldassarre, G.: Socio-hydrology of floods, Oxford Res. Encycl. Nat. Hazard Sci., https://doi.org/10.1093/acrefore/9780199389407.013.264, 2017.
Díez-Herrero, A., Laín-Huerta, L., and Llorente-Isidro, M. A.: Handbook on flood hazard mapping methodologies, Spain Geological Survey, Madrid, ISBN 978-84-7840-813-9, 2009.
Działek, J., Biernacki, W., Konieczny, R., Fiedeń, Ł., Franczak, P., Grzeszna, K., and Listwan-Franczak, K.: Understanding flood preparedness: flood memories, social vulnerability and risk communication in Southern Poland, Springer, https://doi.org/10.1007/978-3-030-04594-4, 2019.
Egli, T. and Wehner, K.: Non-structural flood plain management: measures and their effectiveness, International Commission for the Protection of the Rhine (ICPR), ISBN 3-935324-47-2, 2002.
Georgiou, I: The idea of emergent property, J. Oper. Res. Soc., 54, 239–247, https://doi.org/10.1057/palgrave.jors.2601509, 2003.
Gower, J. C. and Hand, D. J.: Biplots, Vol. 54, CRC Press, ISBN 0-412-71630-5, 1995.
Gower, J. C. and Hand, D. J.: Biplots, Monographs on Statistics and Applied Probability 54, Chapman & Hall, London, UK, ISBN 0-412-71630-5, 1996.
Gray-Scholz, D., Haney, T. J., and MacQuarrie, P.: Out of sight, out of mind? Geographic and social predictors of flood risk awareness, Risk Anal., 39, 2543–2558, https://doi.org/10.1111/risa.13357, 2019.
Haer, T., Botzen, W. W., and Aerts, J. C.: The effectiveness of flood risk communication strategies and the influence of social networks – insights from an agent-based model, Environ. Sci. Pol,, 60, 44–52, 2016.
Houston, J.: Variability of precipitation in the Atacama Desert: its causes and hydrological impact, Int. J. Climatol., 26, 2181–2198, 2006.
Instituto Nacional de Estadísticas (INE): Censo de Población y Vivienda 2017, http://resultados.censo2017.cl (last access: 28 May 2026), 2017.
Instituto Nacional de Estadísticas (INE): Censo de Población y Vivienda 2024, https://censo2024.ine.gob.cl/ (last access: 28 May 2026), 2002.
Instituto Nacional de Estadísticas (INE): Censo de Población y Vivienda 2024, https://censo2024.ine.gob.cl/ (last access: 28 May 2026), 2024.
Jonkman, S. N. and Penning-Rowsell, E.: Human instability in flood flows, J. Am. Water Resour. Assoc., 44, 1208–1218, 2008.
Karunarathne, A. Y. and Lee, G.: The geographies of the dynamic evolution of social networks for the flood disaster response and recovery, Appl. Geogr., 125, 102274, https://doi.org/10.1016/j.apgeog.2020.102274, 2020.
Kerstholt, J., Duijnhoven, H., and Paton, D.: Flooding in The Netherlands: How people’s interpretation of personal, social and institutional resources influences flooding preparedness, Int. J. Disaster Risk Reduct., 24, 52–57, https://doi.org/10.1016/j.ijdrr.2017.05.013, 2017.
Koks, E. E., Jongman, B., Husby, T. G., and Botzen, W. J.: Combining hazard, exposure and social vulnerability to provide lessons for flood risk management, Environ. Sci. Pol., 47, 42–52, 2015.
Krellenberg, K., Link, F., Welz, J., Harris, J., Barth, K., and Irarrazaval, F.: Supporting local adaptation: The contribution of socio-environmental fragmentation to urban vulnerability, Appl. Geogr., 55, 61–70, 2014.
Kron, W.: Flood risk = hazard ⋅ values ⋅ vulnerability, Water Int., 30, 58–68, 2005.
Kuhlicke, C., Seebauer, S., Hudson, P., Begg, C., Bubeck, P., Dittmer, C., Grothmann, T., Heidenreich, A., Kreibich, H., Lorenz, D. F., Masson, T., Reiter, J., Thaler, T., Thieken, A. H., and Bamberg, S.: The behavioral turn in flood risk management, its assumptions and potential implications, Wiley Interdiscip. Rev. Water, 7, e1418, https://doi.org/10.1002/wat2.1418, 2020.
Lechowska, E.: What determines flood risk perception? A review of factors of flood risk perception and relations between its basic elements, Nat. Hazards, 94, 1341–1366, 2018.
Lechowska, E.: Approaches in research on flood risk perception and their importance in flood risk management: a review, Nat. Hazards, 111, 2343–2378, 2022.
Leong, C.: The role of narratives in sociohydrological models of flood behaviors, Water Resour. Res., 54, 3100–3121, 2018.
Lin, S., Shaw, D., and Ho, M.-C.: Why are flood and landslide victims less willing to take mitigation measures than the public?, Nat. Hazards, 44, 305–314, 2008.
Link, O., Brox-Escudero, L. M., González, J., Aguayo, M., Torrejón, F., Montalva, G., and Eguibar-Galán, M. Á.: A paleo-hydro-geomorphological perspective on urban flood risk assessment, Hydrol. Process., 33, 3169–3183, 2019.
Martín-Vide, J. P.: Ingeniería fluvial, Univ. Politèc. de Catalunya, Barcelona, ISBN 978-84-8301-722-7, 2009.
Mavhura, E., Manyangadze, T., Mudavanhu, C., and Pedzisai, E.: An assessment of riparian communities' preparedness to flood risk: The case of Mbire communities in Zimbabwe, GeoJournal, 87, 1671–1693, 2022.
Mazzoleni, M., Mondino, E., Matanó, A., Van Loon, A. F., and Barendrecht, M. H.: Modelling the role of multiple risk attitudes in implementing adaptation measures to reduce drought and flood losses, J. Hydrol., 636, 131305, https://doi.org/10.1016/j.jhydrol.2024.131305, 2024.
Mazzorana, B., Simoni, S., Scherer, C., Gems, B., Fuchs, S., and Keiler, M.: A physical approach on flood risk vulnerability of buildings, Hydrol. Earth Syst. Sci., 18, 3817–3836, https://doi.org/10.5194/hess-18-3817-2014, 2014.
Ministry of Social Development and Family: Encuesta de Caracterización Socioeconómica Nacional (CASEN) 2022, https://observatorio.ministeriodesarrollosocial.gob.cl/encuesta-casen-2022 (last access: 28 May 2026), 2023.
Mendoza Leal, C., Coloma, R., Ponce, D., Alarcón, B., Guerra, M., Stehr, A., Carrasco, J. A., Alcayaga, H., Rojas, O., Link, F., and Link, O.: The status quo effect in the sociohydrology of floods, Hydrol. Sci. J., 69, 2423–2435, 2024.
Mondino, E., Scolobig, A., Borga, M., and Di Baldassarre, G.: The role of experience and different sources of knowledge in shaping flood risk awareness, Water, 12, 2130, https://doi.org/10.3390/w12082130, 2020.
Observatorio de Ciudades UC: Observatorio de Ciudades UC, https://observatoriodeciudades.com/ (last access: 28 May 2026), 2019.
O'Neill, E., Brereton, F., Shahumyan, H., and Clinch, J. P.: The impact of perceived flood exposure on flood-risk perception: The role of distance, Risk Anal., 36, 2158–2186, 2016.
Poussin, J. K., Botzen, W. W., and Aerts, J. C.: Factors of influence on flood damage mitigation behaviour by households, Environ. Sci. Policy, 40, 69–77, 2014.
Raaijmakers, R., Krywkow, J., and van der Veen, A.: Flood risk perceptions and spatial multi-criteria analysis: an exploratory research for hazard mitigation, Nat. Hazards, 46, 307–322, 2008.
Reuter, H., Hölker, F., Middelhoff, U., Jopp, F., Eschenbach, C., and Breckling, B.: The concepts of emergent and collective properties in individual-based models – summary and outlook of the Bornhöved case studies, Ecol. Model., 186, 489–501, 2005.
Rosas Araya, M.: ismtchile: Territorial Socio-Material Index for Chile, https://ismtchile.geocoded.dev/home (last access: 28 May 2026), 2025.
Rufat, S., Fekete, A., Armaş, I., Hartmann, T., Kuhlicke, C., Prior, T., Thaler, T., and Wisner, B.: Swimming alone? Why linking flood risk perception and behavior requires more than “it's the individual, stupid”, Wiley Interdiscip. Rev. Water, 7, e1462, https://doi.org/10.1002/wat2.1462, 2020.
Santos, P. P., Pereira, S., Zêzere, J. L., Tavares, A. O., Reis, E., Garcia, R. A., and Oliveira, S. C.: A comprehensive approach to understanding flood risk drivers at the municipal level, J. Environ. Manage., 260, 110127, https://doi.org/10.1016/j.jenvman.2020.110127, 2020.
Sarricolea, P., Meseguer Ruiz, O., and Romero-Aravena, H.: Tendencias de la precipitación en el norte grande de Chile y su relación con las proyecciones de cambio climático, Diálogo Andino, 54, 41–50, 2017.
Scolobig, A., De Marchi, B., and Borga, M.: The missing link between flood risk awareness and preparedness: findings from case studies in an Alpine Region, Nat. Hazards, 63, 499–520, 2012.
Shah, A. A., Ye, J., Abid, M., and Ullah, R.: Determinants of flood risk mitigation strategies at household level: a case of Khyber Pakhtunkhwa (KP) province, Pakistan, Nat. Hazards, 88, 415–430, 2017.
Sivapalan, M., Savenije, H. H., and Blöschl, G.: Socio-hydrology: A new science of people and water, Hydrol. Process., 26, 1270–1276, 2012.
Sivapalan, M. and Blöschl, G.: Time scale interactions and the coevolution of humans and water, Water Resour. Res., 51, 6988–7022, https://doi.org/10.1002/2015WR017896, 2015.
Stephenson, V. and D'Ayala, D.: A new approach to flood vulnerability assessment for historic buildings in England, Nat. Hazards Earth Syst. Sci., 14, 1035–1048, https://doi.org/10.5194/nhess-14-1035-2014, 2014.
SUBDERE: Sistema Nacional de Información Municipal (SINIM), Subsecretaría de Desarrollo Regional y Administrativo, https://datos.sinim.gov.cl/ (last access: 28 May 2026), 2022.
Takao, K., Motoyoshi, T., Sato, T., Fukuzondo, T., Seo, K., and Ikeda, S.: Factors determining residents' preparedness for floods in modern megalopolises: the case of the Tokai flood disaster in Japan, J. Risk Res., 7, 775–787, 2004.
Terpstra, T.: Emotions, trust, and perceived risk: Affective and cognitive routes to flood preparedness behavior, Risk Anal., 31, 1658–1675, https://doi.org/10.1111/j.1539-6924.2011.01616.x, 2011.
Veloso, C., Flores, E., Noguera, I., Faúndez, R., Arriagada, P., Rojas, O., Carrasco, J. A., and Link, O.: Preparedness against floods in nearly pristine socio-hydrological systems, Hydrol. Sci. J., 67, 319–327, 2022.
Wachinger, G., Renn, O., Begg, C., and Kuhlicke, C.: The risk perception paradox – implications for governance and communication of natural hazards, Risk Anal., 33, 1049–1065, 2013.
Xia, J., Falconer, R. A., Lin, B., and Tan, G.: Numerical assessment of flood hazard risk to people and vehicles in flash floods, Environ. Model. Softw., 26, 987–998, 2011.
- Abstract
- Introduction
- Materials and methods
- Results
- Discussion
- Conclusions
- Appendix A: Univariate analysis for each municipality
- Appendix B: Ordinal regression models for each level
- Data availability
- Author contributions
- Competing interests
- Disclaimer
- Acknowledgements
- Financial support
- Review statement
- References