the Creative Commons Attribution 4.0 License.
the Creative Commons Attribution 4.0 License.
 | 01 Jun 2026
Predicting the risk of individual tree fall along powerlines in Norway with a mechanistic wind risk model and machine learning
Barry Gardiner
Svein Solberg
Tree falls along linear infrastructures and in particular powerlines pose a significant economic, safety and environmental challenge for the companies and institutions managing these infrastructures. The quick progression and affordability of remote sensing technologies such as drone-based inventories offers the opportunity to quickly and efficiently map individual trees along these infrastructures, enabling precise vegetation management to reduce risks. Here, we show how the hybrid empirical and mechanistic wind risk model ForestGALES can be applied to assess the vulnerability of individual trees to windfalls along selected powerlines in southern Norway. The validation dataset contained 180 recorded individual tree falls along powerlines from the winter 2020–2021. There was no major wind event recorded that winter. However, still, the ForestGALES model performed adequately, with an AUC (area under the curve) of 0.67. Combining the vulnerability index from ForestGALES with all other available tree and environmental variables in a machine learning model (extreme gradient boost algorithm) did however significantly improve the prediction performance. These results highlight how a combination of high-quality remote sensing data at the individual tree level can be utilized with ForestGALES and machine learning to provide managers with high-resolution vulnerability information for vegetation management.
- Article
(2862 KB) - Full-text XML
- BibTeX
- EndNote


Linear infrastructures such as roads, railways and powerlines are vital to our societies bringing important social and economic benefits. However, they often intersect with managed and unmanaged forested and other vegetated areas. Coupled with extreme weather events, vegetation-related damage on linear infrastructures poses important safety, social and economic risks. Tree monitoring and management to identify high-risk locations along linear infrastructures is key and a priority for proactive natural hazard and vegetation management (Gardiner et al., 2024; Poulos and Camp, 2010; Szymczak et al., 2022) also minimizing the footprint of these infrastructures on vegetation. Regarding power infrastructures and powerlines, global electricity demand has nearly doubled over the last two decades across the world and is set to continue growing. The powerline grids are likely to expand by 16 million new kilometres for the 2020–2030 period to connect all new sources of electricity across the world (IEA, 2020). This creates increasing pressure on forested lands and increased deforestation and fragmentation when new lines are laid out. In addition, a general ageing of forests in Europe and more climatic disturbance increase the problems (Patacca et al., 2022). Tree management is a significantly growing need and expense for power transmission and distribution companies, for which traditional methods are rapidly becoming obsolete. The electricity distributors have a much larger area to manage the vegetation along the powerlines' right-of-way (ROW). They need to reduce tree fall risks while maintaining biodiversity, carbon sink strength, timber production and access for forest management among other ecosystem services.
The advent of new remote-based technologies paired with machine learning models is rapidly changing the methods for risk assessment and management planning for power suppliers (and for other linear infrastructures). Historically, utilities used a fixed cycle of ground-based patrols visually inspecting powerlines, a time-consuming and expensive routine task. The rapid development and dissemination of optical and LiDAR surveys of the powerlines with airplanes and drones has significantly upgraded the potential for extensive remote monitoring of the vegetation along powerlines (Walker and Dahle, 2023). Combined with new AI models and tools, these new technologies can provide the identification of individual trees and a detailed 3D representation of their characteristics such as species and size (Jain et al., 2021). The acquisition and processing of LiDAR data is however expensive and can be time-consuming, especially for large regions or countries with extensive network of distribution lines. Developing and applying existing and new models utilizing these datasets to quickly calculate vulnerability indices across large areas are therefore key for the electricity providers. This helps to move towards cost-effective precise and individual-based tree management in the powerline ROW by targeting sections with high vulnerability. It also offers the opportunity to increase the safety of ground crews, better comply with local regulations and policies, and optimize the planning process for new powerlines.
In this study, we applied the well-established forest wind damage risk model ForestGALES recently parameterized for Norwegian forests (Merlin et al., 2025). This is a hybrid empirical and mechanistic model for calculating the threshold (Critical Wind Speed CWS) for wind damage for forest stands and individual trees (Gardiner et al., 2008; Hale et al., 2012, 2015), to a compiled drone-based dataset of individual trees along powerlines across southern and western Norway. The ForestGALES model provides a semi-mechanistic alternative to statistical damage models which have limited operational use, by incorporating the physical process of wind loading on individual trees in forests. In Norway, forests cover 38 % of the land and the high-voltage power grid stretches over 130 000 km. Power outages are in general scarce and short in Norway (e.g. in 2024 an end-user experienced an average of 1.7 power outages lasting more than 3 min, with one long-term power outage for an average of 3.5 h (Avbrotsstatistikk fra Reguleringsmyndigheita for energi – NVE, 2025)), with 75 % of them attributable to snow, ice, lightning, precipitation, wind and vegetation. However, stronger storms and heavier wet-snow events in recent years have directly and indirectly, via tree fall, impacted electricity delivery and financially burdened utilities and other involved parties (NVE, 2012). This includes severe cases of long-lasting outages for some consumers and indirect effects on other electricity-based facilities such as emergency networks. Widening of powerline gates have been routinely carried out to secure powerlines against tree fall but may compromise forest cover, continuity and biodiversity. The utilities are therefore keen on implementing an operational solution collecting relevant data for predicting damage probability and design preventive and precise management. The objective of this study was thus to evaluate the performance of a Norwegian-parameterized version of ForestGALES for identifying trees at risk for wind damage along a given powerline.
In our study, we calculated CWS with ForestGALES for individual trees along selected powerline sections in southern Norway. To best represent the individual tree characteristics and the immediate forested environment, different seasonal (presence of snow on tree crowns) scenarios and definitions of tree variables (crown asymmetry, immediate tree neighbourhood definition) were used in the input dataset prior to the calculation of CWS by the ForestGALES model. This was to assess how to best define individual tree characteristics and local environment in order to obtain the most accurate damage predictions. Additionally, three alternative sources describing the wind climate were used when calculating the probability of damage. All options were evaluated for their performance in predicting tree damage against a validation dataset of recorded tree damage during the winter 2020–2021 and the best model selected.
2.1 Individual tree data
We used a single tree dataset from southern Norway (Fig. 1), i.e. mainly in the boreonemoral and south, boreal bioclimatic zones (Bakkestuen et al., 2008). It was compiled by eSmart Systems (https://www.esmartsystems.com/, last access: 29 May 2026), a company providing AI-based services for the inspection and maintenance of energy infrastructures. The dataset contained single tree data along 25 forested powerline sections of 200–500 m in length and approximately 50 to 65 m in width, i.e. ∼25 m on each side of the powerline gate. Out of the 25 locations, 17 were south of Oslo, and 8 were in the more northern and western region. Observations of individual tree damage in and around the 25 powerline locations during the winter 2020–2021 (assumed due to wind damages; no heavy snow event were recorded for that period for the locations considered) were gathered early in summer 2021 and included both uprooted and broken trees. A total of 180 damaged trees were recorded, including 76 Norway spruce, 56 Scots pine and 48 broadleaved trees.
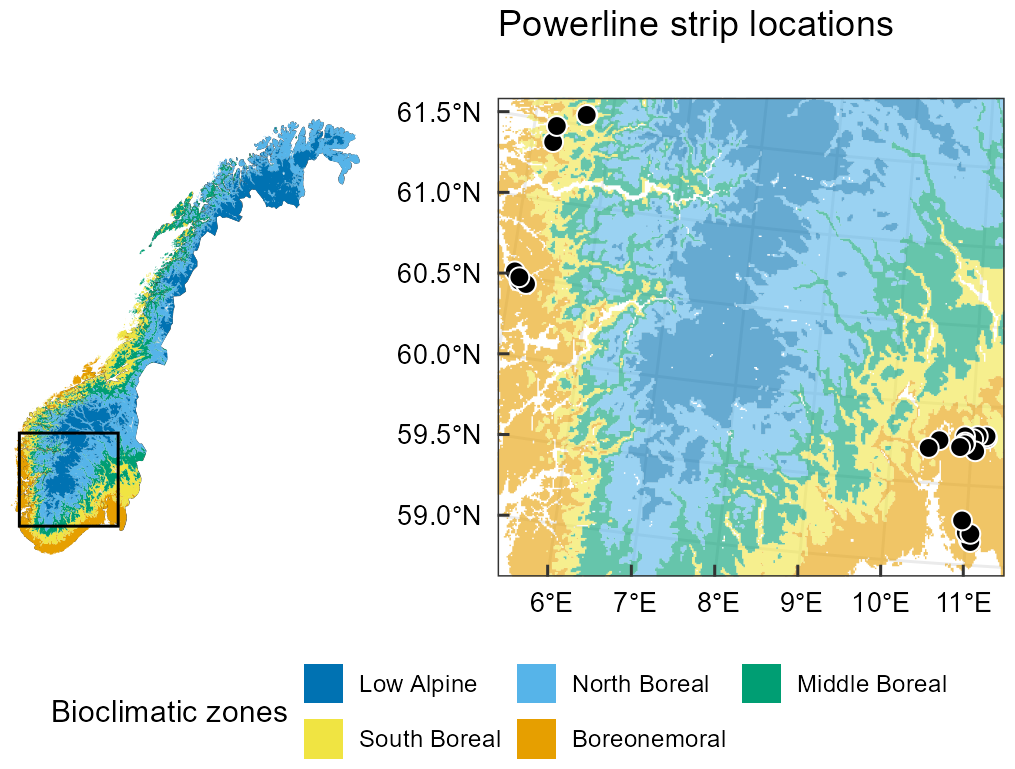
Figure 1Maps showing the location of the study sites (black dots) within the larger study area in southern Norway (black rectangle) across the five bioclimatic regions of Norway.
The single tree data contained 18 689 trees, including 180 damaged trees (∼1 % of the full dataset). The acquisition of this dataset followed two main steps: first the acquisition of UAV laser scanning data and its pre-processing (for the 25 powerline strip locations), second the post-processing of this data to obtain all the required tree characteristics variables. A short description of both steps follows.
2.1.1 UAV laser scanning dataset
The field data collection took place across the summers 2020 and 2021. UAV laser scanning data were collected for the powerline strips. A base station with known GPS coordinates was used for accurate geocoding of the laser returns. The collection was planned based on a 4 or 5 double line pattern along the powerline, at a flight altitude of ∼60 m above ground and with a flight line spacing of ∼10–15 m, resulting in an overlap of the flight lines of ∼85 % in front and ∼75 % side and a scan angle of 0° from nadir, resulting in a ground sampling distance of near 1.41 cm per pixel. Several postprocessing engines were used but Pix4D (© 2025 Pix4D SA) and DroneDeploy (© 2025 DroneDeploy) were the major tools for this (details not shown). The pre-processing of the UAV-LS data yielded a dataset containing the coordinates, species, height and the bounding box of each tree within 25 m of each side of the powerline gate. This pre-processed dataset underwent further processing to calculate the following “landscape” variables: the shortest distance from each tree to the powerline, the distance from each tree to the nearest forest edge (towards and away from the powerline or in the direction parallel to the powerline when an edge existed), the associated size of non-forested gaps (when present). The diameter at breast height (DBH) was estimated using species-specific equations pairing UAV-LS-derived height data and field-based measurements of DBH (see Appendix A, Table A1). The crown radii in the eight cardinal directions were measured to calculate the offset of the crown gravity centre relative to the top of the tree (see below).
2.1.2 Tree data processing and final input dataset
The input dataset was then further processed to obtain all necessary variables required to calculate the CWS using ForestGALES. The stem volume and crown depth of each tree was estimated using Norwegian and species-specific equations derived from the National Forest Inventory and described in the Appendix of Merlin et al. (2025) (the stem volume equation are reiterated here in the Appendix A.1.1, Table A2). A measure of the crown asymmetry for each tree was done using the 8 crown radii measured in the previous step by estimating the displacement of the centre of gravity between a right circular cone shape and an irregular cone. Details about the calculation of the displacement of the crown centre of gravity are shown in Appendix A.1.2, Fig. A1. The crown offset was then added in the calculation of the deflection loading factor (DLF) as an additional displacement of the crown weight – thereby increasing the DLF compared to a tree with a symmetrical crown, decreasing the CWS thereby increasing the tree's vulnerability to wind damage (see Eqs. 2 and 3 for the DLF in the CWS calculations, Locatelli et al., 2022).
For each tree, the characteristics of the surrounding trees were aggregated to represent the neighbourhood of each tree using Voronoi diagrams. We considered both the first order and second order neighbouring Voronoi cells – trees – when defining the neighbouring trees (hereafter named “tier 1 & tier 2”). We calculated the mean tree height, DBH, crown depth and width, and distance for the neighbourhood trees and labelled this as stand variables. We calculated two competition indices, i.e. the Hegyi (distance-dependent, Hegyi, 1974) and the BAL (distance independent, Stage, 1973). Both indices are implemented in the single-tree version of ForestGALES.
The distance to the edge of the forest and the associated forest gap size were calculated in four directions – to and from the powerline, and along the powerline direction – using individual tree positions. Three alternatives were retained when calculating the critical wind speed: (i) the “closest largest gap” was defined using the linear optimizer function of the lpSolve package in R (Berkelaar, 2024), (ii) the “minimum” was simply the closest forest edge and (iii) the “mean” the average of the distances to and size of the non-forested gaps in the four considered directions.
We derived soil type and rooting depth from the Geological Survey of Norway (NGU; https://geo.ngu.no/kart/losmasse_mobil/, last access: 29 May 2026) and the ForestGALES classification (Kennedy, 2002) as detailed in the Appendix of Merlin et al. (2025). Finally, we derived the topographic exposure index Topex (Chapman, 2000) from Norwegian elevation models at 10 m resolution across Norway for a horizon distance of 200, 500, and 1000 m averaged across the eight compass directions, hereafter referred to as Topex 200, Topex 500 and Topex 1000. Topex has been successfully used in forest wind damage assessments and modelling in complex terrain (Costa et al., 2023).
2.1.3 Characteristics of damaged and standing trees
A simple summary of the differences between the standing and damaged trees was performed for tree height, DBH, ratio, the ratio of the estimated crown depth to tree height, species mix (whether the tree of interest was in a stand of the same species (coded 0), of a different species and a conifer species (coded 1), or of a different species and broadleaf (coded 2)), tree status (whether the tree of interest was taller or thinner than the neighbouring trees). Considering the large imbalance in the sample sizes between the damaged and standing trees, we used a repeated random subsampling approach for N=100 simulations. In each of the simulations, all 180 damaged trees were combined with a randomly selected subset of 180 standing trees drawn without replacement to produce balanced datasets. The differences in the characteristics between the standing and damaged trees were evaluated in each simulation, and the results were summarized across the 100 simulations. This approach assumes independence among trees and treats each random subsample of standing trees as an equally plausible representation of the undamaged population. Similar results were obtained when performing the analysis on the complete unbalanced dataset. The significance of the difference was tested using the Mann–Whitney–Wilcoxon (MWW) test foregoing assumptions about the underlying distribution. The statistics of the test were then averaged across the 100 repeated assessments. Similarly, a 2-sample test for equality of proportions was used to test whether damaged trees were different from standing trees in the type of trees in their surroundings (same species, different species with conifers or broadleaves).
2.2 Wind climate and models
A probability of wind damage can be calculated when combining calculated CWS from ForestGALES and information on extreme wind events. Three different descriptions of the wind climate were assessed in this study for their predictive power: the use of the maximum observed wind speed during the winter (October to April), the use of the Weibull distribution describing the mean wind climate assuming its convergence to a Gumbel distribution (as described in the ForestGALES default model), and the use of the Generalized Extreme Value (GEV) distribution describing the extreme – maximum wind speed climate.
2.2.1 Maximum observed wind speed during the winter 2020–2021
The maximum wind speed at 10 m above ground was obtained from the hourly meteorological data from the long-term stable post-processed products of the Norwegian Meteorological Institute MET (available for download here: https://thredds.met.no/thredds/metno.html, last access: 29 May 2026) on a 1 km×1 km spatial grid across Norway. Since all damage was recorded during the winter of 2020–2021, corresponding to the period when tree falls occur most frequently in Norway, the search for the maximum observed wind speed was restricted between October 2020 and April 2021. The maximum wind speed for the winter 2020–2021 in the centroid of each of the 25 powerline strips and for each location of the 180 damaged trees was extracted. Some of the sites belonged to the same 1 km raster cell from the meteorological data, hence the final 2020–2021 maximum wind speed dataset contained 97 different locations for the 205 sites (25 powerline strips and 180 recorded individual tree damage events). The wind climate during this period (winter 2020–2021) was relatively mild, with a mean wind speed of approximately 3 to 4 m s−1 and a 95th percentile between 4 and 5 m s−1. The maximum observed wind speed itself reflected a mild winter, with values around 10 m s−1 for all locations considered here (see Fig. A2).
2.2.2 Weibull distribution – mean wind speed climate
The Global Wind Atlas (https://globalwindatlas.info/en, last access: 29 May 2026) provides a worldwide description of the mean wind climate via the two Weibull distribution parameters A and k. Both parameters are available at a 250 m resolution (at the equator) and were downloaded for Norway. The value of the two parameters in the centroid of each of the 25 powerline strips and for each location of the 180 damaged trees were extracted. The maximum wind speeds described by a Weibull distribution converge to a Gumbel (GEV type I distribution – see below) distribution. The A and k parameters of the Weibull mean wind distribution can then be transformed into the two Gumbel parameters following Quine (2000) to describe the extreme wind climate based on information from the mean wind climate.
2.2.3 Generalized extreme value distribution – maximum wind speed climate
Since the extreme (maximum) wind speed climate is theoretically more relevant for assessing the probability of damage than the mean wind climate, it would be logical to use a model describing the extreme wind climate across Norway. Generalized Extreme Value (GEV) distribution models are well-established and widely used in extreme value statistics (Palutikof et al., 1999). The GEV distribution was first introduced by Jenkinson (1955), describing three possible types of extreme value distributions for the block maxima of a given variable: type I – Gumbel, type II – Fréchet and type III – Weibull (Beirlant et al., 2004). The GEV distribution is a three-parameter distribution of the form:
where μ is the location, σ is the scale, and ξ is the shape parameter. The shape parameter determines one of the three previously mentioned types: type I is when ξ=0, type II is when ξ>0 and type III when ξ<0. For an accurate parameter estimation of the GEV distribution at each site, the time series sample must be sufficiently long; a minimum of ten years of observations is recommended, but the longer the more accurate the estimates of wind extremes will be (Palutikof et al., 1999). There is however no published map of the three GEV parameters for Norway, therefore a GEV model was fitted on a long-term dataset of yearly maximum wind speed for each of the sites. The long-term extreme wind speed dataset contained the yearly maximum wind speed for 47 years (1975–2021) extracted from the same data source as for the maximum wind speed observed in the winter 2020–2021 (i.e. the long-term stable post-processed products of the Norwegian Meteorological Institute MET). Similarly to this other dataset, it contained the time series of maximum wind speed for the 97 locations corresponding to the 205 sites.
For each of the 97 time-series, the GEV fitting procedure was as follows: (1) the Augmented Dickey–Fuller (ADF) and the Kwiatkowski–Phillips–Schmidt–Shin (KPSS) stationary tests were performed and stationarity of the time series was ensured (for α=0.05); (2) the GEV distribution was fitted using the Maximum Likelihood Estimation (MLE); (3) each model fit was checked using two diagnostic plots: (i) the empirical versus model quantiles plot with confidence bands, (ii) the model density compared with the histogram of the empirical data; (4) both the Kolmogorov–Smirnov and Anderson–Darling tests were performed to confirm the empirical data and a randomly generated sample from a GEV model with the estimated parameters originated from the same distribution. During step (2), initial estimates were supplied, in the form of the mean observed maximum wind speed across the time series for the location parameter, a scale value of 1 and a shape value of 0.1. The use of good initial estimates – especially for the location parameter – was important in ensuring convergence of the model. The final parameter estimates for the 97 fitted models were on average 10.5 (SD =1.96) for the location parameter, 0.894 (SD =0.241) for the scale parameter and −0.213 (SD =0.130) for the shape parameter. The majority (94 out of 97) of the models showed a negative shape parameter, indicating a GEV model of type III. Traditionally, extreme wind speeds in temperate latitudes have been fitted to a Type I (Gumbel) distribution, as was done when using the Weibull distribution parameters in this study. However several published studies (Li et al., 2022; Palutikof et al., 1999; Soukissian and Tsalis, 2015) have shown that the Type III distribution is appropriate.
Note that the wind direction or seasonality of the extreme wind speed were not accounted for in this study.
2.3 ForestGALES, Critical Wind Speed and probability of damage
The ForestGALES model is a hybrid empirical and mechanistic wind risk model for forest stands and individual trees, initially developed in the United Kingdom (Hale et al., 2012, 2015) and now used in several European and non-European forest contexts (Duperat et al., 2021; Kamimura et al., 2016; Locatelli et al., 2016) and in Norway (Merlin et al., 2025). We used the individual tree version (Turning Moment Coefficient – TMC – version). It uses input variables of tree characteristics, the surrounding forest stand, and soil class and rooting depth to calculate the Critical Wind Speed (CWS) for breaking and overturning damage. We used the R (fgr) package (Locatelli et al., 2022), which we recently parametrized for Norway (Merlin et al., 2025) and included an upgrade on crown asymmetry (details in Sect. 2.2 and Appendix A).
2.3.1 Critical Wind Speed calculations
The CWS equations for breakage Eq. (2) and overturning Eq. (3) are shown below (Hale et al., 2015; Locatelli et al., 2022):
where π: pi mathematical constant. The Wstem is the total stem weight defined as the total stem volume multiplied by the stem density. The stem volume was estimated using species-specific models defined and routinely used by the Norwegian National Forest Inventory (kg). The equations are detailed in the Appendix A, Table A2. TC is the turning moment coefficient, a dimensionless parameter representing the wind-induced turning moment acting on an individual tree, accounting for tree size and competitive environment. Further details on the calculation of TC can be found in the fgr R package (Locatelli et al., 2022). The TC can be further modified following recent (less than 5 years) thinning operations via the TMC_Ratio accounting for differences in the spacing between trees before and after thinning operations. Since the model was run at a single point in time with no thinning operations conducted in the 5 years prior, the TMC_Ratio was set to 1.0. The diameter at base D0 was derived from DBH, tree height and crown depth using the ForestGALES default equation (m). The wood parameters MOR: modulus of rupture (MPa), MOE: modulus of elasticity (Pa) were extracted from Fischer et al. (2016) and Høibø and Vestøl (2010) for spruce and pine growing in Norway and from Peltola et al. (2000) for birch. The spruce and pine values were obtained from dry boards (spruce) and logs (pine) at 12 % moisture content. The conversion to green wood values used in the ForestGALES model was made following the method of Unterwieser and Schickhofer (2011) used by Locatelli et al. (2016). The new values are summarized in the Appendix A, Table A3, along with the equations for the dry to greenwood conversion. The parameter fknot is a species-specific factor accounting for the reduction in wood strength due to the presence of knots. The default value from the ForestGALES model for each of the species considered was used here, namely 0.9 for Norway spruce, 0.85 for Scots pine and 1.0 for birch. The parameter fEdge+Gap: the combined effect of the tree position relative to the upwind stand edge and the size of the upwind gap, and DLF is the deflection loading factor accounting for the added bending moment due to the displaced crown and stem (Locatelli et al., 2022). Finally, the Creg is the species-specific overturning coefficient empirically describing the root anchorage for different soil and rooting depth combinations (Nm kg−1) (Nicoll et al., 2006). See Hale et al. (2012, 2015) and Locatelli et al. (2022) among others for more in-depth information and definitions of the different parts of the ForestGALES model for the individual tree version.
The CWS for damage – the minimum between the CWS for breakage and overturning – was calculated for each tree under three different seasonal scenarios:
-
A “summer” scenario, where birch trees have a full crown and without any snow loading
-
A “fall” scenario, where birch trees have lost their leaves without any snow loading
-
A “winter” scenario, where birch trees are without leaves and tree crowns of all tree species are loaded with the local (1 km resolution) maximum snow load for the winter 2020–2021. Briefly, the maximum snow load on individual tree crowns for the winter 2020–2021 was extracted from the 2013–2023 timeseries of hourly crown snow load calculated following Lehtonen et al. (2014) on the climate data from the same long-term stable post-processed products of the Norwegian Meteorological Institute MET. Note that this method does not account for species' differences in crown shape and probably overestimates crown snow load for birch trees. The frequency distribution of the crown snow load values for the 2020–2021 winter for the 97 MET locations (corresponding to the 205 sites) is shown in Appendix A, Fig. A3.
Finally, the CWS is elevated to a reference height of 10 m. The reference height of 10 m was chosen to (i) ensure consistency with standard meteorological wind products and (ii) to avoid integrating the increasing influence of forest and other ground cover further away from the site of interest tied with calculating the CWS at higher heights.
2.3.2 Probability of damage
The CWS values on their own offer a broad view into which trees are structurally more vulnerable to damage than others, but this does not account for the wind climate of the area. The probability of damage can be calculated in different ways depending on the wind data and model(s) available and chosen. In this study, we tested three methods based on the probability of exceeding the CWS:
-
Using a logistic function (Gardiner et al., 2024): the maximum wind speed observed during the actual winter 2020–2021 (ws20.21) at each location was compared with the calculated CWS. The wind speed was either kept as is or further adjusted by the local Topex value. The equation for predicting the probability of damage is below:
The factor S is a slope factor, and set to 6 as in (Chen et al., 2018; Gardiner et al., 2024). The value Topexmax is taken as the maximum Topex value across all considered locations and for the horizon chosen (i.e. 200, 500 or 1000 m).
-
Using the annual probability of damage using a 30-year time period of wind data and a Generalized Extreme Value Distribution model describing the maximum wind climate at each location. The probability of damage can therefore be calculated as: where G(X ≤x) is defined in Eq. (1).
-
Using the annual exceedance probability function default in the ForestGALES model and fgr package. Using the Weibull A and k parameters describing the mean wind climate, the probability of exceeding the CWS is given using the Fischer–Tippett (i.e. GEV) Type I distribution since the extremes of a dataset following a Weibull distribution (the mean hourly wind speeds) converge towards a Gumbel (GEV type I) distribution. The probability of damage is then given by the function for the annual exceedance probability in fgr (which is a slightly modified type I GEV from Eq. (1):
where the parameters ci for i in {1:5} are constants and equal to (Quine, 2000):
2.4 Validation
In total, we considered the damage predictions from several models covering the different definitions of tree characteristics, seasonal scenarios, forest gap and edge definition and method for calculating the probability of damage (Fig. 2).
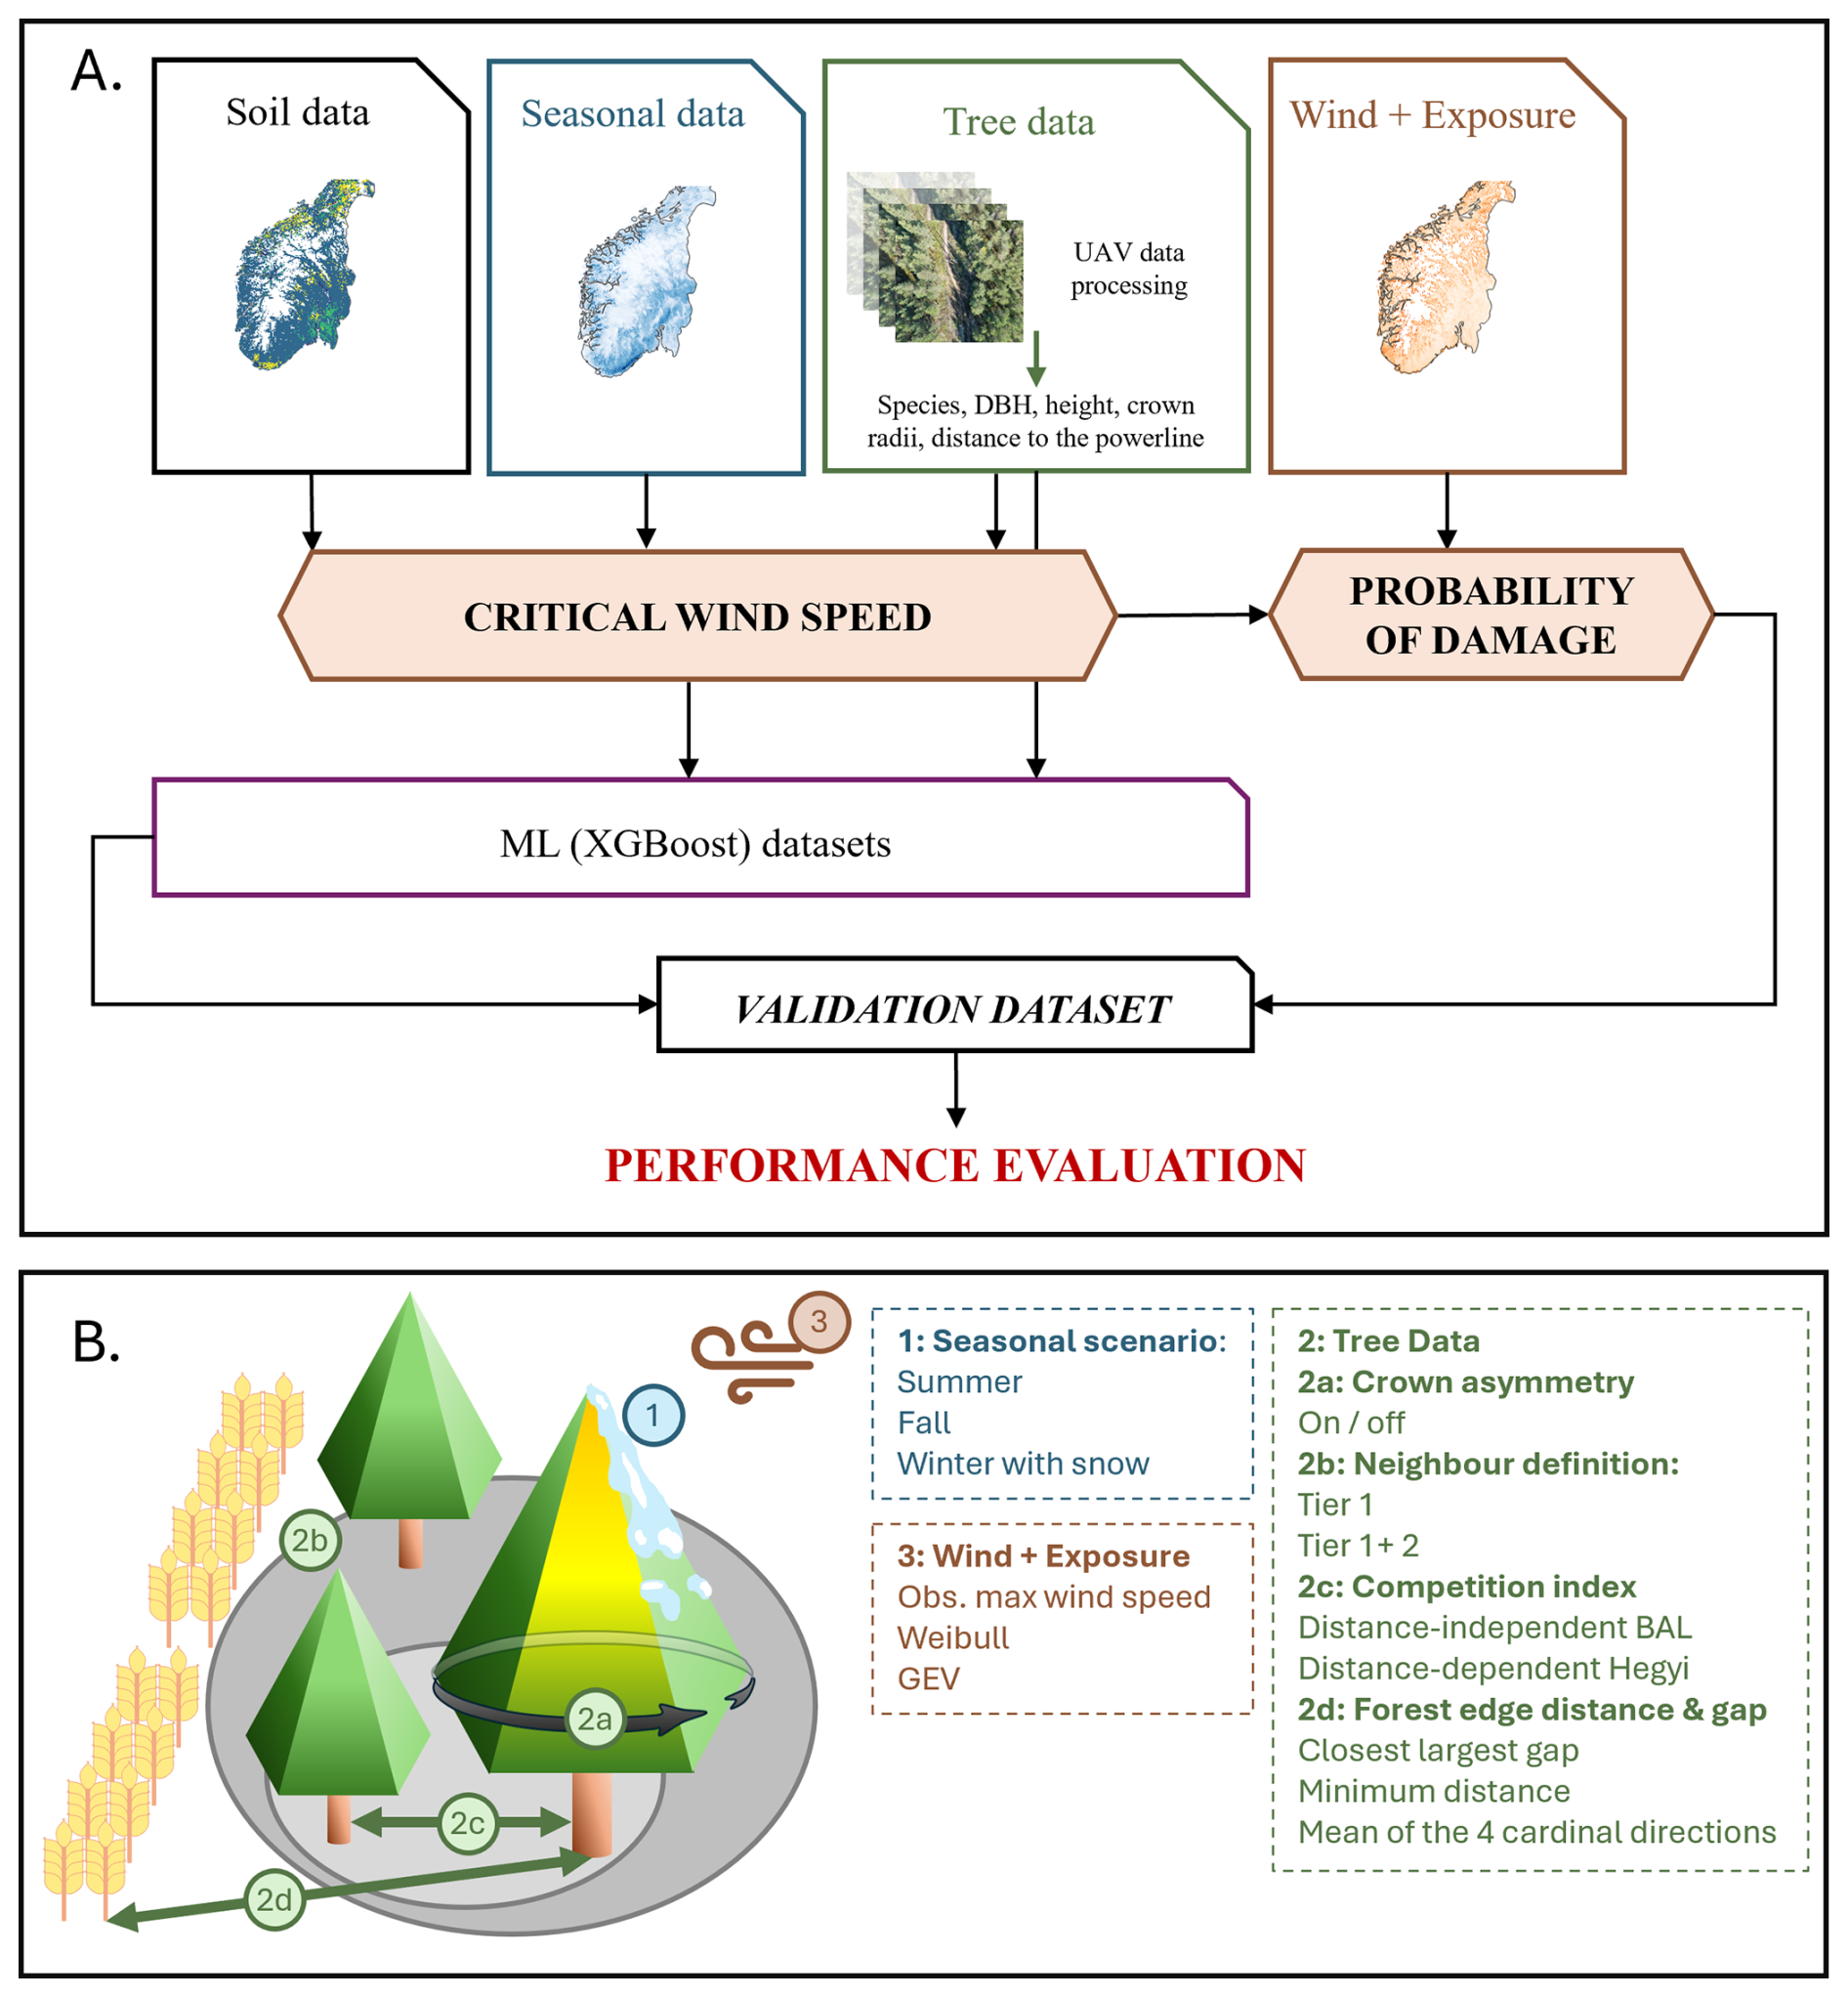
Figure 2Methodological approach used in the study. Box A: The input data (Soil data, Seasonal data, Tree data and Wind + Exposure) are processed and fed into ForestGALES to obtain the Critical Wind Speed and subsequently the Probability of Damage. In addition, the input datasets and the Critical Wind Speed datasets are used in a machine learning (ML) algorithm (XGBoost). The ForestGALES calculated probability of damage and the machine learning datasets are evaluated against a validation dataset – the recorded tree falls along powerlines during the winter 2020–2021 to assess the performance of the two methods. Box B: Graphical representation of the different model options considered in the study split into three categories: 1. the Seasonal Scenario used (Sect. 2.3.1 in the text), 2. the Tree Data processing (Sect. 2.1.2 in the text) and 3. the use of the Wind and Exposure data (Sects. 2.2 and 2.3.2 in the text).
We confronted the damage probability predictions to the observed damage for all models considered. We created contingency tables identifying the true positives (TP), true negatives (TN) and false positives and negatives (FP and FN) for a probability cutpoint varying from 0 to 1 with a step of 0.1. The cutpoint was used to convert the continuous damage probability to a binary prediction of Damage/Standing. We then calculated the sensitivity (TP (TP + FN)) and specificity (TN (TN + FP)) of the models and ranked the discrimination power of the models using the AUC (Area under the curve) of the Receiver Operating Characteristic (ROC). The AUC is commonly used to summarize the accuracy of the model, taking values between 0 and 1. In general, an AUC value of 0.5 suggests no discrimination – the model discrimination ability is no different from random – while values between 0.7 and 0.8 indicates acceptable discrimination, between 0.8 and 0.9 is considered excellent and above 0.9 outstanding (Hosmer et al., 2013).
Given that the data is unbalanced in terms of the ratio of damaged/standing trees as described in Sect. 2.1.3, the assessment of the models' performance (AUC from the ROC) was done on 100 repetitions of balanced damaged/undamaged (N=180 for each) datasets. For each of the N=100 repeated assessments, all 180 damaged trees were combined with a randomly selected subset of 180 standing trees drawn without replacement to produce balanced datasets. The model performance was evaluated in each assessment using ROC analysis, and the results (AUC and other performance metrics) were summarized across the 100 repeated assessments. This approach did not involve cross-validation, instead using a repeated random subsampling (Monte Carlo resampling). It treats each random subsample of standing trees as an equally plausible representation of the undamaged population. Similar results were obtained when performing the analysis on the complete unbalanced dataset.
2.5 Machine learning for improving discrimination
2.5.1 Choice of the eXtreme Gradient Boost machine learning algorithm
Machine learning (ML) methods can provide a complementary approach to mechanistic models such as ForestGALES. The ML models are purely data-driven and can provide predictive power based on complex multivariate relationships that may not be captured in the models or not yet discovered. By combining ForestGALES with an ML model on a multivariate dataset, the calculated CWS and characteristics from the wind climate and landscape exposure to wind may prove to generate better predictions of individual tree fall (Hart et al., 2019). Moreover, ML models can be used as proxy models, approximating the behaviour of a mechanistic model while speeding up the computation time. An ML surrogate using all tree, soil, landscape and wind data bypassing the calculation of CWS could provide a quicker wind risk assessment in decision-support systems for individual tree management for forest stakeholders (e.g. powerline and railway companies). The training of ML algorithms requires however large datasets. The sample of 180 damaged trees in this study is at the low end of sample sizes for fitting ML algorithms. We explored this method nonetheless to assess its potential and set up a precedent for future studies combining ML and ForestGALES. For this reason, no distinction was made between species when running the ML algorithms; only the best global model previously selected was used in determining the CWS used in the input dataset for the ML algorithm.
The ML algorithm used in this study was the eXtreme Gradient Boosting algorithm (XGBoost), an efficient and reliable method for regression and classification (Chen and Guestrin, 2016). The algorithm is a tree-based incremental learning process. At each iteration, a new weak learner is trained based on the error of the decision tree previously learned. Gradient boosting iteratively adjusts the predictions of the decision trees by minimizing the loss function (based on the error between the predicted and observed values), splitting and removing less significant tree nodes. Then, all decision trees are combined, and the predictions from each tree are weighted based on their importance. The iterative process is repeated until either a specific number of iterations are completed, or a predefined criterion is met. Many of the hyperparameters of the XGBoost algorithm can be modified and tuned. To keep it simple, we did not tune the hyperparameters and we used a set of default hyperparameters following the documentation of the xgboost R package. The values used for the main hyperparameters of the XGBoost algorithm are summarised in the Appendix A, Table A4.
2.5.2 Input datasets to the XGBoost algorithm
Two types of datasets were used in the XGBoost algorithm. The first dataset – hereafter referred to as the “ForestGALES-ML” dataset – contained the individual tree CWS value calculated by ForestGALES, the exposure index Topex at 200 m, and a variable describing the local wind climate: either the maximum observed wind speed during the winter 2020–2021 (“max_ws”), the 1-year return level (i.e. the location parameter) of either the GEV model (“return_gev”) or the Weibull model (“return_weib”). By using this first dataset, we assessed the potential in combining a mechanistic model (ForestGALES) to obtain a vulnerability index (CWS) and then a ML algorithm to obtain better damage predictions. The second dataset – hereafter referred to as the “TreeChar-ML” dataset – contained the same individual tree information used as input to the ForestGALES model (tree height, DBH, crown width and depth, crown offset, stand mean DBH, crown width and depth, and stand top height) as well as the ForestGALES soil and rooting depth classes, the exposure index Topex at 200 m and one of the three available variables describing the local wind as in the “ForestGALES-ML” dataset.
2.5.3 Training of the XGBoost algorithm and assessment
We trained the XGBoost algorithm in the same way for both datasets. The input dataset was biased towards a uniform class distribution as described in Sect. 2.5, selecting an equal number of damaged and standing trees, N=180, 100 times. For each of the 100 datasets, the XGBoost algorithm was trained and tested using a 10-folds cross-validation procedure. The data was randomly partitioned into 10 subsamples (folds) of equal size. Nine folds are combined to train the algorithm, and the last fold is used to test the algorithm. The procedure was repeated by leaving out each of the 10 folds in turn. The AUC value, accuracy and feature (variable) importance (measured with the gain – the fractional contribution of each variable to the model) were measured as the mean from their respective values for each of the 10 repetitions from the cross-validation procedure. The AUC, accuracy and feature importance reported hereafter are their mean (and standard deviation “SD”) values across the 100 repetitions.
The XGBoost algorithm returned a probability of damage. The discrimination threshold between damaged and standing trees used was 0.5, such that a probability equal or greater than 0.5 resulted in the damaged classification.
A summary figure of the methodological approach and entire process is described in Fig. 2.
2.6 Software
We accessed and processed the meteorological data using GDAL/OGR 3.4.3 (Rouault et al., 2022), and CDO version 1.9.9rcl (Climate Data Operators, https://mpimet.mpg.de/cdo, last access: 29 May 2026). All analyses were done using the statistical software R 4.3.3 (R Core Team, 2024). The GEV model fitting was performed with the extRemes package (Gilleland and Katz, 2016). The fgr R library (Locatelli et al., 2022) and its extension in a C version (Merlin et al., 2025) implemented in R with the Rcpp package version 1.0.11 (Eddelbuettel et al., 2023) were used to calculate the individual CWSs. The XGBoost algorithm was fitted with the xgboost package (Chen et al., 2024). Maps were generated using the terra and tidyterra packages (Hernangómez, 2023; Hijmans, 2024) and all other figures with the packages ggplot2 and ggpubr (Kassambara, 2023; Wickham, 2016).
3.1 Characteristics of damaged and undamaged trees
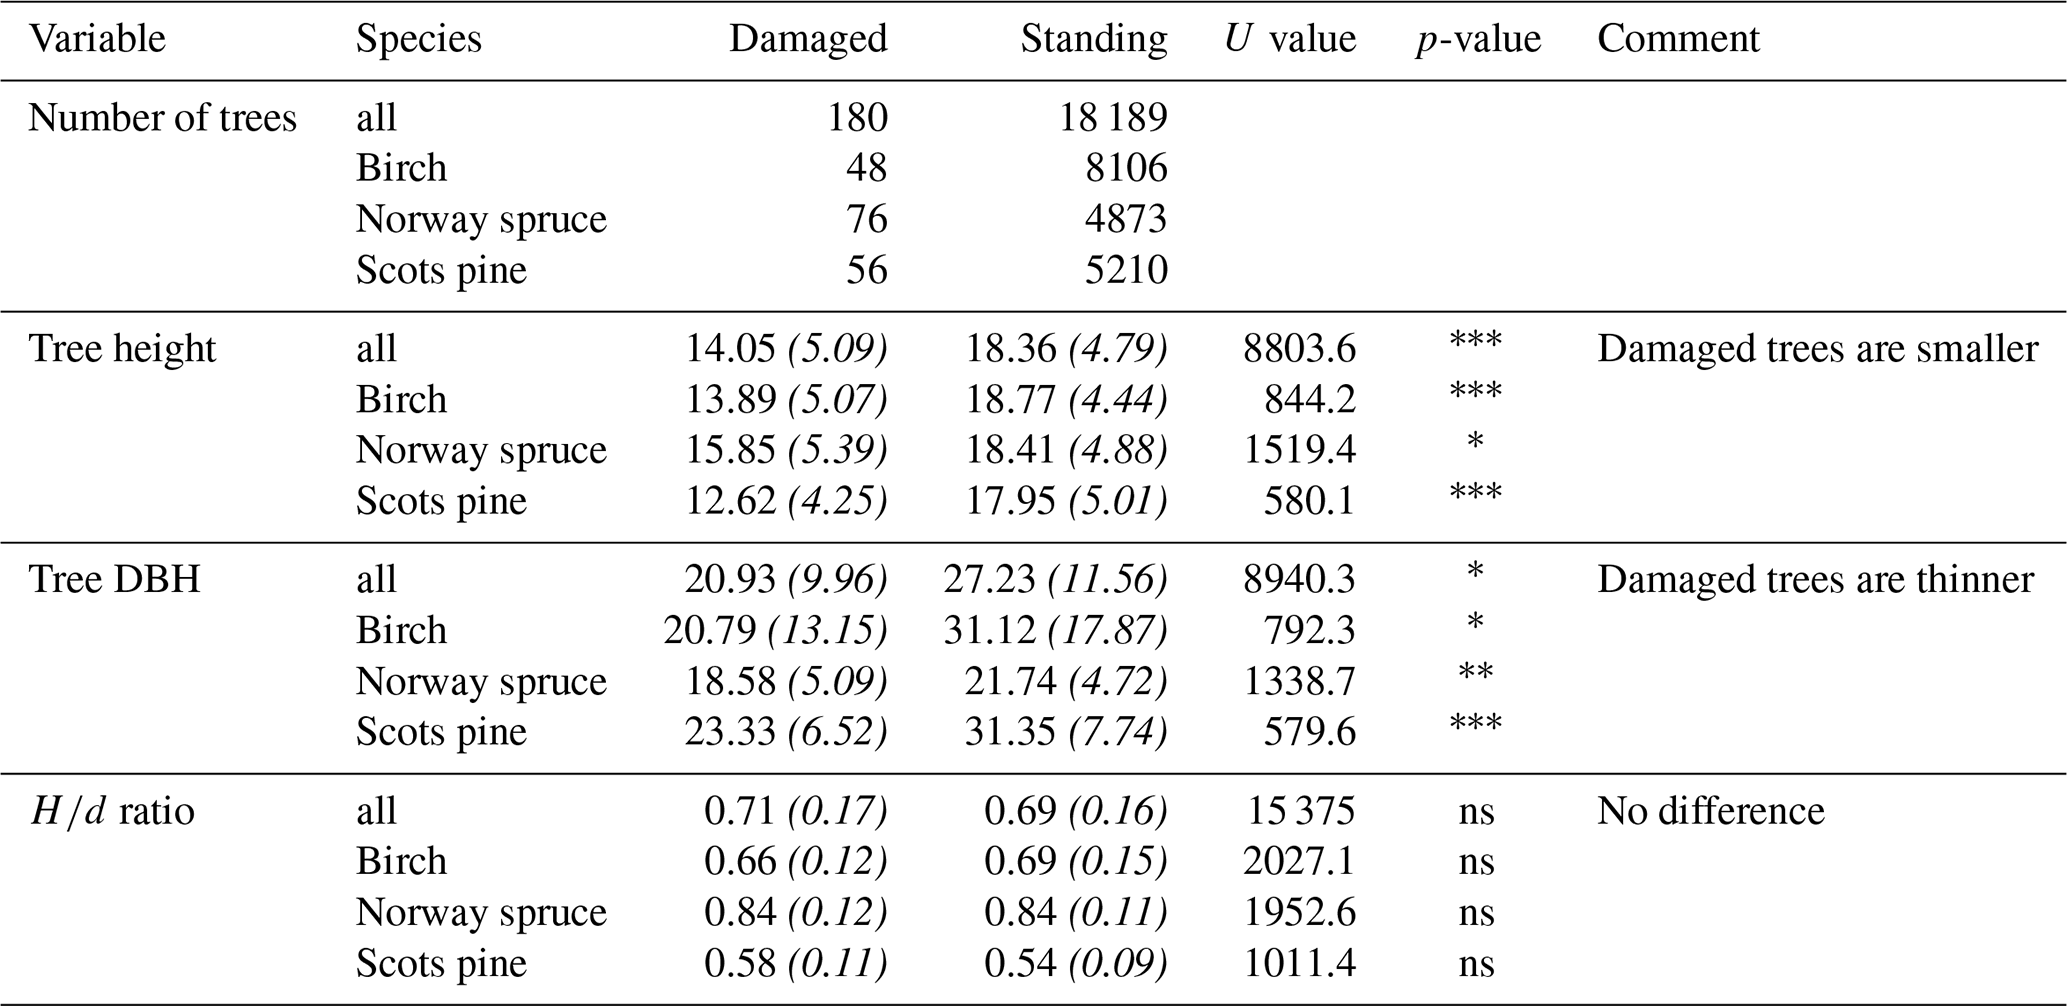
Basic information on the tree height and DBH of the damaged versus standing trees is presented in Table 1. The damaged trees tended to be smaller in both height and diameter than the standing trees, whether considering all species together or individually. No significant difference in the ratio was found between the damaged and standing trees for any of the three species. The damaged trees were typically not the tallest trees in their surroundings and were similar to the standing trees in their relative height to the surroundings' top tree. The damaged trees tended to have a smaller ratio of crown depth to tree height (meaning that they had a shorter crown for a given height) than the standing trees, but this result was mostly driven by Scots pine and birch trees to a lesser extent (results not shown). There was no difference in the tree type (same species, different species and conifer or different species and broadleaf) of the surrounding trees between damaged and standing trees.
Table 1Mean (standard deviation) values statistics between the damaged and undamaged (standing) trees for tree height (in m), tree DBH (in cm), the ratio of tree height to DBH (“ ratio”) between the damaged and undamaged (standing) trees. The U statistic (Mann–Whitney–Wilcoxon test) are shown, along with the p-value associated with those statistics. ∗ p<0.05; p<0.01; p<0.001, ns: not significant (p>0.05).
3.2 Damage probability during the winter 2020–2021
3.2.1 Performance of all tested models
Several options were tested for calculating the CWS and probability of damage: the use of a crown offset, neighbour level, competition index, seasonal scenarios, type of CWS in terms of gap and edge definition, wind data/model type and the use of multipliers for CWS and the wind speeds (summarized in Fig. 2). All models were assessed for their discrimination power – defined by the AUC – based on the calculated probability of damage using 100 repeated assessments with a balanced sample of damaged and standing trees (see Sect. 2.5). Only 20 % (global models) and 23 % (species-specific models) of all tested models yielded an AUC above 0.6. The mean AUC across the different alternatives for all the tested models an AUC above 0.6 are presented in Appendix B, Fig. B1. Among the models with an AUC above 0.6, the models with the BAL competition index significantly outperformed the alternative for the global and species-specific models except for Norway spruce. The models using the tier 1 & tier 2 or tier 2 neighbour levels had higher AUC values than the alternative neighbour level. There were no clear differences in performance among the alternatives for the inclusion of the crown offset and CWS type across all the tested global and the species-specific models. The different seasonal scenarios performed similarly for the global models, but the AUC values for the winter scenario were lower for birch (significant difference) and Norway spruce (non-significant difference) and higher for Scots pine than the fall and summer scenarios. Surprisingly, the use of the GEV wind model performed the worst: only 9 % of all models using the GEV wind model yielded an AUC value above 0.6. Despite representing the extreme wind climate at each location, it performed worse than the Weibull model which described the mean wind climate (Appendix B, Fig. B2). Using a logistic probability function with the actual observed maximum wind speed for the winter 2020–2021 (“Actual WS”, Eq. 4) yielded the highest AUC across the different wind data/model options for the global and species-specific models except for Norway spruce where the use of the Weibull model outperformed it (by 0.05 AUC units, Appendix B, Fig. B2). Overall, including a Topex correction did not improve the performance of the models under the “Actual WS” alternative (Appendix B, Fig. B2).
3.2.2 Best global and species-specific models
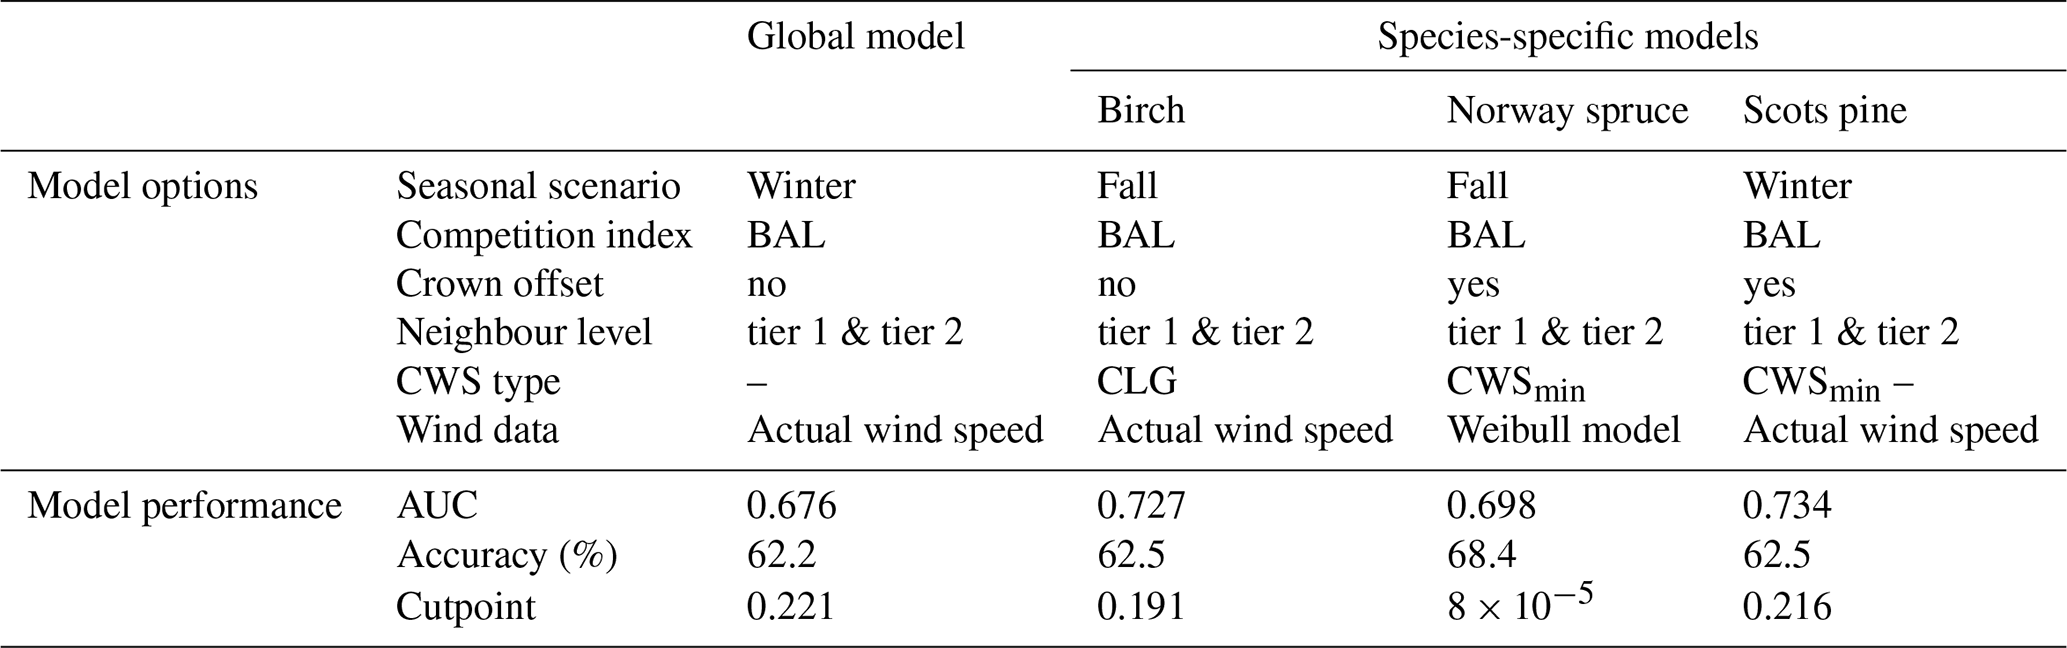
The best global and species-specific models – the ones achieving the highest AUC values under the 100 repeated assessments – were selected and presented in Table 2. None of the global models achieved an AUC value above 0.7. The best global model yielded an AUC of 0.676. The best species-specific models all achieved AUC values at or above 0.7. The cutpoint (for converting the damage probability predictions to binary Damaged/Standing predictions) was generally quite low across the selected best global and species-specific models, indicating that the ForestGALES model overestimates the CWS, therefore overestimating of the damage probability.
Table 2Description and performance assessment of the best models for predicting the observed tree damages during the winter 2020–2021. The best models across species (“All”) and for each of the species were the models which yielded the highest AUC values across the 100 repeated assessments of model performance using a balanced sample of damaged and standing trees (). When the symbol “–” is used for one of the model options, this indicates that all of the option's alternatives yielded a similar AUC value. Accuracy of the model is calculated at the cutpoint, i.e. the probability threshold where model Sensitivity and Specificity are equal. CLG: Critical Wind Speed from the closest largest gap when available.
The ROC curve for the best global and species-specific models selected is presented in Fig. 3, using all samples. The overall accuracy of the best global and species-specific models was ∼64 %, meaning that about 64 % of the damaged and standing trees were correctly identified by the models.
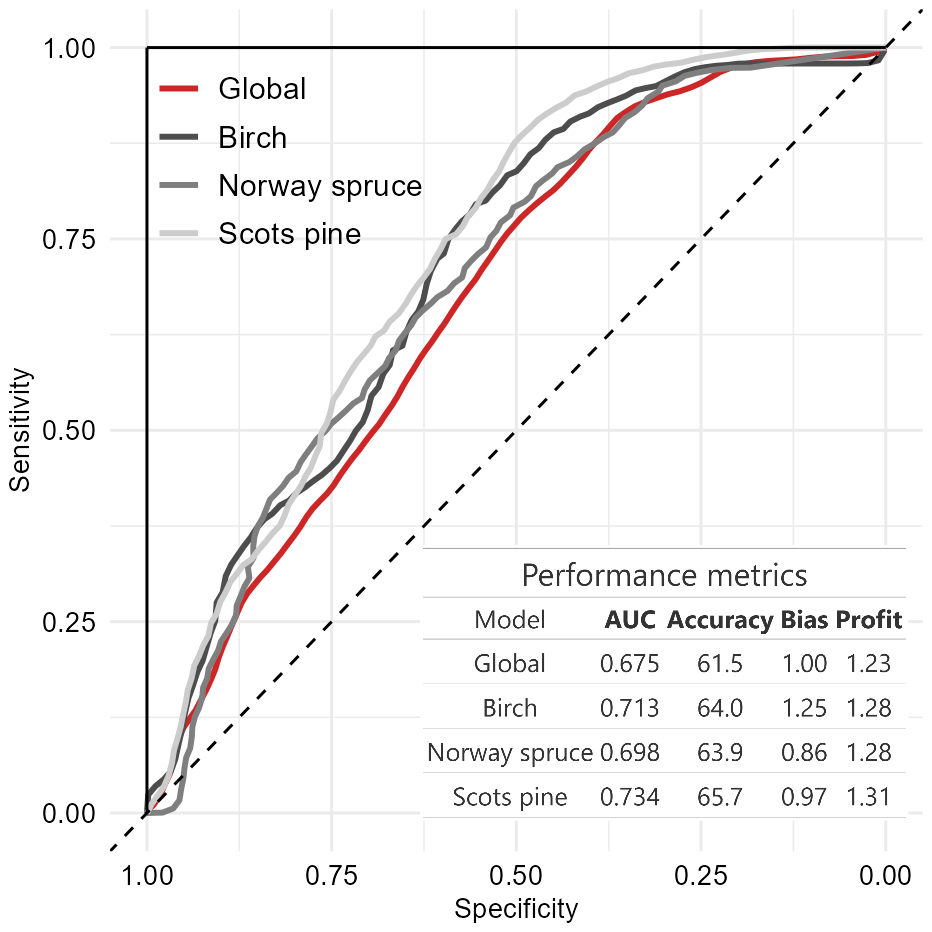
Figure 3Receiver Operator Characteristic (ROC) curve and performance metrics for the prediction of the probability of tree damage during the winter 2020–2021 using the best global and species-specific model options (see Table 2). The average of the 100 repeated assessments using balanced sample of N_damaged =N_standing =180 was used for the figure. The AUC is shown in the table, along with the summary of the average performance metrics (Accuracy in percentage, Bias, and Profit scores) for the cutpoint at which Sensitivity = Specificity.
3.3 Improved damaged predictions with machine learning
A simple implementation of an extreme gradient boosting algorithm was used to improve the predictions of individual tree damage, building on the selected best global model previously identified. The XGBoost algorithm output a probability of damage, which was then transformed into a binary prediction of Damaged/Standing using an arbitrary threshold of 0.5. The algorithm yielded outstanding classification results with both the “ForestGALES-ML” and “TreeChar” datasets, with a mean AUC of or above 0.9 for all three wind variables used across the 100 repetitions. The results with the ForestGALES-ML dataset slightly outperformed the ones with the TreeChar-ML dataset (Fig. 4).
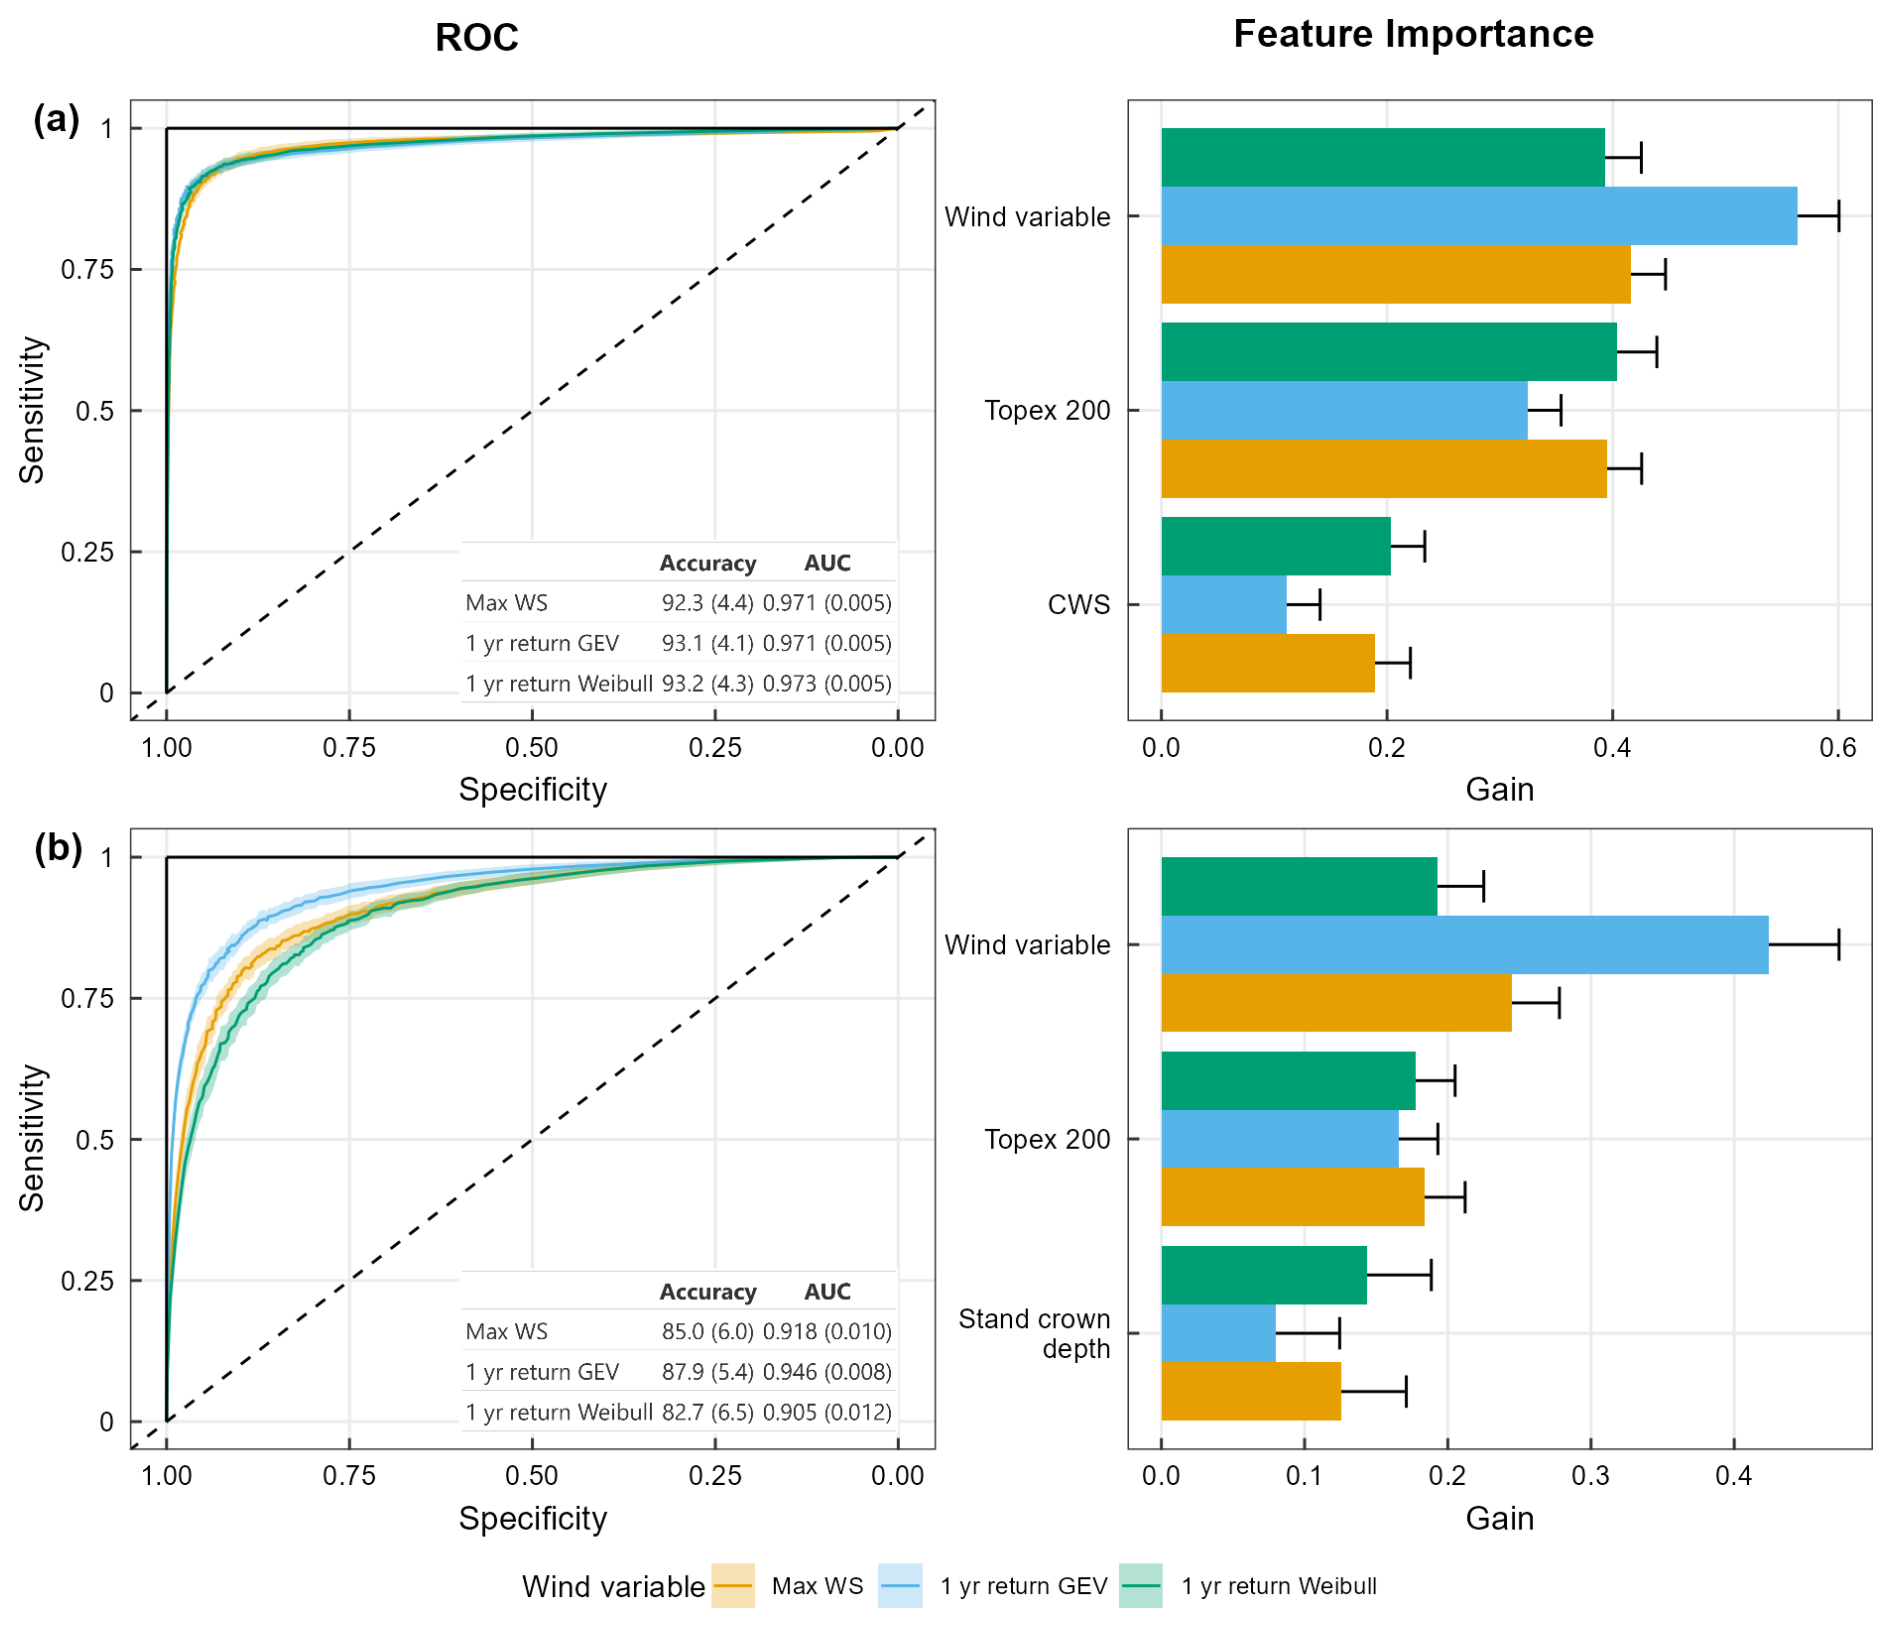
Figure 4Summary of the XGBoost algorithms performance (ROC curve; left) and feature importance for the top three contributing variables (right) when using the “ForestGALES-ML” dataset (a) and the “TreeChar-ML” dataset (b) for the 100 repetitions across the three alternatives for the wind variables. The three alternatives are: Max WS (in orange), the 1-year return GEV (blue) and the 1-year return Weibull (green). The mean (and SD) AUC and accuracy across the 100 repetitions of the 10-folds cross-validation procedure for each alternative of the wind variables are shown as a table in the two left panels.
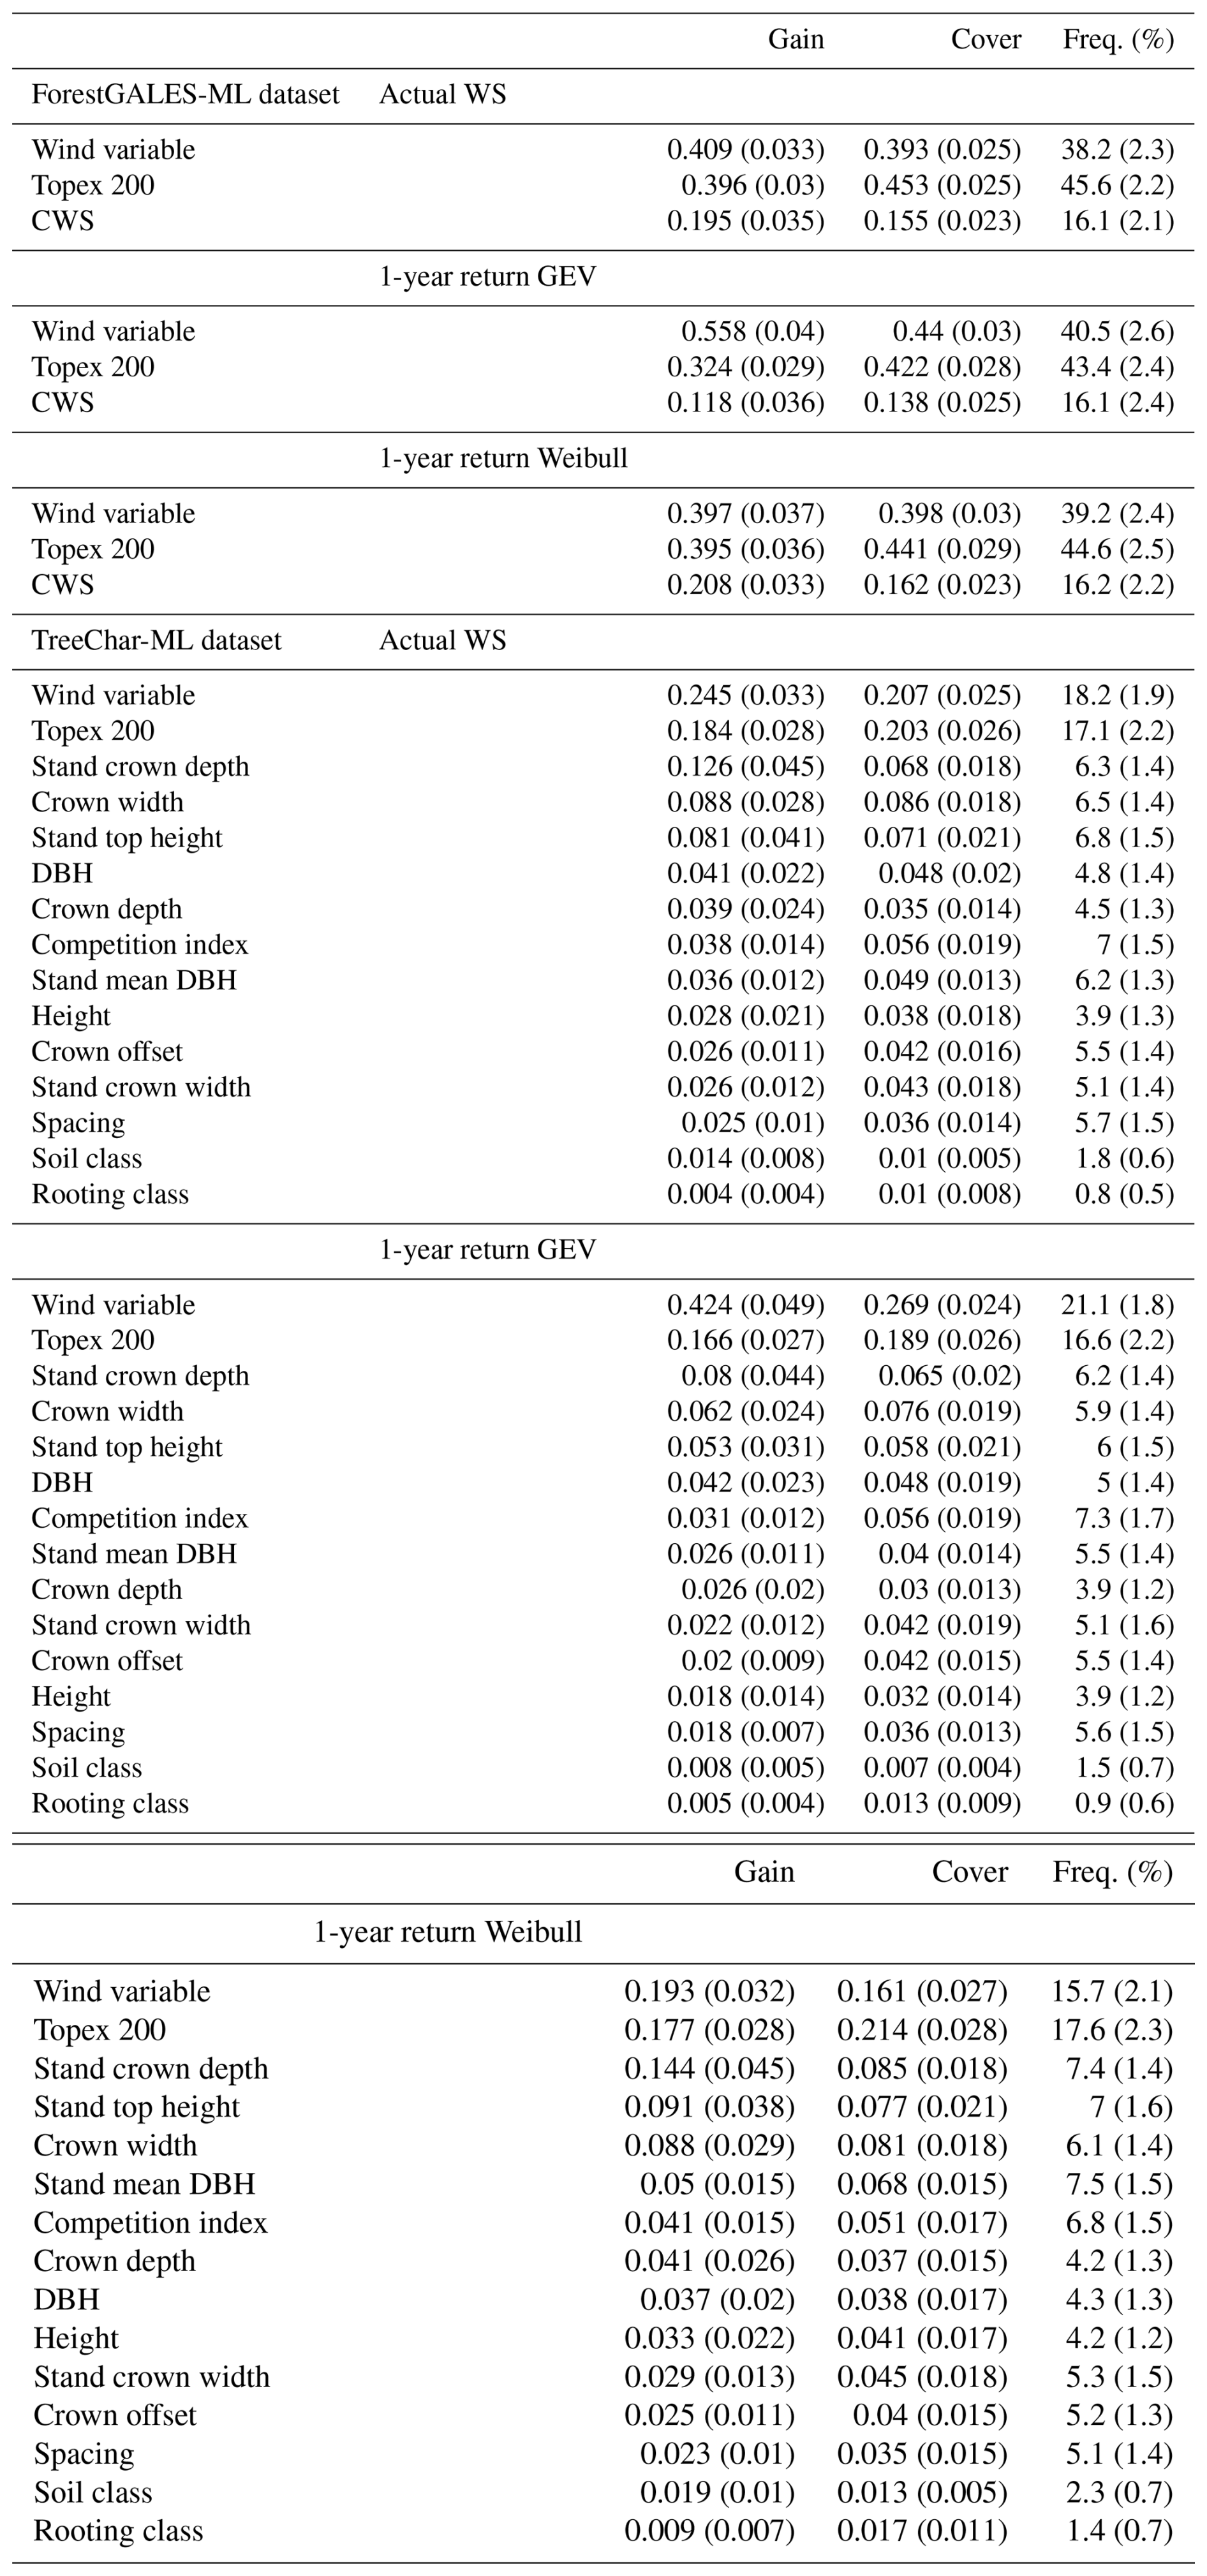
Across both the “ForestGALES-ML” and “TreeChar” datasets, the wind variable and Topex at 200 m were the two variables with the highest mean gain (Fig. 4). The CWS came in third and last for the XGBoost algorithm applied to the “ForestGALES-ML” dataset, while a mix of stand and tree variables shared the lower ranks of feature importance for the “TreeChar-ML” dataset (see the Appendix B, Table B1 for the full list and feature importance metrics for both datasets).
Considering the large importance of the Topex200 variable in the XGBoost algorithms, we removed it and ran the XGBoost algorithms on both datasets once more to assess the ability of the ML algorithm to predict wind damage without this variable. The removal of Topex200 slightly accentuated the differences in performance between the three alternative wind variables used in the XGBoost algorithms. For both datasets, the use of the 1-year return GEV outperformed the other two alternatives (results not shown). On average, the removal of Topex200 decreased the mean AUC by 0.04 points for both the ForestGALES-ML and TreeChar-ML datasets. Similarly, the accuracy dropped by an average of 4 % across the three alternative wind variables. The wind variable was then further removed from the XGBoost algorithm input for the TreeChar-ML dataset to assess its performance when considering only tree characteristics variables. The AUC was then significantly reduced, down to 0.763 for an accuracy of ∼70 %.
This study used the hybrid mechanistic wind risk model ForestGALES to predict individual tree fall during winter 2020–2021 along powerline strips in southern and western Norway. This is the first study using ForestGALES at the individual tree level considering both wind and snow load in predicting tree fall. The model performed reasonably well. Its performance varied across species, and across how tree characteristics, environment and the probability of damage were defined. The machine learning results performed excellently and painted the familiar picture of Risk = Vulnerability × Exposure. It highlights the importance of the background wind, local shelter modulating the background wind in the landscape, and tree vulnerability when predicting wind damage. These results reaffirm the potential of using ForestGALES operationally in designing precision vegetation management along linear infrastructure (Gardiner et al., 2024).
4.1 Remote sensing methods for mapping vulnerable trees along linear infrastructures
Remote sensing techniques have proven invaluable both for informing precision forest management and rapid damage assessment. Precise and individual tree-based vegetation management along linear infrastructures requires detailed data at the individual tree level (Sey et al., 2023). Here, the UAV-LS method provided accurate positioning of individual trees along powerlines and in their immediate environment. It allowed for a better characterization of the individual tree crown characteristics important in the calculation of the CWS. The use of a higher point cloud density in the UAV-LS system could provide a direct estimation of the trees' diameter and crown length (Straker et al., 2023), two critical variables in the CWS calculation (Locatelli et al., 2017). This however comes at a higher cost and a more intensive post-processing task, which may be impractical for operational vegetation management currently. After a storm event, remote sensing can quickly, efficiently and safely map windblown trees, especially in complex and difficult terrain (Dalponte et al., 2020; Reder et al., 2025). This is critical for a rapid assessment of the damage for forest owners, managers, insurance companies and other institutions but also may provide a rapid expansion of available damaged datasets to test and validate models such as ForestGALES. Validation data remain scarce for storm events especially in complex landscapes such as in Norway, and when the threat of secondary mortality from insects and pathogens benefitting from windblown trees (e.g. spruce bark beetle in spruce-dominated stands) requires rapid salvage logging operations. Remote sensing methods can be deployed quickly and contribute to filling this data gap.
4.2 Fair performance of ForestGALES in identifying vulnerable trees
Compared to the traditionally used ratio which showed no difference between damaged and standing trees here, the performance of ForestGALES in identifying vulnerable trees was adequate across all model specifications considered (see Fig. 2 and Appendix B, Figs. B1 and B2). In general, the differences in AUC across all the model specifications were rather small, on average less than 0.05 points in AUC (Appendix B, Fig. B2) but up to 0.2 points for the wind data type used. Not all model specifications performed similarly across the three tree species – e.g. the conifer models showed improved performance when accounting for the crown offset but not the birch model nor the global model. This may stem from species differences in the role of the different variables in the determination of their vulnerability against wind – the example of the crown offset may come from the difference in crown shape and contribution to wind vulnerability between the tree species considered, from unexplained bias in the dataset emerging in the results (e.g. the better performance of the Weibull model for the Norway spruce model) or from the rather simple crown shape used in ForestGALES. In summary, the best model across species for predicting damage in the winter 2020–2021 season considered the addition of crown snow load, with a basal-area based competition index between trees (BAL) but without considering the crown offset, accounting for the larger immediate environment (tier 1 & tier 2 neighbour level) and using the actual observed wind speed for the calculation of the probability of damage.
The middling performance of ForestGALES highlights some of this study's limitation and opportunities for future work. The discrimination between standing and damaged trees was adequate but failed to reach the commonly accepted threshold of 0.7 of good discrimination power across almost all the tested models. ForestGALES was soft-parametrized for the Norwegian forest conditions (from Merlin et al., 2025) therefore may fail to capture local and more complex variations in wood, root anchorage properties, and crown structure observed across the study area. Statistical parametrization and further development to the model could be considered (Lorenz et al., 2025; Stadelmann et al., 2025) but requires extensive damaged datasets. In general, the model's damage predictions were too conservative – as seen with the rather low cutpoint for damage in the ROC analysis (Table 2). Overestimation of the critical wind speed may stem from unaccounted factors at the tree level such as tree age and health. Importantly, decay and root rot caused by Heterobasidion sp. in Norwegian forests and more specifically in spruce-dominated forests – is a major disturbance agent which targets the root system and progresses up the stem, significantly weakening the anchorage and resistance of the tree against wind (Krisans et al., 2020; Žemaitis et al., 2024). This is also the first time the snow load module of ForestGALES was used in assessing wind damage risk at the individual tree level. The snow module has yet to be validated in the field and uncertainties around the crown snow load calculations can further bias the estimate of CWS under snow load. Note that a derivation of this snow module in ForestGALES was used and successfully tested in Zubkov et al. (2024). However, this study's results are the first step towards validation, and brings forth the importance of seasonal conditions when considering wind damage in trees. Beyond the CWS estimation, we've seen that the type of wind data used influences the results. The choice between using the mean maximum historically observed wind speed, Weibull model parameters of mean wind climate or the extreme value model for extreme wind climate should be made according to the scenario in line with this study. No extreme wind speeds were observed during the 2020–2021 winter season – hence the relatively poor performance of the GEV models. We are also operating at the limit the ForestGALES model, developed for estimating damage vulnerability during storm events, and had a limited number of damaged trees. Therefore, we cannot exclude that some of the recorded tree falls may have occurred due to other factors than wind (for example root rot damage for Norway spruce trees).
4.3 Improving damage predictions with Machine Learning
Combining machine learning algorithms with the vulnerability index from ForestGALES significantly improved the damage predictions at the individual tree level. The machine learning model applied solely to the tree characteristics dataset (called “TreeChar-ML” in this study) showed much better performance than the ForestGALES model alone. More importantly, the machine learning model integrating the CWS as one of the predictors performed even better. It highlights the possibility to rely on both our understanding of the mechanics of wind damage on trees and forests with machine learning for accounting for yet unknown factors or processes that affect the risk of damage. Several recent studies have already seen the potential for machine learning to identify trees vulnerable to wind damage (Jahani and Saffariha, 2022; Morimoto et al., 2021; Pawlik and Harrison, 2022). Combined with remotely sensed data, it can provide a powerful tool to accurately map scattered and sparse damage areas in complex terrain to manage efficient and safe salvage logging operations. Nonetheless, one critical aspect of using machine learning models is their reliance on large input datasets. The performance of ML algorithms and their subsequent use depends on the quantity and quality of the data supplied to train the models, which can be limited in the case of forest ecology (Liu et al., 2018) and even more for scattered forest damage. Our study had a very limited number of fallen trees (N=180), nearing the lower limit for applying ML algorithms thus interpretation should be made cautiously. An effort to routinely collect comprehensive wind-driven damage data should be a priority to improve the ML algorithm training, necessary for using the model for damage predictions in other locations in Norway.
4.4 Risk mapping for single-tree management along linear infrastructures
The identification of vulnerable sections based on individual tree surveys could be the most practical goal for implementing a routine vulnerability assessment in vegetation management plans along linear infrastructures. Our study and a previous study along railway lines in Germany (Gardiner et al., 2024) showed that prediction at the individual tree level using ForestGALES alone is adequate or even good. In practice, utilities and other companies or institutions managing linear infrastructures are unlikely to design management plans based on individual tree predictions. Rather, the identification of vulnerable or priority sections can provide a solution mitigating costs while targeting vulnerability issues and designing smart vegetation management plans. The calculation of the CWS with ForestGALES (or a similar damage threshold index) at the individual tree level could be translated into vulnerability along forest sections and integrated in the management assessment process. Unfortunately, this option could not be investigated in this study due to the sampling design. It can be tied together with modules exploring economic consequences and scenario preparation, finally assigning a wind and economic vulnerability score later used in drafting vegetation management plans. The powerline companies have a strong interest in developing and implementing such processes – from remotely sensed individual tree data to a vulnerability score along forest sections to prioritise their management efforts and reduce damage risks.
Routes for the new linear infrastructures could therefore be evaluated in terms of potential wind damage risk with ForestGALES, along with other measures of impacts (biodiversity, timber production, slope stability etc…) using remote sensing for surveying the available landscape or with existing high-resolution forest resource maps. Such a comprehensive assessment can help balancing risk mitigation with provisioning of ecosystem services and minimize the footprint of linear infrastructures expansion in forests (Dupras et al., 2016; Garfinkel et al., 2023). Different management strategies can also be explored for these new routes but also for existing routes when combining ForestGALES with forest stand and tree dynamics models over time, thereby informing the managers of the range of options, trade-offs and potential feedbacks that different management options offer (Öhman et al., 2025).
Mathematical modelling based on high-resolution remote sensing data has a potential for estimating the probability of wind-throw for individual trees along linear infrastructures under different seasonal and climate scenarios. The ForestGALES model performed adequately, while an extension of this into an ML approach performed better. We believe this represents a possible support for managing trees along linear infrastructures in the forest. It can be integrated in a process evaluating and optimizing different vegetation management strategies to balance economic and safety aspects, wind risk, and other forest ecosystem services.
A1 Processing of the individual tree dataset
A1.1 Species specific equations for estimating diameter at breast height and stem volume
Table A1Species-specific dendrometric equations for estimating diameter at breast height (DBH, cm) from UAV-LS (unmanned aerial vehicle – drone – Laser scanning) derived mean height and crown dimensions (area and diameter) based on a field survey conducted by eSmart Systems in summer 2021.
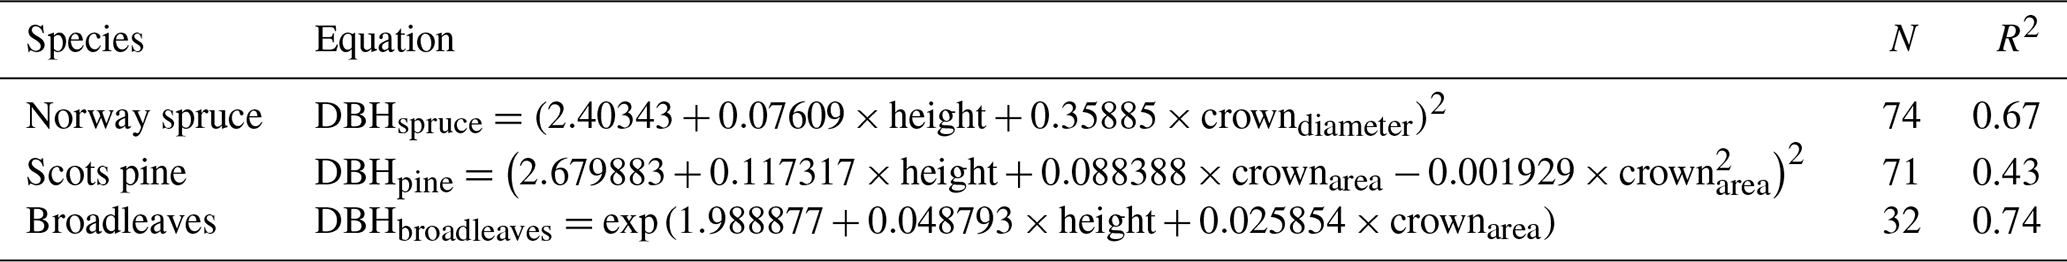
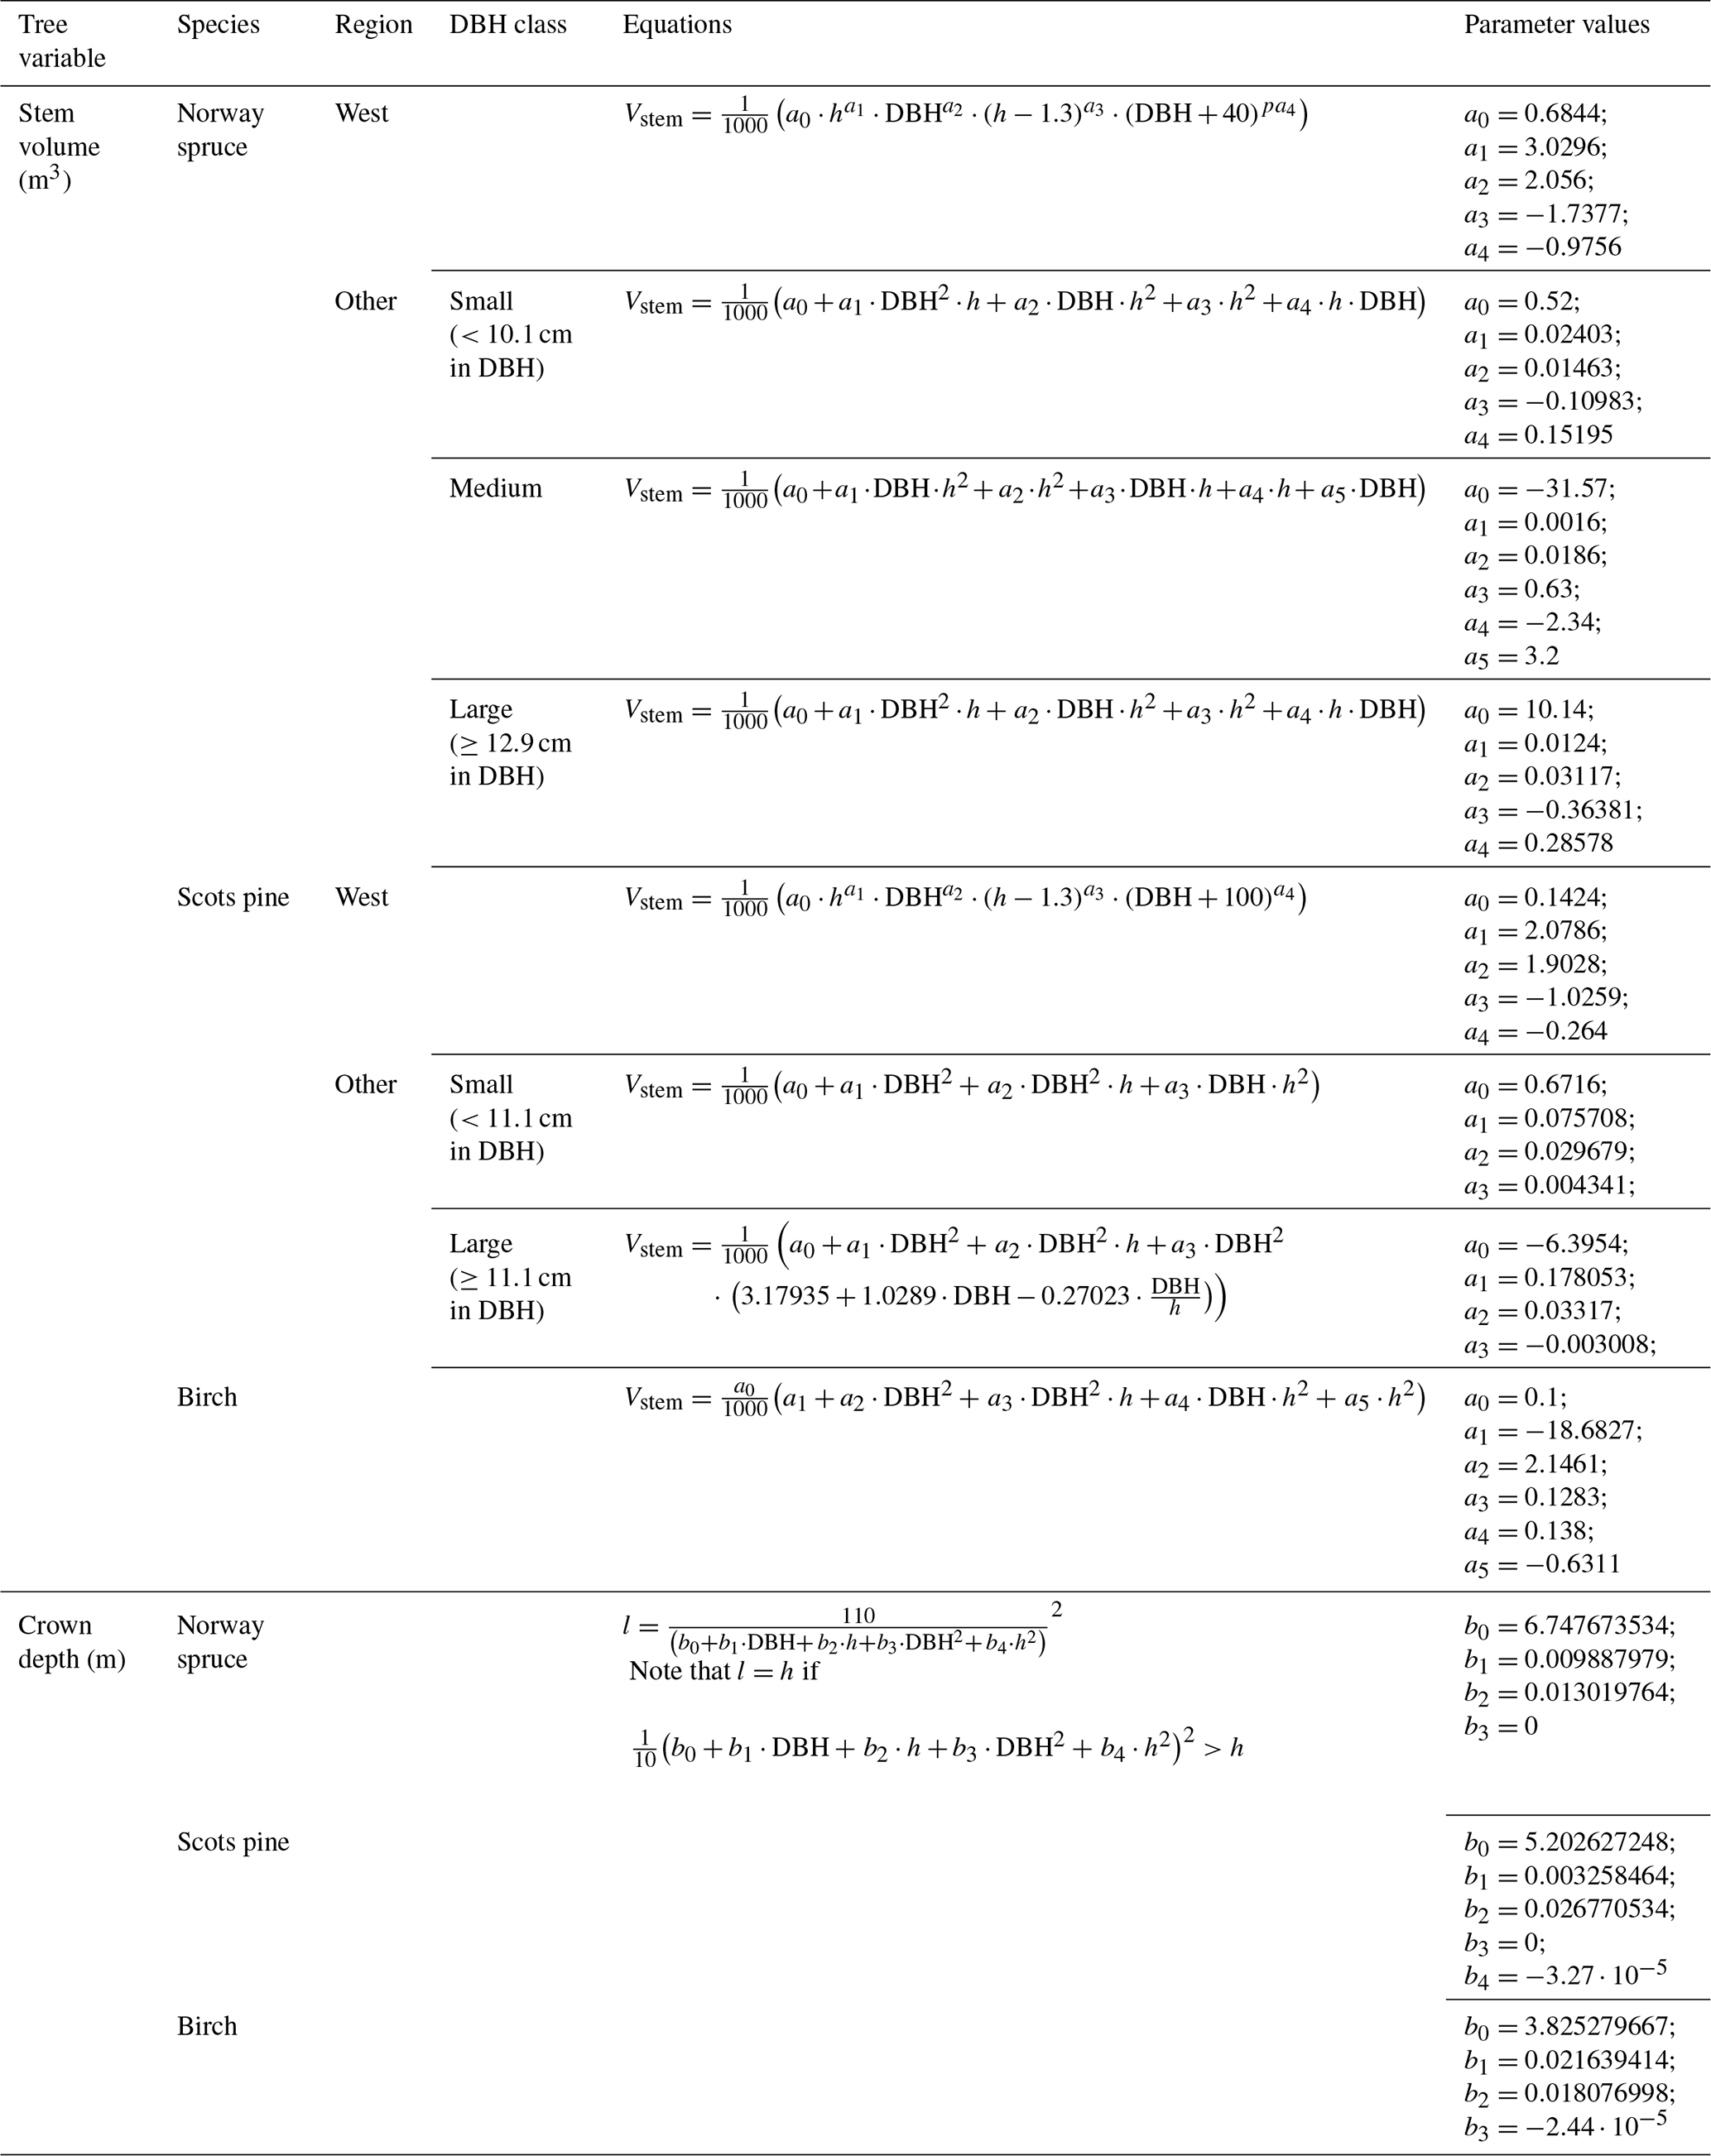
Table A2Norwegian specific allometric and dendrometric equations for estimating mean stem volume and crown depth – taken from Merlin et al. (2025). Stem volume is calculated following the equations used in the Norwegian National Forest Inventory (Braastad, 1966; Brantseg, 1969; Vestjordet, 1967). The crown depth equations were based on the latest available complete NFI dataset (2016–2020 period).
A1.2 Displacement of the crown centre of gravity under asymmetry
A measure of the crown asymmetry for each tree was done using the 8 crown radii available in the single tree dataset. We estimated the displacement of the centre of gravity between a right circular cone shape and an irregular cone. The centre of mass is assumed to be at height of the crown depth above the crown base under both scenarios. The calculation went as follows: first each of the 8 radii and their direction (expressed as an angle from 0 to 315°) were positioned on the xy plane (centred on the positioning of the top of the tree) (Eq. A1a) where i is one of the 8 cardinal directions. Second, the position (xg; yg) of the centre of gravity was calculated as the mean of the 8 pairs (xi; yi) (Eq. A1b). Finally, the crown asymmetry was calculated as the distance between the theoretical crown centre of gravity – taken as the position of the top of the tree, i.e. the origin of the xy plane – and the calculated new position of the centre of gravity (Eq. A1c).
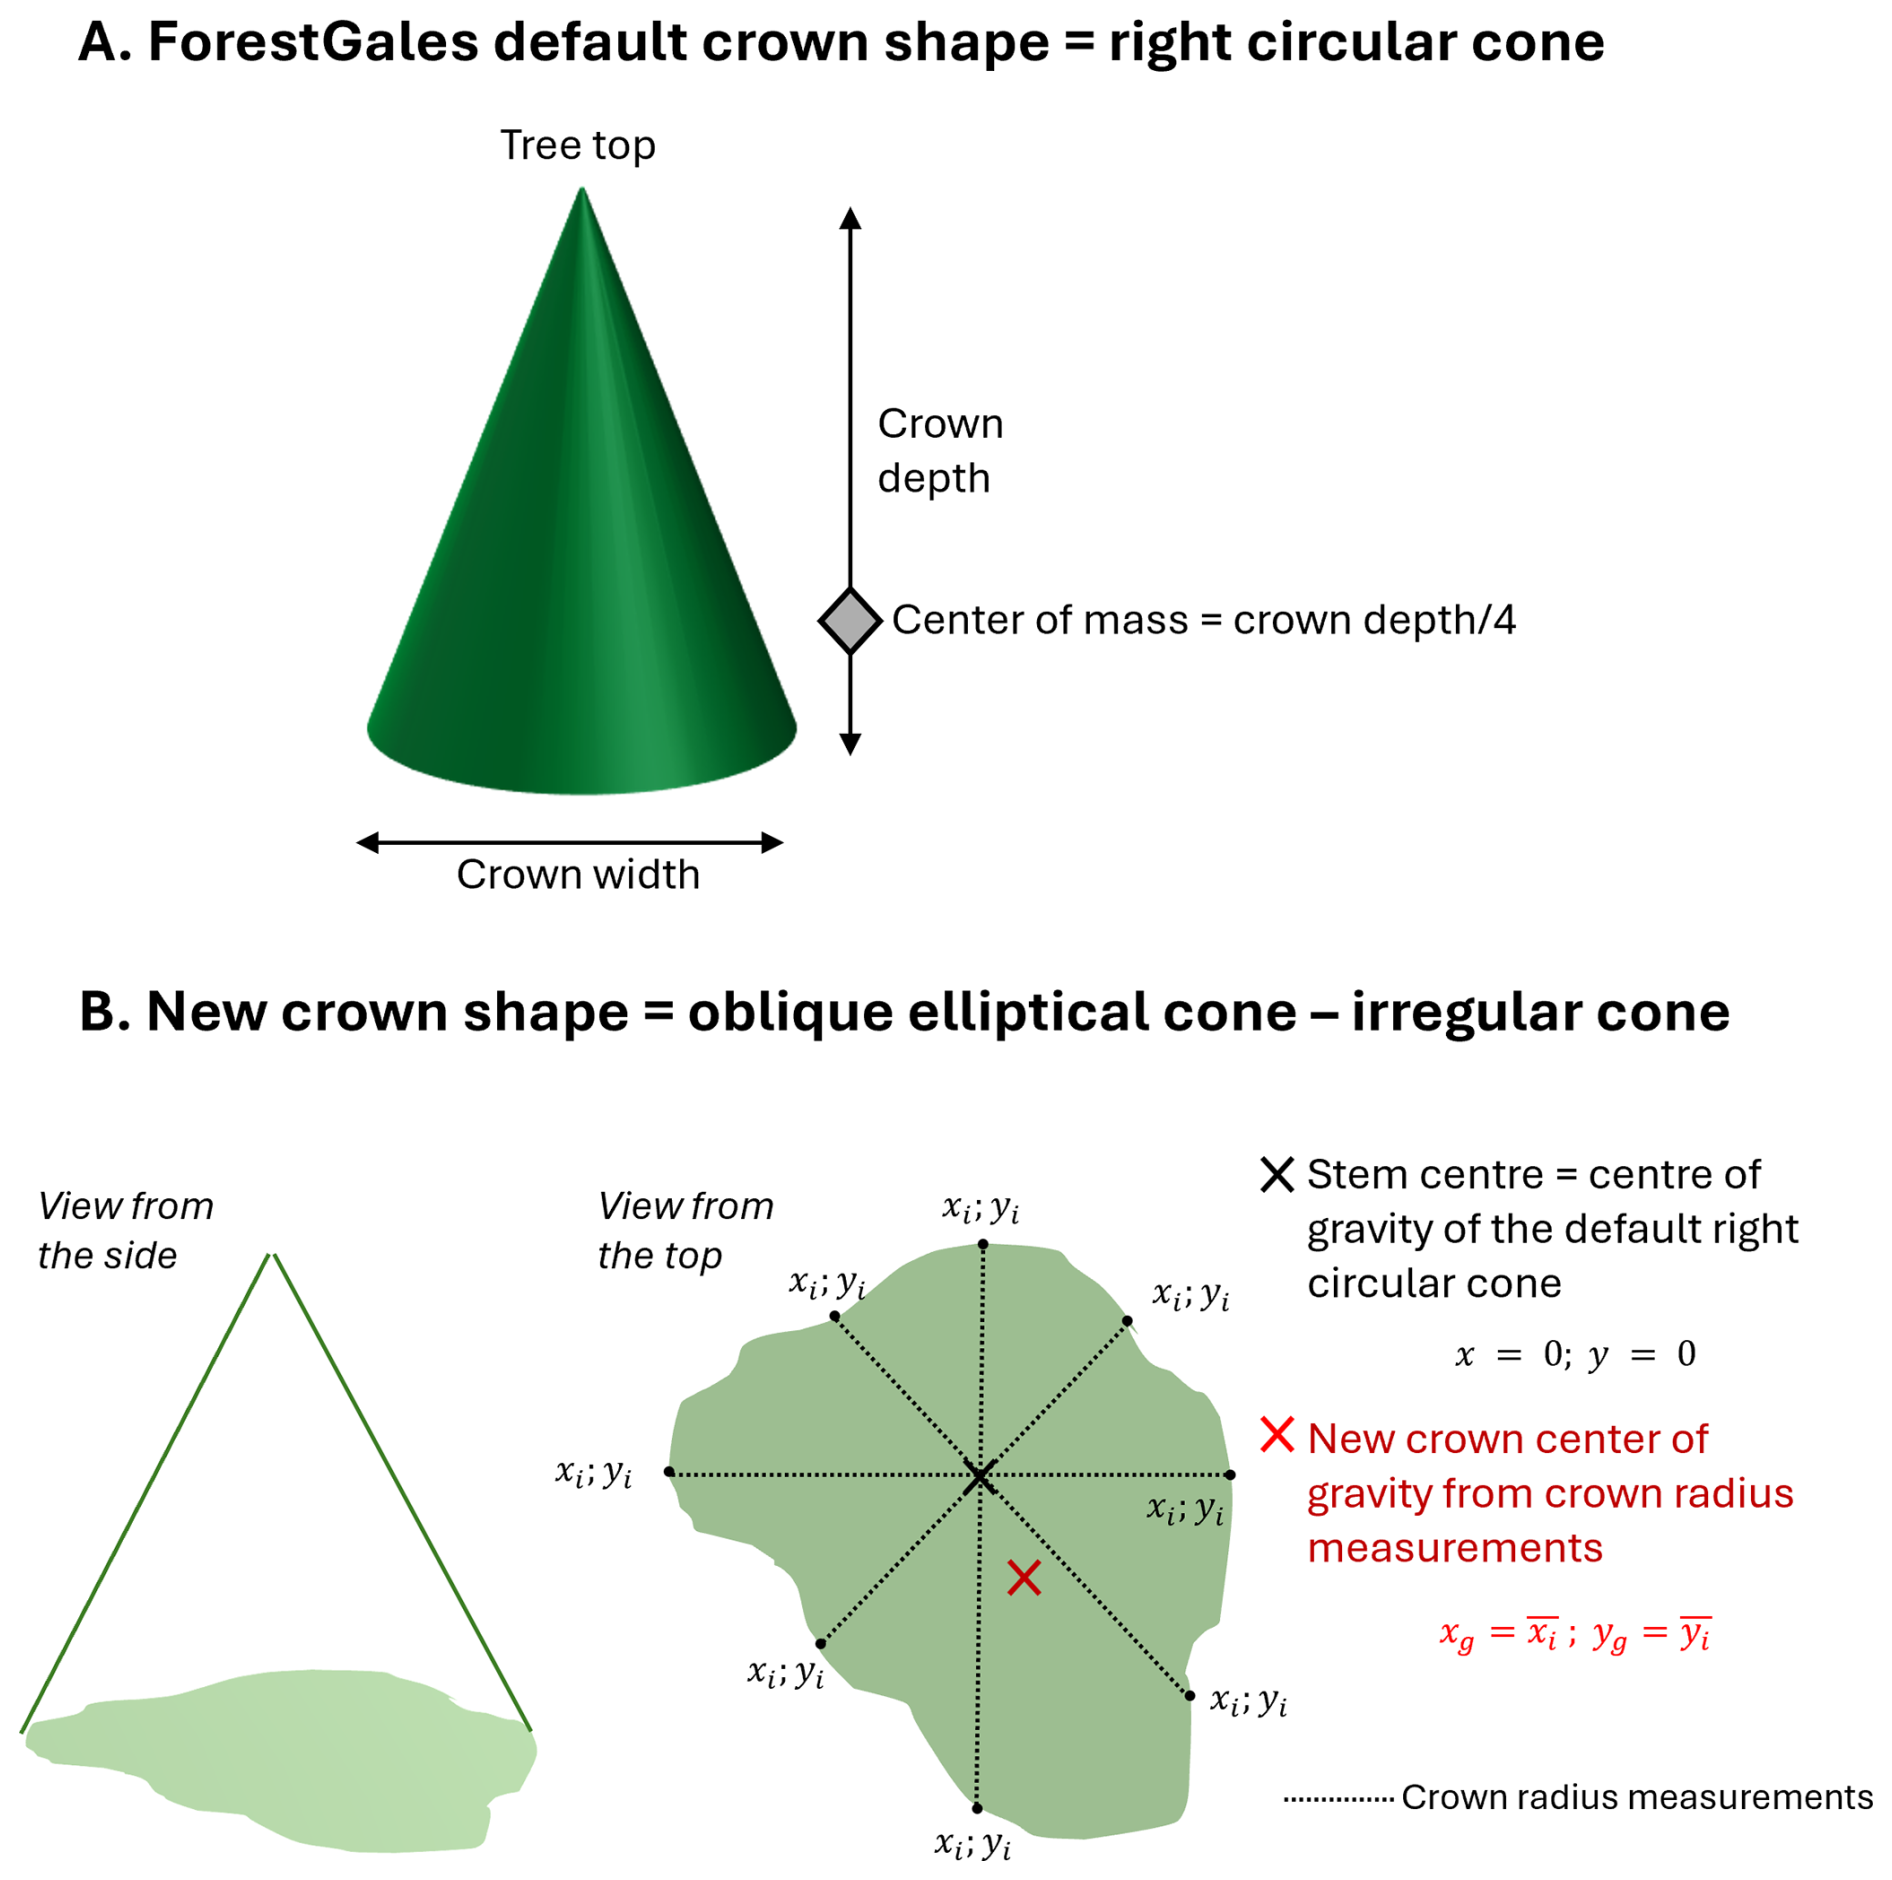
Figure A1Description of the changes made in the assumed crown shape in the ForestGALES model to implement a crown center of gravity offset. (A) The default crown shape in ForestGALES, a right circular cone. (B) The new crown shape to account for an offset in the crown center of gravity – an irregular cone, where the new position of the crown center of gravity is derived from the positions of 8 points at the edge of the crown perimeter. These points were used to obtain the crown radius/diameter measurements from the LiDAR data in the 8 cardinal directions. Under the new crown shape scenario, the assumption that the crown center of mass is at height of the crown depth still holds.
A1.3 Modulus of Rupture and Modulus of Elasticity values
Table A3Modulus of Rupture (MOR) and Modulus of Elasticity (MOE) values used in the Norwegian (NO) parametrization of ForestGALES.
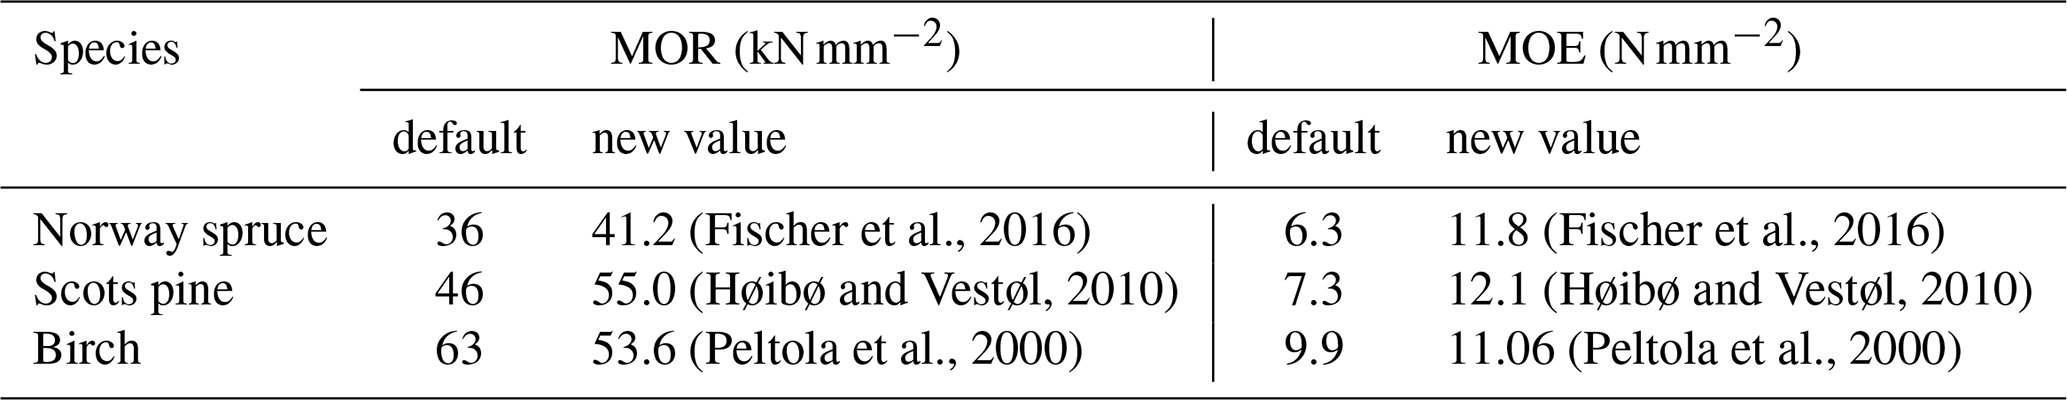
The conversion to green wood values used in the ForestGALES model was made following the method of (Unterwieser and Schickhofer, 2011) used by Locatelli et al. (2016) and the Eq. (A2) presented below:
A2 Wind Speed statistics for the winter 2020–2021
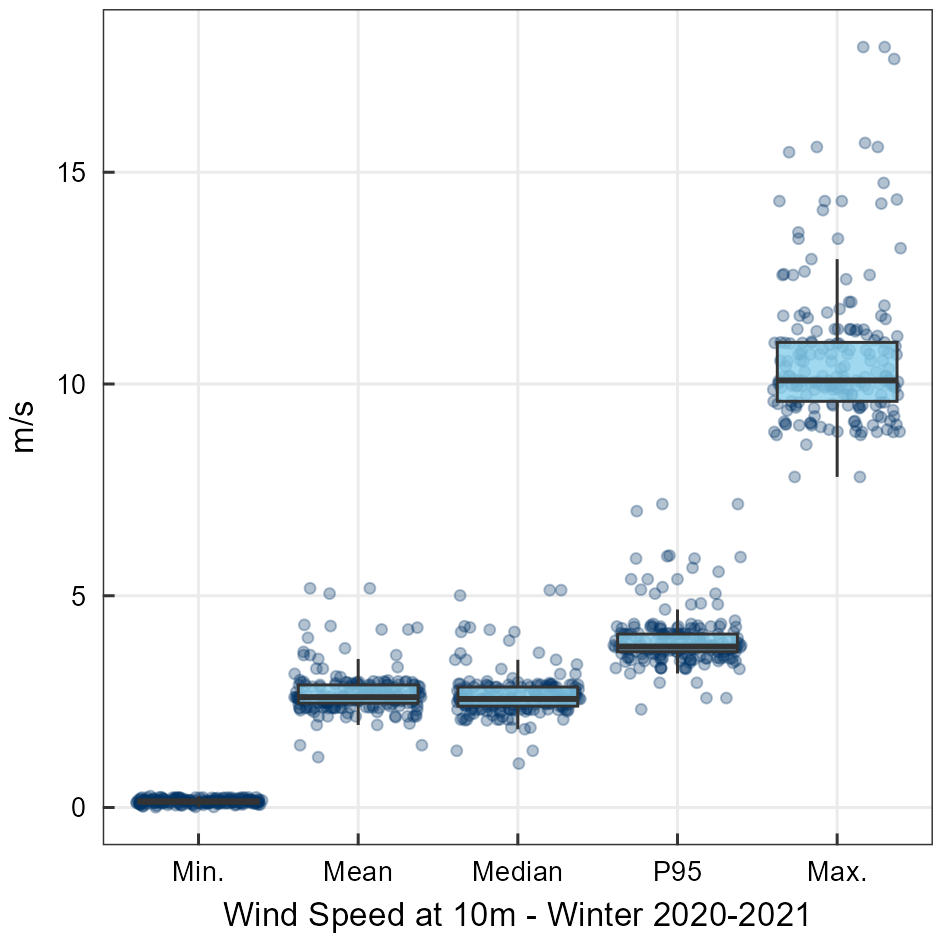
Figure A2Statistics of the wind speed at 10 m during the winter 2020–2021 (September 2020 to April 2021) at the studied locations. The statistics represented are the minimum wind speed (“Min.”), the mean and median, the 95th percentile (“P95”) and the maximum wind speed (“Max.”). Individual locations are shown in the faded points, while the average over all locations is displayed with the boxplots.
A3 Maximum crown snow load for the winter 2020–2021
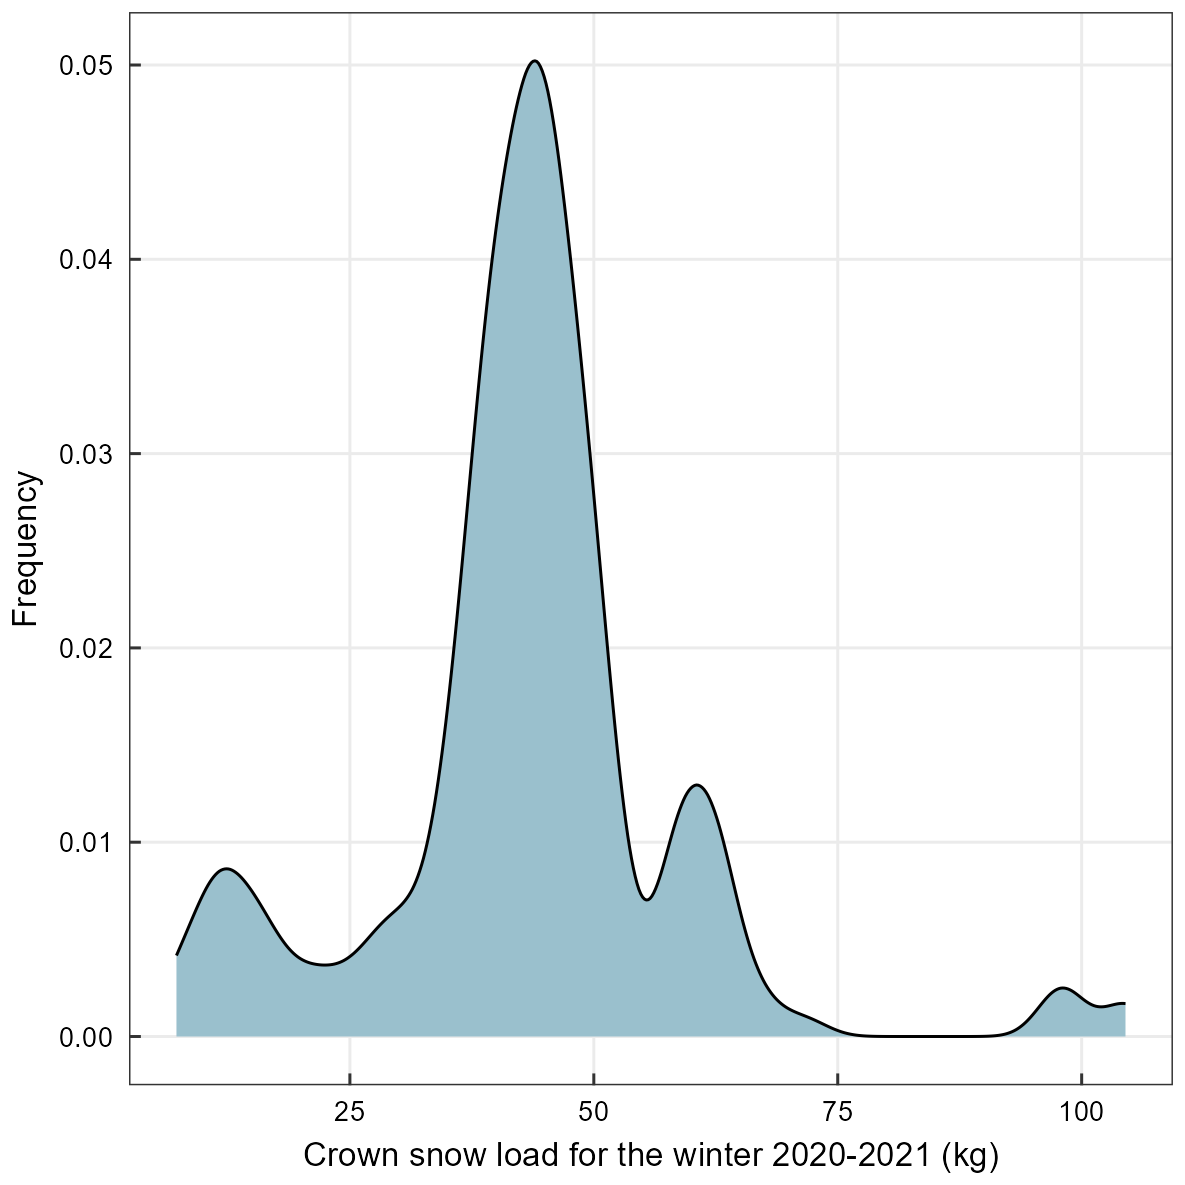
Figure A3Frequency distribution of the maximum calculated crown snow load (kg) for the winter 2020–2021 for the 25 individual powerline strips and 180 recorded damaged trees. Briefly, crown snow load was calculated hourly for the 2013–2023 timeseries using (Lehtonen et al., 2014) on the hourly meteorological data from the long-term stable post-processed products of the Norwegian Meteorological Institute MET (https://thredds.met.no/thredds/metno.html, last access: 29 May 2026) at a 1 km resolution. The maximum for the winter season 2020–2021 was then extracted for the grid cells corresponding to each of the 205 locations (25 powerline strips and 180 fallen trees).
A4 Machine Learning parameters
Table A4Description and value of the main hyperparameters used for the XGBoost (eXtreme Gradient Boosting) algorithm with a 10-fold cross-validation procedure.
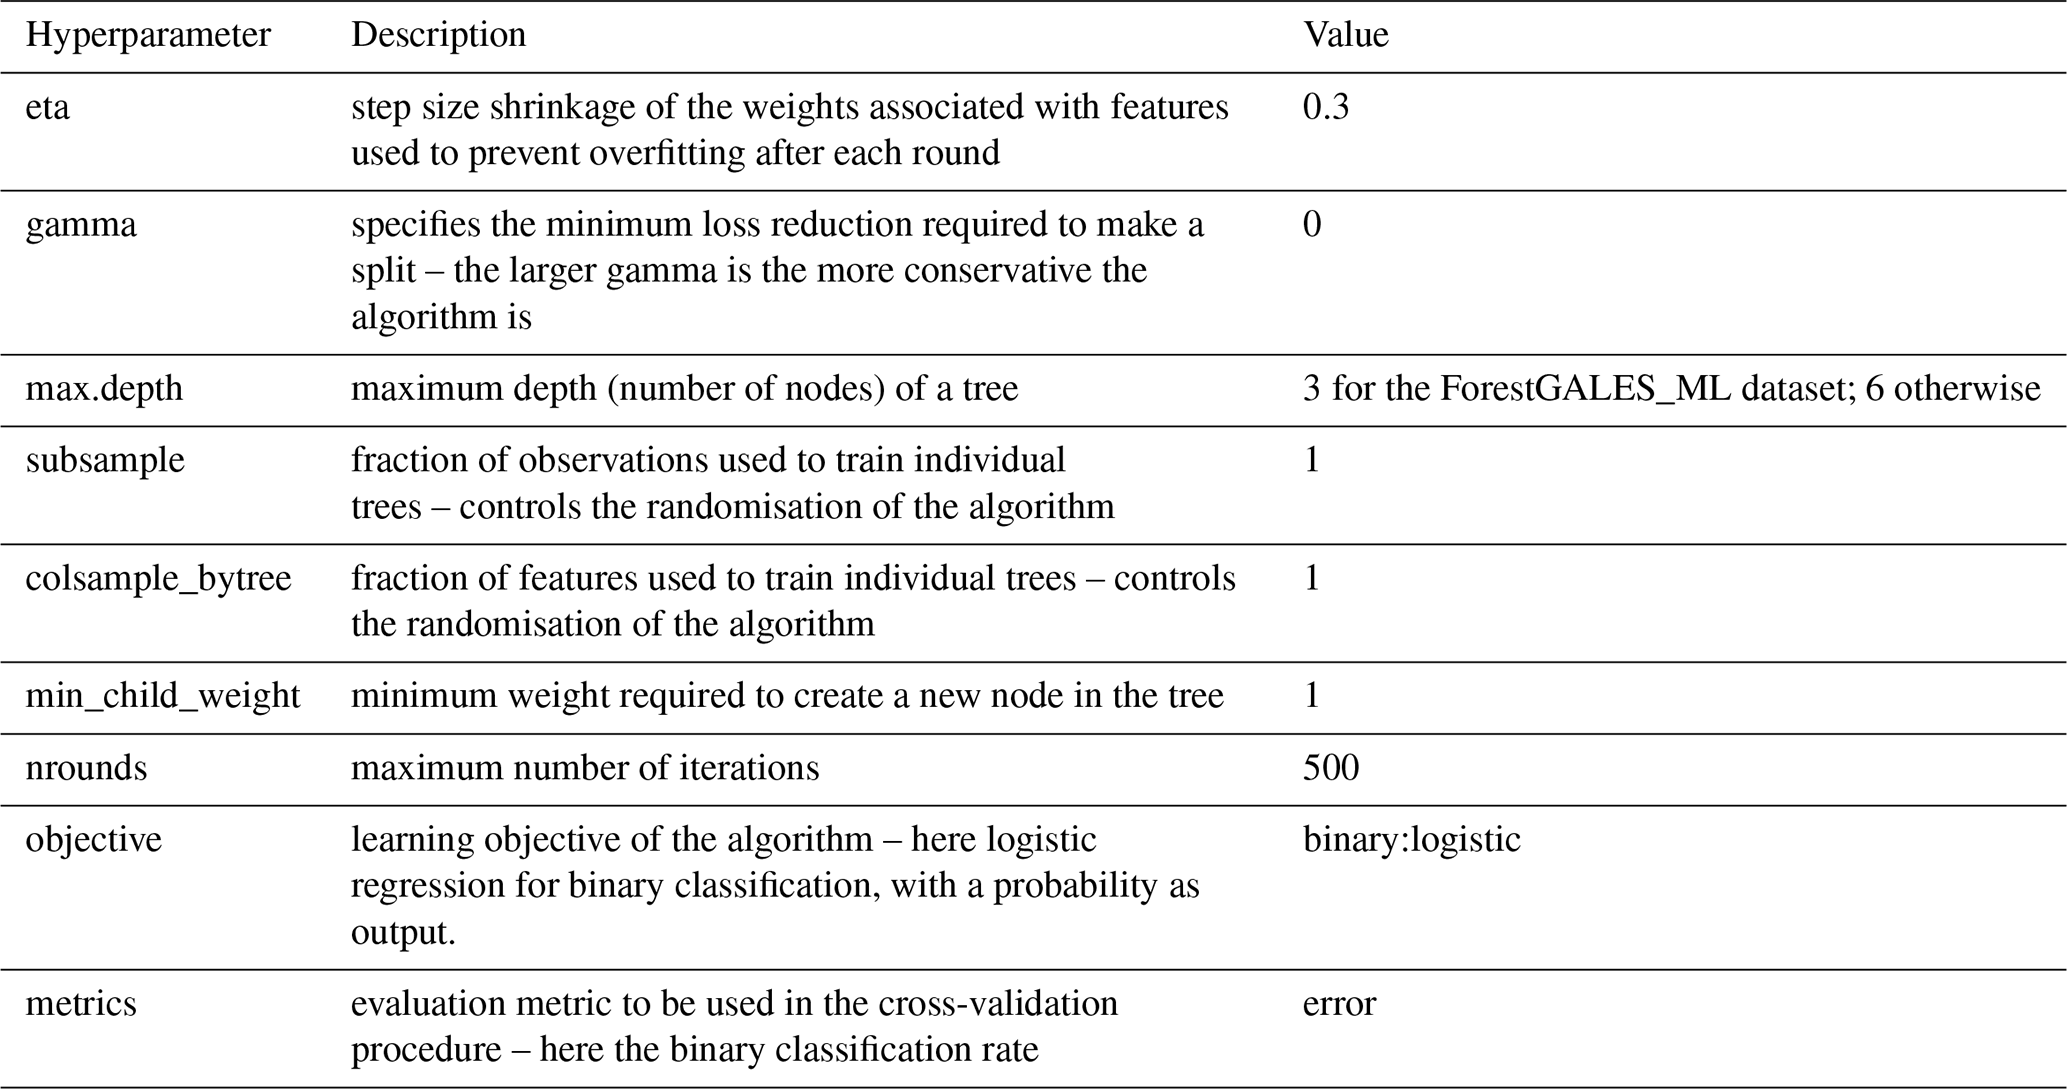
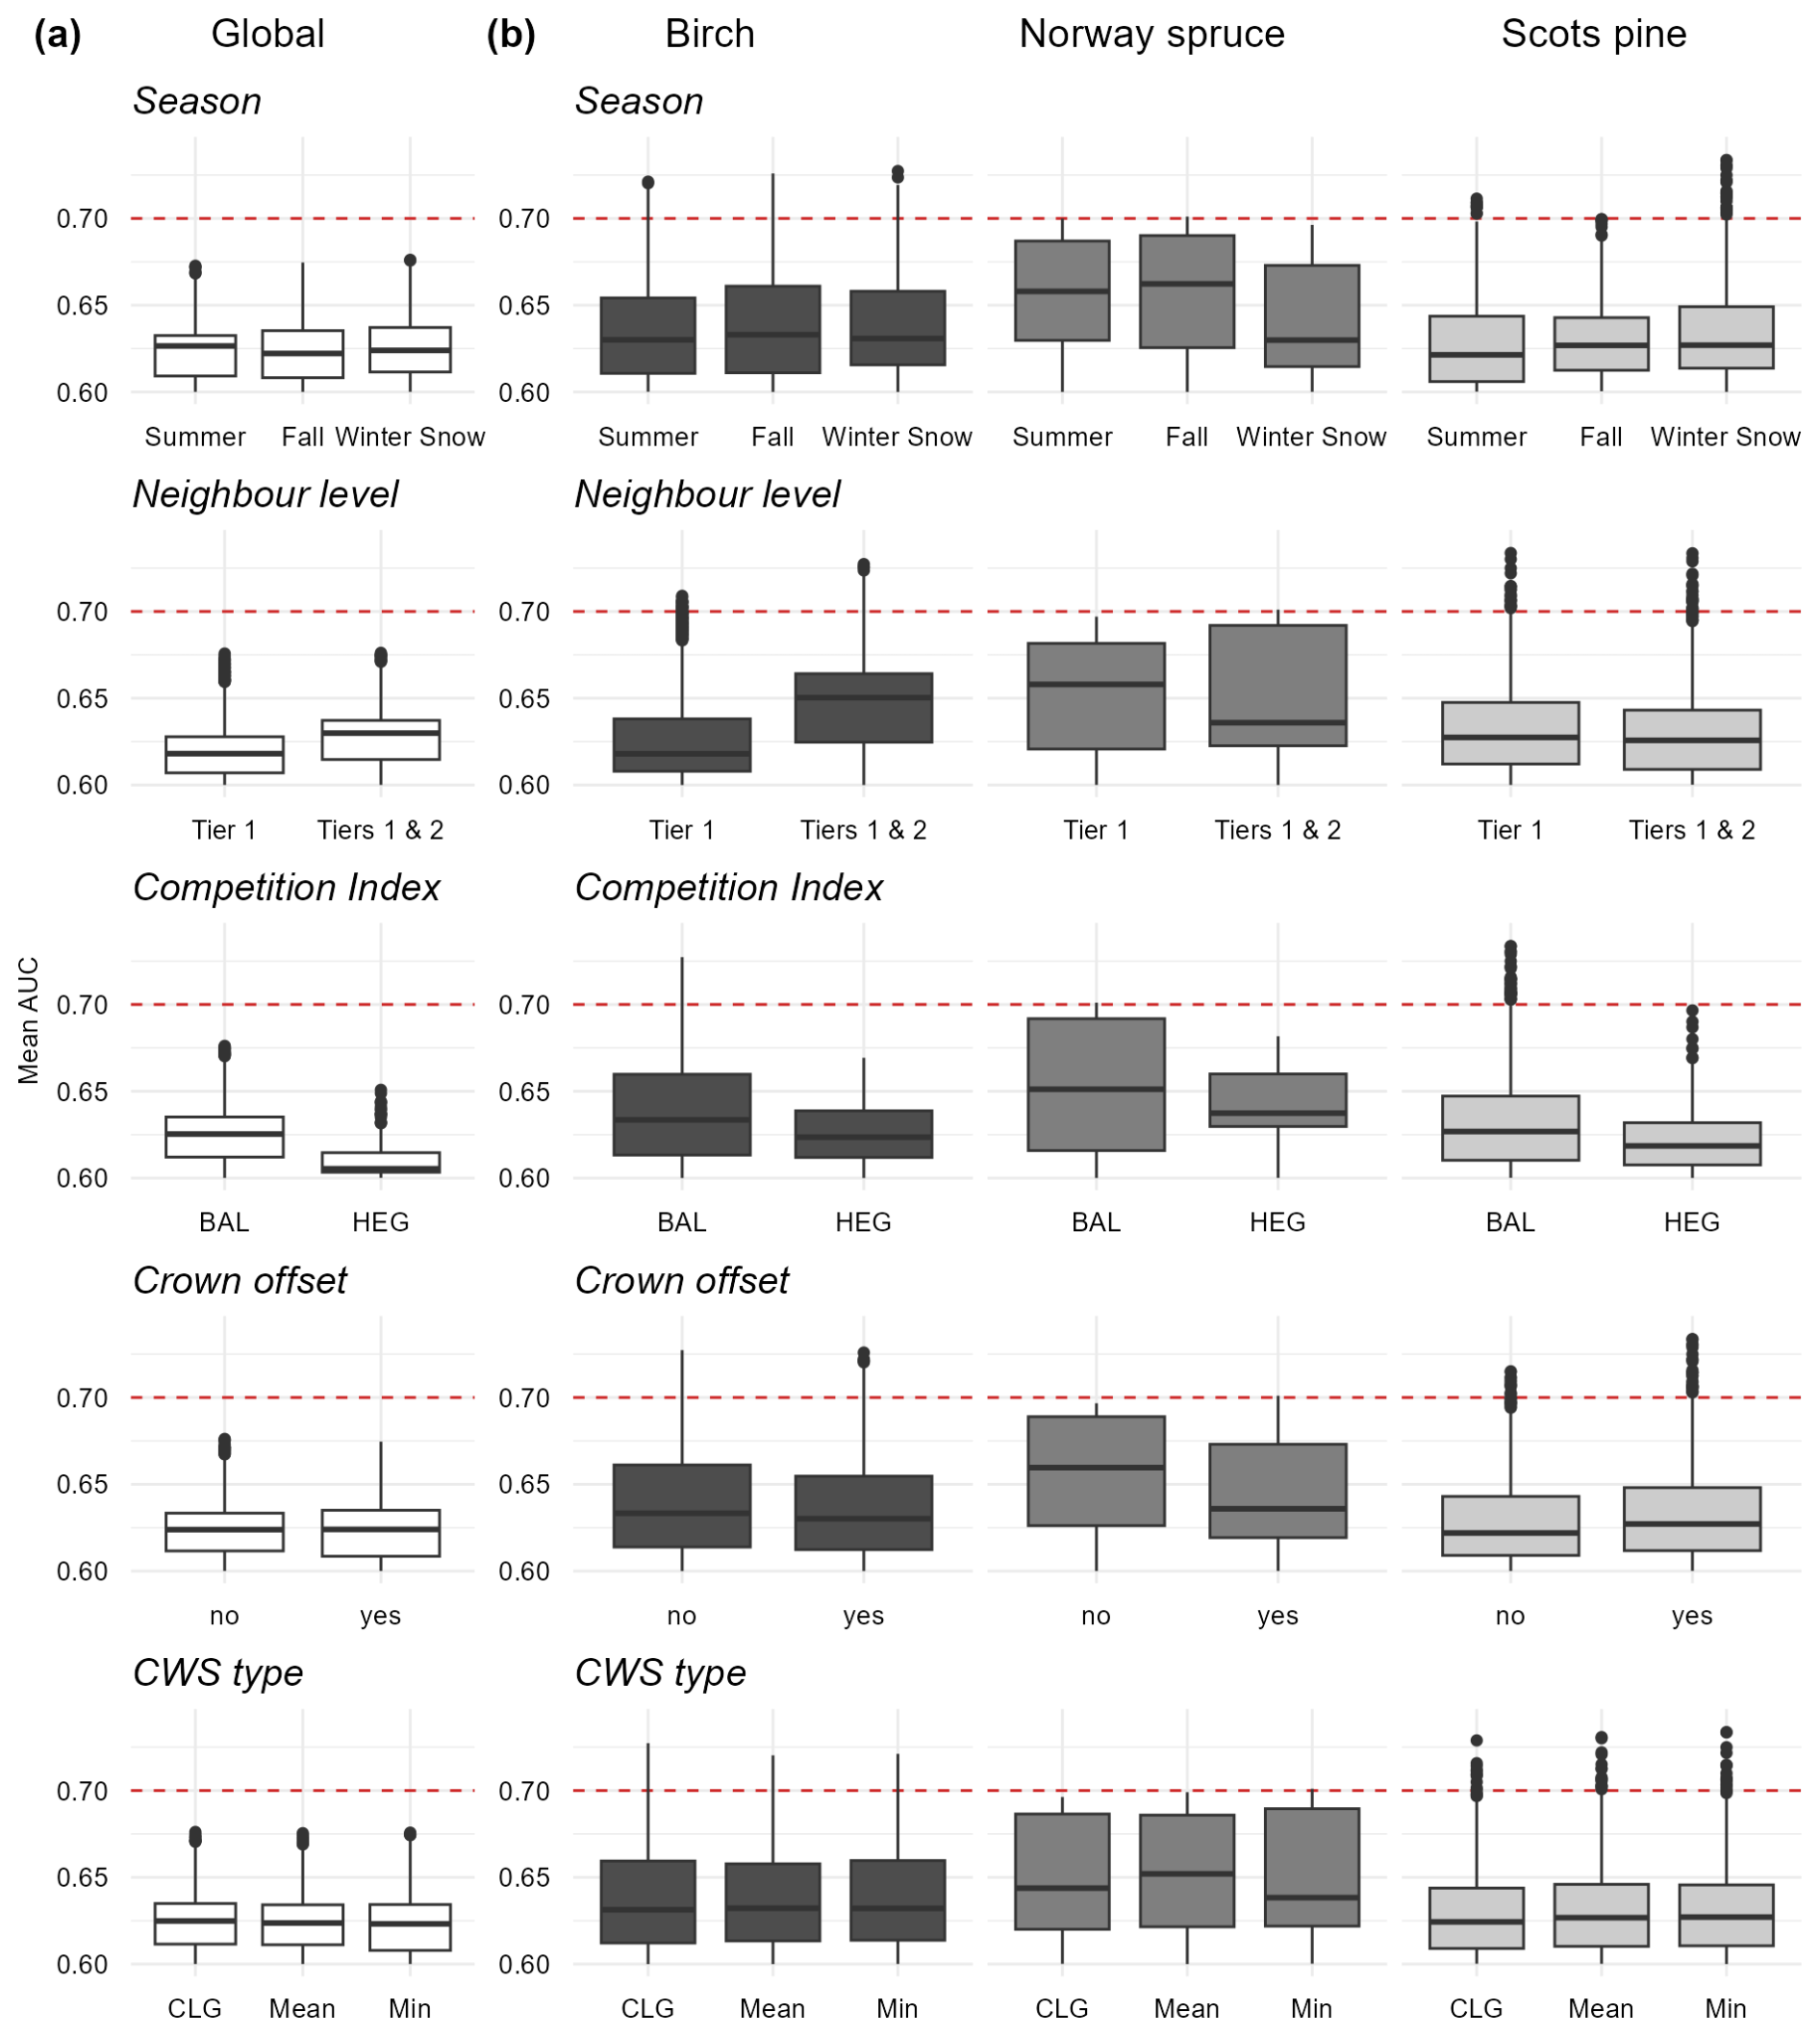
Figure B1Mean AUC values of all tested global (a) and species-specific (b) models for each class of the displayed tested options. Note that the mean AUC were restricted to 0.6 and above – thus only about 20 % of all tested models are included. The options are the seasonal scenario, the definition of the neighbouring trees, the type of competition index, the inclusion of a crown offset, the type of Critical Wind Speed used (in relation to the choice of forest edge and gap – CLG: closest largest gap when available, Mean: mean CWS across all gap directions, Min: minimum CWS across all gap directions). The mean AUC was calculated based on 100 repeated assessments using all damaged trees with an equal number of randomly selected undamaged trees. The horizontal dotted red line shows AUC=0.7, often taken as a threshold to represent a model with satisfactory discriminatory power. The species are further differentiated by colour: Birch in dark grey, Norway spruce in grey, and Scots pine in light grey.
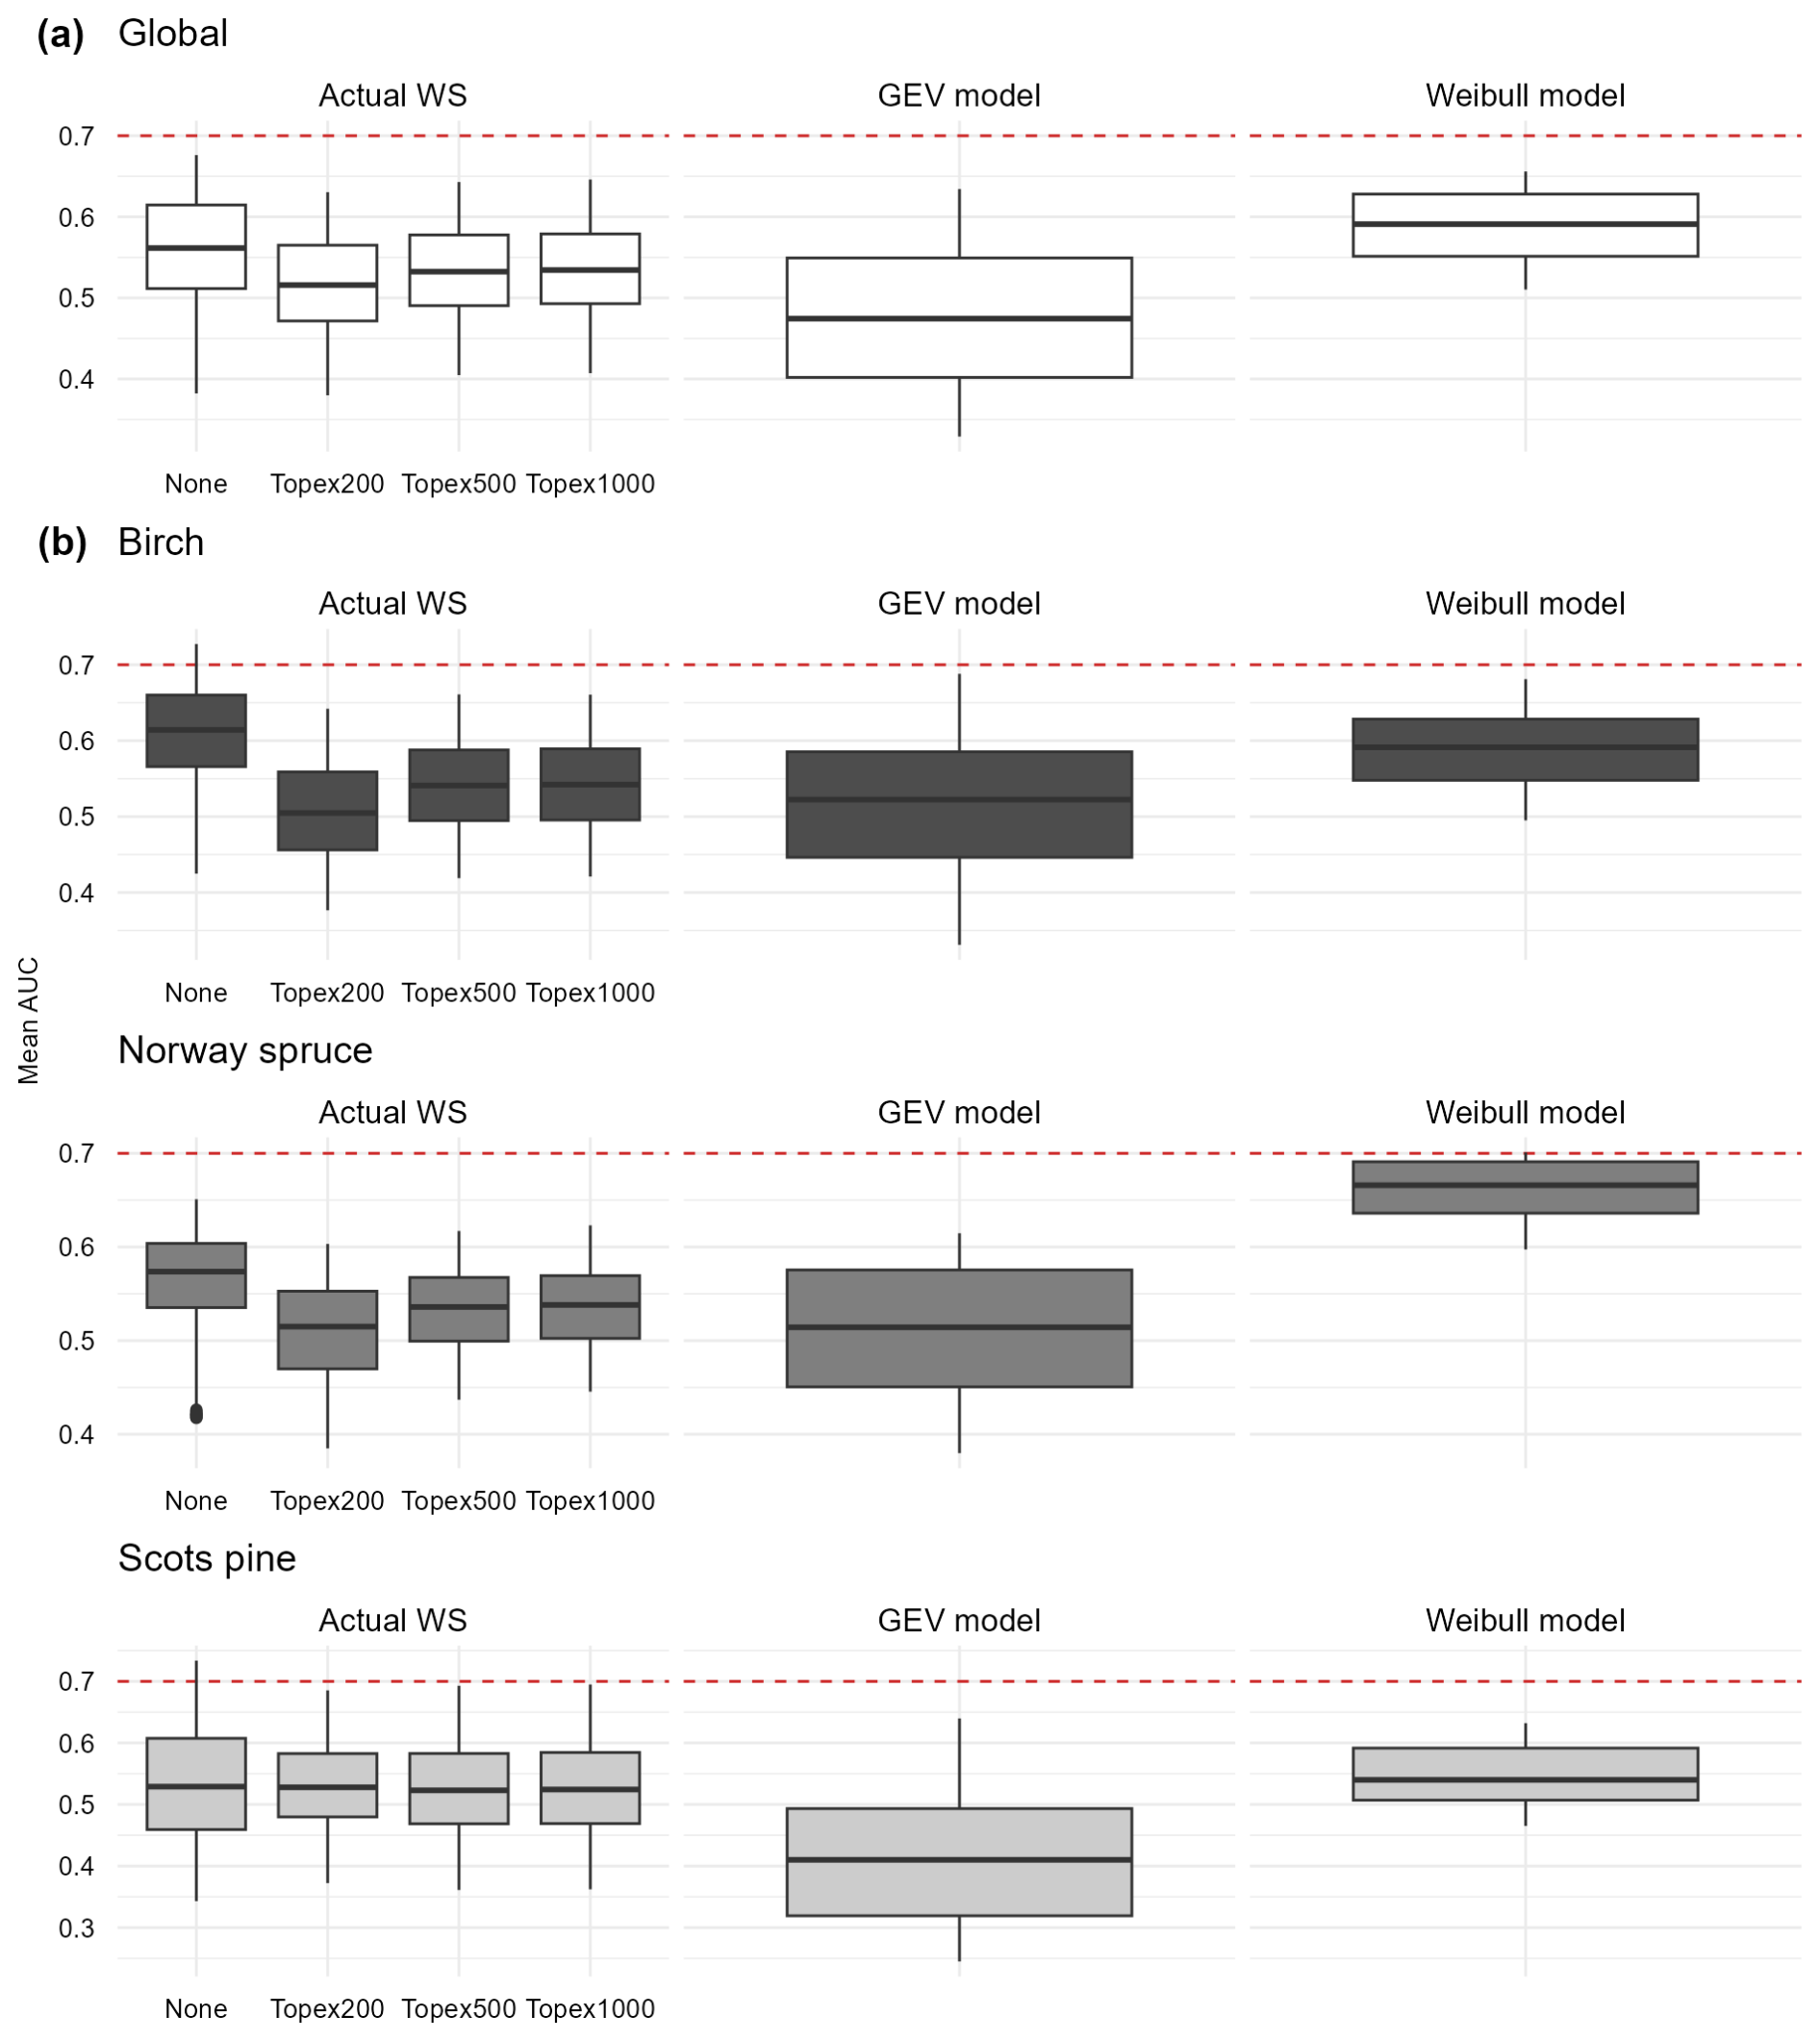
Figure B2Mean AUC values for the tested global (a) and species-specific (b) models for each class of the Wind data/model options when calculating the probability of damage. The three main alternatives were: the use of a logistic probability function with the actual maximum wind speed during the winter 2020–2021 (“Actual WS”) without (“None”) or with a Topex correction with different Topex distances; the use of the Generalized Extreme Value (GEV) model fitted on the 1975–2021 time series of maximum wind speed at each of the considered locations; or the use of the Weibull model describing the mean wind climate using the Weibull A and k parameters extracted from the Global Wind Atlas at each of the considered locations. The mean AUC was calculated based on 100 repeated assessments using all damaged trees with an equal number of randomly selected undamaged trees. The horizontal dotted red line shows AUC=0.7, often taken as a threshold to represent a model with satisfactory discriminatory power. The species are further differentiated by colour: Birch in dark grey, Norway spruce in grey, and Scots pine in light grey.
Table B1Feature importance metrics (Gain, Cover and Frequency – Freq.) of the XGBoost algorithms applied to the two alternative input datasets – ForestGALES-ML and TreeChar-ML – for each of the three wind variable alternatives. Note that the metrics presented are mean (SD) averaged across the 100 repetitions of balanced damaged/standing datasets. Abbreviations: CWS: critical wind speed; WS: wind speed; GEV: generalized extreme value. See the Materials and Methods for more information about the methods.
The individual tree dataset is the property of eSmart Systems and thus not publicly accessible. The wind and climate data are openly available at the sources indicated in the text. The code in this study is largely based on the publicly available R package fgr and can be shared upon request.
MM contributed Methodology, Formal Analysis, Software, Validation, Visualization and Writing (original draft preparation). SS contributed to Conceptualization, Funding acquisition, Methodology, Project Administration and Writing (review and editing). BG contributed to Conceptualization, Funding acquisition, Methodology, Formal analysis and Writing (review and editing).
The contact author has declared that none of the authors has any competing interests.
Publisher's note: Copernicus Publications remains neutral with regard to jurisdictional claims made in the text, published maps, institutional affiliations, or any other geographical representation in this paper. The authors bear the ultimate responsibility for providing appropriate place names. Views expressed in the text are those of the authors and do not necessarily reflect the views of the publisher.
The authors would like to thank Magne Kaspersen (eSmart Systems, Agro Data) for leading the UAV laser scanning field campaigns in the summers 2020 and 2021 and Thi Phuong Huyen Vu at eSmart Systems for preparing the data.
The study was funded by the Norwegian Research Council for the project SkogRiskAI – “AI-based risk model for vegetation along powerlines” for the period 2020–2023 (project number 309307) and further supported by the Norwegian Research Council Contract No. 342631/L10.
This paper was edited by Yves Bühler and reviewed by Sophie Crommelinck and one anonymous referee.
Avbrotsstatistikk fra Reguleringsmyndigheita for energi – NVE: https://www.nve.no/reguleringsmyndigheten/publikasjoner-og-data/statistikk/avbrotsstatistikk/, last access: 19 May 2025.
Bakkestuen, V., Erikstad, L., and Halvorsen, R.: Step-less models for regional environmental variation in Norway, J. Biogeogr., 35, 1906–1922, https://doi.org/10.1111/j.1365-2699.2008.01941.x, 2008.
Beirlant, J., Goegebeur, Y., Teugels, J., and Segers, J.: Statistics of Extremes: Theory and Applications, John Wiley & Sons, Ltd, ISBN 978-0-470-01238-3, 2004.
Berkelaar, M.: lpSolve: Interface to “Lp_solve” v. 5.5 to Solve Linear/Integer Programs, https://doi.org/10.32614/CRAN.package.lpSolve, 2024.
Braastad, H.: Volumtabeller for bjørk, Meddelser fra Det norske Skogforsøksvesen, 21, 23–78, https://hdl.handle.net/11250/2988596, 1966.
Brantseg, A.: Furu sønnafjells, Kubering av stående skog, Funksjoner og tabeller, Meddelser fra Det norske skogforsøksvesen, https://hdl.handle.net/11250/2988596, 1969.
Chapman, L.: Assessing topographic exposure, Meteorol. Appl., 7, 335–340, https://doi.org/10.1017/S1350482700001729, 2000.
Chen, T. and Guestrin, C.: XGBoost: A Scalable Tree Boosting System, in: Proceedings of the 22nd ACM SIGKDD International Conference on Knowledge Discovery and Data Mining, 785–794, https://doi.org/10.1145/2939672.2939785, 2016.
Chen, T., He, T., Benesty, M., Khotilovich, V., Tang, Y., Cho, H., Chen, K., Mitchell, R., Cano, I., Zhou, T., Li, M., Xie, J., Lin, M., Geng, Y., Li, Y., Yuan, J., and Cortes, D.: xgboost: Extreme Gradient Boosting, R package version 3.2.1.1., https://doi.org/10.32614/CRAN.package.xgboost, 2024.
Chen, Y.-Y., Gardiner, B., Pasztor, F., Blennow, K., Ryder, J., Valade, A., Naudts, K., Otto, J., McGrath, M. J., Planque, C., and Luyssaert, S.: Simulating damage for wind storms in the land surface model ORCHIDEE-CAN (revision 4262), Geosci. Model Dev., 11, 771–791, https://doi.org/10.5194/gmd-11-771-2018, 2018.
Costa, M., Gardiner, B., Locatelli, T., Marchi, L., Marchi, N., and Lingua, E.: Evaluating wind damage vulnerability in the Alps: A new wind risk model parametrisation, Agr. Forest Meteorol., 341, 109660, https://doi.org/10.1016/j.agrformet.2023.109660, 2023.
Dalponte, M., Marzini, S., Solano-Correa, Y. T., Tonon, G., Vescovo, L., and Gianelle, D.: Mapping forest windthrows using high spatial resolution multispectral satellite images, Int. J. Appl. Earth Obs., 93, 102206, https://doi.org/10.1016/j.jag.2020.102206, 2020.
Duperat, M., Gardiner, B., and Ruel, J.-C.: Testing an individual tree wind damage risk model in a naturally regenerated balsam fir stand: potential impact of thinning on the level of risk, Forestry, 94, 141–150, https://doi.org/10.1093/forestry/cpaa023, 2021.
Dupras, J., Patry, C., Tittler, R., Gonzalez, A., Alam, M., and Messier, C.: Management of vegetation under electric distribution lines will affect the supply of multiple ecosystem services, Land Use Policy, 51, 66–75, https://doi.org/10.1016/j.landusepol.2015.11.005, 2016.
Eddelbuettel, D., Francois, R., Allaire, J., Ushey, K., Kou, Q., Russell, N., Ucar, I., Bates, D., and Chambers, J.: Rcpp: Seamless R and C Integration, https://doi.org/10.32614/CRAN.package.Rcpp, 2023.
Fischer, C., Vestøl, G. I., and Høibø, O.: Modelling the variability of density and bending properties of Norway spruce structural timber, Can. J. Forest Res., 46, 978–985, https://doi.org/10.1139/cjfr-2016-0022, 2016.
Gardiner, B., Byrne, K., Hale, S., Kamimura, K., Mitchell, S. J., Peltola, H., and Ruel, J.-C.: A review of mechanistic modelling of wind damage risk to forests, Forestry, 81, 447–463, https://doi.org/10.1093/forestry/cpn022, 2008.
Gardiner, B., Lorenz, R., Hanewinkel, M., Schmitz, B., Bott, F., Szymczak, S., Frick, A., and Ulbrich, U.: Predicting the risk of tree fall onto railway lines, Forest Ecol. Manag., 553, 121614, https://doi.org/10.1016/j.foreco.2023.121614, 2024.
Garfinkel, M., Hosler, S., Roberts, M., Vogt, J., Whelan, C., and Minor, E.: Balancing the management of powerline right-of-way corridors for humans and nature, J. Environ. Manage., 330, 117175, https://doi.org/10.1016/j.jenvman.2022.117175, 2023.
Gilleland, E. and Katz, R. W.: extRemes 2.0: An Extreme Value Analysis Package in R, J. Stat. Softw., 72, https://doi.org/10.18637/jss.v072.i08, 2016.
Hale, S. E., Gardiner, B. A., Wellpott, A., Nicoll, B. C., and Achim, A.: Wind loading of trees: influence of tree size and competition, Eur. J. Forest Res., 131, 203–217, https://doi.org/10.1007/s10342-010-0448-2, 2012.
Hale, S. E., Gardiner, B., Peace, A., Nicoll, B., Taylor, P., and Pizzirani, S.: Comparison and validation of three versions of a forest wind risk model, Environ. Modell. Softw., 68, 27–41, https://doi.org/10.1016/j.envsoft.2015.01.016, 2015.
Hart, E., Sim, K., Kamimura, K., Meredieu, C., Guyon, D., and Gardiner, B.: Use of machine learning techniques to model wind damage to forests, Agr. Forest Meteorol., 265, 16–29, https://doi.org/10.1016/j.agrformet.2018.10.022, 2019.
Hegyi, F.: A simulation model for managing jack pine stands, in: Growth Models for Tree and Stand Simulation, Royal Coll. For., Stockholm, 74–90, ISBN 978 9157603432, 1974.
Hernangómez, D.: Using the tidyverse with terra objects: the tidyterra package, Journal of Open Source Software, 8, 5751, https://doi.org/10.21105/joss.05751, 2023.
Hijmans, R. J.: terra: Spatial Data Analysis, https://doi.org/10.32614/CRAN.package.terra, 2024.
Høibø, O. and Vestøl, G. I.: Modelling the variation in modulus of elasticity and modulus of rupture of Scots pine round timber, Can. J. Forest Res., 40, 668–678, https://doi.org/10.1139/X10-021, 2010.
Hosmer, D. W., Lemeshow, S., and Sturdivant, R. X.: Applied Logistic Regression, in: Applied Logistic Regression, John Wiley & Sons, Ltd., 510, https://doi.org/10.1002/9781118548387.fmatter, 2013.
IEA: Electricity security in tomorrow's power systems, IEA, https://www.iea.org/reports/electricity-security-in-tomorrows-power-systems (last access: 29 May 2026), 2020.
Jahani, A. and Saffariha, M.: Tree failure prediction model (TFPM): machine learning techniques comparison in failure hazard assessment of Platanus orientalis in urban forestry, Nat. Hazards, 110, 881–898, https://doi.org/10.1007/s11069-021-04972-7, 2022.
Jain, A., Shah, T., Yousefhussien, M., and Pandey, A.: Combining Remotely Sensed Imagery with Survival Models for Outage Risk Estimation of the Power Grid, in: 2021 IEEE/CVF Conference on Computer Vision and Pattern Recognition Workshops (CVPRW), 1202–1211, https://doi.org/10.1109/CVPRW53098.2021.00131, 2021.
Jenkinson, A. F.: The frequency distribution of the annual maximum (or minimum) values of meteorological elements, Q. J. Roy. Meteor. Soc., 81, 158–171, https://doi.org/10.1002/qj.49708134804, 1955.
Kamimura, K., Gardiner, B., Dupont, S., Guyon, D., and Meredieu, C.: Mechanistic and statistical approaches to predicting wind damage to individual maritime pine (Pinus pinaster) trees in forests, Can. J. Forest Res., 46, 88–100, https://doi.org/10.1139/cjfr-2015-0237, 2016.
Kassambara, A.: ggpubr: “ggplot2” Based Publication Ready Plots, https://doi.org/10.32614/CRAN.package.ggpubr, 2023.
Kennedy, F.: The identification of soils for forest management, Edinburgh: Forestry Commission Publications, ISBN 978 0855385590, 2002.
Krisans, O., Matisons, R., Rust, S., Burnevica, N., Bruna, L., Elferts, D., Kalvane, L., and Jansons, A.: Presence of Root Rot Reduces Stability of Norway Spruce (Picea abies): Results of Static Pulling Tests in Latvia, Forests, 11, 416, https://doi.org/10.3390/f11040416, 2020.
Lehtonen, I., Hoppula, P., Pirinen, P., and Gregow, H.: Modelling crown snow loads in Finland: a comparison of two methods, Silva Fenn., 48, https://doi.org/10.14214/sf.1120, 2014.
Li, J., Liu, L., Liang, Y., He, C., and Jin, J.: An Integrated Estimating Approach for Design Wind Speed under Extreme Wind Climate in the Yangtze River Inland Waterway, Atmosphere, 13, 1849, https://doi.org/10.3390/atmos13111849, 2022.
Liu, Z., Peng, C., Work, T., Candau, J.-N., DesRochers, A., and Kneeshaw, D.: Application of machine-learning methods in forest ecology: recent progress and future challenges, Environ. Rev., 26, 339–350, https://doi.org/10.1139/er-2018-0034, 2018.
Locatelli, T., Gardiner, B., Tarantola, S., Nicoll, B., Bonnefond, J.-M., Garrigou, D., Kamimura, K., and Patenaude, G.: Modelling wind risk to Eucalyptus globulus (Labill.) stands, Forest Ecol. Manag., 365, 159–173, https://doi.org/10.1016/j.foreco.2015.12.035, 2016.
Locatelli, T., Tarantola, S., Gardiner, B., and Patenaude, G.: Variance-based sensitivity analysis of a wind risk model – Model behaviour and lessons for forest modelling, Environ. Modell. Softw., 87, 84–109, https://doi.org/10.1016/j.envsoft.2016.10.010, 2017.
Locatelli, T., Gardiner, B., Hale, S., and Nicoll, B.: fgr: r Version of the ForestGALES wind risk model, R package version 1.0, https://github.com/tom-locatelli/fgr (last access: 29 May 2026), 2022.
Lorenz, R., Becker, N., Gardiner, B., Ulbrich, U., Hanewinkel, M., and Schmitz, B.: Tree fall along railway lines: modelling the impact of wind and other meteorological factors, Nat. Hazards Earth Syst. Sci., 25, 2179–2196, https://doi.org/10.5194/nhess-25-2179-2025, 2025.
Merlin, M., Locatelli, T., Gardiner, B., and Astrup, R.: Large-scale modelling wind damage vulnerability through combination of high-resolution forest resources maps and ForestGALES, Forest Ecosystems, 14, 100361, https://doi.org/10.1016/j.fecs.2025.100361, 2025.
Morimoto, J., Aiba, M., Furukawa, F., Mishima, Y., Yoshimura, N., Nayak, S., Takemi, T., Chihiro, H., Matsui, T., and Nakamura, F.: Risk assessment of forest disturbance by typhoons with heavy precipitation in northern Japan, Forest Ecol. Manag., 479, 118521, https://doi.org/10.1016/j.foreco.2020.118521, 2021.
Nicoll, B. C., Gardiner, B. A., Rayner, B., and Peace, A. J.: Anchorage of coniferous trees in relation to species, soil type, and rooting depth, Can. J. Forest Res., 36, 1871–1883, https://doi.org/10.1139/x06-072, 2006.
NVE: Trær til besvær, Lærdommer om skogrydding i etterkant av ekstremværet Dagmar, Norges vassdrags- og energidirektorat NVE, http://publikasjoner.nve.no/rapport/2012/rapport2012_45.pdf (last access: 29 May 2026), 2012.
Öhman, K., Llorente, I. P., Fustel, T., Bohlin, I., Lämås, T., and Eggers, J.: Integrating wind damage vulnerability into long-term forest planning: An optimisation-based model for spatial decision support, Trees, Forests and People, 20, 100870, https://doi.org/10.1016/j.tfp.2025.100870, 2025.
Palutikof, J. P., Brabson, B. B., Lister, D. H., and Adcock, S. T.: A review of methods to calculate extreme wind speeds, Meteorol. Appl., 6, 119–132, https://doi.org/10.1017/S1350482799001103, 1999.
Patacca, M., Lindner, M., Lucas-Borja, M. E., Cordonnier, T., Fidej, G., Gardiner, B., Hauf, Y., Jasinevičius, G., Labonne, S., Linkevičius, E., Mahnken, M., Milanovic, S., Nabuurs, G.-J., Nagel, T. A., Nikinmaa, L., Panyatov, M., Bercak, R., Seidl, R., Ostrogović Sever, M. Z., Socha, J., Thom, D., Vuletic, D., Zudin, S., and Schelhaas, M.-J.: Significant increase in natural disturbance impacts on European forests since 1950, Glob. Chang. Biol., 29, https://doi.org/10.1111/gcb.16531, 2022.
Pawlik, Ł. and Harrison, S. P.: Modelling and prediction of wind damage in forest ecosystems of the Sudety Mountains, SW Poland, Sci. Total Environ., 815, 151972, https://doi.org/10.1016/j.scitotenv.2021.151972, 2022.
Peltola, H., Kellomäki, S., Hassinen, A., and Granander, M.: Mechanical stability of Scots pine, Norway spruce and birch: an analysis of tree-pulling experiments in Finland, Forest Ecol. Manag., 135, 143–153, https://doi.org/10.1016/S0378-1127(00)00306-6, 2000.
Poulos, H. M. and Camp, A. E.: Decision support for mitigating the risk of tree induced transmission line failure in utility rights-of-way, Environ. Manage., 45, 217–226, https://doi.org/10.1007/s00267-009-9422-5, 2010.
Quine, C. P.: Estimation of mean wind climate and probability of strong winds for wind risk assessment, Forestry, 73, 247–258, https://doi.org/10.1093/forestry/73.3.247, 2000.
R Core Team: R: A Language and Environment for Statistical Computing, https://www.R-project.org/ (last access: 29 May 2026), 2024.
Reder, S., Kruse, M., Miranda, L., Voss, N., and Mund, J.-P.: Unveiling wind-thrown trees: Detection and quantification of wind-thrown tree stems on UAV-orthomosaics based on UNet and a heuristic stem reconstruction, Forest Ecol. Manag., 578, 122411, https://doi.org/10.1016/j.foreco.2024.122411, 2025.
Rouault, E., Warmerdam, F., Schwehr, K., Kiselev, A., Butler, H., Łoskot, M., Szekeres, T., Tourigny, E., Landa, M., Miara, I., Elliston, B., Kumar, C., Plesea, L., Morissette, D., Jolma, A., and Dawson, N.: GDAL, https://doi.org/10.5281/zenodo.6517191, 2022.
Sey, N. E. N., Amo-Boateng, M., Domfeh, M. K., Kabo-Bah, A. T., and Antwi-Agyei, P.: Deep learning-based framework for vegetation hazard monitoring near powerlines, Spat. Inf. Res., 31, 501–513, https://doi.org/10.1007/s41324-023-00518-0, 2023.
Soukissian, T. H. and Tsalis, C.: The effect of the generalized extreme value distribution parameter estimation methods in extreme wind speed prediction, Nat. Hazards, 78, 1777–1809, https://doi.org/10.1007/s11069-015-1800-0, 2015.
Stadelmann, C., Grottian, L., Natkhin, M., and Sanders, T. G.: Improving the predictive capacity of the windthrow risk model ForestGALES with long-term monitoring data – A statistical calibration approach, Forest Ecol. Manag., 576, 122389, https://doi.org/10.1016/j.foreco.2024.122389, 2025.
Stage, A. R.: Prognosis model for stand development, Intermountain Forest & Range Experiment Station, Forest Service, U.S. Dept. of Agriculture, Ogden, Utah, https://doi.org/10.5962/bhl.title.69018, 1973.
Straker, A., Puliti, S., Breidenbach, J., Kleinn, C., Pearse, G., Astrup, R., and Magdon, P.: Instance segmentation of individual tree crowns with YOLOv5: A comparison of approaches using the ForInstance benchmark LiDAR dataset, ISPRS Open Journal of Photogrammetry and Remote Sensing, 9, 100045, https://doi.org/10.1016/j.ophoto.2023.100045, 2023.
Szymczak, S., Bott, F., Babeck, P., Frick, A., Stöckigt, B., and Wagner, K.: Estimating the hazard of tree fall along railway lines: a new GIS tool, Nat. Hazards, 112, 2237–2258, https://doi.org/10.1007/s11069-022-05263-5, 2022.
Unterwieser, H. and Schickhofer, G.: Influence of moisture content of wood on sound velocity and dynamic MOE of natural frequency- and ultrasonic runtime measurement, Eur. J. Wood Wood Prod., 69, 171–181, https://doi.org/10.1007/s00107-010-0417-y, 2011.
Vestjordet, E.: Funksjoner og tabeller for kubering av stående gran, Meddelser fra Det norske Skogforsøksvesen, 22, https://hdl.handle.net/11250/2988611, 1967.
Walker, M. and Dahle, G. A.: Literature Review of Unmanned Aerial Systems and LIDAR with Application to Distribution Utility Vegetation Management, Arboriculture & Urban Forestry (AUF), 49, 144–156, https://doi.org/10.48044/jauf.2023.011, 2023.
Wickham, H.: ggplot2, Springer International Publishing, Cham, https://doi.org/10.1007/978-3-319-24277-4, 2016.
Žemaitis, P., Armoška, E., Stakėnas, V., and Kulbokas, G.: Wood decay and Norway spruce vulnerability to wind-inflicted mortality in monospecific and mixed stands in hemiboreal forests, Forest Ecol. Manag., 569, 122163, https://doi.org/10.1016/j.foreco.2024.122163, 2024.
Zubkov, P., Gardiner, B., Nygaard, B. E., Guttu, S., Solberg, S., and Eid, T.: Predicting snow damage in conifer forests using a mechanistic snow damage model and high-resolution snow accumulation data, Scand. J. Forest Res., 39, 59–75, https://doi.org/10.1080/02827581.2023.2289660, 2024.