
the Creative Commons Attribution 4.0 License.
the Creative Commons Attribution 4.0 License.
 | 26 May 2026
Constructing physical-based rainfall landslides prediction model: insights from rainfall threshold curves database of slope units
Kai Wang
Linmao Xie
Shuailong Xie
Shaojie Zhang
Yongyang Jiang
Ji Zhang
Lin Zhu
Zhiliu Wang
Fuzhou Qi
The commonly used rainfall threshold warning method relies heavily on historical rainfall and landslide inventory data, which limits its applicability in regions that lack these data. While physical methods do not rely on landslide inventories to establish warning criteria, the calculation of the safety factor typically requires considerable time. To address these issues, this study integrates physical methods, rainfall threshold warning methods, and slope units to develop a rapid forecasting model for rainfall landslides at a regional scale. A hydrological analysis technique for slope units based on grid cells was developed to calculate the instability probability of slope units. Then, each slope unit was analyzed under 20 levels of antecedent effective precipitation and nearly 200 combinations of rainfall intensity (I) and duration (D) to derive the key fitting parameters α and β of the I–D curves under various rainfall scenarios. The application results from Fengjie County indicate that the model runs in less than 12 min, with missing alarm and false alarm rates of 11.8 % and 21.1 %, respectively, highlighting its excellent potential for practical application. This study is expected to provide insights for the rapid forecasting of rainfall landslides in the impoverished mountainous regions of developing countries.
- Article
(16518 KB) - Full-text XML
- BibTeX
- EndNote


Rainfall-induced landslides at a regional scale are among the most common types of natural hazards worldwide. Reports indicate that in the United States, rainfall-triggered landslides and secondary hazards result in 25–50 fatalities and economic losses of approximately USD 2 billion annually (Spiker and Gori, 2003). This loss is even more severe in developing countries in the Third World (Wang and Zhang, 2021; Wang et al., 2023, 2024). In recent years, numerous studies have indicated that regional landslide forecasting is highly effective for hazard prevention and mitigation. Researchers have developed various rainfall landslide forecasting models based on statistical and physical methods (Aristizábal et al., 2016; Baum et al., 2008; Bezak et al., 2016; Bogaard and Greco, 2018; Cuomo et al., 2021; Liang and Uchida, 2021; Medina et al., 2021; Pinho and Augusto Filho, 2022; Tufano et al., 2021; Wang et al., 2013; Zhang et al., 2021, 2019; Moeineddin et al., 2023; Li et al., 2025). However, there are still several unresolved issues in regional landslide forecasting, making accurate and efficient warnings a significant global challenge.
The first major issue is the selection of forecasting methods. The presented statistical approaches generally depend on historical precipitation and landslide inventory data to construct the rainfall threshold curves. Recently, researchers proposed different types of rainfall threshold curves, including Intensity–Duration (I–D), Rainfall event–Duration (E–D), Rainfall event–Intensity (E–I), Intraday rainfall and antecedent effective rainfall (IR–AER), Intensity–Probability (I–P), and Intensity–Duration–Mean areal rainfall( I–D–MEAR) (Brunetti et al., 2010; Hong et al., 2005; Rosi et al., 2020; Zhuang et al., 2014). The I–D curve is the most extensively used among these types. The I–D curve is typically fitted in either Cartesian coordinates or a double-logarithmic coordinate system, and the equation of the curve is governed by two key fitting parameters, α and β, expressed as follows:
where α and β are derived from the statistical analysis of historical rainfall and landslide data.
Studies indicate that statistical methods are applicable in regions with abundant historical records of rainfall landslides because these areas can provide sufficient samples for fitting the I–D curve (Bezak et al., 2016; Hong et al., 2017; Kanungo and Sharma, 2014; Kim et al., 2020; Ma et al., 2015; Marra, 2018; Pradhan et al., 2018). However, in the poor mountainous regions of the Third World, many areas that are severely affected by landslides lack professional monitoring devices and rain gauges, potentially limiting the application of statistical approaches (Zhang et al., 2021, 2019). In contrast, physical methods typically rely on hydrological and mechanical analyses to calculate the safety factors of landslides under different rainfall scenarios, thereby reducing the reliance on historical rainfall and landslide observation data. In regions where landslide inventory data are scarce, physical methods could serve as promising alternatives (Zhang et al., 2021, 2019). However, physical methods require historical landslide data to validate the accuracy of the forecasting results, and the safety factor calculation process typically requires a considerable amount of time. This computational burden increases substantially when considering the stability analysis of thousands of slopes at the regional scale, making it difficult to ensure the efficiency of real-time warnings (Zhang et al., 2021).
The second issue pertains to the selection of prediction unit. Clearly defined prediction units enable residents to identify the specific locations where landslides are likely to occur while also providing guidance for local governments to develop emergency schemes. However, the I–D warning curves derived from statistical methods can only provide general trends of hazards within the region but cannot pinpoint the specific locations of landslide occurrences. Grid cells improve the clarity of the prediction results to some extent, as the specific locations of each grid within the area are well defined (Zhang et al., 2021). Researchers have employed grid cells to establish multiple physical forecasting models such as Shallow Landslide Stability model (Montgomery and Dietrich, 1994), Stability Index Mapping (SINMAP) (Tarboton and Goodwin, 1998). The Three-dimensional Fully Distributed Hydrological model-Safety factor (GEOtop-FS) (Rigon et al., 2006), Transient Rainfall Infiltration and Grid-Based Regional Slope-Stability Analysis (TRIGRS) (Baum et al., 2008), High Resolution Slope Stability Simulator (HIRESSS) (Rossi et al., 2013), Hillslope-scale Shallow Landslide Induced Debris Flow Risk Evaluation (H-slider) (Liang and Uchida, 2021), Open and Distributed Hydrological Simulation and Landslides (SHIA_Landslide) (Aristizábal et al., 2016), Shallow Landslides Instability Prediction (SLIP) (Montrasio and Valentino, 2016), and Fast Shallow Landslide Assessment Model (FSLAM) (Guo et al., 2022). However, the morphology of grid cells does not accurately characterize the topographical features of natural hillslopes (Domènech et al., 2019; Zhang et al., 2021), resulting in a lack of clear geomorphological significance. In practical applications, a natural slope can be segmented into a series of grid cells, in which each grid is assigned a different alert level. This indicates that a high warning level in a grid cell does not mean that the entire slope will experience a slide.
In contrast, slope units can represent the topographical features of landslides more accurately, and their boundaries are easily discernible in field environments. Currently, there are various methods for extracting slope units, including the DEM-based hydrological process analysis method (Turel and Frost, 2011), r.slopeunits method (Alvioli et al., 2020), curvature watershed methods (Yan et al., 2021), MIA-HSU methods (Wang et al., 2019), and multi-scale image segmentation methods (Huang et al., 2021). In recent years, researchers have developed forecasting models utilizing slope units, validating their promising application potential in predicting rainfall-induced landslides (Wang et al., 2023; Zhang et al., 2021). Addressing the issues outlined in regional landslide forecasting, this study focuses on the integration of slope units, physical methods, and rainfall parameterized warning techniques to develop a rapid forecasting model applicable to large areas on a scale of thousands of square kilometers. Within this model, we no longer pay attention to the positional relationship between the rainfall data of a landslide and the I–D curve, but concentrate on the key fitting parameters α and β of the I–D curve for each slope unit. To facilitate this, we developed a rainfall infiltration simulation technique rooted in grid cells within slope units and subsequently utilized physical methods to analyze the instability probability for slope units under different rainfall scenarios. For each slope unit, we designed rainfall scenarios comprising various antecedent rainfall levels combined with hundreds of rainfall intensity and duration combinations. This allowed us to obtain the key parameters α and β of the I–D curves for different rainfall scenarios, thereby constructing a database of parameters α and β under various antecedent precipitation levels. A case study in Fengjie County, in the Three Gorges Reservoir area, was conducted to validate the reliability of the proposed method. This research is expected to provide valuable insights for regional landslide forecasting in impoverished mountainous areas in the developing world.
2.1 The slope unit extraction method MIA-HSU
Currently, there are various methods for extracting slope units, each requiring distinct key parameters and yielding different extraction results (Wang et al., 2023). Among these, the MIA-HSU method generates slope units with homogeneous slope gradient and aspect within each unit. In recent years, it has been utilized in rainfall landslide early warning systems in the mountainous regions of southwestern China (Wang and Zhang, 2021; Wang et al., 2025). In this study, we employed the MIA-HSU method to extract slope units (Wang and Zhang, 2021; Wang et al., 2019, 2023). In the MIA-HSU method, each HSU(homogeneous slope unit) is defined as a continuous and homogeneous geomorphological entity. This definition implies that terrain features related to slope and aspect are uniform within each HSU, with boundaries indicating transitions in topographical features. The MIA-HSU method consists of two steps. The first step involves partitioning the Digital Elevation Model (DEM) into small regions with homogeneous terrain characteristics. In this step, the MIA-HSU method utilizes terrain curvature analysis to identify ridge and valley regions (Fig. 1a) and then extracts the morphological skeleton lines of ridge and valley areas to characterize topographic relief. Morphological algorithms (such as dilation and erosion) were used to extract the morphological skeletons of ridges, valleys, and flat areas from the DEM (Fig. 1b), ultimately connecting these skeletons into a closed network (Fig. 1c). Thus, each small region within the network exhibits uniform geomorphological characteristics. The second step involves merging small adjacent regions. The MIA-HSU method employs the principal component analysis (PCA) method to derive fitted planes from localized terrain regions, followed by the implementation of vector similarity criteria to merge adjacent small regions, thereby generating HSUs (Fig. 1d).
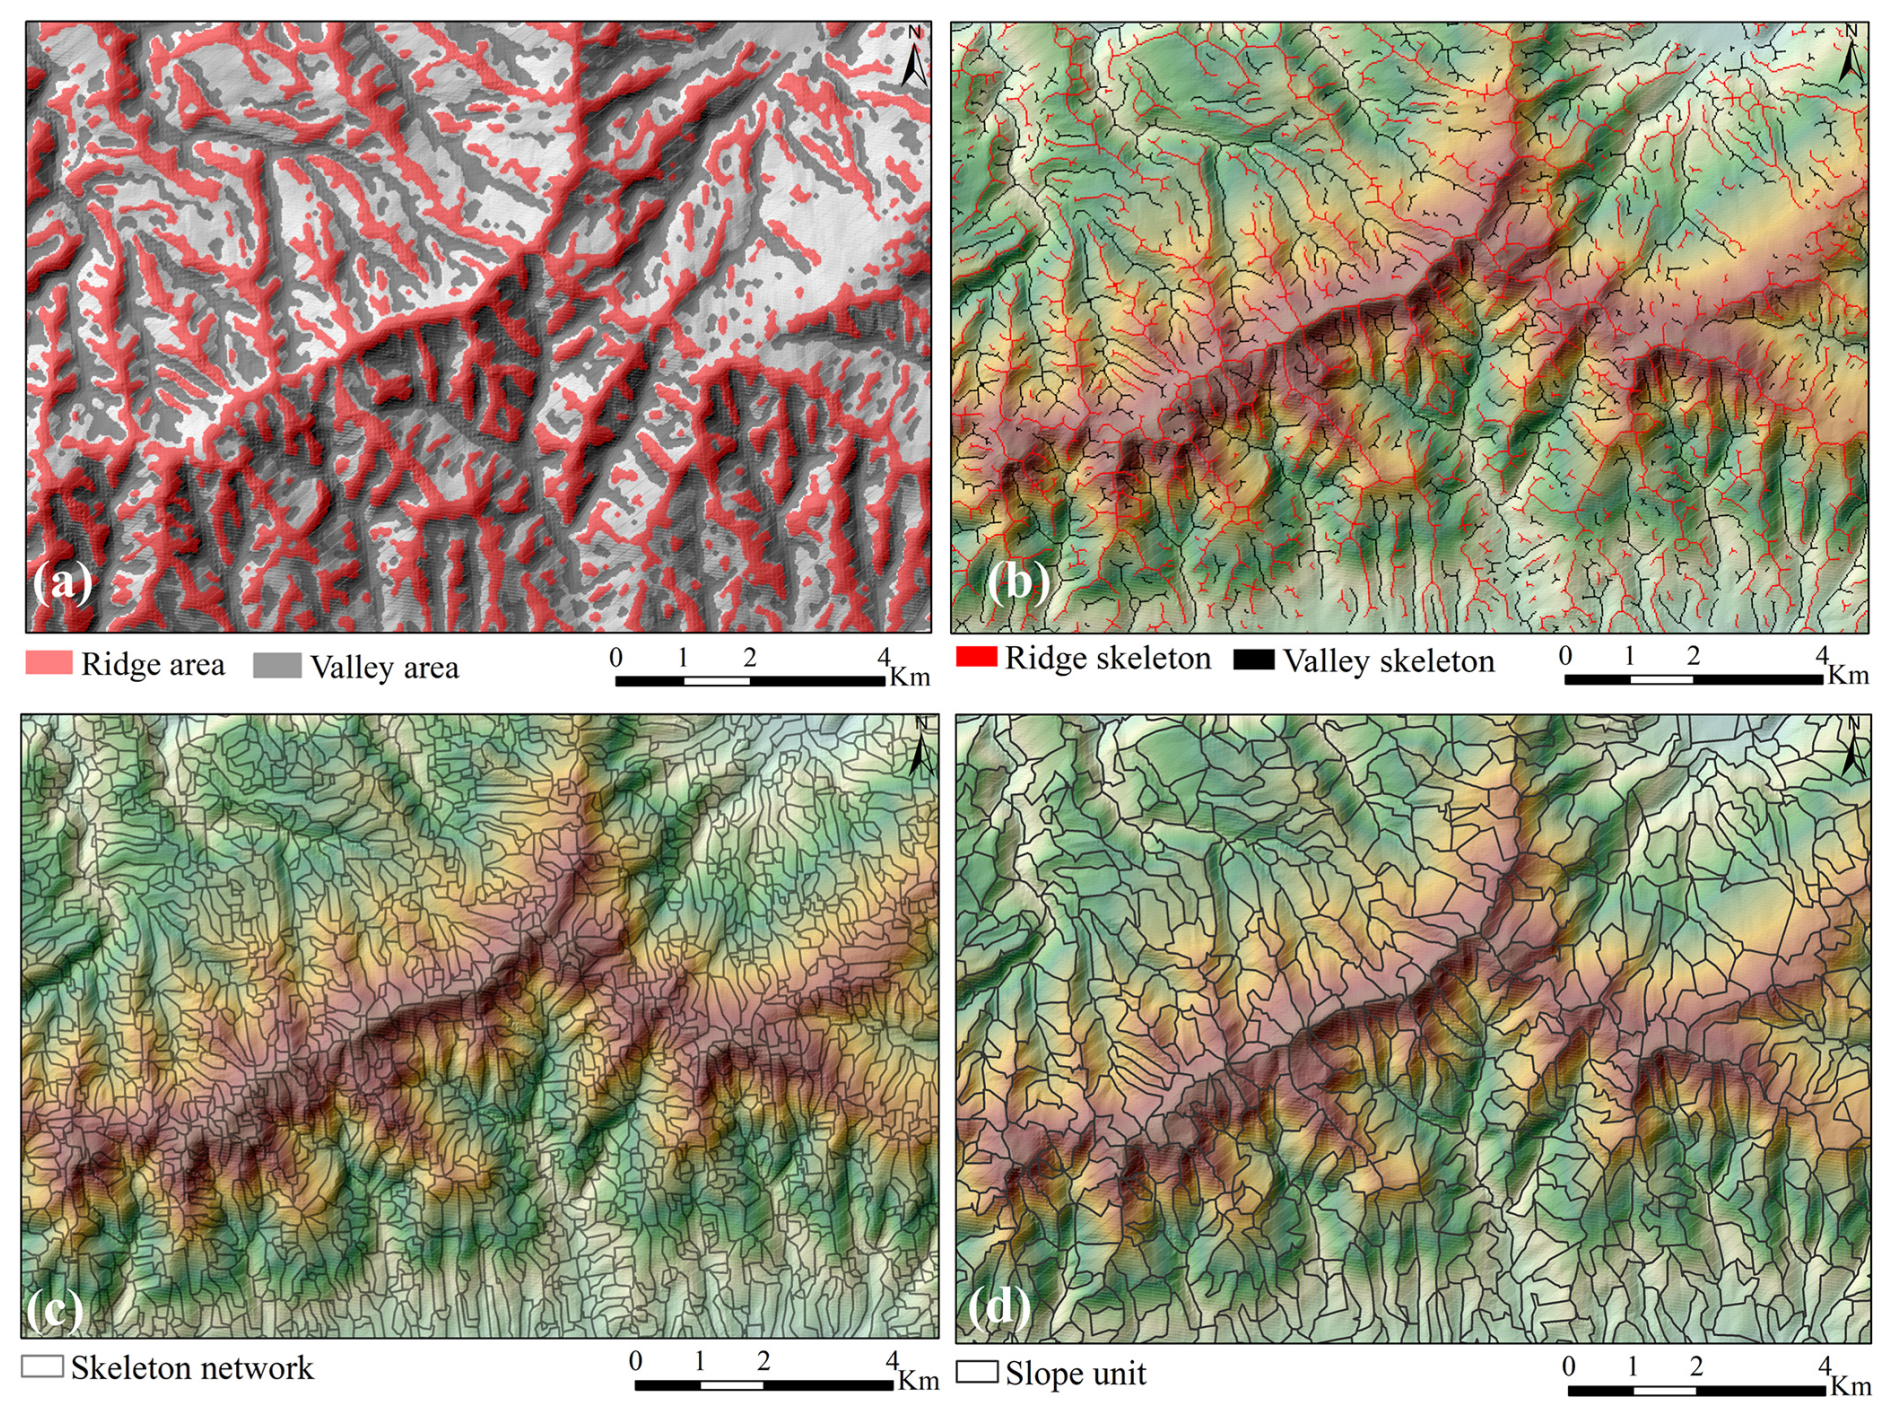
Figure 1HSU extraction process: (a) the identification of ridge and valley areas; (b) the morphological skeleton line extraction for ridge and valley areas; (c) the morphological skeleton closed network; (d) HSU extraction result.
2.2 The HSU hydrologic simulation technique based on grid cells
2.2.1 The identification for row and column information of grid cell within HSUs
From a geometric perspective, an HSU can be regarded as a spatial polygon that signifies a landform entity with homogeneous terrain features in the field environment. At the regional scale, there is obvious heterogeneity in the topography and boundary characteristics among different HSUs (Wang and Zhang, 2021; Wang et al., 2019, 2023), resulting in the immaturity of hydrological analysis methods based on slope units. In contrast, hydrological analysis methods based on grid cells are well-developed. Some researchers have employed grid cells integrated with an infinite slope model or the limit equilibrium method to conduct regional landslide assessment or prediction (Gu et al., 2014; Wang et al., 2023; Zhang et al., 2021; Zhuang et al., 2016). In this study, each HSU was conceptualized as a composition of grid cells with similar microtopographic features, as illustrated in Fig. 2a. For each HSU, we utilized GIS spatial analysis tools to quantify the number of grid cells contained within it and their corresponding row and column positional information, thus establishing a comprehensive database that includes the position information of the grid cells within each HSU.
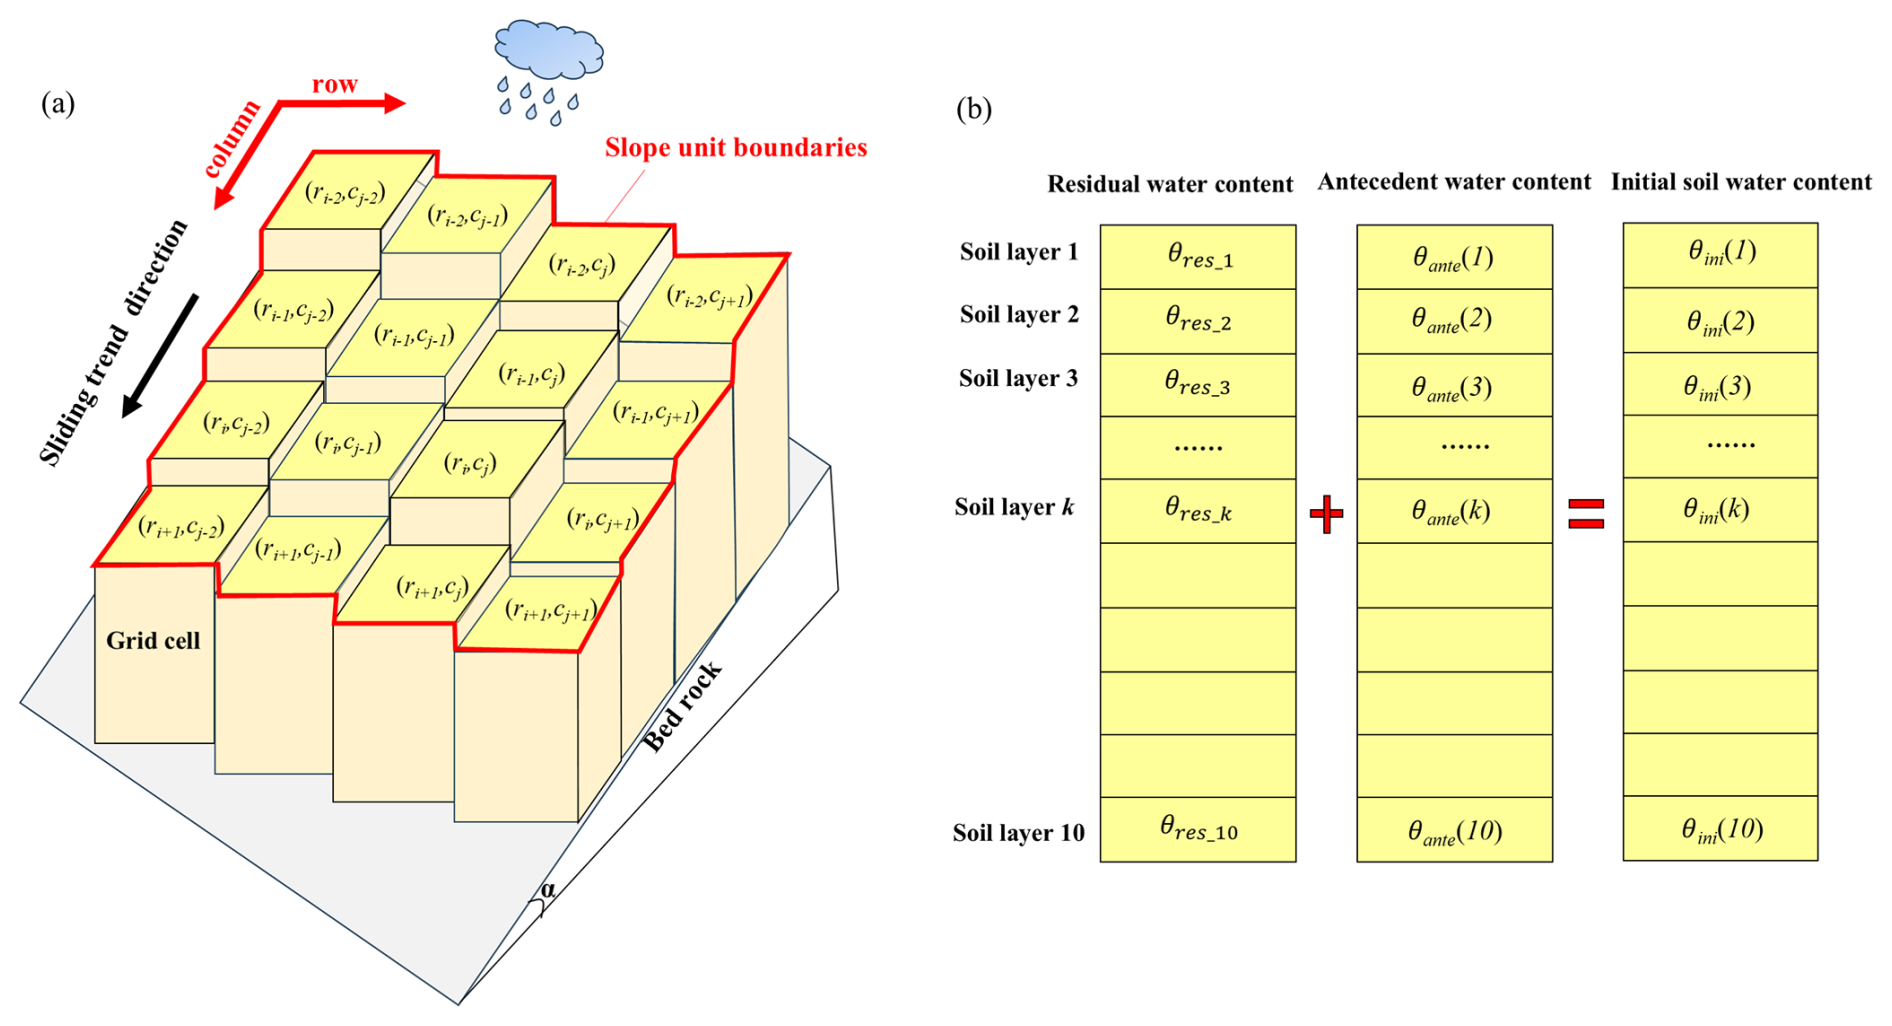
Figure 2The diagram for HSU-grid cell hydrological connection: (a) grid cells contained within HSU (ri, cj represent the row and column of grid cells contained within HSU, respectively).
2.2.2 Initial water content assignment of HSUs
After obtaining the grid cell information contained within each HSU, conducting a rainfall infiltration analysis for these grid cells represents a complex and important task. One issue that cannot be overlooked is initial moisture content. For landslides in the Three Gorges Reservoir area of China, the soil typically experiences a prolonged dry winter before the rainy season (May to September). Previous research indicates that the residual moisture content of slopes before the rainy season averages approximately 7 % to 8 % (Wang et al., 2023). Accordingly, this study categorizes the initial water content into two components: the residual moisture content (θres) and the moisture content increment caused by antecedent precipitation (θante). Here, θres reflects the average moisture level of the soil prior to the rainy season, while θante indicate the increase in moisture content due to antecedent effective precipitation prior to landslide occurrence.
In this study, each grid cell is stratified into ten soil layers, each with a thickness of 0.2 m (Fig. 2b). For the Three Gorges Reservoir area, the regional landslides triggered by rainfall were mainly shallow (with thicknesses of 2–3 m). Therefore, variations in residual moisture content within the soil depth were disregarded, and the same residual moisture content value was assigned to each soil layer. Following this, we applied steady-state infiltration theory to simulate the distribution of moisture content across the soil layers influenced by antecedent precipitation, thereby allocating the antecedent rainfall to each soil layer. The calculation for θini of each soil layer within the grid cell is as follows:
Where n represents the number of soil layers, and here n=10; θini(k) indicates the initial moisture content of each soil layer; θante(k) refers to the moisture change in each soil layer due to previous precipitation; θres stands for the residual moisture content in the grid cell.
2.2.3 Rainfall infiltration process simulation of grid cell
After obtaining the initial moisture content distribution, the 1-dimensional Richards infiltration equation was used to solve the moisture content distribution in the grid cell during the rainfall infiltration process.
Where D(θ) represents the value of soil water diffusivity under unsaturated conditions and has .
The finite difference scheme outlined above was formulated for numerical simulation of hydrological processes. The lower boundary, identified as impermeable, is based on the maximum soil depth of the grid cell. The upper boundary of each grid cell was designated as an infiltration boundary. When the rainfall intensity I(t) is less than the infiltration capacity of the topsoil, all precipitation infiltrates into the soil, and no runoff is generated. In this scenario, the infiltration boundary of precipitation was governed by the following differential equation:
When the rainfall intensity exceeded the soil infiltration capacity, the excess portion was transformed into overland flow. At this point, the rainfall infiltration boundary was governed by the following equation:
Where θs is the saturated water content of the grid cell.
2.2.4 Soil water content generation of HSU
Following the calculation of the soil moisture for individual grid cells, the soil water distribution of the HSU was computed as follows:
Where θHSU(k) represents the moisture content of the kth layer of the HSU, θ(k) denotes the moisture content of the kth layer in the grid cell. n is the number of soil layers (n=10).
2.3 HSUprob: the calculation of instability probability of HSUs
2.3.1 Profile extraction
After calculating the soil water content within each HSU, analyzing the stability of HSUs during the rainfall infiltration process is another important task. At present, the time required to carry out 3D analysis for each HSU on a large regional scale is too large, so extracting the calculation profile of the HSU becomes a reasonable selection. Currently, there is no uniform method for extracting the calculation profile of HSUs. Some reasonable assumptions are summarized as follows: the position of the profile line should reflect the elevation difference between the front and back edges of the slope, and the centroid point of the HSUs should be on the calculated profile to ensure that the soil weight on both sides of the calculated section is relatively uniform, and the areas of the two sections should be close to each other.
Based on these considerations, we developed a fast extraction algorithm HSU-profile (Wang and Zhang, 2021; Wang et al., 2023) for HSU profiles at large regional scales, which can be divided into three steps.
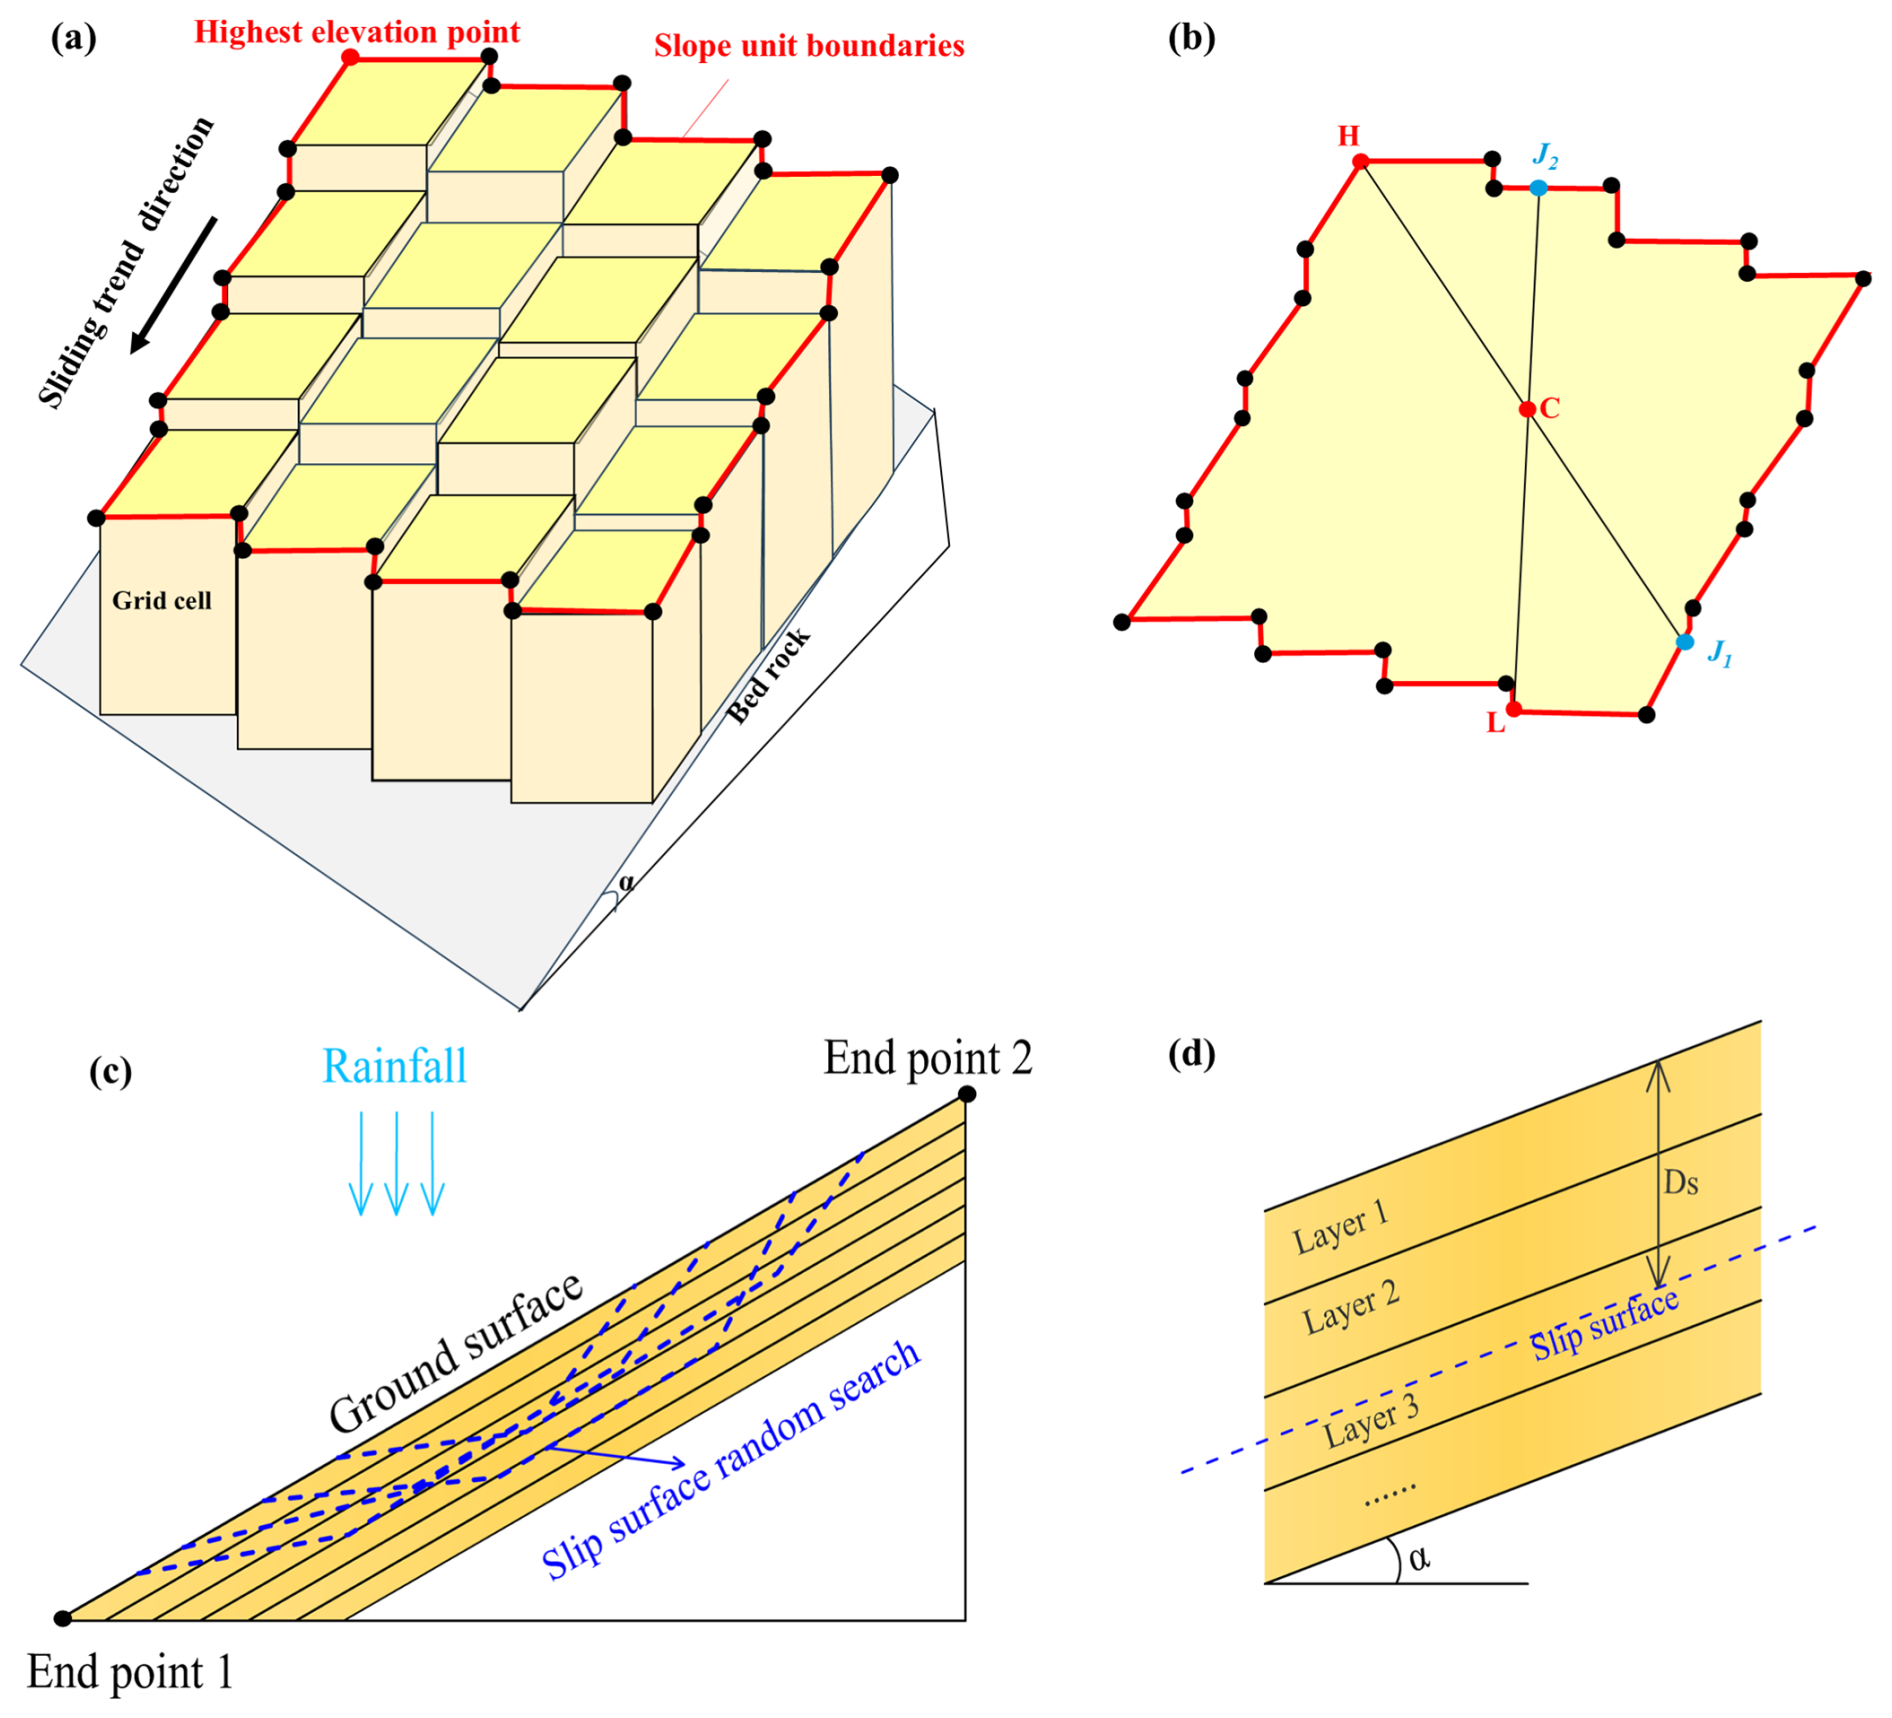
Figure 3HSU instability probability calculation diagram. (a) Extraction of HSU boundary points; (b) profile line extraction of HSU polygon; (c) random search for critical slip surface; (d) enlarged view of the sliding mass for detailed visualization.
First, the highest elevation point H of the HSU polygon is connected to centroid point C to obtain line segment L1, which intersects the HSU polygon at point J1 (Fig. 3b). Line segment L1 divides the HSU polygon into two parts, and the areas of the two parts, S1 and S2 are calculated to obtain the area ratio .
Next, the lowest elevation point L and centroid C are connected to form line segment L2, as shown in Fig. 3b. Determine the intersection point J2 between L2 and the polygon of the slope unit is determined. At this point, the HSU was divided into two parts by line segment L2, and the areas of the two parts, S3 and S4, were calculated to obtain the area ratio .
Finally, and are compared. A smaller absolute value of A indicates that line segment L1 divides the areas on both sides of the HSU polygon more evenly. In this case, L1 is selected as the profile line. Otherwise, the line segment L2 was chosen as the profile line.
2.3.2 Calculation of safety factor Fs calculation
For each HSU, the Monte Carlo method was used to generate a large number of potential polyline-type slip surfaces (Fig. 3c), and the random walk method (Greco, 1996; Zhang and Zhang, 2006) was employed to search for the critical slip surface. The random search times for the sliding surface of each HSU are set to 500 times, then the infinite slope model was used to calculate the safety factor Fs of each potential slip surface as follows:
Where c is the effective cohesion of the soil, φ is the effective internal friction angle of the soil, and rs is the average unit weight of soil above the slip surface. φb is related to the matric suction; when the matric suction is low, it is close to the internal friction angle (Zhang et al., 2018). Ds is the thickness of the soil layer above the slip surface. us represent the matric suction, which can be described by the Van Genuchten model(Van Genuchten, 1980):
Where Se represents the saturation degree, θ denotes the soil water content of the HSU, θs and θr are the saturated and residual water content, respectively. The parameters αw, n and m characterize the shape of the soil–water characteristic curve, with the relationship .
2.3.3 HSUprob calculation
According to the saturated-unsaturated rainfall infiltration theory, the mechanical parameters of the soil (such as cohesion force c (kPa) and internal friction angle φ (°)) are significantly affected by soil moisture content fluctuations. The variation in soil mechanical parameters during the process of rainfall infiltration is very complex, and it is generally acknowledged that dry soil prior to rainfall infiltration exhibits higher mechanical strength (characterized by elevated parameter values). As rainwater continues to infiltrate, the soil water content gradually increases, leading to a decreasing trend in mechanical parameters, such as cohesion and internal friction angle. Consequently, the mechanical parameters of the soil within each HSU are not fixed, but spatial uncertainty exists to some extent. In this context, employing probabilistic analysis methods to calculate the instability probability of an HSU is a more reasonable choice. Probability density functions (such as normal or uniform distributions) are commonly used to describe the uncertainty of the geotechnical parameters. The normal distribution is considered suitable for small areas or watersheds where hydrogeological parameters can be collected in detail, whereas a uniform distribution is more applicable for larger areas, where it is difficult to acquire detailed hydromechanical parameters (Wang and Zhang, 2021; Wang et al., 2023).
In this study, we utilized a uniform distribution to simulate the uncertainty of the mechanical parameters within the HSUs. The soil mechanical parameters in the unsaturated state before rainfall were taken as the upper bound, while those in the fully saturated state were considered the lower bound, thereby establishing the upper and lower value boundaries for the mechanical parameters within the HSU, as indicated in Eqs. (9) and (10):
where cupper and clower represent the upper and lower bounds of c (kPa), respectively, φupper and φlower represent the upper and lower bounds of φ (°), respectively. The Monte Carlo method was employed to randomly select the values within these bounds. The instability probability of the HSU was calculated using Eq. (11).
where m represents the number of random selections for the mechanical parameters and m is set to 500.
2.4 The obtainment of key fitting parameters α and β for I–D curves of HSUs
In this study, an HSU is regarded as unstable when the value of HSUprob exceeds 50 %. Then, the rainfall intensity and duration data with HSU instability under different rainfall scenarios were recorded to obtain the key fitting parameters α and β for the I–D curves of each HSU, thereby establishing a database of parameters α and β. The detailed steps are as follows.
2.4.1 Setting the antecedent effective rainfall levels AER_i (i=1, 2, 3 …, n)
The antecedent effective rainfall(AER) has a significant impact on landslide occurrence. Previous research indicates that in the Three Gorges Reservoir area, the minimum value of AER before landslide occurrence is 0 mm, whereas the maximum value of AER can exceed 170 mm (Wang and Zhang, 2021). Therefore, 20 different levels of AER ranging from 0 to 200 mm were established with intervals of 10 mm.
2.4.2 Design of the combination of rainfall intensity (I) and duration (D)
For each antecedent rainfall level, we categorized rainfall intensity (I) into eight levels to represent the variation from light to heavy rainstorms: 2, 5, 10, 20, 30, 40, 50, and 60 mm h−1. The rainfall duration (D) ranged from 1 to 24 h, with intervals of one hour. Consequently, 192 combinations of I and D were generated for each AER level.
2.4.3 Generation of fitting parameters α, β of the I–D curves
For each combination of rainfall intensity and duration data, the method outlined in Sect. 2.2 is used to determine the soil water distribution within each HSU, and the corresponding value of HSUprob was computed using the method described in Sect. 2.3. If the HSU is unstable, the corresponding intensity and duration data can serve as data points for fitting the I–D curves. Subsequently, a power function was utilized to fit these data points to obtain the key fitting parameters α and β of the I–D curve. As presented above, the fitting parameters α and β for the I–D curve of each HSU can be generated, thereby establishing a database for α and β at different AER levels.
2.5 Warning Mode
In practical applications, the antecedent effective rainfall(AER), rainfall intensity (I), and duration (D) for each HSU can be computed using Quantitative Precipitation Estimation (QPE) and Quantitative Precipitation Forecasting (QPF) products provided by the meteorological department (Wang and Zhang, 2021). Next, we analyzed the relationship between the actual value of AER and the 20 levels of AER documented in the database, thereby determining the level that is closest to the antecedent effective rainfall data of the HSU. The α and β values corresponding to this level were retrieved from the database for the following assessments.
-
If I≥αDβ, the data point (I, D) is above the warning curve; thus, the warning should be released.
-
Conversely, if I<αDβ, it signifies that the data point (I, D) is below the warning curve; therefore, no warning should be issued.
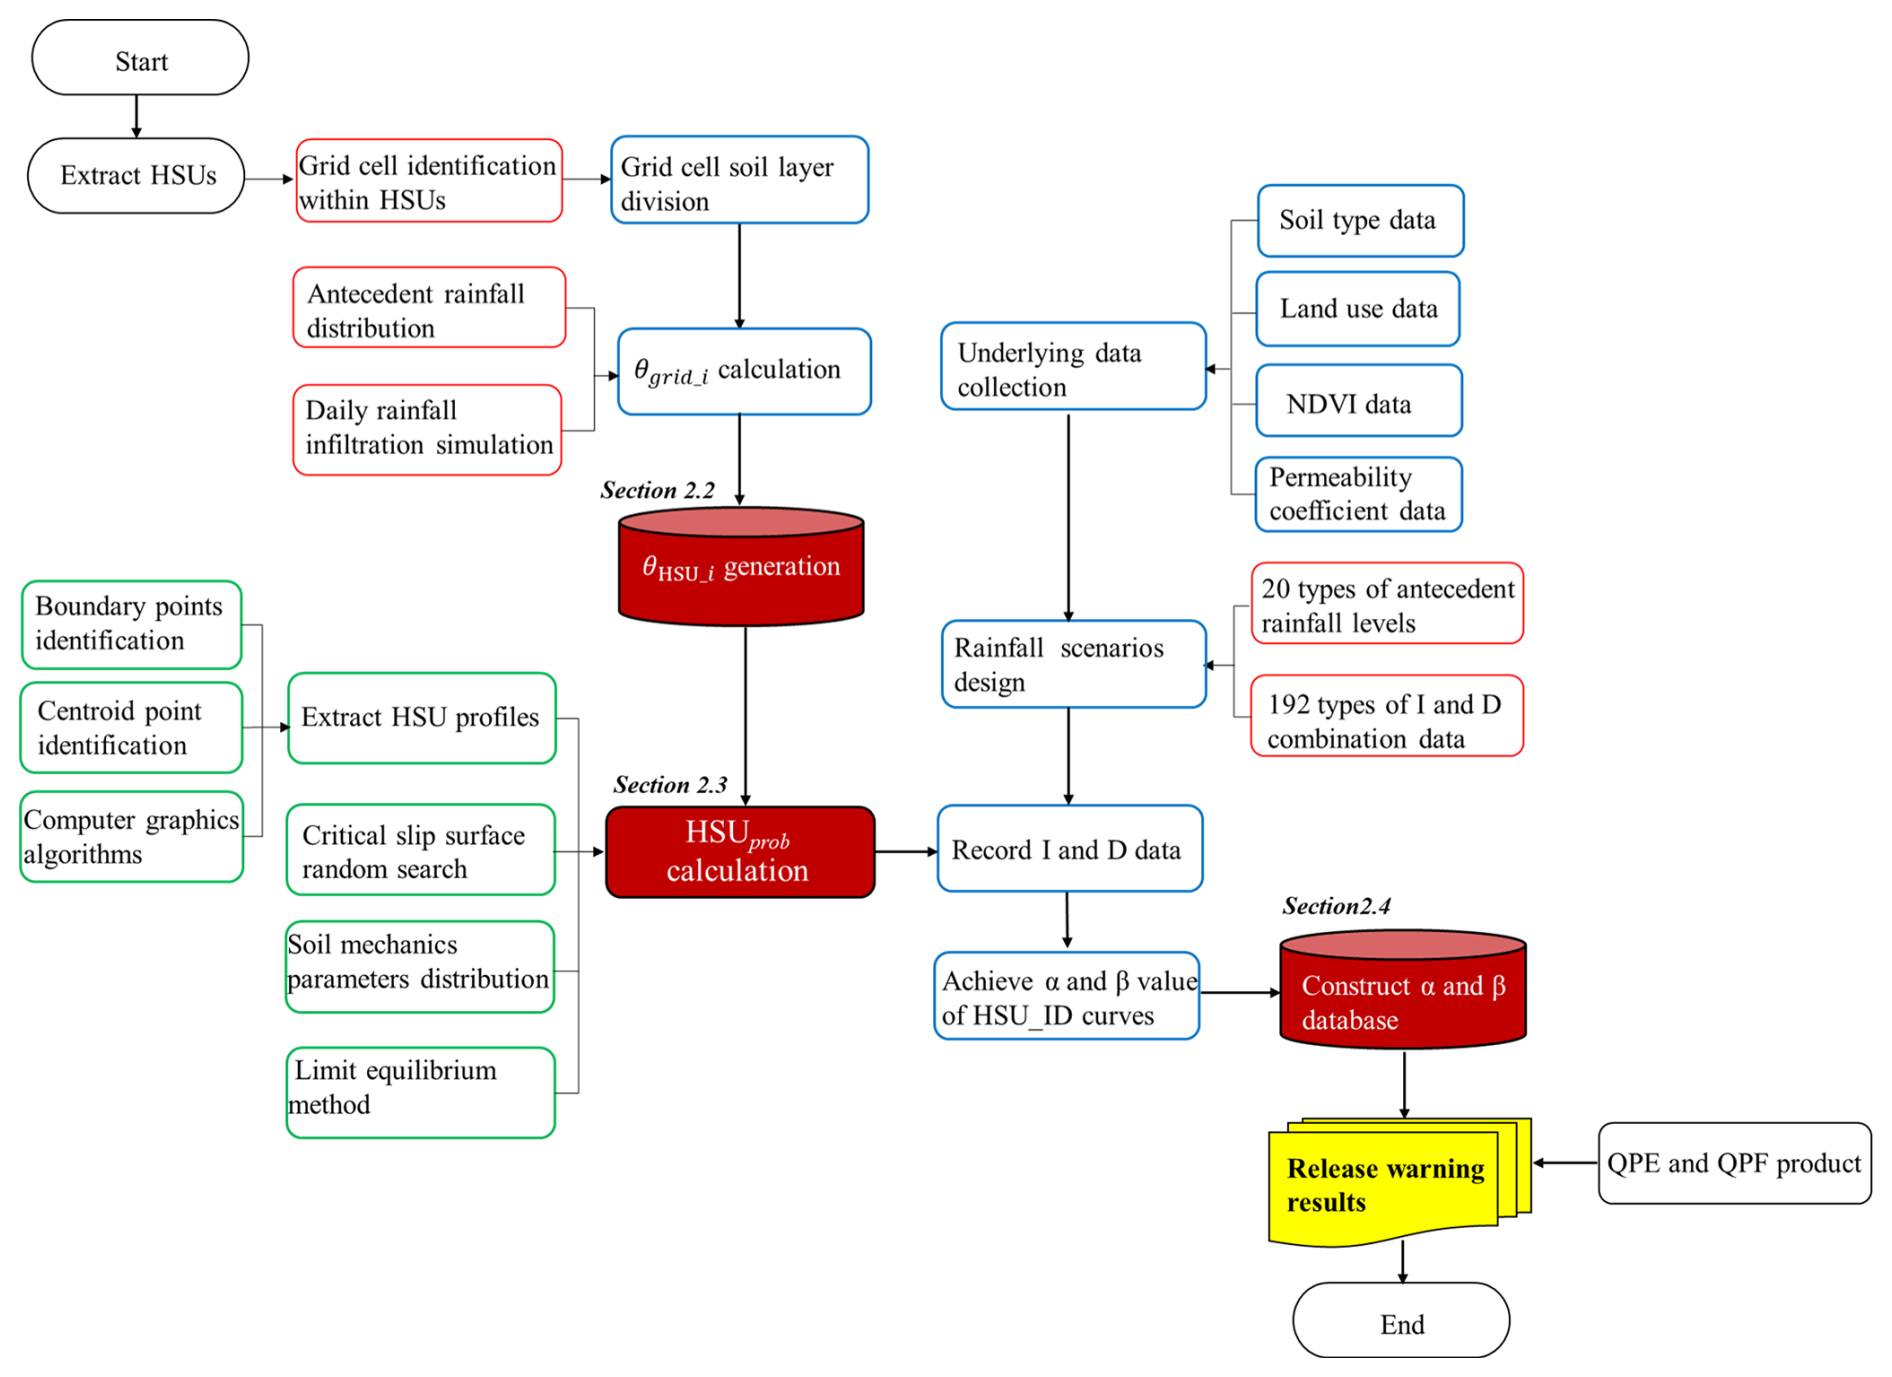
The programming languages Fortran 95 and Python 3.1 were employed to compile the algorithms outlined in Sect. 2.1–2.5, and the overall flowchart of the warning mode is depicted in Fig. 4.
3.1 Study area and slope unit data
Fengjie County is situated in the eastern region of the Three Gorges Reservoir area, with geographical coordinates ranging from 109°1′17′′ to 109°45′58′′ E and 30°29′19′′ to 31°22′33′′ N, covering a total area of 4087 km2. The region has a subtropical humid monsoon climate with an annual average rainfall of 1500–2000 mm. The rainy season occurs from May to September, accounting for 70 % of the annual precipitation. The terrain is primarily mountainous and the Yangtze River flows across the region from west to east. Geological hazards, such as landslides, debris flows, and collapses, are widely distributed in Fengjie County, with rainfall landslides posing the most significant threat. Based on the 7 m DEM of Fengjie (Fig. 5a), the MIA-HSU method was employed to extract the slope units, resulting in the identification of 17 547 HSUs (Fig. 5b and c). Histograms of the slope gradient and area distribution of the HSUs are presented in Fig. 5d–e. As shown in Fig. 5d, the slope gradients of the HSUs follow a normal distribution, with 85.4 % of the slopes falling within the range of 10 to 30°. Figure 5e illustrates that the average area of the HSUs is 0.23 km2, with 53.9 % of the slope units having an area less than 0.25 km2. Because the sliding depth of shallow landslides typically ranges from 2 to 3 m, the majority of HSUs can be classified as small-to medium-scale landslides (with volumes under 500 000 m3).
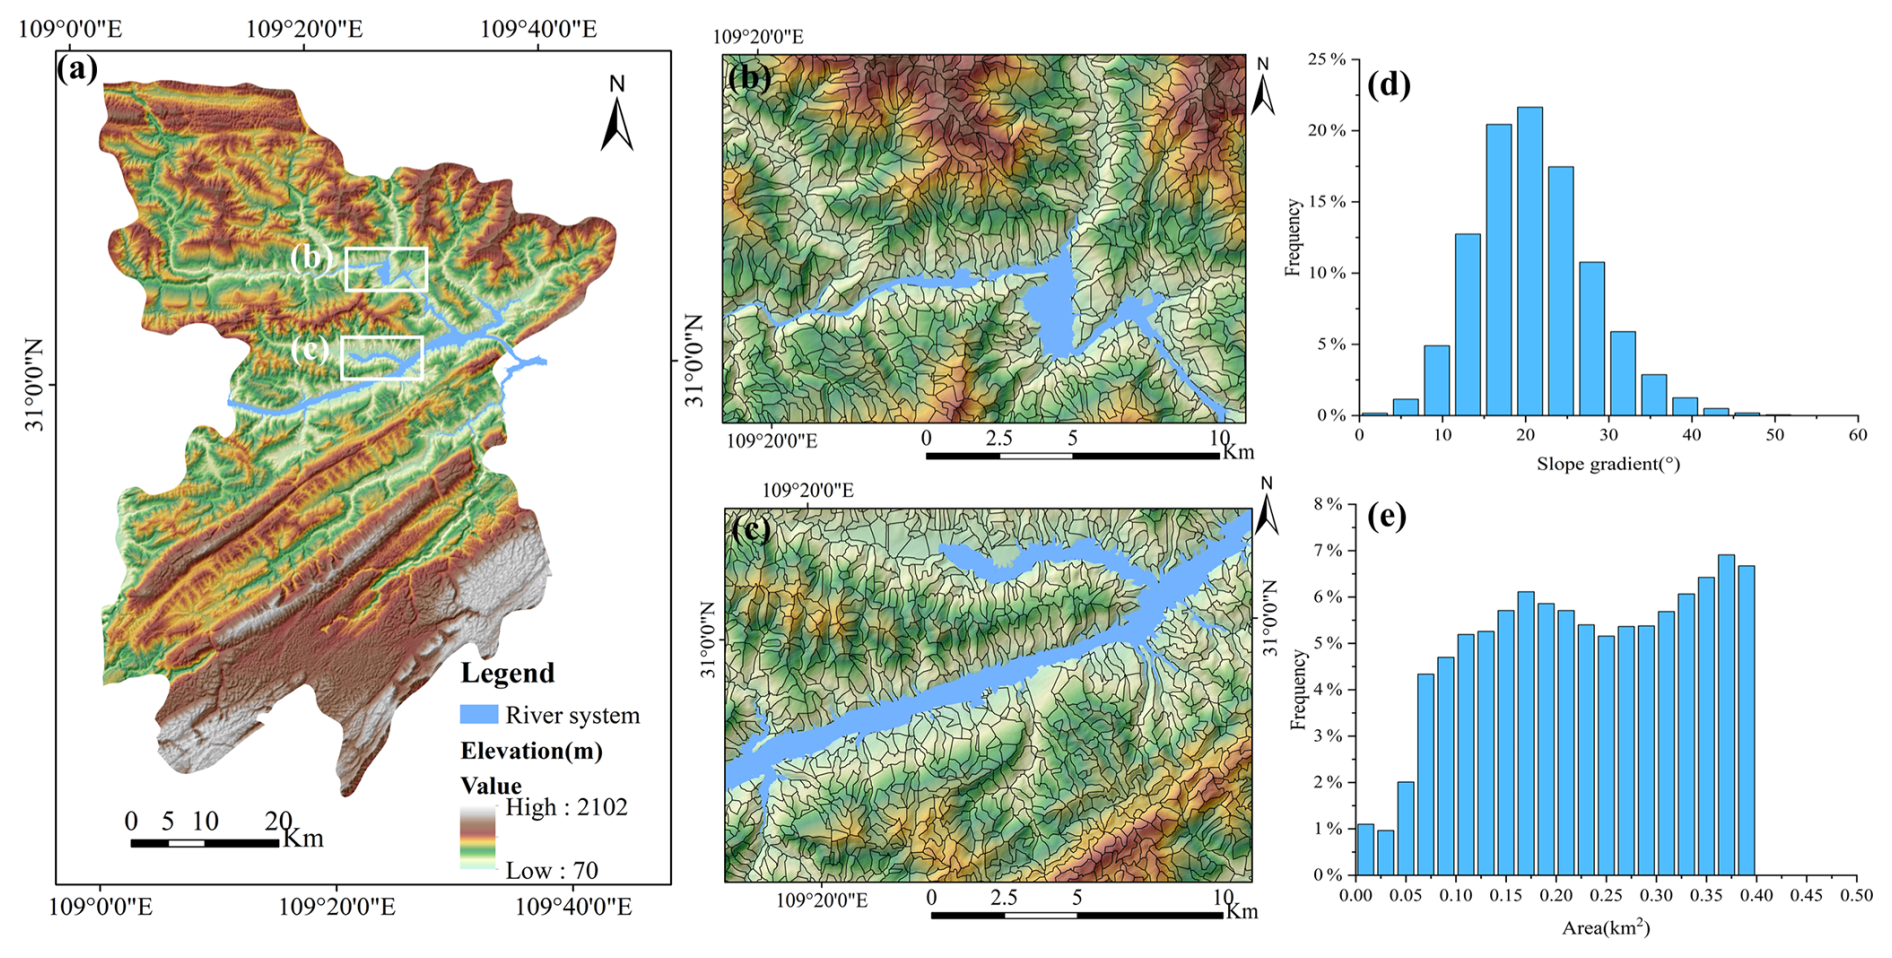
Figure 5Division of HSUs in Fengjie County. (a) Fengjie DEM; (b, c) extraction results for selected regions: enlarged view; (d) histogram of slope distribution of HSUs; (e) histogram of area distribution of HSUs.
3.2 Soil mechanical parameter c (kPa) and φ (°) data of HSUs
The rainfall-triggered shallow landslides within the study area are mainly composed of quaternary clay and silt, which are classified as fine-grained soils (Wang and Zhang, 2021; Wang et al., 2023). Field investigations indicate that the sliding soil is fully or even oversaturated, with some soil mass transitioning into mudflow during the sliding process. The laboratory moisture content tests revealed that the soil water content under these conditions approached or exceeded the liquid limit. To obtain detailed soil mechanical parameters under different moisture states, we conducted extensive field sampling across Fengjie County, resulting in 312 sampling points, as depicted in Fig. 6f. For each sampling point, direct laboratory shear tests were performed to derive the soil mechanical parameters c (kPa) and φ (°) at the liquid and plastic limits, respectively. Based on geological survey data provided by the Fengjie County Land Bureau, the dry density of soil within a 10 m thickness ranges from 1.7 to 1.8 g cm−3 (Wang et al.,2021). Therefore, the dry density of each soil samples is randomly selected within this range. In accordance with the ASTM-d6528 (ASTM D6528-17, 2017) standard, 312 groups of liquid-plastic limit tests and 624 groups of undrained direct shear tests were performed to obtain the mechanical parameters of each sample at both the liquid and plastic limit water contents. Subsequently, ArcGIS spatial analysis tools were utilized to generate distribution maps of c (kPa) and φ (°) under plastic and liquid limit moisture conditions, as shown in Fig. 6g–j.
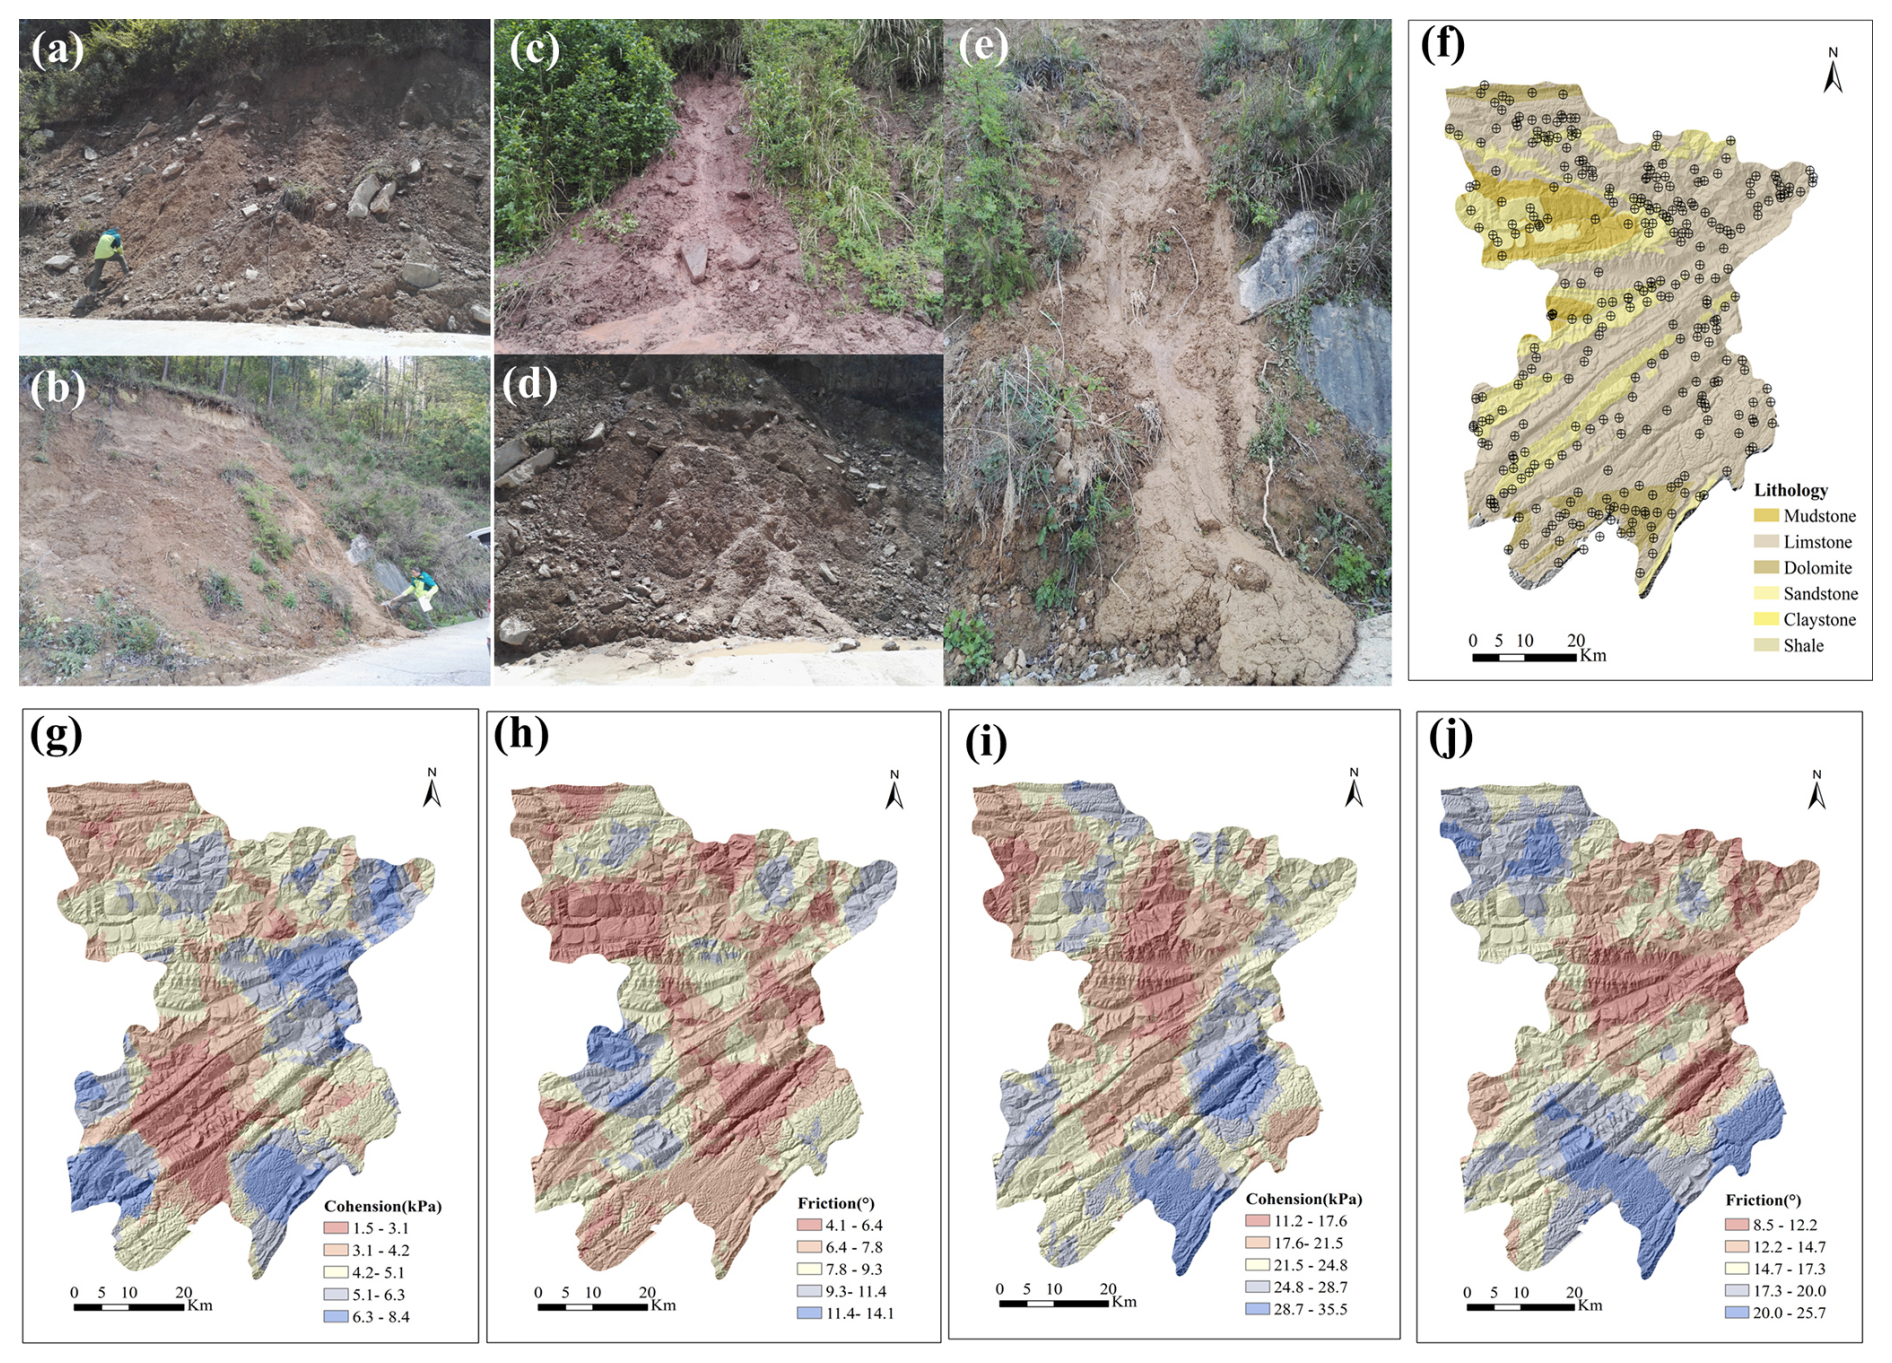
Figure 6State of Landslide Soil Before and After Rainfall. (a) Soil approaching plastic limit moisture content before rainfall; (b) soil approaching plastic limit moisture content before rainfall; (c) soil in a fluid state after rainfall; (d) soil in a fluid state after rainfall; (e) fully saturated and liquefied soil after rainfall; (f) soil sampling locations; (g) c (kPa) at plastic limit moisture content; (h) φ (°) at plastic limit moisture content; (i) c (kPa) at liquid limit moisture content; (j) φ (°) at liquid limit moisture content.
3.3 Rainfall data
Rainfall data sources include Quantitative Precipitation Forecasting (QPF) products and Quantitative Precipitation Estimation (QPE) products. The QPF product obtained from the local government of Fengjie County is typically utilized to forecast future rainfall at a regional scale, which can provide rainfall forecast products for the next hour. QPE data are applied to estimate historical regional rainfall at a regional scale and are essential for determining the antecedent effective rainfall (AER), which can be computed as follows:
Where AER is the antecedent effective rainfall, a is the attenuation coefficient, which is equal to 0.84, based on the research of the Fengjie count (Wang and Zhang, 2021), n is the number of days before the landslide occurs.
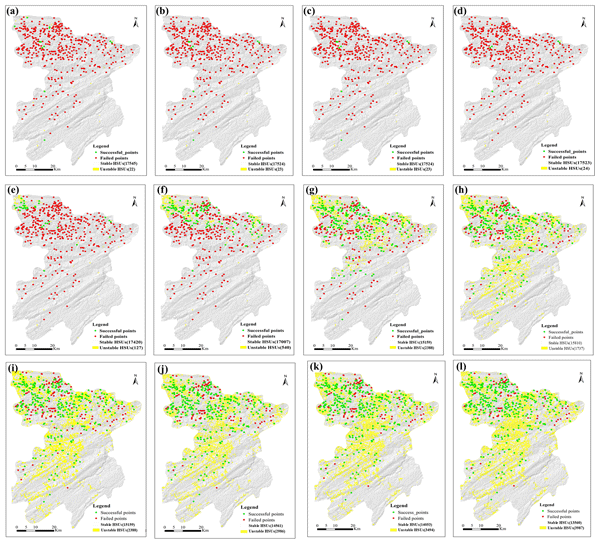
From 30–31 August 2014, Fengjie experienced continuous heavy rainfall, triggering a series of landslide hazards that resulted in over 30 fatalities and an economic loss of CNY 580 million. Based on the QPE data with the resolution of 1 km for 15–31 August, the effective precipitation for the 15 d prior to the landslide hazards is shown in Fig. 7. As illustrated in Fig. 7, the maximum precipitation during this period was 179.10 mm, which occurred in the northwestern region of the area. The hourly QPF data for 31 August (with a resolution of 1 km) are presented in Fig. 8a–l. As illustrated in Fig. 8a–d, the rainfall was minimal from 00:00 to 08:00 Beijing Standard Time (UTC+8), with a maximum cumulative rainfall of 12.2 mm 08:00 BST. As shown in Fig. 8e–g, rainfall began to increase rapidly at 10:00 BST, reaching a maximum cumulative precipitation of 92.40 mm by 14:00 BST in the northwestern region of Fengjie County. Figure 8h–l indicate that from 16:00 to 24:00 BST, the cumulative rainfall remained constant, suggesting that the rainfall process had ceased.
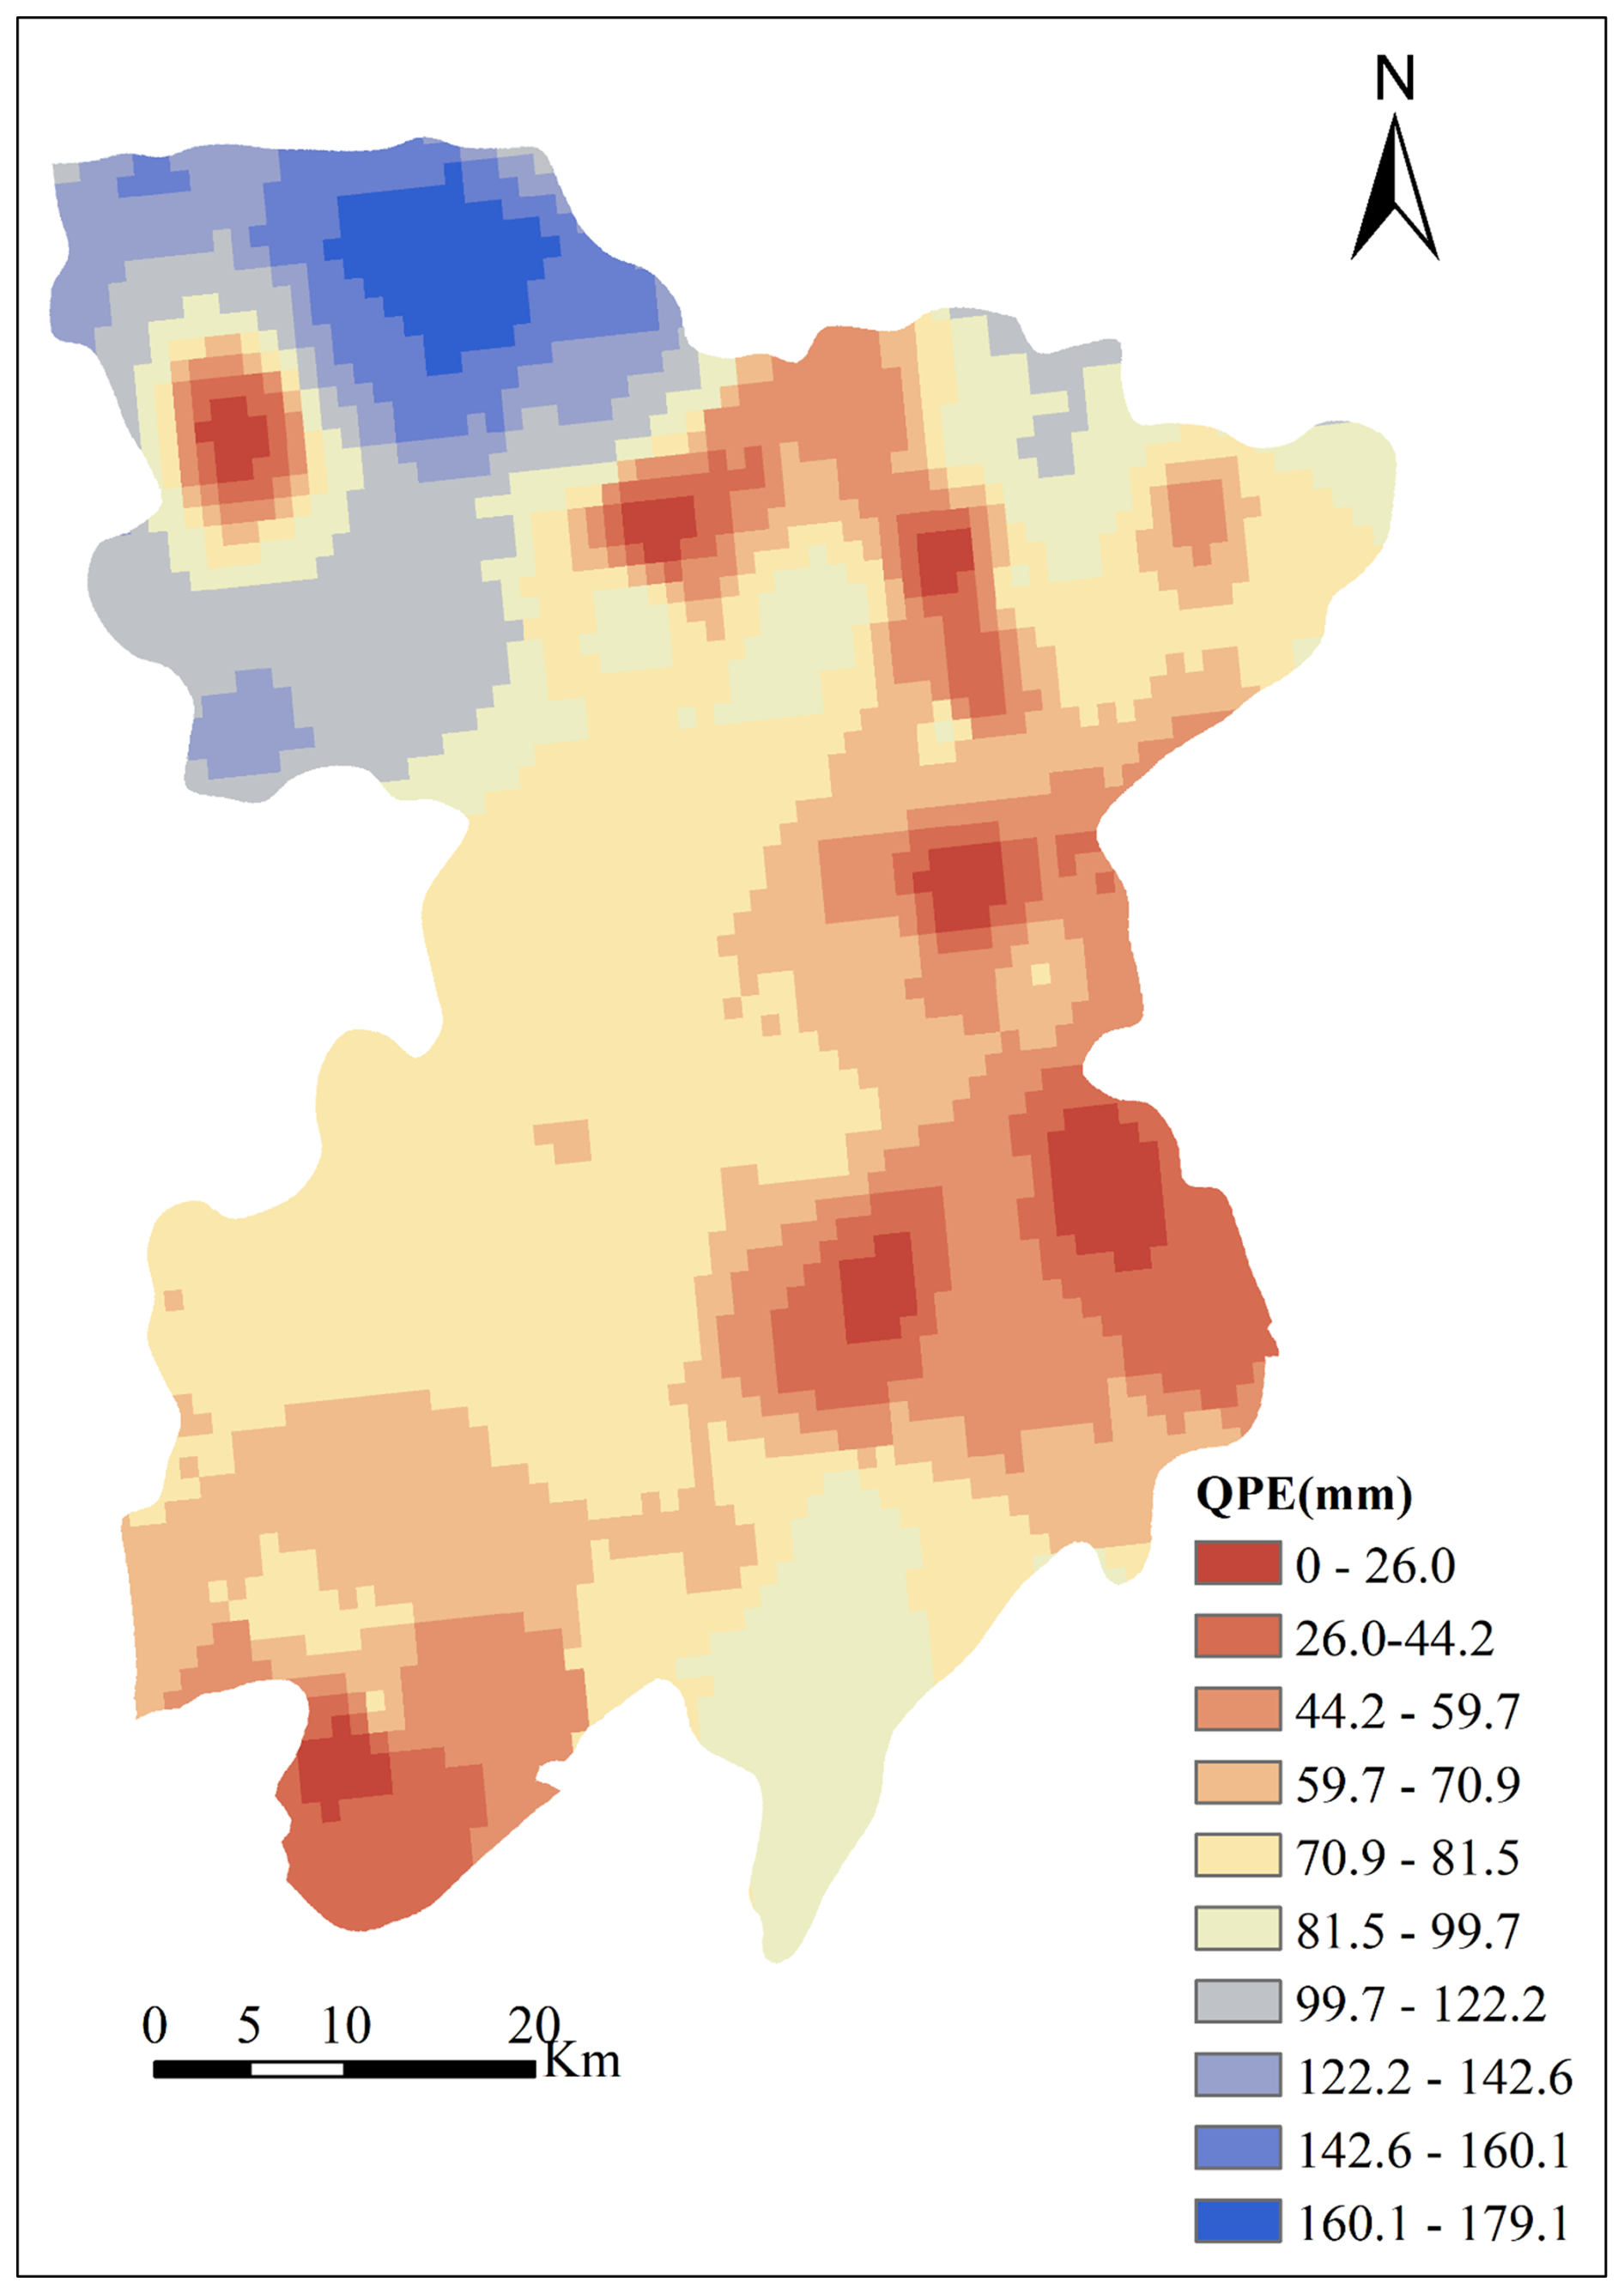
Figure 7Precipitation Data Processing (Effective Precipitation from 15 to 30 August 2014).
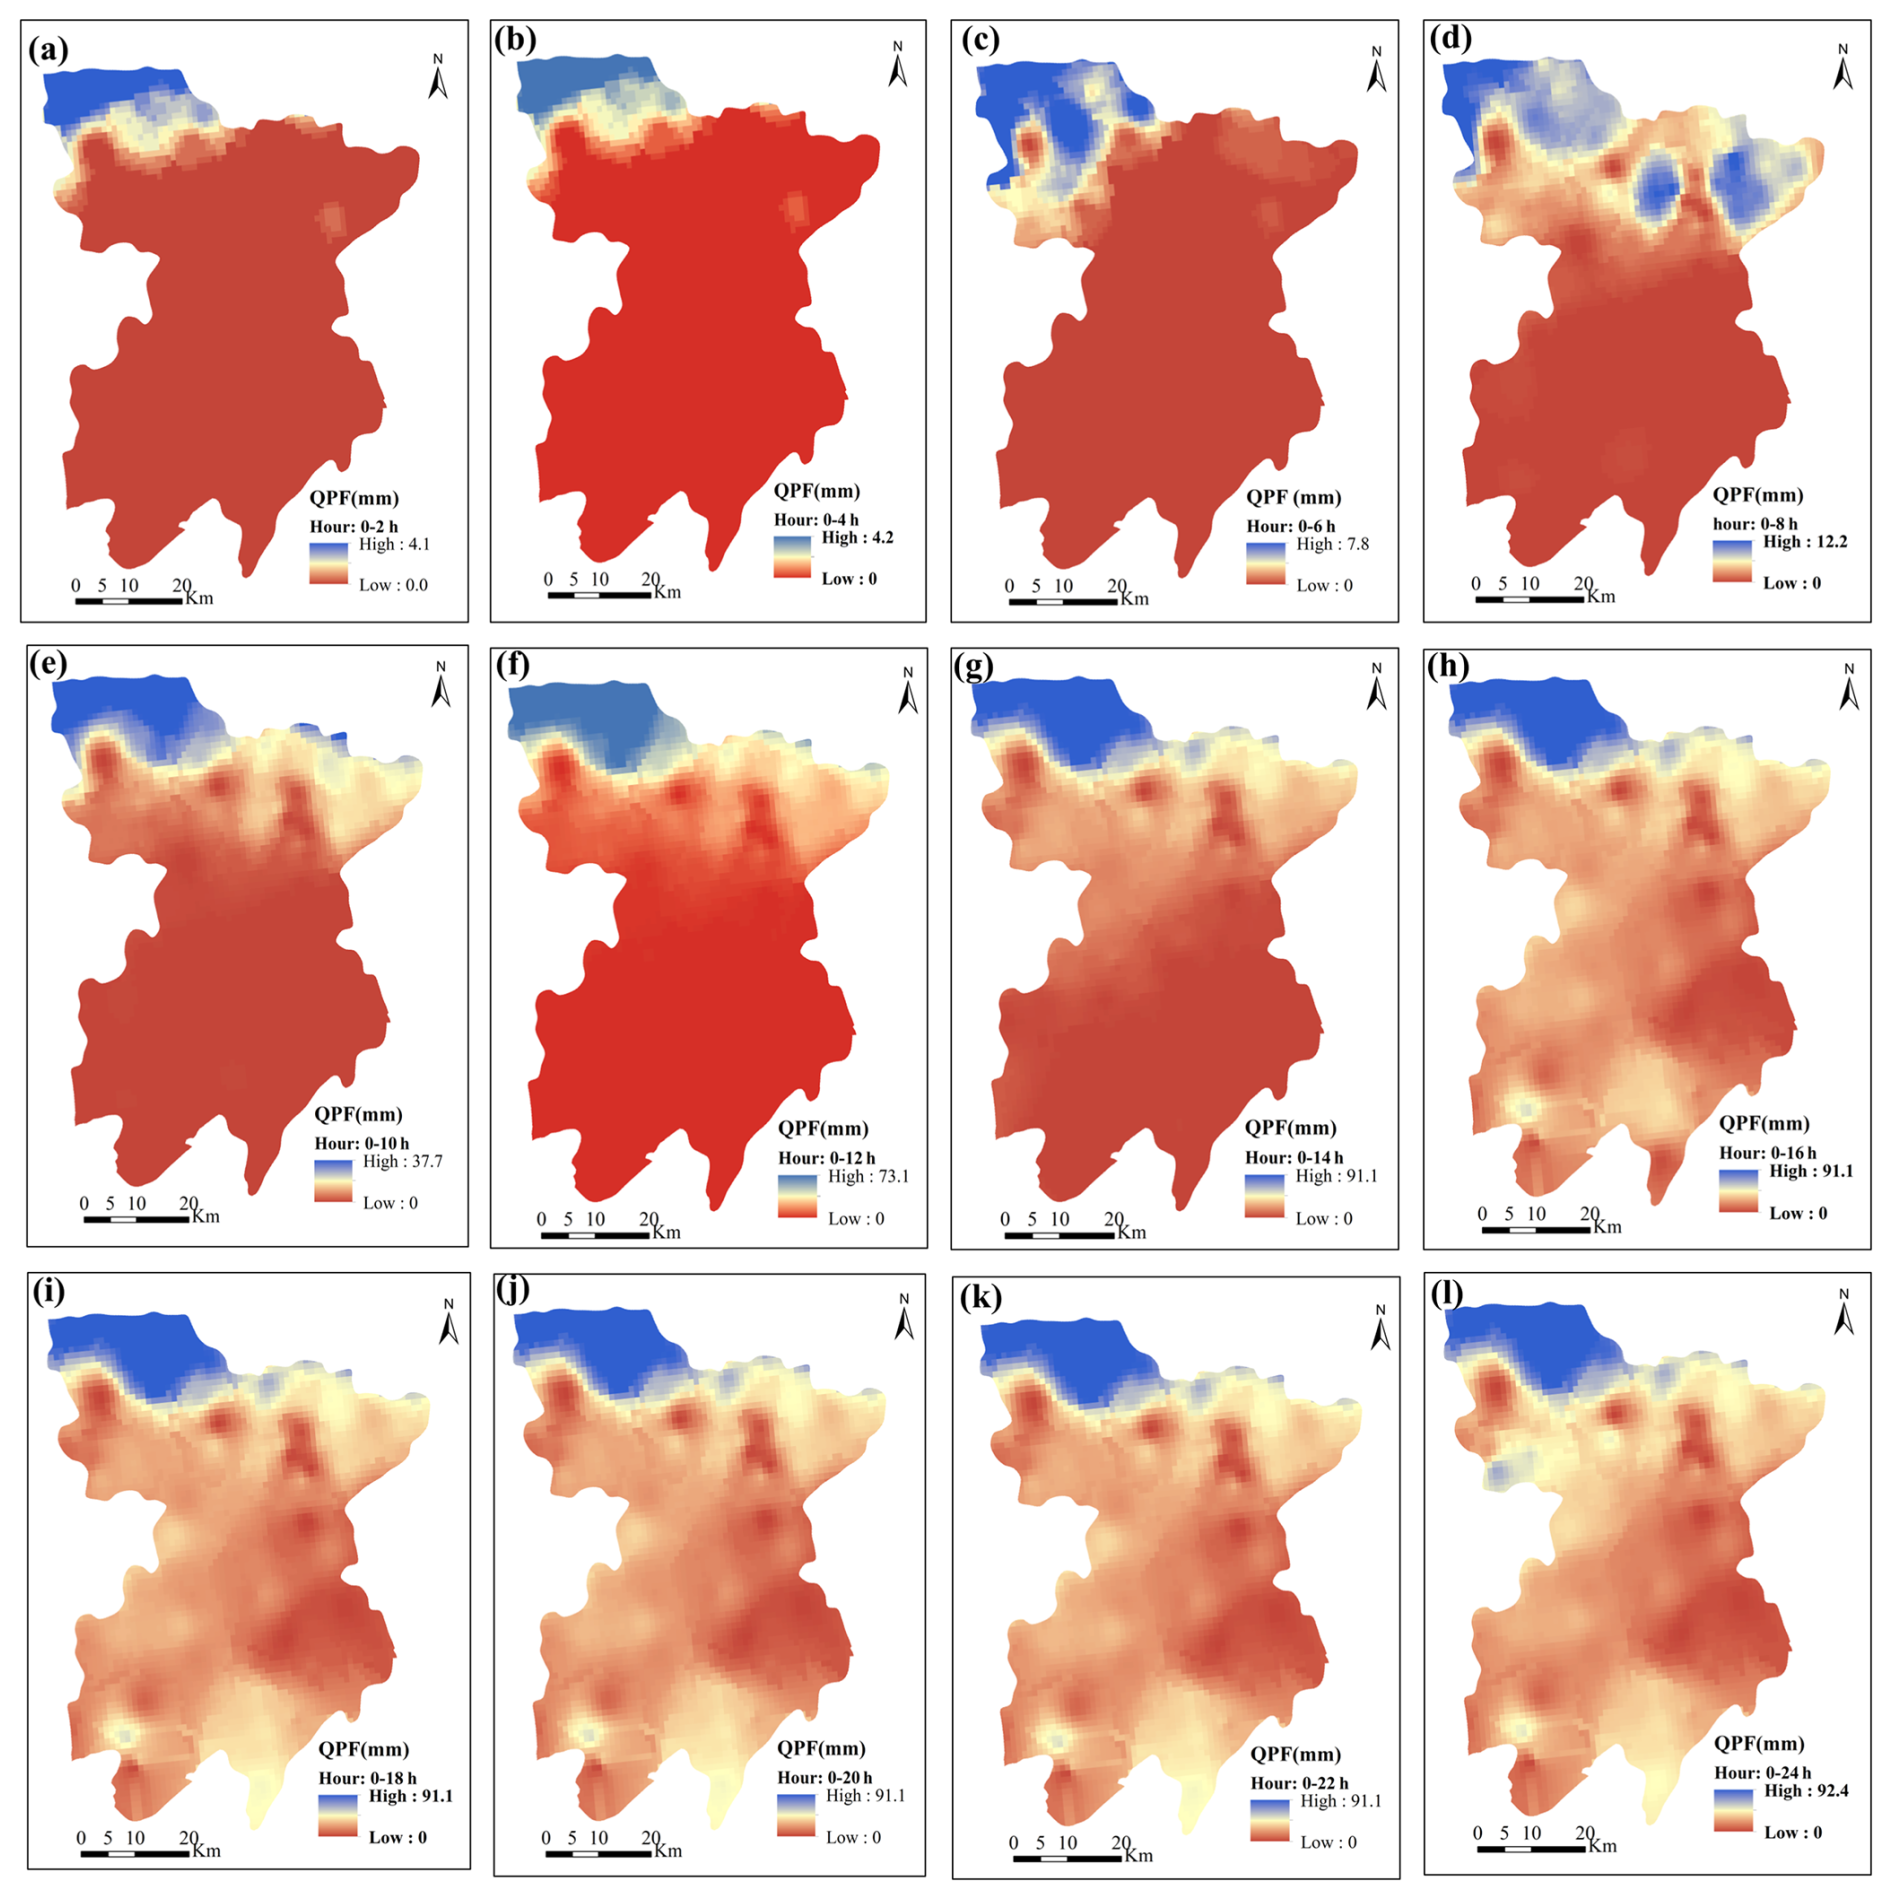
Figure 8Radar forecast precipitation data for 31 August 2014. (a) 02:00 BST; (b) 04:00 BST; (c) 06:00 BST; (d) 08:00 BST; (e) 10:00 BST; (f) 12:00 BST; (g) 14:00 BST; (h) 16:00 BST; (i) 18:00 BST; (j) 20:00 BST; (k) 22:00 BST; (l) 24:00 BST.
The Land and Resources Bureau of Fengjie County provided data on landslide points triggered by rainfall on 31 August. This heavy precipitation triggered 583 landslides, which were mainly distributed in the northwestern region (as indicated by the red and green solid points in Fig. 9). This study utilized the QPE (Fig. 7) and QPF data (Fig. 8a–l) as inputs to forecast landslide hazards for 31 August.
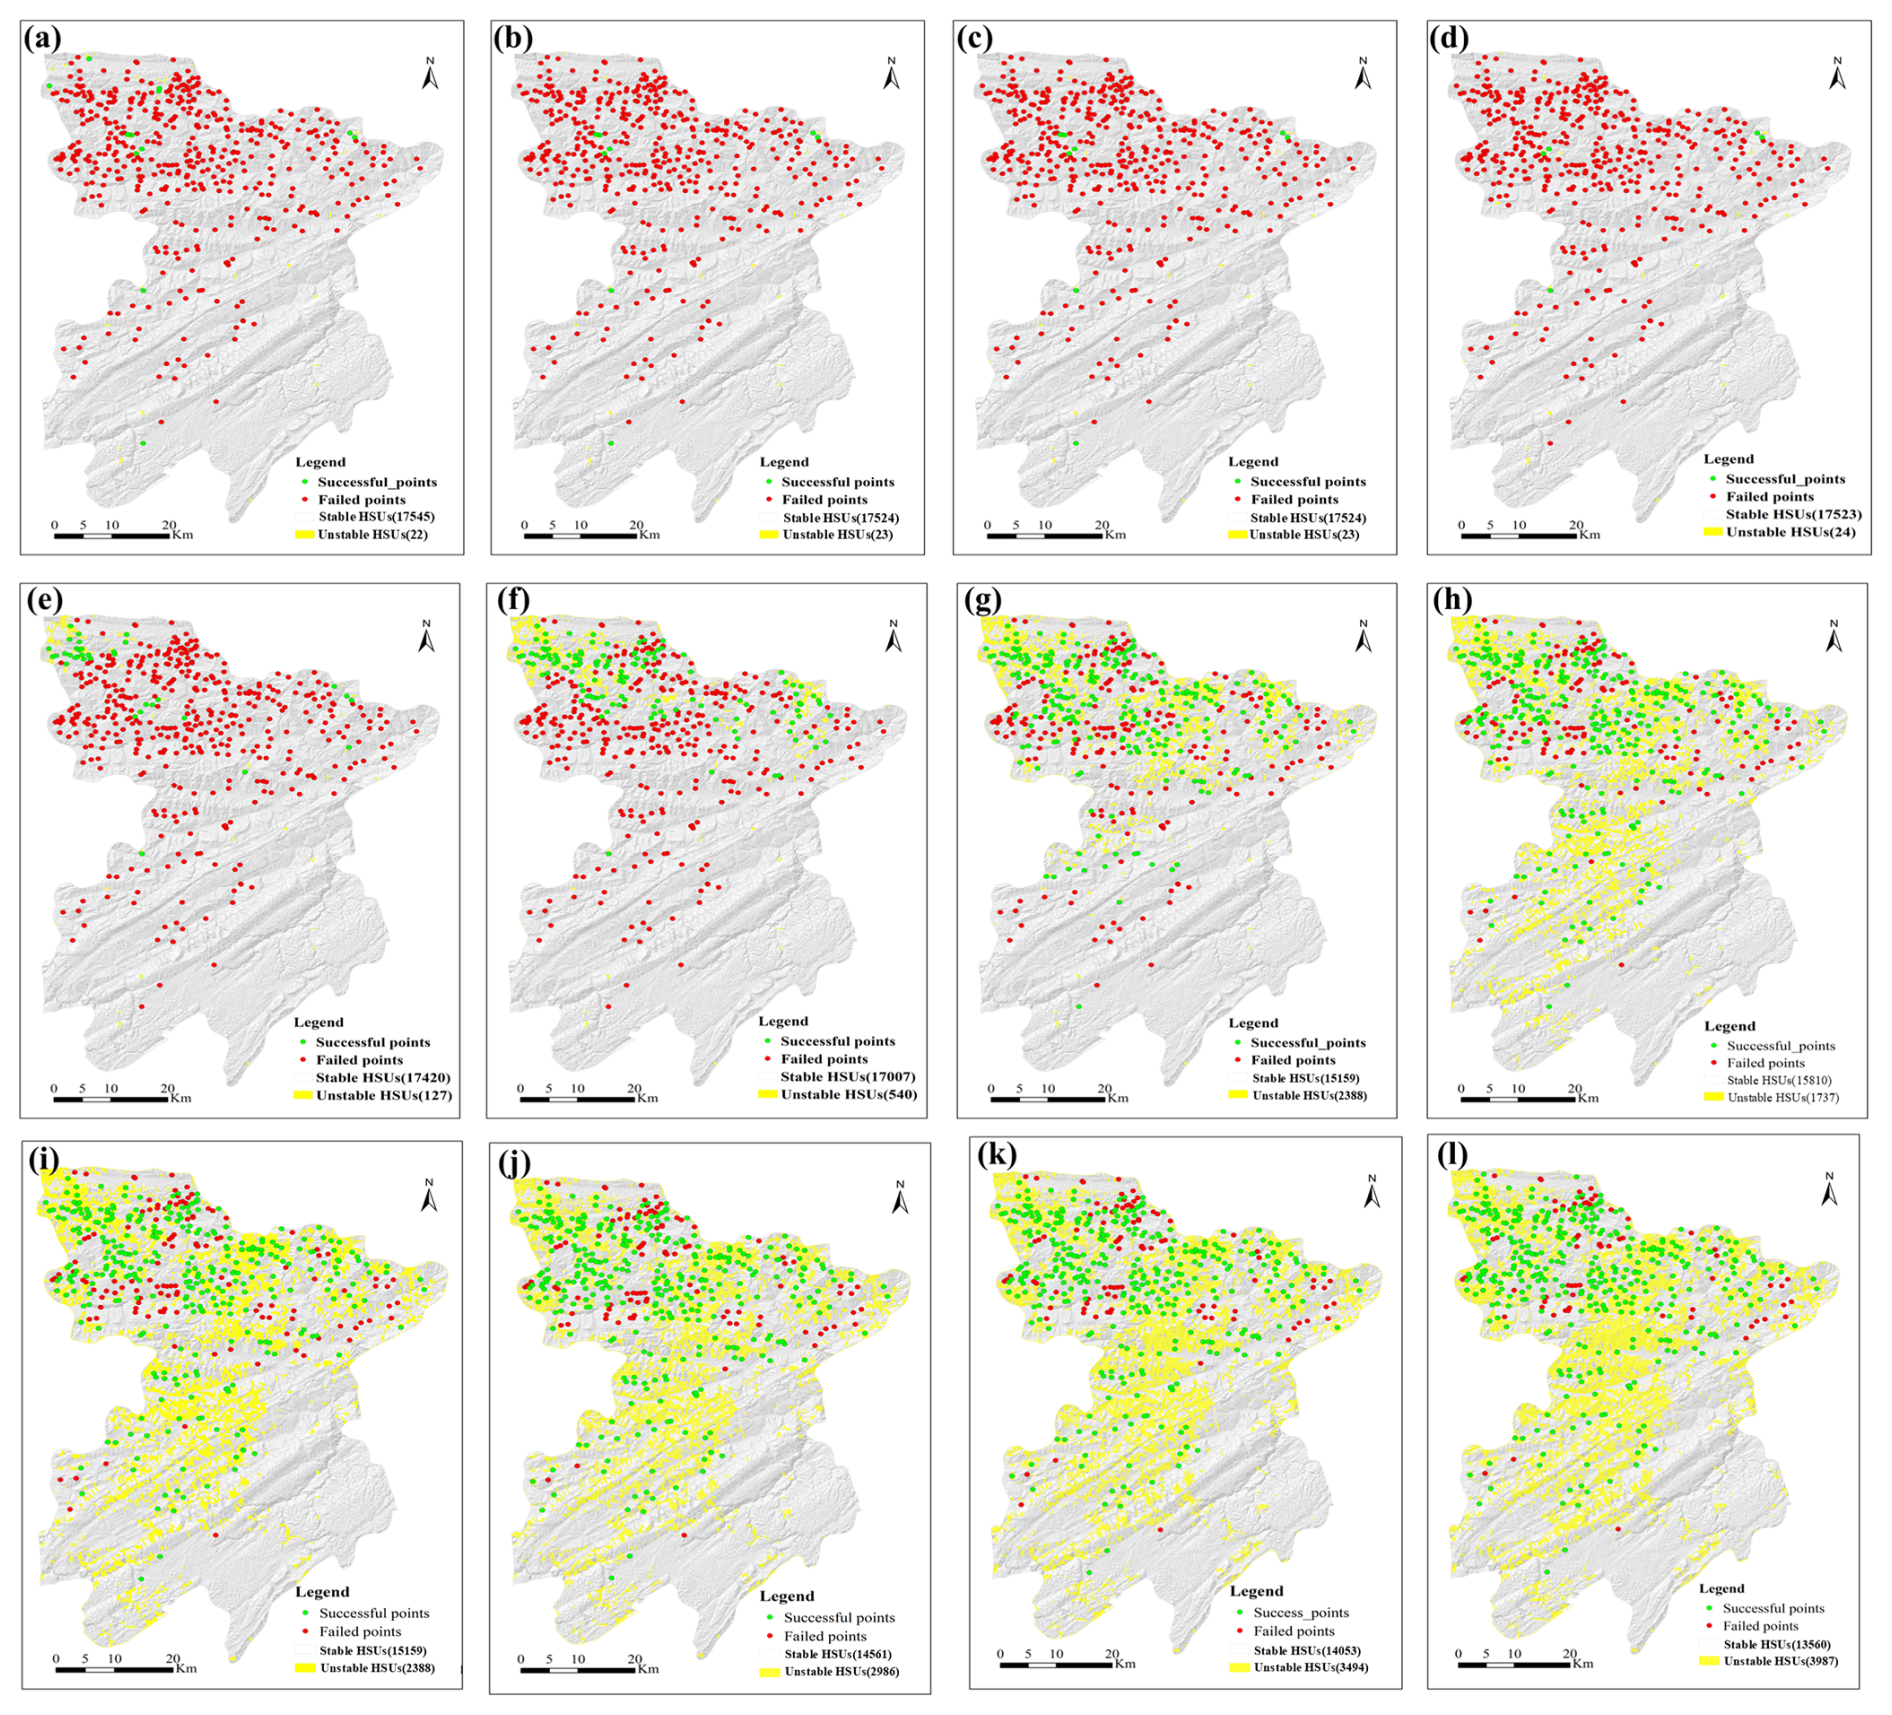
Figure 9Prediction results at 02:00 to 24:00 BST. (a) 02:00 BST; (b) 04:00 BST; (c) 06:00 BST; (d) 08:00 BST; (e) 10:00 BST; (f) 12:00 BST; (g) 14:00 BST; (h) 16:00 BST; (i) 18:00 BST; (j) 20:00 BST; (k) 22:00 BST; (l) 24:00 BST.
The landslide forecast results from 02:00 to 24:00 BST are shown in Fig. 9a–l. It can be seen from Figs. 8 and 9 that there is a good correlation between the spatial distribution of unstable HSUs and rainfall characteristics. As presented in Fig. 9a–d, at the beginning of the rainfall process (before 08:00 BST), the majority of the HSUs remained stable owing to the minimal rainfall. Unstable HSUs began to emerge in the northwestern region starting at 10:00 BST, coinciding with the rapid increase in rainfall. Additionally, as the rainfall progressed, the number of unstable HSUs increased swiftly and spread towards the central and southern regions (Fig. 9f–g). Notably, many unstable slope units appeared within several hours after heavy rainfall ceased. Figure 9h–l reveal that from 16:00 to 24:00 BST, although the heavy rainfall essentially ended, the number of unstable HSUs continued to rise because of the moisture infiltration of the saturated top soil, reaching a total of 3987 at 24:00 BST.
This study employs the Receiver Operating Characteristic (ROC) method to analyze the predictive performance of the HSU (Fawcett, 2006). For physically model-based slope units, the ROC method describes the following four possible states using a contingency table:
-
True Positive (TP): HSU contain landslide points and exhibit instability;
-
True Negative (TN): HSU does not contain landslide points and does not exhibit instability;
-
False Positive (FP): HSU does not contain landslide points but exhibits instability;
-
False Negative (FN): HSU contains landslide points but does not exhibit instability.
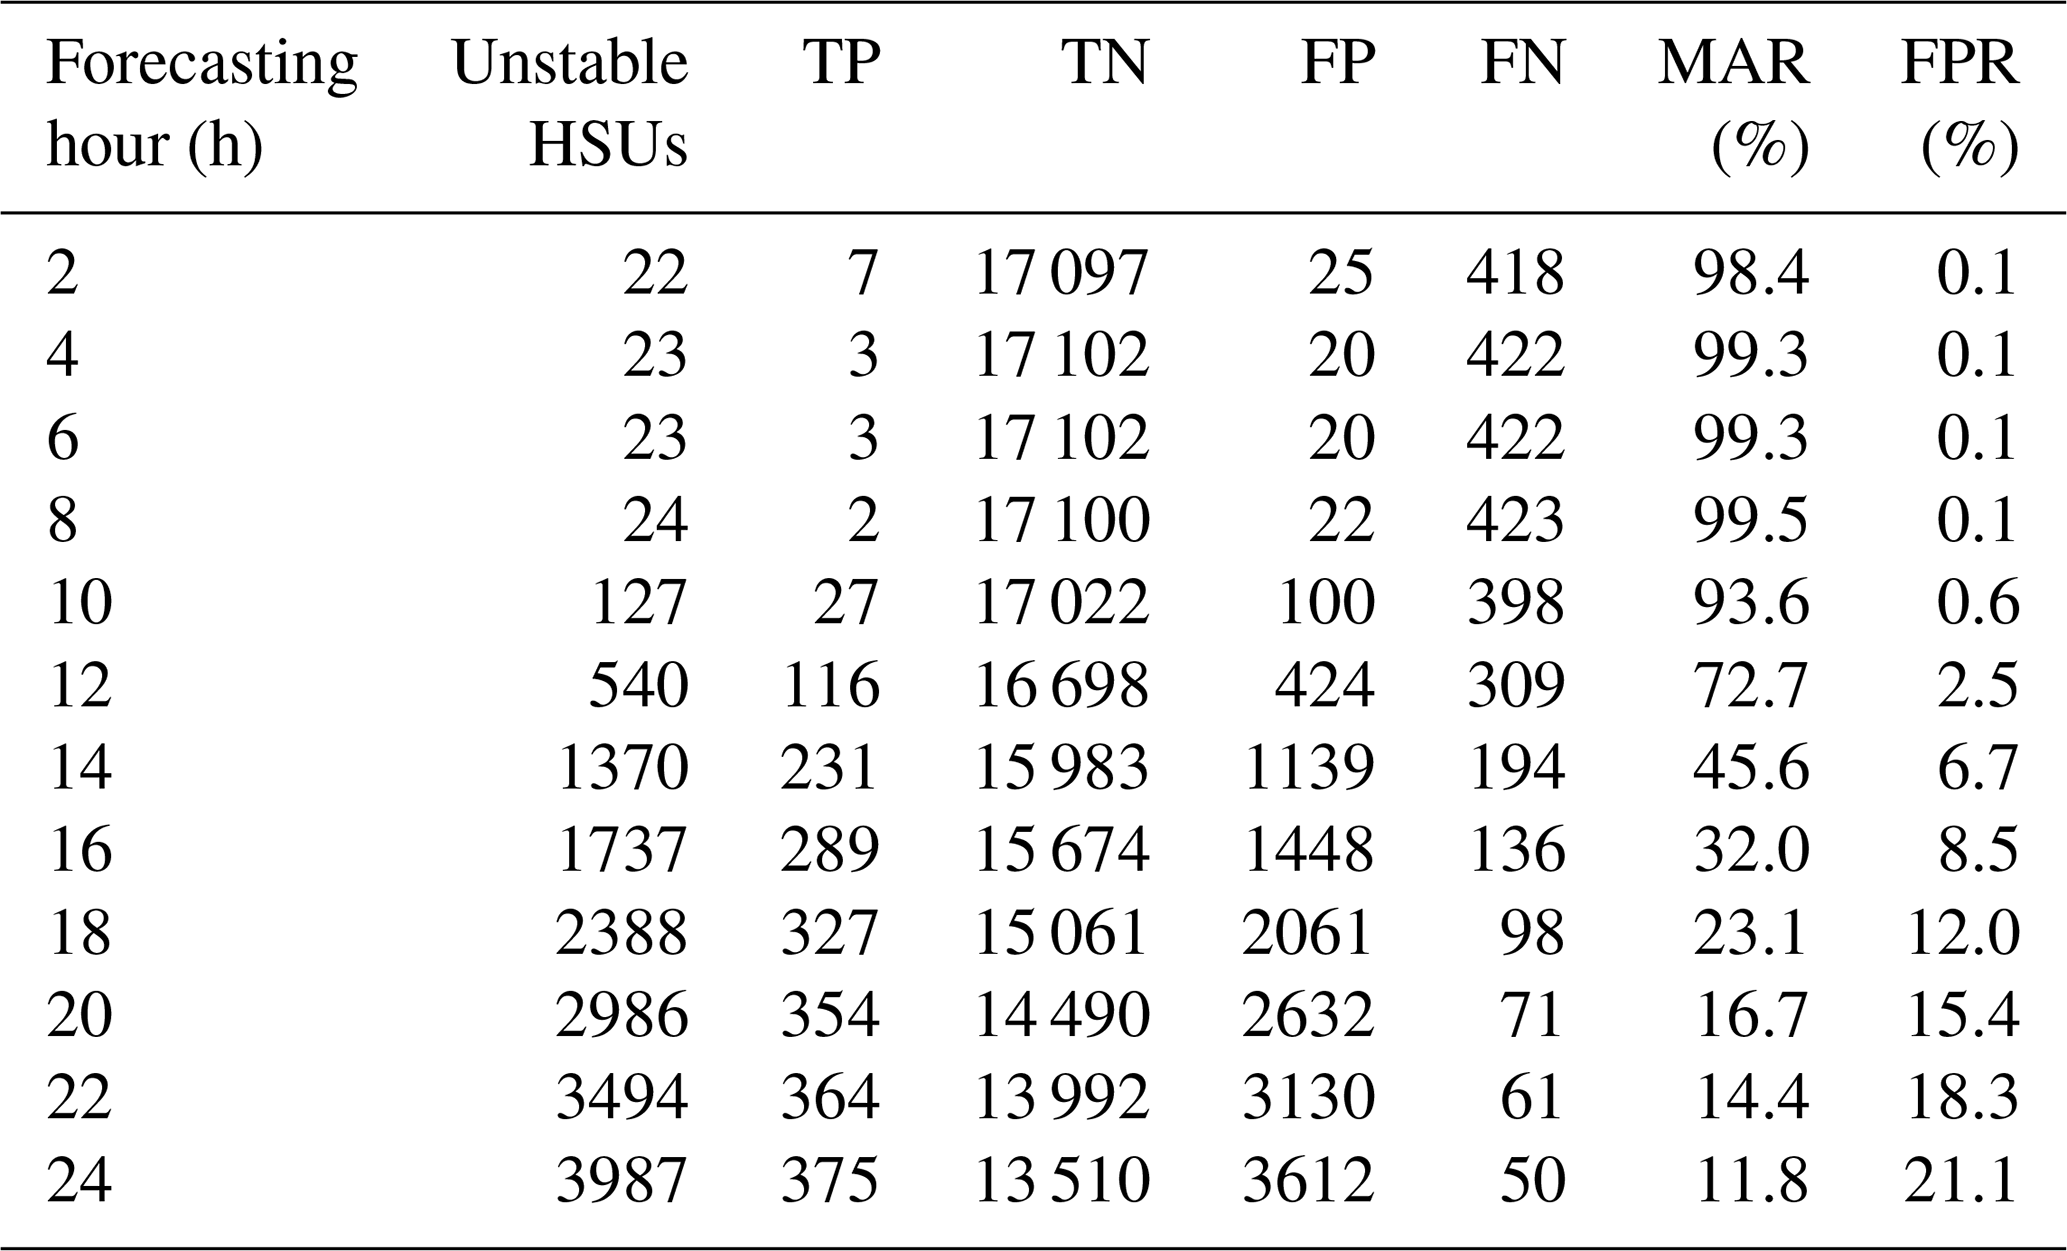
According to GIS spatial statistics, 583 landslides triggered by rainfall on 31 August were contained within 425 HSUs. In this study, these HSUs are taken as benchmark values for the calculation of TP, TN, FP, and FN, and the missing alarm rate (MAR) and false alarm rate (FPR) can be calculated as follows:
The detailed forecast results for 2–24 h are shown in Table 1. As shown in columns 7–8 of Table 1, with increasing rainfall duration, the MAR gradually decreases, while the FPR gradually increases. Taking the result of 24 h as an example, the MAR of 24 h is 11.8 % and the FPR is 21.1 %, indicating that the prediction result can satisfy the requirement of early warning practice.
According to the ROC method, the precision and accuracy of the prediction results were calculated as follows:
Table 2 provide the calculation results of precision and accuracy at 24 h. As shown, the precision of the forecasting results is 80.7 %, with an accurancy value of 79.1 %, indicating the proposed warning mode has satisfactory comprehensive forecasting performance.
Table 2Calculation Results of Precision and Accuracy at the 24th Hour.

5.1 The discussion on the computational efficiency
For emergency warnings during the rainy season, the swift release of warning information is crucial for local authorities to develop emergency plans and to evacuate residents from landslide-prone areas. Therefore, local governments not only seek satisfactory accuracy in the warning model but also require minimal time. To evaluate the computational efficiency of the proposed model, a standard laptop was utilized to execute the forecast for landslide hazards on 31 August. The device specifications and computation times are presented in Table 3. As shown in Table 3, for the regional scale covering several thousand square kilometers, the prediction model can rapidly complete real-time warnings for the next 24 h within 12 min, indicating that its computational efficiency can satisfy the requirements of emergency warning.
Table 3Analysis of computational efficiency of the prediction model.

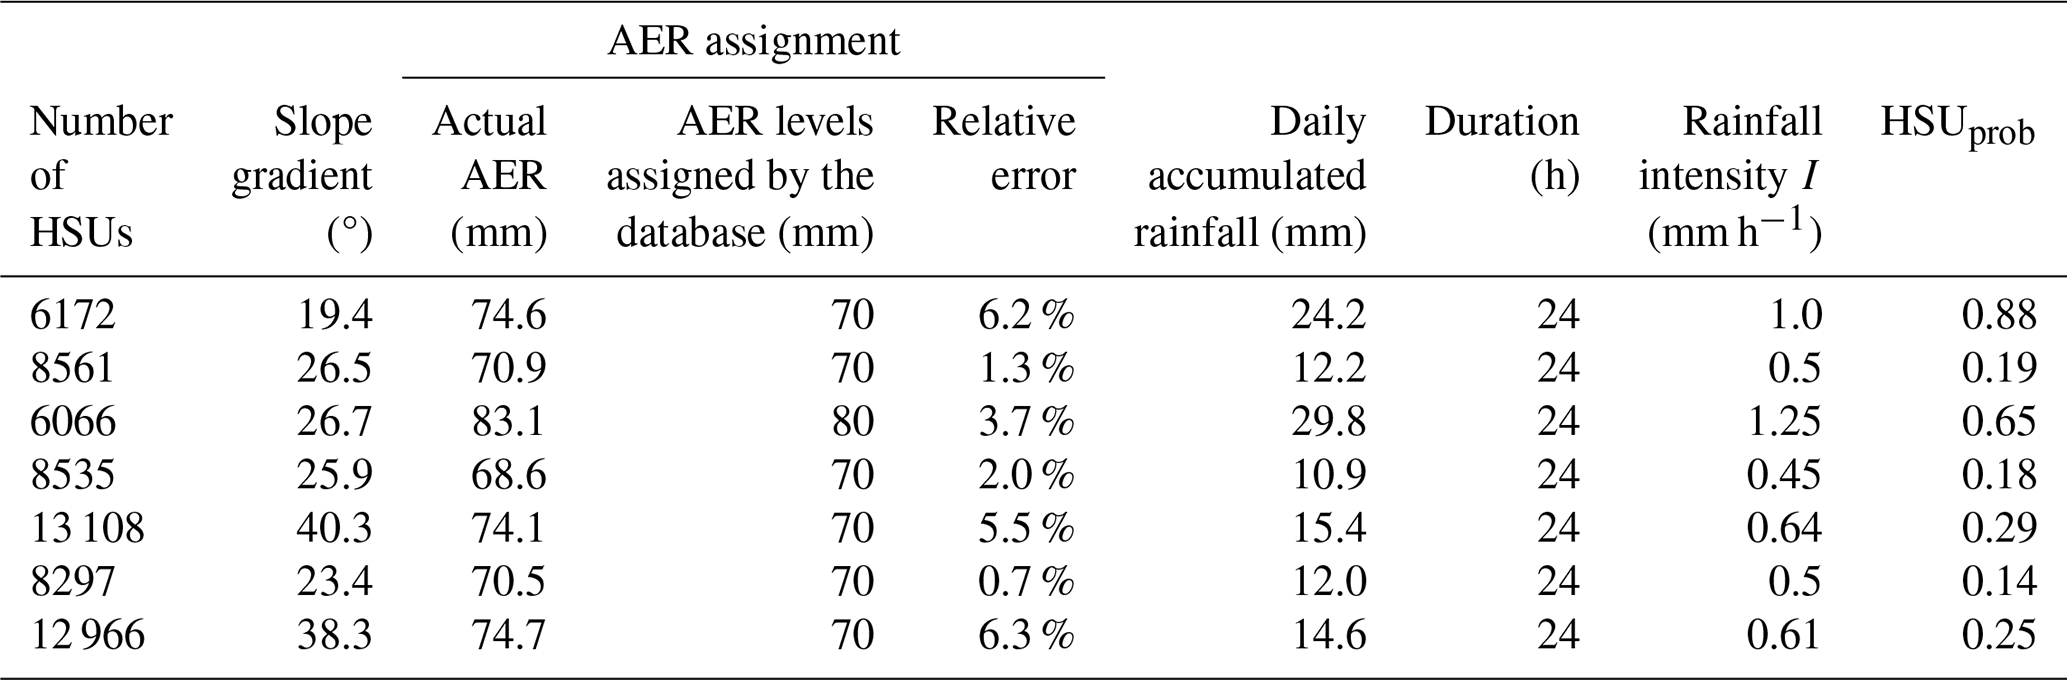
Table 4The selected HSUs that report false alarms at 24:00 BST.
5.2 Further analysis of prediction performance
Using the 24 h prediction results as an example, we randomly selected seven HSUs with false alarms for further analysis (Table 4). Given that existing research indicates that antecedent effective rainfall (AER) and daily accumulated rainfall are crucial sensitive factors affecting the forecasting performance of HSU-based physical models (Wang et al., 2023), the AER of these HSUs, the AER levels assigned by the database and daily accumulated rainfall are presented in Table 4. As shown in Column 5 of this table, the relative error ranges from 0.7 % to 6.3 %, indicating that the 20 levels of the AER designed in the database can accurately reflect the effective antecedent rainfall characteristics of the HSUs. The average rainfall intensity, duration, and cumulative rainfall data at 24:00 BST are shown in Columns 6–8. As seen in Column 6, the cumulative rainfall for the seven HSUs ranges from 12 to 29.8 mm, with average rainfall intensities range from 0.5 to 1.25 mm h−1, which can be classified as light to moderate rain type. The instability probability (HSUprob) of these HSUs was calculated to investigate the causes of false positives. As shown in Column 9, among the seven HSUs with false alarms, five had an instability probability of less than 50 %, indicating that these HSUs did not experience instability during the rainfall process. Therefore, we cautiously conclude that although the prediction model exhibits preferable operational efficiency, it may increase the false positive rate to some extent.
To investigate the potential for reducing the false-alarm rate, we selected four HSUs from Table 4 for further analysis. Figure 10a–d presented the I–D curves and cumulative precipitation distribution histograms for these HSUs.
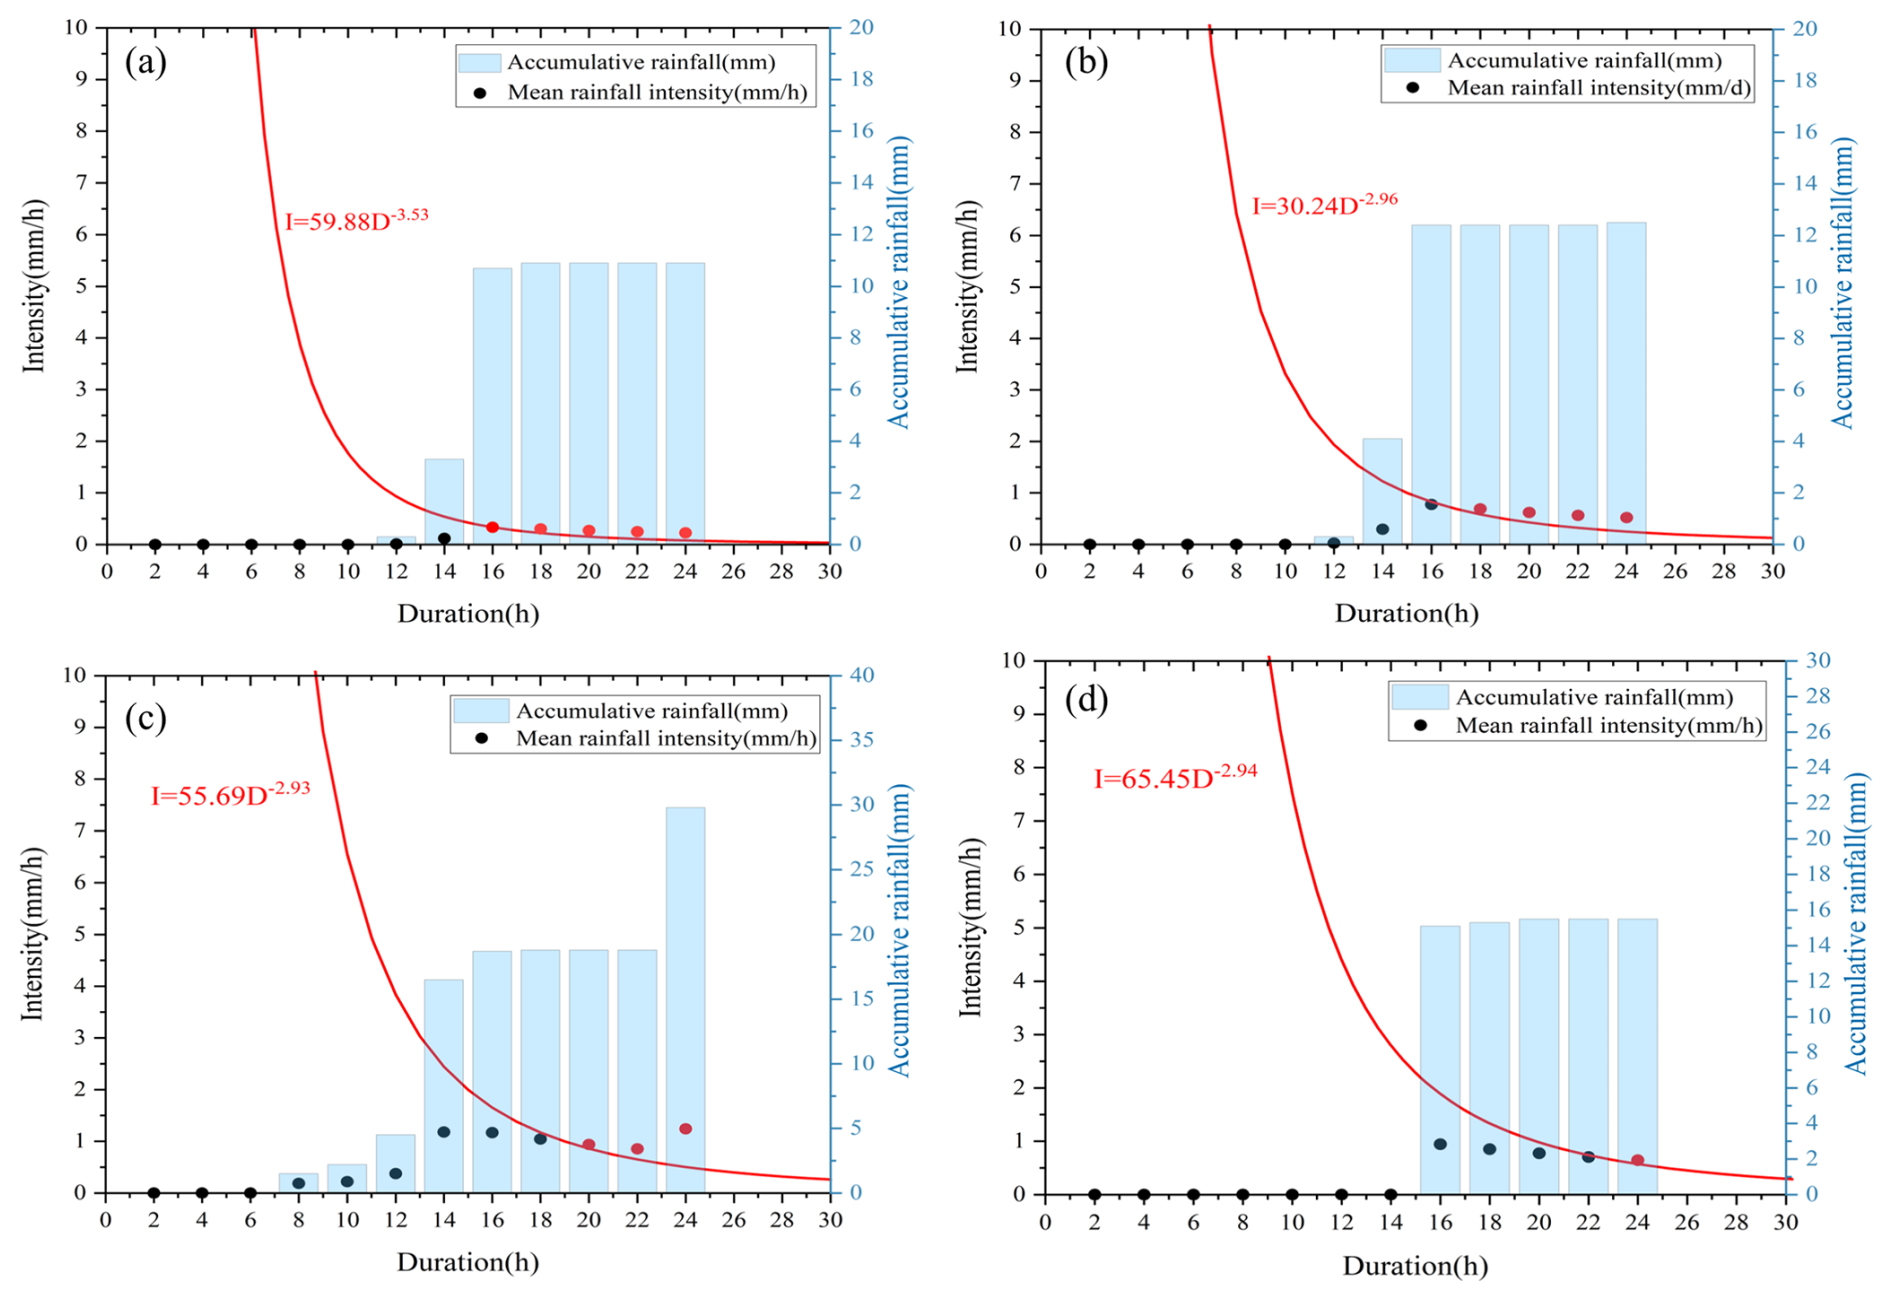
Figure 10The I–D Curves of HSUs before the adjustment of rainfall process. (a) 8535; (b) 8561; (c) 6066; (d) 13 108.
For each HSU, the QPF data from 00:00 to 24:00 BST were discretized into 12 sets of rainfall intensity and duration data points at 2 h intervals (represented by black and red solid dots). The black solid dots positioned below the I–D curve indicate that the HSU is stable at that moment, whereas the red solid dots located above the curve signify false alarms at the current forecasting hour. As shown in Fig. 10a–d, the red false alarm points for the four HSUs are all situated very close to the I–D curve, nearly tangent to it. This proximity suggests that slight spatial adjustments to these points could alter the forecast results. Another important issue is that some of the black solid dots correspond to a cumulative rainfall of 0 mm, indicating that the rainfall process had not yet begun. Therefore, it is necessary to adjust the spatial positions of data points I and D based on the actual initiation time of the rainfall process, thereby facilitating an in-depth investigation of the causes of the false alarms.
Table 5Rainfall process adjustment for HSU with number of 8535. Bold values indicate the recalculated rainfall intensity and duration values after adjustment.
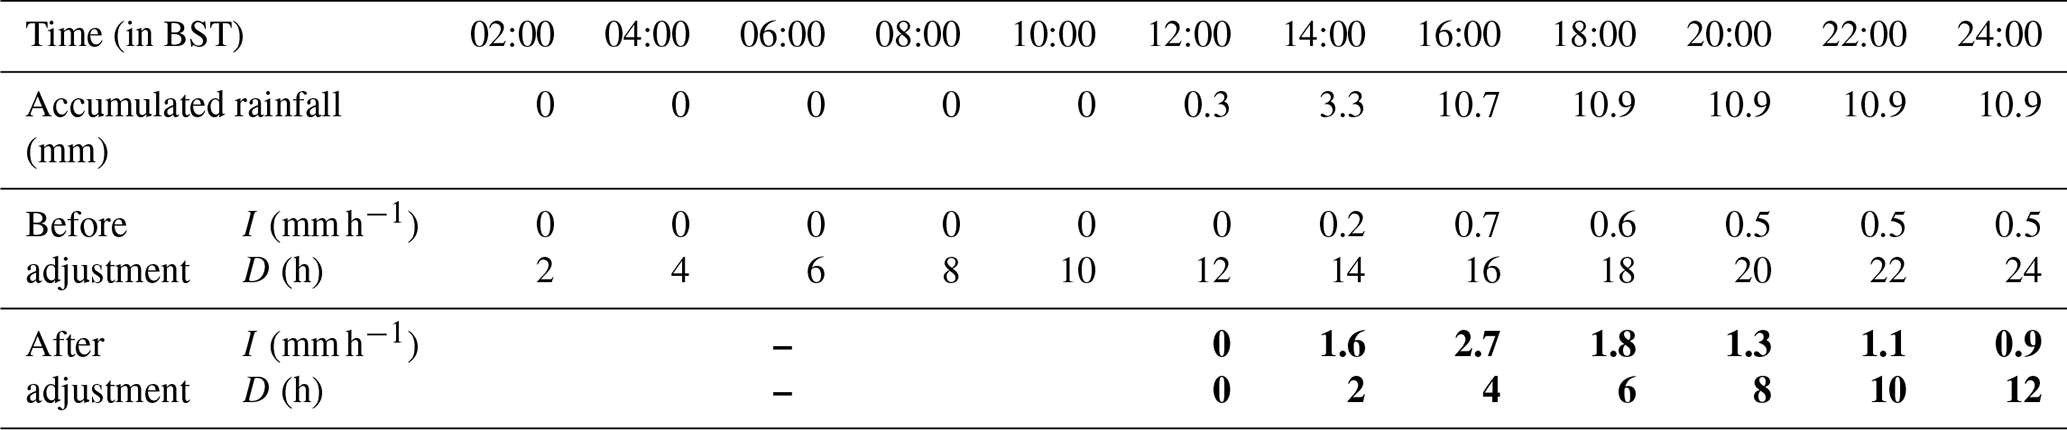
In this study, an HSU with number 8535 is taken as an example to illustrate the process of adjusting the spatial positions of data points I and D. As shown in Table 5, the rainfall process for this HSU started at 12:00 BST and ended at 24:00 BST with a duration of 12 h. The start time of rainfall was used as the starting point to recalculate the rainfall intensity during the rainfall process, as shown in the bold text in Table 5. The adjusted average rainfall intensity was significantly higher than the values prior to adjustment. This means that the adjustment of the rainfall process led to notable changes in the spatial locations of the data points I and D. As shown in Fig. 11a, after updating the positions of data points I and D, the HSU does not exhibit any false alarms. Figure 11b–d present the updated forecast results for the other three HSUs after the adjustment. As shown in Fig. 11a–d, following the adjustments, three out of these four HSUs were able to release accurate results. Therefore, we advise that practical warning applications should consider the influence of the difference in rainfall processes of HSUs on the prediction results.
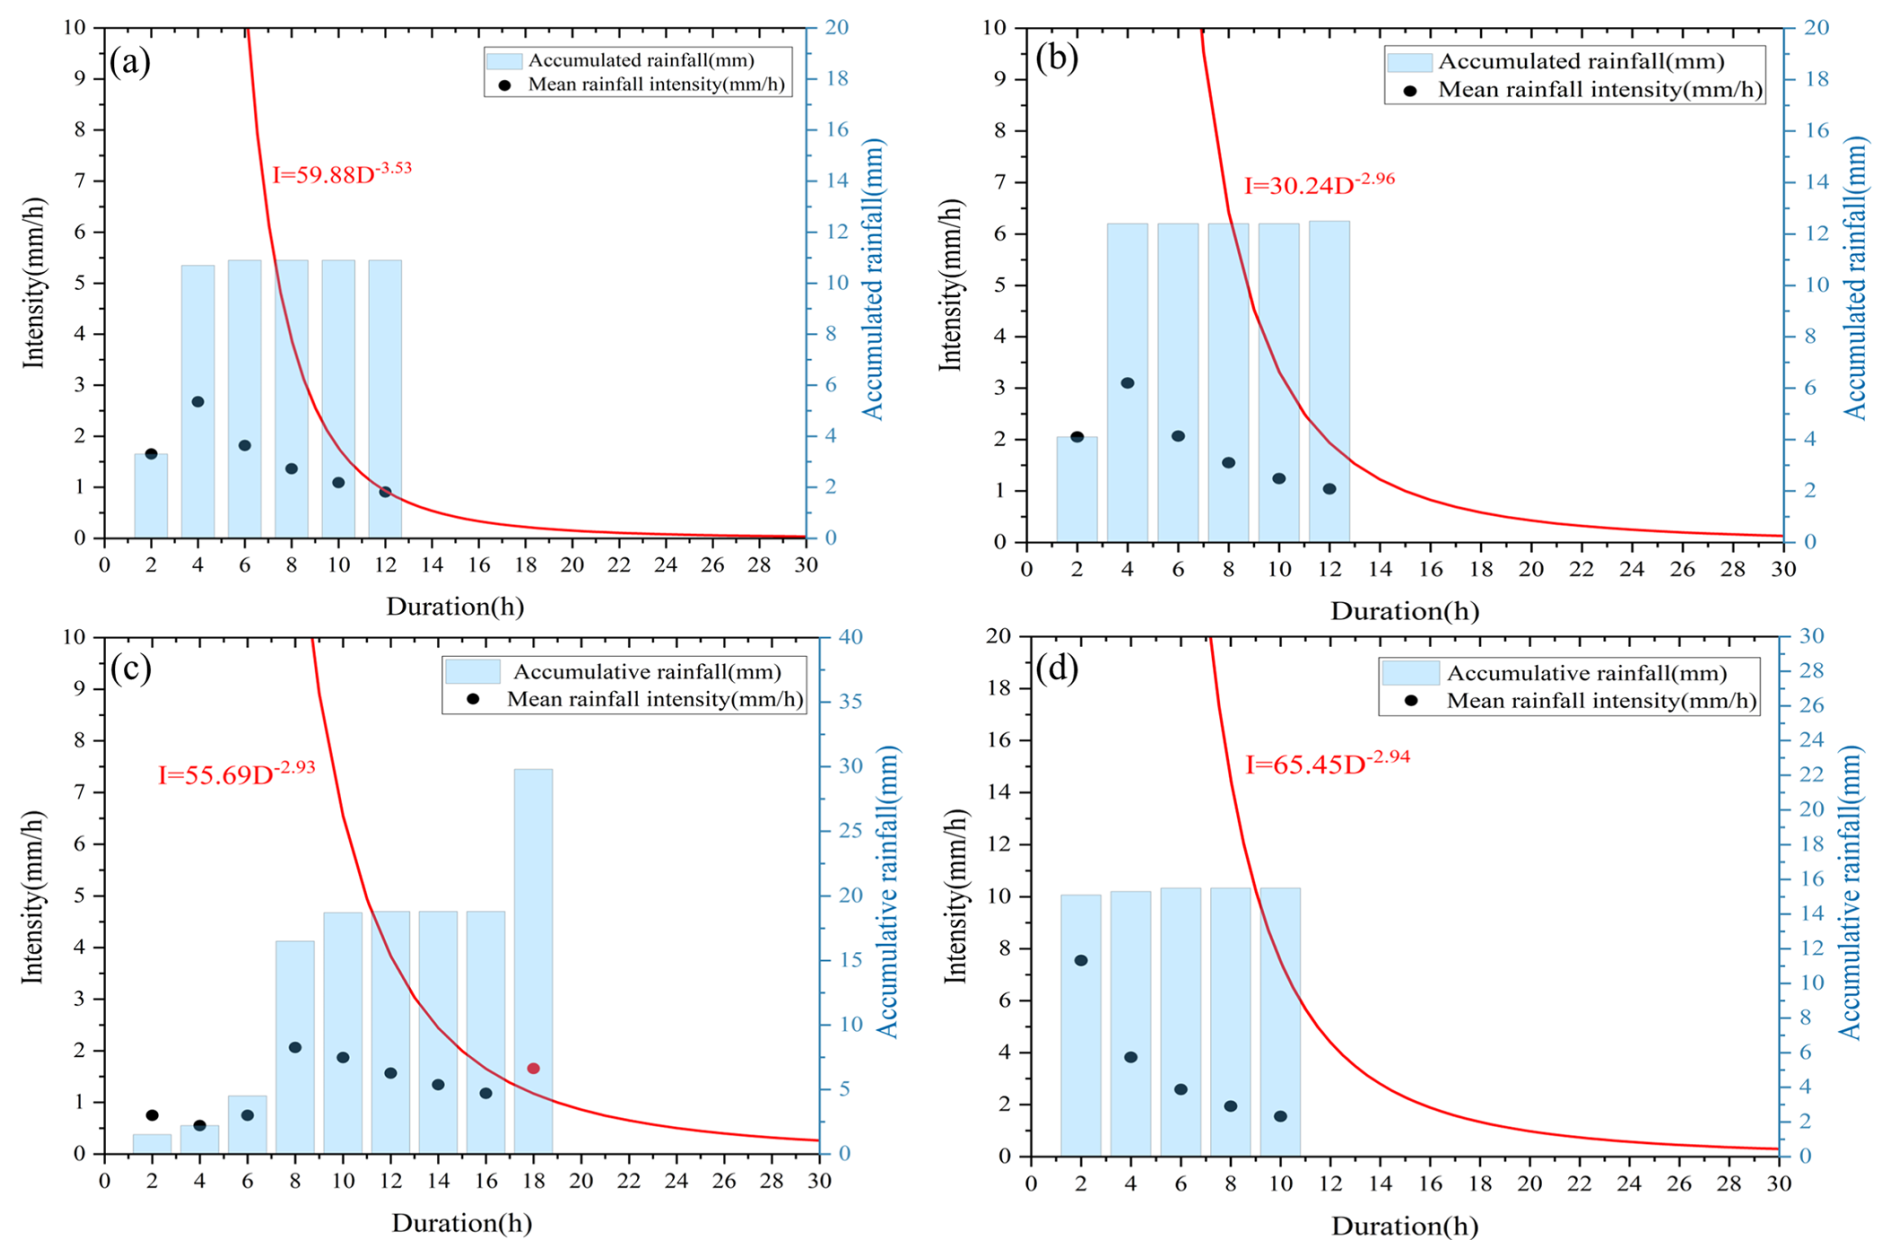
Figure 11The I–D Curves of HSUs after the adjustment of rainfall process. (a) 8535; (b) 8561; (c) 6066; (d) 13 108.
5.3 Comparison with existing approaches in the Fengjie county
Statistical methods have been widely used to establish rainfall thresholds for landslides. Liu et al. (2024) categorized Chongqing into four distinct subregions based on topography, tectonic structures, lithological stratigraphy, and the distribution and characteristics of landslides, and established the rainfall thresholds for landslides in each subregion, as shown in Table 6 (Liu et al., 2024). Fengjie county belongs to Subregion II, with its rainfall threshold is listed in the second row of Table 6. In this table, R represents the cumulative daily rainfall, while Re signifies the antecedent effective rainfall.
Table 6Equations of the thresholds defined for each subregion (Liu et al., 2024).


The prediction results derived from statistical methods are illustrated in Fig. 12, with detailed prediction performance parameters provided in Table 7. As depicted in Fig. 12, there are 5462 unstable HSUs, primarily located in the northwest and southern mountainous regions. According to Table 7, 256 landslide events are successfully predicted by Liu's model. However, the statistical method exhibits a MAR of 40 % and a false alarm rate of 30.4 %, resulting in low overall precision and accuracy. In contrast, the missing and false alarm rate of the HSU_ID model are 11.8 % and 21.1 % at the 24th hour (Table 1), thus demonstrating superior forecasting performance.
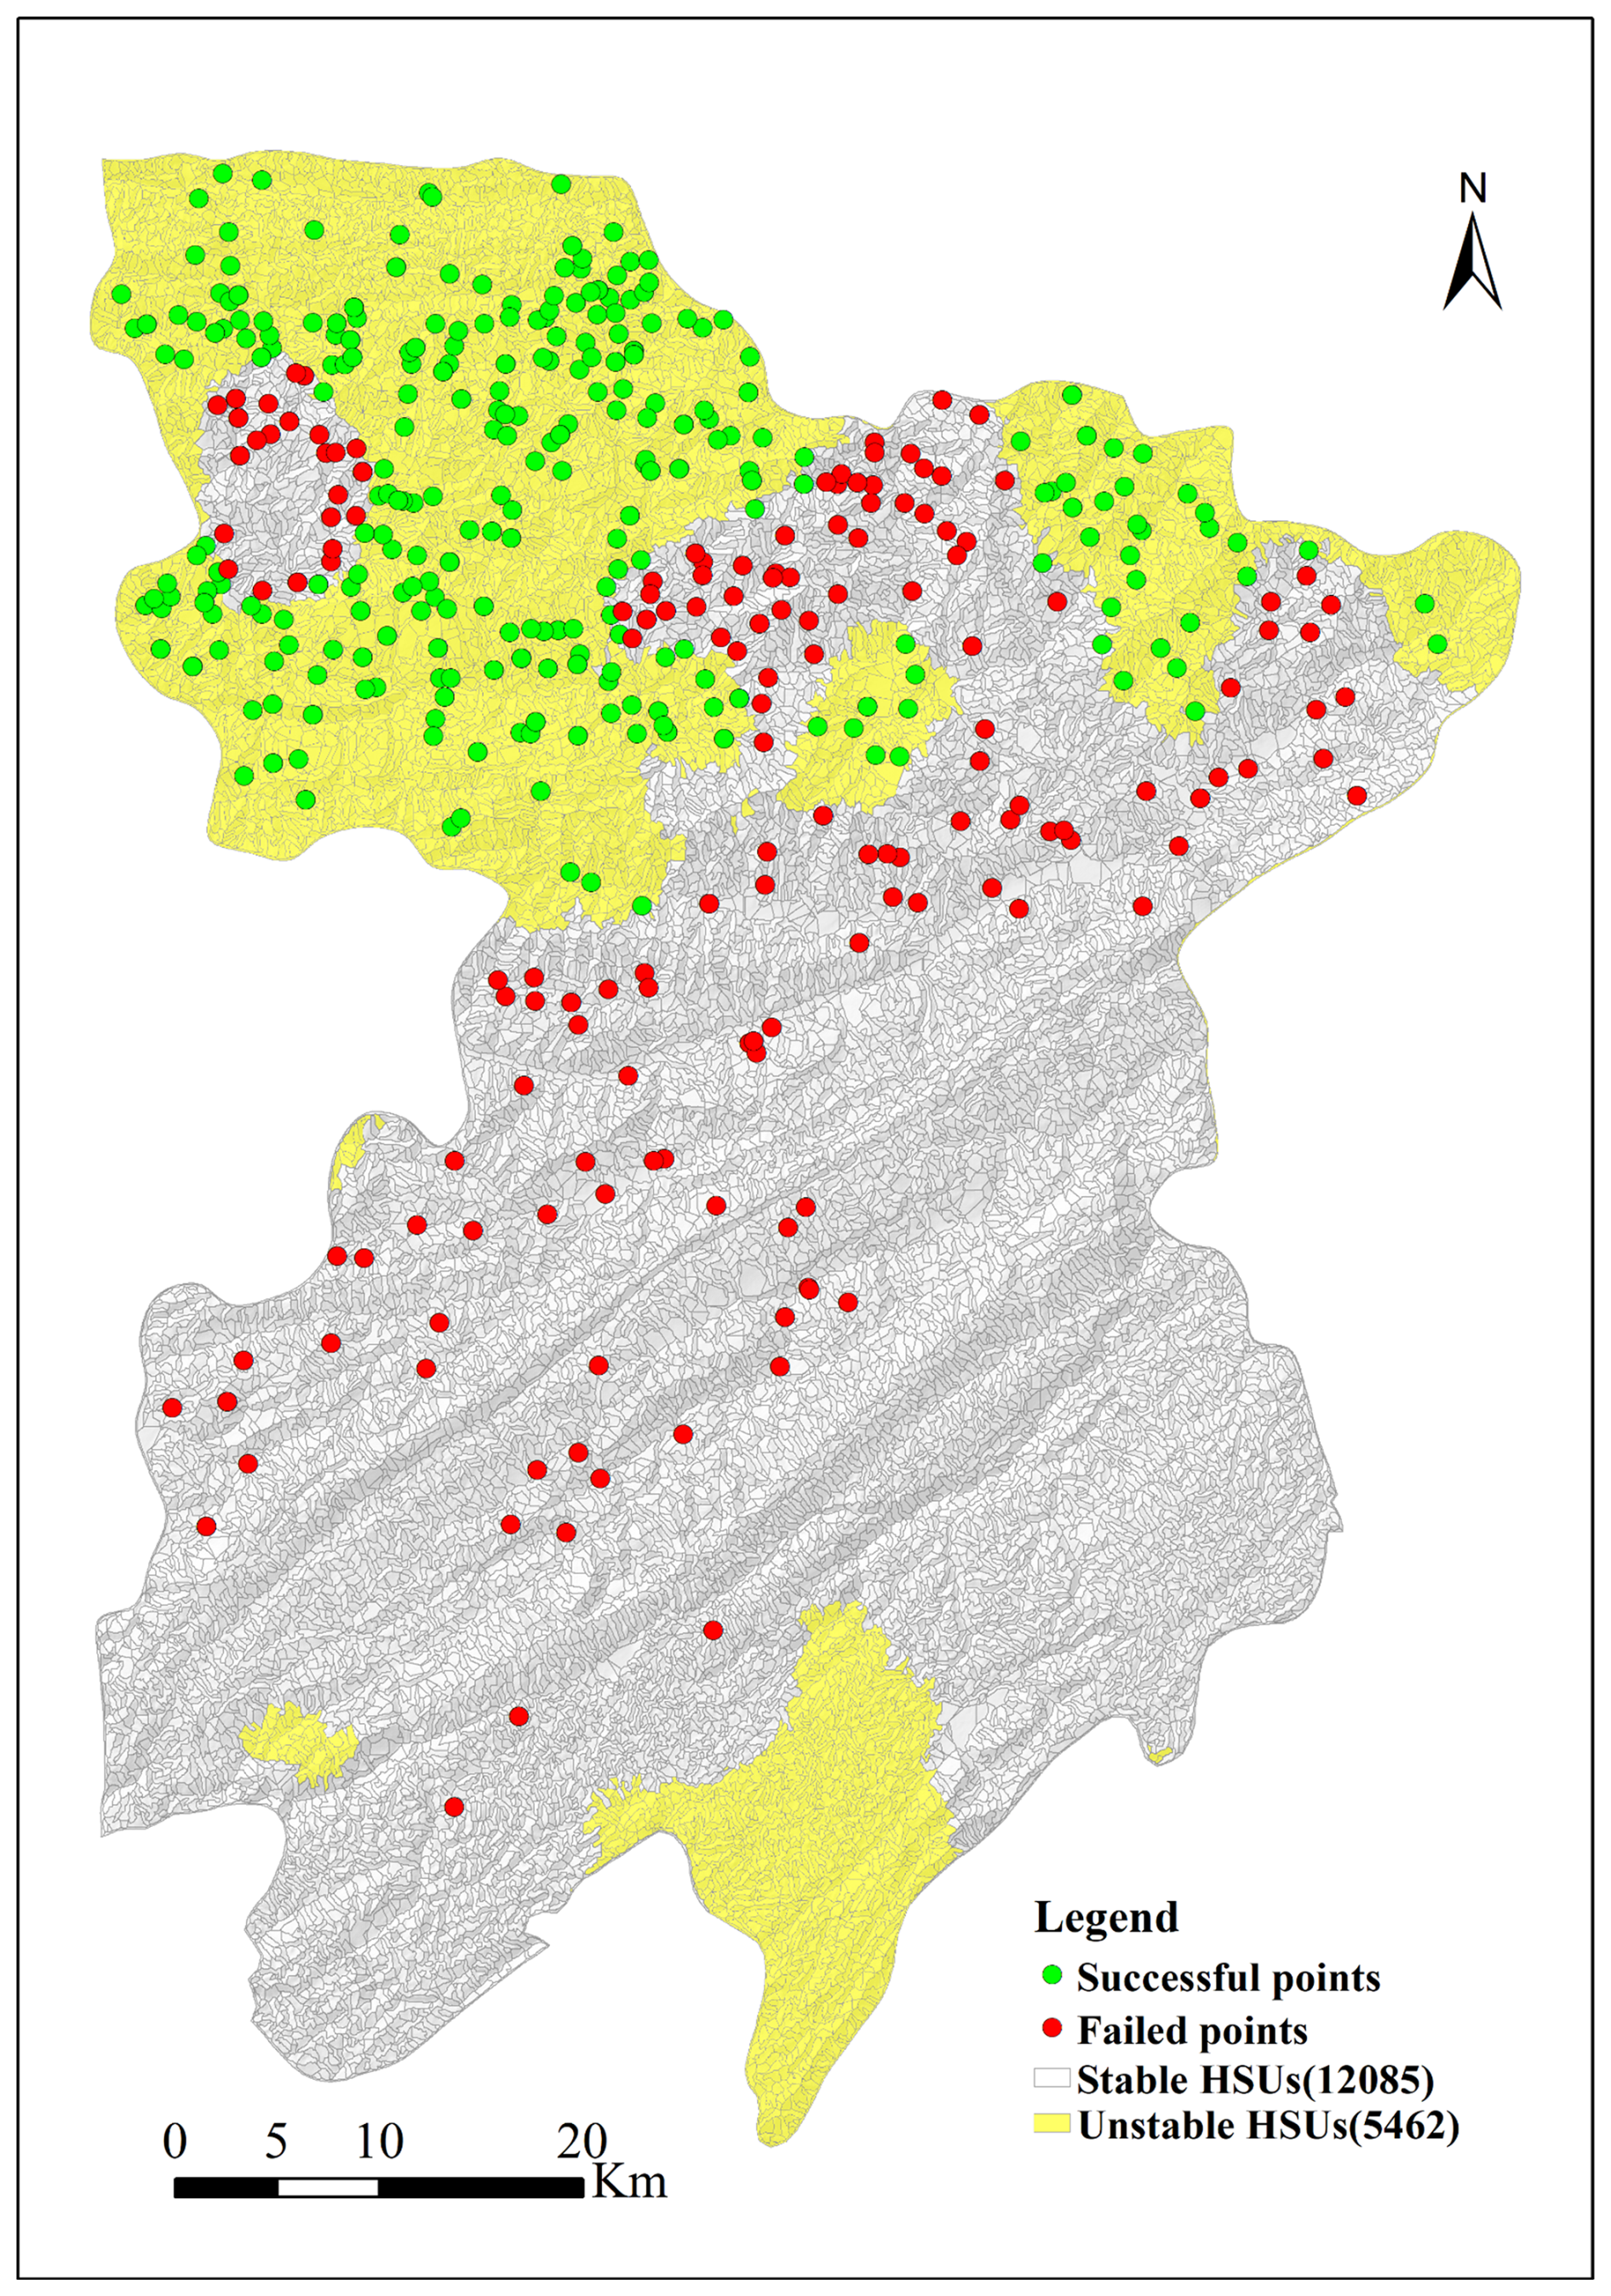
Figure 12Prediction outcomes generated by Liu's model.
5.4 Limitations and future work
The method proposed in this paper reduces dependence on landslide inventory data and avoids the issue of excessive computation time associated with physical models. This offers promising application prospects for emergency early warning in regions of third-world countries where landslide inventory data are scarce. However, it should be noted that the calculation of HSUprob relies on regional-scale mechanical parameters. Therefore, establishing the distribution of mechanical parameters in Southwest China through field sampling, experiments, and spatial analysis is an important task for the future. Another important task lies in optimizing the model algorithm, because the physical mechanisms of rainfall landslides are extremely complex, and the soil-water coupling process under rainfall involves significant nonlinearity (Apip et al., 2010). Some machine learning methods that incorporate physical frameworks are expected to accurately describe this issue (for example the PINN). Therefore, improving the model algorithm by combining machine learning with physical approaches is another important task for the future.
Currently, the operational forecasting of rainfall-induced landslides over regional scales of thousands of square kilometers faces significant challenges. Conventional physical and statistical approaches have shown limitations in terms of achieving satisfactory results. This study utilized HSU as a basis to integrate physical models and rainfall threshold methods for a warning model applicable to large-scale regions. The warning model employs HSU as a prediction unit to improve the clarity of the warning results, physical methods are utilized to develop the warning criteria, thereby reducing the overreliance on historical observational data, and a database of rainfall parameters across different rainfall scenarios is constructed, which enhances the efficiency and applicability of the warning model. The prediction performance was validated through a case study of “8.31” rainfall landslides in Fengjie County. The conclusions are as follows.
-
A rainfall-triggered landslide warning model was established by integrating HSUs, physical approaches, and rainfall parameters. Initially, a grid-based HSU hydrological analysis technique was established to determine the soil moisture content distribution within the HSUs during different rainfall hours. Subsequently, computer graphics algorithms, random search techniques, and infinite slope models were used to develop a regional-scale HSU stability analysis method. Soil mechanics parameters at the limit of water content and probability density functions were used to describe the spatial uncertainty of the soil mechanical parameters within the HSU during rainfall infiltration, allowing for the calculation of the instability probability of the HSU. Different rainfall scenarios were simulated to derive rainfall intensity I and duration D data that can trigger HSU instability, thereby constructing early warning curves for the rainfall thresholds of the HSU.
-
A database for the I–D curve fitting parameters α and β across various AER levels was established. This database includes α and β data for 17 547 HSUs across 20 AER levels, amounting to a total of 350 940 records, thus offering substantial data support for rainfall-induced landslide predictions in Fengjie County. In practical applications, it is sufficient to quickly issue warning information by assessing the relationship between the values of I and αDβ, thereby reducing the time required to calculate the safety factors using conventional physical models. The calculation efficiency test indicates that the warning mode can perform forecasts for thousands of kilometers within a runtime of less than 12 min, thereby meeting the operational needs for real-time warnings over large regional scales.
-
The case study indicates that the distribution trends of unstable HSUs align well with rainfall characteristics. As the rainfall duration increased, the MAR gradually decreased, while the FPR continued to increase. Taking the 24 h forecast results as an example, the MAR was 11.8 %, while the false alarm rate was 21.1 %. ROC analysis revealed that the accuracy of the forecast result at this moment was 80.7 %, with a precision of 79.1 %, reflecting satisfactory overall forecasting performance. Further discussion of the false alarm rate suggests that adjusting the spatial locations of rainfall intensity and duration data points based on the rainfall characteristics of each HSU may be conducive to reducing false alarm rates.
The datasets supporting this study are available from the corresponding author upon reasonable request.
KW: Conceptualization, Writing – original draft, Supervision, Data curation Funding acquisition; LX: Supervision, Visualization, Writing – original draft; SX: Investigation, Data curation, Validation; SZ: Methodology, Resources, Validation; YJ: Supervision, Validation, Software; JZ: Investigation, Software; HG: Investigation, Visualization; LZ: Project administration, Visualization; ZW: Project administration, Writing – review & editing; FQ: Writing – review & editing.
The contact author has declared that none of the authors has any competing interests.
Publisher's note: Copernicus Publications remains neutral with regard to jurisdictional claims made in the text, published maps, institutional affiliations, or any other geographical representation in this paper. The authors bear the ultimate responsibility for providing appropriate place names. Views expressed in the text are those of the authors and do not necessarily reflect the views of the publisher.
The authors would like to acknowledge the Chongqing Meteorological Bureau, China for providing the QPE and QPF data free of charge. We are also thankful to the Land and Resources Bureau of Fengjie county for their support with the field investigation.
This research has been supported by the National Natural Science Foundation of China (grant no. 42301083), the Training Program for Young Backbone Teachers in Higher Education Institutions of Henan Province (grant no. 2025GGJS094), and the Key Research and Development Project of Henan Province.
This paper was edited by Mihai Niculita and reviewed by two anonymous referees.
Alvioli, M., Guzzetti, F., and Marchesini, I.: Parameter-free delineation of slope units and terrain subdivision of Italy, Geomorphology, 358, 107124, https://doi.org/10.1016/j.geomorph.2020.107124, 2020.
Apip, Takara, K., Yamashiki, Y., Sassa, K., Bagiawan, I. A., and Fukuoka, H.: A distributed hydrological-geotechnical model using satellite-derived rainfall estimates for shallow landslide prediction system at a catchment scale, Landslides, 7, 237–258, https://doi.org/10.1007/s10346-010-0214-z, 2010.
Aristizábal, E., Vélez, J. I., Martínez, H. E., and Jaboyedoff, M.: SHIA_Landslide: a distributed conceptual and physically based model to forecast the temporal and spatial occurrence of shallow landslides triggered by rainfall in tropical and mountainous basins, Landslides, 13, 497–517, https://doi.org/10.1007/s10346-015-0580-7, 2016.
ASTM D6528-17: Standard test method for consolidated undrained direct simple shear testing of fine grain soils, ASTM International, West Conshohocken, PA, USA, https://www.astm.org/d6528-17.html (last access: 24 May 2026), 2017.
Baum, R. L., Savage, W. Z., and Godt, J.: TRIGRS – a Fortran program for transient rainfall infiltration and grid-based regional slope-stability analysis, US Geological Survey Open File Report 2008-1159, 2, https://doi.org/10.3133/ofr20081159, 2008.
Bezak, N., Šraj, M., and Matjaž, M.: Copula-based IDF curves and empirical rainfall thresholds for flash floods and rainfall-induced landslides, J. Hydrol., 541, 272–284, https://doi.org/10.1016/j.jhydrol.2016.02.058, 2016.
Bogaard, T. and Greco, R.: Invited perspectives: Hydrological perspectives on precipitation intensity-duration thresholds for landslide initiation: proposing hydro-meteorological thresholds, Nat. Hazards Earth Syst. Sci., 18, 31–39, https://doi.org/10.5194/nhess-18-31-2018, 2018.
Brunetti, M. T., Peruccacci, S., Rossi, M., Luciani, S., Valigi, D., and Guzzetti, F.: Rainfall thresholds for the possible occurrence of landslides in Italy, Nat. Hazards Earth Syst. Sci., 10, 447–458, https://doi.org/10.5194/nhess-10-447-2010, 2010.
Cuomo, S., Di Perna, A., and Martinelli, M.: Modelling the spatio-temporal evolution of a rainfall-induced retrogressive landslide in an unsaturated slope, Eng. Geol., 294, 106371, https://doi.org/10.1016/j.enggeo.2021.106371,2021.
Domènech, G., Alvioli, M., and Corominas, J.: Preparing first-time slope failures hazard maps: from pixel-based to slope unit-based, Landslides, 17, 249–265, https://doi.org/10.1007/s10346-019-01279-4, 2019.
Fawcett, T.: Introduction to ROC analysis, Pattern. Recogn. Lett., 27, 861–874, https://doi.org/10.1016/j.patrec.2005.10.010, 2006.
Greco, V.: Efficient Monte Carlo Technique for Locating Critical Slip Surface, J. Geotech. Eng., 122, 517–525, https://doi.org/10.1061/(ASCE)0733-9410(1996)122:7(517), 1996.
Gu, T., Wang, J., Fu, X., and Liu, Y.: GIS and limit equilibrium in the assessment of regional slope stability and mapping of landslide susceptibility, B. Eng. Geol. Environ.,74, 1–11, https://doi.org/10.1007/s10064-014-0689-2, 2014.
Guo, Z., Torra, O., Hürlimann, M., Abancó, C., and Medina, V.: FSLAM: A QGIS plugin for fast regional susceptibility assessment of rainfall-induced landslides, Environ. Modell. Softw., 150, 105354, https://doi.org/10.1016/j.envsoft.2022.105354, 2022.
Hong, M., Kim, J., and Jeong, S.: Rainfall intensity-duration thresholds for landslide prediction in South Korea by considering the effects of antecedent rainfall, Landslides, 15, https://doi.org/10.1007/s10346-017-0892-x, 2017.
Hong, Y., Hiura, H., Shino, K., Sassa, K., Suemine, A., Fukuoka, H., and Wang, G.: The influence of intense rainfall on the activity of large-scale crystalline schist landslides in Shikoku Island, Japan, Landslides, 2, 97–105, https://doi.org/10.1007/s10346-004-0043-z, 2005.
Huang, F., Tao, S., Chang, Z., Huang, J., Fan, X., Jiang, S. H., and Li, W.: Efficient and automatic extraction of slope units based on multi-scale segmentation method for landslide assessments, Landslides, 18, https://doi.org/10.1007/s10346-021-01756-9,2021.
Kanungo, D. and Sharma, S.: Rainfall thresholds for prediction of shallow landslides around Chamoli-Joshimath region, Garhwal Himalayas, India, Landslides, 11, 629–638, https://doi.org/10.1007/s10346-013-0438-9, 2014.
Kim, S., Chun, K., Kim, M., Catani, F., Choi, B., and Seo, J. I.: Effect of antecedent rainfall conditions and their variations on shallow landslide-triggering rainfall thresholds in South Korea, Landslides, 18, https://doi.org/10.1007/s10346-020-01505-4, 2020.
Li, D., Wang, Z., Guo, H., Zhang, Y., Cheng, X., and Yu, Q.: Deep Learning in Slope Stability Analysis: Evolution, Challenges, and Future Directions, Geotech. Geol. Eng., 43, 1–48, https://doi.org/10.1007/s10706-025-03424-4, 2025.
Liang, W. L. and Uchida, T.: Performance and topographic preferences of dynamic and steady models for shallow landslide prediction in a small catchment, Landslides, 19, https://doi.org/10.1007/s10346-021-01771-w, 2021.
Liu, S. H., Du, J., Yin, K. L., Zhou, C., Huang, C. C., Jiang, J., and Yu, J.: Regional early warning model for rainfall induced landslide based on slope unit in Chongqing, China, Eng. Geol., 333, 107464, https://doi.org/10.1016/j.enggeo.2024.107464, 2024.
Ma, T., Changjiang, L., Lu, Z., and Bao, Q.: Rainfall intensity–duration thresholds for the initiation of landslides in Zhejiang Province, China, Geomorphology, 245, https://doi.org/10.1016/j.geomorph.2015.05.016, 2015.
Marra, F.: Rainfall thresholds for landslide occurrence: systematic underestimation using coarse temporal resolution data, Nat. Hazards, 95, https://doi.org/10.1007/s11069-018-3508-4, 2018.
Medina, V., Hürlimann, M., Guo, Z., Lloret, A., and Vaunat, J.: Fast physically-based model for rainfall-induced landslide susceptibility assessment at regional scale, Catena, 201, 105213, https://doi.org/10.1016/j.catena.2021.105213, 2021.
Moeineddin, A., Seguí, C., Dueber, S., and Fuentes, R.: Physics-informed neural networks applied to catastrophic creepping landslides, Landslides, 20, 1853–1863, https://doi.org/10.1007/s10346-023-02072-0, 2023.
Montgomery, D. and Dietrich, W. :A Physically Based Model for the Topographic Control on Shallow Landsliding, Water. Resour. Res., 30, 1153–1172, https://doi.org/10.1029/93WR02979, 1994.
Montrasio, L. and Valentino, R.: Modelling Rainfall-induced Shallow Landslides at Different Scales Using SLIP – Part I, Proced. Eng., 158, 476–481, https://doi.org/10.1016/j.proeng.2016.08.475, 2016.
Pinho, T. and Augusto Filho, O.: Landslide susceptibility mapping using the infinite slope, SHALSTAB, SINMAP, and TRIGRS models in Serra do Mar, Brazil, J. Mt. Sci.-Engl., 19, 1018–1036, https://doi.org/10.1007/s11629-021-7057-z, 2022.
Pradhan, A., Lee, S. R., and Kim, Y. T.: A shallow slide prediction model combining rainfall threshold warnings and shallow slide susceptibility in Busan, Korea, Landslides, 16, 647–659, https://doi.org/10.1007/s10346-018-1112-z, 2018.
Rigon, R., Bertoldi, G., and Over, T.: GEOtop: A Distributed Hydrological Model with Coupled Water and Energy Budgets, J. Hydrometeorol., 7, 371–388, https://doi.org/10.1175/JHM497.1, 2006.
Rosi, A., Segoni, S., Canavesi, V., Monni, A., Gallucci, A., and Casagli, N.: Definition of 3D rainfall thresholds to increase operative landslide early warning system performances, Landslides, 18, https://doi.org/10.1007/s10346-020-01523-2, 2020.
Rossi, G., Catani, F., Leoni, L., Segoni, S., and Tofani, V.: HIRESSS: a physically based slope stability simulator for HPC applications, Nat. Hazards Earth Syst. Sci., 13, 151–166, https://doi.org/10.5194/nhess-13-151-2013, 2013.
Spiker, E. C. and Gori, P.: National landslide hazards mitigation strategy: a framework for loss reduction, US Geological Survey Circular 1244, https://doi.org/10.3133/cir1244, 2003.
Tarboton, D. and Goodwin, C.: The SINMAP approach to terrain stability mapping, in: Proceedings of the 8th Congress of the International Association of Engineering Geology and the Environment, edited by: Moore, D. and Hungr, O., Vancouver, Canada, 21–25 September 1998, A. A. Balkema, Rotterdam, 2, 1157–1166, ISBN 90-5410-990-4, 1998.
Tufano, R., Formetta, G., Calcaterra, D., and De Vita, P.: Hydrological control of soil thickness spatial variability on the initiation of rainfall-induced shallow landslides using a three-dimensional model, Landslides, 18, https://doi.org/10.1007/s10346-021-01681-x, 2021.
Turel, M. and Frost, J.: Delineation of Slope Profiles from Digital Elevation Models for Landslide Hazard Analysis, Geo-Risk 2011: Risk Assessment and Management, Atlanta, Georgia, USA, 26–28 June 2011, ASCE, Reston, VA, 829–836, https://doi.org/10.1061/41183(418)87, 2011.
Van Genuchten, M.: A Closed-form Equation for Predicting the Hydraulic Conductivity of Unsaturated Soils, Soil Sci. Soc. Am. J., 44, https://doi.org/10.2136/sssaj1980.03615995004400050002x, 1980.
Wang, K. and Zhang, S.: Rainfall-induced landslides assessment in the Fengjie County, Three-Gorge reservoir area, China, Nat. Hazards, 108, 1–28, https://doi.org/10.1007/s11069-021-04691-z, 2021.
Wang, K., Zhang, S., Delgado Téllez, R., and Wei, F.: A new slope unit extraction method for regional landslide analysis based on morphological image analysis, Bull. Eng. Geol. Environ., 78, 4139–4151, https://doi.org/10.1007/s10064-018-1389-0, 2019.
Wang, K., Zhang, S., Xie, W. L., and Guan, H.: Prediction of the instability probability for rainfall induced landslides: the effect of morphological differences in geomorphology within mapping units, J. Mt. Sci-Engl., 20, 1249–1265, https://doi.org/10.1007/s11629-022-7789-4, 2023.
Wang, K., Xie, S., Zhang, S., Zhu, L., Ma, J., Liu, D., and Yang, H.: Creating a big data source of landslide deformation stages: New thoughts on identifying displacement warning thresholds, J. Asian. Earth. Sci., 266, 106120, https://doi.org/10.1016/j.jseaes.2024.106120, 2024.
Wang, K., Xie, S., Xie, L., Zhang, S., Zhu, L., Qi, F., Luo, H., and Zhao, X.: Research on the Impact of Regional-Scale Soil Mechanics Parameter Disturbances on Rainfall Landslides Warning, Geosciences, 15, 449, https://doi.org/10.3390/geosciences15120449, 2025.
Wang, X., Zhang, L., Wang, S., and Lari, S.: Regional landslide susceptibility zoning with considering the aggregation of landslide points and the weights of factors, Landslides, 11, https://doi.org/10.1007/s10346-013-0392-6, 2013.
Yan, G., Cheng, H., Jiang, Z., Teng, L., Tang, M., Shi, T., Jiang, Y., Yang, G., and Zhou, Q.: Recognition of Fluvial Bank Erosion Along the Main Stream of the Yangtze River, Engineering, 19, https://doi.org/10.1016/j.eng.2021.03.027, 2021.
Zhang, L. Y. and Zhang, J. M.: Extended algorithm using Monte Carlo techniques for searching general critical slip surface in slope stability analysis, Chinese Journal of Geotechnical Engineering, 28, 857–862, https://www.cgejournal.com/en/article/id/12113 (last access: 24 May 2026), 2006 (in Chinese).
Zhang, S., Zhao, L., Delgado-Tellez, R., and Bao, H.: A physics-based probabilistic forecasting model for rainfall-induced shallow landslides at regional scale, Nat. Hazards Earth Syst. Sci., 18, 969–982, https://doi.org/10.5194/nhess-18-969-2018, 2018.
Zhang, S., Xu, C. X., Wei, F., Hu, K., Xu, H., Zhao, L. Q., and Zhang, G. P.: A physics-based model to derive rainfall intensity-duration threshold for debris flow, Geomorphology, 351, 106930, https://doi.org/10.1016/j.geomorph.2019.106930, 2019.
Zhang, S., Ma, Z., Li, Y., Hu, K., Zhang, Q., and Li, L.: A grid-based physical model to analyze the stability of slope unit, Geomorphology, 391, 107887, https://doi.org/10.1016/j.geomorph.2021.107887, 2021.
Zhuang, J., Iqbal, J., Jianbing, P., and Tieming, L.:Probability Prediction Model for Landslide Occurrences in Xi'an, Shaanxi Province, China, J. Mt Sci.-Engl., 11, 345–359, https://doi.org/10.1007/s11629-013-2809-z, 2014.
Zhuang, J., Peng, J., Xu, Y., Xu, Q., Zhu, X., and Li, W.: Assessment and mapping of slope stability based on slope units: A case study in Yan'an, China, J. Earth. Syst. Sci., 125, https://doi.org/10.1007/s12040-016-0741-7, 2016.