the Creative Commons Attribution 4.0 License.
the Creative Commons Attribution 4.0 License.
 | 20 May 2026
Culvert blockages in 2D-hydrodynamic flash flood modeling: quantifying the impact on flood dynamics and mitigation strategies
Leon Frederik De Vos
Karan Mahajan
Daniel Caviedes-Voullième
Nils Rüther
Culverts play a critical role in conveying surface runoff during flash flood events, yet their failure due to blockages can significantly alter local flood dynamics, particularly in small, topographically complex catchments. Despite this, culvert blockages are often neglected in flood modeling. To address such gap, this study presents a comprehensive analysis of culvert blockages using the open-source hydrodynamic model TELEMAC-2D, applied to a flash-flood-prone catchment in central Germany. First, the study assesses recent flood events and evaluates the completeness and accuracy of official culvert datasets, identifying missing culverts. A dynamic culvert blockage module is then implemented, simulating varying degrees and timings of blockage based on water level thresholds at culvert inlets. Through a series of flood scenarios, the study identifies culverts whose blockages have a greater impact on local flood hydrographs and inundation extents, whereas their impact at the catchment scale remain small. Results highlight the importance of accurate culvert representation and present a scenario-based blockage modeling framework that can support the identification of critical infrastructure. This enables the development of targeted mitigation strategies, such as prioritized maintenance or emergency protection, ultimately reducing flood risks. The findings underscore the need to integrate culvert blockages into flash flood modeling and risk assessments and support future research into blockage formation mechanisms and improved field data acquisition.
- Article
(17943 KB) - Full-text XML
- BibTeX
- EndNote


Floods have caused numerous catastrophic events in recent years, with increasing frequency and severity linked to climate change. Globally, rainfall extremes have reached record levels (Robinson et al., 2021), and projections suggest that these events will pose even greater risks in the future (Caretta et al., 2022). Especially short-duration, high-intensity rainfall events, often resulting in flash floods, are becoming more common and present specific challenges to flood modeling and hazard mitigation (Borga et al., 2014).
Flash floods occur globally (Gaume et al., 2009; Archer et al., 2019; Reinert et al., 2025; Okamoto et al., 2019), typically in small catchments with short response times (Lóczy et al., 2012; Collier, 2007; Georgakakos, 1987; Voit and Heistermann, 2024). Due to the high rainfall intensity, water cannot be sufficiently infiltrated by the soil, resulting in rapid surface runoff. This runoff concentrates along topographic flow paths and is transported to lower elevations. When runoff exceeds local conveyance capacity, minor watercourses or urban flowpaths can transform into powerful torrents with high flow velocities (Borga et al., 2008), capable of entraining debris such as sediment, vegetation, and floating objects (Bayón et al., 2024; Erpicum et al., 2024; Valero et al., 2024). This debris can significantly increase the hazard potential, particularly in urban environments where vulnerable infrastructure and people are concentrated.
To simulate such complex dynamics, hydrodynamic models must accurately represent small-scale physical processes and interactions between flow and infrastructure. Recent advancements allow for direct rainfall input for hydrodynamic simulations using the rain-on-grid method. This enables the model to take spatially distributed precipitation as input and then compute the resulting runoff, e.g., by applying the SCS-CN method (U.S. Department of Agriculture, Soil Conservation Service, 1972), or the Green-Ampt infiltration model (Green and Ampt, 1911), at each element (Ligier, 2016; De Vos et al., 2024).
In urban and peri-urban environments, accurate modeling of flash floods also requires fine spatial resolution to capture the onset of the flash flood along narrow topographic features (Caviedes-Voullième et al., 2012) and interactions with buildings and infrastructure (Schubert and Sanders, 2012), such as roads, and particularly culverts. Studies have shown that explicit modeling of these components significantly improves simulation accuracy (Ah-Woane et al., 2025; Pizzileo et al., 2024; Bowling and Lettenmaier, 2001).
However, calibration of flash flood models remains challenging due to limited data availability. Flash floods often occur in small, ungauged catchments, and their short duration makes in-situ monitoring difficult (Borga et al., 2008). As a result, photographic documentation, reports from local residents, and citizen science initiatives are often the only sources of validation data (Khosh Bin Gomash et al., 2026; Rohmat et al., 2022). Arguably, flash flood models are the only available source to provide high-resolution spatiotemporal outputs of water depths and velocities, which are crucial for flood forecasting, hazard assessment, and evacuation planning (Apel et al., 2008; Khosh Bin Ghomash et al., 2024; Li et al., 2025).
Furthermore, hydrodynamic flood models are used to evaluate the effectiveness of flood mitigation measures, both by permanent structural measures, such as retention basins, or temporary operational measures, such as temporary flood protection walls or maintenance of critical hydraulic infrastructure.
Hydraulic infrastructure can have large impacts on floods. Bridges can cause backwater effects if logjams of floating debris are formed upstream of the bridge (Burghardt et al., 2025; Okamoto et al., 2019). Next to bridges, culverts ensure stream connectivity across infrastructure such as roads or railway embankments, often turning into critical bottlenecks during flood events. During flash floods, floating or sediment-laden debris can obstruct culvert inlets, reducing discharge capacity and leading to upstream ponding, elevated flood levels, and increased flow velocities at outlets. In extreme cases, this may result in embankment failure due to scour or seepage (Rigby et al., 2002). Even without structural failure, blocked culverts substantially affect local flood behavior and must be accounted for in realistic modeling scenarios.
Therefore, blocked culverts have been studied in laboratory experiments, and equations to incorporate the reduced discharge capacity of blocked culverts have been developed (Weeks et al., 2013; Miranzadeh et al., 2023; Sellevold et al., 2024; Rigby and Barthelmess, 2011). However, mainstream hydrodynamic models rarely incorporate dynamic culvert blockage representations. For instance, Ollett et al. (2017) present their implementation of a static blockage module in TUFLOW, and refer to future studies for a dynamic culvert blockage.
The lack of dynamic culvert blockage models can be linked to at least two challenges: First, culvert blockage mechanisms are highly site-specific and depend on local topography, available debris load and type, and culvert design. Second, the timing and degree of blockage cannot be predicted (Rigby and Barthelmess, 2011) and must be assumed or parameterized using probabilistic or threshold-based approaches (Ball et al., 2019). The Australian Rainfall and Runoff Guidelines, therefore, recommend using unblocked culverts as a reference scenario and simulating blockage scenarios across a range of parameters to assess their potential impact. For an in-depth analysis of the types, mechanisms, and probabilities of culvert blockages, the present study refers to Chap. 6 of the Australian Rainfall and Runoff Guideline for Flood Estimation (Ball et al., 2019).
While some studies have started to address the research gap of modeling blocked culverts within a catchment, few have examined both local and catchment-scale effects. Ah-Woane et al. (2025) modeled dynamic culvert blockages in the Brague catchment in southern France. Blockage onset was triggered at maximum culvert inflow or when bankfull conditions were reached. They observed limited impacts on downstream hydrographs, but noted that local flow dynamics were affected. However, the specific configuration of their case study, where all culverts passed under the same highway, allowed floodwaters to rejoin the downstream system, minimizing the blockage's overall effect. Rigby and Barthelmess (2011) simulated the effects of a single blocked culvert for multiple blockage degrees and timing points, but did not investigate the effects on a catchment with multiple culverts. Their study also identified the need for more research on the impacts of culvert blockages. Similarly, Fallowfield and Motta (2024) investigated the impact of individual culverts with varying degrees of blockage and introduced a flood risk metric, but did not detail their blockage method, assumed culverts were initially blocked, and did not assess multiple culverts within one scenario.
To address the current research gap, the present study proposes a framework to assess the impacts of culvert blockages in flash flood modeling, both on a local and a catchment scale, and focuses on vulnerable urban areas. To showcase the framework, the study applies the open-source model TELEMAC-2D (EDF, 2022) to the catchment of the Reichenberger Bach in central Germany, as blocked culverts and several minor flash floods were observed in this catchment in recent years. TELEMAC-2D is well-suited for this purpose due to its support for unstructured meshes, in turn permitting fine local spatial resolution, and its parallel processing capabilities, allowing it to accurately simulate complex flow conditions along fine topographic flow paths or urban areas.
First, this study analyzes recent flood events in the catchment, followed by a detailed description of the model setup, infrastructure representation, and culvert integration. As a first result, this study stresses the importance of assessing official culvert datasets and identifying missing or inaccurately represented culverts, which are often absent from infrastructure records (Truhlar et al., 2020; Lessard et al., 2023). The proper representation of culverts is essential for reliably simulating flood pathways, connectivity, and ponding effects in small catchments.
A dynamic blockage module is then implemented in TELEMAC-2D and applied for multiple flood scenarios, triggering different partial blockages based on water level thresholds at culvert inlets. Even though calibration and validation of hydrodynamic models are crucial for accurate flood modeling, this study does not aim to achieve a fully calibrated flood model that includes blocked culverts. The aim of this study is to assess the impacts of blocked culverts at the local and catchment scales, and to compare impacts across different blockage degrees and trigger points.
By analyzing hydrographs and inundation extents across different blockage scenarios, the study presents a framework for identifying critical culverts, those whose blockages disproportionately affect flood dynamics in vulnerable areas. This facilitates the development of targeted mitigation scenarios, such as designating certain culverts for maintenance or protection during early warning phases.
The study concludes by demonstrating how safeguarding specific culverts changes local flood outcomes, potentially reducing flood hazards and associated damages. This integrated modeling approach provides valuable insights for risk-informed planning, emergency preparedness, and infrastructure maintenance.
2.1 Study Area
The investigated study area is the ungauged catchment of the Reichenberger Bach with an area of approximately 33 km2 (see red outline in Fig. 1). The Reichenberger Bach merges with the Fuchsstädter Bach shortly downstream of the study area outlet and flows into the River Main south of Würzburg in the Northeast of Bavaria, Germany. The study area has high gradients with the topography ranging from 191 m a.s.l. at the outlet to 374 m a.s.l. at the northwest watershed boundary. Two distinct major streams can be identified in the catchment. The first stream is the Reichenberger Bach, which flows from south to north, mainly surrounded by agricultural fields and passing through some villages. It starts at an elevation of around 290 m a.s.l. and is at around 191 m a.s.l. at the outlet of our study area. With a channel length of approximately 7.7 km, it has an average slope of 1.3 %. The second stream (Guttenberger Bach) flows through forested land from the northwest watershed boundary towards the municipality of Reichenberg. The Guttenberger Bach starts at an elevation of around 356 m a.s.l. and has an elevation of 225 m a.s.l. at its confluence with the Reichenberger Bach. With a channel length of approximately 5.3 km, the Guttenberger Bach has an average slope of 2.5 %.
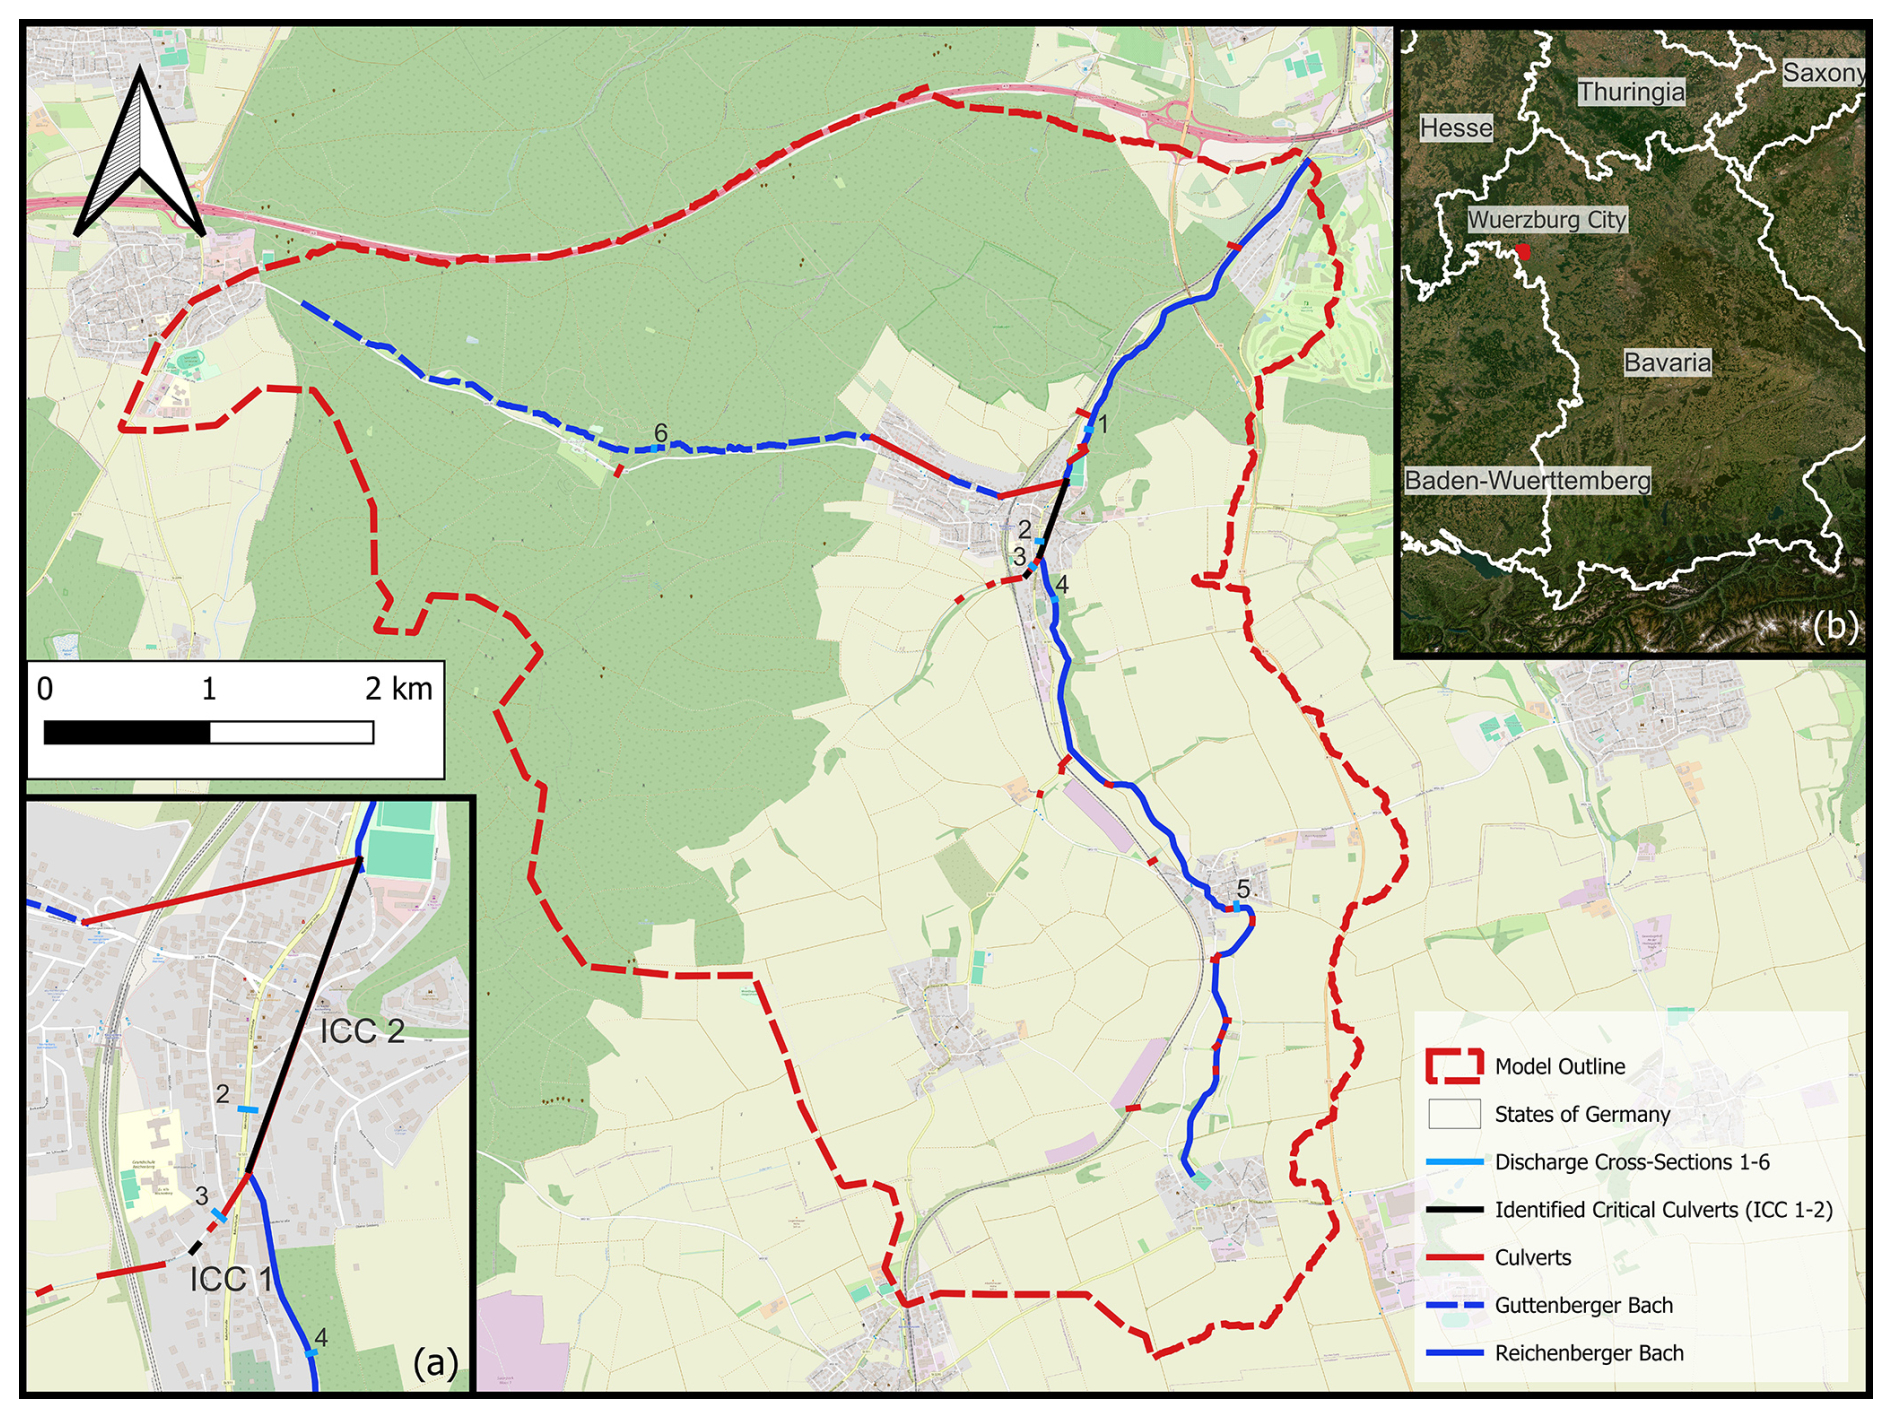
Figure 1The catchment of the study area. The dashed red line shows the catchment boundary. The dark blue line displays the Reichenberger Bach, and the dashed dark blue line the Guttenberger Bach. Solid red lines depict the complete culvert data set, with the black lines being the critical culverts identified in this study. Light blue lines are the numbered cross-sections used for hydrograph analysis in the catchment. Map inset (a): a detailed view of the location of the critical culverts in Reichenberg. Map inset (b): The position of the catchment in the north west of Bavaria, a Federal State in Germany. Basemaps from © OpenStreetMap contributors 2025, distributed under the Open Data Commons Open Database License (ODbL) v1.0, and Powered by Esri (2025).
Within the municipality of Reichenberg, the Reichenberger Bach is conveyed entirely through an underground culvert (see Fig. 1, ICC 2 in Fig. 1a). The Guttenberger Bach enters an underground section within the municipal area and merges with the Reichenberger Bach below ground, leaving the culvert system together toward the downstream municipal boundary.
Numerous culverts are usually located in catchments like the one in this study (see Fig. 1). The data provided by the environmental administration agency in Bavaria, Germany (LfU), included 22 culverts. During the first model runs, it became evident that culverts were missing in the provided data, as inundation areas were forming at elevated roads and railway tracks. An additional seven culverts were identified at some of these inundation areas and surveyed during a site inspection. These 7 culverts must be represented in the model to enhance the quality of the model results, as they impact the flood dynamics. However, it is unlikely that all culverts within the study area were identified; therefore, some minor culverts are most likely undetected. Culvert geometry data and their locations are given in Appendix A.
The culverts in the study area can be separated into two groups:
-
In-stream culverts: Culverts that are directly along the major streams. These culverts were all represented in the data set from the authorities.
-
Towards-stream culverts: Culverts that connect minor streams with the major streams. Here, 7 additional culverts were found. Without these culverts, the sub-catchments upstream of the culverts are disconnected from the overall flood, failing to maintain hydrologic connectivity in the model.
2.2 Precipitation Scenarios
The Reichenberger Bach lies in a region that is frequently affected by droughts, with a mean annual precipitation of 712 mm (Bayerisches Landesamt für Umwelt, 2021). Still, the catchment area of the Reichenberger Bach has experienced several minor flash floods in recent years, triggered by heavy precipitation. HNx denotes a precipitation event with a return period of x years (e.g., HN30 is a precipitation event with a 30-year return period):
-
28 June 2021: 30 mm of precipitation in 3 h (HN3), locally up to 37 mm in 3 h (HN10)
-
9 July 2021: 60 mm in 13 h (HN20), but peak intensities lower than 8 mm h−1
-
15 July 2021: 25 mm in 2 h (HN3), but locally up to 43 mm in 2 h (HN30)
-
3 August 2024: 29 mm in 3 h (HN3), but locally up to 43 mm in 3 h (HN20)
All these events caused multiple fire department operations due to flooded streets and basements (Feuerwehr Reichenberg, 2021b, a, 2024). The precipitation data for the events 1–3 were obtained from the hourly RADKLIM data set (Winterrath et al., 2018), whereas the fourth event was obtained from the recent hourly RADOLAN data set (DWD Climate Data Center (CDC), 2025; Bartels et al., 2004). Both the RADKLIM data set and the RADOLAN data set are free to access radar-based precipitation data sets with a 1 km × 1 km spatial and 1 h temporal resolution. This allows the computation of catchment average precipitation intensities as well as local peak intensities. The return periods were defined based on the KOSTRA 2020 data set, which provides precipitation intensities for different durations and return periods on 5 km × 5 km spatial resolution in Germany (Junghänel et al., 2022). The KOSTRA 2020 data set is the state-of-the-art data set in Germany to obtain statistical precipitation events for different return periods.
Table 1Precipitation values (incremental and cumulative in mm) for various return periods and time intervals.
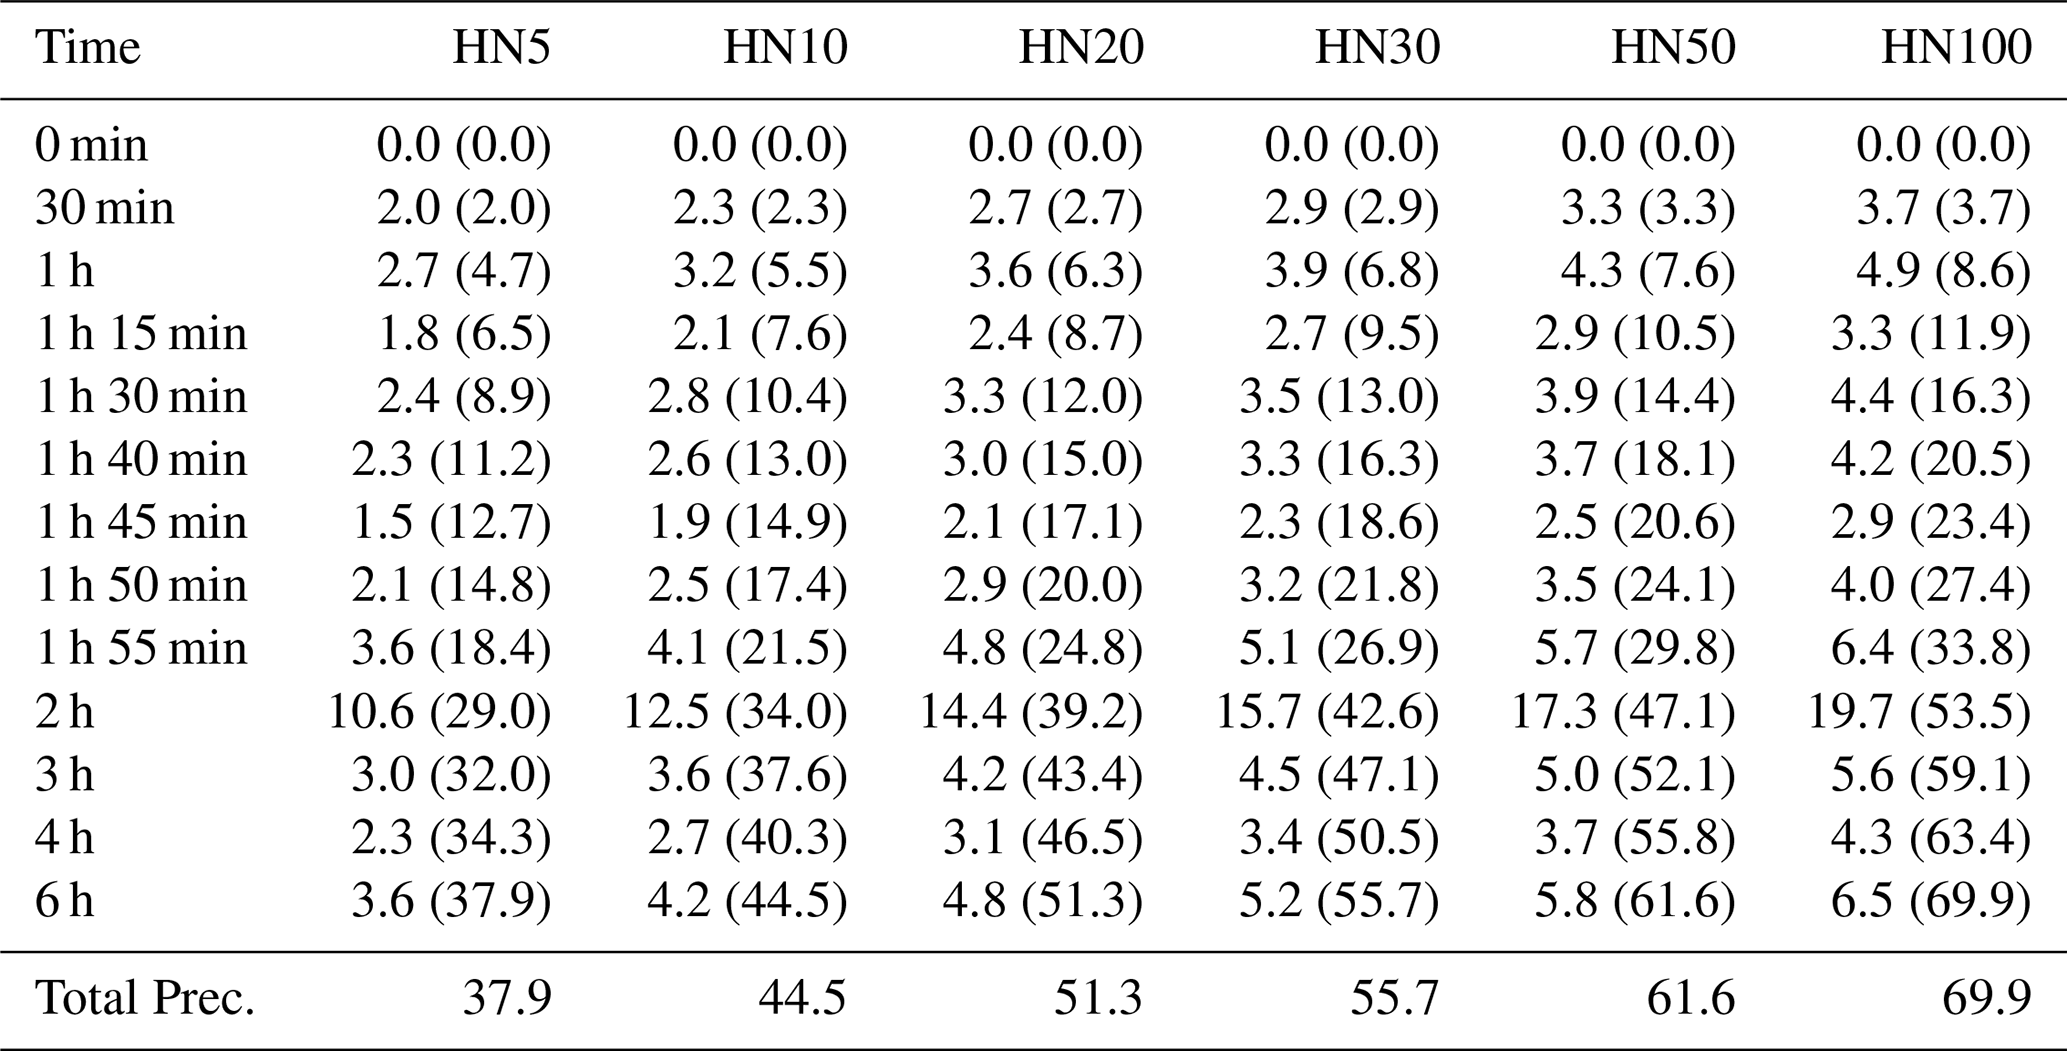
Precipitation scenarios with return periods of 5 to 100 years are modeled (see Table 1 for the temporal distributions), to both cover a broad range of precipitation scenarios and exceed flooding thresholds of previous precipitation events. The precipitation intensities are taken from the KOSTRA 2020 data set (Junghänel et al., 2022) and temporally distributed using the Euler II distribution (Deutsche Vereinigung für Wasserwirtschaft, Abwasser und Abfall, 2006), which arranges the higher intensities in ascending order over the first third of the scenario and the lower intensities in descending order over the rest of the scenario. The precipitation is assumed to be spatially uniform, as differences in rainfall amounts among the 5 km × 5 km KOSTRA 2020 raster cells intersecting the catchment are below 1 %.
After conducting simulations with different precipitation durations, the highest peak discharges were present for precipitation durations of 6 h. Therefore, the overall duration of the investigated precipitation scenarios in this study was set to 6 h. The precipitation serves as an input for the SCS-CN model (U.S. Department of Agriculture, Soil Conservation Service, 1972) that calculates the surface runoff. The total duration of the modeled floods is 10 h to ensure that the flood peak has propagated throughout the catchment.
2.3 Mesh Generation and Parameters
The mesher triangle (Shewchuk, 1996) is used to generate a Delaunay triangulation. To precisely incorporate the topographical stream paths, a watershed delineation with a LIDAR-based digital elevation model with a resolution of 1 m × 1 m is conducted, and stream paths with a Strahler Order of 7 or lower are included as breaklines with a resolution of 0.5–0.7 m. Additionally, areas with measured channel geometries were refined with a resolution of approximately 0.7 m. These areas cover the Reichenberger Bach and some sections of tributaries upstream of their confluence with the Reichenberger Bach. The digital elevation model and the measured channel geometries were both provided by the Bavarian Environment Agency (LfU Bayern). The stream paths, together with the refined areas of channel geometries, represent all the major flow paths in the hydrodynamic model in detail. Buildings close to the channels are represented as holes in the mesh, and their edges are resampled with a resolution of 1–2 m. Buildings farther away from the channels and located higher above the channels are neglected as the flood inundation from the overtopped channels cannot extend to those buildings, and therefore, they do not influence hydrodynamic processes. Their influence on the rainfall-runoff process is deemed insignificant due to the low area percentage covered by buildings in the rural surroundings. Outside of the refined channels, stream paths, and buildings, the mesh coarsens to a resolution of up to 15 m. A finer mesh resolution only marginally changed the results, but resulted in significantly higher computation costs. In total, the applied mesh has 1 168 050 nodes and 2 318 072 elements.
The topography of the model is generated in two steps. First, the digital elevation model is interpolated on the mesh. Then, the bathymetry within the refined channel areas is interpolated from an existing flood model provided by the authorities, where the bathymetry was based on measured channel geometries. The Bavarian Environment Agency additionally provided land use data, which were taken to map roughness values based on administrative guidelines (LUBW, 2020) and generate the CN values for the applied SCS-CN rainfall-runoff method (U.S. Department of Agriculture, Soil Conservation Service, 1972).
The 2D-hydrodynamic module TELEMAC-2D from the open-source software TELEMAC (EDF, 2022) is applied to solve the shallow water equations and simulate the flood scenarios using a timestep of 0.5 s for the semi-implicit solver in the finite-element method. The initial conditions assume a completely dry state, since most of the channels in the catchments only carry little to no water without a preceding rain event. Since the catchment is topographically bounded, there are no discharge inlets, and all water comes from the rain input, applying the implemented SCS-CN method for rainfall-runoff modeling. The catchment outlet is modeled as a free outlet boundary condition.
2.4 Model Plausibility Assessment
In general, data sets for flooding in catchments, as in this study, are scarce due to the short duration and local focus of the rain events (Khosh Bin Gomash et al., 2026). Since the catchment is also ungauged, the model cannot be calibrated or validated using the outlet hydrograph. The best available data set for model plausibility assessment is photographs from the flood event on 15 July 2021, which caused 29 calls to the fire department in total (Feuerwehr Reichenberg, 2021c). The photographs were used to generate a water mask during a field campaign in the catchment (Fig. 2). However, this water mask does not provide any temporal information and cannot be interpreted as a maximum inundation extent, but serves as a snapshot in time or a minimum inundation extent if the photograph does not have a timestamp. Additionally, there is no indication about areas not covered by any photograph. These areas might have been inundated or not, and no plausibility assessment of these areas in the model is possible.
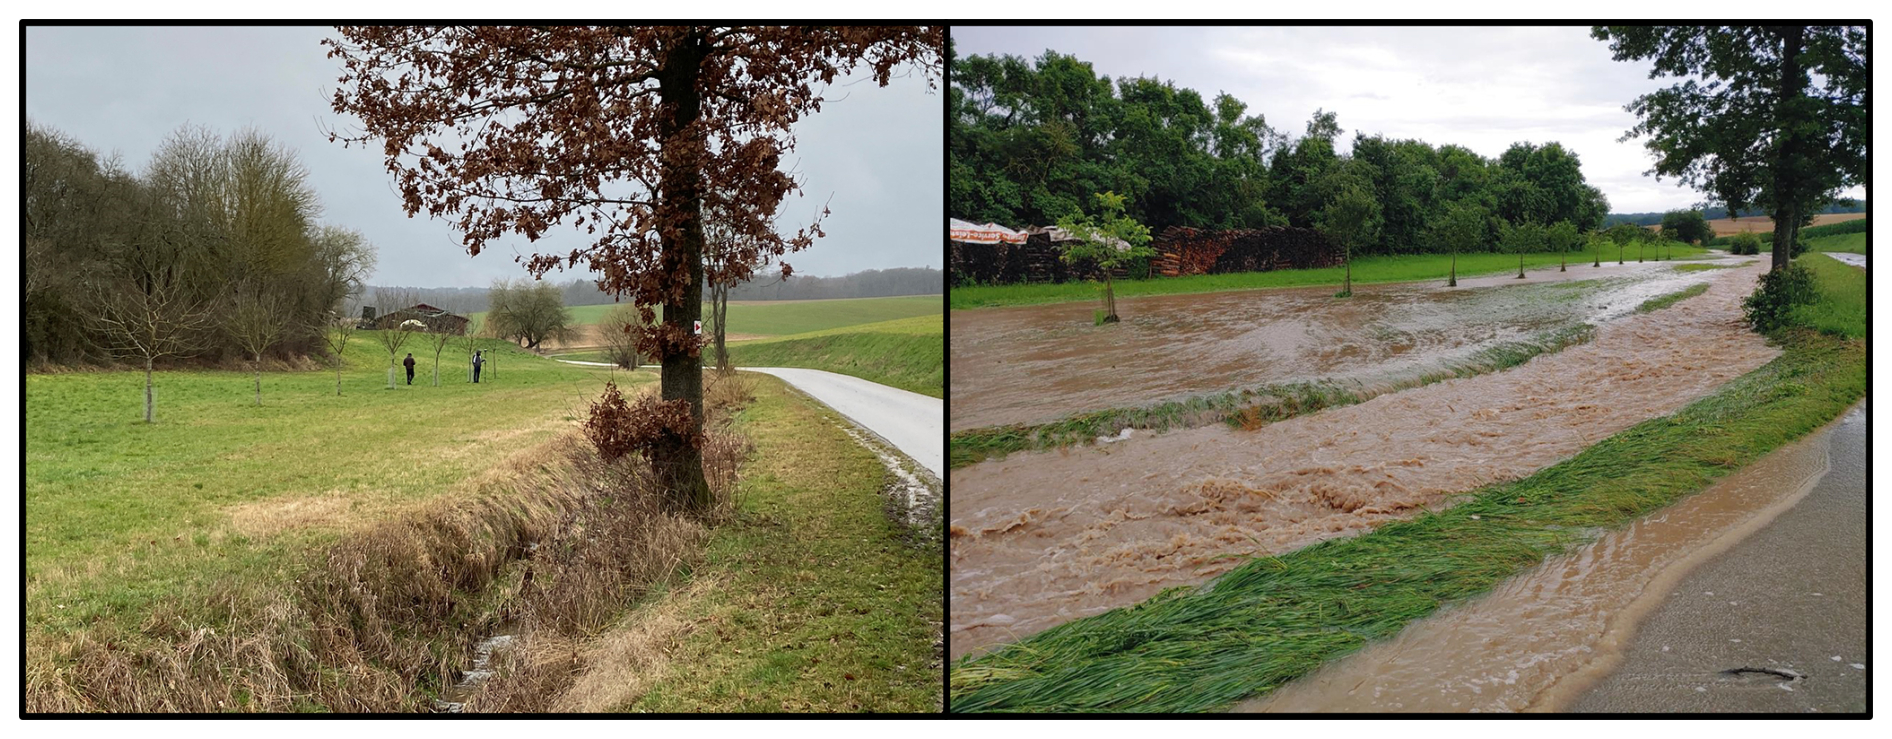
Figure 2Generating a water mask from a recent flood event using photographs. Left: Sampling water extension points from the water mask using an Emlid GPS system. Right: Photograph from the flood event on 15 July 2021.
On 9 July 2021, 6 d prior to the event taken for the plausibility assessment, the catchment experienced another flood event with 60 mm of rainfall in 13 h (see Sect. 2.2). It is expected that the soil throughout the catchment was therefore still presaturated during the event on 15 July, which limited the infiltration capacity of the soil. To account for this, the antecedent moisture in the SCS-CN method is set to wet conditions, which effectively increases the CN values (Hawkins, 1978) and, therefore, the runoff. To minimize the uncertainty of the precipitation input, a spatially distributed precipitation is applied for the event. For this, the temporally more refined 5 min radar-based RADKLIM-YW precipitation data with a pixel size of 1 km × 1 km (Winterrath et al., 2018) is interpolated onto the model and used as input for the SCS-CN method.
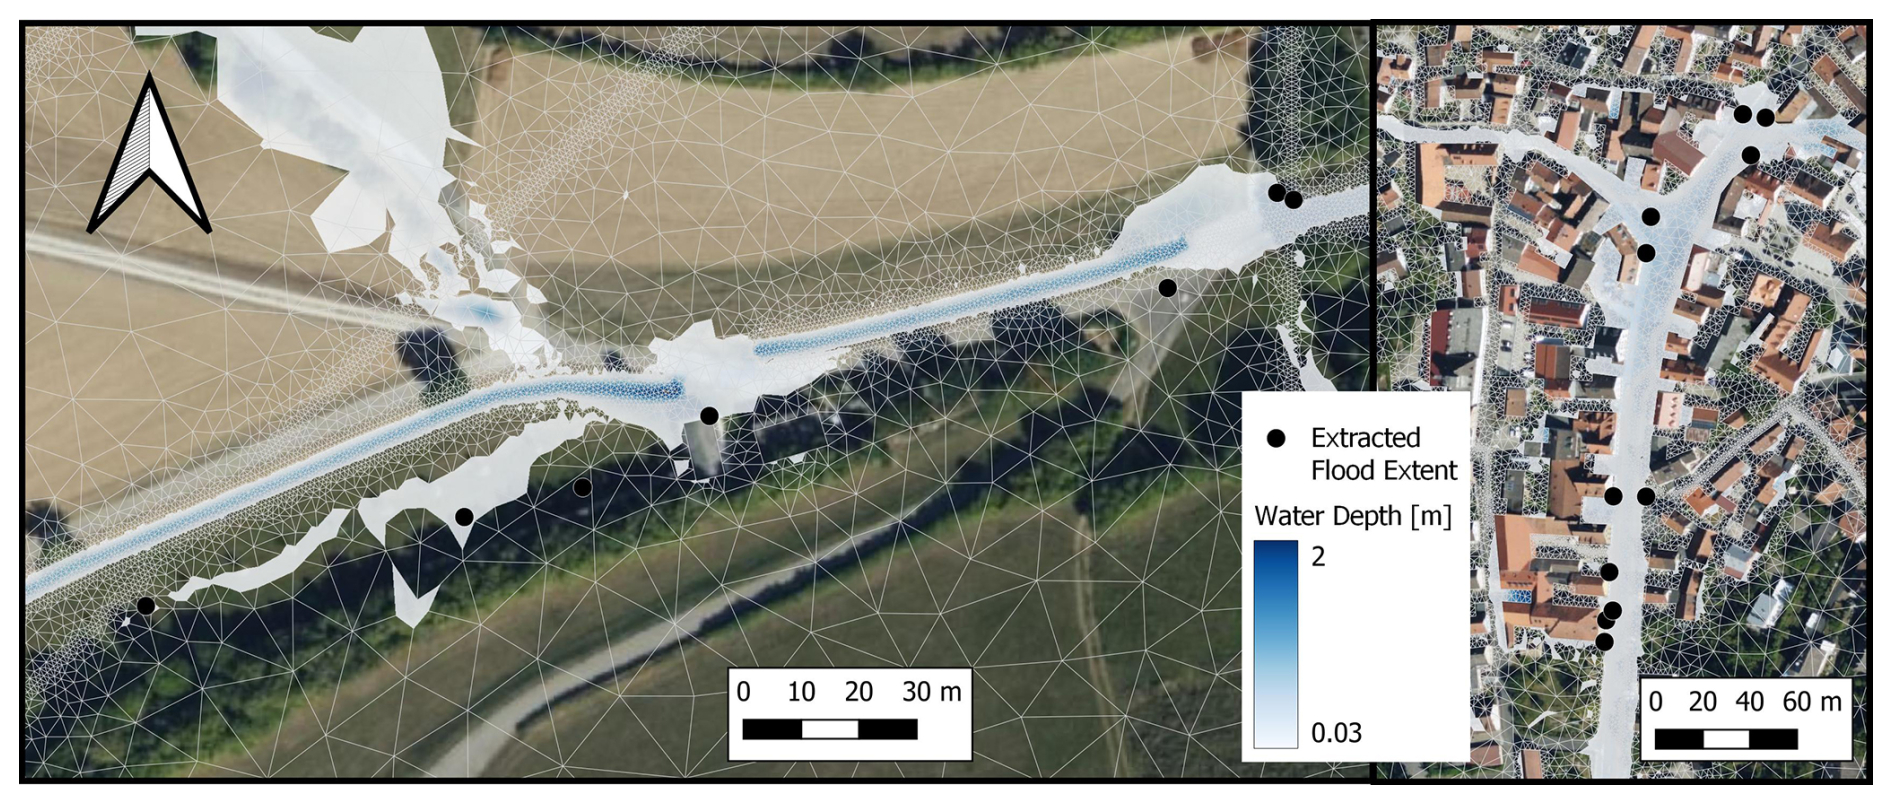
Figure 3Points of measured flood extent and simulated water extension for the event taken for the plausibility assessment. Basemaps: Bing Maps © Microsoft Corporation and its data providers.
Figure 3 compares the water extension from the simulation of the event with the measured water extension points at two distinct locations. At the location on the left, all but one water extension point is reached in the simulation. The location on the right displays the center of the municipality of Reichenberg. The simulated water extension has a good fit with the measured water extension here. This overall allows the conclusion that the model is plausibilized by the photographs of the flood event, and no local model adaptations with respect to friction or runoff coefficients were conducted. The precipitation scenarios used for the assessment of the culvert blockages exceed the precipitation volume of the event. Therefore, flooded areas can be expected within the municipality of Reichenberg for these scenarios.
2.5 Culvert Modeling in TELEMAC-2D
Culverts are a hydraulic infrastructure that ensures stream connectivity through or beneath topographic barriers. These topographic barriers are mainly roads or railway tracks. Still, sometimes a longer stretch of a stream can be moved entirely underground to cope with spatial constraints in settled areas, thereby bypassing whole villages. Even though the geometry and setup of a culvert itself appear relatively simple, culverts pose considerable challenges in hydraulic modeling (Ball et al., 2019) and their correct representation remains an ongoing area of research (Oberauer et al., 2026). This is due to the complex flow behavior of culverts, which can be classified into six different types (Bodhaine, 1968).
Each flow type is defined by the flow in the barrel (full or partly full), culvert slope, and specific ranges in the ratios of the upstream and downstream water depths to the culvert height. The flow types can be further grouped into inlet and outlet control. Under inlet control, the flow is partly full in the barrel and supercritical upstream of the culvert outlet. Therefore, the flow only depends on the water depth and geometry at the inlet. Otherwise, the flow is under outlet control and depends also on the water depth and geometry at the outlet. An in-depth description of the hydraulics of culverts is given in Bodhaine (1968) and Schall et al. (2012).
TELEMAC-2D models culverts as a 1D sink and source link from an upstream node representing the culvert inlet to a downstream node (outlet). As flow type 1 is not implemented in TELEMAC-2D (Smolders et al., 2016), the present study had to assess the potential occurrence of flow type 1 at culverts within the catchments. As flow type 1 is only present at steep culverts with low downstream water depths (Bodhaine, 1968), it can only occur at a limited number of culverts inside the catchment at low discharges. As these culverts are not located within the Reichenberger Bach but on minor streams feeding into it, their impact on the main flood dynamics during flood peaks is negligible.
The discharge calculation for culverts in TELEMAC-2D follows the equations from Bodhaine (1968), and their implementation is described in detail in Smolders et al. (2016). First, the discharge through the culvert QCul is calculated based on the flow type. Then, it is checked whether the upstream node holds enough available water to fulfill the calculated culvert discharge. The available water per time step at the node is calculated using the water depth h at the upstream node, the element area Aelem of the upstream node, and the time step dt. This sets an upper limit for the maximum discharge Qmax through the culvert in the model:
Factor k is set to 0.9 by default in TELEMAC-2D to ensure the element does not get fully dry. In practice, culverts usually span across most of the stream to avoid backwater rising for small discharges. To capture the 2D flow dynamics of the stream in the numerical model, multiple nodes must be laid laterally across the stream, yet only one single node contributes to the discharge through the culvert. Therefore, the calculated discharge through the culvert QCul might be larger than the limit for the maximum discharge Qmax, and not enough water can be transported through the culvert in the model. As indicated in Eq. (1), this limitation could be addressed by reducing the time step of the model. However, this would significantly increase the model runtime and is therefore not considered practical.
Consequently, this study extends the existing culvert implementation in TELEMAC-2D. First, the factor k is reduced to 0.5 to limit the maximum volume reduction at the culvert inlet node. Then, if the calculated discharge through the culvert QCul exceeds the maximum discharge Qmax, only Qmax is taken from the inlet node and the residual discharge () is processed by a predefined neighboring node. If Qmax at this neighboring node is smaller than the residual discharge, then a new residual discharge is calculated and processed by another neighboring node. Residual discharge is passed to predefined neighboring nodes until the full theoretical discharge is transported to the outlet. Similar culvert-handling methods are not only presented in Fernández-Pato et al. (2020), but might also be introduced in future TELEMAC-2D releases (Smolders and Bourbain, 2024).
2.6 Blockage Methods and Scenarios
Since the study area lies in forested and agricultural lands with high gradients, its culverts are prone to logjams (Ball et al., 2019; Rigby et al., 2002), as also demonstrated in photographs from the site inspection and recent flood events (see Fig. 4, middle and right). Culvert blockages are usually modeled either using the area reduction method (ARM), which reduces the culvert diameter or height, or the energy loss method (ELM), which increases the energy loss coefficient at the inlet of the culvert ke (Weeks et al., 2013). The ARM seems to be suitable for sedimentation blockages since the sediment fills up the culvert from bottom to top, and therefore, the bottom elevation of the culvert can still be defined. However, the sedimentation of the study area's culverts is minimal and, therefore, can be neglected (see Fig. 4, left).
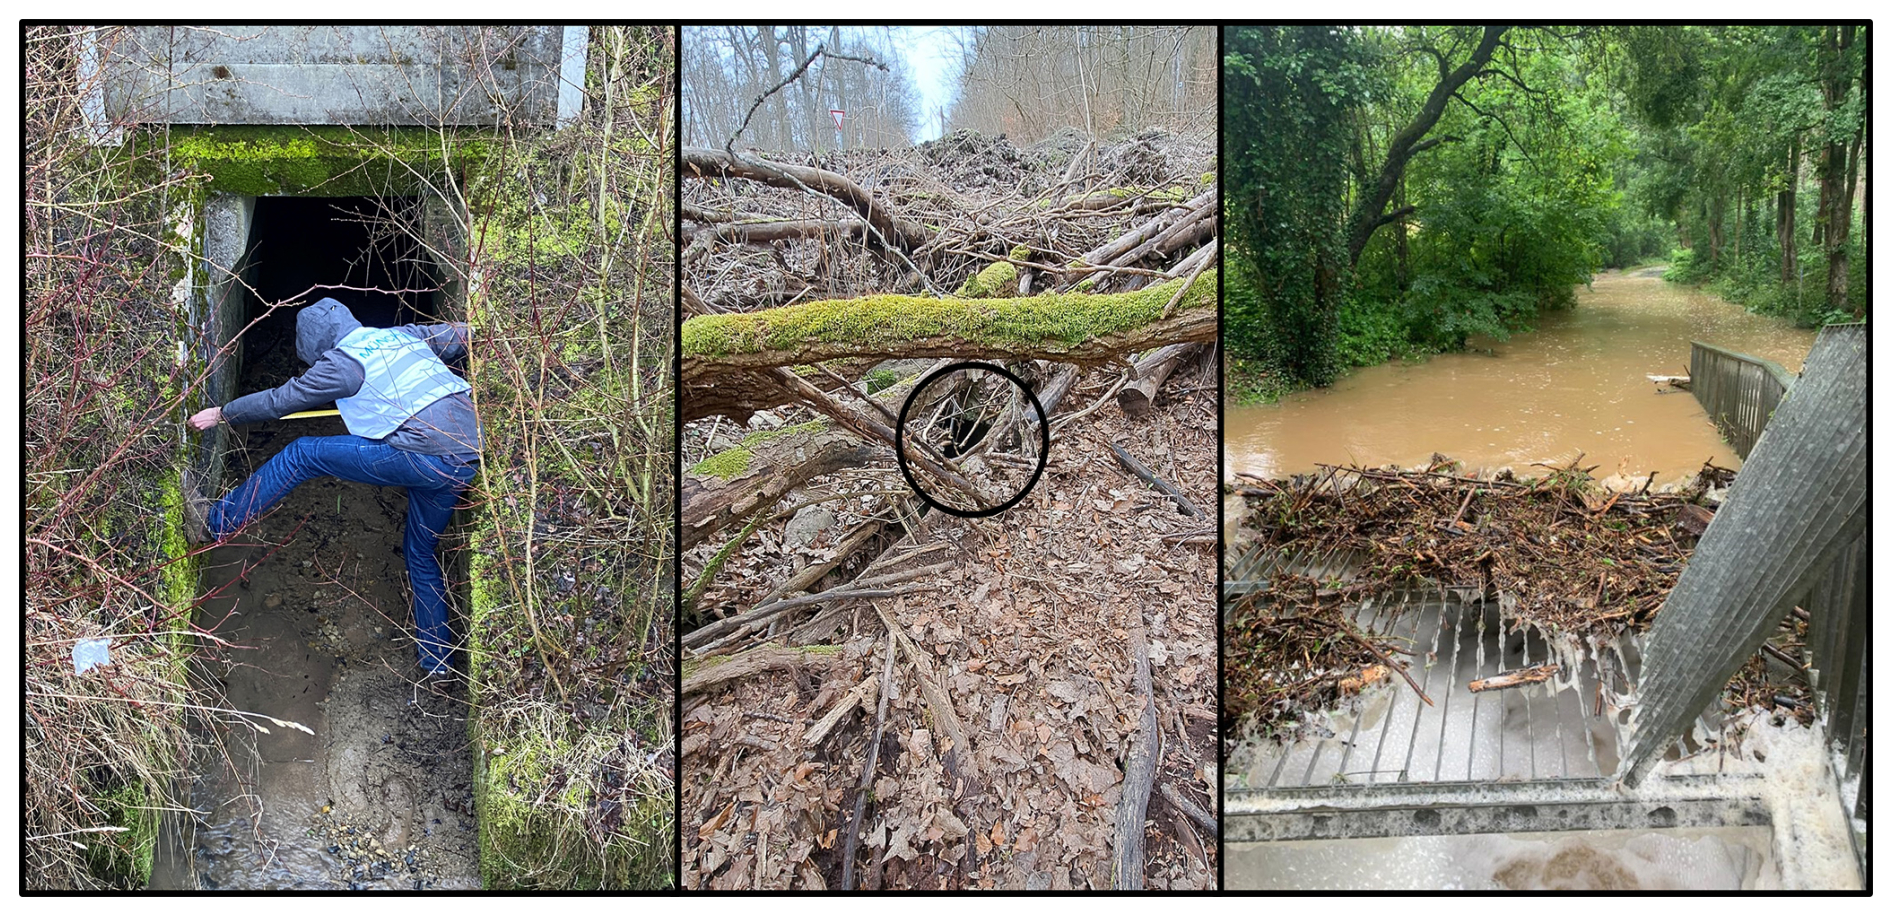
Figure 4Left: inspection of an unsurveyed culvert with slight sedimentation, middle: extreme logjam in front of an unsurveyed culvert (see black circle for culvert location), right: blocked culvert during the flood event at 9 July 2021 (Feuerwehr Reichenberg, 2021b, https://ff-reichenberg.de/einsatzberichte/1752-hochwasser-strasse-ueberflutet/, last access: 13 May 2026).
For logjam blockages, an entangled body of wood logs and branches is captured in front of the inlet of the culvert (see Fig. 4, middle and right). Since the effective loss of the inlet area cannot be strictly accounted for in the bottom or top part of the culvert, this study applies the ELM (energy loss method). The ELM is only applicable for outlet control conditions in culverts (Ollett et al., 2017), and not for inlet control conditions. However, during a flood event, culverts are mainly in outlet conditions, as can be deduced by the definition of the control conditions and flow types through culverts (Bodhaine, 1968; Smolders et al., 2016).
The ELM is based on an increase in the inlet loss coefficient of the culvert based on the blockage ratio BR, defined as the ratio of obstructed culvert area to the overall culvert area without any logjam. Since logjam bodies are complex and heterogeneous in all three dimensions, they are often modeled as porous bodies, impeding the estimation of BR with absolute certainty (Iqbal and Riaz, 2024). Therefore, this study investigates blockage scenarios with BR=0.2, 0.5, and 0.8 to account for different degrees of blockage. Based on these blockage ratios, the corresponding adapted energy loss coefficient at the inlet can be calculated according to Ollett et al. (2017); Weeks et al. (2013) as:
where the initial energy loss coefficient at the inlet without blockage, ke, is set to 0.5 in this study, which corresponds to the mostly square-edged, concrete pipe or box culverts in the catchments (Schall et al., 2012). For BR=0.2, 0.5, and 0.8, the adapted energy loss coefficient at the inlet increases to 1.3, 5.8, and 56.8, respectively. The present study did not assess different ke values for inlet configurations in detail, as the blockage ratio is the dominant parameter in calculating the adapted energy loss coefficient .
Furthermore, the scenarios differ in the timing of the blockage. Blockages are based on the trigger ratio TR, which is defined as the ratio of the water depth at the culvert inlet Hi and the inlet height or diameter of the culvert D:
TR is predefined for each scenario, ranging from TR=0 (initial blockage at all culverts) to TR=1.5 (blockage when water depth at inlet is 1.5 times the inlet height). Once the blockage of a culvert is triggered, it cannot be unblocked again, even if TR falls below the defined trigger threshold after the flood peak. The ELM was implemented into the culvert module of TELEMAC-2D for this study.
The scenarios investigated in this study trigger the blockages for TR=0.8, 1.0, 1.2, and 1.5. Table 2 shows the investigated combinations of scenarios with BR and TR. To reduce computational time, not all possible scenario combinations have been simulated. Each blockage scenario was modeled for rainfall return periods of HN5, HN10, HN20, HN30, HN50, and HN100 (see Sect. 2.2). The reference scenarios incorporate no blockages.
Table 2Investigated blockage scenarios for different blockage ratios (BR) and trigger ratios (TR).
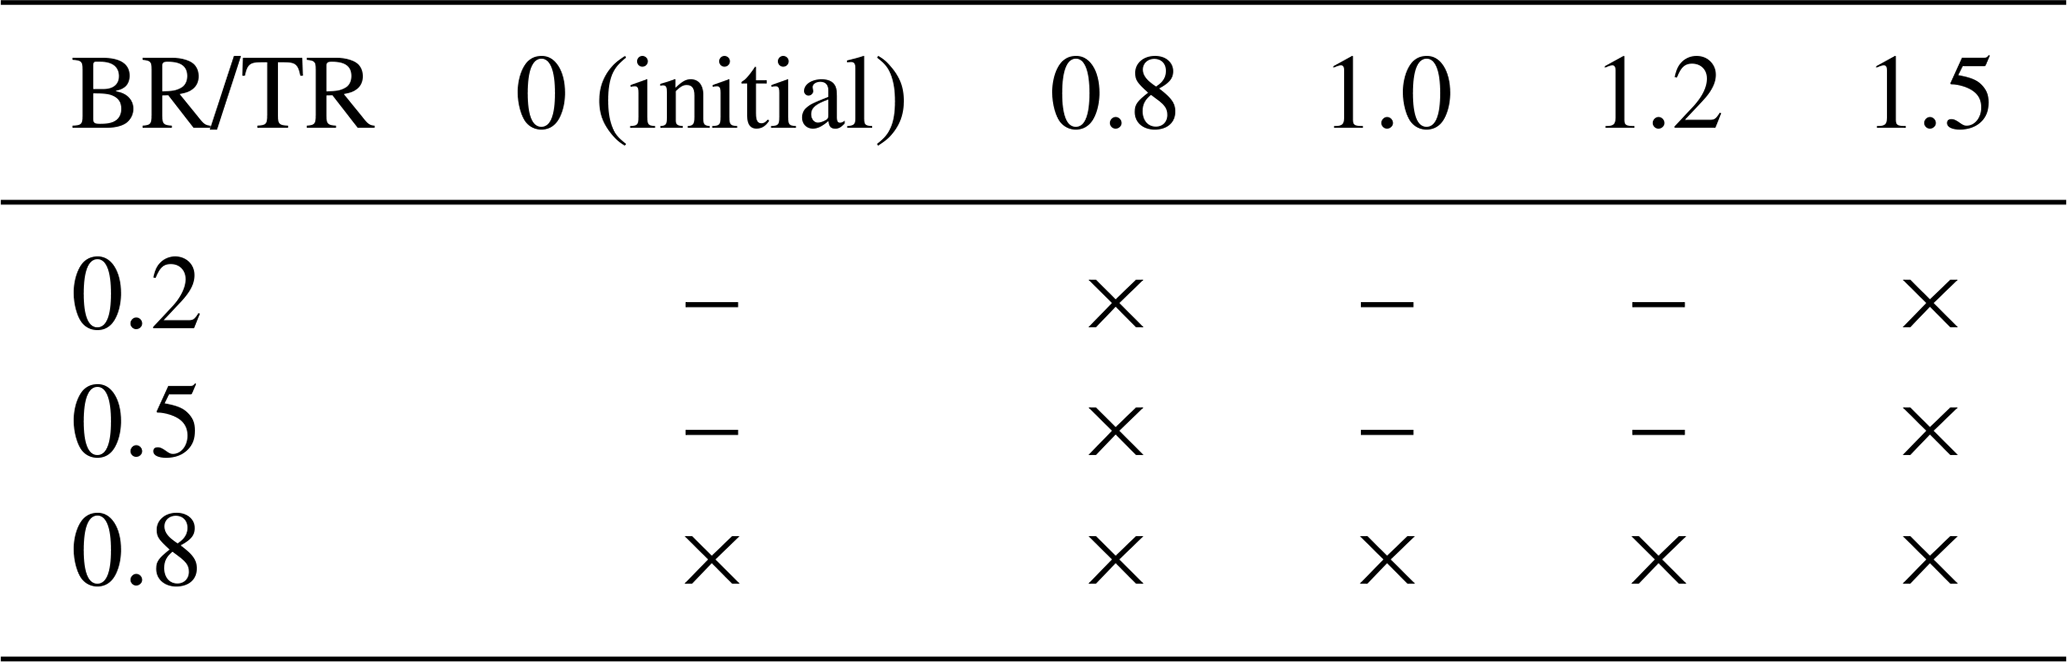
Different TRs cause a different number of culverts to be blocked during the simulation. A lower TR will increase the number of culverts for which blockage is triggered. This allowed to assess the impact of additionally triggered culverts. Therefore, in addition to the BR and TR scenarios listed in Table 2, some additional scenarios accounting for blockage mitigation measures by first responders have been modeled. These scenarios ensure that some culverts cannot be blocked during the flood event (TR=∞), which in practice corresponds to the fire department or other first responders actively removing floating debris and small logjam bodies from the culvert inlets. These scenarios are based on the analysis of the scenarios in Table 2 and will be explained in more detail in Sect. 3.5.
3.1 Influence of Missing Culverts in Data Set from Authorities
An initial model comparison is conducted to highlight the significance of incorporating all culverts within the study area. To this end, simulations were conducted for all rainfall return periods using two configurations: one that includes only the culverts listed by the authorities, and another that incorporates all identified culverts. The results revealed increased peak discharges from 5 % to 9 % at the outlet, when all culverts were included. This underscores the importance of obtaining refined culvert data sets and shows the missing data gap in infrastructure records. For a more in-depth analysis of the flood hydrographs with the two different culvert data sets, the reader is referred to Appendix B.
3.2 Impact of Blockage Scenarios on Outlet Hydrograph
The impact of culvert blockages on hydrographs at the outlet of the study area is first assessed. A blocked culvert increases water levels upstream due to restricted flow, which can lead to expanded upstream inundation areas and temporary water retention. Consequently, blocked culverts are expected to reduce the discharge at the catchment outlet. However, the extent of discharge reduction depends on several factors:
-
Upstream topography: In steep terrain, the potential storage volume gained from increased water depth is limited compared to flat terrain, where broader inundation areas can develop.
-
Crest height of topographic obstacle: Culverts typically cut through embankments or artificial barriers such as roads, railways, dams or levees. The higher the crest elevation of such structures, the greater the upstream retention potential. Once overtopping occurs, the retention effect diminishes as water is redirected downstream via the overtopped path.
-
Blockage ratio BR: Higher blockage ratios correspond to more severe flow constrictions, leading to greater energy loss at the culvert inlet. This results in higher upstream water levels and, consequently, greater retention potential.
-
Timing of triggered blockage: The onset of a blockage has an immediate impact on upstream water levels. The timing is controlled by the trigger ratio (TR), where higher TR values delay the onset of blockage. Lower TR values may trigger blockage too early for a retention effect at the peak discharge, whereas higher TR values may not trigger blockage at all.
Table 3Peak discharge (Max. Q) and relative difference (Rel. Diff.) for various trigger ratio (TR) scenarios and constant blockage ratio (BR=0.8).
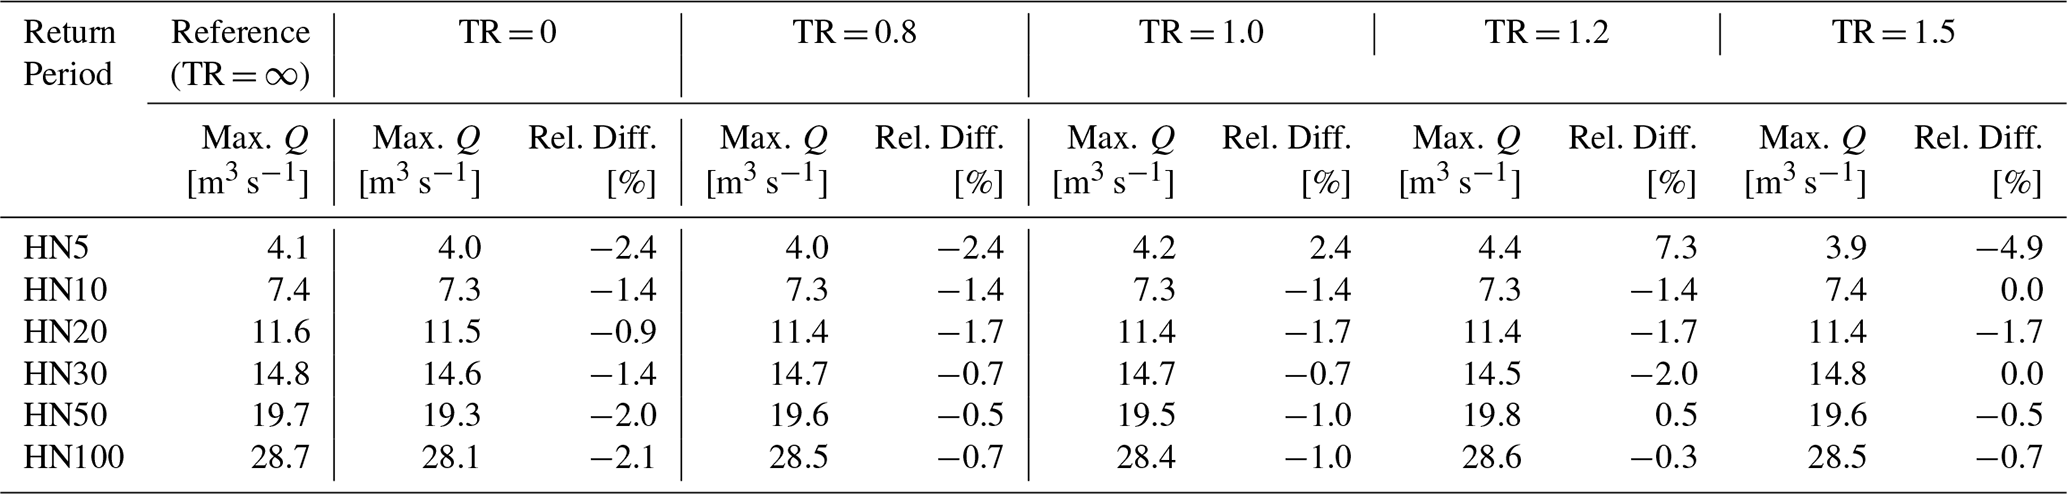
Table 3 presents the peak discharges for scenarios with varying trigger ratios TR and blockage ratio BR=0.8 after triggered blockage across different return periods. The relative differences in peak discharge compared to the corresponding reference scenarios are also provided. For return periods greater than HN5, the observed reduction in peak discharge remains below 2 %, indicating that the influence of culvert blockages is limited at the catchment outlet. The small differences in peak discharge can therefore be attributed to both minor changes in flood dynamics resulting from differences in the propagation and superposition of flood waves from subcatchments due to different trigger timings of culvert blockages, and to general model uncertainties. These findings are consistent with those reported by Ah-Woane et al. (2025).
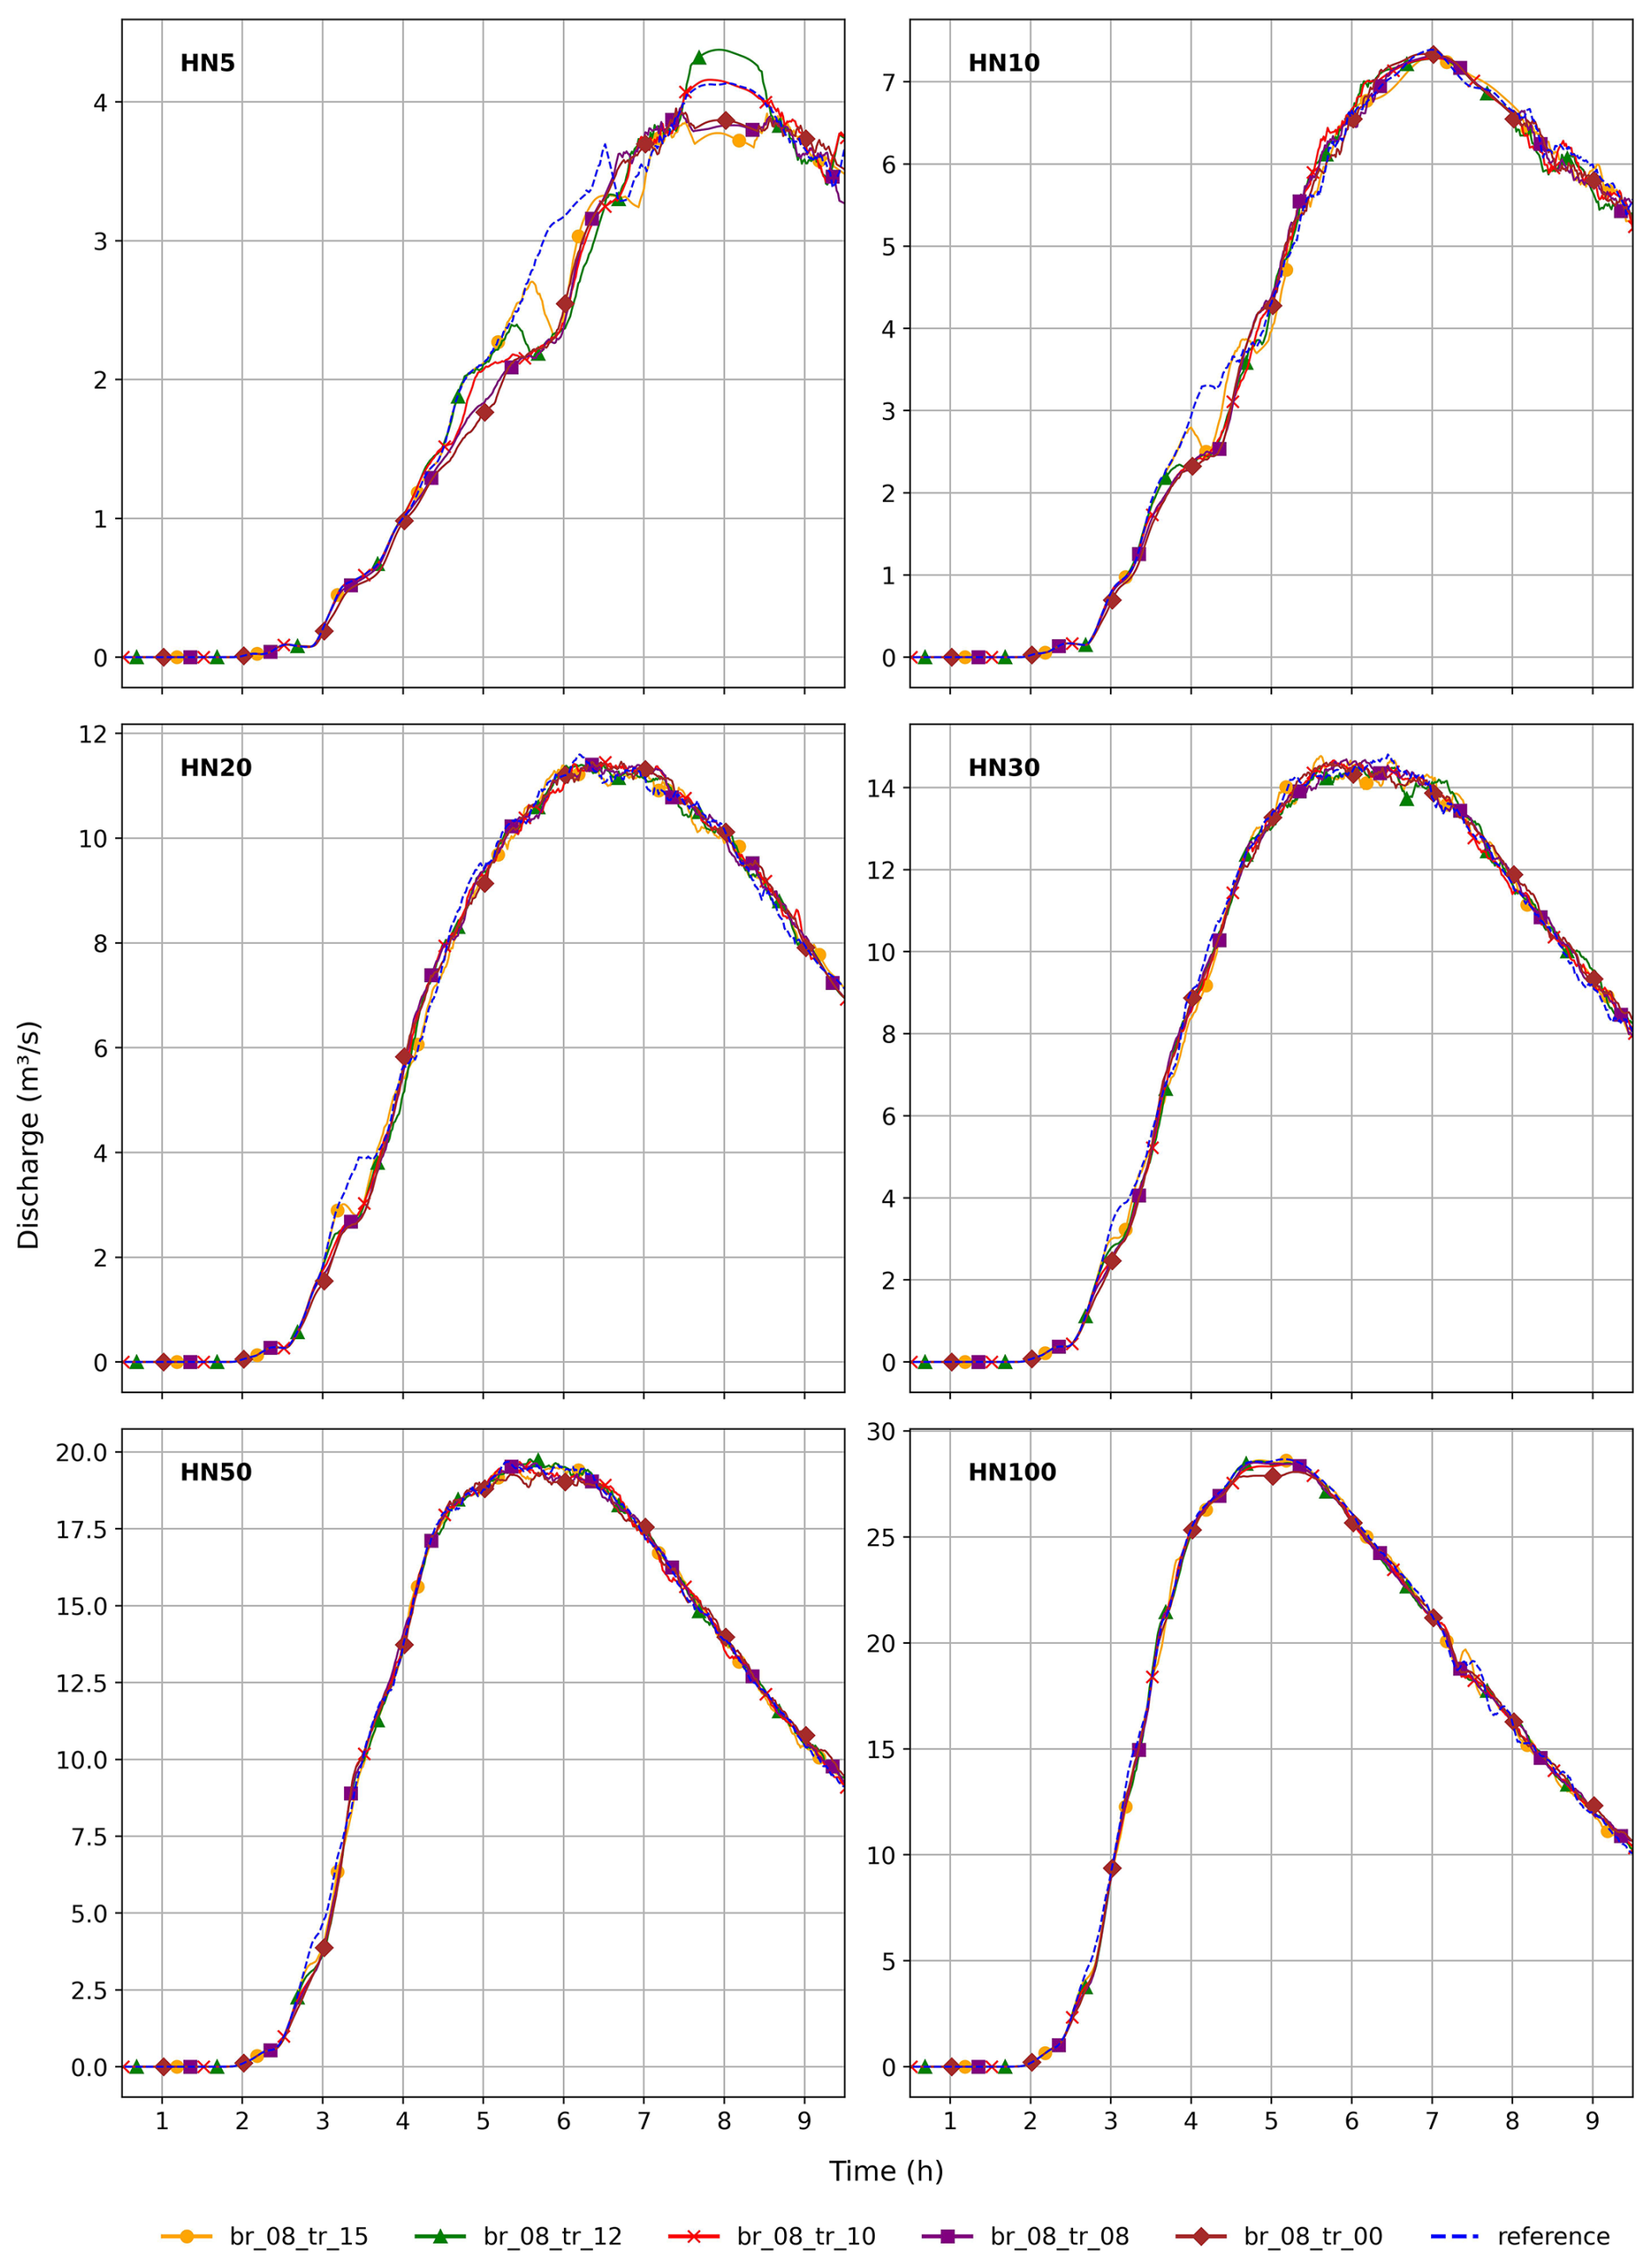
Figure 5Outlet hydrographs for the different precipitation return periods and different TRs for BR=0.8.
Figure 5 provides a detailed comparison of outlet hydrographs across all return periods by juxtaposing the reference scenario with blockage scenarios featuring different trigger ratios TR. For all return periods except HN5, the hydrographs exhibit only minor deviations between the reference and blockage scenarios. The most noticeable differences occur in the ascending limb of the hydrographs, specifically within the discharge range of approximately Q=2 to 4 m3 s−1. In this range, all blockage scenarios demonstrate a slight reduction in discharge relative to the reference. Although this effect is less visually prominent for higher return periods – primarily due to the scale of the y-axis – it remains present. The observed discharge reduction can be attributed to a single culvert blockage that increases the water depth upstream of the inlet, subsequently activating an adjacent floodplain and reducing downstream flow. Notably, the scenario with TR=1.5 shows a delayed onset of this retention effect compared to scenarios with lower TR values, which is expected since blockage is only triggered once a higher water depth-to-culvert diameter ratio is reached.
Although these blockage-induced effects have limited influence on the peak discharge at the outlet, they suggest a potentially more substantial impact on flow dynamics within individual subcatchments. Consequently, hydrographs at selected cross-sections throughout the study area are analyzed in the following section to assess the localized effects of culvert blockages on flood behavior.
3.3 In-Depth Analysis of Hydrographs at Selected Cross-Section
Hydrographs at six cross-sections distributed throughout the catchment (see Fig. 1) were analyzed to assess the local impact of culvert blockages. A detailed figure for each cross-section as well as a brief description can be found in Appendix C, Figs. C1 through C6.
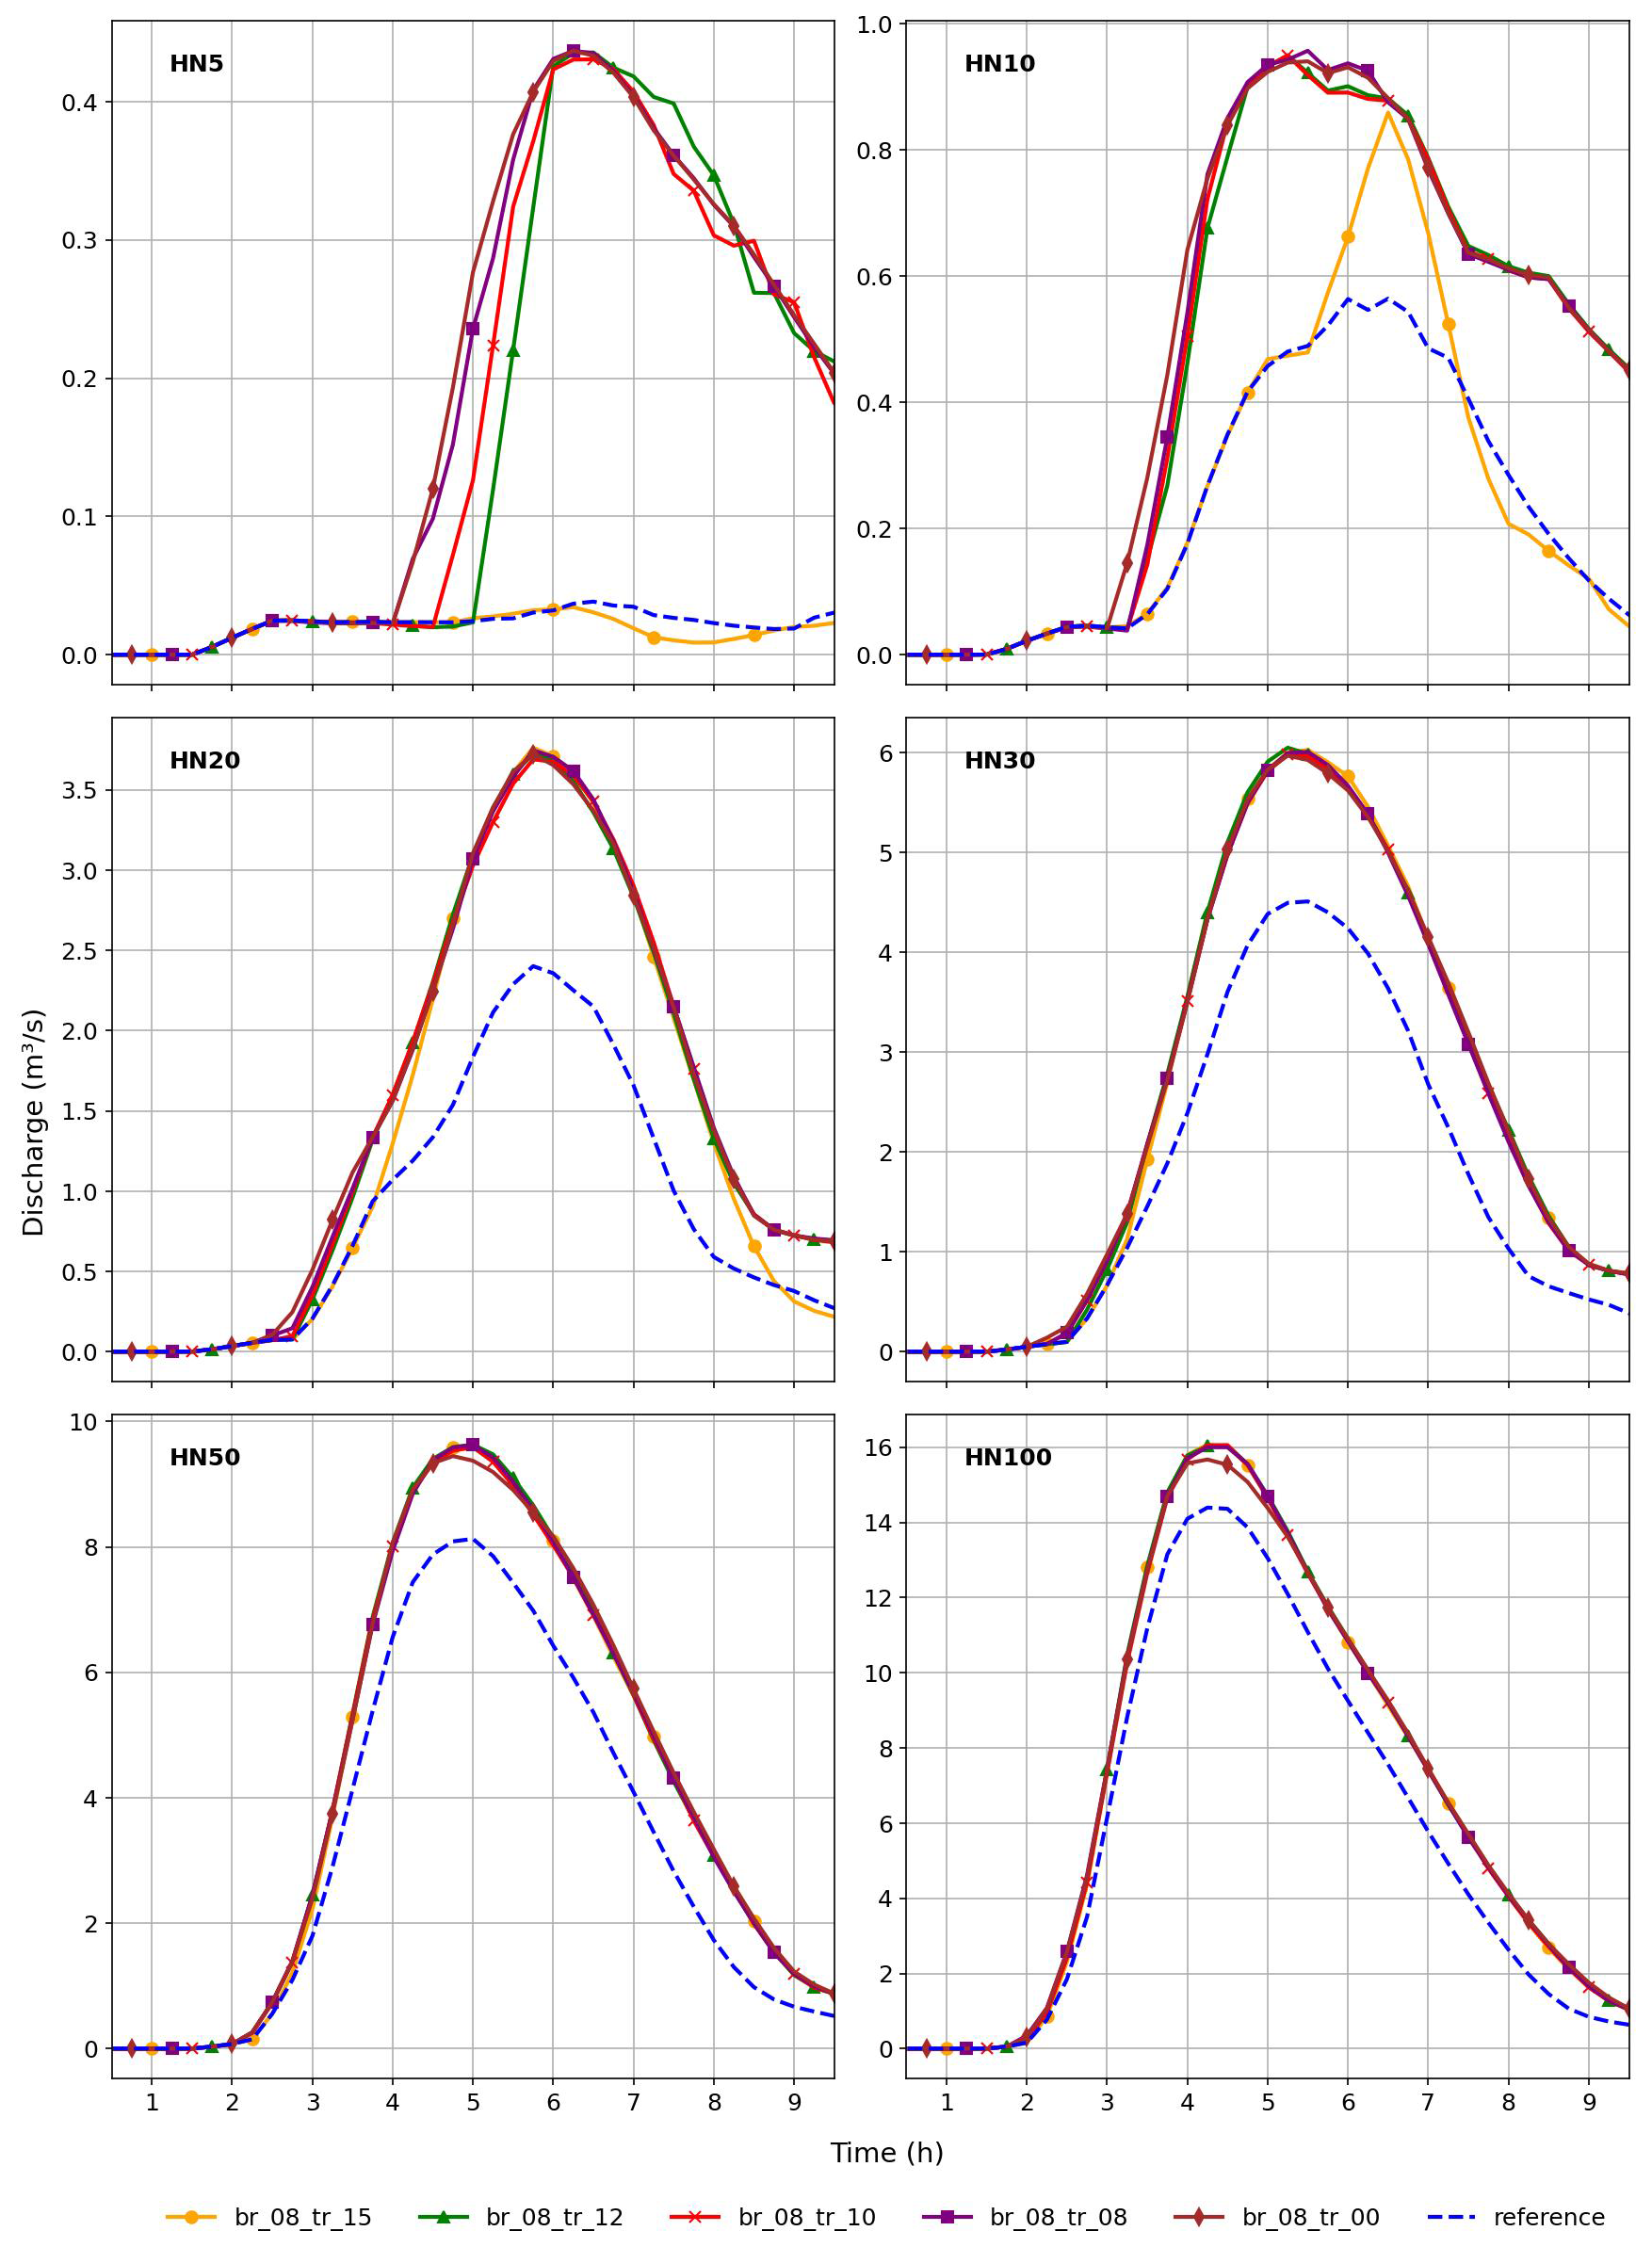
Figure 6Hydrographs at cross-section 2 for the different precipitation return periods and different TRs for BR=0.8.
Cross-section 2 warrants special attention, as it spans across the main street within the municipality of Reichenberg, where both the Reichenberger Bach and Guttenberger Bach are conveyed through an underground section. When the capacity of the culverts of the underground section is exceeded, flooding occurs in Reichenberg, and discharge is present at the street at cross-section 2. Cross-section 2, therefore, does not capture the flow that is conveyed through the culverts beneath the municipality of Reichenberg, but only captures flow from excess surface flooding along the main street of Reichenberg. Given its relevance for the urban flood risk in Reichenberg, cross-section 2 is discussed in more detail in this section. Figure 6 presents the hydrographs for all return periods across different blockage scenarios at this critical location.
-
HN5:
The HN5 event clearly illustrates how the triggered blockage of a critical culvert upstream of Reichenberg leads to significantly increased surface flooding within the municipality. In the initially blocked scenario, a sharp increase in discharge at cross-section 2 occurs at approximately t=4 h closely followed by the TR=0.8 scenario, which shows that the blockage with TR=0.8 introduces only a slight delay. The TR=1.0 scenario exhibits a similar sharp increase at t=4.5 h, and the TR=1.2 scenario follows at t=5 h. Notably, the TR=1.5 scenario does not experience this rapid rise, resulting in considerably lower flooding, comparable to the reference scenario. In total, eight culverts experience triggered blockage in the TR=1.2 scenario, compared to six in the TR=1.5 scenario. One of the additionally blocked culverts in the TR=1.2 scenario is located just upstream of cross-section 3. Once blocked, excess water unable to pass through this culvert is diverted directly through the urban area of Reichenberg. This identifies the culvert as a hydraulically critical structure with direct influence on cross-section 2 and, by extension, makes the difference between flooding and no flooding in Reichenberg for small return periods. -
HN10:
During the HN10 event, culverts upstream of Reichenberg are already overloaded in the reference scenario, resulting in increased urban discharge even without explicit blockage. In the blockage scenarios (TR=0, TR=0.8, TR=1.0, and TR=1.2), the critical culvert upstream of cross-section 3 becomes blocked between t=3 h and t=3.5 h, causing a substantial increase in discharge. In contrast, the TR=1.5 scenario does not trigger a blockage of this culvert until t=5.5 h, resulting in a delayed and slightly attenuated discharge response. Nonetheless, the peak discharge in the TR=1.5 scenario remains lower than in the other blockage scenarios, in which the peaks nearly double that of the reference scenario. -
HN20–HN100:
For the HN20 to HN100 events, the blockage scenarios produce nearly identical hydrographs. This convergence is due to the more simultaneous triggering of blockages in the most influential culverts. The relative difference between the blockage scenarios and the reference scenario decreases with an increasing return period, as culvert overloading becomes increasingly dominant even in the absence of explicit blockage.
Overall, the relative difference in peak discharge between the blockage scenarios and the reference scenario is more pronounced for lower return periods, provided that the blockage of critical culverts is triggered. This highlights the major influence that certain culverts can exert on flood dynamics, thus offering a valuable opportunity for targeted flood mitigation. Through detailed analysis of culvert blockage scenarios within flood models, it is possible to identify particularly crucial culverts whose continued function is essential during flood events. Preventive measures – such as debris clearance, structural reinforcements, or real-time monitoring – can then be prioritized for these culverts both prior to and during flood events. This approach will be further discussed in Sect. 3.5.
The timing of blockage initiation, governed by the trigger ratio (TR), is also a key factor. For lower return periods, culvert blockages may not be triggered at all, and the culverts remain fully operational. However, accurately determining the trigger point of blockage is inherently challenging, as it depends on multiple interrelated factors, including upstream water levels, the presence of debris or woody material, and complex local inflow dynamics. In this study, blockage has been modeled as an instantaneous event, a simplification adopted to avoid further complicating the simulation with dynamic or progressive blockage processes.
3.4 Impact of Blocked Culverts on Inundation
Culvert blockages can lead to increased inundation both upstream of the culvert inlet and downstream, particularly if the embankment or structure the culvert traverses (e.g., roads, railway embankments) is overtopped. Figure 7 illustrates the maximum water depths in Reichenberg for the HN5 event, once without modeled blockage (Fig. 7A), and once with modeled blockages applying BR=0.8 and TR=1.2 (Fig. 7B). Additionally, the absolute increase in maximum water depth due to blockage is highlighted (Fig. 7C).
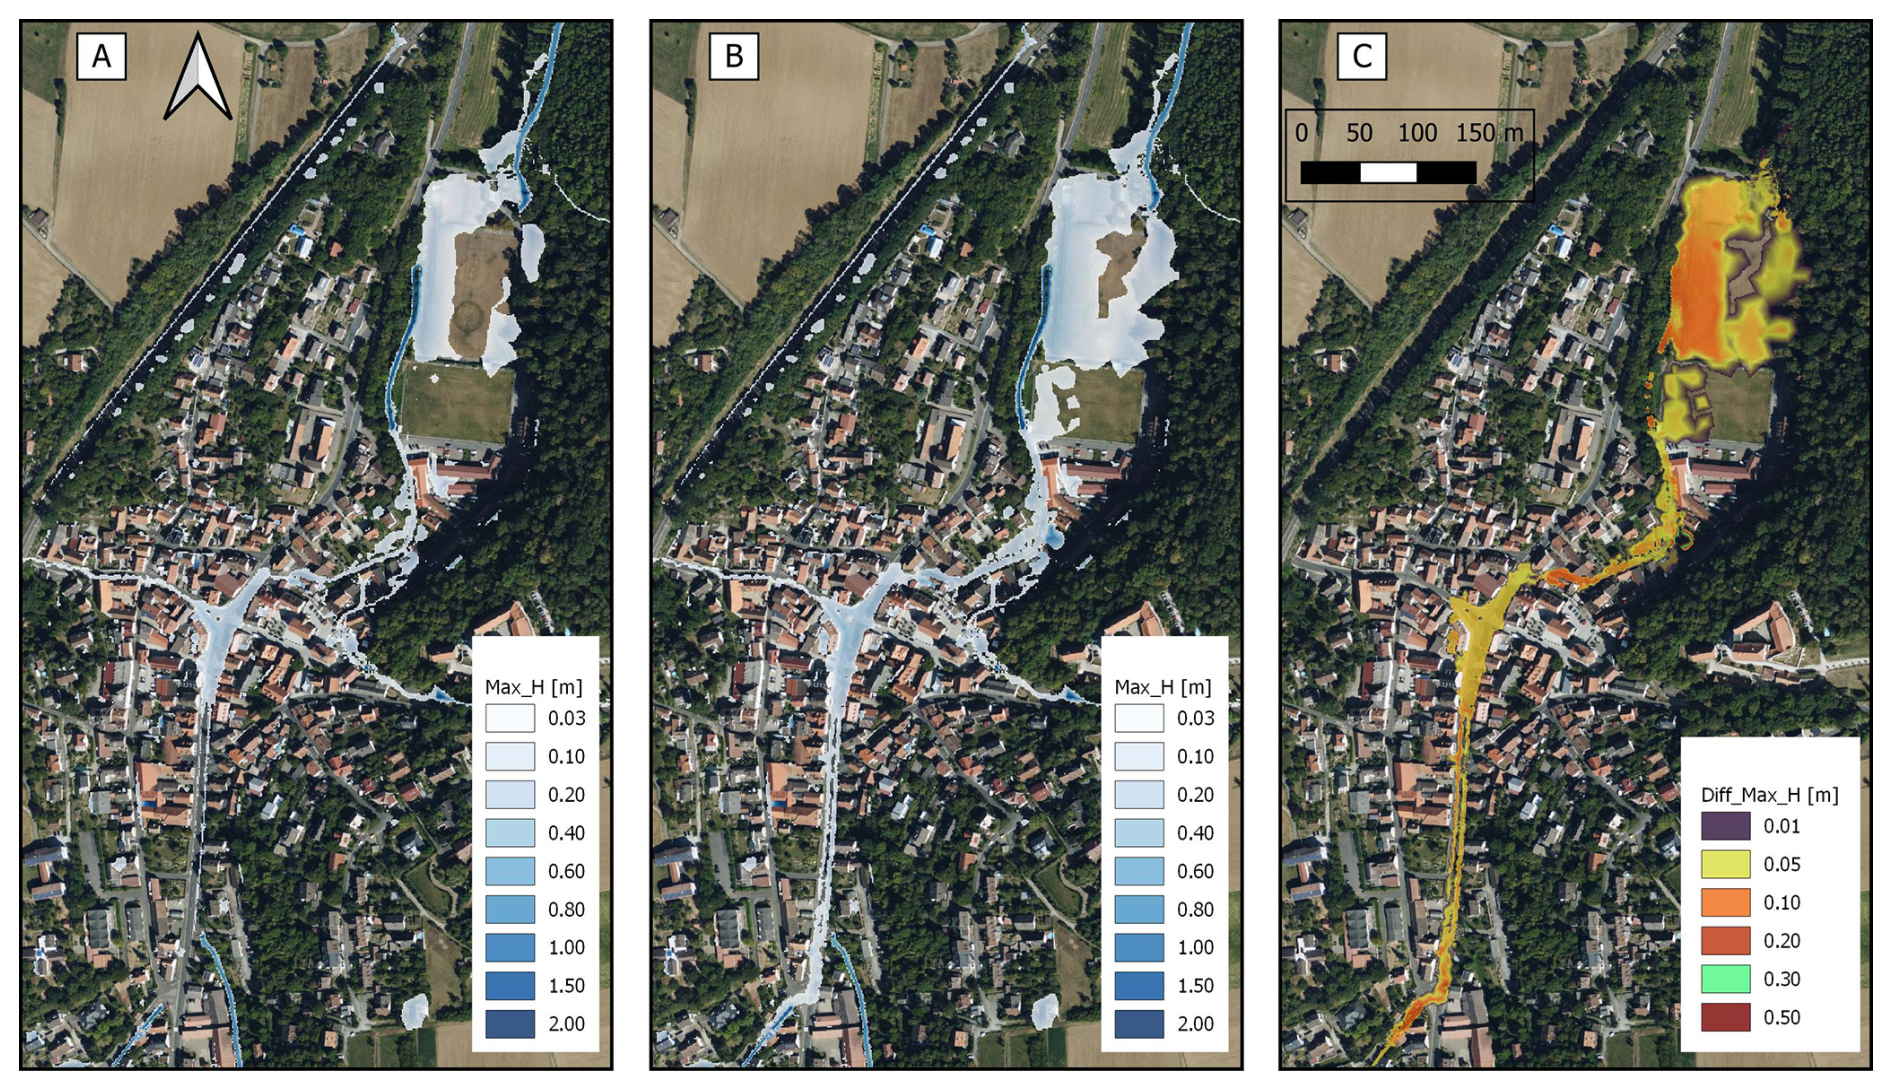
Figure 7(A) Maximum water depth (MaxH) for an HN5 event without simulated blockage. (B) Maximum water depth for an HN5 event with a blockage scenario applying BR=0.8 and TR=1.2. (C) Difference in maximum water depth between the HN5 event with modeled blockage and without blockage. Basemaps: Bing Maps © Microsoft Corporation and its data providers.
As the investigated catchment is steep, only minor differences can be noticed in the inundation extents from the maximum water depths. However, the difference in the maximum water depths illustrates that the increase in water depth is significant. To further stress this, the critical success index (CSI) is computed:
Where TP is the inundation area generated in both the reference and the blockage scenario, FP is the inundation area that is solely generated in the blockage scenario, and FN is the inundation area solely generated in the reference scenario. The CSI expresses whether flooding occurs in different areas in the reference and blockage scenarios. The lower the CSI, the larger the difference between the inundation areas in the reference and blockage scenarios.
As inundation is more hazardous in vulnerable urban areas than on undeveloped land, the CSI is also calculated isolating different land use categories, namely streets and combined residential and industrial (resind) areas. As higher water depths are also linked to greater damage in settled areas (Molinari et al., 2020; Wing et al., 2020), the CSI is calculated for inundated areas with water depths exceeding 3 and 30 cm. This emphasizes hazardous conditions.
Table 4Area with absolute inundation larger than 3 and 30 cm in streets and combined residential and industrial (resind) areas, as well as total inundation for the reference scenario. Furthermore, the calculated CSIs for the blockage scenario with BR=0.8 and TR=0.8 are displayed.
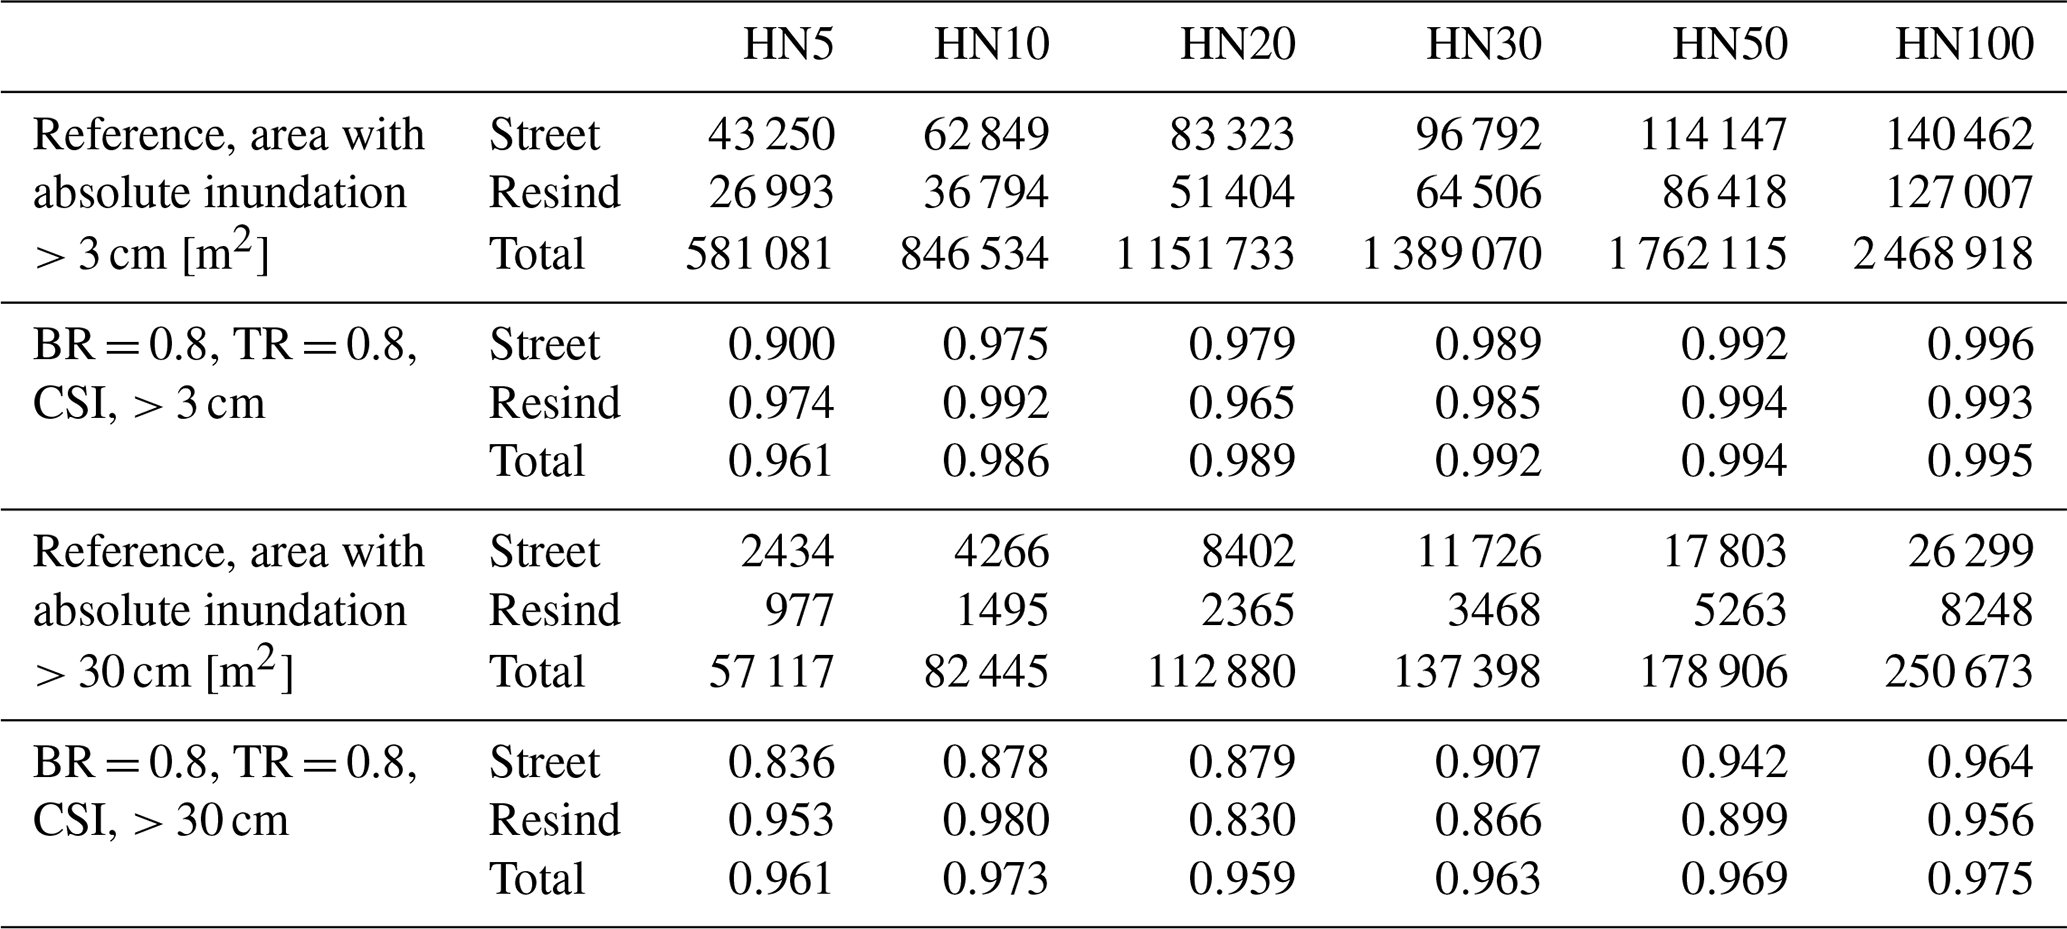
Table 4 displays the absolute inundation areas with water depths larger than 3 and 30 cm for the reference scenario and the different return periods. Furthermore, the calculated CSI values with the BR=0.8 and TR=0.8 blockage scenario are listed. In general, CSIs are very high, mostly exceeding 0.97, for water depths greater than 3 cm. For water depths greater than 30 cm, the CSI decreases, especially when looking at street and resind landuse.
Therefore, further analysis focuses on inundation with water depths greater than 30 cm in street and resind areas. Furthermore, the relative increase in the inundation area with water depths exceeding 30 cm is now assessed, as the CSI alone does not indicate whether inundation areas increase or decrease under blockage.
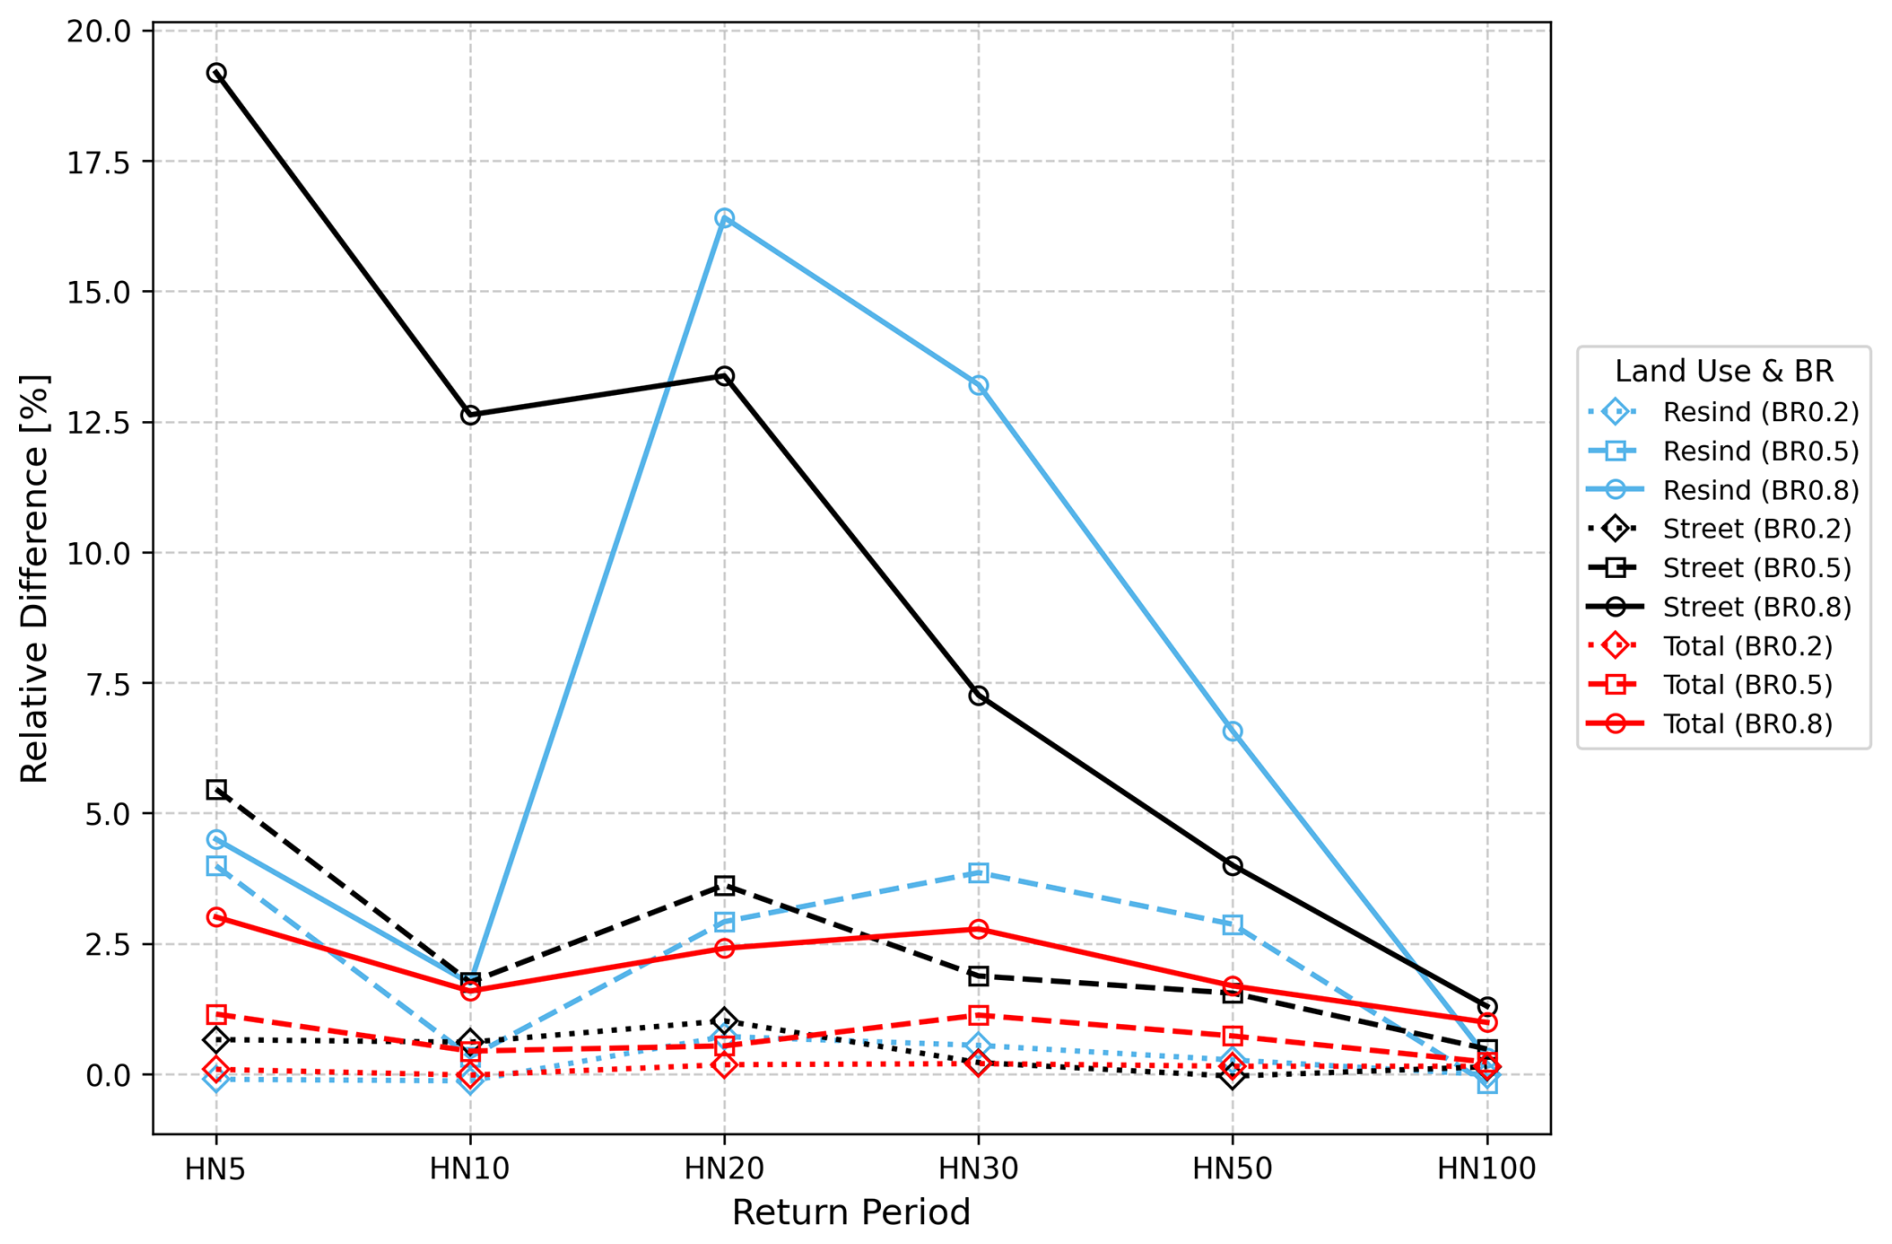
Figure 8Relative difference of inundation area with water depth greater than 30 cm between blockage scenarios with constant TR=0.8, but variable BR, and the reference scenarios across multiple return periods. The relative difference is given for the land uses, streets, and combined residential and industrial (resind) areas, as well as total inundation.
Figure 8 illustrates the relative differences in inundated area for the total domain and for the selected land use classes across multiple return periods. A smaller relative increase in inundation at a higher return period can yield a larger absolute increase in inundation than a larger relative increase at a lower return period, as absolute inundation areas increase with the return period. This concludes that the largest relative increase might not actually coincide with the largest absolute increase.
All presented blockage scenarios use a trigger ratio of TR=0.8 but vary the blockage ratio (BR=0.8, 0.5, and 0.2). Thus, the number of blocked culverts remains constant, while the severity of each blockage varies, affecting upstream water levels differently. The underlying data are provided in Appendix D, Table D1, but the absolute inundation areas from the reference scenarios are also in Table 4.
Scenarios with BR=0.8 produce the most substantial increases in inundation. While the total inundated area increases by only between 1 % and 3 %, the inundation increase in critical areas is considerably higher. Streets experience increases exceeding 10 % for the return periods lower than HN30, and resind areas show similar increases for HN20 and HN30. Notably, the additional relative increase in inundation in streets is highest for the HN5 event and then decreases steadily through HN100. In contrast, peak relative increase in inundation in resind areas occurs during the HN20 event and diminishes for higher return periods.
The BR=0.5 scenarios exhibit significantly lower impacts. Across all return periods, the total increase in inundated area remains below 1.2 %. The trends along the return periods are consistent with the BR=0.8 scenarios, though the maximum inundation increase in resind areas now occurs at HN5 rather than HN20. For HN100, inundation in these areas actually decreases minimally relative to the reference scenario.
In the BR=0.2 scenario, inundation increases are negligible. Total and land use-specific inundation changes remain below 1 %, with some scenarios even showing a very small reduction in inundated area.
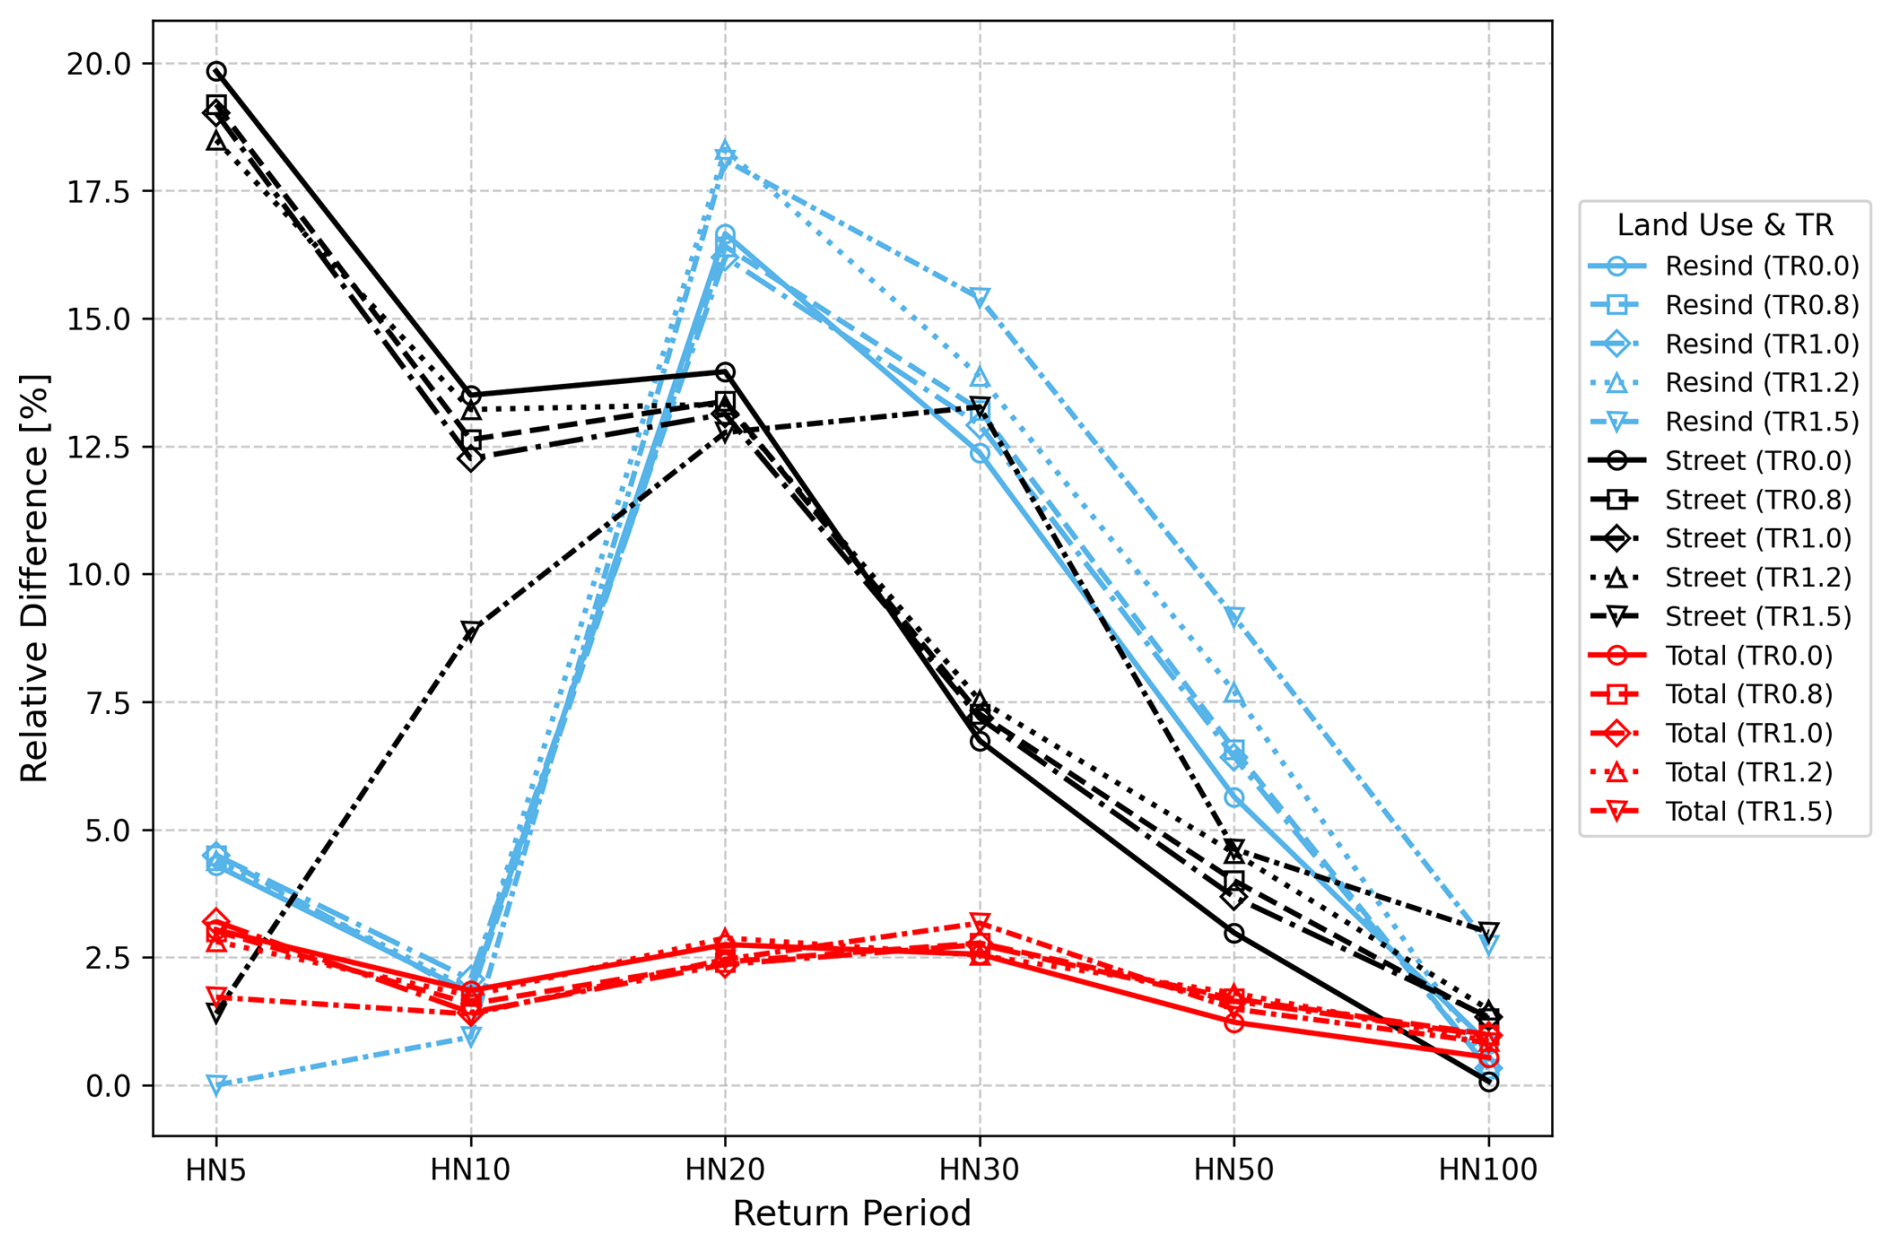
Figure 9Relative difference of inundation area with water depth greater than 30 cm between blockage scenarios with constant BR=0.8, but variable TR, and the reference scenarios across multiple return periods. The relative difference is given for the land uses, streets, and combined residential and industrial (resind) areas, as well as total inundation.
Figure 9 presents the relative inundation increase analysis for varying trigger ratios (TR=0.0, 0.8, 1.0, 1.2 and 1.5), while maintaining a constant blockage ratio of BR=0.8. Due to the varying trigger ratios, the number and timing of culvert blockages differ across scenarios. The underlying data are provided in Appendix D, Table D2.
For events with lower return periods, triggered blockages show larger increases in relative inundation. In the HN5 event, the inundation in streets increases by almost 20 %. However, defining a trigger ratio TR=1.5, there is only a low increase in inundation by 1.4 %. This indicates again that a critical culvert remains unblocked in this scenario, but is blocked in the other scenarios with lower TRs. In general, the relative increase in inundation in the streets decreases for higher return periods and becomes almost insignificant for the HN100. Only for the TR=1.5 scenario, the largest relative inundation increase is around the HN20 and HN30 event, indicating that the critical culvert has the largest impact for these return periods.
For resind areas, the largest relative increases in inundation are for the HN20 return period, pointing to a critical culvert getting blocked only for events larger than HN20. The relative increase in inundation in resind areas then decreases with higher return periods, once again being almost insignificant for the HN100 return period.
In general, the results indicate that at lower return periods, lower trigger ratios lead to greater relative increases in inundation. However, at higher return periods, higher trigger ratios result in a more pronounced effect, since the delayed blockage is closer to the overall flood peak. If the blockage is not triggered near the flood peak, the trigger point itself has little impact. The relative increases in inundation diminish for the HN50 and HN100, as culverts are already overwhelmed in the reference scenario, and the extent of flooding is large regardless of blockage timing.
3.5 Simulation of Mitigation Measure
The analyses in Sect. 3.3 and 3.4 enable the identification of critical culverts within the study area. By varying the trigger ratios and return periods, locations exhibiting abrupt increases in inundation can be detected. A comparison of scenarios with significant inundation increases against those with minimal changes reveals a set of culverts that are potential drivers of the observed differences. Culverts that are part of this candidate group but located further away from the affected areas are less likely to be critical. To further narrow down the set of critical culverts, discharge through cross-sections near regions of increased inundation is analyzed. The timing of culvert blockages is extracted from the simulation data. If a distinct change in discharge is observed in the vicinity of a culvert shortly after its blockage, a direct influence on local flow conditions can be inferred. Complementary to this, a visual assessment of the spatiotemporal inundation patterns supports the identification of culverts that critically affect flood dynamics.
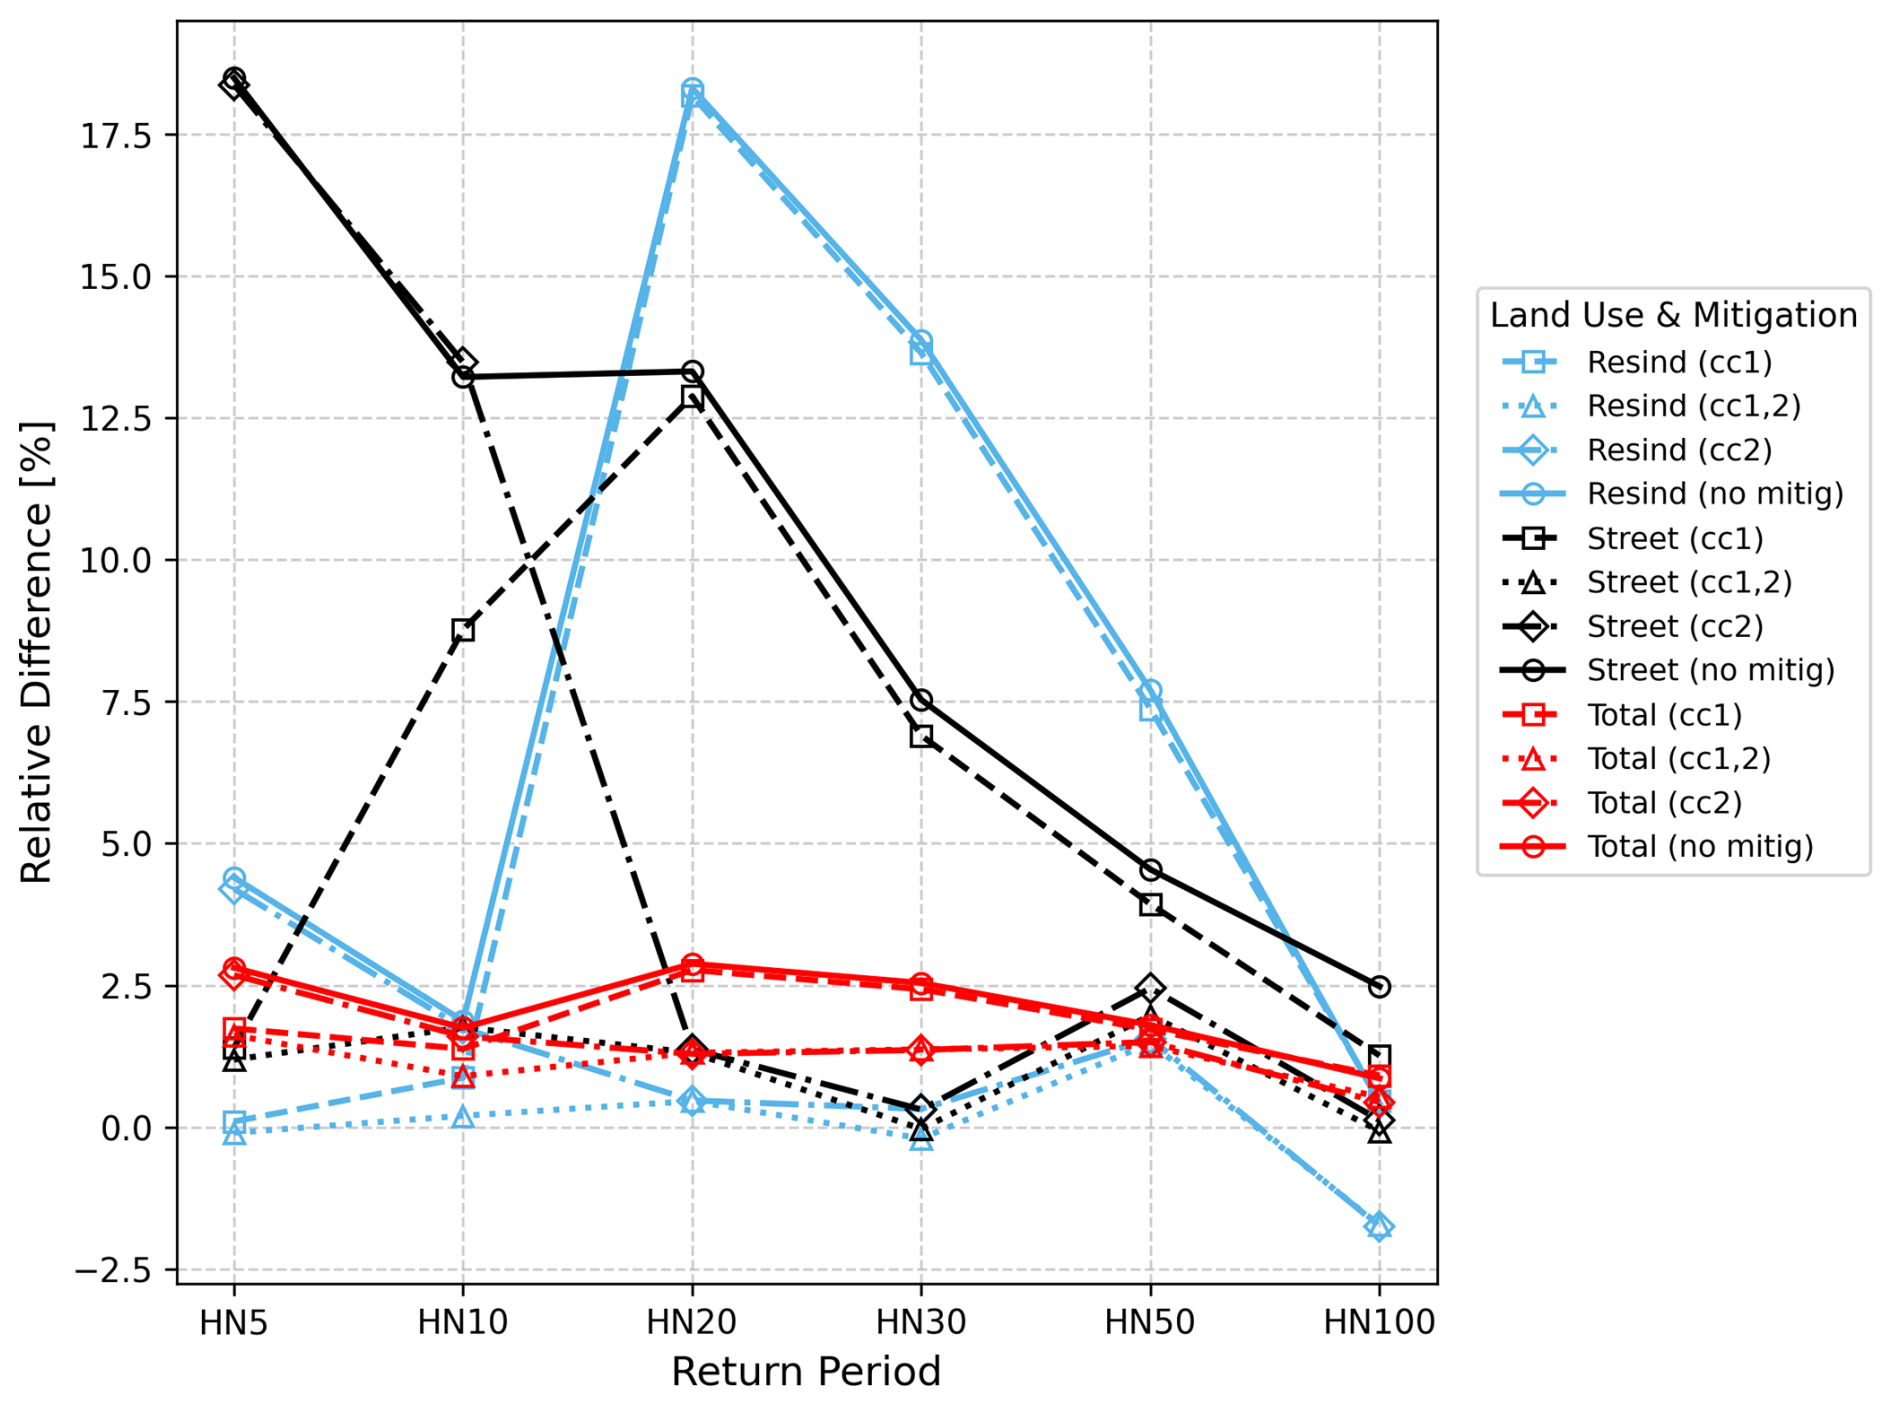
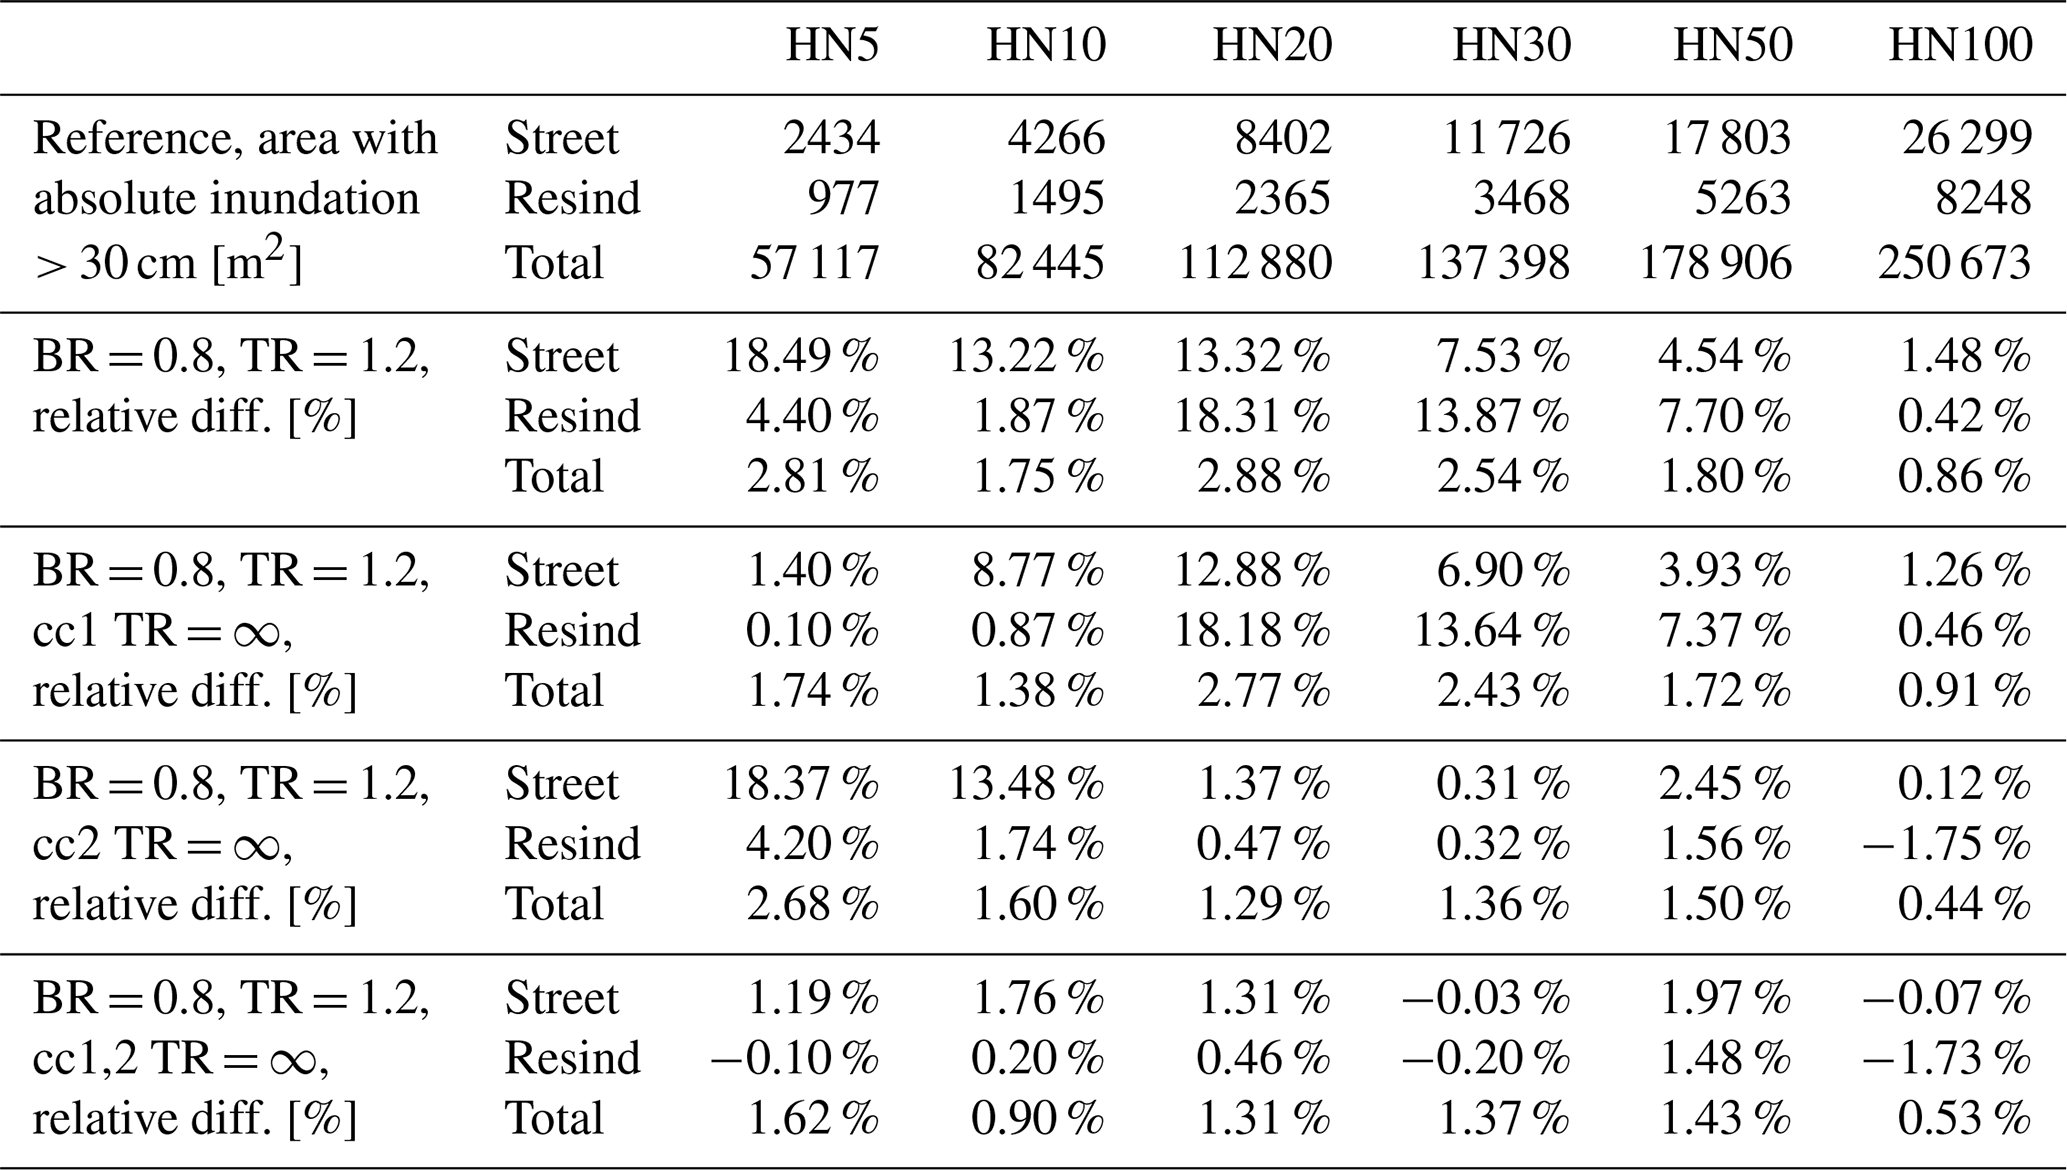
Figure 10Relative difference of inundation area with water depth greater than 30 cm between blockage scenarios and the reference scenarios across multiple return periods. These blockage scenarios share the same blockage ratios BR=0.8 and trigger ratios TR=1.2, except for the scenarios in which installed mitigation measures are simulated at the critical culverts 1 (cc1), 2 (cc2) or both (cc1,2) by applying TR=∞. The relative difference is given for the land uses streets and combined residential and industrial (resind) areas, as well as total inundation.
Based on these analyses and using Fig. 6 and the previously described method, two critical culverts within the study area were identified (see Fig. 1). To further assess their influence on inundation dynamics, three additional scenarios were defined in which one (cc1 or cc2) or both (cc1,2) of these culverts were exempted from blockage by assigning them an infinite trigger ratio (TR=∞). This configuration represents the implementation of a mitigation measure during the flood event, such as the manual removal of debris by emergency services. For all other culverts, a trigger ratio of TR=1.2 and a blockage ratio of BR=0.8 were applied. Figure 10 compares the relative differences of inundation extents from these simulated mitigation scenarios with those of the corresponding baseline scenarios lacking such interventions (“no mitig”). The underlying data of Fig. 10 is provided in Appendix D, Table D3
In the HN5 event, the simulated mitigation measure at critical culvert 1 (cc1) nearly eliminates the increased inundation observed in streets (from 18.49 % to 1.40 %) and residential areas (from 4.40 % to 0.10 %). In contrast, preventing blockage at critical culvert 2 alone (cc2) has a negligible impact. The combined mitigation of both culverts (cc1,2) yields only a marginal improvement over solely prohibiting blockage at culvert 1, indicating that blocked culvert 1 is the dominant contributor to inundation in the HN5 event, and a blockage mitigation measure here is most effective, whereas culvert 2 exhibits limited sensitivity to the inundation dynamics.
For the HN10 event, prohibiting blockage at culvert 1 reduces the inundation increase in streets to 8.77 %. Interestingly, preventing blockage only at culvert 2 slightly increases the inundation in streets from 13.22 % to 13.48 %, yet by an almost negligible margin. However, when blockage is prohibited at both culverts, the inundation increase drops significantly to 1.76 %, indicating that both culverts are hydraulically influential during this event, despite culvert 2 having no mitigating effect when considered in isolation.
At higher return periods (HN20 to HN100), culvert 2 emerges as the more critical structure. While mitigation at culvert 1 alone results in only minor improvements, preventing blockage at culvert 2 consistently leads to substantial reductions in inundation extent across these scenarios.
These findings highlight the importance of targeted mitigation strategies focused on hydraulically critical culverts. However, the criticality of individual culverts is not constant across return periods. A culvert may play a negligible role during low-magnitude events but become a key factor in mitigating flooding under more extreme conditions. Hydrodynamic modeling of different culvert blockage scenarios is, therefore, a valuable tool to identify critical culverts and to design effective mitigation measures against increased inundation due to blockage.
3.6 Limitations
The primary limitation of this study lies in the inability to robustly validate the hydrodynamic model and the subsequent findings of the blockage modeling. A plausibility check was conducted using photographs from a reference flood event and a water mask derived from a field campaign. It is true that hydrodynamic models for short-duration, high-intensity precipitation events are rarely amenable to full calibration. Yet, as demonstrated by Apel et al. (2008), they offer valuable insights into flood dynamics and can be used advantageously for supporting the planning of mitigation strategies, including in the context of blocked culverts (Fallowfield and Motta, 2024). Research specifically addressing culvert blockages during flood events remains limited, as the majority of studies focus on debris accumulation at bridges, probably also due to better data availability. Well aware of the described limitations, the present study employs a state-of-the-art culvert blockage model (Ollett et al., 2017) and yields robust findings by simulating a wide range of precipitation and blockage scenarios.
Within the blockage modeling, the main factor of uncertainty stems from the timing and degree of culvert blockage. This study has assumed instantaneous blockage rather than gradual accumulation. While continuous blockage functions were implemented into the model, the associated increase in parameter complexity led to a focus on scenario-based analysis with varying trigger and blockage ratios only. To the authors' knowledge, gradual culvert blockages have not yet been thoroughly investigated in the literature. The only comparable study found, by Ah-Woane et al. (2025), also adopts an instantaneous blockage approach, triggered by global maximum flood parameters. Statistical approaches to describe the timing and degree of culvert blockage could be assessed in laboratory experiments. However, these parameters will always strongly depend on the availability of debris in the catchment, which can vary temporally.
The omission of flow type 1 for culvert modeling in TELEMAC-2D introduces slight uncertainties in the modeling framework. Representing flow type 1 in this study area might lead to delayed blockage at some culverts due to lower water depths under supercritical conditions. However, flow type 1 would mainly occur during low discharges at these culverts and would not affect flood peaks or peak inundation. Furthermore, the main focus of this study was on comparing the effects of different culvert blockages and showing their local significance, not on reporting absolute effects of culvert blockages. For this, a rigorous model validation would have been required, which is still ongoing research for culvert modeling (Oberauer et al., 2026; Fernández-Pato et al., 2020).
The culvert modeling could also be improved by representing the culverts in a 1D drainage model that is then tightly coupled to the 2D surface model. This can enhance culvert modeling results by accurately representing time lags from the inlet to the outlet, incorporating changes in geometry within the culvert, and enabling modeling of culvert bifurcations. While a coupling of drainage models with TELEMAC-2D is currently under development for vertical orifices and drains (Lapillone et al., 2025), the culverts in the present studies are horizontal drains, which further complicates the coupling, as more flow states have to be represented and implemented (Smolders et al., 2016) in comparison to vertical orifices. Furthermore, the improvement of the results is expected to be rather small with regard to changes in geometry within the culvert and bifurcations, as most culverts in the study area are straight, circular or rectangular pipes. The more accurate time lags from a drainage coupling are expected to primarily affect the timing of inundation, rather than the overall extent.
The degree of inundation increase caused by culvert blockage, as identified in this study, is inherently catchment-specific. Variations in topography, land use, and hydraulic infrastructure strongly influence the sensitivity and impact of blocked culverts, particularly in vulnerable areas. Nevertheless, this study demonstrates the necessity of explicitly representing all culverts in a catchment for accurate flood modeling. It shows that the blockage of individual critical culverts can substantially increase inundation and, consequently, damage potential. Furthermore, it highlights that scenario-based analyses, accounting for multiple return periods and blockage parameters, enable the identification of critical culverts and the design of effective mitigation strategies.
This work exclusively focuses on culverts and does not examine the impact of blocked bridges. Although numerous bridges are present in the study area, their influence on inundation is generally limited by their structural geometry: backwater effects tend to be constrained by the thickness of the bridge decks. Only dense and voluminous blockage formations, exceeding the bridge height, could result in significant upstream inundation. As such, the contribution of bridge blockages to inundation in this context is expected to be minor.
Administrations in Germany are currently developing nationwide flash flood hazard maps based on heavy rainfall scenarios (Wimmer et al., 2023). In addition to the HN100 event, these maps include an extreme design storm characterized by 100 mm of precipitation within 1 h (Wimmer and Hovenbitzer, 2025). The precipitation intensities considered in the present study are substantially lower. The HN100 event exhibits a peak intensity of 45 mm within 1 h (see Table 1). Nevertheless, already for the HN50 and HN100 events, the influence of culvert blockages on inundation extent decreases (see Fig. 9). Consequently, events with higher precipitation intensities or volumes were not examined, as the impact of culvert blockages is expected to diminish further for increasingly extreme events.
Finally, one of the most severe hazards associated with culvert blockages is the potential failure of the culvert structure itself, leading to the erosion of the topographic dam. This can result in the abrupt release of impounded water, combined with sediment and debris, potentially triggering catastrophic downstream impacts. Modeling such dam-break processes would introduce additional parameters, sensitivities, and uncertainties, and was therefore excluded from this study. However, given the severity of this hazard, this study strongly recommends limiting the risk of this catastrophic culvert failure by avoiding culvert blockages. Even though the effects of blocked culverts are small on a catchment scale in this study, a blocked culvert that facilitates a structural failure can immediately trigger catastrophic impacts on a catchment scale. Debris and other potentially obstructive materials in front of culverts should, therefore, be removed promptly to ensure culvert functionality.
This study has illustrated the impacts of culvert blockages in flash flood modeling in steep catchments with urbanized areas. The results show that certain culverts can impact local flood dynamics, while global impacts remain small, underlining the need to recognize and prioritize these critical structures. By applying a scenario-based modeling approach with varying degrees and timings of culvert blockage, this study provides a solid framework for identifying critical culverts and evaluating the effectiveness of targeted mitigation strategies, given that blockage information is simply not available. The methods and analyses developed for this study can be directly implemented in other study areas and also for larger catchments, even though the effects of culvert blockage will most likely not impact larger rivers. The results of these analyses can be directly provided to emergency planning and flood risk management, particularly first responders. Consequently, accounting for culvert blockages should become an integral part of flash flood modeling and hazard assessment.
Future research should further investigate the processes driving culvert blockage formation. Laboratory experiments can provide insight into blockage mechanisms and thresholds, which could then be translated into dynamic numerical models. Moreover, there remains a significant gap in the availability and accuracy of field data, not only concerning blockage occurrence during flash flood events but also regarding the geometric detail and spatial accuracy of culvert infrastructure. Additionally, spatially distributed gauges throughout catchments and within drainage infrastructure are necessary to improve model benchmarking for culvert blockages. Bridging this data gap is essential for improving model reliability and enhancing risk-informed flood management practices.
Table A1Summary of culvert characteristics and hydraulic parameters. The columns are in the following order: culvert ids, culvert width or diameter, culvert height, culvert length, elevation of inlet, elevation of outlet, slope of culvert, circular shape of culvert.
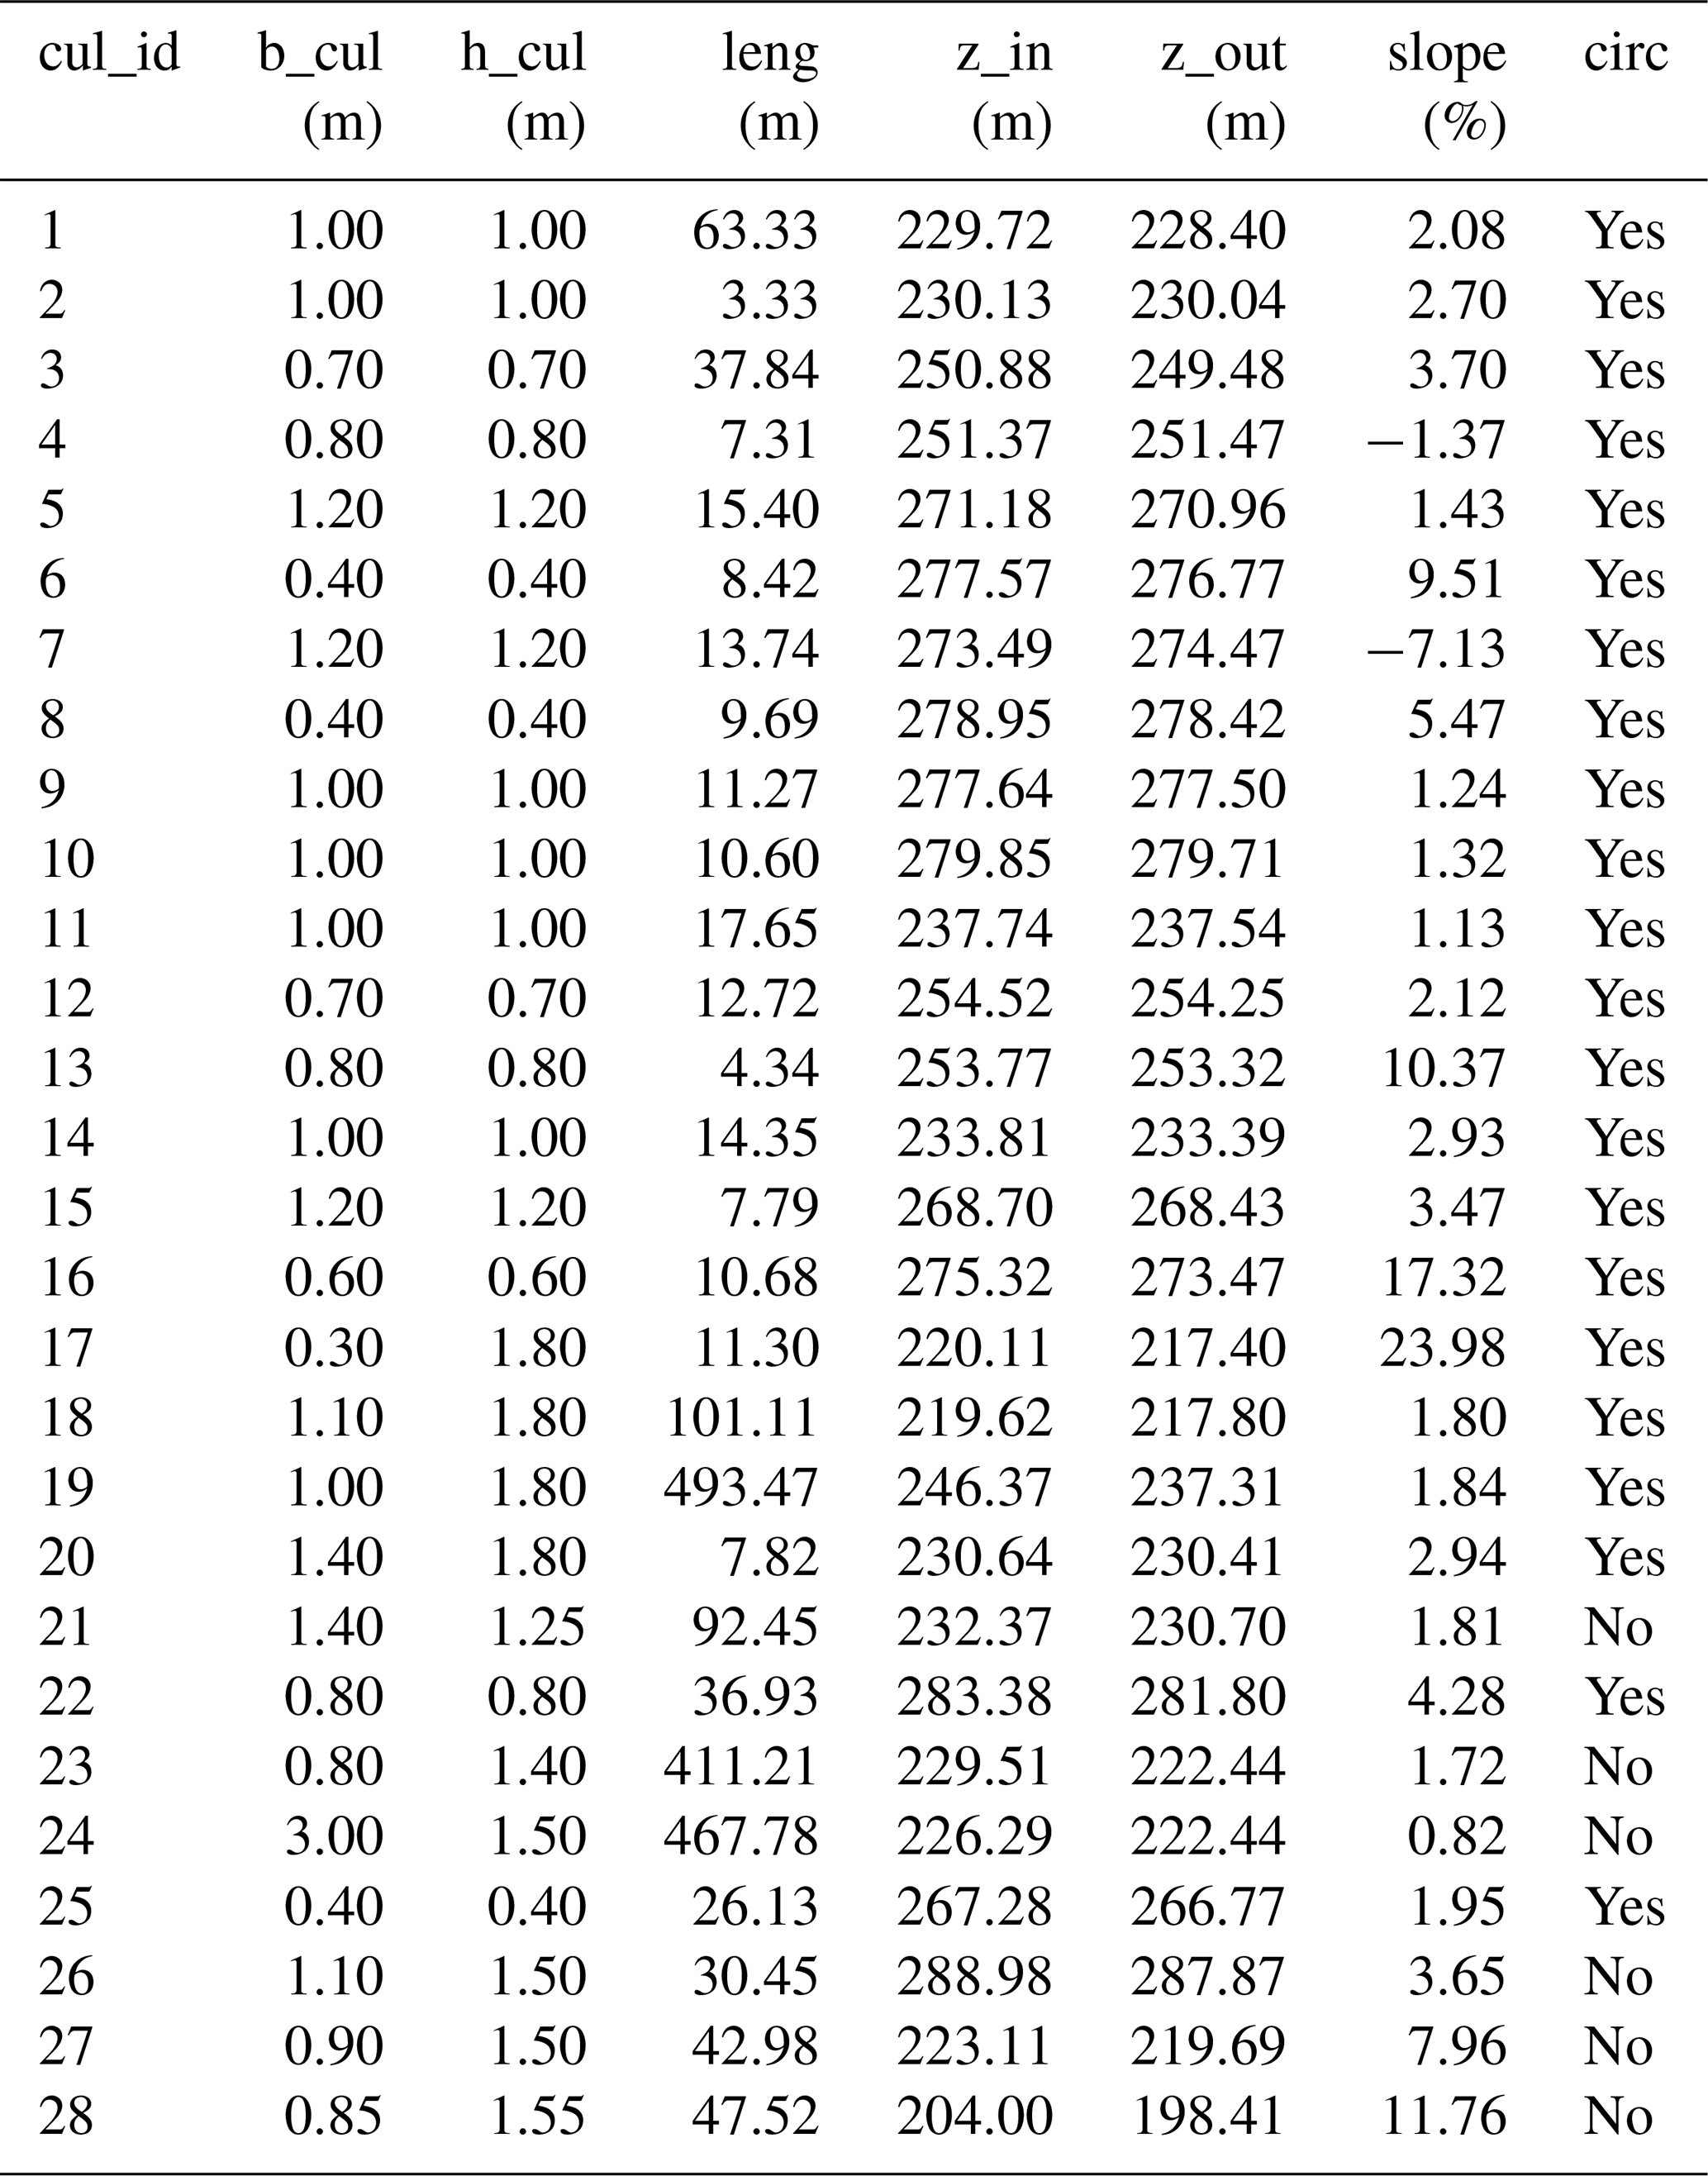
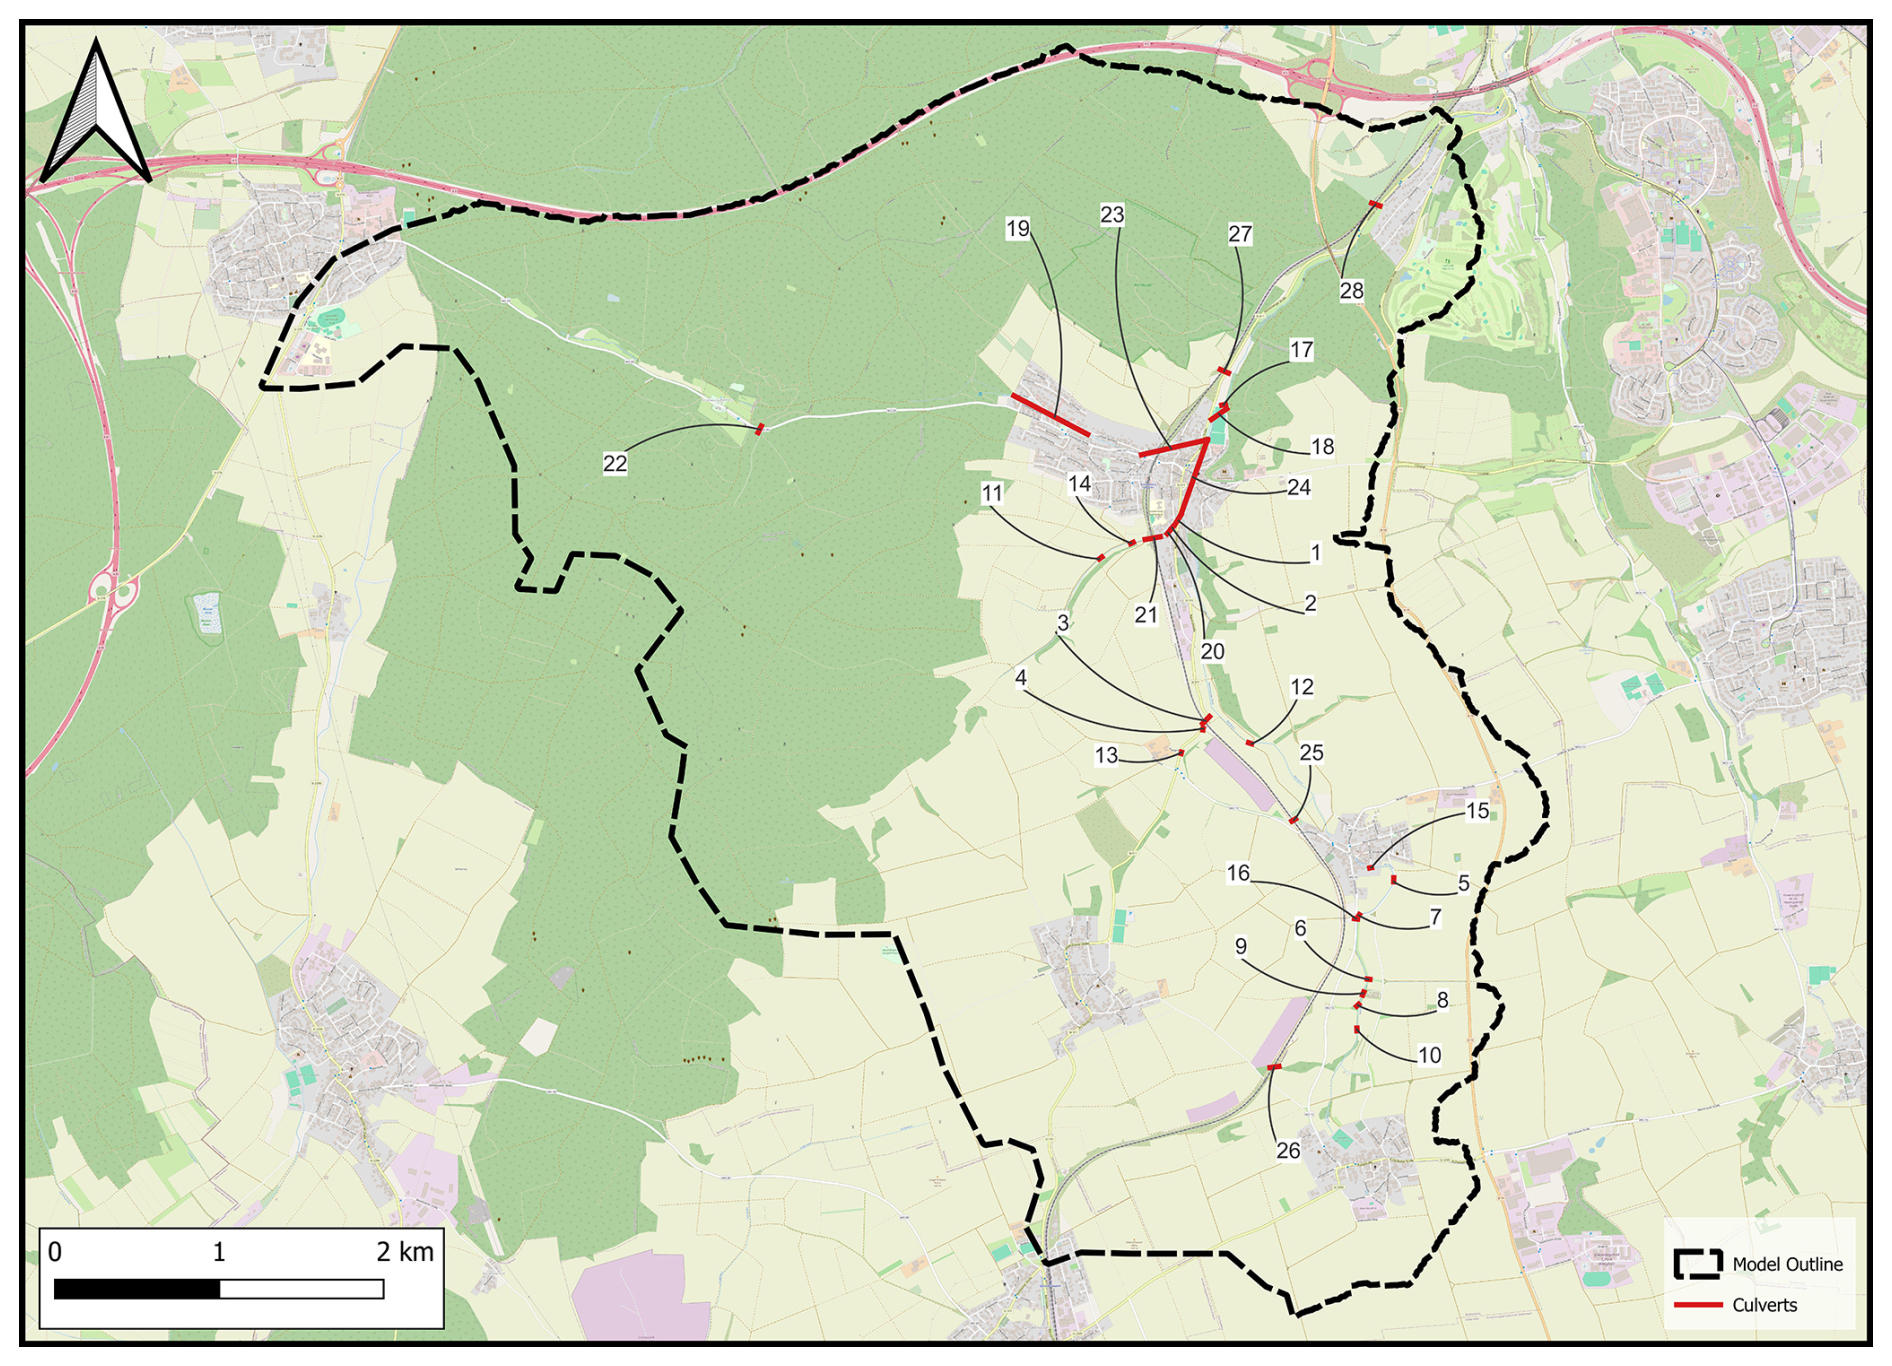
Table B1 lists the peak discharges at the catchment outlet across all return periods, applying the culvert data set from the authorities and the data set including all located culverts. Although the absolute differences in peak discharge are relatively small, the relative differences range from 4.9 % to up to 8.6 %, underscoring the potential impact of an incomplete culvert data set on flood modeling outcomes.
Since the additional culverts are all towards-stream culverts, it can indeed be expected that their inclusion leads to an increase in simulated discharge, as illustrated by the hydrographs in Fig. B1. Notably, the increase in discharge coincides with the overall flood peak, suggesting that the response times of the contributing subcatchments align closely with the overall catchment response.
While this characteristic could be specific to the catchment investigated in this study and has not been proven to be generalizable to others, the findings underscore the importance of using a comprehensive culvert dataset. Omitting culverts in hydrodynamic models can cause parts of the catchment to become artificially disconnected from the flood dynamics, resulting in an underestimation of downstream discharge and flood extent. It could also, in turn, result in an overestimation of flood extent upstream of the missing culverts.
It is also important to acknowledge that some culverts within the study area may still be undiscovered, and hence unaccounted for. As a result, the simulated outlet hydrographs are likely to be still underestimated. However, since additional culverts were specifically identified in areas of pronounced inundation, it is less likely that the remaining unidentified culverts would substantially alter the peak discharge at the outlet.
Table B1Peak discharge Qmax [m3 s−1] for different rainfall return periods without any blockages, once incorporating all located culverts and once only the culverts from the authorities' data set. Additionally, the relative difference (Rel. Diff.) in peak discharge is listed.
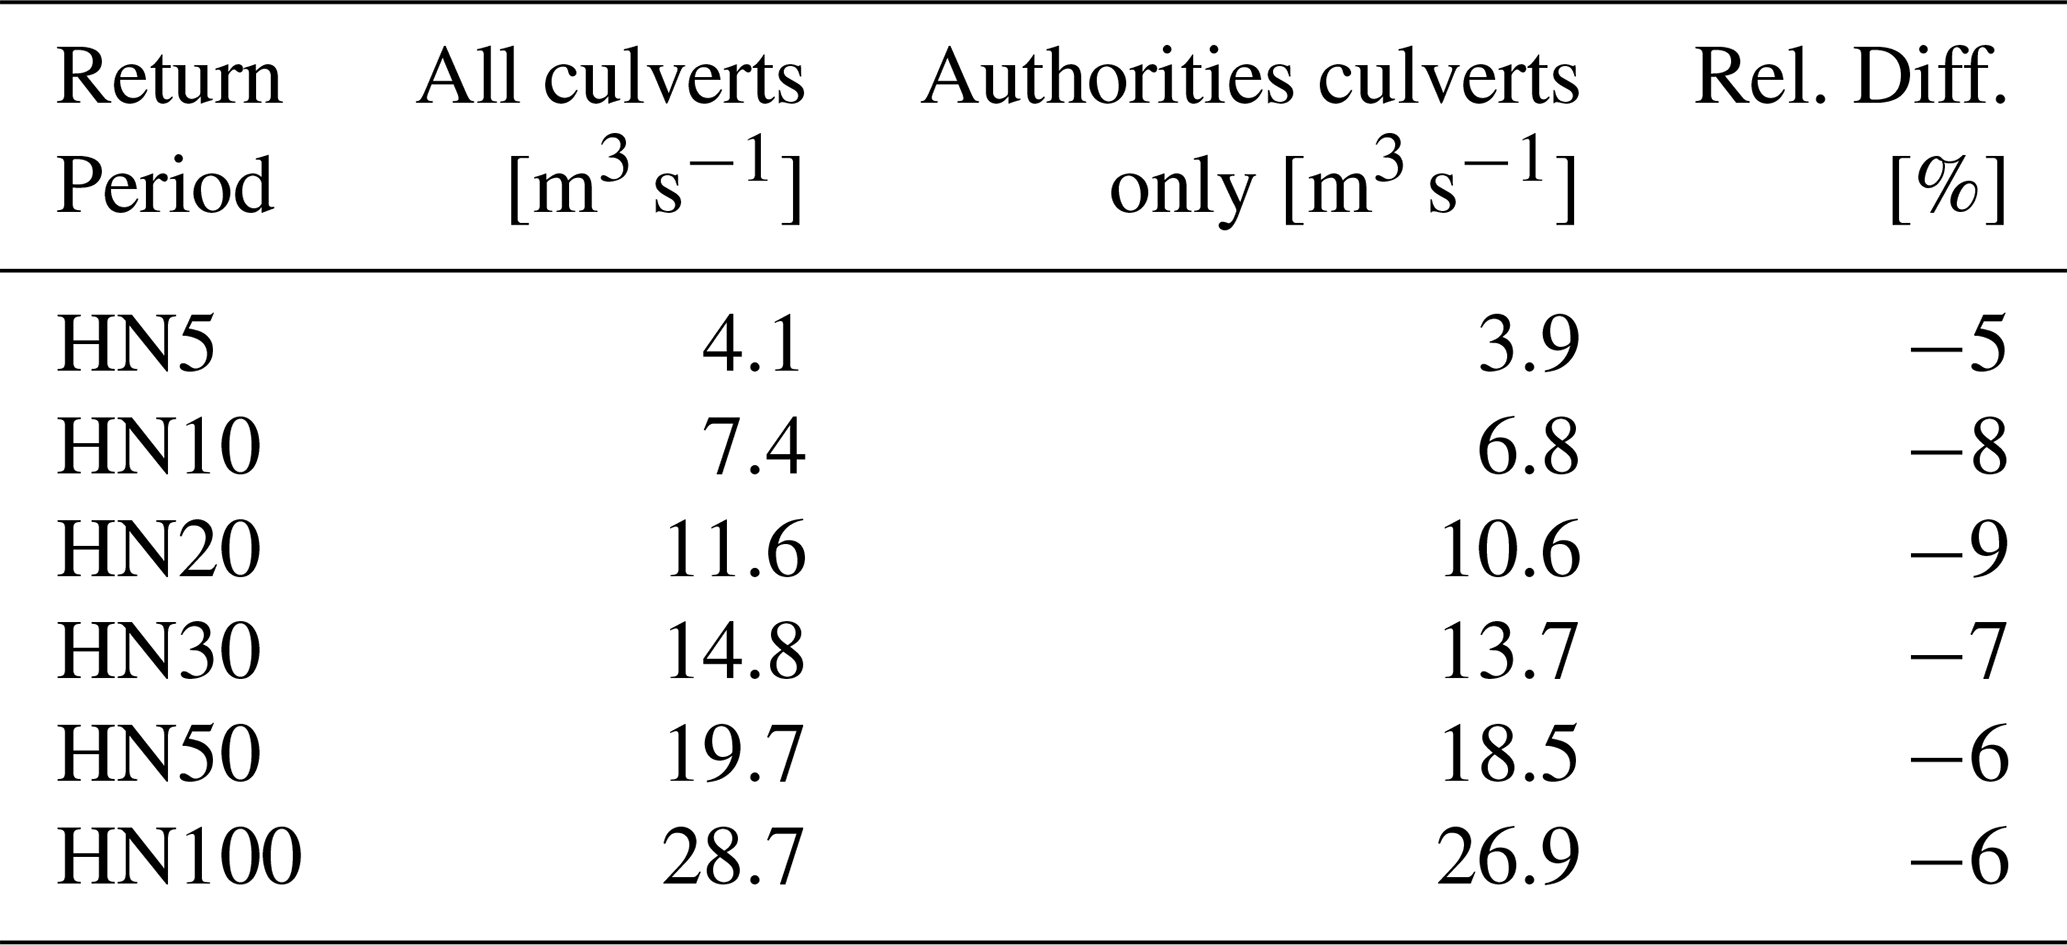
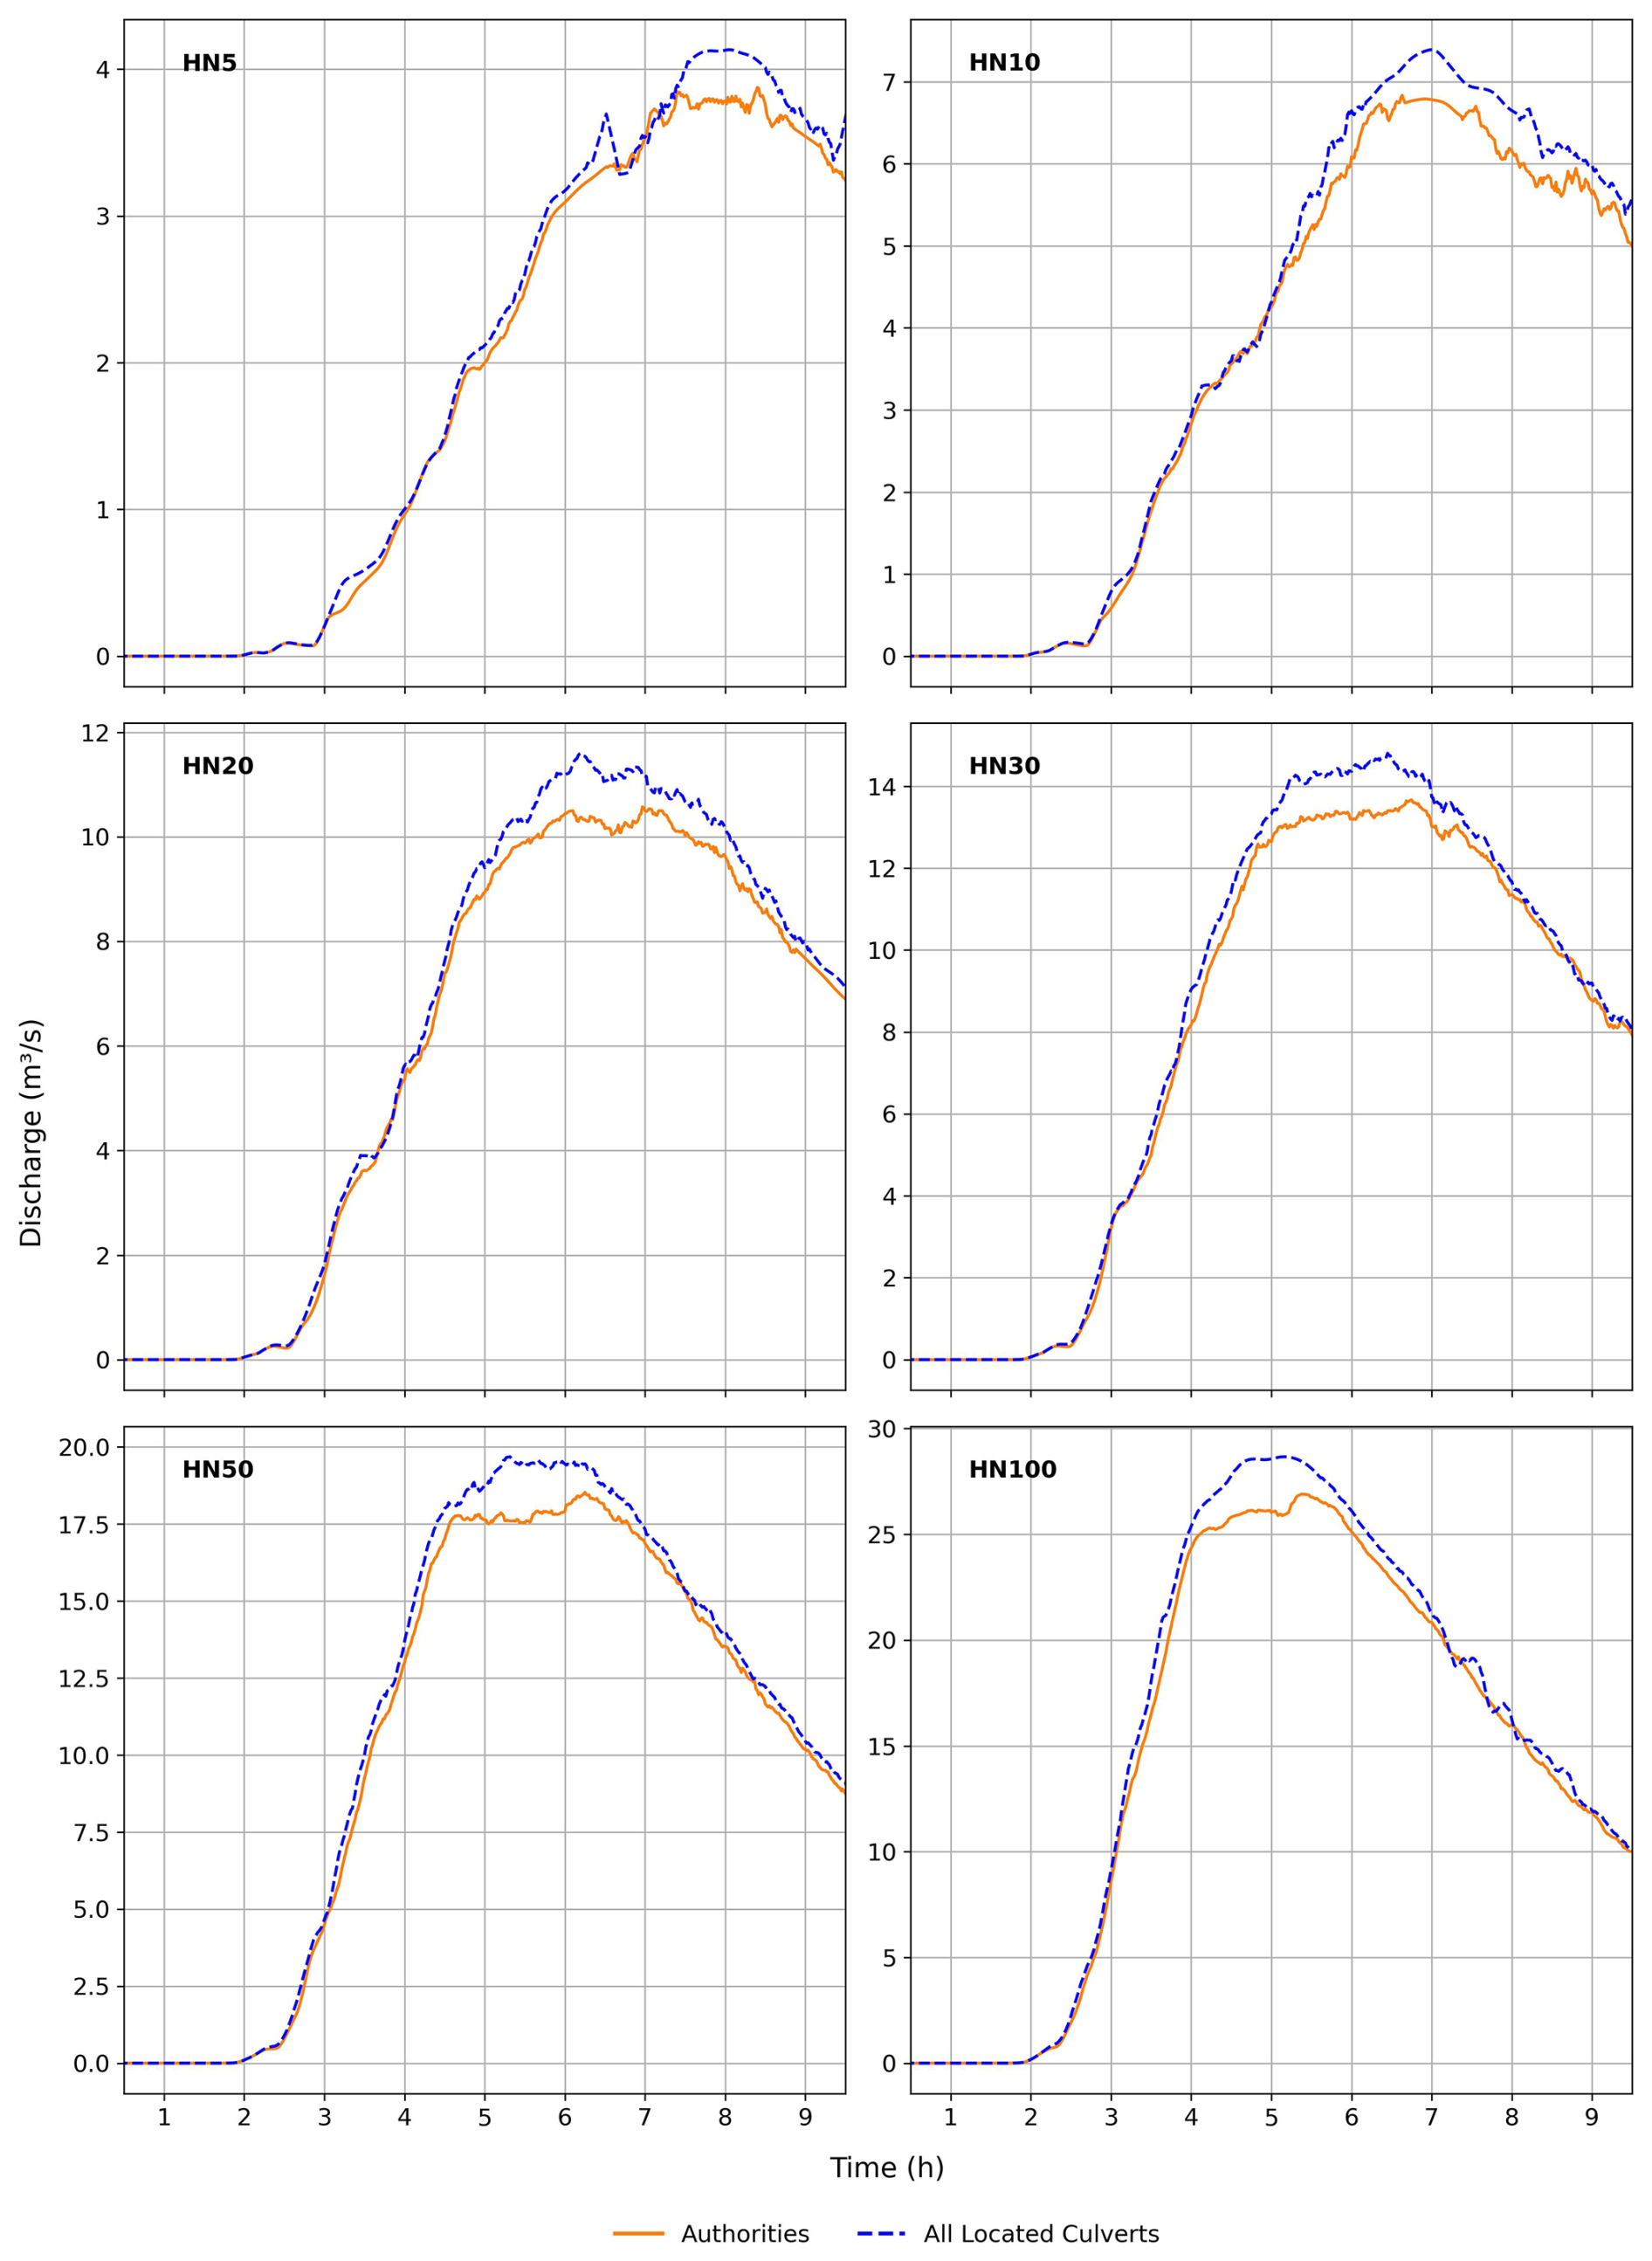
Figure B1Outlet hydrographs for the different rainfall return periods, once incorporating all located culverts and once only the culverts from the authorities' data set.
Cross-section 1 lies downstream of the municipality of Reichenberg, just below the piped sections of the Reichenberger Bach. The hydrographs (see Fig. C1) closely resemble those at the catchment outlet, with minor differences visible in the peak discharges for the HN20 and HN30 scenarios, where the reference scenario shows slightly lower peaks.
Cross-section 2 lies within the municipality of Reichenberg, where the Reichenberger Bach is fully routed underground. Consequently, any simulated discharge here indicates surcharge conditions due to culvert overloading (see Fig. C2). Given its relevance for urban flood risk, this cross-section is discussed in more detail in Sect. 3.3.
Cross-section 3 is located upstream of a toward-stream culvert connecting the Sichelgrund to the Reichenberger Bach. Situated within the municipality of Reichenberg, this site is influenced by several upstream culverts, which are all blocked in higher return period scenarios. Nevertheless, the hydrographs show no substantial differences compared to the reference scenario, except for HN5, where minor timing variations in blockage initiation result in small retention effects during the rising limb (see Fig. C3).
Cross-section 4 lies upstream of Reichenberg along the Reichenberger Bach. Except for the HN5, only the HN50 and HN100 scenarios exhibit minor differences in peak discharge, with the initially blocked scenario producing slightly lower peaks (see Fig. C4. This suggests the presence of culverts upstream that are not blocked in the triggered scenarios but do reduce flow when blocked from the beginning.
Cross-section 5 is located further upstream on the Reichenberger Bach. Peak discharges here are less than half of those at cross-section 4 (see Figs. C4 and C5). Similar to cross-section 4, culverts upstream are never blocked in the triggered scenarios but demonstrate an influence on hydrographs when initially blocked.
Cross-section 6 lies upstream of Reichenberg along the Guttenberger Bach. As the subcatchment upstream of the cross-section is mainly forested, it has reduced surface runoff and therefore a highly delayed hydrologic response time. Only one upstream culvert, identified during the field campaign, is present. This culvert influences the hydrographs for HN50 and HN100 by reducing peak discharges in the initially blocked scenario (see Fig. C6). It is not blocked in any of the triggered scenarios.
Overall, cross-sections 4–6 illustrate that culvert blockages can induce localized retention effects within subcatchments.
Figure C1Hydrographs at cross-section 1 for the different precipitation return periods and different TRs for BR=0.8.

Figure C2Hydrographs at cross-section 2 for the different precipitation return periods and different TRs for BR=0.8.
Figure C3Hydrographs at cross-section 3 for the different precipitation return periods and different TRs for BR=0.8.
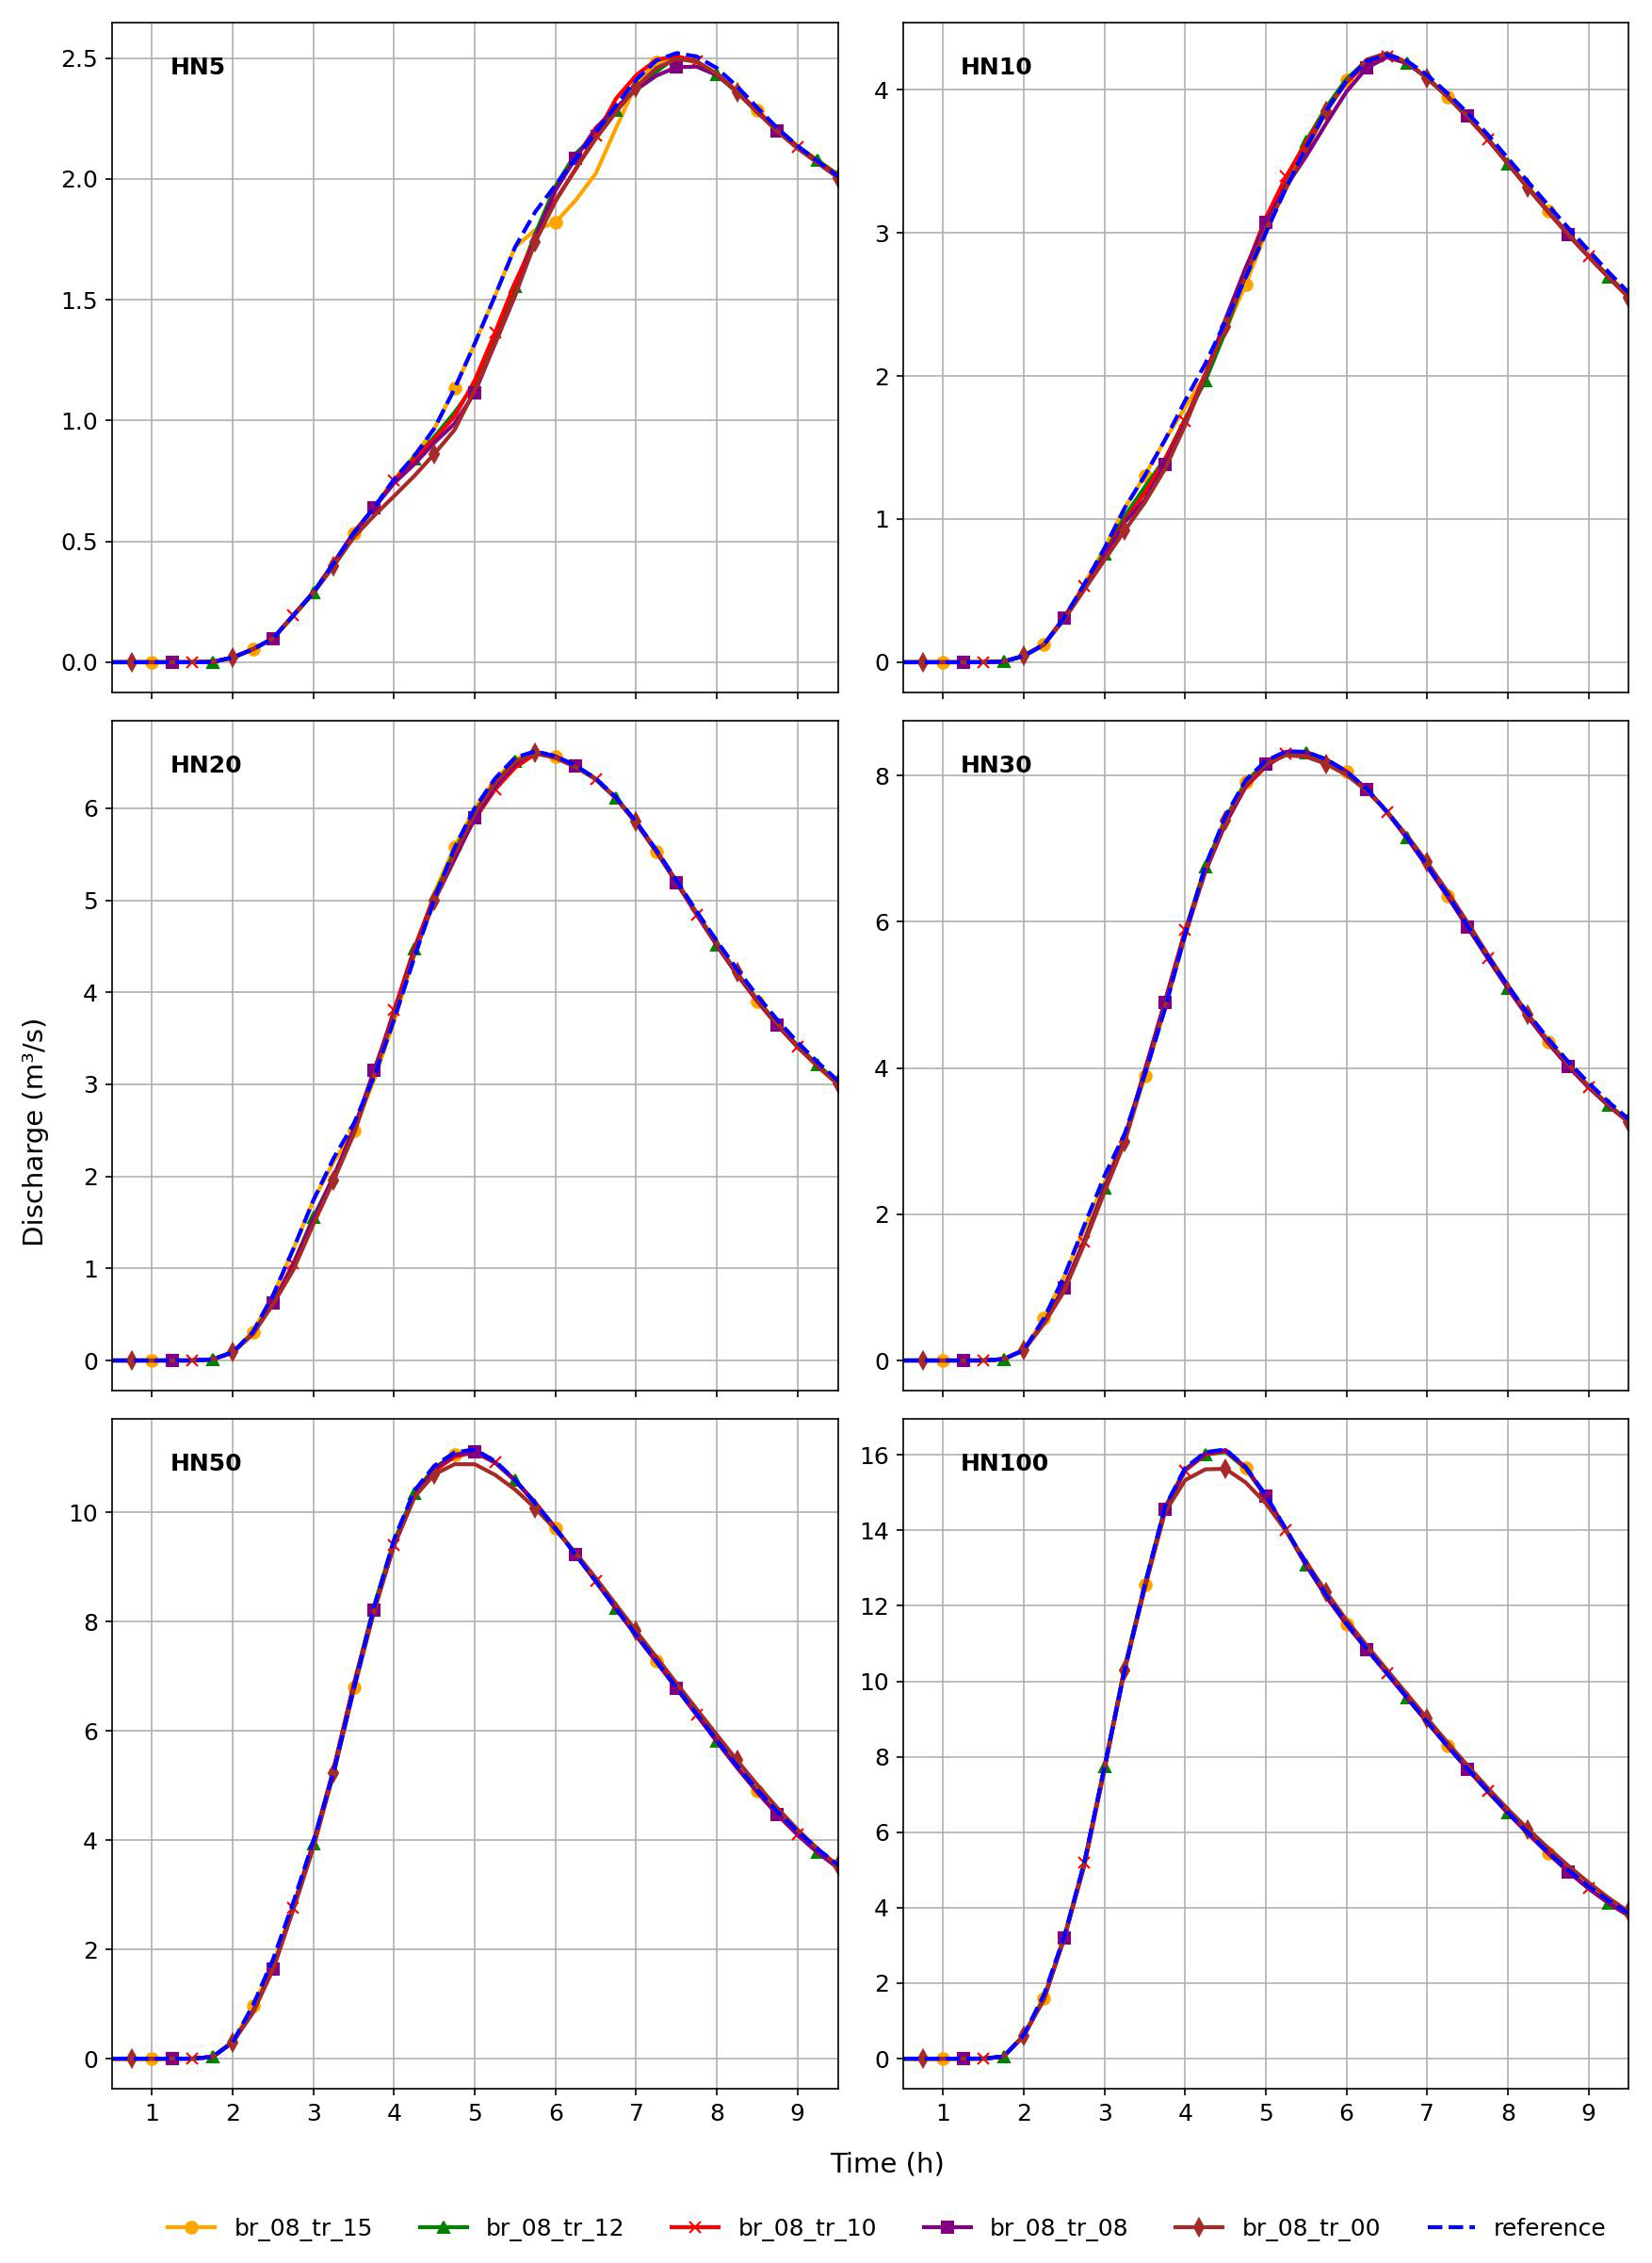
Figure C4Hydrographs at cross-section 4 for the different precipitation return periods and different TRs for BR=0.8.
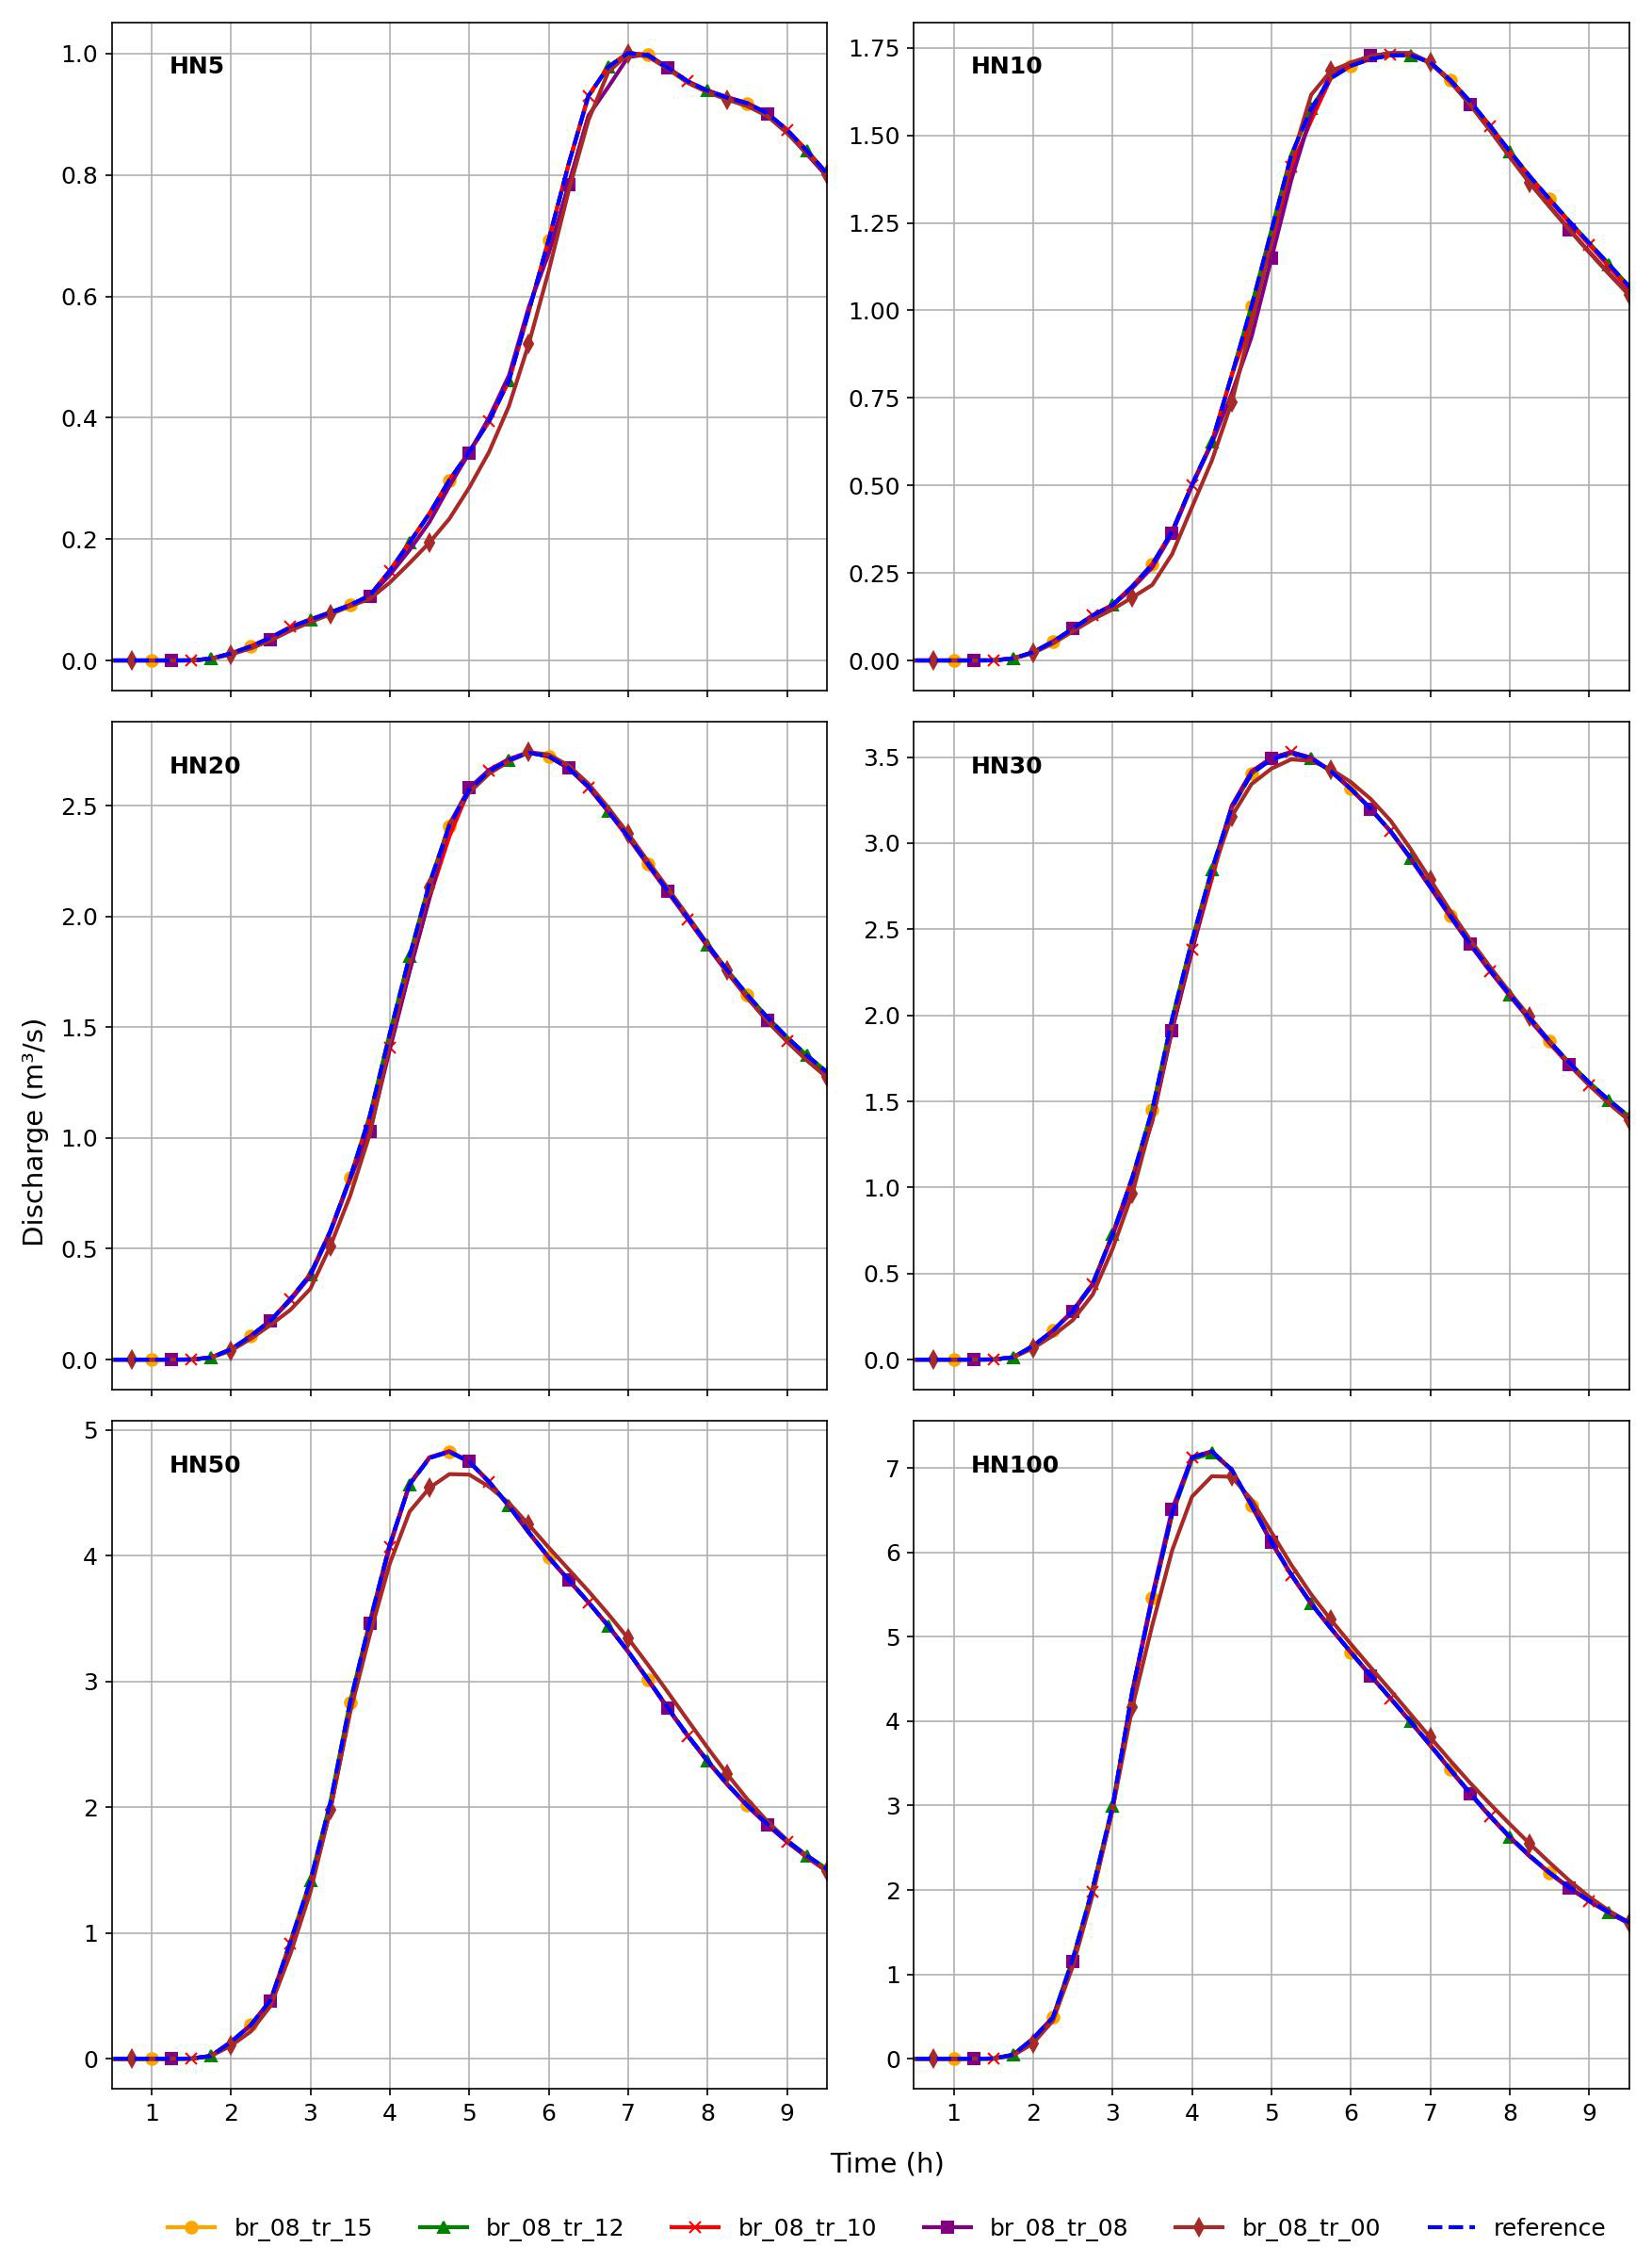
Figure C5Hydrographs at cross-section 5 for the different precipitation return periods and different TRs for BR=0.8.
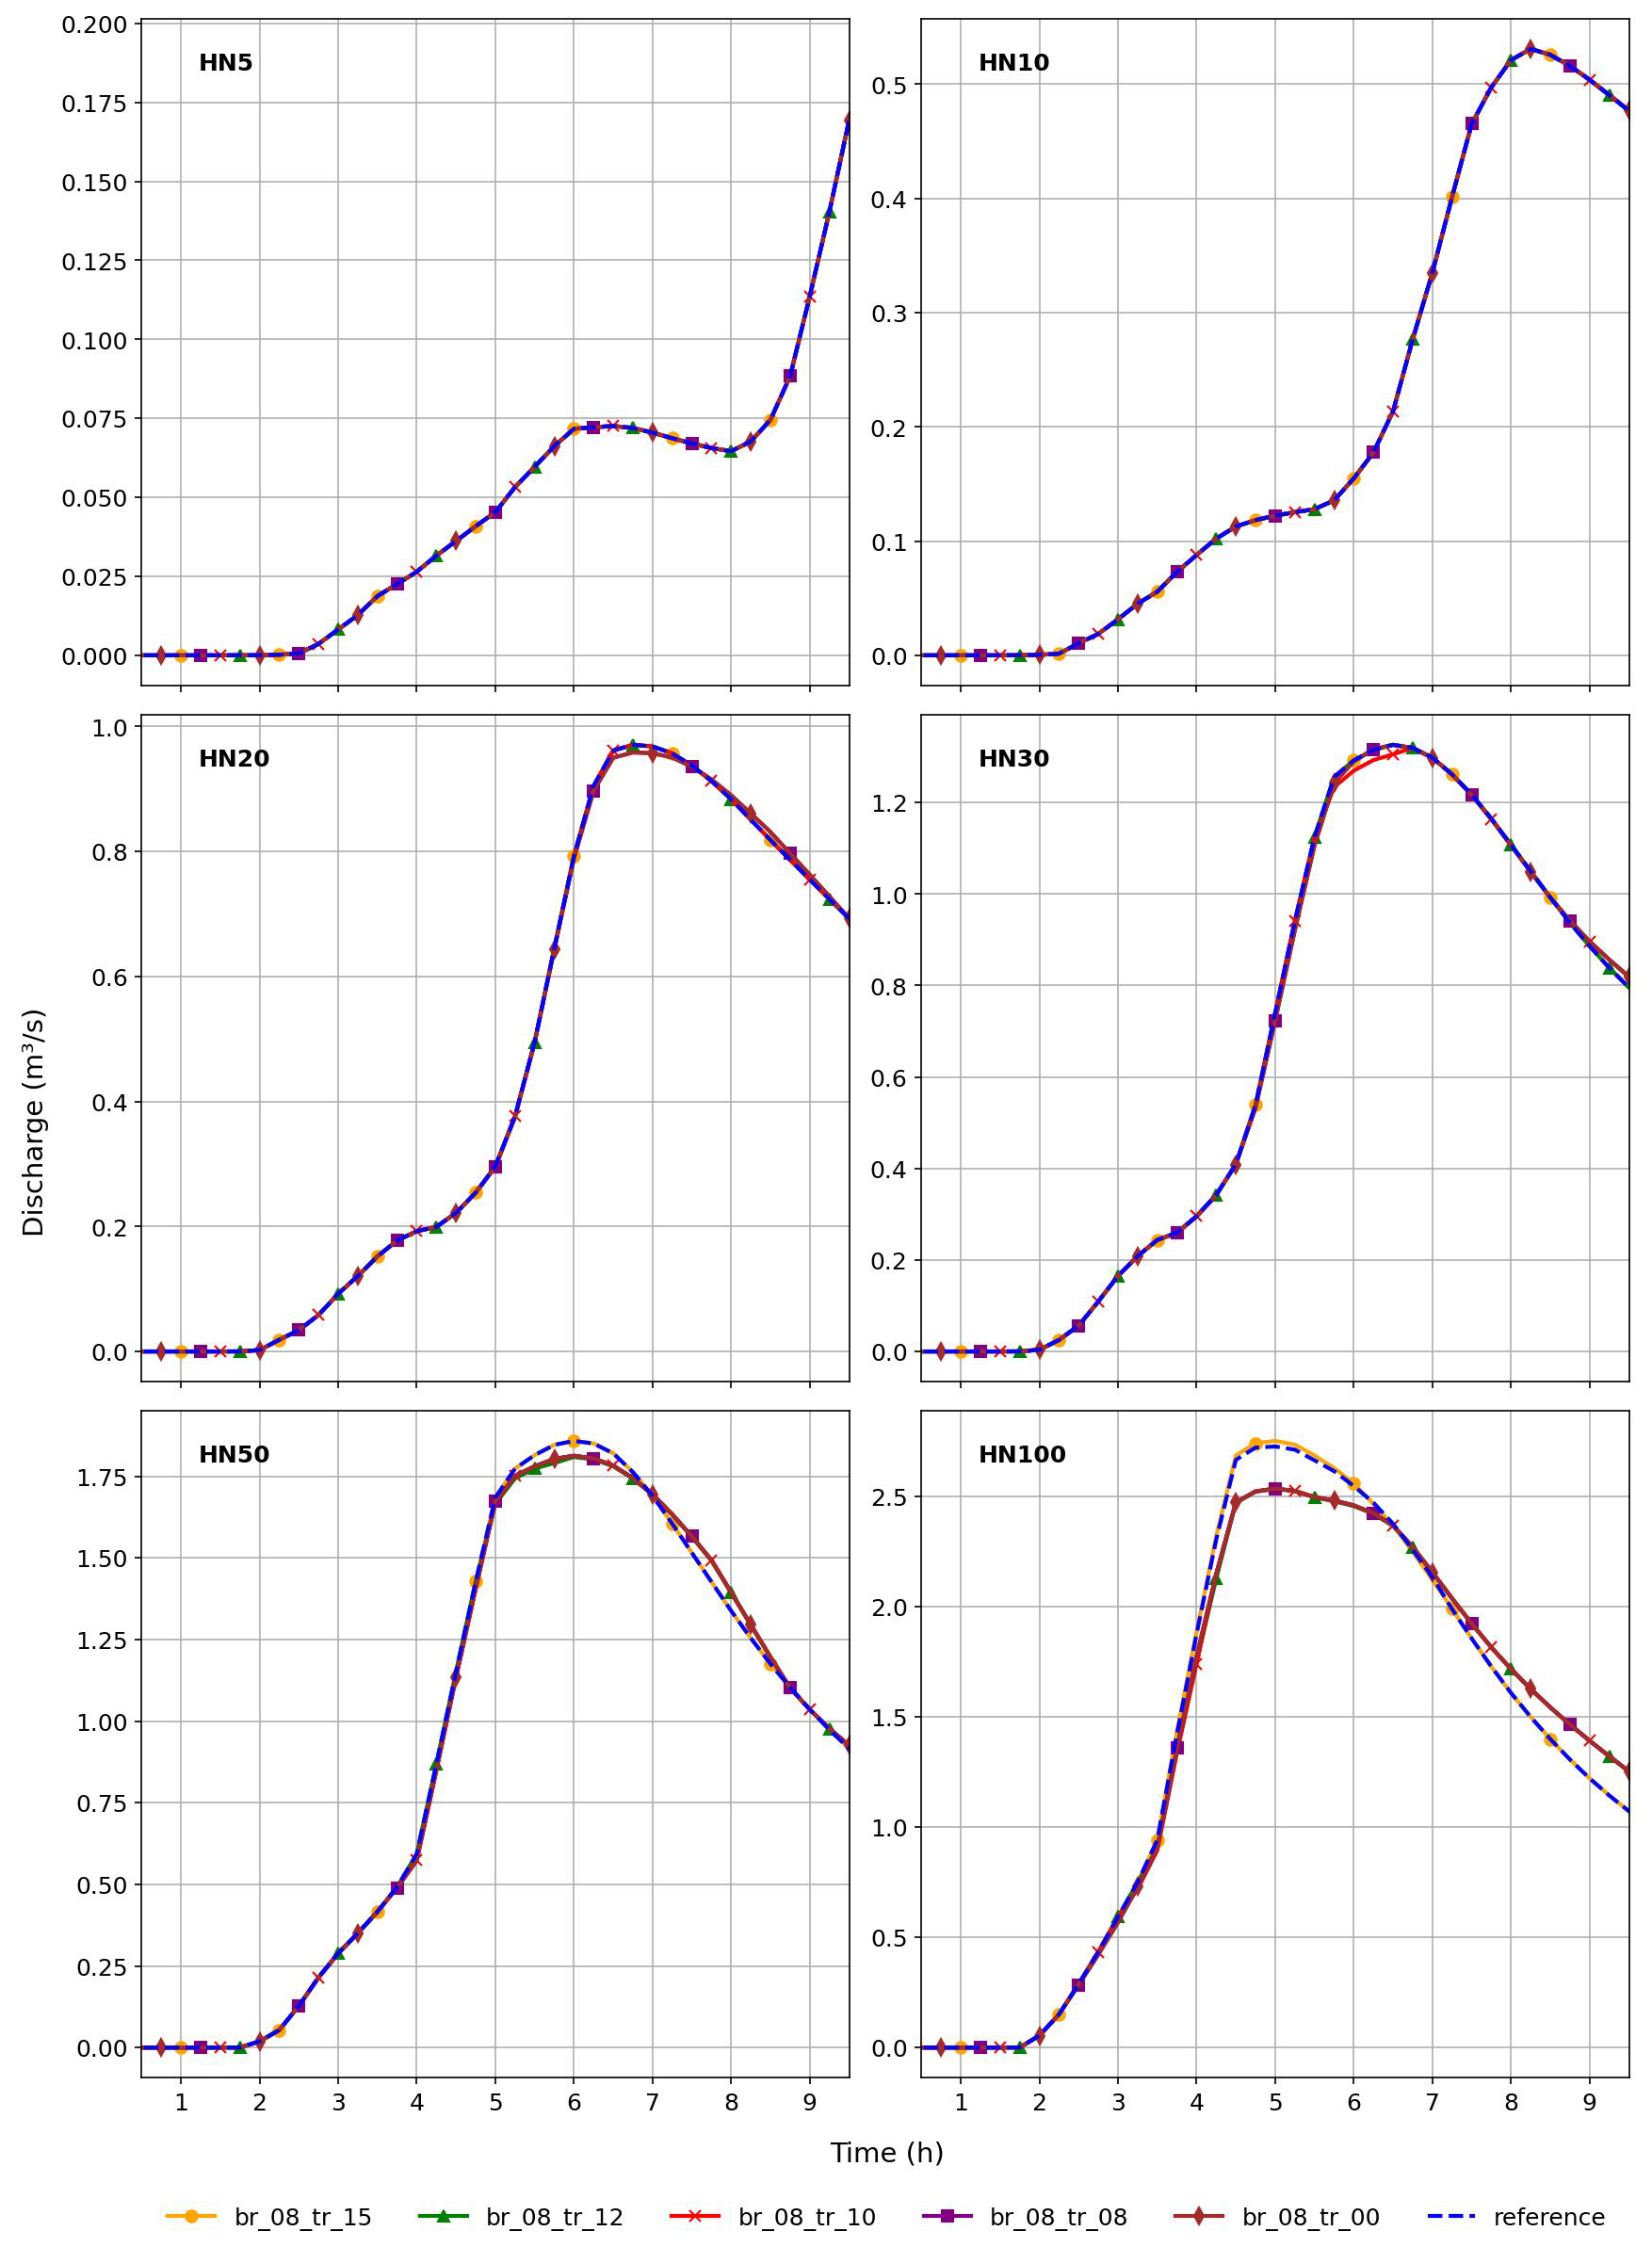
Figure C6Hydrographs at cross-section 6 for the different precipitation return periods and different TRs for BR=0.8.
Table D1Absolute inundation larger than 30 cm in streets and combined residential and industrial (resind) areas, as well as total inundation for the reference scenario. The relative difference in inundation of three different blockage scenarios is listed for comparison. These blockage scenarios share the same trigger ratio TR=0.8, but differ in blockage ratios BR.
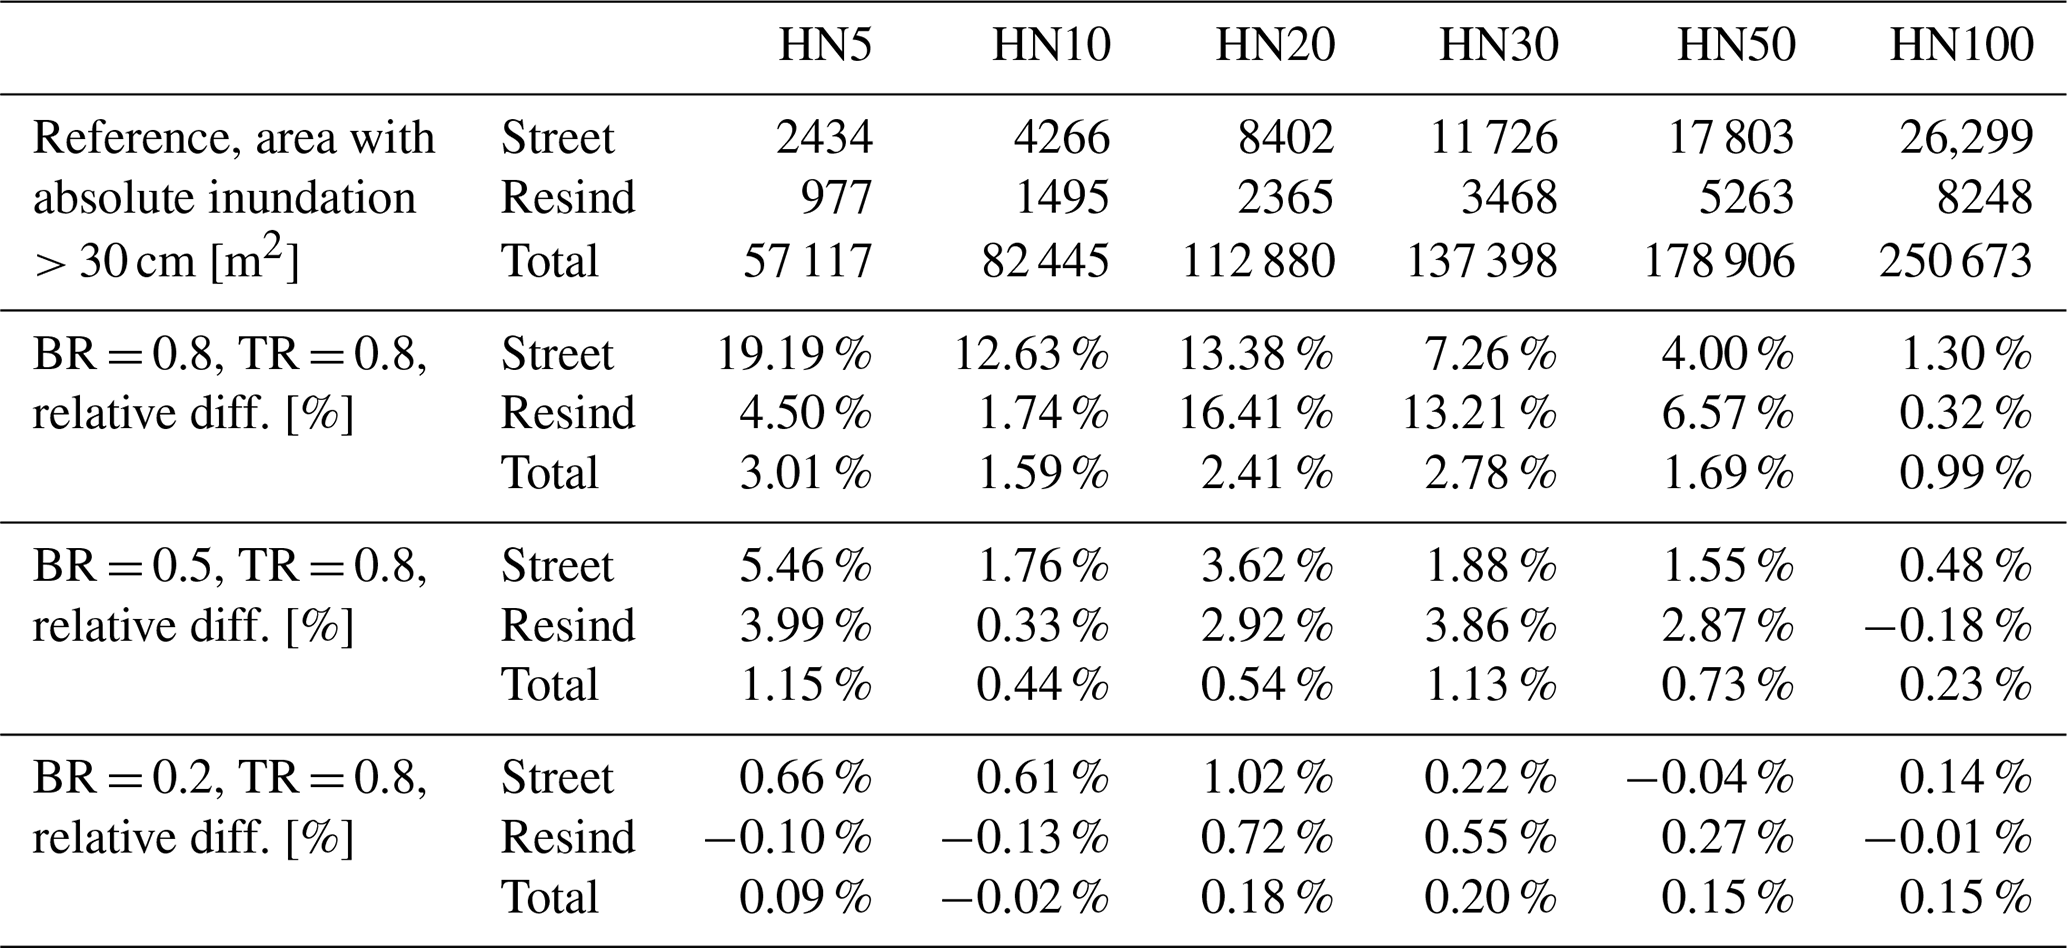
Table D2Absolute inundation larger than 30 cm in streets and combined residential and industrial (resind) areas, as well as total inundation for the reference scenario. The relative difference in inundation of five different blockage scenarios is listed for comparison. These blockage scenarios share the same blockage ratios BR=0.8, but differ in the trigger ratio TR.
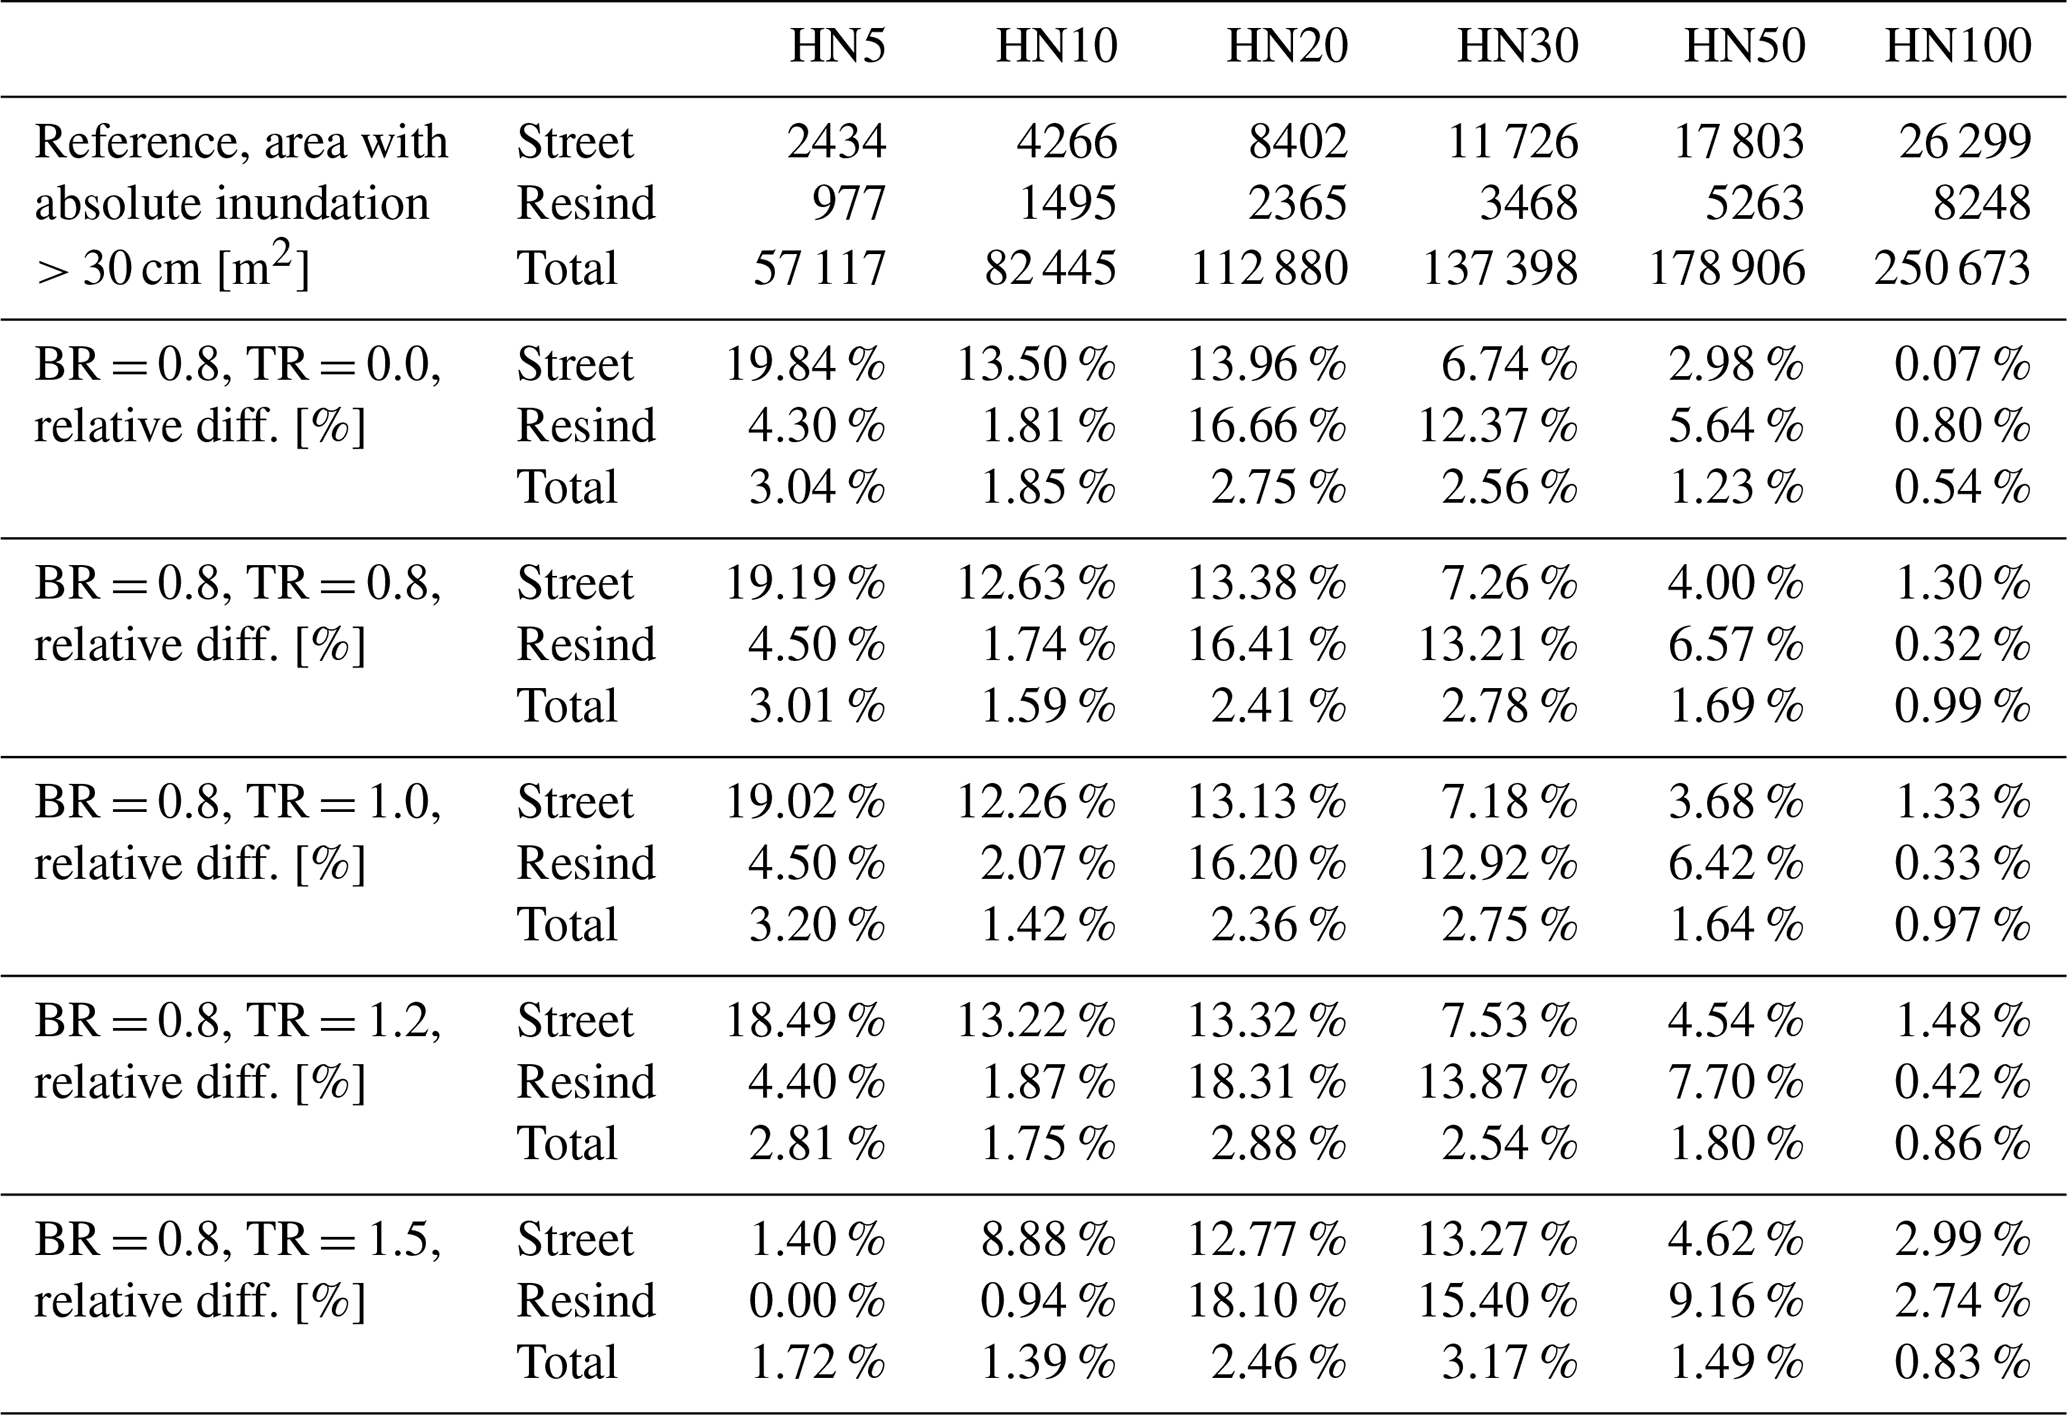
Table D3Absolute inundation larger than 30 cm in streets and combined residential and industrial (resind) areas, as well as total inundation for the reference scenario. The relative difference in inundation of four different blockage scenarios is listed for comparison. These blockage scenarios share the same blockage ratios BR=0.8 and trigger ratios TR=1.2, except for the scenarios in which installed mitigation measures are simulated at the critical culverts 1 (cc1), 2 (cc2) or both (cc1,2) by applying TR=∞.
The rastered maximum water depths can be openly retrieved at: https://osf.io/6m5nb/?view_only=c3f6c563d4bc44ff844bfa48d2038116 (De Vos, 2025).
All authors contributed to the concept and developed methods. LFDV and KM generated the models and managed data pre- and postprocessing. LFDV adapted the code for culverts in TELEMAC. LFDV was in charge of the main analysis and was responsible for writing the original draft for submission. KM and DCV also contributed to the generation of figures, writing and reviewing the figures.
The contact author has declared that none of the authors has any competing interests.
Publisher's note: Copernicus Publications remains neutral with regard to jurisdictional claims made in the text, published maps, institutional affiliations, or any other geographical representation in this paper. The authors bear the ultimate responsibility for providing appropriate place names. Views expressed in the text are those of the authors and do not necessarily reflect the views of the publisher.
We thank Professor Axel Bronstert, Dr. Maik Heistermann, Dr. Guilherme Samprogna Mohor and Sarah Lindenlaub for supporting this study within the project. We thank Moritz Reininger for providing photographs of recent flood events in the catchment and the fire department of Reichenberg for their cooperation. Finally, we thank Florian Brunner and Burak Gür for assisting in the field study and Marko Kajo for testing setups of the blockage implementation in TELEMAC-2D. We also acknowledge the usage of Grammarly and ChatGPT to locate grammatical errors in this paper.
This research has been supported by the Bundesministerium für Forschung, Technologie und Raumfahrt (grant no. 02WEE1632B).
This paper was edited by Mihai Niculita and reviewed by Francesco Dottori and three anonymous referees.
Ah-Woane, E., Amama, Z., Cordier, F., Davarend, T., Lotfi, J., Assaba, M., Sochinskii, A., Majdalani, S., Moussa, R., Abily, M., and Delestre, O.: Toward Brague river flood modelling 3: the impact of culvert representation, Digital Water, 3, 1–22, https://doi.org/10.1080/28375807.2025.2465376, 2025. a, b, c, d
Apel, H., Aronica, G., Kreibich, H., and Thieken, A.: Flood risk analyses-how detailed do we need to be?, Nat. Hazards, 49, 79–98, https://doi.org/10.1007/s11069-008-9277-8, 2008. a, b
Archer, D., O'Donnell, G., Lamb, R., Warren, S., and Fowler, H. J.: Historical flash floods in England: New regional chronologies and database, J. Flood Risk Manag., 12, e12526, https://doi.org/10.1111/jfr3.12526, 2019. a
Ball, J., Babister, M., Nathan, R., Weeks, W., Weinmann, E., Retallick, M., and Testoni, I.: Australian Rainfall and Runoff: A Guide to Flood Estimation, Commonwealth of Australia (Geoscience Australia), ISBN 978-1-925848-36-6, 2019. a, b, c, d
Bartels, H., Weigl, E., Reich, T., Lang, P., Wagner, A., Kohler, O., and Gerlach, N.: Projekt RADOLAN-Routineverfahren zur Online-Aneichung der Radarniederschlagsdaten mit Hilfe von automatischen Bodenniederschlagsstationen (Ombrometer): zusammenfassender Abschlussbericht für die Projektlaufzeit von 1997 bis 2004, Tech. rep., Deutscher Wetterdienst (DWD), https://www.dwd.de/DE/leistungen/radolan/radolan_info/abschlussbericht_pdf.pdf?__blob=publicationFile&v=2 (last access: 13 May 2026), 2004. a
Bayerisches Landesamt für Umwelt (Ed.): Klima-Faktenblätter Bayern und Mainregion – Klima der Vergangenheit und Zukunft, Bayerisches Landesamt für Umwelt, Augsburg, Germany, https://www.bestellen.bayern.de/med/7ee3d7b0-b4a5-11f0-81ee-c3fc7d0a3316/4b0e6a70-1059-11d9-4c85-9d915831e9eb/0/lfu_klima_00188.pdf (last access: 13 May 2026), 2021. a
Bayón, A., Valero, D., and Franca, M. J.: Urban flood drifters (UFD): Identification, classification and characterisation, J. Flood Risk Manag., 17, https://doi.org/10.1111/jfr3.13002, 2024. a
Bodhaine, G. L.: Measurement of peak discharge at culverts by indirect methods, US Government Printing Office Washington, DC, https://doi.org/10.3133/twri03A3, 1968. a, b, c, d, e
Borga, M., Gaume, E., Creutin, J., and Marchi, L.: Surveying flash floods: Gauging the ungauged extremes, Hydrol. Process., 22, 3883–3885, https://doi.org/10.1002/hyp.7111, 2008. a, b
Borga, M., Stoffel, M., Marchi, L., Marra, F., and Jakob, M.: Hydrogeomorphic response to extreme rainfall in headwater systems: Flash floods and debris flows, J. Hydrol., 518, 194–205, https://doi.org/10.1016/j.jhydrol.2014.05.022, 2014. a
Bowling, L. C. and Lettenmaier, D. P.: The Effects of Forest Roads and Harvest on Catchment Hydrology in a Mountainous Maritime Environment, Land Use and Watersheds: Human Influence on Hydrology and Geomorphology in Urban and Forest Areas, 145–164 pp., https://doi.org/10.1029/WS002p0145, 2001. a
Burghardt, L., Klopries, E.-M., and Schüttrumpf, H.: Structural damage, clogging, collapsing: Analysis of the bridge damage at the rivers Ahr, Inde and Vicht caused by the flood of 2021, J. Flood Risk Manag., 18, https://doi.org/10.1111/jfr3.13001, 2025. a
Caretta, M., Mukherji, A., Arfanuzzaman, Betts, R., Gelfan, A., Hirabayashi, Y., Lissner, T., Liu, J., Lopez Gunn, E., Morgan, R., Mwanga, S., and Supratid, S.: Water, in: Climate Change 2022: Impacts, Adaptation and Vulnerability. Contribution of Working Group II to the Sixth Assessment Report of the Intergovernmental Panel on Climate Change, edited by: Pörtner, H.-O., Roberts, D., Tignor, M., Poloczanska, E., Mintenbeck, K., Alegría, A., Craig, M., Langsdorf, S., Löschke, S., Möller, V., Okem, A., and Rama, B., Cambridge University Press, Cambridge, UK and New York, NY, USA, 551–712, https://doi.org/10.1017/9781009325844.006, 2022. a
Caviedes-Voullième, D., García-Navarro, P., and Murillo, J.: Influence of mesh structure on 2D full shallow water equations and SCS Curve Number simulation of rainfall/runoff events, J. Hydrol., 448–449, 39–59, https://doi.org/10.1016/j.jhydrol.2012.04.006, 2012. a
Collier, C. G.: Flash flood forecasting: What are the limits of predictability?, Q. J. Roy. Meteor. Soc., 133, 3–23, https://doi.org/10.1002/qj.29, 2007. a
Deutsche Vereinigung für Wasserwirtschaft, Abwasser und Abfall: Arbeitsblatt DWA-A 118: Hydraulische Bemessung und Nachweis von Entwässerungssystemen, Deutsche Vereinigung für Wasserwirtschaft, Abwasser und Abfall, Hennef, ISBN 978-3-887-21924-6, 2006. a
De Vos, L. F.: Culvert Blockage in Catchment Floods, OSF [data set], https://osf.io/6m5nb/?view_only=c3f6c563d4bc44ff844bfa48d2038116 (last access: 13 May 2026), 2025. a
De Vos, L. F., Wirthensohn, M., Broich, K., and Rüther, N.: Revised Implementation of the Green-Ampt Infiltration Method in TELEMAC-2D, in: Proceedings of 30th TELEMAC User Conference, https://henry.baw.de/server/api/core/bitstreams/e89ec4c8-b56e-4c5c-8836-51e74ba0ce37/content (last access: 13 May 2026), 2024. a
DWD Climate Data Center (CDC): Recent hourly RADOLAN grids of precipitation depth (GIS-readable), version 2.5, https://opendata.dwd.de/climate_environment/CDC/grids_germany/hourly/radolan/recent/asc/ (last access: 13 May 2026), 2025. a
EDF: TELEMAC-2D: User Manual. Version v8p4, EDF, 2022. a, b
Erpicum, S., Poppema, D., Burghardt, L., Benet, L., Wüthrich, D., Klopries, E.-M., and Dewals, B.: A dataset of floating debris accumulation at bridges after July 2021 flood in Germany and Belgium, Sci. Data, 11, 1092, https://doi.org/10.1038/s41597-024-03907-8, 2024. a
Esri: Satellite [basemap], scale not given, World Imagery, https://www.arcgis.com/home/item.html?id=10df2279f9684e4a9f6a7f08febac2a9 (last access: 13 May 2026), 2025. a, b
Fallowfield, L. and Motta, D.: The permanent flood risk of culverts and the impact of increasing debris blockage, J. Flood Risk Manag., 17, e13021, https://doi.org/10.1111/jfr3.13021, 2024. a, b
Fernández-Pato, J., Martínez-Aranda, S., Morales-Hernández, M., and García-Navarro, P.: Analysis of the performance of different culvert boundary conditions in 2D shallow flow models, J. Hydroinform., 22, 1093–1121, https://doi.org/10.2166/hydro.2020.025, 2020. a, b
Feuerwehr Reichenberg: Flood Protection Operation July 15th, 2021, https://ff-reichenberg.de/einsatzberichte/1775-hochwasser-keller-unter-wasser/ (last access: 24 April 2025), 2021a. a
Feuerwehr Reichenberg: Flood Protection Operation July 9th, 2021, https://ff-reichenberg.de/einsatzberichte/1752-hochwasser-strasse-ueberflutet/ (last access: 24 April 2025), 2021b. a, b
Feuerwehr Reichenberg: Fire Department Operations in 2021, https://ff-reichenberg.de/einsatzberichte/2021/ (last access: 24 April 2025), 2021c. a
Feuerwehr Reichenberg: Flood Protection Operation August 3rd, 2024, https://ff-reichenberg.de/einsatzberichte/4944-hochwasser-strasse-uebeflutet/ (last access: 24 April 2025), 2024. a
Gaume, E., Bain, V., Bernardara, P., Newinger, O., Barbuc, M., Bateman, A., Blaškovičová, L., Blöschl, G., Borga, M., Dumitrescu, A., Daliakopoulos, I., Garcia, J., Irimescu, A., Kohnova, S., Koutroulis, A., Marchi, L., Matreata, S., Medina, V., Preciso, E., Sempere-Torres, D., Stancalie, G., Szolgay, J., Tsanis, I., Velasco, D., and Viglione, A.: A compilation of data on European flash floods, J. Hydrol., 367, 70–78, https://doi.org/10.1016/j.jhydrol.2008.12.028, 2009. a
Georgakakos, K.: Real-Time Flash Flood Prediction, J. Geophys. Res., 92, 9615–9629, https://doi.org/10.1029/JD092iD08p09615, 1987. a
Green, W. H. and Ampt, G. A.: Studies on Soil Physics, J. Agr. Sci., 4, 1–24, https://doi.org/10.1017/S0021859600001441, 1911. a
Hawkins, R. H.: Runoff curve numbers with varying site moisture, J. Irr. Drain. Div.-ASCE, 104, 389–398, 1978. a
Iqbal, U. and Riaz, M. Z. B.: Blockage at cross-drainage hydraulic structures – Advances, challenges and opportunities, Heliyon, 10, e35786, https://doi.org/10.1016/j.heliyon.2024.e35786, 2024. a
Junghänel, T., Bär, F., Deutschländer, T., Haberlandt, U., Otte, I., Shehu, B., Stockel, H., Stricker, K., Thiele, L., and Willems, W.: Methodische Untersuchungen zur Novellierung der Starkregenstatistik für Deutschland (MUNSTAR), Tech. rep., Synthesebericht, https://www.dwd.de/DE/leistungen/kostra_dwd_rasterwerte/download/Synthesebericht_MUNSTAR_pdf.pdf?__blob=publicationFile&v=3 (last access: 13 May 2026), 2022. a, b
Khosh Bin Ghomash, S., Apel, H., and Caviedes-Voullième, D.: Are 2D shallow-water solvers fast enough for early flood warning? A comparative assessment on the 2021 Ahr valley flood event, Nat. Hazards Earth Syst. Sci., 24, 2857–2874, https://doi.org/10.5194/nhess-24-2857-2024, 2024. a
Khosh Bin Ghomash, S., Deng, S., and Apel, H.: Enabling real-time high-resolution flood forecasting for the entire state of Berlin through multi-GPU accelerated physics-based modeling, Nat. Hazards Earth Syst. Sci., 26, 85–101, https://doi.org/10.5194/nhess-26-85-2026, 2026. a, b
Lapillone, S., Bourban, S., Camazzola, A., Mignot, E., Rivière, N., Proust, S., and Lipeme Kouyi, G.: Modelling drainage-surface exchanges with TELEMAC-SWMM at the scale of a neighbourhood, in: Proceedings of 31st TELEMAC User Conference, https://hal.science/hal-05325000v1/document (last access: 13 May 2026), 2025. a
Lessard, F., Jutras, S., Perreault, N., and Éric Guilbert: Performance of automated geoprocessing methods for culvert detection in remote Forest environments, Can. Water Resour. J., 48, 248–257, https://doi.org/10.1080/07011784.2022.2160660, 2023. a
Li, C., Jiang, C., Chen, J., Lam, M. Y., Xia, J., and Ahmadian, R.: An overview of flood evacuation planning: Models, methods, and future directions, J. Hydrol., 656, 133026, https://doi.org/10.1016/j.jhydrol.2025.133026, 2025. a
Ligier, P. L.: Implementation of a rainfall-runoff model in TELEMAC-2D, in: Proceedings of XXIIIrd TELEMAC-MASCARET User Conference, https://henry.baw.de/server/api/core/bitstreams/fd1d3237-cc94-4561-a8a8-2a85bf9bb985/content (last access: 13 May 2026), 2016. a
Lóczy, D., Czigány, S., and Pirkhoffer, E.: Flash Flood Hazards, in: Studies on Water Management Issues, edited by: Kumarasamy, M., Chap. 2, IntechOpen, Rijeka, https://doi.org/10.5772/28775, 2012. a
LUBW: Kommunales Starkregenrisikomanagement in Baden-Württemberg, LUBW, https://www.dwd.de/DE/leistungen/kostra_dwd_rasterwerte/download/Synthesebericht_MUNSTAR_pdf.pdf?__blob=publicationFile&v=3 (last access: 13 May 2026), 2020. a
Miranzadeh, A., Keshavarzi, A., and Hamidifar, H.: Blockage of box-shaped and circular culverts under flood event conditions: a laboratory investigation, International Journal of River Basin Management, 21, 607–616, https://doi.org/10.1080/15715124.2022.2064483, 2023. a
Molinari, D., Scorzini, A. R., Arrighi, C., Carisi, F., Castelli, F., Domeneghetti, A., Gallazzi, A., Galliani, M., Grelot, F., Kellermann, P., Kreibich, H., Mohor, G. S., Mosimann, M., Natho, S., Richert, C., Schroeter, K., Thieken, A. H., Zischg, A. P., and Ballio, F.: Are flood damage models converging to “reality”? Lessons learnt from a blind test, Nat. Hazards Earth Syst. Sci., 20, 2997–3017, https://doi.org/10.5194/nhess-20-2997-2020, 2020. a
Oberauer, M., Lehmann, B., Buttinger-Kreuzhuber, A., and Waser, J.: Methodological approaches for numerical integration of culverts in 2D surface models in urban flood analysis, J. Hydrol., 665, 134728, https://doi.org/10.1016/j.jhydrol.2025.134728, 2026. a, b
Okamoto, T., Takebayashi, H., Sanjou, M., Suzuki, R., and Toda, K.: Log jam formation at bridges and the effect on floodplain flow: A flume experiment, J. Flood Risk Manag., 13, https://doi.org/10.1111/jfr3.12562, 2019. a, b
Ollett, P., Syme, B., and Ryan, P.: Australian Rainfall and Runoff guidance on blockage of hydraulic structures: numerical implementation and three case studies, J. Hydrol., 56, 109–122, 2017. a, b, c, d
Pizzileo, S., Moretti, G., and Orlandini, S.: Flood plain inundation modeling with explicit description of land surface macrostructures, Adv. Water Resour., 188, 104713, https://doi.org/10.1016/j.advwatres.2024.104713, 2024. a
Reinert, J., Dittmer, C., Lorenz, D., and Klopries, E.-M.: Design Flaws at the Interface of Flood Forecasting, Early Warning and Disaster Response in the Disaster in Western Germany in July 2021 – An Interdisciplinary Analysis, J. Flood Risk Manag., 18, 70099, https://doi.org/10.1111/jfr3.70099, 2025. a
Rigby, E. and Barthelmess, A.: Culvert Blockage Mechanisms and their Impact on Flood Behaviour, in: Proceedings of the 34th IAHR world congress, https://www.iahr.org/library/infor?pid=24857 (last access: 13 May 2026), 2011. a, b, c
Rigby, E., Boyd, M., Roso, S., Silveri, P., and Davis, A.: Causes and Effects of Culvert Blockage During Large Storms, Ninth International Conference on Urban Drainage, https://doi.org/10.1061/40644(2002)298, 2002. a, b
Robinson, A., Lehmann, J., Barriopedro, D., Rahmstorf, S., and Coumou, D.: Increasing heat and rainfall extremes now far outside the historical climate, npj Clim. Atmos. Sci., 4, 45, https://doi.org/10.1038/s41612-021-00202-w, 2021. a
Rohmat, F. I. W., Sa'adi, Z., Stamataki, I., Kuntoro, A. A., Farid, M., and Suwarman, R.: Flood modeling and baseline study in urban and high population environment: A case study of Majalaya, Indonesia, Urban Climate, 46, 101332, https://doi.org/10.1016/j.uclim.2022.101332, 2022. a
Schall, J. D., Thompson, P. L., Zerges, S. M., Kilgore, R. T., and Morris, J. L.: Hydraulic Design of Highway Culverts, Third Edition, Tech. Rep. FHWA-HIF-12-026, U.S. Department of Transportation, Federal Highway Administration, Washington, DC, USA, https://www.fhwa.dot.gov/engineering/hydraulics/pubs/12026/hif12026.pdf (last access: 13 May 2026), 2012. a, b
Schubert, J. E. and Sanders, B. F.: Building treatments for urban flood inundation models and implications for predictive skill and modeling efficiency, Adv. Water Resour., 41, 49–64, https://doi.org/10.1016/j.advwatres.2012.02.012, 2012. a
Sellevold, J., Norem, H., Bruland, O., Rüther, N., and Pummer, E.: Effects of Bottom-Up Blockage on Entrance Loss Coefficients and Head-Discharge Relationships for Pipe Culvert Inlets: Comparisons of Theoretical Methods and Experimental Results, J. Irrig. Drain. E., 150, https://doi.org/10.1061/JIDEDH.IRENG-10219, 2024. a
Shewchuk, J. R.: Triangle: Engineering a 2D Quality Mesh Generator and Delaunay Triangulator, in: Applied Computational Geometry: Towards Geometric Engineering, edited by: Lin, M. C. and Manocha, D., Lecture Notes in Computer Science, from the First ACM Workshop on Applied Computational Geometry, Springer-Verlag, vol. 1148, 203–222, https://doi.org/10.1007/BFb0014497, 1996. a
Smolders, S. and Bourbain, S.: Applications of the new simplified approach to model obstacles: weirs, culverts and virtual ponds, Proceedings of the 30th TELEMAC User Conference, https://henry.baw.de/server/api/core/bitstreams/12f5c2d8-0dab-4e9c-9664-f813db8d2a5c/content (last access: 13 May 2026), 2024. a
Smolders, S., Leroy, A., Teles, M. J., Maximova, T., and Vanlede, J.: Culverts modelling in TELEMAC-2D and TELEMAC-3D, Proceedings of the 23rd TELEMAC User Conference, 21–33, https://henry.baw.de/server/api/core/bitstreams/01796a18-ef3a-4e07-957b-5728be4ef276/content (last access: 13 May 2026), 2016. a, b, c, d
Truhlar, A. M., Marjerison, R. D., Gold, D. F., Watkins, L., Archibald, J. A., Lung, M. E., Meyer, A., and Walter, M. T.: Rapid Remote Assessment of Culvert Flooding Risk, Journal of Sustainable Water in the Built Environment, 6, 06020001, https://doi.org/10.1061/JSWBAY.0000900, 2020. a
U.S. Department of Agriculture, Soil Conservation Service: National Engineering Handbook, Section 4: Hydrology, Chapter 10: Estimation of Direct Runoff from Storm Rainfall, U.S. Department of Agriculture, Washington, D.C., nEH Notice 4-102, August 1972, https://ia601205.us.archive.org/27/items/CAT71334647003/CAT71334647003.pdf (last access: 13 May 2026), 1972. a, b, c
Valero, D., Bayón, A., and Franca, M. J.: Urban Flood Drifters (UFDs): Onset of movement, Sci. Total Environ., 927, 171568, https://doi.org/10.1016/j.scitotenv.2024.171568, 2024. a
Voit, P. and Heistermann, M.: A downward-counterfactual analysis of flash floods in Germany, Nat. Hazards Earth Syst. Sci., 24, 2147–2164, https://doi.org/10.5194/nhess-24-2147-2024, 2024. a
Weeks, B., Barthelmess, A., Rigby, E., Witheridge, G., and O'Loughlin, G.: Project 11: Blockage of Hydraulic Structures, Stage 1 Report, Engineers Australia, https://arr.ga.gov.au/arr-guideline/revision-projects/project-list/projects/project-11/downloads/ARR_Project_11_Stage1_report_Final.pdf (last access: 13 May 2026), 2013. a, b, c
Wimmer, L. and Hovenbitzer, M.: Introducing a Nationwide High-Resolution Pluvial Flood Map: A New Tool for Risk Assessment and Emergency Management in Germany, Abstr. Int. Cartogr. Assoc., 9, 43, https://doi.org/10.5194/ica-abs-9-43-2025, 2025. a
Wimmer, L., Hovenbitzer, M., Lenk, M., Katz, E.-C., and Engel, M.: Hinweiskarte Starkregengefahren: Ein Projekt des Bundes und der Länder, Korrespondenz Wasserwirtschaft, 2023, 732–737, 2023. a
Wing, O. E. J., Pinter, N., Bates, P. D., and Kousky, C.: New insights into US flood vulnerability revealed from flood insurance big data, Nat. Commun., 11, 1444, https://doi.org/10.1038/s41467-020-15264-2, 2020. a
Winterrath, T., Brendel, C., Hafer, M., Junghänel, T., Klameth, A., Lengfeld, K., Walawender, E., Weigl, E., and Becker, A.: Radar climatology (RADKLIM) version 2017.002; gridded precipitation data for Germany, Deutscher Wetterdienst (DWD), https://doi.org/10.5676/DWD/RADKLIM_RW_V2017.002, 2018. a, b
- Abstract
- Introduction
- Materials and Methods
- Results & Discussion
- Conclusion
- Appendix A: Culvert Data
- Appendix B: In-Depth Analysis of the Influence of Missing Culverts in the Data Set from Authorities
- Appendix C: Hydrographs at different Cross-sections throughout the Catchment
- Appendix D: Inundation area tables
- Data availability
- Author contributions
- Competing interests
- Disclaimer
- Acknowledgements
- Financial support
- Review statement
- References