the Creative Commons Attribution 4.0 License.
the Creative Commons Attribution 4.0 License.
 | 13 May 2026
Monitoring diffuse volcanic degassing with seismic ambient noise
Martin Schimmel
Diffuse volcanic degassing is a persistent and often underestimated natural hazard, with potential impacts on air quality, ecosystem health, and volcanic risk management. Detecting and monitoring this process is challenging, especially in volcanoes lacking visible fumarolic activity, where the final stage of gas migration is jointly modulated by the shallow subsurface structure and natural pressure forcings. We present a continuous monitoring approach based on Rayleigh wave ellipticity from ambient seismic noise to track pressure-driven gas transport in the uppermost soil layers. Applied to Cumbre Vieja Volcano (La Palma, Canary Islands), the method detects subdaily seismic velocity variations linked to periodic pressure oscillations, consistent with natural forcings such as atmospheric and solid earth tides. In this work, we focus on the terdiurnal cycle, the only subdaily band at La Palma Island that reflects purely atmospheric pressure forcing. Its temporal evolution reveals long-term fluctuations that broadly coincide with reported CO2 emission trends, despite differences in spatial and temporal resolution between both estimates. In addition, we identify a clear semiannual cycle in the long-term ellipticity response at the terdiurnal frequency. This seasonality coincides with the modulation by solid Earth tides and confirms their role in controlling permeability in the upper vadose zone and in the enhancement of barometric pumping efficiency across all stations analyzed. Prior to the 2021 eruption, the terdiurnal cycle reveals contrasting station responses, with TBT exhibiting the earliest and most sustained increase. Together, these observations point to the usefulness of this approach as a complementary tool in the assessment of diffuse degassing and volcanic unrest. This seismic-noise-based approach offers a cost-effective and resilient strategy for detecting hazardous gas migration, supporting early warning and mitigation efforts in volcanic regions.
- Article
(14335 KB) - Full-text XML
- BibTeX
- EndNote


Diffuse volcanic degassing is the continuous, nonvisible release of gases from a volcanic system through soil, fractures, and other permeable structures, occurring even during quiescent periods and independently of fumaroles or plumes. Anomalies in this process can represent both a precursor of volcanic activity and a geohazard. However, detecting this subtle volcanic manifestation is challenging due to typically low emission fluxes and the need for specialized instrumentation (Viveiros and Silva, 2024). Among the released gases, carbon dioxide (CO2) and helium (He) are key indicators of magmatic activity, as elevated emissions often precede magma ascent. Despite this, degassing anomalies prior to eruptions remain rare (e.g., Hernández et al., 2001; Pérez et al., 2022). However, even without an eruption, such episodes still constitute a geohazard and provide valuable information on subsurface processes. Therefore, their long- to medium-term monitoring is crucial for improving volcanic hazard assessment and early warning capabilities (Epiard et al., 2017).
The final stage of volcanic gas transport occurs in the vadose zone, the unsaturated region between the water table and the surface, where periodic natural pressure forcings can modulate fluid movement. In coastal volcanic settings, these forcings may arise from barometric tides, ocean tides transmitted through hydraulically connected aquifers, and solid Earth tides, each contributing to poroelastic deformation and pore pressure changes with distinct amplitudes, phases, and penetration depths (e.g., Wang and Manga, 2021; Sato, 2006; Jiao and Li, 2004; Merrit, 2004; Robinson and Bell, 1971). In seismological research, such periodic forcings have been used as natural “pump–probe” experiments to infer subsurface properties (e.g., Bai et al., 2026; Kramer et al., 2023, 2025; Aiman et al., 2023; Delorey et al., 2021; Mao et al., 2019). By focusing on the atmospheric tidal component, this study also adopts a natural pump–probe approach to investigate the upper vadose zone, where gas-phase processes dominate and barometrically induced pressure serves as a proxy for gas transport.
To test this approach, we apply Rayleigh wave ellipticity (RWE) from ambient seismic noise as a high-resolution near-surface monitoring tool (e.g., Seivane et al., 2024) to track gas accumulation at Cumbre Vieja, La Palma. Unlike other volcanic islands with widespread visible degassing, La Palma exhibits limited surface gas emissions, with the only known manifestation being a CO2-rich bubbling cold spring in the Taburiente caldera (Padrón et al., 2015). This unique setting offers ideal conditions to investigate diffuse degassing and to evaluate barometric pumping as a mechanism for detecting subsurface gas accumulation at timescales and depths not yet addressed by existing seismic monitoring networks, with direct implications for improving hazard assessment during volcanic unrest.
Previous studies using seismic noise interferometry in La Palma (e.g., Cabrera-Pérez et al., 2023a; Mezcua and Rueda, 2024) have focused on deeper structures. Therefore, monitoring the vadose zone requires a shift in both spatial and temporal scales. The focus here is the very-near surface, where periodic hourly cycles associated with barometric pumping are known to modulate the rates and magnitudes of gas exhalation (e.g., Forde et al., 2019). Such short-term variations cannot be effectively resolved using ambient noise interferometry with the current seismic network in La Palma, as its station density and frequency resolution are insufficient for detecting these near-surface processes.
Dense seismic arrays with inter-station distances ranging from hundreds of meters to a few kilometers have demonstrated this capability (e.g., Kramer et al., 2023), but their availability is often limited. These constraints motivate the use of an alternative seismic-noise observable that can resolve shallow, sub-daily variability without requiring dense instrumentation or stable noise-source conditions. Compared to traditional methods relying on continuous cross-correlation of ambient seismic noise, monitoring subsurface velocity variations using RWE offers two key advantages: (1) its sensitivity kernels are well-constrained and easily derived across different frequency bands, ensuring reliable depth sensitivity, and (2) it is unaffected by noise source variability, making it particularly robust for real-time monitoring, even during tremor episodes.
In this study, we address the limitations in spatial resolution and sensor requirements of previous approaches by applying RWE as an alternative seismic-noise-based method to characterize the near-surface response to pressure-driven forcings in the sub-daily time-scales. By tracking the long-term evolution of this pressure-driven sub-daily signature, we assess whether the observed variability is consistent with changes in near-surface conditions and with temporal variations in very shallow gas storage conditions in the context of diffuse degassing at La Palma Island.
2.1 Geological and Degassing Setting
La Palma, one of the most volcanically active islands in the Canary Archipelago, is composed of two main volcanic structures: the circular shield volcano of Taburiente in the north and the elongated Cumbre Vieja rift to the south (Fig. 1). Volcanic edifices become progressively younger from north to south, reflecting the southward migration of emerged volcanism (Troll and Carracedo, 2016; Carracedo et al., 2001). Unlike other volcanic islands, La Palma lacks visible fumarolic emissions. Nevertheless, the N–S rift system constitutes a major pathway for deep gas migration and diffuse degassing, with helium measurements indicating mantle-derived contributions (Padrón et al., 2012).
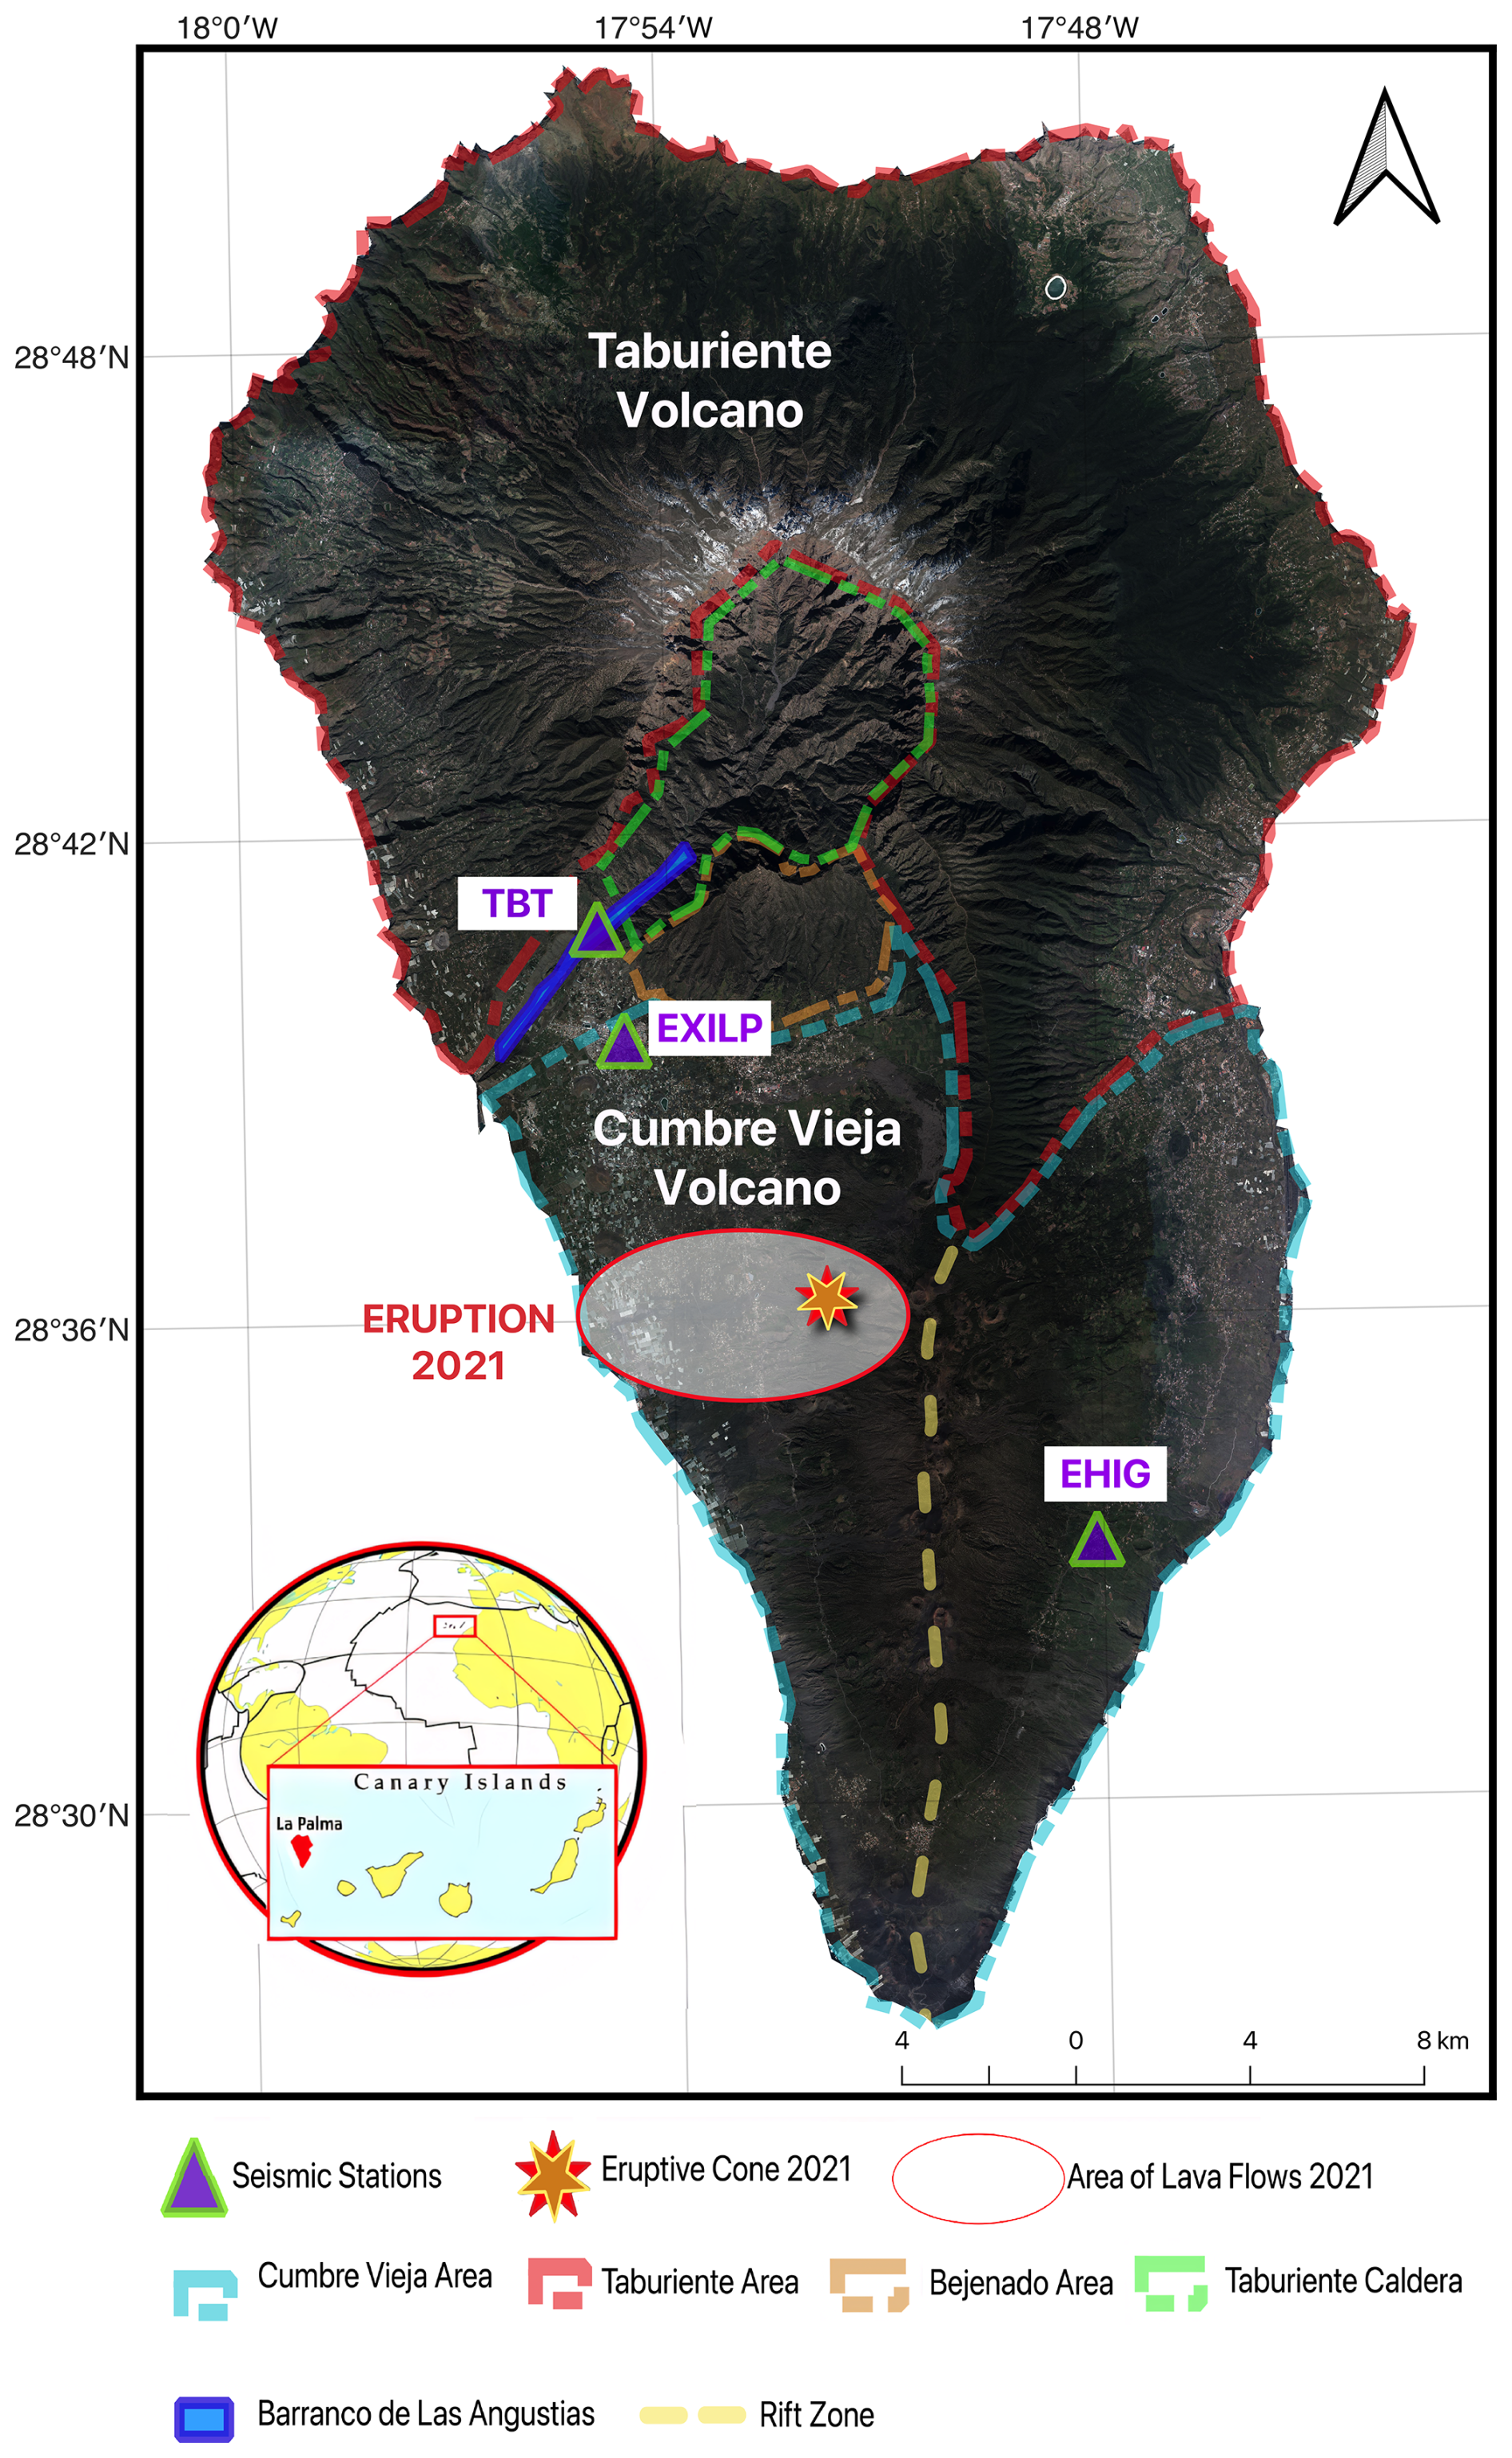
Figure 1Map of the main geological features of La Palma Island, including the northern Taburiente and Bejenado volcanoes, the Taburiente Caldera, and the southern Cumbre Vieja Volcano with its rift zone. The seismic stations used in this study are represented by violet-green triangles, and the area affected by the 2021 eruption is also highlighted. The background orthophoto of La Palma is based on OrtoPNOA 2024 (CC-BY scne.es), with modifications by the authors.
2.2 Structural Controls on Shallow Gas Transport
Shallow gas transport in La Palma is strongly conditioned by the rift architecture and a dense network of magmatic dikes extending from the Basal Complex to the most recent basaltic deposits (Poncela et al., 2022). Dikes and associated discontinuities can compartmentalize the subsurface and modify permeability, thereby influencing gas migration pathways and the transmission of pressure perturbations in the near-surface. Fractures and other permeable pathways further facilitate the propagation of pressure variations through porous media and can promote gas migration from depth (Nilson et al., 1991). Overall, the efficiency of pressure-driven transport depends on the distribution of permeable pathways and on material properties such as porosity, permeability, and water content. Vertical dike intrusions, which are abundant in the Taburiente Caldera and within the basal complex, can impose permeability anisotropy. This enhances transport along dike-parallel directions while reducing it perpendicular to their orientation.
2.3 Vadose Zone Characteristics
The vadose zone is the target of this work, as it is the shallow domain where atmospheric pressure forcing can modulate gas transport. Its thickness varies markedly across the island (García-Gil et al., 2023). In the Barranco de las Angustias, groundwater levels are high and perennial runoff occurs, a rare condition on the island. Here, the vadose zone is only a few meters thick. In contrast, in the central rift zone, where groundwater lies deeper, it can reach several hundred meters.
Because both pressure diffusion and gas transport in the vadose zone depend strongly on the physical properties of the hosting materials, spatial contrasts in porosity and permeability are expected to influence the magnitude and timing of the atmospheric pressure-driven response. In Cumbre Vieja, younger basaltic flows generally exhibit higher porosity and permeability than the older, more compacted basalts of Taburiente (Fig. 1), consistent with the strong dependence of these properties on deposit age, compaction, and degree of fracturing.
2.4 2021 Eruption Context and Motivation
The 2021 Cumbre Vieja eruption was preceded by years of deep seismicity (25–35 km) since 2017 and was marked by a rapid escalation of unrest in September 2021. Seismicity migrated from ∼10 km depth to shallower levels beginning on 11 September 2021, accompanied by clear deformation signals. A progressive decrease in seismic velocity () was reported 9.5 d before the eruption (Cabrera Pérez et al., 2023a), localized near the future eruptive centers and associated with a cluster of shallow earthquakes (<4 km) appearing only four days before the onset. This pattern suggests that hydrothermal fluids released by ascending magma may have reached the near-surface ahead of the magma itself (Carvalho et al., 2024; Cabrera Pérez et al., 2023a), consistent with the dual ascent pathways proposed by Mezcua and Rueda (2023).
The eruption began on 19 September and lasted 85 d, destroying over 2800 buildings and covering nearly 1000 ha with lava and pyroclasts. While provided important precursory information, strong volcanic tremor during the eruptive phase can limit the applicability of ambient noise interferometry for real-time monitoring. This motivates complementary approaches that remain robust under high tremor levels, including single-station observables such as RWE that remain unaltered by source variability when interferometric measurements degrade.
3.1 Gas-Phase Flow and Seismic-Velocity Variations from Atmospheric Forcing in the Vadose Zone
Daily fluctuations in atmospheric pressure, known as atmospheric tides, arise mainly from the absorption of solar radiation in the atmosphere (e.g., Ramesh et al., 2025). These tides are oscillations with periods which correspond to integer fractions of a solar day, primarily at 24 h (diurnal), 12 h (semidiurnal), and 8 h (terdiurnal). These variations can induce periodic pressure changes in the Earth's subsurface, which can drive subsurface gas movement through porous and fractured earth materials, a process known as barometric pumping. This phenomenon has been widely studied in diverse contexts, including contaminant transport, gas leakage in oil and gas wells, and cave ventilation (e.g., Gomell et al., 2021; Forde et al., 2019; Auer et al., 1996).
The efficiency of barometric pumping in mobilizing subsurface gases depends on the physical properties of the porous medium and surrounding conditions. In environments where the pore space is predominantly gas-filled with negligible liquid water, gas flow can be treated as single-phase. This condition is commonly met in the upper vadose zone, where gas dominates and water content remains low. In practice, true steady-state flow is rarely achieved in subsurface gas transport. Instead, gas movement typically occurs under transient flow conditions, where pressure, density, and flow rate fluctuate over space and time. This behavior is governed by a diffusion-type partial differential equation, mathematically analogous to heat conduction in solids or solute diffusion in liquids. Unlike these stochastic processes, pressure diffusion in porous media follows Darcy's law, which describes fluid movement through a porous matrix. Mathematically, Darcy's law is analogous to fundamental transport laws such as Ohm's law for electrical conduction, Fick's law for solute diffusion, and Fourier's law for heat conduction (Zimmerman, 2018).
The governing equation for pressure diffusion in porous media results from coupling Darcy's law with mass conservation (e.g. Lin, 1977; Brace et al., 1968). Under isothermal conditions, assuming one-dimensional transient gas flow in a homogeneous and isotropic medium, the governing equation is expressed as a partial differential equation
where P is the gas pressure, t is time, z is the vertical coordinate, k is the medium permeability, ϕ the medium porosity and μ the gas viscosity. The total compressibility ct is defined as the sum of the medium (cm) and gas (cg) compressibilities (), where is taken as the pore-volume compressibility with Vp denoting the pore volume and Pc the confining pressure (Zimmerman, 2017). The coefficient multiplying the spatial second derivative in Eq. (1) defines the hydraulic diffusivity D
which controls the rate at which pressure perturbations propagate through the porous medium.
3.1.1 Short-term response to subdaily atmospheric tides
For harmonic atmospheric forcing, the surface boundary condition can be written as
and the corresponding analytical solution for Eq. (1) is
where ω is the frequency of the atmospheric fluctuations (Hanks and Woodruff, 1958). Equation (4) shows that atmospheric tides generate a depth-dependent oscillatory pore-gas pressure field characterized by exponential amplitude decay and a progressive phase lag with depth, both controlled by the hydraulic diffusivity. These cyclic pore-gas pressure changes can imprint on seismic observations as subdaily modulations of the relative seismic velocity changes (e.g., Kramer et al., 2025; Wang et al., 2025; Mao et al., 2019).
In particular, for unsaturated and dry conditions in a regime where the relative motion between gas and solid phases is negligible, Conte et al. (2009) express the shear- and compressional-wave velocities as
and
where G is the shear modulus, φ is the porosity, νSK is Poisson's ratio of the soil skeleton, ρg and ρS are the densities of gas and solid phases, and Kg denotes the bulk modulus of the gas filling the soil pores. Crucially, only VP depends directly on pore-gas pressure through the pressure-dependent bulk modulus . Therefore, the pore-gas pressure oscillations predicted by Eq. (4) provide a pressure-controlled mechanism for generating subdaily changes in compressional-wave velocity within the vadose zone.
3.1.2 Long-term evolution under a gas-injection scenario
Beyond the subdaily response described above, sustained diffuse degassing can progressively modify the background state of the vadose zone by increasing gas content and mean pore-gas pressure. Under a gas-injection scenario, increasing mean pore-gas pressure reduces the effective gas compressibility (cg), thereby decreasing (ct) and increasing the hydraulic diffusivity (D). Consequently, atmospheric pressure oscillations are expected to penetrate deeper and attenuate less strongly, producing larger pore-gas pressure amplitudes at depth and modifying the phase lag relative to the surface forcing (Eq. 4). Progressive gas accumulation should therefore strengthen the subsurface imprint of atmospheric tides by enhancing pressure transmission through the vadose zone.
Long-term gas injection can also affect seismic velocities through changes in pore-gas density. An input of additional gas into the pore space increases ρg, slightly raising the overall bulk density (. As implied by Eq. (5), this leads to a slight decrease in VS if the shear modulus (G) remains unchanged. In contrast, the long-term evolution of VP reflects the combined influence of density and the pressure-dependent gas bulk modulus (Kg) (Eq. 6), such that evolving pore-gas conditions are expected to modulate more strongly VP than VS (e.g., Sánchez-Pastor et al., 2023). Accordingly, increasing gas accumulation is expected to manifest as a modest VS decrease, together with an enhanced and more persistent subdaily modulation of VP driven by atmospheric tides.
Importantly, the seismic observable used in this study (RWE) is sensitive to near-surface velocity variability but does not uniquely separate the relative contributions of VP and VS nor does it determine the sign of the underlying perturbation without independent constraints (e.g., direct velocity measurements). The analysis of barometric pumping reduces this ambiguity because it introduces an externally imposed forcing with a constrained physical effect: in the unsaturated vadose-zone regime considered here, subdaily pressure oscillations primarily modulate the pore-gas bulk modulus rather than the shear modulus of the solid skeleton. Therefore, although our methodology does not explicitly distinguish VP from VS, examining the long-term evolution of the subdaily atmospheric-tide response provides a more constrained basis for interpretation of the observed RWE variations in terms of pressure-driven, gas-controlled changes in the vadose zone.
For this reason, the Results section focuses on the long-term evolution of the subdaily atmospheric-tide response. We examine temporal changes in its amplitude, persistence, and phase and evaluate whether they are compatible with progressive gas injection and a more efficient transmission of pressure oscillations into the vadose zone. In this framework, RWE variability is interpreted primarily in terms of pressure-driven, gas-controlled changes in the shallow subsurface.
3.1.3 Selection of the Atmospheric Cycle
The interpretation of subdaily pressure oscillations in terms of hydraulic diffusivity D, and therefore in terms of subsurface variability, requires isolating the contribution of atmospheric forcing from other potential drivers. As indicated by Eq. (4), both amplitude attenuation and phase shift depend on the hydraulic diffusivity D. An increase in D reduces attenuation and decreases the phase lag with depth, while a decrease in D has the opposite effect. However, when multiple natural forcings act simultaneously and induce pressure oscillations in the subsurface (e.g., atmospheric tides, solid Earth tides, and aquifer fluctuations), changes in the observed amplitude or phase of the induced velocity response may not exclusively reflect variations in diffusivity but can also result from the superposition of different forcings (e.g., Kuang et al., 2013).
To minimize this ambiguity, we concentrate on atmospheric tidal components that are spectrally well separated from other periodic forcings. In La Palma, the most robust strategy to confidently isolate the atmospheric contribution is to focus on the 8 h atmospheric tide. This component is clearly expressed in the atmospheric pressure spectrum, whereas the corresponding 8 h oceanic, solid Earth, and temperature tidal constituents are nearly absent (Fig. 2). This spectral separation makes the 8 h band a clean subdaily diagnostic of barometric forcing. In La Palma, the 8 h barometric tide has an amplitude more than an order of magnitude smaller than the dominant 12 h component (Fig. 2), with a peak-to-peak variation of 3.5 Pa. In contrast, the 8 h ocean tide (M3) is nearly three orders of magnitude weaker than the principal 12 h ocean tide (M2) (Dirección General de Costas, 2004), further reinforcing its suitability as a barometric indicator in this setting.
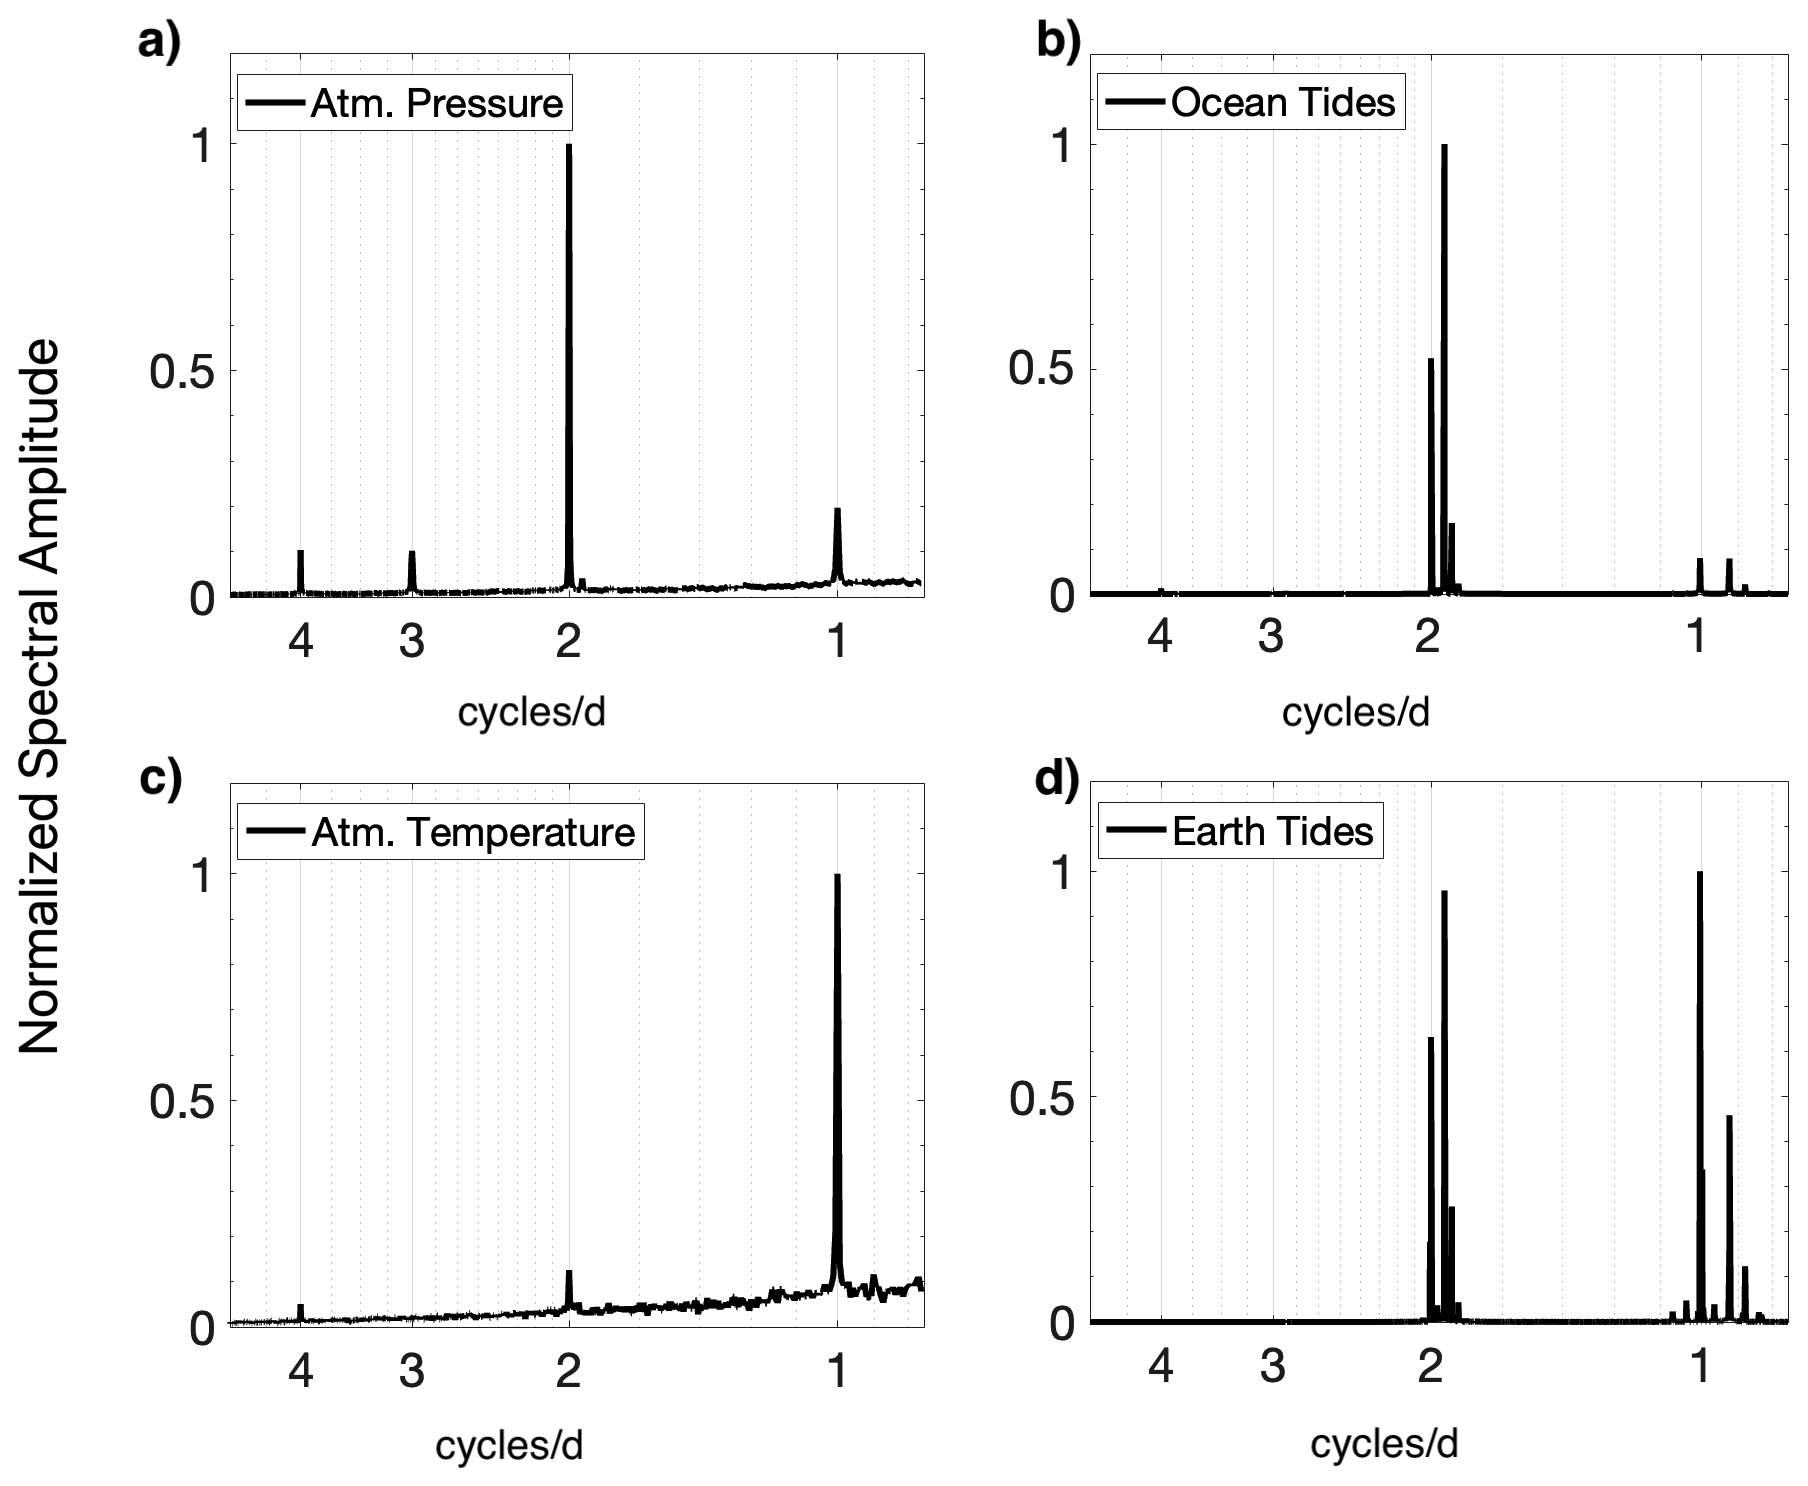
Figure 2Normalized amplitude spectra obtained from the Fourier transform of: (a) atmospheric pressure time series retrieved from ERA5 (https://cds.climate.copernicus.eu/datasets/, last access: 29 August 2025), (b) ocean tide time series reconstructed from the harmonic constituents of Tazacorte Port (Dirección General de Costas, 2004), (c) atmospheric temperature time series from ERA5, and (d) vertical solid Earth tide displacement for La Palma Island derived with pysolid (Yunjun et al., 2022).
The applicability of the 8 h barometric tide in other regions is expected to depend on its spatial variability. While the 24 and 12 h atmospheric tides exhibit relatively consistent large-scale patterns (e.g., McMillan et al., 2019), the 8 h component is less well constrained and can vary significantly with longitude and regional atmospheric conditions (e.g., Moudden and Forbes, 2013), as it may arise from the superposition of multiple tidal components. Therefore, although the 8 h signal provides a useful diagnostic in La Palma due to its spectral isolation, its detectability and amplitude may differ substantially elsewhere, and its applicability should be evaluated on a site-by-site basis.
3.2 Monitoring of Seismic Velocity Variations through Rayleigh wave Ellipticity
The particle motion of Rayleigh waves is polarized along a vertical ellipse, whose ellipticity, defined as the ratio between its horizontal and vertical components, is highly sensitive to the subsurface structure beneath the recording site. This sensitivity derives mainly from the structure around the receiver up to a distance of about half the wavelength (Maupin, 2017) and shows a strong frequency dependence related to near-surface layering (e.g., Cercato, 2018). Building on these properties, several recent studies have proposed and validated the use of RWE as a tool to monitor temporal changes in shallow structure (e.g., Seivane et al., 2024; Jones et al., 2023).
In this study, we exploit RWE in a time-lapse framework to indirectly monitor subdaily, atmosphere-driven variations in shallow seismic velocities. Our aim is to characterize the long-term spectral variability of these seismic velocity oscillations, and in particular those triggered by the 8 h barometric period described in Sect. 3.1. We focus on spectral variability rather than on raw RWE variations because the spectral variability of RWE is easy to access and permits a direct correlation to the driving forces. In the absence of independent VP or VS measurements, absolute RWE variations cannot be straightforwardly converted into relative velocity changes. In contrast, the spectral domain allows us to isolate specific periodic components and quantify their persistence and relative strength over time.
The seismic dataset used in this study includes both broadband velocity sensors and accelerometers. To ensure consistency in particle motion analysis, recordings from accelerometers were converted to velocity using the instrument response prior to further processing. As a general procedure for each analyzed seismic station in this work, and following the workflow proposed by Seivane et al. (2024), we first apply the DOP-E method (Berbellini et al., 2019; Schimmel and Gallart, 2003) to retrieve the RWE function using a 2 h sampling interval. At each sampling time, ellipticity is estimated from a single 80 s analysis window. This methodology employs the eigen-decomposition of the spectral covariance matrix to compute the degree of polarization (DOP), the semi-major and semi-minor axes of the particle motion, and the corresponding planarity vector (Berbellini et al., 2019; Schimmel et al., 2011; Schimmel and Gallart, 2004). Within each 80 s analysis window, multiple elliptically polarized Rayleigh-wave signals may be identified, potentially arriving from different directions. Only signals exhibiting stable elliptically polarized motion are retained. To isolate a clean fundamental Rayleigh-wave mode, we discard signals for which the semi-major axis deviates by more than 10° from the vertical and retain only those with a DOP greater than 0.75. Ellipticity is computed for each retained signal as the amplitude ratio between the instantaneous semi-major and semi-minor axes, and the ellipticity value assigned to the window is taken as the median of all retained values at each frequency. In this way, for every analyzed frequency we construct an RWE time series with 2 h sampling, which forms the basis for the long-term spectral analysis carried out in this study.
To analyze the temporal behavior of these RWE series, we depart from the approach of Seivane et al. (2024) and, instead of computing the Dissimilarity Index (DSI), we directly examine the raw ellipticity variations as a function of frequency and time. This frequency-by-frequency approach preserves the full spectral resolution of the ellipticity function and allows the identification of narrow-band periodic signals. Compared to the DSI-based methodology, this direct analysis improves sensitivity to localized changes confined to specific frequencies or narrow frequency ranges. With this approach, we aim to resolve an 8 h period in the RWE variability and to confidently attribute it to changes in the subsurface medium rather than to temporal fluctuations in the noise sources.
As presented above, a key strength of the DOP-E-based RWE measurement is its reduced sensitivity to noise source variability, which makes it particularly robust for real-time monitoring, even during tremor episodes and in high-frequency seismic noise bands that are often dominated by anthropogenic and highly variable sources (e.g., Lecocq et al., 2020; Díaz et al., 2017; Bonnefoy-Claudet et al., 2006). In this context, RWE offers a valuable alternative within the broader family of single-station methods used to monitor temporal changes in shallow structure. A comparable alternative to RWE is the horizontal-to-vertical spectral noise ratio (HVSNR) method, which has demonstrated similar sensitivity to velocity variations associated with groundwater dynamics (Galone et al., 2024; Seivane et al., 2022; Vassallo et al., 2022). However, the HVSNR method is highly dependent on wavefield composition (see Fig. A1 in Appendix) and can be significantly affected by transient disturbances (Haghshenas et al., 2008). Consequently, its applicability for continuous structural monitoring during tremor episodes is constrained by the same limitations, i.e. wavefield variability, that affect ambient noise interferometry (e.g., Carvalho et al., 2024; Cabrera-Pérez et al., 2023a; Sánchez-Pastor et al., 2018).
4.1 Long-term RWE spectral characteristics at EHIG station
To demonstrate the impact of gas injections from diffuse volcanic activity on the upper vadose zone and the ability of RWE to monitor these changes, we analyzed the long-term record (2007–2023) of the EHIG seismic station (Fig. 1). Figure 3 provides an overview of the RWE observations for one representative year at this station, including a time–frequency representation, the annual median curve and the corresponding raw time series at 48 Hz. This station is particularly suited for our study because it was operative during the well-documented episode of increased diffuse CO2 emissions reported by Padrón et al. (2015) between 2007 and 2012, and it continued recording throughout subsequent volcanic unrest and the 2021 eruption. Although pre-eruptive swarms in 2021 were accompanied by reports of enhanced degassing (e.g., Santana de León et al., 2022), the lack of quantitative CO2 flux data prevents direct comparison for that period.
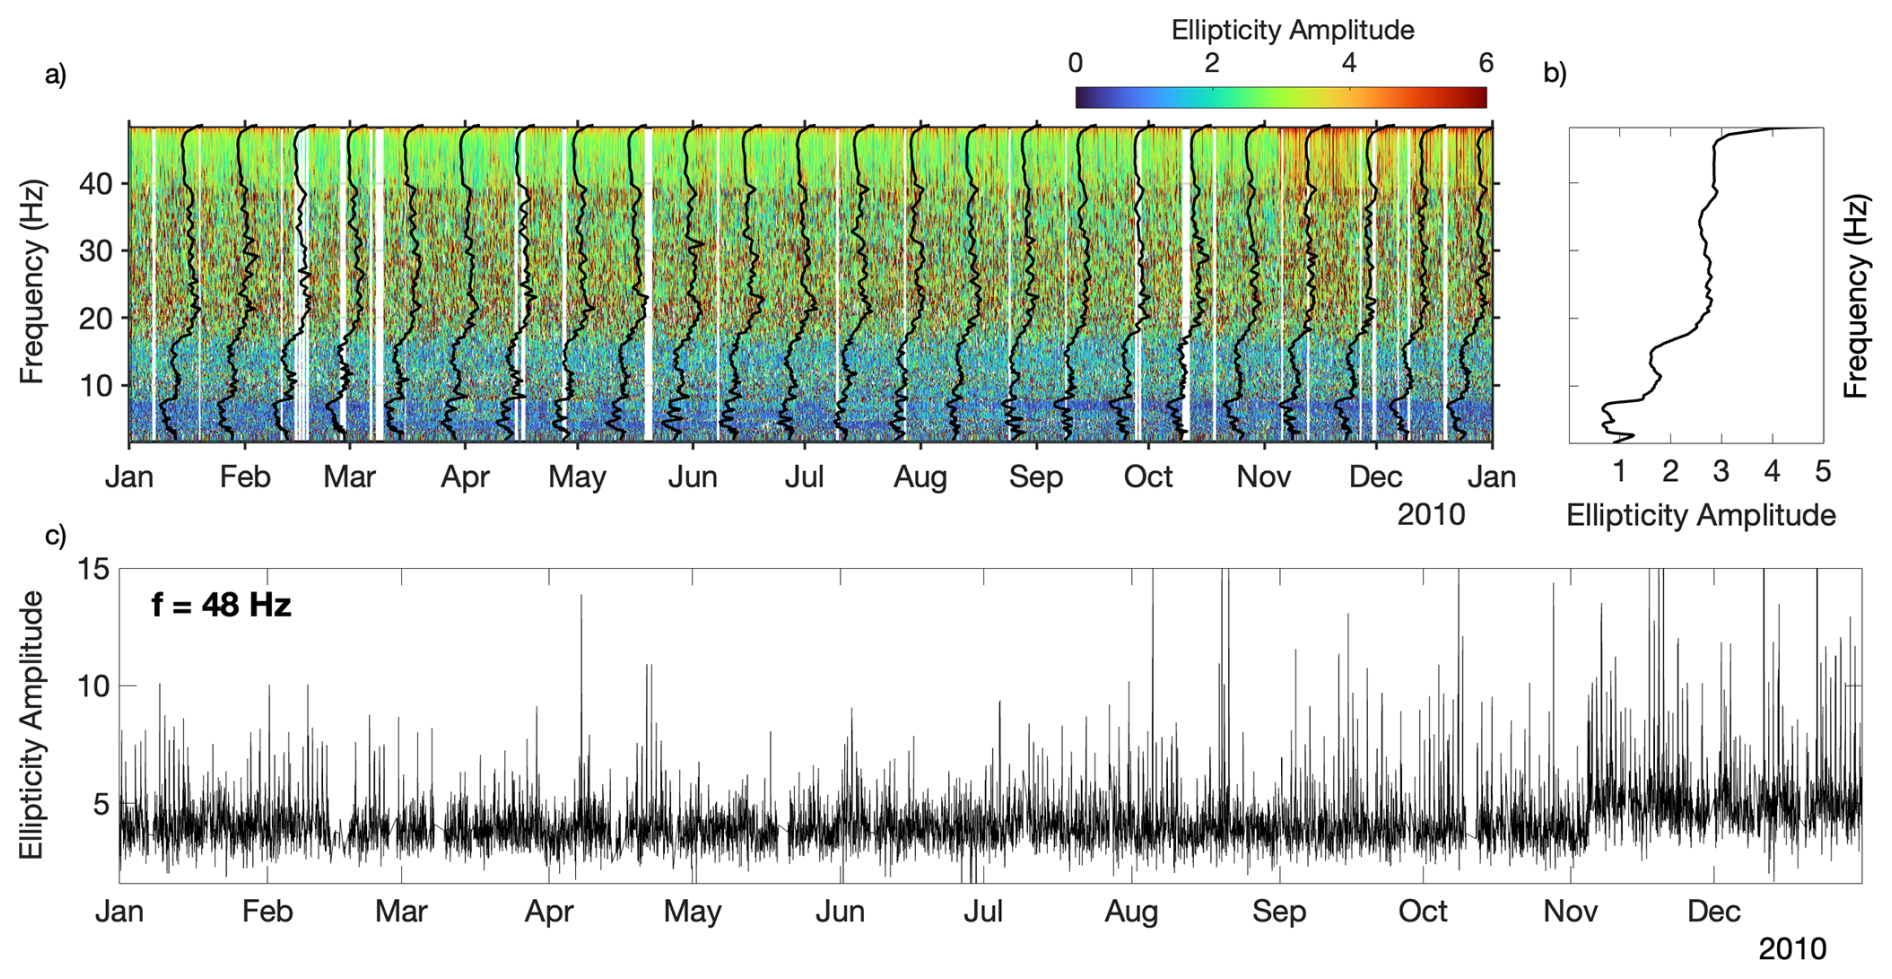
Figure 3RWE observations at EHIG station during 2010, showing the temporal evolution and frequency-dependent behavior of the RWE curve for the same year analyzed in Fig. 5. (a) Time–frequency representation of hourly ellipticity measurements (1–50 Hz). Black curves denote the median ellipticity functions computed every 15 d. (b) Annual median ellipticity curve for 2010. (c) Raw RWE time series at 48 Hz, showing the hourly variability examined in Fig. 5.
Figure 4a shows the spectrogram of the RWE series at station EHIG in the 0.8–5 cycles per day (cpd) band. To construct this figure, the RWE time series at each analyzed frequency for one representative year within the full record (2007–2023) was segmented into overlapping 30 d windows. Within each window, the mean was removed and a fast Fourier transform (FFT) was applied to obtain the frequency spectrum of the detrended signal. At station EHIG, the dominant spectral peaks occur at 1 and 2 cpd (hereafter E1 and E2), confined to the 40–50 Hz frequency range. In addition, weaker but well-defined peaks appear at 3 and 4 cpd (E3 and E4) between 45 and 50 Hz. The long-term spectrogram of the 48 Hz RWE series (Fig. 4b) confirms the persistence of all four components (E1–E4) throughout 2007–2023, corresponding to periods of 24, 12, 8, and 6 h, respectively.
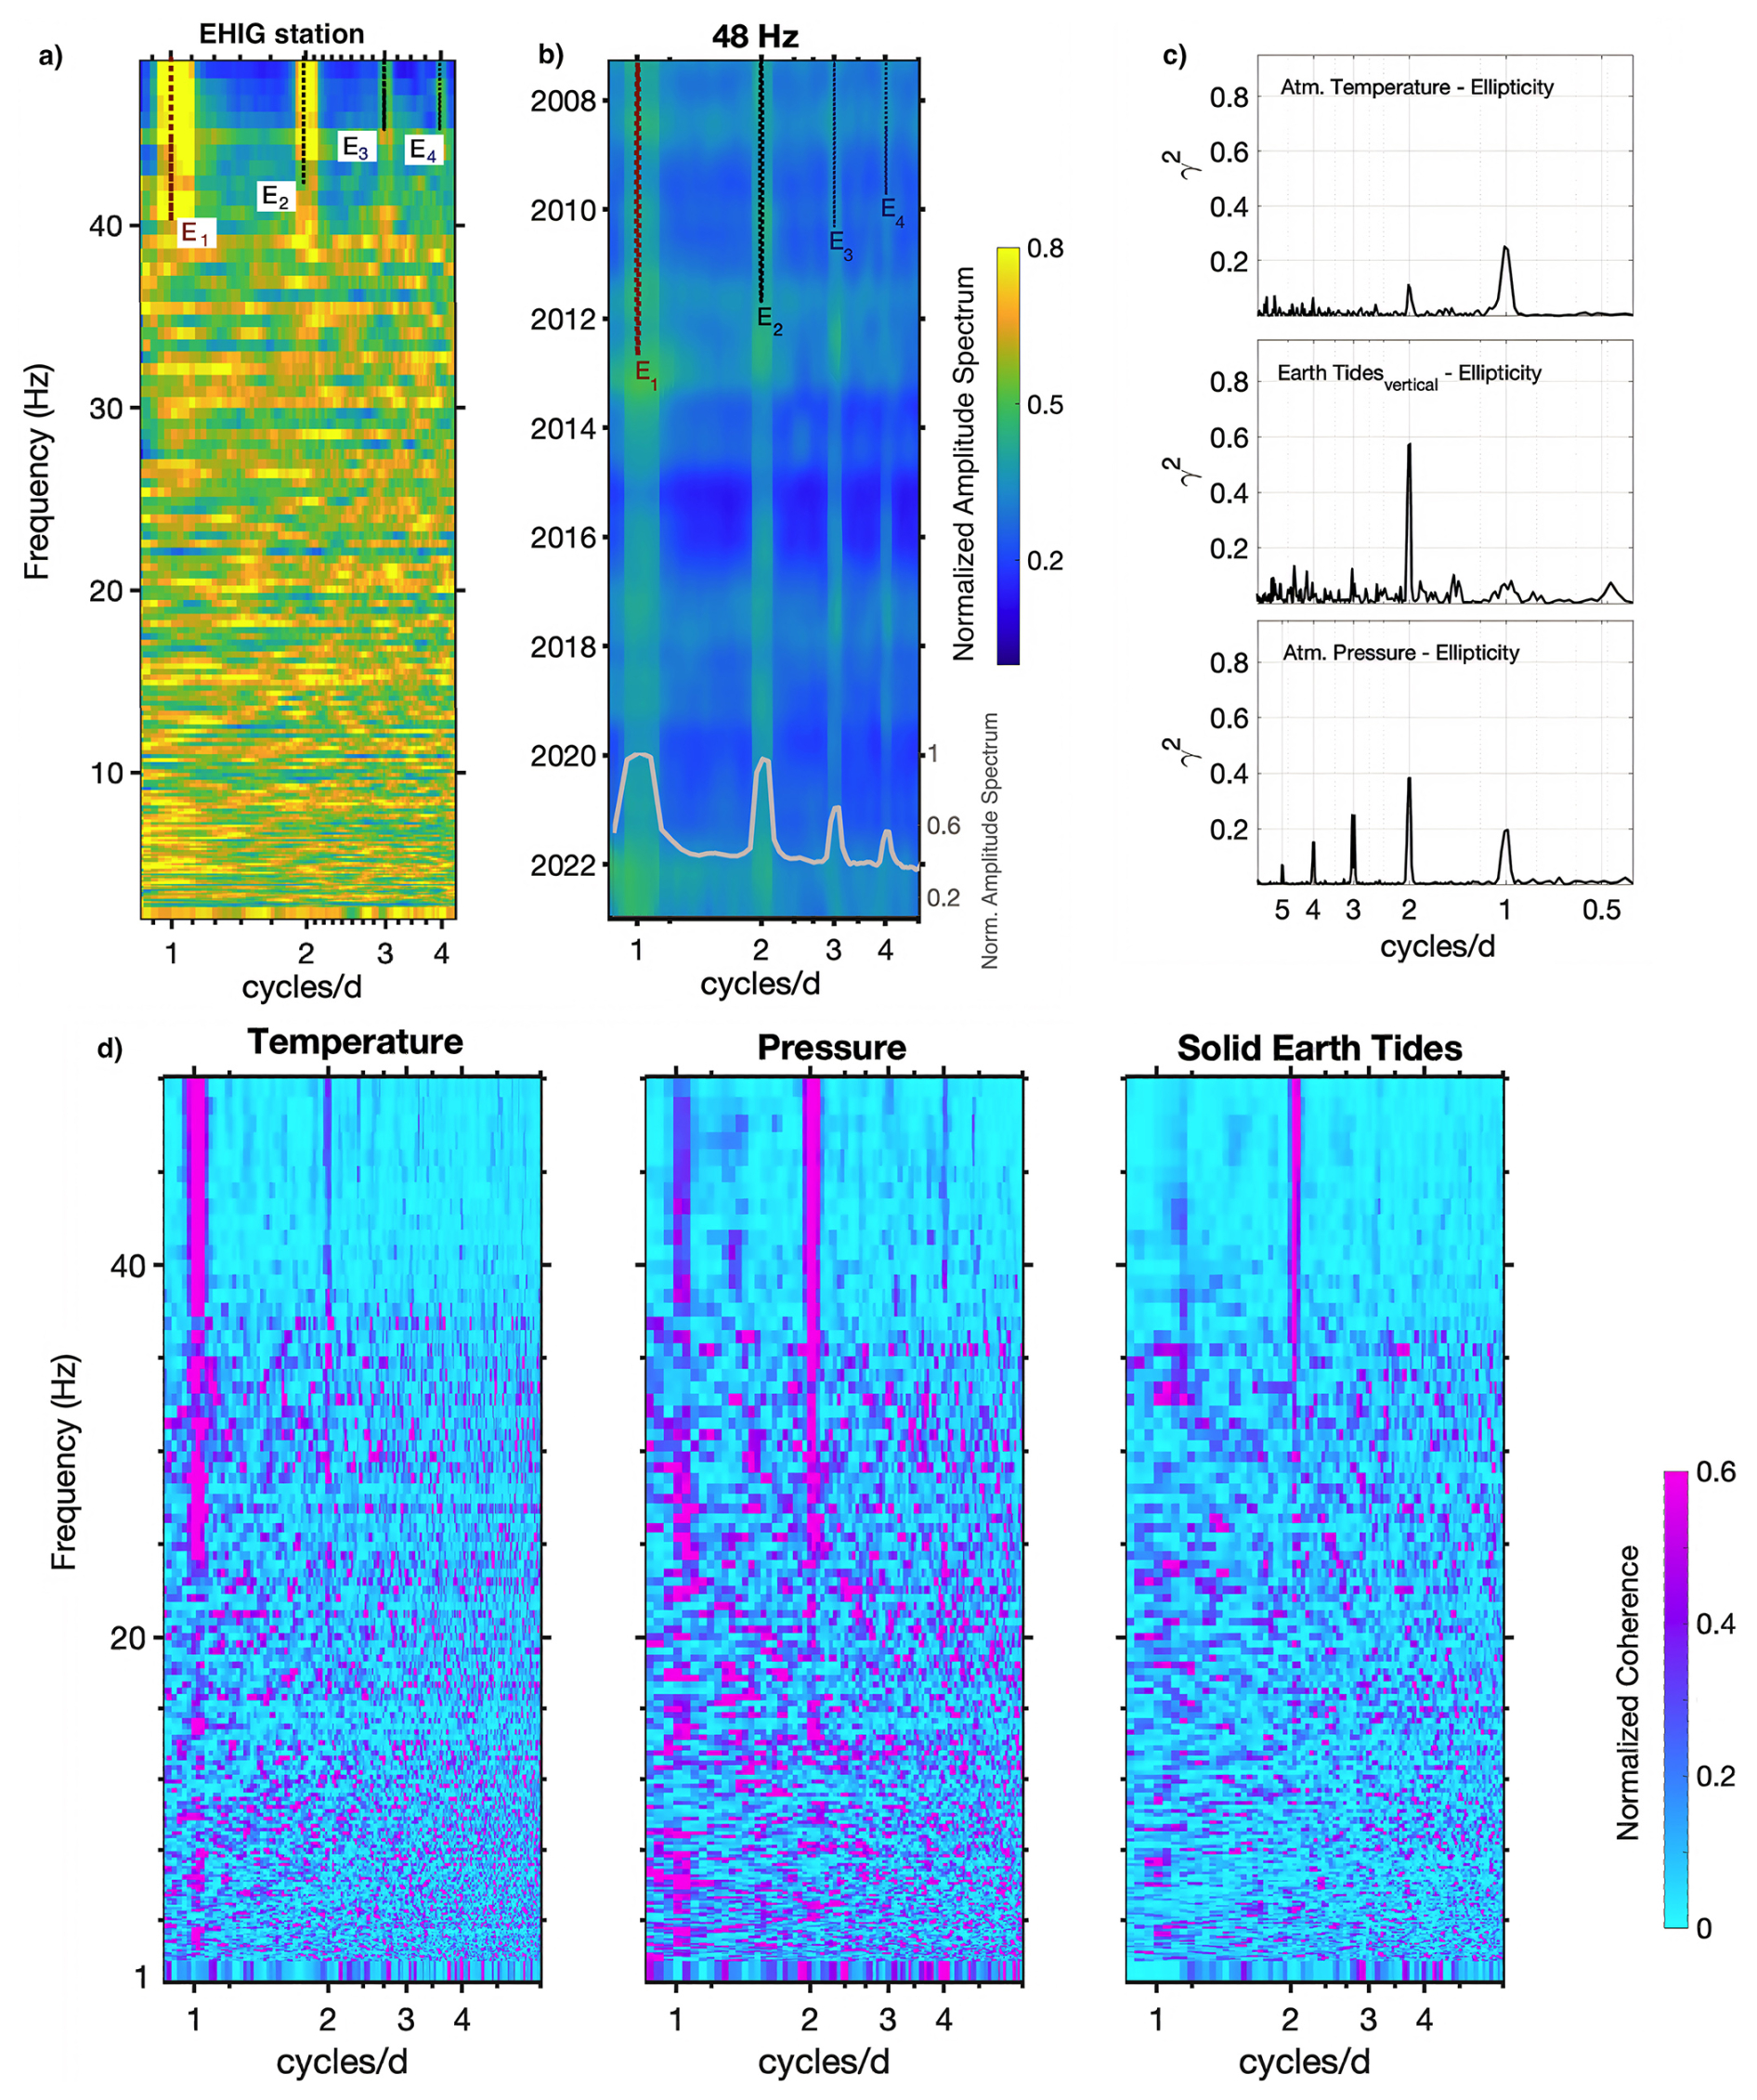
Figure 4(a) Normalized frequency–period Fourier spectrogram of the RWE series during 2010 (frequency range 1–50 Hz) at EHIG station. Sliding windows of 30 d with 50 % overlap were applied. Distinct spectral peaks at 1, 2, 3, and 4 cycles per day are observed and labeled as E1–E4. (b) Time–frequency Fourier spectrogram of the 48 Hz RWE series (2007–2023), showing the persistence of the four subdaily components throughout the record. The overlaid gray curve at the bottom displays the time-stacked normalized average spectrum over the entire study period. (c) Magnitude-squared coherence (MSC) between 48 Hz ellipticity and external drivers: atmospheric temperature (top), vertical component of displacement from solid Earth tides (middle), and atmospheric pressure (bottom). (d) Frequency–period MSC maps between RWE and the three drivers for the period 2007–2010. Sliding windows of 30 d with 50 % overlap were used. For visualization, coherence at each RWE frequency was normalized by its maximum.
4.1.1 Coherence analysis between RWE and external forcings
To investigate the link between RWE and known tidal forcings, we calculated the magnitude-squared coherence (MSC) between RWE and potential external drivers: atmospheric pressure and temperature time series derived from the ERA5 reanalysis database, and vertical solid Earth tides computed with the Python package pysolid (Yunjun et al., 2022). MSC quantifies, in the frequency domain, the linear correlation between two time series through their cross-spectra, and helps identify phase and amplitude synchronizations. It is defined as:
Where Pxx(f) and Pyy(f) are the power spectral densities (PSD) of the two time series, and Pxy(f) is their cross-spectral density. We estimated MSC using Welch PSD method (Welch, 1967), as implemented in the MATLAB function pwelch. The RWE and driver series were aligned to a common 2 h interval, segmented into overlapping windows of 60 d, tapered with a Hanning window, and averaged in the frequency domain.
The MSC spectra shown in Fig. 4c for the RWE function at 48 Hz compared to the three different tidal forcings indicate that the observed spectral peaks in RWE (Fig. 4a and b) are statistically significant and highly correlated with the external drivers. However, statistically significant coherence does not necessarily imply a causal relationship. For instance, in the MSC between RWE at 48 Hz and the vertical displacement of solid Earth tides, the most prominent peak appears at 2 cpd. In contrast, at 1 cpd where the solid Earth tide spectrum exhibits its strongest peak (Fig. 2d), no clear correspondence with RWE is observed. This discrepancy can be explained by the fact that both barometric and solid Earth tides share the 2 cpd harmonic. In this case, coherence does not reflect a direct causal link between solid Earth tides and RWE, but rather an indirect relationship mediated by the common periodicity present in barometric pressure oscillations. We infer that barometric pressure is the dominant driver at 2 cpd, as only the MSC between atmospheric pressure and ellipticity displays a clear correlation at 1 cpd and across all harmonics (Fig. 4c), as also reported by Kramer et al. (2023).
Figure 4d presents the MSC maps for all frequencies of the RWE function at station EHIG with respect to the three external drivers considered. Consistent with the spectrograms (Fig. 4a and b), the E1 and E2 components exhibit the highest coherences with well-defined spectral peaks. In contrast, the targeted terdiurnal component (E3) is only discernible at the highest frequencies (>45 Hz) in the coherence map with atmospheric pressure. These results motivate restricting the long-term analysis of the 3 cpd behavior to the 40–50 Hz frequency band.
4.1.2 Long-term transfer function analysis of the 3 cpd component
Having established that the terdiurnal component (E3) is restricted to the 40–50 Hz band, we next examine its long-term variability over 2007–2023. This analysis provides the basis for linking the 3 cpd oscillations to diffuse gas injections and to their imprint on the long-term subdaily velocity response in the shallow vadose zone. To do so, we assume that the coupling between atmospheric pressure and RWE variations can be described as a linear time invariant system at that period. Under this assumption, the system response can be characterized by the complex transfer function
The magnitude quantifies the gain of the RWE response relative to the input, while its phase expresses the frequency-dependent delay. As in the coherence analysis, all spectra were estimated with the Welch method using Hanning tapers.
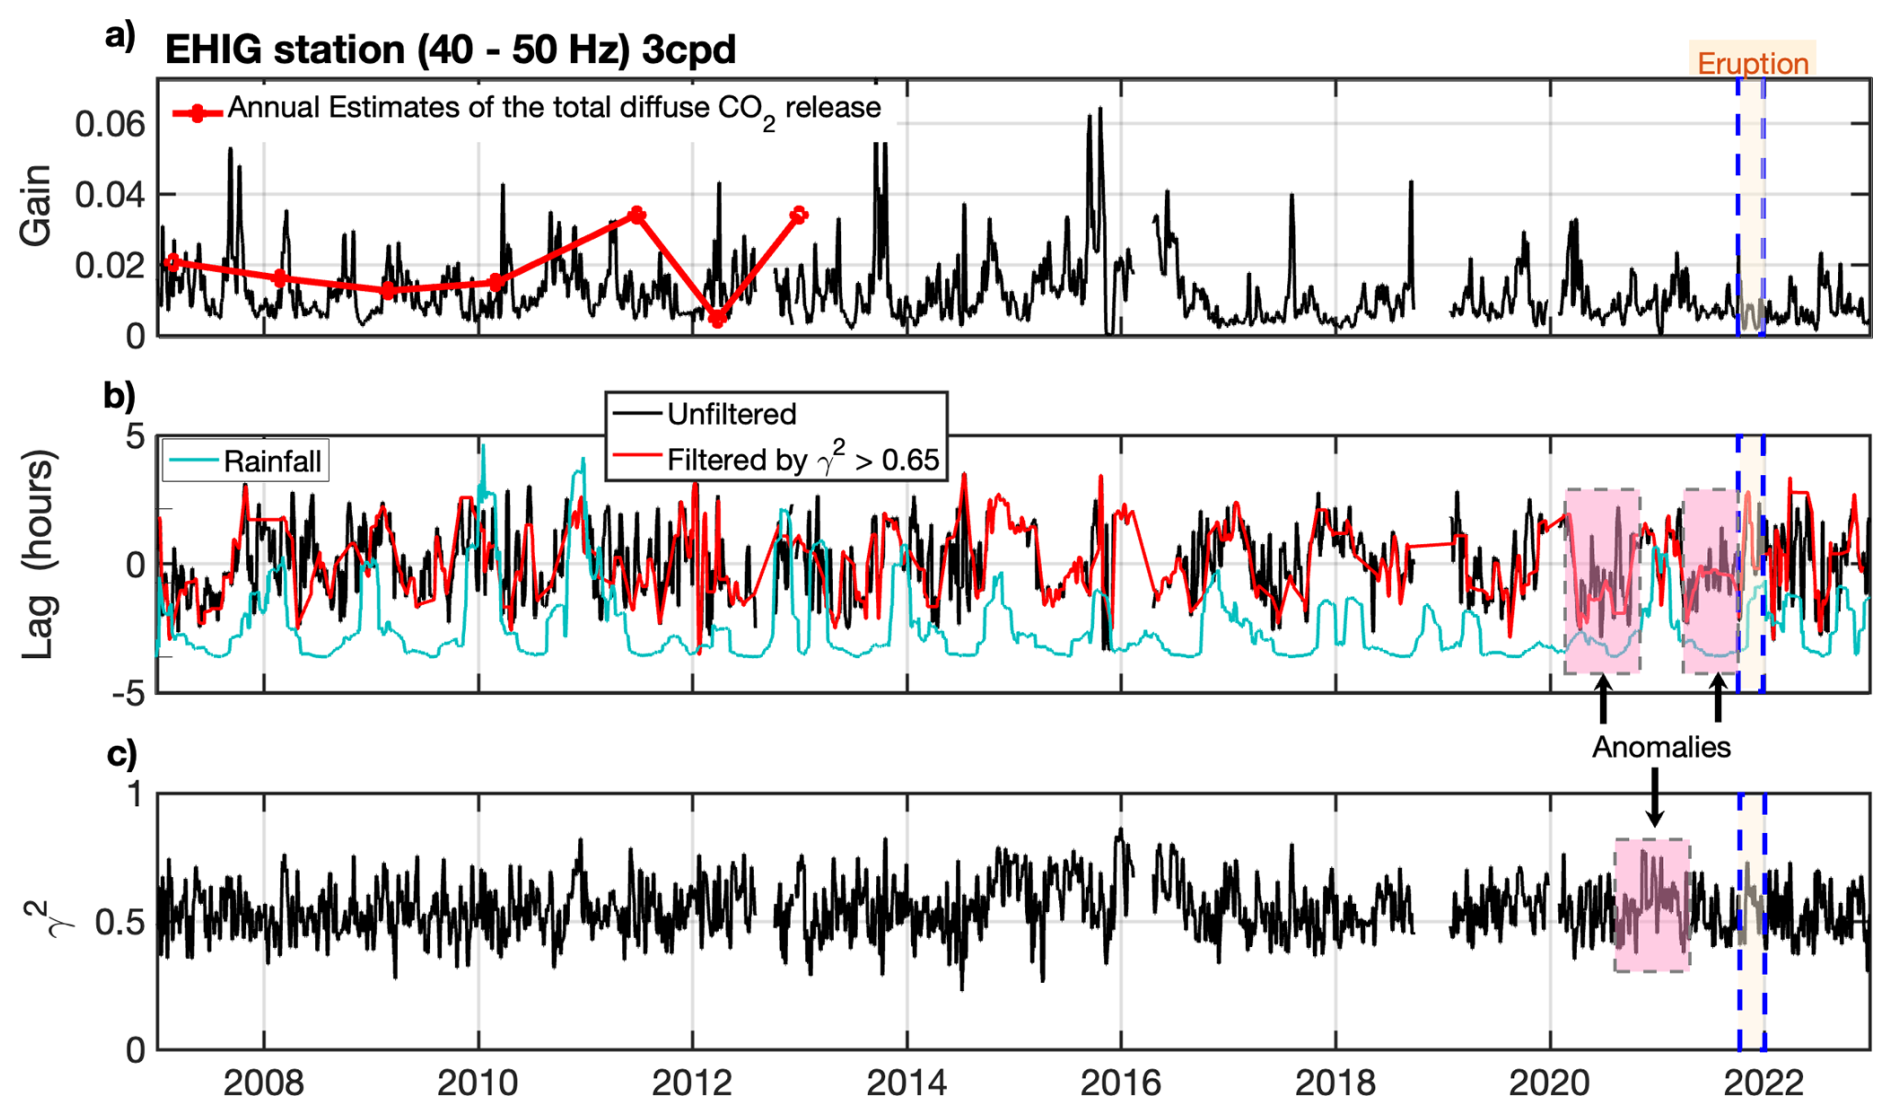
Figure 5(a) Gain at EHIG station (40–50 Hz band, 2007–2023) shown in black, with annual estimates of the total diffuse CO2 release overlaid in red. (b) Phase lag at 3 cpd (black) together with the same series filtered by magnitude-squared coherence γ2>065 (red), and rainfall shown in cyan. (c) Magnitude-squared coherence γ2 at 3 cpd. All three metrics were computed in sliding windows of 15 d with 13 d overlap (2 d step) on time series sampled at 2 h intervals, and displayed as 5-point moving medians. The dashed blue rectangle marks the 2021 eruption. Shaded pink boxes highlight anomalous intervals discussed in the text.
Figure 5 shows the temporal evolution of the gain, phase lag, and MSC at the terdiurnal frequency (3 cpd) for the EHIG station from 2007 to 2023. These results were obtained using 15 d sliding windows with a 2 d step, and the resulting time series were smoothed with a 10 d moving median. In each window, the 3 cpd component was isolated by averaging the cross- and auto-spectra within a narrow frequency band centered at 3 cpd. The top panel displays the gain, deemed as well as the amplitude ratio between the RWE response and atmospheric pressure variations. The middle panel shows the corresponding phase lag expressed in hours, with positive values indicating that RWE is delayed with respect to pressure. The bottom panel presents the MSC, which quantifies the statistical stability of the coupling at this frequency.
The comparison between gain variations and CO2 effluxes is challenging for several reasons. First, the two observables represent different physical scales: fluxes quantify the amount of gas released into the atmosphere, whereas RWE variations are most sensitive to changes within the upper meters of the subsurface. Specifically, in the 40–50 Hz band and using a reference velocity model constrained by tomographic studies of La Palma (e.g., Serrano et al., 2023; Cabrera-Pérez et al., 2023b), the RWE kernel is confined to depths shallower than ∼5 m, with maximum sensitivity at ∼2 m. A temporal delay between surface fluxes and subsurface RWE variations is therefore expected. Second, the CO2 efflux dataset represents a spatial average over the entire volcanic edifice, while our RWE measurement reflects a point-specific response. Under a diffuse degassing regime, it is reasonable that individual sites exhibit their own local trends. Third, the temporal resolutions are markedly different: RWE gain was estimated every two days, whereas CO2 effluxes are available as annual averages.
Despite these differences in scale, resolution, and sensitivity, both curves display broadly consistent long-term trends, suggesting a moderate agreement between the two observations (see Fig. A2 in Appendix). As reasoned in Sect. 3.1, an increase in gas concentration reduces the effective gas compressibility and enhances the hydraulic diffusivity. In the transfer function analysis, this process is expected to manifest as an increase in gain, reflecting the more efficient transmission of pressure oscillations into the subsurface.
Between 2015 and 2017 we observe a marked increase in coherence, accompanied by a rise in gain that could indicate a stronger degassing episode in this area (Fig. 5). Unfortunately, no direct records of gas emissions are available for this period to validate this interpretation. Over the entire study period, the phase lag displays a clear seasonal variability. Soil moisture and precipitation are known to influence gas transport by attenuating barometric pumping (Forde et al., 2019). Consistently, comparison of the phase lag results with the rainfall pattern for La Palma suggests a possible influence of precipitation. The seasonal oscillations in phase show a moderate alignment with the island's annual precipitation cycle, which may reflect transient reductions in diffusivity caused by water infiltration into the vadose zone. This observation departs from our initial assumption of a purely gas-filled vadose zone and underscores the role of hydrological processes in modulating the pressure response.
No sustained trend in gain, coherence, or phase that could be interpreted as a precursor signal to the 2021 eruption is observed at this station, suggesting that the eruptive episode did not correspond to the most intense period of diffuse degassing within its long-term record. Only a slight increase in coherence during the eruption episode and in early 2021 is remarkable, together with a disruption of the purely annual phase seasonality observed in mid-2020 and mid-2021, when the phase lag tended to approach zero (Anomalies marked in Fig. 5). As these phase lag perturbations are not accompanied by a corresponding increase in gain, we interpret them as changes in the hydrological state of the vadose zone, most likely related to variations in soil moisture or permeability of the soil, rather than as evidence of enhanced gas injections.
4.2 Spatial variability of the RWE response near the eruption site
Having characterized the long-term behavior at EHIG for the 3 cpd, we next examined whether similar signatures could be detected at stations located nearer to the eruption site. For this purpose, we analyzed the TBT and EXILP stations (Fig. 1), whose records cover 2019–2023 and encompass the pre-eruptive, eruptive, and post-eruptive periods. EHIG and TBT are equipped with broadband velocity sensors whereas EXILP is an accelerometer. For EXILP, which has a sampling rate of 200 Hz, our analysis focused on the 50–100 Hz frequency band, in contrast to the 1–50 Hz band used at the other two stations. This choice is not only consistent with the data resolution, but also physically meaningful: higher frequencies provide sensitivity to shallower depths. As shown by the sensitivity kernels (Fig. A3 in Appendix), the 40–50 Hz band is maximally sensitive to depths of about 2 m, while sensitivity shifts to ∼1 m in the 90–100 Hz range. Figure 6a shows the amplitude spectrum for EXILP within this frequency range. At this station the four spectral peaks identified at EHIG (E1–E4) are also present. Figure 6b displays the temporal evolution of gain, phase, and coherence at EXILP in the 90–100 Hz band. No systematic trend or increase in coherence is observed prior to the eruption, although a rise in gain is evident at the onset of the eruptive episode. The phase lag exhibits two intervals of comparatively stable oscillatory behavior. The first coincides with the onset of the initial seismic swarms and is accompanied by a moderate increase in coherence. The second occurs shortly before the 2021 eruption.
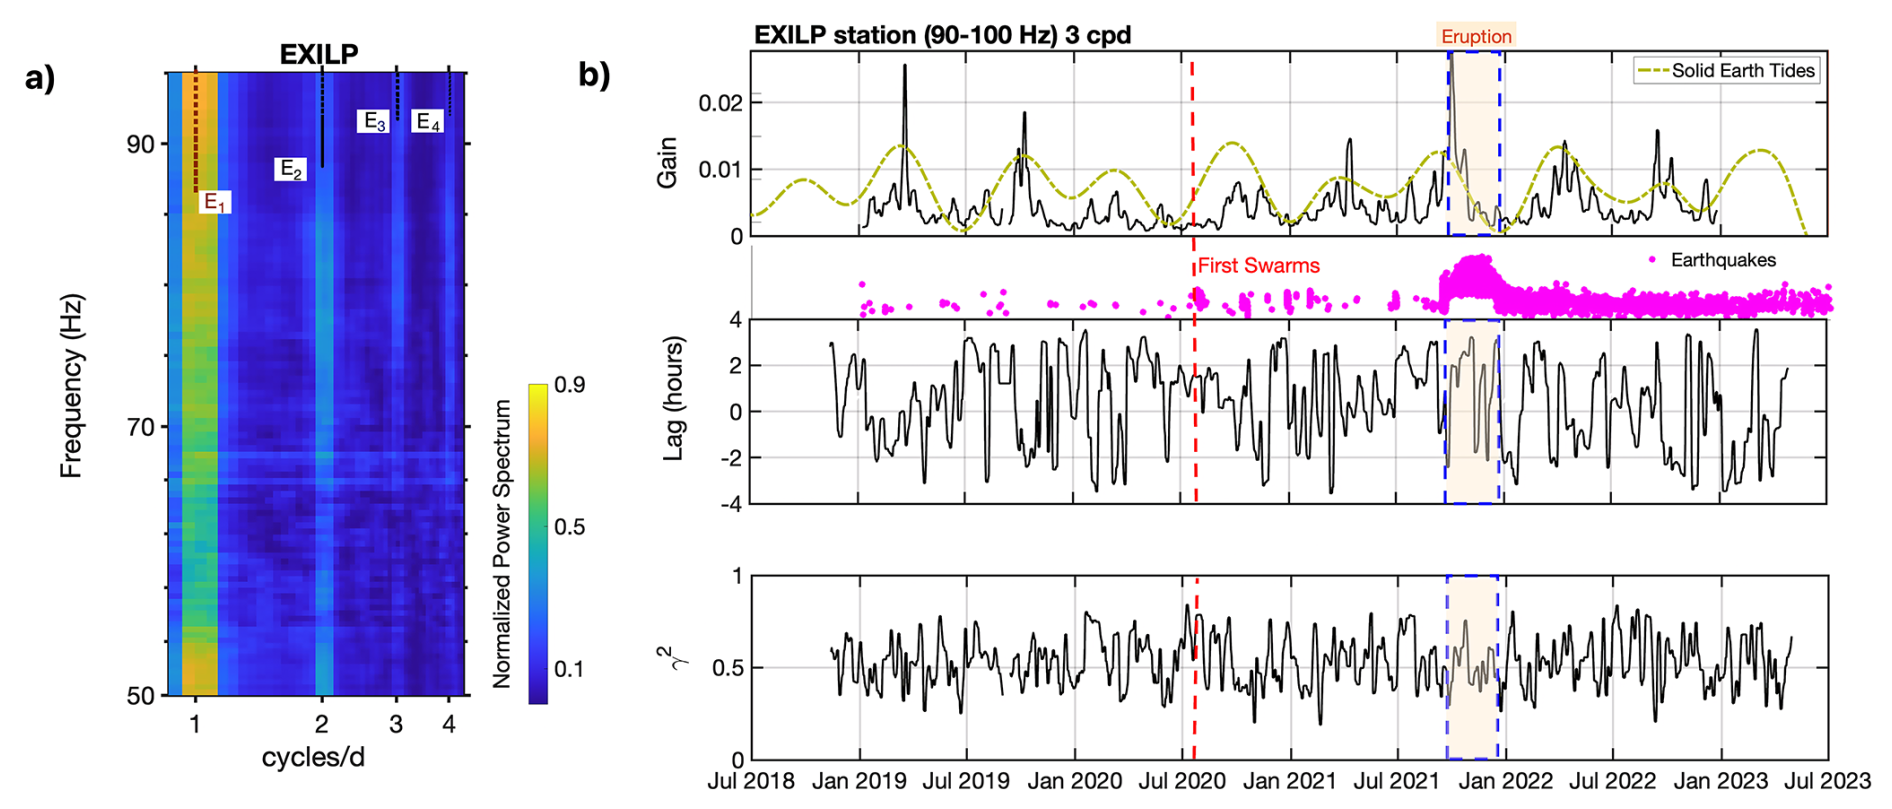
Figure 6(a) Normalized frequency–period Fourier spectrogram of the RWE series during 2021 (frequency range 50–100 Hz) at EXILP station. Sliding windows of 30 d with 50 % overlap were applied. Distinct spectral peaks at 1, 2, 3, and 4 cycles per day are observed and labeled as E1–E4. (b) Transfer-function results at 3 cpd for the 90–100 Hz band at EXILP station (2019–2023): (top) Gain shown in black, with the vertical solid Earth tide displacement (dashed green) computed with the Python package pysolid (Yunjun et al., 2022) and bandpass filtered between 100 and 300 d. Magenta dots represent individual earthquakes, plotted according to their occurrence time (x axis) and magnitude (MbLg, y axis). The largest event reached MbLg 5.1. (middle) Phase lag at 3 cpd. (bottom) Magnitude-squared coherence γ2 at 3 cpd. All three metrics were computed in sliding windows of 15 d with 13 d overlap (2 d step) on time series sampled at 2 h intervals, and displayed as 5-point moving medians. The dashed blue rectangle marks the 2021 eruption.
4.2.1 Semiannual RWE modulation across stations: evidence for tidal control of permeability
An additional and particularly noteworthy finding is the presence of a clear semiannual cycle in the gain, consistently observed throughout the study period (Fig. 6b). When examining the gain at the three analyzed stations, semiannual cycles are also apparent (Figs. 5–7). At EHIG, for example, during the low CO2 emission period (2007–2010) the cycle is clearly expressed (Fig. 5), and at TBT a semiannual modulation emerges with peaks in March and September and minima in July and December (Fig. 7b), a seasonal pattern that is synchronized across the three stations. Although environmental variables such as volumetric soil water content, wind, or even atmospheric pressure can also exhibit semiannual variability, none of them display a pattern as regular and well defined as the solid Earth tides. The latter reproduce the cycles observed at the three stations, supporting our hypothesis that the detected semiannual modulation reflects the influence of solid tidal forcing.
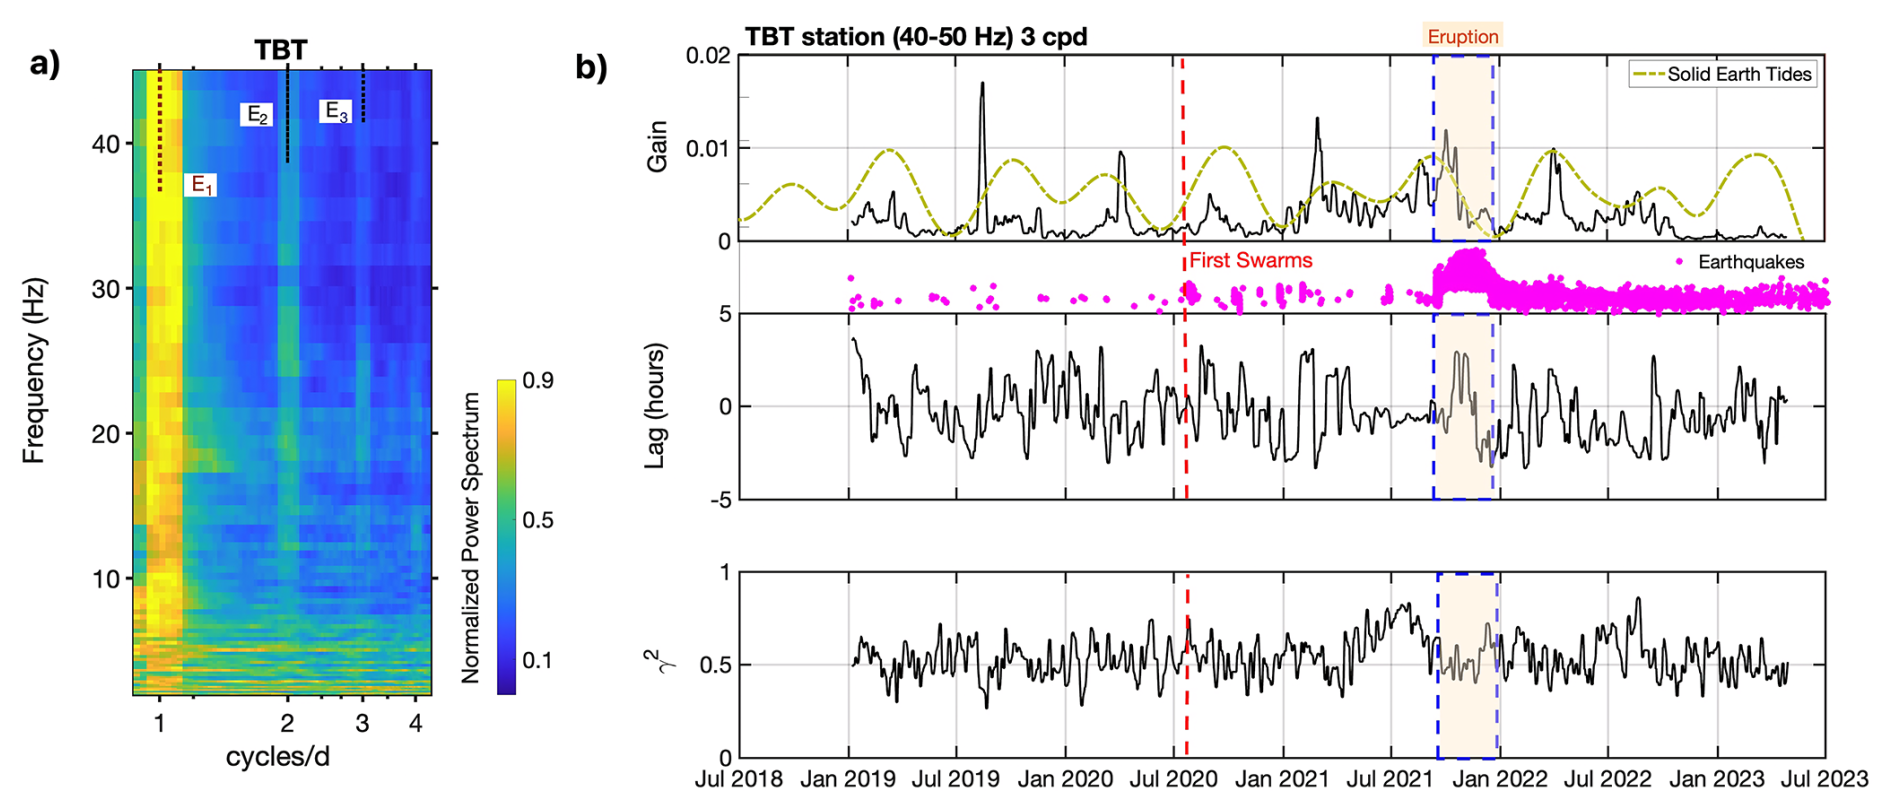
Figure 7(a) Normalized frequency–period Fourier spectrogram of the RWE series during 2021 (frequency range 1–50 Hz) at TBT station. Sliding windows of 30 d with 50 % overlap were applied. Distinct spectral peaks at 1, 2 and 3 cycles per day are observed and labeled as E1–E3. (b) Transfer function results at 3 cpd for the 40–50 Hz band at TBT station (2019–2023): (top) Gain shown in black, with the vertical solid Earth tide displacement (dashed green) computed with the Python package pysolid (Yunjun et al., 2022) and bandpass filtered between 100 and 300 d. Magenta dots represent individual earthquakes, plotted according to their occurrence time (x axis) and magnitude (MbLg, y axis). The largest event reached MbLg 5.1. (middle) Phase lag at 3 cpd. (bottom) Magnitude squared coherence γ2 at 3 cpd. All three metrics were computed in sliding windows of 15 d with 13 d overlap (2 d step) on time series sampled at 2 h intervals, and displayed as 5 point moving medians. The dashed blue rectangle marks the 2021 eruption.
This semiannual modulation can be physically explained by the response of the fractured medium to solid Earth tides. At the peaks of the vertical tidal component, fractures are expected to open, leading to an increase in the effective permeability of the medium. As described by Eqs. (2)–(4), an increase in permeability directly translates into higher diffusivity and thus a more efficient propagation of the barometric pressure wave. Consequently, earth tidal peaks are expressed as gain maxima, in agreement with the observed cycles at the three stations (Figs. 5a, 6b and 7b). This result highlights not only the potential of our approach to monitor subsurface gas accumulation, but also its ability to detect permeability changes driven by tidal forcing. In settings where degassing or significant gas fluxes from the critical zone are not expected, analyzing the 3 cpd cycle and its response to solid Earth tides provides a novel tool to probe short term variations in subsurface permeability. We therefore propose that tidal modulation of barometric pumping can serve as a powerful diagnostic for permeability changes, with applications extending well beyond volcanic environments.
4.2.2 Pre-eruptive RWE anomalies and their relation to gas accumulation and permeability changes
Although the semiannual modulation provides a common background signal at all stations, its expression depends on the degassing regime. At EHIG, for example, the cycle is most clearly observed during periods of low CO2 emission and becomes less evident when degassing intensifies (Fig. 5a). TBT, however, shows an additional feature: a marked increase in coherence together with a stabilization of the lag prior to the eruption (Fig. 7), pointing to localized changes in permeability or gas flux that were not equally expressed elsewhere. Notably, this anomaly would not be apparent if one considered gain alone, since the initial increase in coherence coincided with a decrease in the vertical solid Earth tide, corresponding to a scenario of fracture compression. Under such conditions, even if gas injection occurred, the simultaneous closure of fractures would dampen the RWE response. While we lack direct measurements of gas flux to validate this observation, we interpret the increase in coherence and stabilization of the lag at TBT as being consistent with subsurface gas accumulation and/or changes in vadose zone permeability. These processes may also have favored anomalous efflux to the atmosphere about six months before the eruption.
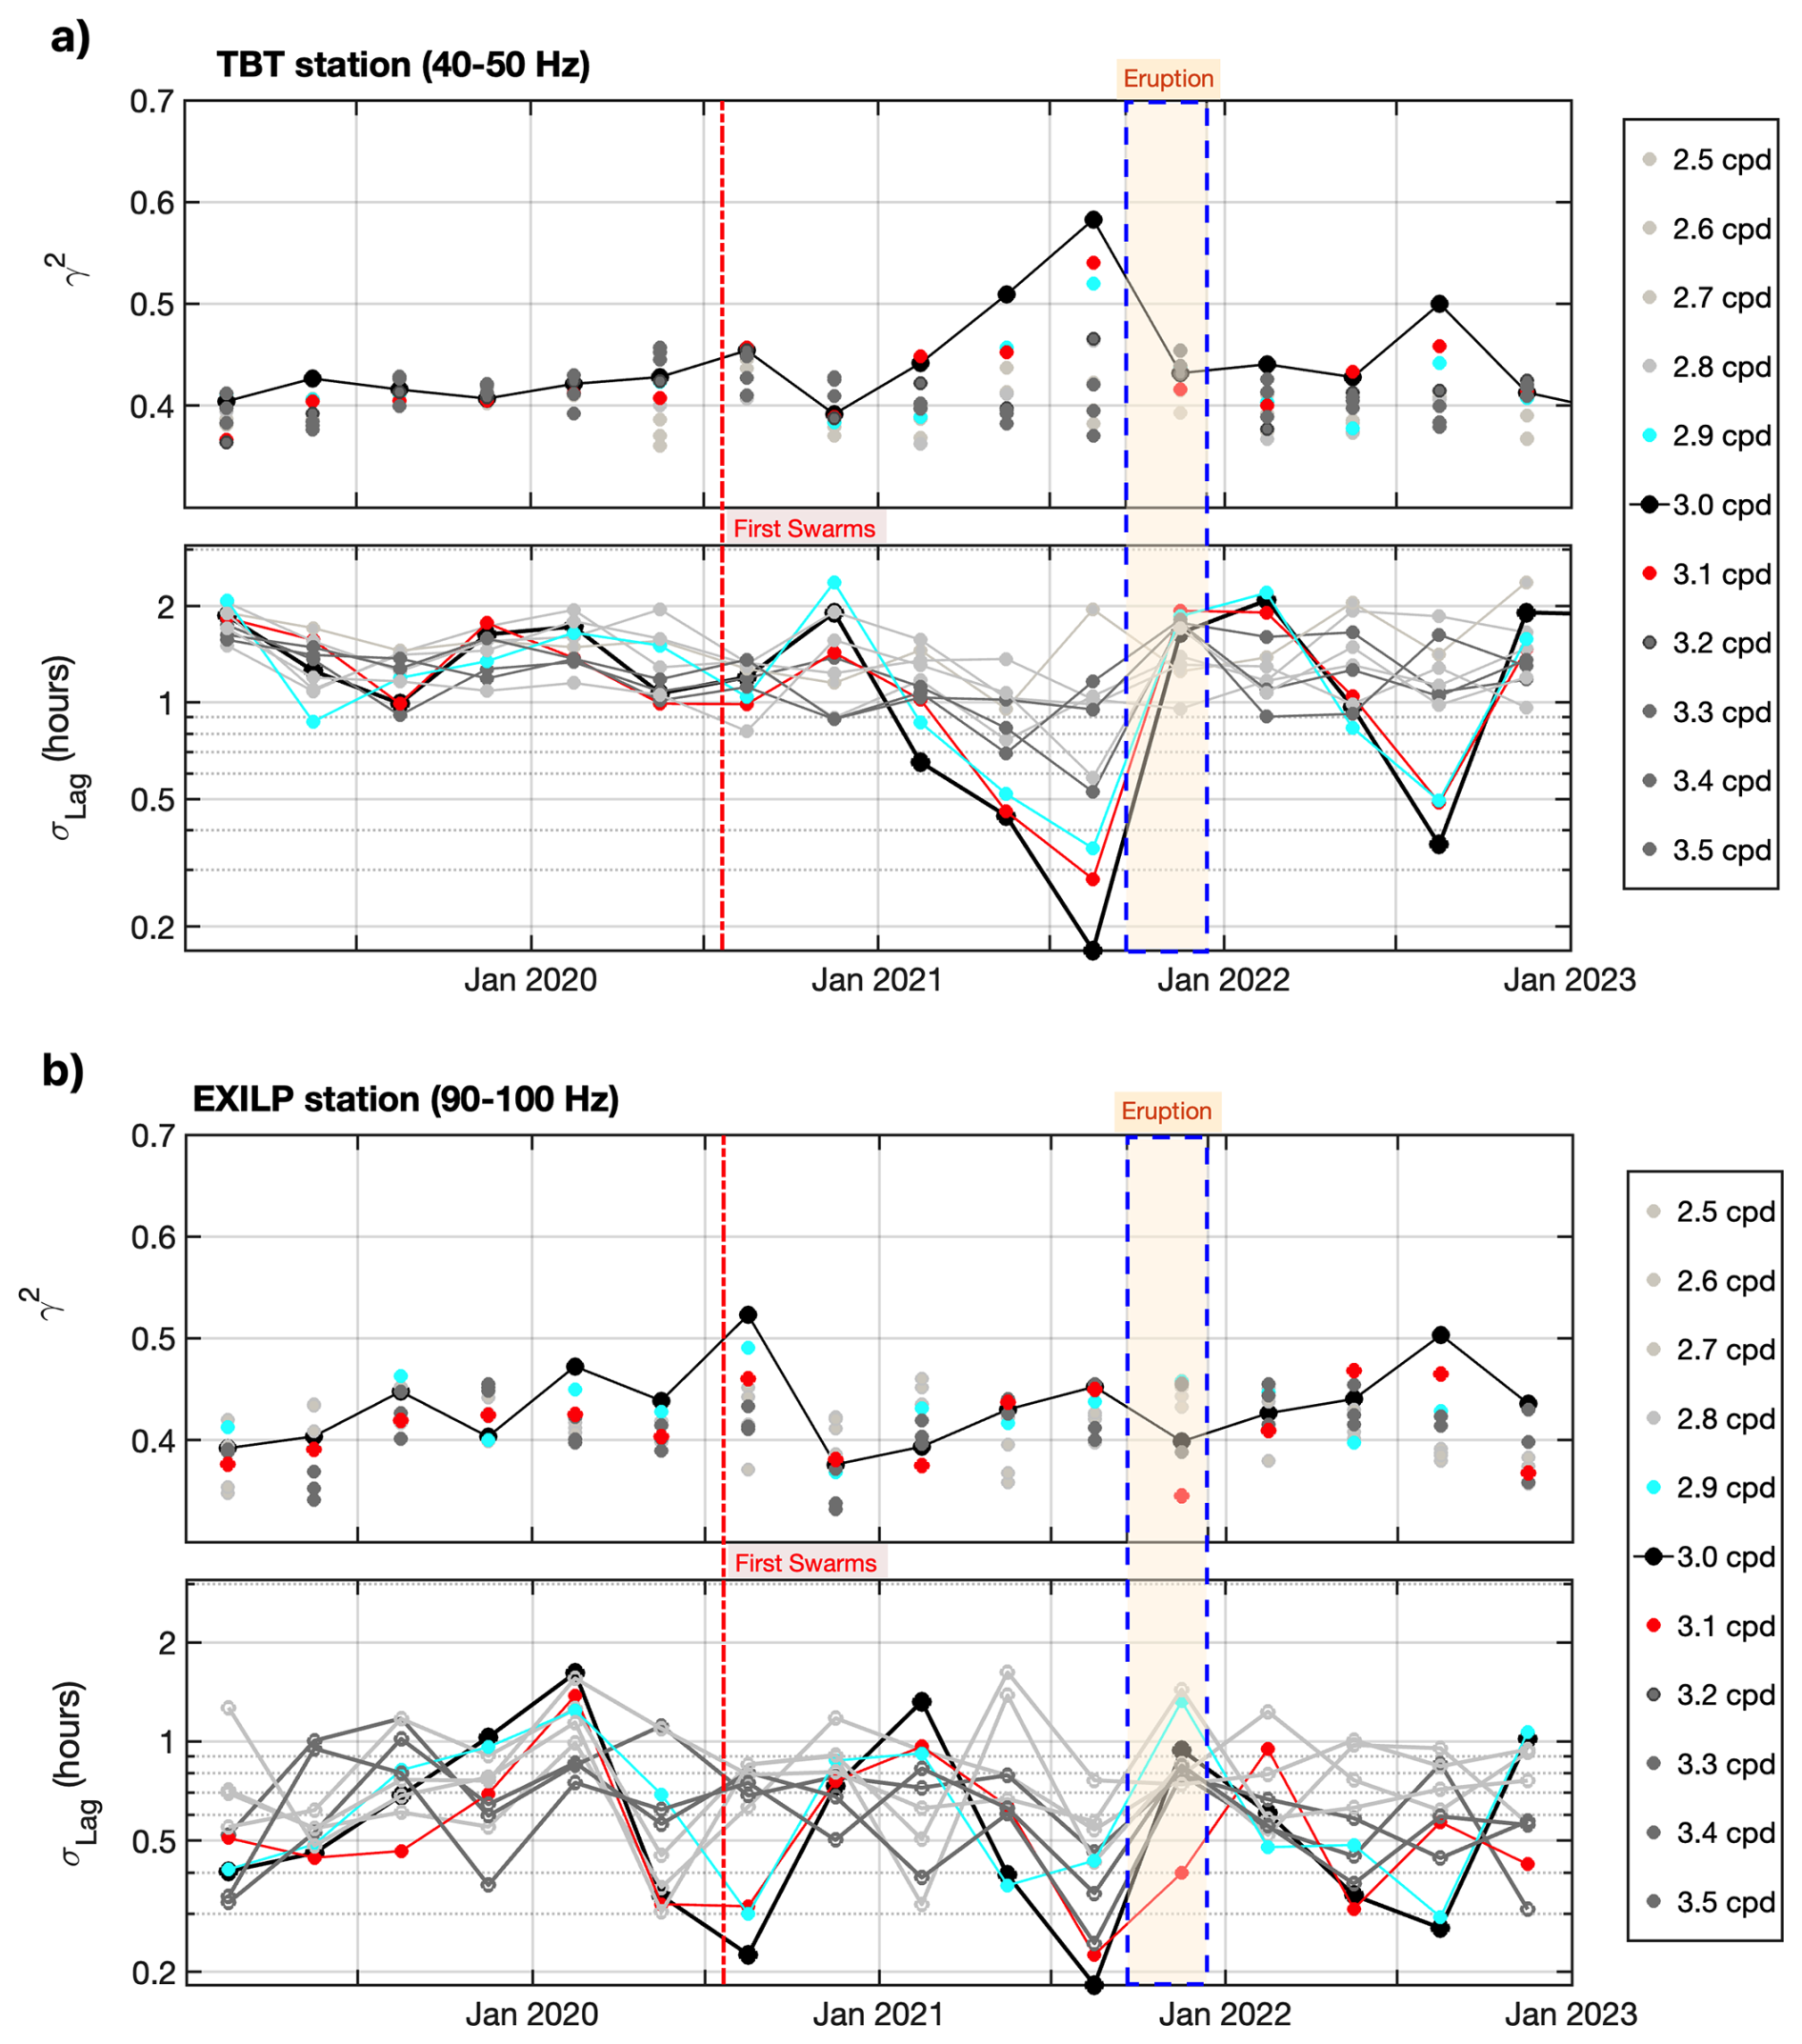
Figure 8Frequency dependence of coherence (top panels) and the standard deviation of the lag (bottom panels) at (a) TBT station (40–50 Hz band) and (b) EXILP station (90–100 Hz band) for frequencies between 2.5 and 3.5 cpd, computed using 3 month averaging windows based on transfer function analysis (Figs. 6 and 7). A consistent increase in coherence and reduction in lag variability is observed for both stations between 2.9 and 3.1 cpd, most pronounced at 3.0 cpd, during the months preceding the 2021 eruption (blue dashed rectangle). At EXILP, a comparable decrease in lag variability is also observed around the onset of the first seismic swarms.
This distinctive behavior at TBT can be explained by its structural and hydrogeological setting. The station is located within a highly fractured zone affected by abundant vertical dike intrusions and intersected by water wells and galleries, which together enhance vertical permeability and pressure transmission. Such structural discontinuities likely provide preferential pathways for gas ascent from the underlying hydrothermal system, amplifying the coupling between barometric pumping and subsurface gas accumulation. In contrast, stations located in less fractured domains or outside the main hydrothermal influence, such as Taburiente Caldera (Fig. 1), lack this level of connectivity and therefore do not record the same precursor signal. To further verify that the observed anomaly at TBT reflects atmospheric forcing rather than random fluctuations or other mechanisms, we examined the frequency dependence of the coherence (γ2) and the standard deviation of the lag (σLag) around the terdiurnal cycle (Fig. 8a). The results show that the enhanced coherence and reduced lag variability preceding the eruption are consistently observed between 2.9 and 3.1 cpd, with the strongest signal at 3.0 cpd. This narrowband expression supports the interpretation that the anomaly is linked to barometric pumping and thus constitutes a genuine precursor signal.
A closely similar behavior is also observed at EXILP, where the standard deviation of the lag exhibits two marked reductions, including a drop towards nearly zero immediately prior to the eruption (Fig. 8b). When lag variability is examined as a function of period, both TBT and EXILP independently show a narrowing and stabilization of the 3 cpd response in the pre-eruptive interval. This coherent pattern at two stations with different geological settings strengthens our interpretation of the signal as a precursor, consistent with a pre-eruptive increase in shallow gas accumulation and/or permeability changes that enhanced barometric pressure coupling near the future vent area.
4.3 Scope and limitations of RWE for monitoring pressure-driven processes in the shallow subsurface
It is important to note that Rayleigh waves possess several attributes in multilayered media that may be exploited for subsurface imaging and monitoring. For example, the sense of particle motion (prograde or retrograde) carries additional information on subsurface structure and can provide further constraints in inversion studies (Malischewsky et al., 2008). The DOP-E method adopted here does not discriminate between these two cases. However, this limitation is not critical for the present study, which focuses on temporal monitoring rather than detailed structural inversion. For our purposes, the temporal variability of the RWE function alone constitutes a robust observable. Moreover, RWE is jointly controlled by the elastodynamic parameters (VP, VS, and density) and by the thickness and geometry of near surface layers. Although RWE is often most sensitive to VS (e.g., Cercato, 2018; Arai and Tokimatsu, 2004), changes in VP, density, or layer thickness can also contribute to the observed ellipticity variations. Thus, RWE alone does not inherently distinguish between VP and VS variations, nor does it indicate whether velocities increase or decrease in the absence of independent constraints. In our case, and as reasoned in Sect. 3.1.3, by focusing on the barometrically forced 3 cpd band we narrow the range of plausible physical mechanisms. In this band, the response can be described in terms of barometric pressure-driven changes in the bulk modulus of the upper vadose zone. This, in turn, allows us to more confidently interpret the observed 3 cpd RWE variations as VP changes associated with hydraulic diffusivity conditions, rather than as the result of more complex or competing processes.
However, this component may not always be observable in other contexts. In such cases, alternative strategies could focus on more energetic pressure cycles, such as the 2 cpd barometric tide. This option is complicated by the frequency overlap of this atmospheric harmonic with the solar semidiurnal solid Earth tide (S2), the semidiurnal ocean tide, and the nearby lunar constituent M2. In hydrogeology, this difficulty is commonly addressed through the concept of barometric efficiency and its frequency domain formulations (e.g., Valois et al., 2022; Acworth et al., 2016), which exploit the spectral relationship between S2 and M2 to separate atmospheric and solid Earth contributions. Nevertheless, because the lunar semidiurnal constituent (M2) is not clearly expressed in our observations for La Palma, such approaches cannot be straightforwardly applied here to investigate degassing processes using the 2 cpd cycle.
Taken together, our results demonstrate that RWE provides a sensitive tool to track both gas injections and permeability changes in the upper vadose zone. The comparison with CO2 efflux data shows a consistent trend with the gain observed at EHIG, despite differences in spatial scale and temporal resolution (Figs. 5 and A2 in Appendix). The robust semiannual modulation observed across stations can be explained by the tidal control of fracture permeability through solid Earth tides, while site-specific anomalies reveal how additional processes shape the response. At EHIG, the seasonal variability of phase is consistent with hydrological control, most likely linked to soil moisture and rainfall (Fig. 5). In contrast, at TBT, the pre-eruptive increase in coherence and stabilization of lag point to subsurface gas accumulation and possibly anomalous efflux several months before the 2021 eruption (Fig. 8). This highlights the value of jointly analyzing gain, phase, and coherence, since they provide complementary constraints on the physical processes controlling the pressure response. Through a denser seismic network, this approach could provide more continuous observations, improve our understanding of volcanic degassing processes, and enhance hazard mitigation by enabling remote monitoring without the need to deploy personnel in hazardous areas. Overall, our findings indicate that, in the La Palma Island setting, the 3 cpd component constitutes a reliable diagnostic of pressure-driven processes in the shallow subsurface, with the potential to identify subtle diffusivity changes.
This study demonstrates for the first time that RWE from ambient noise can be used to track ground variability induced by tidal forcing. Our analysis focuses mainly on air pressure tides and shows that RWE is a robust single-station observable sensitive to shallow velocity changes. In this framework, we interpret the temporal evolution of the barometrically forced RWE response as an indirect proxy for diffuse volcanic degassing and transient gas transport. Unlike conventional seismic interferometry, which fails during eruptive tremor, RWE remains effective in high noise volcanic environments. Our results establish a clear link between subsurface pressure oscillations and gas transport, suggesting that the analysis of RWE variations at subdaily tidal cycles provides a novel pathway to monitor permeability changes and degassing in volcanic systems, with direct implications for hazard assessment and early warning. In addition, although our analysis was primarily designed to investigate the evolution of the 3 cpd cycle driven by atmospheric forcing, we identified a coupling with the semiannual modulation imposed by solid Earth tides, indicating the influence of Earth tidal forcing in controlling fracture permeability.
The pre-eruptive and eruptive records of the three stations reveal distinct but complementary patterns. At EHIG, only a slight increase in coherence is observed during the eruption, together with a disruption of the annual phase seasonality in mid-2020 and mid-2021, when the phase lag tended to approach zero. Given the limited temporal extent of this coherence increase and the absence of a corresponding increase in gain before and during the eruption, this feature is not interpreted as evidence of intense gas degassing at this site. At EXILP, the highest gain of the entire series coincides with the onset of the eruption and only subtle pre-eruptive changes are observed, mainly as reductions in lag variability. In contrast, TBT exhibits clear pre-eruptive signals, including a marked increase in coherence, stabilization of the lag, and a progressive rise in gain starting about six months before the eruption. This distinct precursor at TBT likely reflects its location in a highly fractured zone, which enhances vertical connectivity and gas-driven responses to atmospheric forcing. While this study focuses on Cumbre Vieja, the method is applicable to other volcanic systems, geothermal reservoirs, and CO2 storage sites, where monitoring pressure-driven gas transport is essential for stability and leakage detection.
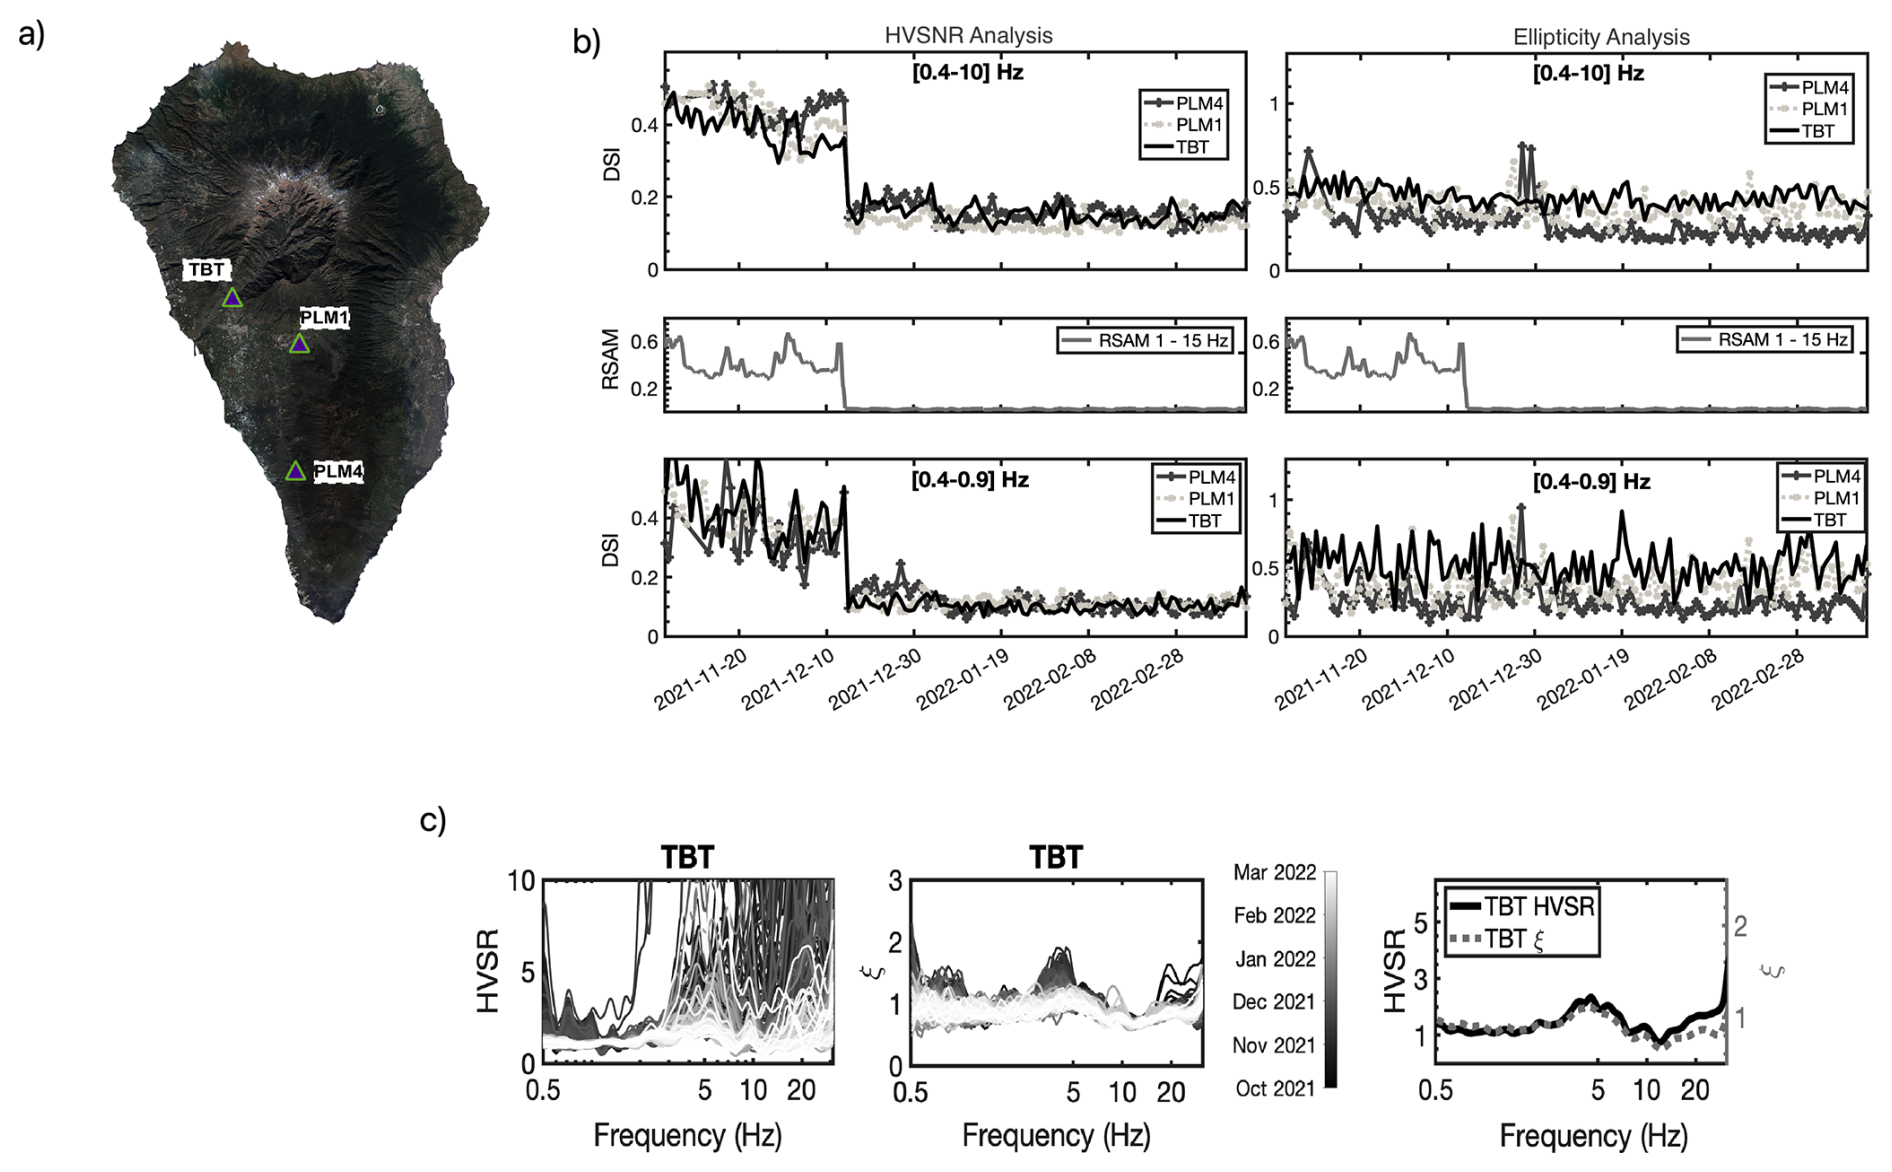
Figure A1Comparison of the Dissimilarity Index (DSI) evolution from HVSNR analysis (left panels) and Rayleigh-wave ellipticity (ξ) analysis (right panels) at three seismic stations (PLM4 and PLM1 from network 9A, GFZ Data Services; and TBT from network ES, IGN Red Sísmica Nacional) during and after the 2021 La Palma eruption. The DSI is defined as DSI NCC, where NCC is the normalized zero-lag cross-correlation between the measured curve and a reference curve corresponding to an unperturbed structural state (Seivane et al., 2024). In this formulation, DSI =0 indicates no deviation from the reference state, while DSI =2 corresponds to completely unrelated curves. (a) Location of the three seismic stations used in this comparison. The background orthophoto of La Palma is based on OrtoPNOA 2024 (CC-BY scne.es), with modifications by the authors. (b) The top and bottom panels show the temporal evolution of the DSI for two frequency bands: 0.4–10 Hz (upper) and 0.4–0.9 Hz (lower). The central panels display the Real-time Seismic Amplitude Measurement (RSAM, 1–15 Hz) as a proxy for tremor amplitude. A sharp drop in the DSI from the HVSNR analysis is observed following the eruption cessation, coinciding with the tremor amplitude decrease. In contrast, the DSI derived from ellipticity analysis remains stable, demonstrating its robustness against tremor-related amplitude variations. (c) Comparison of Ellipticity (center) and HVSNR curves (left) for TBT station, with colors representing different time periods from October 2021 to March 2022. The right panel compares the median HVSNR and Ellipticity curves for TBT station. The stabilization of the median around the most recurrent values explains the similarity between the curves in the lower-right panel, as the analyzed period contains more data after the eruption cessation than during the eruption.
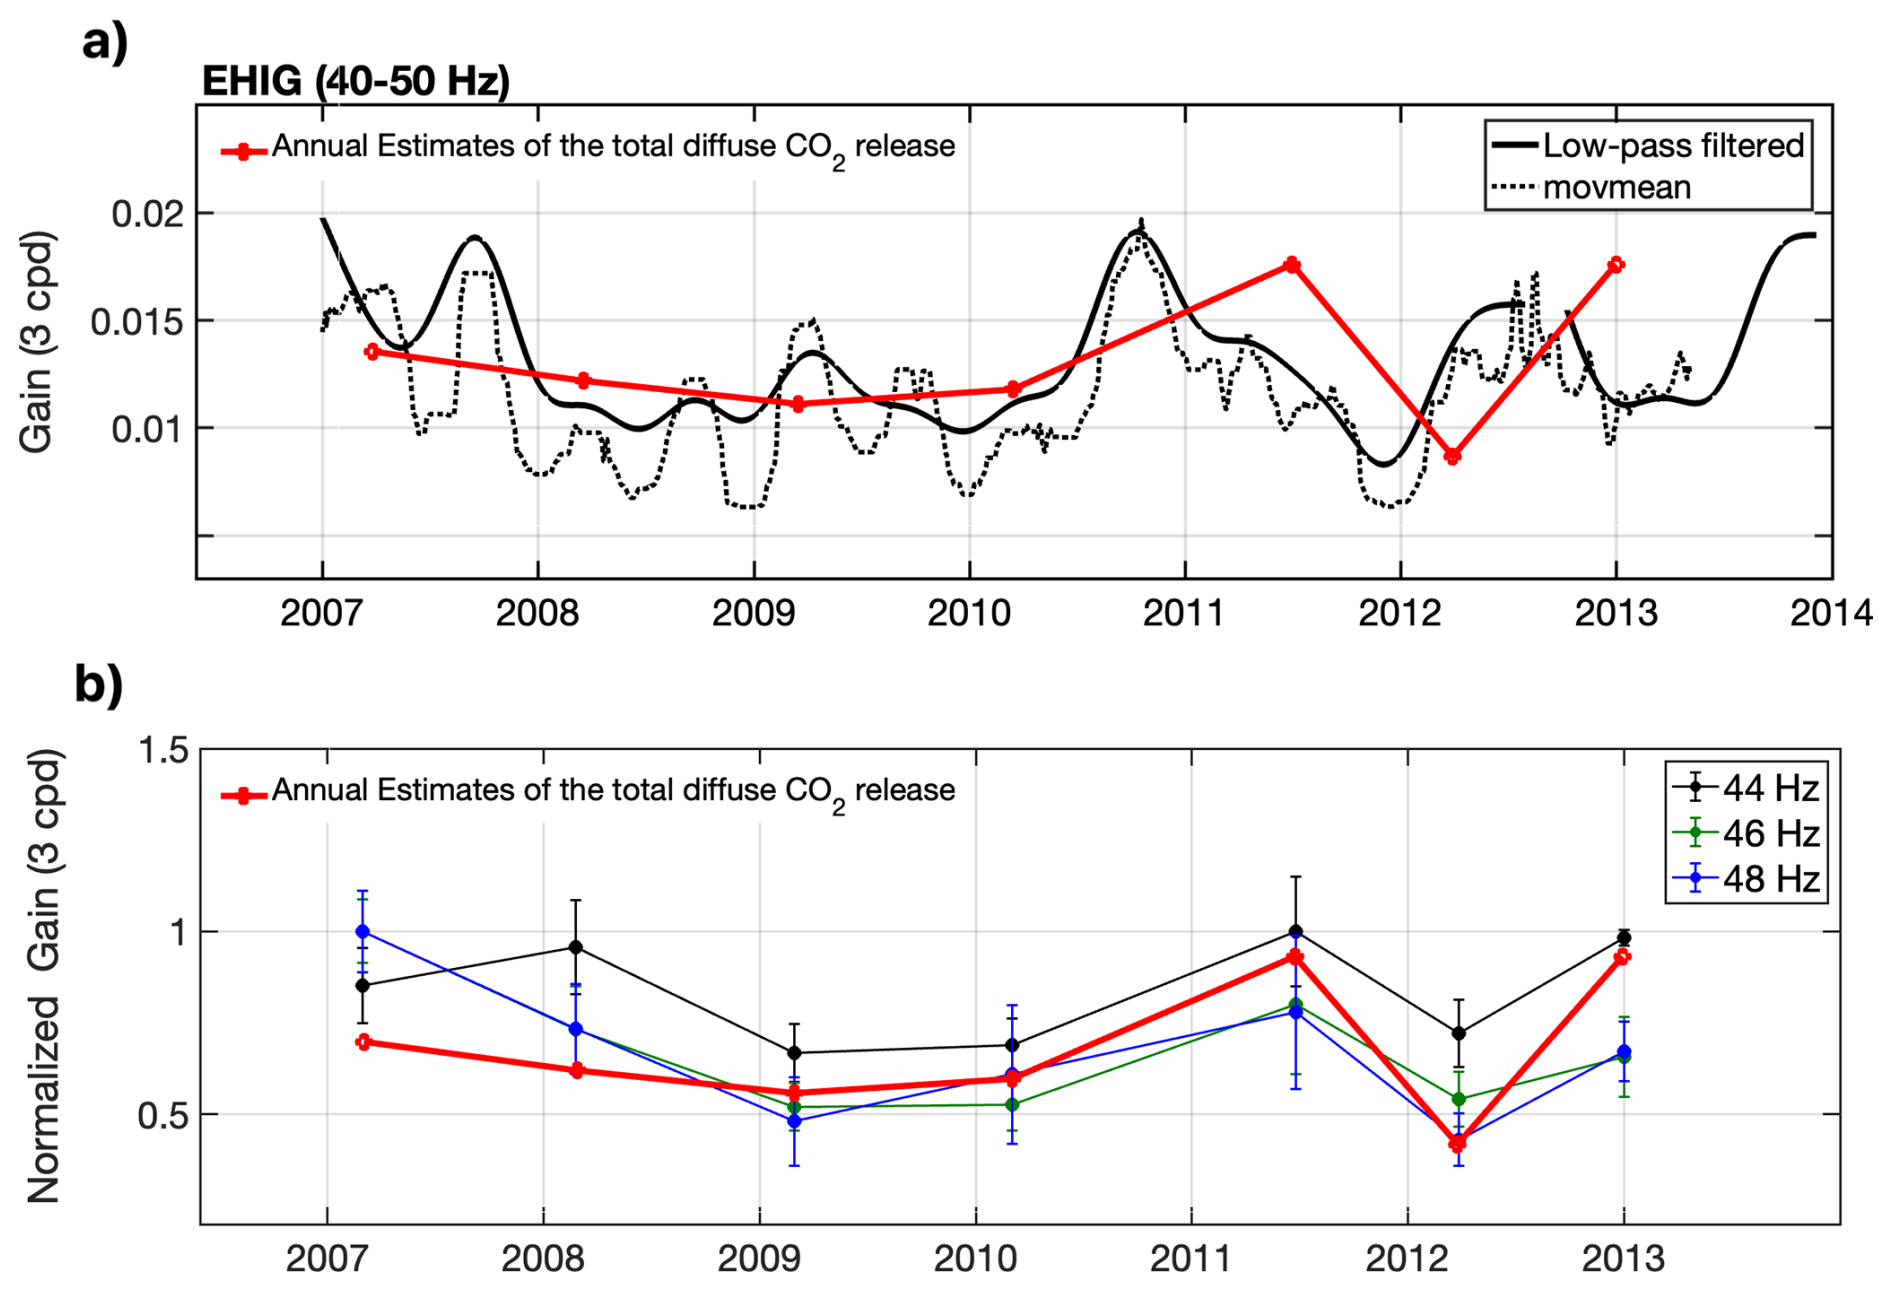
Figure A2(a) Gain at EHIG station (40–50 Hz band, 2007–2013), compared with annual estimates of the total diffuse CO2 release overlaid in red. The black solid line shows the series low-pass filtered with a 240 d cutoff, while the dashed line indicates the 240 d moving-average mean. (b) Period-averaged, normalized values of the low-pass filtered gain at EHIG shown in panel (a) and compared with annual estimates of the total diffuse CO2 release overlaid in red. The gain values were averaged over successive time intervals defined by the availability of the CO2 outgassing measurements. Curves correspond to three representative frequencies within the 40–50 Hz range: 44 Hz (black), 46 Hz (green), and 48 Hz (blue). Symbols indicate mean values for each interval, and error bars denote the standard deviation. Pearson correlation coefficients between the period-averaged gain values and the CO2 release estimates are 0.54, 0.47, and 0.55 for the black, green, and blue curves, respectively.
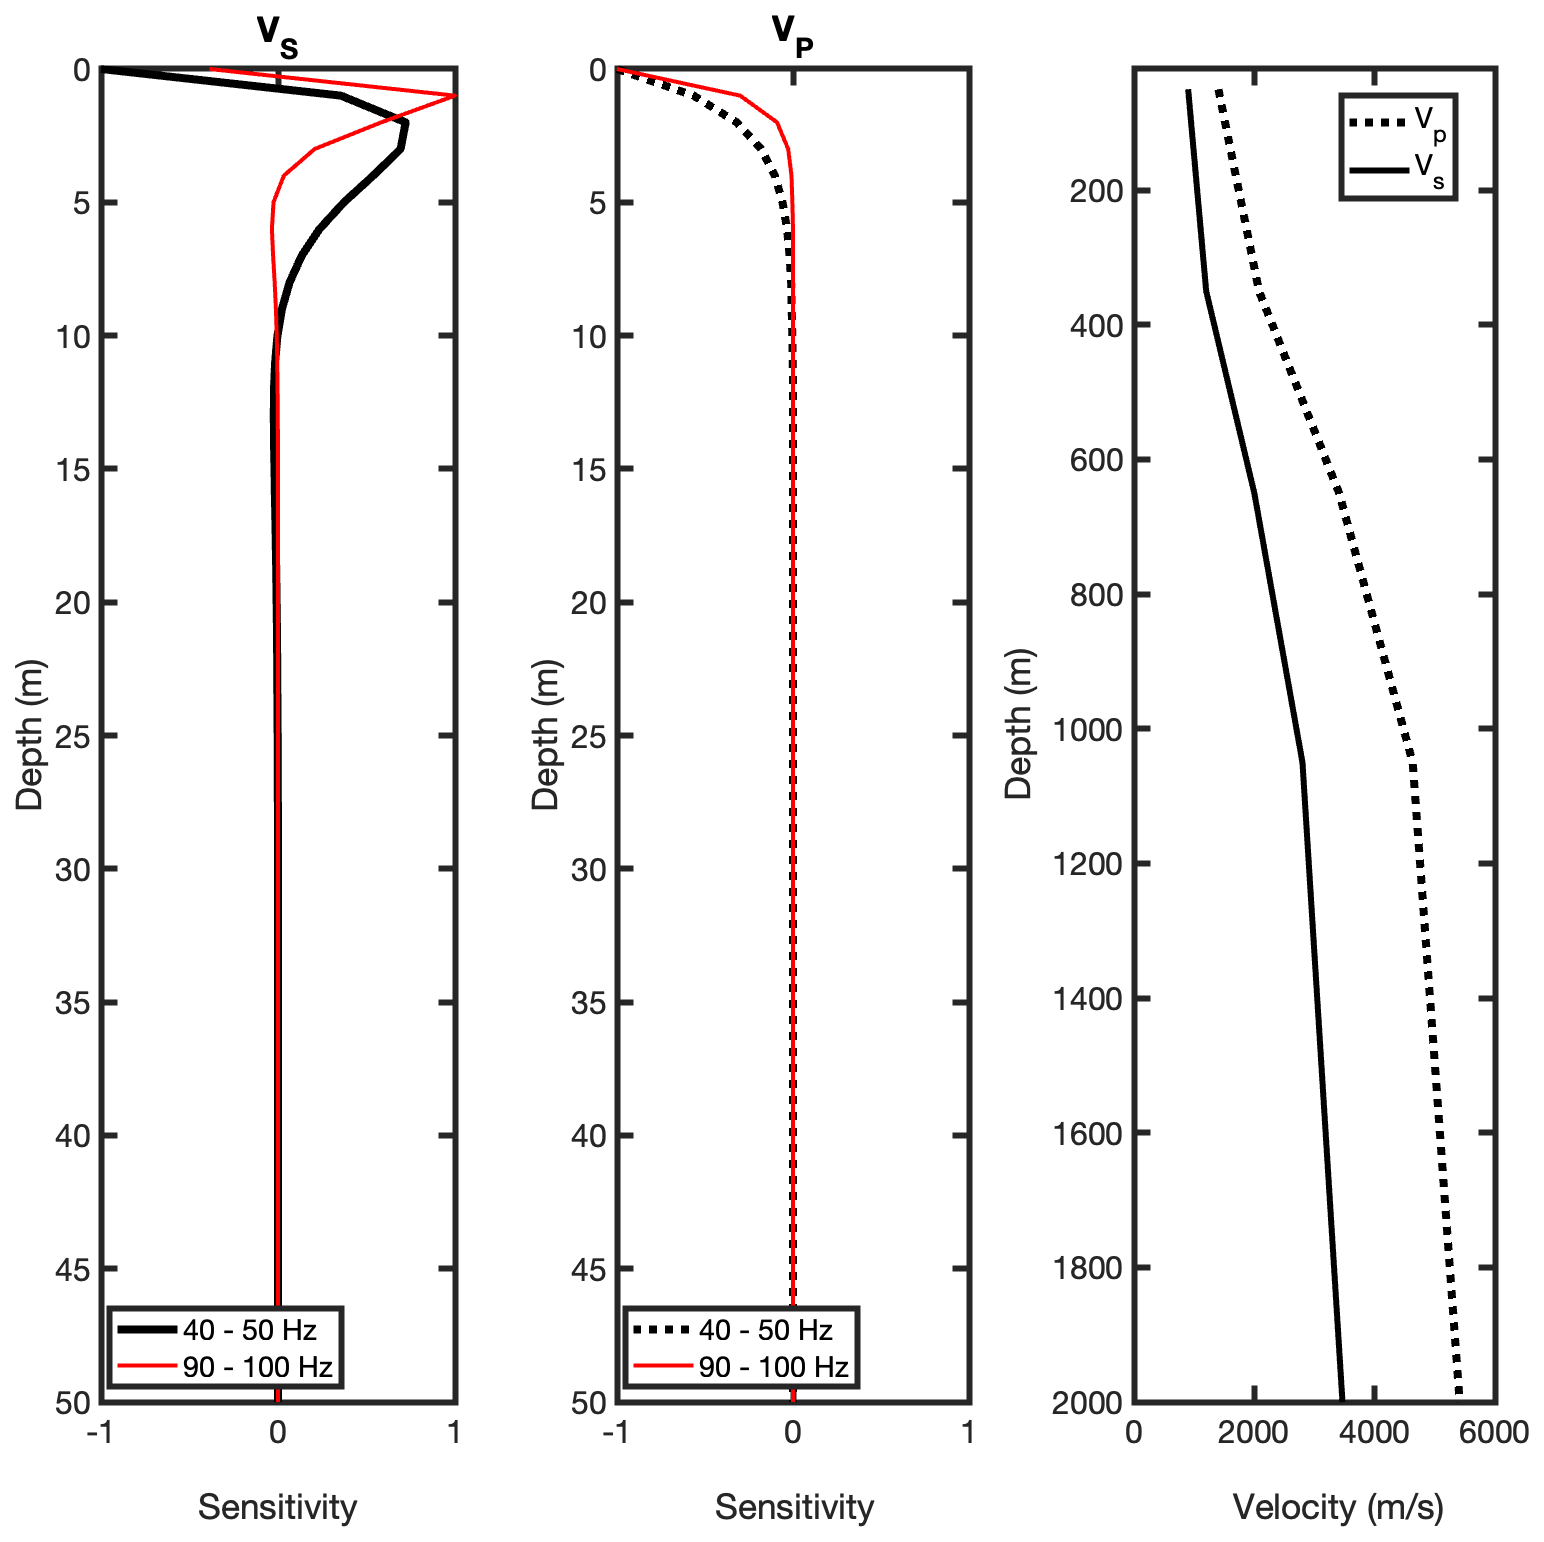
Figure A3Normalized Vs and Vp depth sensitivity kernels for the fundamental mode of Rayleigh wave ellipticity at 40–50 Hz and 90–100 Hz frequency bands, computed using the Python package disba (Luu, 2021) and a reference velocity model constrained by tomographic studies of La Palma (e.g., Serrano et al., 2023; Cabrera-Pérez et al., 2023b).
The link to the source routines for the degree of polarization method (Schimmel and Gallart, 2004) are described in Berbellini et al. (2019) and available at https://github.com/berbellini/DOP-E (Berbellini and Schimmel, 2026).
The seismic data used in this study are publicly available through FDSN data services for the ES network (https://doi.org/10.7914/SN/ES, Instituto Geografico Nacional, 1999) and the 9A networks (https://doi.org/10.14470/4N7576350874, Walter et al., 2021). The atmospheric data were obtained from the ERA5 database (https://cds.climate.copernicus.eu/datasets/, last access: 29 August 2025).
HS and MS: investigation. HS and MS: conceptualization. HS: data preparation. HS and MS: methodology. HS and MS: software. HS and MS: formal analysis. HS: writing (original draft). HS and MS: writing (review and editing). HS: visualization. MS: supervision. HS: validation.
The contact author has declared that neither of the authors has any competing interests.
Publisher's note: Copernicus Publications remains neutral with regard to jurisdictional claims made in the text, published maps, institutional affiliations, or any other geographical representation in this paper. The authors bear the ultimate responsibility for providing appropriate place names. Views expressed in the text are those of the authors and do not necessarily reflect the views of the publisher.
During the preparation of this work, the first author used ChatGPT, an AI language model developed by OpenAI, in order to assist with drafting and refining the manuscript. After using this tool, the authors reviewed and edited the content as needed and take full responsibility for the content of the publication.
This research has been supported by the HORIZON EUROPE European Institute of Innovation and Technology (grant no. 101058178).
The article processing charges for this open-access publication were covered by the CSIC Open Access Publication Support Initiative through its Unit of Information Resources for Research (URICI).
This paper was edited by Giovanni Macedonio and reviewed by three anonymous referees.
Acworth, R. I., Halloran, L. J. S., Rau, G. C., Cuthbert, M. O., and Bernardi, T. L.: An objective frequency domain method for quantifying confined aquifer compressible storage using Earth and atmospheric tides, Geophys. Res. Lett., 43, https://doi.org/10.1002/2016GL071328, 2016.
Aiman, Y. A., Delorey, A. A., Lu, Y., and Bokelmann, G.: S Hmax orientation in the Alpine region from observations of stress-induced anisotropy of nonlinear elasticity, Geophys. J. Int., 235, 2137–2148, https://doi.org/10.1093/gji/ggad353, 2023.
Arai, H. and Tokimatsu, K.: S-Wave Velocity Profiling by Inversion of Microtremor H/V Spectrum, B. Seismol. Soc. Am., 94, 53–63, https://doi.org/10.1785/0120030028, 2004.
Auer, L. H., Rosenberg, N. D., Birdsell, K. H., and Whitney, E. M.: The effects of barometric pumping on contaminant transport, J. Contam. Hydrol., 24, 145–166, https://doi.org/10.1016/S0169-7722(96)00010-1, 1996.
Bai, H., Feng, X., Fu, L., Nilot, E. A., Wang, X., Fehler, M., and Brown, S.: Monitoring the In Situ Nonlinear Elasticity Near the Dalk Glacier Area, Antarctica, Using Dense Seismic Arrays, J. Geophys. Res.-Sol. Ea., 131, e2025JB031752, https://doi.org/10.1029/2025JB031752, 2026.
Berbellini, A. and Schimmel, M.: DOP-E, GiHub [code], https://github.com/berbellini/DOP-E, last access: 11 May 2026.
Berbellini, A., Schimmel, M., Ferreira, A. M., and Morelli, A.: Constraining S-wave velocity using Rayleigh wave ellipticity from polarization analysis of seismic noise, Geophys. J. Int., 216, 1817–1830, https://doi.org/10.1093/gji/ggy512, 2019.
Bonnefoy-Claudet, S., Cotton, F., and Bard, P.-Y.: The nature of noise wavefield and its applications for site effects studies, Earth-Sci. Rev., 79, 205–227, https://doi.org/10.1016/j.earscirev.2006.07.004, 2006.
Brace, W. F., Walsh, J. B., and Frangos, W. T.: Permeability of granite under high pressure, J. Geophys. Res., 73, 2225–2236, https://doi.org/10.1029/JB073i006p02225, 1968.
Cabrera-Pérez, I., D'Auria, L., Soubestre, J., Przeor, M., Barrancos, J., García-Hernández, R., Ibáñez, J. M., Koulakov, I., Van Dorth, D. M., Ortega, V., Padilla, G. D., Sagiya, T., and Pérez, N.: Spatio-temporal velocity variations observed during the pre-eruptive episode of La Palma 2021 eruption inferred from ambient noise interferometry, Sci. Rep.-UK, 13, 12039, https://doi.org/10.1038/s41598-023-39237-9, 2023a.
Cabrera-Pérez, I., Soubestre, J., D'Auria, L., Barrancos, J., Martín-Lorenzo, A., Van Dorth, D. M., Padilla, G. D., Przeor, M., and Pérez, N. M.: Geothermal and structural features of La Palma island (Canary Islands) imaged by ambient noise tomography, Sci. Rep.-UK, 13, 12892, https://doi.org/10.1038/s41598-023-39910-z, 2023b.
Carracedo, J. C., Badiola, E. R., Guillou, H., De La Nuez, J., and Pérez Torrado, F. J.: Geology and volcanology of La Palma and El Hierro, Western Canaries, Estud. Geol.-Madrid, 57, 175–273, https://doi.org/10.3989/egeol.01575-6134, 2001.
Carvalho, J., Silveira, G., Mendes, V. B., Schimmel, M., and Antón, R.: Insights into fluid migration during the 2021 La Palma eruption using seismic noise interferometry, Front. Earth Sci., 12, 1298472, https://doi.org/10.3389/feart.2024.1298472, 2024.
Cercato, M.: Sensitivity of Rayleigh wave ellipticity and implications for surface wave inversion, Geophys. J. Int., 213, 489–510, https://doi.org/10.1093/gji/ggx558, 2018.
Conte, E., Cosentini, R. M., and Troncone, A.: Shear and dilatational wave velocities for unsaturated soils, Soil Dyn. Earthq. Eng., 29, 946–952, https://doi.org/10.1016/j.soildyn.2008.11.001, 2009.
Delorey, A. A., Guyer, R. A., Bokelmann, G. H. R., and Johnson, P. A.: Probing the Damage Zone at Parkfield, Geophys. Res. Lett., 48, e2021GL093518, https://doi.org/10.1029/2021GL093518, 2021.
Díaz, J., Ruiz, M., Sánchez-Pastor, P. S., and Romero, P.: Urban Seismology: on the origin of earth vibrations within a city, Sci. Rep.-UK, 7, 15296, https://doi.org/10.1038/s41598-017-15499-y, 2017.
Dirección General de Costas: Study of tides and hydrographic zero. Ecocartographic study of the coast of La Palma Island, No. Technical Report P02202_ATLP_cero_v04, 2004.
Epiard, M., Avard, G., De Moor, J. M., Martínez Cruz, M., Barrantes Castillo, G., and Bakkar, H.: Relationship between Diffuse CO2 Degassing and Volcanic Activity, Case Study of the Poás, Irazú, and Turrialba Volcanoes, Costa Rica, Front. Earth Sci., 5, 71, https://doi.org/10.3389/feart.2017.00071, 2017.
Forde, O. N., Cahill, A. G., Beckie, R. D., and Mayer, K. U.: Barometric-pumping controls fugitive gas emissions from a vadose zone natural gas release, Sci. Rep.-UK, 9, 14080, https://doi.org/10.1038/s41598-019-50426-3, 2019.
Galone, L., Panzera, F., Colica, E., Fucks, E., Carol, E., Cellone, F., Rivero, L., Agius, M. R., and D'Amico, S.: A Seismic Monitoring Tool for Tidal-Forced Aquifer Level Changes in the Río de la Plata Coastal Plain, Argentina, Sustainability, 16, 1432, https://doi.org/10.3390/su16041432, 2024.
García-Gil, A., Jimenez, J., Marazuela, M. Á., Baquedano, C., Martínez-León, J., Cruz-Pérez, N., Laspidou, C., and Santamarta, J. C.: Effects of the 2021 La Palma volcanic eruption on groundwater resources (part I): Hydraulic impacts, Groundwater for Sustainable Development, 23, 100989, https://doi.org/10.1016/j.gsd.2023.100989, 2023.
Gomell, A., Austin, D., Ohms, M., and Pflitsch, A.: Air pressure propagation through Wind Cave and Jewel Cave: How do pressure waves travel through barometric caves?, Int. J. Speleol., 50, 263–273, https://doi.org/10.5038/1827-806X.50.3.2393, 2021.
Haghshenas, E., Bard, P.-Y., Theodulidis, N., and SESAME WP04 Team: Empirical evaluation of microtremor H/V spectral ratio, B. Earthq. Eng, 6, 75–108, https://doi.org/10.1007/s10518-007-9058-x, 2008.
Hanks, R. J. and Woodruff, N. P.: Influence of wind on water vapor transfer through soil, gravel, and straw mulches, Soil Sci., 86, 160–164, 1958.
Hernández, P. A., Notsu, K., Salazar, J. M., Mori, T., Natale, G., Okada, H., Virgili, G., Shimoike, Y., Sato, M., and Pérez, N. M.: Carbon Dioxide Degassing by Advective Flow from Usu Volcano, Japan, Science, 292, 83–86, https://doi.org/10.1126/science.1058450, 2001.
Instituto Geografico Nacional, Spain: Spanish Digital Seismic Network, International Federation of Digital Seismograph Networks [data set], https://doi.org/10.7914/SN/ES, 1999.
Jiao, J. J. and Li, H.: Breathing of coastal vadose zone induced by sea level fluctuations, Geophys. Res. Lett., 31, 2004GL019572, https://doi.org/10.1029/2004GL019572, 2004.
Jones, G. A., Ferreira, A. M. G., Kulessa, B., Schimmel, M., Berbellini, A., and Morelli, A.: Constraints on the Cryohydrological Warming of Firn and Ice in Greenland From Rayleigh Wave Ellipticity Data, Geophys. Res. Lett., 50, e2023GL103673, https://doi.org/10.1029/2023GL103673, 2023.
Kramer, R., Lu, Y., and Bokelmann, G.: Interaction of Air Pressure and Groundwater as Main Cause of Sub-Daily Relative Seismic Velocity Changes, Geophys. Res. Lett., 50, e2022GL101298, https://doi.org/10.1029/2022GL101298, 2023.
Kramer, R., Lu, Y., Wang, Q.-Y., Serafin, S., Ceppi, A., and Bokelmann, G.: Identifying large vulnerable water reservoirs using passive seismic monitoring, Earth Planet. Sc. Lett., 653, 119223, https://doi.org/10.1016/j.epsl.2025.119223, 2025.
Kuang, X., Jiao, J. J., and Li, H.: Review on airflow in unsaturated zones induced by natural forcings: Subsurface Airflow Induced By Natural Forcings, Water Resour. Res., 49, 6137–6165, https://doi.org/10.1002/wrcr.20416, 2013.
Lecocq, T., Hicks, S. P., Van Noten, K., Van Wijk, K., Koelemeijer, P., De Plaen, R. S. M., Massin, F., Hillers, G., Anthony, R. E., Apoloner, M.-T., Arroyo-Solórzano, M., Assink, J. D., Büyükakpınar, P., Cannata, A., Cannavo, F., Carrasco, S., Caudron, C., Chaves, E. J., Cornwell, D. G., Craig, D., Den Ouden, O. F. C., Diaz, J., Donner, S., Evangelidis, C. P., Evers, L., Fauville, B., Fernandez, G. A., Giannopoulos, D., Gibbons, S. J., Girona, T., Grecu, B., Grunberg, M., Hetényi, G., Horleston, A., Inza, A., Irving, J. C. E., Jamalreyhani, M., Kafka, A., Koymans, M. R., Labedz, C. R., Larose, E., Lindsey, N. J., McKinnon, M., Megies, T., Miller, M. S., Minarik, W., Moresi, L., Márquez-Ramírez, V. H., Möllhoff, M., Nesbitt, I. M., Niyogi, S., Ojeda, J., Oth, A., Proud, S., Pulli, J., Retailleau, L., Rintamäki, A. E., Satriano, C., Savage, M. K., Shani-Kadmiel, S., Sleeman, R., Sokos, E., Stammler, K., Stott, A. E., Subedi, S., Sørensen, M. B., Taira, T., Tapia, M., Turhan, F., Van Der Pluijm, B., Vanstone, M., Vergne, J., Vuorinen, T. A. T., Warren, T., Wassermann, J., and Xiao, H.: Global quieting of high-frequency seismic noise due to COVID-19 pandemic lockdown measures, Science, 369, 1338–1343, https://doi.org/10.1126/science.abd2438, 2020.
Lin, W.: Compressible fluid flow through rocks of variable permeability, Rep. UCRL-52304, https://www.osti.gov/servlets/purl/7080925 (last access: 11 May 2026), 1977.
Luu, K.: disba: Numba-accelerated computation of surface wave dispersion, Zenodo [code], https://doi.org/10.5281/ZENODO.5775195, 2021.
Malischewsky, P. G., Scherbaum, F., Lomnitz, C., Tuan, T. T., Wuttke, F., and Shamir, G.: The domain of existence of prograde Rayleigh-wave particle motion for simple models, Wave Motion, 45, 556–564, https://doi.org/10.1016/j.wavemoti.2007.11.004, 2008.
Mao, S., Campillo, M., Van Der Hilst, R. D., Brenguier, F., Stehly, L., and Hillers, G.: High Temporal Resolution Monitoring of Small Variations in Crustal Strain by Dense Seismic Arrays, Geophys. Res. Lett., 46, 128–137, https://doi.org/10.1029/2018GL079944, 2019.
Maupin, V.: 3-D sensitivity kernels of the Rayleigh wave ellipticity, Geophys. J. Int., 211, 107–119, https://doi.org/10.1093/gji/ggx294, 2017.
McMillan, T. C., Rau, G. C., Timms, W. A., and Andersen, M. S.: Utilizing the Impact of Earth and Atmospheric Tides on Groundwater Systems: A Review Reveals the Future Potential, Rev. Geophys., 57, 281–315, https://doi.org/10.1029/2018RG000630, 2019.
Merrit, M.: Estimating hydraulic properties of the Floridan Aquifer System by analysis of earth-tide, ocean-tide, and barometric effects, Collier and Hendry Counties, Florida (No. 2003–4267), U.S. Geological Survey, https://doi.org/10.3133/wri034267, 2004.
Mezcua, J. and Rueda, J.: Seismic Velocity Variations Observed Prior to the La Palma Volcano Eruption on 19 September 2021, in Cumbre Vieja, Canary Islands (Spain), The Seismic Record, 4, 11–20, https://doi.org/10.1785/0320230048, 2024.
Moudden, Y. and Forbes, J. M.: A decade-long climatology of terdiurnal tides using TIMED/SABER observations, J. Geophys. Res.-Space, 118, 4534–4550, https://doi.org/10.1002/jgra.50273, 2013.
Nilson, R. H., Peterson, E. W., Lie, K. H., Burkhard, N. R., and Hearst, J. R.: Atmospheric pumping: A mechanism causing vertical transport of contaminated gases through fractured permeable media, J. Geophys. Res., 96, 21933–21948, https://doi.org/10.1029/91JB01836, 1991.
Padrón, E., Pérez, N. M., Hernández, P. A., Sumino, H., Melián, G., Barrancos, J., Nolasco, D., and Padilla, G.: Helium emission at Cumbre Vieja volcano, La Palma, Canary Islands, Chem. Geol., 312–313, 138–147, https://doi.org/10.1016/j.chemgeo.2012.04.018, 2012.
Padrón, E., Pérez, N. M., Rodríguez, F., Melián, G., Hernández, P. A., Sumino, H., Padilla, G., Barrancos, J., Dionis, S., Notsu, K., and Calvo, D.: Dynamics of diffuse carbon dioxide emissions from Cumbre Vieja volcano, La Palma, Canary Islands, B. Volcanol., 77, 28, https://doi.org/10.1007/s00445-015-0914-2, 2015.
Pérez, N. M., Melián, G. V., Hernández, P. A., Padrón, E., Padilla, G. D., Baldago, Ma. C., Barrancos, J., Rodríguez, F., Asensio-Ramos, M., Alonso, M., Arcilla, C., and Lagmay, A. M.: Diffuse CO2 degassing precursors of the January 2020 eruption of Taal volcano, Philippines, Sci. Rep.-UK, 12, 19091, https://doi.org/10.1038/s41598-022-22066-7, 2022.
Poncela, R., Santamarta, J. C., García-Gil, A., Cruz-Pérez, N., Skupien, E., and García-Barba, J.: Hydrogeological characterization of heterogeneous volcanic aquifers in the Canary Islands using recession analysis of deep water gallery discharge, J. Hydrol., 610, 127975, https://doi.org/10.1016/j.jhydrol.2022.127975, 2022.
Ramesh, K., Mitchell, N. J., Hindley, N. P., and Moffat-Griffin, T.: Long-Term Variability and Tendencies of the Semidiurnal Tide in Mesosphere and Lower Thermosphere From Meteor Radar Observations Over Esrange (67.9° N, 21.1° E), J. Geophys. Res.-Atmos., 130, e2024JD043134, https://doi.org/10.1029/2024JD043134, 2025.
Robinson, E. S. and Bell, R. T.: Tides in confined well-aquifer systems, J. Geophys. Res., 76, 1857–1869, https://doi.org/10.1029/JB076i008p01857, 1971.
Sánchez-Pastor, P., Obermann, A., and Schimmel, M.: Detecting and Locating Precursory Signals During the 2011 El Hierro, Canary Islands, Submarine Eruption, Geophys. Res. Lett., 45, https://doi.org/10.1029/2018GL079550, 2018.
Sánchez-Pastor, P., Wu, S.-M., Hokstad, K., Kristjánsson, B., Drouin, V., Ducrocq, C., Gunnarsson, G., Rinaldi, A., Wiemer, S., and Obermann, A.: Steam caps in geothermal reservoirs can be monitored using seismic noise interferometry, Commun. Earth Environ., 4, 453, https://doi.org/10.1038/s43247-023-01122-8, 2023.
Santana De León, J. M., Melián, G. V., Rodríguez, C., Cervigón-Tomico, G., Ortega, V., Martínez Van Dorth, D., Cabrera-Pérez, I., Cordero, M., Przeor, M., Silva, R. F. F., Matos, S. B. D., Baldoni, E., Ramalho, M. M. P., Viveiros, F., Calvo, D., and Pérez, N. M.: Long-term variations of diffuse CO2 at Cumbre Vieja volcano, La Palma, Canary Islands, EGU General Assembly 2022, Vienna, Austria, 23–27 May 2022, EGU22-8773, https://doi.org/10.5194/egusphere-egu22-8773, 2022.
Sato, K.: Monitoring the underground migration of sequestered carbon dioxide using Earth tides, Energ. Convers. Manage., 47, 2414–2423, https://doi.org/10.1016/j.enconman.2005.11.005, 2006.
Schimmel, M. and Gallart, J.: The use of instantaneous polarization attributes for seismic signal detection and image enhancement, Geophys. J. Int., 155, 653–668, https://doi.org/10.1046/j.1365-246X.2003.02077.x, 2003.
Schimmel, M. and Gallart, J.: Degree of Polarization Filter for Frequency-Dependent Signal Enhancement Through Noise Suppression, B. Seismol. Soc. Am., 94, 1016–1035, https://doi.org/10.1785/0120030178, 2004.
Schimmel, M., Stutzmann, E., Ardhuin, F., and Gallart, J.: Polarized Earth's ambient microseismic noise: Polarized Microseismic Noise, Geochem. Geophy. Geosy., 12, https://doi.org/10.1029/2011GC003661, 2011.
Seivane, H., García-Jerez, A., Navarro, M., Molina, L., and Navarro-Martínez, F.: On the use of the microtremor HVSR for tracking velocity changes: a case study in Campo de Dalías basin (SE Spain), Geophys. J. Int., 230, 542–564, https://doi.org/10.1093/gji/ggac064, 2022.
Seivane, H., Schimmel, M., Martí, D., and Sánchez-Pastor, P.: Rayleigh wave ellipticity from ambient noise: A practical method for monitoring seismic velocity variations in the near-surface, Eng. Geol., 343, 107768, https://doi.org/10.1016/j.enggeo.2024.107768, 2024.
Serrano, I., Dengra, M. A., Almendros, F. J., Torcal, F., and Zhao, D.: Seismic anisotropy tomography beneath La Palma in the Canary Islands, Spain, J. Volcanol. Geoth. Res., 441, 107870, https://doi.org/10.1016/j.jvolgeores.2023.107870, 2023.
Troll, V. R. and Carracedo, J. C.: The Geology of La Palma, in: The Geology of the Canary Islands, Elsevier, 101–180, https://doi.org/10.1016/B978-0-12-809663-5.00003-7, 2016.
Valois, R., Rau, G. C., Vouillamoz, J., and Derode, B.: Estimating Hydraulic Properties of the Shallow Subsurface Using the Groundwater Response to Earth and Atmospheric Tides: A Comparison With Pumping Tests, Water Resour. Res., 58, e2021WR031666, https://doi.org/10.1029/2021WR031666, 2022.
Vassallo, M., Cultrera, G., Di Giulio, G., Cara, F., and Milana, G.: Peak Frequency Changes From HV Spectral Ratios in Central Italy: Effects of Strong Motions and Seasonality Over 12 Years of Observations, J. Geophsy. Res.-Sol. Ea., 127, e2021JB023848, https://doi.org/10.1029/2021JB023848, 2022.
Viveiros, F. and Silva, C.: Hazardous volcanic CO2 diffuse degassing areas – A systematic review on environmental impacts, health, and mitigation strategies, iScience, 27, 110990, https://doi.org/10.1016/j.isci.2024.110990, 2024.
Walter, T., Dahm, T., Cesca, S., Valenzuela-Malebran, C., Milkereit, C., Richter, N., Shevshenko, A., Vollmer, D., and Kriegerowski, M.: HART-La Palma volcanic eruption, Dataset/Seismic Network, GFZ Data Services [data set], https://doi.org/10.14470/4N7576350874, 2021.
Wang, C.-Y. and Manga, M.: Response to Tides, Barometric Pressure and Seismic Waves, in: Water and Earthquakes, Springer International Publishing, Cham, 83–153, https://doi.org/10.1007/978-3-030-64308-9_5, 2021.
Wang, X., Feng, X., Nilot, E. A., Bai, H., and Ding, M.: Study on nonlinear elastic behavior in diurnal surface velocity variations caused by temperature using distributed acoustic sensing, Geophysics, 90, MR85–MR95, https://doi.org/10.1190/geo2024-0455.1, 2025.
Welch, P.: The use of fast Fourier transform for the estimation of power spectra: A method based on time averaging over short, modified periodograms, IEEE Trans. Audio Electroacoust., 15, 70–73, https://doi.org/10.1109/TAU.1967.1161901, 1967.
Yunjun, Z., Fattahi, H., Pi, X., Rosen, P., and Aoki, Y.: PySolid: A Python wrapper for solid Earth tides, GitHub repository, 2022.
Zimmerman, R. W.: Pore Volume and Porosity Changes under Uniaxial Strain Conditions, Transport Porous Med., 119, 481–498, https://doi.org/10.1007/s11242-017-0894-0, 2017.
Zimmerman, R. W.: The Imperial College Lectures in Petroleum Engineering: Volume 5: Fluid Flow in Porous Media, World Scientific (Europe), https://doi.org/10.1142/q0146, 2018.