the Creative Commons Attribution 4.0 License.
the Creative Commons Attribution 4.0 License.
 | 08 May 2026
Longitudinal wave power as a proxy for coastal change detection
Óscar Ferreira
Alejandro López-Ruiz
Miguel Ortega-Sánchez
Coastal areas are subject to atmospheric, fluvial and marine hazards that can cause relevant morphological changes. Wave height (Hs) is the most commonly used climate variable to define morphological changes in coastal engineering studies. However, this approach fails to capture directional effects, which are essential for predicting and managing shoreline erosion and associated risks. This work introduces a methodology that identifies relevant morphological changes (morphological events) by using the longitudinal wave power (LWP), after defining an optimized set of Peak Over Threshold (POT) parameters. The morphological evolution of an idealized river mouth was simulated using the Delft3D numerical model and six different wave climate conditions along with tidal and river flow conditions. The optimized LWP approach performed better than Hs in identifying morphological changes, providing a better agreement between climatological and morphological events. The methodology was further validated through its application to two real-world sites along the southern Iberian Peninsula incorporating real wave conditions, variable river discharges, and complete tidal regimes. In these areas, the numerical models had been previously calibrated. The results confirm the robustness and transferability of the methodology beyond idealized conditions. By considering both erosional and accretional processes, this LWP-based methodology offers coastal managers a robust, physics-based tool for predicting morphological responses to wave conditions, supporting the development of early warning systems on inlet-adjacent shorelines.
- Article
(4171 KB) - Full-text XML
-
Supplement
(2739 KB) - BibTeX
- EndNote


Coastal areas, including tidal inlets, estuaries and river mouths, are continuously affected by changes in their morphology as a result of the action of atmospheric, fluvial and marine agents, as well as variations in sediment supply, either due to natural causes (e.g. droughts/floods) (Cabezas-Rabadán et al., 2024; Roco et al., 2024; Velasquez-Montoya et al., 2020) or artificial ones (e.g. coastal engineering works such as nourishments or groins) (Benedet et al., 2016). The population living along the coast has increased over the years leading to a strong interaction between human occupation and coastal dynamics and a significant elevation of risk associated with natural hazards (Celedón et al., 2023). Coastal erosion, caused by sediment starvation, storm activity, human interventions and sea level rise, is a primary hazard and one of the main topics in coastal management (Adamo et al., 2014; Toimil et al., 2017; Vitousek et al., 2017). This erosion not only compromises the integrity of coastal ecosystems but also threatens human infrastructure and safety, highlighting the urgent need for effective risk assessment, mitigation strategies, and the development of coastal management (Manno et al., 2016).
Intensive river regulation and human intervention near river mouths since the beginning of the 20th century have resulted in some of the most eroded coastlines (Anthony et al., 2015). This is a consequence of the strong reduction in the sediments traditionally supplied to the coast by rivers (Baar et al., 2023; Gao et al., 2019; Garel and Ferreira, 2011; Özpolat and Demir, 2019; Poulos and Collins, 2002), and also of the presence of artificial obstacles on the coast that interrupt littoral drift and contribute to exacerbating the effects of the structural erosion (Van Rijn, 2011). Together with medium- to long-term structural erosion, coastal areas can be affected by short-term events that can lead to relevant morphological changes. These events are often linked to natural hazards such as severe storms, which drastically increase coastal vulnerability (Celedón et al., 2023). In the literature, most authors have defined coastal events as extreme meteorological conditions (storms) that lead to coastal erosion. Moreover, Harley (2017) defines a coastal storm as “a meteorologically-induced disturbance to the local maritime conditions (i.e. waves and/or water levels) that has the potential to significantly alter the underlying morphology and expose the backshore to waves, currents and/or inundation”. The defining hallmarks of a coastal storm are that it must include a maritime component, and a morphological disturbance. If the duration of the event is long enough (in the order of days), the morphological changes produced may not return to their pre-storm state (Castelle and Harley, 2020). Therefore, a large part of the studies related to coastal change deal with coastal erosion due to storms, especially cross-shore erosion (e.g. Kelpšaitė-Rimkienė et al., 2021; López-Olmedilla et al., 2022; Romão et al., 2024; Toimil et al., 2017; Zhang et al., 2025). However, it is well known that beaches can recover due to sediment accretion (Bramato et al., 2012; Cabezas-Rabadán et al., 2024; Vousdoukas et al., 2011) by both cross-shore and longshore processes. The alongshore non-uniformity found in some environments, consisting of alternating shoreline salients and embayments, can result in strongly longshore-varying erosion rates at the onset of a storm (Harley, 2017). Typically, longshore processes, including sediment transport, are considered to understand how the shoreline changes over time (de Santiago et al., 2021; López-Olmedilla et al., 2022; Vitousek et al., 2017) by calculating the changes across various beach sectors.
The literature on the interrelated patterns of erosion and accretion that may occur due to an event in coastal areas near inlets and estuaries is limited. This is particularly relevant in such areas, where complex longshore and cross-shore interactions can result in potential erosion in some zones and accretion in others (Anthony, 2013; Ruiz de Alegría-Arzaburu et al., 2022; Thom and Hall, 1991). Nienhuis et al. (2016) concluded that the short-term dynamic behavior of river mouths and the surrounding coasts is not only determined by storms and floods, and that moderate conditions can play a major role. In fact, morphological changes in coastal areas can occur during other events that are not considered extreme but have sufficient energy or duration to promote these changes (Haerens et al., 2012). On the other hand, studies of coastal storminess using a statistical approach, such as Peaks Over Threshold (POT) method, are widely used (Almeida et al., 2012; Armaroli et al., 2012; Castelle et al., 2015; Masselink et al., 2014; Mendoza et al., 2011; Plomaritis et al., 2015). Furthermore, some studies have employed the Wave Energy Flux or the Wave Power for coastal risk evaluation. For instance, in Mentaschi et al. (2017), where they use the 100 year return level of Wave Energy Flux as a robust proxy for both coastal flooding and erosion. More recently, Rusu (2022) demonstrated that the spatial distribution of wave power is heavily influenced by local bathymetry, highlighting its relevance for site-specific coastal planning. Nevertheless, to the authors' knowledge, no detailed studies have integrated the role of Longitudinal Wave Power (LWP), quantified using the POT method to identify significant morphological changes, and subsequently compared this role with that of extreme events.
In view of the above, the main objectives of this paper are twofold: (a) to identify all types of events that can lead to significant morphological changes along a coastal area surrounding an inlet, reflecting the interaction between offshore wave conditions, sediment transport and coastal morphology, and (b) to improve the understanding of the longshore and cross-shore signals in the morphological response of the considered coastal area. This enhanced understanding is essential for improving coastal hazard and risk assessment models, and ultimately, for better-informed coastal planning and disaster risk reduction. To this end, a modelling approach was used and a new method for identifying coastal morphological changes was developed.
The paper is structured as follows: Section 2 explains the materials used and the modeling approach followed in the work. Section 3 provides a detailed explanation of the methodology used to identify the events, whether morphological (Sect. 3.1) or climatic (Sect. 3.2), followed by the definition of the method selection (Sect. 3.3) and the implemented statistical analysis (Sect. 3.4). Section 4 presents the results obtained. Section 5 provides a real-world application focusing on two areas on the South Atlantic coast of the Iberian Peninsula. Section 6 provides a comprehensive discussion of the methodology and results, and finally, Sect. 7 presents the conclusions.
This work utilizes morphodynamic numerical modeling using Delft3D of an idealized physical scenario forced with different wave conditions under constant tide and river flow conditions. The methodological procedure is explained in this section.
2.1 Physical scenario
The physical scenario is based on an idealized river mouth following previous works by Nienhuis et al. (2016) and Ruiz-Reina and López-Ruiz (2021). The scenario follows a typical idealized river mouth like those of previous studies (Jiang et al., 2024; Jiménez-Robles and Ortega-Sánchez, 2018; Jiménez-Robles et al., 2016; Matsoukis et al., 2023). This scenario, shown in Fig. 1a, is representative of several real study areas such as the coastal areas surrounding the mouth of the Guadiaro River (Cadiz, Spain) (Roman-Sierra et al., 2008), the Misa River (Senigallia, Italy) (Melito et al., 2020) or the Maipo River (Central Chile) (Roco et al., 2024). The wave climates of these areas are similar to the wave conditions used in this work.
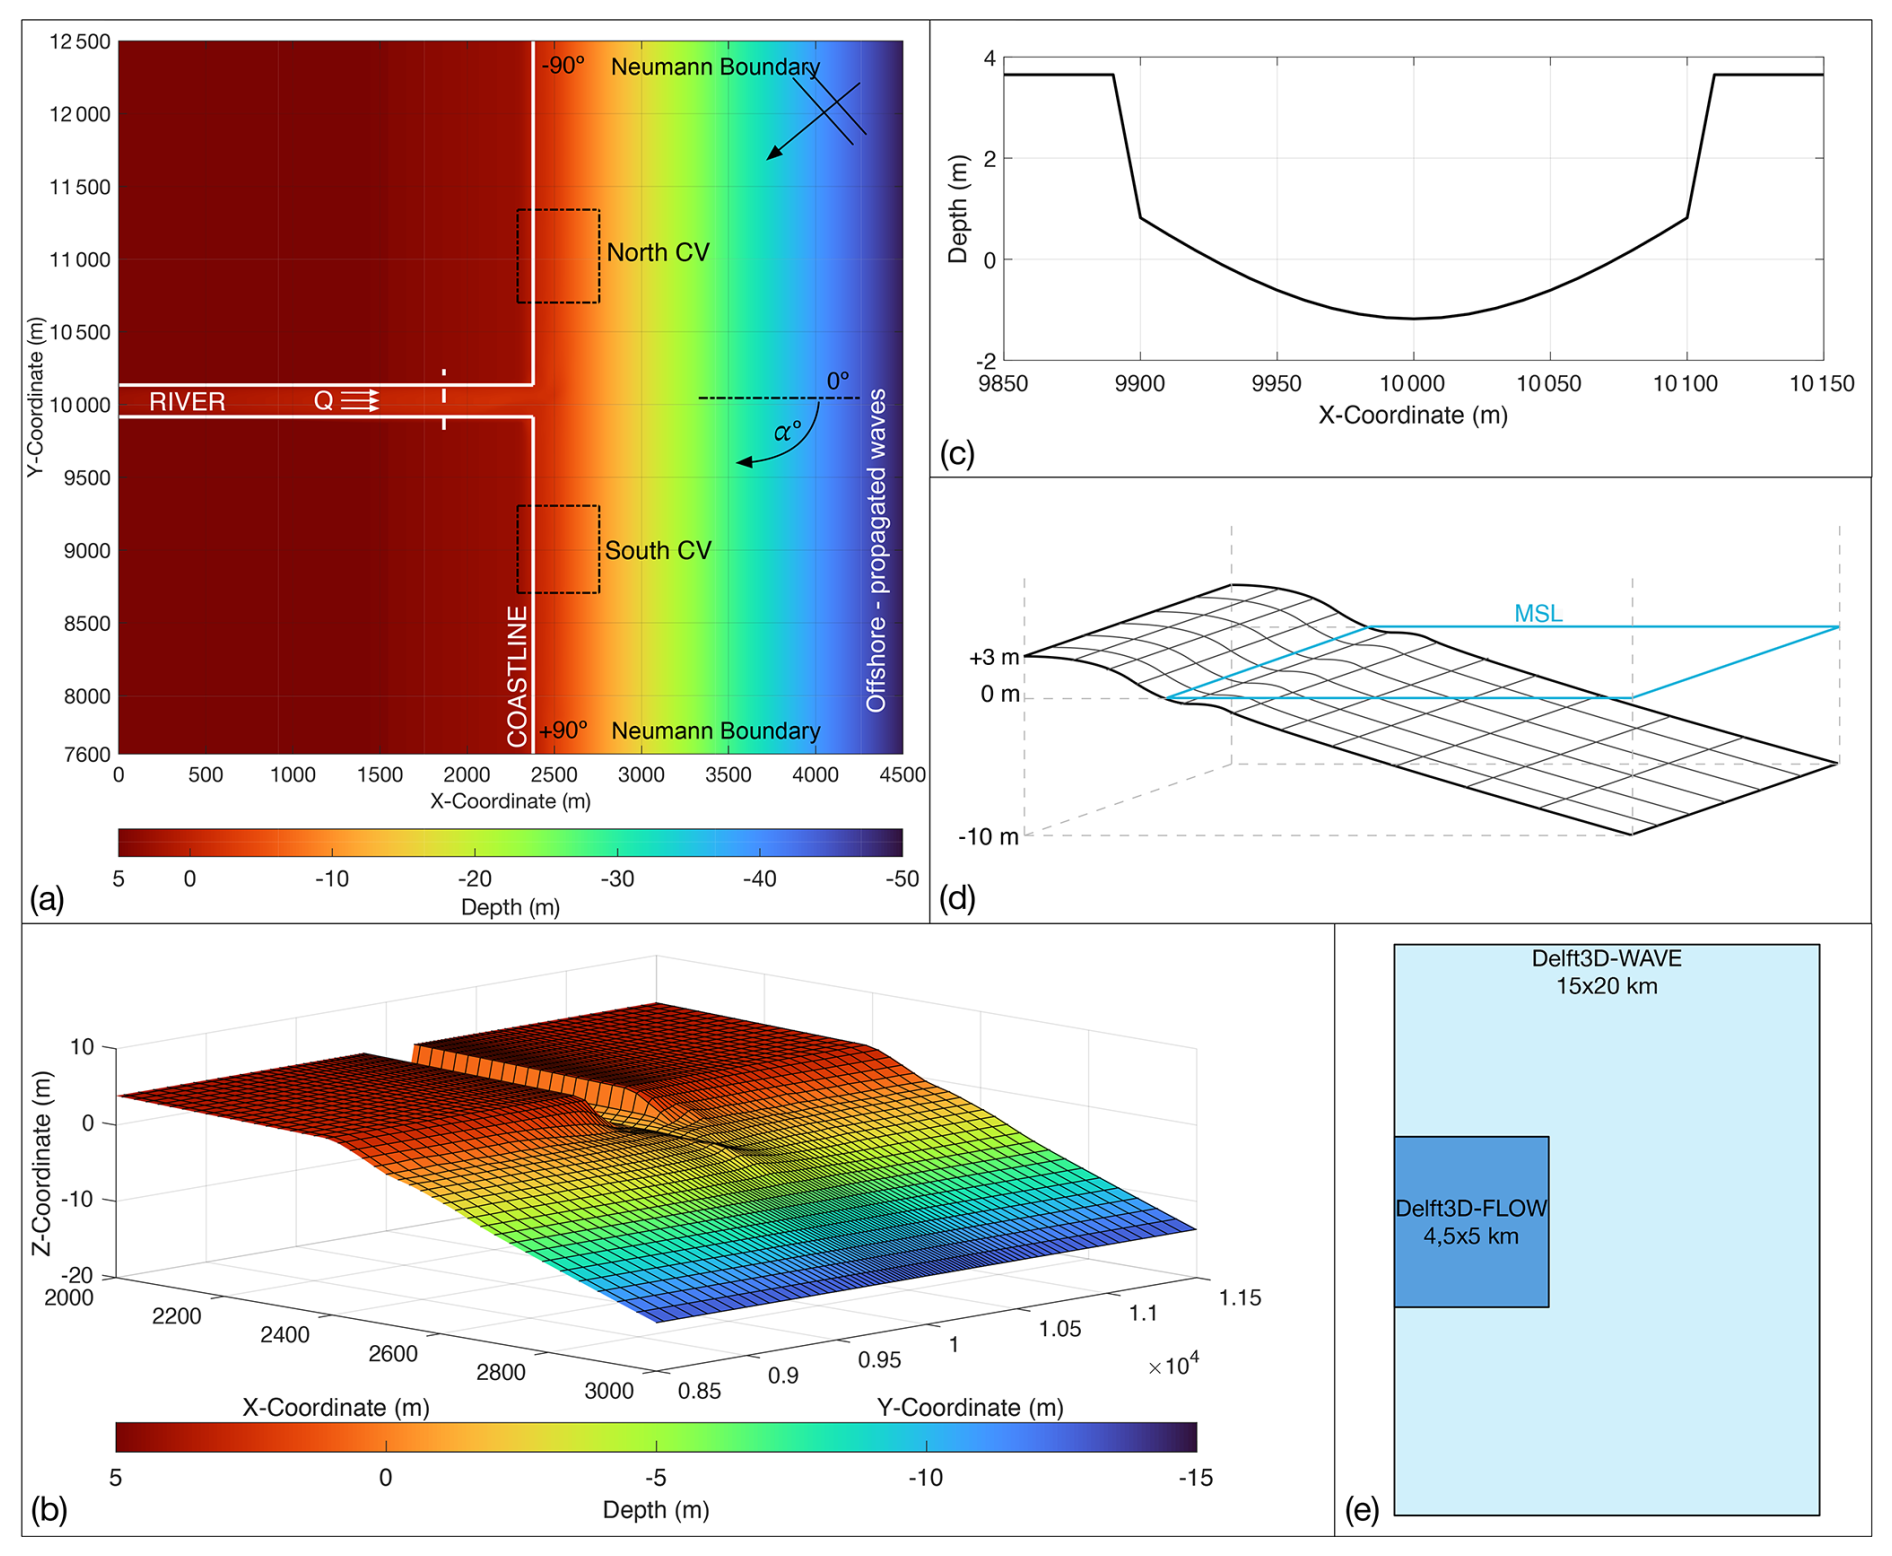
Figure 1Physical scenario: (a) and (b) depict the smoothed bathymetry (basic state) used for the simulations; (a) plan view where the dashed black line represents shore-normal incident waves, with positive (negative) values indicating waves coming from the South (North) part of the figure, and the white arrows on the river channel indicates the flow discharge (Q); (b) 3D view; (c) channel cross-section corresponding to the dashed white line position in (a); (d) representation of the surface (with variable grid) and the limits for the volume calculated in each control volume (CV) depicted in (a); and (e) the Delft3D-FLOW domain embedded into a larger Delft3D-WAVE domain; note that the FLOW domain is coupled with the WAVE domain.
The geometry of the domain is rectangular, with a length of 4500 m on the X axis and 5000 m on the Y axis (Fig. 1a). The river segment modeled is 2500 m long and 200 m wide, featuring a Gaussian cross section (Fig. 1c) with a 5 m depth at the thalweg and a 0.2 % slope. Specifically, the segment serves as a numerical representation of a larger system, where the 2500 m open upstream boundary (explained in Sect. 2.4) is placed beyond the 1000 m tidal excursion limit to prevent tidal wave reflections from influencing the imposed discharge condition. The river reaches the continental shelf at 2 m below mean sea level (houtlet=2 m b.m.s.l.). The beach on both sides of the river also has a slope of 0.2 % up to the point of interaction with the beach face at 3 m a.m.s.l. The geometry of the study area was designed to keep much of the beach dry, so that the berm located at 3 m a.m.s.l. prevents overtopping by moderate swells. From there, the beach face and the continental shelf were defined by a modified Dean profile, as proposed by Falqués and Calvete (2005), with Dean parameter A=0.21, based on a uniform, non-cohesive D50=1 mm. This sediment size is typical of the Spanish Mediterranean coast (Bergillos et al., 2016; Durán et al., 2016) and will be used for the entire topo-bathymetry for simplicity. The shelf reaches a depth of 51 m b.m.s.l. at the offshore boundary where the hydrodynamic boundary conditions are defined (Flow module of Delft3D) and a depth of 258 m b.m.s.l. where the wave boundary conditions are imposed (Wave module). This profile, unlike the classic Dean profile, makes the transition from the continental shelf to the beach smoother, eliminating abrupt changes.
The defined bathymetry was smoothed to produce more realistic experiments (Fig. 1a and b). For this purpose, a first Delft3D real-time simulation was performed with 6 months of medium energy wave climate (from the same data point, Sect. 2.2) and with the same synthetic tidal forcing and flow rate as used in the rest of the experiments (see Sect. 2.2 for further details). This wave climate is characterized by a mean wave height of 1.1 m, a mean peak period of 5.6 s, and two arrival directions at 0 and 22.5° (following the reference of Fig. 1a). At the end, the bathymetry reached a quasi-steady behavior, defined as the basic state, which was then used for the remaining simulations. For more information see Aragón et al. (2023).
2.2 Hydrodynamic Forcings
The wave data were provided by the MeteOcean Research Group of the University of Genoa (Italy) (Besio et al., 2016; Cassola et al., 2016; Lira-Loarca et al., 2023; Mentaschi et al., 2013, 2015) at a point located 15.2 km off the Mediterranean coast of Cadiz (Spain). The dataset consists of hourly information on the significant wave height (Hs), the peak period (Tp), and the mean incoming wave direction. The wave directions were modified to fit into the orientation of the defined physical scenario, following the system of reference shown in Fig. 1a. The study uses idealized conditions, both morphological and climatic, which are nevertheless based on real-world data and potentially representative of other bimodal wave climates. Given that the wave data are hourly, all results in this study are presented on the same time scale to ensure consistency.
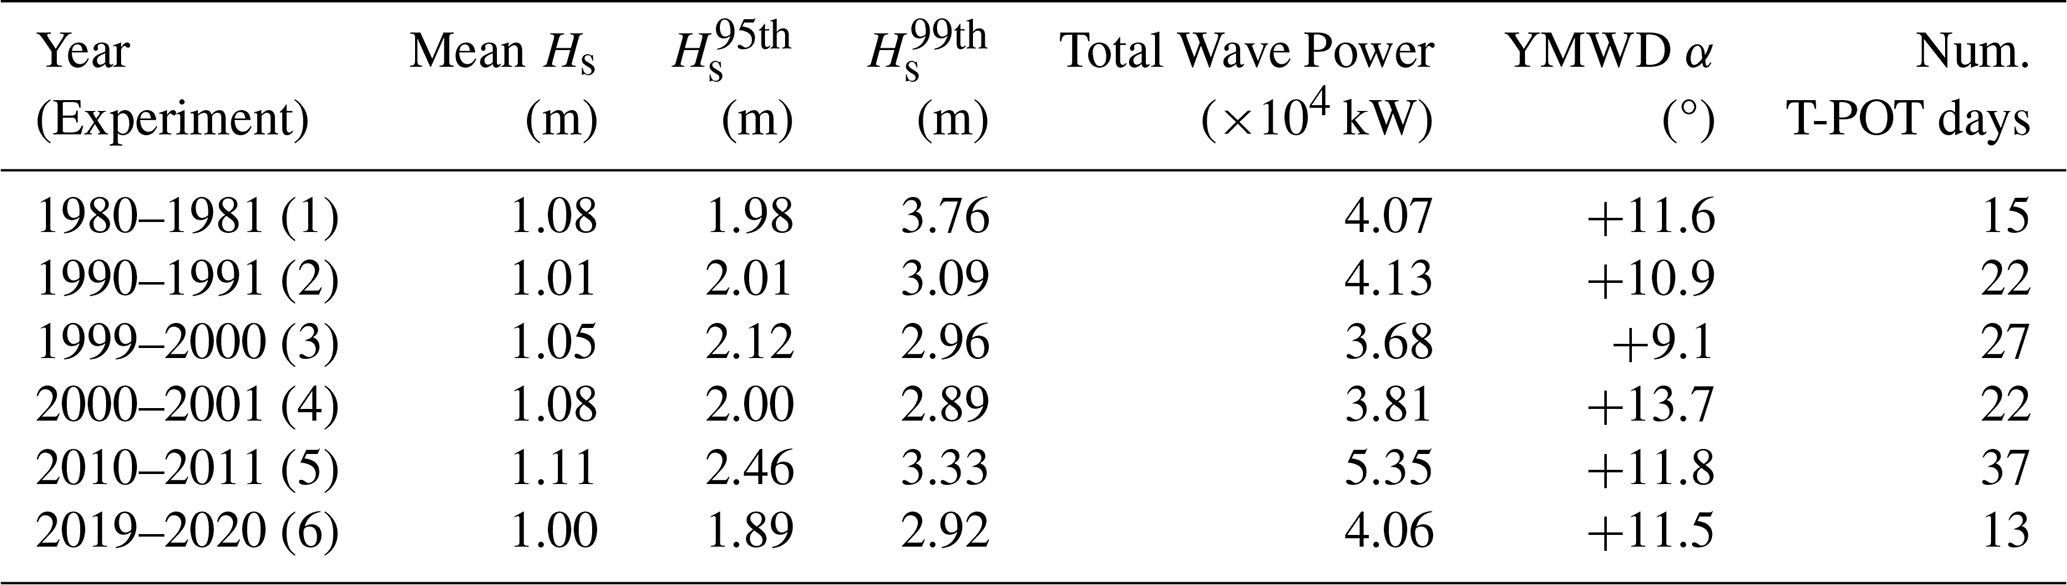
Six different 1-year (from 1 October to 30 September) wave conditions were used for the morphodynamic experiments, using the basic state as the original topo-bathymetry: (1) 1980–1981, (2) 1990–1991, (3) 1999–2000, (4) 2000–2001, (5) 2010–2011 and (6) 2019–2020. While mean Hs values were similar (1.00–1.11 m), the most extreme waves (e.g. Hs 99th) showed greater variability, ranging from 2.89 to 3.76 m (Table 1). This selection focuses on a single representative site to evaluate the methodology's sensitivity to inter-annual variability in wave energy distribution, rather than climatic shifts across different locations. This approach ensures consistency in regional characteristics while maintaining a manageable computational cost for high-resolution event-based analysis.
Table 1Characteristics of the annual wave conditions used, each column representing: statistical values of the significant wave height (Hs), in order: the mean, the 95th percentile and the 99th percentile, respectively; the total wave power; the yearly mean wave direction (YMWD), represented by α (°), which is the angle measured with respect to the normal direction, in a clockwise direction; and the number of days with values that are considered extreme for the Traditional Peaks Over Threshold combination (T-POT) with percentile 95th, 3 d for the independence criterion and 12 h of minimum duration of the storm.
For the astronomical tidal forcing, a synthetic tide with M2 (1 m amplitude and 180° phase) and S2 (0.25 m amplitude and 90° phase) components was defined. This synthetic tide was based on a semidiurnal tidal regime. The resulting tidal range was selected as it effectively represents a realistic average condition, bridging the gap between a micro-tidal regime and a meso-tidal regime. Consequently, this tidal range condition is applicable to a wide array of worldwide coastal areas (Short, 1991; Whitfield and Elliott, 2012). For the river input, a constant flow rate of 10 m3 s−1 was selected based on the ecological and mean flows of Andalusian rivers with similar characteristics. Information related to the mean flow can be found in Ruiz-Reina (2021). The ecological flow data were obtained from Annex V of the hydrological plans for the Tinto, Odiel, and Piedras; Mediterranean Basins; and Guadalete-Barbate basins (Junta de Andalucía, 2023a, b, c), and the Guadalquivir basin (Confederación Hidrográfica del Guadalquivir, 2023).
2.3 Numerical model
The hydrodynamic and morphodynamic simulations were conducted using the high-resolution, fluid dynamics Delft3D model (Lesser et al., 2004), which was developed to simulate coupled unsteady flows, sediment transport phenomena, and associated bathymetric changes. The model has been extensively used to analyze river mouth hydro-morphodynamics (Boudet et al., 2017; Edmonds and Slingerland, 2007; Gao et al., 2019; Nardin and Fagherazzi, 2012; Nienhuis et al., 2016). Following the similarity of the study zone to those in other works such as Lamb et al. (2012) and Jiménez-Robles et al. (2016), the effects of wind, Coriolis force, density stratification, and buoyancy (e.g., affecting hyperpycnal or hypopycnal behavior) were neglected as in the aforementioned works. Accordingly, and following similar works (Broaddus et al., 2025; De Goede, 2020; Hopkins et al., 2018; Mariotti and Murshid, 2018; Nienhuis et al., 2016; Xie et al., 2024), depth-averaged simulations were performed to balance computational feasibility with the required accuracy for morphodynamic simulations.
2.3.1 Model hydrodynamics and wave propagation
The hydrodynamic model uses a finite difference scheme to solve the unsteady shallow water equations for incompressible, turbulent flow. The Flow module with depth-averaged approximation was used, the continuity and horizontal momentum equations from Lesser et al. (2004). The Wave module uses the third-generation SWAN spectral wave model (Booij et al., 1999; Ris et al., 1999). It calculates the propagation of short-crested random waves in coastal regions along deep, intermediate and shallow waters by solving the action balance equation and considering wave-current and wave-seafloor interactions among others. Both modules (Flow and Wave) are coupled online during the simulations: water levels and currents are considered for the wave propagation processes, while wave-induced forces are included in the momentum equation of the hydrodynamic module. Bathymetry is also included in the coupling as an extension of the Flow module.
2.3.2 Sediment transport and morphodynamics
Among the different formulations for non-cohesive sediment transport included in Delft3D, the formulation by van Rijn (2007a) was used, as in other works such as Brakenhoff et al. (2020), Hu and Chen (2023) and Luijendijk et al. (2017). This formulation accounts for the effective velocity and the wave orbital velocity. Bed load and suspended sediment transport for non-cohesive sediments are computed separately with the model. For bed-load transport, the van Rijn (2007a) simplified formula for steady flow, applicable with or without waves, was used:
With D50 being the characteristic diameter of the study area (1 mm), ρs the sediment density [kg m−3], u the depth-averaged velocity, h the water depth and Me the current-wave mobility parameter:
Where s is the relative density calculated the ratio of sediment density to water density (), and ue is the effective velocity:
with γ=0.4 for irregular waves, and the peak orbital velocity Uw (based on linear wave theory) being given by:
while ucr is the critical depth-averaged velocity:
being ucr,c the critical velocity based on Shields (initiation of motion) and ucr,w the critical velocity for waves based on Komar and Miller (1975) with:
For the suspended sediment transport it was used the van Rijn (2007b) simplified suspended load transport equation that reads:
where D∗ is the dimensionless particle size:
being υ the kin viscosity
The parameters used for the Delft3D implementation of the Van Rijn sediment transport formulation are provided in the Supplement (Table S1).
2.4 Model setup and experimental design
The numerical domain was defined with two rectangular variable grids, as shown in Fig. 1e. The Flow domain is nested within a larger Wave grid. The Flow grid was defined with cell sizes ranging from 22 m×22 m to 180 m×120 m, and the Wave grid with cells ranging from 66 m×66 m to 1300 m×730 m. This configuration was developed to ensure proper nesting and minimize numerical instabilities. Four open boundaries were considered in the computational grid (Fig. 1a). The astronomical tidal conditions were imposed at the offshore boundary, with the ocean tide and waves propagating from the seaward boundary towards the coast and river mouth. The two cross-shore boundary conditions were defined as Neumann-type, with null alongshore gradient of the water level to avoid numerical inaccuracies (Roelvink and Walstra, 2004). Finally, at the upstream boundary of the river channel, a constant discharge of 10 m3 s−1 was used (as explained in Sect. 2.2). Equilibrium sediment concentrations were defined for the transport boundary conditions. The bed friction was defined using a constant Chézy coefficient of 65 in both directions, the horizontal eddy viscosity was defined as 2 m2 s−1, and the horizontal eddy diffusivity was defined as 10 m2 s−1. These values are equivalent to those used by Nienhuis et al. (2016) and Ruiz-Reina and López-Ruiz (2021). Stability and accuracy requirements were fulfilled using a time step of 6 s (Deltares, 2026) due to the grid size and the bathymetry. The initial conditions were defined as water at rest (cold-start) and null global suspended sediment concentration. A morphological 12 h spin-up interval was used before considering the bathymetry update.
A sensitivity analysis was conducted through eight additional simulations to assess the robustness of the methodology with respect to key model parameters. While maintaining all other parameters constant, the uniform horizontal eddy viscosity was tested at values of 1 and 5 m2 s−1, and two Chézy roughness coefficients (60 and 70, in both directions) were evaluated for comparison with the original values. These four sensitivity scenarios were performed for two representative experiments (1980–1981 and 1999–2000). The match percentages obtained for both the T-POT and the optimal POT combination were identical across all sensitivity scenarios (Table S4 in the Supplement), confirming that the identified optimal parameter combination is independent of these numerical settings. To consider the possible influence of the wave climate variability on the morphological evolution, the experimental design is based on six different 1 year wave conditions defined in Sect. 2.2. Each experiment was performed with the same initial baseline bathymetry (basic state, see Sect. 2.1) and these results will be further analyzed in the following sections.
Furthermore, it should be noted that this paper only considers results from numerical models of an idealized coastal area, due to the requirement for synchronized hourly resolution of climate and morphological data. Although morphological changes can occur within hours during energetic conditions (Castelle and Harley, 2020; Nienhuis et al., 2016), existing monitoring technologies often lack the temporal and quantitative precision necessary for hourly volumetric change analysis, making it difficult to perform a validation against field data (see Sect. 3). Nevertheless, as previously mentioned, the proposed methodology has been applied to two real-world coastal areas for demonstration purposes, as detailed in Sect. 5.
The present study aims to define a new method to identify morphological changes, both erosion and accretion, on the coast using only deep-water wave information. This new method will provide the best possible parameters to identify morphological changes in similar study area. To apply the method presented here, it is necessary to have the same temporal resolution for both the bathymetry updates and the climate data.
The steps followed to identify the changes are summarized in Fig. 2. Three main blocks can be distinguished: (1) simulation of the morphodynamic evolution of the basic state (Fig. 1a and b), forced with the wave conditions, astronomical tide and river discharge described in Sect. 2.4, in order to obtain the volume variations in the defined control volumes (CV) (Fig. 1a) and then the morphological events (ME); (2) identification of the climatic events (CE) for the longitudinal wave power (LWP) and for the wave height (Hs) using various Peaks Over Threshold (POT) parameters combinations; and (3) find correlations between the ME and CE to provide the best parameters to reproduce these morphological changes (or ME). In wave-dominated coasts, the most common method to define independent events that can produce morphological changes is the POT method, applied to a climatic variable, generally wave height (Celedón et al., 2023; Flor-Blanco et al., 2021; Gramcianinov et al., 2023; Kümmerer et al., 2024; Vieira et al., 2021). However, in this work the POT method is also applied to the LWP and the volume variation.
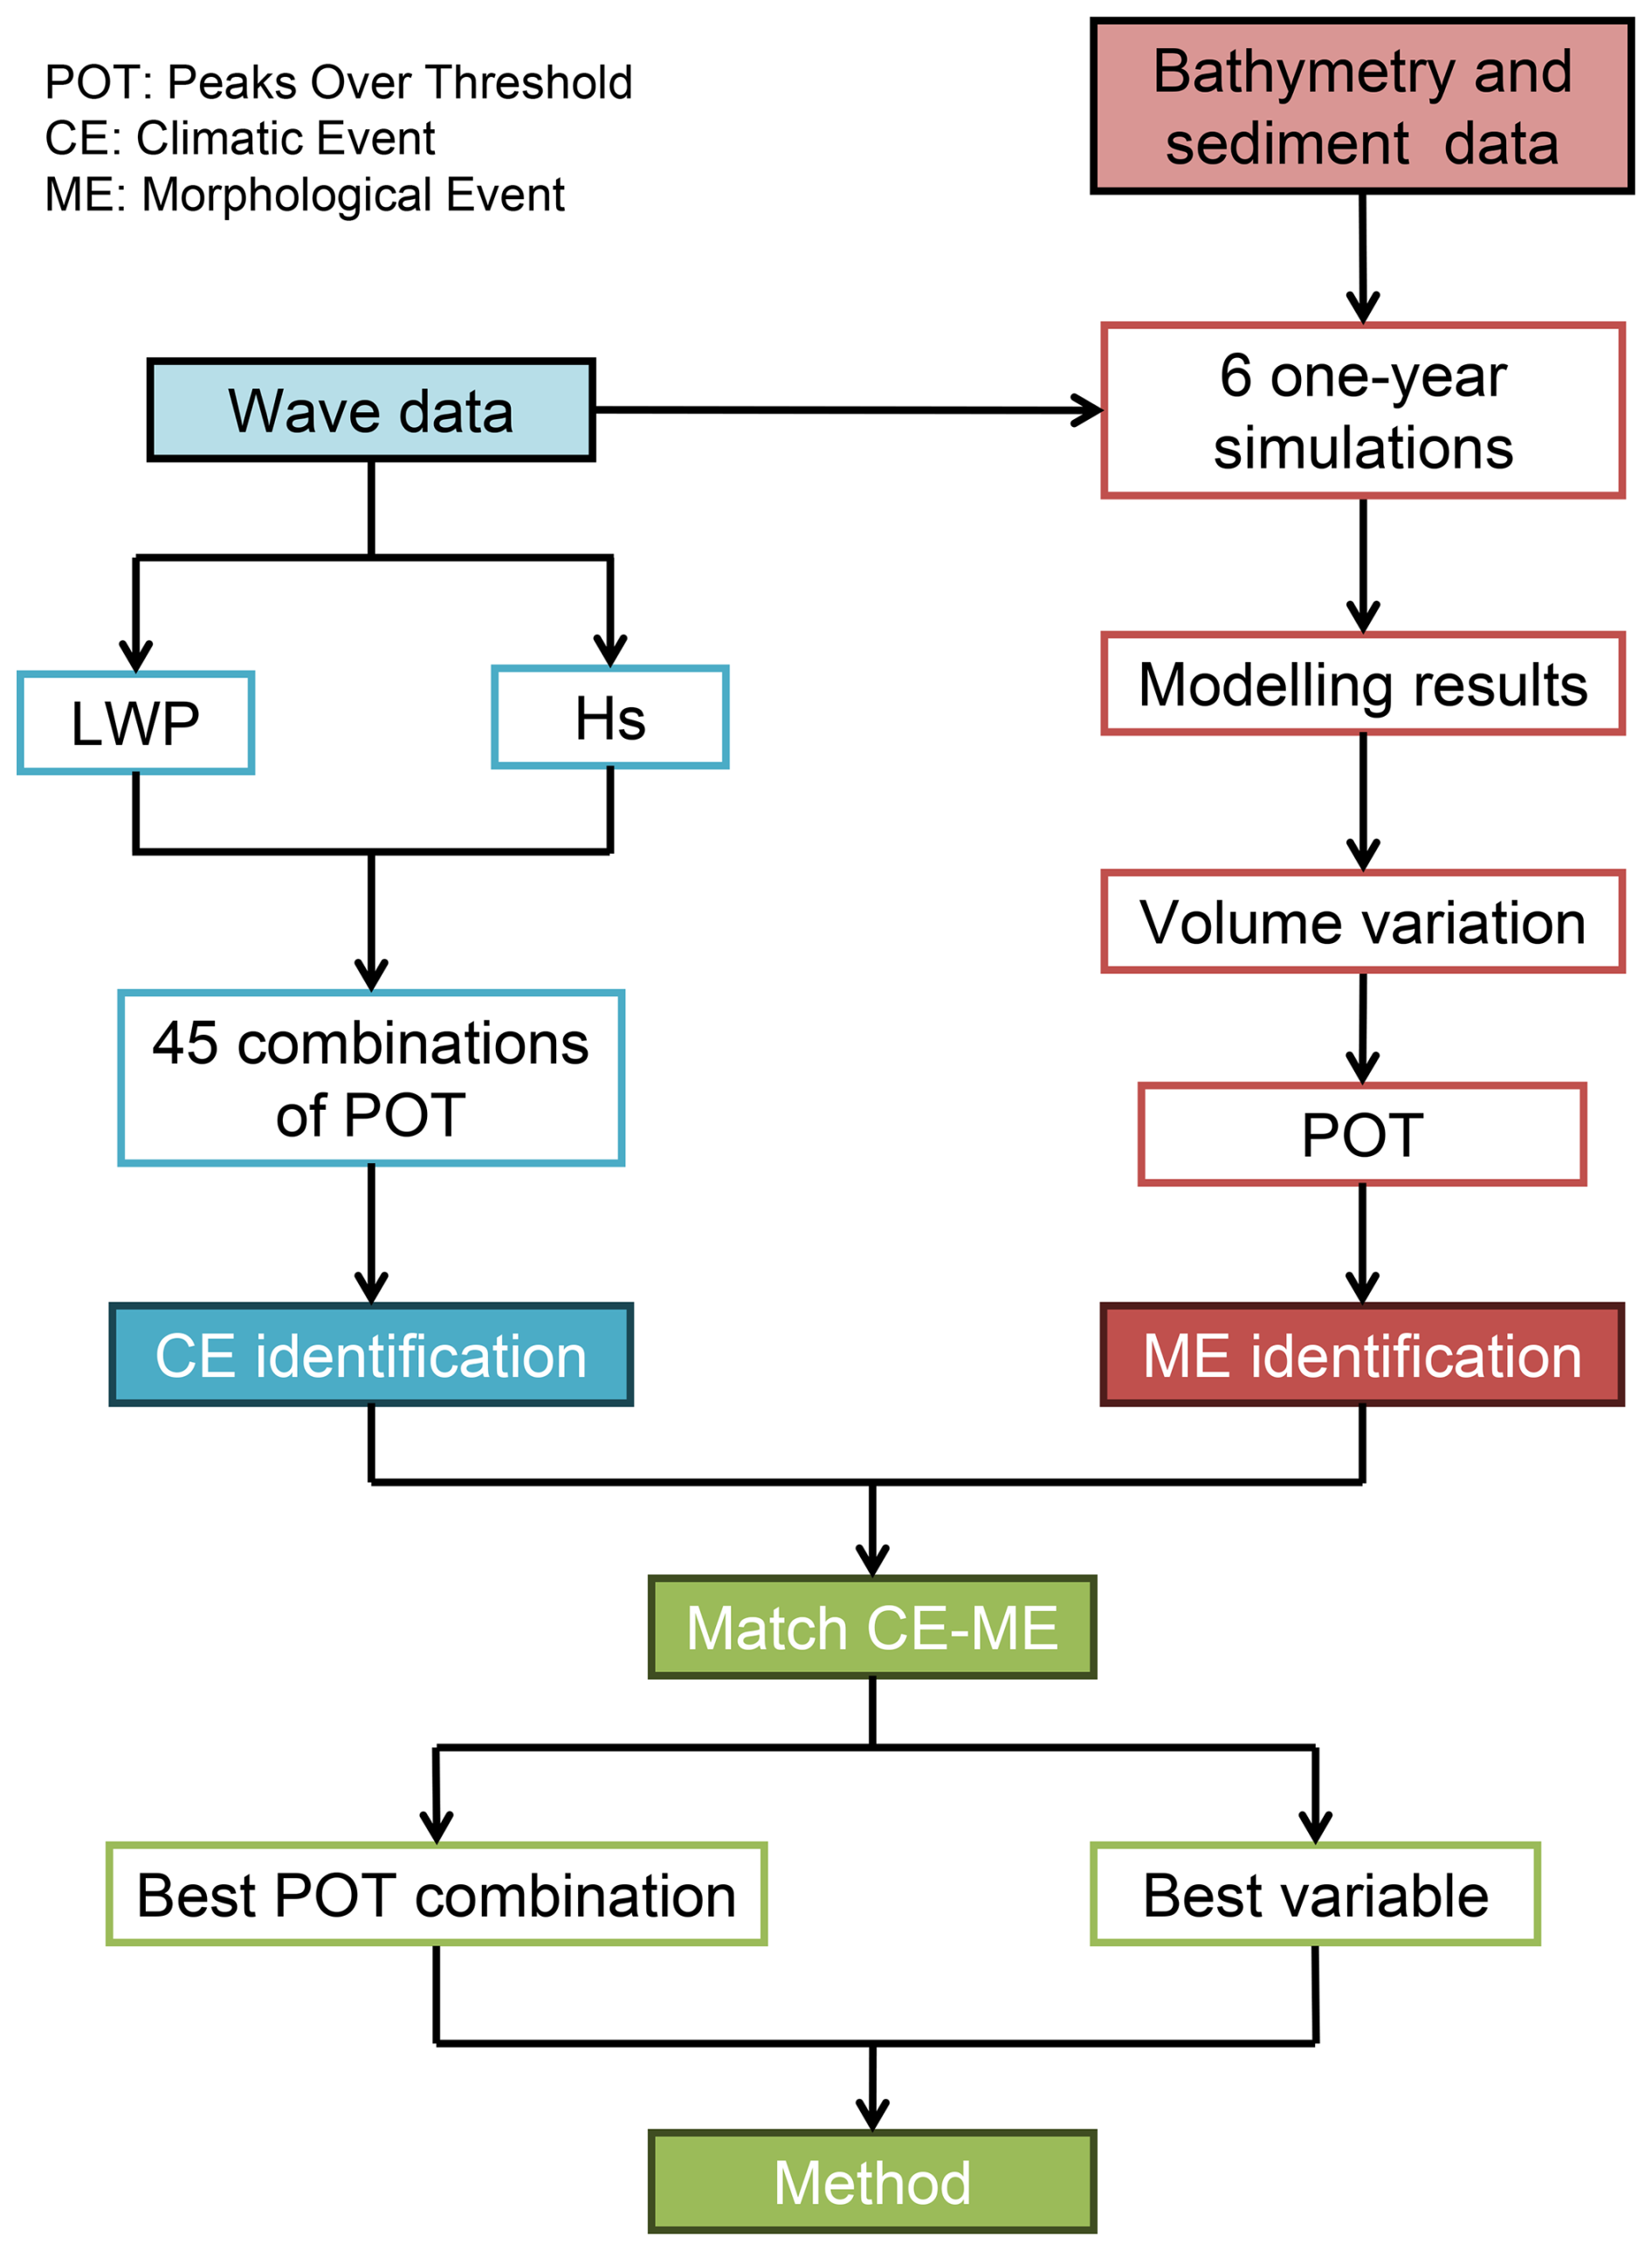
Figure 2Schematization of the methodology followed to obtain the final method of morphological changes identification.
The POT method extracts independent peak values of the selected variable above a certain threshold, which must be identified. The most common method in literature for obtaining the threshold is to use the 5 % exceedance level of the wave height probability distribution (Castelle and Harley, 2020). Nevertheless, the meteorological independence criterion could be very arbitrary as Harley (2017) pointed out. The POT method was applied by the definition of three parameters: (1) threshold, defined by a percentile of the probability distribution, (2) meteorological independence criterion (typically on the order of days), and (3) minimum event duration (typically on the order of hours).
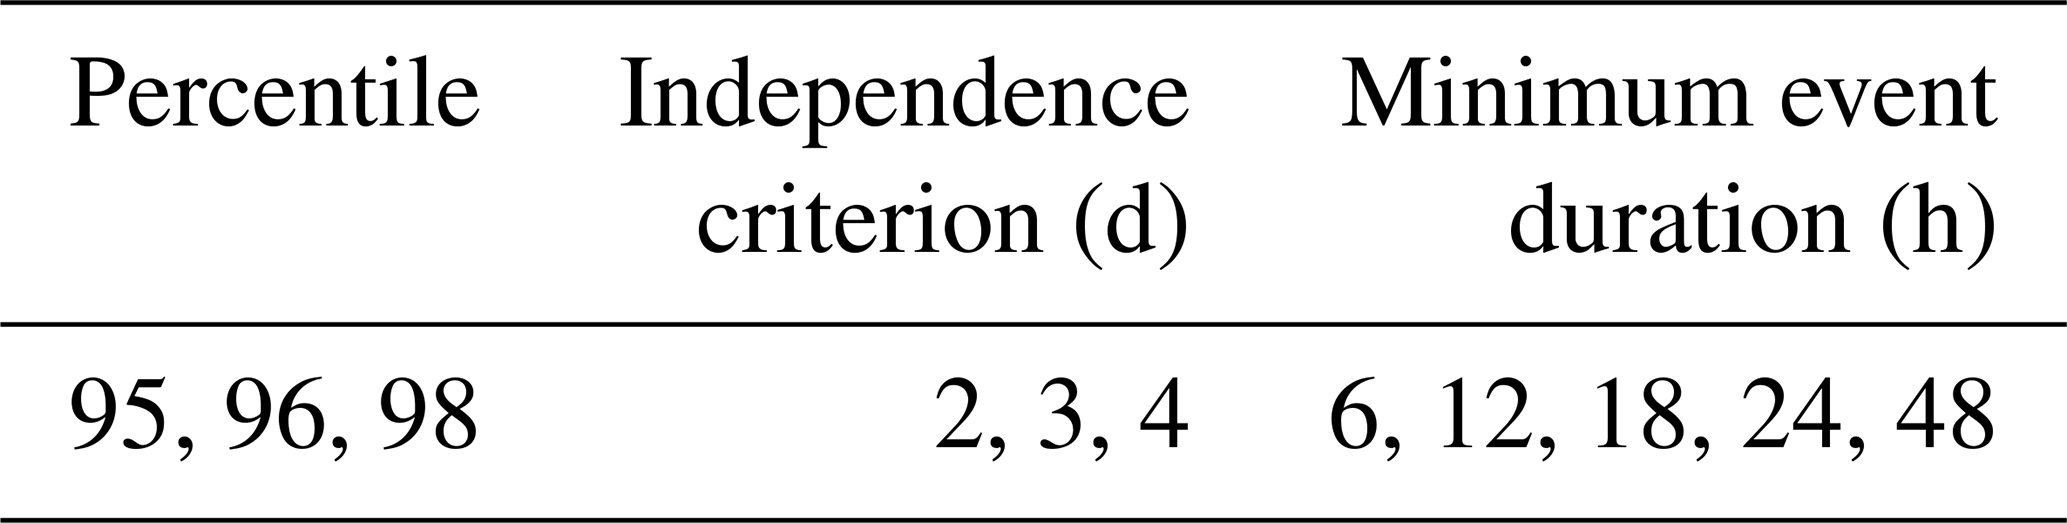
There is a combination commonly used to find extreme events in the Andalusian Atlantic coast (Puig et al., 2016; Rangel-Buitrago and Anfuso, 2015), in the Algarve coast, southern Portugal (Almeida et al., 2012), or in the Spanish Mediterranean, as in the Catalan coast (Lin-Ye et al., 2016), where the three parameters are determined by: (1) a 95th percentile, (2) 3 d as a meteorological independence criterion, and (3) a minimum duration of 12 h. It is hereafter referred to as the traditional POT combination or T-POT. Nevertheless, a total of 45 parameter combinations (including the traditional POT, T-POT) were tested for the CE analysis in the present study (Table 2). As can be seen, there are 3 different percentiles, 3 different meteorological independence criteria, and 5 different minimum durations.
Even though coastal storm thresholds are site-specific (Harley, 2017), the existing literature lacks a unified criterion for these parameters even within the same geographical regions. Storm definitions are commonly different between authors, and storm thresholds are often selected arbitrarily, with the statistical and meteorological independence between storm events frequently being neglected (Kümmerer et al., 2024). This non-uniformity is evident in the threshold selection: for instance, studies on the Mediterranean Sea utilize varying wave height thresholds, such as the 95th percentile (Martzikos et al., 2021), 96th percentile (Del-Rosal-Salido et al., 2025), or 98th percentile (Sanuy et al., 2024). Similarly, the minimum storm duration exhibits significant regional variability: it ranges from 6 h (Mendoza et al., 2011) to 12 h (Ojeda et al., 2017) for the Mediterranean Sea, while on the Atlantic coast (Portugal and West Andalusia), the range is even wider, varying from 12 h (Puig et al., 2016) to 48 h (Almeida et al., 2012). Regarding the independence criterion, which is typically approached using a fixed value (Martzikos et al., 2021), the values shown in Table 2 were selected to cover the observed range in literature. This range extends from the lower boundary of 30 h, established for the South Portuguese coast (Almeida et al., 2012), to the upper limit of 96 h (Martzikos et al., 2021). However, since the POT combinations analyzed included a minimum storm duration of 48 h, adopting an independence interval shorter than this would lack physical consistency. Consequently, the lower boundary was fixed at 48 h (2 d).
A complete list of the 45 combinations and the parameters they represent can be found in the Supplement (Table S3). In the following, each combination (except T-POT) will be named as POT(percentile, days, hours). For instance, the combination represented by the 95th percentile, 2 d for the independence criterion and 18 h of minimum duration of the storm will be referred to as POT(95,2,18).
On the other hand, two different combinations of POT were used for ME. These combinations have the same independence criterion of 12 h and the same minimum duration of 3 h, but two different percentiles: 90th and 95th were used to calculate the threshold of change. In this case, to identify the results (ME) related to one or the other POT, they are called ME90 and ME95, respectively. It is also necessary to point out a slight difference between the use of POT for CE or for ME. While there is a complete and available database for the wave conditions, morphology is based on six different and independent experiments. Therefore, in the case of ME, the thresholds for POT were calculated independently for each experiment (six thresholds for each percentile in each CV, 12 in total), but in the case of CE, only one threshold for each percentile was calculated for the entire time series (three thresholds).
3.1 Identification of Morphological Events
The first step is the identification of the ME generated during the morphodynamic simulations. The total volume change within the control volume (CV) (Fig. 1a), which accounts for both overall erosion and accretion, was used to characterize these morphological variations. Each CV has an area of 0.33 km2, the offshore boundary is set at 10 m b.m.s.l. and the beach boundary is located at 3 m a.m.s.l. (a schematic representation is shown in Fig. 1d). The volume is calculated in relation to the baseline depth of 10 m b.m.s.l., which is deeper than the closure depth (at 7 m b.m.s.l.) estimated using the Hallermeier (1980) equation. Following Ortiz and Ashton (2016), using a baseline deeper than the closure depth allows the analysis to capture all the sediment mobilization predicted by the model, as it accounts additional physical processes (tidal currents and river discharge) that are not considered in the Hallermeier formula. This choice was also supported by the numerical grid itself. Using a specific grid line ensures a more consistent and robust boundary for the volume change calculations.
The volume in the CV at hour i (voli) of the simulation is calculated as expressed in equation:
Where tf is the end time of the simulation in hours. Thus, each hourly volume of the CV is calculated as the sum, in the n grid cells of the CV, of the product of the cell area (An) and the difference between the depth −10 m and the depth of the cell at hour i ().
The identification of the ME is assessed by the volumetric change every 48 h (Δvoli, Eq. 10). Δvoli was obtained for each hour as the absolute difference between the CV volume 24 h before and after. After a sensitivity study, it was found that this 48 h interval allows considering both the cumulative effect of existing hydrodynamic events (e.g. storms) and the delay in the response time that often exists between the starting of a hydrodynamic event and the morphological response of the beach.
Once the volumetric variations have been obtained for each CV and for each experiment, the ME is calculated using the POT method previously explained. Different ME are obtained for each experiment and CV, depending on whether the 90th or 95th percentile is used as the threshold (resulting in ME90 and ME95, respectively).
3.2 Identification of Climatic Events
Wave height is frequently used to represent and define extreme events leading to erosion/retreat. However, morphological changes can also occur due to accretion, for instance associated with the recovery after a storm or to the longshore sediment transport. For an overall and continuous analysis of the coastal behavior, the recovery (accretion) of the coast is as important as the erosion (Castelle and Harley, 2020). To include such changes, a more complex description of the wave energy is required, and other proxies could be used. Wave power could better define overall morphological changes as it includes not only wave height but also wave period. Another advantage of wave power is that it can be decomposed into longitudinal and transverse components, which includes the influence of the incoming wave direction. Due to the morphology of the study area and its exposure to different directions, the LWP was tested as a proxy to identify the morphological changes in addition to the traditional wave height POT analysis. To achieve this, the LWP was calculated every hour using all the available climate data, as described below.
Wave Power (or wave energy flux, P) in deep water, is defined as the wave energy flux per unit of crest length for a fixed duration, d. The wave energy flux can be calculated considering the mean energy density, E, and the group wave celerity, cg, as:
where ρ is the water density, g is the gravitational acceleration, Hs is the significant wave height and Tp is peak wave period.
The LWP can be calculated as follows:
Where θ is the direction, following the direction criteria defined in Fig. 1a.
Therefore, it is possible to distinguish between CE related to wave height or longitudinal wave power. Both are calculated using the same procedure explained above, the POT method, which gives 45 possible combinations of CE for each year that can generate changes in the coast.
3.3 Matching between ME and CE
When a ME and a CE occur at the same time, or close to each other, this coincidence is referred to as a match. Since matches refer to the morphological response with respect to a given CE, it is necessary to consider that the coast has a morphological response time (time lag) to a maritime forcing. In this study, it was observed that the largest morphological changes occur within the first 24 h after a CE. Thus, it is considered a match if there is a CE and the corresponding ME is up to 24 h later, in at least one of the CVs. For each possible ME (ME90 and ME95), the variable (Hs or LWP) and the corresponding POT combination with the highest percentage of agreement across all simulations is chosen as the selected pair that best represents the morphological changes in the study area. Note that a 100 % match would mean that all ME would be associated with a CE. To confirm the correct functioning of the selected POT combination, the percentage of the volume mobilized is calculated as the ratio between the volume mobilized by all ME (ME90 or ME95) and the volume mobilized only by the ME identified by the CE (LWP or Hs).
3.4 Optimal POT Selection
The selection of the optimal POT combination is determined using a statistical approach involving a Composite Index (CI). This index was computed to rank the 45 POT combinations by synthesizing two normalized metrics: mean performance (Mnorm) and consistency (Cnorm). The CI is calculated separately for each ME percentile (ME90 and ME95), using the match results obtained earlier. Therefore, a single final match value (either Mean or Consistency) will be obtained for each POT combination, aggregating the data from the six wave conditions and the two CV. Both metrics are scaled to 0–1 range using a min-max scaling, where 1 will be the best performance. The CI is then calculated as a weighted average:
This weighted approach assigns a higher weight to performance (70 %) than to consistency (30 %), ensuring the selected POT combination achieves high accuracy along with coherent behavior. The normalized mean performance (Mnorm) quantifies the average match across all the wave conditions and both CV for each POT combination. It was normalized using a min-max scaling as follows:
Where Mc denotes the average match for a specific POT combination, calculated across all wave conditions and both CV, and Mmin and Mmax correspond to the minimum and maximum of these average match values, respectively, when considering all 45 POT combinations. The normalized Consistency (Cnorm) coefficient quantifies the relative consistency using the Relative Consistency () coefficient, which is intentionally inverted to prioritize low variability (i.e., high consistency). To calculate it, the standard deviation (σ) and the mean match (μ) for each POT combination are needed, each calculated across the six wave conditions and the two CV.
This inversion ensures that the most consistent combinations receive scores approaching 1, allowing for a coherent combination within the CI.
This section shows the simulations results used to describe the behavior of the bathymetry and presents the results of the identification method explained in Sect. 3.
4.1 Modeling results
The results of all experiments show the formation of a delta at the river mouth (Fig. 3). The dynamics of the delta induce asymmetric behavior in the two CVs. They can both act as a source (or sink) of material to (or from) the delta.

Figure 3Final bathymetries obtained for each simulation: (a) 1980–1981, (b) 1990–1991, (c) 1999–2000, (d) 2000–2001, (e) 2010–2011 and (f) 2019–2020.
In each experiment, this asymmetry manifests such that one CV (typically the SCV) experiences a net loss of material to the delta, while the other (typically the NCV) simultaneously undergoes accretion from it. Consequently, the differential morphodynamic response is primarily driven by the Yearly Mean Wave Direction (YMWD, Table 2), which shifts the direction on the longitudinal sediment transport. This mechanism, in conjunction with coast-delta-tide interactions, results in the observed asymmetric morphodynamic response. Overall, all simulations demonstrate a similar morphology: the formation of a northward-rotated ebb delta. This pattern is a direct result of the longitudinal sediment transport generated by the prevailing wave direction of the selected wave conditions.
4.2 T-POT analysis
Before quantifying the matching results by comparing the ME and CE criteria, an analysis of the results obtained was carried out by identifying the ME and their correspondence with the CE obtained by using the T-POT. As an example, this section will refer to the 1980–1981 simulation, as can be seen in Fig. 4 for the ME90 and Fig. 5 for the ME95.
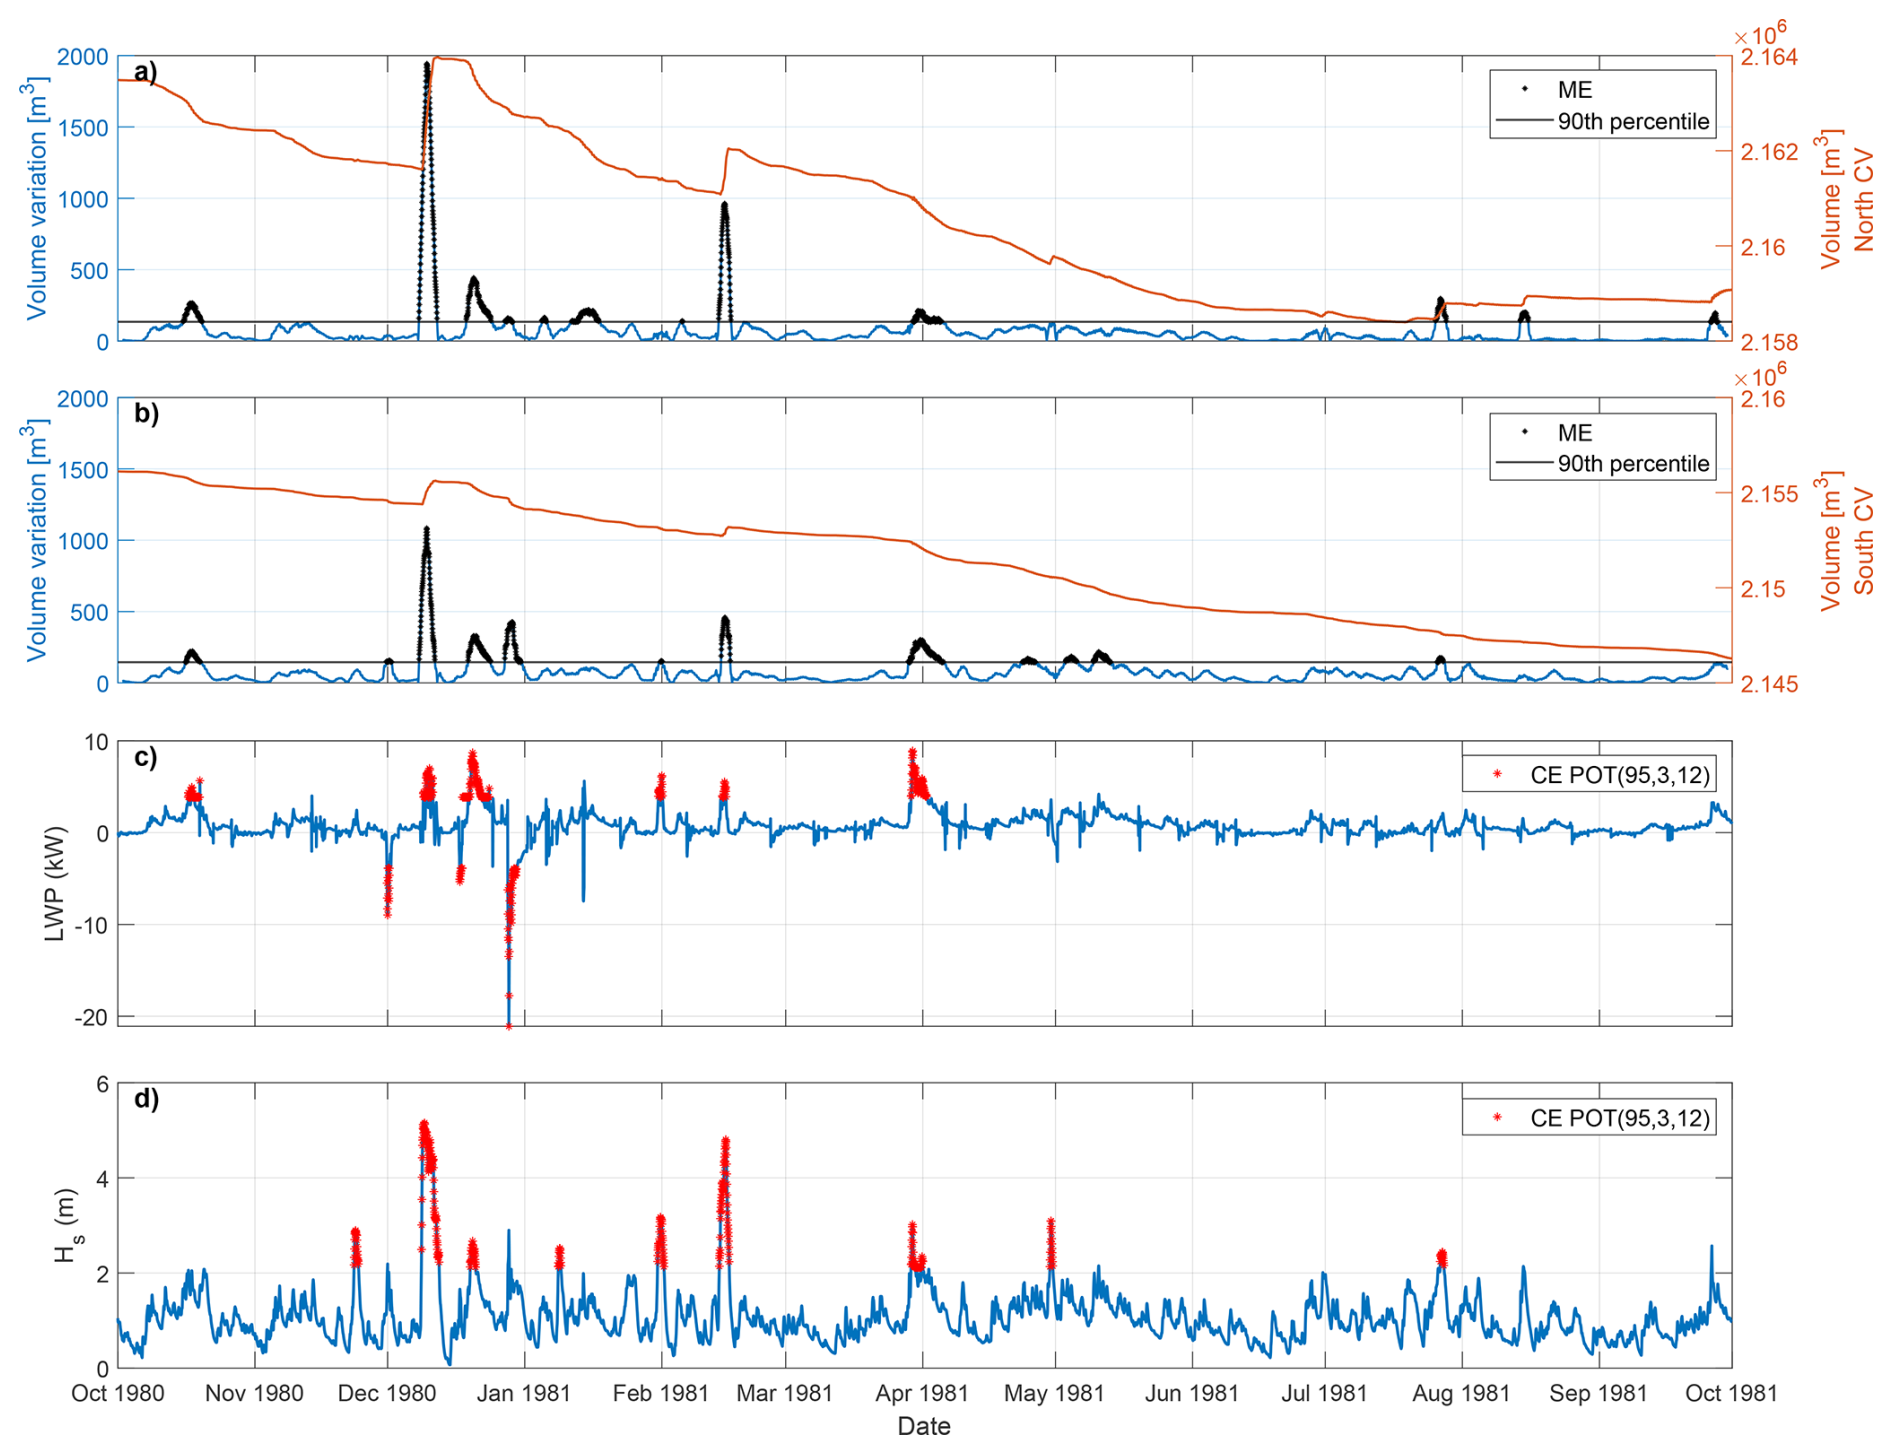
Figure 4Comparison between volume changes, in north (a) and south CV (b), LWP (c) and wave height (d) during the 1980–1981 climate for ME90 (90th percentile for volume variation). In (c) and (d) the CE related to T-POT are marked in red dots.
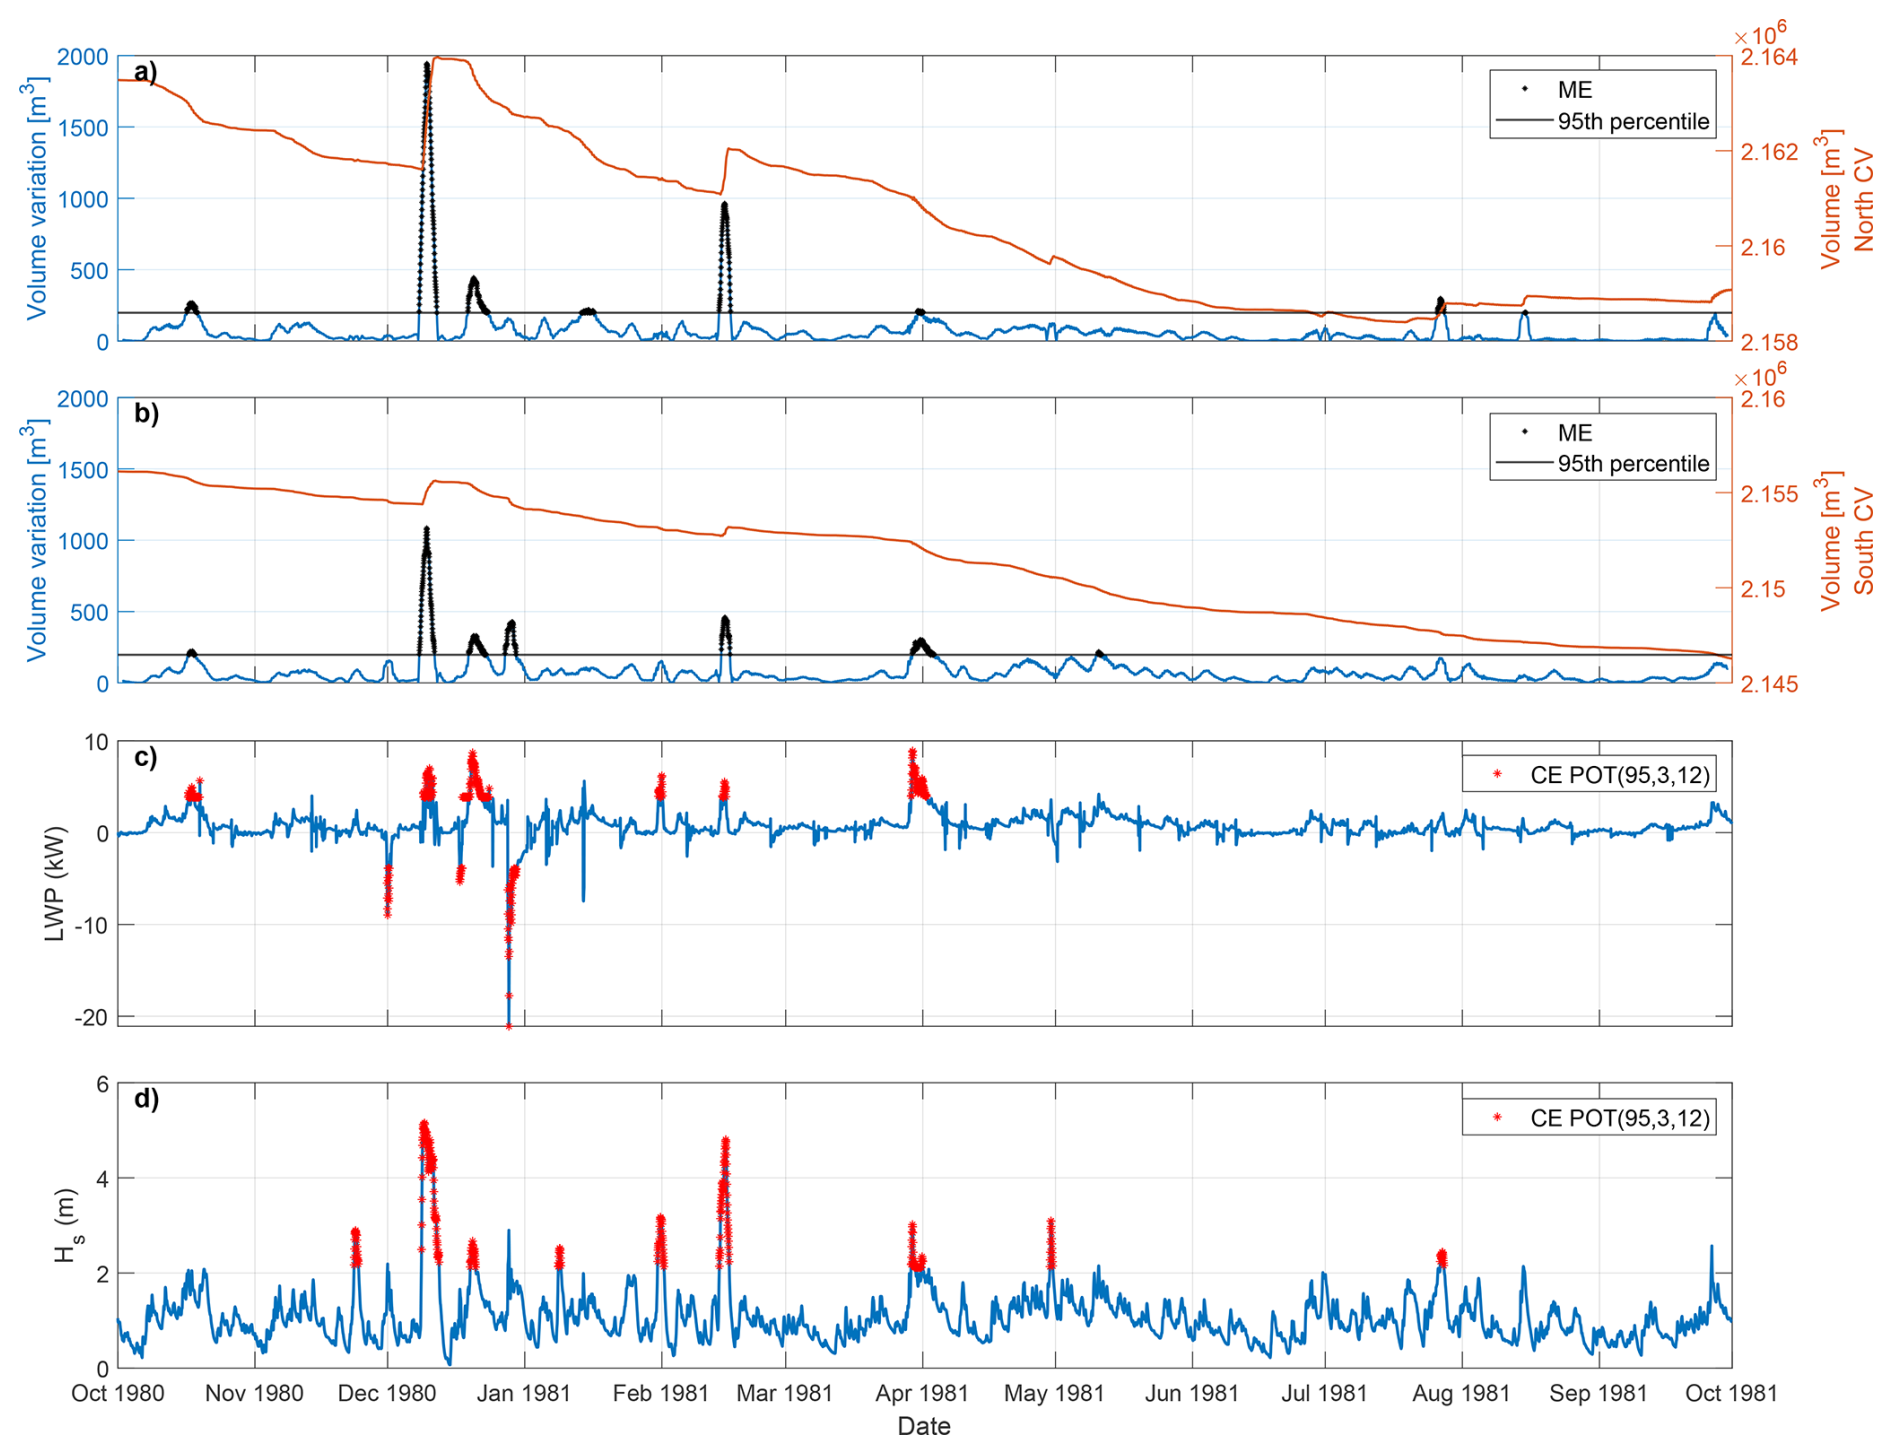
Figure 5Comparison between volume changes, in north (a) and south CV (b), LWP (c) and wave height (d) during the 1980–1981 climate for ME95 (95th percentile for volume variation). In (c) and (d) the CE related to T-POT are marked in red dots.
Focusing only on the results relative to the 90th percentile (Fig. 4), chronologically the first ME, in mid-October, is identified only by the LWP, indicating that the longshore wave power alone was sufficient to exceed the ME threshold despite relatively low wave heights. The reverse occurs in late November, when the wave height conditions are energetic enough to mark a CE that does not correspond to any ME. Similarly to October, in early December 1980, there is an ME on the south beach that corresponds to a CE by the LWP but is not identified by the wave height alone. The strongest match is observed later in December 1980, when a higher-energy storm occurs and the year's largest ME is identified simultaneously by both CEs (LWP and wave height). However, in late December 1980, a ME in both CVs aligns with a CE defined solely by negative LWP, representing northward-directed waves (negative α, Fig. 1a), despite a low wave height. Then, in early to mid-January, an unidentified ME can be observed, followed by another that is only identified by the wave height. Next, from late January to early May, there is a general simultaneous identification of ME by both CE. This pattern holds until mid-May when there is a ME on the south beach that does not correspond to a CE, whether defined by LWP or by wave height. Then, in August 1981, the only ME identified by the wave height criteria that is not considered an event by the LWP is observed. When this ME was analyzed, the importance of cross-shore transport in this event was highlighted. During the rest of the summer some ME were detected but no CE was identified.
A further in-depth analysis was performed by observing whether ME and CE occurred simultaneously (i.e. when the red dots coincided with the black dots). The quantification of the ME is performed simultaneously in both CVs, so that an ME is considered to have occurred if there is a ME in at least one of the two CVs. As shown in Table 3, there are a total of 16 ME for the 90th percentile (Fig. 4a and b, in black). Of these ME, eight are detected by the LWP-based T-POT CE (Fig. 4c, in red) and six by the Hs-based T-POT CE (Fig. 4d, in red). This indicates better performance of the LWP when compared to the wave height, as all identified LWP-CE coincide with ME. In addition, the T-POT of the wave height identifies three other CE that are not associated with any nearby morphological change.
Table 3Number of T-POT CE for both variables (LWP and Hs) and coincidences (match) for all the experiments. The Total ME90 or ME95 are the number of ME that occur at least in one CV.
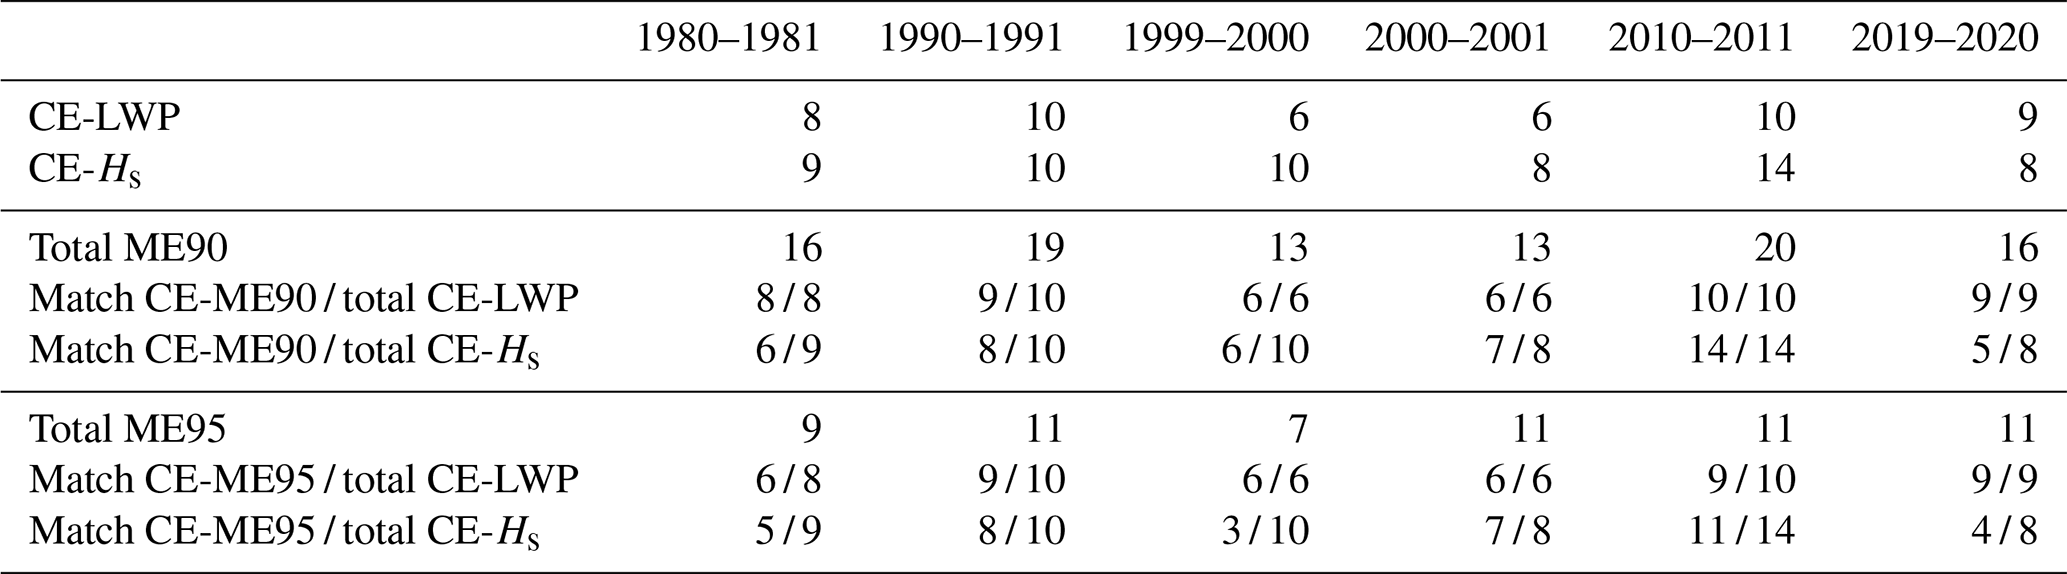
The same analysis was performed for the 95th percentile results (Fig. 5). As the percentile value for ME calculation increased, the number of detected ME decreased (nine ME in total across both CVs). Of these nine ME, six (five) coincide with a T-POT CE based on the LWP (Hs), which also indicates better performance of the LWP compared to the wave height criterion. In this case, both variables have identified CEs that are not associated with any ME: 2 overestimations of LWP and 4 of Hs. This result also suggests that LWP offers a slightly improved performance over Hs in defining a morphological event.
For the remaining experiments, the results can be found in Supplement (Figs. S1–S10), with a summary given in Table 3.
It is noteworthy that for ME90 (ME95), all CE detected by the LWP have a corresponding ME in five (three) out of six experiments. In contrast, for the wave height criterion, this correspondence occurs in only one (zero) out of six experiments. Consequently, the overestimation of events when using wave height is higher than that obtained using LWP. However, for the T-POT analysis, no experiment achieved a complete alignment across all ME metrics. To further evaluate the performance of LWP and Hs, the rates of overestimation and underestimation were analyzed. Here, overestimation refers to a CE with no corresponding ME, while underestimation refers to an ME that remains undetected by any CE. These rates are closely linked to the choice of percentile (ME90 or ME95). As shown in Table 3, the use of ME90 results in a greater number of events, leading to a near-perfect match where almost all CE correspond to an ME. Conversely, because ME95 identifies fewer events, it fails to capture all CE, resulting in higher underestimation.
A direct magnitude comparison between the wave height and LWP thresholds can be misleading since LWP represents only a fraction of the total wave power. Furthermore, the identification of ME events only by wave height (late November, mid-January, and late August) underscores the importance of cross-shore sediment transport, a process where Hs is the primary driver of bed shear stress and sediment resuspension. The absence of CE by LWP-ME match, alongside the existence of a CE by Hs-ME match, suggests that the wave conditions were conducive to significant cross-shore morphodynamic change (e.g., beach erosion/accretion). However, as the cross-shore wave power is directly related to the wave height, the LWP is a key indicator to identify more ME than using just Hs or other cross-shore limited indicator that will not account with longshore variability on sediment transport/deposition.
4.3 Analysis of the matches: POT optimization
The results presented in this section are divided into three parts: (1) match percentage values, (2) a statistical approach to find the optimal POT combination(s), and (3) a final study of the mobilized sediment. In general, higher matches (darker green color in Figs. 6 and 7) are found for combinations 1–30 (relative to the 95th and 96th percentiles), and even higher for combinations 1–14 (95th percentile). It can also be seen that ME95 (Fig. 7) has a higher percentage of matches than ME90 (Fig. 6) due to the lower number of ME.
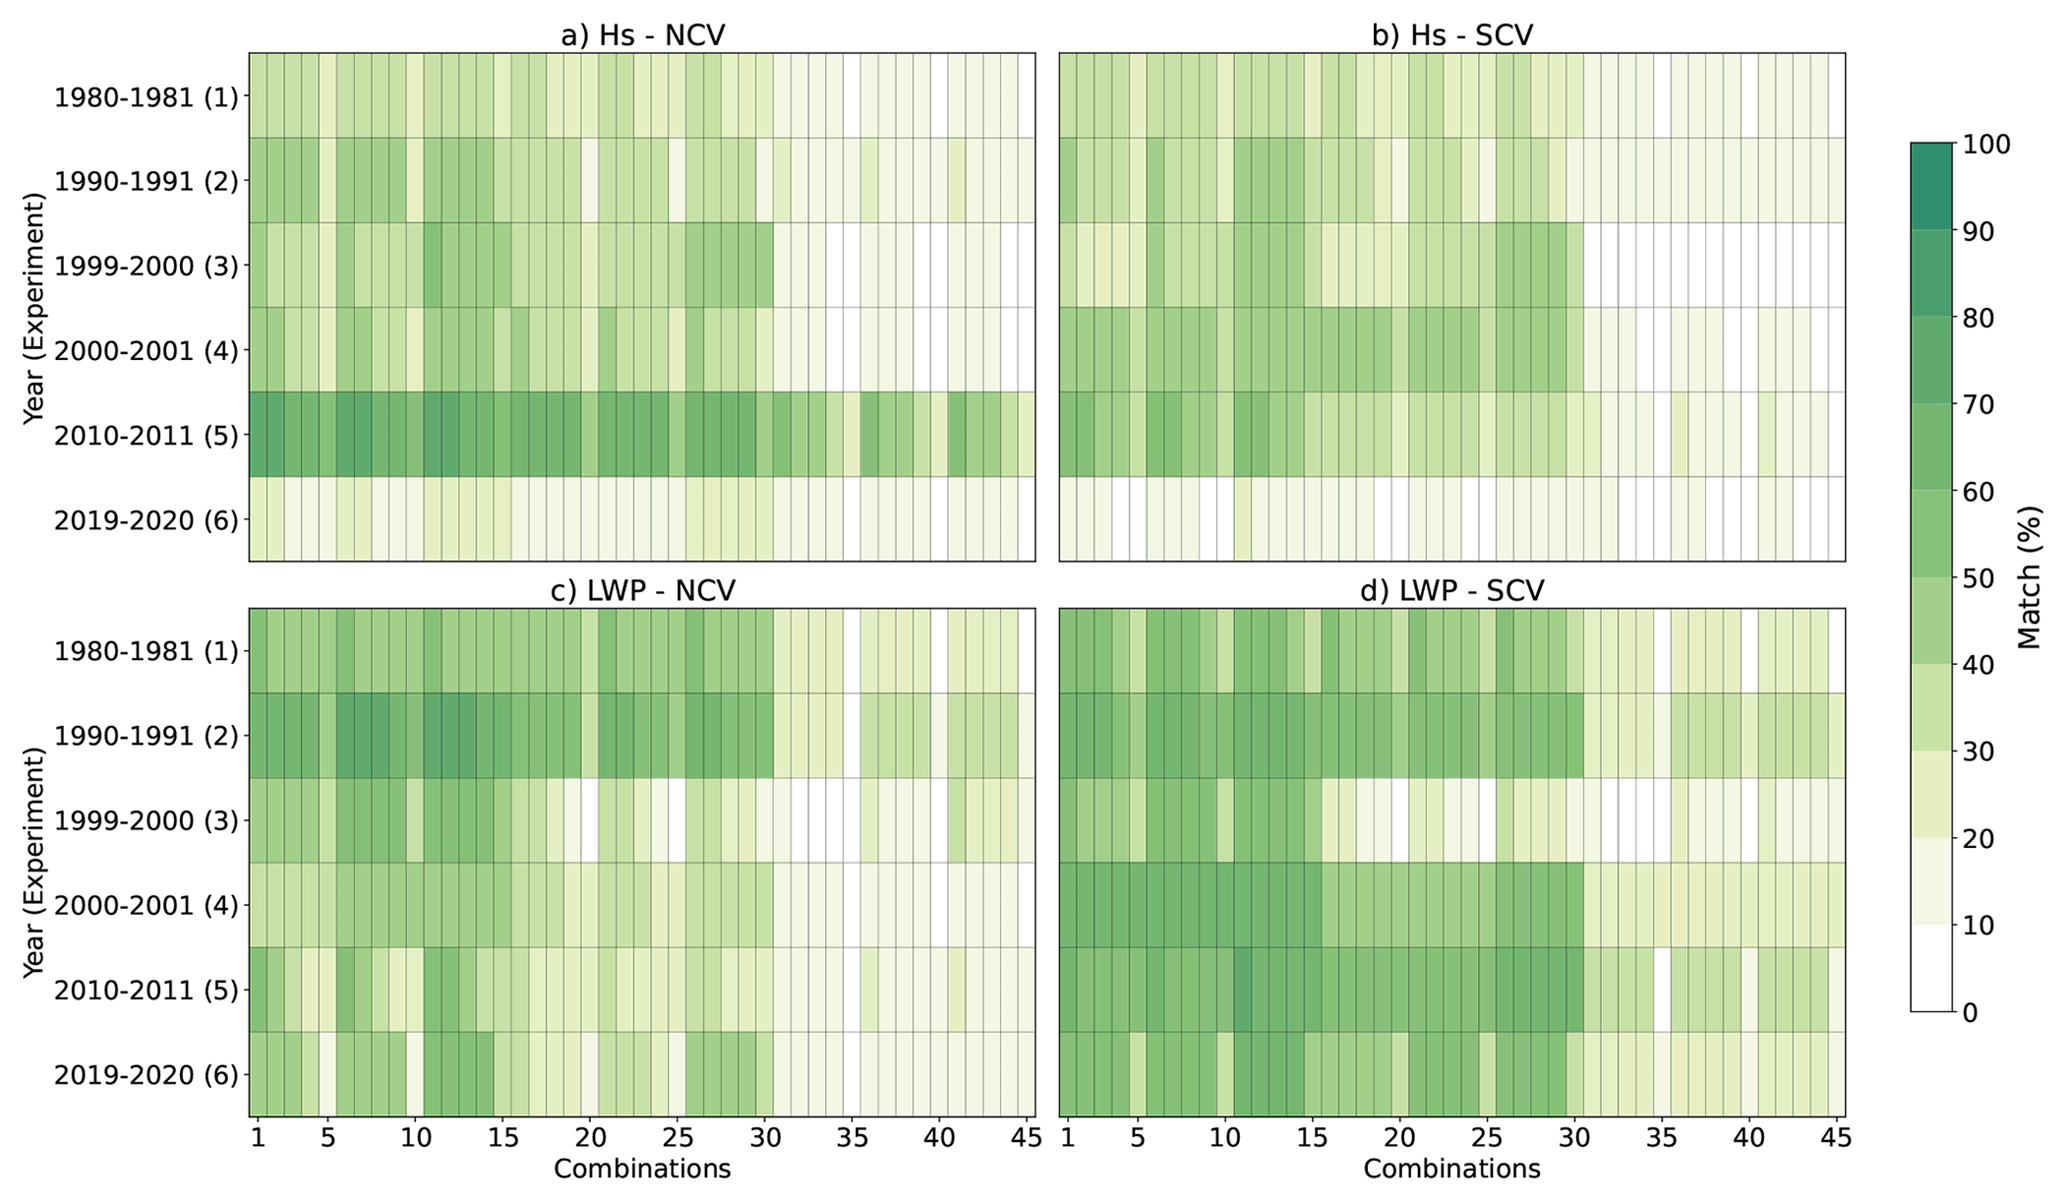
Figure 6Matches between ME90 and Hs in North CV (NCV, a), LWP in NCV (c), Hs in South CV (SCV, b), and LWP in SCV (SCV, d), for all the experiments and all the POT combinations for CE. Colors represent the % of match.
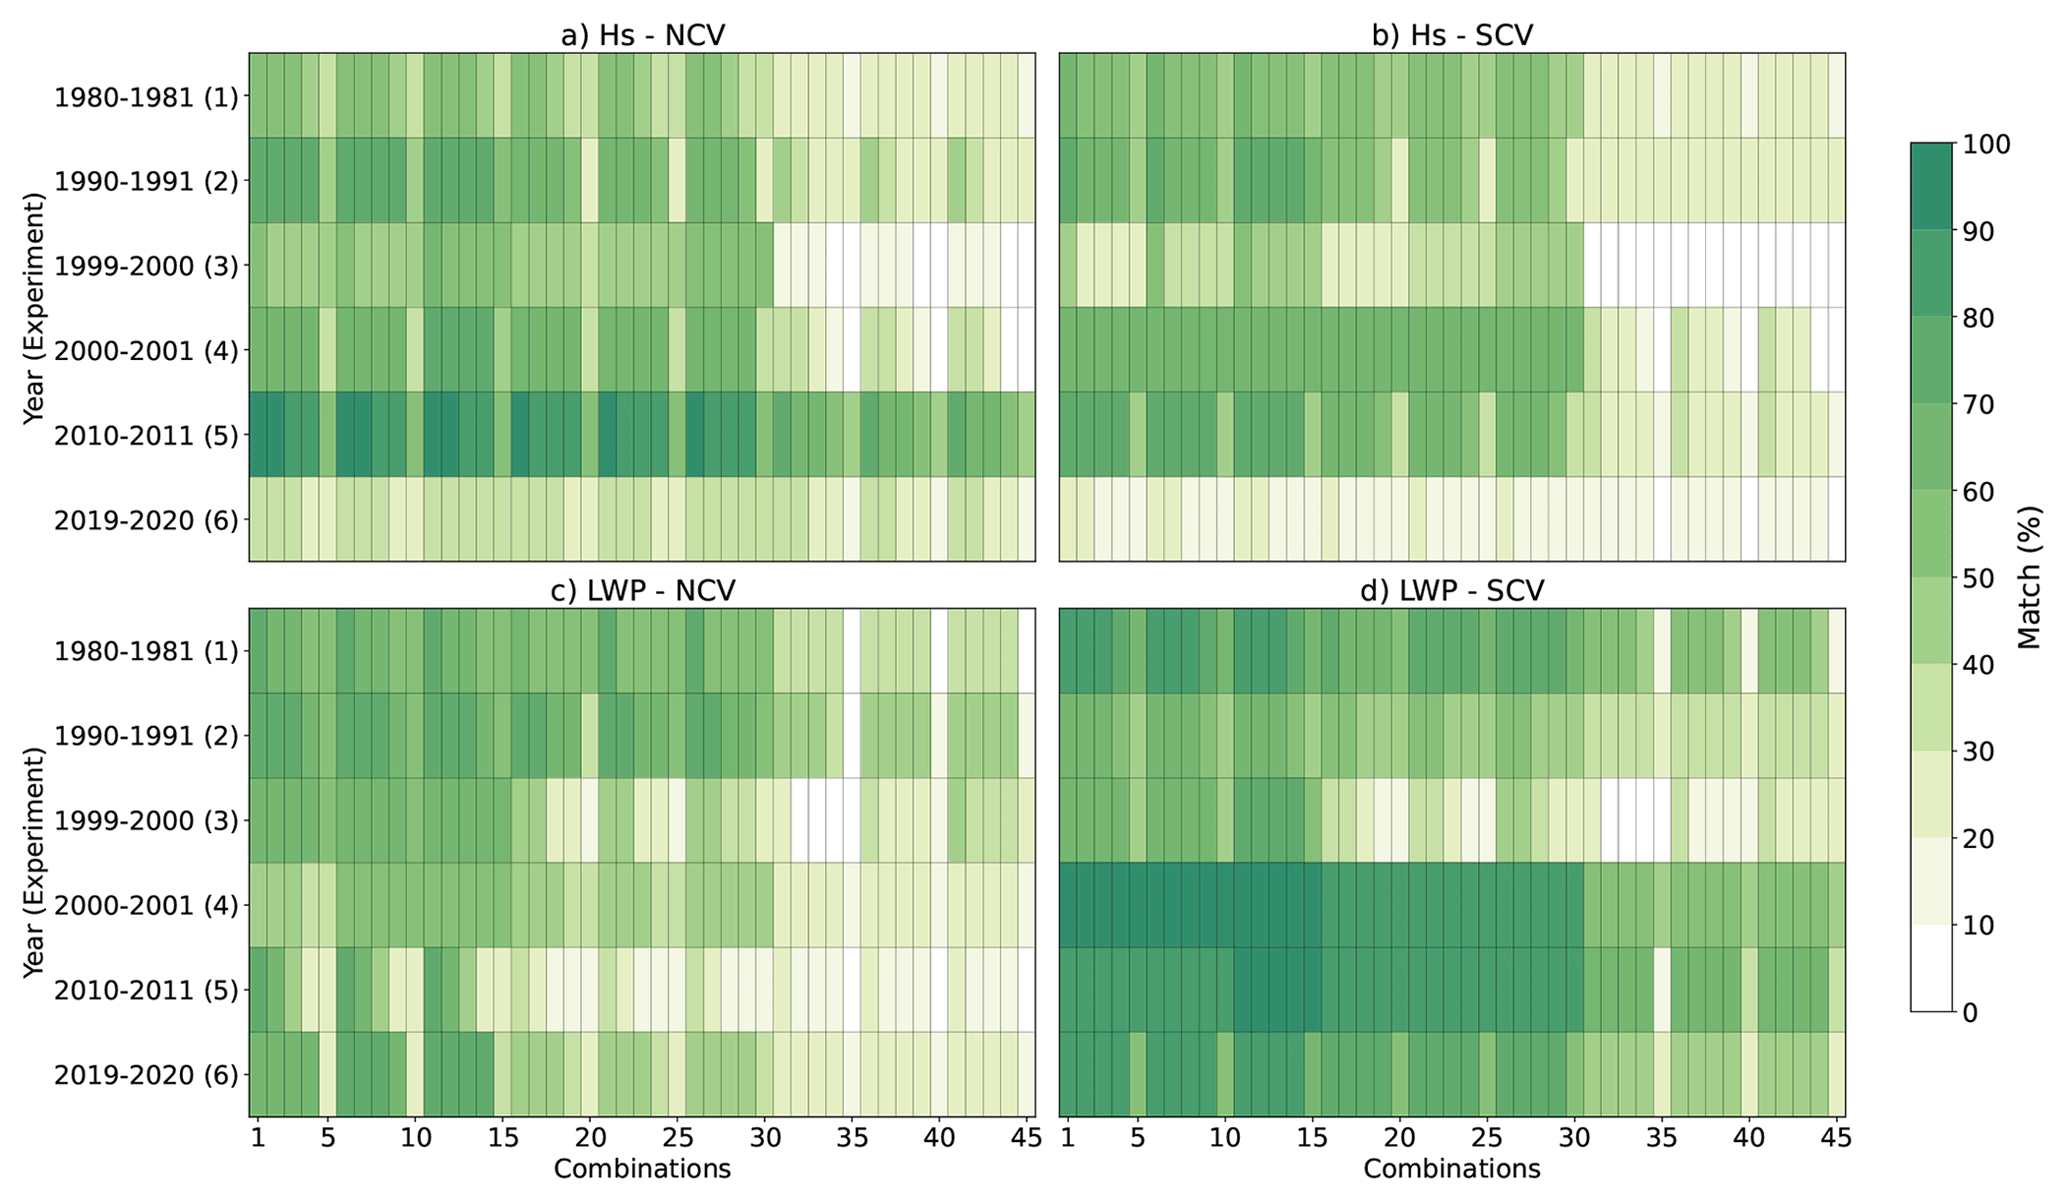
Figure 7Matches between ME95 and Hs in North CV (NCV, a), LWP in NCV (c), Hs in South CV (SCV, b), and LWP in SCV (SCV, d), for all the experiments and all the POT combinations for CE. Colors represent the % of match.
On average, LWP performs better than wave height in terms of match, as the CE by LWP identifies more ME. Nevertheless, for Experiment 5 (2010–2011), the wave height has a better performance, especially for the NCV. On the other hand, Experiment 6 (2019–2020) has the worst performance for wave height, also in the NCV. Although the choice of the best variable may depend on the wave behavior, LWP performed generally better than wave height for the set of experiments used. When comparing both CVs, the NCV had a more diverse behavior in the results than the SCV, which could indicate a shadow effect from the delta. The two experiments that have more extreme behavior are Experiment 5 (2010–2011) and Experiment 6 (2019–2020), and the difference was concentrated at the NCV, while for the SCV the results are not so different. Experiments 5 and 6 are similar in terms of YMWD (Table 1), but the wave conditions for the year 2010-2011 (Experiment 5) generated an added 31.8 % of total wave power. On the other hand, Experiment 5 is the one with more T-POT days, while Experiment 6 is the one with fewer T-POT days (Table 1).
When comparing the performance of the POT combinations through statistical analysis, it is noteworthy that the Combination 11, or POT(95,4,6) (characterized by a 95th percentile, 4 d for the independence criterion, and 6 h of minimum duration), is the top-performing one among all tested combinations. Moreover, as can be seen in Figs. 8 and 9, Combination 11 is the highest-ranked for both ME possibilities. The mean match percentages for ME90 (Fig. 8) are smaller than for ME95 (Fig. 9). However, a similar trend can be found in both, as the combinations with a higher threshold identify fewer ME. Moreover, as seen in Figs. 8d and 9d, the TOP 10 of the POT combinations for ME90 and ME95 are in the combinations 1–14 (95th percentile). Therefore, using the 95th percentile for the threshold seems to outperform the results, whether for wave height or LWP.
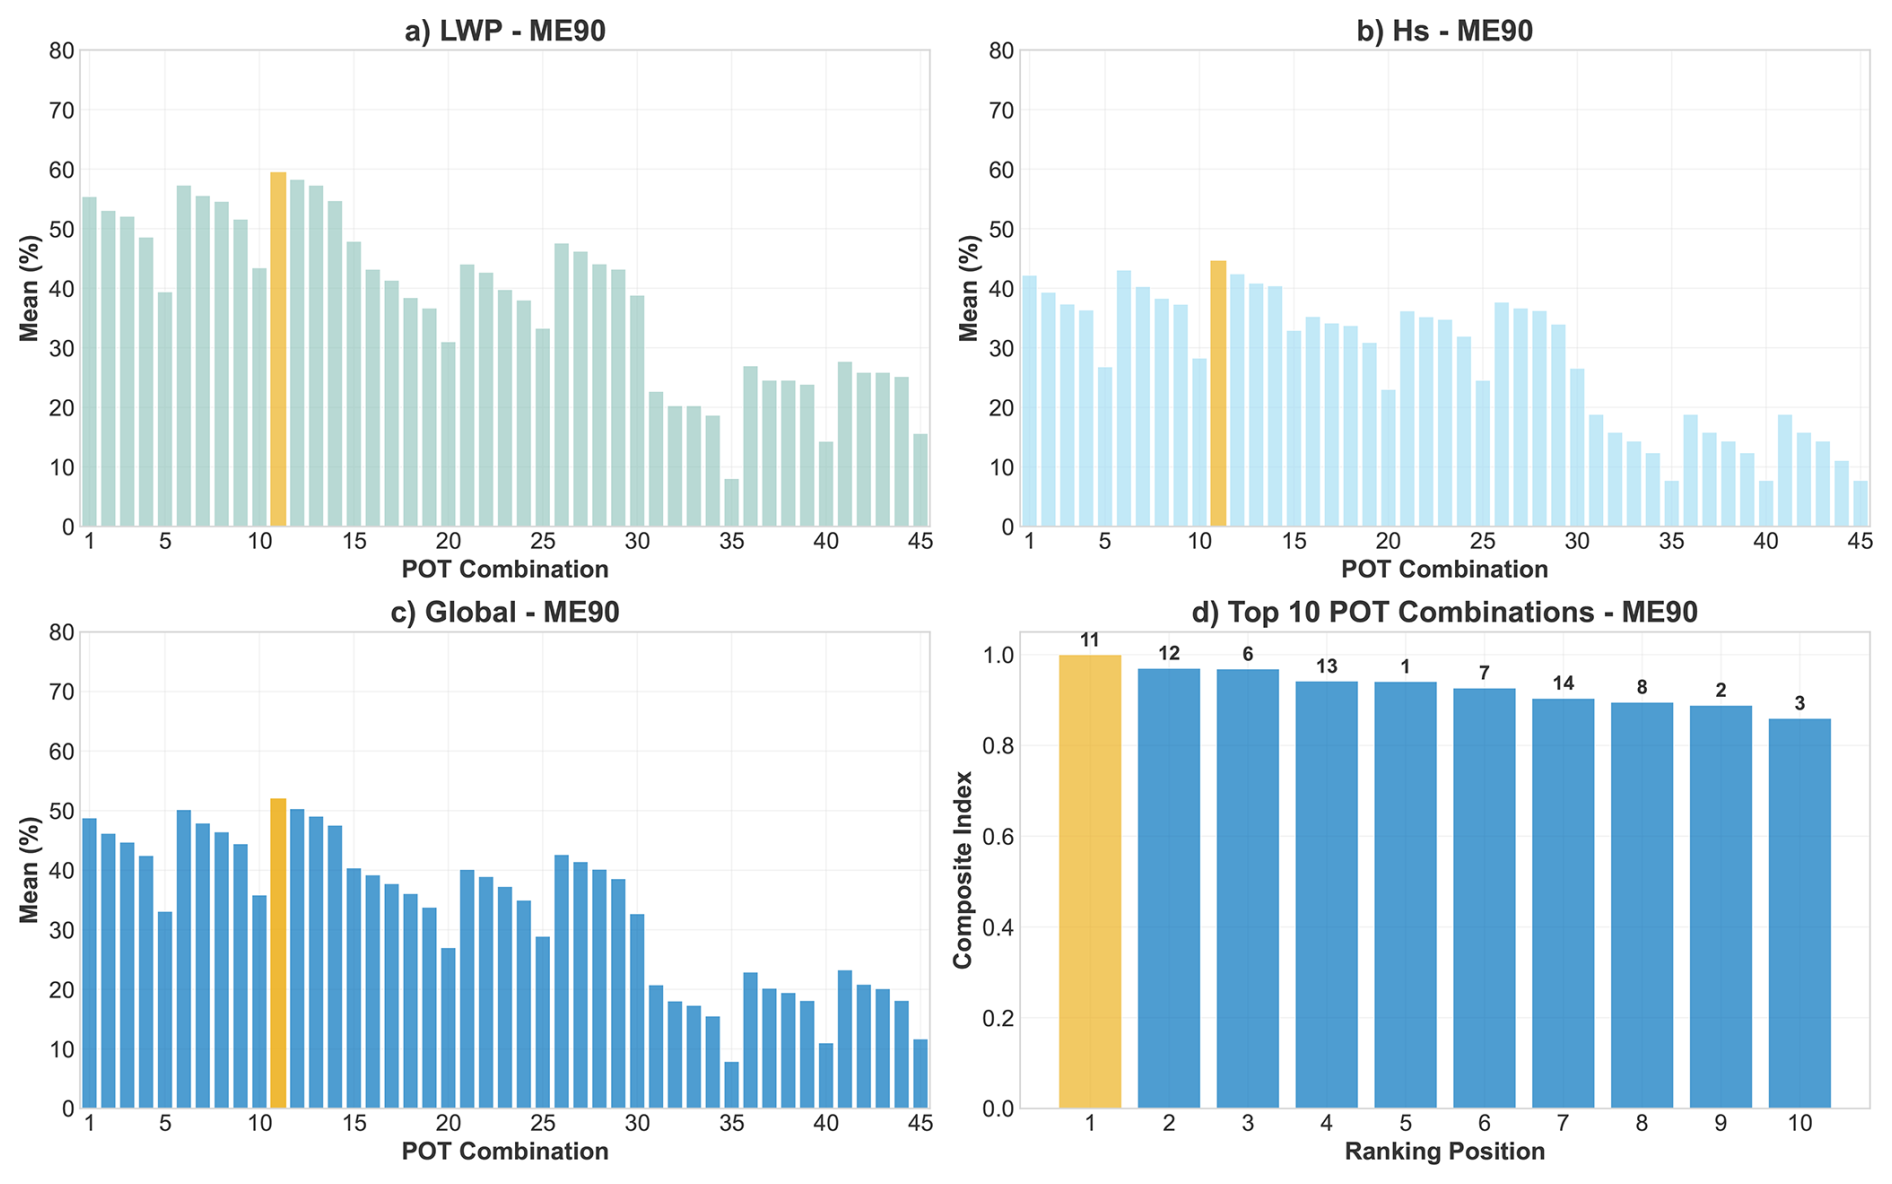
Figure 8Statistical analysis relative to ME90. (a) Mean match of LWP; (b) mean match of wave height. The mean values in (a) and (b) are calculated across all wave conditions and both CV, for each POT combination. (c) Mean match between LWP and wave height; (d) TOP 10 of combinations ranked by the Composite Index (CI), with the combination number indicated above each bar.
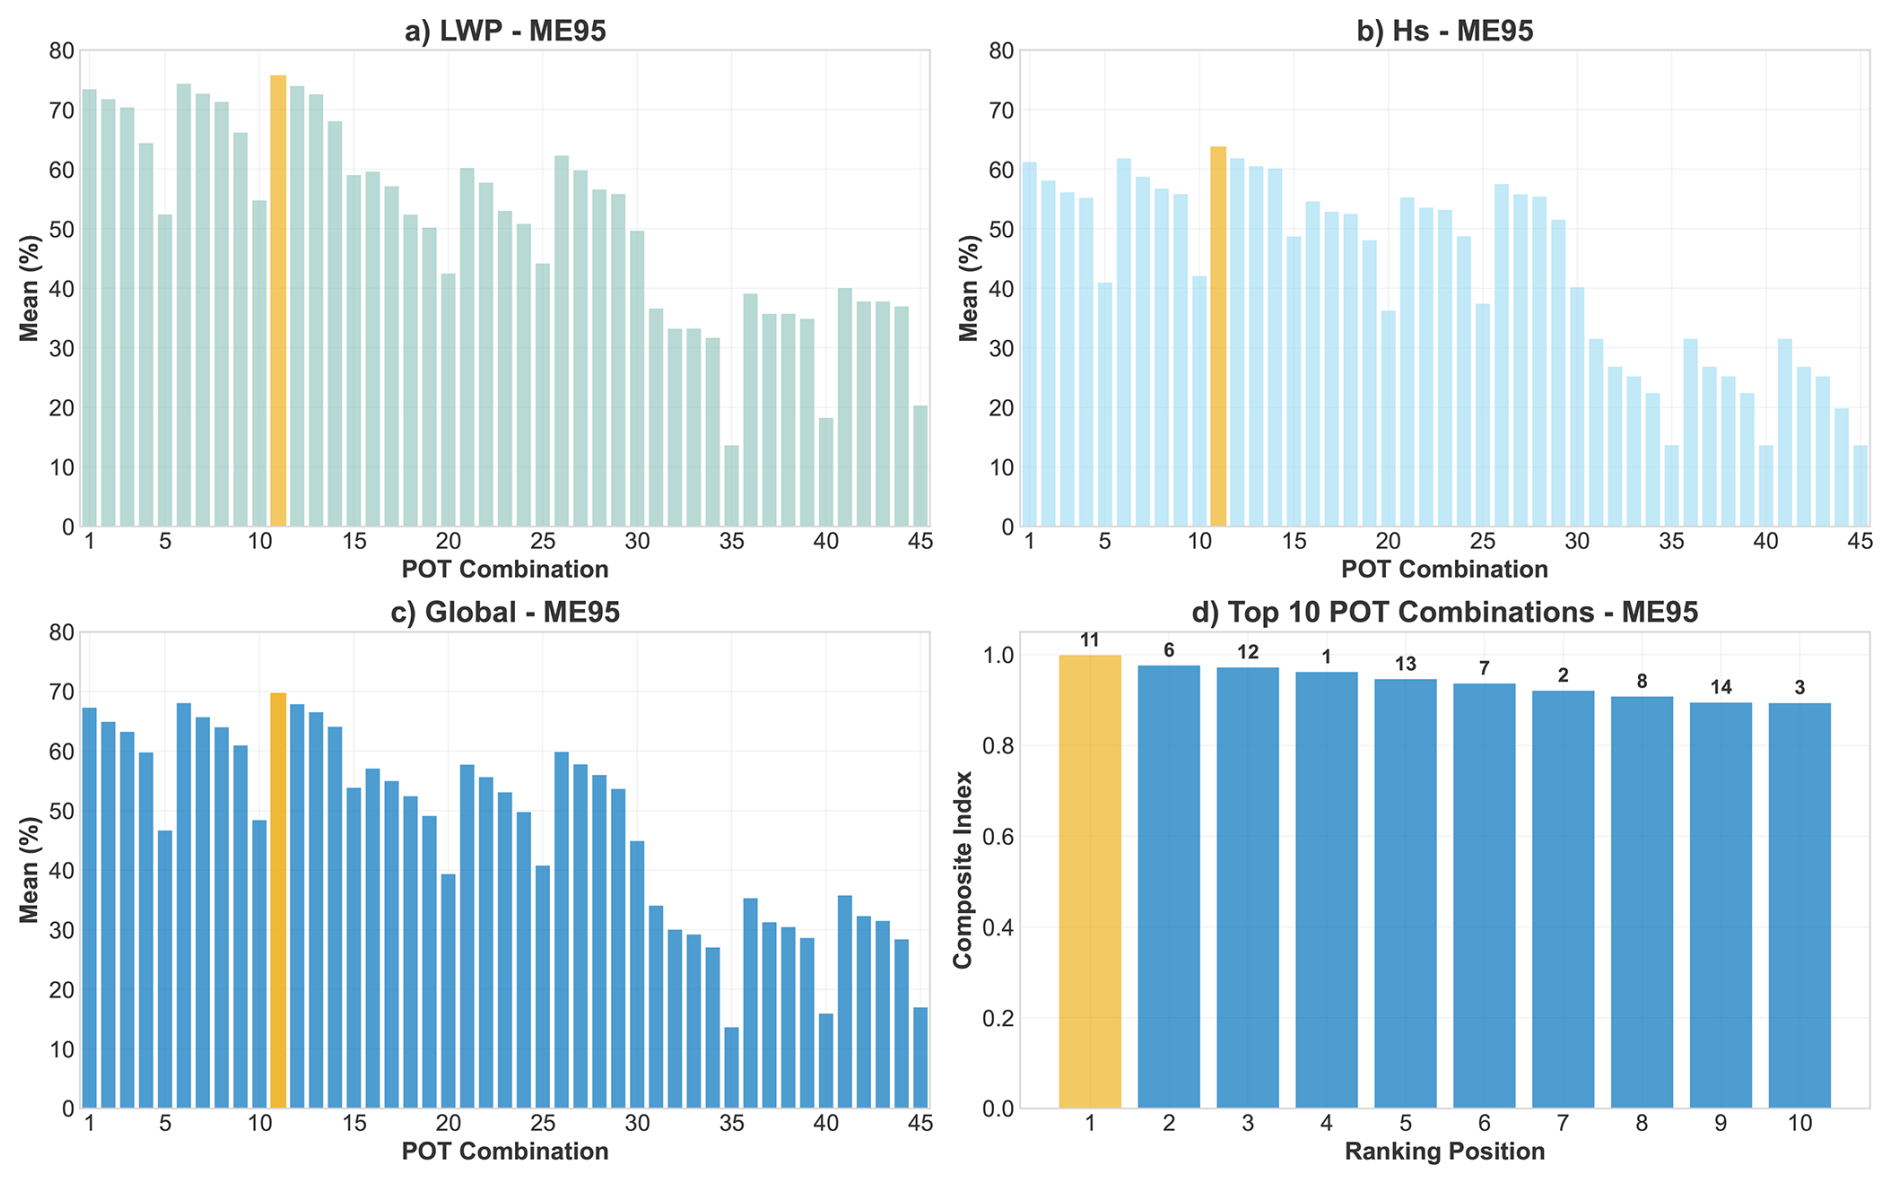
Figure 9Statistical analysis relative to ME95. (a) Mean match of LWP; (b) mean match of wave height. The mean values in (a) and (b) are calculated across all wave conditions and both CV, for each POT combination. (c) Mean match between LWP and wave height; (d) TOP 10 of combinations ranked by the Composite Index (CI), with the combination number indicated above each bar.
Another observation that arises from the results is that for combinations with a minimum storm duration of 48 h (combinations 5, 10, 15, 20, 25, 30, 35, 40, and 45), the match rate decreases drastically, as few storms exhibit such persistence. However, for combinations 15, 30, and 45, as the independence criterion increases to 4 d, the percentage of match slightly increases. This trend suggests that the effectively identified ME are short-lived, high-intensity impulses rather than sustained, long-duration ME. For the optimal combination, the average percentage of matches ranged between 56.1 % and 86.1 % for the different considered criteria and CV with maximum values reaching up to 80 % in some cases.
In terms of matches, the best pair was determined to be LWP and Combination 11. This can be supported by looking at the mobilized volume (Table 4). In general, the percentage of mobilized volume is higher for the ME identified by the CE by LWP criterion than for those identified by wave height. This percentage is systematically higher for ME95, reaching more than 90 % in some cases. The percentages corresponding to Combination 11 are generally higher than those of T-POT, indicating that this combination not only finds a higher match in each case, but also achieves better performance in terms of sediment volume, as it considers more ME. This improved performance in mobilized volume suggests that when the LWP is large enough to capture a CE, there is a much greater correspondence with actual morphological change within the 24 h following the onset of the CE.
Table 4Percentage of mobilized volume by ME identified by CEs (depending on CV and variable) relative to total mobilized volume by all ME (ME90 or ME95, represented as 90th and 95th respectively). In bold, the higher percentage per CV and per year.
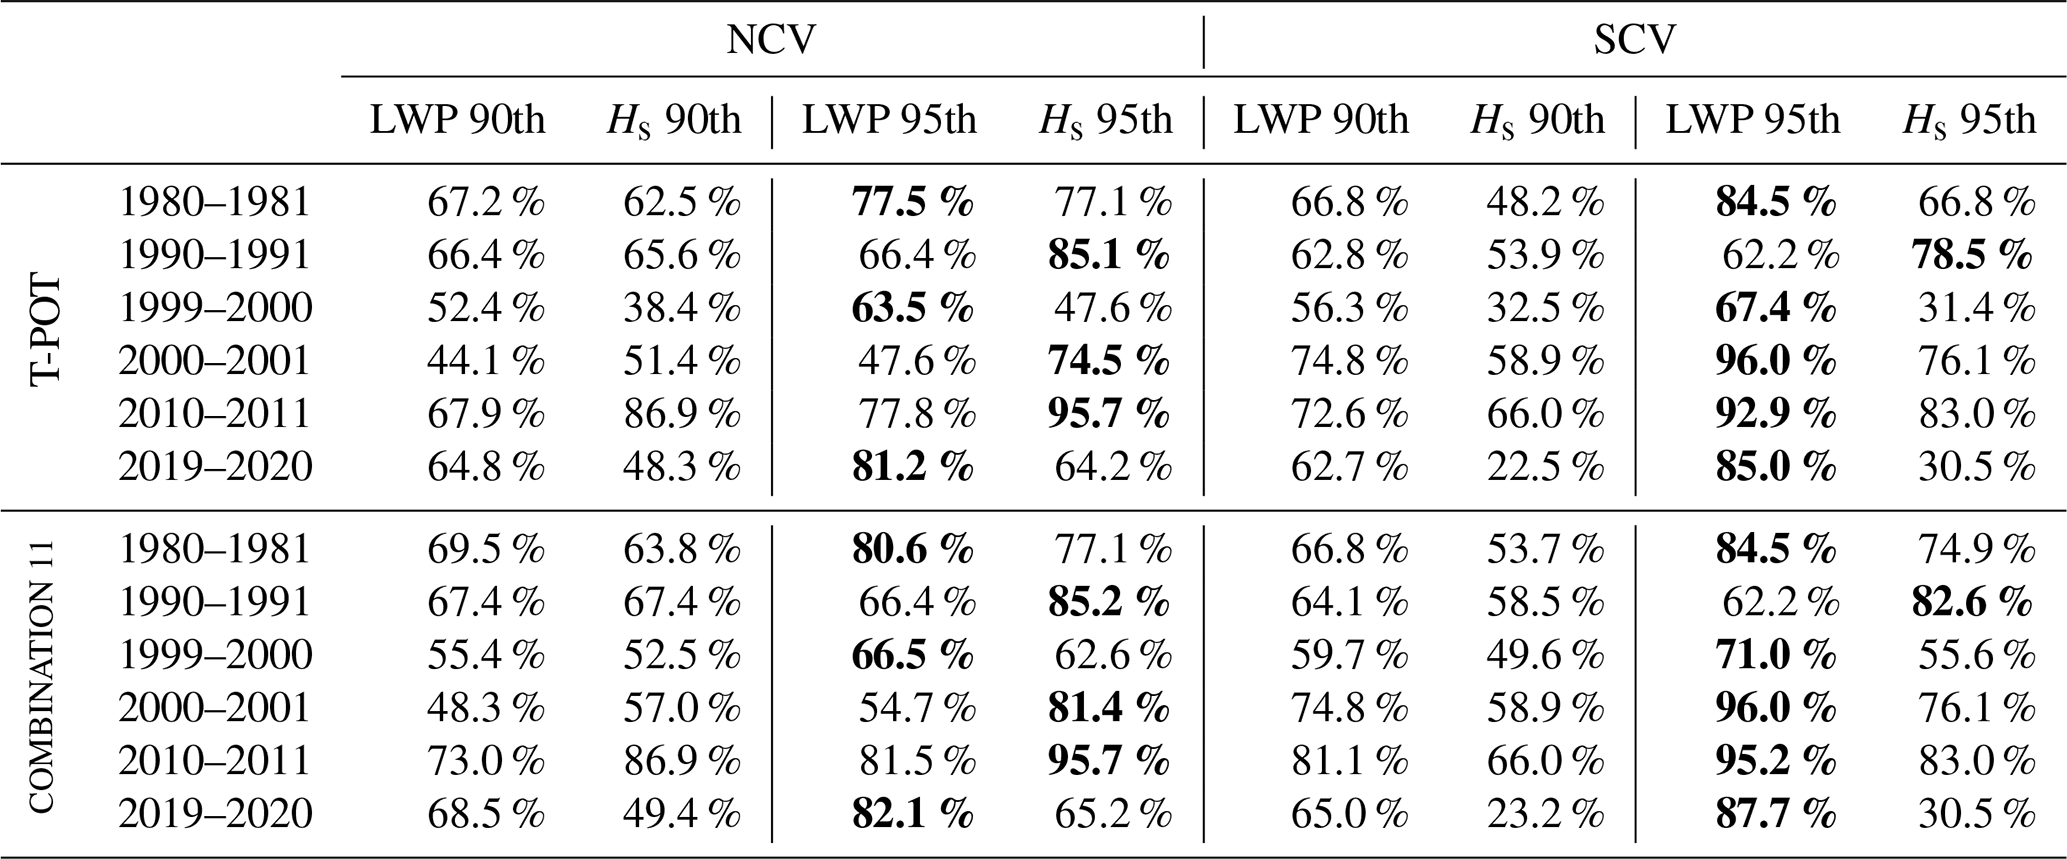
However, when analyzing mobilized sediment (Table 4), LWP shows better performance than wave height in the SCV for both ME90 and ME95. Conversely, in the NCV, LWP only excels for ME90, while wave height provides superior results for ME95 (by a mean of approximately 5 % for both POT combinations). This discrepancy is likely because longshore sediment transport is truncated by the delta, thereby restricting northward sediment transfer.
The methodology was applied to two different real-world study areas in Southern Spain: the Punta Umbría Inlet, following Zarzuelo et al. (2019) and the Guadiana estuary, following López-Ruiz et al. (2020). For both study cases, models were implemented in Delft3D and have been calibrated and validated against field-measured bathymetric surveys, providing continuous morphological simulations over real observed periods. For the Punta Umbría Inlet, the model spans from July 2014 to October 2015, with model data obtained at 3 h intervals. For the Guadiana estuary, two separate simulations with hourly data were utilized: (1) from July 2016 to June 2017, and (2) from June 2017 to December 2018. This section presents the match results for each simulation using the two primary POT combinations: T-POT and Combination 11.
5.1 Punta Umbría Inlet
The Punta Umbría Inlet (hereinafter PUI) consists of a NW-SE trending channel, 8 km in length and 0.5 km in width, with a maximum depth of 12 m b.m.s.l. Characterized as an ebb-tidal system, it features minor ebb channels, shoals, and frontal lobes. The model utilizes a spatially distributed D50 sediment grain size, ranging from 0.5 to 4 mm. This is defined via a grid-based input file to reflect the natural variability of the seabed. Due to long-standing navigational difficulties associated with shoal development, a jetty was constructed at the inlet, reaching 4 m b.m.s.l. The numerical setup and validation procedures follow Zarzuelo et al. (2019) in their entirety. A comprehensive description of the model performance is available in that study. The control volume used to apply the methodology is located in the channel (Fig. S11 in the Supplement). The match values obtained for the T-POT are 43.4 % and 41.4 % for the LWP-ME90 and LWP-ME95, respectively, and 42.7 % and 45.1 % for the Hs-ME90 and Hs-ME95, respectively. For the optimal combination (Combination 11, POT(95,4,6)), the match results for LWP increase to 47.4 % (ME90) and 47.5 % (ME95), while the Hs matches remain identical to those of the T-POT. This suggests that the Combination 11 improves upon the T-POT for LWP while maintaining the same accuracy for Hs.
5.2 Guadiana estuary
The numerical setup for the Guadiana estuary follows the configuration described in López-Ruiz et al. (2020), where a comprehensive description of the model's calibration and performance is available. The study area encompasses the ebb-tidal delta of the Guadiana River, located at the southern border between Spain and Portugal. The region is characterized by a semi-diurnal mesotidal regime, with a mean tidal range of 2 m. Similar to the PUI, the river mouth is stabilized by a jetty system, and the main channel undergoes periodic dredging to maintain navigability. Sediment distribution in the area exhibits the high variability typical of deltaic environments, with grain sizes ranging from fine to coarse sands. The model utilizes a spatially distributed D50 sediment grain size, ranging from 1 to 10 mm. This is defined via a grid-based input file to reflect the natural variability of the seabed.
Two simulations covering different periods are available for this study area, hereafter referred to as Guadiana 1617 (from July 2016 to June 2017) and Guadiana 1718 (from June 2017 to December 2018). The control volume used to apply the methodology is located in the ebb delta, within an area comparable to the one analyzed by Garel et al. (2019) to unravel the sediment transport patterns in the delta (Fig. S12 in the Supplement). For Guadiana 1617, the match values obtained for the T-POT are 63.5 % and 62.9 % for the LWP-ME90 and LWP-ME95, respectively, and 64.3 % and 63.9 % for the Hs-ME90 and Hs-ME95, respectively. For the Combination 11, the match results for LWP increase to 67.5 % (ME90) and 67.9 % (ME95), while the Hs matches remain identical to those of the T-POT. For the Guadiana 1718 period, the T-POT achieved match values of 72.3 % and 90.5 % for LWP (ME90 and ME95, respectively), and 73.1 % and 90.5 % for Hs. The Combination 11 improved the LWP-ME90 match to 79 % and the Hs-ME90 to 74.4 %, while maintaining identical results for all ME95 events. Notably, almost all ME95 occurred during Storm Emma (February 2018), which heavily impacted the South Atlantic coast of the Iberian Peninsula (Málvarez et al., 2021).
This study evaluates the conventional reliance on significant wave height (Hs) for identifying coastal morphological events and proposes a more robust methodology centered on Longitudinal Wave Power (LWP) within an optimized Peaks Over Threshold (POT) framework. In the traditional coastal engineering methodologies, Hs has been used as a key parameter in structural design (Goda, 2000). This parameter has been consistently applied in storm impact studies, predominantly through POT approaches that focus on extreme wave heights (Kümmerer et al., 2024). Despite their efficacy in ensuring structural safety and their continued use in characterizing coastal storms (Harley, 2017; Kümmerer et al., 2024), these approaches have significant limitations when applied to comprehensive coastal morphodynamic studies. These limitations arise from the complex role that sediment transport processes play in driving morphodynamic changes along the coastline, which cannot be captured by Hs alone. The modeling results of this work demonstrate this limitation, as shown in Sect. 4.2 where traditional POT approaches based solely on Hs failed to identify numerous significant ME. As shown in Table 3, the wave height criteria identified several CE that did not correspond to any actual ME, while several ME were only correctly identified by the LWP-based approach. This finding supports the need for methodological advances beyond conventional Hs analysis.
6.1 The role of wave direction
In many coastal regions, longshore processes can induce significant morphological changes. This is especially relevant in coastal zones adjacent to inlets, which are highly sensitive to shifts in wave direction and wave regime (Stevens et al., 2024). Castelle et al. (2020) highlighted that modest variations in wave obliquity can induce substantial beach rotation and planform changes in embayed beaches, where shifts as small as 5–10° in the dominant wave direction can induce complete reversals in sediment transport patterns. Similarly, Loureiro et al. (2012a, b) found that wave direction shifts of as small as 10° can transition beach systems from an equilibrium state to erosive conditions, especially when these shifts coincide with high-energy wave events. The modeling results described in Sect. 4.1 confirm this sensitivity, showing that all simulations produced asymmetric delta formation with northward rotation (Fig. 3), directly reflecting the prevailing wave direction of the selected yearly wave conditions (Table 1, YMWD).
The effect of wave obliquity is further magnified in areas with complex nearshore bathymetry, where directional changes in wave approach angles can create localized erosion hotspots and accelerate sediment transport rates even under moderate wave energy conditions (Horta et al., 2018). According to these authors, wave obliquity can influence beach circulation patterns, which can rapidly shift from longshore-dominated to rip-dominated systems depending on changes in offshore wave direction and tidal conditions. These circulation transitions can lead to relevant morphological responses even when wave heights remain relatively constant. This directional sensitivity, coupled with complex local interactions between the ebb delta, the discharge, the tides, and the nearshore currents, results in the observed morphodynamic asymmetry between the two control volumes. It is also the driving mechanism behind alongshore changes to coastal morphology that simpler indicators like Hs alone might not report.
Despite these documented impacts, most of the research examining the impact of longshore transport on coastal evolution has focused on monthly to multi-year timescales (e.g., Fernández-Fernández et al., 2020; Kahl et al., 2024; Roelvink et al., 2020; Stevens et al., 2024), without analyzing how these directionally sensitive processes operate at the event time scale. The methodology of this work, based on the LWP (Eq. 12), which integrates directional information, provides a more process-relevant proxy for the coastal forces driving event-based morphological change, enabling the detection of significant coastal responses that would be missed by conventional Hs approaches. Furthermore, by applying the LvC (Longshore vs. Cross-shore) index proposed by López-Dóriga and Ferreira (2017), it was found that the NCV exhibits a more cross-shore dominated in experiment 2 (1990–1991) with an LvC=0.18, and in experiment 5 (2010–2011) with LvC=0.01, both of which correspond to a higher Hs-match. Conversely, the SCV shows systematically higher LvC across most experiments, indicating a greater degree of longshore dominance, which corresponds with a higher LWP-match. The calculated LvC indices for all experiments and control volumes are provided in Table S5 in the Supplement.
6.2 Main novelties and methodological advancements
The methodology proposed in this paper expands beyond typical erosive storms as the sole contributor to significant short-term morphological changes. It integrates other CE capable of inducing substantial short-term morphological change through both erosion and sedimentation processes. This approach directly addresses the limitations identified in Sect. 4.2, where traditional wave height-based methods failed to capture many ME. A major advantage of the method is its generalizability. Although developed for an idealized coastal zone described in Sect. 2.1, it can be applied to different geographical and geomorphological contexts. The approach addresses both erosion and sedimentation processes simultaneously, providing a comprehensive view of morphological changes, a significant improvement over existing methods that typically focus on either erosion or sedimentation in isolation, as noted by Mentaschi et al. (2018) in their global assessment of coastal erosion and accretion patterns.
The methodology is innovative in its use of deep-water variables to enhance flexibility and applicability across diverse coastal environments (Sect. 2.2). The method also accounts for post-storm recovery processes, an essential component for understanding long-term coastal dynamics that is frequently overlooked in traditional storm impact assessments. This recovery aspect is particularly important, as shown by Málvarez et al. (2021) who documented both the immediate erosional impacts of storms and the subsequent recovery periods in developed coastal systems.
One of the key elements of the methodology is the use of the LWP, which has been under-utilized in previous coastal morphodynamic studies. As defined in Sect. 3.2 (Eq. 12), this parameter provides important insights into the impact of directional wave energy, complementing the traditional Hs analyses. The results in Sect. 4.3 demonstrate that LWP can outperform wave height in identifying morphological events. Furthermore, the optimization approach analyzing multiple POT combinations (Table 2) allows for the identification of the most effective parameter set for detecting morphological changes. As shown in Table 4, the optimized POT combination not only achieved higher match percentages in all scenarios (Figs. 8 and 9) but also captured a greater proportion of the total sediment volume mobilized during morphological events, particularly for ME95, where it exceeded 90 % in several cases. This demonstrates a more robust linkage between the identified climatic forcing (LWP-CE) and the coastal response. It should be noted, however, that the superior performance of LWP does not preclude the utility of Hs as a morphological proxy. In coastal settings characterized by a low LvC index, where cross-shore processes dominate sediment transport, Hs remains a more accurate indicator of morphologically significant events, suggesting that LWP serves as a complementary proxy rather than a total replacement.
6.3 Limitations and further improvements
While the methodology offers several advances, it also has specific limitations that require further refinement. The use of deep-water variables, while providing flexibility and ease of application, may introduce uncertainties when applied to complex coastal sites with intricate bathymetry or varying nearshore wave conditions. This limitation can be particularly evident in areas where wave transformation between offshore and nearshore zones is complex and nonlinear, as observed by Loureiro et al. (2012b) in their study of geologically constrained morphological variability on embayed beaches. The robustness of the methodology is further supported by its transition from idealized configurations to real-world scenarios (Sect. 5). Although the method was developed following established idealized frameworks (e.g., Jiménez-Robles et al., 2016; Ruiz-Reina and López-Ruiz, 2021), its successful validation in calibrated environments with real-world forcings, which include wind, variable river discharge, and full tidal regimes, addresses the applicability to complex coastal zones and supports the robustness of the methodology under more complex forcing conditions.
This methodological approach differs from traditional Hs-based POT techniques used in coastal engineering and opens new research directions to verify its performance under different conditions. It represents the first application of LWP-based POT, making direct comparison with traditional Hs-based POT analyses challenging. The results demonstrate that climatic events can be effectively characterized through a composite LWP-based POT analysis, incorporating established parameters such as independence criteria and event duration. While the specific parameter combination identified appears robust for the detection of morphological events in the study area, it is likely to be site-dependent, requiring site-specific calibration in future applications. Future validation efforts may become feasible as emerging monitoring technologies (e.g., continuous video systems, high-resolution remote sensing) develop the capability to provide the required temporal resolution for morphological measurements, across a wider range of LvC conditions.
6.4 Implications for Coastal Management
The approach here presented has significant management applications by enabling advanced forecasting of coastal morphological changes. This ability to anticipate coastal responses represents a critical advance in management practices, considering that coastal zones provide essential protection against erosion and flooding, which is critical for adaptation and planning decisions (Toimil et al., 2023). Current approaches to coastal protection against erosion and extreme flooding often involve the definition of setback buffer zones where permanent construction is prohibited (Karditsa and Poulos, 2024; Sanò et al., 2011). Sanò et al. (2011) specifically emphasized that effective setback definition requires dynamic assessment methods that account for both long-term trends and event-driven morphological changes, a gap that the methodology presented here directly addresses.
Nahon et al. (2022) also found that increased rates of LWP (along with the associated longshore currents and sediment transport), resulted in the erosion of barrier spits on the updrift margin of a tidal inlet. All the above statements and existing results prove the need to include the longshore component of sediment transport (which is directly associated with LWP) in 3D analyses of short-term morphological changes in coastal areas. Therefore, accurately quantifying sediment transport requires the inclusion of wave direction. LWP captures this directional effect and offers a more complete description of the coastal forces driving morphodynamic change. While previous studies address shoreline retreat assessment, many rely on large-scale analysis that neglects cumulative storm impacts, storm duration, and spacing effects (Monioudi et al., 2023; Xie et al., 2024). The new methodology addresses these gaps and could assist managers and policymakers in identifying at-risk beaches, estimating losses in beach carrying capacity and economic value, and prioritizing effective adaptation responses.
From an operational management perspective, coastal zone concessions do not usually consider the available beach area or the expected shoreline evolution. Palazón et al. (2018) documented this disconnection in southeastern Spain, where 62 % of the concessions were inappropriately located in relation to coastline dynamics, leading to both infrastructure damage and reduced user satisfaction as the freely usable beach surface area is reduced. This approach allows for a more detailed analysis of individual storm impacts but also to impacts resulting from longshore shifts, thereby improving the coastal area management. Celedón et al. (2023) identified similar challenges in their assessment of risk hotspots for storm events in coastal regions with high morphodynamic variability, emphasizing the need for event-based forecasting capabilities such as those provided by the here presented method. Understanding which CE are likely to trigger significant changes in specific coastal areas enhances the preparedness of coastal managers and facilitates preventive actions such as timely asset removal or targeted short-term nourishment to mitigate erosion (Málvarez et al., 2021).
Ultimately, by providing a tool to link specific climatic forcing patterns (including directional shifts that may be altered by climate change) with morphological responses, this method can contribute to the development of more effective, process-based coastal adaptation strategies, including early warning systems or the strategic implementation of nature-based solutions.
This study introduces a methodology to determine when significant morphological changes will occur along coastal areas due to the combined action of tides, river discharge, and waves. While traditional approaches focus primarily on erosion, the presented method considers both erosion and accretion processes, providing a more comprehensive understanding of coastal dynamics. Deep-water significant wave height (Hs) was compared with longitudinal wave power (LWP) as predictors of morphological change through different combinations of Peak-Over-Threshold (POT) parameters, including minimum event duration and independence intervals between different events.
The experimental framework employed an idealized coastal zone with a central inlet, representative of the morphology of the Spanish Mediterranean coast. The numerical simulations revealed the formation of a delta at the river mouth, which caused the northern and southern beach sections to behave as independent morphodynamic units. Volume variations in two control areas (north-south) were used to define the match between climatic events and morphological events. By systematically testing 45 different POT combinations, a consistent pattern was identified across all six wave climate conditions. The optimized POT configuration (Combination 11: 95th percentile threshold, 4 d independence criterion, and 6 h minimum duration) consistently outperformed other combinations, including the traditional POT approach commonly used in coastal engineering. This optimized framework not only achieved higher match percentages (up to 86.1 %) between climatic and morphological events but also captured a significantly greater proportion of mobilized sediment volume, exceeding 90 % in several scenarios.
The results highlighted the limitations of traditional Hs-based POT approaches to identify coastal changes. Not only did these methods fail to identify many morphologically significant events, but they often flagged high wave events that had minimal morphological impact. LWP consistently demonstrated superior performance compared to Hs due to the incorporation of wave direction, enabling detection of morphological changes driven by directional shifts that can occur even under moderate wave height conditions. Moreover, the methodology remains consistent when applied to real-world coastal areas. Although match percentages may be slightly lower due to the inherent complexity of natural systems, the core patterns observed in the idealized cases are maintained. This confirms that the LWP-based approach is a highly applicable and reliable tool for event detection in actual coastal environments.
This methodology offers considerable practical value for coastal managers by enabling more accurate predictions of morphological changes and supporting proactive management strategies. Crucially, the ability of this methodology to accurately identify morphologically significant events, whether by applying the optimized POT combination or by leveraging the superior predictive capacity of LWP, is highly valuable for coastal hazard assessment. By applying these optimized criteria to operational climate models and wave forecasts, managers can preemptively identify a broader range of high-risk events. The application to real-world study areas further confirms the robustness of this methodology, as the optimal POT combination consistently outperforms traditional approaches across all analyzed simulations.
The Data related to the climate information were provided by the MeteOcean research group of the University of Genoa (Italy). All the information related to the data can be consulted in Besio et al. (2016), Cassola et al. (2016), Lira-Loarca et al. (2023), Mentaschi et al. (2013, 2015), and in their website: https://meteocean.science/ (last access: 6 April 2026).
The model input files on which this article is based are publicly available via Zenodo (https://doi.org/10.5281/zenodo.15222539, Aragón et al., 2025), distributed under the Creative Commons Attribution 4.0 International Public License (CC BY 4.0). Concurrently, the Delft3D source codes, integral to the simulations, are open-source software for hydrodynamic, morphological, and wave modeling, downloadable from the Deltares model repository at https://oss.deltares.nl/web/delft3d/get-started (last access: 6 April 2026). Access to Delft3D requires user registration for download, with specific licensing details available on the Deltares portal (Deltares, 2025).
The supplement related to this article is available online at https://doi.org/10.5194/nhess-26-2065-2026-supplement.
M. Aragón: Conceptualization, Methodology, Software, Formal analysis, Writing – original draft. Ó. Ferreira: Formal analysis, Writing – review and editing, Funding acquisition. A. López-Ruiz: Conceptualization, Methodology, Writing – review and editing, Project administration, Funding acquisition. M. Ortega-Sánchez: Conceptualization, Writing – review and editing, Funding acquisition.
The contact author has declared that none of the authors has any competing interests.
Publisher's note: Copernicus Publications remains neutral with regard to jurisdictional claims made in the text, published maps, institutional affiliations, or any other geographical representation in this paper. The authors bear the ultimate responsibility for providing appropriate place names. Views expressed in the text are those of the authors and do not necessarily reflect the views of the publisher.
The authors would like to thank MeteOcean Research Group (Genoa, Italy) for the climate information, and the three anonymous reviewers for their thorough and constructive comments, which led to significant improvements in the manuscript.
This publication is part of the Grant PID2024-160478OB-I00 funded by MICIU/AEI/10.13039/501100011033 and by “ERDF/EU”. The first author was supported by the Ministry of Science, Innovation and Universities (Spain) through Research Contract FPU21/01194 and Mobility Grant EST24/00107. Óscar Ferreira acknowledges the support by the Portuguese Foundation for Science under projects LA/P/0069/2020 (Associate Laboratory ARNET) and UIDP/00350/2020 (CIMA, https://doi.org/10.54499/UIDP/00350/2020).
This paper was edited by Liang Gao and reviewed by three anonymous referees.
Adamo, F., De Capua, C., Filianoti, P., Lanzolla, A. M. L., and Morello, R.: A coastal erosion model to predict shoreline changes, Measurement, 47, 734–740, https://doi.org/10.1016/j.measurement.2013.09.048, 2014.
Almeida, L. P., Vousdoukas, M. V., Ferreira, Ó., Rodrigues, B. A., and Matias, A.: Thresholds for storm impacts on an exposed sandy coastal area in southern Portugal, Geomorphology, 143–144, 3–12, https://doi.org/10.1016/j.geomorph.2011.04.047, 2012.
Anthony, E. J.: Storms, shoreface morphodynamics, sand supply, and the accretion and erosion of coastal dune barriers in the southern North Sea, Geomorphology, 199, 8–21, https://doi.org/10.1016/j.geomorph.2012.06.007, 2013.
Anthony, E. J., Brunier, G., Besset, M., Goichot, M., Dussouillez, P., and Nguyen, V. L.: Linking rapid erosion of the Mekong River delta to human activities, Sci. Rep.-UK, 5, 14745, https://doi.org/10.1038/srep14745, 2015.
Aragón, M., Martín-Llanes, G., Zarzuelo, C., López-Ruiz, A., and Ortega-Sánchez, M.: Wave Schematization for Coastal Morphodynamics: The Role of Wave Chronology, in: Proceedings of the 40th IAHR World Congress (Vienna, 2023), 501–508, https://doi.org/10.3850/978-90-833476-1-5_iahr40wc-p0628-cd, 2023.
Aragón, M., Ferreira, Ó., López-Ruiz, A., and Ortega-Sánchez, M.: Dataset accompanying the publication: Longitudinal Wave Power as a Proxy for Coastal Change Detection, Zenodo [data set], https://doi.org/10.5281/zenodo.15222539, 2025.
Armaroli, C., Ciavola, P., Perini, L., Calabrese, L., Lorito, S., Valentini, A., and Masina, M.: Critical storm thresholds for significant morphological changes and damage along the Emilia-Romagna coastline, Italy, Geomorphology, 143–144, 34–51, https://doi.org/10.1016/j.geomorph.2011.09.006, 2012.
Baar, A. W., Braat, L., and Parsons, D. R.: Control of river discharge on large-scale estuary morphology, Earth Surf. Proc. Land., 48, 489–503, https://doi.org/10.1002/esp.5498, 2023.
Benedet, L., Dobrochinski, J. P. F., Walstra, D. J. R., Klein, A. H. F., and Ranasinghe, R.: A morphological modeling study to compare different methods of wave climate schematization and evaluate strategies to reduce erosion losses from a beach nourishment project, Coast. Eng., 112, 69–86, https://doi.org/10.1016/j.coastaleng.2016.02.005, 2016.
Bergillos, R. J., Ortega-Sánchez, M., Masselink, G., and Losada, M. A.: Morpho-sedimentary dynamics of a micro-tidal mixed sand and gravel beach, Playa Granada, southern Spain, Mar. Geol., 379, 28–38, https://doi.org/10.1016/j.margeo.2016.05.003, 2016.
Besio, G., Mentaschi, L., and Mazzino, A.: Wave energy resource assessment in the Mediterranean Sea on the basis of a 35 year hindcast, Energy, 94, 50–63, https://doi.org/10.1016/j.energy.2015.10.044, 2016.
Booij, N., Ris, R. C., and Holthuijsen, L. H.: A third-generation wave model for coastal regions: 1. Model description and validation, J. Geophys. Res.-Oceans, 104, 7649–7666, https://doi.org/10.1029/98JC02622, 1999.
Boudet, L., Sabatier, F., and Radakovitch, O.: Modelling of sediment transport pattern in the mouth of the Rhone delta: Role of storm and flood events, Estuar. Coast. Shelf S., 198, 568–582, https://doi.org/10.1016/j.ecss.2016.10.004, 2017.
Brakenhoff, L., Schrijvershof, R., van der Werf, J., Grasmeijer, B., Ruessink, G., and van der Vegt, M.: From ripples to large-scale sand transport: The effects of bedform-related roughness on hydrodynamics and sediment transport patterns in delft3d, J. Mar. Sci. Eng., 8, 1–25, https://doi.org/10.3390/jmse8110892, 2020.
Bramato, S., Ortega-Sánchez, M., Mans, C., and Losada, M. A.: Natural recovery of a mixed sand and gravel beach after a sequence of a short duration storm and moderate sea states, J. Coastal Res., 28, 89–101, https://doi.org/10.2112/jcoastres-D-10-00019.1, 2012.
Broaddus, C. M., Nienhuis, J. H., Edmonds, D. A., and Foufoula-Georgiou, E.: Wave-Influenced Deltas: Growth Through Cyclical Accretion of Barrier-Spits and the Role of Mud, J. Geophys. Res.-Earth, 130, e2024JF008166, https://doi.org/10.1029/2024JF008166, 2025.
Cabezas-Rabadán, C., Pardo-Pascual, J. E., Palomar-Vázquez, J., Roch-Talens, A., and Guillén, J.: Satellite observations of storm erosion and recovery of the Ebro Delta coastline, NE Spain, Coast. Eng., 188, 104451, https://doi.org/10.1016/j.coastaleng.2023.104451, 2024.
Cassola, F., Ferrari, F., Mazzino, A., and Miglietta, M. M.: The role of the sea on the flash floods events over Liguria (northwestern Italy), Geophys. Res. Lett., 43, 3534–3542, https://doi.org/10.1002/2016GL068265, 2016.
Castelle, B. and Harley, M.: Extreme events: Impact and recovery, in: Sandy Beach Morphodynamics, edited by: Jackson, D. W. T. and Short, A. D., Elsevier, 533–556, https://doi.org/10.1016/B978-0-08-102927-5.00022-9, 2020.
Castelle, B., Marieu, V., Bujan, S., Splinter, K. D., Robinet, A., Sénéchal, N., and Ferreira, S.: Impact of the winter 2013–2014 series of severe Western Europe storms on a double-barred sandy coast: Beach and dune erosion and megacusp embayments, Geomorphology, 238, 135–148, https://doi.org/10.1016/j.geomorph.2015.03.006, 2015.
Castelle, B., Robinet, A., Idier, D., and D'Anna, M.: Modelling of embayed beach equilibrium planform and rotation signal, Geomorphology, 369, 107367, https://doi.org/10.1016/j.geomorph.2020.107367, 2020.
Celedón, V., Del Río, L., Ferreira, Ó., Costas, S., and Plomaritis, T. A.: Identification of risk hotspots to storm events in a coastal region with high morphodynamic alongshore variability, Nat. Hazards, 115, 461–488, https://doi.org/10.1007/S11069-022-05562-X, 2023.
Confederación Hidrográfica del Guadalquivir: Plan Hidrológico de la Demarcación Hidrográfica del Guadalquivir 2022–2027, Ministerio para la Transición Ecológica y el Reto Demográfico, https://www.chguadalquivir.es/tercer-ciclo-guadalquivir (last access: 6 April 2026), 2023 (in Spanish).
De Goede, E. D.: Historical overview of 2D and 3D hydrodynamic modelling of shallow water flows in the Netherlands, Ocean Dynam., 70, 521–539, https://doi.org/10.1007/s10236-019-01336-5, 2020.
de Santiago, I., Camus, P., González, M., Liria, P., Epelde, I., Chust, G., del Campo, A., and Uriarte, A.: Impact of climate change on beach erosion in the Basque Coast (NE Spain), Coast. Eng., 167, 103916, https://doi.org/10.1016/j.coastaleng.2021.103916, 2021.
Del-Rosal-Salido, J., Bermúdez, M., Ortega-Sánchez, M., Sanuy, M., Silva-Santana, M., and Jiménez, J. A.: A composite index framework for compound flood risk assessment, Commun. Earth Environ., 6, 342, https://doi.org/10.1038/s43247-025-02331-z, 2025.
Deltares: Delft3D 4 Download portal, Deltares, https://oss.deltares.nl/web/delft3d/get-started (last access: 6 April 2026), 2025.
Detares: Delft3d User Manual, Version: 4.07.01, Revision: 80851, https://content.oss.deltares.nl/delft3d4/Delft3D-FLOW_User_Manual.pdf, last access: 6 April 2026.
Durán, R., Guillén, J., Ruiz, A., Jiménez, J. A., and Sagristà, E.: Morphological changes, beach inundation and overwash caused by an extreme storm on a low-lying embayed beach bounded by a dune system (NW Mediterranean), Geomorphology, 274, 129–142, https://doi.org/10.1016/j.geomorph.2016.09.012, 2016.
Edmonds, D. A. and Slingerland, R. L.: Mechanics of river mouth bar formation: Implications for the morphodynamics of delta distributary networks, J. Geophys. Res.-Earth, 112, https://doi.org/10.1029/2006JF000574, 2007.
Falqués, A. and Calvete, D.: Large-scale dynamics of sandy coastlines: Diffusivity and instability, J. Geophys. Res.-Oceans, 110, 1–15, https://doi.org/10.1029/2004JC002587, 2005.
Fernández-Fernández, S., Silva, P. A., Ferreira, C. C., and Carracedo-García, P. E.: Longshore Sediment Transport Estimation at Areão Beach (NW Portugal) under Climate Change Scenario, J. Coastal Res., 95, 479–483, https://doi.org/10.2112/SI95-093.1, 2020.
Flor-Blanco, G., Alcántara-Carrió, J., Jackson, D. W. T., Flor, G., and Flores-Soriano, C.: Coastal erosion in NW Spain: Recent patterns under extreme storm wave events, Geomorphology, 387, 107767, https://doi.org/10.1016/j.geomorph.2021.107767, 2021.
Gao, W., Shao, D., Wang, Z. B., Nardin, W., Rajput, P., Yang, W., Sun, T., and Cui, B.: Long-Term Cumulative Effects of Intra-Annual Variability of Unsteady River Discharge on the Progradation of Delta Lobes: A Modeling Perspective, J. Geophys. Res.-Earth, 124, 960–973, https://doi.org/10.1029/2017JF004584, 2019.
Garel, E. and Ferreira, Ó.: Effects of the Alqueva Dam on Sediment Fluxes at the Mouth of the Guadiana Estuary, J. Coastal Res., 64, 1505–1509, 2011.
Garel, E., López-Ruiz, A., and Ferreira, Ó.: A method to estimate the longshore sediment transport at ebb-tidal deltas based on their volumetric growth: Application to the Guadiana (Spain–Portugal border), Earth Surf. Proc. Land., 44, 2557–2569, https://doi.org/10.1002/esp.4679, 2019.
Goda, Y.: Random Seas and Design of Maritime Structures, 2nd edn., edited by: Liu, P., World Scientific, https://doi.org/10.1142/3587, 2000.
Gramcianinov, C. B., Staneva, J., de Camargo, R., and da Silva Dias, P. L.: Changes in extreme wave events in the southwestern South Atlantic Ocean, Ocean Dynam., 73, 663–678, https://doi.org/10.1007/s10236-023-01575-7, 2023.
Haerens, P., Ciavola, P., Ferreira, Ó., Van Dongeren, A., Van Koningsveld, M., and Bolle, A.: Online Operational Early Warning System Prototypes to Forecast Coastal Storm Impacts (CEWS), Coast. Eng. Proc., 1, management.45, https://doi.org/10.9753/icce.v33.management.45, 2012.
Hallermeier, R. J.: A profile zonation for seasonal sand beaches from wave climate, Coast. Eng., 4, 253–277, https://doi.org/10.1016/0378-3839(80)90022-8, 1980.
Harley, M.: Coastal Storm Definition, in: Coastal Storms: Processes and Impacts, edited by: Ciavola, P. and Coco, G., Wiley Blackwell, 1–21, https://doi.org/10.1002/9781118937099.CH1, 2017.
Hopkins, J., Elgar, S., and Raubenheimer, B.: Storm Impact on Morphological Evolution of a Sandy Inlet, J. Geophys. Res.-Oceans, 123, 5751–5762, https://doi.org/10.1029/2017JC013708, 2018.
Horta, J., Oliveira, S., Moura, D., and Ferreira, Ó.: Nearshore hydrodynamics at pocket beaches with contrasting wave exposure in southern Portugal, Estuar. Coast. Shelf S., 204, 40–55, https://doi.org/10.1016/j.ecss.2018.02.018, 2018.
Hu, X. and Chen, X.: Fractional formula of sediment transport rate for graded sediment in wave-driven sheet flow, Coast. Eng., 180, 104270, https://doi.org/10.1016/j.coastaleng.2022.104270, 2023.
Jiang, C. H., Zhou, Z., Townend, I. H., Guo, L. C., Wei, Y. Z., Luo, F., and Zhang, C. K.: Modelling the impact of sediment composition on long-term estuarine morphodynamics, Coast. Eng., 193, 104595, https://doi.org/10.1016/j.coastaleng.2024.104595, 2024.
Jiménez-Robles, A. M. and Ortega-Sánchez, M.: Implications of River Discharge Angle and Basin Slope on Mouth Bar Morphology and Discharge Dynamics of Stable Jets, J. Hydraul. Eng., 144, https://doi.org/10.1061/(asce)hy.1943-7900.0001506, 2018.
Jiménez-Robles, A. M., Ortega-Sánchez, M., and Losada, M. A.: Effects of basin bottom slope on jet hydrodynamics and river mouth bar formation, J. Geophys. Res.-Earth, 121, 1110–1133, https://doi.org/10.1002/2016JF003871, 2016.
Junta de Andalucía: Plan Hidrológico de la Demarcación Hidrográfica de las Cuencas Mediterráneas Andaluzas 2022–2027, Consejería de Agricultura, Pesca, Agua y Desarrollo Rural, https://www.juntadeandalucia.es/medioambiente/portal/areas-tematicas/agua/planificacion-hidrologica/2022-2027/cuencas-mediterraneas (last access: 6 April 2026), 2023a (in Spanish).
Junta de Andalucía: Plan Hidrológico de la Demarcación Hidrográfica del Guadalete-Barbate 2022–2027, Consejería de Agricultura, Pesca, Agua y Desarrollo Rural, https://www.juntadeandalucia.es/medioambiente/portal/areas-tematicas/agua/planificacion-hidrologica/2022-2027/guadalete-barbate (last access: 6 April 2026), 2023b (in Spanish).
Junta de Andalucía: Plan Hidrológico de la Demarcación Hidrográfica del Tinto, Odiel y Piedras 2022–2027, Consejería de Agricultura, Pesca, Agua y Desarrollo Rural, https://www.juntadeandalucia.es/medioambiente/portal/areas-tematicas/agua/planificacion-hidrologica/2022-2027/tinto-odiel-piedras (last access: 6 April 2026), 2023c (in Spanish).
Kahl, D. T., Vulis, L. M., Schubert, J. E., and Sanders, B. F.: Characterizing longshore transport potential and divergence of drift to inform beach loss trends, Coast. Eng., 189, 104473, https://doi.org/10.1016/j.coastaleng.2024.104473, 2024.
Karditsa, A. and Poulos, S. E.: Socio-economic risk assessment of the setback zone in beaches threatened by sea level rise induced retreat (Peloponnese coast- Eastern Mediterranean), Anthropocene Coasts, 7, https://doi.org/10.1007/S44218-024-00061-X, 2024.
Kelpšaitė-Rimkienė, L., Parnell, K. E., Žaromskis, R., and Kondrat, V.: Cross-shore profile evolution after an extreme erosion event – Palanga, Lithuania, J. Mar. Sci. Eng., 9, https://doi.org/10.3390/jmse9010038, 2021.
Komar, P. D. and Miller, M. C.: The Initiation of Oscillatory Ripple Marks and the Development of Plane-bed at High Shear Stresses Under Waves, SEPM J. Sediment Res., 45, https://doi.org/10.1306/212F6E15-2B24-11D7-8648000102C1865D, 1975.
Kümmerer, V., Ferreira, Ó., Fanti, V., and Loureiro, C.: Storm identification for high-energy wave climates as a tool to improve long-term analysis, Clim. Dynam., 62, 2207–2226, https://doi.org/10.1007/s00382-023-07017-w, 2024.
Lamb, M. P., Nittrouer, J. A., Mohrig, D., and Shaw, J.: Backwater and river plume controls on scour upstream of river mouths: Implications for fluvio-deltaic morphodynamics, J. Geophys. Res.-Earth, 117, F01002, https://doi.org/10.1029/2011JF002079, 2012.
Lesser, G. R., Roelvink, J. A., van Kester, J. A. T. M., and Stelling, G. S.: Development and validation of a three-dimensional morphological model, Coast. Eng., 51, 883–915, https://doi.org/10.1016/j.coastaleng.2004.07.014, 2004.
Lin-Ye, J., Garcia-Leon, M., Gracia, V., and Sanchez-Arcilla, A.: A multivariate statistical model of extreme events: An application to the Catalan coast, Coast. Eng., 117, 138–156, https://doi.org/10.1016/j.coastaleng.2016.08.002, 2016.
Lira-Loarca, A., Berg, P., Baquerizo, A., and Besio, G.: On the role of wave climate temporal variability in bias correction of GCM-RCM wave simulations, Clim. Dynam., 61, 3541–3568, https://doi.org/10.1007/s00382-023-06756-0, 2023.
López-Dóriga, U. and Ferreira, Ó.: Longshore and cross-shore morphological variability of a berm-bar system under low to moderate wave energy, J. Coastal Res., 33, 1161–1171, https://doi.org/10.2112/jcoastres-d-16-00050.1, 2017.
López-Olmedilla, L., Almeida, L. P., de Figueiredo, S. A., Fontán-Bouzas, Á., Silva, P. A., and Alcántara-Carrió, J.: Effect of alongshore sediment supply gradients on projected shoreline position under sea-level rise (northwestern Portuguese coast), Estuar. Coast. Shelf S., 271, 107876, https://doi.org/10.1016/j.ecss.2022.107876, 2022.
Loureiro, C., Ferreira, Ó., and Cooper, J. A. G.: Extreme erosion on high-energy embayed beaches: Influence of megarips and storm grouping, Geomorphology, 139–140, 155–171, https://doi.org/10.1016/j.geomorph.2011.10.013, 2012a.
Loureiro, C., Ferreira, Ó., and Cooper, J. A. G.: Geologically constrained morphological variability and boundary effects on embayed beaches, Mar. Geol., 329–331, 1–15, https://doi.org/10.1016/j.margeo.2012.09.010, 2012b.
Luijendijk, A. P., Ranasinghe, R., de Schipper, M. A., Huisman, B. A., Swinkels, C. M., Walstra, D. J. R., and Stive, M. J. F.: The initial morphological response of the Sand Engine: A process-based modelling study, Coast. Eng., 119, 1–14, https://doi.org/10.1016/j.coastaleng.2016.09.005, 2017.
Málvarez, G., Ferreira, O., Navas, F., Cooper, J. A. G., Gracia-Prieto, F. J., and Talavera, L.: Storm impacts on a coupled human-natural coastal system: Resilience of developed coasts, Sci. Total Environ., 768, 144987, https://doi.org/10.1016/j.scitotenv.2021.144987, 2021.
Manno, G., Anfuso, G., Messina, E., Williams, A. T., Suffo, M., and Liguori, V.: Decadal evolution of coastline armouring along the Mediterranean Andalusia littoral (South of Spain), Ocean Coast. Manage., 124, 84–99, https://doi.org/10.1016/j.ocecoaman.2016.02.007, 2016.
Mariotti, G. and Murshid, S.: A 2D Tide-Averaged Model for the Long-Term Evolution of an Idealized Tidal Basin-Inlet-Delta System, J. Mar. Sci. Eng., 6, 154, https://doi.org/10.3390/jmse6040154, 2018.
Martzikos, N. T., Prinos, P. E., Memos, C. D., and Tsoukala, V. K.: Statistical analysis of Mediterranean coastal storms, Oceanologia, 63, 133–148, https://doi.org/10.1016/j.oceano.2020.11.001, 2021.
Masselink, G., Austin, M., Scott, T., Poate, T., and Russell, P.: Role of wave forcing, storms and NAO in outer bar dynamics on a high-energy, macro-tidal beach, Geomorphology, 226, 76–93, https://doi.org/10.1016/j.geomorph.2014.07.025, 2014.
Matsoukis, C., Amoudry, L. O., Bricheno, L., and Leonardi, N.: Investigating how river flow regimes impact on river delta salinization through idealized modeling, Front. Mar. Sci., 10, 1075683, https://doi.org/10.3389/fmars.2023.1075683, 2023.
Melito, L., Parlagreco, L., Perugini, E., Postacchini, M., Devoti, S., Soldini, L., Zitti, G., Liberti, L., and Brocchini, M.: Sandbar dynamics in microtidal environments: Migration patterns in unprotected and bounded beaches, Coast. Eng., 161, 103768, https://doi.org/10.1016/j.coastaleng.2020.103768, 2020.
Mendoza, E. T., Jimenez, J. A., and Mateo, J.: A coastal storms intensity scale for the Catalan sea (NW Mediterranean), Nat. Hazards Earth Syst. Sci., 11, 2453–2462, https://doi.org/10.5194/nhess-11-2453-2011, 2011.
Mentaschi, L., Besio, G., Cassola, F., and Mazzino, A.: Developing and validating a forecast/hindcast system for the Mediterranean Sea, J. Coastal Res., 65, 1551–1556, https://doi.org/10.2112/SI65-262.1, 2013.
Mentaschi, L., Besio, G., Cassola, F., and Mazzino, A.: Performance evaluation of Wavewatch III in the Mediterranean Sea, Ocean Model., 90, 82–94, https://doi.org/10.1016/j.ocemod.2015.04.003, 2015.
Mentaschi, L., Vousdoukas, M. I., Voukouvalas, E., Dosio, A., and Feyen, L.: Global changes of extreme coastal wave energy fluxes triggered by intensified teleconnection patterns, Geophys. Res. Lett., 44, 2416–2426, https://doi.org/10.1002/2016GL072488, 2017.
Mentaschi, L., Vousdoukas, M. I., Pekel, J. F., Voukouvalas, E., and Feyen, L.: Global long-term observations of coastal erosion and accretion, Sci. Rep.-UK, 8, 1–11, https://doi.org/10.1038/s41598-018-30904-w, 2018.
Monioudi, I. N., Velegrakis, A. F., Chatzistratis, D., Vousdoukas, M. I., Savva, C., Wang, D., Bove, G., Mentaschi, L., Paprotny, D., Morales-Nápoles, O., Chatzipavlis, A. E., Hasiotis, T., and Manoutsoglou, E.: Climate change – induced hazards on touristic island beaches: Cyprus, Eastern Mediterranean, Front. Mar. Sci., 10, 1188896, https://doi.org/10.3389/fmars.2023.1188896, 2023.
Nahon, A., Idier, D., Bertin, X., Guérin, T., Marieu, V., Sénéchal, N., and Mugica, J.: Modelling the contribution of wind waves to Cap Ferret's updrift erosion, Coast. Eng., 172, 104063, https://doi.org/10.1016/j.coastaleng.2021.104063, 2022.
Nardin, W. and Fagherazzi, S.: The effect of wind waves on the development of river mouth bars, Geophys. Res. Lett., 39, https://doi.org/10.1029/2012GL051788, 2012.
Nienhuis, J. H., Ashton, A. D., Nardin, W., Fagherazzi, S., and Giosan, L.: Alongshore sediment bypassing as a control on river mouth morphodynamics, J. Geophys. Res.-Earth, 121, 664–683, https://doi.org/10.1002/2015JF003780, 2016.
Ojeda, E., Appendini, C. M., and Mendoza, E. T.: Storm-wave trends in Mexican waters of the Gulf of Mexico and Caribbean Sea, Nat. Hazards Earth Syst. Sci., 17, 1305–1317, https://doi.org/10.5194/nhess-17-1305-2017, 2017.
Ortiz, A. C. and Ashton, A. D.: Exploring shoreface dynamics and a mechanistic explanation for a morphodynamic depth of closure, J. Geophys. Res.-Earth, 121, 442–464, https://doi.org/10.1002/2015JF003699, 2016.
Özpolat, E. and Demir, T.: The spatiotemporal shoreline dynamics of a delta under natural and anthropogenic conditions from 1950 to 2018: A dramatic case from the Eastern Mediterranean, Ocean Coast. Manage., 180, 104910, https://doi.org/10.1016/j.ocecoaman.2019.104910, 2019.
Palazón, A., López, I., Gilart, V., Bañón, L., and Aragonés, L.: Concessions within the maritime-terrestrial public domain on the beaches of southeastern Spain, Ocean Coast. Manage., 161, 156–164, https://doi.org/10.1016/j.ocecoaman.2018.05.011, 2018.
Plomaritis, T. A., Benavente, J., Laiz, I., and Del Río, L.: Variability in storm climate along the Gulf of Cadiz: the role of large scale atmospheric forcing and implications to coastal hazards, Clim. Dynam., 45, 2499–2514, https://doi.org/10.1007/s00382-015-2486-4, 2015.
Poulos, S. E. and Collins, M. B.: Fluviatile sediment fluxes to the Mediterranean Sea: a quantitative approach and the influence of dams, Geol. Soc., Lond., Spec. Publ., 191, 227–245, https://doi.org/10.1144/gsl.sp.2002.191.01.16, 2002.
Puig, M., Del Río, L., Plomaritis, T. A., and Benavente, J.: Contribution of storms to shoreline changes in mesotidal dissipative beaches: case study in the Gulf of Cádiz (SW Spain), Nat. Hazards Earth Syst. Sci., 16, 2543–2557, https://doi.org/10.5194/nhess-16-2543-2016, 2016.
Rangel-Buitrago, N. and Anfuso, G.: Risk Assessment of Storms in Coastal Zones: Case Studies from Cartagena (Colombia) and Cadiz (Spain), Springer Briefs in Earth Sciences, Springer, https://doi.org/10.1007/978-3-319-15844-0, 2015.
Ris, R. C., Holthuijsen, L. H., and Booij, N.: A third-generation wave model for coastal regions: 2. Verification, J. Geophys. Res.-Oceans, 104, 7667–7681, https://doi.org/10.1029/1998JC900123, 1999.
Roco, A., Flores, R. P., Williams, M. E., and Saldías, G. S.: Observations of river-wave interactions at a small-scale river mouth, Coast. Eng., 189, 104456, https://doi.org/10.1016/j.coastaleng.2024.104456, 2024.
Roelvink, D. and Walstra, D.-J.: Keeping It Simple By Using Complex Models, in: Advances in Hydro-Science and Engineering, edited by: Altinakar, M. S., Wang, S. S. Y., Holz, K. P., and Kawahara, M., National Center for Computational Hydroscience and Eng., 335–346, ISBN 0-937099-12-0, 2004.
Roelvink, D., Huisman, B., Elghandour, A., Ghonim, M., and Reyns, J.: Efficient Modeling of Complex Sandy Coastal Evolution at Monthly to Century Time Scales, Front. Mar. Sci., 7, 535, https://doi.org/10.3389/fmars.2020.00535, 2020.
Roman-Sierra, J., Navarro-Pons, M., Muñoz-Pérez, J. J., and Álvarez, M. B. T.: Variabilidad espacio-temporal de la flecha del río Guadiaro, Ing. Civil, 149, 111–121, 2008 (in Spanish).
Romão, F., Coelho, C., Lima, M., Ásmundsson, H., and Myer, E. M.: Cross-Shore Modeling Features: Calibration and Impacts of Wave Climate Uncertainties, J. Mar. Sci. Eng., 12, 760, https://doi.org/10.3390/jmse12050760, 2024.
Ruiz de Alegría-Arzaburu, A., Gasalla-López, B., and Benavente, J.: Morphological response of an embayed beach to swell-driven storminess cycles over an 8 year period, Geomorphology, 403, 108164, https://doi.org/10.1016/j.geomorph.2022.108164, 2022.
Ruiz-Reina, A.: River mouth data from major streams in southern Spain (Versión 01), Zenodo [data set], https://doi.org/10.5281/zenodo.4541878, 2021.
Ruiz-Reina, A. and López-Ruiz, A.: Short-term river mouth bar development during extreme river discharge events: The role of the phase difference between the peak discharge and the tidal level, Coast. Eng., 170, 103982, https://doi.org/10.1016/j.coastaleng.2021.103982, 2021.
Rusu, L.: The near future expected wave power in the coastal environment of the Iberian Peninsula, Renew. Energ., 195, 657–669, https://doi.org/10.1016/j.renene.2022.06.047, 2022.
Sanò, M., Jiménez, J. A., Medina, R., Stanica, A., Sanchez-Arcilla, A., and Trumbic, I.: The role of coastal setbacks in the context of coastal erosion and climate change, Ocean Coast. Manage., 54, 943–950, https://doi.org/10.1016/j.ocecoaman.2011.06.008, 2011.
Sanuy, M., Peña, J. C., Assimenidis, S., and Jiménez, J. A.: Synoptic weather patterns conducive to compound extreme rainfall–wave events in the NW Mediterranean, Hydrol. Earth Syst. Sci., 28, 283–302, https://doi.org/10.5194/hess-28-283-2024, 2024.
Short, A.: Macro-mesal tidal beach morphodynamics-an overview, J. Coastal Res., 7, 417–436, 1991.
Stevens, A. W., Ruggiero, P., Parker, K. A., Vitousek, S., Gelfenbaum, G., and Kaminsky, G. M.: Climate controls on longshore sediment transport and coastal morphology adjacent to engineered inlets, Coast. Eng., 194, 104617, https://doi.org/10.1016/j.coastaleng.2024.104617, 2024.
Thom, B. G. and Hall, W.: Behaviour of beach profiles during accretion and erosion dominated periods, Earth Surf. Proc. Land., 16, 113–127, https://doi.org/10.1002/esp.3290160203, 1991.
Toimil, A., Losada, I. J., Camus, P., and Díaz-Simal, P.: Managing coastal erosion under climate change at the regional scale, Coast. Eng., 128, 106–122, https://doi.org/10.1016/j.coastaleng.2017.08.004, 2017.
Toimil, A., Losada, I. J., Álvarez-Cuesta, M., and Le Cozannet, G.: Demonstrating the value of beaches for adaptation to future coastal flood risk, Nat. Commun., 14, 3474, https://doi.org/10.1038/s41467-023-39168-z, 2023.
van Rijn, L. C.: Unified View of Sediment Transport by Currents and Waves. I: Initiation of Motion, Bed Roughness, and Bed-Load Transport, J. Hydraul. Eng., 133, 649–667, https://doi.org/10.1061/(ASCE)0733-9429(2007)133:6(649), 2007a.
van Rijn, L. C.: Unified View of Sediment Transport by Currents and Waves. II: Suspended Transport, J. Hydraul. Eng., 133, 668–689, https://doi.org/10.1061/(ASCE)0733-9429(2007)133:6(668), 2007b.
van Rijn, L. C.: Coastal erosion and control, Ocean Coast. Manage., 54, 867–887, https://doi.org/10.1016/j.ocecoaman.2011.05.004, 2011.
Velasquez-Montoya, L., Overton, M. F., and Sciaudone, E. J.: Natural and anthropogenic-induced changes in a tidal inlet: Morphological evolution of Oregon Inlet, Geomorphology, 350, 106871, https://doi.org/10.1016/j.geomorph.2019.106871, 2020.
Vieira, B. F. V, Pinho, J. L. S., and Barros, J. A. O.: Extreme wave value analysis under uncertainty of climate change scenarios off Iberian Peninsula coast, Ocean Eng., 229, 109018, https://doi.org/10.1016/j.oceaneng.2021.109018, 2021.
Vitousek, S., Barnard, P. L., Limber, P., Erikson, L., and Cole, B.: A model integrating longshore and cross-shore processes for predicting long-term shoreline response to climate change, J. Geophys. Res.-Earth, 122, 782–806, https://doi.org/10.1002/2016JF004065, 2017.
Vousdoukas, M. I., Pedro, L., Almeida, M., and Ferreira, Ó.: Beach erosion and recovery during consecutive storms at a steep-sloping, meso-tidal beach, Earth Surf. Proc. Land., 37, 583–593, https://doi.org/10.1002/esp.2264, 2011.
Whitfield, A. and Elliott, M.: Ecosystem and Biotic Classifications of Estuaries and Coasts, in: Treatise on Estuarine and Coastal Science, Vol. 1, Elsevier Inc., 99–124, https://doi.org/10.1016/B978-0-12-374711-2.00108-X, 2012.
Xie, D., Hughes, Z., FitzGerald, D., Tas, S., Asik, T. Z., and Fagherazzi, S.: Longshore sediment transport across a tombolo determined by two adjacent circulation cells, J. Geophys. Res.-Earth, 129, e2024JF007709, https://doi.org/10.1029/2024JF007709, 2024.
Zarzuelo, C., López-Ruiz, A., and Ortega-Sánchez, M.: Evaluating the impact of dredging strategies at tidal inlets: Performance assessment, Sci. Total Environ., 658, 1069–1084, https://doi.org/10.1016/j.scitotenv.2018.12.227, 2019.
Zhang, J., Tsai, B., Rafati, Y., Hsu, T. J., and Puleo, J. A.: Cross-shore hydrodynamics and morphodynamics modeling of an erosive event in the inner surf zone, Coast. Eng., 196, 104662, https://doi.org/10.1016/j.coastaleng.2024.104662, 2025.
- Abstract
- Introduction
- Methods
- Identification of morphodynamic and climatic events
- Results
- Application to real-world study areas
- Discussion
- Conclusions
- Code and data availability
- Author contributions
- Competing interests
- Disclaimer
- Acknowledgements
- Financial support
- Review statement
- References
- Supplement