the Creative Commons Attribution 4.0 License.
the Creative Commons Attribution 4.0 License.
 | 30 Apr 2026
Detection and characterization of precipitation extremes and geohydrological hazards over a transboundary Alpine area based on different methods and climate datasets
Katharina Enigl
Sebastian Lehner
Klaus Haslinger
Massimiliano Pittore
Extreme hydrometeorological events are an increasing concern in Central Europe, particularly in the European Alps, where they pose significant threats to ecological and socio-economic systems. Risk assessment and management can benefit from a better understanding of how the choice of climate datasets and extreme definition affect the identification of extreme meteorological events capable of triggering hazardous events. Considering precipitation as a key triggering factor for geohydrological hazards, such as landslides and floods, this study compares different meteorological products and statistical definitions for the identification and characterization of extreme precipitation events over 2003–2020 in a transboundary Alpine region between Austria and Italy. In particular, the temporal and spatial match of detected precipitation events and available hazard records is analysed. Three statistical metrics of 1 d precipitation are adopted for identifying the most intense precipitation events, each of them accounting for a different aspect of extreme conditions, i.e., the spatial extent of intensities, the local intensity peak and the magnitude. The metrics are calculated from four gridded meteorological products with spatial resolution ranging from 1 to 9 km. These products include observation-based data (SPARTACUS-TST) and radar-aided products (INCA) as well as reanalyses (CERRA-Land and ERA5-Land). The sets of most intense precipitation events identified by each combination of datasets and statistical approaches are evaluated against hazard occurrences in both space and time. Extreme events defined by the local intensity, i.e., the spatial 99th percentile over the study area, show the highest correspondence with observed hazards. In terms of datasets, the two 1 km observation-based products, especially INCA, offer a more detailed and reliable representation of precipitation intensities and exhibit a stronger association with hazards. Contrarily, the 9 km ERA5-Land reanalysis shows the lowest performance in precipitation extreme identification across all metrics and in their match with recorded hazards, both spatially and temporally. The spatial scales resolved by the meteorological data and/or accounted for by the metrics applied to define extreme events play a crucial role in capturing processes able to trigger geohydrological hazards in the study area. These findings can support the formulation of methodological recommendations for assessing transboundary risks associated with precipitation extremes and related geohydrological processes in the Alpine regions.
- Article
(3889 KB) - Full-text XML
-
Supplement
(1634 KB) - BibTeX
- EndNote


Weather extremes such as heavy rainfall events can trigger multiple hazardous processes leading to adverse consequences on ecosystems and human activities. Intense precipitation can cascade into geohydrological hazards, such as floods and gravitational mass movements like debris flows, landslides and rockfalls. These phenomena could in turn cause loss of life and damage buildings, transport infrastructure, agricultural production, and natural capital also with long-term economic effects (Bouwer, 2019). The costs of disaster response and recovery can further strain economies, emphasizing the need for understanding and preparing for extreme events to enhance resilience and reduce vulnerability. For instance, in 2023, in Europe extreme hydrometeorological events, such as thunderstorms and torrential rainfall causing widespread flooding in Italy and Austria, incurred more than 20 fatalities and EUR 15 billion of losses (Munich RE, 2024).
The Alpine region, characterized by a complex topography, is particularly prone to geohydrological hazards mainly triggered by intense precipitation episodes, including heavy snowfall, whose effects can transcend national borders and affect multiple countries simultaneously (Steger et al., 2023; Stoffel et al., 2014). Precipitation intensity and extreme occurrence are generally assumed as direct proxies for potential geohydrological phenomena, as well as for the related risks, although some of these processes can also be caused by complex cascading or compound processes or be influenced by multiple predisposing factors (Gonzalez et al., 2024; Steger et al., 2023; Zscheischler et al., 2020). With the expected intensification of precipitation extremes in the Alpine region under future warming scenarios, the potential for hazardous processes could also increase, thus, posing additional challenges in an already vulnerable territory (Kotlarski et al., 2023; Rajczak and Schär, 2017; Wilhelm et al., 2022). Understanding hazardous precipitation extremes in the Alpine region is, therefore, increasingly important to support effective risk management, including early-warning systems, and climate-change adaptation strategies for mitigating adverse consequences on natural systems and human communities.
Precipitation extremes generally refer to exceedances of one or more features, e.g., intensity, duration and magnitude, with respect to a given threshold, based on the probability distribution of data or on a fixed value. The statistics and threshold criteria accounting for one or multiple exceedance conditions adopted to define extreme events can vary based on the specific application or the type of expected impacts (Barlow et al., 2019; Breugem et al., 2020; McPhillips et al., 2018). For instance, Barton et al. (2022) applied the 98th percentile of 1 d precipitation totals as upper threshold to identify past extreme precipitation events over Europe and assess their temporal clustering with implications for flood-related impacts. Meyer et al. (2022) considered rainfall intensities above 40 mm h−1 as conditions with triggering potential for flash floods in central western Europe. Many other studies aiming at improving the characterization and prediction of rainfall-induced gravitational mass movements analysed precipitation threshold definitions for describing predisposing and triggering conditions considering different accumulation periods, duration and timing of precipitation (e.g., Peruccacci et al., 2017; Steger et al., 2023; Vaz et al., 2018). Araújo et al. (2022) used locally defined rainfall triggering thresholds for study areas in Portugal to characterize future precipitation extremes and assess their possible impact on landslide activity. Understanding the sensitivity of precipitation extreme definitions with respect to the temporal and spatial dimensions of the related processes and area of interest remains, thus, essential to enable a robust characterization of rainfall events and anticipate their hazard potential in both present and future conditions (Pinto et al., 2013; Raj et al., 2021; Ramos et al., 2014).
The accurate identification of precipitation events also depends on the meteorological dataset used. Gridded precipitation products provide a continuous description of precipitation fields with spatial details depending on the type of data source used for their development. High-resolution, e.g., km-scale, datasets derived by interpolating station observations or integrating in situ and radar measurements are often employed to derive a detailed local representation of precipitation patterns. In the absence of such datasets, as in case of wide study areas crossing multiple countries for which a consistent high-resolution trans-border observation product may not exist, reanalysis data, i.e., simulations of atmospheric models constrained by observations, are valuable alternatives, even though they generally offer a coarser spatial resolution. The ability of regional gridded observations and reanalysis data to represent daily precipitation extremes has been evaluated extensively (e.g., Bandhauer et al., 2022; Hu and Franzke, 2020; Reder et al., 2022). The performance of these datasets is influenced not only by their resolution but also by the different methods used to produce the spatial fields (Alexander et al., 2020; Hu and Franzke, 2020).
Besides the representation of precipitation intensities, understanding to what extent precipitation events identified as extreme correspond to hazards is a crucial step for developing impact-related detection frameworks supporting risk-oriented studies. There exists a knowledge gap in evaluating the skill of the combination of gridded meteorological data and extreme event definitions to explain hazard occurrences, with only a limited number of studies addressing this issue. For instance, Insua-Costa et al. (2021) identified and ranked past precipitation events in the Western Mediterranean area by applying a spatially varying daily precipitation threshold to a 5.5 km precipitation reanalysis dataset (Soci et al., 2016) and linked them to flood occurrences reported in international disaster databases (Llasat et al., 2013). Liu et al. (2020) employed a percentile-based method to detect extreme precipitation events in the mainland of China and connected those to economic losses caused by floods to derive a disaster-triggering threshold of extreme precipitation. Wood et al. (2025) conducted a systematic evaluation of precipitation, temperature, and snowfall metrics across four climate reanalyses, assessing their ability to represent the frequency and intensity of extreme hydrological events in Switzerland. Banfi and De Michele (2024) investigated the temporal clustering of precipitation and its role for triggering multiple mass movement processes in Italy based on both reanalysis and observation products. Several studies also explored the use of satellite-based products such as TRMM, GPM/IMERG (e.g., Kirschbaum et al., 2015), or high-resolution radar-derived precipitation data (e.g., Millán-Arancibia and Lavado-Casimiro, 2023) to derive rainfall statistics for landslide-triggering events at regional to global scales. However, literature lacks a systematic assessment of statistics and precipitation datasets for defining and describing extreme events over transboundary Alpine areas by measuring their ability to account for temporal and spatial occurrence of rainfall-driven geohydrological hazards.
In this framework, the study aims to (i) evaluate how metrics for precipitation intensity, not a-priori tailored to a specific hazardous process, enable to capture extreme events with triggering potential for geohydrological hazards over complex topography; (ii) assess the suitability of precipitation datasets of different types and spatial resolution to describe extremes; (iii) investigate the optimal combinations of metrics and datasets for characterizing extreme precipitation events and their spatiotemporal relation with hazard records. To answer these questions, three metrics measuring different aspects of rainfall extremes are calculated from 1 d precipitation fields of four meteorological datasets over a transboundary Alpine area between Italy and Austria and used to identify precipitation events over 2003–2020. Subsequently, they are compared with a harmonized archive of geohydrological hazard records to quantify the spatiotemporal match between identified events and observed records.
2.1 Study area
The study area is a transboundary region in the eastern European Alps including South Tyrol, the northernmost province of Italy, as well as East Tyrol and Carinthia in the southern part of Austria (Fig. 1). The region extends over ∼ 19 000 km2 mostly on the southern Alpine ridge and is dominated by a mountainous landscape with strong altitude gradients. South Tyrol extends over 7400 km2 with elevations ranging from 200 to 3900 m above sea level (a.s.l.) and about 85 % of the territory is located above 1000 m a.s.l. In East Tyrol and Carinthia, the elevation ranges from 400 to 3800 m a.s.l. with about 75 % of the territory (∼ 11 500 km2) above 1000 m a.s.l. The climate is influenced by the humid airflows from the Atlantic North-West, including air masses from the continental east and air masses advected from the south, with occasional so-called Vb cyclone patterns induced through Genoa-cyclogenesis (Hofstätter et al., 2016). Precipitation is primarily driven by mesoscale systems, with the highest precipitation amounts occurring in summer and secondarily in autumn. The complex topography induces local patterns, such as typical drier conditions in inner valleys due to the sheltering effects of surrounding mountains (Price, 2009).
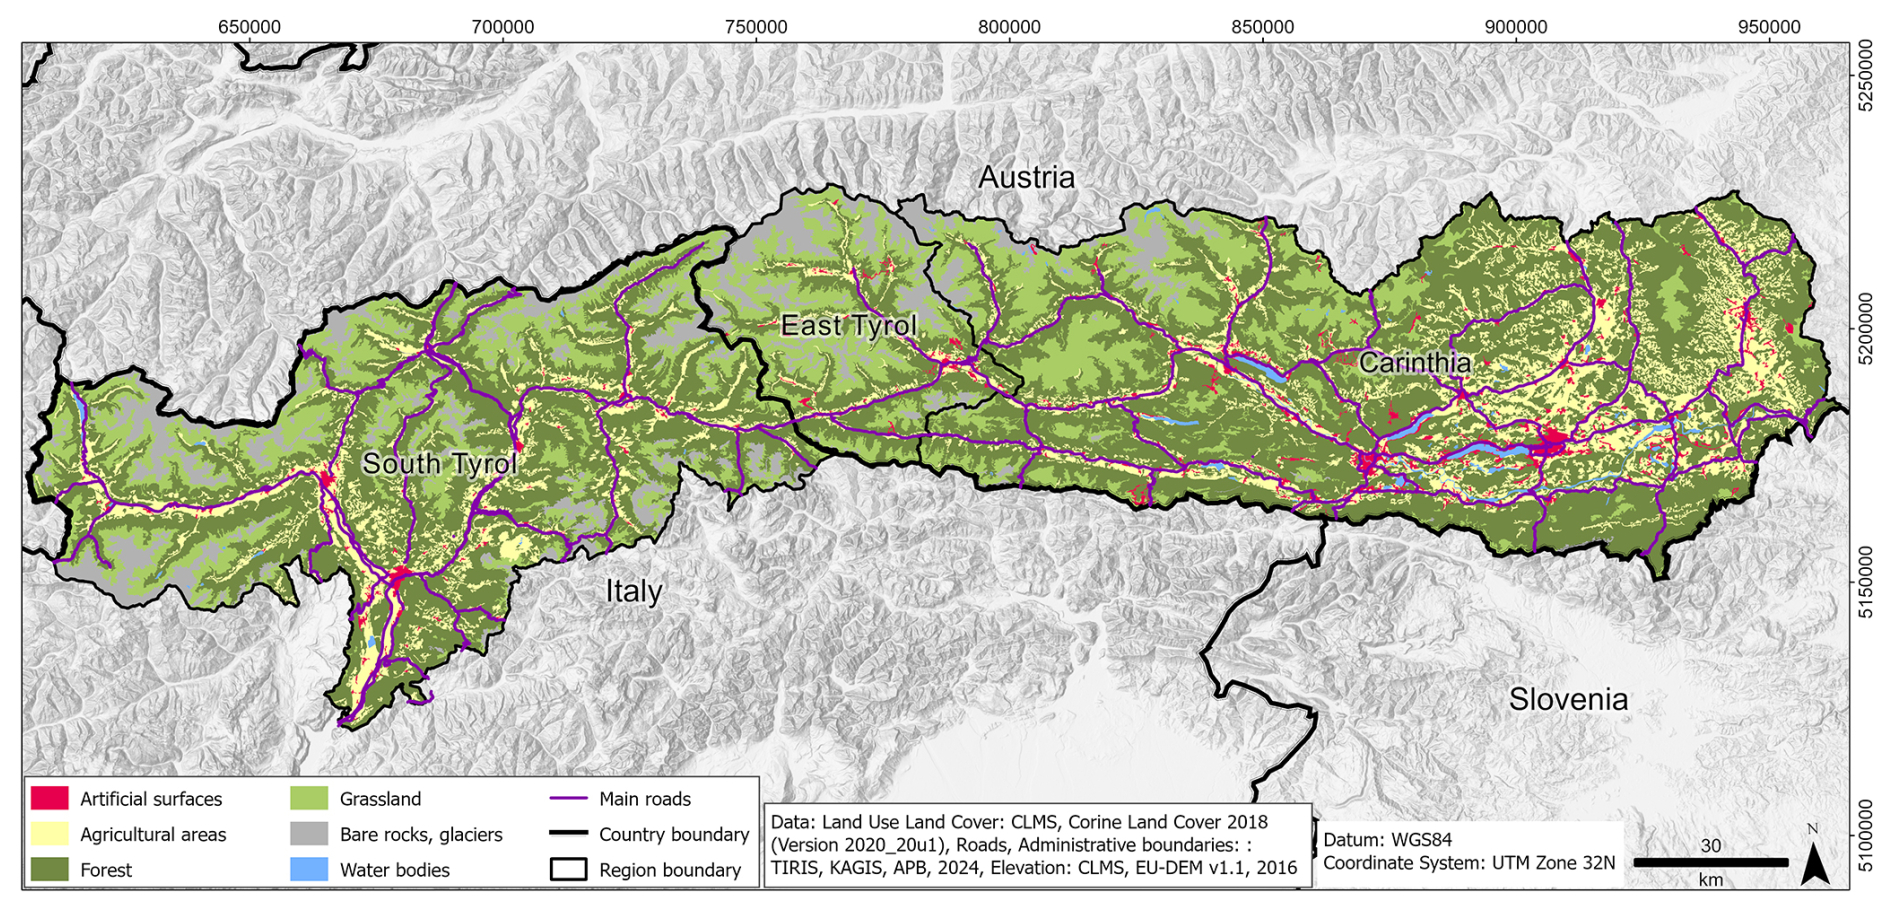
Figure 1Map of the Italy-Austria cross-boundary study area depicting the main roads and land-use classes. Data sources are reported in the legend.
South Tyrol is populated by 530 000 people (ASTAT, 2023), of which one fifth lives in the provincial capital Bolzano. In East Tyrol and Carinthia, most of the population (approximately 610 000 people) lives in the regional capitals Lienz (East Tyrol) and Klagenfurt (Carinthia). The transboundary area is a popular tourist destination. In 2023, about 36 million overnight stays were recorded in South Tyrol, 2.5 million in East Tyrol and 13 million in Carinthia (ASTAT, 2024; Statistik Austria, 2024). Tourism, together with agriculture and manufacturing, are the most important economic sectors of this territory. Due to the mountainous topography, main settlements and infrastructure are concentrated in the valleys, making them vulnerable to natural hazards typical of the surrounding steep terrain, especially gravitational mass movements including landslides, rockfalls and avalanches in higher elevations (Pittore et al., 2023; Schlögel et al., 2020). Moreover, the region hosts critical infrastructures of high social and economic relevance connecting the two national areas, such as the corridors of the Trans-European Transport Network crossing the Brenner pass.
The choice of the domain was motivated by the need of accounting for the transnational perspective but considering bordering areas where the common mountainous environment is supposed to be similarly affected by the same precipitation-induced hazards of interest.
2.2 Data
2.2.1 Climate datasets
Four climate datasets covering the study area are selected to assess their ability to detect and characterise extreme precipitation events over the transboundary region. The selection aims to evaluate precipitation fields from different types of products i.e., observation-based grids against reanalyses, and across different spatial resolutions. Two regional products are considered as km-scale datasets, one based purely on the interpolation of in situ observations and one incorporating multiple sources including observations and weather radar fields. The state-of-the-art European reanalysis CERRA-Land at 5.5 km and the global reanalysis ERA5-Land at 9 km are chosen to account for two widely used large-scale products and to evaluate to what extent their precipitation fields are comparable with those resolved by regional datasets. Each dataset is described in detail in the following, while key facts of each product are summarized in Table S1 in the Supplement. All analyses were based on the congruent period 2003–2020, while each product was used in its native spatial resolution.
SPARTACUS-TST
To derive an observation dataset covering the transboundary Italy-Austria study area, two available regional gridded products available for each subregion were merged. The Spatiotemporal Reanalysis Dataset for Climate in Austria (SPARTACUS; Hiebl and Frei, 2018), providing daily precipitation fields for Austria, covers East Tyrol and Carinthia, while the regional daily dataset developed by Crespi et al. (2021) for Trentino-South Tyrol, hereafter TST, covers South Tyrol. SPARTACUS was generated by interpolating quality checked data from irregularly distributed weather stations. It provides daily precipitation totals from 1961 onwards on a 1 km grid across Austria and close surroundings, i.e., the southern parts of Germany and South Tyrol in Italy. However, the low number of weather stations located in South Tyrol (< 10) included in the SPARTACUS interpolation scheme limits the accuracy of reproduced precipitation patterns in this area (Fig. S1). A preliminary comparison with rain gauge observations and TST precipitation fields across South Tyrol showed that the SPARTACUS dataset underestimates precipitation intensities over the Italian area with some events being completely missed. For this reason, the TST dataset was used for the Italian part of the study region providing daily precipitation totals from 1980 onwards on a 250 m grid based on the records from about 80 rain gauges located in South Tyrol. The spatial combination of the two products was considered possible since they are generated by a similar two-step interpolation algorithm modelling the dependence of precipitation on orographic features. The TST dataset was therefore bilinearly interpolated onto the 1 km grid of SPARTACUS and replaced SPARTACUS data over South Tyrol. Daily fields in TST are defined as cumulative precipitation from 08:00 UTC of the previous day to 08:00 UTC of the current day, while daily values in SPARTACUS refer to precipitation totals from 06:00 UTC of the current day to 06:00 UTC of the following day. Therefore, a 1 d shift to daily precipitation fields of TST was applied to align them temporally with SPARTACUS. Despite the similar interpolation scheme and the temporal re-alignment, some minor spatial discontinuities in the merged fields might remain in the border area due to the different weather stations and the level of smoothing of orographic details used in the interpolation procedure of SPARTACUS and TST. Although these discrepancies are expected to have a negligible impact on the event analysis, the adopted approaches were designed to minimize the effect on the results from potential discontinuities due to residual temporal shifts in the merged daily fields (see Sect. 2.3 for the methodology description). The merged dataset is hereafter referred to as SPARTACUS-TST.
INCA
The Integrated Nowcasting through Comprehensive Analysis (INCA) system offers high-resolution precipitation data on a 1 km grid covering Austria and surrounding areas, including South Tyrol. The dataset begins in 2003 and is an operational product updated every 15 min. INCA combines the Numerical Weather Prediction (NWP) model fields with rain gauge data, weather radar estimates and detailed topographical information (Ghaemi et al., 2021; Haiden et al., 2011). The system integrates precipitation data from approximately 250 weather stations of the national network managed by GeoSphere Austria and additional observations from the Austrian hydrographic service and surrounding areas. These observations are interpolated using an inverse distance weighting method and merged with radar data following a specific correction procedure of radar estimates by means of the weather station records. In regions where radar coverage is insufficient, an elevation gradient is applied to the rain gauge data to enhance the overall accuracy. However, it is important to note that these corrections can sometimes result in very high scaling factors, which may create local artifacts in the final analysis (Ghaemi et al., 2021). The INCA precipitation dataset is subject to continuous development and is regularly updated as new data sources are integrated into the system. As part of this ongoing improvement process, additional observational inputs are incorporated over time to enhance spatial coverage and data quality. For example, the South Tyrolean weather radar was integrated into the INCA system at the beginning of 2015, leading to improved representation of precipitation patterns in this region. However, the relatively low number of stations incorporated in INCA for South Tyrol may still lead to an underestimation of precipitation values in this part of the study area. Also shielding effects from both the Austrian and the South Tyrolean radars may lead to underestimations of precipitation over East Tyrol. Nonetheless, INCA is considered a valuable tool for analysing spatial and temporal patterns of precipitation events in mountainous regions at a high resolution and is also suitable for transboundary assessments due to its spatial extent. The 15 min precipitation data of INCA are aggregated to daily sums, representing the precipitation totals from 00:00 UTC of the current day to 00:00 UTC of the next day.
CERRA-Land
The Copernicus European Regional ReAnalysis (CERRA) is a regional reanalysis project developed by the European Centre for Medium-Range Weather Forecasts (ECMWF) for the pan-European region, featuring a horizontal resolution of 5.5 km (Ridal et al., 2024). CERRA was created using the HARMONIE-ALADIN limited-area numerical weather prediction and data assimilation system. CERRA reanalysis incorporates observational data, lateral boundary conditions from the ERA5 global reanalysis as prior estimates of the atmospheric state, and physiographic datasets describing the surface characteristics of the model. CERRA-Land provides surface and soil variables using the SURFEX land surface modelling platform and a daily total precipitation assimilation system. Specifically, daily precipitation fields are generated through an optimal interpolation scheme, combining an initial estimate derived from CERRA forecasted precipitation with daily rain gauge observations. Precipitation totals, available (at the time of the analysis) from September 1984 to May 2021 at a daily temporal resolution, represent the accumulated precipitation from 06:00 UTC of the previous day to 06:00 UTC of the current day. To ensure the temporal alignment with the other datasets, all daily records were shifted 1 d back. The primary advantages of CERRA-Land over other reanalysis products lie in the rain gauge data assimilation and its higher horizontal resolution, which allows for a more detailed representation of topography and physiographic features.
ERA5-Land
ERA5-Land is a replay of the land component of the global reanalysis ERA5 with a finer spatial resolution of 9 km and provides hourly fields of surface variables from 1950 to present. ERA5-Land does not assimilate observations, but it uses ERA5 atmospheric fields interpolated to the finer grid as input to control land model simulations. Due to its spatial and temporal resolution and its long temporal extent, ERA5-Land has been widely used for supporting impact-oriented applications and for assessing the state of the climate (Muñoz-Sabater et al., 2021). Daily precipitation totals are extracted from accumulated precipitation totals (including both liquid and solid precipitation) from 00:00 UTC of the current day to 00:00 UTC of the next day.
2.2.2 Hazard datasets
In this study, we use four different datasets that comprise recorded hazards in the study region. We focus on gravitational mass movements and floods, since the occurrence of these hazardous processes can be largely influenced by precipitation intensity (e.g., Borga et al., 2014). However, it is important to note that the categories of floods and gravitational mass movements include different processes. The records for floods include fluvial sediment transports, urban flooding and overbank sedimentations, while gravitational mass movements encompass multiple movement types, i.e., shallow landslides, debris avalanches, debris and mud flows as well as translational and rotational slides. It is important to note that although most hazards, especially floods, generally extend over an area, they are often recorded where actual impacts are observed and, thus, they refer to specific locations. Due to the variety of processes covered by available records, their link to impacts, and their complex dependence on environmental conditions and conditioning factors, the use of daily precipitation extremes as triggering conditions provides only a first-order explanation of the occurrence of all observed hazards. Furthermore, in contrast to the case of meteorological data, there is currently no recognized standard for the collection and recording of hazard data, neither at cross-boundary level, nor at national level. To account for this additional bias the different types of geohydrological events have been treated as equivalent (no specific distinction is made) and only their recorded location and observation date have been considered. The final database includes 1541 flood events and 2784 mass movement events over 2003–2020.
WLK
The Austrian Service for Torrent and Avalanche Control (WLV), established in 1884, has traditionally focused on managing torrents and avalanches primarily in Alpine regions. One of its key tools is the “Wildbach- und Lawinenkataster” (WLK), a digital geo-information management system introduced in 2017, which maintains comprehensive, long-term records of hazardous processes (Bundesministerium für Nachhaltigkeit und Tourismus, 2018). These records report geohydrological events pinpointed with exact locations. Additionally, most entries in the WLK include the precise day of the event. In this study, we use all documented events recorded between 2003 to 2020 for the region of Carinthia and East Tyrol featuring an exact event date.
GEORIOS
The Geological Survey of Austria, now operating under the name GeoSphere Austria, collects and maintains extensive records of gravitational mass movements within the GEORIOS database (Tilch et al., 2011). These records are derived from different sources including literature, reports, and maps, leading to discrepancies in quality. Consequently, the precision and granularity of information related to location, scale, and volume feature notable variations across the database. Hence, a verification process is undertaken to rectify redundancies, and standardized methodologies are implemented to unify the data into a dataset with consistent quality (Tilch et al., 2011). The GEORIOS entries utilized in this study encompass the region of Carinthia and South Tyrol and provide both event locations and days of occurrence spanning from 2003 to 2020, covering a range of gravitational processes.
ED30
The “Event Documentation of the 30th Division of the Autonomous Province of Bolzano (ED30)” began in 1998 as a database for recording various incidents in the province of Bolzano, including natural disasters and human-made events (https://pericoli-naturali.provincia.bz.it/it/archivio-report-pericoli-naturali, last access: April 2026). It helps authorities in analysing, planning, and responding to emergencies by providing detailed information on event dates, locations, impacts, and response actions. Data are sourced from official reports, field assessments, eyewitness accounts and sensor data. This study focuses on the geohydrological events collected in this database from 2003 to 2020 for which the precise event location and date are available.
IFFI
The Italian Landslide Inventory (IFFI) serves as the national and official repository of landslide data. In collaboration with Regions and Self-Governing Provinces, the Italian National Institute for Environmental Protection and Research (ISPRA) has overseen the implementation of IFFI. This inventory plays a crucial role as a fundamental knowledge resource for evaluating landslide hazards in River Basin Plans, conducting preliminary designs for slope instability and flood mitigation projects, and safeguarding infrastructure networks. Additionally, IFFI aids in the development of Civil Protection Emergency Plans. Currently, the IFFI database documents over 620 000 landslides across Italy. For this study, we focus on analysing gravitational mass movement events occurring in South Tyrol between 2003 and 2020, considering only those for which the day of occurrence and point location are available.
2.3 Methodology
2.3.1 Event definition and detection
High-intensity precipitation events can be associated with large-scale phenomena affecting extended areas or be very localized in space and time, such as those caused by convective processes. The level of intensity of an event can be described based on the absolute accumulated precipitation within a given area, or on its anomalousness relative to the precipitation conditions expected to occur in each given time of the year based on a reference period. Comparing event detection methods adopting different metrics allows for a more comprehensive evaluation of the ability to identify precipitation extremes coinciding with hazard occurrences. The detection and characterization of past precipitation extremes in the study area are, thus, carried out by applying three different methodologies to daily precipitation fields over the 2003–2020 period. For this study, we assume that daily accumulated precipitation allows for a reasonable description of potential triggering conditions for the geohydrological hazards covered by the collected records (e.g., Leonarduzzi and Molnar, 2020; Schlögl et al., 2021). The metrics adopted for event detection are chosen to consider three different aspects of extreme conditions: the spatial extent of intensities, the local intensity peak, and the magnitude, i.e., the combination of anomalies and their spatial extent. For each method, the corresponding metric is calculated for all days in the 2003–2020 period and used to sort the dates, from highest to lowest, as follows:
-
In the first detection approach, hereafter “areal mean”, dates in the 2003–2020 period are sorted based on their corresponding accumulated daily precipitation over all grid cells in the study region divided by the total number of grid cells (i.e., representing the average daily precipitation intensity per grid cell):
where Rt is the sum at daily time step t of the precipitation values over all N grid cells of the study area divided by the total number of grid cells. This method is expected to mostly detect large-scale meteorological events leading to high precipitation amounts over a substantial portion of the study region.
-
The second approach, hereafter “local p99”, uses the 99th percentile of precipitation values over all grid cells for each day:
where is the 99th percentile at daily time step t calculated over the precipitation values rt of all the N grid cells in the study area. The local p99 approach is expected to capture precipitation events of high intensity including those occurring on more localized sub-portions of the study area.
-
The third approach, hereafter called “anomaly”, measures the relative exceptionality of events based on the daily precipitation deviations from average conditions. While the two previous methods sort the daily fields based on their absolute precipitation values, the anomaly-based method assigns a higher ranking to dates with precipitation significantly exceeding the mean climatic conditions associated to that specific period of the year. More specifically, by applying a similar procedure as described in previous studies (e.g., Insua-Costa et al., 2021; Ramos et al., 2014), daily precipitation time series for each grid cell i are converted into standardized anomalies:
where for each grid cell i, at,i is the precipitation standardized anomaly at daily time step t, rt,i is the daily precipitation value, μi is the daily precipitation mean over all wet-day values (daily precipitation > 1 mm) in a 21 d window centred on the corresponding calendar day and spanning the 2003–2020 period, while σ is its standard deviation. For each day, the percentage of the grid cells with and the mean value of these anomalies are computed. Dates are sorted based on the total magnitude which is calculated by multiplying the domain fraction with anomalies above the threshold by the average value of these anomalies.
The three methods are independently applied to all climate datasets, yielding three sorted lists of dates per dataset. Each list is used to derive and compare the most extreme precipitation days over 2003–2020 and to link them to hazard occurrences. Specifically, the most extreme precipitation events over 2003–2020 are selected by considering the top 5 % of the sorted precipitation dates obtained for each dataset-method combination. The top 5 % of the analysed period is considered a suitable trade-off between obtaining a sufficiently large event sample to derive robust results and focusing on the most extreme precipitation events. A 5 d window centred on each date is also considered to temporally define events to ensure that subsequent dates belonging to the same extreme episode are not considered as single events. Moreover, if the central day of a 5 d window falls within the 5 d window of another topmost date, only the 5 d window centred on the highest-ranking date is kept as an event in the final set. To ensure that the size of the final selection is the same for all combinations of methods and datasets, for each discarded event another date from the sorted full list is added to the topmost set until the target size of the selection is achieved (i.e., a total of 330 events in the case of top 5 % of days in the 2003–2020 period).
2.3.2 Spatiotemporal comparison between identified precipitation extreme and hazard records
To evaluate the causal relationship between identified extreme precipitation events and ensuing geohydrological hazards within the specified region, the top 5 % precipitation event occurrences are cross-referenced both temporally and spatially with the hazard records collected from the national datasets (Sect. 2.2.2). The intersection is evaluated within the 5 d window centred around the precipitation event date (see Sect. 2.3.1) in all analyses, as this temporal buffer of ±2 d is expected to compensate for potential uncertainties in the reported hazard dates and possible shifts in the precipitation events recorded by different climate products.
Temporal coherence
The temporal coherence in the occurrence of extreme precipitation events and hazards in the region is first analysed without considering the spatial consistency between registered hazard location and precipitation intensity. Pearson correlation coefficients between daily time series of extreme statistics and hazard records over the study area are first analysed for each dataset. A contingency table is then used to compare the dates over 2003–2020 with at least two geohydrological records, hereafter called hazardous dates, with the 5 d windows centred on topmost precipitation extreme occurrences. The total number of hazardous dates is 405, corresponding to ∼ 6 % of the whole period and to 40 % of days with at least one hazard occurrence. The application of a lower threshold for filtering the series of hazard occurrences before assessing the temporal coherence with extreme precipitation dates is intended to account for the relatively high frequency of days with only one hazard observation which might hide the actual probability of an extreme precipitation event to be linked to hazard occurrences (see Sect. 3.1). For each method and dataset, the hit rate is calculated as the proportion of hazardous dates falling within an extreme precipitation event (5 d window), which can be interpreted as the probability for a hazardous episode of being properly captured by the top 5 % most extreme precipitation events. The contingency table is also used to estimate the conditional probability of recording a hazardous date given an extreme precipitation event and to assess the level of association between hazard occurrences and precipitation extremes. The statistical significance of the association is tested through a Pearson Chi-Square test considering a significance level of 0.05. The sensitivity to different thresholds for selecting hazardous dates for the intersection analysis as well as the variability of the hit rate per hazard type, i.e., flood or mass movement, and per season, i.e., differentiating between winter and summer half years, are also investigated.
Spatial coherence
The evaluation of temporal association is complemented by the assessment of spatial coherence between hazard records and intensity distribution over the region for the corresponding precipitation event. In fact, hazards might have been recorded within a 5 d window surrounding an extreme precipitation event, but in locations where minimal or no precipitation was reported. The spatial consistency is assessed for each method-dataset combination, by analysing precipitation values on extreme days in the spatial proximity to individual hazards in terms of both relative intensity classes and absolute values.
-
Relative intensity classes: For each extreme date in the selected set of 330 events, the gridded values of daily precipitation over the study domain are categorized into six classes defined by quantile ranges calculated over all grid points. The quantile ranges considered are: [0–0.1), [0.1–0.3), [0.3–0.5), [0.5–0.7), [0.7–0.9) and [0.9–1]. For each precipitation event, all hazard records within its 5 d centred window are searched and their spatial distribution over the corresponding precipitation classes is analysed. To avoid double-counting, the hazard records included in overlapping 5 d windows of subsequent events are considered only for the event with the highest ranking. To allow for a certain degree of uncertainty in the location of both hazard records and precipitation peaks, each hazard occurrence is associated with the maximum precipitation class included in a 10 km radius around its location. The total portions of hazards across precipitation classes for all top 5 % events for each dataset-method combination are subsequently derived and compared. The 10 km searching radius corresponds to a different number of surrounding grid points depending on the spatial resolution of the dataset considered, thus, it is meant to account for the different grid spacing of analysed products. This spatial range is compatible with the coarsest grid spacing of ERA5-Land, while it is expected to be representative of the mean interstation distance determining the effectively resolved scales in observation-based products.
-
Absolute precipitation intensities: For each hazard record included in the 5 d windows centred on the top 5 % most extreme precipitation events given by the various dataset-method combinations, the daily precipitation maximum in a 10 km radius around the hazard on the central date of the 5 d window is extracted and used to analyse the spatial relationship between hazard location and precipitation intensity. As for the previous analysis, hazard records falling in overlapping 5 d windows are considered once and attributed to the precipitation event with the highest ranking.
3.1 Precipitation statistics from meteorological datasets and hazard record overview
By comparing the 99th percentile (p99) of daily precipitation totals for each month calculated over all daily values in the period 2003–2020 and over the entire domain (Fig. 2), the four datasets show a consistent seasonal pattern, although with notable differences in monthly magnitudes. In all products, lower extreme precipitation values are reported in late winter and early spring, followed by a steady increase toward late summer and autumn. Peak p99 values generally occur between September and December, indicating a maximum in extreme precipitation intensity during autumn. While CERRA-Land shows its primary maximum in August and a secondary peak in October, all other datasets reach their maxima in November, especially INCA. INCA exhibits the highest p99 values throughout the year, whereas ERA5-Land shows the lowest extremes. SPARTACUS-TST and CERRA-Land fall between these two datasets, with CERRA-Land generally closer to INCA, particularly during late summer and autumn. If 2003–2020 mean monthly precipitation totals, as spatial averages, are compared (Fig. S2), the seasonality is still consistent among datasets although with some differences in value distributions with respect to p99. CERRA-Land is slightly wetter in summer than the other datasets, while ERA5-Land is wetter in winter and spring, with winter precipitation up to 40 % higher than in the other products. This wet bias of ERA5-Land is consistent with findings from previous intercomparison studies (e.g., Dalla Torre et al., 2024; Monteiro and Morin, 2023). It is noteworthy that the greatest monthly totals of ERA5-Land correspond to the lowest p99 values, suggesting that precipitation intensities in ERA5-Land are generally more spread and smoothed over the domain than in the other products. In contrast, lower monthly totals in INCA turn into the highest p99 in all months.
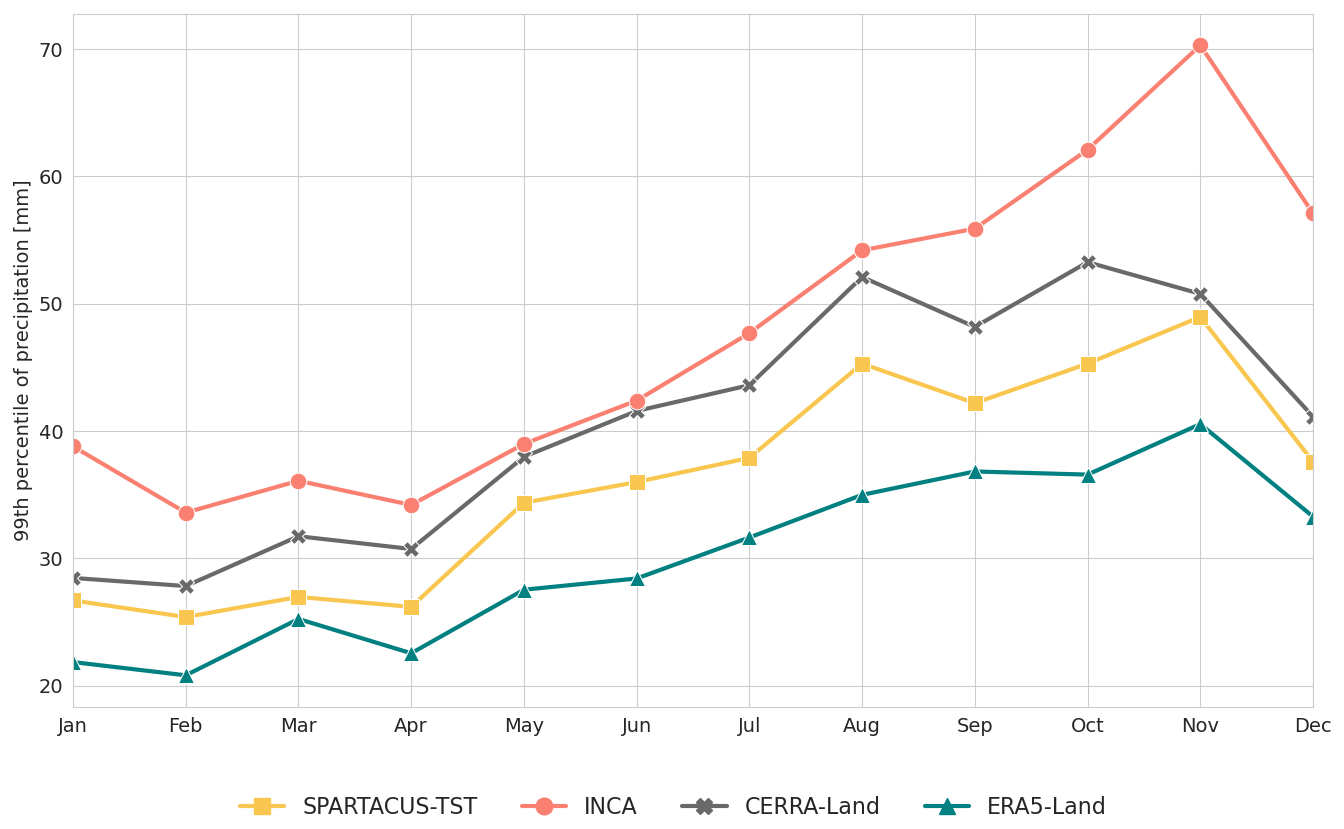
Figure 2Monthly 99th percentile of daily precipitation calculated over all days in 2003–2020 and all grid points in the study area for the four gridded datasets considered.
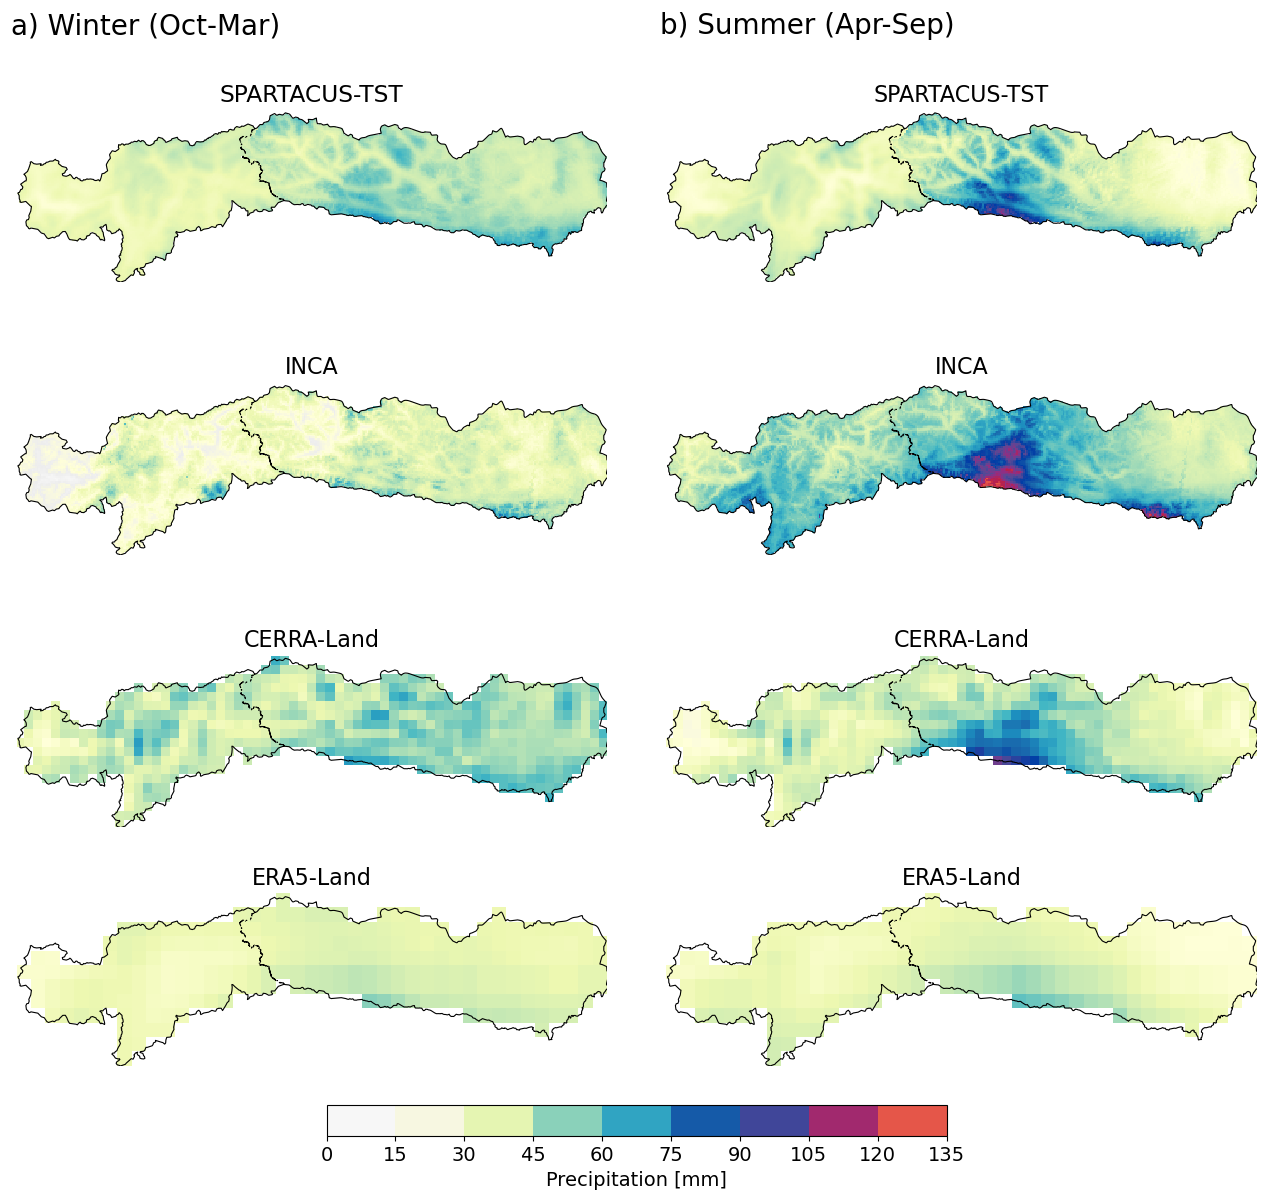
Figure 3(a) Winter half year (October to March) and (b) summer half year (April to September) 99th percentile of daily precipitation totals over 2003–2020 in the study area based on SPARTACUS-TST, INCA, CERRA-Land and ERA5-Land. Each dataset is shown in its native spatial resolution.
The spatial distribution of the 99th percentile of daily precipitation totals for winter (October–March; Fig. 3a) and summer (April–September, Fig. 3b) over the period 2003–2020 shows that all datasets exhibit weak spatial gradients in winter with relatively moderate p99 values. During summer, p99 values are substantially higher and display stronger spatial variability, especially over the central and eastern Alps in East Tyrol and Carinthia, reflecting the increased influence of convective precipitation. INCA shows the highest 1 d extreme precipitation totals and the finest spatial structures, whereas SPARTACUS-TST reproduces similar but smoother patterns. CERRA-Land captures a similar spatial distribution of summer extremes but underestimates local maxima, while ERA5-Land yields the lowest p99 values and the most spatially homogeneous fields in both seasons, indicating a strong attenuation of precipitation extremes. Both effects are attributable to the coarser spatial resolution of the datasets.
The temporal variability over 2003–2020 of daily precipitation statistics, specifically the areal mean, the local 99th percentile and the local maximum of daily precipitation values, averaged on a yearly basis, shows largely comparable patterns among the meteorological datasets (Fig. 4), but again with differences in terms of magnitudes, depending on the statistic.
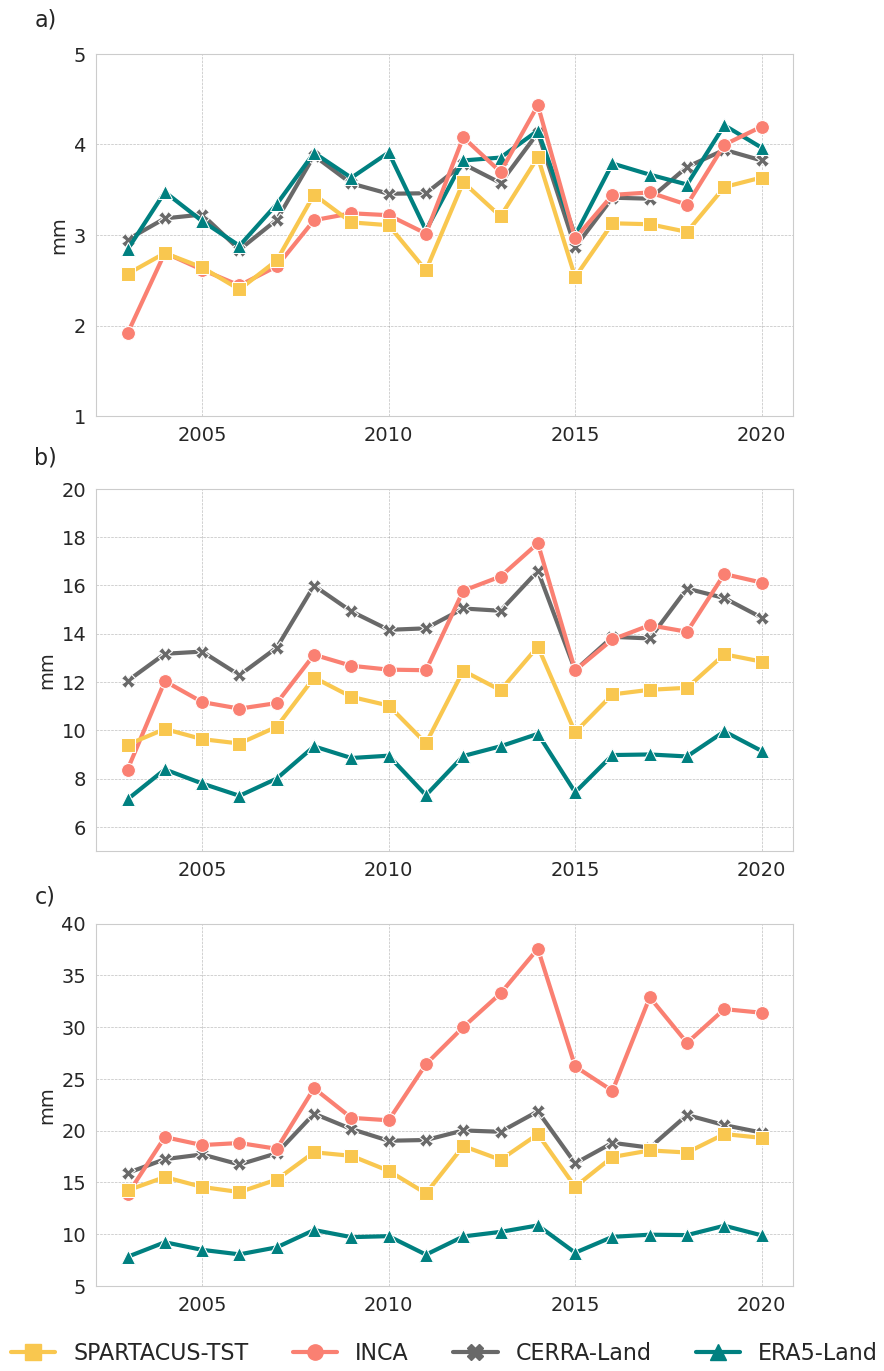
Figure 4Annual time series 2003–2020 of the yearly averages of daily precipitation statistics: (a) areal mean, (b) local 99th percentile and (c) local maxima over the study region.
Even though an increasing tendency is apparent for all statistics and all products, although less evident for ERA5-Land, the relatively short length of the analysed series (18 years) does not allow for a robust evaluation of temporal trends. INCA is characterized by the most pronounced increases in all statistics, especially in daily precipitation maxima, with a sudden increase in the values after 2011. Such behaviour is probably due to a discontinuity in the time series after 2011 caused by changes in the modelling frameworks and by the inclusion of new radar data used for the product development. If the longer period (1985–2020) commonly covered by SPARTACUS-TST, ERA5-Land and CERRA-Land datasets is considered, the increasing pattern of extreme statistics is confirmed in almost all cases with a weaker signal for CERRA-Land (Fig. S3). Linear trends over 1985–2020 are positive and statistically significant for SPARTACUS-TST and ERA5-Land for all statistics, while CERRA-Land exhibits statistically significant increases in the local daily precipitation maximum only. The different temporal variability of CERRA-Land statics can be ascribed to the adopted assimilation system of rain gauge observations, which, in case of changing observation networks over time, can introduce biases in the climatology, thus affecting the overall trend accuracy. ERA5-Land and SPARTACUS-TST are expected to provide more reliable temporal trend estimates as they are less influenced by the temporal variability of in situ data coverage since the first does not directly assimilate observations and the latter is based on a stable set of historical observations.
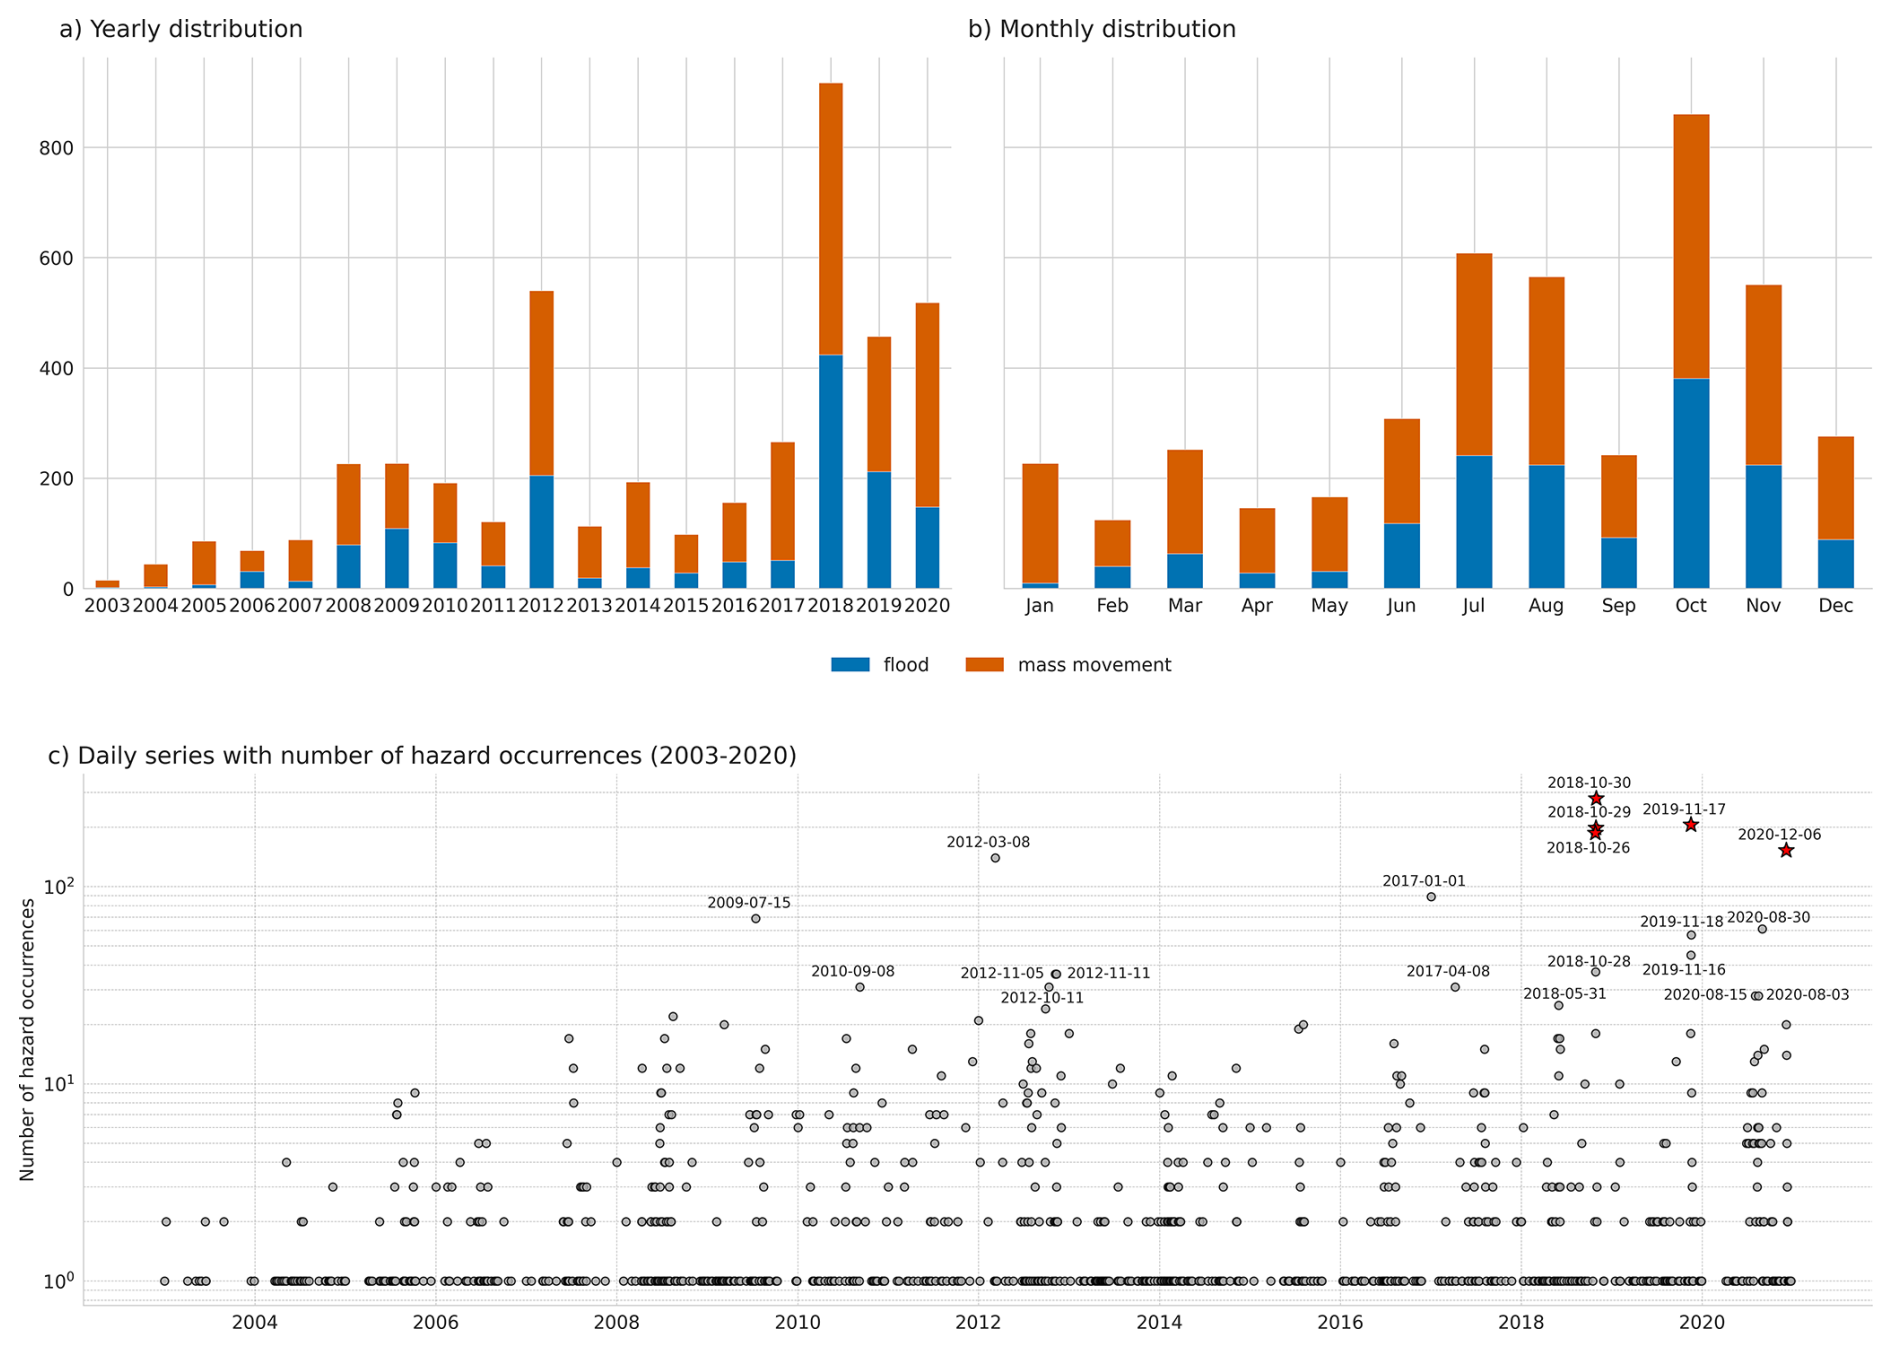
Figure 5Overview of documented geohydrological events in the study area (South Tyrol, East Tyrol and Carinthia) over 2003–2020 sourced from the IFFI and ED30 databases for South Tyrol and the WLV and GEORIOS databases for Austria: (a) annual and (b) monthly distributions of observed events distinguishing between flood and mass movement types and (c) 2003–2020 daily series of the total number of events recorded in the study area (y axis in logarithmic scale) where stars indicate the five episodes with the highest number of hazard occurrences in the series.
An increasing tendency is also noticeable in the annual total of hazard records, for both floods and mass movements, over the study area from 2003 to 2020 (Fig. 5a). Similarly to precipitation statistics, a robust trend analysis cannot be performed over the 18-year series whose temporal variability is expected to be influenced by multiple factors. The increase might be partly related to a rise in the frequency of possibly damaging events, but also to the increasingly more systematic field collection of hazard observations. While in the past only hazard occurrences with a magnitude above a certain threshold were recorded, a greater number of hazard events started to be reported in more recent years (Heiser et al., 2019).
On a monthly level, the number of hazard records, for both flood and mass movement categories, peaks in October and secondarily in the summer months (Fig. 5b). It is noteworthy that the frequency of mass movement records is generally higher than that of flood records in all months. Figure 5c shows the full daily time series of hazard occurrences over 2003–2020. A total of 4325 hazard events were recorded over 1012 distinct days, resulting in a probability of observing a day with at least one recorded hazard of around 15.4 %, or about one hazard event per week. The high frequency of days recording at least one geohydrological hazard underlines the orographic complexity of the study area driving very local processes. On the contrary, there are dates with an exceptional number of hazard records and most of them can be associated with known meteorological past extreme events. For instance, the highest number of hazard occurrences (280) was observed on 30 October 2018, during the Vaia storm. Similarly, the second highest number of geohydrological events (206) was recorded on the central day of an intense storm occurring from 16 to 19 November 2019. The relatively high probability of days with at least one geohydrological hazard occurrence in the study region and the concentration of records in correspondence to a few extreme meteorological episodes is already considered in the methods applied to analyse the temporal consistency between hazard dates and extreme precipitation events (see Sect. 2.3.2). Moreover, the daily time series of hazard records exhibits a significant autocorrelation until a lag of 4 d (Fig. S4a), which motivates the use of a buffer of ±2 d around the precipitation extreme dates for associating them to hazard occurrences.
3.2 Characteristics of extreme precipitation events
The top 5 % of the most extreme precipitation events (corresponding to a total of 330 d) identified for each dataset-method combination over 2003–2020 was first investigated to compare temporal patterns and assess seasonal dependencies.
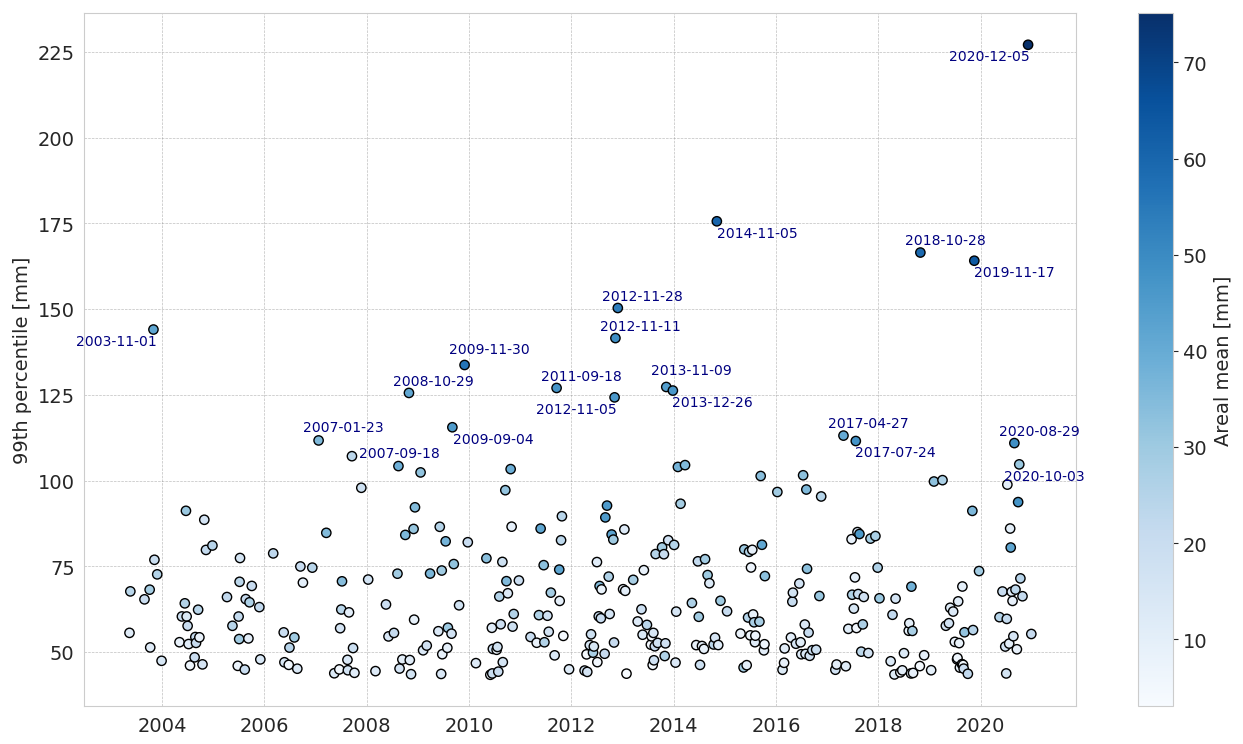
Figure 6The topmost 5 % of precipitation events detected using INCA and the local p99 method in the study area. For each event the local 99th percentile (local p99 approach) used for ranking is shown on the y-axis. The colour of the point reports the areal mean precipitation (areal mean approach) for the same day, and the label refers to the date of the detected event.
The detection method being equal, the percentage of events commonly detected based on different datasets ranges from 71 % to 88 %, independently of their ranking (Table S2). Extreme precipitation dates detected through the areal mean approach show in general the greatest agreement across datasets, which might be explained by the fact that the areal-aggregated metric is less sensitive to the spatial details resolved by the datasets than statistics, like the local 99th percentile, calculated at the grid-cell level. In particular, the largest agreement in selected dates based on areal mean is obtained between SPARTACUS-TST and INCA and between SPARTACUS-TST and CERRA-Land, while, for all methods, ERA5-Land reports the lowest portion of extreme precipitation dates in common with the other datasets. For each dataset, the agreement in events detected across the three metrics is about 80 % or higher in all cases (Table S3). However, commonly detected dates are not necessarily ranked equally across datasets or methods. While major precipitation events recorded in the study area in recent years, such as the winter storm of December 2020 (https://watchers.news/2020/12/07/major-winter-storm-snow-alps-december-2020/, last access: April 2026), the Vaia storm in October 2018 (https://watchers.news/2018/11/04/severe-storms-italy-november-2018/, last access: April 2026) and the severe precipitation episodes in November 2019 (https://weather.com/news/news/2019-11-18-austria-mudslides-flooding-avalanches-kill-one-person, last access: April 2026) and 2014 (https://watchers.news/2014/11/07/southcentral-europe-hit-by-severe-weather-heavy-rain-and-floods/, last access: April 2026), are detected by all datasets and methods, they are differently ranked. In general, only half of the 20 top-ranking dates are in common across the selections obtained by different datasets and methods. As an example, the distribution of the top 5 % most extreme events detected by INCA based on the local p99 is shown in Fig. 6 together with the corresponding areal mean of daily precipitation values on the same dates.
Table 1Relative distribution over seasons of the top 5 % most extreme precipitation events (330 events) over 2003–2020 detected by each dataset and method. For each dataset-method combination the relative portion (%) of total events falling in spring (March to May. MAM), summer (June to August, JJA), autumn (September to November, SON) and winter (December to February, DJF) is reported.
The seasonal distribution of the top 5 % most extreme events is similar among all datasets considered (Table 1). Table 1 reports the results for the three-month seasons instead of half-year seasons to provide a more detailed overview of the distribution of precipitation extremes over the year. Most detected events by the areal mean and the local p99 occurred in summer and autumn. This is generally consistent with the mean distribution of monthly precipitation totals peaking in summer months and secondarily in autumn (Fig. S2), while the seasonality of extreme daily intensities (Fig. 2) suggests that events in autumn, although less frequent than in summer, might be associated with higher rainfall amounts. The seasonal distinction of events identified by the anomaly method is less pronounced, which is expected since anomalies are standardized with the annual cycle. Consequently, a larger portion of extreme episodes occurs in spring compared to the other methods. Such spring events are probably not exceptional in terms of absolute intensities but rather deviations from average conditions, which are usually drier than in summer and autumn.
While summer is mainly dominated by convective phenomena causing intense rainfall that is concentrated in space and time, autumn is more prone to intense and persistent precipitation associated with low-pressure systems and affecting wider areas. The highest portion of detected summer events is reported by INCA and CERRA-Land using the local p99, which might suggest the greater ability of these datasets and method to represent locally intense precipitation events, particularly common during the summer period. These findings are also reflected in the distribution of the 330 topmost events per year between 2003 and 2020 by distinguishing summer half year (from April to September) and winter half year (from October to March) (Fig. S5). In all cases, the 5 % topmost events occurred mainly in the summer half year. No dataset indicates a visible trend in the annual number of detected precipitation extremes except for INCA, which exhibits a significant increase in the annual counts of summer events. This is consistent with the temporal pattern of its extreme precipitation statistics as discussed in Sect. 3.1 (Fig. 4). Notably, event occurrences and their temporal patterns are generally consistent among all datasets, regardless of the detection method applied. For instance, all products show a similar peak of summer events in 2016 and a drop of winter events in 2011 and 2015.
3.3 Spatiotemporal comparison of precipitation extremes with hazard records
3.3.1 Temporal association of precipitation and hazard occurrences
To obtain a preliminary assessment of how the extreme precipitation events at regional scale relate with observed hazard occurrences, the series of daily counts of hazard records from 2003 to 2020 over the study area was correlated with the daily precipitation statistics used in the detection methods, i.e., areal precipitation mean, local 99th percentile and event magnitude (see Sect. 2.3.1). By calculating the cross-correlation between the daily counts of observed hazards and the daily precipitation statistics, in all cases the correlation is the highest at lag + 1 d and remains significant until lag ± 3 d (Fig. S4b, for SPARTACUS-TST only). This finding further supports the choice of considering a temporal buffer for evaluating the association of hazard records to a specific precipitation event. However, the correlation coefficient with daily hazard records remains relatively low and varies little among the precipitation statistics considered. By considering the lag + 1 d, the correlation between precipitation statistics and hazards is ∼ 0.16 for ERA5-Land and up to 0.23 for the areal precipitation mean from SPARTACUS-TST (Table S4). Correlation slightly increases if daily series are filtered by retaining only dates with at least two hazard records. It is interesting to note that correlation with hazards is generally higher for precipitation statistics from SPARTACUS-TST and INCA.
Table 2Hit rate (%) as the portion of hazardous dates (i.e., dates with at least two hazard records) occurring in coincidence of an extreme precipitation event (within a 5 d window centred on the extreme precipitation days) for each combination of datasets and methods and by considering the whole year, summer (April to September) and winter (October to March) half years. The top 5 % most extreme precipitation dates over 2003–2020 are considered (330 events).
The hit rate, defined as the proportion of the 405 dates with at least two recorded hazards (i.e., the hazardous dates) coincident with the top 5 % extreme precipitation events, is higher for the local p99 method, especially for INCA and, secondarily for SPARTACUS-TST, exceeding 55 % in summer half-year and on a yearly basis (Table 2). Relatively higher hit rates (above 50 %) are reported by both 1 km datasets for the anomaly method in summer half year and secondarily on a yearly basis. Both reanalyses report lower hit rates in almost all cases. The lowest values are exhibited by ERA5-Land regardless of the method for identifying precipitation extremes, except for winter half year. In winter, when the number of hazardous occurrences is the lowest (136), the performance of methods and datasets in detecting hazard-related precipitation events is less distinguishable. In all cases, the level of association between extreme precipitation occurrences and hazard episodes turns out to be significant (p-value < 0.05). The conditional probability of recording a hazardous date given the extreme precipitation event ranges between 55 % (ERA5-Land) and 69 % (INCA), which is about 9 to 11-fold higher than the expected probability assuming hazard occurrence being independent of the happening of precipitation extremes.
The same findings are obtained if a smaller sample of the hazard series is considered, e.g., by selecting only dates with at least five hazard records, which correspond to ∼ 2.4 % of the full series (160 dates). Hit rates are the highest for the local p99 method for all datasets. For all methods the greatest hit rates are reached for INCA while the lowest correspondence with hazards is shown by ERA5-Land.
Hit rates calculated for mass movements and floods separately are still higher for the set of precipitation extreme events defined by the local p99 and for INCA in almost all cases (Tables S5 and S6). Hit rates of floods are generally greater in the winter half-year, with values exceeding 60 %, while the results for mass movements are more aligned with the ones exhibited by the full hazard set. It is important to note that the number of hazardous dates over 2003–2020 due to mass movements (307) is double that the one due to floods (150).
3.3.2 Spatial association of precipitation and hazard occurrences
Figure 7 shows one event that is detected in all dataset-method combinations and corresponds to the highest number of hazard records over the analysed period (Fig. 5c). The Vaia storm hit the study region from 27 to 31 October 2018 and, based on in situ observations, led to exceptional accumulated precipitation over the 5 d of the event, exceeding 650 mm at Plöckenpass/Passo di Monte Croce Carnico in the Carnic Alps (Hübl and Beck, 2019). The location of peak precipitation intensity is clearly depicted in all four datasets, but with spatial differences. INCA and SPARTACUS-TST agree on the spatial structure of the precipitation field with lower amounts in the east of Carinthia and the highest precipitation totals in the western part of Carinthia and north of South Tyrol. However, INCA reports in general more detailed spatial gradients and higher precipitation amounts than SPARTACUS-TST, especially in South Tyrol. In contrast, the precipitation field presented by CERRA-Land differs significantly. Although it accurately captures the location of the precipitation minima and maxima over the domain, the spatial patterns appear noisier than the observational datasets. ERA5-Land, on the other hand, displays a much smoother precipitation field, with values below 300 mm throughout the domain due to its coarser spatial resolution, and presents a different spatial precipitation pattern in South Tyrol compared to the other datasets. Regarding the registered hazards, it is noteworthy that most events occur in the areas with the highest precipitation values, particularly in the south of Carinthia, although some events are recorded in areas where the gridded datasets report lower precipitation amounts.
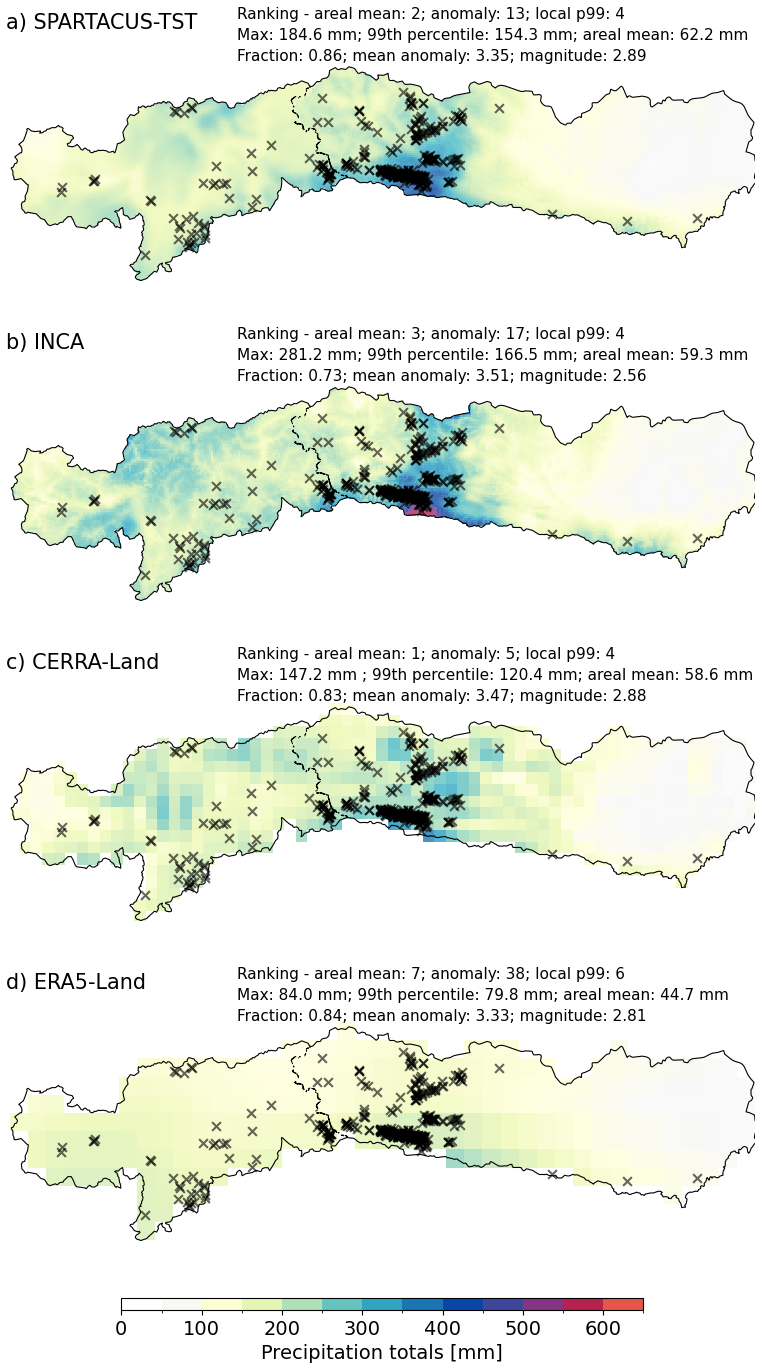
Figure 7Cumulative precipitation during the Vaia storm, spanning from 27 to 31 October 2018, based on (a) SPARTACUS-TST, (b) INCA, (c) CERRA-Land, and (d) ERA5-Land. All hazard records in the study region that occurred in that 5 d interval are indicated by crosses. Metric values correspond to the single day of the identified Vaia event, which may vary by ±2 d across different datasets and methods.
Table 3Distribution over different precipitation classes of hazards recorded in a 5 d window of the top 330 (5 %) events identified for each dataset-method combination. Precipitation classes are defined as quantile ranges of the gridded precipitation values over the study area. Values are reported as percentages of the total hazard records included in the 5 d windows of the top 5 % precipitation events (in the last column). For each method, the dataset reporting the highest total number of hazards included in the top 5 % precipitation events is in bold.
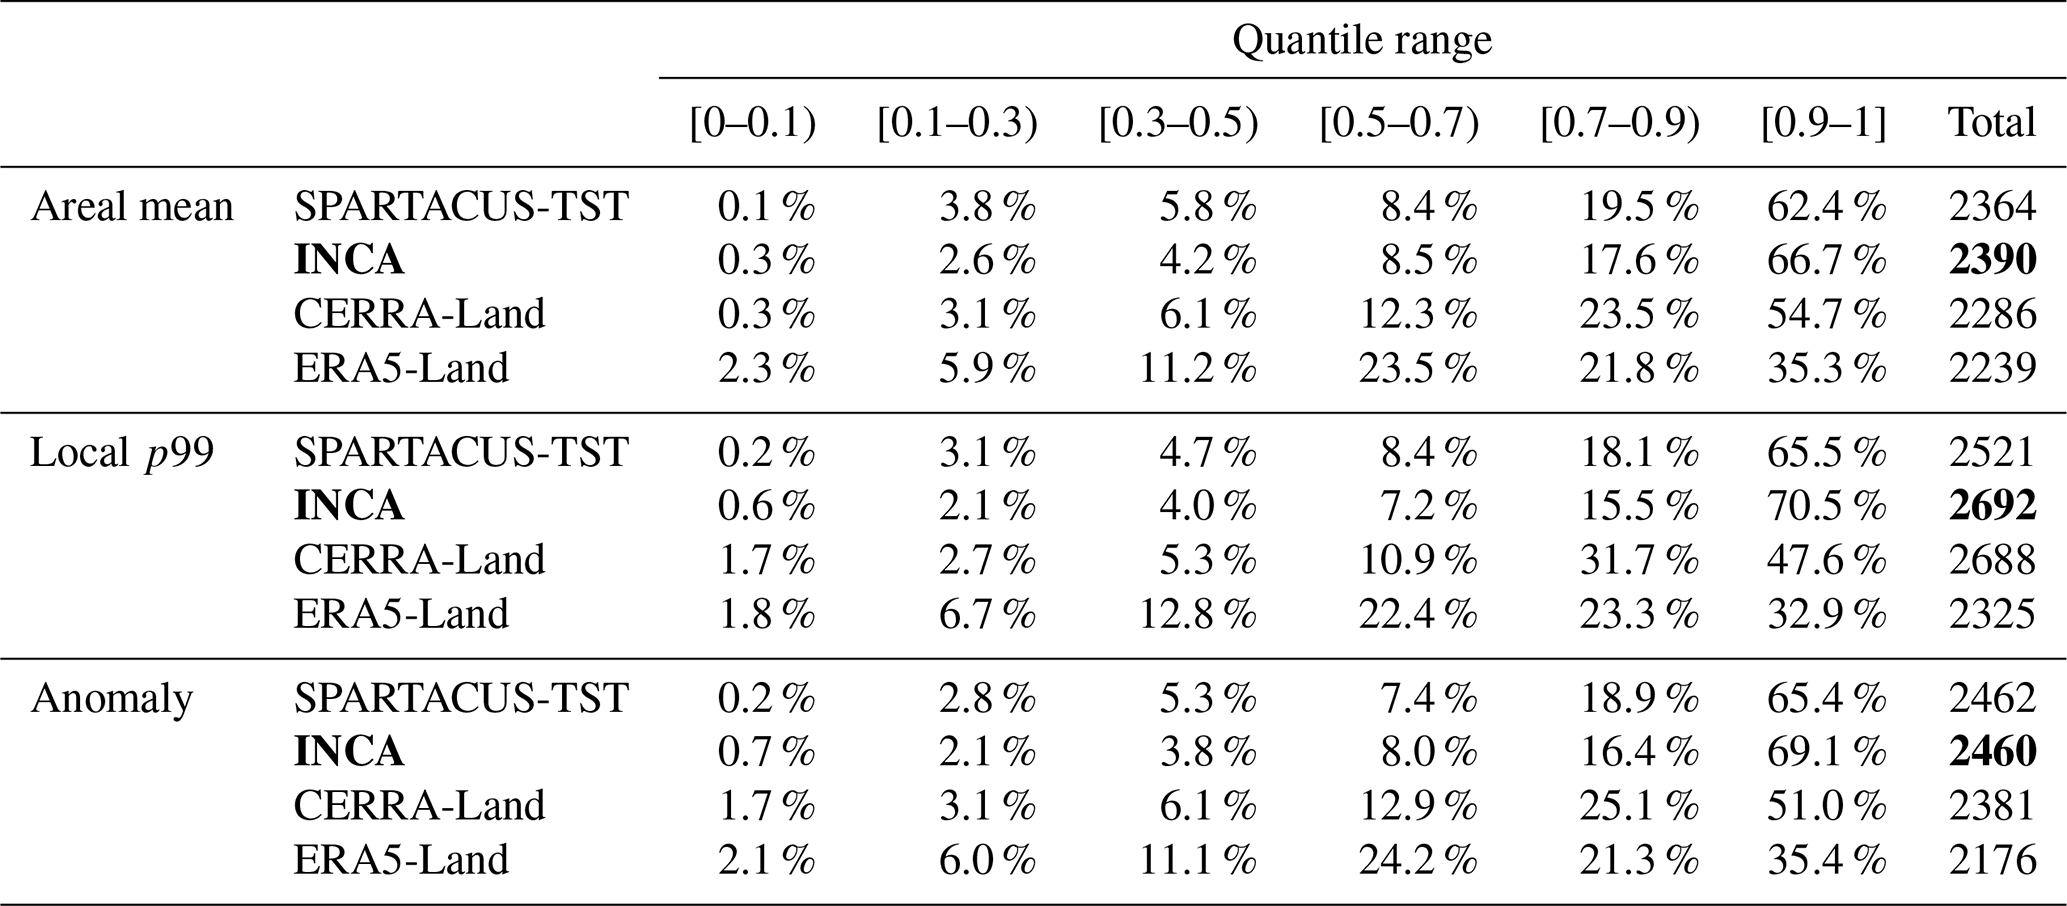
The distribution of recorded hazards with respect to the precipitation intensity, represented by different percentile classes, highlights the main differences among the climate datasets (Table 3). The portion of hazard records included in the top 5 % precipitation events consistently increases with precipitation classes for all dataset-method combinations. For SPARTACUS-TST and INCA the highest portions of hazard occurrences (more than 60 %) are spatially associated with the greatest precipitation intensities over the study area on the event dates, especially for INCA. On the contrary, for reanalyses, especially ERA5-Land, hazard records are more evenly distributed across precipitation classes. While CERRA-Land fields still capture about 75 % of hazard records in the two upper classes, more than 20 % of hazards recorded during the top 5 % precipitation events of ERA5-Land fall in areas where corresponding precipitation is below the median value over the domain. The total number of hazard records collected within the 5 d windows of each extreme precipitation event is also counted and considered for the comparison. The 330 extreme precipitation events defined by the local p99 method intersect the highest overall number of hazards across all datasets. In particular, precipitation events derived from INCA account for the greatest number of total intersected hazards (about 2700). Similar results are obtained if the Vaia storm (from 27 to 31 October 2018), for which the largest number of hazards (about 530) was recorded, is excluded from the event samples.
By directly comparing the intensity of daily precipitation at the locations of hazard occurrences, the different features of the gridded precipitation datasets emerge even more clearly. Figure 8 illustrates the distribution of daily precipitation totals in the vicinity of hazards based on the events detected by the local p99 approach. The intensities associated to hazard locations recorded on the same date are here represented as median to prevent the resulting distribution from being influenced by the different spatial granularity of the climate datasets, with multiple hazards falling on the same grid cell in the coarser products. For the reanalysis datasets, ERA5-Land shows precipitation intensities near hazards reaching up to 83 mm, with a median of approximately 22 mm and a 75th percentile around 33 mm. In comparison, CERRA-Land reports values as high as 116 mm, with the median and 75th percentile at roughly 36 and 48 mm, respectively. The high-resolution observational products show higher precipitation intensities. Precipitation distributions for SPARTACUS-TST and INCA are comparable in terms of median (42 and 46 mm, respectively) and maximum values (181 and 202 mm, respectively), with slightly higher intensities for INCA. Moreover, INCA reports a higher value of the 75th percentile (74 mm) and shows a slightly different shape of the two distributions, with more values in the upper tail. This is also confirmed if the intensities in the proximity of hazards for SPARTACUS-TST and INCA are compared without taking the median over the hazard records on the same date (Fig. S6). INCA captures the highest local intensities, up to 287 mm, while SPARTACUS-TST reaches 252 mm only. Similar results are observed for the precipitation events derived from the other two methods used in the study (Fig. S7). The complete statistics of precipitation values in the vicinity of hazards for all extreme metrics is reported in Table S7.
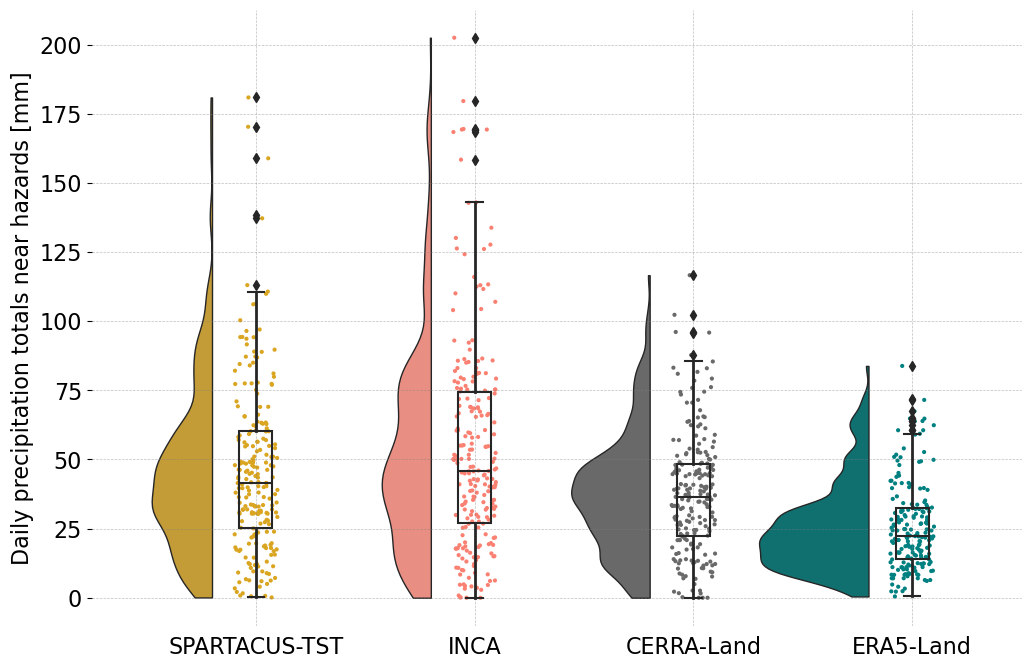
Figure 8Distribution of daily precipitation intensities in the spatial proximity of recorded hazards for all datasets based on the most intense 5 % precipitation events (330 events) detected by the local p99 method. The precipitation intensities are extracted from the closest grid point to each hazard location and the median values over all hazard records on the same date are displayed.
Similar conclusions can be derived also from the seasonal comparison. The summer half year distribution closely resembles the annual pattern for all methods, suggesting that precipitation extremes from April to September leading to geohydrological processes substantially influence yearly precipitation statistics. In contrast, precipitation intensities spanned by the winter half year distributions are more moderate across all datasets, but still with the highest intensities captured by the 1 km datasets (Fig. S8).
By comparing three different statistical methods for extreme event detection and four precipitation datasets, this study aims to provide insights into the suitability and limits of different climate products to identify and characterize hazardous precipitation events in the period 2003–2020 over a transboundary and orographically complex area in the eastern European Alps. Moreover, recognizing the similarities and complementarities of different statistical definitions for daily extremes can enhance the understanding of how methodological choices influence extreme event detection. In particular, the main aim of the presented study was to evaluate the most suitable combinations of statistical definitions and gridded datasets for the identification of the most extreme precipitation dates over the recent decades, the characterization of their spatiotemporal features and the intersection with geohydrological hazard records. It is important to note that the findings rely solely on daily precipitation totals used as proxy for triggering effects of geohydrological hazards, described by recorded event days from hazard catalogues. In-depth analyses of sub-daily precipitation extremes and pre-moistening conditions are not explicitly included and will be addressed in future studies.
4.1 Temporal patterns of precipitation statistics and hazard records
One of the most noteworthy considerations is that all combinations of datasets and statistical definitions yield similar temporal patterns and seasonality of precipitation events. In particular, the most intense events over 2003–2020 are consistently detected across all approaches and datasets. This consistency highlights that, despite differences in the type and spatial resolution of climate datasets and the specific extreme metric considered for event detection, the most intense precipitation extremes, especially when a substantial portion of the study domain is affected, are detected. However, there also emerged different precipitation features between the datasets. The 1 km observation-based products show more highly resolved spatial patterns of precipitation intensities over the domain compared to the coarser reanalyses. The smoothed precipitation gradients reported by ERA5-Land make it the least suitable choice to derive accurate precipitation intensities and local peaks. Interestingly, it exhibits the weakest annual precipitation cycle over the region. In contrast, CERRA-Land, which shares the same ERA5 boundary conditions, shows the strongest cycle, highlighting summer precipitation totals. This underscores the effective contribution of the higher-resolution modelling scheme and the assimilation system of in situ observations underlying CERRA-Land. Extreme precipitation statistics from the different datasets show similar temporal variability over 2003–2020, mostly suggesting increasing tendencies. However, products derived from operational forecasting, such as INCA, are more affected by changes in the production systems over time and might be less suitable for climatological analyses.
The comparable rise observed in the number of geohydrological hazards recorded over 2003–2020, although the record length is not enough for a quantitative trend analysis, may suggest a contribution from increasing precipitation extremes to a greater probability of hazardous phenomena resulting in more recorded hazards. However, this temporal pattern may also partly reflect the improvements of hazard data collection over time and the influence of other non-climatic factors. As hazards occurring near infrastructure and causing damage are generally more likely to be recorded, also the increased exposure from expanding infrastructure can play a role. Future studies are needed to rigorously investigate the links between extreme precipitation patterns and increase of hazard records with exposure and vulnerability included as essential variables to get a more comprehensive explanation of the temporal trends of hazard records (Schlögl et al., 2021).
4.2 Methodological choices for comparing extreme precipitation events and hazard records
The study highlights how a preliminary evaluation of precipitation data and hazard records is needed to understand the most suitable criteria to apply for their analysis and intersection. Potential mismatches in the temporal alignment of daily precipitation records among different precipitation datasets and with hazard databases made it necessary to use a multi-day window to distinguish precipitation events and analyse the temporal intersections with hazard occurrences. The choice of a 5 d window was supported by autocorrelation and cross-correlation analyses. The high frequency of hazard occurrences over the study period, i.e., the relatively high frequency of days with at least one hazard record, also required filtering out the hazardous dates to retain events characterized by a higher number of recorded hazards to calculate the hit rate for extreme precipitation dates. This stems from the consideration that isolated “background” hazards are less likely to be triggered by extreme precipitation and rather be connected to other processes and environmental conditions on different time scales. The threshold used for filtering the hazardous dates in the hit rate analysis (at least two recorded hazards over the domain) is justified by the need of not reducing too much the sample size while retaining the most relevant subset of hazard records. The same criterion was also applied for the selection of the most extreme precipitation events, by limiting the test sample to 330 dates, which correspond to about the top 5 % of the entire precipitation series. Future studies should include a more systematic evaluation of how the choice of the threshold influences the explained portion of all hazardous dates (Spiekermann et al., 2023). This is expected to provide valuable insights for refining the evaluation and the definition of precipitation extremes.
Next to precipitation datasets and detection methods, another factor affecting the results is related to the set of hazard records used which covers only some flood (e.g., flooding, surface runoff, fluvial sediment transport) and gravitational mass movement types (e.g., debris flows, mud flows, translational/rotational slides) of weather-induced hazards. The decision to combine the two categories of processes, which differ in spatial scale, temporal dynamics, and triggering mechanisms, was intended to extend the applicability of the results regarding the ability of precipitation datasets and metrics – not designed for a specific hazard type – to describe extreme events with general hazard potential. However, this might partially reduce the match between detected precipitation extremes and hazard records and improvements in the spatial and temporal correspondence can be expected if analyses are refined focusing on specific hazard processes adopting hazard-related extreme precipitation statistics. Apart from the hazard categories considered, hazards are generally recorded when roads and infrastructure incur damage and necessitate intervention. Therefore, the database of hazard observations might be negatively biased in remote and unsettled areas, thus underrepresenting all actual hazardous mass movements and flooding processes occurred in the region and potentially triggered by extreme precipitation episodes (Schlögel et al., 2020; Steger et al., 2024).
4.3 Temporal coherence between extreme precipitation events and hazard occurrences
Results show a moderate temporal relationship between extreme precipitation and hazard occurrence, which is independent from the considered combination of datasets and detection methods. While it is found that extreme precipitation days increase significantly the likelihood of recorded hazards in all cases, the relatively low correlation and the hit rate, i.e., the portion of hazardous dates intersected by the top 5 % precipitation extremes, around 50 % clearly indicates that other factors besides the daily precipitation intensity contribute to explain the occurrence of geohydrological phenomena. Nevertheless, the comparison of hit rates obtained by each combination of datasets and methods reveals non-negligible differences in the detection skill, even though it is not possible to uniquely conclude which combined choice performs best for identifying hazardous episodes. Regardless of the method used, coarser spatial resolution products, such as ERA5-Land, show a limited ability to identify precipitation extremes likely associated with hazard occurrences. In contrast, the higher resolution products INCA and SPARTACUS-TST, incorporating observations, offer a higher accuracy in detecting extreme precipitation events with hazard potential. In particular, INCA benefits from the integration of rain gauges, radar estimates and model simulations to capture precipitation extremes. It exhibits the highest detection rates, especially in summer, likely due to the greater ability of the multi-source fields to resolve small-scale, high-intensity events with respect to the use of the solely station observations as in SPARTACUS-TST.
Among methods, extremes detected based on a high percentile calculated over the whole study domain were found to be more linked to hazardous dates than those identified through approaches more influenced by the extent of precipitation events. This is likely because the percentile-based method accounts for very intense but more localized precipitation events which are ranked lower by the other areal-based methods but still recorded local hazards. This suggests that local events can trigger disproportionally more hazard phenomena than precipitation events with a larger extent but lower intensities. Areal-based definitions might be preferable when the aim is to detect the main events driven by large-scale precipitation systems, especially for wider regions characterized by more heterogeneous climatic regimes and topographic patterns, e.g., the whole Alpine region. Sensitivity tests evaluating the performance of extreme definitions based on the targeted spatial scale and types of precipitation phenomena could provide a more detailed guidance for better tailoring hazard and impact-oriented studies.
The portion of hazardous dates over 2003–2020 included in the top-ranking precipitation extremes around 50 % may suggest that 1 d precipitation intensity is not enough to explain hazard occurrence or the 1 d precipitation metric definitions do not fully capture the essence of events with hazard potential. Some hazard records might be better correlated to hourly peak rainfall intensities which are expected to be underrepresented by only considering the daily sums. However, since all considered products, except INCA, provide daily precipitation fields only, such an intercomparison evaluation using sub-daily intensities is not possible and will be addressed in future studies. Moreover, other factors, including preparatory conditions, influence some hazardous geohydrological processes, even with low-intensity precipitation events. Such factors include for instance temperature anomalies, freeze-thaw cycles, soil moistening and snowmelt, which are not considered here (Banfi and De Michele, 2024). This might partly explain the reduced hit rates for the winter period, where the intensity of precipitation phenomena over the study domain is generally lower than in summer. The results of the hit rate analysis for floods and mass movements, separately, do not show clear or consistent differences. This lack of distinct differences may be explained by the fact that the applied metrics based on daily precipitation intensities are not fully suitable for representing the specific underlying processes of these hazards, and other important controlling variables and scales, such as antecedent soil moisture, play a role.
4.4 Spatial coherence between extreme precipitation intensities and hazard records
The performance of datasets in the temporal alignment of hazardous dates with precipitation extremes turned out to be less comparable when considering the spatial relationships between precipitation intensities and hazard locations. In particular, the representation of precipitation intensities in the spatial proximity of hazard occurrences was found to be primarily dataset-dependent rather than method-dependent. Although hazards are predominantly found in areas with higher precipitation intensities in all cases, spatially refined datasets outperform reanalyses in locating precipitation peaks in the proximity of hazards and in resolving precipitation intensities. SPARTACUS-TST and, especially, INCA exhibit a pronounced upper tail in the distribution of precipitation intensities close to hazard locations, confirming the greater suitability of INCA to support the detection of small-scale, high-resolution events. However, INCA might still underestimate some events in South Tyrol as this region is only partially covered by in situ stations included in the product, and radar observations may additionally be affected by shielding effects in this part of the domain. In contrast, both reanalyses show a similar underrepresentation of spatial precipitation patterns with respect to hazard locations and a similar underestimation of local 1 d precipitation amounts, regardless of their different spatial resolution. This finding suggests that the choice of the product is key when the analysis requires a detailed description of precipitation intensities and small-scale aspects of triggering phenomena to be linked with hazard occurrences. In the example of the Vaia storm (Fig. 7), the smoother precipitation fields of ERA5-Land are clearly the least suitable to analyse and model the spatial correspondences between precipitation intensities and hazard occurrences. However, the study confirms the findings from other inter-comparison studies focusing on the characterization of precipitation extremes and it expands them by integrating a comparison with hazard records. For instance, Hu and Franzke (2020) showed for Germany that the best representation of the magnitude of 1 d precipitation extremes is achieved by the high-resolution national observation dataset. In contrast, both ERA5 and the regional COSMO-REA6 reanalyses, lacking a proper assimilation scheme of precipitation data, report the least accurate statistics, especially regarding the timing of extremes. It is important to note that national products, while offering better performances, might limit the possibility of conducting cross-boundary studies as they are generally available only at a national or sub-national level and might be affected by local biases due to the uneven spatial distribution of underlying station observations.
Although performances in describing spatial and temporal matches with hazards are lower than for km-scale regional datasets, CERRA-Land remains a valid alternative for deriving extreme precipitation events with hazard potential in the transboundary area. Consistently with Wood et al. (2025), the 5.5 km grid and the integration of rain gauge data in the precipitation assimilation system contribute to the greater ability in representing precipitation extremes and their timing with respect to the coarser ERA5-Land reanalysis, where in situ observations are not directly used. Including other cross-boundary precipitation products in the evaluation and performing it over wider Alpine domains can help to further expand the findings, understand the suitability of large-scale datasets for assessing extremes and hence, provide important implications for transboundary studies. In particular, km-scale reanalyses, which explicitly resolve convective processes, are expected to offer significant added value for hazard and impact-oriented analyses in large-scale studies (Cavalleri et al., 2024), although these products are generally available at a national scale and/or for short periods only (e.g., Frank et al., 2020; Giordani et al., 2023). Similarly, including large-scale gauge-adjusted radar precipitation products, such as EURADCLIM for Europe (Overeem et al., 2023), in the inter-comparison might provide additional insight into their applicability for conducting cross-border analyses of weather extremes and natural hazards.
This study provides a first assessment of methods and meteorological datasets for the detection and characterization of extreme precipitation events possibly triggering geohydrological hazards in a transboundary Alpine area covering South Tyrol in Italy and East Tyrol-Carinthia in Austria.
The precipitation events defined by a percentile-based approach considering local intensities (local p99) coincide with more dates registering hazards, especially when the method is applied to the 1 km multi-source INCA dataset. The temporal match with hazards worsens for the 1 km observation-based SPARTACUS-TST product and further for the 5 km CERRA-Land reanalysis, while it is substantially weaker for the 9 km ERA5-Land reanalysis, independently from the method used. INCA and, secondarily, SPARTACUS-TST resolve the highest rainfall intensities in the proximity of hazard occurrences, especially for events defined by the local p99 approach. CERRA-Land still benefits from the higher spatial resolution and rain gauge data assimilation compared to ERA5-Land, but it lags behind the 1 km regional datasets, which remain the primary choices when applications rely on an accurate description of precipitation fields (e.g., in hydrological modelling, flood forecasting or water resource monitoring).
The findings suggest that relatively simple statistics, when combined with sufficiently accurate precipitation products, can help a first identification of extremes with hazard potential in a complex Alpine region. While the spatial match between hazard locations and rainfall intensities is relatively high for all tested products, the temporal match remains limited, also for the km-scale products, and can be improved by more in-depth evaluations of specific hazard processes and tailored extreme definitions. Adapting extreme detection metrics to sub-daily precipitation data can further help to overcome some of the shortcomings which emerged in the spatiotemporal comparison with hazard records. The scope of the analysis and the rainfall type of interest, e.g., large-scale phenomena or small convective episodes, remain key to define the optimal choice of the precipitation dataset and the extreme event detection metrics to use, individually or in combination, to compile event portfolios supporting risk analyses in cross-boundary regions. This and similar studies can also inform methodological choices for the development of impact-based early warning systems and the implementation of risk-oriented applications in cross-boundary regions.
All codes are available upon request from the authors.
The top 5 % extreme precipitation events identified by each method-dataset combination and the full daily precipitation statistics over 2003–2020 from all climate datasets are available from Crespi et al. (2025): https://doi.org/10.5281/zenodo.15756269. Hazard records are available upon request.
The supplement related to this article is available online at https://doi.org/10.5194/nhess-26-1975-2026-supplement.
AC and EK collected the data, performed the analyses and discussed the results. LS, KH and MP contributed to methodology and result discussion. MP provided support for the analyses and supervision. AC and EK wrote and revised the paper with contributions from all co-authors.
The contact author has declared that none of the authors has any competing interests.
Publisher's note: Copernicus Publications remains neutral with regard to jurisdictional claims made in the text, published maps, institutional affiliations, or any other geographical representation in this paper. The authors bear the ultimate responsibility for providing appropriate place names. Views expressed in the text are those of the authors and do not necessarily reflect the views of the publisher.
The regional agencies (Austrian Service for Torrent and Avalanche Control, the Autonomous Province of Bolzano and the Geological Survey of Austria) and the Italian National Institute for Environmental Protection and Research managing the hazard databases used in this study are acknowledged. The Copernicus Climate Change Service providing access to the reanalysis data is acknowledged. The TransAlp project (“Transboundary Storm Risk and Impact Assessment in Alpine regions”) financed by the European Commission under the program UCPM-2020-PP-AG (Prevention and Preparedness Projects for Civil Protection and Marine Pollution) is acknowledged for initiating the discussion leading to this work. The authors also thank the two reviewers for their valuable feedback, which improved the quality and clarity of this manuscript.
This project has received funding from the European Union Civil Protection Mechanism (Directorate General for European Civil Protection and Humanitarian Aid Operations) under the grant agreement number 101004843.
This paper was edited by Christos Giannaros and reviewed by Raul R. Wood and one anonymous referee.
Alexander, L. V., Bador, M., Roca, R., Contractor, S., Donat, M. G., and Nguyen, P. L.: Intercomparison of annual precipitation indices and extremes over global land areas from in situ, space-based and reanalysis products, Environ. Res. Lett., 15, 055002, https://doi.org/10.1088/1748-9326/ab79e2, 2020.
Araújo, J. R., Ramos, A. M., Soares, P. M. M., Melo, R., Oliveira, S. C., and Trigo, R. M.: Impact of extreme rainfall events on landslide activity in Portugal under climate change scenarios, Landslides, 19, 2279–2293, https://doi.org/10.1007/s10346-022-01895-7, 2022.
ASTAT: Il Censimento permanente della popolazione in provincia di Bolzano – 2023, https://astat.provinz.bz.it/de/publikationen/demografische-daten-2023 (last access: April 2026), 2023.
ASTAT: Andamento turistico – 2022/23, https://astat.provinz.bz.it/it/pubblicazioni/andamento-turistico-anno-turistico-2022-23 (last access: April 2026), 2024.
Bandhauer, M., Isotta, F., Lakatos, M., Lussana, C., Båserud, L., Izsák, B., Szentes, O., Tveito, O. E., and Frei, C.: Evaluation of daily precipitation analyses in E-OBS (v19.0e) and ERA5 by comparison to regional high-resolution datasets in European regions, Int. J. Climatol., 42, 727–747, https://doi.org/10.1002/joc.7269, 2022.
Banfi, F. and De Michele, C.: Temporal Clustering of Precipitation Driving Landslides Over the Italian Territory, Earths Future, 12, e2023EF003885, https://doi.org/10.1029/2023EF003885, 2024.
Barlow, M., Gutowski, W. J., Gyakum, J. R., Katz, R. W., Lim, Y.-K., Schumacher, R. S., Wehner, M. F., Agel, L., Bosilovich, M., Collow, A., Gershunov, A., Grotjahn, R., Leung, R., Milrad, S., and Min, S.-K.: North American extreme precipitation events and related large-scale meteorological patterns: a review of statistical methods, dynamics, modeling, and trends, Clim. Dyn., 53, 6835–6875, https://doi.org/10.1007/s00382-019-04958-z, 2019.
Barton, Y., Rivoire, P., Koh, J., Ali S., M., Kopp, J., and Martius, O.: On the temporal clustering of European extreme precipitation events and its relationship to persistent and transient large-scale atmospheric drivers, Weather and Climate Extremes, 38, 100518, https://doi.org/10.1016/j.wace.2022.100518, 2022.
Borga, M., Stoffel, M., Marchi, L., Marra, F., and Jakob, M.: Hydrogeomorphic response to extreme rainfall in headwater systems: Flash floods and debris flows, J. Hydrol., 518, 194–205, https://doi.org/10.1016/j.jhydrol.2014.05.022, 2014.
Bouwer, L. M.: Observed and Projected Impacts from Extreme Weather Events: Implications for Loss and Damage, in: Loss and Damage from Climate Change, edited by: Mechler, R., Bouwer, L. M., Schinko, T., Surminski, S., and Linnerooth-Bayer, J., Springer International Publishing, Cham, 63–82, https://doi.org/10.1007/978-3-319-72026-5_3, 2019.
Breugem, A. J., Wesseling, J. G., Oostindie, K., and Ritsema, C. J.: Meteorological aspects of heavy precipitation in relation to floods – An overview, Earth-Sci. Rev., 204, 103171, https://doi.org/10.1016/j.earscirev.2020.103171, 2020.
Bundesministerium für Nachhaltigkeit und Tourismus: Richtlinie für den Wildbach- und Lawinenkataster (WLK-RL), BMNT, https://www.bmluk.gv.at/themen/wald/wald-und-naturgefahren/wildbach--und-lawinenverbauung/richtliniensammlung/wlk_rl.html (last access: April 2026), 2018.
Cavalleri, F., Lussana, C., Viterbo, F., Brunetti, M., Bonanno, R., Manara, V., Lacavalla, M., Sperati, S., Raffa, M., Capecchi, V., Cesari, D., Giordani, A., Cerenzia, I. M. L., and Maugeri, M.: Multi-scale assessment of high-resolution reanalysis precipitation fields over Italy, Atmos. Res., 312, 107734, https://doi.org/10.1016/j.atmosres.2024.107734, 2024.
Crespi, A., Matiu, M., Bertoldi, G., Petitta, M., and Zebisch, M.: A high-resolution gridded dataset of daily temperature and precipitation records (1980–2018) for Trentino-South Tyrol (north-eastern Italian Alps), Earth Syst. Sci. Data, 13, 2801–2818, https://doi.org/10.5194/essd-13-2801-2021, 2021.
Crespi, A., Enigl, K., Lehner, S., Haslinger, K., and Pittore, M.: 1-day precipitation extremes over 2003–2020 in a transboundary Alpine area (Eastern Alps) identified by different methods and climate datasets (Version v1), Zenodo [data set], https://doi.org/10.5281/zenodo.15756269, 2025.
Dalla Torre, D., Di Marco, N., Menapace, A., Avesani, D., Righetti, M., and Majone, B.: Suitability of ERA5-Land reanalysis dataset for hydrological modelling in the Alpine region, J. Hydrol.-Regional Studies, 52, 101718, https://doi.org/10.1016/j.ejrh.2024.101718, 2024.
Frank, C. W., Pospichal, B., Wahl, S., Keller, J. D., Hense, A., and Crewell, S.: The added value of high resolution regional reanalyses for wind power applications, Renew. Energ., 148, 1094–1109, https://doi.org/10.1016/j.renene.2019.09.138, 2020.
Ghaemi, E., Foelsche, U., Kann, A., and Fuchsberger, J.: Evaluation of Integrated Nowcasting through Comprehensive Analysis (INCA) precipitation analysis using a dense rain-gauge network in southeastern Austria, Hydrol. Earth Syst. Sci., 25, 4335–4356, https://doi.org/10.5194/hess-25-4335-2021, 2021.
Giordani, A., Cerenzia, I. M. L., Paccagnella, T., and Di Sabatino, S.: SPHERA, a new convection-permitting regional reanalysis over Italy: Improving the description of heavy rainfall, Q. J. Roy. Meteor. Soc., 149, 781–808, https://doi.org/10.1002/qj.4428, 2023.
Gonzalez, F. C. G., Cavacanti, M. D. C. R., Nahas Ribeiro, W., Mendonça, M. B. D., and Haddad, A. N.: A systematic review on rainfall thresholds for landslides occurrence, Heliyon, 10, e23247, https://doi.org/10.1016/j.heliyon.2023.e23247, 2024.
Haiden, T., Kann, A., Wittmann, C., Pistotnik, G., Bica, B., and Gruber, C.: The Integrated Nowcasting through Comprehensive Analysis (INCA) System and Its Validation over the Eastern Alpine Region, Weather Forecast., 26, 166–183, https://doi.org/10.1175/2010WAF2222451.1, 2011.
Heiser, M., Hübl, J., and Scheidl, C.: Completeness analyses of the Austrian torrential event catalog, Landslides, 16, 2115–2126, https://doi.org/10.1007/s10346-019-01218-3, 2019.
Hiebl, J. and Frei, C.: Daily precipitation grids for Austria since 1961 – development and evaluation of a spatial dataset for hydroclimatic monitoring and modelling, Theor. Appl. Climatol., 132, 327–345, https://doi.org/10.1007/s00704-017-2093-x, 2018.
Hofstätter, M., Chimani, B., Lexer, A., and Blöschl, G.: A new classification scheme of European cyclone tracks with relevance to precipitation, Water Resour. Res., 52, 7086–7104, https://doi.org/10.1002/2016WR019146, 2016.
Hu, G. and Franzke, C. L. E.: Evaluation of Daily Precipitation Extremes in Reanalysis and Gridded Observation-Based Data Sets Over Germany, Geophys. Res. Lett., 47, e2020GL089624, https://doi.org/10.1029/2020GL089624, 2020.
Hübl, J. and Beck, M.: Ereignisdokumentation 2018, IAN Report 202, https://boku.ac.at/lawi/alpe/forschung/reports-forschungsberichte (last access: April 2026), 2019.
Insua-Costa, D., Lemus-Cánovas, M., Miguez-Macho, G., and Llasat, M. C.: Climatology and ranking of hazardous precipitation events in the western Mediterranean area, Atmos. Res., 255, 105521, https://doi.org/10.1016/j.atmosres.2021.105521, 2021.
Kirschbaum, D., Stanley, T., and Zhou, Y.: Spatial and temporal analysis of a global landslide catalog, Geomorphology, 249, 4–15, https://doi.org/10.1016/j.geomorph.2015.03.016, 2015.
Kotlarski, S., Gobiet, A., Morin, S., Olefs, M., Rajczak, J., and Samacoïts, R.: 21st Century alpine climate change, Clim. Dyn., 60, 65–86, https://doi.org/10.1007/s00382-022-06303-3, 2023.
Leonarduzzi, E. and Molnar, P.: Deriving rainfall thresholds for landsliding at the regional scale: daily and hourly resolutions, normalisation, and antecedent rainfall, Nat. Hazards Earth Syst. Sci., 20, 2905–2919, https://doi.org/10.5194/nhess-20-2905-2020, 2020.
Liu, Y., Chen, J., Pan, T., Liu, Y., Zhang, Y., Ge, Q., Ciais, P., and Penuelas, J.: Global Socioeconomic Risk of Precipitation Extremes Under Climate Change, Earths Future, 8, e2019EF001331, https://doi.org/10.1029/2019EF001331, 2020.
Llasat, M. C., Llasat-Botija, M., Petrucci, O., Pasqua, A. A., Rosselló, J., Vinet, F., and Boissier, L.: Towards a database on societal impact of Mediterranean floods within the framework of the HYMEX project, Nat. Hazards Earth Syst. Sci., 13, 1337–1350, https://doi.org/10.5194/nhess-13-1337-2013, 2013.
McPhillips, L. E., Chang, H., Chester, M. V., Depietri, Y., Friedman, E., Grimm, N. B., Kominoski, J. S., McPhearson, T., Méndez-Lázaro, P., Rosi, E. J., and Shafiei Shiva, J.: Defining Extreme Events: A Cross-Disciplinary Review, Earths Future, 6, 441–455, https://doi.org/10.1002/2017EF000686, 2018.
Meyer, J., Neuper, M., Mathias, L., Zehe, E., and Pfister, L.: Atmospheric conditions favouring extreme precipitation and flash floods in temperate regions of Europe, Hydrol. Earth Syst. Sci., 26, 6163–6183, https://doi.org/10.5194/hess-26-6163-2022, 2022.
Millán-Arancibia, C. and Lavado-Casimiro, W.: Rainfall thresholds estimation for shallow landslides in Peru from gridded daily data, Nat. Hazards Earth Syst. Sci., 23, 1191–1206, https://doi.org/10.5194/nhess-23-1191-2023, 2023.
Monteiro, D. and Morin, S.: Multi-decadal analysis of past winter temperature, precipitation and snow cover data in the European Alps from reanalyses, climate models and observational datasets, The Cryosphere, 17, 3617–3660, https://doi.org/10.5194/tc-17-3617-2023, 2023.
Munich RE: Natural disasters in 2023, Munich RE NatCatSERVICE, https://www.munichre.com/en/company/media-relations/media-information-and-corporate-news/media-information/2024/natural-disaster-figures-2023.html (last access: April 2026), 2024.
Muñoz-Sabater, J., Dutra, E., Agustí-Panareda, A., Albergel, C., Arduini, G., Balsamo, G., Boussetta, S., Choulga, M., Harrigan, S., Hersbach, H., Martens, B., Miralles, D. G., Piles, M., Rodríguez-Fernández, N. J., Zsoter, E., Buontempo, C., and Thépaut, J.-N.: ERA5-Land: a state-of-the-art global reanalysis dataset for land applications, Earth Syst. Sci. Data, 13, 4349–4383, https://doi.org/10.5194/essd-13-4349-2021, 2021.
Overeem, A., van den Besselaar, E., van der Schrier, G., Meirink, J. F., van der Plas, E., and Leijnse, H.: EURADCLIM: the European climatological high-resolution gauge-adjusted radar precipitation dataset, Earth Syst. Sci. Data, 15, 1441–1464, https://doi.org/10.5194/essd-15-1441-2023, 2023.
Peruccacci, S., Brunetti, M. T., Gariano, S. L., Melillo, M., Rossi, M., and Guzzetti, F.: Rainfall thresholds for possible landslide occurrence in Italy, Geomorphology, 290, 39–57, https://doi.org/10.1016/j.geomorph.2017.03.031, 2017.
Pinto, J. G., Ulbrich, S., Parodi, A., Rudari, R., Boni, G., and Ulbrich, U.: Identification and ranking of extraordinary rainfall events over Northwest Italy: The role of Atlantic moisture, J. Geophys. Res.-Atmos., 118, 2085–2097, https://doi.org/10.1002/jgrd.50179, 2013.
Pittore, M., Campalani, P., Renner, K., Plörer, M., and Tagliavini, F.: Border-independent multi-functional, multi-hazard exposure modelling in Alpine regions, Nat. Hazards, 119, 837–858, https://doi.org/10.1007/s11069-023-06134-3, 2023.
Price, C.: Will a drier climate result in more lightning?, Atmos. Res., 91, 479–484, https://doi.org/10.1016/j.atmosres.2008.05.016, 2009.
Raj, S., Shukla, R., Trigo, R. M., Merz, B., Rathinasamy, M., Ramos, A. M., and Agarwal, A.: Ranking and characterization of precipitation extremes for the past 113 years for Indian western Himalayas, Int. J. Climatol., 41, 6602–6615, https://doi.org/10.1002/joc.7215, 2021.
Rajczak, J. and Schär, C.: Projections of Future Precipitation Extremes Over Europe: A Multimodel Assessment of Climate Simulations, J. Geophys. Res.-Atmos., 122, https://doi.org/10.1002/2017JD027176, 2017.
Ramos, A. M., Trigo, R. M., and Liberato, M. L. R.: A ranking of high-resolution daily precipitation extreme events for the Iberian Peninsula, Atmos. Sci. Lett., 15, 328–334, https://doi.org/10.1002/asl2.507, 2014.
Reder, A., Raffa, M., Padulano, R., Rianna, G., and Mercogliano, P.: Characterizing extreme values of precipitation at very high resolution: An experiment over twenty European cities, Weather and Climate Extremes, 35, 100407, https://doi.org/10.1016/j.wace.2022.100407, 2022.
Ridal, M., Bazile, E., Le Moigne, P., Randriamampianina, R., Schimanke, S., Andrae, U., Berggren, L., Brousseau, P., Dahlgren, P., Edvinsson, L., El-Said, A., Glinton, M., Hagelin, S., Hopsch, S., Isaksson, L., Medeiros, P., Olsson, E., Unden, P., and Wang, Z. Q.: CERRA, the Copernicus European Regional Reanalysis system, Q. J. Roy. Meteor. Soc., qj.4764, https://doi.org/10.1002/qj.4764, 2024.
Schlögl, M., Fuchs, S., Scheidl, C., and Heiser, M.: Trends in torrential flooding in the Austrian Alps: A combination of climate change, exposure dynamics, and mitigation measures, Climate Risk Management, 32, 100294, https://doi.org/10.1016/j.crm.2021.100294, 2021.
Schlögel, R., Kofler, C., Gariano, S. L., Van Campenhout, J., and Plummer, S.: Changes in climate patterns and their association to natural hazard distribution in South Tyrol (Eastern Italian Alps), Sci. Rep., 10, 5022, https://doi.org/10.1038/s41598-020-61615-w, 2020.
Soci, C., Bazile, E., Besson, F., and Landelius, T.: High-resolution precipitation re-analysis system for climatological purposes, Tellus A, 68, 29879, https://doi.org/10.3402/tellusa.v68.29879, 2016.
Spiekermann, R. I., Van Zadelhoff, F., Schindler, J., Smith, H., Phillips, C., and Schwarz, M.: Comparing physical and statistical landslide susceptibility models at the scale of individual trees, Geomorphology, 440, 108870, https://doi.org/10.1016/j.geomorph.2023.108870, 2023.
Statistik Austria: Tourismus in Österreich 2023 – Ergebnisse der Beherbergungsstatistik, ISBN 978-3-903393-91-2, https://www.statistik.at/fileadmin/user_upload/Tourismus_2023_barr.pdf (last access: April 2026), 2024.
Steger, S., Moreno, M., Crespi, A., Zellner, P. J., Gariano, S. L., Brunetti, M. T., Melillo, M., Peruccacci, S., Marra, F., Kohrs, R., Goetz, J., Mair, V., and Pittore, M.: Deciphering seasonal effects of triggering and preparatory precipitation for improved shallow landslide prediction using generalized additive mixed models, Nat. Hazards Earth Syst. Sci., 23, 1483–1506, https://doi.org/10.5194/nhess-23-1483-2023, 2023.
Steger, S., Moreno, M., Crespi, A., Luigi Gariano, S., Teresa Brunetti, M., Melillo, M., Peruccacci, S., Marra, F., De Vugt, L., Zieher, T., Rutzinger, M., Mair, V., and Pittore, M.: Adopting the margin of stability for space–time landslide prediction – A data-driven approach for generating spatial dynamic thresholds, Geosci. Front., 15, 101822, https://doi.org/10.1016/j.gsf.2024.101822, 2024.
Stoffel, M., Tiranti, D., and Huggel, C.: Climate change impacts on mass movements – Case studies from the European Alps, Sci. Total Environ., 493, 1255–1266, https://doi.org/10.1016/j.scitotenv.2014.02.102, 2014.
Tilch, N., Kociu, A., Haberler, A., Melzner, S., Schwarz, L., and Lotter, M.: The Data Management System GEORIOS of the Geological Survey of Austria (GBA), 2011.
Vaz, T., Zêzere, J. L., Pereira, S., Oliveira, S. C., Garcia, R. A. C., and Quaresma, I.: Regional rainfall thresholds for landslide occurrence using a centenary database, Nat. Hazards Earth Syst. Sci., 18, 1037–1054, https://doi.org/10.5194/nhess-18-1037-2018, 2018.
Wilhelm, B., Rapuc, W., Amann, B., Anselmetti, F. S., Arnaud, F., Blanchet, J., Brauer, A., Czymzik, M., Giguet-Covex, C., Gilli, A., Glur, L., Grosjean, M., Irmler, R., Nicolle, M., Sabatier, P., Swierczynski, T., and Wirth, S. B.: Impact of warmer climate periods on flood hazard in the European Alps, Nat. Geosci., 15, 118–123, https://doi.org/10.1038/s41561-021-00878-y, 2022.
Wood, R. R., Janzing, J., van Hamel, A., Götte, J., Schumacher, D. L., and Brunner, M. I.: Comparison of high-resolution climate reanalysis datasets for hydro-climatic impact studies, Hydrol. Earth Syst. Sci., 29, 4153–4178, https://doi.org/10.5194/hess-29-4153-2025, 2025.
Zscheischler, J., Martius, O., Westra, S., Bevacqua, E., Raymond, C., Horton, R. M., Van Den Hurk, B., AghaKouchak, A., Jézéquel, A., Mahecha, M. D., Maraun, D., Ramos, A. M., Ridder, N. N., Thiery, W., and Vignotto, E.: A typology of compound weather and climate events, Nat. Rev. Earth Environ., 1, 333–347, https://doi.org/10.1038/s43017-020-0060-z, 2020.