the Creative Commons Attribution 4.0 License.
the Creative Commons Attribution 4.0 License.
 | 31 Mar 2026
Development and validation of an Early Warning System for coastal flooding operating on a Mediterranean urban beach
Antonis Chatzipavlis
Daniele Trogu
Andrea Ruju
Juan Montes
Antonio Usai
Marco Porta
Giovanni Coco
Sandro De Muro
Paolo Ciavola
This study presents an Early Warning System (EWS) for coastal flooding that integrates wind, wave, and sea level forecasts which are validated using in situ records. The system employs the SWAN spectral wave model to simulate nearshore hydrodynamics while an empirical approach is used to assess Total Watel Level (TWL) exceedances over a user-defined morphological threshold, deriving from repeated topographic surveys. This approach utilizes widely used empirical methods for wave run-up estimation and makes use of the most effective one after calibration. The performance of the EWS is assessed through seven monitored surge events of varying magnitude and hydrodynamic conditions, demonstrating strong agreement between projected TWL exceedances over predefined morphological thresholds, particularly under high-energy wave conditions. Minor discrepancies are noted during events with marginal TWL exceedances over short durations. Results underline the system's potential as a valuable tool for coastal hazard assessment and risk management, with future improvements focusing on appropriate updates of the beach morphology and the integration of suitable numerical techniques and machine learning algorithms.
- Article
(22059 KB) - Full-text XML
- BibTeX
- EndNote


Coastal floods are considered among the most hazardous natural disasters, posing significant threats to coastal communities, affecting livelihood and crucial socio-economic aspects. Millions of people living in coastal areas are currently at risk of displacement due to flooding, leading to the loss of livelihoods, social disruption and economic costs related to relocation (Neumann et al., 2015a; Hauer et al., 2016; Nicholls et al., 2019; IPCC, 2023). At the same time, critical infrastructure assets such as ports, coastal airports, power plants and transportation networks are particularly vulnerable, with potential repair and adaptation costs running into tens of billions of dollars annually (Neumann et al., 2015b; UNCTAD, 2018; Monioudi et al., 2018; Asariotis et al., 2024). In addition, coastal flooding risks devalue properties in flood-prone areas, potentially leading to losses in property value worth billions of dollars (Murfin and Spiegel, 2020; Vousdoukas et al., 2020; Bakkensen and Barrage, 2021). The economic impacts of coastal flooding are expected to rise, as sea levels are increasing at an accelerating rate. Global mean sea level has risen by about 0.2 m since 1900, with a significant acceleration in recent decades (Jevrejeva et al., 2016; IPCC, 2023). Future projections indicate that Mean Sea Level (MSL) could rise by 0.4–0.8 m by 2100, depending on emissions scenario, significantly heightening the risk of coastal flooding (IPCC, 2023). Extreme Sea Level (ESL) events occurring during extreme storms/surges due to the increased hydrodynamic action are additionally expected to increase over the 21st century (Vousdoukas et al., 2018a; Almar et al., 2021). The combination of higher MSL and ESL can lead to more frequent and severe coastal inundation events, making previously safe areas susceptible to flooding necessitating substantial investments in mitigation and adaptation strategies to protect vulnerable coastal communities (Vousdoukas et al., 2018a; IPCC, 2023).
Consequently, there is an urgent need for decision-support tools to assist local stakeholders and coastal planners. In the long run, such tools can be used to effectively design risk-reduction strategies based on future flood risk projections. In the short-term, the development of Early Warning Systems (EWSs) plays a crucial role in safeguarding coastal areas. Several EWSs for coastal flooding have been developed to enhance the resilience of coastal communities (e.g. Harley et al., 2012; Stokes et al., 2021; Le Gal et al., 2023; Sánchez-Artús et al., 2025). These systems integrate hydrodynamic modeling, real-time monitoring networks, and forecasting techniques to predict and mitigate flood impacts on a large (national/regional) or localized scale. Large scale operating EWSs cover broader geographical areas, averaging out specific local conditions. On the other hand, locally tailored systems provide highly specific and customized warnings, using real-time monitoring and detailed modeling of nearshore hydrodynamics at finer resolution.
At a national scale, one of the earliest efforts for the prediction of storm surge induced flooding during hurricane activity is the Sea, Lake, and Overland Surges from Hurricanes (SLOSH) model developed by the U.S. National Oceanic and Atmospheric Administration (NOAA) that integrates coastal topo-bathymetry, meteorological data and tide conditions (Jelesnianski et al., 1992), providing crucial data for early warning and evacuation planning. Furthermore, Xiao et al. (2006) introduced the Coastal and Estuarine Storm Tide (CEST), a numerical modeling system that integrates multiple data sources, such as tidal predictions, meteorological data, and wave information to predict water levels during extreme weather events. In the United Kingdom, the Joint Met Office – Environment Agency Flood Forecasting Centre (FFC) utilizes an EWS that integrates meteorological and hydrological data to deliver timely flood risk assessments across the United Kingdom (Stephens and Cloke, 2014). More recently, the European Coastal Flood Awareness System (ECFAS) generated real-time flood forecasts using pre-identified local morphological thresholds at defined coastal sectors along the entire European coastline, together with a combination of predicted hydrodynamic conditions and high-resolution numerical modeling (LISFLOOD-FP) suited to regional-to-local scale assessments (Le Gal et al., 2023). Locally tailored systems offer customizable early warning solutions by integrating multiple datasets and real-time hydrodynamic modeling of the nearshore processes at finer scales. For instance, a fully operational EWS operates at the region of Emilia-Romagna (Italy) that integrates atmospheric, hydrodynamic, and morphodynamic models to provide 3 d forecasts of dune erosion and marine flooding at strategic locations, translating model outputs into actionable information for emergency planners (Ciavola et al., 2011; Armaroli et al., 2012; Harley et al., 2012). Furthermore, Biolchi et al. (2022) presented the integration of ensemble prediction methods into a coastal EWS that employs an advanced morphodynamic model (XBeach – Roelvink et al., 2009) for selected cross-shore sections of Emilia-Romagna. Sánchez-Artús et al. (2025) presented a high-resolution hydrodynamic operational service using the XBeach model to forecast coastal flooding for three urban beaches in Barcelona (Spain). Garzon et al. (2023) introduced a Bayesian networks-based EWS for wave-induced flooding that makes use of a probabilistic approach to assess the flooding likelihood, accounting for multiple uncertain variables, including wind, wave and tide conditions. In Venice lagoon, the “Acqua Alta” (high water) surge forecast system demonstrates the effective integration of a hydrodynamic model used for sea level forecasts and an Artificial Neural Network (ANN) module used to correct the modeled output with observed sea level data in the Adriatic Sea (Bajo and Umgiesser, 2010; Zampato et al., 2016). The most recent development in coastal flood forecasting is the exclusive use of ANNs that integrate atmospheric (wind and barometric pressure) and hydrodynamic (waves, sea level and tide) parameters to generate acceptable sea level predictions. Several studies have tested different ANNs at various locations worldwide, found to be capable of providing water level predictions during extreme surge events with RMSEs ranging between 9 and 34 cm, depending on the event's magnitude and duration (Hashemi et al., 2016; Wang et al., 2016; Wang and Yuan, 2018; Chao et al., 2020; Dato et al., 2024). In Venice lagoon, the “Acqua Alta” (high water) surge forecast system demonstrates the effective integration of dynamic and neural network models, providing accurate forecasts of storm surge events in Venice Lagoon, enabling authorities to implement timely interventions (Bajo and Umgiesser, 2010). A more recent development in coastal flood forecasting is the Bayesian networks-based EWS for wave-induced flooding, as proposed by Garzon et al. (2023). This system uses a probabilistic approach to assess the likelihood of wave-induced flooding, accounting for multiple uncertain variables, including wind, wave and tide conditions.
To trigger the warning levels, it is essential to establish thresholds based on the predicted intensity of the flood event. Defining these thresholds and identifying extreme levels can be carried out by employing the TWL at the coastal boundary. TWL at a given time (t) can be defined by synthesizing three different components as (Pugh, 1987): TWL(t) = Zo(t) + T(t) + R(t), where Zo(t) is the mean sea level due to atmospheric forcing (pressure and wind, non-tidal residual), T(t) is the tidal component and R(t) is the wave run-up expressed as the sum of level changes due to wave set-up and the swash. Over recent years, a number of studies have suggested different approaches for the calculation of the non-tidal residuals (R(t) and Zo(t)). Vousdoukas et al. (2016, 2018b) and Le Gal et al. (2023) estimate TWL as the sum of the mean sea level (Zo(t)), the tidal signal (T(t)) and the wave set-up to predict the extension of coastal flooding. Del Río et al. (2012) proposed a method for TWL calculation that involves the tidal signal, the wind-induced setup, barometric pressure changes and sea level perturbations due to wave action, whereas Jimenez et al. (2009) used wave information for estimating the inundation danger of the coast of Emilia-Romagna region (Italy), Catalan (Spain) and Languedoc-Rossillon (France) coastlines. On the other hand, Rulent et al. (2020), Caruso and Marani (2022) and Croteau et al. (2023) use a more simplistic approach, where TWL is estimated as the sum of the mean sea level, tide and level variations associated with storm surges, excluding the wave induced perturbations.
During storms or elevated tide and surge conditions wave run-up can significantly exceed the elevation of coastal protection elements (like dunes and seawalls) leading to overtopping and flooding. However, wave run-up processes are not frequently integrated into EWSs due to the limited availability of high-resolution coastal topo-bathymetry, as well as the complexity of simulating the highly dispersive wave transformation at the nearshore (e.g. Ardhuin et al., 2009; Naeini and Snaiki, 2024). Even so, the numerical models capable to resolve such non-linearities and provide sufficient wave run-up estimates require significant computational time and effort (e.g. XBeach – Roelvink et al, 2009; SWASH – Zijlema et al., 2011; Boussinesq based model – Klonaris et al., 2013). Thus, coastal scientists and engineers commonly use parameterized empirical expressions that have been found capable in providing realistic estimates, in different beach environments (e.g. Ruggiero et al., 2004; Stockdon et al., 2006; Vousdoukas et al., 2009; Senechal et al., 2011; Paprotny et al., 2014; Suanez et al., 2016; Poate et al., 2016; Gomes da Silva et al., 2020; Bujak et al., 2023).
In this context, the aim of the present contribution is to report the development and validation of an operational flood EWS (henceforth called NEPTUNE-EWS) that has been configured and tested on a microtidal wave-dominated beach in the southern part of Sardinia island (Italy). The system utilizes high-resolution topo-bathymetric data and locally generated wind-wave forecasts to simulate nearshore hydrodynamics and predict the Total Water Level (TWL), incorporating wave run-up estimates. Flood forecasts are based on the exceedance of TWL over predefined morphological thresholds, which are dynamically updated through repeated topographic leveling at selected locations. The system's performance is evaluated against seven surge events of varying magnitude, monitored through an autonomous video monitoring system and triggered by different wind, wave and sea level conditions.
2.1 Pilot Site: Poetto beach
Poetto is an urban microtidal (maximum tidal range of 40 cm during spring cycles and 20 cm during neap cycles, Biondo et al., 2020), wave dominated beach fronting the city of Cagliari, hosting about 100 000 people per day during the summer season, making it the most visited beach of Sardinia (Strazzera et al., 2008). The high carrying capacity of Poetto is justified by its dimensions (length of about 8 km and maximum width of about 100 m), whereas a significant number of coastal facilities and assets can be found at the low-lying (maximum elevation of about 2.5 m above sea level) backshore coastal promenade. Due to its socio-economic and environmental importance for the region, the Mediterranean Geomorphological Coastal and Marine Laboratory (MedCoastLab) of the University of Cagliari developed a monitoring program that involves analytical studies of Poetto's hydro-morphodynamics, making it one of the most studied beaches of Sardinia (e.g. De Muro et al., 2017; Ruju et al., 2019; Biondo et al., 2020; Ruju et al., 2022; Trogu et al., 2023; Trogu et al., 2024).
Poetto can be considered as an intermediate beach having mild to intermediate foreshore slopes (tan β) that range between 0.07 and 0.15, backed by a relatively narrow (between 10 and 50 m) and low (maximum elevation at 2.2 m above sea level) primary dune system (Ruju et al., 2022). Its low-lying topography makes the beach vulnerable to surge and erosion events during periods of increased hydrodynamic action. As an effort to limit erosion, a beach nourishment project (of about 300 000 m3 of sand) was carried out in 2002 at the Western sector, significantly modifying the textural, compositional and morphological features of the beach (De Muro et al., 2017). Most of the coarser bioclastic material used for nourishment was rapidly eroded in the following years with a registered erosion rate of up to 3 m yr−1 in the Western, most urbanized and vulnerable sector (Biondo et al., 2020). During autumn – early winter periods, the foreshore beach is periodically covered by Posidonia oceanica banquettes or/and accumulation of Arundo donax reeds as a response to increased hydrodynamic activity and the species biological cycle (Ruju et al., 2022; Trogu et al., 2023).
A coastal video monitoring system is deployed in Poetto, set to monitor the western and central sectors of the beach (proximal beach stretch of about 2.7 km – see Fig. 1b). The system consists of two videocameras that provide optical records (frames) of high frequency (4 Hz) and time coverage (for 20 min, at the beginning of every 3 h during daylight), used for the detection of surge events, amongst other hydro-morphological parameters (for details see Trogu et al., 2023).
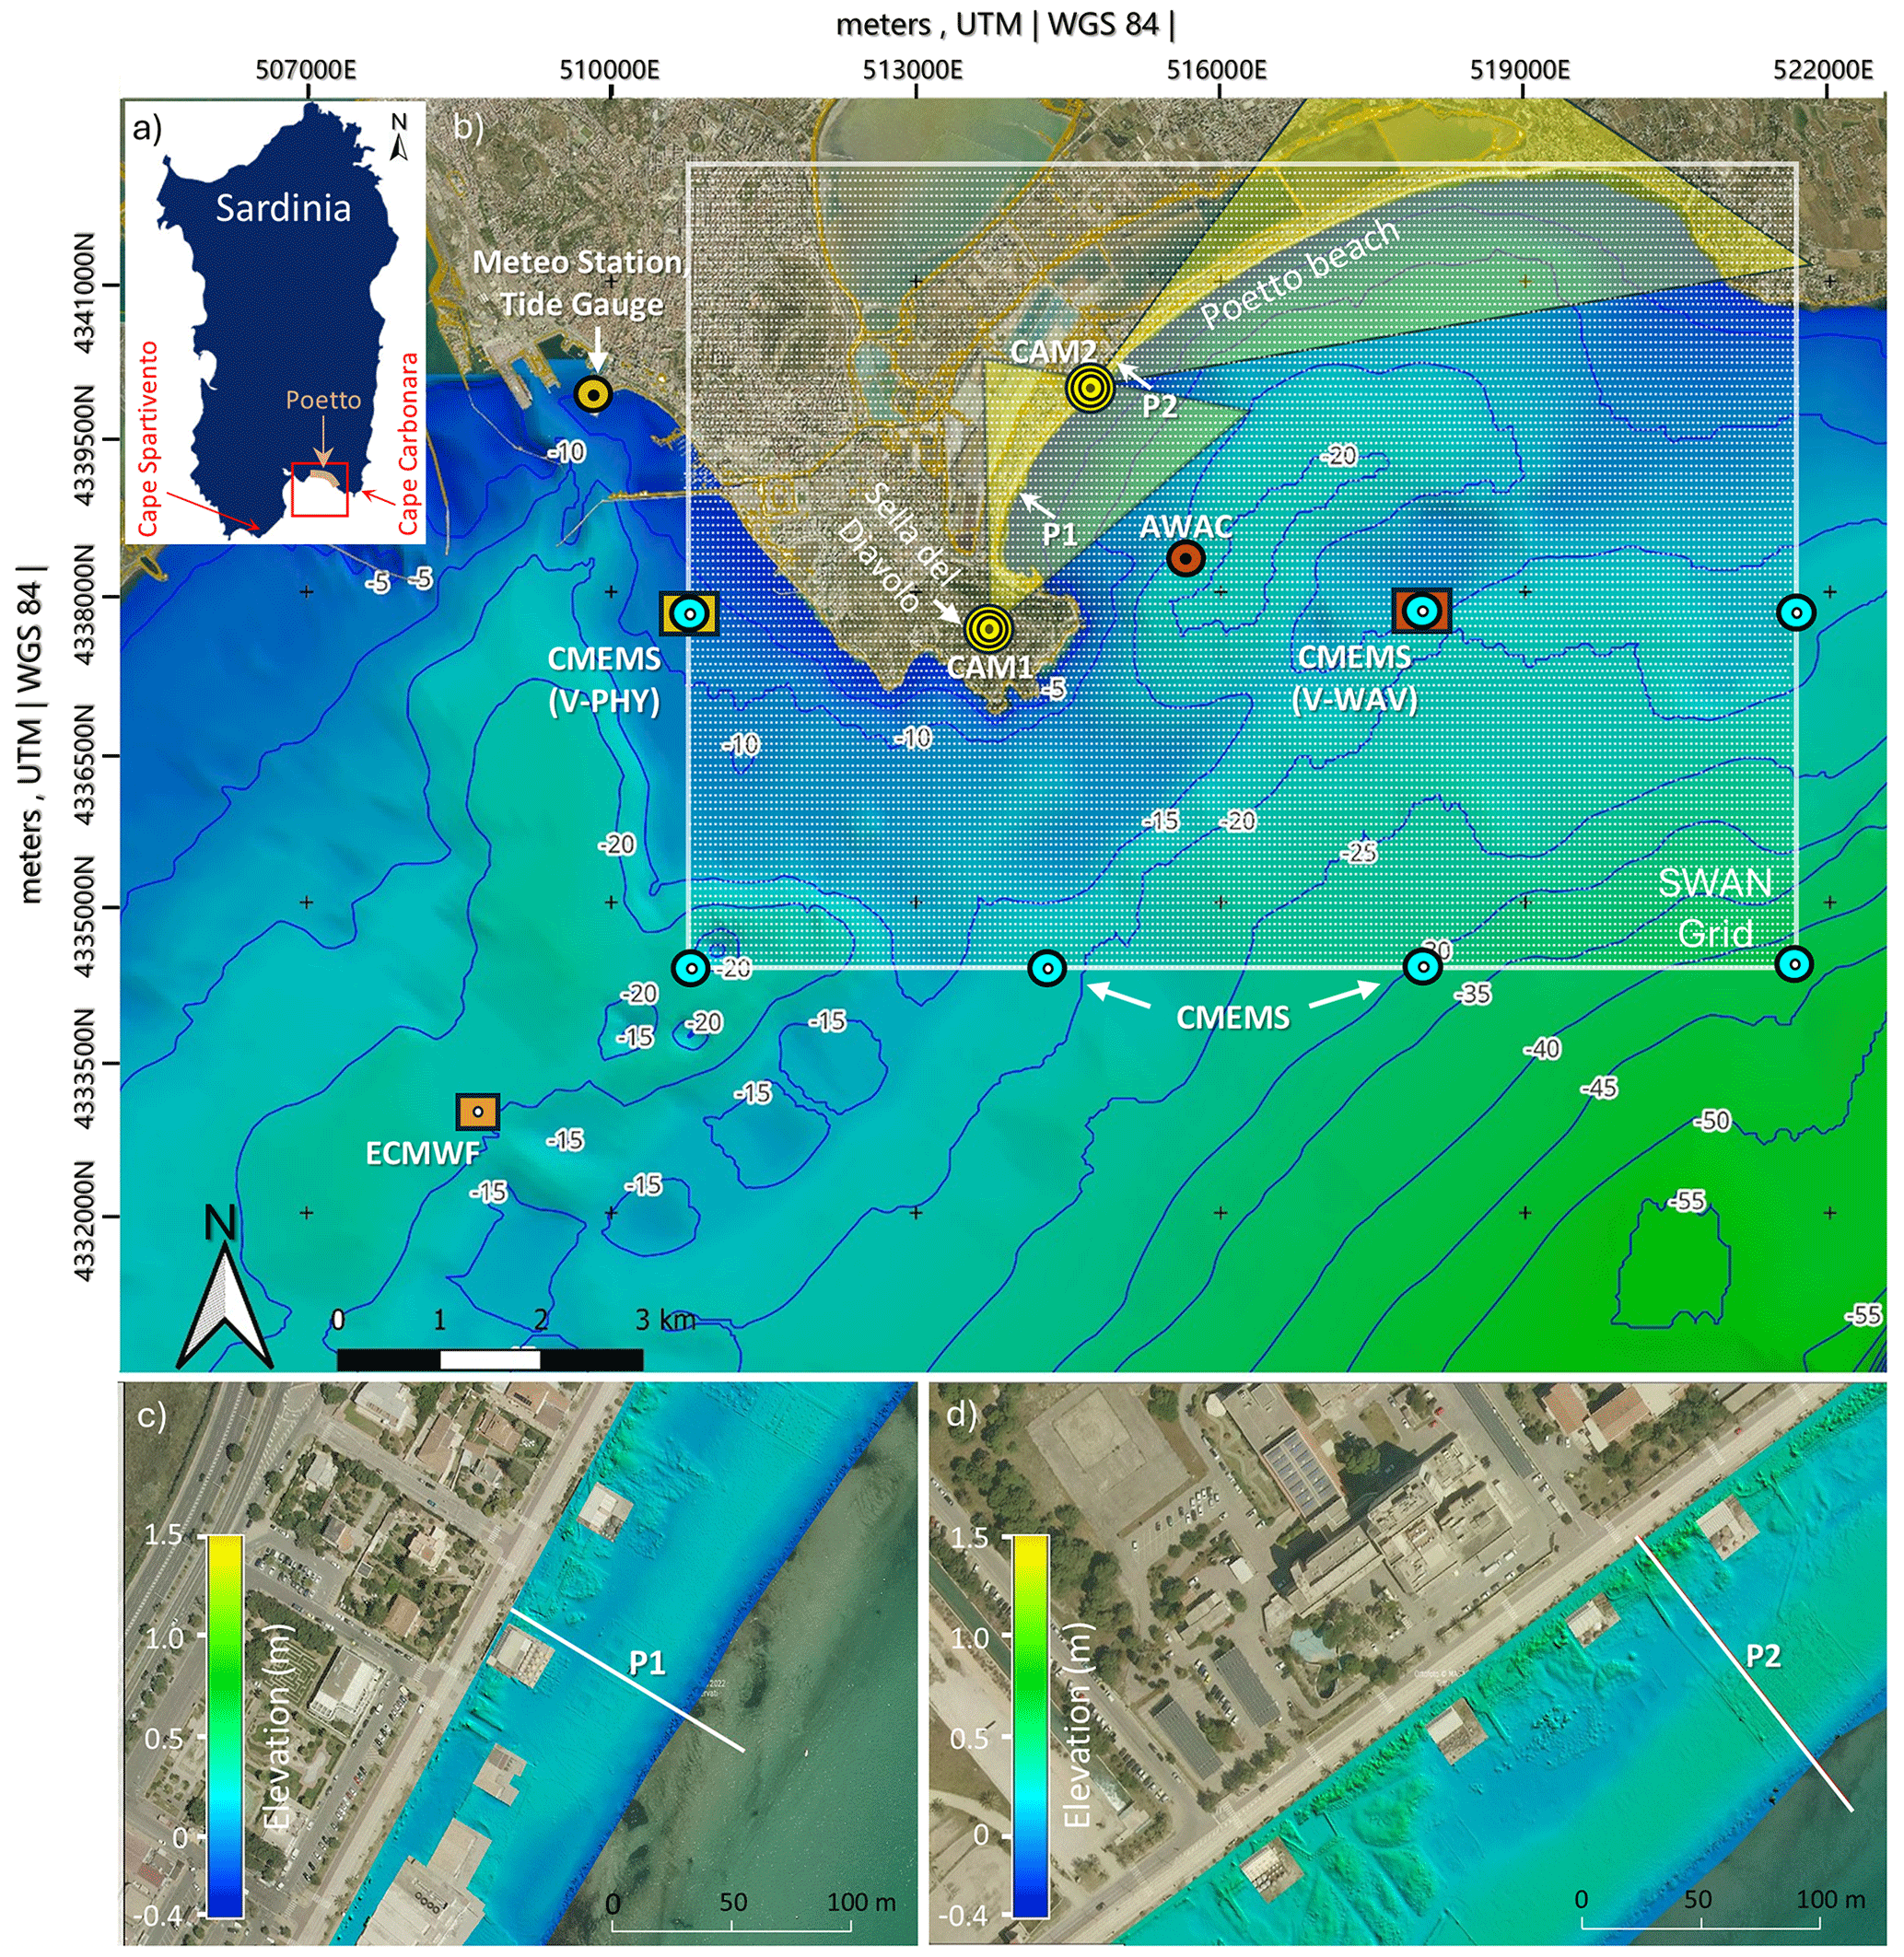
Figure 1(a) Map of Sardinia showing the location of Poetto beach. (b) Bathymetry of the wider area of Poetto and Cagliari port. The locations of the coastal videocameras (CAM1 and CAM2) and their fields of view, cross-shore profiles P1 and P2, AWAC logger, meteorological station and tide gauge, CMEMS and ECMWF grid points, and the computational grid used in SWAN, are also shown. (b, c) Elevation maps (above MSL) of the locations close to cross-shore profiles P1 and P2 (Image source: Sardegna Geoportale, 2024).
Dune height is commonly used as a key reference threshold for assessing coastal flooding (e.g. Armaroli et al., 2012; Harley et al., 2012, 2016). However, in Poetto beach the area between the dune toe and the berm is periodically flooded at specific locations due to berm overtopping, causing damage and economic losses to the coastal facilities (mainly beach bars/restaurants), located at this berm-dune zone. These surge events are primarily driven by the combined effects of the wave action and elevated water levels induced by southeast storms, with a flooding extension that episodically can reach the coastal promenade of the western, most vulnerable sector of the beach (De Muro et al., 2017; Trogu et al., 2024). Importantly, flooding rarely exceeds beyond the dune crest, with the most recent event generated by Cyclone Harry that affected Poetto during 19–22 January 2026. For further information on the meteorological exceptional weather system consult the relevant activation of the Copernicus Emergency Management Service EMSR number EMSR858 (CMS, 2026).
2.2 NEPTUNE-EWS: Structure and Computational Elements
The NEPTUNE-EWS is set-up on the web-server of the MedCoastLab, implemented as Linux shell scripts that call dedicated Python functions/scripts. The system is fully operational providing TWL forecasts of the next 4 d with a 3 h timestep. NEPTUNE-EWS is fed with a detailed bathymetric Digital Elevation Model (DEM), coupled with analytical survey data (topographic DEM) to detect low elevation and prone to flood areas, according to historical flood records derived from the coastal video monitoring system. For these areas two crucial morphological parameters (the foreshore (wet) slope (tan β) and the berm height (B)), are extracted from the topographic data. Foreshore slope is a key parameter that controls wave run-up, which is a main component for estimating TWL (see Appendix, Table A2).
In the case of Poetto beach, berm height is used as an exceedance threshold against the projected TWL, to assess flood risk at the berm-dune toe zone of the examined, more vulnerable locations. The performance of the system is assessed through a selected timeseries of seven surge events of different characteristics (in terms of wind and hydrodynamic conditions, see Appendix, Figs. B2, C1, D2, D3 and 10). Each event is categorized according to its impact, evidenced by the coastal videocameras, as: (i) no flooding; (ii) limited overtopping (i.e. detected traces of partial water coverage or/and Posidonia oceanica washes); and (iii) extensive overtopping (i.e. flooding of the berm-dune zone). The timeseries of the camera frames used to identify these events (4 images per day during light hours) are archived in Zenodo (Trogu et al., 2026).
Flood risk is evaluated by comparing the TWL exceedance against the morphological threshold, incorporating an error margin. The risk levels are defined as follows: (i) Low – when TWL is below the berm height adjusted by the error margin; (ii) Moderate – when TWL is close to the threshold, within the range defined by the error margin, but does not exceed it; (iii) High – when TWL exceeds the threshold but remains within the error margin; and (iv) Very high – when TWL is clearly above the threshold, surpassing the error margin. In the case of Poetto, the error margin was adjusted at 20 % after assessing the performance of the system against the records of the coastal videocameras (see also Sect. 3.3). NEPTUNE is set to automatically send an e-mail to any interested parties (e.g. civil protection, local authorities/institutions), warning of potential flood risk over the most vulnerable beach sectors. The e-mail contains: (i) an analytical figure of the projected TWL (magnitude and duration – see Figs. 8, 9 and 11); and (ii) a text warning, indicating the projected flood risk for each day. The system's structure and the main computational elements are presented in Fig. 2.
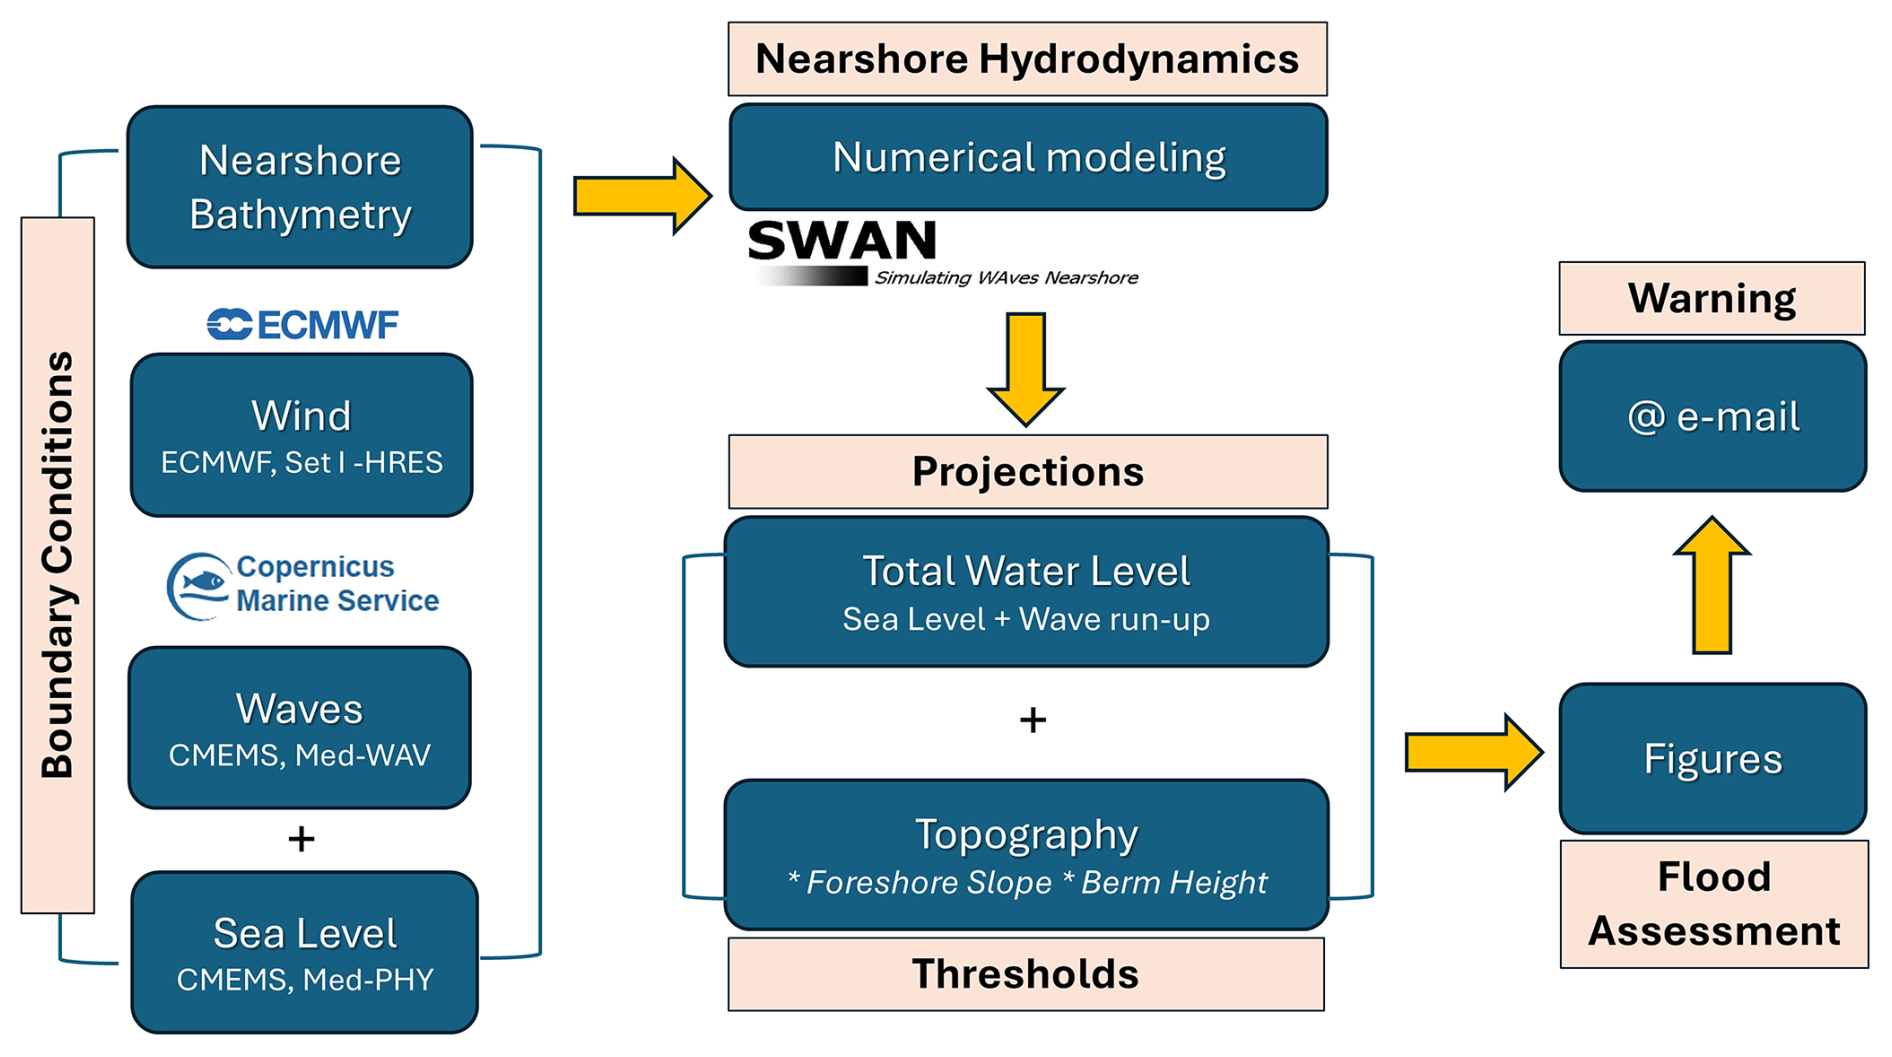
During execution of NEPTUNE-EWS, the initial step involves the extraction of the wind and hydrodynamic forecasts from a local area weather model. More specifically, hourly forecasts of (i) the wind conditions (two horizontal velocity components, u10 and v10); (ii) the wave climate (13 parameters) involving the significant wave heights, spectral moments/peak periods and mean directions of both wind generated and swell (primary and secondary) wave components; and (iii) the sea level perturbations due to the combined action of the tidal cycle and barometric perturbations, are extracted from widely used e-databases (see Appendix A – Table A1). Wind forecasts are provided by the European Center for Medium-range Weather Forecasts (ECMWF), whereas wave and sea level forecasts are extracted from the Copernicus Marine Environmental Monitoring Service (CMEMS) virtual buoys/e-database using the Copernicus Marine Toolbox – version 2.0.0 (CMS, 2025). The forecasted wind-wave climate deriving from the ECMWF and CMEMS e-databases, is used as input to the SWAN (Simulating WAves Nearshore) model (e.g. Zijlema and van der Westhuysen, 2005). The computational elements of NEPTUNE-EWS are reported in the following sections. Section 2.2.1. presents the boundary conditions and the thresholds used during initial system set-up, whereas the process of simulating nearshore hydrodynamics and TWL estimates are presented in Sect. 2.2.2.
2.2.1 Boundary conditions
Topography and Bathymetry
Nearshore bathymetry was retrieved on 21 May 2019 with the use of a boat equipped with a single beam echosounder (Reson Navisound 215) combined with a DGPS Differential Global Positioning System (DGPS – Omnistar 8300HP), set to operate at 5 Hz and interfaced through a notebook via the dedicated Reson PDS2000 navigation and acquisition software. The boat navigated through dense (spaced at about 350 m) cross- and long-shore transects from shallow depths (of about 1 m) up to the inshore expansion limit of the Posidonia oceanica meadow at depths between 10 and 18 m. Regarding beach topography, an Unmanned Aerial Vehicle (Enac-certified DJI Phantom 4 Pro APRs with GSD = 3/5 cm per pixel) was used to obtain a detailed topographic DTM (Digital Terrain Model) on 22 May 2019. Furthermore, nine topographic surveys were carried out during the period 2017–2026 along the two locations/cross-shore profiles (named P1 and P2) most prone to flooding according to the topographic DEM and the camera records. The topographic data were measured with the use of a Real Time Kinematic Differential Global Positioning System (RTK-DGPS), collecting survey points from the dune system down to shallow depths of about 1 m.
The bathymetric grid used in SWAN simulations was generated by merging the retrieved high-resolution bathymetry and the EMODnet bathymetric database (EMODnet Bathymetry Consortium, 2024). To date, EMODnet represents the best available harmonised Digital Terrain Model (DTM) for European seas, showing however relatively high vertical errors in shallow depths. To overcome this and retrieve the best possible accuracy, the retrieved high-resolution nearshore bathymetry replaced the EMODnet values covering the same area. Moreover, a triangular interpolation where samples are organized into a Delaunay network allowed computation of the nearshore bathymetry (up to ∼ 40 m depth) and generation of the final grid.
Meteorology and Hydrodynamics
Wind forecast is extracted from the ECMWF's dataset (see Appendix, Table A1 – ECMWF, 2025). The dataset is based on the Set I – High RESolution (HRES) atmospheric model, specifically tailored to compute wind components at 10 m height (u10 and v10) for 10 d ahead, updated twice a day, with a spatial resolution of 0.1° × 0.1° (of about 9 km) and hourly frequency. The operational implementation of ECMWF Set I-HRES benefits from improvements in computational methods and the integration of observational data (Hersbach et al., 2020). To validate the accuracy of ECMWF forecasts in Poetto, the forecasted wind climate is compared against wind records of a meteorological station installed and operating at the port of Cagliari at an elevation of 3 m, with a recording frequency of 10 min (see Fig. 1b). The data are accessible through the monitoring network of the Italian Institute for Environmental Protection and Research (ISPRA) (ISPRA, 2025). To achieve that, wind data from the closest available geographical point of the ECMWF database were used (located at a distance of 7.2 km offshore the meteorological station – see Fig. 1b). For comparison, wind records of the meteorological station were extracted for the same timestep with the ECMWF forecasts (hourly) and were converted to wind velocity at 10 m height (U10) as U10 = Uz, 0 < z < 20, where z, is the elevation of the meteorological station (USACE, 1984). Furthermore, the effective wind events (i.e. storms with intensity greater than 4 Beaufort, blowing from directions within the effective fetch of Poetto) were isolated by using the criterion of Sanchez-Arcilla et al. (2008), according to which a wind event can be classified as storm surge if it has a duration of at least 6 h, while any break in strong winds (in this case greater than 4 Beaufort) should not exceed 18 h between consecutive wind records. These events were compared against the wave heights projected by CMEMS to identify trends and assess the wind-generated waves during increased wind activity (see Sect. 3.2.1).
Wave climate forecasts are extracted from the CMEMS download center through the wave component of the Mediterranean forecasting system (V-WAV) (see Appendix, Table A1 – Korres et al., 2023). Forecasts are based on the WAM6 numerical model, developed from the fundamental work of Hasselmann et al. (1973). WAM6 is one-way nested, designed to simulate ocean wave dynamics with a spatial resolution of 1/24° (of about 4.2 km) and high precision. The model resolves the prognostic part of the wave spectrum with 24 directionally and 32 logarithmically distributed frequency bins, whereas the solutions are corrected by an optimal interpolation data assimilation scheme of along track satellite observations of the significant wave height (Oikonomou et al., 2023). The model is updated twice a day and provides hourly forecasts for 10 d ahead of the main wave parameters (significant wave height, mean/peak wave period and mean direction) for a wind generated wave component and two swell wave components (primary and secondary). The performance of V-WAV was assessed against the closest available records of a Nortek AWAC (Acoustic Wave And Current) profiler deployed for a 45 d period between 16 October and 30 November 2020 at 18 m depth, located 2.1 km away from the most proximal CMEMS point/virtual buoy (CMEMS V-WAV) located at a similar depth (see Fig. 1b). The reanalysis dataset used for comparison is generated from the WAM4 (version 4.6.2) model (see Appendix, Table A1 – Korres et al., 2021), as the latest WAM6 based forecasts became available at a later stage (since 1 December 2021).
Sea Surface Height (SSH) forecasts are similarly extracted from the CMEMS download center through the physical component of the Mediterranean forecasting system (V-PHY) (see Appendix, Table A1 – Clementi et al., 2021). V-PHY provide hourly forecasts of the SSH perturbations (parameter zos), considering both the barometric component and the tidal signal. To achieve that, it utilizes a coupled hydrodynamic-wave model (NEMO and WAVEWATCH III) to account for wave-current interactions, while it integrates observational data through a 3D variational data assimilation scheme known as OceanVar (CMS, 2024).
The accuracy of the modeled sea level (CMEMS V-PHY) was evaluated against in situ measurements deriving from a tide gauge operating in Cagliari port, at a location next to the meteorological station as part of the Italian tide gauge network (ISPRA, 2025). These data were plotted against the timeseries deriving from the closest to this location CMEMS virtual buoy, at a distance of 2.6 km away (CMEMS V-PHY, see Fig. 1b).The comparison is carried out using a set of statistical indicators that involve the Correlation coefficient (R), Mean Absolute Error (MAE), Scaled Mean Absolute Error (SMAE), Mean Residual (Bias) and Root Mean Square Error (RMSE).
2.2.2 Simulations of nearshore hydrodynamics, TWL forecasts
The projected wind-wave climate deriving from the ECMWF and CMEMS and the detailed nearshore bathymetry are set as input to the SWAN model. SWAN is a spectral wave model based on the wave action balance (e.g. Stokes et al., 2021). The grid used in SWAN has a spatial resolution of 0.001° (of about 100 m – see Fig. 1b), allowing the representation of the main wave transformation processes. Reconstruction of the wave spectra is based on the approach of Ruju et al. (2022) who investigated nearshore wave spreading in Poetto beach (with the use of the same grid as currently available in NEPTUNE-EWS) and validated SWAN's wave forecasts against in situ wave records of an AWAC. This approach is also consistent with Ruju and Viola (2024) who suggested that, during multimodal wave conditions, nearshore wave predictions can be improved by using boundary conditions in which wave spectra are reconstructed from partitioned wave parameters rather than from bulk integrated wave parameters.
The intensity of the flood event is assessed through identifying TWL thresholds. This is achieved by synthesizing the three TWL components (Zo, T and R – Pugh, 1987). Wave run-up contribution to the TWL(R) is determined from the spectral wave parameters (Significant wave height – Hs and peak wave period – Tp) computed by SWAN outside the surf zone along the selected, prone to flood locations transects (in this case, P1 and P2). The system uses the spectral wave parameters to estimate the offshore wave height (Ho) and length (Lo), with the use of an inverse shoaling function as Lo = and Ho = . Where g, is the gravitational acceleration (9.81 m s−1) and ks, is the shoaling coefficient calculated as . Where is the offshore group velocity and cg the nearshore (shallow) group velocity. Offshore group velocity is calculated as , where co is the offshore wave celerity calculated as the ratio of . Nearshore group velocity is calculated as c⋅n, where c, is the wave celerity equal to and n, the group velocity factor accounting for dispersion effects in finite depth.
After estimation of the offshore wave parameters, six commonly used empirical expressions controlled by the incident wave energy and the foreshore slope are employed by NEPTUNE-EWS (see Appendix – Table A2). The performance of each formula is assessed against the events of different duration and magnitude (monitored by the coastal videocameras) to select the most effective (see also Sect. 3.2).
3.1 Topographic Records
Distinct morphodynamic patterns emerge when examining the evolution of the P1 and P2 profiles over the 2017–2026 period (Fig. 3). Profile P1 is found to be the most vulnerable location in terms of shoreline erosion with recorded retreat of 23.3 m, showing however quite stable berm and dune elevations. In contrast, profile P2 retreated by 8.2 m, while a notable reduction in dune height of 0.6 m. Dune height in profile P1 has progressively decreased from 2.01 m in 2017 to 1.67 m in 2024, but showed signs of recovery in the years that followed, with recorded elevation of 1.91 m in 2026 (prior to Cyclone Harry). It has to be noted that P2 profiles surveyed from 9 June 2023 and onwards appear unusually flat over a 50 m stretch of the backshore, which contradicts natural beach morphologies (Fig. 3b). The latter is linked with man-made works (bulldozing operations) that have been since then carried out in this beach sector, aimed at leveling the beach front for recreational purposes, such as the installation of a volleyball court in this area. To notice that such man-made changes are of great importance for setting up the morphological thresholds of the NEPTUNE-EWS.
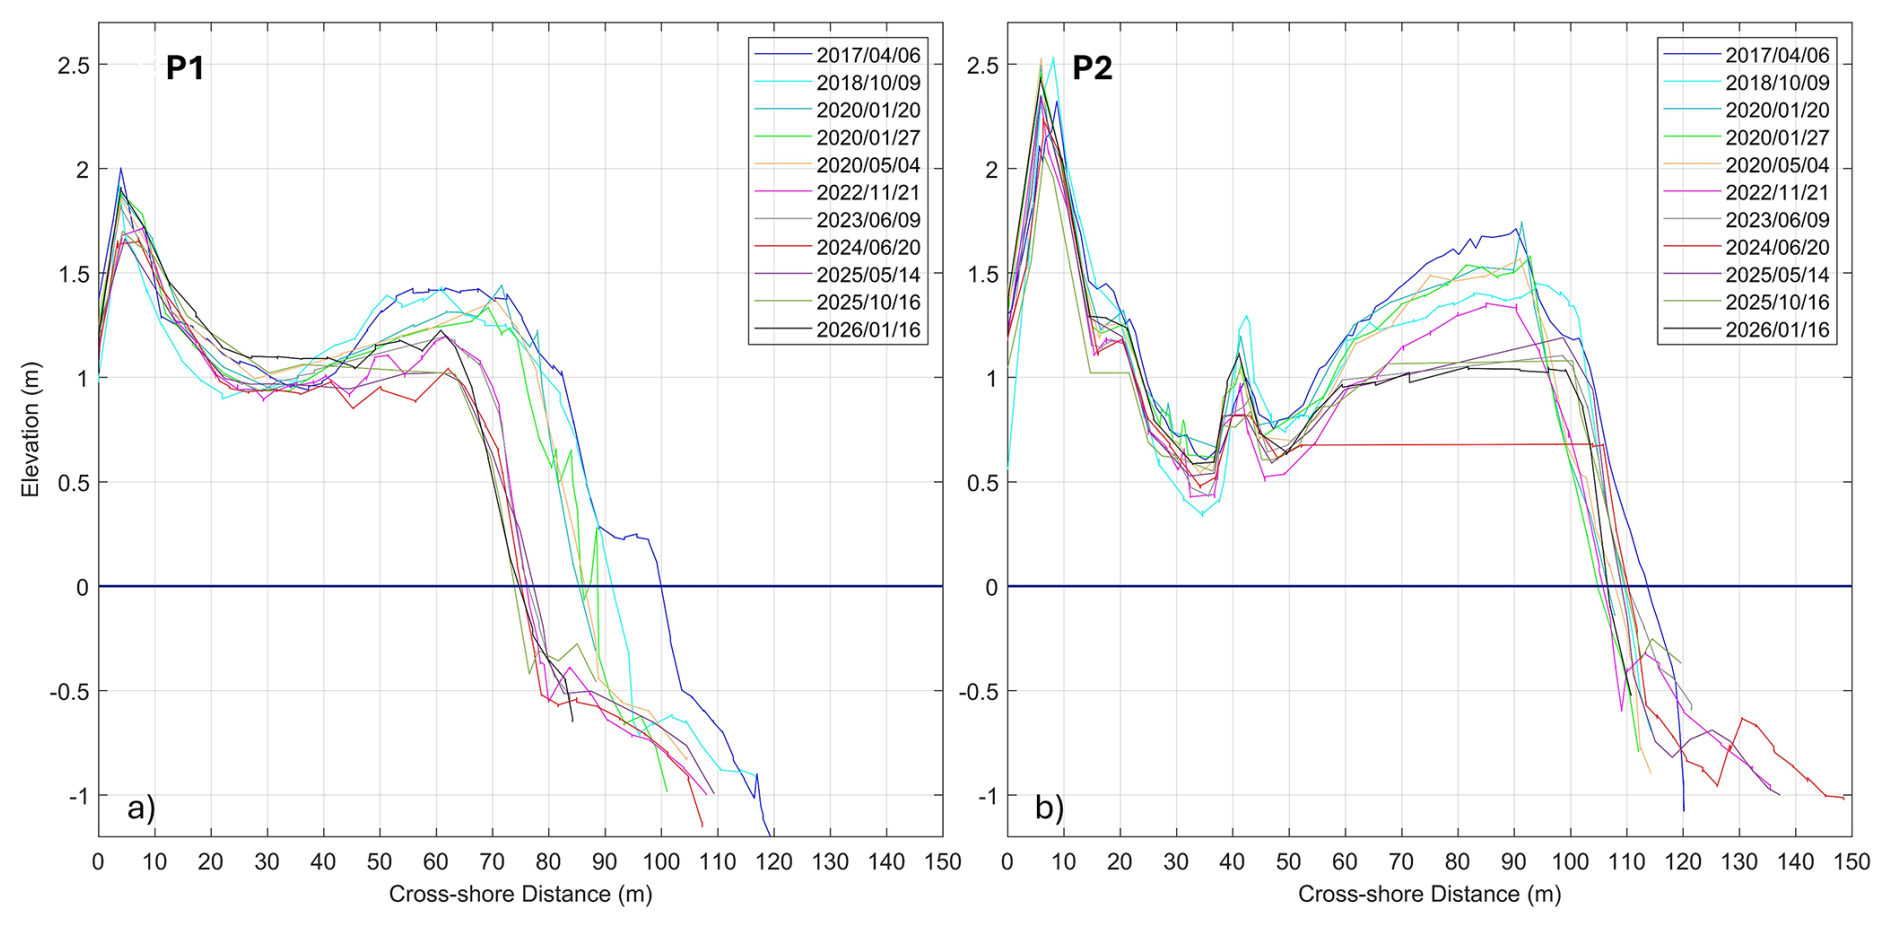
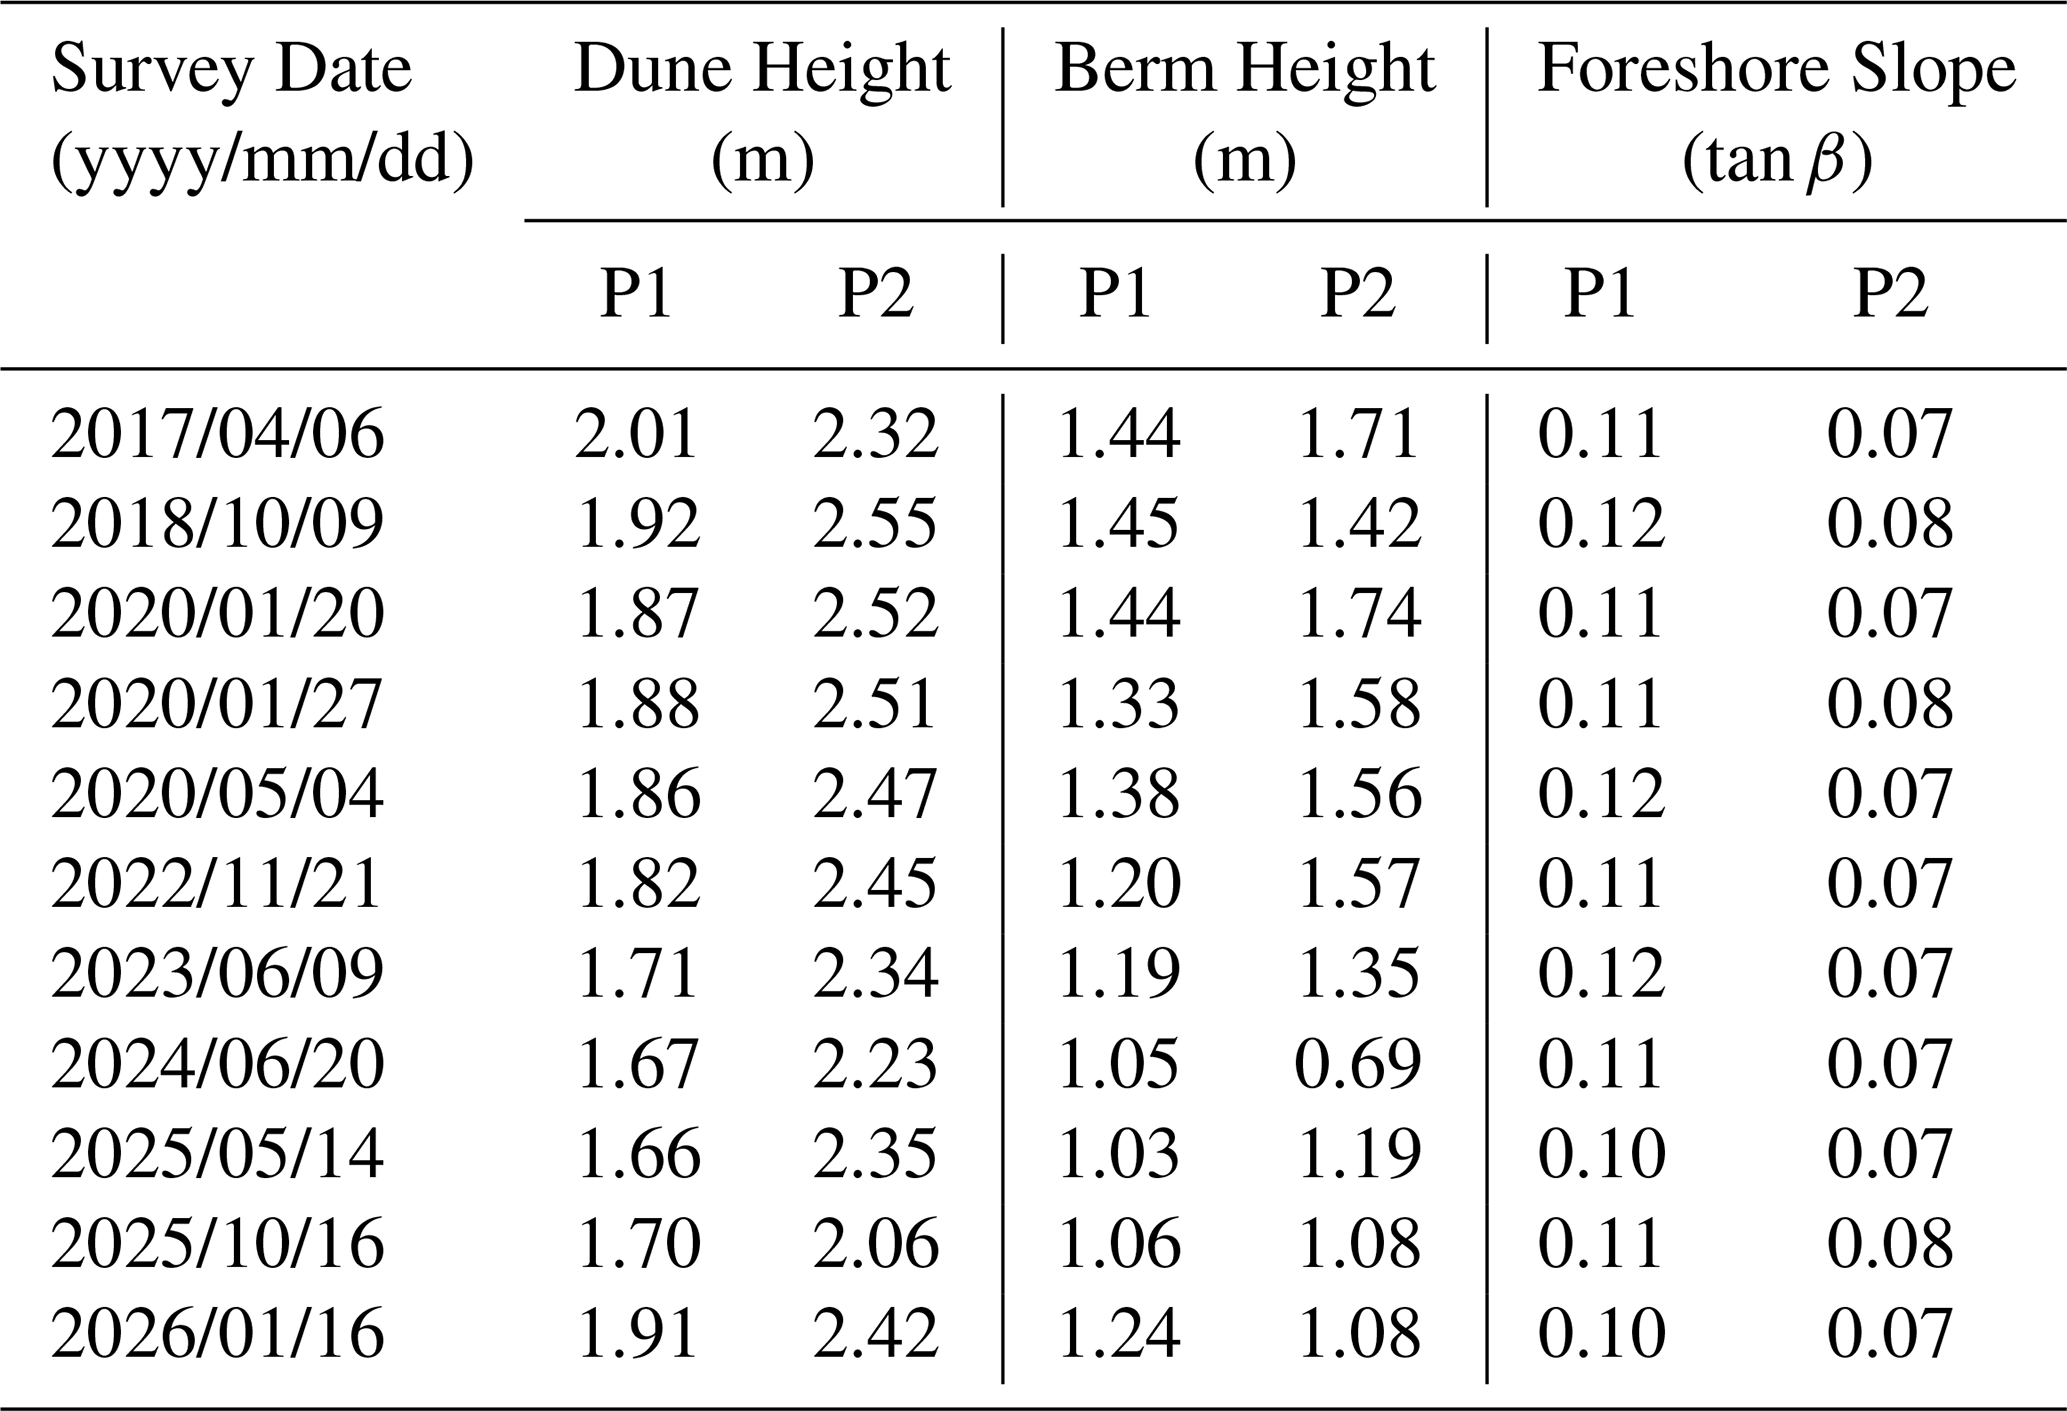
Despite the changes in beach width and berm height, the foreshore slope (tan β) for cross-shore profiles P1 and P2 is relatively constant, ranging between 0.10–0.12 and 0.07–0.08, respectively (Table 1). As the morphological threshold changes over time, the most updated values deriving from field measurements are used in NEPTUNE-EWS, considering also the seasonal cross-shore berm differentiations (i.e. summer–winter berm deposition).
Table 1Morphological parameters of Poetto beach at cross-shore profiles P1 and P2 as obtained from the nine topographic surveys conducted during the period 2017–2026.
3.2 Validation of forecasts
3.2.1 Wind and Sea Level
The forecasted wind climate is found to align well with the in situ records following similar trends, both in velocity and direction during the 2.5-year validation period. Nevertheless, the intensity of the ECMWF forecasted winds deriving from directions to which the beach is exposed (22 % of total records) are found to have lower values by about 2–3 m s−1. When the criterion of Sanchez-Arcilla et al. (2008) was applied to filter out low energy conditions, 69 effective wind events (representing 11 % of the timeseries) capable of generating increased hydrodynamic conditions (greater than 4 Bf) have been isolated. An analytical overview of the wind regime and sea level conditions, as well as the isolated effective wind events are reported in Appendix B, C, and D (Figs. B2, C1 and D1).
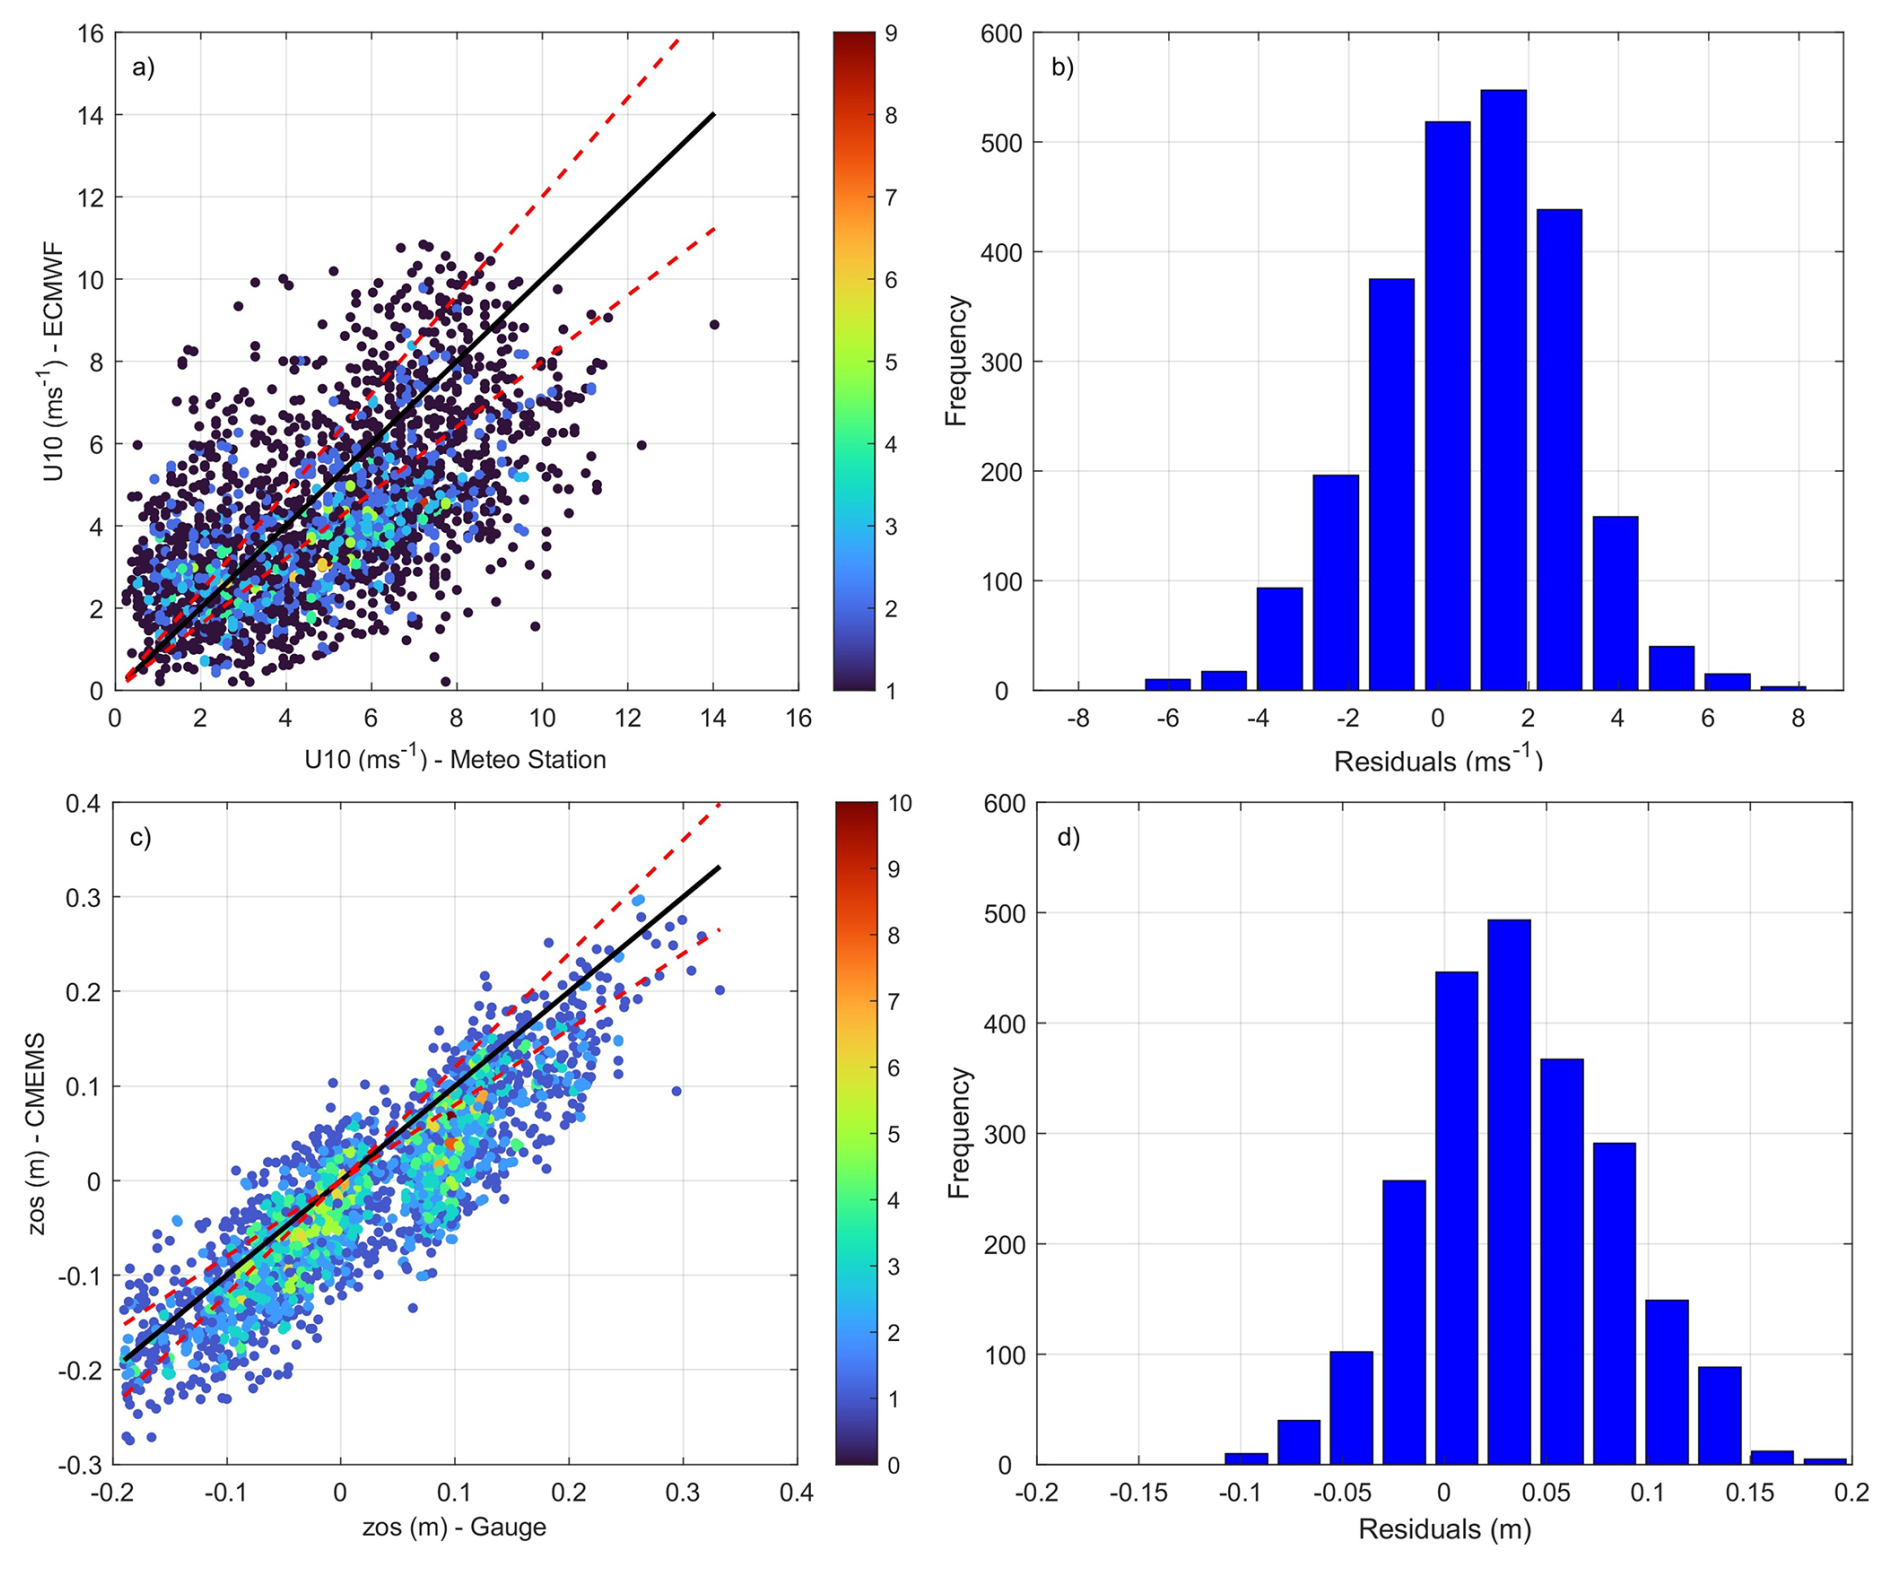
Figure 4Scatterplot of (a) wind velocities at 10 m height (U10) recorded from the meteorological station versus the forecasts provided by ECMWF and (c) Sea level (zos) recorded from the tide gauge versus the forecasts of CMEMS-MedPhy, during the 69 energetic isolated events; red lines: 20 % error bounds, black line: perfect matching. (b, d) Distribution of residuals during the isolated energetic events for U10 and zos, respectively.
The performance of wind and sea level forecasts is assessed during these 69 energetic events. The scatter plot of wind velocities during these events shows overall agreement between recorded and forecasted velocities, with most points lying close to the 1:1 reference line (Fig. 4a). The mean residual (bias = 0.73 m s−1) indicates a systematic offset, suggesting a consistent underestimation of forecasted wind velocities, evident also in the wind roses (see Appendix B – Fig. B1). While this bias is moderate, the spread of the points highlights variability in accuracy, with several values falling outside the 20 % error bounds, particularly during higher velocities where forecast errors increase. The correlation is moderate (R = 0.573, p < 0.05) with MAE = 1.80 m s−1, representing a substantial fraction of the mean wind velocity (SMAE = 36.5 %). Residuals are mainly clustered around the value of 1.5 m s−1, while occasional extremes contribute to a higher RMSE (2.22 m s−1) compared to MAE, suggesting the presence of large deviations in some events. Overall, the results indicate a moderate correlation but a tendency toward systematic underestimation by ECMWF forecasts.
Regarding sea level (Fig. 4c and d), the correlation coefficient was found to have a value of R = 0.88, indicating that the forecast is fairly reliable and that the two datasets generally follow a similar trend. On average, forecasted sea levels were found to deviate from the recorded values by MAE = 0.05 m and by RMSE = 0.06 m. The mean Residual (Bias) was estimated at 0.04 m, suggesting that on average, the CMEMS forecasted data are systematically slightly underestimating the recorded sea level. This is also consistent with the distribution of the residuals, where most values are being concentrated at low errors (mostly positive). SMAE was found to be 217.7 %, suggesting that for some records (especially for values close to zero), the forecast might be off by a large percentage, although the magnitude of sea level variation is small compared to other contributions. It has to be considered that the tide gauge is located inside Cagliari's port is 2.6 km away from the CMEMS V-PHY virtual buoy (see Fig. 1b).
Extended validation of the wind and sea level forecasts during the 2.5-year period of records is reported in Appendix B and C (Figs. B3 and C2).
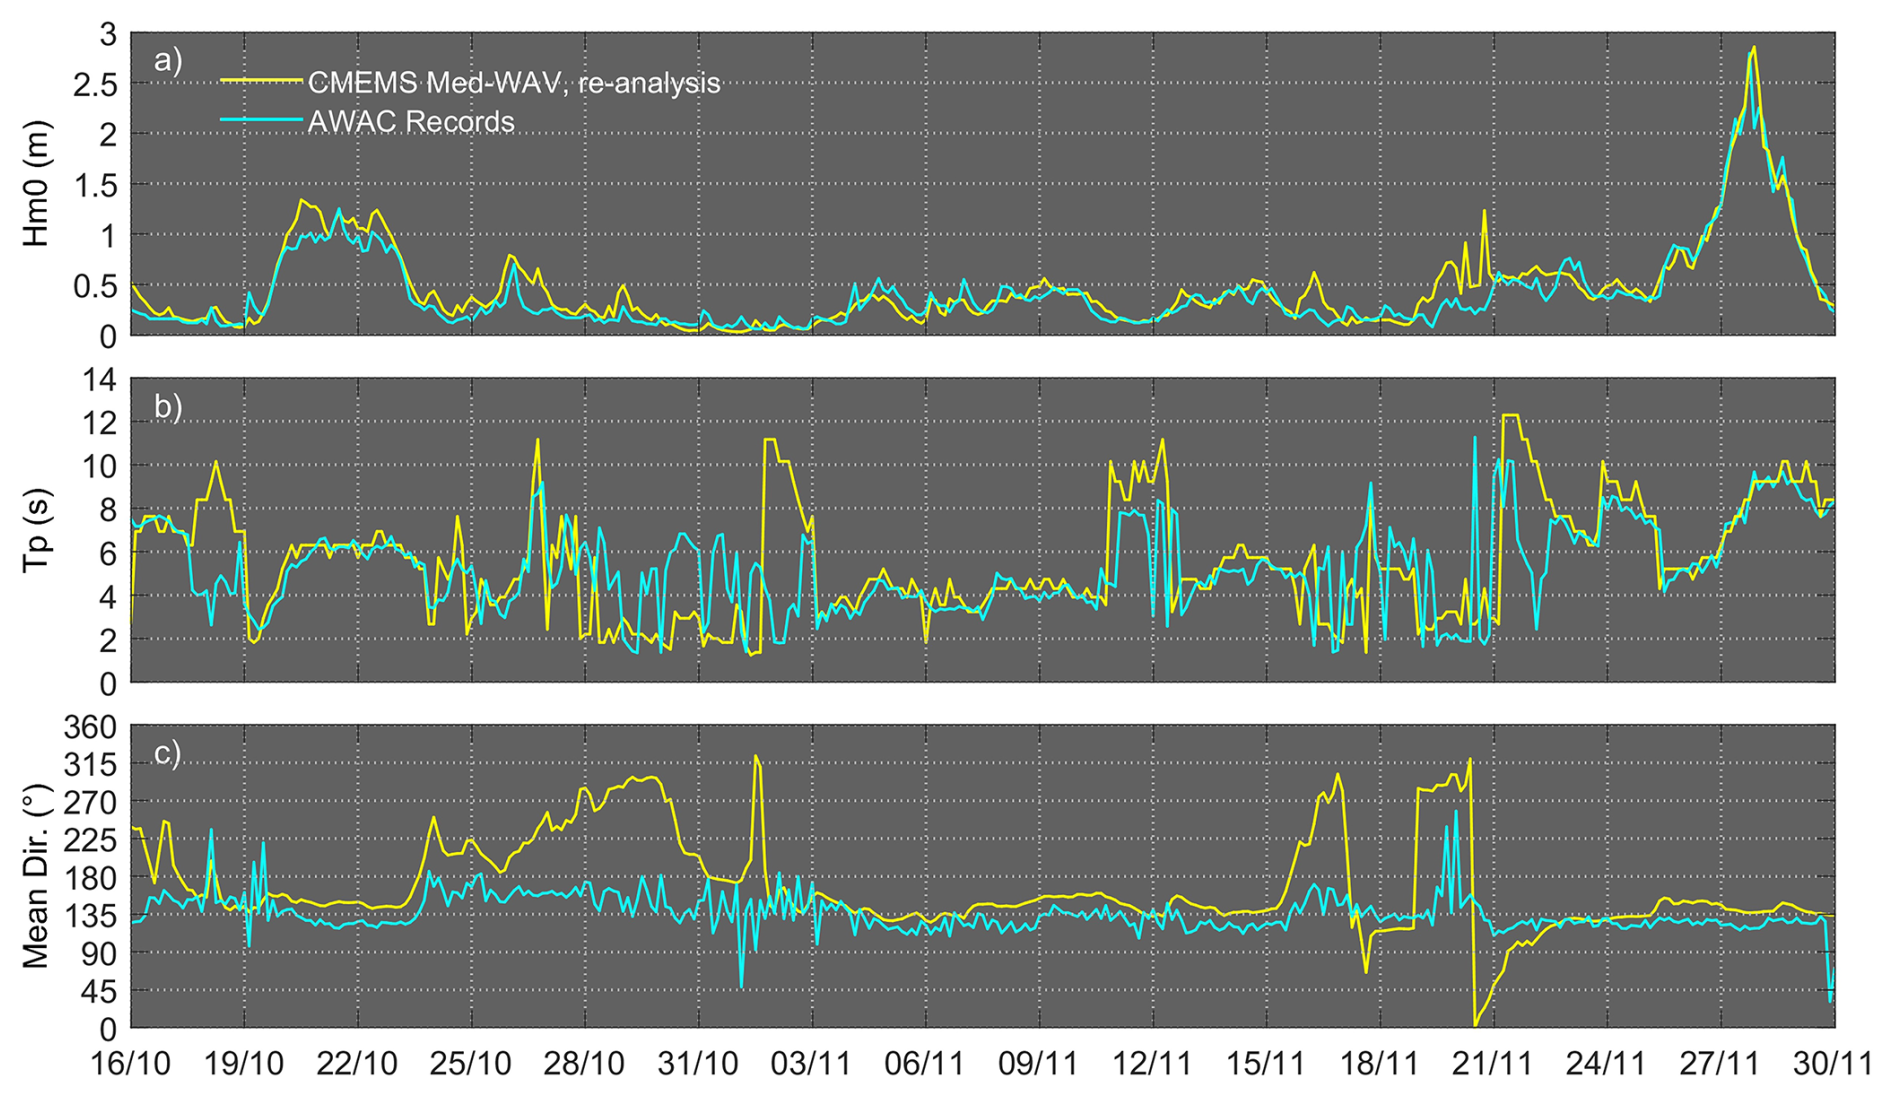
Figure 5(a) Spectral moment wave height (Hm0); (b) peak wave period (Tp); and (c) mean wave direction derived from the AWAC records and the CMEMS V-WAV re-analysis product for a 45 d period (16 October–30 November 2020).
3.2.2 Wave climate
During the 45 d validation period (16 October–30 November 2020), the CMEMS V-WAV re-analysis data generally follow the trends observed through the AWAC measurements. More specifically, the spectral moment significative wave height (Hm0) is found to be slightly overestimated by CMEMS data (by about 0.2 m) during specific periods (e.g. on 20 October, 27 October, 16 and 20/22 November – Fig. 5a). Notable discrepancies in peak wave period (up to 10 s) are observed during low-energy events (i.e. at times when wave heights are smaller than 0.5 m), such as on 18 October, 2 November, 20–21 November (Fig. 5b). Mean wave direction is also found to differ significantly (by up to 130°) at periods of low wave energy (between 24 October–2 November and 16–21 November), where the reanalysis data exhibit abrupt directional changes that are not observed in the AWAC records. However, at periods of increased wave heights (more than 0.7 m), CMEMS data are found to align reasonably well, having differences of about 20–25° (Fig. 5c). The model performs rather well in the validation for wave heights but is less accurate for the period and direction. This is a known issue of such wave models with several studies reporting similar biases, particularly during low energy events (e.g. Ruju et al., 2019; Alday et al., 2022; Oikonomou et al., 2023; Korres et al., 2021, 2023).
To investigate the performance of CMEMS V-WAV forecasts in high energy conditions, and considering the limited number of data, the recorded wave heights higher than 0.7 m have been considered for further statistical analysis, representing the highest 16 % of the dataset (60 out of 361 total AWAC records). An analytical overview of the wave forecasts, as well as extended validation that involved the whole AWAC records), is reported in Appendix D (Figs. D1–D4).
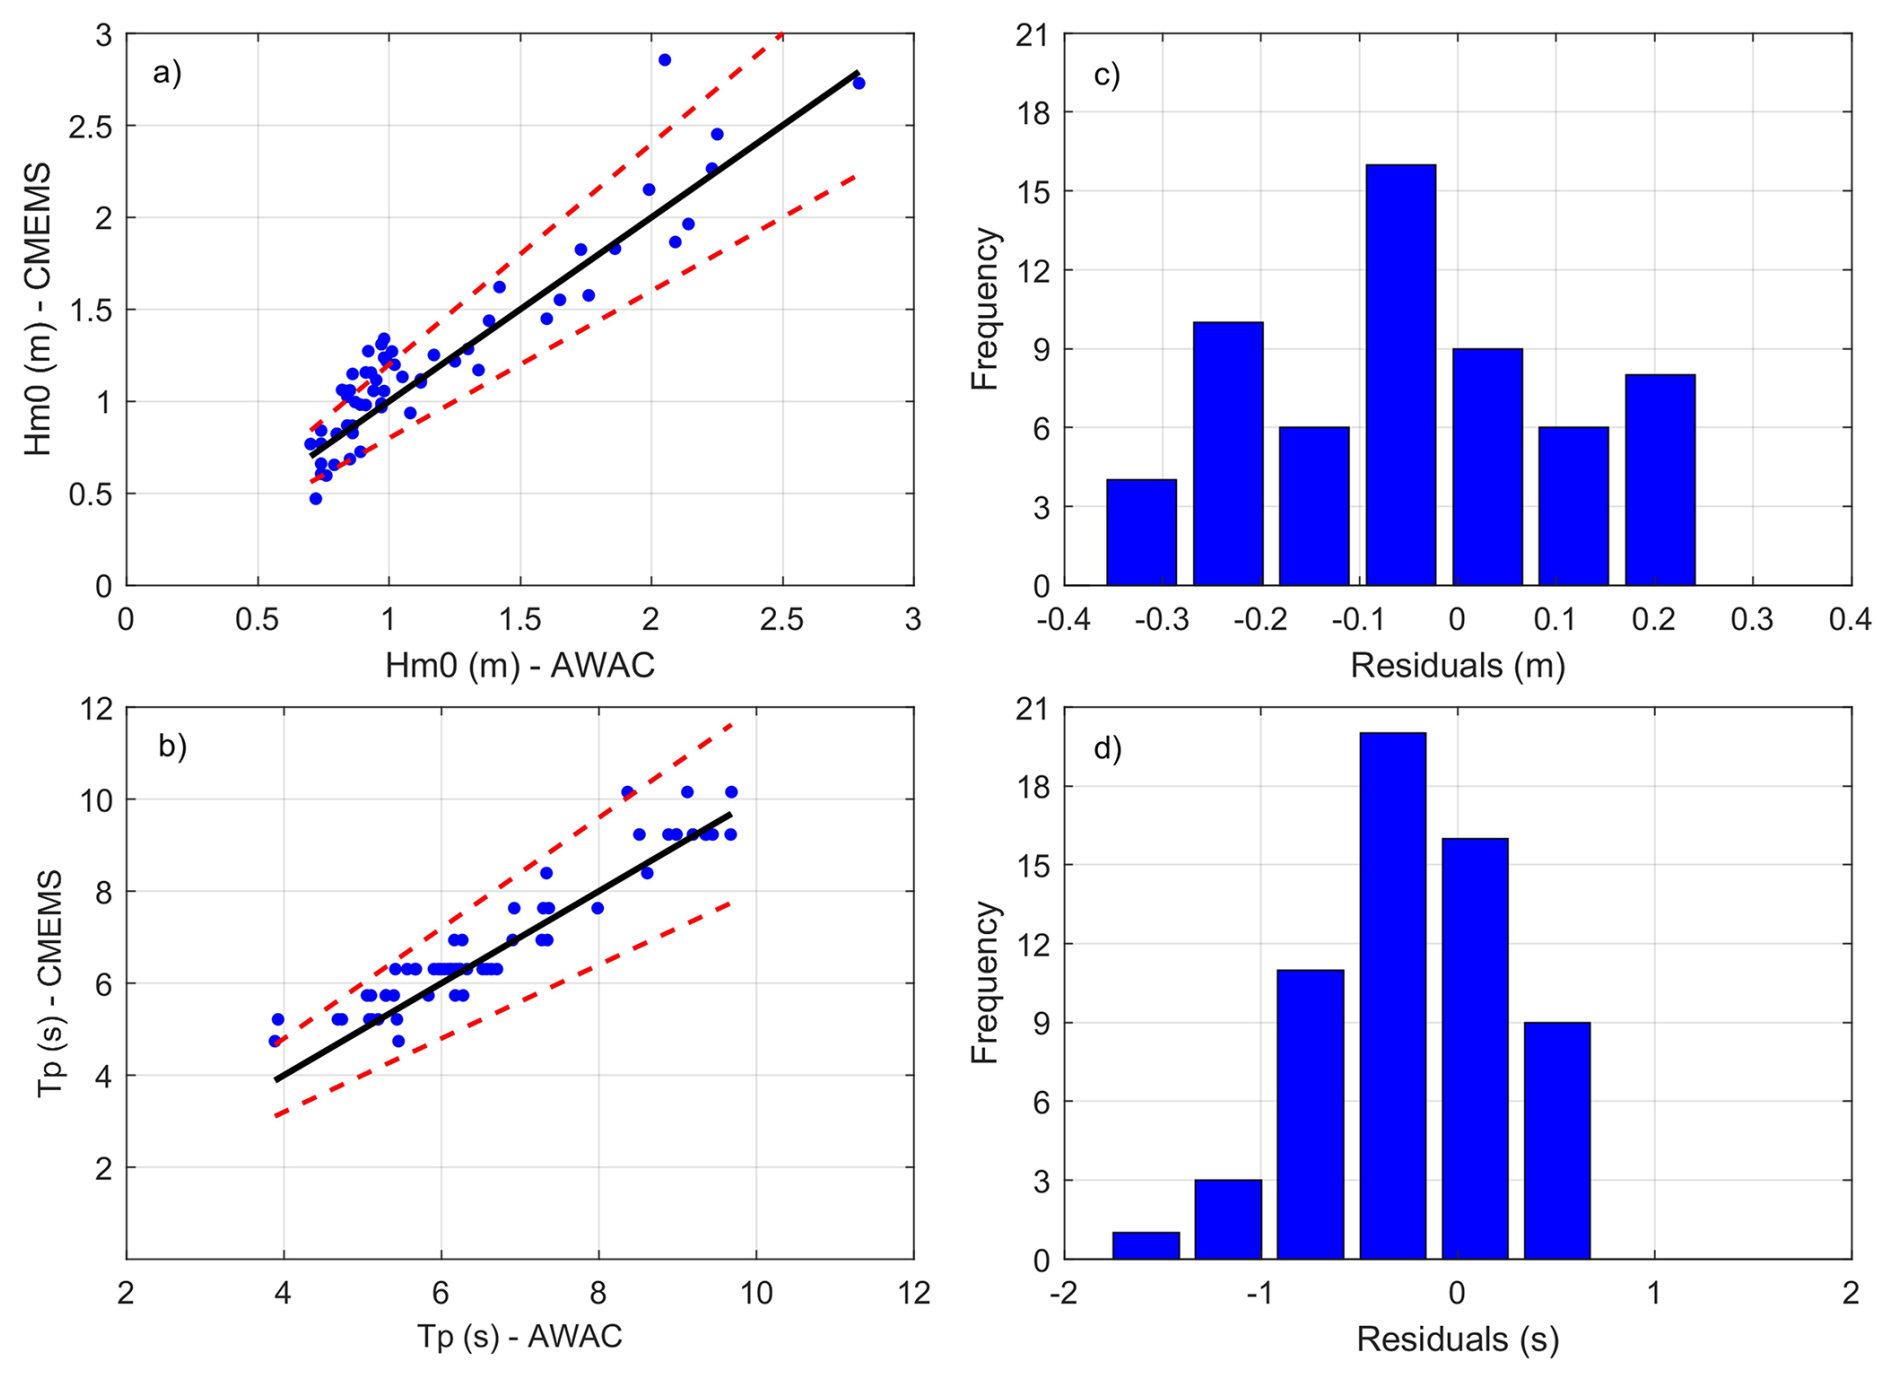
Figure 6(a) Scatter plot of spectral moment wave height (Hm0); and (b) peak wave period (Tp) recorded from the AWAC versus CMEMS re-analysis for the recorded events with Hs > 0.7 m during the examined 45 d period; red lines: 20 % error bounds, black line: perfect matching. (c, d) Error distribution (residuals) amongst the Hm0 and Tp timeseries, respectively.
By examining the scatterplot, it is evident that Hm0 data are well aligned along the 1:1 reference line showing limited spread, indicating very good agreement between CMEMS V-WAV and AWAC data, supported by a strong correlation coefficient (R = 0.93, Fig. 6a) and relatively low negative bias (−0.06 m). MAE is 0.15 m, reflecting the average discrepancy between AWAC and CMEMS records. SMAE has a value of 12.5 %, suggesting relatively low errors when scaled by the observed mean, while RMSE is 0.19 m. Most residuals (AWAC – CMEMS) fall within the range of ±0.2 m, showing that most errors are moderate (Fig. 6c). Regarding peak wave period, the points also align well with the 1:1 line supported by a high correlation coefficient (R = 0.95, Fig. 6b). MAE is 0.42 s, while SMAE is 6.4 %, indicating relatively small errors when scaled by the observed mean, and RMSE is 0.54 s. The residual distribution shows a concentration around zero, with a slight negative bias of −0.24 s, whereas most residuals fall within ±1 s (Fig. 6d), indicating generally small errors. Overall, CMEMS V-WAV forecasts are found to reproduce the recorded wave parameters reasonably well, when higher energetic events are considered.
3.3 Assessment of NEPTUNE-EWS's Performance over the 2022–2024 period
NEPTUNE-EWS, is set to estimate TWL by using empirical equations for wave run-up estimations. The performance of each tested equation during the monitored surge event of the longest duration (event S1) is shown in Fig. 7c–d. Beach conditions during the events were examined through the records of the coastal videocameras. An example of no flooding, limited overtopping (evidenced by partial water coverage or washes of Posidonia oceanica) and extensive overtopping (flooding of the berm-dune zone), is shown in Fig. 7a–b for event S1 at locations P1 and P2. The optical timeseries during each surge event is accessible to readers through the Zenodo platform (Trogu et al., 2026). The wind, sea level and wave components of the selected surge events occurred over the validation period are analytically reported in Appendix B, C and D (Figs. B2, C1, D2 and D3).
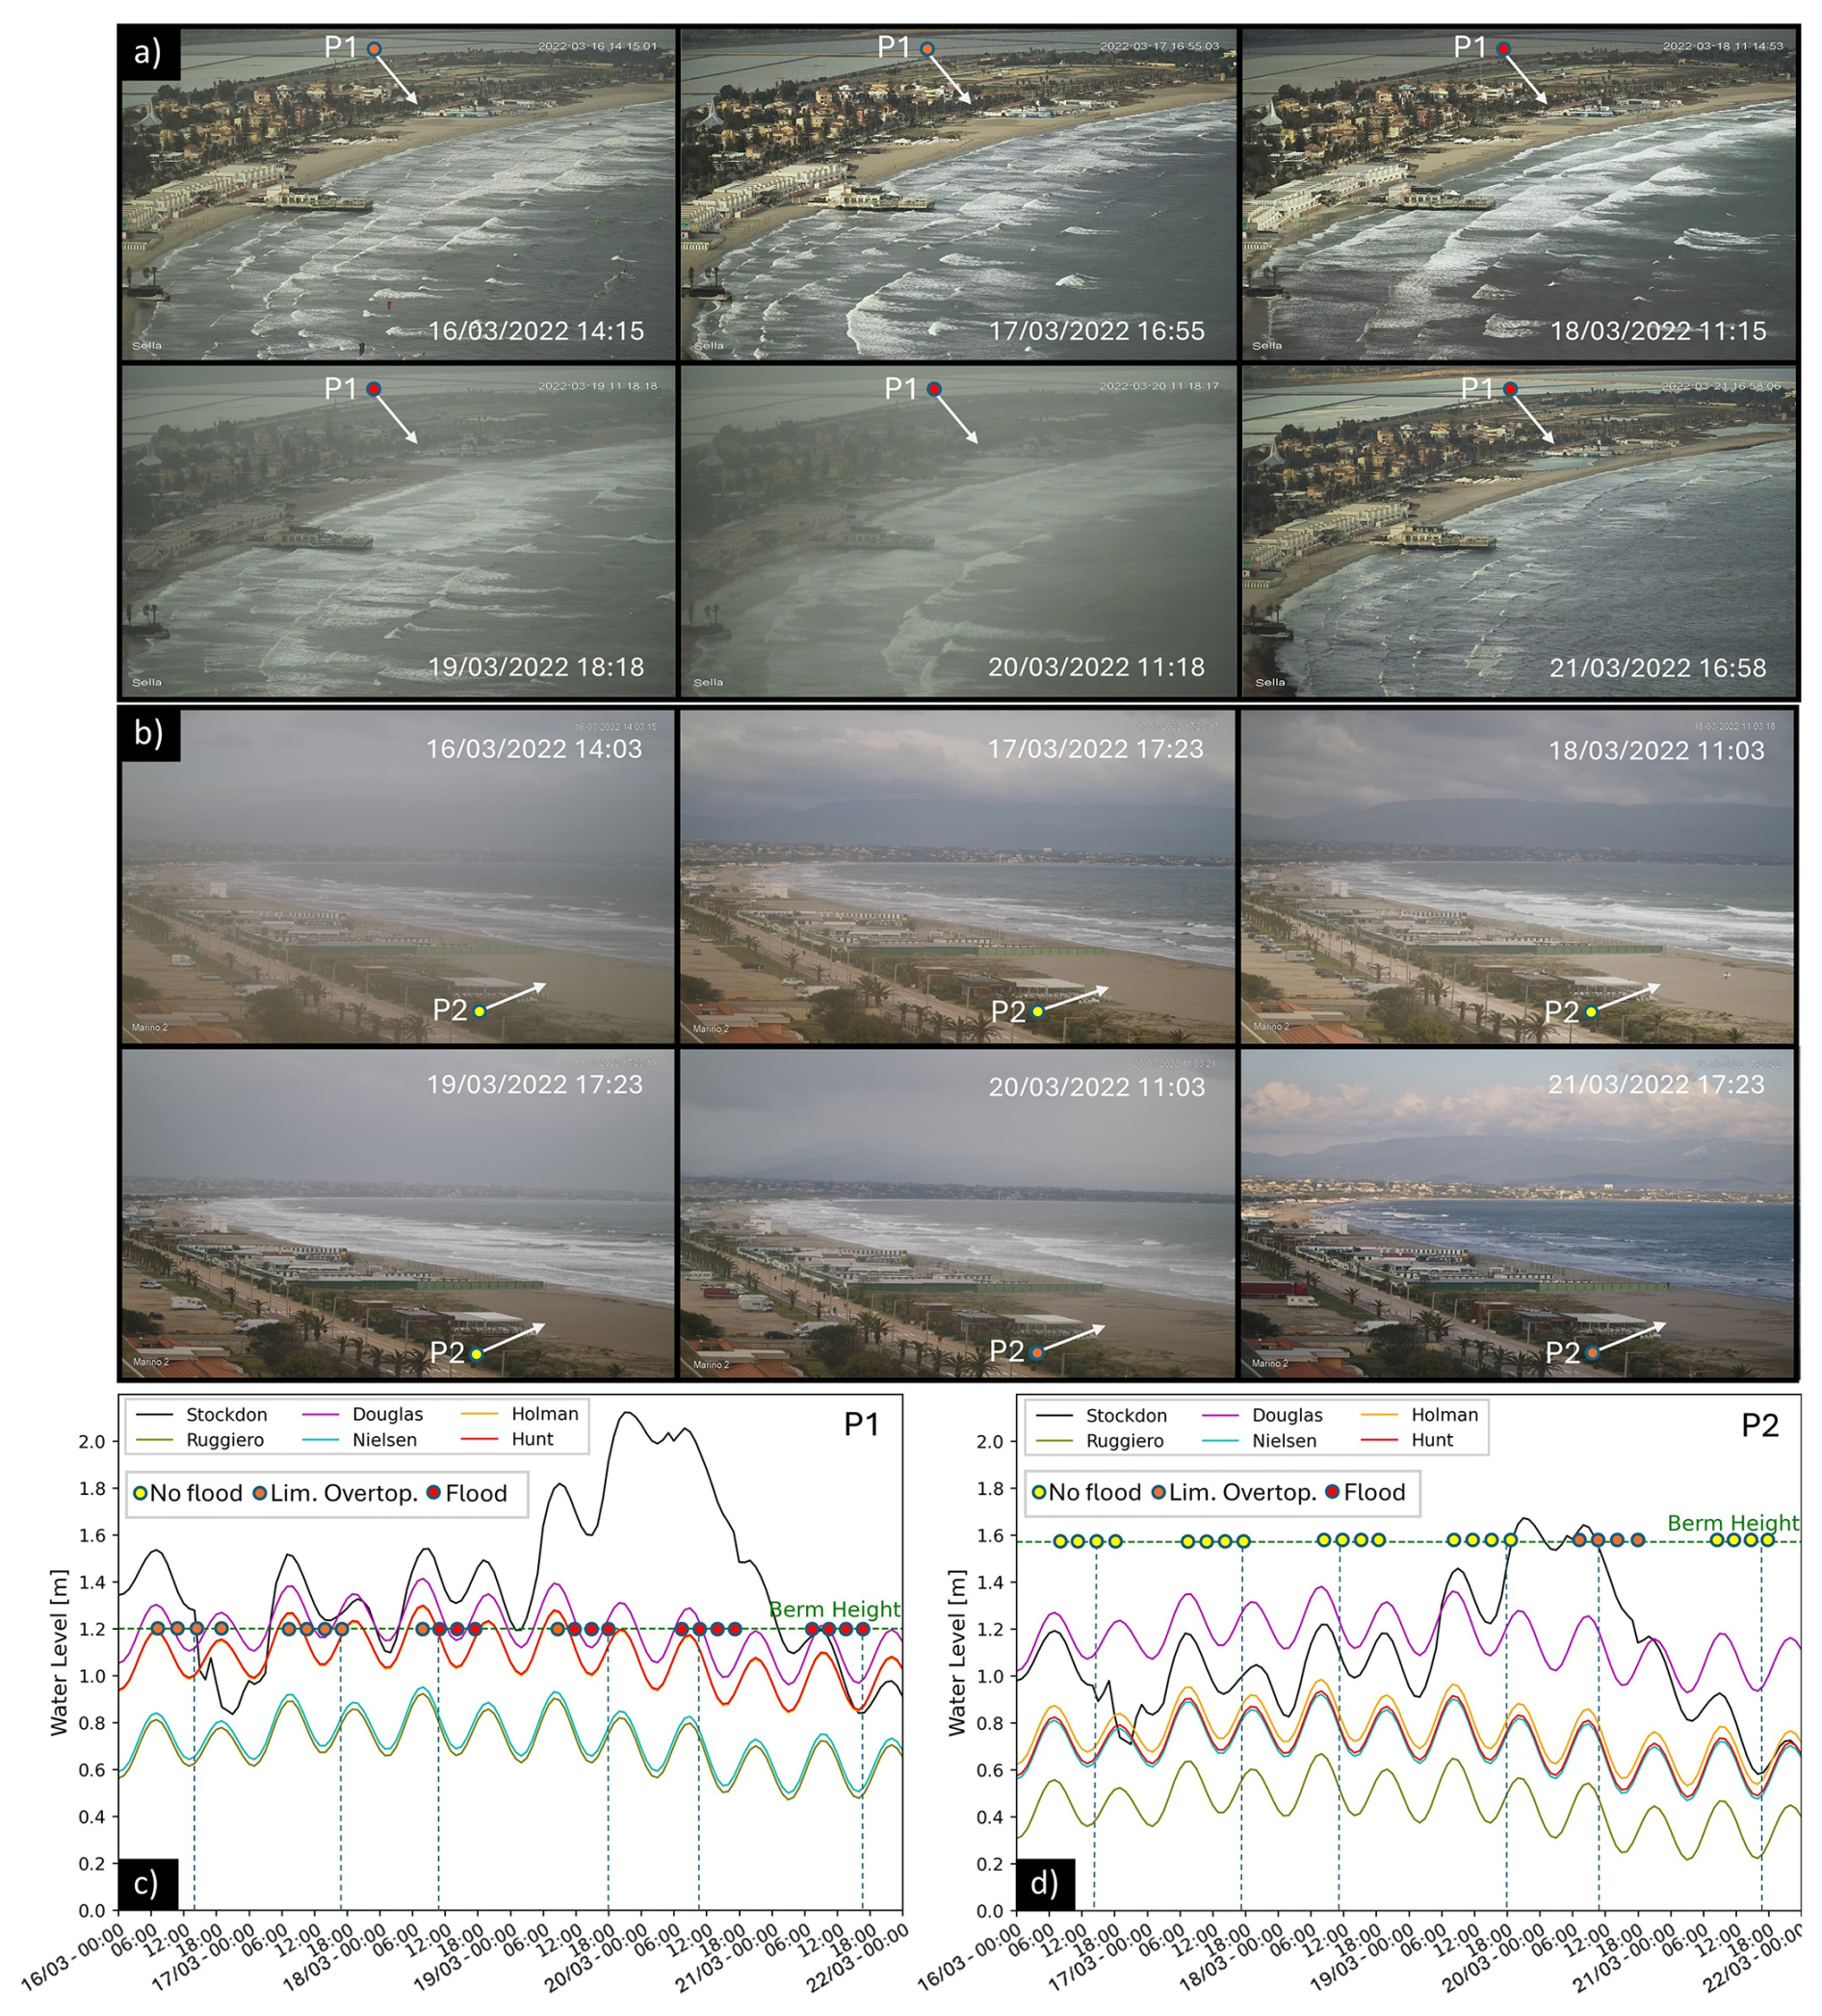
Figure 7(a, b) Selected daily images during event S1 recorded from coastal videocameras CAM1 and CAM2 at locations P1 and P2, respectively. (c, d) Projected Total Water Level (TWL) after the use of six typical empirical equations for wave run-up estimation during event S1 at locations P1 and P2, respectively; points show the monitoring periods of the videocameras and the flood state (optical observations); vertical dashed lines delimit the time during which images shown in panels (a) and (b) were retrieved.
Event S1 (16–21 March 2022) was found to be the most energetic in both intensity (Hm0 > 2 m, peaked at 2.9 m) and duration, during the 2022–2024 monitoring period. TWL forecasts at both P1 and P2 locations reflected the wave sequence (Fig. 8a–b). At location P1, TWL was forecasted to exceed the threshold for 68 h, consistent with overtopping and flooding of the berm-dune zone observed in the optical records. Similarly, at location P2, TWL was forecasted to slightly exceed (by about 0.1 m) the ∼ 1.6 m berm threshold, and for a limited duration (for 6 and 8 h between 19 and 20 March). The forecasts of this event match with the limited overtopping observed from the camera records.
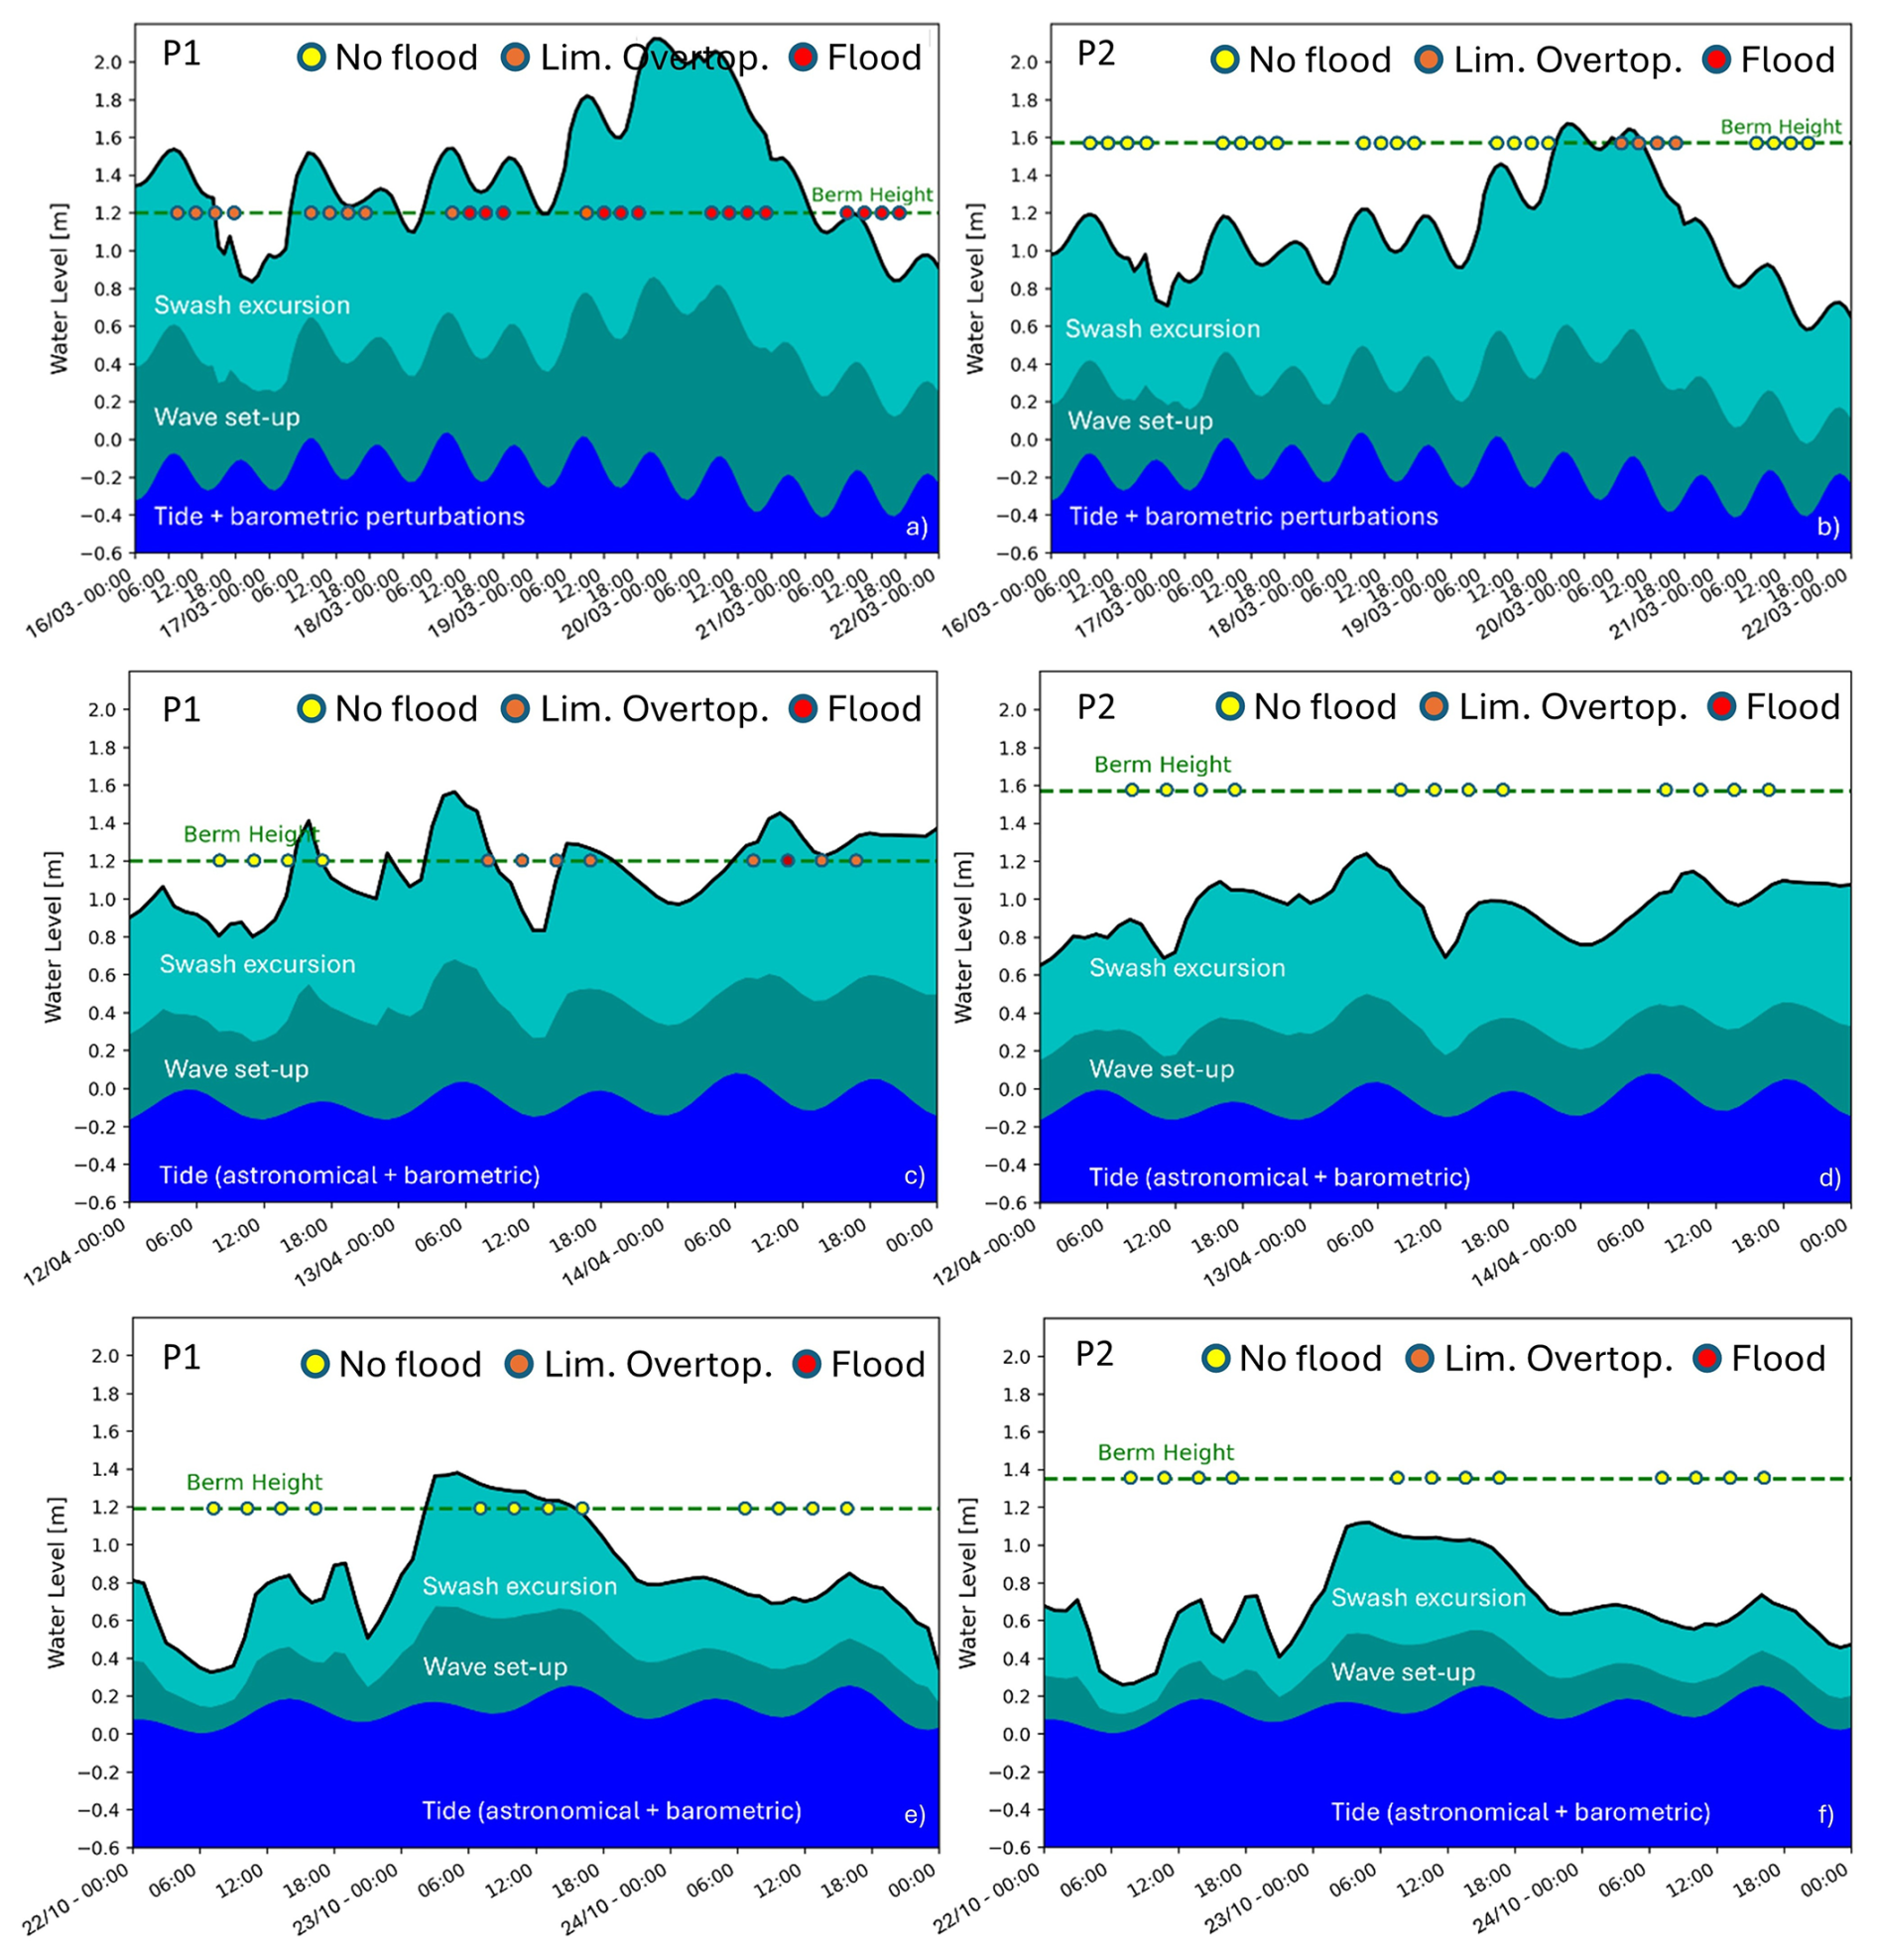
Figure 8Predicted TWL and its components, as well as no flood, limited and extended overtopping (flood) states identified from the coastal videocameras during events (a–b) S1; (c–d) S2; and (e–f) S3, at locations P1 and P2.
During event S2 (12–14 April 2022), forecasted Hm0 ranged between 1.2 and 2.0 m. At location P2, TWL remained below the berm threshold, consistent with the absence of overtopping observations of this period (Fig. 8d). At P1, four overtopping events were forecasted. The last three of this sequence of events of coincided with limited or extensive overtopping (flood) observations from the coastal frames. There was no observed overtopping for the primary event of this sequence, attributed to the low exceedance (< 0.2 m over the berm) and limited duration (4 h) (Fig. 8c). In general, NEPTUNE-EWS forecasts are found to align well with the camera observations.
During event S3 (22–23 October 2023), forecasted Hm0 was generally mild (< 1.0 m) with the exception of 7 h, during which forercasted Hm0 ranged between 1.0 and 1.6 m. At location P2, TWL remained below the berm threshold and no overtopping was observed (Fig. 8f). At location P1, TWL forecasts exceeded the 1.2 m threshold for 15 h (Fig. 8e), but no overtopping was detected on the camera records, likely due to the limited exceedance (< 0.2 m).
During event S4 (29–31 October 2023), forecasted Hm0 peaked at 1.8 m on 30 October before declining. At location P1, TWL forecasts suggested exceedance of the berm threshold by 24 h showing a peak at ∼ 1.8 m on 30 October. These forecasts are confirmed by the limited and extensive overtopping (flooding) sequential events identified by the coastal frames (Fig. 9b). However, at location P2, NEPTUNE-EWS did not capture the limited overtopping observed in the optical data. Forecasted TWL remained below the ∼ 1.4 m threshold, with a single limited exceedance on 30 October (Fig. 9b).
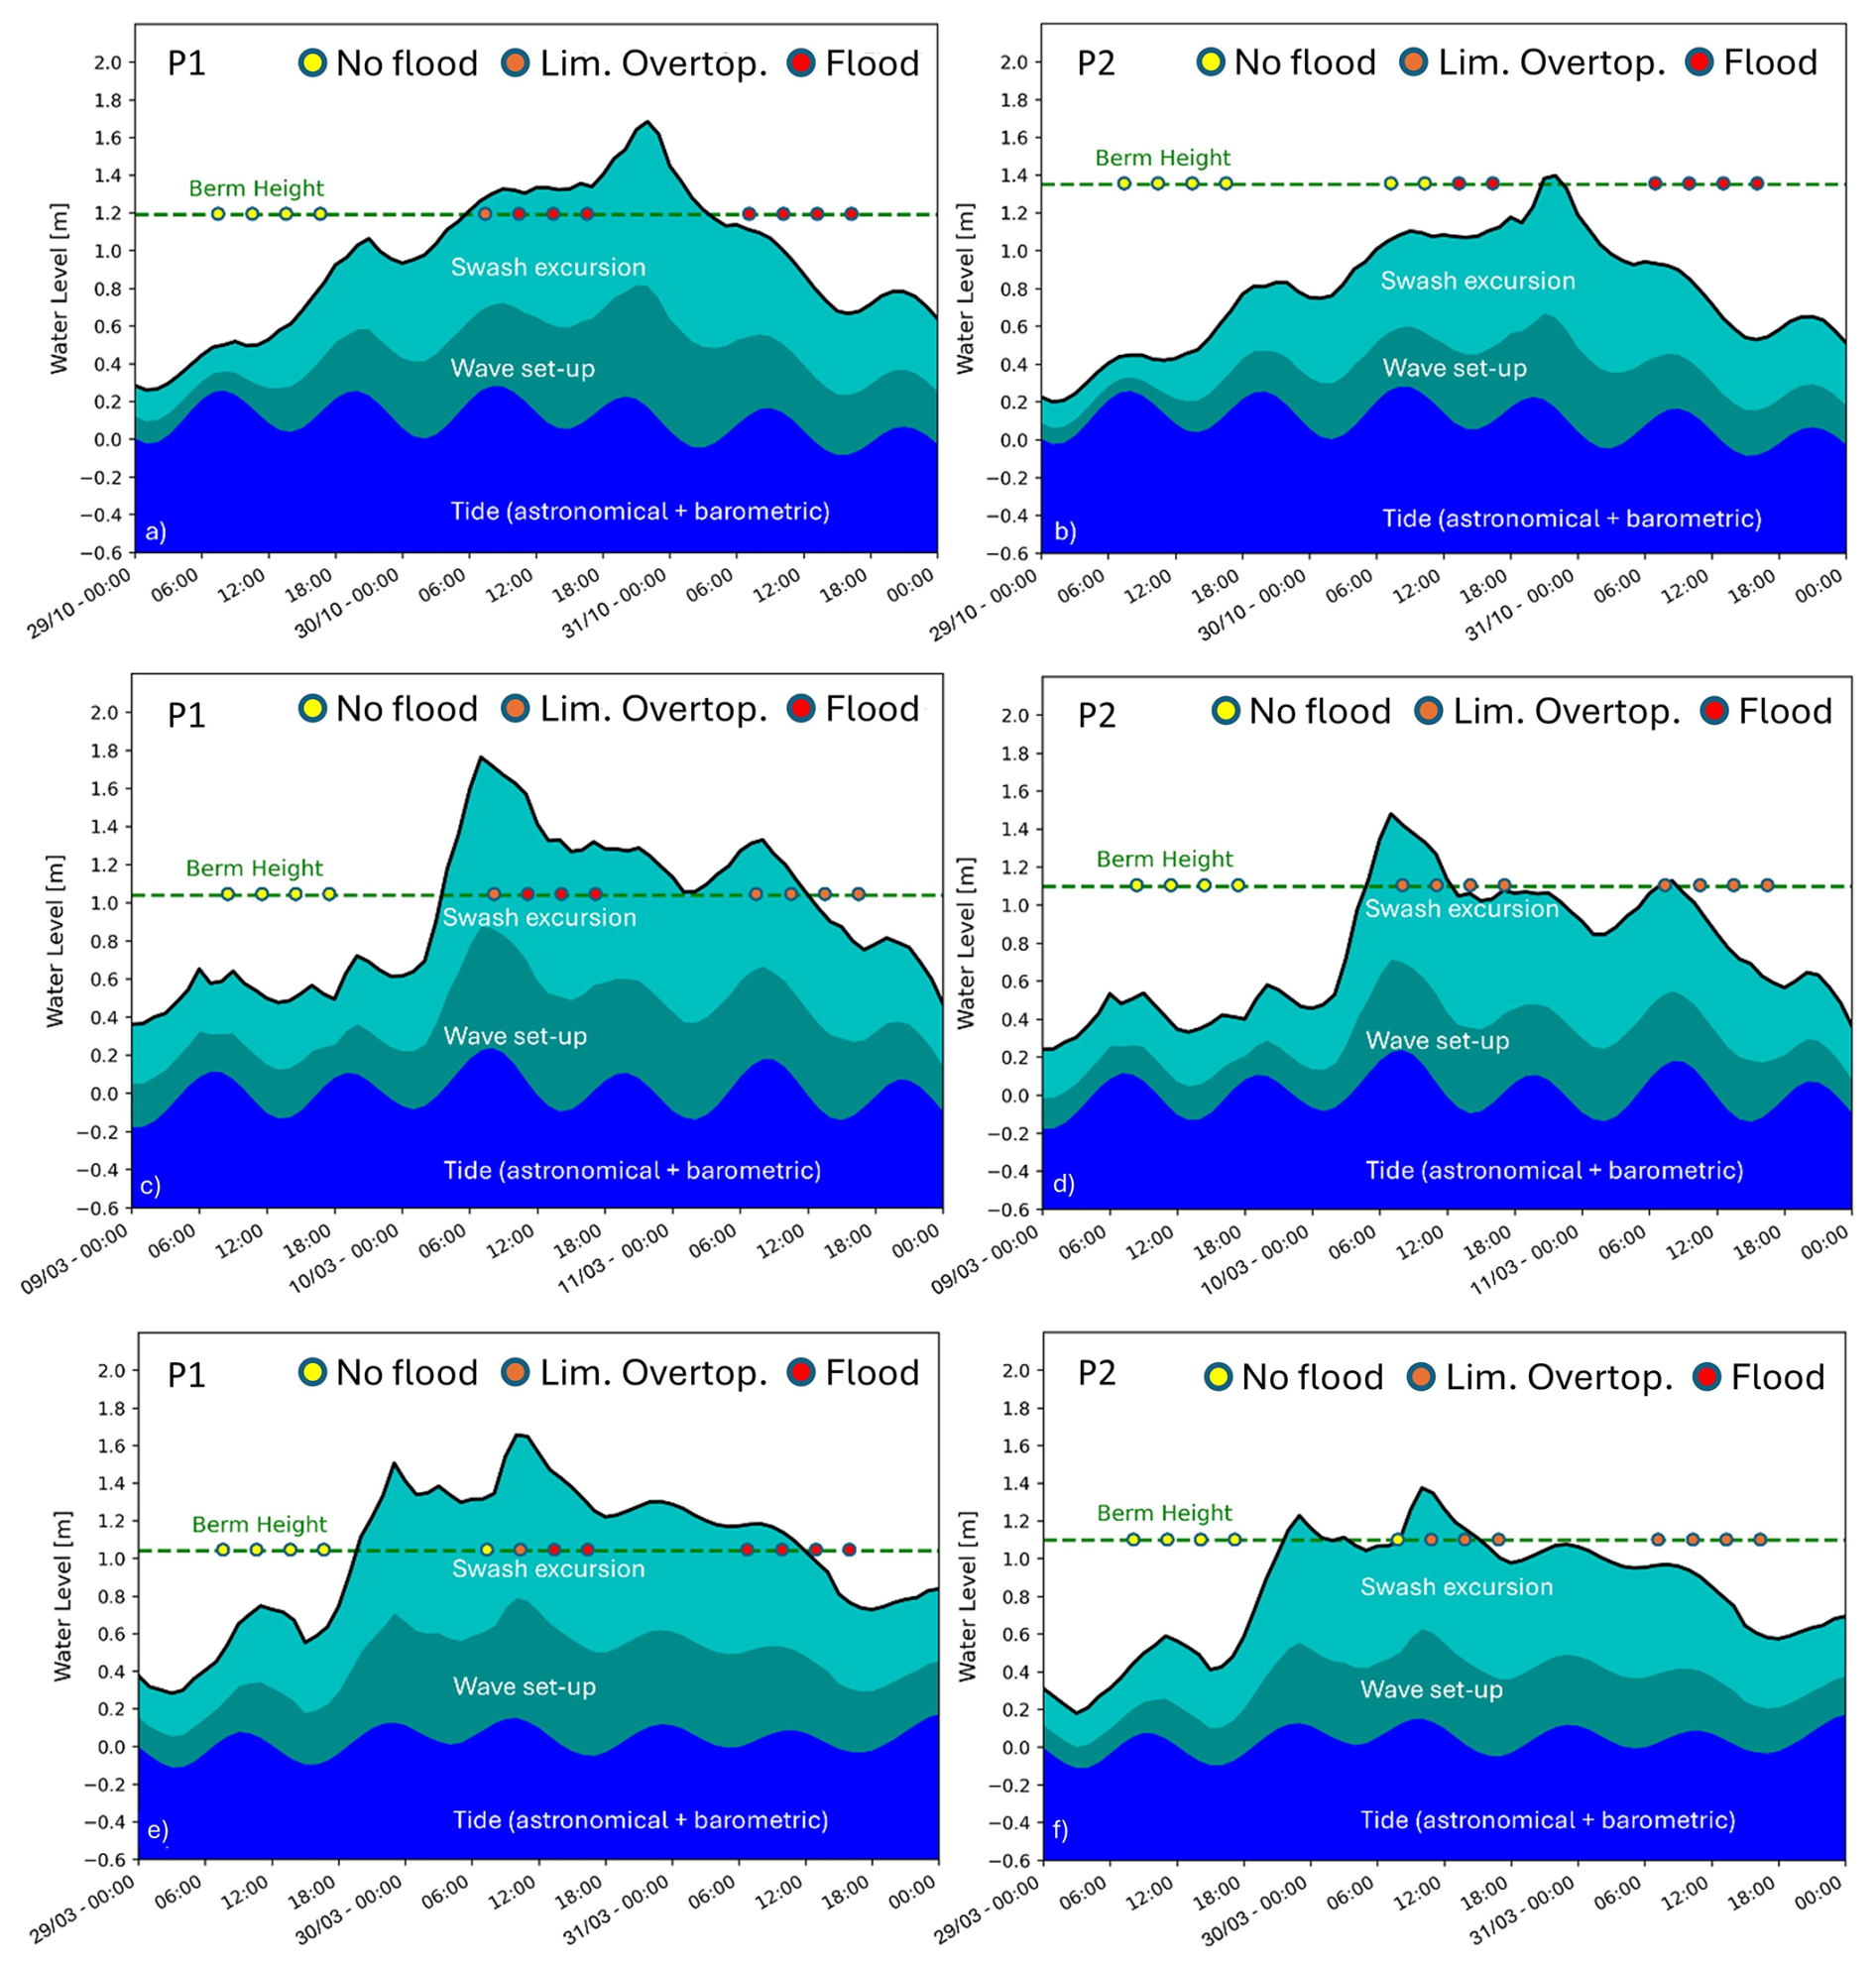
Figure 9Predicted TWL and its components, as well as no flood, limited and extended overtopping (flood) states identified from the coastal videocameras during surge events (a–b) S4; (c–d) S5; and (e–f) S6 at locations P1 and P2.
Event S5 (9–11 March 2024) shows a similar sequential pattern with even S3, being however more energetic (forecasted Hm0 peaked at 1.6 m on 10 March). At location P1, TWL exceeded the berm threshold for 30 h (up to 0.8 m of exceedance. The trends of this event (peaks and declines) are consistent with the visual observations (Fig. 9c). At location P2, overtopping was observed on the coastal frames on 10 and 11 March, coinciding with TWL exceedances of the 1.1 m berm threshold (up to 0.3 m for 8 h during the first exceedance (Fig. 9d).
During event S6 (29–31 March 2024), forecasted Hm0 remained above 1.0 m for 53 h with corresponding increases in TWL forecasts. At location P1, TWL forecasts slightly exceeded (up to 0.2 m) the 1.2 m threshold for most of this period. At the same time, there was no overtopping observed from the records of the coastal videocameras 12 h after the starting hour of projected TWL. However, limited overtopping is observed at the next available record (at 11:00 CEST, UTC+2) followed by extensive overtopping and flooding of the berm-dune zone, suggesting accurate early warning by the system (Fig. 9f), At location P2, TWL exceedance occurred during two short intervals (for 3 and 6 h) on 30 March (Fig. 9f). From the camera records, limited overtopping was first identified at 11:00 CEST, coinciding with the maximum TWL forecast of this event (1.4 m).
Overall, NEPTUNE-EWS forecasts showed good consistency with the optical observations across the six surge events monitored during the 2022–2024 period. Threshold exceedance at location P1 was more frequent and of longer duration compared to P2, reflecting site-specific morphological controls. In most cases, times of limited overtopping and flooding corresponded well with the forecasted periods of TWL exceedances. Discrepancies are mainly attributed to limited exceedances (< 0.2 m), and especially during short durations (less than 6 h), or/and uncertainties in berm elevation. The observed limited exceedances of the berm threshold at times when no overtopping was observed on the coastal frames (at P1 during S2, S3 and at P2 during S6) was considered to adjust the error margin (set at 20 % of the morphological threshold in this case), used for flood risk assessment by NEPTUNE-EWS (see Sect. 2.2). The results suggest that the system can reliably capture the timing and intensity of overtopping events, though local morphological variability remains a key factor in prediction accuracy.
3.4 A benchmarking test: The passage of Cyclone Harry, 19–22 January 2026
During the passage of Cyclone Harry, the hydrodynamic conditions (waves and sea level) exhibited distinct patterns. Forecasted zero-moment wave height values at the validated CMEMS V-WAV point (located at 18 m depth, and the closest to the beach – see Fig. 1b) increased from 1.0 m on 19 January at 01.00 to 3.0 m at 19:00, peaking at approximately 4.7 m on 20 January at 05:00 and at 15:00, before gradually decreasing through the rest of the event (Fig. 10). Peak wave periods were also forecasted to increase with a similar trend from about 6.2 s to about 13.5 s until the event's peak but remained relatively high till the end of the event. Forecasted sea level was found to range between −0.05 and 0.39 m during the event. The highest level occurred on 20 January at 09:00, coinciding with the period between the wave height peaks.
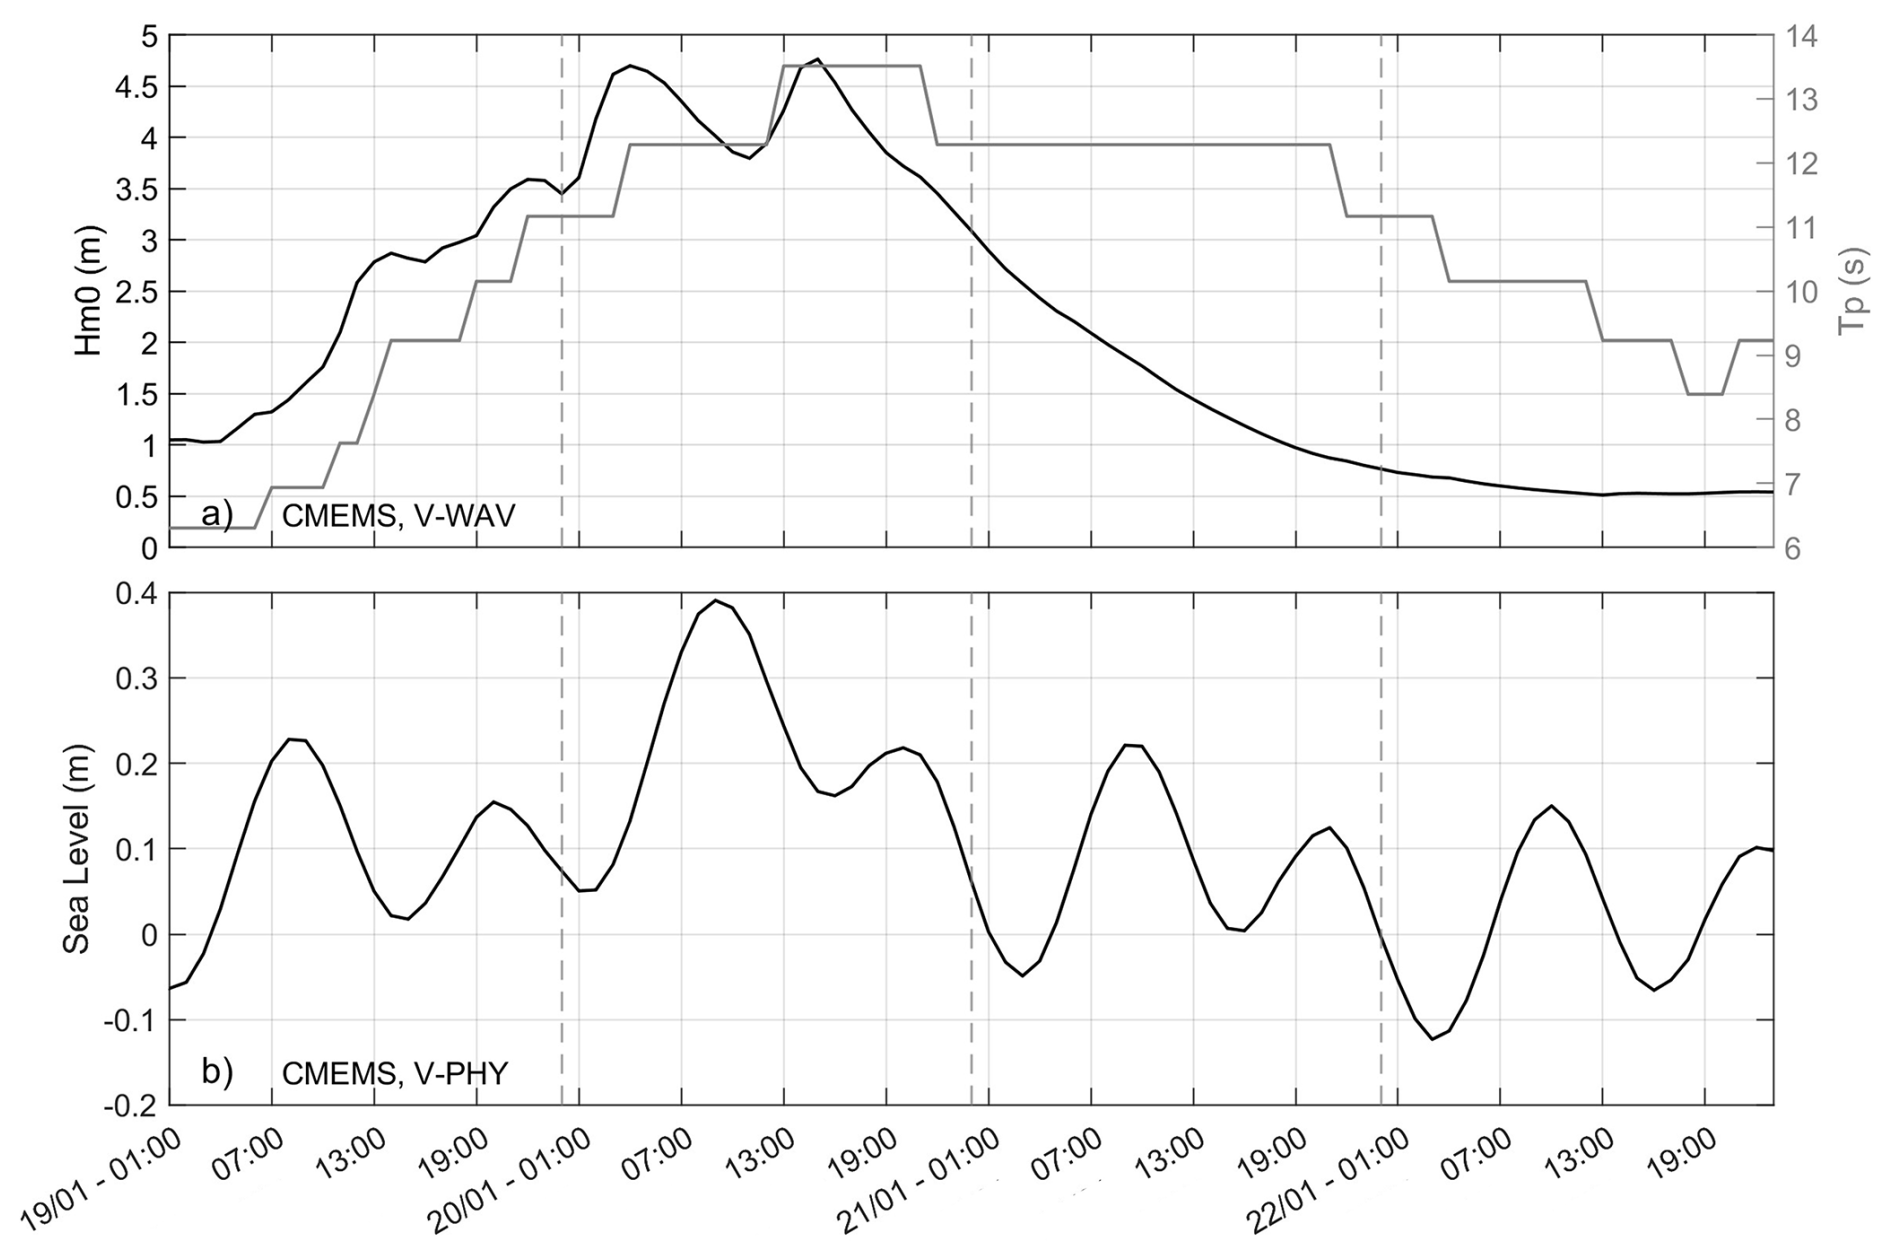
Figure 10(a) Forecasted zero-moment wave height (Hm0) and peak-wave period (Tp) at the location of CMEMS, V-WAV virtual buoy; and (b) forecasted sea level at CMEMS, V-PHY point (see also Fig. 1b).
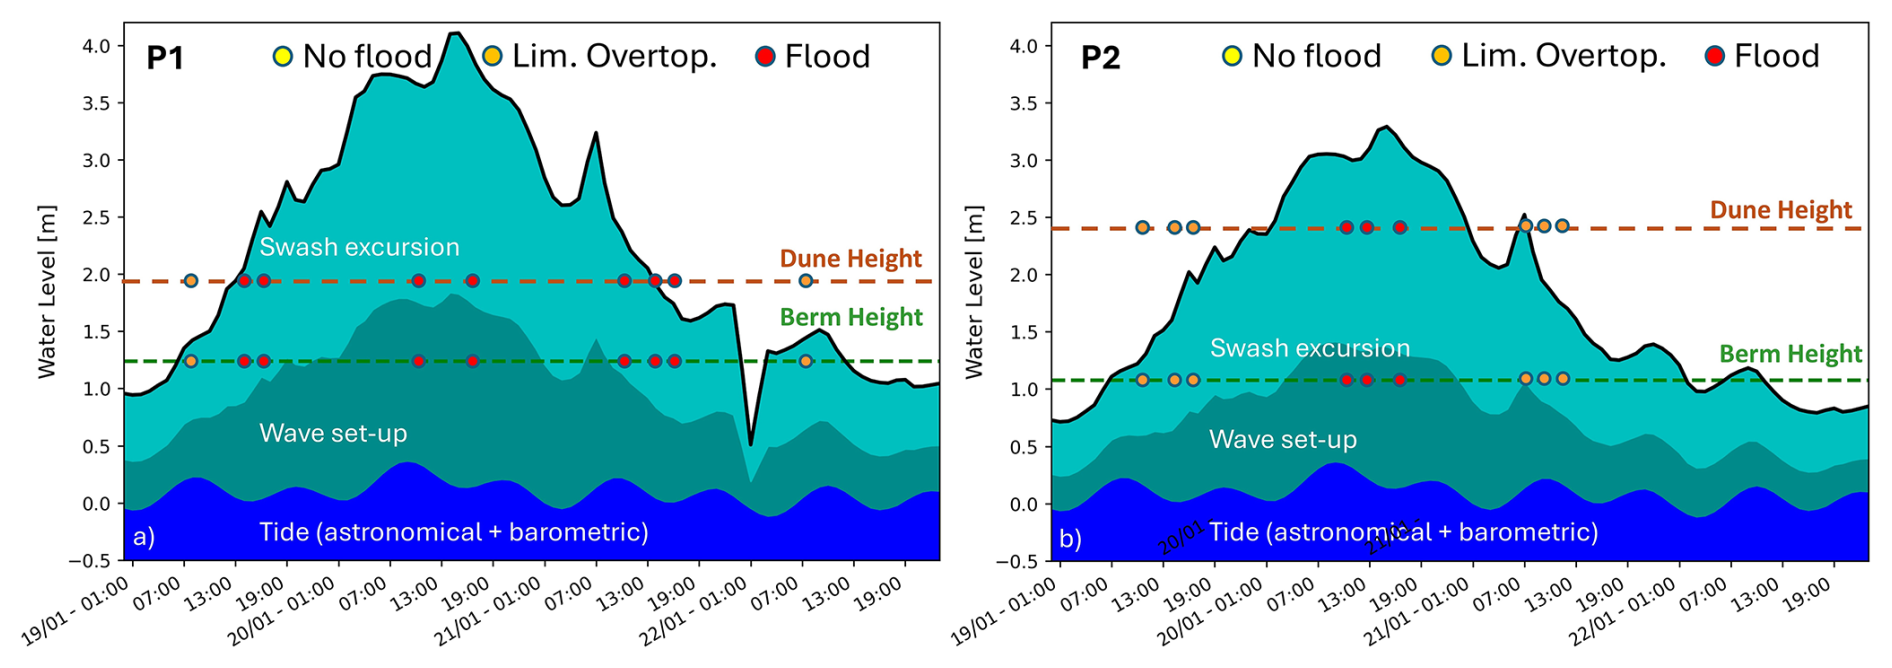
Figure 11Predicted TWL and its components, as well as no flood, limited and extended overtopping (flood) states identified from the coastal videocameras during Cyclone Harry (19–22 January 2026). The berm and dune heights for each P1 and P2 locations recorded prior to the event (on 16 January 2026) are also shown.
TWL forecasts during the passage of Cyclone Harry show good agreement with the available records of the coastal videocameras, that show sea water overtopping the dune system at the beach (Fig. 11, see also Trogu et al., 2026). Times when TWL was predicted to exceed the dune height, are in agreement with the captures of the coastal videocameras in both locations. Notably, cases of forecasted TWL exceeding the berm threshold, but at the same time not overtopping the dune height, were found to match with captured flooding states. Furthermore, NEPTUNE-EWS accurately captured the flooding sequence (rising and recession) at P1 and P2 locations, aligning with the timing of the available frames derived from the cameras (i.e. adverse weather conditions hindered clear image retrieval at specific times). For instance, the limited overtopping state observed in P1 at the beginning of this extreme (19 January 2026 at 08:00) followed by a flood state after 4 h (at 14:00) and the flooding state of the same location observed on 21 January 2026 followed by a limited overtopping state observed the next day. Similarly, in P2, the forecasted TWL found to exceed the dune height occur at moments of observed flooding state, whereas limited overtopping is observed at times of berm (but no dune) exceedance (with the exception of a peak on 21 January 2026 at 08:00).
The forecasted wind and sea level data generally aligned well with the in situ records of the meteorological station and the tide gauge for the examined 2.5-year period demonstrating similar trends. The forecasted wind directions at the location of the ECMWF point are found to be consistent with the meteorological station records. However, ECMWF wind velocity forecasts were found to be generally underestimated compared to the wind records, particularly for high values. It is important to consider that ECMWF forecasts are provided at a point located at a distance of 11.2 km offshore the meteorological station, which is deployed at a low elevation inside the port of Cagliari and may reflect sheltering of the headland and relief of Sella del Diavolo that delimits the bay (see Fig. 1b). Nevertheless, the latest up-to-date analytical studies that examined ECMWF U10 forecasts against in situ records, agree that predictions tend to systematically underestimate wind velocity (U10), with a similar rate (e.g. Cavaleri et al., 2024; Haiden et al., 2024). Comparison of the wave characteristics between the AWAC records and CMEMS V-WAV re-analysis data are found to align reasonably well. Spectral moment wave heights and peak wave periods deriving from CMEMS are found to be slightly overestimated, especially at times of lower conditions. Regarding wave direction, a difference of about 20–25° is observed at periods of increased wave heights while there are deviations in the prediction of secondary parameters (see Appendix D). Such discrepancies are a common issue in wave modeling, particularly in coastal regions (e.g. Ruju et al., 2019; Alday et al., 2022; Oikonomou et al., 2023; Korres et al., 2021, 2023). Sea level forecasts provided from CMEMS V-PHY, are found to be in good agreement with the tide gauge records showing slight underestimations during high-water periods. This consistent underestimation could be explained by the spatial offset between the CMEMS grid point and the tide gauge location but also aligns well with the findings of recent studies (e.g. Irazoqui Apecechea et al., 2023; Pérez-Gómez et al., 2024). Despite these minor discrepancies, sea level forecasts successfully captured the evolution trends of the recorded timeseries.
The outperformance of Stockdon et al. (2006) formula is consistent with relevant studies that evaluated the capability of several wave run-up predictors on sandy beaches with mild foreshore slopes under increased wave action, despite reported cases of underestimations (e.g., Vousdoukas et al., 2009; Vousdoukas et al., 2012; Senechal et al., 2011; Paprotny et al., 2014; Aniskiewicz et al., 2016; Cohn and Ruggiero, 2016; Atkinson et al., 2017; Gomez da Silva et al., 2020; Bujak et al., 2023). Regarding the contribution of both wave set-up and swash excursion components in TWL, it is evident that the inclusion of wave conditions provided the most realistic results. This comes in contrast with the findings of previous studies, which suggest that TWL can be approximated as the sum of the mean sea level, tide and level variations associated with storm surges (Rulent et al., 2020; Caruso and Marani, 2022; Croteau et al., 2023). Moreover, Cabrita et al. (2024) provided a detailed investigation of the different methods used for TWL estimations and concluded that the approaches which involve calculating extreme values from a combined time series or the water level time series plus the extreme value of wave setup, yield the most realistic results, excluding the wave run-up (in this case swash excursion) component. It seems that the selection of individual TWL components is a complicated task, being subjected by limitations arising from the spatial resolution used for the computation of TWL.
The NEPTUNE-EWS proved to be capable of providing accurate predictions, showing good agreement with the seven surge events of different magnitude monitored by the coastal videocameras, especially during periods of energetic conditions. Overall, it was found that at times when the projected TWL exceeded the morphological threshold by more than 0.2 m for a duration greater than 6 h, limited or extensive overtopping (flooding state in the case of Poetto) was recorded by the coastal videocameras. This was considered in establishing an error margin of 20 % over the morphological threshold.
Nearshore morphological beach features exert significant control on the morphodynamic response of beaches during sequences of storm events. Variations in nearshore bathymetry (such as bar migration and changes in beach slopes) are major factors in modulating wave attenuation, run-up and erosion. The importance of considering site-specific variability of such morphological features in predictive models is highlighted by several studies, as even moderate bathymetric changes can significantly alter nearshore wave energy dissipation and inundation extent by several studies (e.g. Vousdoukas et al., 2012; Coco et al., 2013; Eichentopf et al., 2019; Oo et al., 2023). In the case of Poetto, foreshore slope did not show any significant differentiation, and NEPTUNE-EWS proved to provide realistic TWL estimates. However, for other types of beaches where nearshore morphology varies substantially over time, frequent updates of beach morphology are essential to maintain accurate predictions.
In comparison to other localized EWSs that similarly integrate hydrodynamic modeling with empirical wave run-up estimates, NEPTUNE-EWS utilizes a different approach. For example, the system implemented in Emilia-Romagna is based on beach width, expressed as absolute value or distance between the maximum TWL and the buildings located on the backshore (Harley et al., 2012), whereas the system used for three urban beaches in Barcelona is based on the predicted flood extent at times when forecasted Hs exceeds a 2 m threshold (Sánchez-Artús et al., 2025).
Future improvements should include updates of the morphological threshold based on field data. Mediterranean beaches show a marked difference between winter and summer profiles, as in the fair-weather season wave action is moderated. The inclusion of a representative beach morphology is two-fold. A first possibility could involve carrying out a survey at the end of the period of highest wave activity (e.g. in May/June) and one at the end of the fair-weather period (e.g. October). To account for seasonal variations, representative winter-summer seasonal profiles can be extracted from topographic data of adequate temporal coverage, using statistical and clustering techniques (e.g. Zhao et al., 2020; Athanassiou et al., 2021; Otto et al., 2021). Such techniques can identify seasonal changes and trends in key nearshore topo-bathymetric features (i.e. dune, berm and bars) driving the run-up. The latter approach may prove to improve forecast realism, without the need for frequent updates of the beach topo-bathymetry.
Even though calibrated and validated hydrodynamic models provide consistent information on TWL and can be checked with predefined alert thresholds, these models do not consider hydro-morphodynamic interactions. Therefore, incorporating effective methods for modeling beach hydro-morphodynamics like coupling spectra model with a wave-resolving sediment transport model (for instance SWAN and XBeach) could account for the changing morphology during the event, where beach erosion would change beach characteristics and ultimately the slope with a large control on wave run-up values. However, the benefits are constrained if nearshore bathymetry is not frequently updated, which is practically challenging. Furthermore, the use of such a modeling chain would require significant computational time and effort for calibration of the model parameters, considering that default configuration is found to overestimate changes in beach morphology (e.g. Biolchi et al., 2022).
Other approaches like the Bayesian network-based system of Garzon et al. (2023) introduce probabilistic assessments of flood likelihood, whereas NEPTUNE-EWS follows a deterministic approach. Future improvements could include incorporating probabilistic methods or/and deterministic ANNs to enhance forecast reliability under uncertain wave and surge conditions, similar to the approach of Zampato et al. (2016). Finally, the integration of one or more machine learning algorithms operating in parallel with the same input parameters could provide an alternative approach for TWL forecasting and allow comparisons.
This study presents an early warning system for coastal flooding operating at Poetto beach. The system integrates wind, wave and sea level forecasts, from widely used databases (ECMWF and CMEMS), whose accuracy has been checked against in situ records. Although slight differences were observed, these are attributed to the spatial offset between the forecasted points and the locations of the in situ measurements. Nevertheless, forecasted data are found to have successfully captured the overall trends. The system provides TWL estimates to predict coastal flooding at a local/beach scale. Results showed that forecasted wind, wave and sea level data generally aligned well with the in situ records. For the case of the intermediate slope of Poetto beach, among the tested wave run-up parameterizations, the estimates based on the formulae of Stockdon et al. (2006) were found to provide the most realistic results when incorporated into the TWL calculation.
NEPTUNE-EWS proved to be a reliable tool for forecasting episodic flooding in Poetto, with its predictions aligning well with the monitored surge events. The system's ability to replicate storm events, particularly during high-energy conditions such as Cyclone Harry, underscores its utility in coastal risk management and flood forecasting at a localized/beach scale. The findings point out the need for continuous updates of the morphological thresholds. Future improvements should focus on incorporating a module to enhance the reliability of CMEMS and ECMWF forecasts, as well as a parallel module that employs machine learning algorithms capable of providing accurate TWL forecasts with significantly reduced computational costs. Future research could also examine the integration of numerical models capable of simulating nearshore hydro-morphodynamics in greater detail (e.g. coupling SWAN and Xbeach) and assess its operational efficiency, despite practical limitations arising by the need for frequent bathymetric updates, and additional computational challenges that must be considered.
The specific wind, wave, and sea-level forcing parameters extracted from ECMWF and CMEMS forecasts, and used by the NEPTUNE-EWS system are reported in the table below.
Table A1Wind, wave and sea level forcing parameters as extracted/used by NEPTUNE-EWS to simulate coastal hydrodynamics. The CMEMS Med-WAV (mentioned in this work also as V-WAV) re-analysis product used for validation of the wave climate is also reported.
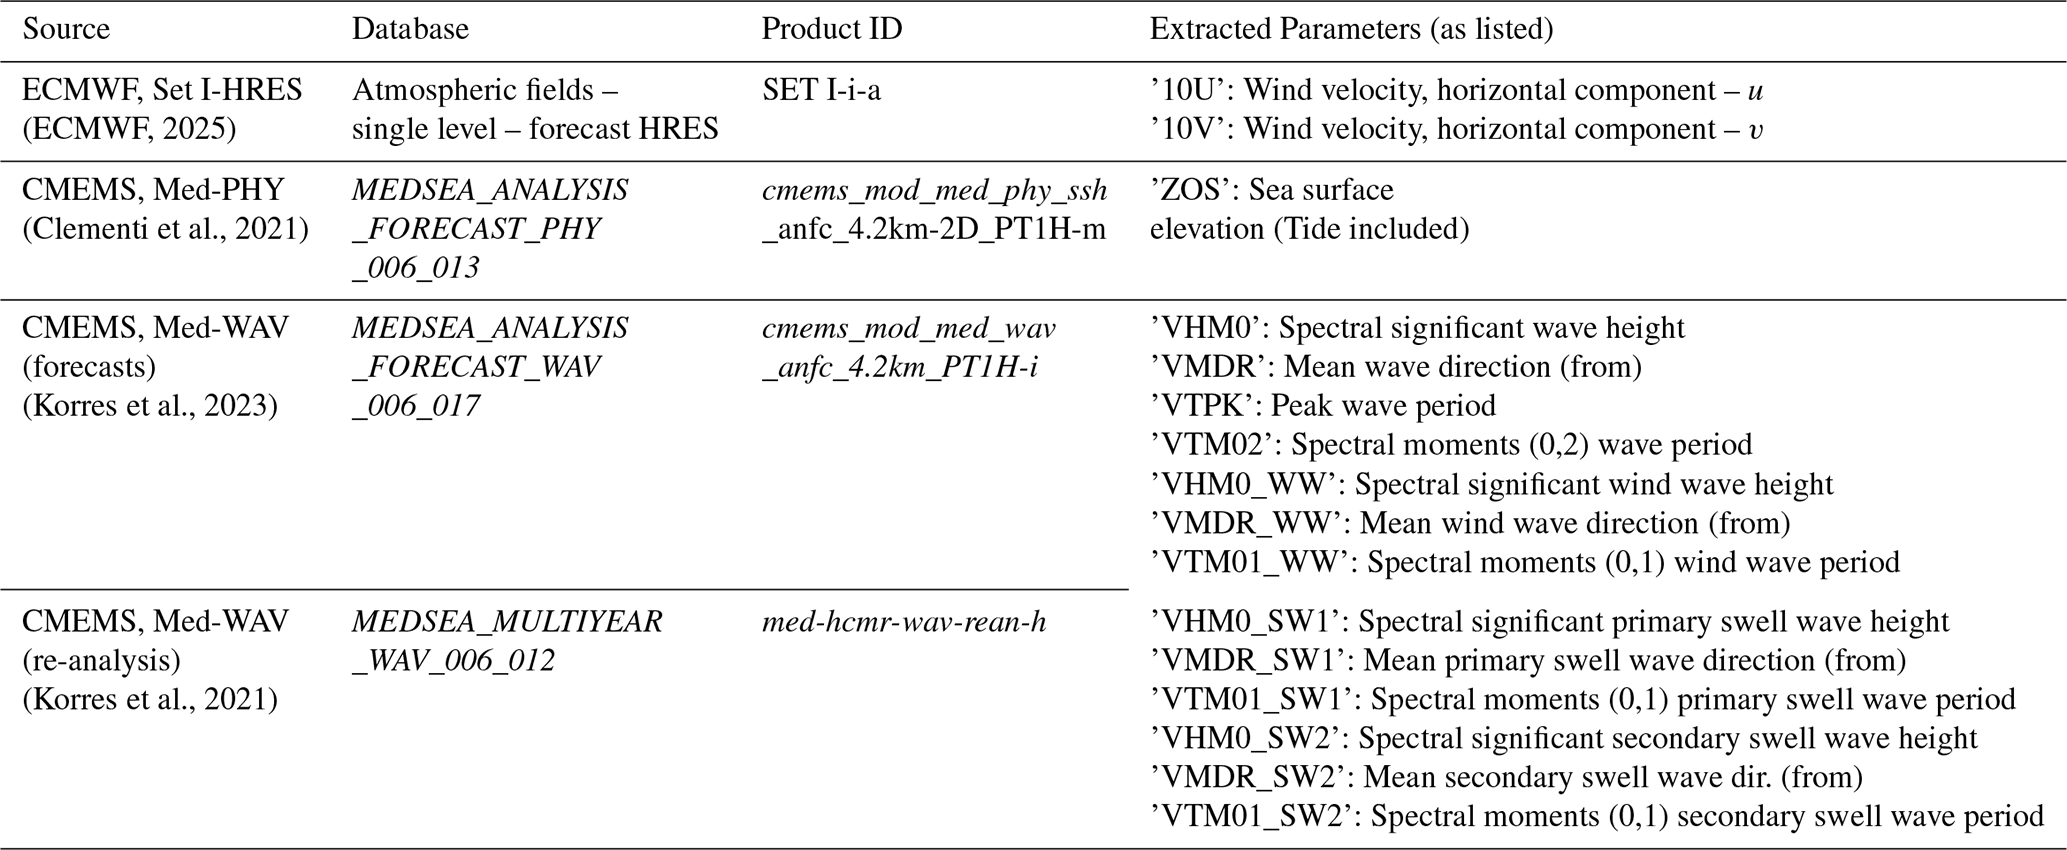
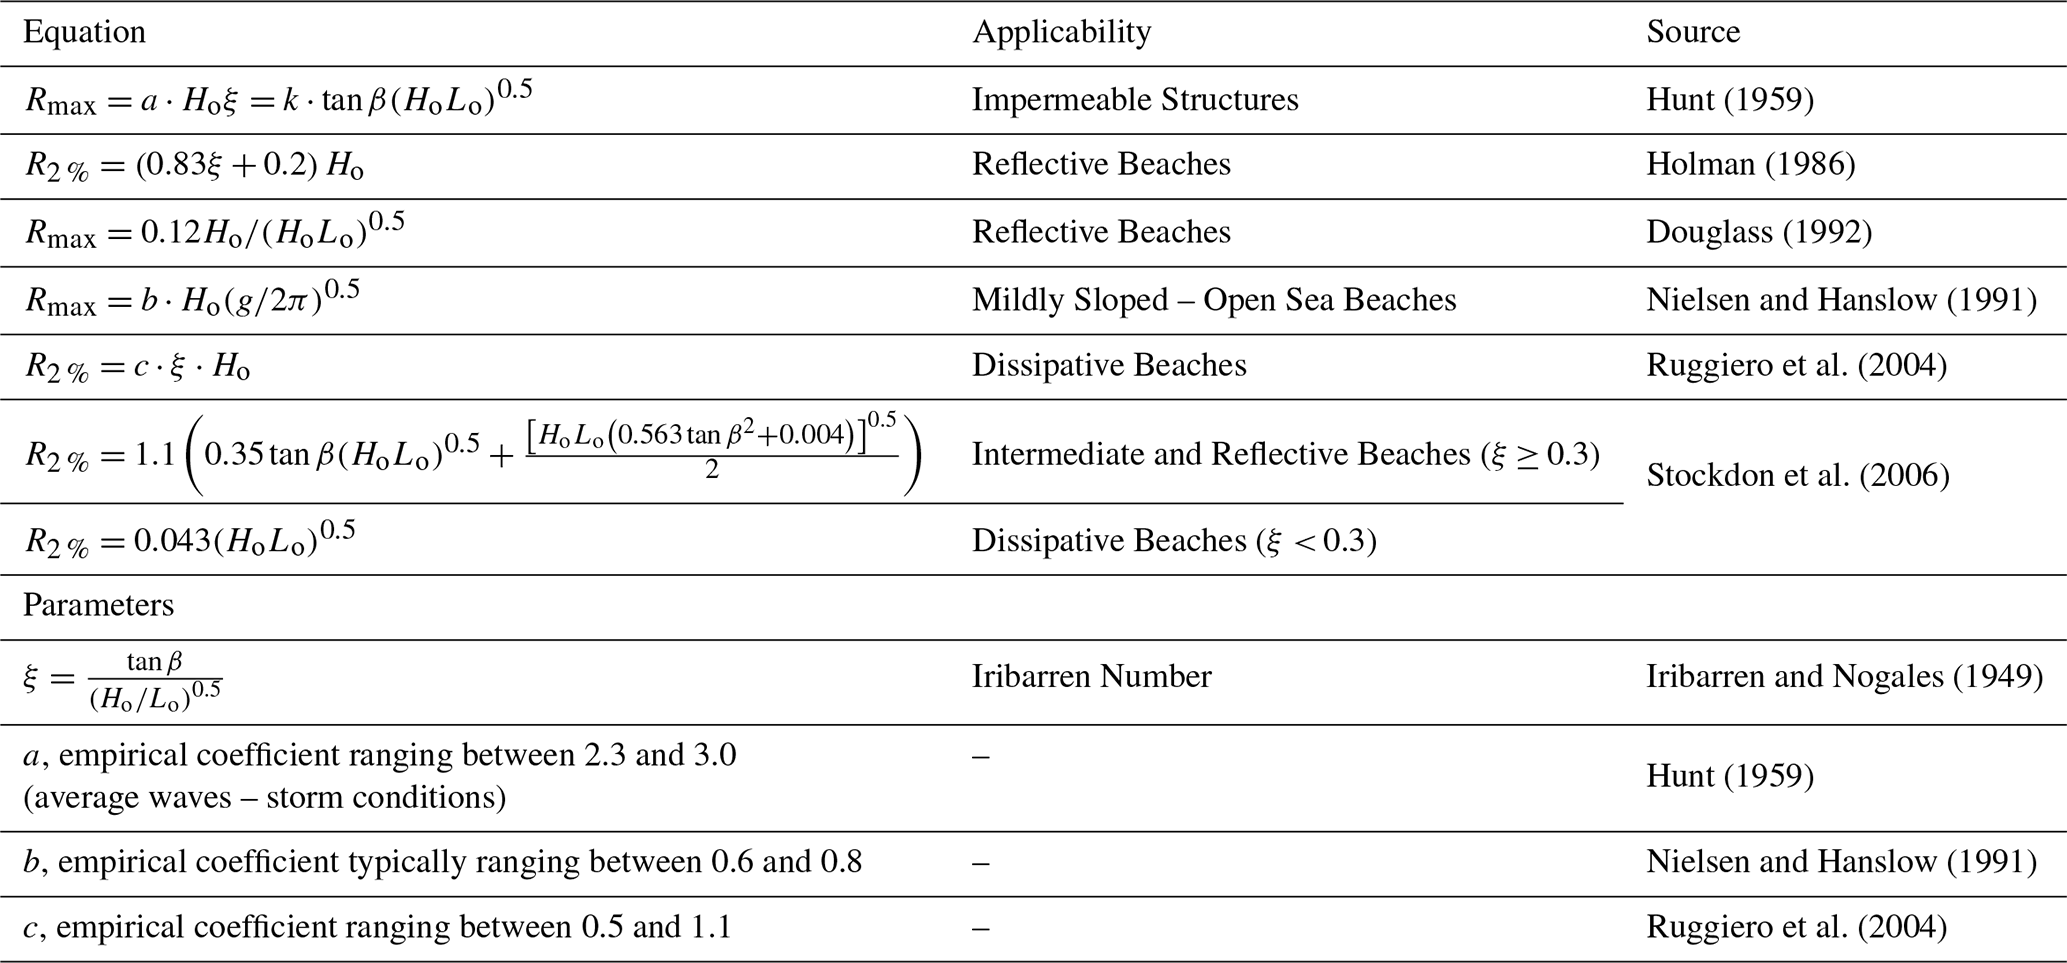
Table A2 shows the empirical formulas employed by NEPTUNE-EWS to test their accuracy as wave run-up predictors, against the monitored surge events.
Table A2The empirical formulae for wave run-up estimates employed in NEPTUNE-EWS.
During the 2.5-year validation period of available wind and sea level records, the majority (74 %) of the wind records deriving from the meteorological station are found to blow mainly from NW and NNW directions (Fig. 4). The forecasted wind climate is found to align well with the in situ records following similar trends, both in velocity and direction. Nevertheless, the intensity of the ECMWF forecasted winds deriving from directions to which the beach is exposed (i.e. between 117 and 202°) are found to have lower values by about 2–3 m s−1 (Fig. 4). Winds deriving from these directions are found to represent 22 % of the total records. When the criterion of Sanchez-Arcilla et al. (2008) was applied to filter out low energy conditions, 69 effective wind events (representing 11 % of the timeseries) capable of generating increased hydrodynamic conditions (greater than 4 Bf) have been isolated.
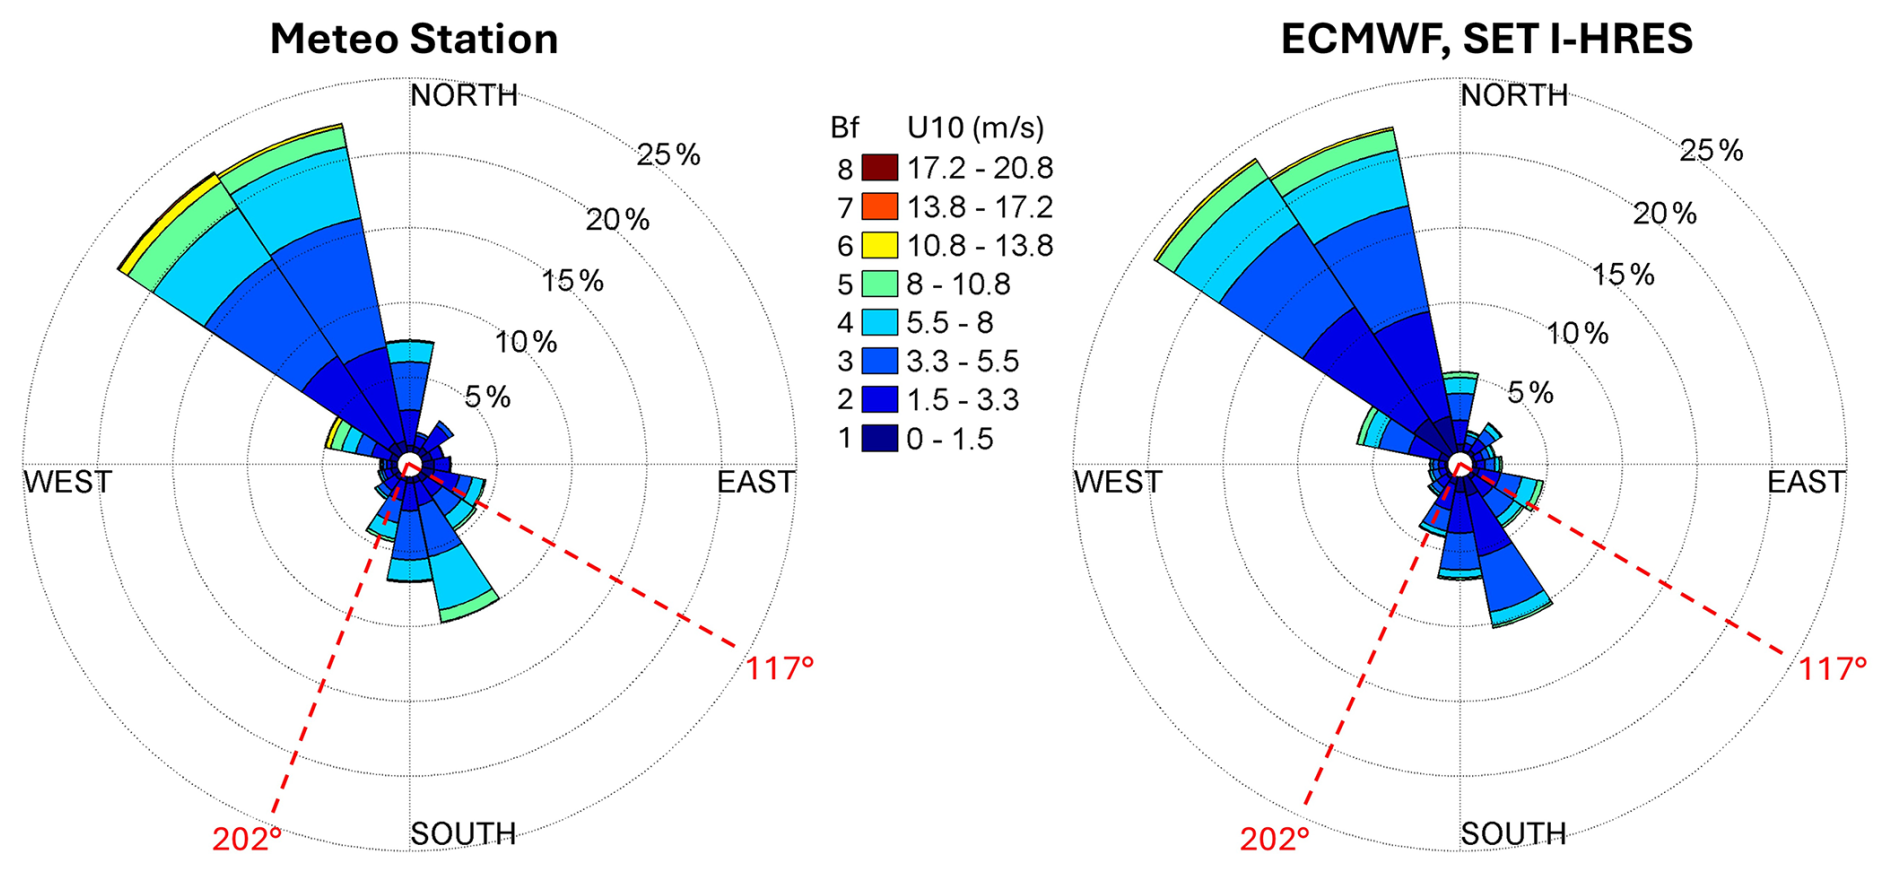
Figure B1Recorded (a) and forecasted (b) wind roses. The dashed red lines denote the directional limits of the effective fetch of Poetto beach, representing the wave exposure sector inside the bay.
The smoothed timeseries (window size equal to 200) of both recorded and forecasted wind climate follow similar patterns with slight differences (of about 0.5–2 m s−1) in wind velocity (Fig. B2a). By examining the raw wind records of the meteorological station against ECMWF forecasts during the six isolated storm events of the 2022–2024 validation period, there are cases of notable differences. During S1 the majority of the forecasted wind is found to have higher values (of about 1–3 m s−1) compared to the records of the meteorological station (Fig. B2b). At the beginning of storm event S2, in situ records are found to align well with the forecasted wind, however, after 13 April 2022 at 18:00 and onwards, the forecasted wind is found to be similarly overestimated (by 1–3 m s−1), even if the declining trend of the forecasted wind velocity aligns with the meteorological records (Fig. B2c). The latter is also the case for the rest of the examined storm events (S3–S6), however there are cases where the ECMWF forecasts are slightly lower (by 1.0–3.5 m s−1) compared to the recorded wind (e.g. during S3 on 23 October 2022 between 06:00 and 18:00 and during S5 on 9 March 2024 between 12:00 and 06:00). S1 and S2 occurred during periods of increased wind velocity (greater than 4 Beaufort) blowing from directions within the effective fetch of Poetto (effective wind events), whereas the remaining storm events (S2 till S6) occurred during periods for which no effective wind events were detected.
The scatter plot of recorded and forecasted wind velocities shows overall agreement, with most points being concentrated along the 1:1 line. The mean residual (bias = 0.46 m s−1) indicates a slight systematic offset, suggesting underestimation of forecasted wind velocities. While this bias is relatively small, the spread of the points suggests variability in accuracy, with many values falling outside the 20 % error bounds, particularly for higher wind speeds (greater than 4 Bf), where forecast errors increase (greater than 4 Bf). In this case, the bias increases to 1.62 m s−1 and the correlation is moderate (R = 0.610, p < 0.05) with MAE = 2.05 m s−1 (higher than when considering the full dataset, when MAE = 1.57 m s−1) representing a substantial fraction of the mean wind velocity (SMAE = 27.5 %). Residuals are mostly clustered around 2 m s−1, with occasional extremes near 4 m s−1 that contribute to a higher RMSE (2.47 m s−1) compared to MAE, reflecting a systematic underestimation of ECMWF forecasts (Fig. B3).
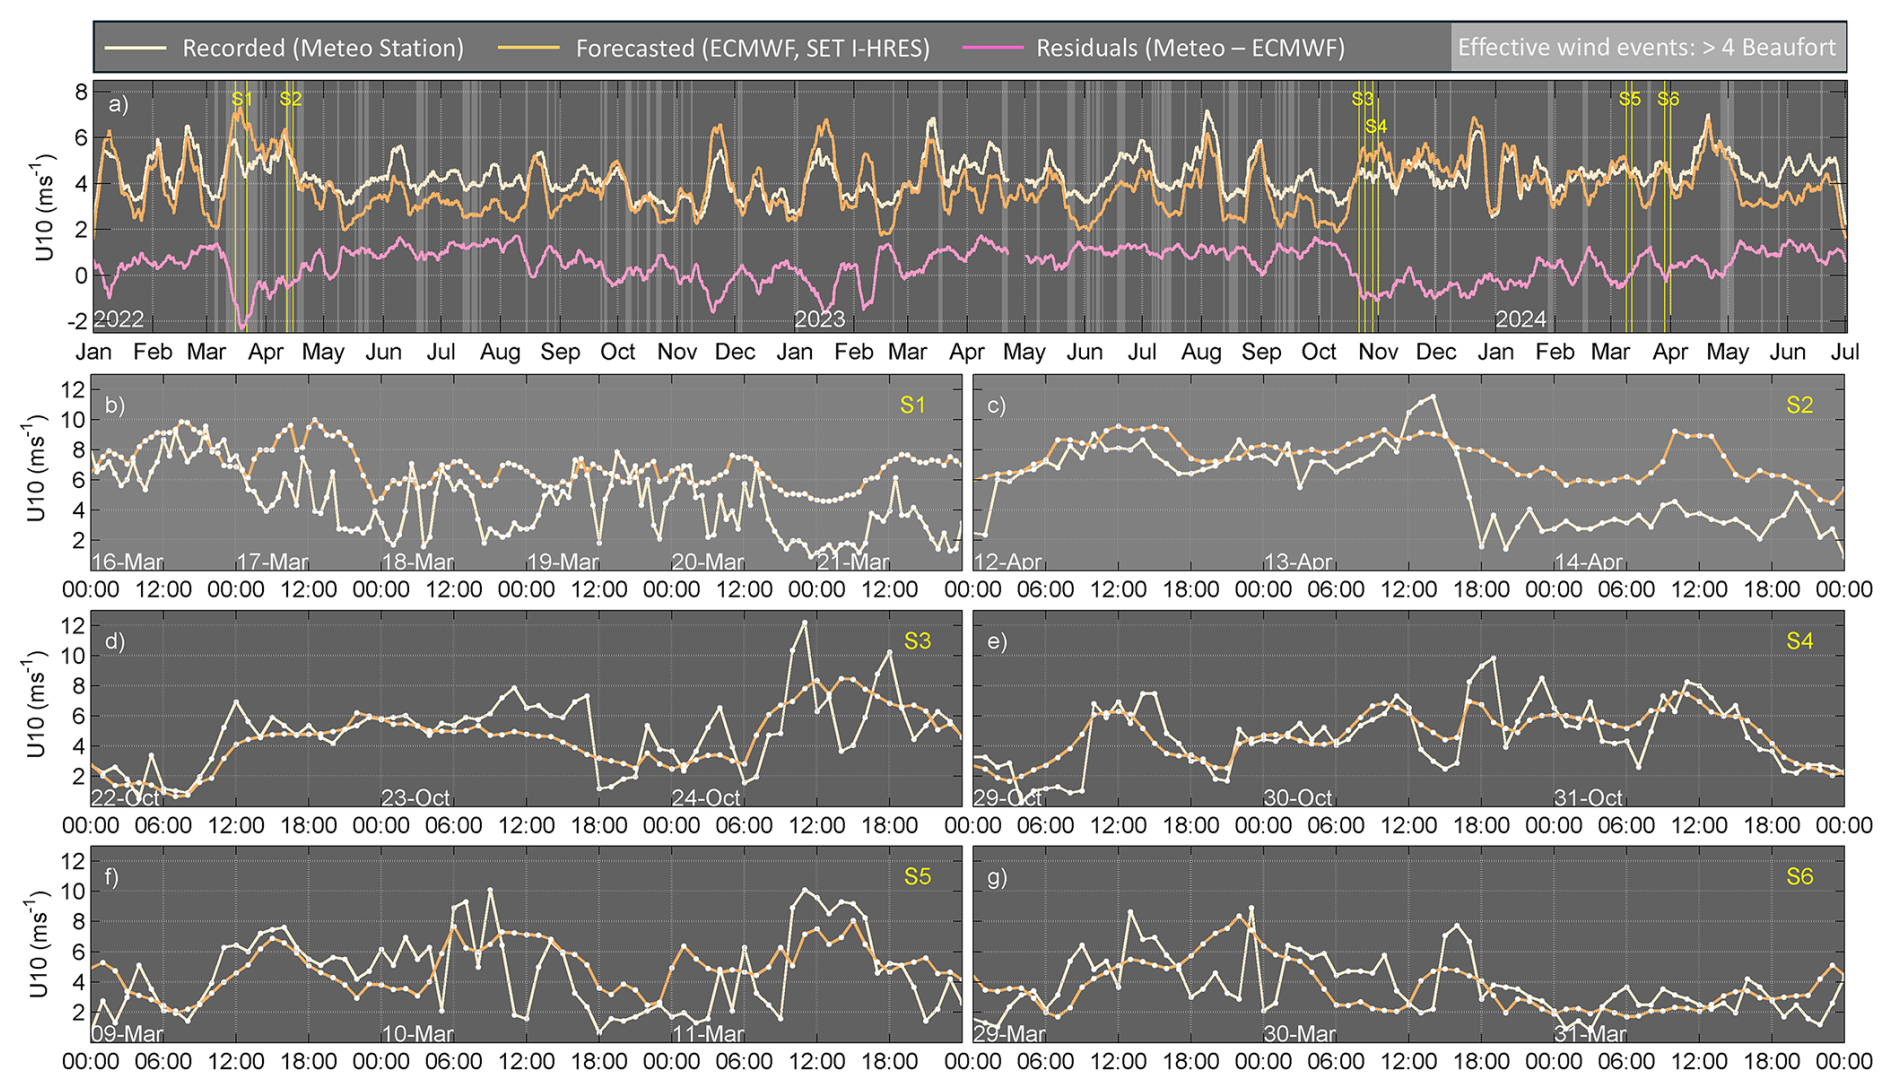
Figure B2(a) Wind velocity at 10 m height (U10) of both recorded and forecasted timeseries after smoothing (window size equal to 200) during the period of January 2022–July 2024. Light grey lines denote periods of detected storms/effective wind events according to the criterion of Sanchez-Arcilla et al. (2008); (b–f) raw recorded and forecasted U10 timeseries of the six selected surge events during the validation period.
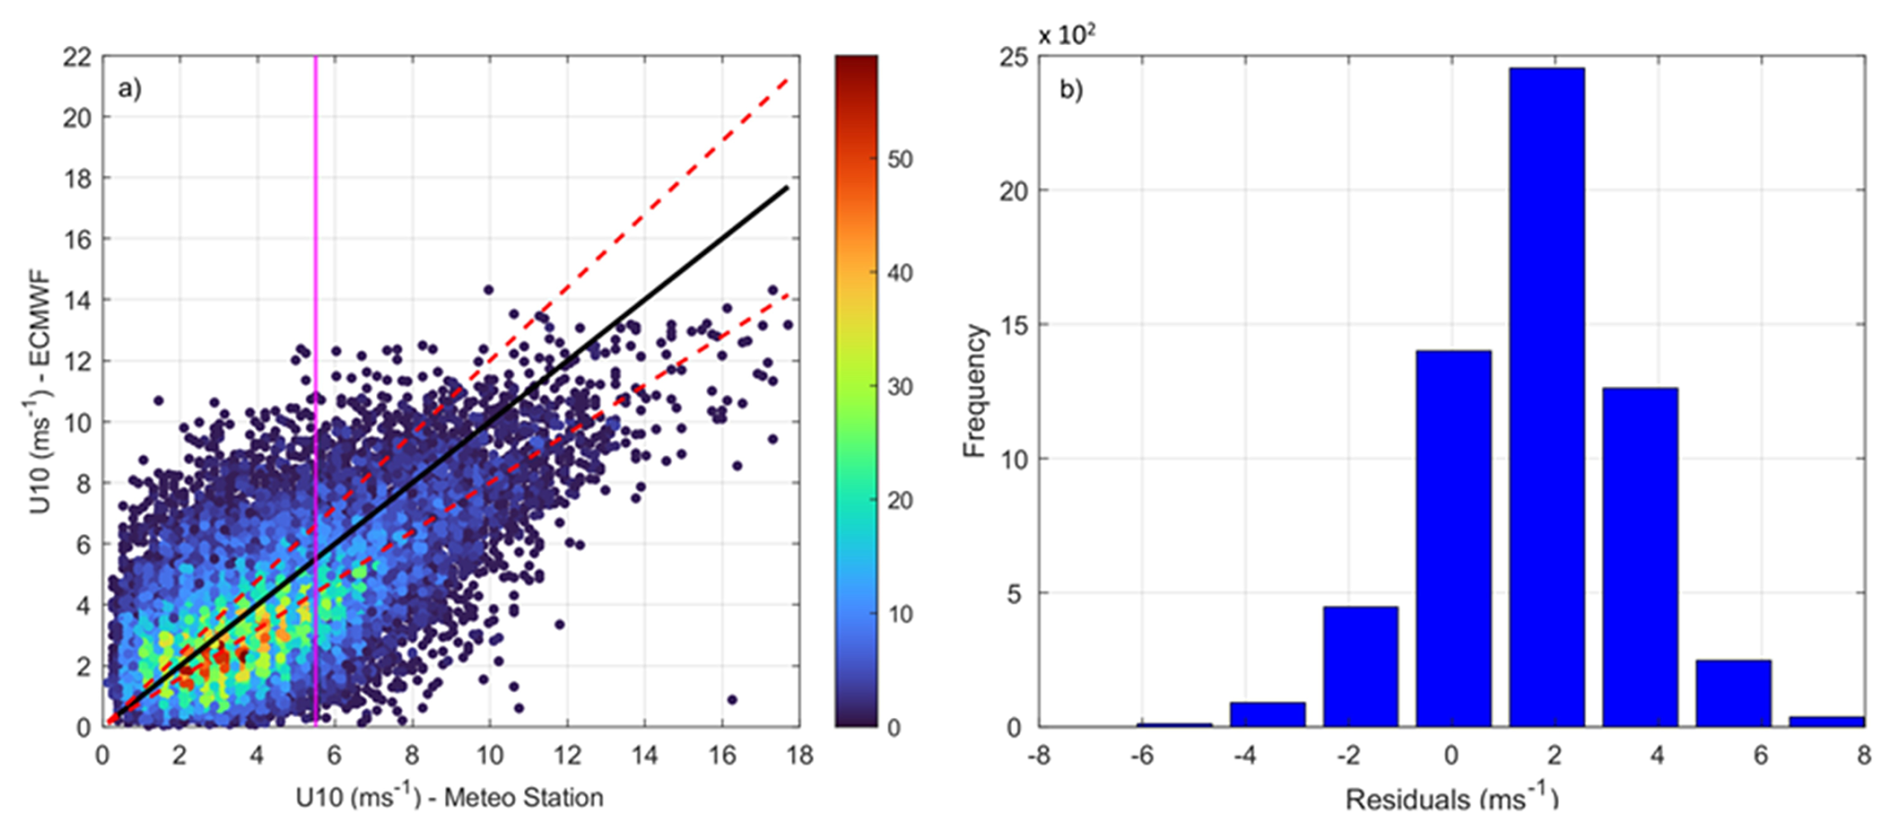
Figure B3(a) Scatterplot of wind velocities at 10 m height (U10) recorded from the meteorological station versus those forecasted by ECMWF during the examined 2.5-year period (21 870 records)); red lines: 20 % error bounds, black line: perfect matching, magenta line: delimits the records of the meteorological station with U10 greater than 5.5 m s−1 (corresponding to 4 Beaufort); (b) distribution of forecast errors (residuals) amongst the U10 values that exceeded 4 Beaufort (5948 records).
During the six monitored surge events of the validation period 2022–2024, recorded sea level is found to be slightly higher with maximum differences of about 0.1 m (Fig. C1b–d). Events S1 and S5 are found to fit almost perfectly with the recorded values, whereas sea level forecasts during events S2, S3, S4 and S6 are found to have lower values, compared to the tide gauge records (of about 0.1 m). Overall, the forecasted sea level values used by NEPTUNE-EWS are found to be slightly underestimated, but in a minor way that has limited effect on the early warning system.
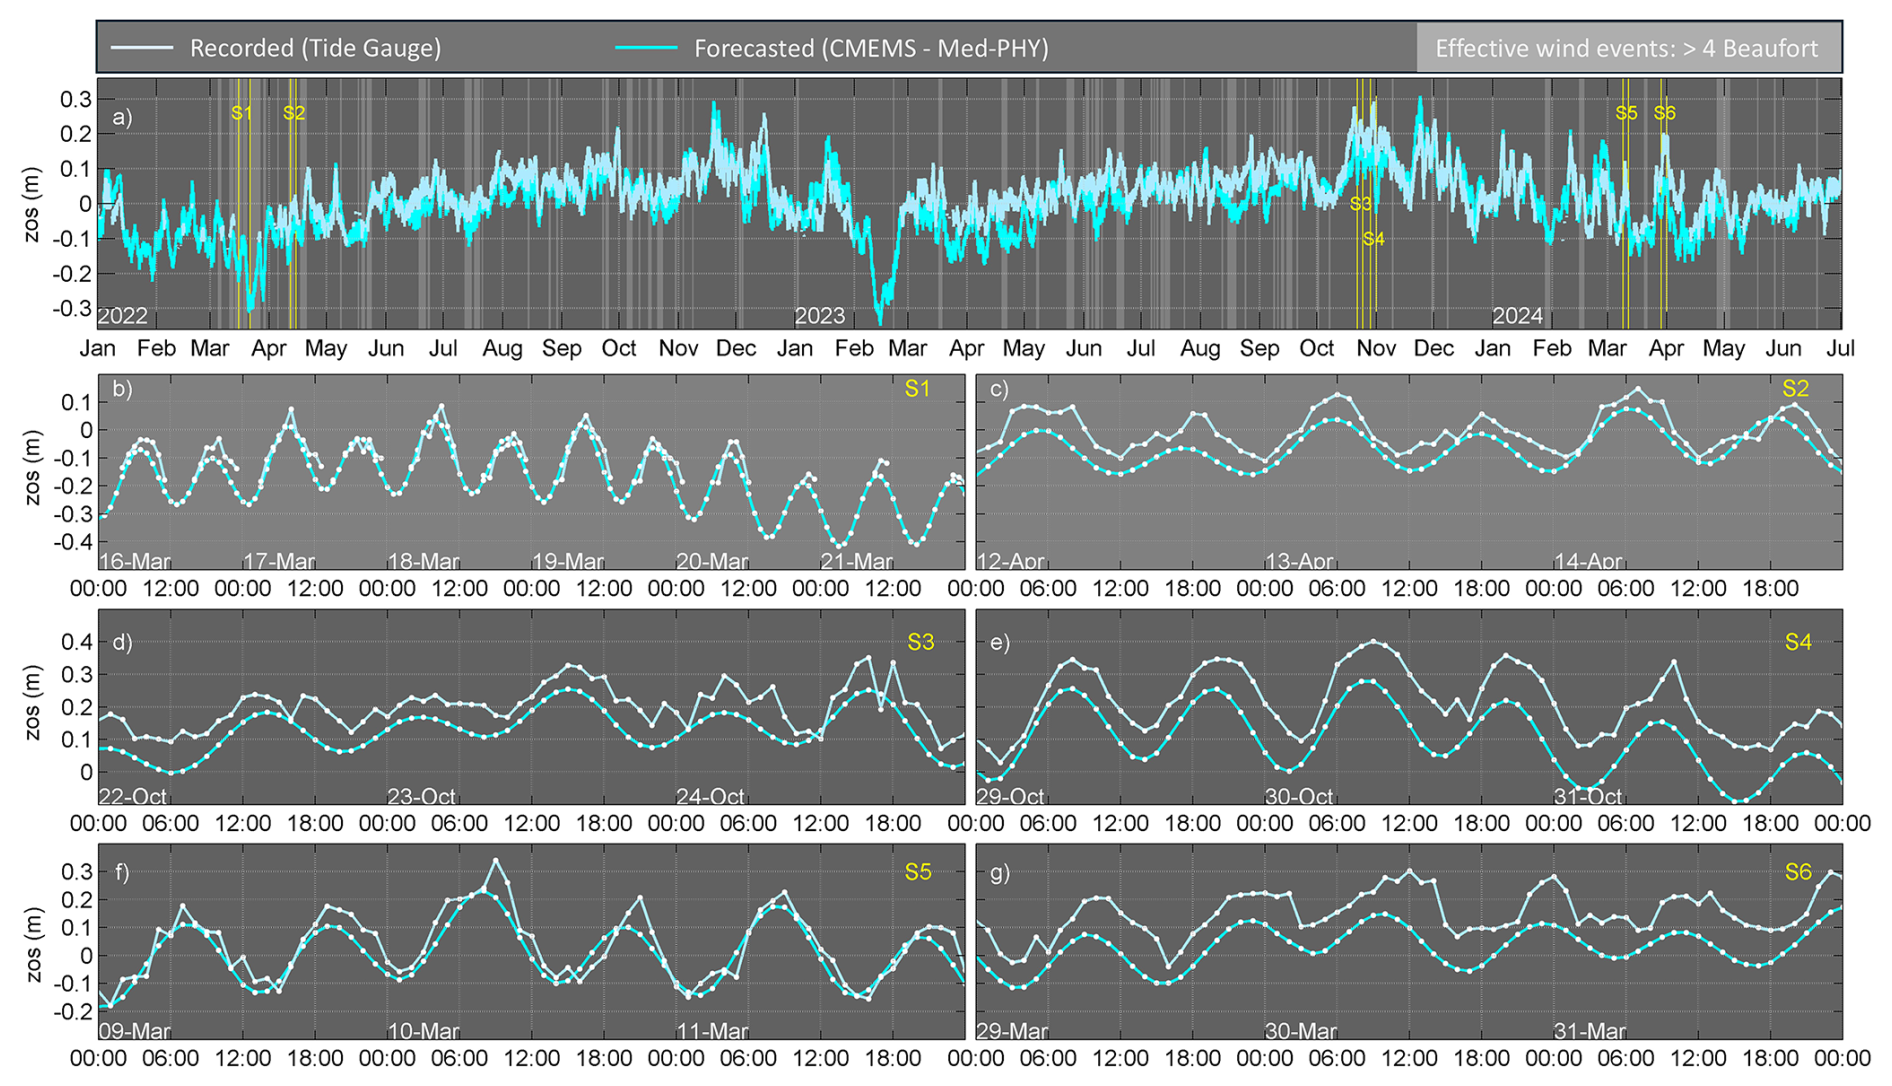
Figure C1(a) Sea level recorded from the logger and forecasted from CMEMS V-PHY after smoothing (window size equal to 20) during the period of January 2022–July 2024. Light grey lines denote periods of detected storms/effective wind events according to the criterion of Sanchez-Arcilla et al. (2008); (b–f) recorded and forecasted sea level timeseries of the six selected surge events during the validation period 2022–2024.
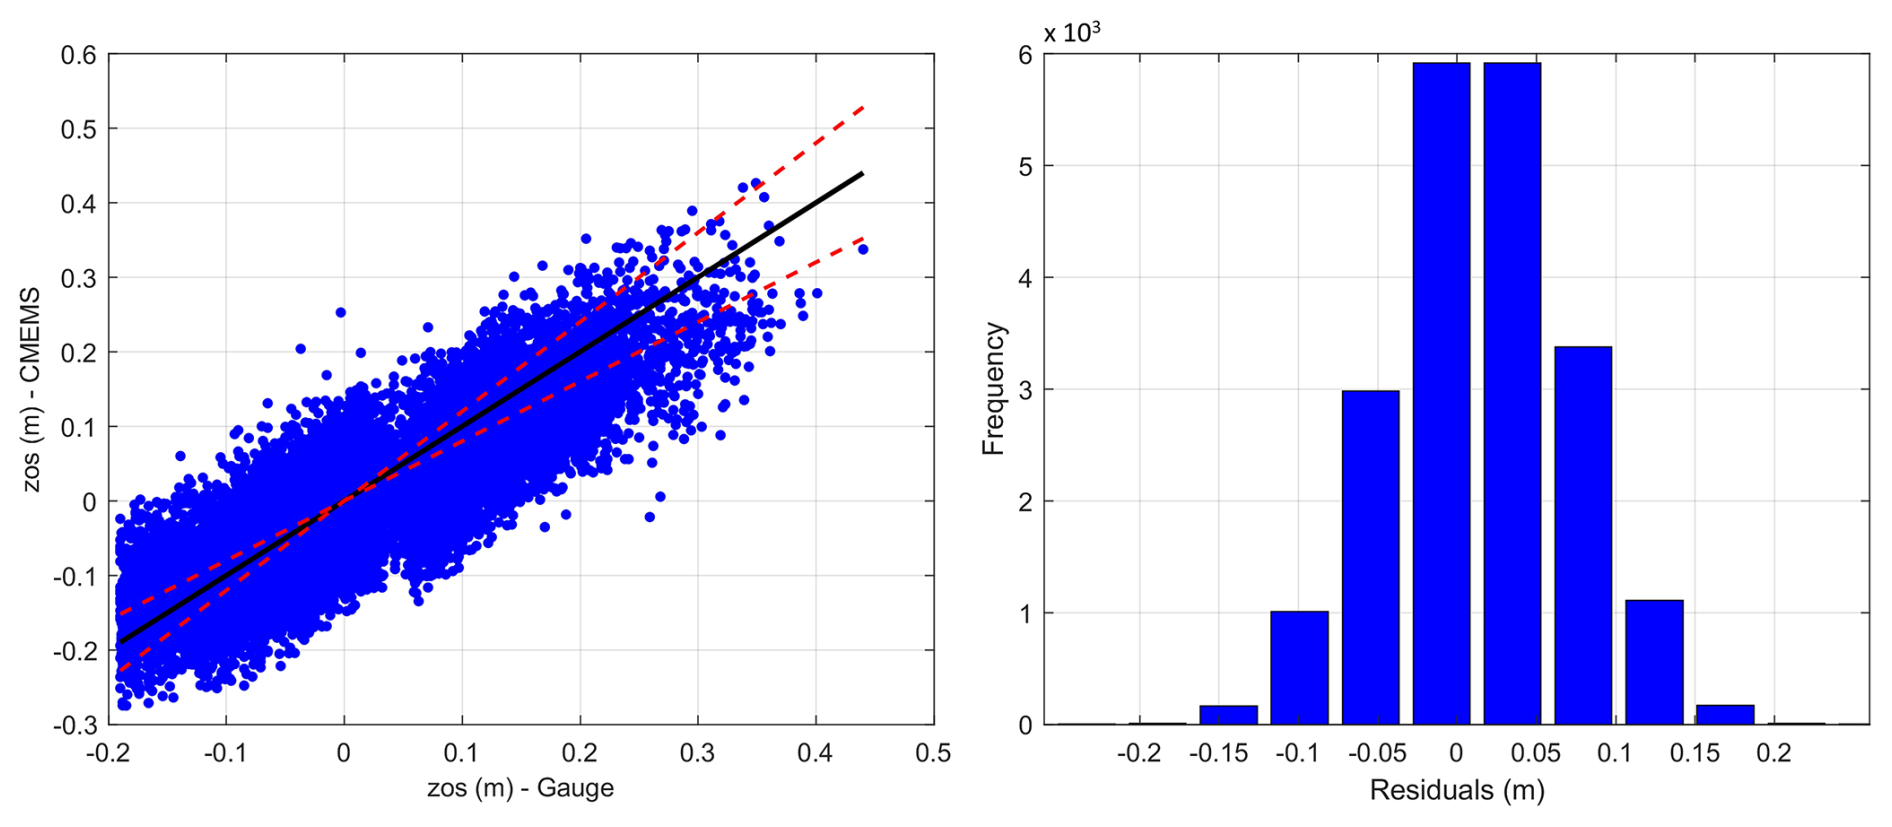
Figure C2(a) Scatter plot of sea surface height (zos) recorded from the tide gauge versus the forecasted by CMEMS for the examined 2.5-year period; red lines: 20 % error bounds, black line: perfect matching; (b) distribution of forecast errors (residuals) amongst the 21 870 total values of the timeseries.
When examining the statistical results, the correlation coefficient was found to have a value of R = 0.85, indicating that the forecast is fairly reliable and that the two datasets generally follow a similar trend. The latter is also evident when checking the scatter plot, where points are dense within the range of the 20 % error bounds (Fig. C2a). On average, forecasted sea levels were found to deviate from the recorded values by MAE = 0.047 m and by RMSE = 0.059 m, which tends to emphasize larger errors more than smaller ones. The mean Residual (Bias) was estimated at 0.014 m, suggesting that on average, the CMEMS forecasted data are systematically slightly underestimating the recorded sea level. This is also consistent with the distribution of the residuals, where most values are being concentrated at low errors (mostly positive) following an almost normalized distribution (Fig. C2b). SMAE was found to be 188.9 %, suggesting that for some records (especially for values close to zero), the forecast might be off by a large percentage, although the magnitude of sea level variation is small compared to other contributions. It has to be noted that the tide gauge is located inside Cagliari's port, distanced 2.6 km away from the CMEMS V-PHY virtual buoy.
Spectral moment wave heights forecasted by CMEMS V-WAV during the examined 2.5-year period (1 January 2022–1 July 2024) are found to derive from directions within the effective fetch of the beach. From these values, 30 % are characterized as small waves (smaller than 0.5 m), whereas 13 % are found to have values more than 0.7 m and 6 % more than 1 m. The most energetic events (i.e. Hm0 greater than 1 m) occur during the October–March period (Fig. D1a). The contribution of primary swell (Hm0_SW1) follows similar trends to Hm0 while secondary swell (Hm0_SW2) is found to be always smaller than 0.3 m. Wind generated waves (Hm0_WW) are found to be smaller than 0.5 m during low and moderate events (i.e. Hm0 smaller than 1 m) and of about 0.5–0.7 m at times when Hm0 is close to 1 m. Regarding wave periods, peak wave period (Tp), primary (Tm01_SW1) and secondary (Tm01_SW2) swell related periods range between 2.8 and 8.5 s, with higher periods at times of increased wave heights. Periods related to wind generated waves range between 1 and 2.5 s.
The wave components during the selected surge events are presented in Figs. D2 and D3. Event S1 was found to have the highest magnitude and duration during the examined 2.5 years period with forecasted spectral wave height (Hm0) values greater than 1.5 m and corresponding peak periods (Tp) ranging between 8 and 11 s, for a period of 4.5 d (16–21 March 2022) (Figs. D2a and D3a). During this event, wind generated waves heights (Hm0_WW) were between 0.5 and 1.2 m, with a peak at about 2.0 m on 16 March 2022, and corresponding periods (Tm01_WW) were between 2.9 and 4.8 s. Primary swell wave heights (Hm0_SW1) were generally 0.1 to 0.2 m lower than Hm0 in most cases, with the exception of the Hm0_WW peak on 16 March 2022. During event S2, Hm0 is found to range between 1.3 and 2.0 m with corresponding peak periods of about 6.4–9.0 s. Primary swell is found to be the main wave component. Secondary swell wave heights are found to be of zero value for both S1 and S2 events. Events S3, S4, S5 and S6 have a duration of 3 d and are found to follow similar patterns. During the first day of these events, forecasted waves are lower than 1 m, while waves are found to progressively grow in height, reaching their peak values of about 1.6 m (S3), 1.8 m (S4, S5) and 2.2 m (S6).
Hm0 data points are generally aligned along the 1:1 reference line of perfect matching, indicating good agreement between CMEMS and AWAC data, followed by a strong correlation coefficient (R = 0.83). However, a spread is noticed, particularly at Hm0 values lower than 0.5 m (Fig. D4a). MAE is 0.18 m, reflecting the average magnitude of discrepancies between AWAC and CMEMS records. SMAE has a value of 43.9 %, suggesting relatively large error when scaled by the observed mean, whereas RMSE is 0.25 m, quantifying the typical magnitude of errors with a higher emphasis on larger deviations. When checking the residuals (AWAC – CMEMS), these are approximately normally distributed and centered around −0.2 m, confirming the negative bias of −0.12 m observed in the statistical results. The majority of residuals fall within the range of ±0.2 m, indicating that most errors are moderate (Fig. D4b).
Regarding peak wave period, the scatter plot shows that points have significant deviations from the 1:1 line of perfect matching, which is also reflected by the relatively low correlation coefficient (R = 0.33). MAE is 1.7 s, whereas SMAE is 28.0 %, suggesting a moderate relative error when scaled by the observed mean and RMSE is 2.5 s. The residuals distribution shows that most differences are slight, being concentrated between ±2 s (Fig. D4d), which also reflects the positive bias of 0.26 s found in the statistical analysis. Nevertheless, the histogram reveals significant spread, with residuals ranging from −8 to 10 s, highlighting substantial errors for some predictions, particularly for low wave heights.
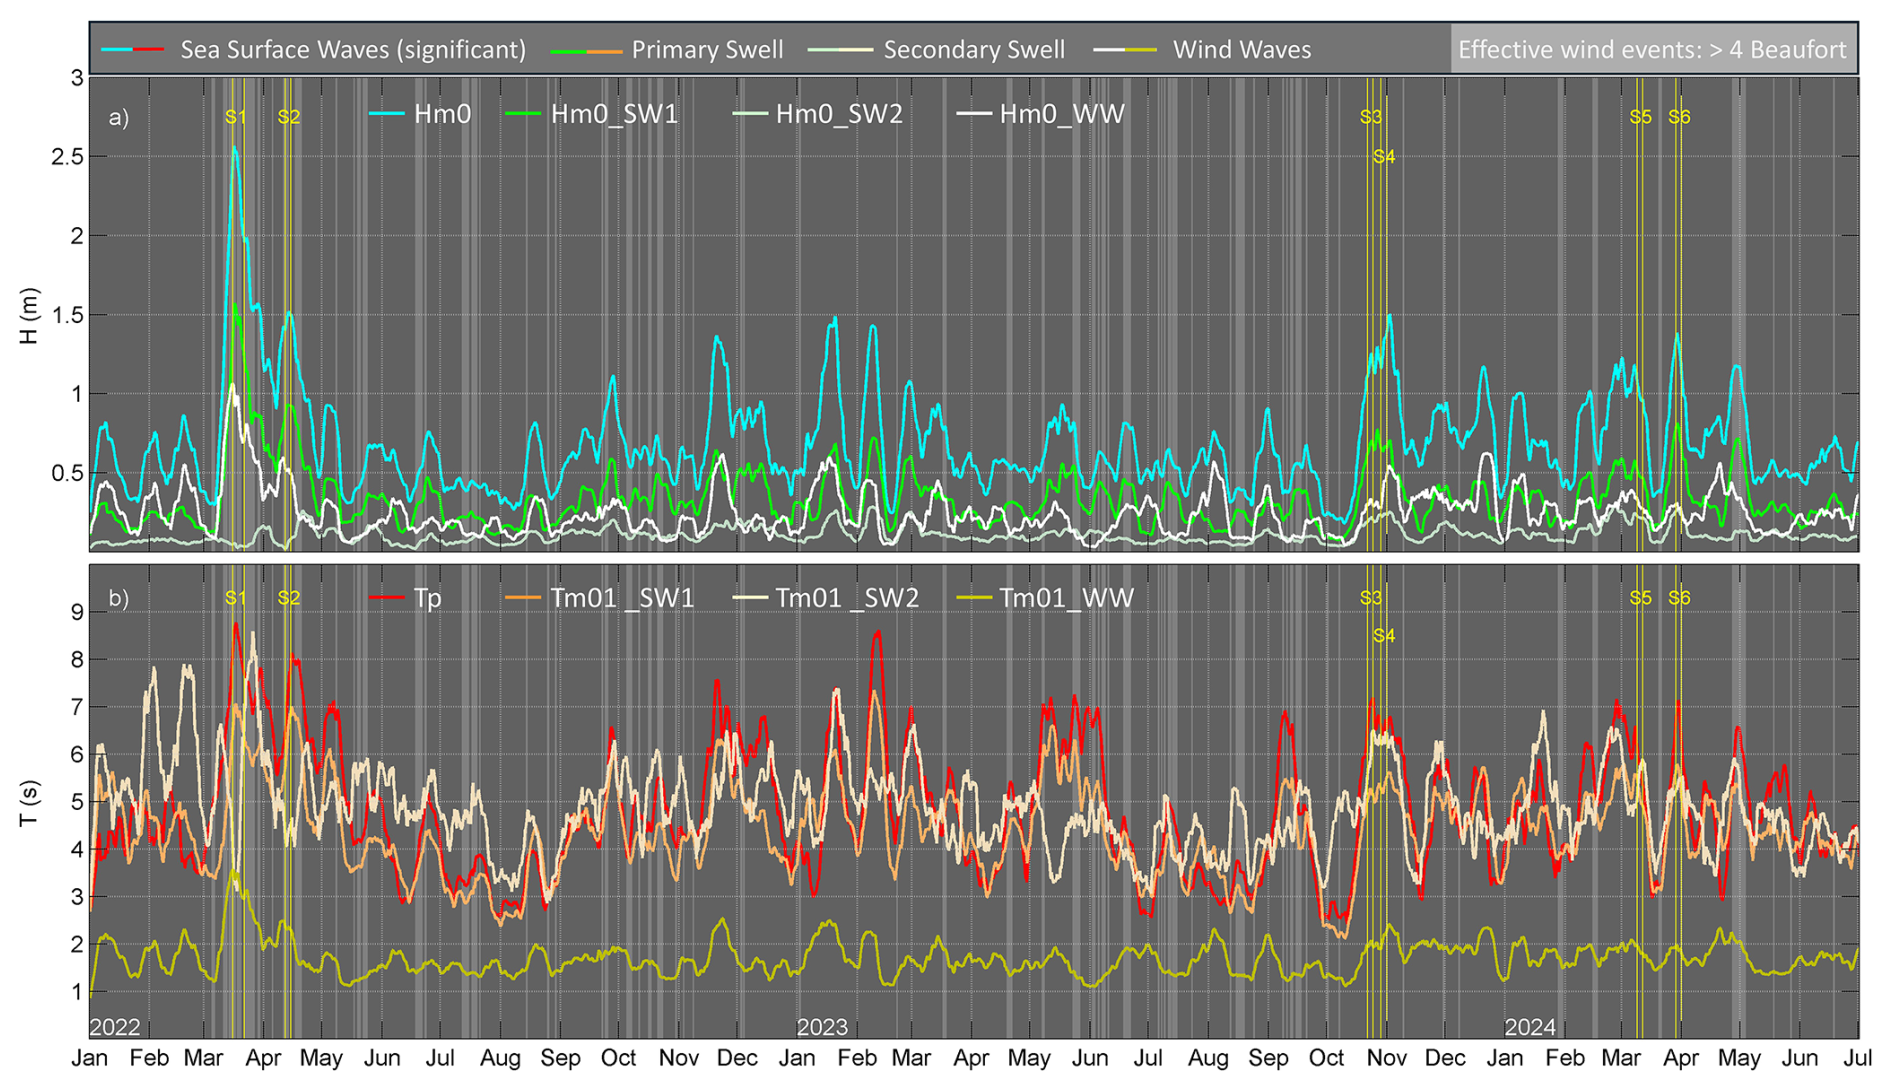
Figure D1Smoothed (window length equal to 200) timeseries of the wave characteristics extracted from CMEMS, V-WAV virtual buoy offshore Poetto beach. (a) Spectral significant wave height (Hm0), spectral significant wind wave height (Hm0_WW), spectral significant primary (Hm0_SW1) and secondary (Hm0_SW2) swell wave height; (b) peak wave period (Tp), spectral moments (0,1) wind wave period (Tm01_WW), spectral moments (0,1) primary (Tm01_SW1) and secondary (Tm01_SW2) swell wave period.
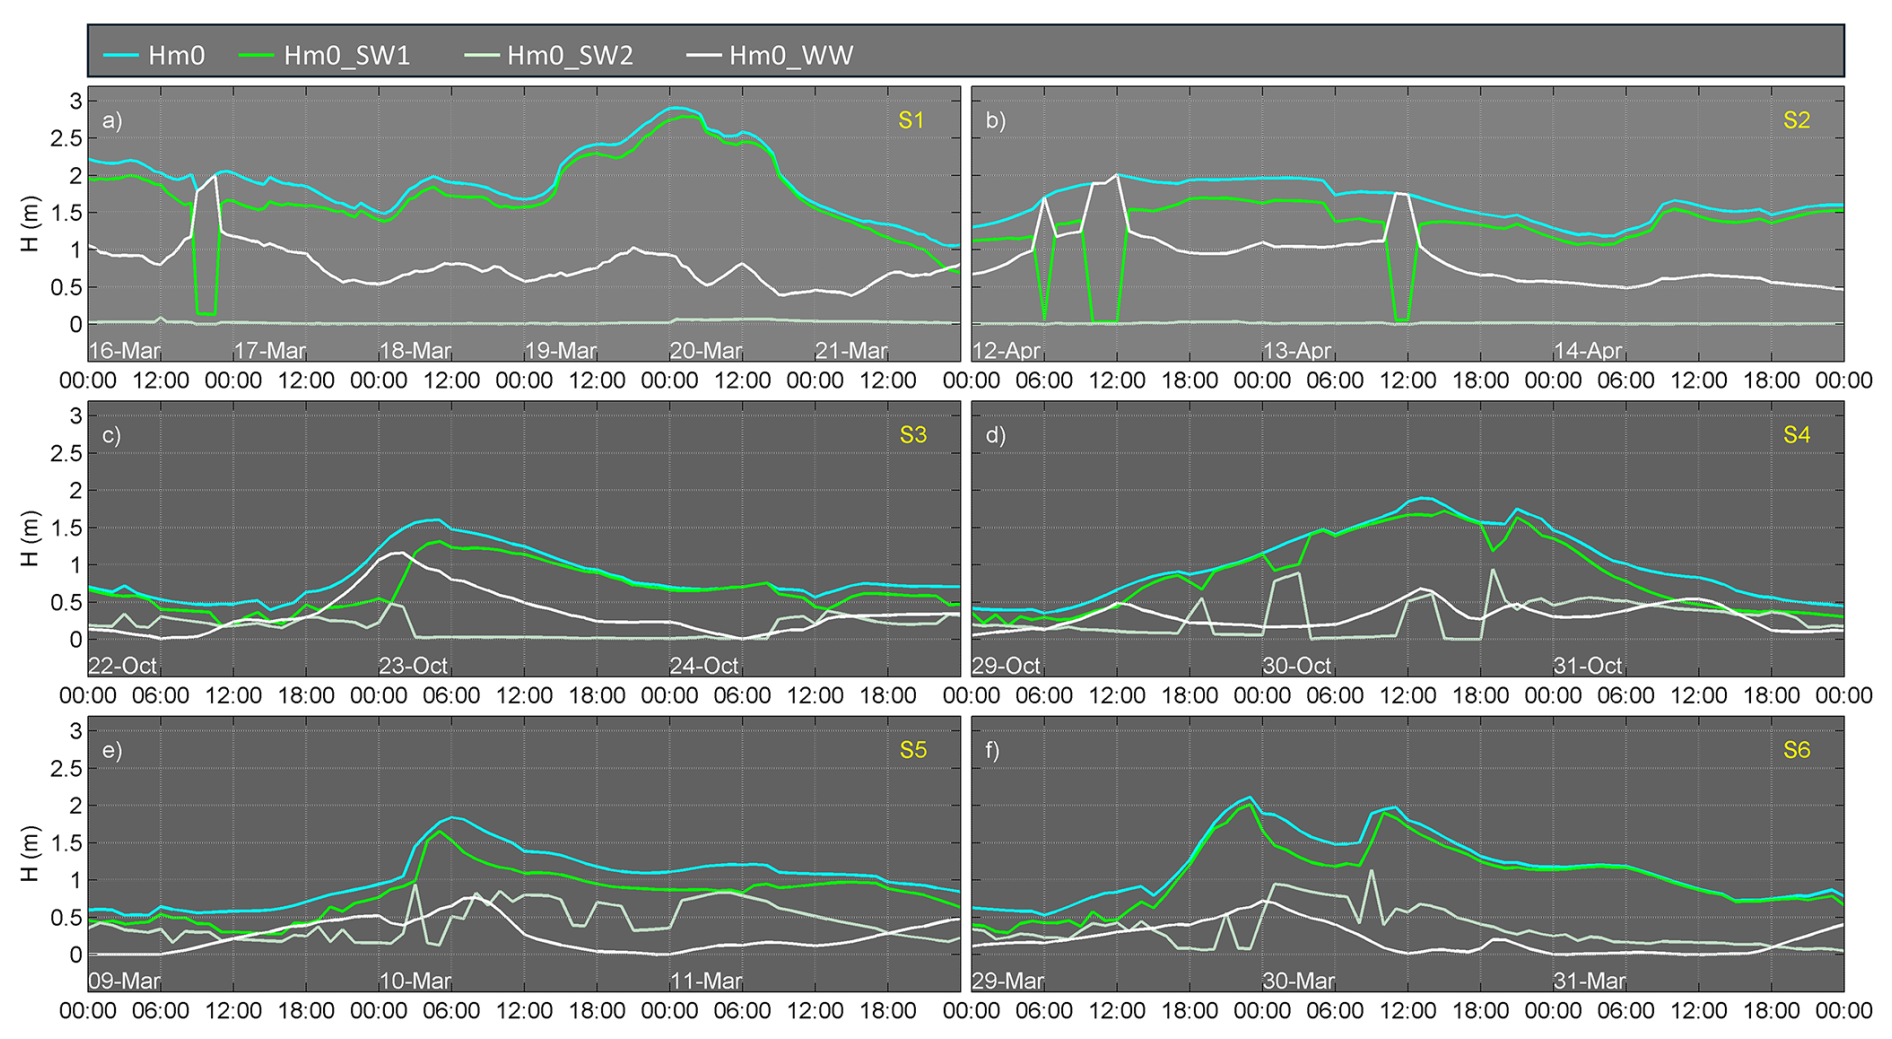
Figure D2Wave heights extracted from CMEMS, V-WAV virtual buoy offshore Poetto beach during the six isolated surge events during the validation period 2022–2024.
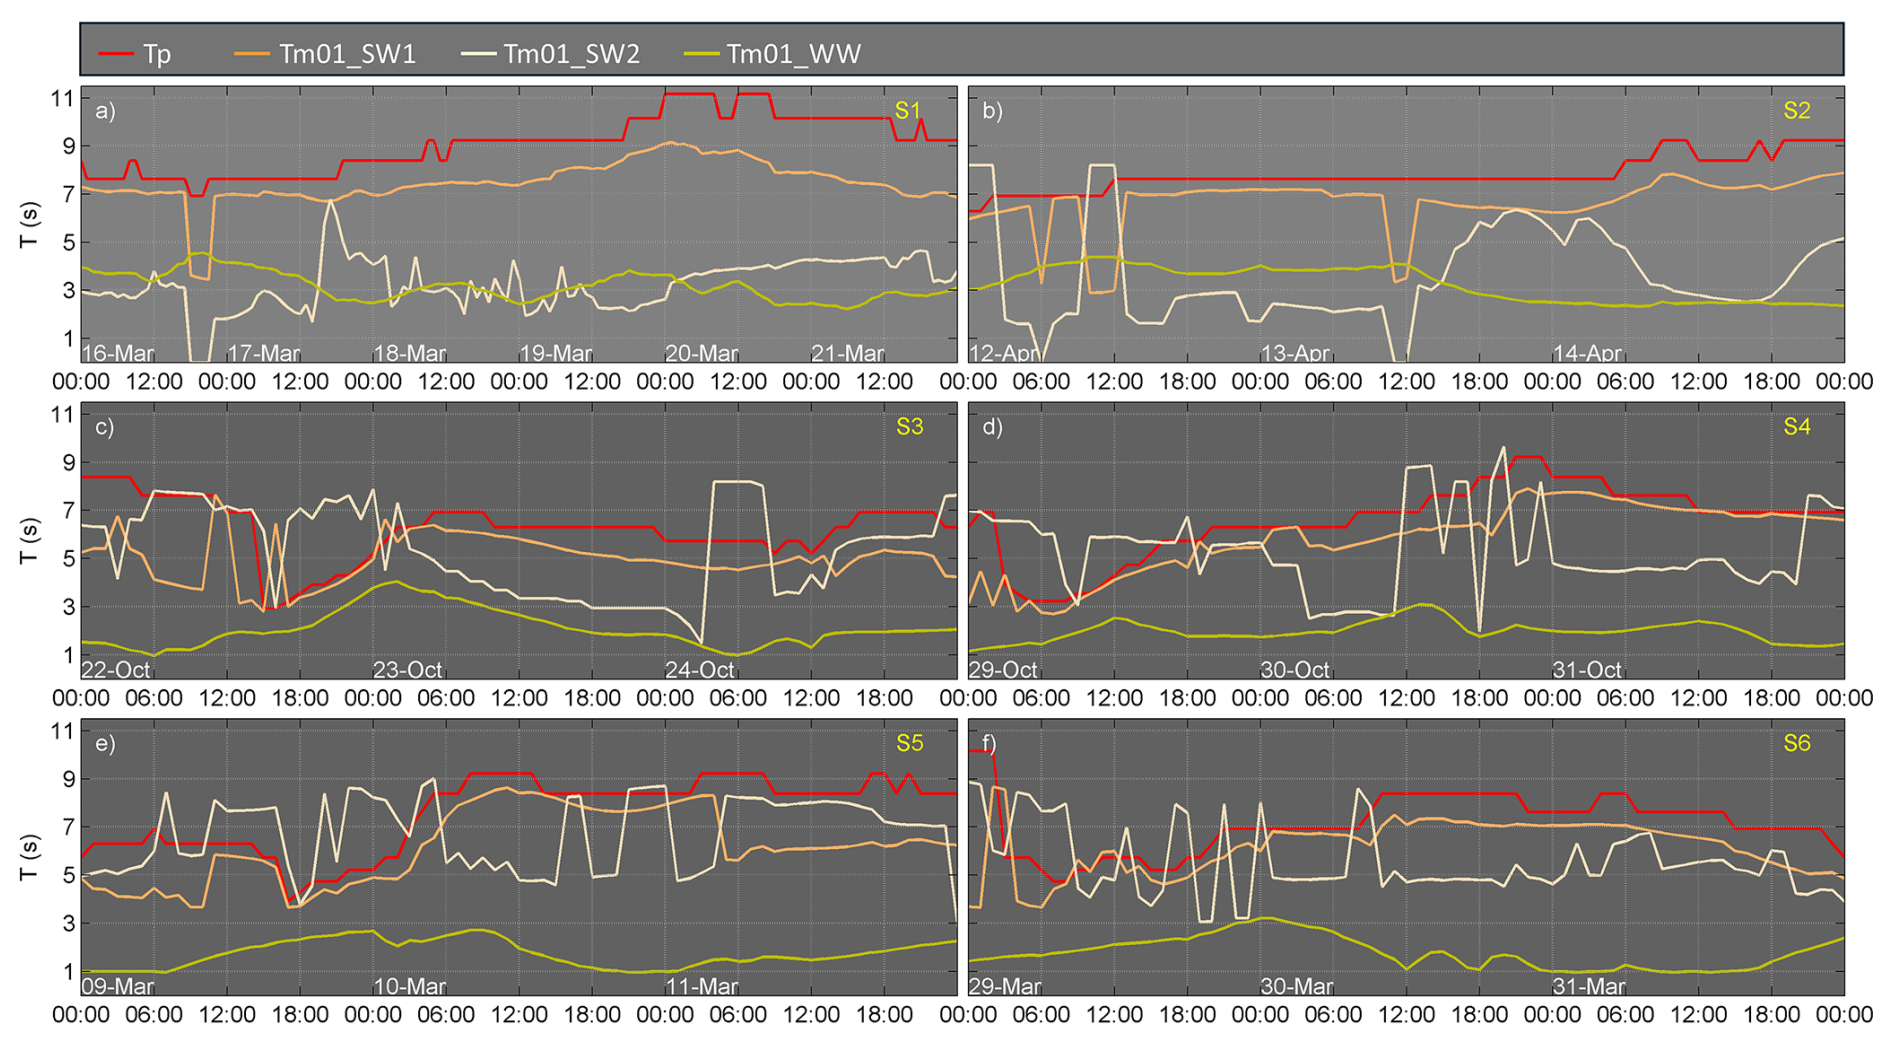
Figure D3Wave periods extracted from CMEMS, V-WAV virtual buoy offshore Poetto beach during the six isolated surge events during the validation period 2022–2024.
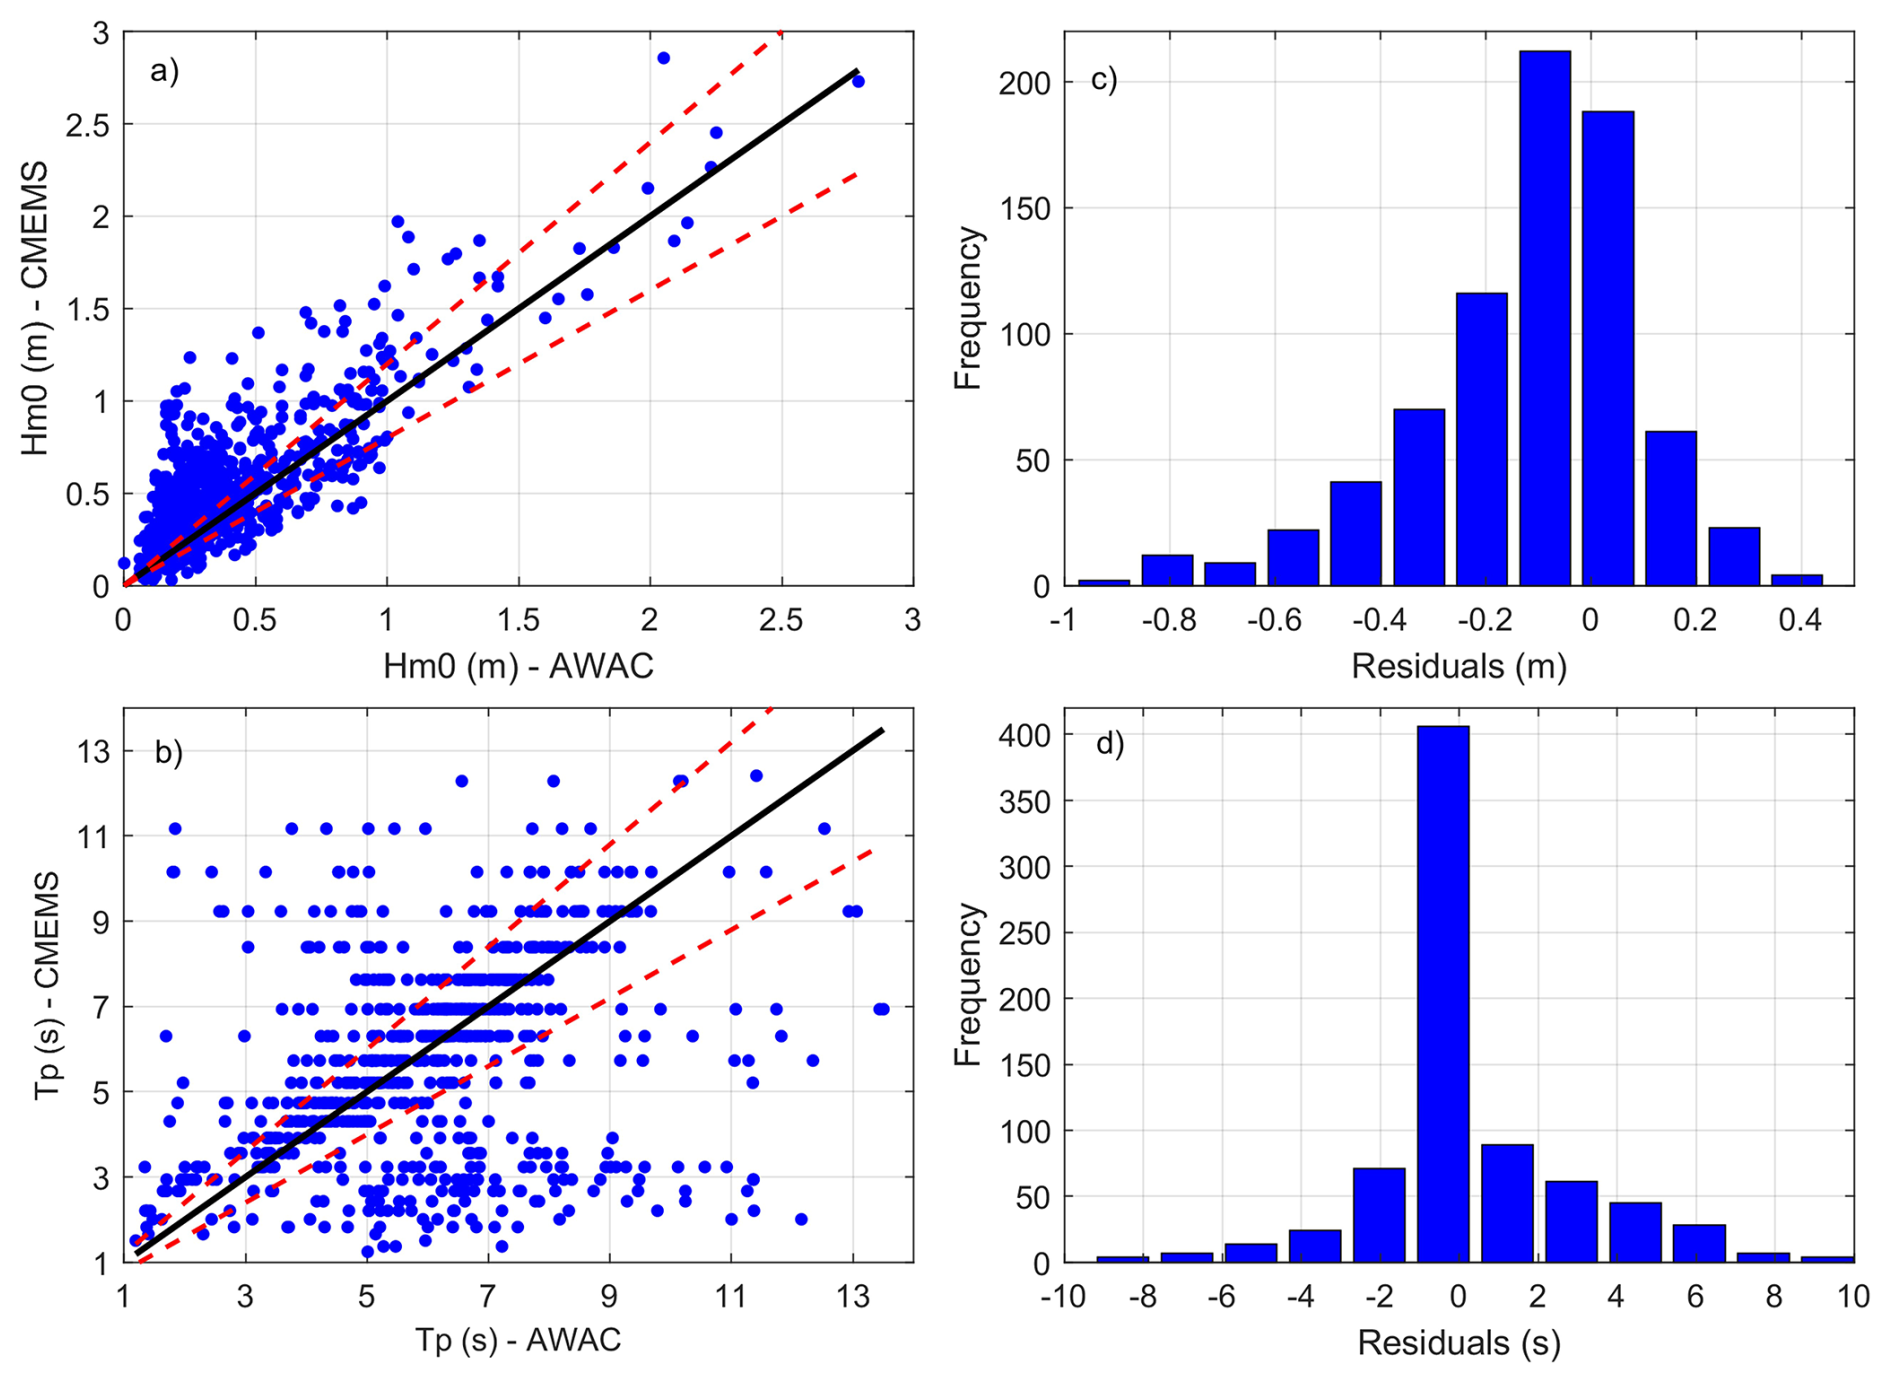
Figure D4(a) Scatter plot of spectral moment wave height (Hm0); and (b) peak wave period (Tp) recorded from the AWAC versus CMEMS re-analysis for the examined 45 d period; red lines: 20 % error bounds, black line: perfect matching; (c, d) error distribution (residuals) amongst the 361 total values of the Hm0 and Tp timeseries, respectively.
The Copernicus Marine Toolbox (version 2.0.0), integrated into the developed software, is available from Copernicus Marine Service (CMS, 2025). The SWAN model is freely available at https://swanmodel.sourceforge.io (last access: 15 October 2025). System functions and configuration files developed in this study are available from the corresponding author upon reasonable request.
The forecast/re-analysis data used in this study are reported in Table A1. In situ wind and sea level data used for validation are freely accessible through the monitoring network of the Italian Institute for Environmental Protection and Research (ISPRA, 2025). Optical data (frames) recorded by the coastal video monitoring system during surge events S1 to S6, used for validation of NEPTUNE-EWS forecasts, are archived on the Zenodo platform at https://doi.org/10.5281/zenodo.18828498 (Trogu et al., 2026). Retrieved topo-bathymetric and wave data, as well as the full dataset (videos) of the monitored events may be available from the corresponding author upon reasonable request.
Antonis Chatzipavlis: conceptualization, methodology, software, validation, formal analysis, investigation, visualization, writing (original draft). Daniele Trogu: conceptualization, methodology, resources, investigation, writing (review and editing). Andrea Ruju: conceptualization, methodology, software, formal analysis, investigation, visualization, writing (review and editing). Juan Montes: methodology, software, investigation, writing (review and editing). Antonio Usai: resources, investigation, writing (review and editing). Marco Porta: resources, investigation, writing (review and editing). Giovanni Coco: supervision, methodology, writing (review and editing). Sandro De Muro: supervision, writing (review and editing), funding acquisition. Paolo Ciavola: supervision, methodology, writing (review and editing).
The contact author has declared that none of the authors has any competing interests.
Publisher's note: Copernicus Publications remains neutral with regard to jurisdictional claims made in the text, published maps, institutional affiliations, or any other geographical representation in this paper. The authors bear the ultimate responsibility for providing appropriate place names. Views expressed in the text are those of the authors and do not necessarily reflect the views of the publisher.
The authors warmly thank Sardegna Progetta for their assistance during fieldwork. The authors also thank the Sardinia Sea Port Authority, the “Deposito PolNato Marina Militare (Navy PolNato Depot Marina Militare)” of Cape S. Elia–Cagliari and Comando supporto logistico di Cagliari (MARICAGLIARI). P. Ciavola acknowledges the support of the University of Ferrara through the FAR funds.
This study was carried out within the RETURN Extended Partnership and received funding from the European Union Next-Generation EU (National Recovery and Resilience Plan – NRRP, Mission 4, Component 2, Investment 1.3 – D.D. 1243 2/8/2022, PE0000005). The research has also been funded by Regione Autonoma Sardegna under L.R. 7/2007, “Promozione della ricerca scientifica e dell'innovazione tecnologica in Sardegna” for BEACH and TENDER NEPTUNE projects, directed by Sandro De Muro, University of Cagliari. This study was also produced within the framework of the PHD programme in INNOVATION SCIENCES AND TECHNOLOGIES at the University of Cagliari, Cycle XXXVIII, with the support of a scholarship financed by the Ministerial Decree no. 351 of 9th April 2022, based on the NRRP – funded by the European Union – NextGenerationEU – Mission 4 “Education and Research”, Component 1 “Enhancement of the offer of educational services: from nurseries to universities” - Investment 3.4 “Advanced teaching and university skills”. P. Ciavola acknowledges the support of the University of Ferrara through the FAR funds.
This paper was edited by Oded Katz and reviewed by Michalis Vousdoukas and one anonymous referee.
Almar, R., Ranasinghe, R., Bergsma, E. W. J., Diaz, H., Melet, A., Papa, F., Vousdoukas, M., Athanasiou, P., Dada, O., Almeida, L. P., and Kestenare, E.: A global analysis of extreme coastal water levels with implications for potential coastal overtopping, Nat. Commun., 12, 1–9, https://doi.org/10.1038/s41467-021-24008-9, 2021.
Alday, M., Ardhuin, F., Dodet, G., and Accensi, M.: Accuracy of numerical wave model results: application to the Atlantic coasts of Europe, Ocean Sci., 18, 1665–1689, https://doi.org/10.5194/os-18-1665-2022, 2022.
Aniskiewicz, P., Benedyczak, R., Furmanczyk, K., and Andrzejewski, P.: Validation of Empirical Wave Run-up Formulas to the Polish Baltic Sea Coast, J. Coastal Res., 75, 10075, 243–247, https://doi.org/10.2112/SI75-049.1, 2016.
Ardhuin, F., Rogers, E., Babanin, A. V., Filipot, J. F., Magne, R., Roland, A., Van der Westhuysen, A., Queffeulou, P., Lefevre, J. M., Aouf, L., and Collard, F.: Semiempirical dissipation source functions for wind-wave models: Part I, definition, calibration, and validation, J. Phys. Oceanogr., 51, 2131–2150, https://doi.org/10.1175/2010JPO4324.1, 2009.
Armaroli, C., Ciavola, P., Perini, L., Calabrese, L., Lorito, S., Valentini, A., and Masina, M.: Critical storm thresholds for significant morphological changes and damage along the Emilia-Romagna coastline, Italy, Geomorphology, 143–144, 34–51, https://doi.org/10.1016/j.geomorph.2011.09.006, 2012.
Asariotis, R., Monioudi, I. N., Mohos Naray, V., Velegrakis, A. F., Vousdoukas, M. I., Mentaschi, L., and Feyen, L.: Climate change and seaports: hazards, impacts and policies and legislation for adaptation, Anthropocene Coasts, 7, 14, https://doi.org/10.1007/s44218-024-00047-9, 2024.
Athanassiou, P., van Dongeren, A. P., Giardino, A., Vousdoukas, M., Antolinez, J. A. A., and Ranasinghe, R.: A Clustering Approach for Predicting Dune Morphodynamic Response to Storms Using Typological Coastal Profiles: A Case Study at the Dutch Coast, Front. Mar. Sci., 8, 747754, https://doi.org/10.3389/fmars.2021.747754, 2021.
Atkinson, A. L., Power, H. E., Moura, T., Hammond, T., Callaghan, D. P., and Baldock, T. E.: Assessment of runup predictions by empirical models on non-truncated beaches on the south-east Australian coast, Coast. Eng., 119, 15–31, https://doi.org/10.1016/j.coastaleng.2016.10.001, 2017.
Bajo, M. and Umgiesser, G.: Storm surge forecast through a combination of dynamic and neural network models, Ocean Model., 33, 1–9, https://doi.org/10.1016/j.ocemod.2009.12.007, 2010.
Bakkensen, L. A. and Barrage, L.: Flood risk belief heterogeneity and coastal home price dynamics: Going under water?, National Bureau of Economic Research (NBER), Working Paper 23854, 30 pp., https://doi.org/10.3386/w23854, 2021.
Biolchi, L. G., Unguendoli, S., Bressan, L., Giambastiani, B. M. S., and Valentini, A.: Ensemble technique application to an XBeach-based coastal Early Warning System for the Northwest Adriatic Sea (Emilia-Romagna region, Italy), Coast. Eng., 173, 104081, https://doi.org/10.1016/j.coastaleng.2022.104081, 2022.
Biondo, M., Buosi, C., Trogu, D., Mansfield, H., Vacchi, M., Ibba, A., Porta, M., Ruju, A., and De Muro, S.: Natural vs. Anthropic Influence on the Multidecadal Shoreline Changes of Mediterranean Urban Beaches: Lessons from the Gulf of Cagliari (Sardinia), Water, 12, 3578, https://doi.org/10.3390/w12123578, 2020.
Bujak, D., Ilic, S., Miličević, H., and Carević, D.: Wave Runup Prediction and Alongshore Variability on a Pocket Gravel Beach under Fetch-Limited Wave Conditions, J. Mar. Sci. Eng., 11, 614, https://doi.org/10.3390/jmse11030614, 2023.
Cabrita, P., Montes, J., Duo, E., Brunetta, R., and Ciavola, P.: The Role of Different Total Water Level Definitions in Coastal Flood Modelling on a Low-Elevation Dune System, J. Mar. Sci. Eng., 12, 1003, https://doi.org/10.3390/jmse12061003, 2024.
Caruso, M. F. and Marani, M.: Extreme-coastal-water-level estimation and projection: a comparison of statistical methods, Nat. Hazards Earth Syst. Sci., 22, 1109–1128, https://doi.org/10.5194/nhess-22-1109-2022, 2022.
Cavaleri, L., Balsamo, G., Beljaars, A., Bertotti, L., Davison, S., Edwards, J., Kanehama, T., and Wedi, N.: ECMWF and UK Met Office Offshore Blowing Winds: Impact of Horizontal Resolution and Coastal Orography, J. Geophys. Res.-Atmos., 129, 14 pp., https://doi.org/10.1029/2023JD039673, 2024.
Chao, W. T., Young, C. C., Hsu, T. W., Liu, W. C., and Liu, C. Y.: Long-lead-time prediction of storm surge using artificial neural networks and effective typhoon parameters: revisit and deeper insight, Water, 12, 2394, https://doi.org/10.3390/w12092394, 2020.
Ciavola, P., Ferreira, O., Haerens, P., Van Koningsveld, M., and Armaroli, C.: Storm impacts along European coastlines. Part 2: lessons learned from the MICORE project, Environ. Sci. Policy, 14, 924–933, https://doi.org/10.1016/j.envsci.2011.05.009, 2011.
Clementi, E., Aydogdu, A., Goglio, A.C., Pistoia, J., Escudier, R., Drudi, M., Grandi, A., Mariani, A., Lyubartsev, V., Lecci, R., Cretí, S., Coppini, G., Masina, S., and Pinardi, N.: Mediterranean Sea Physical Analysis and Forecast (CMEMS MED-Currents, EAS6 system), Version 1, Copernicus Monitoring Environment Marine Service (CMEMS) [data set], https://doi.org/10.25423/CMCC/MEDSEA_ANALYSISFOREC AST_PHY_006_013_EAS8, 2021.
CMS: Quality Information Document for the Mediterranean Sea Physics Analysis and Forecasting Product MEDSEA_ANALYSISFORECAST_PHY_006_013, Copernicus Marine Service, 63 pp., https://documentation.marine.copernicus.eu/QUID/CMEMS-MED-QUID-006-013.pdf (last access: 4 March 2025), 2024.
CMS: New Release of the Copernicus Marine Toolbox, Copernicus Marine Service, version 2.0.0, https://marine.copernicus.eu/news/new-release-copernicus-marine-toolbox, (last access: 5 March 2025), 2025.
CMS: Copernicus Emergency Management Service: EMSR858 – Situational reporting: Reporting, Copernicus, https://mapping.emergency.copernicus.eu/activations/EMSR858/reporting/, (last access: 28 February 2026), 2026.
Coco, G., Senechal, N., Rejas, A., Bryan, K. R., Capo, S., Parisot, J. P., Brown, J. A., and MacMahan, J. H. M.: Beach response to a sequence of extreme storms, Geomorphology, 204, 493–501, https://doi.org/10.1016/j.geomorph.2013.08.028, 2013.
Cohn, N. and Ruggiero, P.: The influence of seasonal to interannual nearshore profile variability on extreme water levels: Modeling wave runup on dissipative beaches, Coast. Eng., 115, 79–92, https://doi.org/10.1016/j.coastaleng.2016.01.006, 2016.
Croteau, R., Pacheco, A., and Ferreira, O.: Flood Vulnerability under Sea Level Rise for a Coastal Community Located in a Back-barrier Environment, Portugal, J. Coast. Conserv., 27, 16 pp., https://doi.org/10.1007/s11852-023-00955-x, 2023.
Dato, J. F., Dinápoli, M. G., D'Onofrio, E. E., and Simionato, C. G.: On water level forecasting using artificial neural networks: the case of the Río de la Plata Estuary, Argentina, Nat. Hazards, 120, 9753–9776, https://doi.org/10.1007/s11069-024-06585-2, 2024.
Del Río, L., Plomaritis, T. A., Benavente, J., Valladares, M., and Ribera, P.: Establishing Storm Thresholds for the Spanish Gulf of Cádiz, Geomorphology, 143–144, 13–23, https://doi.org/10.1016/j.geomorph.2011.04.048, 2012.
De Muro, S., Porta, M., Passarella, M., and Ibba, A.: Geomorphology of four wave-dominated microtidal Mediterranean beach systems with Posidonia oceanica meadow: a case study of the Northern Sardinia coast, J. Maps, 13, 74–85, https://doi.org/10.1080/17445647.2016.1259593, 2017.
Douglass, S. L.: Estimating extreme values of run-up on beaches, J. Waterway Port C. Div., 118, 220–224, https://doi.org/10.1061/(ASCE)0733-950X(1992)118:2(220), 1992.
ECMWF: Atmospheric Model high resolution 15-day forecast (Set I – HRES), European Center for Medium-Range Weather Forecasts, https://www.ecmwf.int/en/forecasts/datasets/set-i, (last access: 12 April 2025), 2025.
Eichentopf, S., Karunarathna, H., and Alsina, J. M.: Morphodynamics of sandy beaches under the influence of storm sequences: current research status and future needs, Water Sci. Eng., 12, 221–234, https://doi.org/10.1016/j.wse.2019.09.007, 2019.
EMODnet Bathymetry Consortium: EMODnet Digital Bathymetry (DTM 2024), https://doi.org/10.12770/cf51df64-56f9-4a99-b1aa-36b8d7b743a1, 2024.
Garzon, J. L., Ferreira, O., Zozimo, A. C., Fortes, C. J. E. M., Ferreira, A. M., Pinheiro, L. V., and Reis, M. T.: Development of a Bayesian networks-based early warning system for wave-induced flooding, Int. J. Disast. Risk Re., 96, 103931, https://doi.org/10.1016/j.ijdrr.2023.103931, 2023.
Gomes da Silva, P., Coco, G., Garnier, R., and Klein, A. H. F.: On the prediction of runup, setup and swash on beaches, Earth-Sci. Rev., 204, 103148, https://doi.org/10.1016/j.earscirev.2020.103148, 2020.
Haiden, T., Janousek, M., Vitart, F., Tanguy, M., Prates, F., and Chevallier, M.: Evaluation of ECMWF forecasts, ECMWF Technical Report, 62 pp., https://doi.org/10.21957/52f2f31351, 2024.
Harley, M. D., Valentini, A., Armaroli, C., Ciavola, P., Perini, L., Calabrese, L., and Marucci, F.: An early warning system for the on-line prediction of coastal storm risk on the Italian coastline, Coast. Eng. Proc., 1, 11 pp., https://doi.org/10.9753/icce.v33.management.77, 2012.
Harley, M. D., Valentini, A., Armaroli, C., Perini, L., Calabrese, L., and Ciavola, P.: Can an early-warning system help minimize the impacts of coastal storms? A case study of the 2012 Halloween storm, northern Italy, Nat. Hazards Earth Syst. Sci., 16, 209–222, https://doi.org/10.5194/nhess-16-209-2016, 2016.
Hashemi, M. R., Spaulding, M. L., Shaw, A., Farhadi, H., and Lewis, M.: An efficient artificial intelligence model for prediction of tropical storm surge, Nat. Hazards, 82, 471–491, https://doi.org/10.1007/s11069-016-2193-4, 2016.
Hasselmann, K., Barnett, T., Bouws, E., Carlson, H., Cartwright, D., Enke, K., Ewing, J. A., Gienapp, H., Hasselmann, D.E., Kruseman, P., Meerburg, A., Müller, P., Olbers, D.J., Richter, K., Sell, W., and Walden, H.: Measurements of wind-wave growth and swell decay during the Joint North Sea Wave Project (JONSWAP), Deut. Hydrograf. Z., Reihe A, 12, 1–95, 1973.
Hauer, M. E., Evans, J. M., and Mishra, D. R.: Millions projected to be at risk from sea-level rise in the continental United States, Nat. Clim. Change, 6, 691–695, https://doi.org/10.1038/nclimate2961, 2016.
Hersbach, H., Bell, B., Berrisford, P., Hirahara, S., Horányi, A., Muñoz-Sabater, J., Nicolas, J., Peubey, C., Radu, R., Schepers, D., Simmons, A., Soci, C., Abdalla, S., Abellan, X., Balsamo, G., Bechtold, P., Biavati, G., Bidlot, J., Bonavita, M., De Chiara, G., Dahlgren, P., Dee, D., Diamantakis, M., Dragani, R., Flemming, J., Forbes, R., Fuentes, M., Geer, A., Haimberger, L., Healy, S., Hogan, R. J., Hólm, E., Janisková, M., Keeley, S., Laloyaux, P., Lopez, P., Lupu, C., Radnoti, G., de Rosnay, P., Rozum, I., Vamborg, F., Villaume, S., and Thépaut, J.-N.: The ERA5 global reanalysis, Q. J. Roy. Meteor. Soc., 146, 1999–2049, https://doi.org/10.1002/qj.3803, 2020.
Holman, R. A.: Extreme value statistics for wave run-up on a natural beach, Coast. Eng., 9, 527–544, https://doi.org/10.1016/0378-3839(86)90002-5, 1986.
Hunt, I. A.: Design of seawalls and breakwaters, J. Waterway Div.-ASCE, 85, 123–152, https://doi.org/10.1061/JWHEAU.0000129, 1959.
IPCC: Climate Change 2023: Synthesis Report, Contribution of Working Groups I, II and III to the Sixth Assessment Report of the Intergovernmental Panel on Climate Change, edited by: Core Writing Team and Lee, H.-O., IPCC, Geneva, Switzerland, 202 pp., https://doi.org/10.59327/IPCC/AR6-9789291691647, 2023.
Irazoqui Apecechea, M., Melet, A., and Armaroli, C.: Towards a Pan-European Coastal Flood Awareness System: Skill of Extreme Sea-Level Forecasts from the Copernicus Marine Service, Front. Mar. Sci., 9, 1091844, https://doi.org/10.3389/fmars.2022.1091844, 2023.
Iribarren, C. R. and Nogales, C.: Protection des ports, Proceedings of the XVIIth International Navigation Congress, Lisbon, Portugal, Section II, Communication, 4, 31–80, 1949.
ISPRA: Tide Gauge Network – Cagliari Monitoring Station, Istituto Superiore per la Protezione e la Ricerca Ambientale, https://www.mareografico.it/?session=0S97946769682PJFG83R68&syslng=ita&sysmen=2&sysind=13&syssub=0&sysfnt=0&code=STAZ&idst=1I (last access: 14 March 2025), 2025.
Jelesnianski, C. P., Chen, J., and Shaffer, W. A.: SLOSH: Sea, Lake, and Overland Surges from Hurricanes, National Oceanic and Atmospheric Administration, Technical Report NWS 48, https://repository.library.noaa.gov/view/noaa/7235/noaa_7235_DS1.pdf (last access: 28 July 2024), 1992.
Jevrejeva, S., Jackson, L. P., Riva, R. E., Grinsted, A., and Moore, J. C.: Coastal sea level rise with warming above 2 °C, P. Natl. Acad. Sci. USA, 113, 13342–13347, https://doi.org/10.1073/pnas.1605312113, 2016.
Jimenez, J., Ciavola, P., Balouin, Y., Armaroli, C., Bosom, E., and Gervais, M.: Geomorphic Coastal Vulnerability to Storms in Microtidal Fetch-Limited Environments: Application to NW Mediterranean and N Adriatic Seas, J. Coastal Res., 56, 1641–1645, 2009.
Klonaris, G. Th., Memos, C. D., and Karambas, Th. V.: A Boussinesq-type model including wave-breaking terms in both continuity and momentum equations, Ocean Eng., 57, 128–140, https://doi.org/10.1016/j.oceaneng.2012.08.007, 2013.
Korres, G., Ravdas, M., Zacharioudaki, A., Denaxa, D., and Sotiropoulou, M.: Mediterranean Sea Waves Reanalysis (CMEMS Med-Waves, MedWAM3 system), Version 1, Copernicus Monitoring Environment Marine Service [data set], https://doi.org/10.10.25423/CMCC/MEDSEA_MULTIYEAR_ WAV_006_012, 2021.
Korres, G., Oikonomou, C., Denaxa, D., and Sotiropoulou, M.: Mediterranean Sea Waves Analysis and Forecast (Copernicus Marine Service MED-Waves, MEDWAM4 system), Version 1, Copernicus Marine Service [data set], https://doi.org/10.10.25423/CMCC/MEDSEA_ANALYSISFOR ECAST_WAV_006_017_MEDWAM4, 2023.
Le Gal, M., Fernández-Montblanc, T., Duo, E., Montes Perez, J., Cabrita, P., Souto Ceccon, P., Gastal, V., Ciavola, P., and Armaroli, C.: A new European coastal flood database for low–medium intensity events, Nat. Hazards Earth Syst. Sci., 23, 3585–3602, https://doi.org/10.5194/nhess-23-3585-2023, 2023.
Monioudi, I. N., Asariotis, R., Becker, A., Bhat, C., Dowding-Gooden, D., Esteban, M., Feyen, L., Mentaschi, L., Nikolaou, A., Nurse, L., Phillips, W., Smith, D. A. Y., Satoh, M., Trotz, U. O'D., Velegrakis, A. F., Voukouvalas, E., Vousdoukas, M. I., and Witkop, R.: Climate change impacts on critical international transportation assets of Caribbean Small Island Developing States (SIDS): the case of Jamaica and Saint Lucia, Reg. Environ. Change, 18, 2211–2225, https://doi.org/10.1007/s10113-018-1360-4, 2018.
Murfin, J. and Spiegel, M.: Is the risk of sea level rise capitalized in residential real estate?, Rev. Financ. Stud., 33, 1217–1255, https://doi.org/10.1093/rfs/hhz134, 2020.
Naeini, S. S. and Snaiki, R.: A physics-informed machine learning model for time-dependent wave runup prediction, Ocean Eng., 295, 116986, https://doi.org/10.1016/j.oceaneng.2024.116986, 2024.
Neumann, B., Vafeidis, A. T., Zimmermann, J., and Nicholls, R. J.: Future coastal population growth and exposure to sea-level rise and coastal flooding – a global assessment, PLoS ONE, 10, e0118571, https://doi.org/10.1371/journal.pone.0118571, 2015a
Neumann, J. E., Price, J., Chinowsky, P., Wright, L., Ludwig, L., Streeter, R., Jones, R., Smith, J. B., Perkins, W., Jantarasami, L., and Martinich, J.: Climate change risks to US infrastructure: impacts on roads, bridges, coastal development, and urban drainage, Climatic Change, 131, 97–109, https://doi.org/10.1007/s10584-013-1037-4, 2015b.
Nicholls, R. J., Hinkel, J., Lincke, D., and van der Pol, T.: Global investment costs for coastal defense through the 21st century, The World Bank, Policy Research Working Paper No. 8745, 64 pp., https://doi.org/10.1596/1813-9450-8745, 2019.
Nielsen, P. and Hanslow, D. J.: Wave run-up distributions on natural beaches, J. Coastal Res., 7, 1139–1152, 1991.
Oikonomou, C., Denaxa, D., and Korres, G.: Quality Information Document for Mediterranean Production Centre, product: MEDSEA_ANALYSISFORECAST_WAV_006_017, Copernicus Marine Service, 39 pp., https://catalogue.marine.copernicus.eu/documents/QUID/CMEMS-MED-QUID-006-017.pdf (last access: 13 February 2025), 2023.
Oo, Y. H., Vieira da Silva, G., and Zhang, H.: Storm sequence chronology and initial profile morphology controls on beach erosion, Appl. Ocean Res., 130, 103431, https://doi.org/10.1016/j.apor.2022.103431, 2023.
Otto, P., Piter, A., and Gijsman, R.: Statistical Analysis of Beach Profiles – A Spatiotemporal Functional Approach, Coast. Eng., 170, 103999, https://doi.org/10.1016/j.coastaleng.2021.103999, 2021.
Paprotny, D., Andrzejewski, P., Terefenko, P., and Furmanczyk, K.: Application of Empirical Wave Run-Up Formulas to the Polish Baltic Sea Coast, PLoS ONE, 9, e105437, https://doi.org/10.1371/journal.pone.0105437, 2014.
Pérez-Gómez, B., Garcia-Leon, M., Garcia-Valdecasas, J., Clementi, E., Mosso Aranda, C., Perez-Rubio, S., Masina, S., Coppini, G., Molina-Sanchez, R., Munoz-Cubillo, A., Garcia Fletcher, A., Sanchez Gonzalez, J. F., Sanchez-Arcilla, A., and Alvarez Fanjul, E.: Understanding Sea Level Processes During Western Mediterranean Storm Gloria, Front. Mar. Sci., 8, 647437, https://doi.org/10.3389/fmars.2021.647437, 2021.
Poate, T. G., McCall, R., and Masselink, G.: A new parameterisation for runup on gravel beaches, Coast. Eng., 117, 176–190, https://doi.org/10.1016/j.coastaleng.2016.08.003, 2016.
Pugh, D. T.: Tides, Surges, and Mean Sea-Level: A Handbook for Engineers and Scientists, John Wiley and Sons Ltd., Hoboken, New York, USA, 472 pp., ISBN: 047191505X, 1987.
Roelvink, D., Reneirs, A., van Dongeren, A., van Thiel de Vries, J., McCall, R., and Lescinsky, J.: Modeling storm impacts on beaches, dunes and barrier islands, Coast. Eng., 56, 1133–1152, https://doi.org/10.1016/j.coastaleng.2009.08.006, 2009.
Ruggiero, P., Holman, R. A., and Beach, R. A.: Wave run-up on a high-energy dissipative beach, J. Geophys. Res., 109, C06025, https://doi.org/10.1029/2003JC002160, 2004.
Ruju, A., Passarella, M., Trogu, D., Buosi, C., Ibba, A., and De Muro, S.: An operational wave system within the monitoring program of a mediterranean beach, J. Mar. Sci. Eng., 7, 32, https://doi.org/10.3390/jmse7020032, 2019.
Ruju, A., Buosi, C., Coco, G., Porta, M., Trogu, D., Ibba, A., and De Muro, S.: Ecosystem services of reed and seagrass debris on a urban Mediterranean beach (Poetto, Italy), Estuar. Coast. Shelf S., 271, 107862, https://doi.org/10.1016/j.ecss.2022.107862, 2022.
Ruju, A. and Viola, F.:. An assessment of the impact of boundary conditions in dynamical downscaling techniques for fetch-limited waves, Coast. Eng. J., 66, 637–658, https://doi.org/10.1080/21664250.2024.2399393, 2024.
Rulent, J., Calafat, F. M., Banks, C. J., Bricheno, L. M., Gommenginger, C., Green, J. A. M., Haigh, I. D., Lewis, H., and Martin, A. C. H.: Comparing Water Level Estimation in Coastal and Shelf Seas from Satellite Altimetry and Numerical Models, Front. Mar. Sci., 7, 549467, https://doi.org/10.3389/fmars.2020.549467, 2020.
Sanchez-Arcilla, A., Gomez-Aguar, J., Egozcue, J. J., Ortego, M. I., Galiatsatou, P., and Prinos, P.: Extremes from scarce data. The role of Bayesian and scaling techniques in reducing uncertainty, J. Hydraul. Res., 46, 224–234, https://doi.org/10.1080/00221686.2008.9521956, 2008.
Sánchez-Artús, X., Gracia, V., Espino, M., Grifoll, M., Simarro, G., Guillén, J., González, M., and Sanchez-Arcilla, A.: Operational hydrodynamic service as a tool for coastal flood assessment, Ocean Sci., 21, 749–766, https://doi.org/10.5194/os-21-749-2025, 2025.
Sardegna Geoportale: WMS Service – Regione Sardegna, https://webgis.regione.sardegna.it/geoserverraster/ows?service=WMS&request=GetCapabilities (last access: 5 May 2024), 2024.
Senechal, N., Coco, G., Bryan, K. R., and Holman, R. A.: Wave runup during extreme storm conditions, J. Geophys. Res.-Oceans, 116, C07032, https://doi.org/10.1029/2010JC006819, 2011.
Stephens, E. and Cloke, H.: Improving flood forecasts for better flood preparedness in the UK (and beyond), Geogr. J., 180, 310–316, https://doi.org/10.1111/geoj.12103, 2014.
Stockdon, H. F., Holman, R. A., Howd, P. A., and Sallenger, J. A. H.: Empirical parameterization of setup, swash, and runup, Coast. Eng., 53, 573–588, https://doi.org/10.1016/j.coastaleng.2005.12.005, 2006.
Stokes, K., Poate, T. Masselink, G., King, E., Saulter, A., and Ely, N.: Forecasting coastal overtopping at engineered and naturally defended coastlines, Coast. Eng., 164, p.103827, https://doi.org/10.1016/j.coastaleng.2020.103827, 2021.
Strazzera, E., Cherchi, E., and Ferrini, S.: A choice modelling approach for assessment of use and quasi option value in urban planning for areas of environmental interest, Fondazione Eni Enrico Mattei, NDL63.2008, 32 pp., https://doi.org/10.22004/ag.econ.42903, 2008.
Suanez, S., Blaise, E., Cancouet, R., and Floch, F.: Empirical Parameterization of Wave Runup and Dune Erosion during Storm Conditions on a Natural Macrotidal Beach Serge, J. Coastal Res., 75, 932–936, https://doi.org/10.2112/SI75-187.1, 2016.
Trogu, D., Simeone, S., Ruju, A., Porta, M., Ibba, A., and De Muro, S.: A Four-Year Video Monitoring Analysis of the Posidonia oceanica Banquette Dynamic: A Case Study from an Urban Microtidal Mediterranean Beach (Poetto Beach, Southern Sardinia, Italy), J. Mar. Sci. Eng., 11, 2376, https://doi.org/10.3390/jmse11122376, 2023.
Trogu, D., Simeone, S., Usai, A., Porta, M., and De Muro, S.: On the role of wood and seagrass rests in coastal flooding events in Mediterranean microtidal beaches, Journal of Marine Sciences and Engineering (JMSE), 113, 115–119, https://doi.org/10.2112/JCR-SI113-023.1, 2024.
Trogu, D., Porta, M., Usai, A., De Muro, S., Chatzipavlis, A., Ruju, A., Montes, J., Coco, G., and Ciavola, P.: Supplementary dataset (frames) of the submitted to NHESS paper (ID: EGUSPHERE_2025_2292), Version v1, Zenodo [data set], https://doi.org/10.5281/zenodo.18828498, 2026.
UNCTAD: Climate change impacts on coastal transport infrastructure in the Caribbean: enhancing the adaptive capacity of Small Island Developing States (SIDS), Saint Lucia: A case study, United Nations Conference on Trade and Development (UNCTAD), UNDA project 1415O, 136 pp., https://unctad.org/system/files/official-document/dtltlb2018d3_en.pdf, (last access: 27 July 2024), 2018.
USACE: Shore Protection Manual, United States Army Corps of Engineers – Coastal Engineering Research Center, United States Washington, DC, USA, https://doi.org/10.5962/bhl.title.47829, 1984.
Vousdoukas, M. I., Velegrakis, A. F, Dimou, K., Zervakis, V., and Conley, D. C.: Wave run-up observations in microtidal, sediment-starved beaches of the Eastern Mediterranean. J. Marine Syst., 78, 537–547, https://doi.org/10.1016/j.jmarsys.2009.01.004, 2009.
Vousdoukas, M. I., Wziatek, D., and Almeida, L. P.: Coastal vulnerability assessment based on video wave run-up observations at a mesotidal, steep-sloped beach, Ocean Dynam., 62, 123–137, https://doi.org/10.1007/s10236-011-0480-x, 2012.
Vousdoukas, M. I., Voukouvalas, E., Mentaschi, L., Dottori, F., Giardino, A., Bouziotas, D., Bianchi, A., Salamon, P., and Feyen, L.: Developments in large-scale coastal flood hazard mapping, Nat. Hazards Earth Syst. Sci., 16, 1841–1853, https://doi.org/10.5194/nhess-16-1841-2016, 2016.
Vousdoukas, M. I., Mentaschi, L., Voukouvalas, E., Bianchi, A., Dottori, F., and Feyen, L.: Climatic and socioeconomic controls of future coastal flood risk in Europe, Nat. Clim. Change, 8, 776–780, https://doi.org/10.1038/s41558-018-0260-4, 2018a.
Vousdoukas, M. I., Mentaschi, L., Voukouvalas, E., Verlaan, M., Jevrejeva, S., Jackson, L. P., and Feyen, L.: Global Probabilistic Projections of Extreme Sea Levels Show Intensification of Coastal Flood Hazard, Nat. Commun., 9, 2360, https://doi.org/10.1038/s41467-018-04692-w, 2018b.
Vousdoukas, M., Mentaschi, L., Mongelli, I., Ciscar Martinez, J., Hinkel, J., Ward, P., Gosling, S., and Feyen, L.: Adapting to rising coastal flood risk in the EU under climate change, Publications Office of the European Union, Luxembourg, JRC118512, https://doi.org/10.2760/456870, ISBN 978-92-76-12990-5, 2020.
Wang, Q., Chen, J., and Hu, K.: Storm surge prediction for Louisiana coast using artificial neural networks, in: Neural Information Processing, ICONIP 2016, edited by: Hirose, A., Ozawa, S., Doya, K., Ikeda, K., Lee, M., and Liu, D., Lecture Notes in Computer Science, Springer, Cham, Switzerland, 9949, 396–405, https://doi.org/10.1007/978-3-319-46675-0_43, 2016.
Wang, W. and Yuan, H.: A tidal level prediction approach based on BP neural network and cubic B-spline curve with knot insertion algorithm, Math. Probl. Eng., 2018, 9835079, https://doi.org/10.1155/2018/9835079, 2018.
Xiao, C., Zhang, K., and Shen, J.: CEST: A Three-Dimensional Coastal and Estuarine Storm Tide Model, International Hurricane Research Center, Florida International University, Miami, Florida, 20 pp., 2006.
Zampato, L., Bajo, M., Canestrelli, P., and Umgiesser, G.: Storm surge modelling in Venice: two years of operational results, J. Oper. Oceanogr., 9, 46–57, https://doi.org/10.1080/1755876x.2015.1118804, 2016.
Zhao, Y., Li, F., Yao, R., Jiao, W., and Hill, R. L.: An Empirical Orthogonal Function-Based Approach for Spatially- and Temporally-Extensive Soil Moisture Data Combination, Water, 12, 2919, https://doi.org/10.3390/w12102919, 2020.
Zijlema, M. and van der Westhuysen, A. J.: On convergence behaviour and numerical accuracy in stationary SWAN simulations of nearshore wind wave spectra, Coast. Eng., 52,(3) 237–256, https://doi.org/10.1016/j.coastaleng.2004.12.006, 2005.
Zijlema, M., Stelling, G. S., and Smit, P. B.: SWASH: An operational public domain code for simulating wave fields and rapidly varied flows in coastal waters, Coast. Eng., 58, 992–1012, https://doi.org/10.1016/j.coastaleng.2011.05.015, 2011.
- Abstract
- Introduction
- Methodology
- Results
- Discussion
- Conclusions
- Appendix A: Wind, Wave and Sea Level Forecasts and wave run-up predictors
- Appendix B: Extended Validation – Wind Regime
- Appendix C: Extended Validation – Sea Level
- Appendix D: Extended Validation – Waves
- Code and data availability
- Data availability
- Author contributions
- Competing interests
- Disclaimer
- Acknowledgements
- Financial support
- Review statement
- References