the Creative Commons Attribution 4.0 License.
the Creative Commons Attribution 4.0 License.
 | 18 Mar 2026
The role of El Niño Southern Oscillation in driving coastal hazards in the U.S. Pacific Northwest
Peter Ruggiero
Laura Cagigal
Dylan Anderson
Fernando Mendez
Since the 1982–1983 major El Niño event, the El Niño Southern Oscillation (ENSO) has been suspected to be a major driver of coastal hazards in the U.S. Pacific Northwest (PNW). However, the limited availability of observations, combined with the diversity of ENSO characteristics, has led to significant challenges constraining the teleconnections between ENSO effects and hazardous impacts on the coast. Defining these teleconnections provides key insight into internal climate dynamics and will inform hazard management. Here, we used a stochastic climate emulator to probabilistically assess the role of ENSO phase, ENSO strength, and synoptic weather in driving flooding and erosion hazard proxies on the U.S. PNW coast. When compared to the last 45 years of observations, our simulations suggest that ENSO is not necessarily a strong predictor of cross-shore coastal hazards in the PNW, and instead, indicate that the relationship between ENSO and coastal hazard teleconnections is more complex than previously believed.
- Article
(10840 KB) - Full-text XML
-
Supplement
(1546 KB) - BibTeX
- EndNote


Chronic coastal hazards, such as flooding and erosion, are driven by complex multivariate forcings that include large-scale climate patterns, synoptic weather, and local hydrodynamic and morphologic conditions. There is high certainty that many of these drivers are intensifying due to climate change (Oppenheimer et al., 2019; Erikson et al., 2022). However, the magnitude, modality, and impacts of these changes are much less certain (Cai et al., 2020). Furthermore, the fundamental connections between these drivers and their role in forcing coastal hazards is also highly uncertain (Mentaschi et al., 2017; Sprintall et al., 2020; Taschetto et al., 2020). Understanding the role climate and weather patterns play in driving coastal hazards is crucial to identifying and preparing for how changes to those systems may translate to changing hazard exposure. By anticipating the hazardous teleconnections of climate and weather patterns, coastal communities can implement interventions that mitigate negative impacts associated with different climate phases (Goddard and Gershunov, 2020).
The El Niño Southern Oscillation (ENSO) is the major driver of interannual climatic variability in the Pacific (McPhaden et al., 2020), and there is a strong body of evidence indicating that variations in ENSO are associated with elevated coastal hazards globally (e.g., Barnard et al., 2015). For example, using satellite-derived shorelines, ENSO phase has been associated with dramatic shoreline change in the Pacific Basin and even beyond (Almar et al., 2023; Vos et al., 2023). Complicating the relationship between ENSO events and coastal hazard teleconnections are the many flavors of El Niño, distinct in the strength, persistence, and location of sea-surface temperature anomalies (SSTAs) in the Pacific Basin, which can lead to wide variations in the teleconnections felt by coastal regions (Capotondi et al., 2020; Paek et al., 2017; Timmermann et al., 2018). Eastern Pacific (EP) and Central Pacific (CP) events are endmembers of El Niño types, with names reflecting their differing peak SSTA locations. EP El Niño events (e.g., 1982–1983 and 1997–1998) tend to be stronger (have larger SSTAs) than CP events (e.g., 2009–2010) (Capotondi et al., 2020). However, larger SSTAs do not always translate to more intense teleconnections (Barnard et al., 2017; Boucharel et al., 2021) and there is limited understanding of the influence of EP versus CP El Niño events in shaping coastal hazard impacts (Barnard et al., 2011, 2015; Boucharel et al., 2024). Mixed EP-CP events (e.g., 2015–2016) can further blur the role of ENSO diversity in driving coastal impacts, as they contain traits associated with both El Niño endmembers.
Since the 1982–1983 El Niño event, when significant property losses occurred, ENSO has been recognized as an important driver of coastal flooding and erosion for the U.S. PNW Coast (Allan and Komar, 2002; Komar, 1998, 1986). Subsequent observations of ENSO patterns in this region have revealed El Niño events (the warm phase of ENSO) can elevate winter water levels on the order of 10–30 cm (Barnard et al., 2015; Komar et al., 2011; Shope et al., 2022), can amplify winter wave energy by ∼ 30 % (as seen during the 2015–2016 El Niño event; Barnard et al., 2017; Shope et al., 2022), and have been associated with more frequent high-energy winter storm events (Allan and Komar, 2002; Aramburo et al., 2022; Boucharel et al., 2021; Bromirski et al., 2005; Komar, 1998). These compounding increases to hazardous conditions have led to widespread and severe coastal impacts (e.g., property damage, shoreline retreat, infrastructure inundation) on the U.S. West/PNW Coast reported during 1982–1983, 1997–1998, 2009–2010, and 2015–2016 El Niño winters (Allan and Komar, 2002; Barnard et al., 2011, 2015, 2017; Kaminsky et al., 1998; Komar, 1986, 1998; Ruggiero et al., 2013).
Based on the three major El Niño events between 1982–2016, ENSO has been suspected to be a key driver of PNW coastal hazards (Komar et al., 2013; Ruggiero et al., 2005; Ruggiero et al., 2013). However, there is a relatively short record of ENSO variability (∼ 150 years of instrumental observations) and even shorter records of coastal hazard teleconnections (∼ 45 years of satellite observations or reanalysis data). Furthermore, of the last 150 years, three of the four strongest El Niño events (1877–1878, 1982–1983, 1997–1998, and 2015–2016) occurred in the last fifty (Huang et al., 2016; Webb and Magi, 2022). Therefore, the timing of the three “super strong” El Niño events, those that have an SSTA greater than 2.0 °C, raises the question – “is our understanding of ENSO's role in driving U.S. PNW coastal erosion biased by the recency of the extreme El Niño events and our developing ability to measure ENSO and its teleconnections?” In fact, the most recent El Niño (2023–2024), a strong (borderline super strong) event, further calls into question potential biases in our understanding of ENSO-PNW coastal-hazard teleconnections. During the 2023–2024 winter, the PNW experienced water levels 16.5 cm higher than typical, but wave energy flux only 3 % larger than average winters and beach profiling data suggest relatively unremarkable shoreline change (Oregon Department of Geology and Mineral Industries (DOGAMI), 2024). The relatively inconsequential influence of the 2023–2024 El Niño on wave energy flux and shoreline change suggests that there can be diverse teleconnections between even strong El Niño events and PNW coastal hazard impacts. Therefore, there is a need to contextualize observations of the last half-century regarding the relationship between ENSO and coastal-hazard teleconnections within the longer-term climate record.
To constrain the connections between different ENSO phases and intensities and their associated coastal hazard impacts, most studies to date have relied on observational or reanalysis data (Almar et al., 2023; Barnard et al., 2011, 2015, 2017; Boucharel et al., 2021; Odériz et al., 2020; Vos et al., 2023). Of the studies addressing this topic, some have excluded the PNW from their analysis due to limited data or less apparent climate signals (Boucharel et al., 2021; Vos et al., 2023). However, these analyses have greatly refined our understanding of the hydrodynamic and coastal hazard teleconnections of ENSO within the Pacific Basin and beyond. For example, recent studies have used wave and wind reanalysis data to assess historical teleconnections between ENSO and wave climates, finding that the PNW tends to experience increased wave energy and anticlockwise (southerly) rotation in wave direction during El Niño years, and the opposite in La Niña years (Oderiz et a., 2020). These effects are associated with strengthened wind speeds caused by intensification of both local and far-field storms (Aramburo et al., 2022) and shifts in storm track locations due to ENSO-driven alterations to jet stream activity (Aramburo et al., 2022; Boucharel et al., 2021; Bromirski et al.,2005; Kako and Kubota, 2006). Other studies have analyzed ENSO teleconnection impacts on shoreline evolution at global and U.S. PNW scale (Almar et al., 2023; Barnard et al., 2011, 2015, 2017; Taherkhani et al., 2026; Vos et al., 2023). These studies explored shoreline change datasets ranging from 13 to 40 years in length, spanning ENSO events from 1984–2024 at most. All found higher rates of shoreline retreat, elevated water levels, and higher than typical wave energy flux during major El Niño years for the North Pacific.
While connections between coastal hazard drivers (water levels, waves, and storminess) and ENSO dynamics are well-established, due to the diversity of ENSO events, the extent, intensity, and directionality of connected coastal hazard drivers for a given ENSO event remains difficult to predict. Barnard et al. (2011, 2017) in particular, highlighted the role ENSO diversity plays in driving coastal hazards on the U.S. PNW coast. For example, while PNW beaches all experienced elevated water levels during the 1997–1998, 2009–2010, and 2015–2016 El Niño winters, the 1997–1998 (an EP El Niño) winter was significantly higher than the mean (+23 cm) when compared to the 2009–2010 (CP) winter (∼ +5 cm) and the 2015–2016 (mixed EP-CP) winter (+17 cm). Storm-wave energy flux (top 5 %) was 29 %–44 % higher in the 2015–2016 winter when compared to the 1997–1998 winter. Variations in wave energy flux have been attributed to shifts in storm tracks, either farther north (as during the 2015–2016 year) or south (as during the 1997–1998 event). The shifts in storm tracks also serve to modify the directionality of storm wave energy, causing increased hotspot erosion (i.e., shoreline re-orientation; Anderson et al., 2018). For instance, during the 1997–1998 El Niño, waves approached with more southerly angles than typical, causing southern portions of Oregon and Washington littoral cells to experience shoreline retreat rates on the order of 10 to 40 m yr−1 while northern portions experienced accretion rates ranging 10 to 30 m yr−1 (Ruggiero et al., 2005). Elevated water levels and wave energy flux during El Niño events also contribute to cross-shore sediment-transport gradients, which leads to anomalous offshore sediment deposition rather than shoreline reorientation. For example, while the 1997–1998 and 2009–2010 El Niño years had comparable wave direction anomalies, 1997–1998 had much higher wave energy flux and water level anomalies leading to relatively more offshore deposition (shoreline erosion), compared to the alongshore transport (shoreline re-orientation) seen in 2009–2010.
Compared to El Niño, the role of La Niña in shaping PNW coastal hazards has been relatively unexplored. However, the 1998–1999 La Niña (a strong to moderate event) was noted for causing greater water-level anomalies than the 2009–2010 El Niño, winter wave heights comparable to the 1997–1998 El Niño, and northerly shifted storm tracks and wave-direction anomalies (Allan and Komar, 2002; Barnard et al., 2011). This event ultimately produced greater winter shoreline retreat than the 1997–1998 El Niño (Barnard et al., 2011), causing dune recession on the order of > 30 m in some locations (Ruggiero and Voigt, 2000).
Collectively, these studies have greatly advanced our understanding of coastal hazards associated with individual ENSO events in the last ∼ 45 years but are limited in their ability to statistically assess ENSO-coastal hazard teleconnections, as the timeframes they assess comprise at most 2–4 strong El Niño and La Niña years each. Probabilistic assessments of these teleconnections can reveal new insights about the inherent diversity and stochasticity of ENSO and its connection to coastal hazards to provide coastal managers with a fuller representation of potential hazard exposure and risk. To address this, we use a stochastic climate emulator first presented in Anderson et al. (2019). This model employs a weather-type-based approach that allows for the probabilistic simulation of hydrodynamic drivers responsible for coastal hazards while retaining dependencies between the hazard drivers and the climate and weather patterns that force them. This probabilistic and climate-aware approach enables exploration of coastal hazards that captures the inherent randomness of individual processes that when superimposed can compound or dampen the overall hazard signal. Furthermore, the weather-typing approach is designed to simulate ENSO events that are previously unseen in the historic record, but statistically feasible based on observations of climate, weather, and hydrodynamic data, allowing for the exploration of a broader range of ENSO diversity than was seen in the ∼ 45 years of observations. This approach enables refined characterization of various ENSO flavors, and their associated coastal hazards impacts within the full probability space associated with climatic variability seen from 1880–2016. As predictions of future ENSO evolve, the characterizations of the ENSO-coastal hazard teleconnections can be used to constrain the range of hazard exposure that coastal communities must prepare for and, ultimately, develop better informed hazard planning.
Using the stochastic climate emulator, we generated 10 000 years of synthetic hydrodynamic drivers and assessed the coastal hazard impacts associated with different ENSO phases, ENSO intensities, and seasonal weather patterns for the Pacific Northwest, USA, ranging from Northern Washington to Northern California. This dataset was produced at 100 m scale resolution (9000 transects), involving the simulation of offshore coastal hazard drivers, nearshore bathymetric transformation, and the calculation of onshore hazard proxies (Leung, et al., 2024a). The analysis shown below use a subset of this data, centered around Northern Oregon/Southern Washington, to highlight the role of ENSO and synoptic weather in driving extreme hydrodynamic conditions and associated outer-coast coastal hazards for this region. While these simulations identify winter anomalies during El Niño years in line with historical observations, they show a broader range of possible hydrodynamic and hazard teleconnections than suggested by studies focusing primarily on recent strong ENSO events. This probabilistic analysis indicates that there are more complex forcings influencing the relationship between ENSO and U.S. PNW Coast hazards than suggested by considering the past 45 years of data alone.
This analysis integrates a stochastic climate emulator (Anderson et al., 2019) with a coastal hazard impact analysis based on the Sallenger Storm Impact Regimes (Sallenger, 2000) to probabilistically assess the range of hazards associated with different ENSO phases and strengths, as well as different synoptic weather patterns. An overview of the complete methodology including relevant input datasets employed in this analysis can be found in Fig. 1.
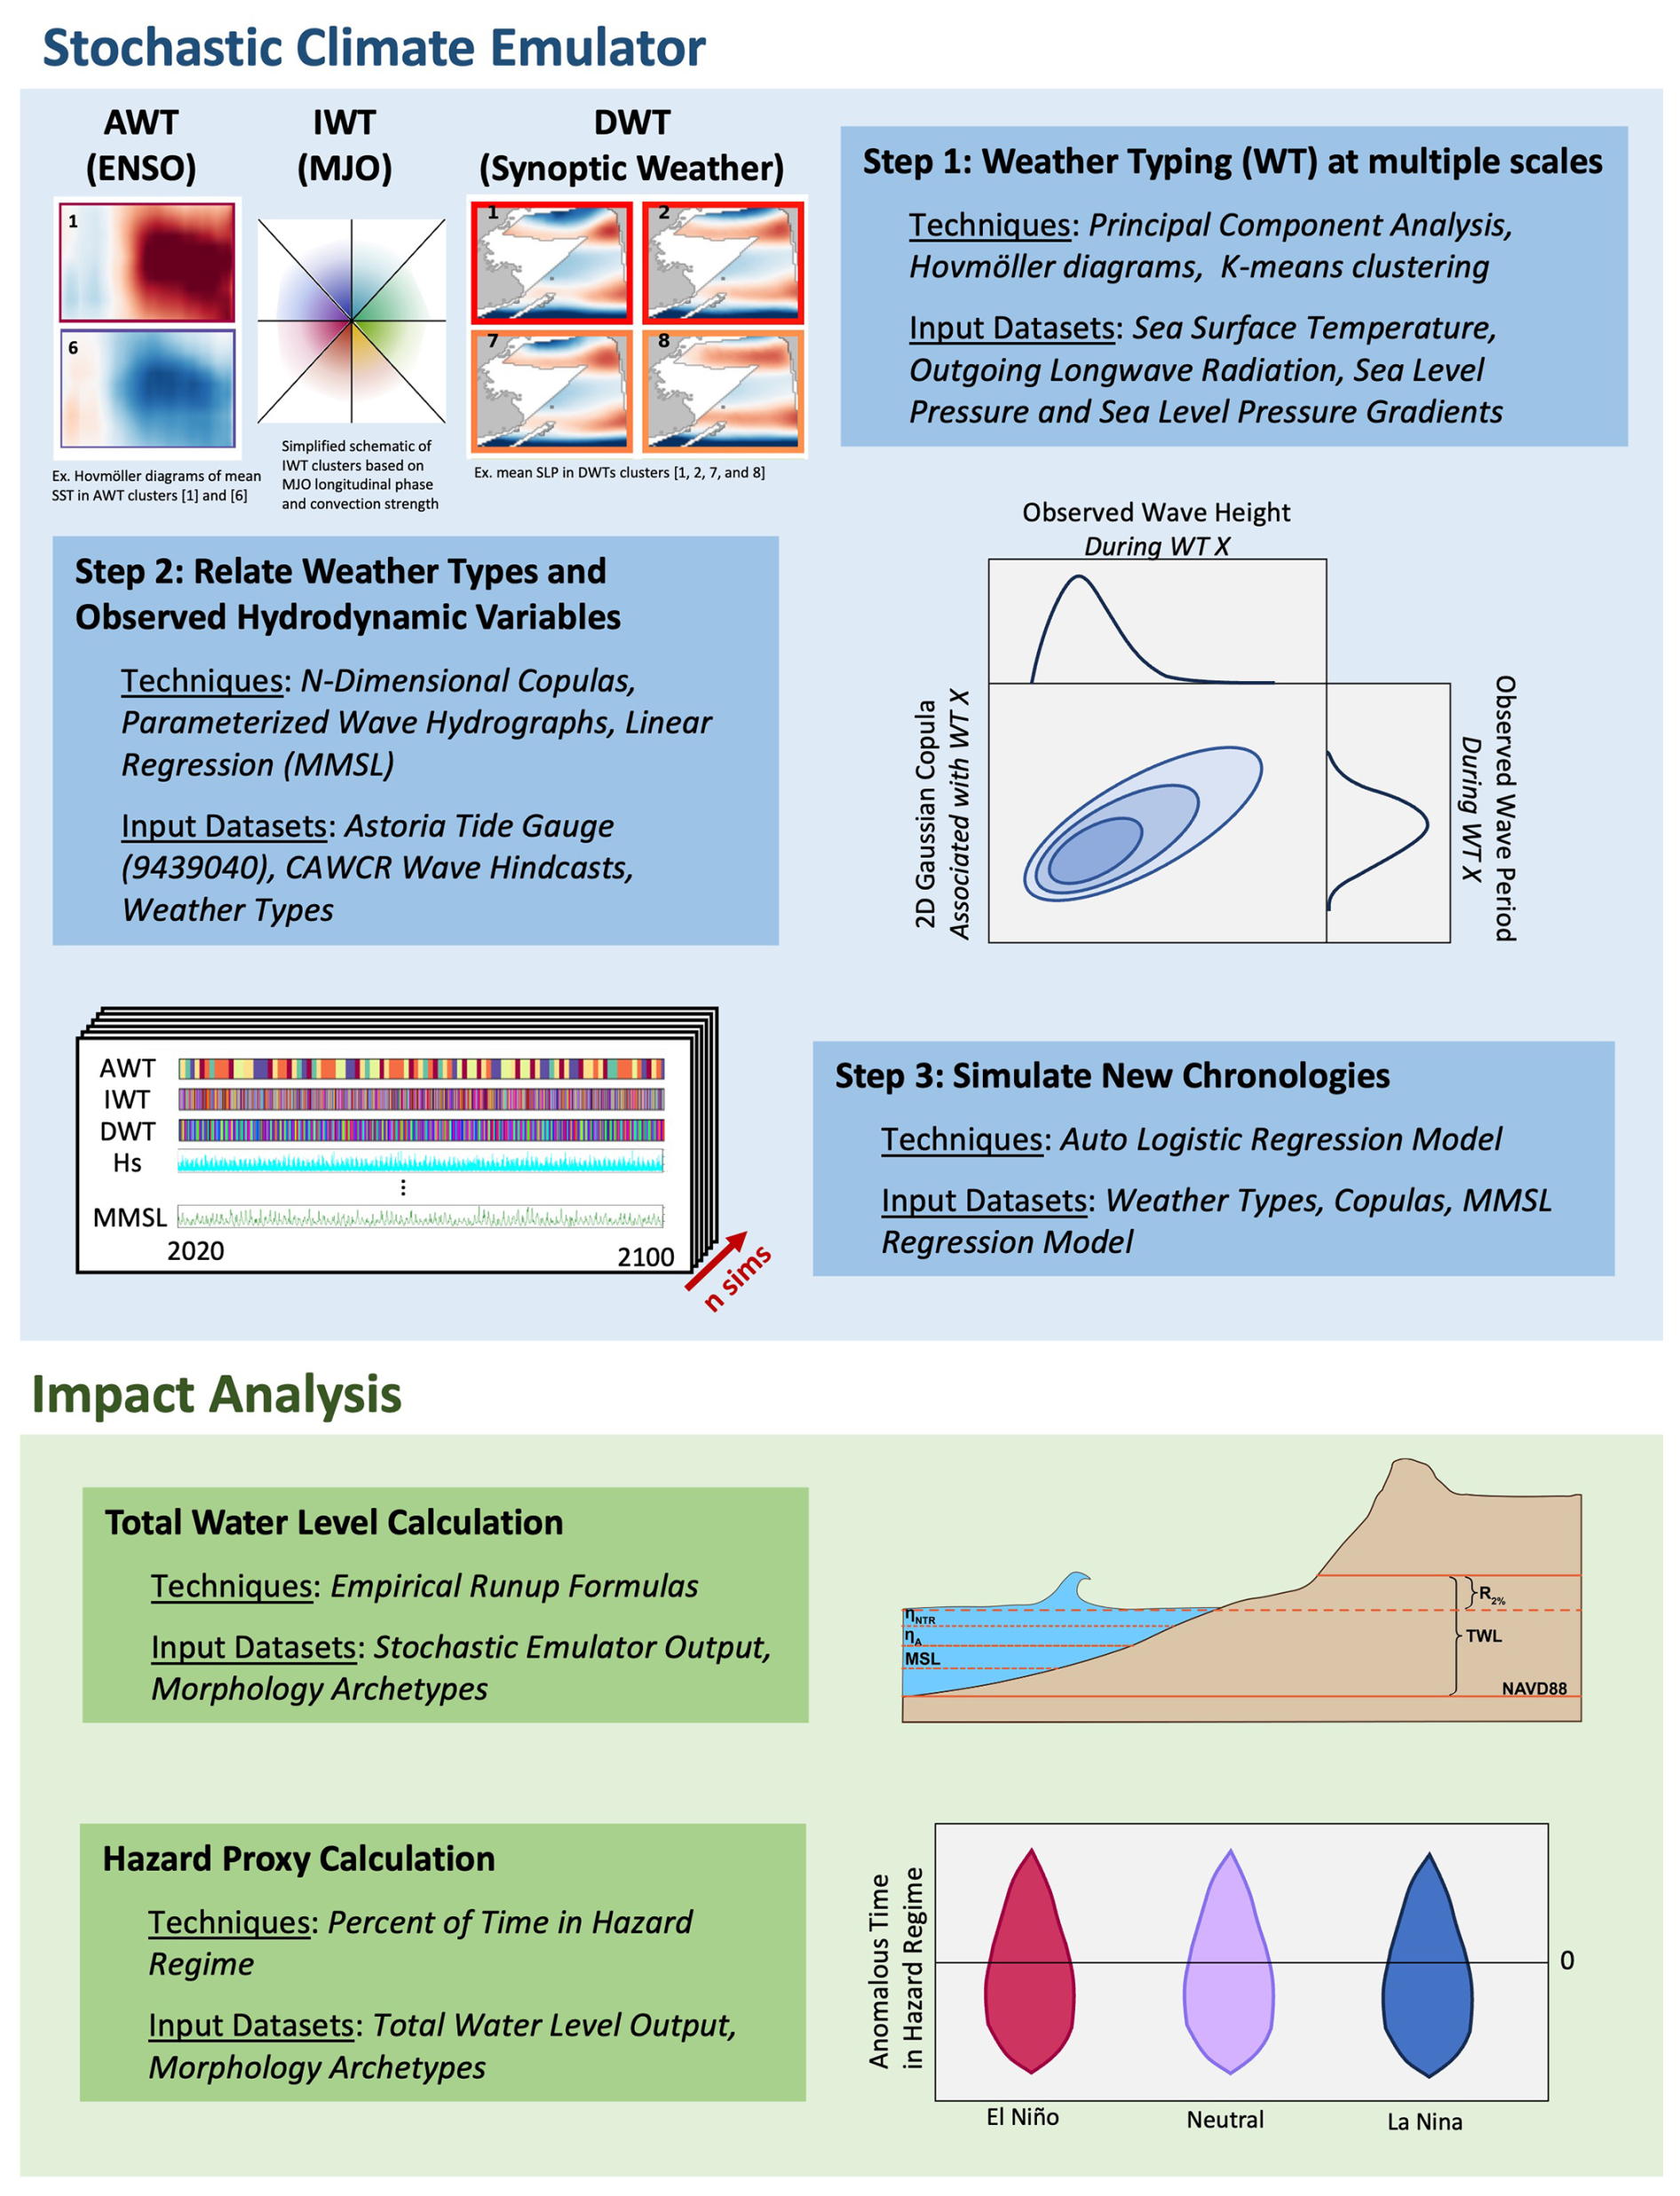
Figure 1A methodological overview of the techniques and datasets employed in this analysis. A stochastic climate emulator is used to generate climate-aware simulations of hydrodynamic data, while total water level calculations and hazard proxies are used to assess the influence of climate and weather on hazard exposure.
2.1 Stochastic Climate Emulator
The climate emulator. uses machine learning (e.g., k-means clustering, auto-logistic regression) and statistical modeling (e.g., principal component [PC] analysis, copulas) techniques to generate new chronologies of climate, weather, and hydrodynamic drivers based on historical observations and reanalysis of oceanographic and atmospheric data. Simulated variables include annual weather types (AWTs), intraseasonal weather types (IWTs), daily weather types (DWT), wave characteristics (height, period, direction), and water-level drivers such as storm surge (SS) and monthly mean sea level (MMSL). With the emulator, 10 000 years of hypothetical chronologies of these variables were generated at hourly timescale based on the statistical relationships derived from observations of present-day climate for the PNW, USA. This approach generates timeseries that represent the full range of forcing, as it captures the inherent randomness of individual processes that, when superimposed, can compound or dampen the overall TWL signal. The stochastic climate emulator methodology has been applied and validated at several sites globally (Anderson et al., 2021; D'Anna et al., 2022; Marra et al., 2022; Vitousek et al., 2021), including for the PNW region explored here (Leung et al., 2024a).
A key strength of the climate emulator is the weather type-based approach (Camus et al., 2014), which enables the retention and representation of multivariate interconnections between climate, weather, and hazard drivers. Following the methodology presented in Anderson et al. (2019), historical annual weather types (AWTs) are constructed through weather typing (k-means clustering of dominant PCs) of SSTA Hovmöller diagrams based on SSTAs (Extended Reconstructed SST v4, i.e., ERSSTv4 (Huang et al., 2015)) in the equatorial Pacific (Sect. S1.1 in the Supplement). This process clusters AWT PCs into six AWTs, which in order, represent conditions typical of EP El Niño, CP El Niño, three transition or neutral phases of ENSO, and La Niña (Fig. 2a). This custom ENSO index preserves orthogonal modes of variability in SSTA patterns, critical for representing event diversity and complexity (Almar et al., 2023; Williams and Patricola, 2018), while enabling analysis of similar ENSO phases through the clustered label (AWT 1–6). It further supports generation of synthetic ENSO events via random sampling of gaussian copulas constructed from AWT PCs, essentially enabling the representation of statistically plausible SSTA behavior that does not replicate historical observations (Fig. 2b–c and Sect. S1.2).
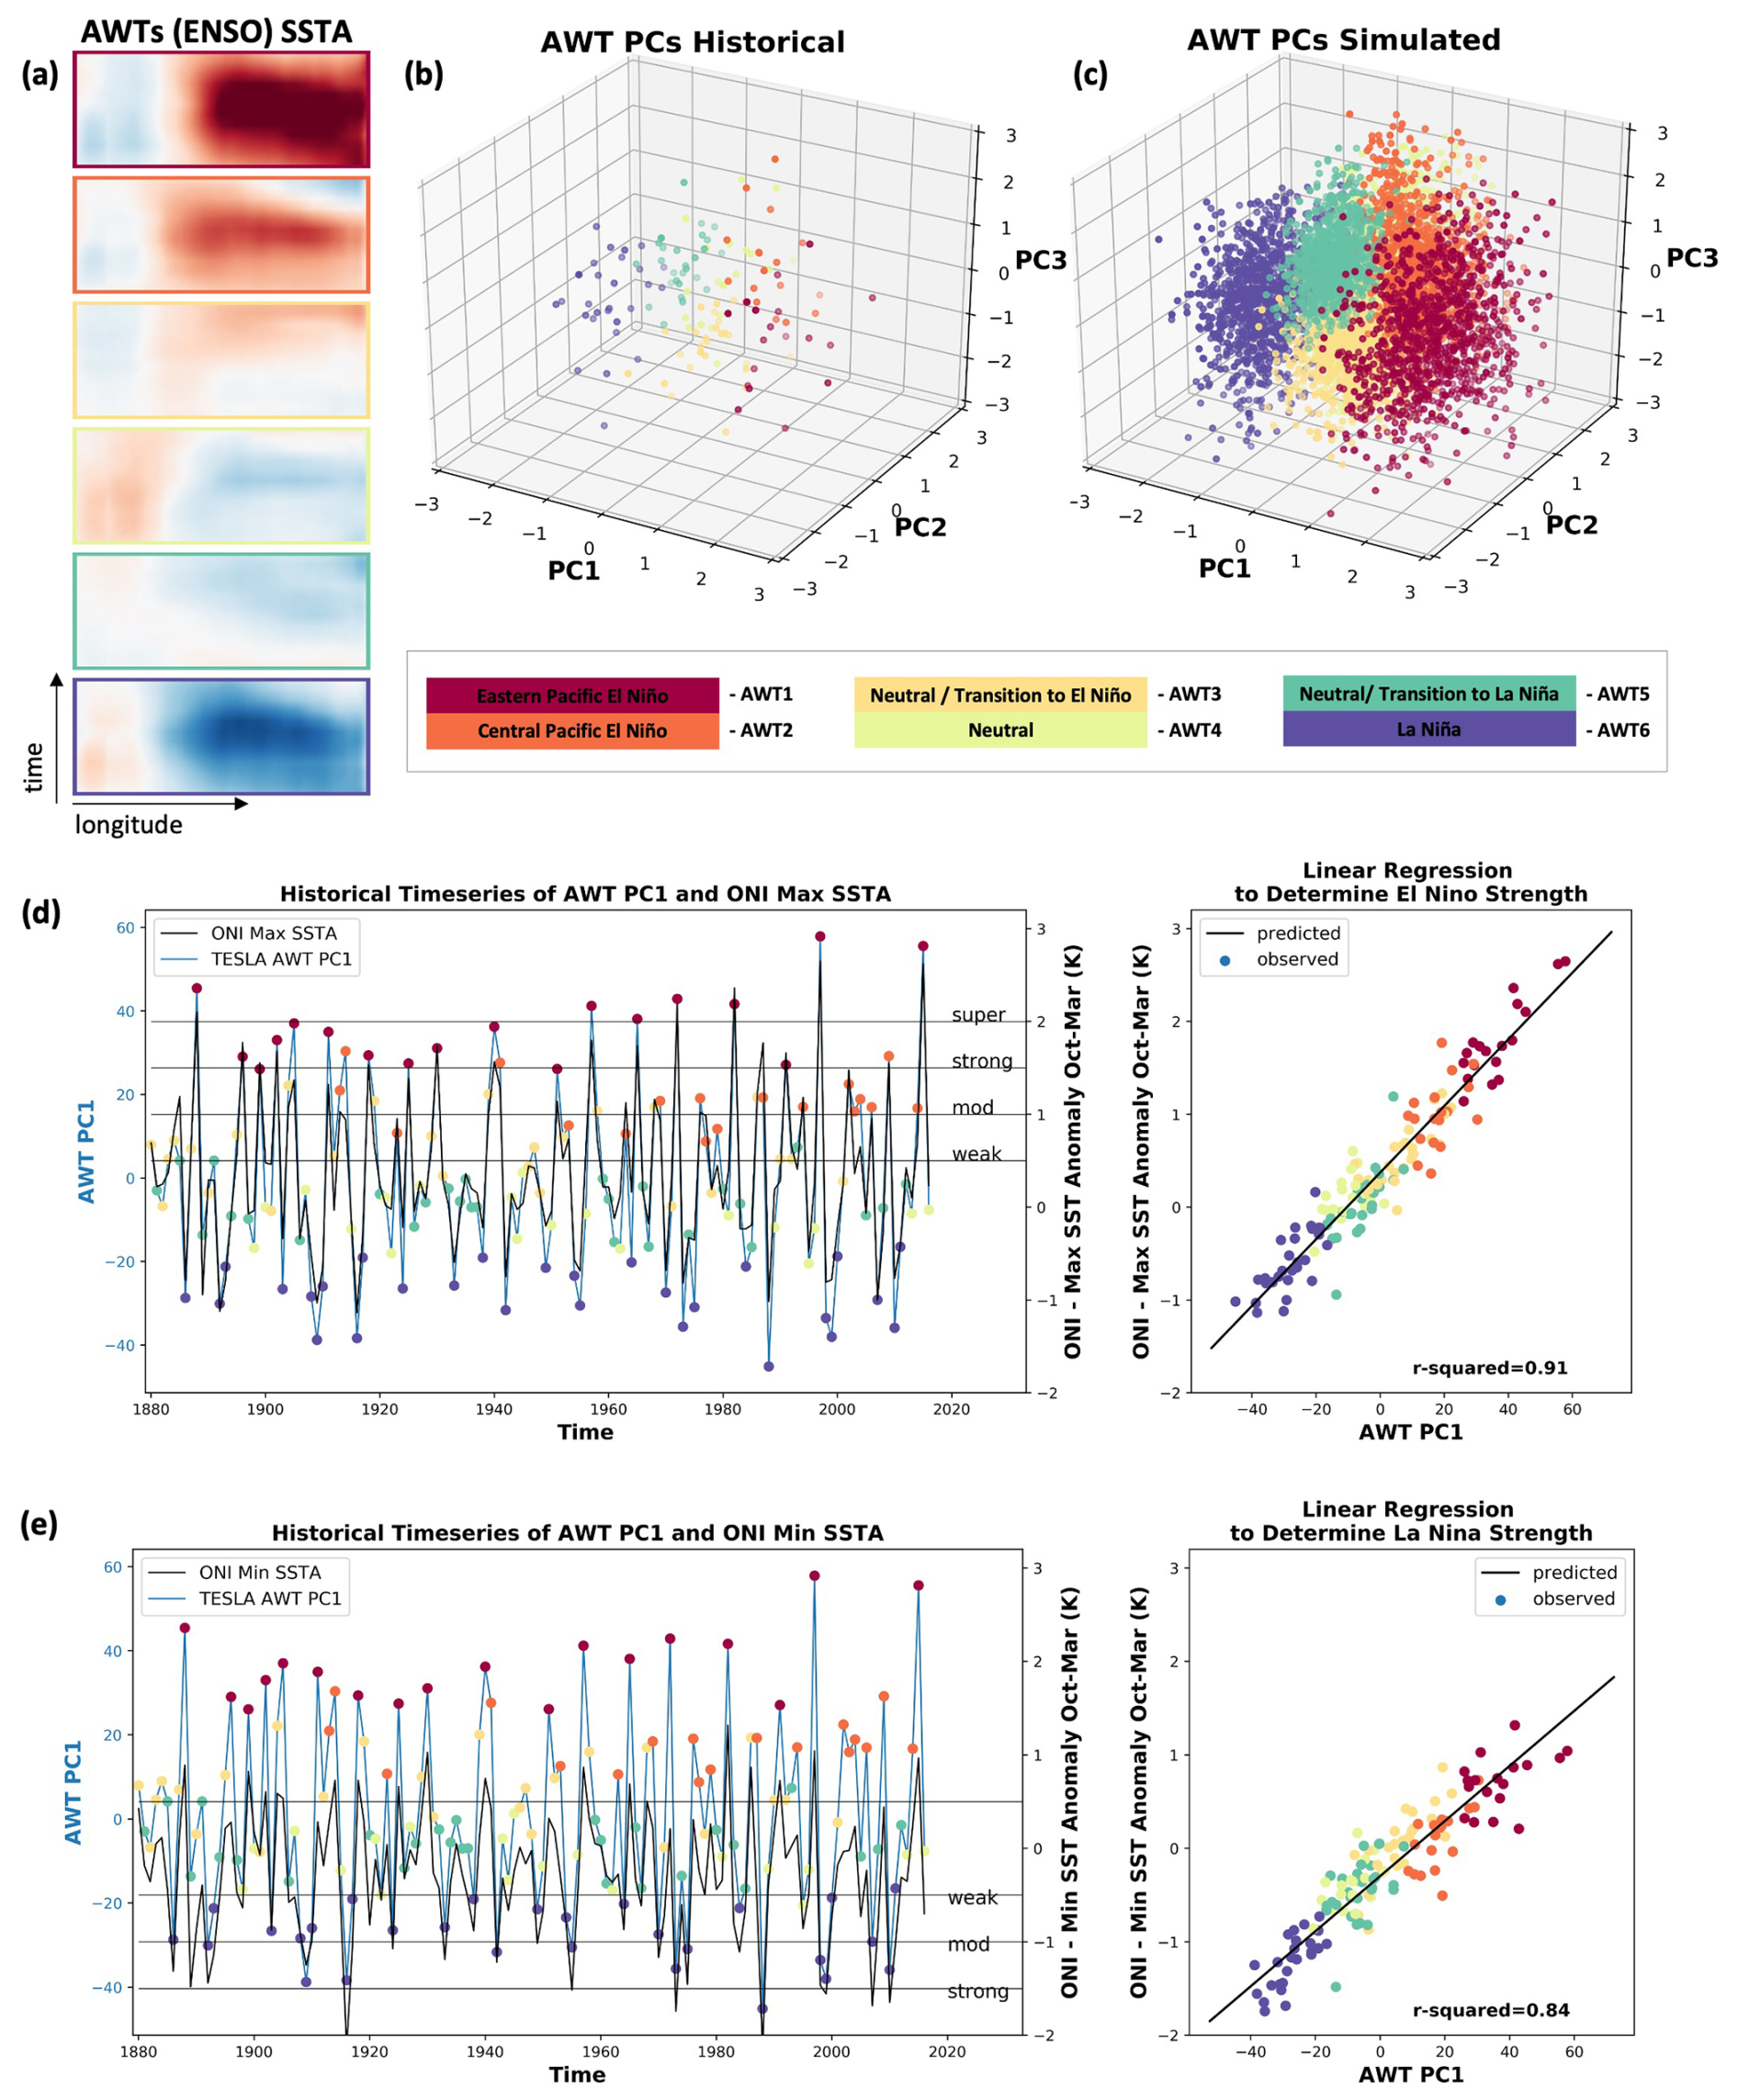
Figure 2Synthetic annual weather types (AWTs) in the stochastic climate emulator classified based on ENSO phase and strength. (a) Six AWTs are generated using k-means clustering of leading principal components (PCs) of sea-surface temperature anomaly Hovmöller plots. (b) AWT PCs from historical datasets compared to (c) simulated AWT PCs highlights the climate emulator’s ability to produce new weather types, dependent on the statistics of historical observations, but with the ability to extrapolate beyond observed events. (d, e) A linear regression between the leading AWT PC and historical ONI (maximums or minimums) enables classification of simulated AWTs by El Niño or La Niña strength.
El Niño strength is ascribed to AWT events using a linear regression (r2 = 0.91) between the leading AWT PC and maximum SSTA from a historical ensemble ONI dataset (Webb and Magi, 2022) averaged over a 3-month window from October to the following March (Fig. 2d). A similar regression was performed to determine La Niña strength, using minimum SSTAs during that same October–March period (r2 = 0.84; Fig. 2e). While there are several climate indices that can be used to define ENSO strength (e.g., Multivariate ENSO Index, Southern Oscillation Index, Niño 3.4), we chose to regress against ONI because it aligns closely with how the AWTs were developed: ONI is based solely on SSTAs at the equator, rather than incorporating other variables (like wind, sea-level pressure, or cloudiness) and it extracts SSTAs from the same bounding box (Niño 3.4) used to construct AWTs. We tested multivariate regressions using higher order AWT PC predictors; however, this did not improve the regression skill. Since this regression explains 84 %–91 % of ONI variance and the divisions between SSTAs defining the strength of ENSO events are somewhat arbitrary, there are some differences between historical classifications of ENSO strength and the classifications determined by this regression. For example, the 1982–1983 event is defined as “super strong” based on observed ONI SSTA but “strong” using the AWT PC regression. Results in this manuscript that assess ENSO strength use the AWT PC regressions for both the historical and simulated periods for consistency.
Daily Weather Types (DWTs) are generated with similar techniques to the AWTs. K-means clustering and PC analysis of SLP and SLP gradients (Saha et al., 2014) in the Pacific Basin produces thirty-six DWTs depicting regional synoptic weather patterns (Fig. 3a). SLP data was extracted from a domain representing the source of 99 % of wave energy that reaches the site of interest to prioritize classification of weather dynamics most relevant to the given study site (Leung et al., 2024a; Pérez et al., 2014). An Intraseasonal Weather Type (IWT) based on Madden Julien Oscillation patterns are clustered into eight longitudinal phases (Wheeler and Hendon, 2004) and convection strength (low, medium, and high) (Lafleur et al., 2015). The number of weather-type clusters (e.g., 6 AWTs and 36 DWTs) were chosen to balance the number of clusters needed to reproduce identified patterns in the literature while ensuring there were enough observations to populate reliable statistical distributions within each weather type (Anderson et al., 2019). For example, in the DWT clustering, a wave-guided regression was used to encourage clusters that considered both sea-level pressure patterns and wave characteristics. Further, each cluster had to contain a minimum number of observations (in this case, 60) to ensure there was both separation between distinct weather and wave conditions, and that each cluster had enough data to support reliable statistical analyses. Previous studies focused on testing and developing this weather typing methodology performed sensitivity testing to determine the appropriate number of k-clusters for AWT, IWT, and DWT formation (e.g., Camus et al., 2011, 2014; Anderson et al., 2019; Cagigal et al., 2020, 2021).
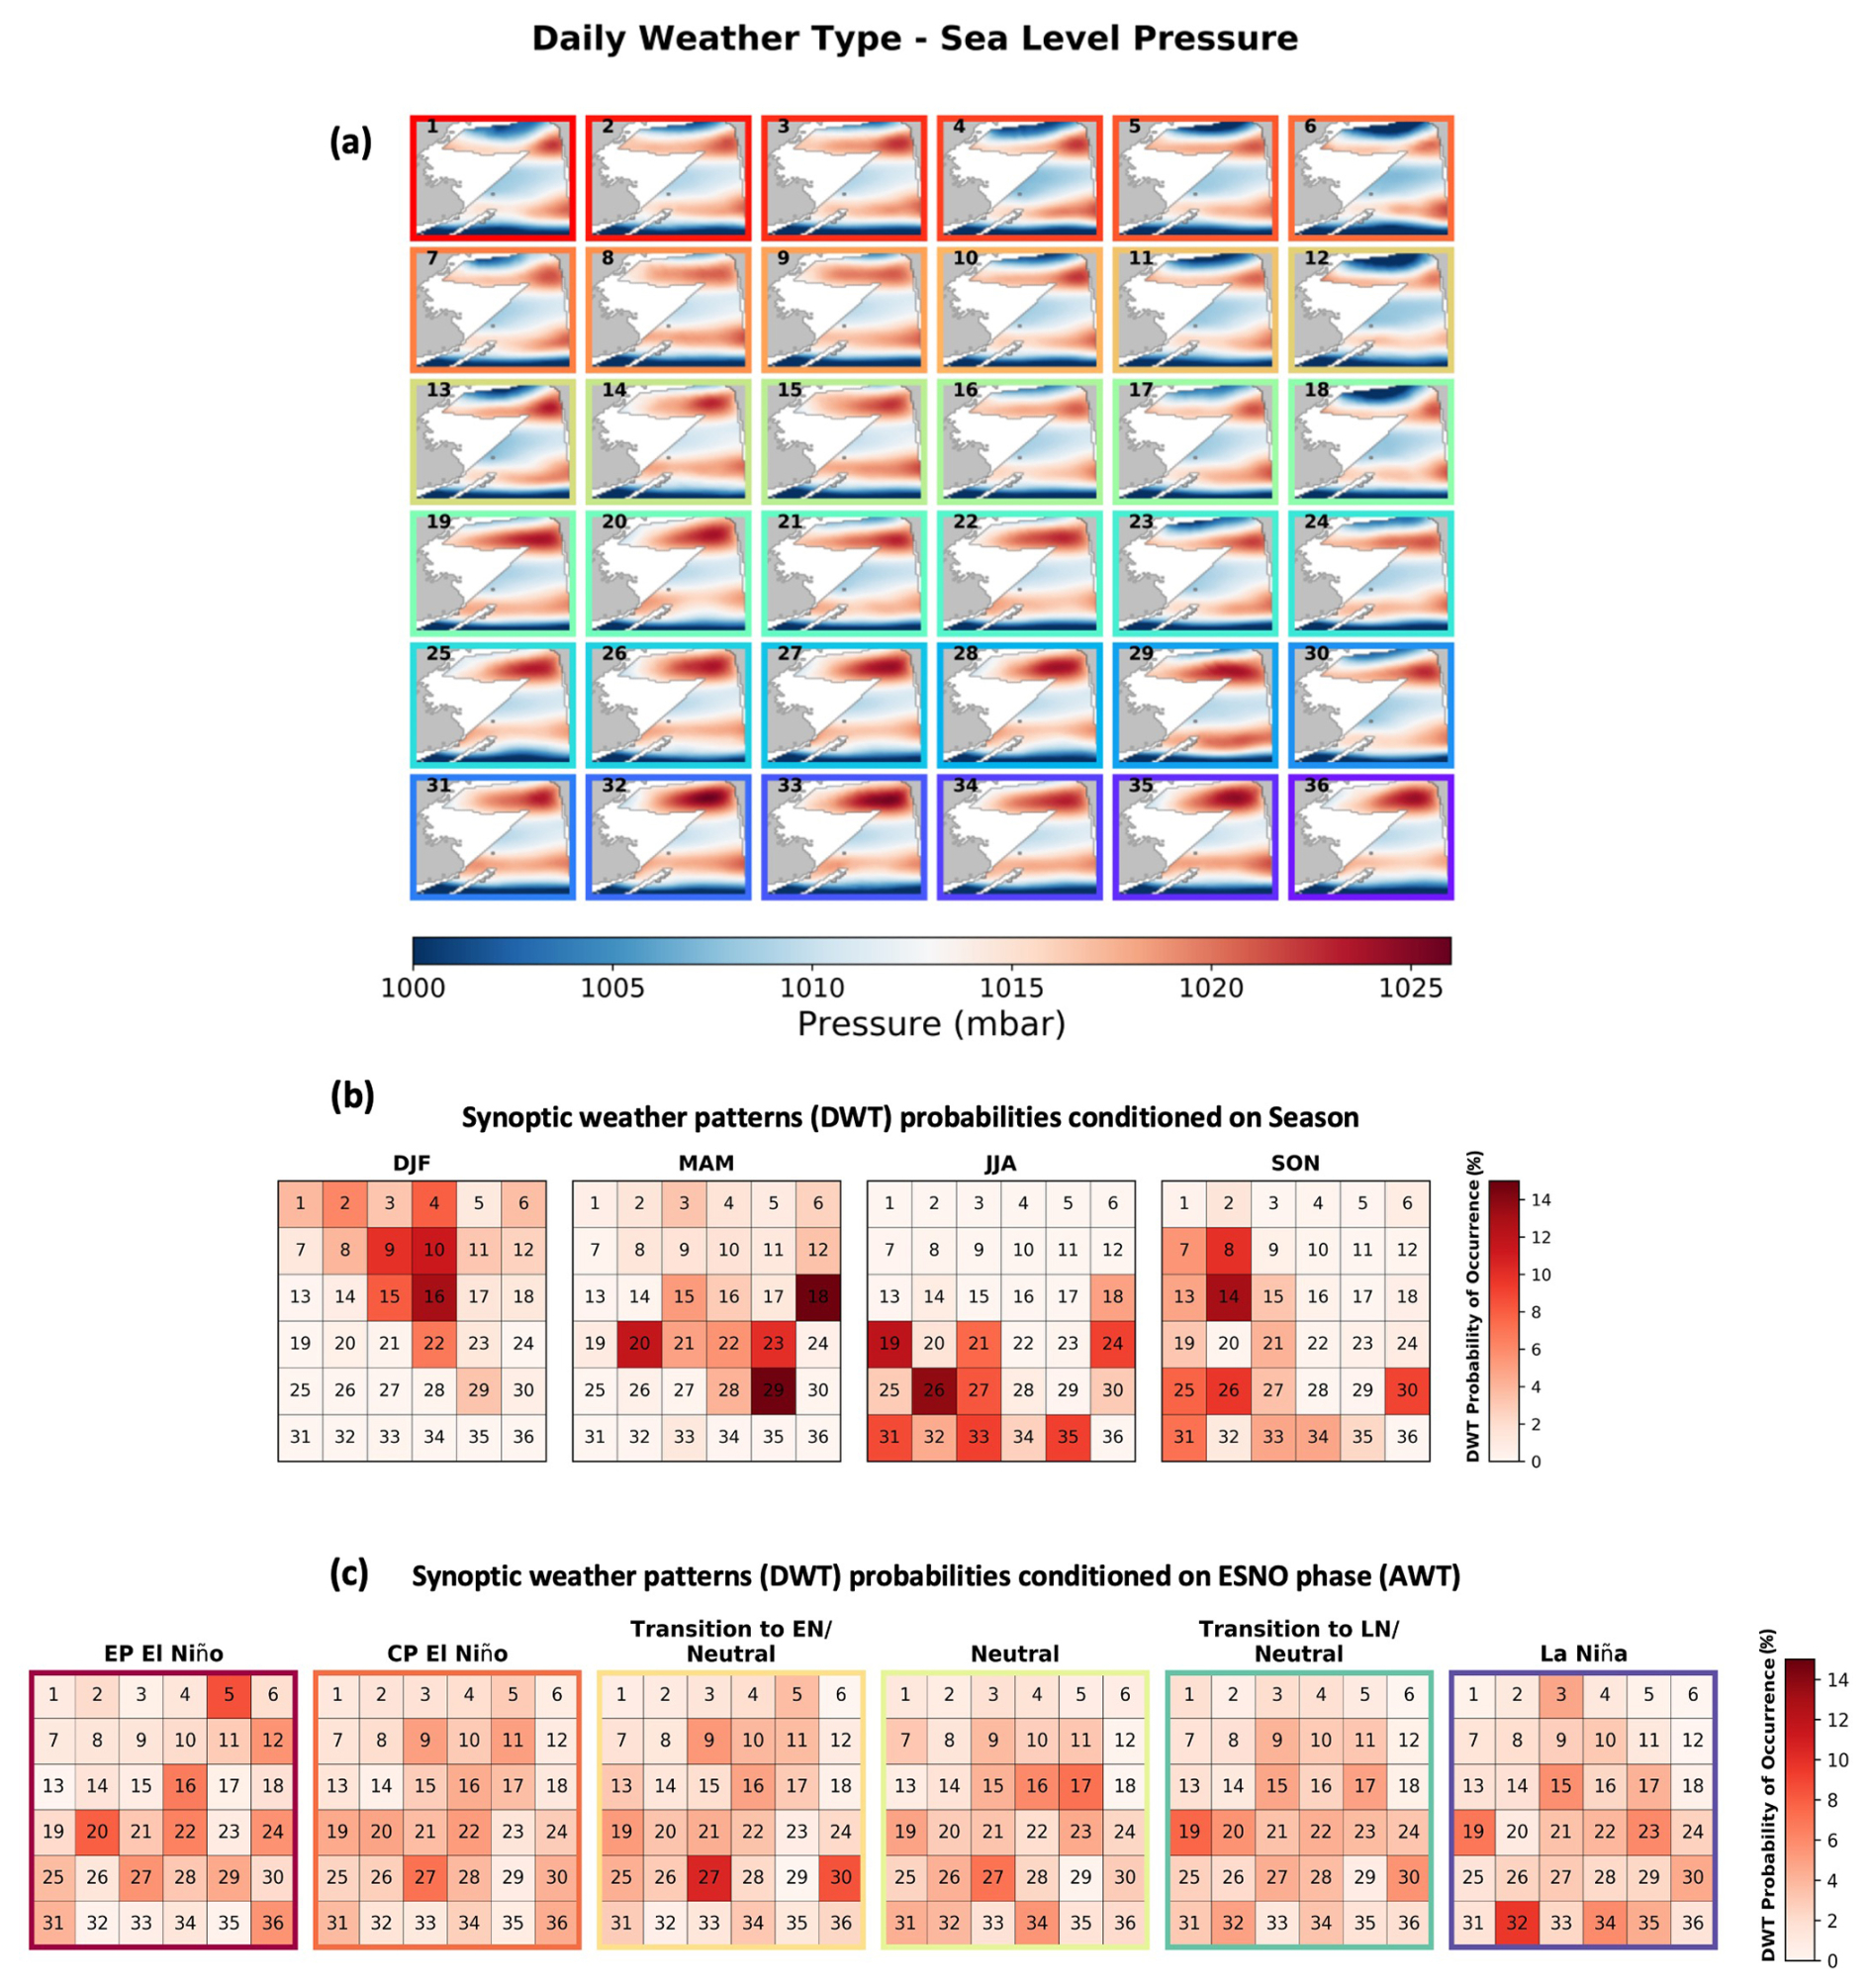
Figure 3Statistical relationships between climate and weather patterns in the climate emulator. (a) Synthetic daily weather types (DWTs) classified based on synoptic weather patterns derived from k-means clustered PCs of sea level pressure and sea level pressure gradients extracted from a domain representing where 99 % of wave energy that reaches the site of interest is generated. Probability of DWT occurrence based on seasonality (b) and ENSO phase (annual weather type; AWT, c).
New chronologies of the weather types (AWTs, IWTs, and DWTs) are generated via auto-logistic regression (ALR) models that can reproduce the occurrence, persistence, and transition probabilities of the weather types reflective of historical observations (Sect. S1.3) (Antolínez et al., 2016; Guanche et al., 2013). As such, the ALR framework can account for the AWTs, seasonality, and individual DWT transition likelihood and persistence in the simulation of synthetic timeseries. This enables the exploration of the role different AWTs (ENSO phases) and seasonality play in driving different DWTs (synoptic weather patterns), as seen in Fig. 3, where darker colors indicate higher probability of occurrence. The stormy DWTs (e.g., DWT 2 – featuring an Aleutian low-pressure system) are more likely to occur in winter (+5 %) than summer and are also more likely to occur during EP El Niño years (+1 %) compared to the average of all ENSO phases. However, stormy DWTs with the greatest hydrodynamic anomalies also have a chance of occurring during ENSO neutral to La Niña years (e.g., DWT 3 has a 5 % chance of occurring during La Niña), such that stochastic simulations still sample from stormy DWTs throughout all ENSO phases. While stormy DWTs may be slightly more common during El Niño years, extreme anomalies associated with these storms are not isolated to specific El Niño phases.
Using gaussian copulas and linear regression models, observed WTs (annual and daily) are statistically linked to historical reanalysis data (1979–2021) of wave characteristics, such as wave height, period, and direction (Durrant et al., 2019) and observations (1925–2021) of non-tidal residuals (storm surge and MMSL) from the Astoria, OR tide gauge (9439040) (NOAA Tides and Currents, 2023). The simulated wave and water-level variables are downscaled to an hourly timescale for each synthetic WT timeseries through a multistep process. First, consecutive days of the same DWTs are grouped together as we assume they represent the same synoptic weather system. Each synoptic weather event is assigned a hydrograph that represents the ramp up to and ramp down from the maximum potential total water level within that weather system and is designed to maintain physically realistic joint dependence of sea-state parameters. Synthetic wave hydrographs are generated based on random sampling of parameterized historical hydrographs during the specified DWT sea state using gaussian copulas (Anderson et al., 2019). Employing gaussian copulas maintains the historical dependence structures between sea-state parameters and weather types while allowing for extrapolation from historical observations (Sect. S1.2; Cagigal et al., 2020). While wave height evolves hourly, based on hydrograph ramp up and down, other variables (Tp, Dir, and SS) remain static for the duration of the hydrograph (three-day maximum) for simplicity. A simple bias correction is applied to simulated wave heights after validation of each variable within the copulas revealed simulated wave heights to be consistently lower than observations (Leung et al., 2024a). MMSL and astronomical tides are the only predictands not simulated through the hydrographs. Instead, MMSL was simulated using a linear regression with covariates derived from the weather types (Leung et al., 2024a; Mukhopadhyay et al., 2023). Astronomical tide is simulated through harmonic analysis using the UTide python package (Codiga, 2011).
This stochastic emulator approach enables probabilistic hydrodynamic and coastal hazard teleconnection analyses to be conditioned on ENSO phase and intensity, and seasonal weather patterns.
2.2 Coastal Hazard Impact Analysis
The way the hydrodynamic teleconnections of ENSO translate to hazard impacts on the coast can be quantified in several ways, for example, rates of shoreline change (Vos et al., 2023), property damage (Allan and Komar, 2002), and economic costs (Barnard et al., 2015), etc. Here, we use simple proxies for coastal hazards based on an established storm-impact framework (Leung et al., 2024a; Leaman et al., 2021; Sallenger, 2000) that compares the elevation of water levels on the coast to the elevation of geomorphic features to determine whether hazardous conditions are likely to occur. This approach does not attempt to determine the extent or severity of the hazard, rather simply if thresholds for hazard occurrence are exceeded. It further focuses on cross-shore directed hazards and does not assess longshore sediment transport, gradients of which are needed for shoreline rotation assessments. As such, it's very useful for exploratory assessments of hazard exposure. This is particularly true for probabilistic assessments, such as this one, for which more complex hazard modeling approaches (e.g., dynamical flood modeling, nearshore sediment transport modeling) may be computationally prohibitive.
Following the simulation of probabilistic hydrodynamic wave and water-level drivers, empirical wave runup formulas (e.g., Stockdon et al., 2006) were used to calculate the TWL, or maximum elevation that water reaches on the shoreline. On dune-backed beach types, the Stockdon et al. (2006) formula was used, while on cliff or riprap backed beach types, a modified TAW (Technical Advisory Committee for Water Retaining Structures) barrier runup method was applied when TWL elevation exceeded the barrier toe (Pullen et al., 2007; van der Meer, 2002) in line with other impact assessments in the region (Allan et al., 2015; Leung, et al., 2024b).
TWLs are then used to estimate coastal hazard exposure using simple elevation-based proxies (Leaman et al., 2021; Sallenger, 2000). Here, we assessed proxies for unsafe beach, erosion, and flooding exposure for four morphologies, reflecting typical sandy beaches on the PNW outer coast (Wright and Short, 1984). This approach enables simple threshold analysis of probabilistic hazard exposure (were hazards likely or not?). These proxies state that unsafe beach conditions are met when the total water level (TWL) is high enough that the beach width is less than 10 m (this threshold width is designed to be flexible based on the unique geomorphic setting or community needs), erosion conditions are met when the TWL exceeds the backshore feature (e.g., dune or cliff) toe but not the crest, and flooding conditions are met when the TWL exceeds the backshore feature crest (Leung et al., 2024a; Sallenger, 2000).
The representative PNW morphologies were selected based on the 2016 U.S. West Coast lidar-extracted, 100 m resolution, beach morphology dataset (National Oceanic and Atmospheric Administration, 2017; Shope et al., 2021). We developed four representative morphologies for the PNW based on quantiles of beach slope, dune-toe elevation, and dune-crest elevation for the most common beach types from Northern California to Northern Washington (∼ 9000 transects). The representative morphologies included: a dissipative (gently sloping) beach backed by a tall dune or low cliff, an intermediate to reflective (steeply sloping) beach backed by a tall dune/low cliff, an intermediate to reflective beach backed by a riprap revetment (the most common erosion control measure in the region), and a low-lying dissipative beach representing a barrier spit or break in the dune line caused by natural phenomena (e.g., random low-lying morphology) or human intervention (e.g., a beach access road, dune restoration project). The dune toes and crests of the high dune-backed beaches fall within the 45th–65th percentile for the given beach types. The low-lying dune system is relatively rare in the PNW, as 6 m high dunes are shorter than 92 % of dune crests for dissipative beaches in the region. While rare, this morphology type was chosen to highlight the most vulnerable beach type in the region.
To isolate the influence of individual ENSO events on hazard impacts, we calculated the percentage of time TWLs spent in each hazard proxy regime (Leung et al., 2024a). We calculated this percent impact for winter months (December, January, February) as ENSO impacts are most apparent during these periods. A similar approach was taken to assess the influence of synoptic weather (DWT) on coastal hazards, however the percent impact was averaged annually, rather than during just winter, as each DWT can occur several times throughout the year, and some DWTs rarely to never occur during winter months.
3.1 Role of ENSO and synoptic weather in driving hydrodynamic variability
The stochastic emulator approach enables probabilistic (10 000 synthetic years of hourly) hydrodynamic and coastal hazard teleconnection analyses to be conditioned on ENSO phase and intensity, and seasonal weather patterns. Simulations reproduce the statistics (timing, frequency, and magnitude) of observed climate and weather patterns, historical tide-gauges, and wave reanalysis datasets, but can extrapolate beyond extremes observed in the historical record. This can be seen in comparisons of the observed and simulated probability density functions (pdfs) of the hydrodynamic variables, in which the simulated data largely recreates the historical distributions but smooths the pdfs and extends the tails of the distributions (Fig. 4a). These pdfs highlight the climate emulator's ability to recreate both chronic and extreme conditions, while allowing for simulation of previously unseen events. Conditioning the observed and simulated data on ENSO phase, El Niño strength, and synoptic weather patterns reveals which climate and weather phenomena are the dominant drivers of hydrodynamic variability (Fig. 4b–d). The distributions of the observed versus simulated data are not identical, particularly when conditioned on ENSO, as there may be very few years of each ENSO event in the historical record (e.g., two years of super-strong El Niños), compared to thousands in the simulated distribution. ENSO phase and strength have a large influence on MMSL, with El Niño phases and stronger El Niño years elevating this variable on the order of 10–20 cm in both the observed and simulated data. EP El Niños (red, Fig. 4b), which tend to be stronger than CP El Niños (orange, Fig. 4b), therefore tend to have greater MMSL. In both the observed and simulated data, ENSO phase and intensity have little influence on wave height, period, and direction when exploring conditions over the course of the entire year, with small shifts in the medians and quartiles of the distributions across ENSO phase and strength. There are small differences in the tails (extremes) of the distributions, indicating hydrodynamic distinctions between ENSO phases and intensities may be more apparent in outlier events (storms) rather than during everyday conditions.
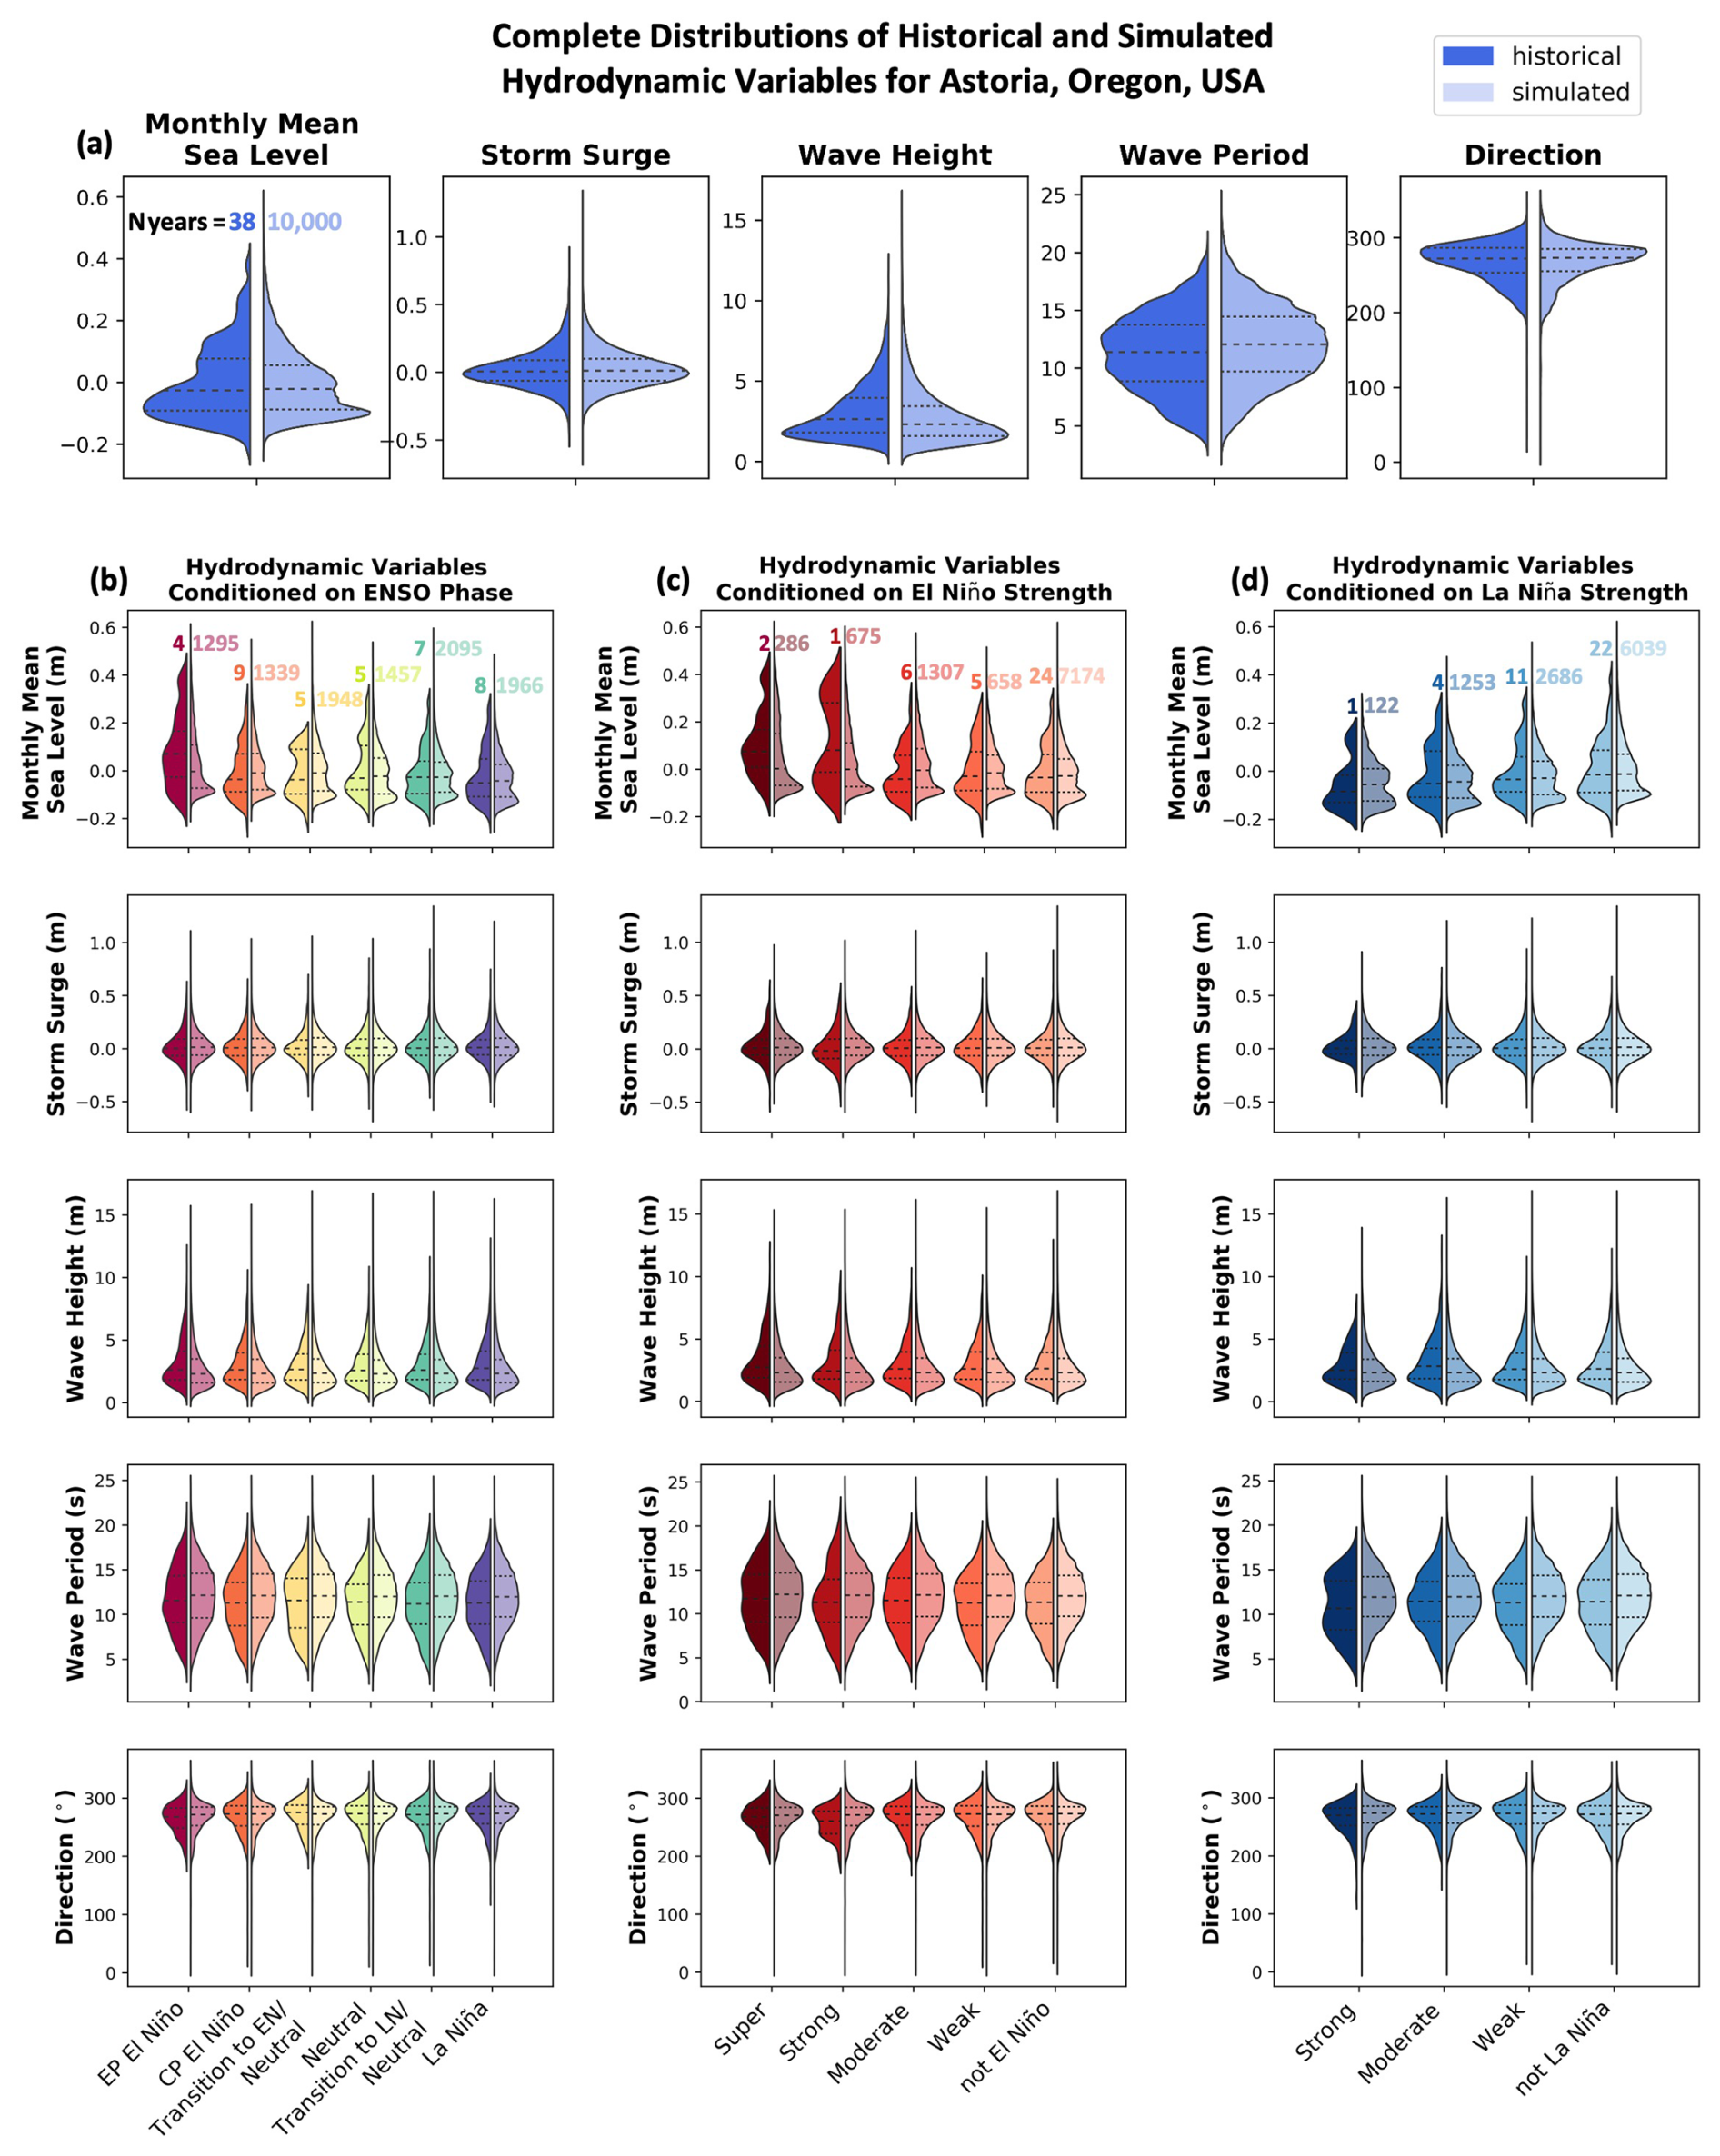
Figure 4Split violin plots comparing the historical (left, darker colors) and simulated (right, lighter colors) probability distribution functions (pdfs) of the hydrodynamic outputs of the stochastic climate emulator. Comparisons are shown for (a) the entire historical (38 years) and simulated (10 000 years) periods and (b) conditioned on ENSO phase (Annual Weather Type; AWT), (c) El Niño intensity, (d) La Niña intensity. Dashed lines show the 0.25, 0.5, and 0.75 quantiles of each distribution, and numbers bordering distributions reflect the number of years of data included in each distribution (though data is in hourly or monthly resolution). Note, since ENSO phase does not align to calendar year, the simulated distributions conditioned on ENSO contain 100 partial years (the N years sums to 10 100).
To better compare against the historic analyses of ENSO-PNW hazard teleconnections from previous studies (Allan and Komar, 2002; Barnard et al., 2011, 2015, 2017; Vos et al., 2023), we isolated the average winter anomalies of wave direction, wave energy flux, and non-tidal residual water level (storm surge + MMSL) (Fig. 5). Average winter anomalies were calculated by subtracting the mean of the hydrodynamic variable in winter months over the entire timeseries (e.g., December, January, February 1979–2021), from the mean of the hydrodynamic variable taken over a single winter (e.g., December, January and February 2020–2021). Through this isolation, the influence of ENSO phase and intensity becomes much clearer. Trends of simulated distributions again generally align with historical observations, however, due to limited historical occurrences of different ENSO types, there are also differences. For example, based on historical EP El Niño years (1982–1983, 1991–1992, 1997–1998, and 2015–2016 events), the median winter wave energy flux is calculated to be 56 % higher than the average of all winters. However, simulations including > 1000 EP El Niño years find that the median winter wave energy flux anomaly is closer to +12 %. Likewise, based on the simulated data, median winter wave energy flux anomalies during CP years are barely higher than (less than 1 %) average winters and La Niña years are 5 % lower, while the observed data places winter wave energy flux anomalies during CP years as 4 % lower and 9 % lower during La Niña years. Median winter water-level anomalies are simulated to be +11 cm higher during EP El Niño years, +3 cm higher during CP El Niño, and −5 cm during La Niña. Observational medians of winter water-level anomalies are +15, +3, and −2 cm for those same ENSO phases. Wave direction anomalies are presented as 0° representing west (approximately shore-normal), 90° representing north, and −90° representing south. Simulated median winter wave direction is −3° (more southerly) during EP years, −1° during CP years, and +2° during La Niña years. Observations place median winter wave direction anomalies at −6° during EP and CP years, and +4° in La Niña years.
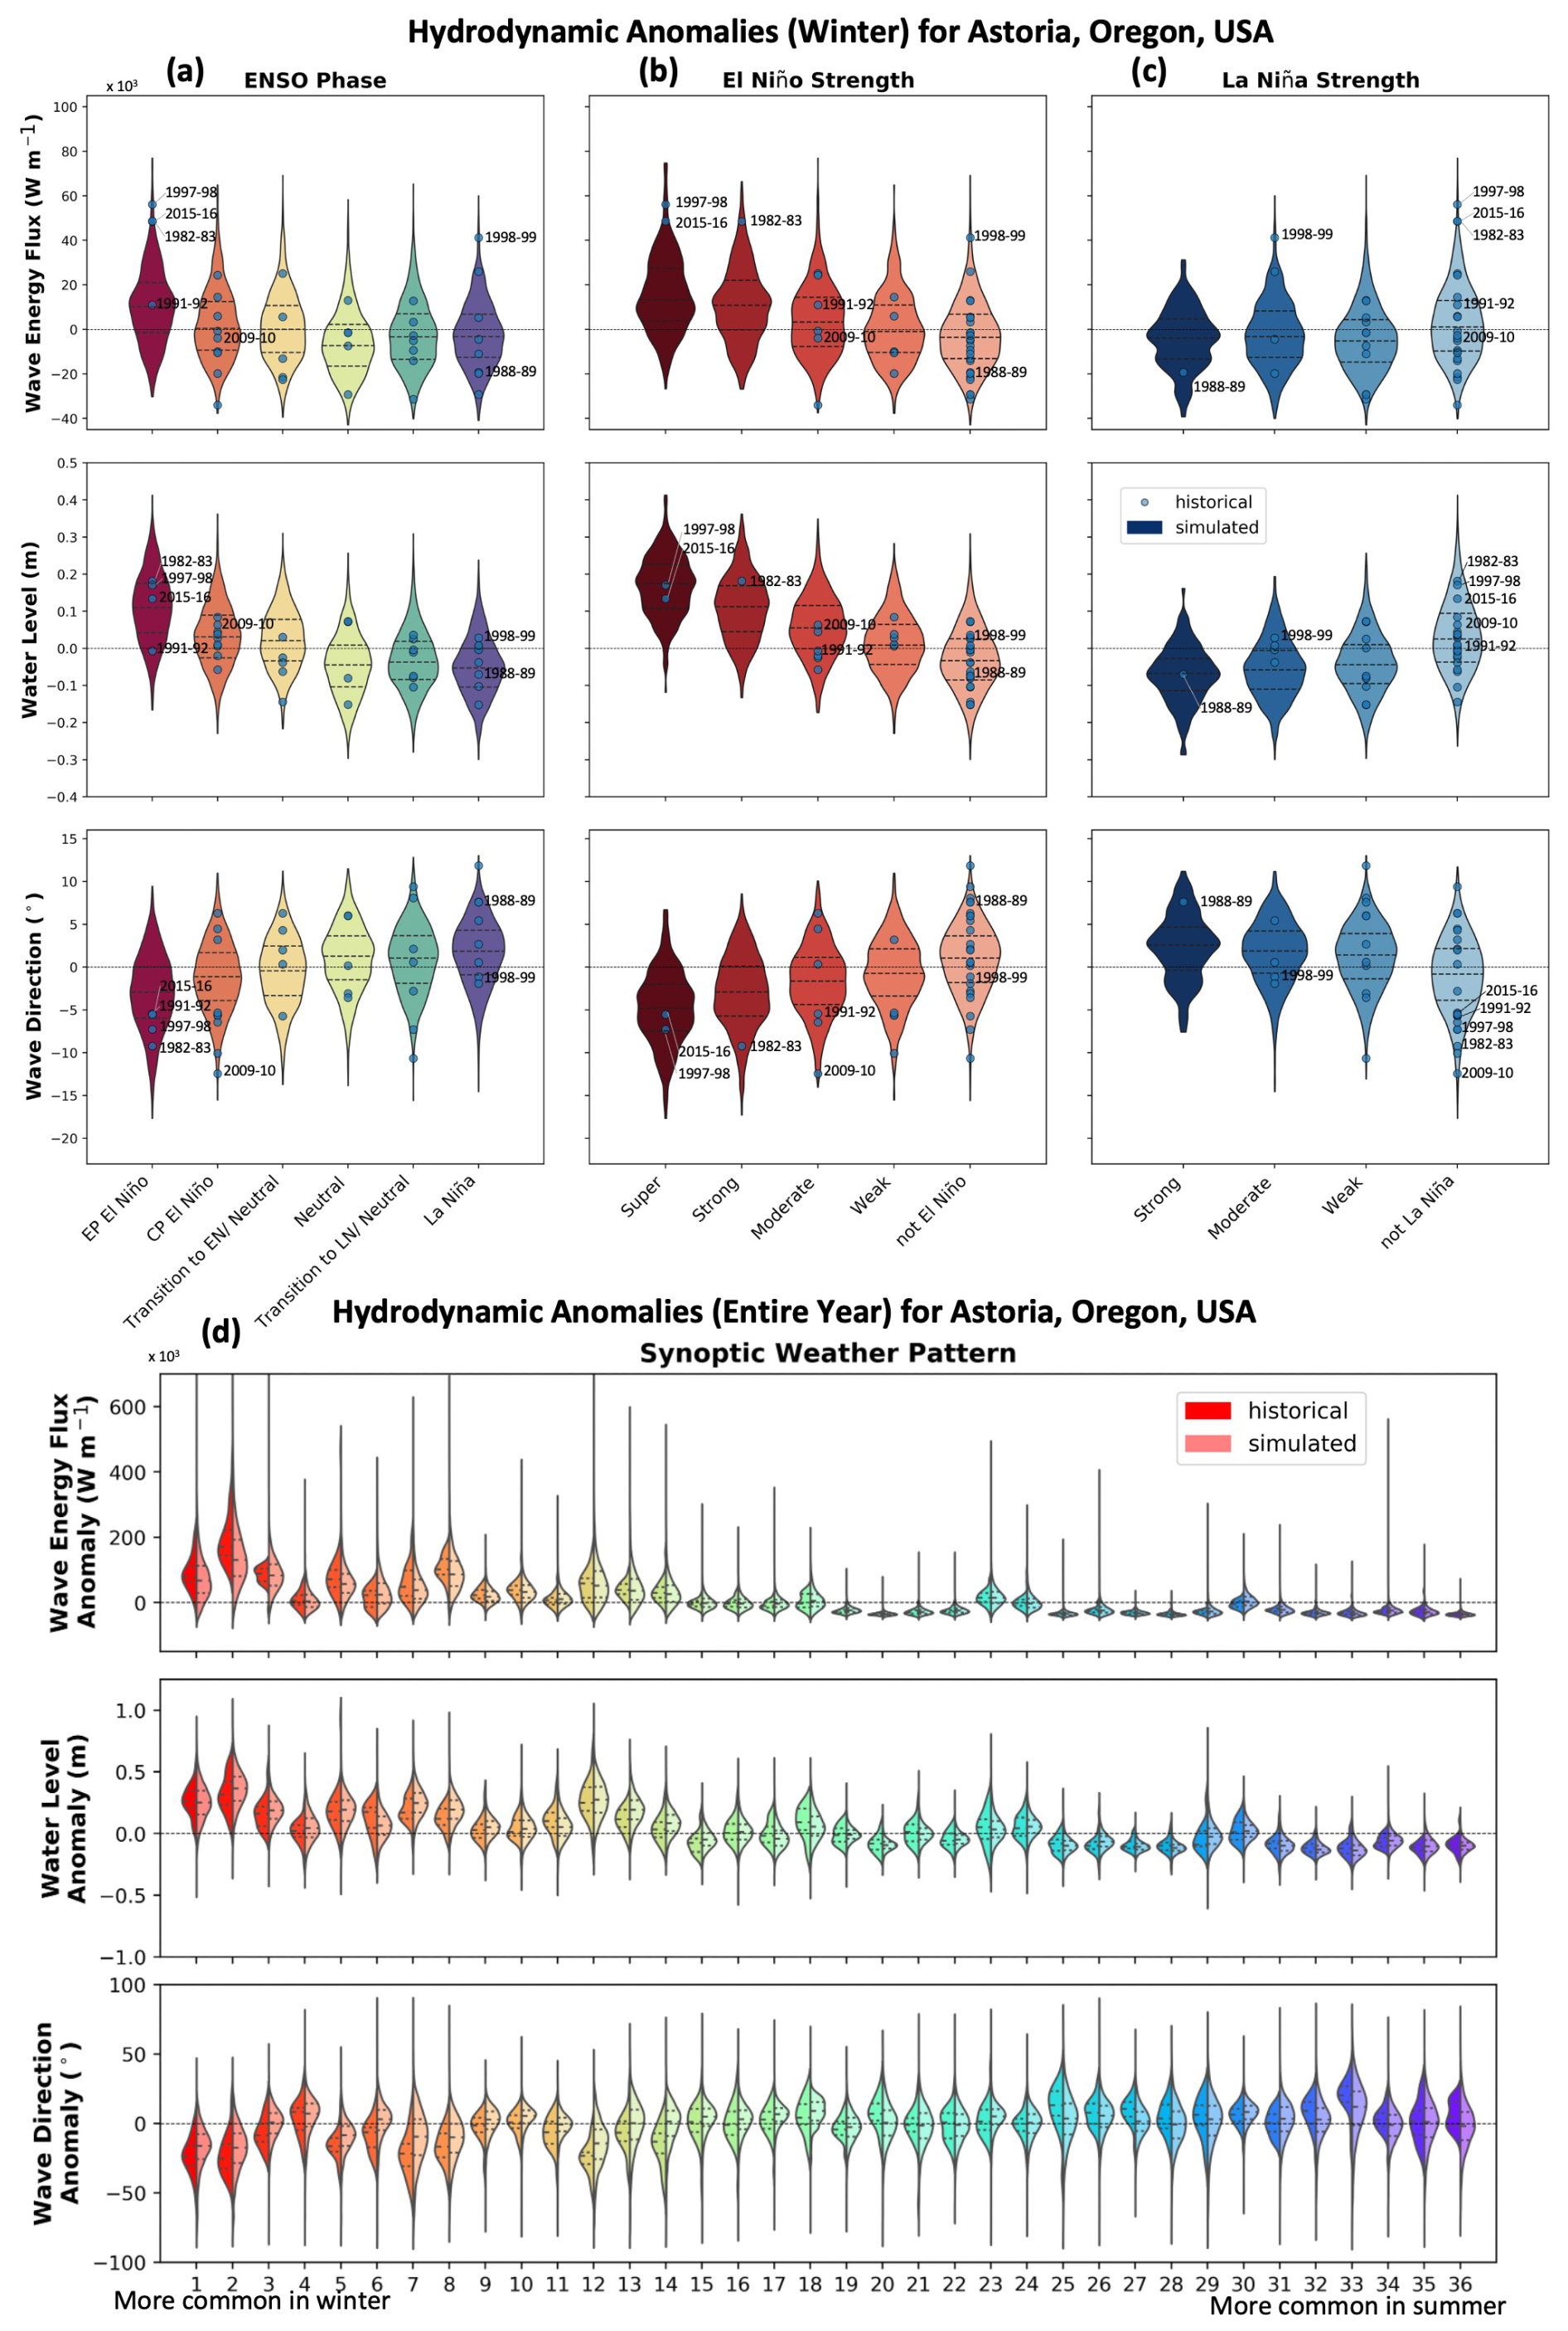
Figure 5Anomalies of wave energy flux (function of period and height), water level (storm surge + MMSL), and wave direction. (a–c) Mean winter (DJF) anomalies are shown as a violin plot for the simulated data and scatter points for the historical data conditioned on (a) ENSO phase (Annual Weather Type; AWT), (b) El Niño intensity, (c) La Niña intensity. Observations from notable historical El Niño and La Niña years are labeled. (d) Mean anomalies (averaged over the entire dataset not just winter months) conditioned on synoptic weather patterns (Daily Weather Type; DWT), with the historical (left, saturated) and simulated (right, desaturated) probability distribution functions (pdfs) shown as split violins. Dashed lines show the 0.25, 0.5, and 0.75 quantiles of the simulated distribution. The horizontal line at zero helps to distinguish between positive and negative anomalies.
The distinctions between simulated distributions and historical observations conform with existing knowledge on the influence of ENSO diversity in causing varied coastal impacts in the PNW. Individual ENSO events can drive widely ranging wave energy, water level, and direction anomalies based on complex ENSO dynamics. There is some spatial variability associated with ENSO impacts on winter hydrodynamic variables in the PNW, particularly when examining the hydrodynamics of individual ENSO events, however similar trends are found across the region (Northern Washington to Northern California; Sect. S2). Overall, the observations and the stochastic simulations indicate that both EP and CP El Niños tend to bring high water-level anomalies. EP El Niños also bring anomalously high wave energy flux, but the wave energy associated with CP El Niños is only sometimes higher than typical winters. While individual ENSO events can generate extreme winter wave and water-level anomalies, particularly during EP El Niño events, the probabilistic distributions of these ENSO phases indicate that the effect of EP El Niño on these hydrodynamic variables is less dramatic than the four EP El Niños in the 45-year historical record would suggest. While the four historical EP events examined here show higher wave energy than typical winters, the simulated distribution indicates that EP El Niños could also exhibit negative winter wave energy anomalies. In fact, randomly sampling four EP El Niño events from the simulated distribution would produce positive winter wave energy anomalies for all four events with 25 % probability. This indicates that while the observed positive anomaly events are not rare, alternate realities where the roll of the dice (inherent stochasticity of the system) led to more EP El Niños with small or negative wave energy anomalies being sampled (like the 2023–2024 event) would have dramatically altered our understanding of historical El Niño teleconnections.
Conditioning the hydrodynamic drivers of coastal hazards on synoptic weather patterns (DWT), rather than ENSO (AWT) phase and intensity, reveals the influence of smaller scale (spatial and temporal) processes on hazard teleconnections in the PNW region. Figure 5d shows the wave and water-level anomalies associated with each DWT. Here, the anomalies, rather than being compared to average winters, are compared to the average for the entire dataset because some of the DWTs rarely (or never) occur during winter. There are small differences in the observed and simulated anomalies across the DWTs, which can be attributed to a few factors. First, by looking at the anomalies across the DWTs, we are comparing smaller subsets of observations to the simulated data (in the case of DWT 6, a pattern with a lower probability of occurrence, we are comparing ∼ 1500 h observed data to ∼ 580 000 h of simulated data). Additionally, the observed and simulated wave characteristics differ due to the parameterized storm hydrographs, which simulate the hourly evolution of wave height, but keep wave period and direction static throughout a given storm. Despite these relatively minor differences, the distributions for the historical and simulated timeseries align well. Of note, is how great the anomalies are within synoptic weather types and how much the distributions vary across them. For example, the median simulated wave energy flux anomaly is 130 %–253 % higher than typical in stormy DWTs (lower numbers, like 1 and 2). In DWTs associated with calmer weather (higher numbers, like DWT 35 and 36), wave energy flux anomaly is 56 %–71 % lower than typical. Similarly, DWTs 1 and 2 have a median water-level anomaly of 25–37 cm, while DWTs 35 and 36 have a −10 cm anomaly. Waves in DWTs 1 and 2 also tend to approach from a more southerly direction (median anomaly −16 to −17°) compared to the northerly to neutral approaches of DWTs 35 and 36 (+1 to −2°). The teleconnections between synoptic weather patterns and coastal hydrodynamics are much greater (as seen by the extents of the y-axis) and more distinct (as seen by the shifting distributions) than those associated with ENSO.
3.2 Role of ENSO and synoptic weather in driving erosion hazards
From the simulated hydrodynamic drivers, we calculated hourly TWLs to enable simple, elevation-based proxy analysis exploring unsafe beach, erosion, and flooding hazards. We tested these proxies on four morphologies representative of typical sandy beaches for the PNW (Wright and Short, 1984): a gently sloping (0.04) beach backed by a tall dune or low cliff, a steeply sloping (0.07) beach backed by a tall dune/ low cliff, a steeply sloping beach backed by a riprap revetment, and a low-lying dissipative beach representing a barrier spit or break in the dune line. For each representative morphology, we calculated the percentage of time that the TWL exceeds the hazard proxy thresholds (percent impact). The percent impact for each winter for the entire historical and simulated distributions is shown in Fig. 6a. The four beaches spend a median of 23 %–78 % of winters exceeding the unsafe beach proxy and 8 %–30 % of winters exceeding the erosion proxy, with the range of percent impact depending on the morphologic setting. The flooding hazard proxy remains at zero for the beaches backed by tall dunes or cliffs under both simulations and historical timeseries, while the riprap-backed beach and low-lying beach experience flooding a maximum 3 %–6 % of the time in all simulated years. This finding reflects the fact that flooding is relatively uncommon in the PNW region, occurring only on rare transects that have low lying features (Leung et al., 2024a; Ruggiero et al., 2013).
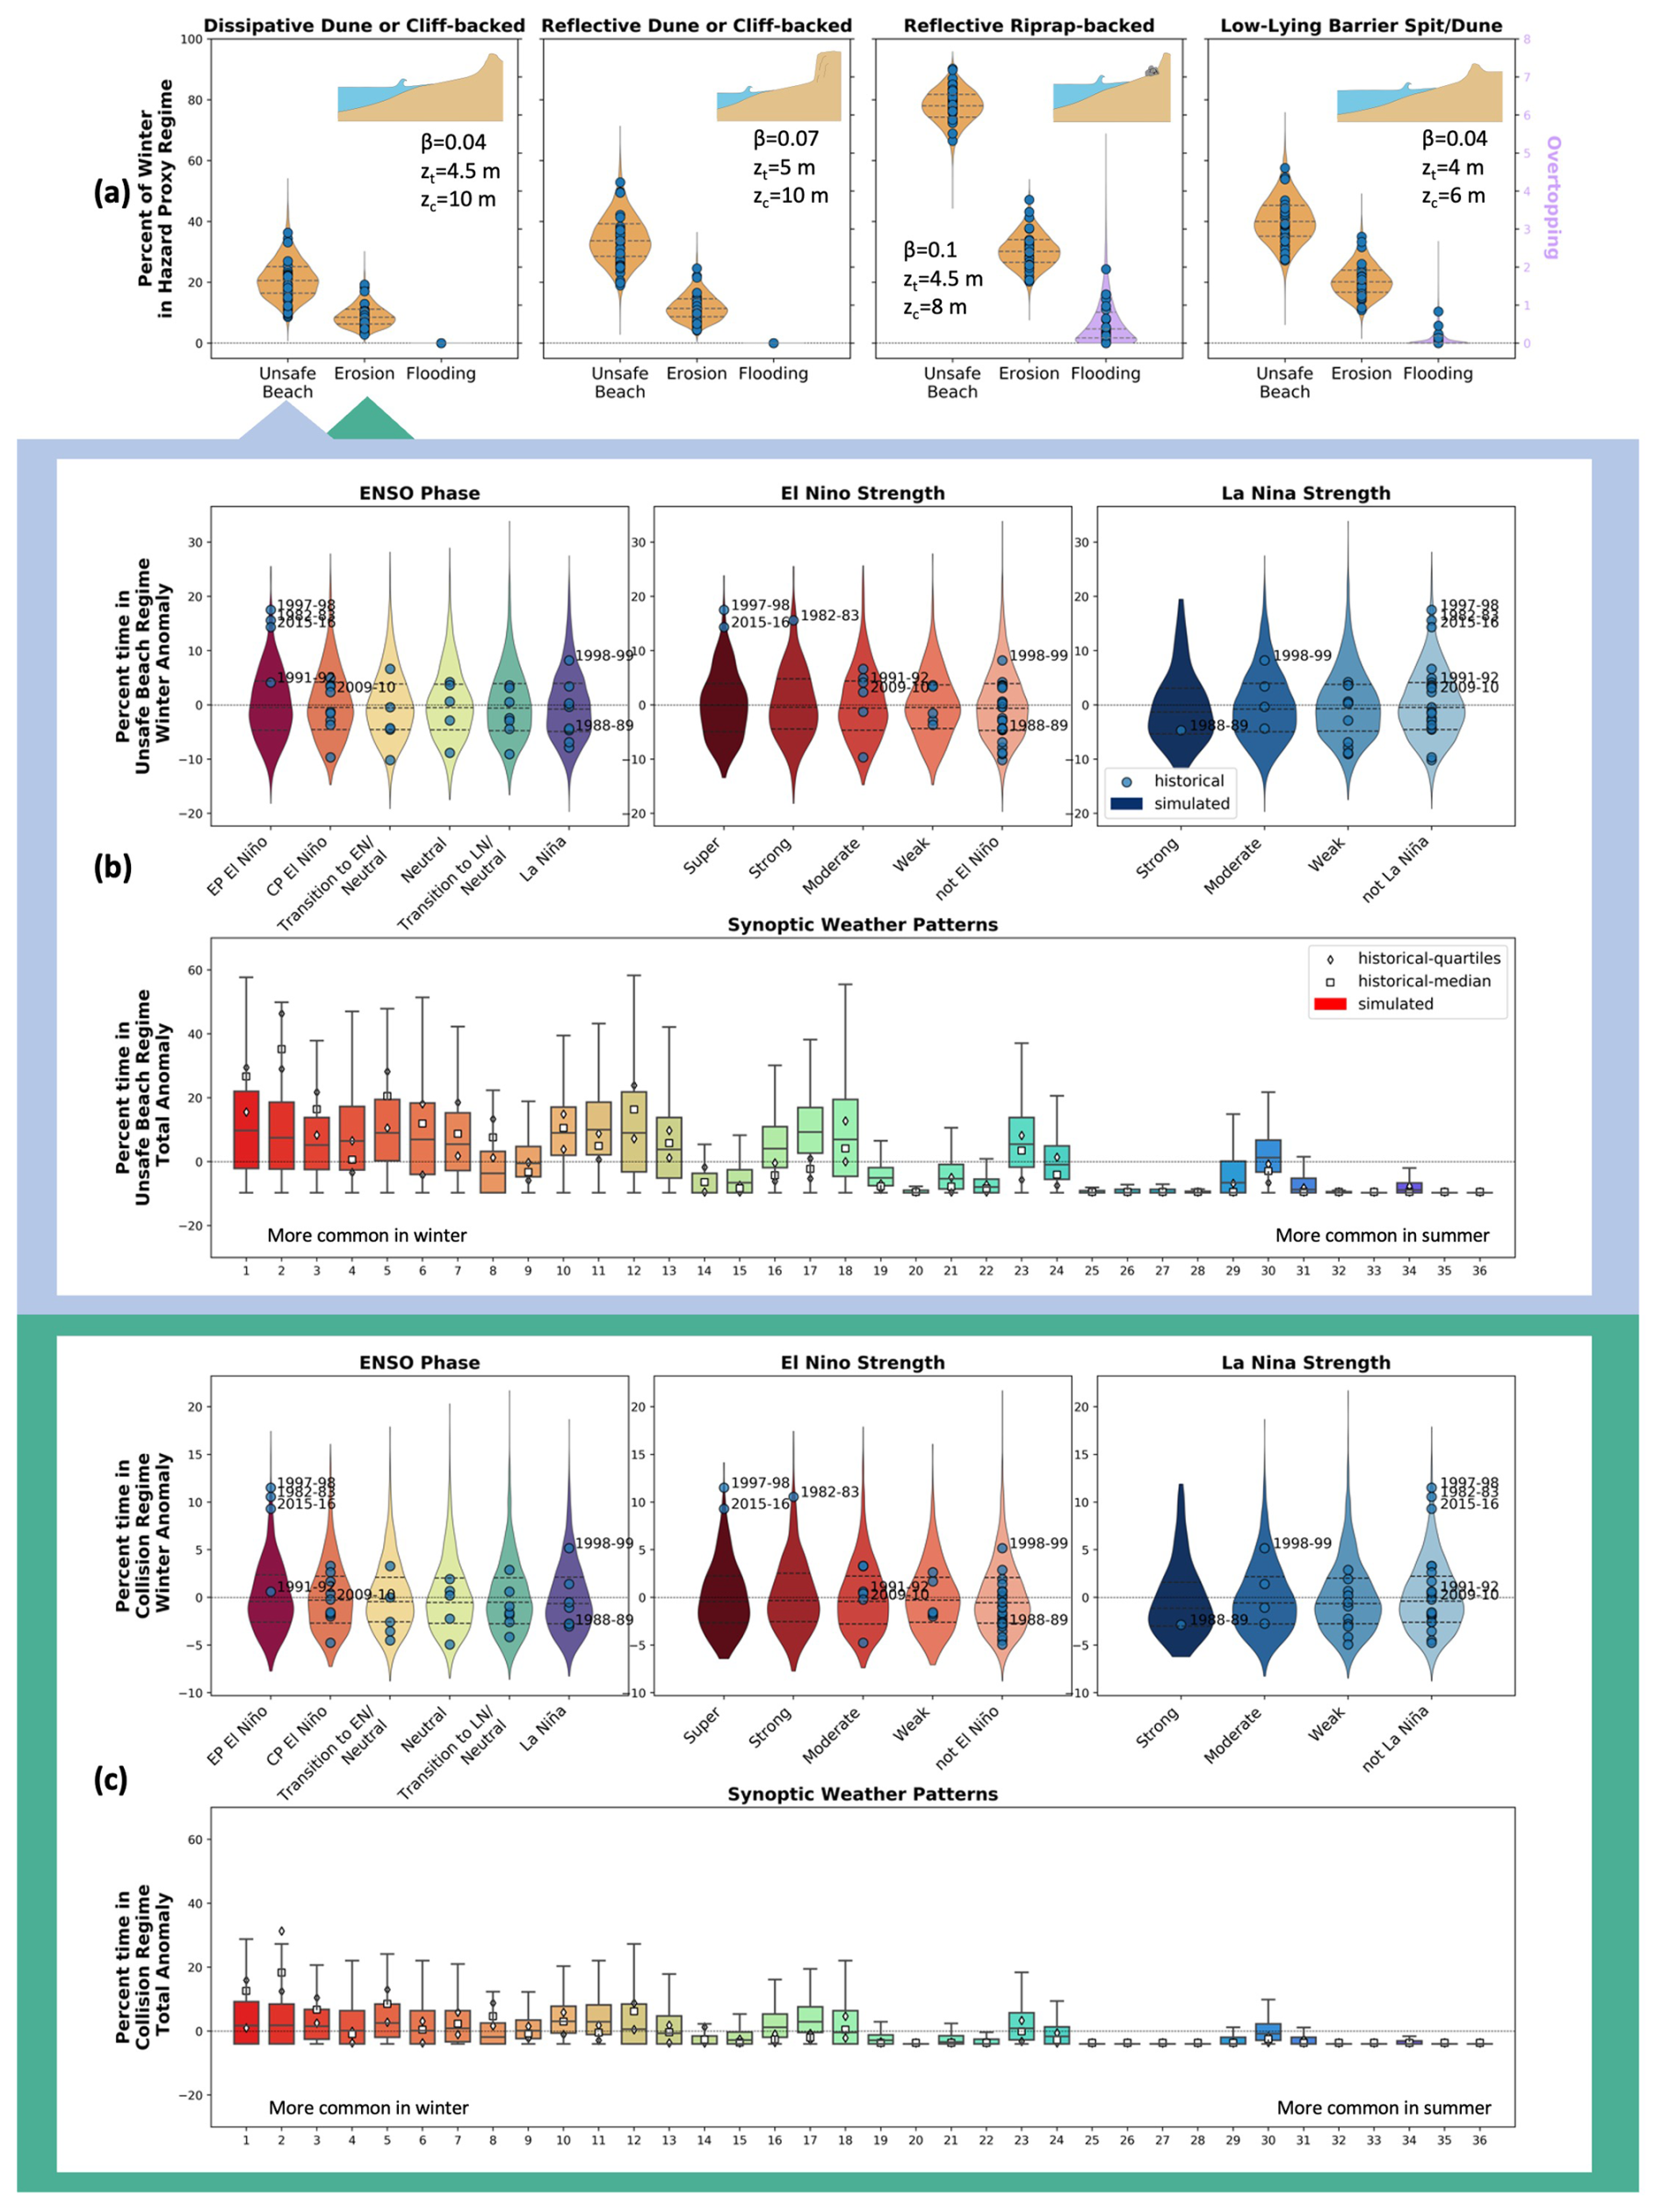
Figure 6(a) Percentage of time spent in the three hazard proxy regimes for four representative beach morphologies for the PNW during winter; violin plots show simulated winters while scatter points show historical winters. Note overtopping is shown on a different y-axis. Inset sketches and morphologic variables show key features for each beach, where β is beach slope, zt is backshore feature toe elevation, and zc is backshore feature crest elevation. For the dissipative sandy-dunebacked morphology, we conditioned the unsafe beach and erosion proxies on ENSO phase, El Niño Strength, La Niña strength, and synoptic weather pattern in panels (b) and (c) respectively. Violin plots show the full simulated distributions of winter impact anomalies, while boxplot whiskers show up to the 0.05 and 0.95 quantiles of the simulated anomalies for the full (not just winter) distribution.
In Fig. 6b and c, the winter percent-impact anomalies of unsafe beach and erosion proxies are shown conditioned on ENSO phase, strength, and synoptic weather patterns for the dissipative sandy dune-backed beach, though similar results were found for all three morphological archetypes tested. There are notable erosion and unsafe beach hazards associated with the three recent extreme El Niños (1982–1983, 1997–1998, and 2015–2016), spending around 10 % more of winter in the collision regime than typical, and 15 % more time in the unsafe beach regime. However, comparing the simulated anomaly data across ENSO phases and intensities reveals that the medians and inter-quartiles are well within a single percentage point of each other. There are a few differences, namely the median of EP El Niño spends ∼ 0.5 % more of winter in the unsafe beach regime compared to La Niña. This small trend persists for both El Niño and La Niña strength. Additionally, while the super El Niño tails are not as long as weaker El Niños and non-El Niño years (perhaps attributable to the rarity of super El Niños (286) even in 10 000 years of simulated data), the shape of the tails are wider, indicating that large winter anomalies are more common at higher quantiles than in other El Niño intensities. While El Niño years may produce a slightly wider tail than other ENSO phases, some of the longest tails (largest winter anomalies of time spent in hazard proxy regimes) are associated with neutral or transition phases of ENSO. This highlights that extreme hazard events can occur during any ENSO phase.
Overall, the small distinctions between ENSO phases and intensities for the anomalies in percent of winter spent in hazard proxy regimes, indicate that while ENSO teleconnections may be evident in the hydrodynamic data anomalies (Fig. 5), they are less apparent in the hazard impacts. This is most likely attributable to these anomalies only contributing ∼ centimeters to decimeters to the ultimate TWL elevation on the coast, while other drivers that are not influenced by ENSO can contribute to TWL variance on the order of meters. For example, tides in the PNW vary on the range of 2–4 m and morphologic and bathymetric influences can cause large, nonlinear differences in hazard impacts (Serafin et al., 2019). While large hydrodynamic anomalies, like those seen in the historic extreme El Niños, can cause greater unsafe beach and erosion hazards, exploring a fuller range of ENSO diversity shows that, on the whole, El Niño events do not cause elevated cross-shore hazard impacts compared with other ENSO phases.
However, like the hydrodynamic forcings, significant variability in unsafe beach and erosion proxies are driven by seasonality and synoptic weather patterns. Many calmer synoptic weather patterns have on average near-zero percentages of time spent in the erosion regime leading to negative anomalies. During stormy weather patterns, TWLs spend a median 2 %–4 % more time in the collision regime and 6 %–8 % more time in the unsafe beach regime than the average of the entire simulated distribution (Fig. 6b and c). Outlier percentages indicate that for some years, these stormy DWTs can spend up to 10 %–30 % more time in the erosion regime and 20 %–60 % more time in the unsafe beach regime compared to other DWTs. Boxplots of the hazard proxy anomalies for each DWT show that stormy DWTs have wider anomalies (both positive and negative) compared with DWTs associated with calmer weather.
4.1 ENSO Mechanisms Affecting PNW Coastal Hazards
This probabilistic analysis of ENSO teleconnections to potential PNW coastal hazards suggests that ENSO phase and intensity are not as powerful predictors of hydrodynamic conditions and anomalous hazard exposure in the PNW as suggested by the major El Niño events of the past ∼ 45 years. During this period, we experienced three of the strongest four El Niño events since 1850, producing extreme SSTAs and extreme coastal hazard teleconnections. However, when our stochastic climate emulator is used to reproduce the statistics of longer-term climate (1880s–2016), analyses of the hydrodynamic and hazard-impact teleconnections suggests that while ENSO phase and intensity are strongly associated with winter-wave and water-level anomalies, they are not necessarily the dominant predictor of either the bulk hydrodynamic distributions (Fig. 4) or the winter hazard-impact anomalies (Fig. 6). Individual ENSO years may produce extreme hazard responses, but across the entire probability space and when wave energy flux and water-level anomalies are superimposed with drivers that do not have a reliance on ENSO patterns (e.g., tides), the effect of ENSO on the hazard proxies computed here can be muted. This is reflected in the historical record through the relatively weak hydrodynamic and hazard anomalies associated with the strong 2023–2024 El Niño and the greater hydrodynamic and heightened hazard response associated with the moderate La Niña in 1998–1999 and ENSO neutral years in 2005–2006 and 2006–2007 (Barnard et al., 2011). The synoptic weather patterns are more direct predictors of extreme hydrodynamic conditions and hazard impacts in the PNW than ENSO. However, since regional weather can be directly associated with ENSO phase, refining our understanding of how diverse ENSO events modulate regional weather patterns may provide better insight into which ENSO events and dynamics will produce teleconnections that drive extreme hazard responses in the PNW.
There are few existing studies that explore ENSO and PNW coastal hazard teleconnections from a statistical perspective, but those that do exist (Baron et al., 2015, p. 20; Mills et al., 2021), provide additional evidence for the limited role that ENSO may play in driving PNW coastal hazards. These studies employed scenario-based modeling approaches, modifying the frequency of El Niño occurrence to assess the impact to future coastal hazards. They found modifying El Niño frequency produced mixed effects to coastal hazard exposure (Mills et al., 2021) to no effect (Baron et al., 2015). Overall, these heuristic games modulating El Niño frequency to explore their role in driving coastal hazards in the PNW support our finding that El Niño years do not necessarily experience greater coastal hazard exposure in the PNW when compared to other ENSO phases. Serafin et al. (2017)'s study examining the drivers of extreme total water levels (TWLs) on the U.S. West Coast provides further context on the role of individual hydrodynamic variables in driving 1 in 100-year events. They found that elevated MMSL, the variable most strongly influenced by ENSO phase and strength, is not a significant contributor to 100-year TWL events. Instead, tides (2–4 m) and large storm surge events (0.5–1.5 m) are more strongly associated with the higher return period events. They indicated, therefore, that extreme TWL events are not always concurrent with El Niño years (which elevate MMSL on the order of 10–30 cm), despite observations of large coastal impacts during past El Niño years.
4.2 ENSO-Coastal Hazard Teleconnections Interactions with Other Climate Modes
The finding that ENSO is not always a strong predictor of coastal hazard impacts likely reflects the wide range of ENSO flavors and diverse coastal hazard responses in the PNW. ENSO is known to have decadal variability, in which different phases (El Niño vs La Niña or EP El Niño vs CP El Niño) occur with greater frequency than others. These decadal patterns may be associated with internal stochasticity of ENSO dynamics, external modulation forced by changes in other climate signals (for example the Pacific Decadal Oscillation [PDO], Intertropical Convergence Zone [ITCZ], and Atlantic Multidecadal Oscillation [AMO]), or complex, nonlinear feedbacks between the two (Capotondi et al., 2020). However, the relatively short instrumental records of ENSO and other relevant climate modes make it difficult to uncouple the complex dynamics driving this variability (McPhaden et al., 2020). Since the stochastic emulator builds AWTs based on SSTA data from 1880–2016, it is trained on many more periods of multidecadal variation than existing studies that focused on ENSO-coastal hazard teleconnections using only observed or reanalysis data (∼ 45 years at most). Incorporating greater multidecadal ENSO variability into the climate emulator may therefore be contributing to the broader range of ENSO-coastal hazard teleconnections in the PNW seen in the simulated data as compared to the last 45 years.
This stochastic analysis, however, does not support definitive interpretation of the dynamics driving historic multidecadal shifts in ENSO, nor the dynamics of how ENSO diversity translates to coastal hazards. For example, using our approach we are unable to explore the role of external climate models in compounding ENSO teleconnections. Anderson et al. (2018) investigated the role of various climate signals in forcing shoreline rotation or hotspot erosion in Oregon. They found that shifts in the wave climate exacerbated multidecadal hotspot erosion trends during El Niño years, coinciding with fluctuations in the PDO (i.e., hazard impacts were greater when both ENSO and PDO are in their warm phases). This finding was corroborated by Stevens et al. (2024) in their exploration of longshore transport patterns based on recent survey data (2014–2023) collected in the Columbia River Littoral Cell in the PNW. Their analysis found northward longshore transport during 2015–2017 (hotspot erosion in southern portions of littoral cells) associated with a positive winter PDO phase. During other years in the study period (negative PDO) longshore transport was predominantly southward. The simulations presented here incorporate climatic and hydrodynamic data from both cool and warm phases of PDO, yet do not differentiate between PDO state when simulating new timeseries of ENSO phase or when assessing the influence of ENSO phase/intensity in driving erosion hazards. Therefore, we may be lumping together an important mode of climate variability in the PNW.
4.3 Study Limitations and Future Research Directions
The finding that El Niño is not necessarily a strong predictor of intensified cross-shore coastal hazards could be attributable to model limitations. For example, short or imperfect observations used as input data, statistical assumptions used to derive joint probabilities, and parameterizations of wave characteristics all contribute to model uncertainty and limitations in skill. However, the stochastic emulator was intentionally designed to capture interannual variability associated with ENSO and has been validated at several locations, consistently recreating the observed hydrodynamic variability associated with ENSO (Anderson et al., 2019; Marra et al., 2022). As new research improves access to high-quality, long-term input data and refines the statistical assumptions/parameterizations used in the model, the probabilistic range of coastal teleconnections estimated by the climate emulator may be better characterized. Similarly, as projections of future ENSO events become more skillful, this data can be incorporated into the climate emulator framework to produce probabilistic hazard assessments for discrete ENSO years, supporting explicit characterization of future ENSO-coastal hazard teleconnections.
As described above, the stochastic climate emulator is also limited in supporting interpretation of multidecadal variability and climate modes outside those explicitly incorporated into the model framework. Future studies that probabilistically simulate hazard drivers with additional climate modes (e.g., PDO, AMO) may help clarify the role of these modes in externally modulating ENSO characteristics, as well as directly driving coastal teleconnections. Furthermore, the hazard proxy analysis does not quantify longshore directed erosion or deposition. Anomalous longshore sediment transport is known to be associated with strong El Niño events from the last 45 years of observations (Barnard et al., 2015; Komar et al., 2011; Stevens et al., 2024; Taherkhani et al., 2026). So, while the proxies for cross-shore hazard exposure do not show strong dependence on ENSO phase and intensity in the PNW, there may be a stronger association to shoreline rotation that is not captured in this impact analysis. Using a stochastic climate emulator as input into a shoreline change model could be an important avenue of future research to quantify this teleconnection.
4.4 Implications for Future Coastal Hazard Impacts
By probabilistically characterizing the coastal hazard teleconnections of different ENSO phases and strengths, we hope to enable more informed hazard adaptation under evolving ENSO patterns. There is uncertainty in how ENSO will evolve under climate change due to persistent model biases in global climate models (Cai et al., 2020). However, a recent study by Cai et al. (2023) finds evidence that anthropogenic warming has already increased the amplitude of ENSO variations by 10 % since 1960, caused by enhanced upper-ocean stratification in the equatorial Pacific. This amplified ENSO variance translates to more frequent and stronger El Niño (particularly EP El Niño) and La Niña events. This could lead to enhanced teleconnections in the PNW, but the outputs of the stochastic climate emulator suggest that, probabilistically, despite future changes in ENSO frequency and strength, coastal hazards in the PNW may not evolve dramatically.
In this study, we employ a stochastic climate emulator to probabilistically assess the role of ENSO in driving coastal hydrodynamic and hazard teleconnections in the US PNW region. This approach allowed us to contextualize the relatively short record of concurrent ENSO and coastal observations (∼ 45 years of satellite data) within the longer-term climate record (1880–2016) using synthetic representations of climate, weather, and coastal hydrodynamic data (10 000 years of simulated data) to test the broadly recognized hypothesis that ENSO is a key driver of coastal hazard impacts in the PNW, first proposed following observations of the super strong El Niño event in 1982–1983 (Komar, 1986).
Outputs of the climate emulator show the probabilistic range of wave energy, water levels, and wave directionality associated with different ENSO phases and strengths. Simulated ENSO teleconnections correspond to observations, showing that heightened wave energy, elevated water levels, and southerly wave directionality are more likely to occur during El Niño (particularly strong El Niño) events than neutral or La Niña years. However, when these coastal hydrodynamic responses are propagated to onshore coastal hazard impacts, probabilistic analyses reveal ENSO phase and strength are not dominant predictors of cross-shore hazards (beach safety, erosion, and flooding). In line with observations, the stochastic climate emulator results demonstrated that extreme coastal hydrodynamic and hazard responses (both positive and negative) can occur across ENSO phases and strengths. These findings affirm that ENSO diversity can produce a wide range of teleconnections in the PNW, and that ENSO may not be as dominant a predictor of PNW coastal hazards as recent observations suggested.
Data and stochastic climate emulator code used in this analysis were described in Leung et al. (2024a) and are available to download from DesignSafe (https://doi.org/10.17603/ds2-mr46-5g54, Leung, et al., 2024b). The Leung et al. (2024b) dataset includes a README file and Jupyter notebooks that enables users to index and download subsets of the data based on their desired location or number of simulations. For this analysis, we employed the offshore historical and simulated data for the Astoria (CASC_As) sub-site. In the Supplement, we additionally used data from the North Beach (CASC_NB) and North Spit (CASC_NS) sub-sites. Figure generation code is available upon request.
The supplement related to this article is available online at https://doi.org/10.5194/nhess-26-1397-2026-supplement.
ML: Conceptualization, Methodology, Software, Validation, Formal analysis, Data Curation, Visualization, Writing – Original Draft, Writing – Review and Editing. PR: Conceptualization, Methodology, Resources, Writing – Review and Editing, Supervision, Project administration, Funding acquisition. LC: Methodology, Software, Data Curation, Writing – Review and Editing. DA: Conceptualization, Methodology, Writing – Review and Editing. FM: Conceptualization, Methodology, Writing – Review and Editing.
The contact author has declared that none of the authors has any competing interests.
Publisher's note: Copernicus Publications remains neutral with regard to jurisdictional claims made in the text, published maps, institutional affiliations, or any other geographical representation in this paper. The authors bear the ultimate responsibility for providing appropriate place names. Views expressed in the text are those of the authors and do not necessarily reflect the views of the publisher.
We thank the anonymous reviewers for their thoughtful comments and constructive feedback, which helped improve the clarity and quality of this manuscript. We also thank Karen Slater (NSF NCAR) for her time and expertise in science writing editing.
This research has been supported by the Oregon Sea Grant, Oregon State University (grant no. NA18OAR170072 (CDFA 11.417)), the National Science Foundation (grant no. 2103713), the National Oceanic and Atmospheric Administration (grant no. NA19NOS4780180), Cantabria Government/FEDER, UE (Perfect-Storm, 2023/TCN/003), MCIN (Ministerio de Ciencia e Innovación)/AEI (Agencia Estatal de Investigación) (CE4Wind, CPP2022-010118, MCIN/AEI/10.13039/501100011033), MICIU (Ministerio de Ciencia, Innovación y Universidades)/AEI (TWINPEACS, AIA2025-163820-C51, MICIU/AEI/10.13039/501100011033), MICIU/AEI and the European Regional Development Fund (ERDF, CACCI, CPP2024-011731), Spanish Ministry of Science and Innovation (CE4Flood, CPP2023-010627), and the Office of Naval Research (ESTCP, 2035806-W912HQ24C001).
This paper was edited by Dung Tran and reviewed by three anonymous referees.
Allan, J. and Komar, P.: Extreme Storms on the Pacific Northwest Coast during the 1997–1998 El Nino and 1998–1999 La Nina, J. Coast. Res., 18, 175–193, 2002.
Allan, J., Ruggiero, P., García Medina, G., Harris, E., Roberts, J., and Stimely, L.: Coastal flood hazard study, Clatsop County, Oregon, Oregon Department of Geology and Mineral Industries (DOGAMI), https://doi.org/10.13140/RG.2.1.1656.5608, 2015.
Almar, R., Boucharel, J., Graffin, M., Abessolo, G. O., Thoumyre, G., Papa, F., Ranasinghe, R., Montano, J., Bergsma, E. W. J., Baba, M. W., and Jin, F.-F.: Influence of El Niño on the variability of global shoreline position, Nat. Commun., 14, 3133, https://doi.org/10.1038/s41467-023-38742-9, 2023.
Anderson, D., Ruggiero, P., Antolínez, J. A. A., Méndez, F. J., and Allan, J.: A Climate Index Optimized for Longshore Sediment Transport Reveals Interannual and Multidecadal Littoral Cell Rotations, J. Geophys. Res.-Earth Surf., 123, 1958–1981, https://doi.org/10.1029/2018jf004689, 2018.
Anderson, D., Rueda, A., Cagigal, L., Antolinez, J. A. A., Mendez, F. J., and Ruggiero, P.: Time-Varying Emulator for Short and Long-Term Analysis of Coastal Flood Hazard Potential, J. Geophys. Res.-Oceans, 124, 9209–9234, https://doi.org/10.1029/2019jc015312, 2019.
Anderson, D., Ruggiero, P., Mendez, F. J., Barnard, P. L., Erikson, L. H., O'Neill, A. C., Merrifield, M., Rueda, A., Cagigal, L., and Marra, J.: Projecting Climate Dependent Coastal Flood Risk With a Hybrid Statistical Dynamical Model, Earths Future, 9, https://doi.org/10.1029/2021ef002285, 2021.
Antolínez, J. A. A., Méndez, F. J., Camus, P., Vitousek, S., González, E. M., Ruggiero, P., and Barnard, P.: A multiscale climate emulator for long-term morphodynamics (MUSCLE-morpho), J. Geophys. Res.-Oceans, 121, 775–791, https://doi.org/10.1002/2015jc011107, 2016.
Aramburo, D., Montoya, R. D., and Osorio, A. F.: Impact of the ENSO phenomenon on wave variability in the Pacific Ocean for wind sea and swell waves, Dyn. Atmos. Ocean., 100, 101328, https://doi.org/10.1016/j.dynatmoce.2022.101328, 2022.
Barnard, P. L., Allan, J., Hansen, J. E., Kaminsky, G. M., Ruggiero, P., and Doria, A.: The impact of the 2009–10 El Niño Modoki on U.S. West Coast beaches, Geophys. Res. Lett., 38, https://doi.org/10.1029/2011GL047707, 2011.
Barnard, P. L., Short, A. D., Harley, M. D., Splinter, K. D., Vitousek, S., Turner, I. L., Allan, J., Banno, M., Bryan, K. R., Doria, A., Hansen, J. E., Kato, S., Kuriyama, Y., Randall-Goodwin, E., Ruggiero, P., Walker, I. J., and Heathfield, D. K.: Coastal vulnerability across the Pacific dominated by El Niño/Southern Oscillation, Nat. Geosci., 8, 801–807, https://doi.org/10.1038/ngeo2539, 2015.
Barnard, P. L., Hoover, D., Hubbard, D. M., Snyder, A., Ludka, B. C., Allan, J., Kaminsky, G. M., Ruggiero, P., Gallien, T. W., Gabel, L., McCandless, D., Weiner, H. M., Cohn, N., Anderson, D. L., and Serafin, K. A.: Extreme oceanographic forcing and coastal response due to the 2015–2016 El Niño, Nat. Commun., 8, 14365, https://doi.org/10.1038/ncomms14365, 2017.
Baron, H. M., Ruggiero, P., Wood, N. J., Harris, E. L., Allan, J., Komar, P., and Corcoran, P.: Incorporating climate change and morphological uncertainty into coastal change hazard assessments, Nat. Hazards, 75, 2081–2102, https://doi.org/10.1007/s11069-014-1417-8, 2015.
Boucharel, J., Almar, R., Kestenare, E., and Jin, F.-F.: On the influence of ENSO complexity on Pan-Pacific coastal wave extremes, Proc. Natl. Acad. Sci. USA, 118, e2115599118, https://doi.org/10.1073/pnas.2115599118, 2021.
Boucharel, J., Almar, R., and Dewitte, B.: Seasonal forecasts of the world's coastal waterline: what to expect from the coming El Niño?, Npj Clim. Atmos. Sci., 7, 37, https://doi.org/10.1038/s41612-024-00570-z, 2024.
Bromirski, P. D., Cayan, D. R., and Flick, R. E.: Wave spectral energy variability in the northeast Pacific, J. Geophys. Res.-Oceans, 110, https://doi.org/10.1029/2004JC002398, 2005.
Cagigal, L., Rueda, A., Anderson, D., Ruggiero, P., Merrifield, M. A., Montaño, J., Coco, G., and Méndez, F. J.: A multivariate, stochastic, climate-based wave emulator for shoreline change modelling, Ocean Model., 154, https://doi.org/10.1016/j.ocemod.2020.101695, 2020.
Cagigal, L., Rueda, A., Ricondo, A., Pérez, J., Ripoll, N., Coco, G., and Méndez, F. J.: Climate‐Based Emulator of Distant Swell Trains and Local Seas Approaching a Pacific Atoll, J. Geophys. Res.-Oceans, 126, https://doi.org/10.1029/2020jc016919, 2021.
Cai, W., Santoso, A., Wang, G., Wu, L., Collins, M., Lengaigne, M., Power, S., and Timmermann, A.: ENSO Response to Greenhouse Forcing, in: El Niño Southern Oscillation in a Changing Climate, 289–307, https://doi.org/10.1002/9781119548164.ch13, 2020.
Cai, W., Ng, B., Geng, T., Jia, F., Wu, L., Wang, G., Liu, Y., Gan, B., Yang, K., Santoso, A., Lin, X., Li, Z., Liu, Y., Yang, Y., Jin, F.-F., Collins, M., and McPhaden, M. J.: Anthropogenic impacts on twentieth-century ENSO variability changes, Nat. Rev. Earth Environ., 4, 407–418, https://doi.org/10.1038/s43017-023-00427-8, 2023.
Camus, P., Mendez, F. J., and Medina, R.: A hybrid efficient method to downscale wave climate to coastal areas, Coast. Eng., 58, 851–862, https://doi.org/10.1016/j.coastaleng.2011.05.007, 2011.
Camus, P., Menéndez, M., Méndez, F. J., Izaguirre, C., Espejo, A., Cánovas, V., Pérez, J., Rueda, A., Losada, I. J., and Medina, R.: A weather-type statistical downscaling framework for ocean wave climate, J. Geophys. Res.-Oceans, 119, 7389–7405, https://doi.org/10.1002/2014JC010141, 2014.
Capotondi, A., Wittenberg, A. T., Kug, J.-S., Takahashi, K., and McPhaden, M. J.: ENSO Diversity, in: El Niño Southern Oscillation in a Changing Climate, 65–86, https://doi.org/10.1002/9781119548164.ch4, 2020.
Codiga, D.: Unified tidal analysis and prediction using the UTide Matlab functions, Graduate School of Oceanography, University of Rhode Island, Narragansett, https://doi.org/10.13140/RG.2.1.3761.2008, 2011.
D'Anna, M., Idier, D., Castelle, B., Rohmer, J., Cagigal, L., and Mendez, F.: Effects of Stochastic Wave Forcing on Equilibrium Shoreline Modelling Across the 21 st Century Including Sea-Level Rise, Coast. Eng., https://doi.org/10.1016/j.coastaleng.2022.104149, 2022.
Durrant, T., Hemer, M., Smith, G., Trenham, C., and Greenslade, D.: CAWCR Wave Hindcast – Aggregated Collection, v5, CSIRO, http://hdl.handle.net/102.100.100/137152?index=1 (last access: December 2021), 2019.
Erikson, L., Morim, J., Hemer, M., Young, I., Wang, X. L., Mentaschi, L., Mori, N., Semedo, A., Stopa, J., Grigorieva, V., Gulev, S., Aarnes, O., Bidlot, J. R., Breivik, Ø., Bricheno, L., Shimura, T., Menendez, M., Markina, M., Sharmar, V., Trenham, C., Wolf, J., Appendini, C., Caires, S., Groll, N., and Webb, A.: Global ocean wave fields show consistent regional trends between 1980 and 2014 in a multi-product ensemble, Commun. Earth Environ., 3, 320, https://doi.org/10.1038/s43247-022-00654-9, 2022.
Goddard, L. and Gershunov, A.: Impact of El Niño on Weather and Climate Extremes, in: El Niño Southern Oscillation in a Changing Climate, 361–375, https://doi.org/10.1002/9781119548164.ch16, 2020.
Guanche, Y., Mínguez, R., and Méndez, F. J.: Autoregressive logistic regression applied to atmospheric circulation patterns, Clim. Dyn., 42, 537–552, https://doi.org/10.1007/s00382-013-1690-3, 2013.
Huang, B., Banzon, V. F., Freeman, E., Lawrimore, J., Liu, W., Peterson, T. C., Smith, T. M., Thorne, P. W., Woodruff, S. D., and Zhang, H.-M.: Extended Reconstructed Sea Surface Temperature (ERSST), Version 4, National Centers for Environmental Information (NCEI), https://doi.org/10.7289/V5KD1VVF, 2015.
Huang, B., L'Heureux, M., Hu, Z.-Z., and Zhang, H.-M.: Ranking the strongest ENSO events while incorporating SST uncertainty, Geophys. Res. Lett., 43, 9165–9172, https://doi.org/10.1002/2016GL070888, 2016.
Kako, S. and Kubota, M.: Relationship between an el niño event and the interannual variability of significant wave heights in the north pacific, Atmos.-Ocean, 44, 377–395, https://doi.org/10.3137/ao.440404, 2006.
Kaminsky, G., Ruggerio, P., and Gelfenbaum, G.: Monitoring Coastal Change in Southwest Washington and Northwest Oregon during the 1997/98 El Nino, Shore Beach, 66, 42–51, 1998.
Komar, P.: The 1982–1983 El Niño and erosion on the coast of Oregon, Shore Beach, 54, ISBN 0037-4237, 1986.
Komar, P.: The 1997–1998 El Nino and Erosion on the Oregon Coast, Shore Beach, 66, 33–41, 1998.
Komar, P., Allan, J., and Ruggiero, P.: Sea Level Variations along the U.S. Pacific Northwest Coast: Tectonic and Climate Controls, J. Coast. Res., 276, 808–823, https://doi.org/10.2112/jcoastres-d-10-00116.1, 2011.
Komar, P., Allan, J., and Ruggiero, P.: U.S. Pacific Northwest Coastal Hazards: Tectonic and Climate Controls, in: Coastal Hazards, edited by: Finkl, C., Springer Netherlands, Dordrecht, 587–674, https://doi.org/10.1007/978-94-007-5234-4_21, 2013.
Lafleur, D. M., Barrett, B. S., and Henderson, G. R.: Some Climatological Aspects of the Madden–Julian Oscillation (MJO), J. Clim., 28, 6039–6053, https://doi.org/10.1175/JCLI-D-14-00744.1, 2015.
Leaman, C. K., Harley, M. D., Splinter, K. D., Thran, M. C., Kinsela, M. A., and Turner, I. L.: A storm hazard matrix combining coastal flooding and beach erosion, Coast. Eng., 170, https://doi.org/10.1016/j.coastaleng.2021.104001, 2021.
Leung, M., Cagigal, L., Mendez, F., and Ruggiero, P.: Projecting Future Chronic Coastal Hazard Impacts, Hotspots, and Uncertainty at Regional Scale, Earths Future, 12, e2024EF005523, https://doi.org/10.1029/2024EF005523, 2024a.
Leung, M., Cagigal, L., Pittman, R., Mendez, F. J., and Ruggerio, P.: TESLA-Cascadia Total Water Levels and Chronic Hazard Proxies, in TESLA-Cascadia: Stochastic Total Water Level and Chronic Coastal Hazard Proxy Simulations, DesignSafe-CI [data set], https://doi.org/10.17603/ds2-mr46-5g54, 2024b.
Marra, J. J., Sweet, W. V., Leuliette, E., Kruk, M., Genz, A. S., Storlazzi, C. D., Ruggiero, P., Leung, M., Anderson, D., Merrifield, M. A., Becker, J. M., Robertson, I., Widlandsky, M. J., Thompson, P., Mendez, F. J., Rueda, A., Antolinez, J. A. A., Cagigal, L., Menéndez, M., Lobeto, H., Obeysekera, J., and Chiesa, C.: Advancing Best Practices for the Analysis of the Vulnerability of Military Installations in the Pacific Basin to Coastal Flooding under a Changing Climate – RC-2644: Final Report for the U.S. Department of Defense Strategic Environmental Research and Development Program, 1 June 2022, 543 pp., http://apdrc.soest.hawaii.edu/SERDP/SERDP_RC-2644_FINAL_REPORT_V2_.pdf (last access: 10 January 2022), 2022.
McPhaden, M. J., Santoso, A., and Cai, W.: Introduction to El Niño Southern Oscillation in a Changing Climate, in: El Niño Southern Oscillation in a Changing Climate, 1–19, https://doi.org/10.1002/9781119548164.ch1, 2020.
Mentaschi, L., Vousdoukas, M. I., Voukouvalas, E., Dosio, A., and Feyen, L.: Global changes of extreme coastal wave energy fluxes triggered by intensified teleconnection patterns, Geophys. Res. Lett., 44, 2416–2426, https://doi.org/10.1002/2016gl072488, 2017.
Mills, A. K., Ruggiero, P., Bolte, J. P., Serafin, K. A., and Lipiec, E.: Quantifying Uncertainty in Exposure to Coastal Hazards Associated with Both Climate Change and Adaptation Strategies: A U.S. Pacific Northwest Alternative Coastal Futures Analysis, Water, 13, https://doi.org/10.3390/w13040545, 2021.
Mukhopadhyay, S., Leung, M., Cagigal, L., Kucharski, J., Ruggiero, P., and Steinschneider, S.: Understanding the Natural Variability of Still Water Levels in the San Francisco Bay Over the Past 500 yr: Implications for Future Coastal Flood Risk, J. Geophys. Res.-Oceans, 128, e2022JC019012, https://doi.org/10.1029/2022JC019012, 2023.
National Oceanic and Atmospheric Administration: 2016 USGS West Coast El-I Lidar DEM (WA, OR, CA), National Oceanic and Atmospheric Administration, https://coast.noaa.gov/htdata/raster2/elevation/West_Coast_El_Nino_DEM_2016_6260/ (last access: December 2021), 2017.
NOAA Tides and Currents: https://tidesandcurrents.noaa.gov/stationhome.html?id=9439040 (last access: December 2023), 2023.
Odériz, I., Silva, R., Mortlock, T. R., and Mori, N.: El Niño-Southern Oscillation Impacts on Global Wave Climate and Potential Coastal Hazards, J. Geophys. Res.-Oceans, 125, e2020JC016464, https://doi.org/10.1029/2020JC016464, 2020.
Oppenheimer, M., Glavovic, B. C., Hinkel, J., Wal, R. van de, Magnan, A. K., Abd-EIgawad, A., Cai, R., Cifuentes-Jara, M., DeConto, R. M., Ghosh, T., Hay, J., Isla, F., Marzeion, B., Meyssignac, B., and Sebesvari, Z.: Sea Level Rise and Implications for Low-Lying Islands, Coasts and Communities, Intergovernmental Panel on Climate Change, Geneva, https://doi.org/10.1017/9781009157964.006, 2019.
Oregon Department of Geology and Mineral Industries (DOGAMI): Oregon Beach and Shoreline Mapping and Analysis Program (OBSMAP), Oregon Department of Geology and Mineral Industries (DOGAMI), https://nvs.nanoos.org/BeachMapping (last access: May 2024), 2024.
Paek, H., Yu, J.-Y., and Qian, C.: Why were the 2015/2016 and 1997/1998 extreme El Niños different?, Geophys. Res. Lett., https://doi.org/10.1002/2016gl071515, 2017.
Pérez, J., Méndez, F. J., Menéndez, M., and Losada, I. J.: ESTELA: a method for evaluating the source and travel time of the wave energy reaching a local area, Ocean Dyn., 64, 1181–1191, https://doi.org/10.1007/s10236-014-0740-7, 2014.
Pullen, T., Allsop, W., Bruce, T., Kortenhaus, A., Schüttrumpf, H., and van der Meer, J.: EurOtop Wave Overtopping of Sea Defences and Related Structures: Assessment Manual, Die Küste, https://www.overtopping-manual.com/assets/downloads/EAK-K073_EurOtop_2007.pdf (last access: March 2025), 2007.
Ruggiero, P. and Voigt, B.: Beach Monitoring in the Columbia River Littoral Cell, 1997–2000 (Historical), Publ. No 00-06-026, Coast. Monit. Anal. Program Wash.-Partment Ecol. Olymp. WA 113, https://apps.ecology.wa.gov/publications/SummaryPages/000626.html (last access: May 2023), 2000.
Ruggiero, P., Kaminsky, G. M., Gelfenbaum, G., and Voigt, B.: Seasonal to Interannual Morphodynamics along a High-Energy Dissipative Littoral Cell, J. Coast. Res., 2005, 553–578, https://doi.org/10.2112/03-0029.1, 2005.
Ruggiero, P., Kratzmann, M. G., Himmelstoss, E. A., Reid, D., Allan, J., and Kaminsky, G.: National Assessment of Shoreline Change: Historical Shoreline Change along the Pacific Northwest Coast, US Geol. Surv. Open-File Rep., 2012–1007, 62 pp., https://doi.org/10.3133/ofr20121007, 2013.
Saha, S., Moorthi, S., Wu, X., Wang, J., Nadiga, S., Tripp, P., Behringer, D., Hou, Y.-T., Chuang, H., Iredell, M., Ek, M., Meng, J., Yang, R., Mendez, M. P., van den Dool, H., Zhang, Q., Wang, W., Chen, M., and Becker, E.: The NCEP Climate Forecast System Version 2, J. Clim., 27, 2185–2208, https://doi.org/10.1175/JCLI-D-12-00823.1, 2014.
Sallenger, A. H.: Storm Impact Scale for Barrier Islands, J. Coast. Res., 16, 890–895, 2000.
Serafin, K. A., Ruggiero, P., and Stockdon, H. F.: The relative contribution of waves, tides, and nontidal residuals to extreme total water levels on U.S. West Coast sandy beaches, Geophys. Res. Lett., 44, 1839–1847, https://doi.org/10.1002/2016gl071020, 2017.
Serafin, K. A., Ruggiero, P., Barnard, P. L., and Stockdon, H. F.: The influence of shelf bathymetry and beach topography on extreme total water levels: Linking large-scale changes of the wave climate to local coastal hazards, Coast. Eng., 150, 1–17, https://doi.org/10.1016/j.coastaleng.2019.03.012, 2019.
Shope, J. B., Erikson, L. H., Barnard, P. L., Storlazzi, C. D., Hardy, M. W., and Doran, K. S.: Modeled extreme total water levels along the U.S. west coast: U.S. Geological Survey data release, US Geological Survey, https://doi.org/10.5066/P95FBGZ1, 2021.
Shope, J. B., Erikson, L. H., Barnard, P. L., Storlazzi, C. D., Serafin, K., Doran, K., Stockdon, H., Reguero, B., Mendez, F., Castanedo, S., Cid, A., Cagigal, L., and Ruggiero, P.: Characterizing storm-induced coastal change hazards along the United States West Coast, Sci. Data, 9, 224, https://doi.org/10.1038/s41597-022-01313-6, 2022.
Sprintall, J., Cravatte, S., Dewitte, B., Du, Y., and Gupta, A. S.: ENSO Oceanic Teleconnections, in: El Niño Southern Oscillation in a Changing Climate, 337–359, https://doi.org/10.1002/9781119548164.ch15, 2020.
Stevens, A. W., Ruggiero, P., Parker, K. A., Vitousek, S., Gelfenbaum, G., and Kaminsky, G. M.: Climate controls on longshore sediment transport and coastal morphology adjacent to engineered inlets, Coast. Eng., 194, 104617, https://doi.org/10.1016/j.coastaleng.2024.104617, 2024.
Stockdon, H. F., Holman, R. A., Howd, P. A., and Sallenger, A. H.: Empirical parameterization of setup, swash, and runup, Coast. Eng., 53, 573–588, https://doi.org/10.1016/j.coastaleng.2005.12.005, 2006.
Taherkhani, M., Vitousek, S., Graffin, M., Vos, K., Allan, J. C., Kaminsky, G. M., and Ruggiero, P.: ENSO and PDO drive shoreline position anomalies in the US Pacific Northwest, PNAS Nexus, 5, pgaf404, https://doi.org/10.1093/pnasnexus/pgaf404, 2026.
Taschetto, A. S., Ummenhofer, C. C., Stuecker, M. F., Dommenget, D., Ashok, K., Rodrigues, R. R., and Yeh, S.-W.: ENSO Atmospheric Teleconnections, in: El Niño Southern Oscillation in a Changing Climate, 309–335, https://doi.org/10.1002/9781119548164.ch14, 2020.
Timmermann, A., An, S.-I., Kug, J.-S., Jin, F.-F., Cai, W., Capotondi, A., Cobb, K. M., Lengaigne, M., McPhaden, M. J., Stuecker, M. F., Stein, K., Wittenberg, A. T., Yun, K.-S., Bayr, T., Chen, H.-C., Chikamoto, Y., Dewitte, B., Dommenget, D., Grothe, P., Guilyardi, E., Ham, Y.-G., Hayashi, M., Ineson, S., Kang, D., Kim, S., Kim, W., Lee, J.-Y., Li, T., Luo, J.-J., McGregor, S., Planton, Y., Power, S., Rashid, H., Ren, H.-L., Santoso, A., Takahashi, K., Todd, A., Wang, G., Wang, G., Xie, R., Yang, W.-H., Yeh, S.-W., Yoon, J., Zeller, E., and Zhang, X.: El Niño–Southern Oscillation complexity, Nature, 559, 535–545, https://doi.org/10.1038/s41586-018-0252-6, 2018.
van der Meer, J.: Technical report wave run-up and wave overtopping at dikes, TU Delft, Deflt, the Netherlands, https://www.overtopping-manual.com/assets/downloads/TRRunupOvertopping.pdf (last access: May 2023), 2002.
Vitousek, S., Cagigal, L., Montaño, J., Rueda, A., Mendez, F., Coco, G., and Barnard, P. L.: The Application of Ensemble Wave Forcing to Quantify Uncertainty of Shoreline Change Predictions, J. Geophys. Res.-Earth Surf., 126, https://doi.org/10.1029/2019jf005506, 2021.
Vos, K., Harley, M. D., Turner, I. L., and Splinter, K. D.: Pacific shoreline erosion and accretion patterns controlled by El Niño/Southern Oscillation, Nat. Geosci., 16, 140–146, https://doi.org/10.1038/s41561-022-01117-8, 2023.
Webb, E. J. and Magi, B. I.: The Ensemble Oceanic Niño Index, Int. J. Climatol., 42, 5321–5341, https://doi.org/10.1002/joc.7535, 2022.
Wheeler, M. C. and Hendon, H. H.: An All-Season Real-Time Multivariate MJO Index: Development of an Index for Monitoring and Prediction, Mon. Weather Rev., 132, 1917–1932, https://doi.org/10.1175/1520-0493(2004)132<1917:AARMMI>2.0.CO;2, 2004.
Williams, I. N. and Patricola, C. M.: Diversity of ENSO Events Unified by Convective Threshold Sea Surface Temperature: A Nonlinear ENSO Index, Geophys. Res. Lett., 45, 9236–9244, https://doi.org/10.1029/2018GL079203, 2018.
Wright, L. D. and Short, A. D.: Morphodynamic variability of surf zones and beaches: A synthesis, Mar. Geol., 56, 93–118, https://doi.org/10.1016/0025-3227(84)90008-2, 1984.