the Creative Commons Attribution 4.0 License.
the Creative Commons Attribution 4.0 License.
 | 03 Mar 2026
Advancing glacial lake hazard and risk assessment in Bhutan through hydrodynamic flood mapping and exposure analysis
Stuart Dunning
Rachel Joanne Carr
Simon Allen
Sonam Wangchuk
Ashim Sattar
Hazard and risk from glacial lake outburst floods (GLOFs) in Bhutan have traditionally been assessed with limited consideration of the downstream exposure and vulnerability associated with individual lakes. However, exposure and vulnerability are key components of risk, and when explicitly attributed to each lake, can provide a more robust basis for prioritising hazard investigations and mitigation efforts. We modelled hypothetical GLOF scenarios for all glacial lakes with an area greater than 0.05 km2 and located within 1 km of a glacier terminus. We then determined GLOF risk by explicitly accounting for downstream impacts using depth–velocity outputs at each exposed element affected by the simulated GLOF from each lake, as well as the vulnerability of the affected community. Our study shows that approximately > 11 000 people, > 2500 buildings, > 250 km of road, > 400 bridges and ∼ 20 km2 of farmland are exposed to potential GLOF in Bhutan. We classified lake130 (Thorthormi Tsho) as a very high hazard glacial lake in Bhutan, five lakes as high hazard and 22 other lakes as moderate hazard. Among these high hazard glacial lakes, three of them: lake93 (Phudung Tsho), lake251, and lake278 (Wonney Tsho) were not recognised as being high hazard in previous studies. Five downstream local government administrative units (LGUs) were associated with very high GLOF risk, while eight others are associated with high GLOF risk. Five of these very high and high risk LGUs had not been previously documented as being at risk from GLOF. Our study underscores the significance of integrating potential inundation mapping and downstream exposure data to define high hazard glacial lakes. We recommend strengthening and expanding the existing GLOF preparedness and risk mitigation efforts in Bhutan, particularly in the LGUs, as having high GLOF risk identified in this study, to reduce potential future damage and loss.
- Article
(10604 KB) - Full-text XML
-
Supplement
(2256 KB) - BibTeX
- EndNote


There are currently 110 000 glacial lakes globally, with a total area of ∼ 15 000 km2. The glacial lakes have increased in area by ∼ 22 % between 1990 and 2020, primarily due to the accumulation of meltwater on newly exposed depressions left by retreating glaciers (Zhang et al., 2024). Glacial lakes across the world have produced 3152 GLOF events between 850 and 2022 CE (Lützow et al., 2023), which caused more than 12 400 human deaths and damaged infrastructure worth hundreds of millions of USD (Carrivick and Tweed, 2016; Lützow et al., 2023). In High Mountain Asia (HMA), 682 GLOF events have occurred between 1833 and 2022, causing 6907 fatalities (Shrestha et al., 2023). However, this reported number is highly uncertain, primarily because of scarce/incomplete documentation of many past events. Moreover, ∼ 80 % these reported deaths in HMA are associated with a single compounding event involving Chorabari glacial lake and a cloud-burst induced debris flow in 2013 (Allen et al., 2015; Das et al., 2015). Moraine-dammed GLOF events have caused an order of magnitude more damage than the combined damage from all other types of glacial lakes in HMA, despite moraine-dammed GLOF events only accounting for one-third of total GLOF events in HMA (Shrestha et al., 2023; Carrivick and Tweed, 2016). This is because GLOFs from moraine-dammed lakes are (usually) high magnitude but highly unpredictable through space and time, posing a high risk for downstream settlements (Zhang et al., 2025b; Shrestha et al., 2023; Lützow et al., 2023). In addition, moraine-dammed lakes are often located upstream of densely populated areas such as are found in HMA, the Andes and Alps, in contrast to other types of glacial lakes, such as ice-dammed or supraglacial ponds/lakes (Emmer, 2024). Thus, it is important to quantify the risk they pose to the downstream settlements.
Using the concept of so called “potentially dangerous” glacial lake (PDGL), existing hazards and risks from glacial lakes in Bhutan are identified based on the likelihood and magnitude of potential GLOF, which in turn are assessed based on the inherent stability of the lake's dam and factors that influence the potential for an external triggering event, such as a mass movement entering the lake (Allen et al., 2019; Zheng et al., 2021b). Commonly used parameters include topographic potential for mass input into the lake from the surrounding hillslopes, lake volume (usually derived from a relationship to lake area), lake growth, moraine dam geometry and composition, and catchment area (Zhang et al., 2023b; Zheng et al., 2021b; Fujita et al., 2013; Nagai et al., 2017). Although the approaches and factors selected are influenced by study objectives and expert judgment, they are largely based on historical events, often backed with limited observed data (Shrestha et al., 2023; Zheng et al., 2021b). Constraining certain parameters, such as the location and magnitude of possible/probable mass movements entering a lake, is challenging even with field-based assessments and more so when using coarse, globally available, open-access data, but previous studies show that this parameter may be fundamental for the resulting GLOF magnitude (Rinzin et al., 2025). Moreover, the dynamic nature of cryospheric processes, exacerbated under climate warming, means that these reconstructed GLOF characteristics cannot necessarily be applied to contemporary or future conditions (Allen et al., 2017). This is evident from some GLOF events which have occurred from glacial lakes which had been deemed less susceptible to GLOF, for example, Lagmale glacial lake in the Nepalese Himalaya in 2017 (Byers et al., 2018) and Gongbatongsha Co lake in 2013 in the Indian Himalaya (Cook et al., 2018). Thus, the likelihood of producing a GLOF from any glacial lake is subject to inevitable uncertainties. If a glacial lake generates an exceptionally large flood, but the downstream community is unaffected, we can consider the risk from the glacial lake as low, whereas even a small flood that impacts a large number of people should be classified as a high risk. Typically, this is neglected in favour of classifications of PGDL only on lake/trigger conditions, and not downstream impacts (Taylor et al., 2023a).
In recent decades, the amount of infrastructure, buildings and farmland exposed to potential GLOFs in HMA has increased (Nie et al., 2023). For example, critical and high-cost infrastructure, such as hydroelectric power plants are being developed closer to glacial lakes due to growing energy demand in HMA regions (Nie et al., 2021; Schwanghart et al., 2016). In HMA, the population in GLOF-exposed areas increased by 31 % (7.0 to 9.2 million) between 2000 and 2020 and may therefore have contributed significantly more towards rising GLOF risk than (debatably) increasing potential GLOF magnitude due to lake expansion (Taylor et al., 2023b). Thus, changing downstream exposure and vulnerability can play a greater role in shaping contemporary and near-future GLOF risk than the glacial lake and surrounding properties, making the inclusion of the former in the identification of high hazard lakes a crucial, but often overlooked, factor both in the HMA and other high GLOF risk regions globally, such as the Andes (Cook et al., 2016; Colavitto et al., 2024).
To identify GLOF risk with greater confidence and to implement effective management, mitigation and/or emergency response, we need to consider the interaction between GLOFs and downstream exposure and vulnerability. Taylor et al. (2023a) used the downstream population within a 1 km buffer of the river through which a GLOF would flow, to a maximum runout of 50 km from each glacial lake to calculate global-scale GLOF risk/danger. However, the coarse resolution of data and crude assumption of GLOF flow path without hydrodynamic modelling introduces substantial uncertainties due to factors such as detailed local topography, especially where even populations very close in plain view distance to a GLOF flow routeway are in reality disconnected from the river by, for example, high river terraces – common in high-mountain regions such as Bhutan. GLOF risk assessments at the HMA scale have been undertaken by combining hydrodynamic modelling and open-source downstream data, such as OpenStreetMap (Zhang et al., 2023b), but the flood mapping component was only for glacial lakes that they deemed very high or high hazard through prior GLOF susceptibility assessment. Flood mapping for some lakes that can directly impact downstream communities in future GLOF events has not been carried out despite huge deviations and inconsistencies between the previous susceptibility assessments (Zheng et al., 2021b; Zhang et al., 2023b; Rinzin et al., 2021; National Centre for Hydrology and Meteorology (NCHM), 2019). Moreover, since such studies are focused on a global to continental scale, they do not provide adequate granularity at the national and basin scale for bespoke risk reduction activities and planning.
This study presents a new GLOF risk assessment approach for Bhutan, which combines robust flood mapping (through hydrodynamic modelling) and downstream exposure and vulnerability data. For this, we selected all glacial lakes with an area of 0.05 km2 (n = 278) within the Bhutan Himalaya and conducted hydrodynamic simulations for all these lakes using HEC-RAS (U.S. Army Corps of Engineers et al., 2021). We then combined the flood map generated through hydrodynamic modelling with downstream data on exposure and vulnerability derived from OpenStreetMap, land-use and land cover maps, and population and housing 2017 census data (National Statistics Bureau of Bhutan (NSB), 2018). As a result, (1) we produced a flood map for all study glacial lakes in Bhutan; (2) mapped all downstream exposed elements; and (3) provided a new, updated ranking of glacial lakes in Bhutan, based on the hazard they pose to downstream settlement(s). We have developed a publicly available web portal that hosts the glacial lake dataset, GLOF inundation maps and downstream GLOF risk across local administrative units in Bhutan.
Bhutan's landscape is characterised by high mountains, rugged topography and steep terrain with elevations ranging between 200 m a.s.l. in the south to over 7000 m a.s.l. in the north. Bhutan's northern regions consist of the Greater Himalaya mountains, which contain ∼ 1487 km2 of glacier ice, of which 64 % (951 km2) are debris-covered glaciers (Nagai et al., 2016) (Fig. 1). Between 2000 and 2020, Bhutanese glaciers lost mass at a rate of 0.47 m w.e. yr−1, which exceeds the neighbouring eastern Himalayan (∼ 0.33 m w.e. yr−1) and Nyainqêntanglha (∼ 0.46 m w.e. yr−1) regions (Hugonnet et al., 2021). It is projected that Bhutanese glaciers will undergo continuous and accelerated melting in the future in response to the current climate warming trend (Rupper et al., 2012). As of 2020, there were 2574 (156.63 ± 7.95 km2) glacial lakes in Bhutan, which was an increase of 17.7 % in number and 20.3 % in area from the 1960s (Rinzin et al., 2021) (Fig. 1). While these glacial lakes are predominantly present in basins such as Phochu (28.18 % of the total lake area) and Kurichu (26.35 % of the total area), they are widespread across the Bhutan Himalaya and drainage from these lakes flows through most of the major towns and settlements in Bhutan (Fig. 1). Sixty-four (64) glacial lakes greater than 0.05 km2 were identified as highly or very highly susceptible to producing GLOF in the future based on geomorphological conditions such as topographical potential for avalanching into the lake (Rinzin et al., 2021). Likewise, using similar criteria, the NCHM has identified 17 high hazard lakes (termed “potentially dangerous” in their report) (NCHM, 2019), based on the earlier assessment by ICIMOD (Mool et al., 2001). Of these high hazard glacial lakes, the majority (n = 9) are located within the Phochu basins, the headwaters of Punatsangchu (where “Chu” translates to river/stream).
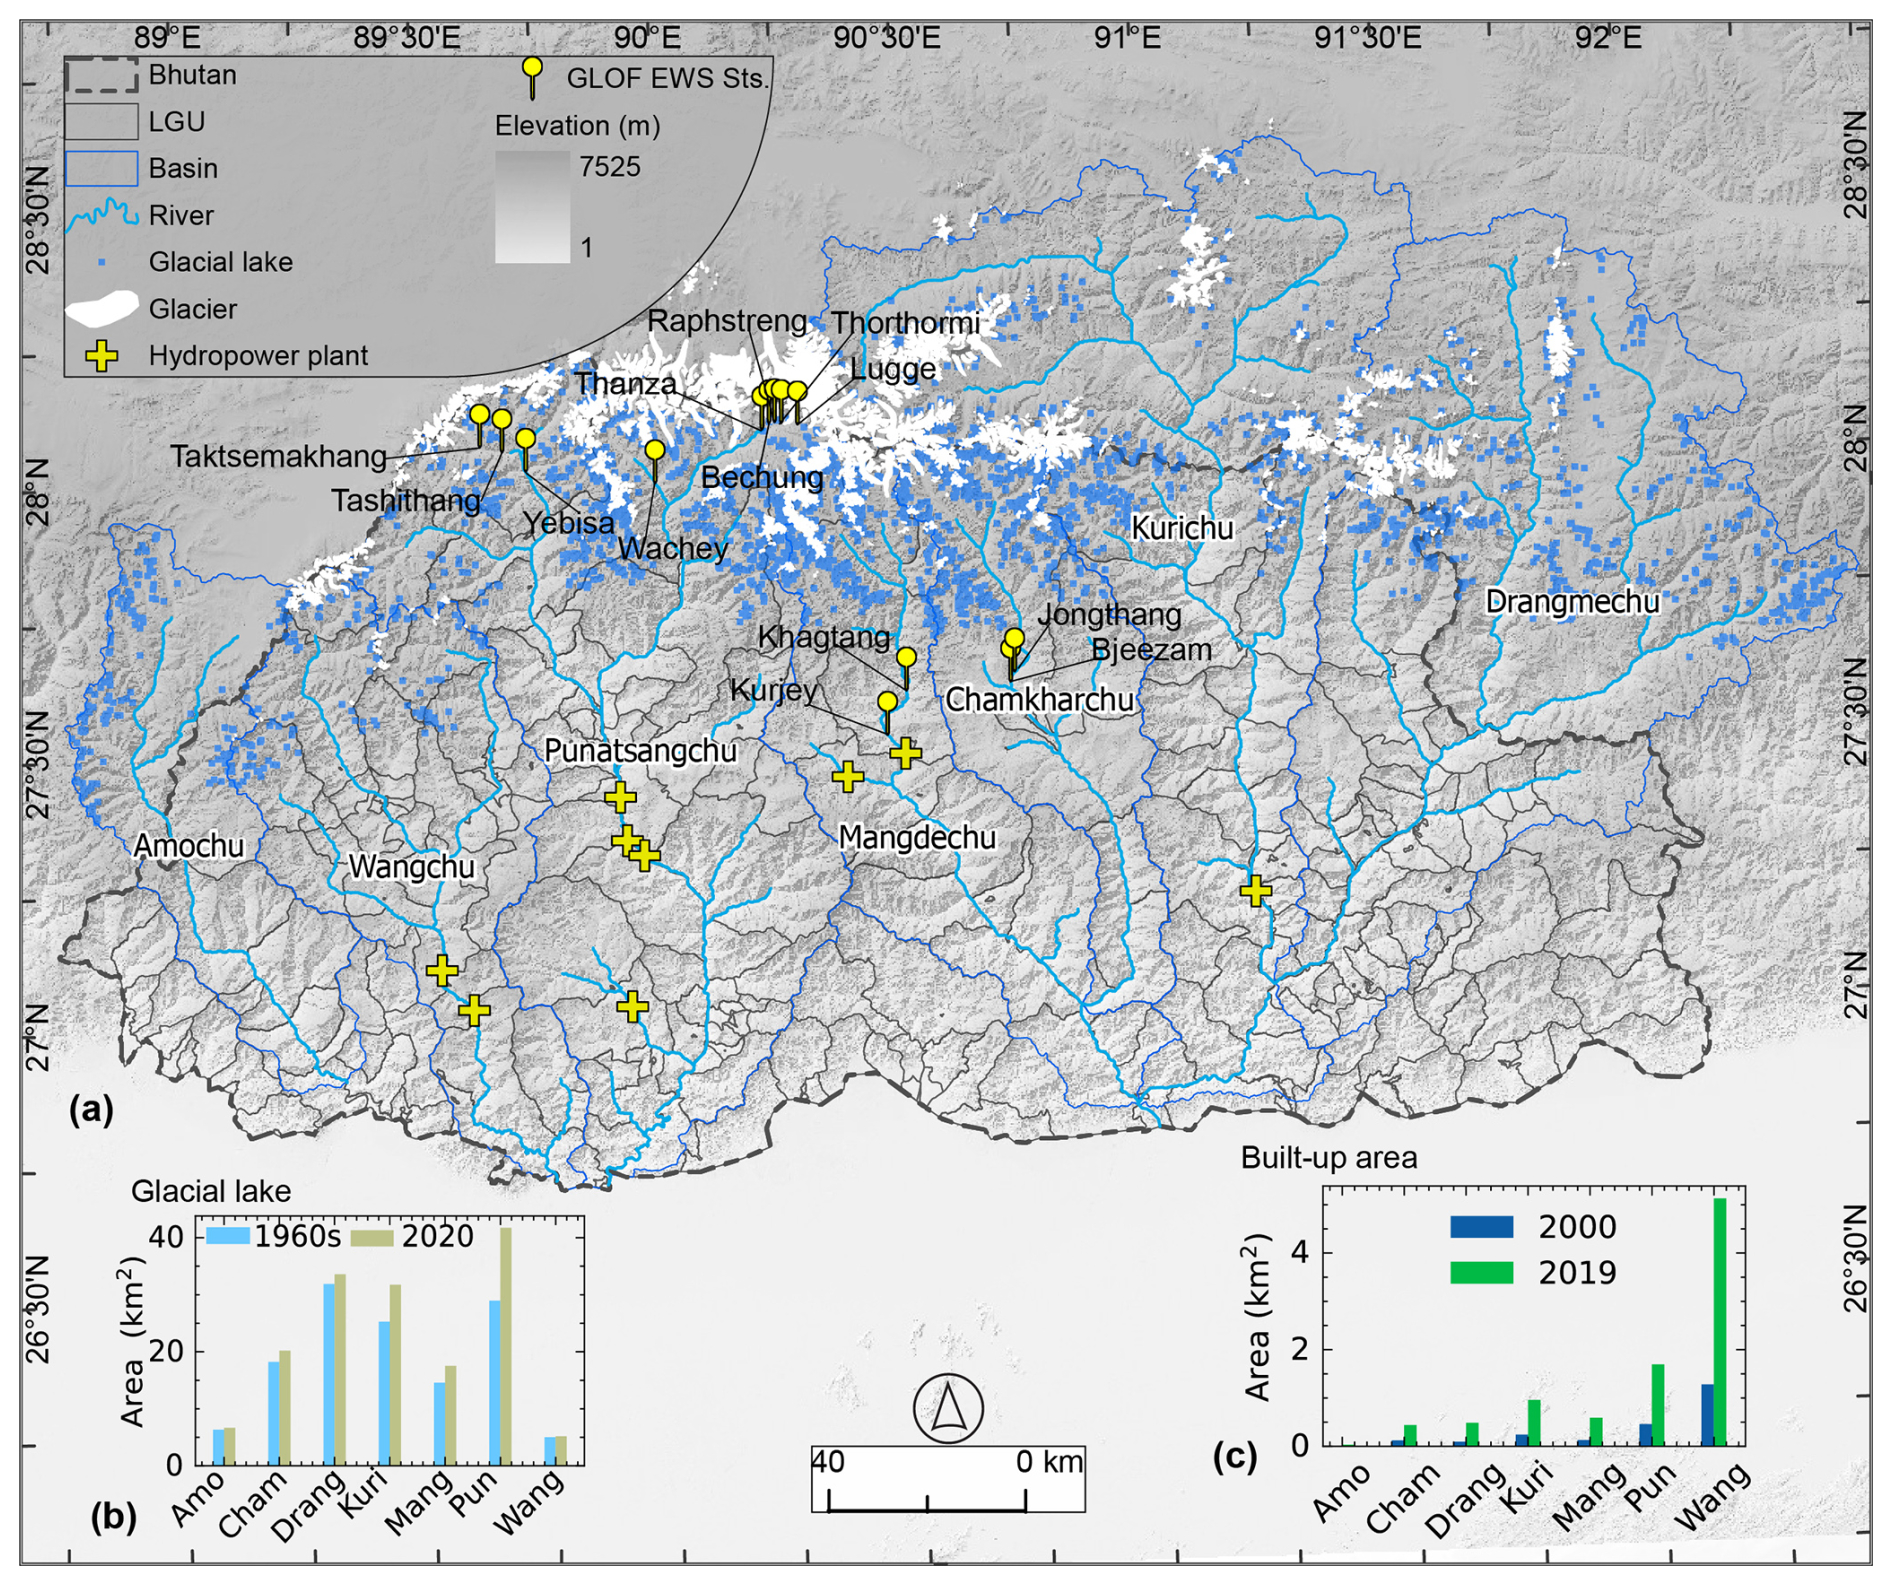
Figure 1The map (a) depicts Bhutan and the glaciated basins from which the rivers flow into inland Bhutan. It also shows the distribution of glacial lakes, glaciers, GLOF early warning monitoring stations (with the names of the places where they are located), and hydropower plants. The inset bar charts illustrate (b) the glacial lake area in the 1960s and 2020 (Rinzin et al., 2021) and (c) built-up area changes between 2000 and 2021 as per the land-use and land cover map of ICIMOD (Uddin et al., 2021). The basin names are presented in abbreviated form on x-tick labels for both bar charts.
The glaciers in the northern mountains feed seven major river systems in Bhutan, namely (West-East): Amochu, Wangchu, Punatsangchu, Mangdechu, Chamkharchu, Kurichu and Drangmechu (Fig. 1). The hydropower generated from these river systems accounts for about 40 % of Bhutan's national revenue, as the majority of energy is being exported to India, valued at USD 0.27 billion (Ministry of Economic Affairs, 2021). All seven currently operational hydropower plants and two nearly commissioned hydropower plants (Punatsangchu-I and Punatsangchu-II) are located along these glacier-fed rivers (Fig. 1). The agriculture sector, which is also heavily dependent on these river systems, employs about 60 % of the total population (786 385) (NSB, 2018). The built-up areas within the 1 km buffer of these glacier-fed rivers have increased by 200 % (2.3 to 9.3 km2) within ∼ 19 years from 2000 to 2019 (Fig. 1) (Uddin et al., 2021). Thus, infrastructure and crucial economic activity have grown rapidly in areas downstream of glacial lakes in recent decades in Bhutan, making it vital to quantify the risk posed by GLOFs in these basins.
3.1 GLOF modelling hydrodynamic parameters
We used the glacial lake inventory by Rinzin et al. (2021), which has been developed specifically for Bhutan, and offers greater robustness and accuracy for Bhutan compared to other datasets available at the Pan-HMA scale (Zhang et al., 2023b; Zheng et al., 2021b). Rinzin et al. (2021) mapped 2574 glacial lakes in 2020, located within 10 km of glacier termini and with a minimum lake area threshold of 0.003 km2. This dataset includes 85 transboundary glacial lakes, located in the Indian and Chinese territories of the Himalaya, whose drainage flows into the inland regions of Bhutan. Previous records indicate that GLOF originating from a relatively small lake (as small as 0.001 km2) can cause substantial damage in downstream communities, although such cases are rare (Sattar et al., 2025a). For instance, across the HMA region, the median area of glacial lakes with known pre-outburst extents is approximately 0.189 km2 (Shrestha et al., 2023). In Bhutan specifically, the smallest glacial lake with a documented outburst history has a present-day area of 0.0506 km2 (Rinzin et al., 2021; Komori et al., 2012). Including all glacial lakes for detailed hydraulic modelling would substantially increase the computational demands, whereas resorting to simplified GIS-based approaches (Allen et al., 2019; Zheng et al., 2021b) to cover all lakes would significantly compromise the robustness and accuracy of the resulting flood maps. Therefore, based on the trade-off between model complexity and result reliability, we focused on glacial lakes that (i) are at least 0.05 km2 in area and (ii) are located within 1 km of glacier termini. This approach ensures a balance between computational feasibility and the production of reliable flood maps, while still capturing a substantial number of high hazard lakes. Based on these criteria, we identified 278 glacial lakes in Bhutan for flood inundation mapping using hydrodynamic modelling (Fig. S1 in the Supplement).
where V is the volume in 106 m3, and A is the area in km2.
Accurate glacial lake volume data is crucial as one of the key determinants of modelled GLOF hydrodynamic characteristics such as flow depth and velocity. However, field-based bathymetric measurement for multiple lakes is costly and not currently possible for some glacial lakes due to their remote location. In the absence of in-situ bathymetric data to determine volume, we calculated the volume of each glacial lake using the area-volume scaling relationship (Eq. 1) proposed by Zhang et al. (2023a) based on the area of each glacial lake as mapped in 2020 (Rinzin et al., 2021) (see Table S1 in the Supplement). This area-volume scaling relationship (maintaining an error margin of ±15 % in the eastern Himalaya), based on recent bathymetric data from the Greater Himalayan region, including 13 representative lakes from Bhutan, is well-suited to approximate Bhutanese glacial lake volumes (Zhang et al., 2023a). However, the lake area is an essential parameter in our study, as we used it as a proxy for calculating volume and peak discharge as follows. Therefore, we examined the sensitivity of model output (depth-velocity) by varying lake size between 0.01 and 5 km2 (see the Supplement for details).
It is important to note that not all lakes drain entirely during a GLOF (Maurer et al., 2020; Nie et al., 2018; Zhang et al., 2024). The amount of water drained during a GLOF event depends on numerous factors, such as dam geometry and composition, lake bathymetry, and GLOF trigger – for example, seepage-induced versus landslide-triggered wave overtopping. While consideration of all these factors is crucial for a detailed impact assessment of a particular glacial lake, constraining the drained volume based on these detailed attributes is highly challenging for a study involving numerous glacial lakes. Previous data indicate that smaller lakes are more likely to drain completely during a GLOF event than larger lakes. Here, we used data from Zhang et al. (2023b) documenting the drainage volumes of 64 lakes in the HMA regions. Among these 64 lakes, the median percentage of drainage volume was 98 % for lakes with an area < 0.1 km2, 62 % for lakes with an area of 0.1 to 1 km2 and 33 % for lakes with an area > 1 km2. We used these observed drainage percentages as the basis to calculate the flood volume generated by each lake. For simplicity and recognising that these median drainage values lie within the uncertainty bounds of established area-volume scaling relationships, we adopted the following assumptions: 100 % drainage for lakes < 0.1 km2, 60 % drainage for lakes between 0.1 and 1 km2, and 30 % drainage for lakes > 1 km2. Subsequently, we used Evans's empirical Eq. (2) for moraine-dammed lakes to calculate the possible peak discharge of each lake (Evans, 1986). See Fig. S1 for the distribution of volume and peak flow calculated for each glacial lake in Bhutan (see Table S1).
Qmax is peak discharge, and V is the total volume of the lake calculated using Eq. (1).
3.2 HEC-RAS model set-up
Most GLOFs from moraine-dammed lakes start from dam breaching, which is frequently triggered by large mass movement(s) entering the lake from the surrounding hillslopes (Shrestha et al., 2023). However, conducting a dam breach simulation for each lake is challenging due to complexities and uncertainties in constraining the appropriate value for a large range of input parameters (U.S. Army Corps of Engineers et al., 2021). To simplify this, we conducted a flood simulation for each lake by using an input hydrograph as an upstream boundary condition. For each lake, we generated an input hydrograph by fitting the peak flow of each lake to a log-normal distribution curve with a standard deviation (σ) value of 0.75 and a mean of 0, adapting the approach used by earlier studies (Carr et al., 2024; Kropáček et al., 2015). For example, for lake1, the peak flow was 1110 m3 s−1; thus, we constructed a log-normally distributed hydrograph with a peak flow of 1110 m3 s−1 and gradually decreasing flow after this peak. With this assumption, we generated the hydrograph so that the flow rises to its peak rapidly and progressively decreases after attaining the peak, which is consistent with the hydrograph of many previous GLOF events (Maurer et al., 2020; Nie et al., 2020; Zheng et al., 2021a) (see Fig. S2 for a representative hydrograph). The flow duration of the hydrograph of each lake was subsequently adjusted to account for the complete drainage of the estimated drainage volume calculated for each lake. For example, for lake1, the required drainage volume was calculated at 1.036 × 10⁶ m3, and so, the flow duration for this lake was adjusted so that the cumulative flow through the GLOF event was equal to this volume (Table S1).
We used the ALOS Global Digital Surface Model (AW3D30) with ∼ 30 m ground resolution as a source of terrain information for the model setup (Japan Aerospace Exploration Agency, 2021). The DSM was hydrologically corrected by removing spurious depressions and burning in artificial flow paths in locations where deep gorges were incorrectly represented as floodplains (Rinzin et al., 2023). We chose AW3D30 because previous studies (Rinzin et al., 2025) have indicated that it has higher vertical and horizontal accuracy compared to other freely available DEMs for our study area with similar spatial resolution, such as SRTM GL1 (for example, Liu et al., 2019). We assigned an n value of 0.06, which has been used in GLOF modelling in Bhutan previously (Maurer et al., 2020). However, n is one of the most sensitive input parameters in hydraulic modelling. Therefore, we conducted sensitivity analysis by varying n between 0.040 and 0.070, the value range suggested by Chow (1959) for river channel beds with large boulders and cobbles, which characterise river channels in the Bhutan Himalaya (see the Supplement for details).
We created one HEC-RAS project for each major river basin so that a total of seven project files correspond to the seven glaciated basins in Bhutan. For each project, the model domain was established by creating a 1000 m buffer on either side of the centre line of the river originating from each lake. Within this model domain, a computational mesh with a grid resolution equal to the native resolution of AW3D30 (30 × 30 m) was generated. An upstream boundary condition for each lake was defined at the frontal terminus of each lake. We used the same downstream boundary condition for all lakes in the basin, which was defined at the furthest end at the international border between Bhutan and India (for example, Fig. S2). Unique flow data was created for each lake, where we imposed flow hydrographs as the upstream boundary condition for the respective lake and downstream boundary conditions defined by normal depth with an energy slope of 0.01 (U.S. Army Corps of Engineers et al., 2021). Finally, one unsteady flow analysis plan for each lake with corresponding unsteady flow data and boundary conditions was developed. For example, in the Phochu basin, which contains 67 glacial lakes considered for this study, one project file was established. This project file included a single model domain, a downstream boundary condition, 67 upstream boundary conditions and 67 flow datasets (Fig. S2).
We computed all the simulations using the full momentum shallow water equations since they better represent GLOF rheology (although with a clear water assumption) than the diffusion wave equation (Sattar et al., 2023, 2021). Considering that this study is mainly aimed at providing a GLOF risk overview in Bhutan, all other computational parameters were maintained at the default setting. At a mesh size of 30 m, each model was run stably with a computational time step of 3 s with a Courant number well below 2 (U.S. Army Corps of Engineers et al., 2021). The simulations were executed simultaneously across 15 computers at the Geospatial Laboratory in Newcastle University. We maintained 10 h of simulation time for each model setup, which took 2 to 4 h depending on the lake's size. The utput for each project plan was examined and any models exhibiting instability (e.g., a Courant number above 2 or failed before complete execution) were re-executed by adjusting the position of upstream boundary condition, changing the timesteps, or adding additional features like refinement regions within the 2D model domains to ensure stable model run and reliable results (U.S. Army Corps of Engineers et al., 2021).
3.3 GLOF impact and exposure
We collated the GLOF inundation boundary for each lake generated through the HEC-RAS modelling and calculated the area and length of each inundation. We mapped all buildings, roads, bridges, farmland, and hydropower plants within the GLOF inundation area to identify downstream elements at risk. OpenStreetMap (updated as of 30 April 2025) was used to map buildings, roads and bridges, which we manually verified using Google Earth high-resolution imagery. This resulted in updates of 41 km of missing roads, 152 buildings and 20 bridges using the Google Earth imagery within the flood inundation plain. The local government administrative unit (LGU) boundary map was then used to map these elements at risk in each LGU. As there is no population data with sufficient granularity to map exposed people directly, we therefore used exposed buildings as a proxy for exposed people, assuming that the distribution of people usually corresponds to the location of buildings. Specifically, we divided the total population of each LGU by its total number of buildings, using the 2017 Bhutan population and census data (NSB, 2018) and OpenStreetMap building data. The number of people exposed to GLOF in each LGU was then calculated by multiplying the population per building by the total number of exposed buildings. The ICIMOD's Landsat-based land-use and land cover map of 2023 was used to map farmland (Uddin, 2021) since it is of better quality at the HKH scale than other open-access land cover data, such as Esri Sentinel-2 land cover data (Karra et al., 2021). We considered buildings the most important downstream exposed element because they are the primary space where people live. Thus, we used exposed buildings to calculate the GLOF damage index (Fig. 2), and our risk assessment is biased towards loss of life based on building counts over, for example, asset monetary value where hydropower losses may dominate.
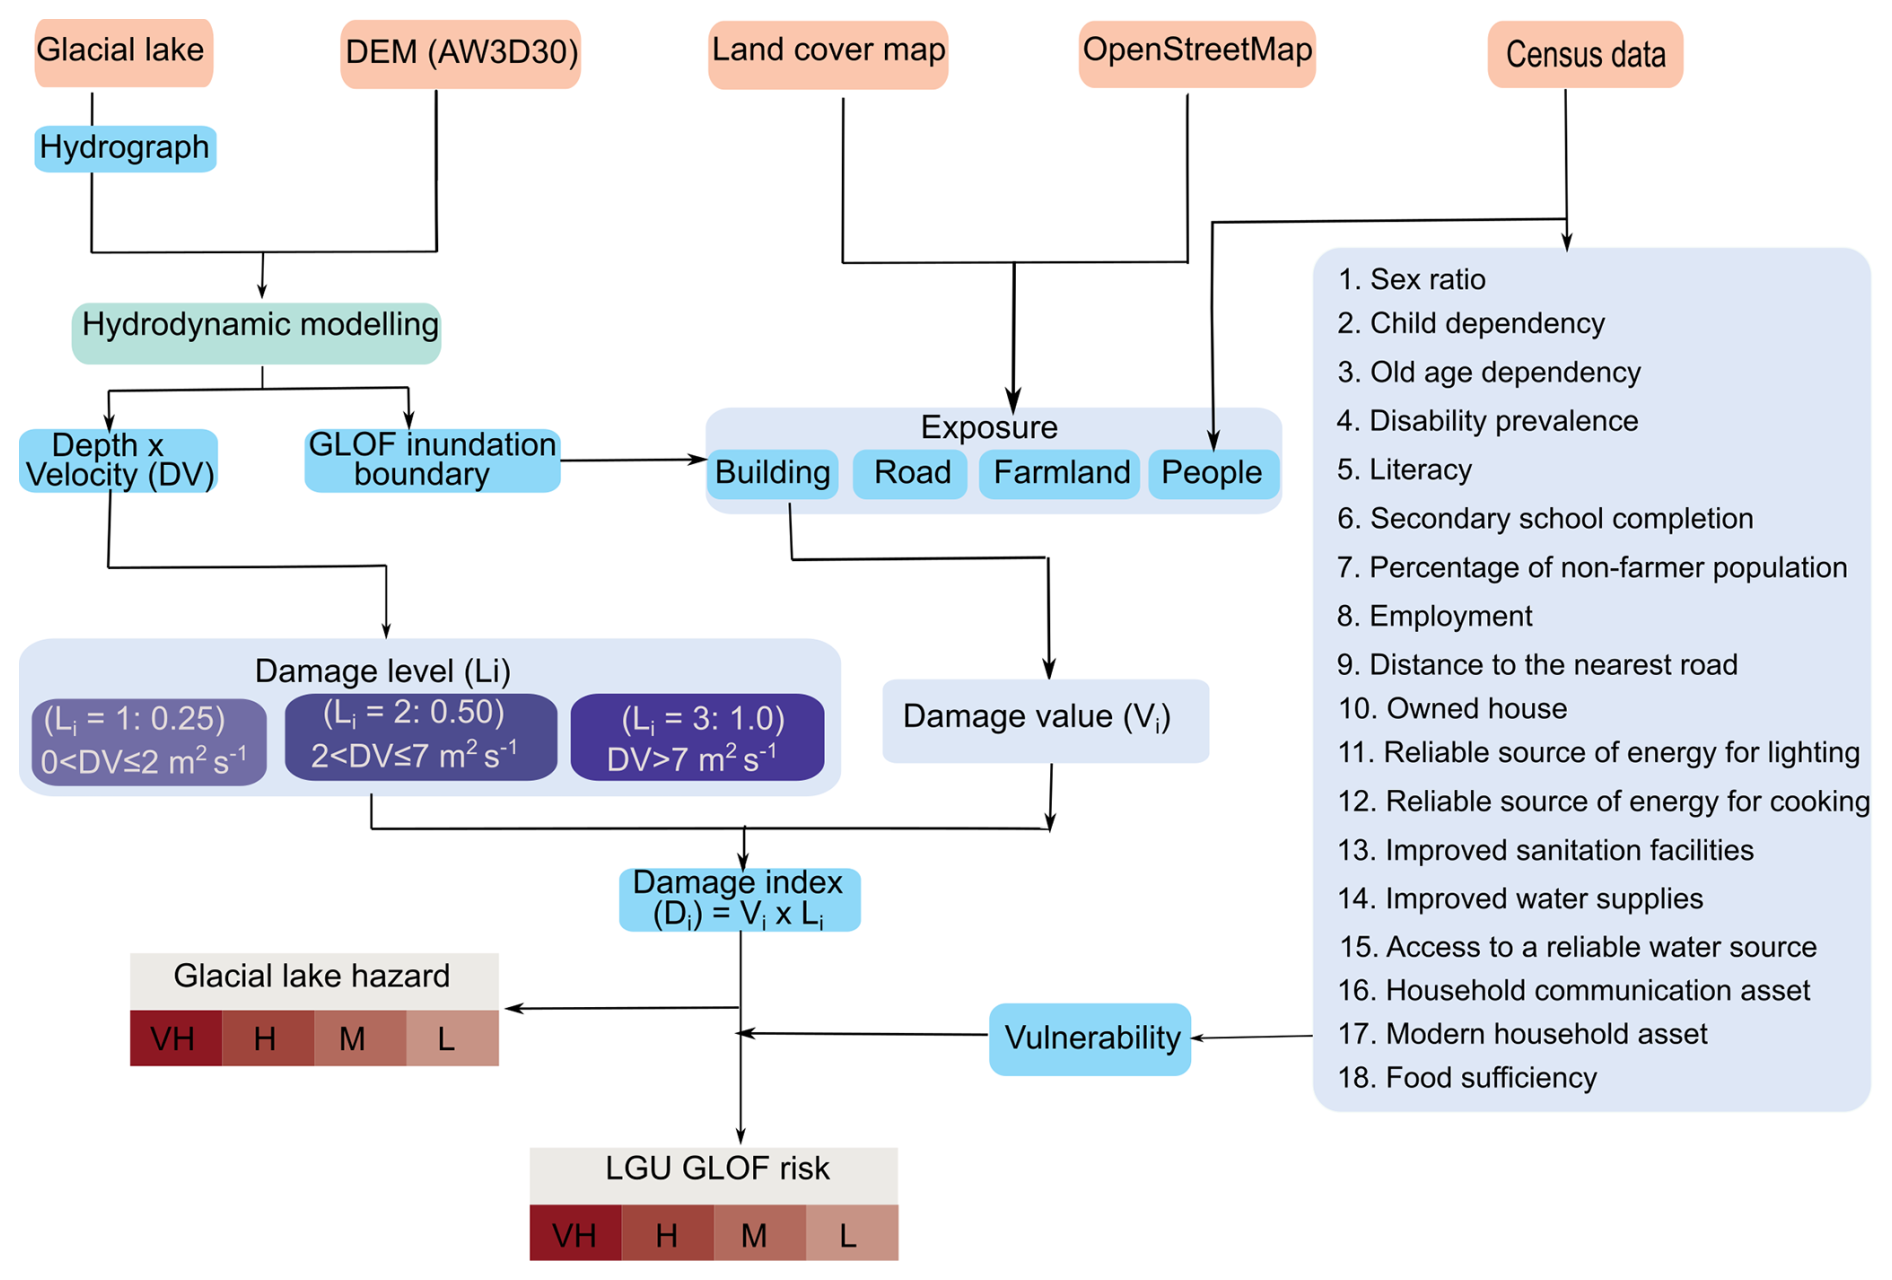
Figure 2Flow chart showing an overview of the methodology we used for assessing GLOF risk in this study. Here damage index (Di) for each exposed building was calculated as a function of damage value (Vi) and level (Li). The glacial lake hazard was calculated as the sum of the Di across the GLOF inundation boundary of the respective lake. The GLOF risk at the local administrative unit was calculated by multiplying the sum of Di across the respective LGU boundary by the vulnerability index. AW3D30 is the abbreviated form for Advanced Land Observing Satellite (ALOS) Global Digital Surface Model – 30 m.
3.4 GLOF hazard
In this study, we defined GLOF hazard based on the downstream damage (calculated here as damage index (Di)) resulting from each GLOF event (Fig. 2). The hazard in this study refers to damage/destruction to buildings that could result from future potential GLOF. We assume that any of our study glacial lakes has the potential to generate a GLOF in the future, and the resulting damage will determine the level of hazard that the glacial lake would pose to those downstream communities. The Di for each element (grid cell) resulting from any GLOF event was calculated as a function of the value of the exposed element (Vi) and the level of damage (Li) following the approach proposed by Petrucci (2012) (Eq. 2) (Fig. 2). Qualitative data such as construction type, occupancy type, and value of the content of the building inside the house are essential to obtain the appropriate value of structure and content. However, such qualitative attributes are incomplete in the existing OpenStreetMap and introduce substantial uncertainties when estimated using other open-access data. In this study, our focus is on providing a relative quantitative comparison of GLOF impacts across different communities instead of determining exact damage values resulting from each GLOF event. Therefore, we considered each building as one unit of Vi uniformly applied across the study domain (Fig. 2).
GLOFs with higher flow velocity can cause more damage to exposed elements than low flow velocity (Federal Emergency Management Agency, 2004). Therefore, we calculated the Li associated with each GLOF event as a function of both velocity and depth, which was accomplished by calculating the depth × velocity (DV) from the HEC-RAS output layer. The level of damage a building suffers also depends on its structural integrity, which in turn is a function of the construction type of the building. The 2017 Bhutan Population and Housing Census reported that the construction type of most Bhutanese buildings is masonry (NSB, 2018). Clausen and Clark (1990) have categorised three damage levels to masonry buildings based on DV as follows: inundation (DV ≤ 2 m2 s−1), partial damage (2 m2 s−1 < DV ≤ 7 m2 s−1) and complete damage (DV > 7 m2 s−1). Accordingly, we used these DV value ranges to classify three levels of damage and assigned Li following Petrucci (2012) as follows: Level 1 (Li = 0.25), Level 2 (Li = 0.5), and Level 3 (Li = 1) (Fig. 2).
Finally, the sum of Di for all damaged buildings located within the GLOF inundation boundary of each lake was summed to derive a hazard value (Hg) associated with each lake (Eq. 3). The Hg was then normalised between 0 and 1, and lakes were ranked based on this metric. Additionally, for the classification purpose, using normalised Hg, we categorised glacial lakes into four hazard levels: very high, high, moderate, and low hazard using the Natural Jenks classification system in ArcGIS.
where Di is the damage index for exposed element i, Vi is the value of each downstream element, and Li is the damage level for each element. Hg is the aggregated hazard index for geographical unit g (LGU or inundation boundary of the respective lake). Rg is the risk index for geographical unit g (LGU). Vlg is the vulnerability of the geographical unit g.
3.5 Downstream GLOF risk
We conducted GLOF risk assessment (Rg) for downstream settlements at various geographical scales: 20 districts and 274 local government administrative units (LGUs) (including 205 gewogs [sub-district blocks] and 69 towns). We aggregated the Di of each damage grid located within the respective LGU boundary to calculate Hg for each LGU using Eq. (3). In cases where downstream elements were affected by GLOFs originating from multiple lakes, the combined Hg from each contributing lake was considered in the analysis to account for their exposure to multiple possible GLOFs (Fig. 2).
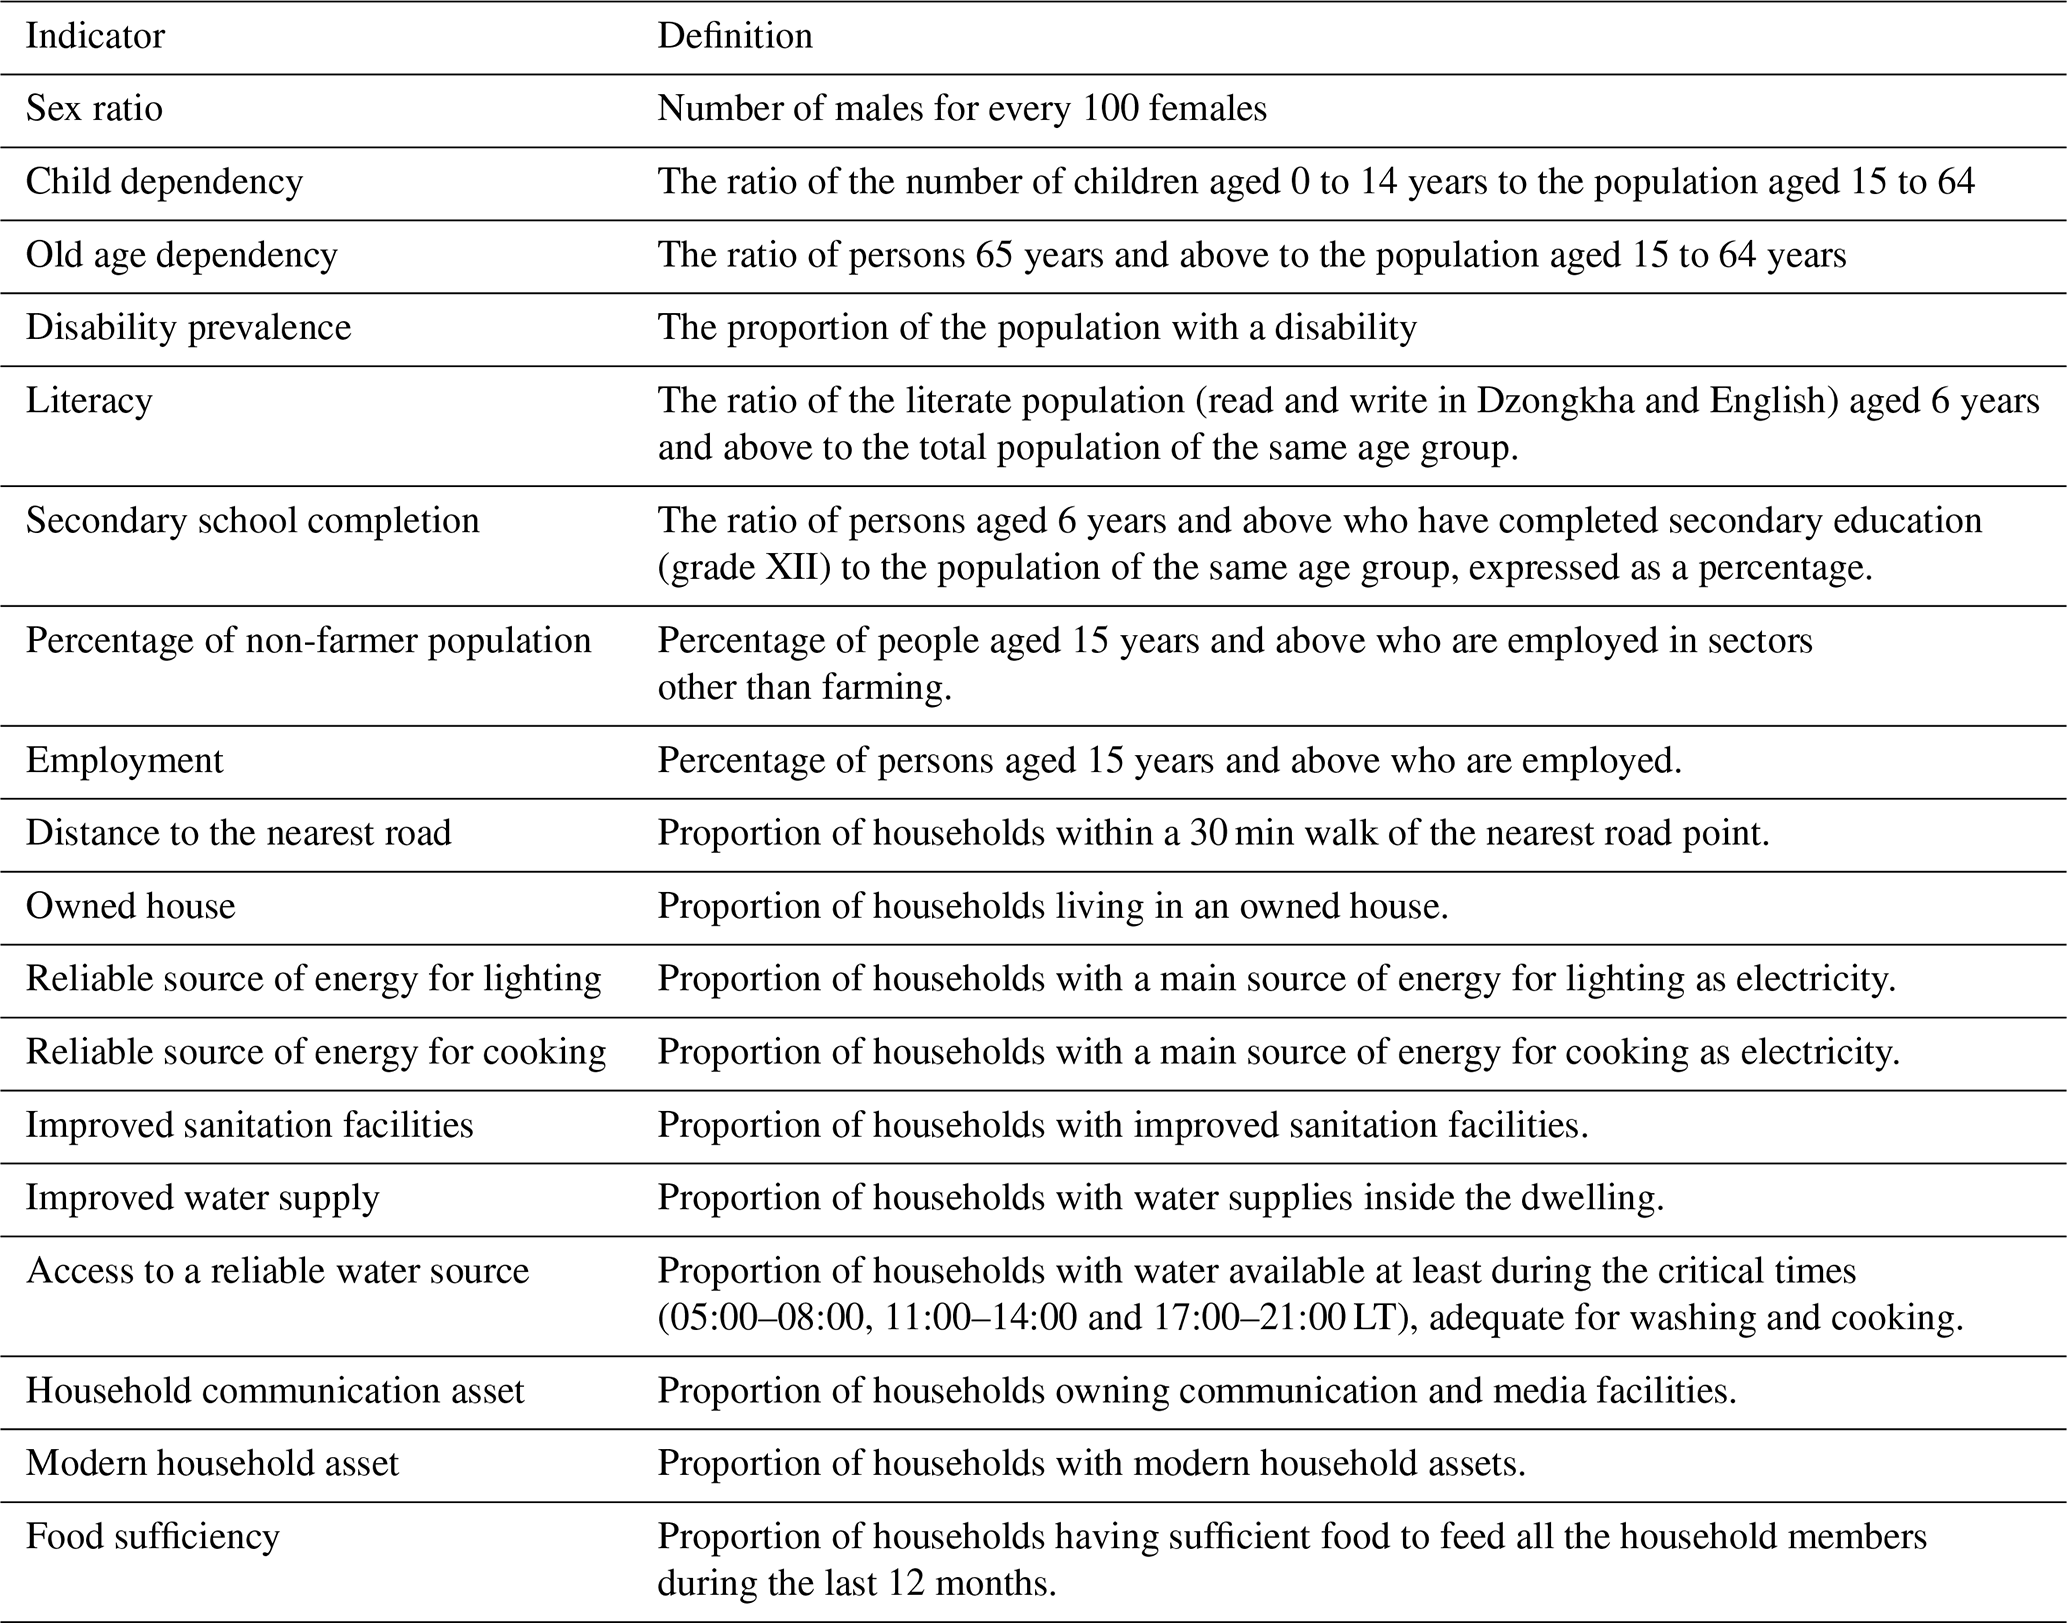
As well as the magnitude of GLOF and the presence of downstream elements along the flow path, downstream GLOF risk is also determined by the community's capacity to prepare, respond and recover from a GLOF event (Cutter et al., 2008; Zhou et al., 2009). Lack of this capacity, referred to as vulnerability, is influenced by wide-ranging socio-economic factors, including but not limited to the standard of living and the age and gender composition of the community (Cutter and Finch, 2008). Across the world, developed countries were found to be more disaster resilient than developing countries, while disaster-related death and damage have largely spiked in low-income countries (Rahmani et al., 2022). However, identifying specific socio-economic variables that are most relevant to GLOF damage remains a significant challenge, particularly because social data from past events are either unknown or, at times, overlooked. Past studies have used variables such as gross domestic product, population density (Carrivick and Tweed, 2016), human development index, corruption index and social vulnerability index at the national scale (Taylor et al., 2023a). While such data represent a broad overview of the country's socio-economic condition and thus vulnerability to disaster, they do not represent the regional and community-level disparity within the country that influences their ability to respond and recover from the disaster. To address this, drawing upon our local understanding and following earlier studies (Allen et al., 2016; Rinzin et al., 2023), we calculated the relative vulnerability index (Vlg) using a total of 18 socio-economic indicators from the 2017 Bhutan population and housing census (NSB, 2018) (Table 1). This census data, which is updated every 10 years, represents the most comprehensive and detailed dataset currently available, offering spatial granularity at the individual LGU level. These indicators are essential for evaluating a community's preparedness and response capacity to disasters from hazards like GLOF (Cutter and Finch, 2008). For example, in Bhutan's traditionally gendered societal structure, men often assume more prominent roles in disaster response efforts. The Vli for each LGU was calculated as the normalised value across these 18 socio-economic indicators (Fig. 2). The definitions and approaches used for calculating each indicator are summarised in Table 1. Assuming that the LGUs with higher Vli are less able to respond to and recover from a future GLOF, Hg for each LGU was multiplied by Vlg to calculated associated GLOF risk (Rg) (Eq. 4).
Table 1Socio-economic indicators are used to calculate LGUs' vulnerability to the future GLOF. The indicators were extracted from Bhutan's 2017 population and housing census. Details on how data for each indicator are collected are provided in the NSB (2018). The calculated values were inverted so that they contribute positively to vulnerability for the indicators other than child dependency, old age dependency, and disability prevalence rate.
3.6 GLOF arrival time and GLOF early warning system
Building damage from a GLOF is a function of hydrodynamic factors such as depth and velocity, and the structural integrity of the buildings. On the other hand, human casualties and injuries also depend on the warning/response time, making it essential to consider flood arrival time in GLOF risk assessment. Thus, GLOF arrival time needs to be considered separately from the Di we computed earlier. Accordingly, we determined the flow arrival time of the earliest arriving GLOF for each LGU to determine the amount of response time the people living in the particular LGU will get in case of a future GLOF.
The NCHM, Bhutan, monitors several lakes in Bhutan identified as high hazard (NCHM, 2019). Currently, they have a GLOF early warning system covering Punatsangchu, Mangdechu and Chamkharchu basins, which consists of 13 monitoring stations (Fig. 1). We utilised monitoring station location data from NCHM to evaluate the relationship between Bhutan's existing early warning system, modelled GLOF scenarios originating from these glacial lakes and affected downstream communities. To achieve this, we first overlaid all monitoring stations in Bhutan in a GIS and counted how many of our catalogue of possible GLOFs in the region are covered by the existing early warning system based on their hydrological relationship (NCHM, 2021). We assumed that if a GLOF flow intersects any of the existing EWS monitoring stations, then the event would be monitored by the existing EWS in Bhutan. Similarly, if an LGU is affected by a GLOF that passes through one or more of these stations, the LGU is regarded as being monitored by the existing EWS.
4.1 Flood volume and peak discharge
Of the 278 glacial lakes selected for GLOF modelling and downstream risk assessment in this study, the majority (n = 91) of them were in the Punatsangchu basin, followed by the Kurichu basin (n = 64). By contrast, Wangchu (n = 2) and Amochu (n = 5) had the minimum number of lakes meeting our selection criteria (Fig. 3). The volumes of the selected glacial lakes ranged between 0.64 × 10⁶ and 344.1 × 10⁶ m3, with a median volume of 2 × 10⁶ m3. Based on these total volumes, minimum, median and maximum drainage volumes were 0.64 × 10⁶, 1.4 × 10⁶, and 103.2 × 10⁶ m3, respectively. Furthermore, the empirical-based estimation showed that these glacial lakes can produce GLOFs with peak discharges of up to 24 085 m3 s−1, while the median peak discharge is 1552 m3 s−1 (Fig. S3).
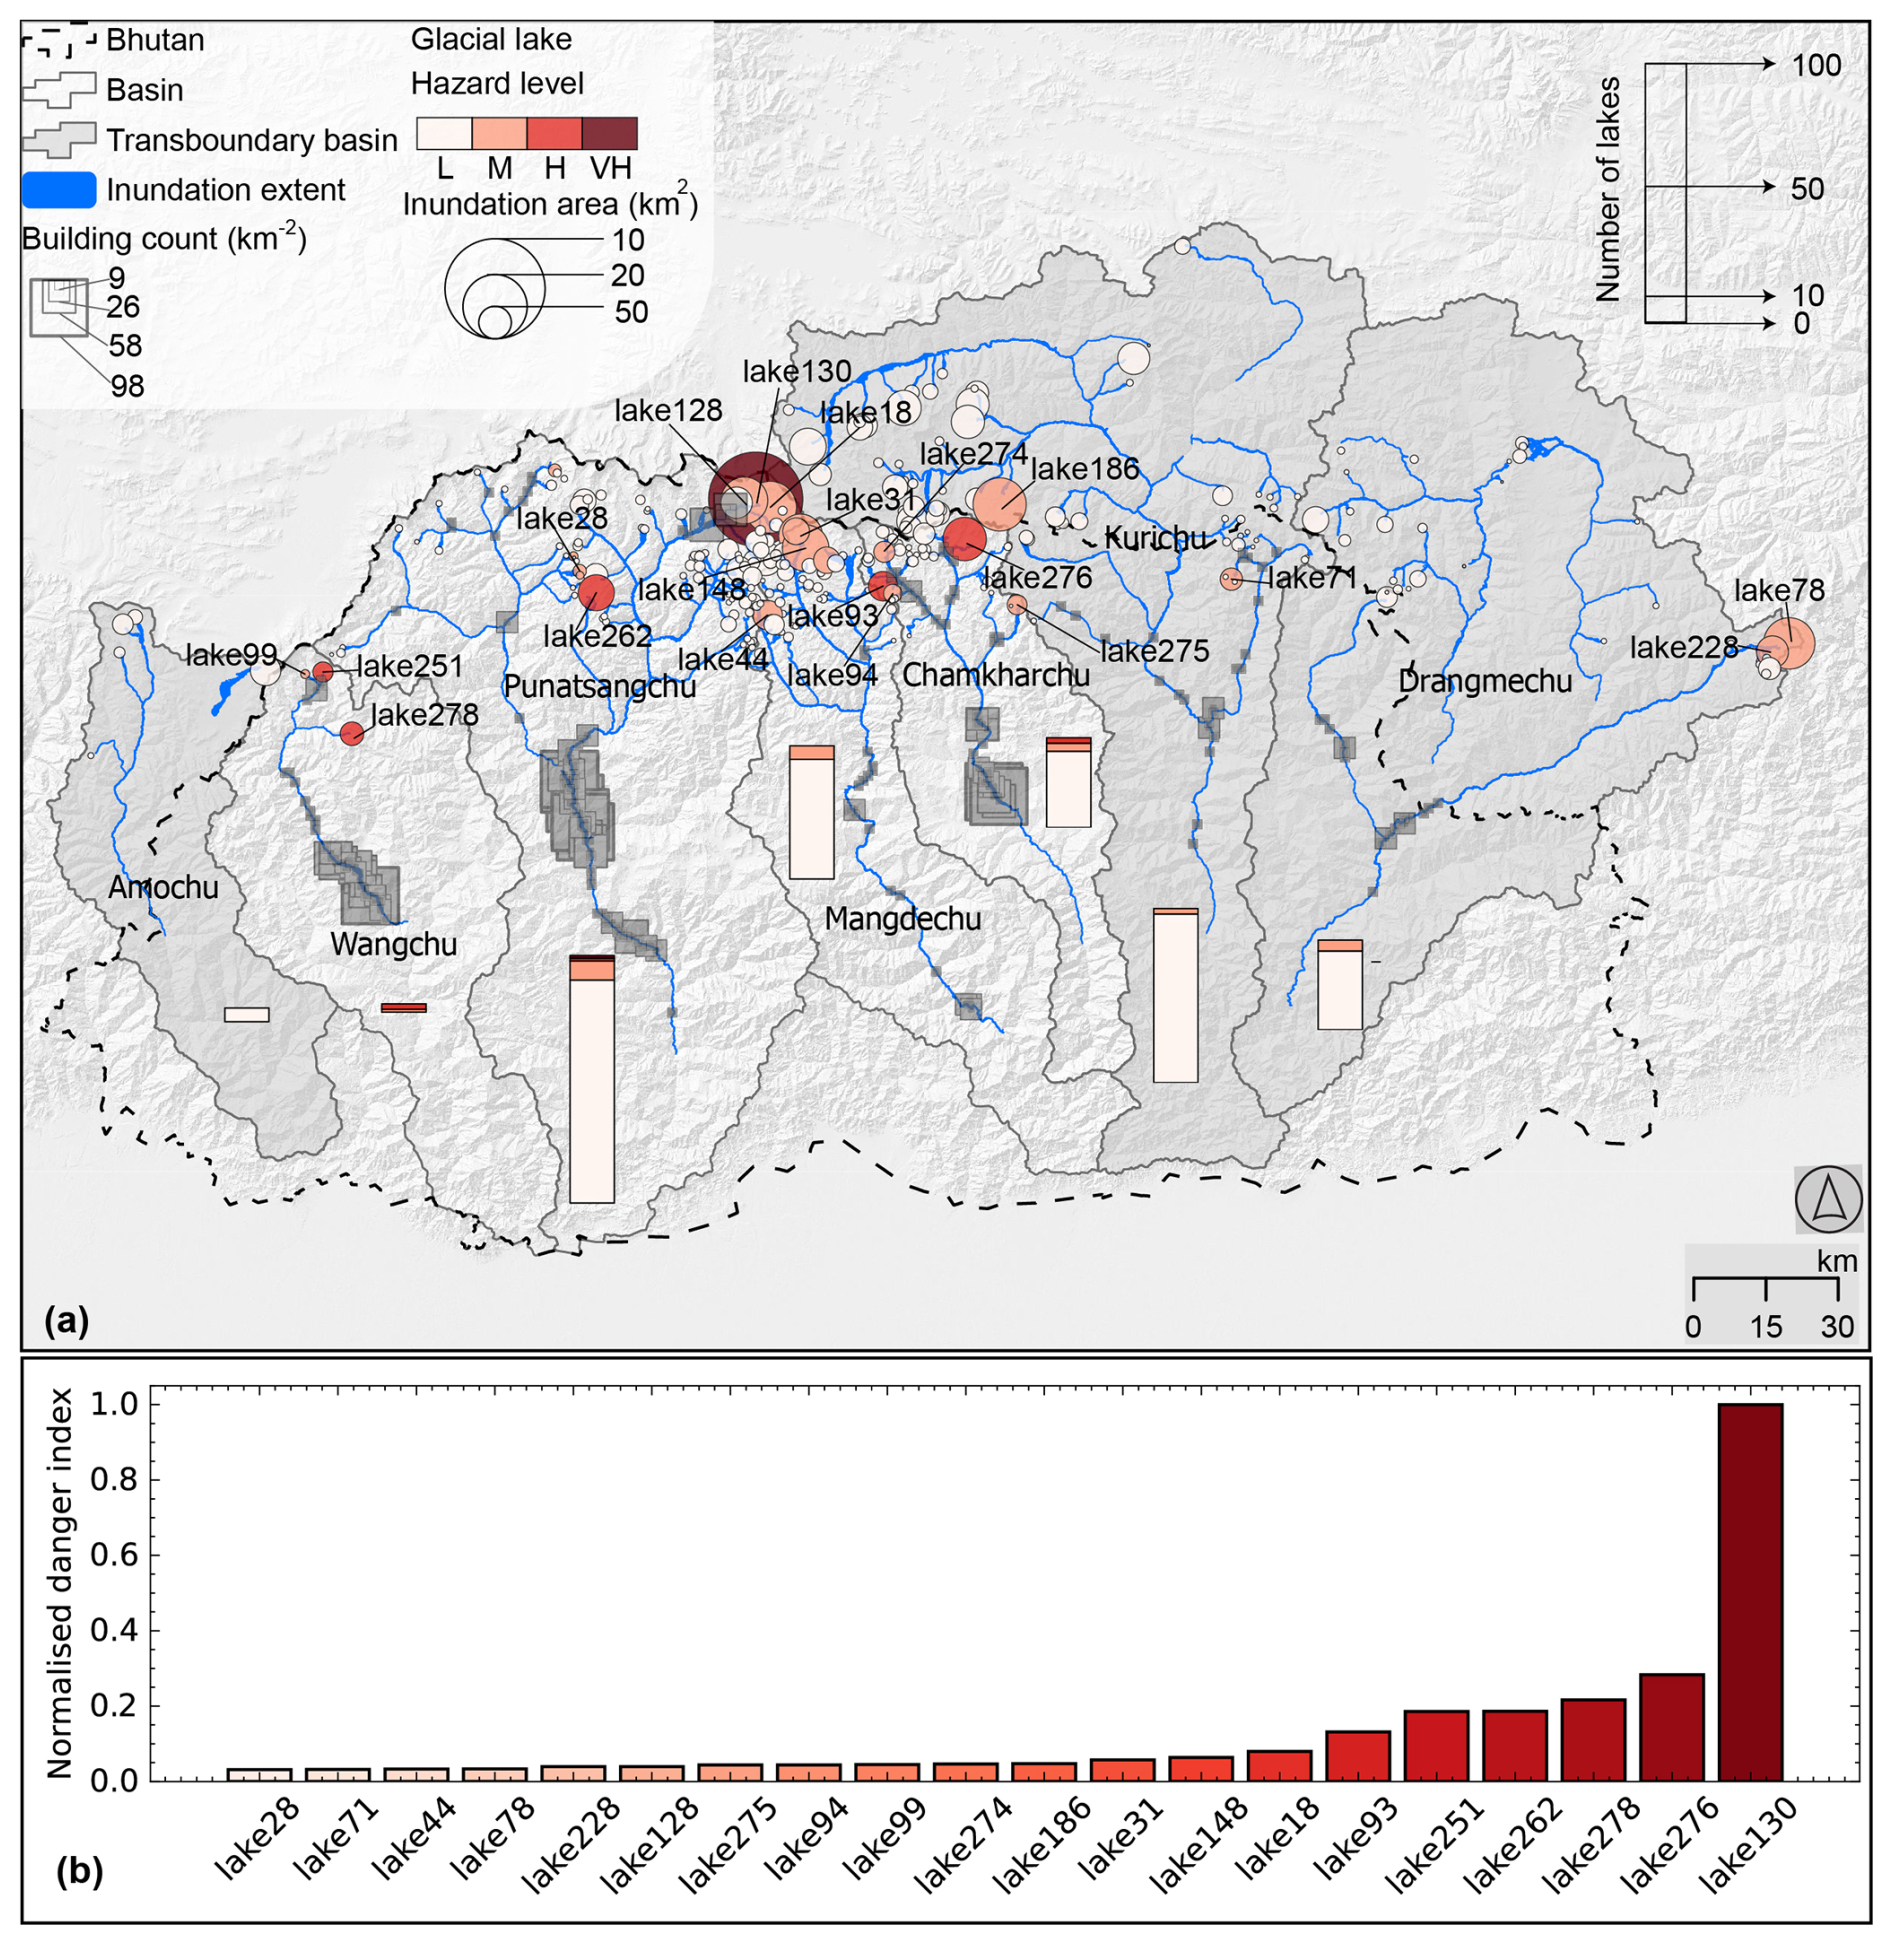
Figure 3Distribution of glacial lakes of various hazard levels. The color of the bubble in map (a) shows the distribution of glacial lakes with associated GLOF hazard levels across the eight glaciated basins in Bhutan: very high (VH), high (H), moderate (M) and low hazards. The size of the bubble corresponds to the area of GLOF inundation corresponding to each lake. The bar charts within the map show the number of glacial lakes (where the height of the bar corresponds to the number of lakes in each basin, referenced to the inset bar) with various hazard levels in each basin. The size of box along the flood path shows the number of buildings per km2. The (b) bar chart shows the hazard index (normalised between 0 and 1) associated with the top 20 lakes arranged in ascending order (left to right). The lake ID on the x-tick label correspond to the ID on the map.
4.2 GLOF impact and exposure
Our study revealed that GLOFs from individual glacial lakes can travel as far as 167 km downstream and can inundate a maximum area of 30 km2. The modelled GLOFs exhibit a median travel distance of 40 km and an inundation area of 2.9 km2 (Fig. S3). Collectively, about 2 % (781 km2) of Bhutan's total land area is exposed to GLOF. The mean flow depth and velocity were 3.3 m and 3.4 m s−1, respectively (Fig. S4). The shortest arrival time to the nearest building was 8 min, and the longest was 10 h (Fig. S3). As a result, a total of 11 322 people, 2613 buildings, 270 km of road, 402 bridges, 19 km2 of farmland and 4 hydropower dams are exposed to GLOFs in Bhutan (Table 2). Of the total modelled GLOF events, 71 % (n = 197) affect roads, 42 % (n = 116) affect buildings, and 28 % (n = 77) affect farmland. A GLOF from Thorthormi Tsho could impact 1119 buildings, 72 km of roads, and 4.2 km2 of farmland, making it the most consequential event reaching elements at risk. It is followed by lake278, located in the Wangchu basin and Chubdha Tsho in the Chamkharchu basin, both of which are classified as high hazard glacial lakes by this study (Table S1).
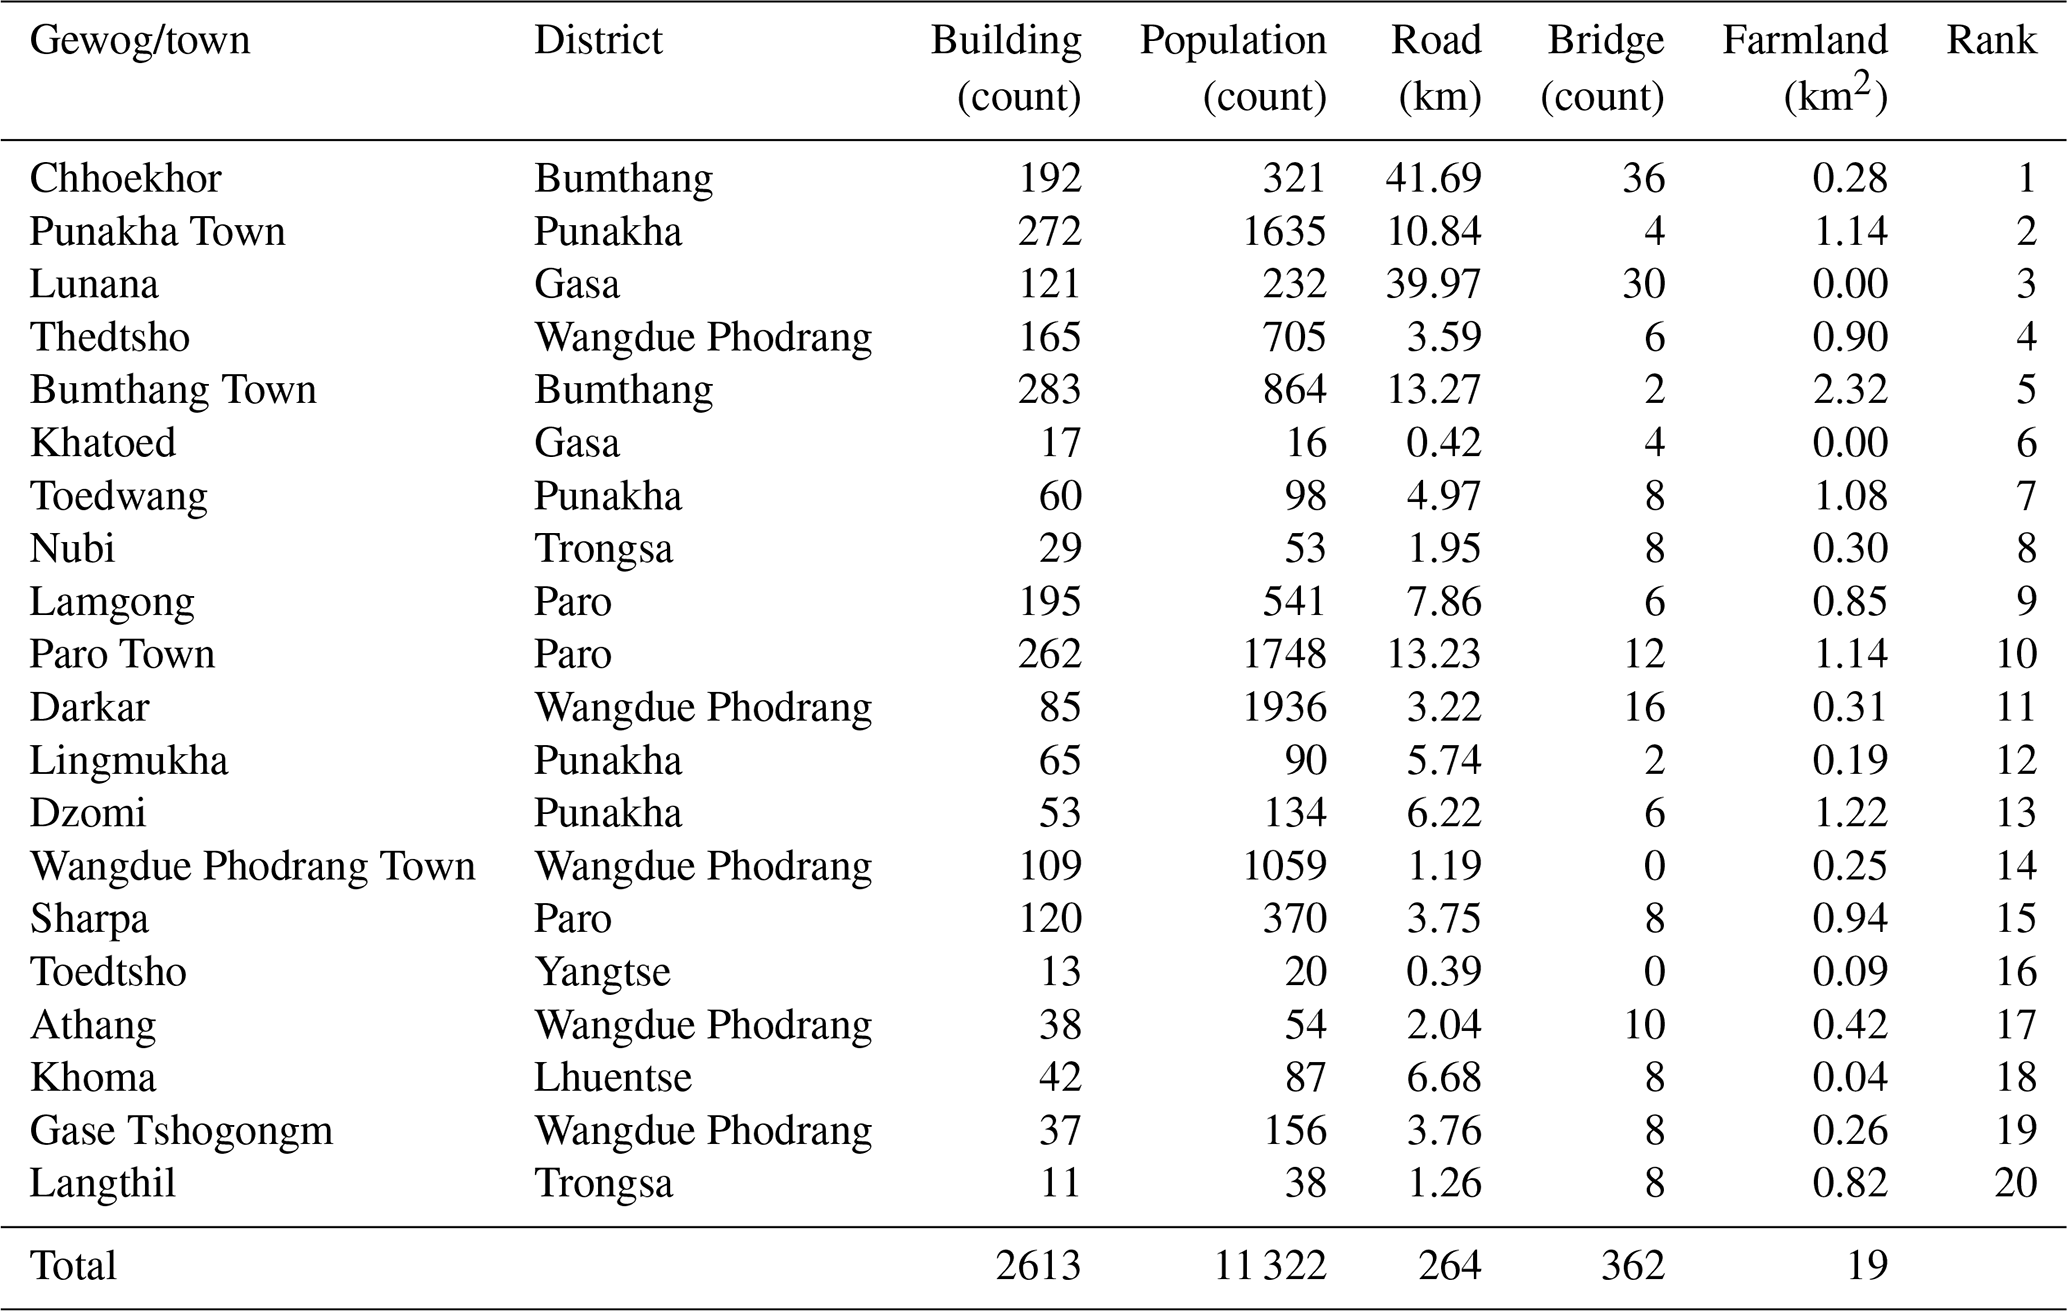
Table 2GLOF exposed elements: people, buildings, roads, bridges and farmland distributed across the top 20 GLOF risk LGUs. The total value in the last row represents the total exposed elements across all LGUs in Bhutan.
Out of 278 glacial lakes selected for flood mapping for this study, 85 (30.6 %) are within catchments that cross the boundaries of India and China and drain into Bhutan inland. GLOFs from these transboundary lakes also affect a substantial number of downstream elements located in Bhutan, including 20 buildings, 0.6 km2 of farmland, and 2 km of roads in Bhutan. All these exposed elements are situated within the Kurichu and Drangmechu basins.
The exposed elements are distributed across 17 districts and 88 local government administrative units (LGUs). Bumthang, Paro, Punakha, Wangdue Phodrang and Gasa districts are most affected by the GLOFs. For example, Paro itself has 673 GLOF exposed buildings, 32 km of road and 64 bridges (Table 2). Among the LGUs, the maximum number of exposed buildings is in Bumthang town (n = 283), followed by Punakha town (n = 272) and Paro town (n = 262). The greatest road (roads, footpaths, tracks) inundation occurs in Chhoekhor, followed by Lunana and Saephu, while most farmland is impacted in LGUs such as Bumthang town (2.3 km2), Dzomi Gewog (1.2 km2) and Paro town (1.1 km2) (Table S2).
4.3 GLOF hazards
We defined the GLOF hazard based on the total damage associated with each lake. Of the total lakes studied here (278), 164 had zero hazard index as the GLOF from these lakes does not impact any buildings. Among other lakes, with the highest Dg, Thorthormi Tsho in the Punatsangchu basin emerged as the very high PDGL in Bhutan (Fig. 3). Five other lakes are identified as high hazard, which are distributed across the Wangchu (2), Chamkharchu (2), and Punatsangchu (1) basins. Twenty-two of the glacial lakes were in the moderate hazard category: seven in Punatsangchu, five in Mangechu basin, four in Drangmechu basin, three in Chamkharchu, two in Kurichu and one in Wangchu basins (Fig. 3). The remaining (250) were classified as low hazard. None of the high or very high hazard glacial lakes were located within the Chinese and Indian sides of the basins, which drain into Bhutan (Fig. 3).
4.4 Downstream GLOF risk
In this section, we present the GLOF risk ranking and level associated with downstream communities, encompassing 20 districts and 274 LGUs. Punakha is identified as the district that would suffer from the highest GLOF damage in the future, followed by Bumthang and Wangdue Phodrang districts.
Five of the LGUs were classified as having very high GLOF risk, including: Chhoekhor, Punakha town, Lunana, Thedtsho, and Bumthang town (Fig. 4). Further, eight others were associated with high GLOF risk. Likewise, 18 LGUs were associated with moderate GLOF risk, while the rest were identified as low risk LGUs (Fig. 4).
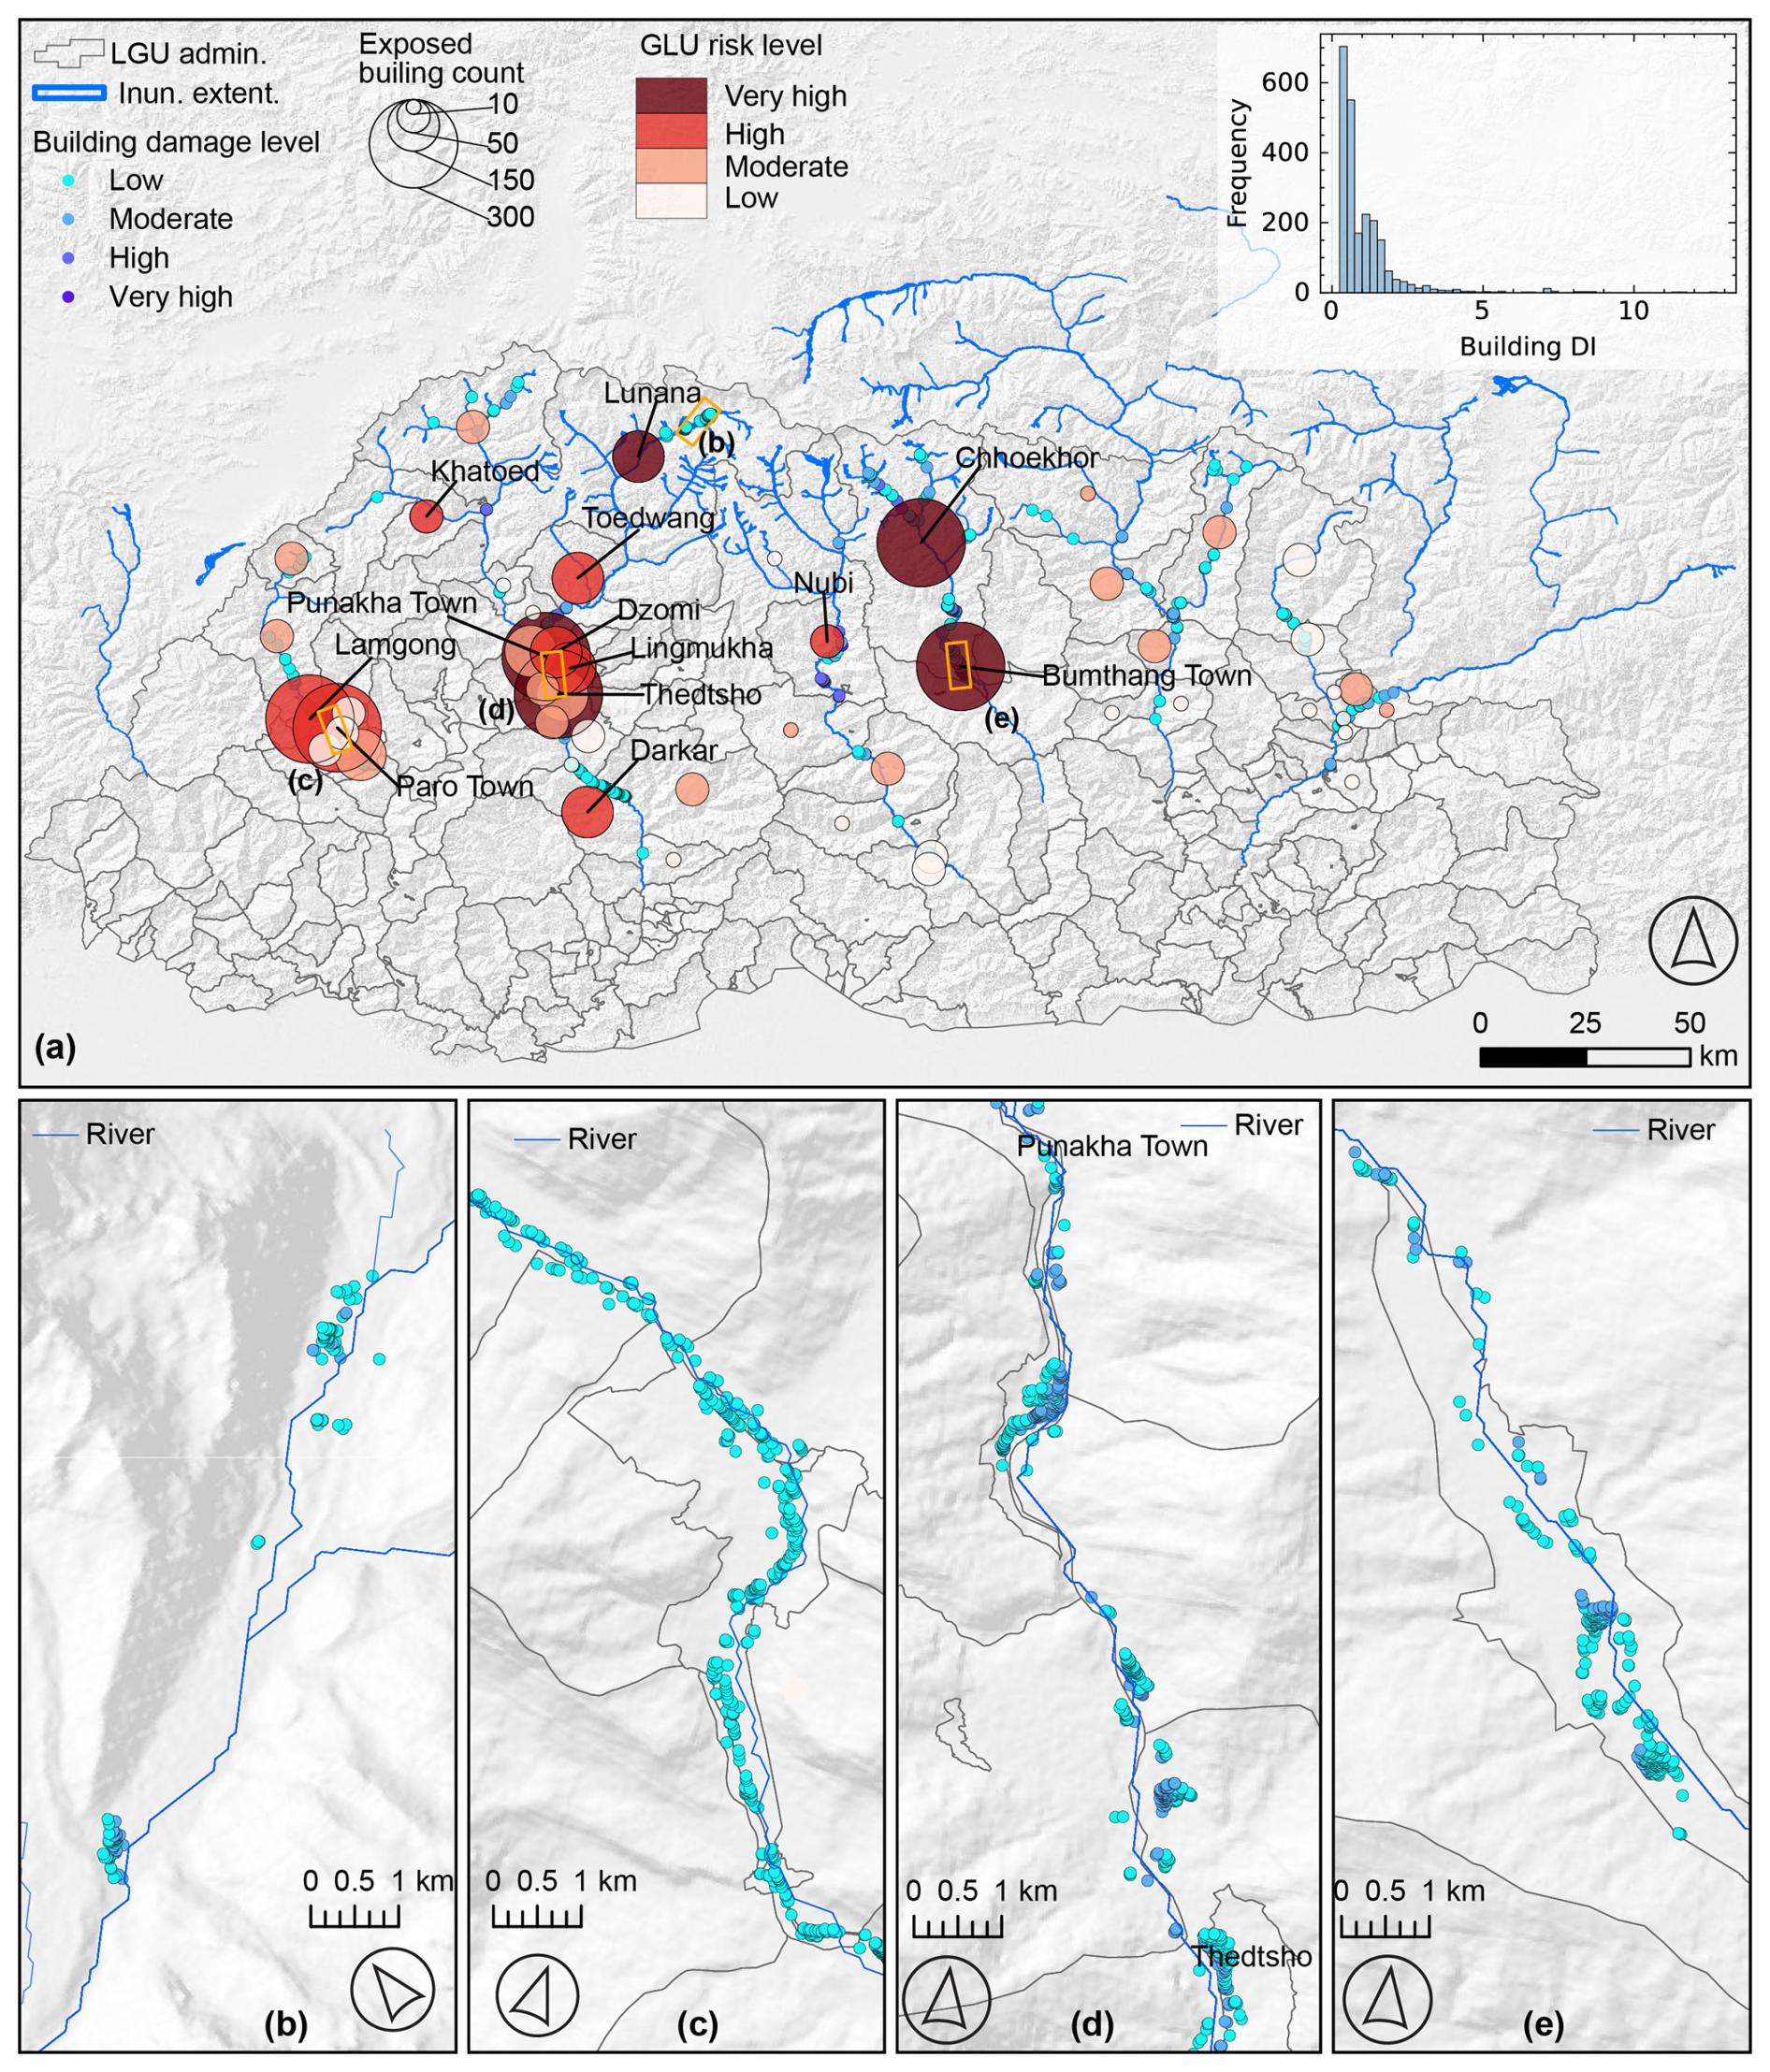
Figure 4Downstream GLOF risk level distribution. The (a) map shows distribution of local administrative unit LGUs with various GLOF risk level (indicated by the color of the bubble) and number of exposed buildings (depicted by the size of the bubble) in Bhutan. The inset bar graph in the map shows distribution of damage index (Di) across exposed buildings. The lower panels (b)–(e) are the zoomed-in maps from panel (a), which show the damage level associated with individual buildings.
4.5 Flow arrival time
We also ranked the LGUs based on the flow arrival time of the GLOF scenario that would impact on the first buildings in the LGU. Results showed that, for the seven gewogs including Soe, Khoma, Chhoekhor, Lunana, Laya, Saephu, and Kurtoed, the fastest GLOF can impact some of their buildings within 30 min. Some buildings in Khatoed, Tsento, Toedwang and Nubi could be affected within 1 h. Nine gewogs can be affected within 2 to 4 h, another nine within 4–6 h, while the fastest GLOF could take more than 6 h to affect buildings in other LGUs (Fig. 5).
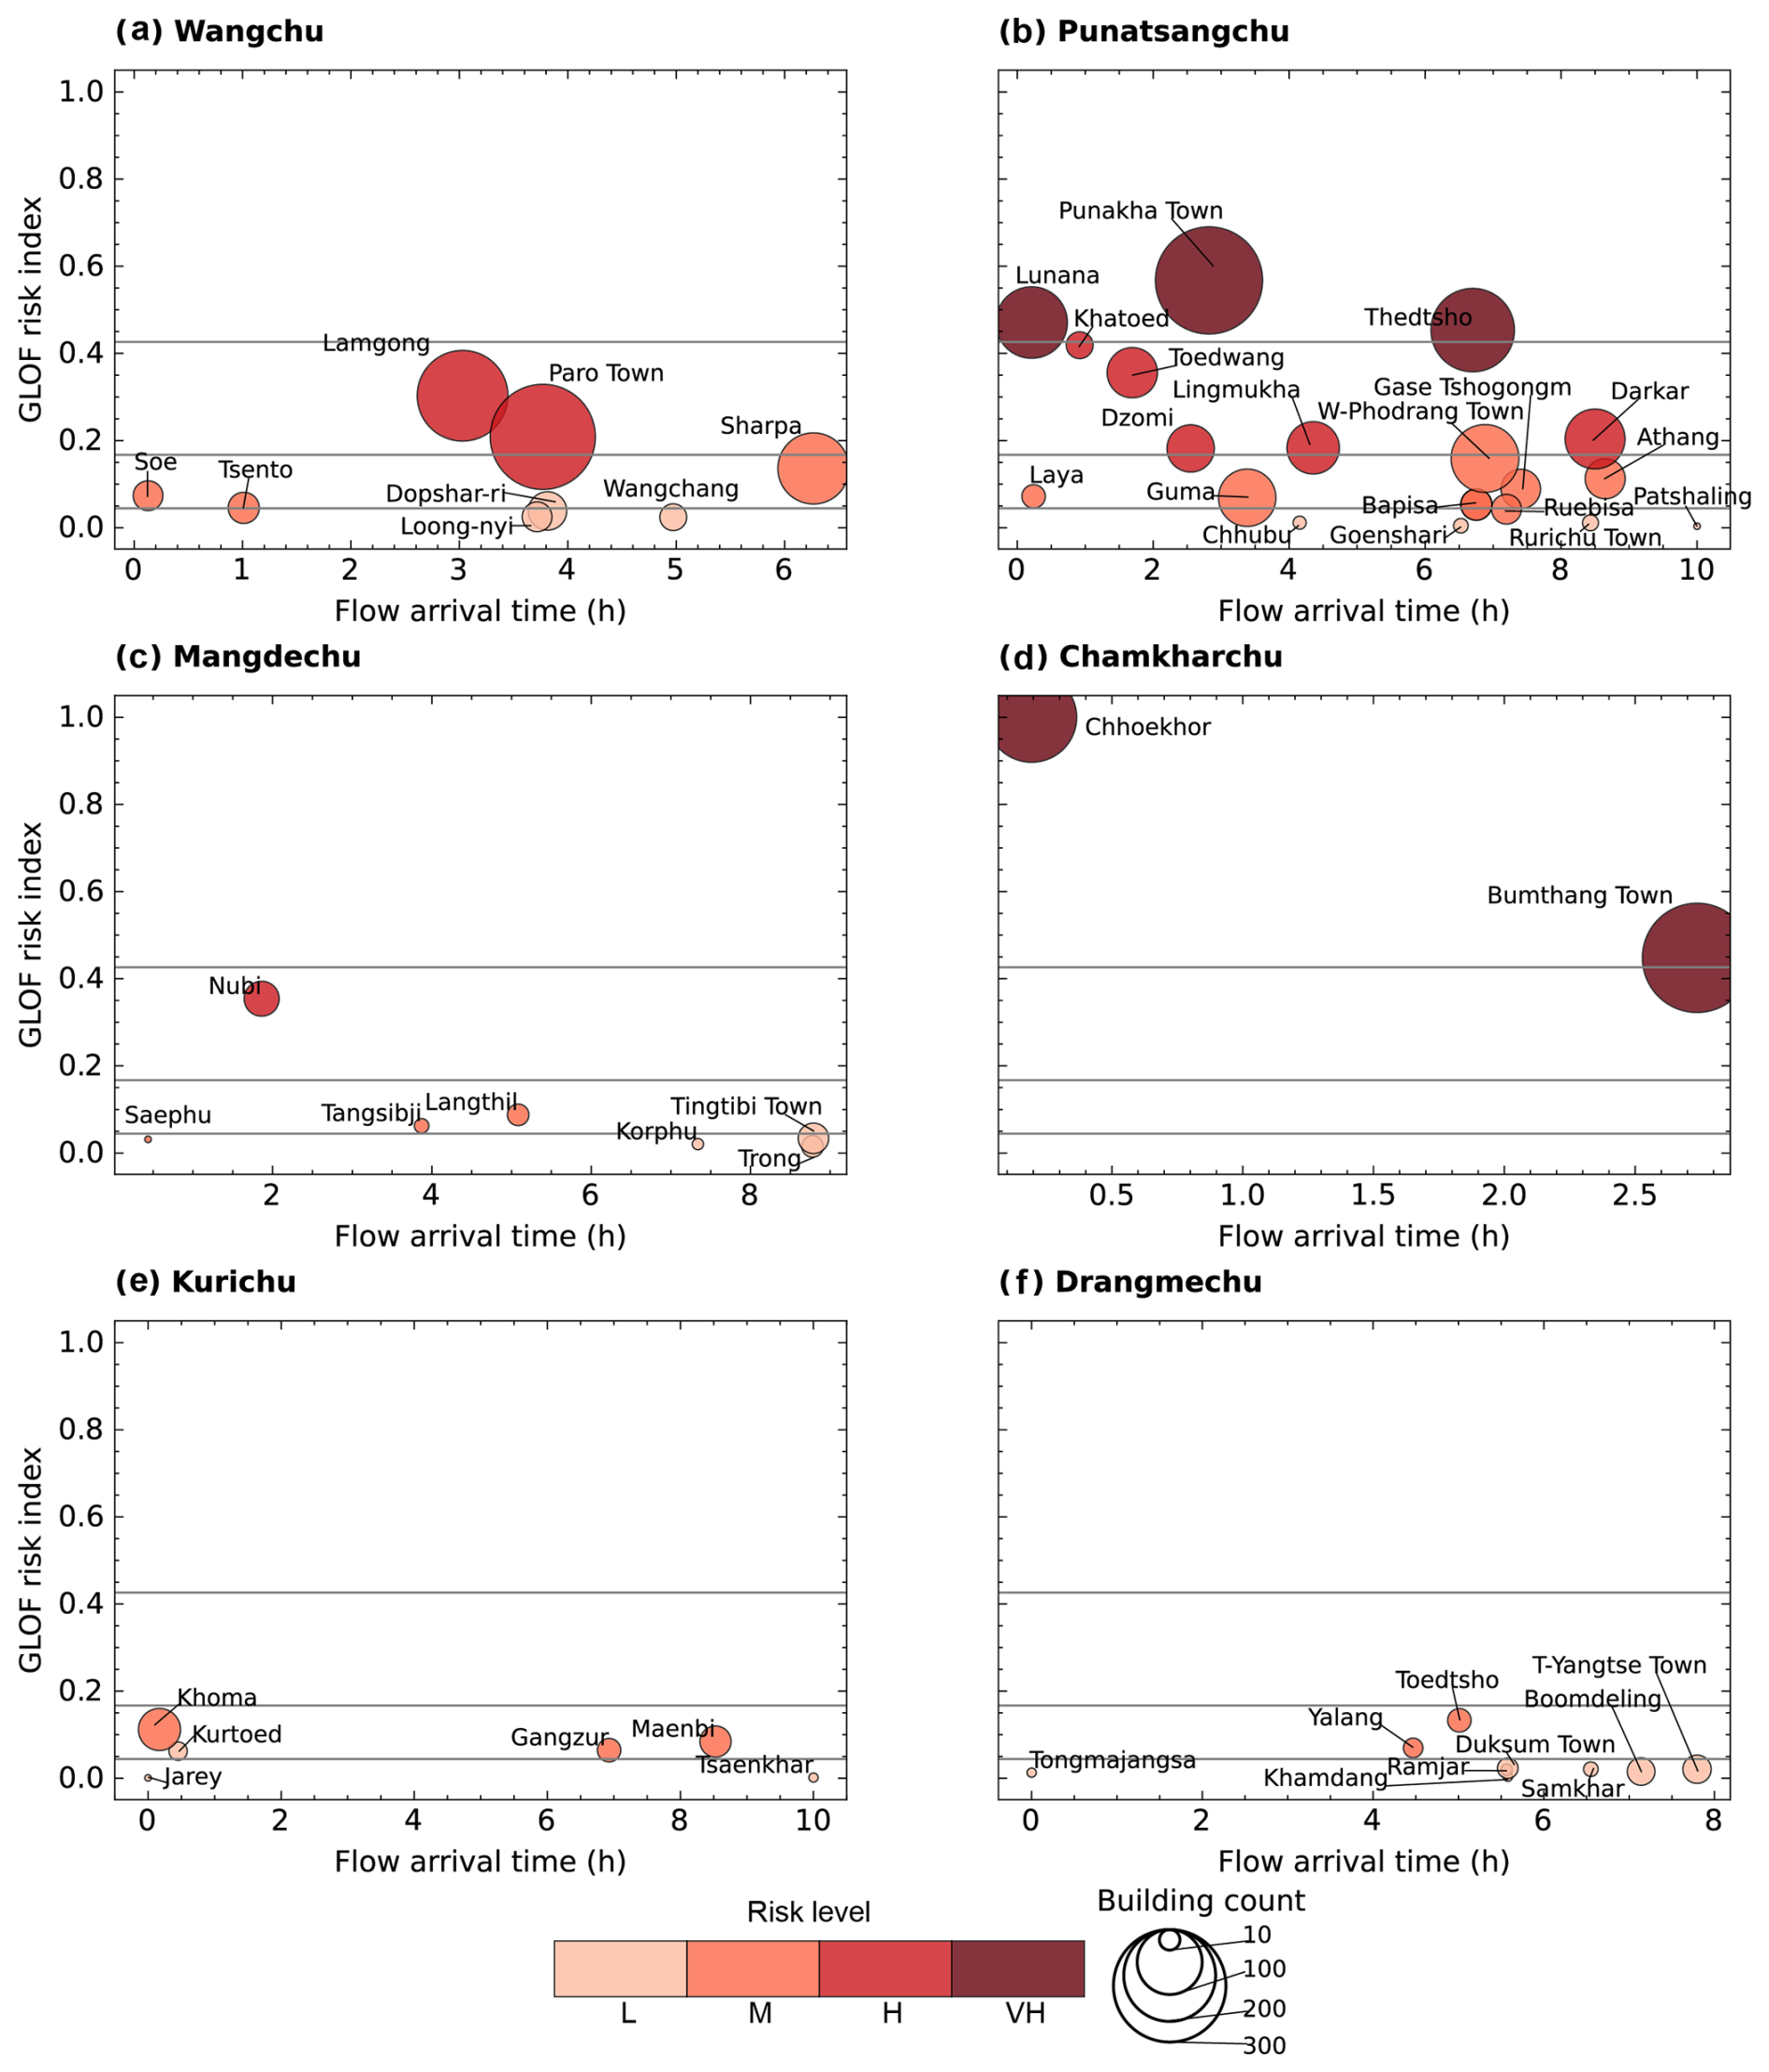
Figure 5The GLOF risk index and flow arrival time of the fastest arriving GLOF for each local administrative unit (LGUs) in impacted basins: (a) Wangchu, (b) Punatsangchu, (c) Mangdechu, (d) Chamkharchu, (e) Kurichu and (f) Drangmechu. The horizontal grey lines categorise LGUs into various GLOF risk levels (low to very high level).
In the LGUs such as Soe and Laya, the first buildings affected by the GLOF are typically isolated and located very close to glacial lakes. Despite their proximity, the GLOF risk ranking for these LGUs remains relatively low due to the limited number of exposed buildings in these LGUs (Fig. 5). Therefore, we compared the Di and the arrival time of the fastest-arriving GLOF within each LGU. This analysis identified Lunana and Chhoekhor as LGUs with very high GLOF risk levels, and the fastest GLOF can arrive in as little as 15 min. On the other hand, the fastest GLOF impacting buildings takes up to 3 h for other LGUs with very high GLOF risk, such as Punakha town and Bumthang town (Fig. 5).
4.6 Early Warning System and GLOF
We analysed the distribution of the existing GLOF early warning system in Bhutan with respect to high hazard lakes and downstream communities associated with GLOF risk. Currently, Bhutan has a GLOF early warning system in three basins: Punatsangchu, Mangdechu, and Chamkharchu. Across these basins, the system is equipped with 13 monitoring stations placed at various locations (Fig. 1). Assuming that GLOFs from a lake may be monitored if an EWS monitoring station is located downstream of the glacial lake, our study shows that the existing EWS currently tracks 51 out of the 278 glacial lakes we investigated here. Among these monitored lakes, the network includes the very high hazard glacial lake, Thorthormi Tsho, as well as two of the five high hazard glacial lakes and five of the six moderate hazard glacial lakes. The remaining monitored lakes are classified as low or very low hazard. Notably, the high hazard glacial lakes newly identified here, including lake251, lake262 and lake278, are not monitored by existing early warning systems.
We further examined how many residents within GLOF exposed buildings could receive early warnings based on their hydrological relationship to the existing EWS monitoring stations. Assuming that the buildings located downstream of the EWS monitoring stations can receive an early warning, our study revealed that the existing GLOF monitoring stations can provide early warning to the people living in 1549 buildings, of which about 75 % are in the Punatsangchu basin. Of these, residents in 268 buildings are estimated to have less than 30 m to evacuate after receiving a warning from the EWS monitoring stations located in their respective communities (Fig. 6).
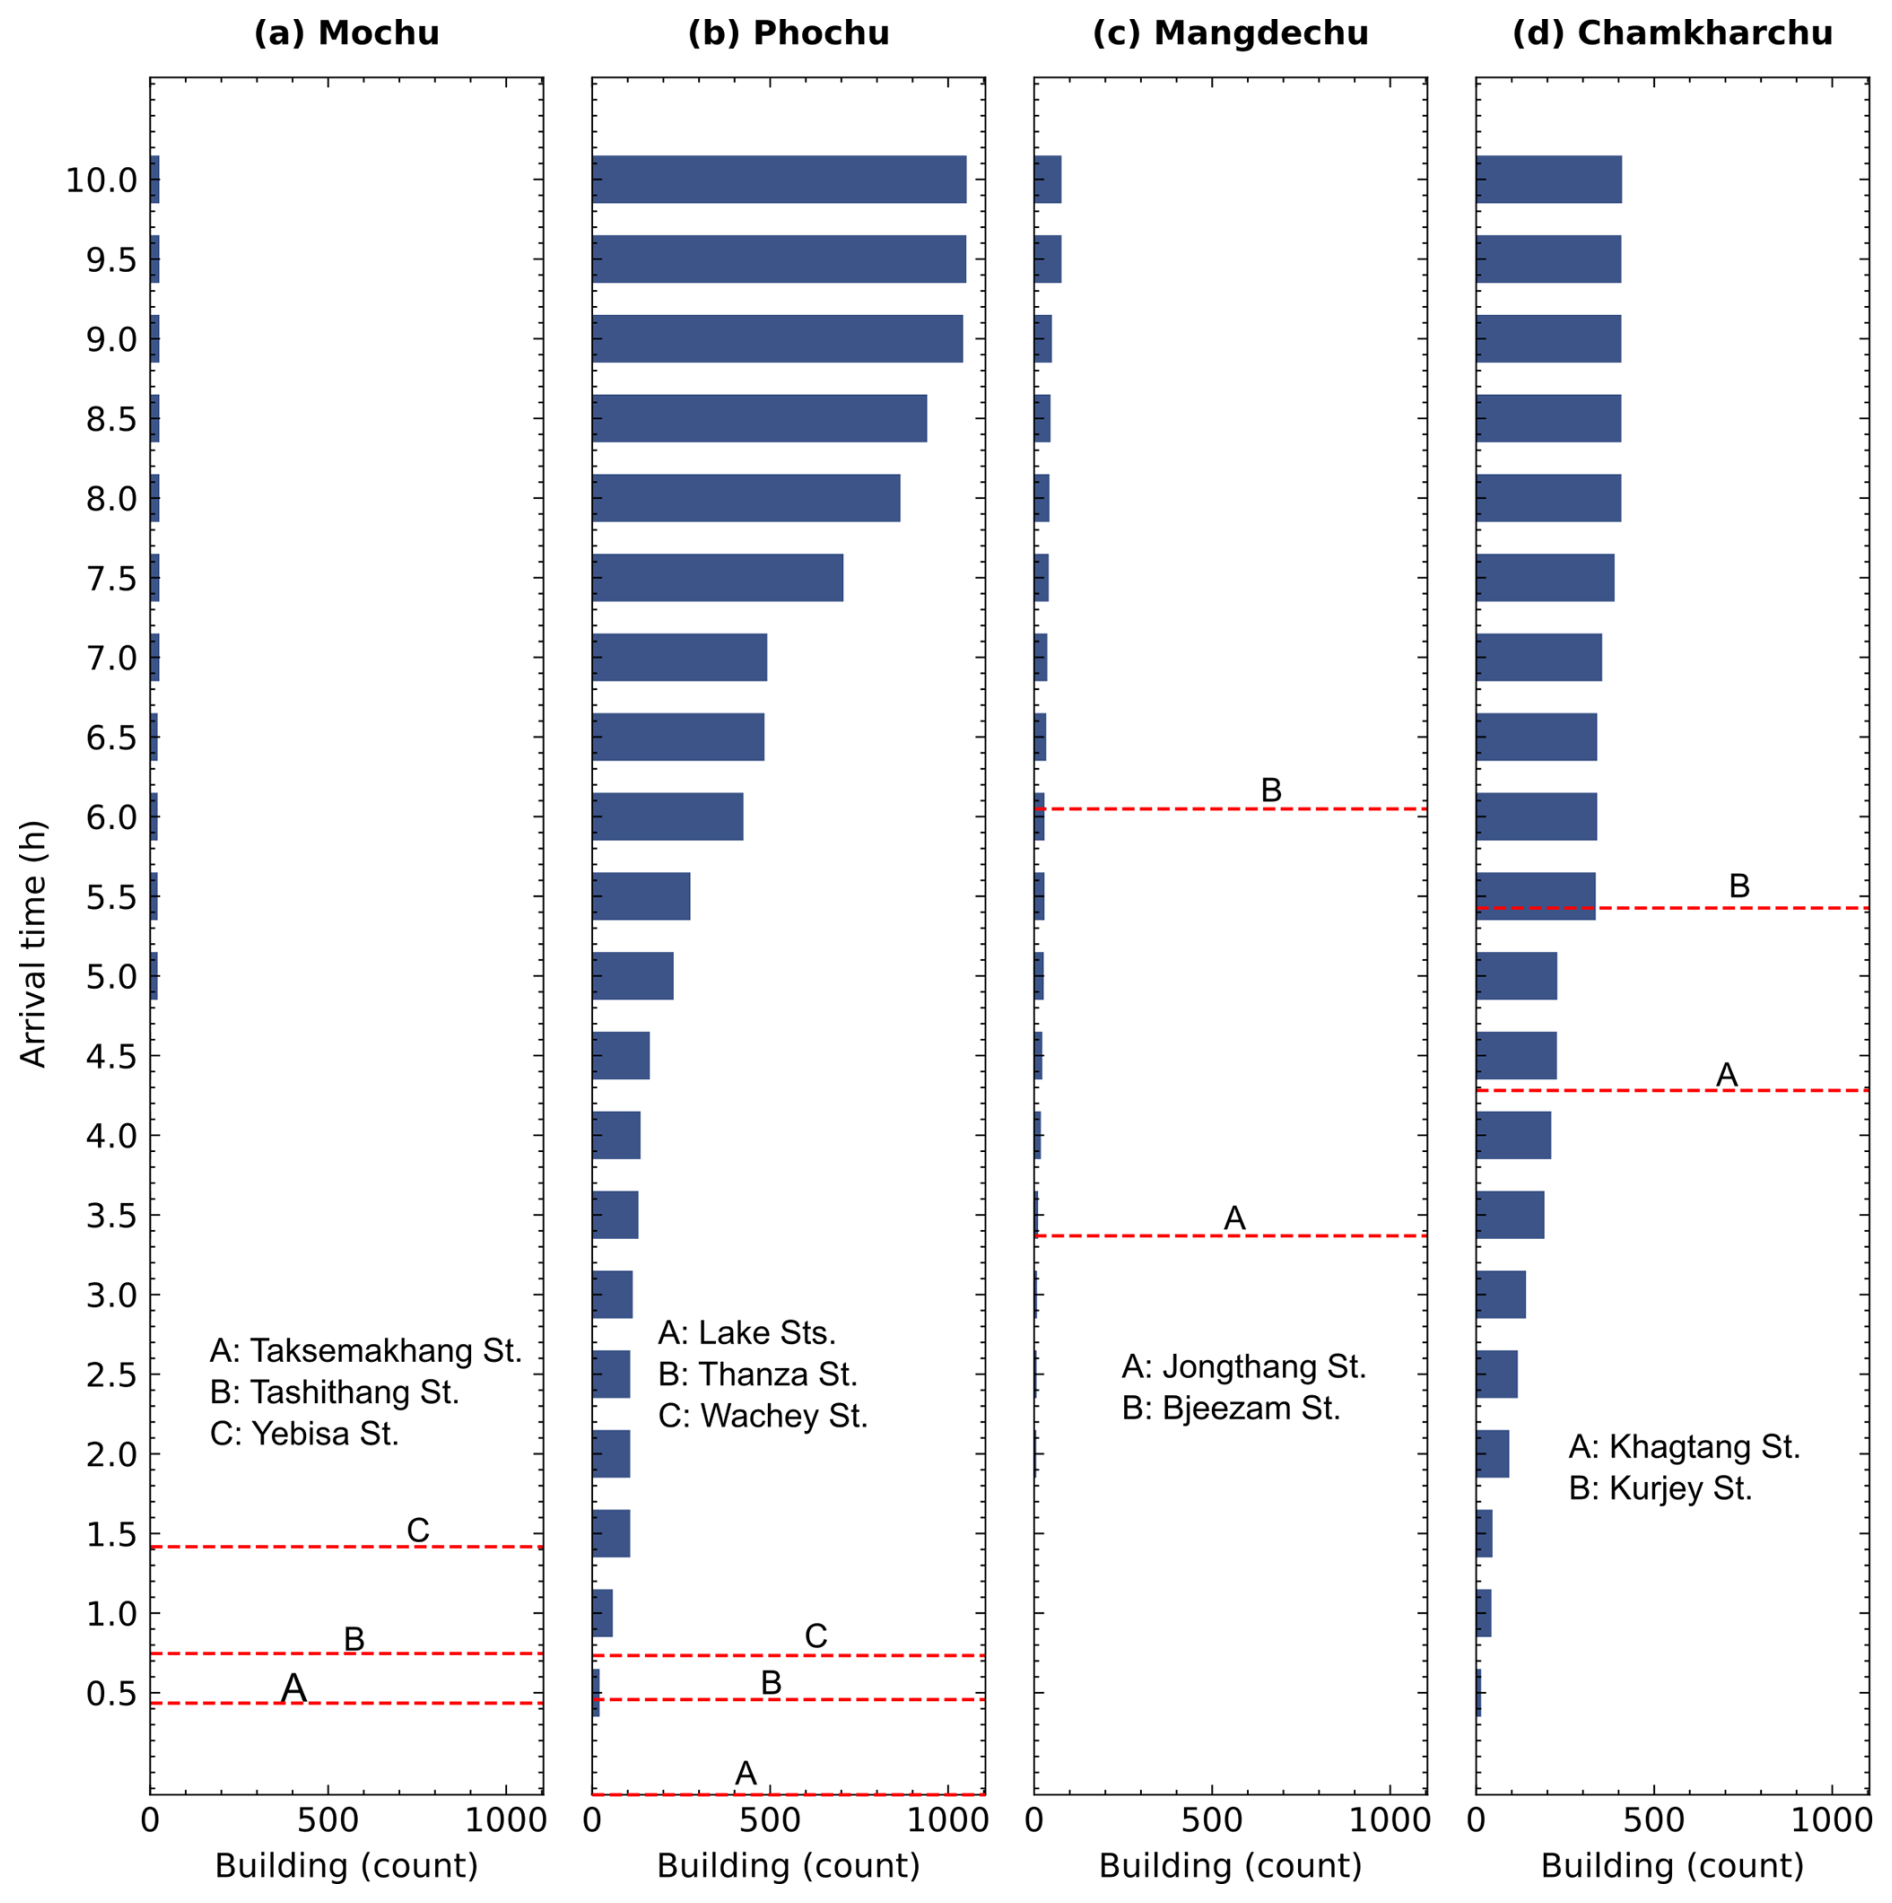
Figure 6Bar plots showing the number of buildings located downstream of GLOF early warning monitoring stations in Punatsangchu basin (a: Mochu, b: Phochu), (c) Mangdechu, and (d) Chamkharchu basins. Red dashed lines represent the location of EWS monitoring stations relative to the average flow arrival time of all GLOFs detected by each EWS monitoring station. The names and location of each EWS monitoring station are indicated with a letter (A to C) within the respective panel. The monitoring stations located at the lakes, including Bechung, Raphstreng, Thorthormi and Lugge Tsho in Phochu basin, are marked as “Lake Sts.” in panel (b).
Conversely, people living in 1050 exposed buildings, that is, at least 41 % of exposed buildings, do not have access to early warning coverage. Approximately half of these unserved buildings are clustered in downstream LGUs with high GLOF risk, including Lamgong and Paro Town in Paro districts. Although EWS is in place in the Chamkharchu basin, a cluster of about 82 buildings in Chhoekhor in Bumthang is not covered by EWS. This is because the flood waves from the potential GLOF can arrive at these buildings before activating the monitoring stations at Khagtang and Kurjey (Fig. 6).
5.1 Improved GLOF risk understanding
Some of the most damaging historical GLOF events in the world have occurred from seemingly inconspicuous glacial lakes (Allen et al., 2015; Petrakov et al., 2020), whilst some large-magnitude GLOF events have caused minimal or no downstream damage (Shrestha et al., 2023; Lützow et al., 2023). This is because the GLOF magnitude alone does not determine downstream damage caused by the GLOF event; instead, it is the interaction between GLOF magnitude and the downstream exposed elements that determines the extent of damage (Taylor et al., 2023a). For example, the greatest number of building damages associated with the 2023 South Lhoknak Lake GLOF event in the Indian state of Sikkim occurred between 200 and 385 km downstream of the glacial lake, with 59 % of these impacted structures constructed within the past decade (Sattar et al., 2025b). This highlights the escalating exposure and so the risk due to infrastructure expansion and settlement growth in GLOF-exposed areas (Nie et al., 2023) and underscores the importance of considering exposure data in GLOF risk assessment. To address this in Bhutan, we improved our understanding of GLOF risk by coupling flood characteristic modelling of individual lakes and downstream exposure data. Accordingly, we have produced flood mapping and GLOF hazard ranking for 278 glacial lakes, along with comprehensive GLOF risk assessments for 274 local government administrative units (LGUs). As a result, we classified lake130 (Thorthormi Tsho) as a very high hazard glacial lake in Bhutan, five lakes (lake93, lake251, lake262, lake276 and lake278) as high hazard and 20 other lakes as moderate hazard. Likewise, five downstream LGUs were associated with very high GLOF risk, while eight others were associated with high GLOF risk.
Our approach departs from many existing practices of identifying high hazard glacial lakes, which are primarily based on the susceptibility of lakes to produce GLOF without regarding the characteristics of settlements located downstream of the lakes (Rinzin et al., 2021; NCHM, 2019), in two ways: (1) incorporation of GLOF Hydrodynamic characteristics: we considered flow velocity and flow depth, which are both primary components of the GLOF flow that determine damage to the downstream elements (Federal Emergency Management Agency, 2004). (2) Interaction of flow depth and velocity with downstream exposed buildings: we mapped potential downstream building damage associated with each GLOF event based on the interaction between the depth-velocity and downstream at risk elements. By focusing on the interaction between flood magnitude and downstream exposed buildings, our method classifies glacial lakes as high hazard only when their potential flood poses a threat to downstream elements, making it a more practical and effective strategy for bespoke GLOF risk reduction activities. For example, lake278 and lake251 are small, and they produce relatively small GLOFs with their estimated peak discharge approximately 2000 m3 s−1. However, both were classified as high hazard as the GLOF from these lakes impacts hundreds of downstream buildings (Fig. 7). Likewise, our approach assigns a higher GLOF risk ranking to communities that are either affected by GLOFs from multiple lakes, impacted by high-magnitude GLOFs, or have multiple buildings located within the GLOF inundation area, whilst also considering the community's vulnerability. For example, Chhoekhor was identified as having the highest GLOF risk in Bhutan because at least 191 buildings were potentially impacted by GLOF from as many as 14 lakes in the basin. On the other hand, gewogs such as Toedwang in Punakha are also classified as having very high GLOF risk, despite having a comparatively low number (60) of potentially impacted buildings, because these buildings could be impacted by very high magnitude GLOFs in terms of depth and velocity (Fig. 7).
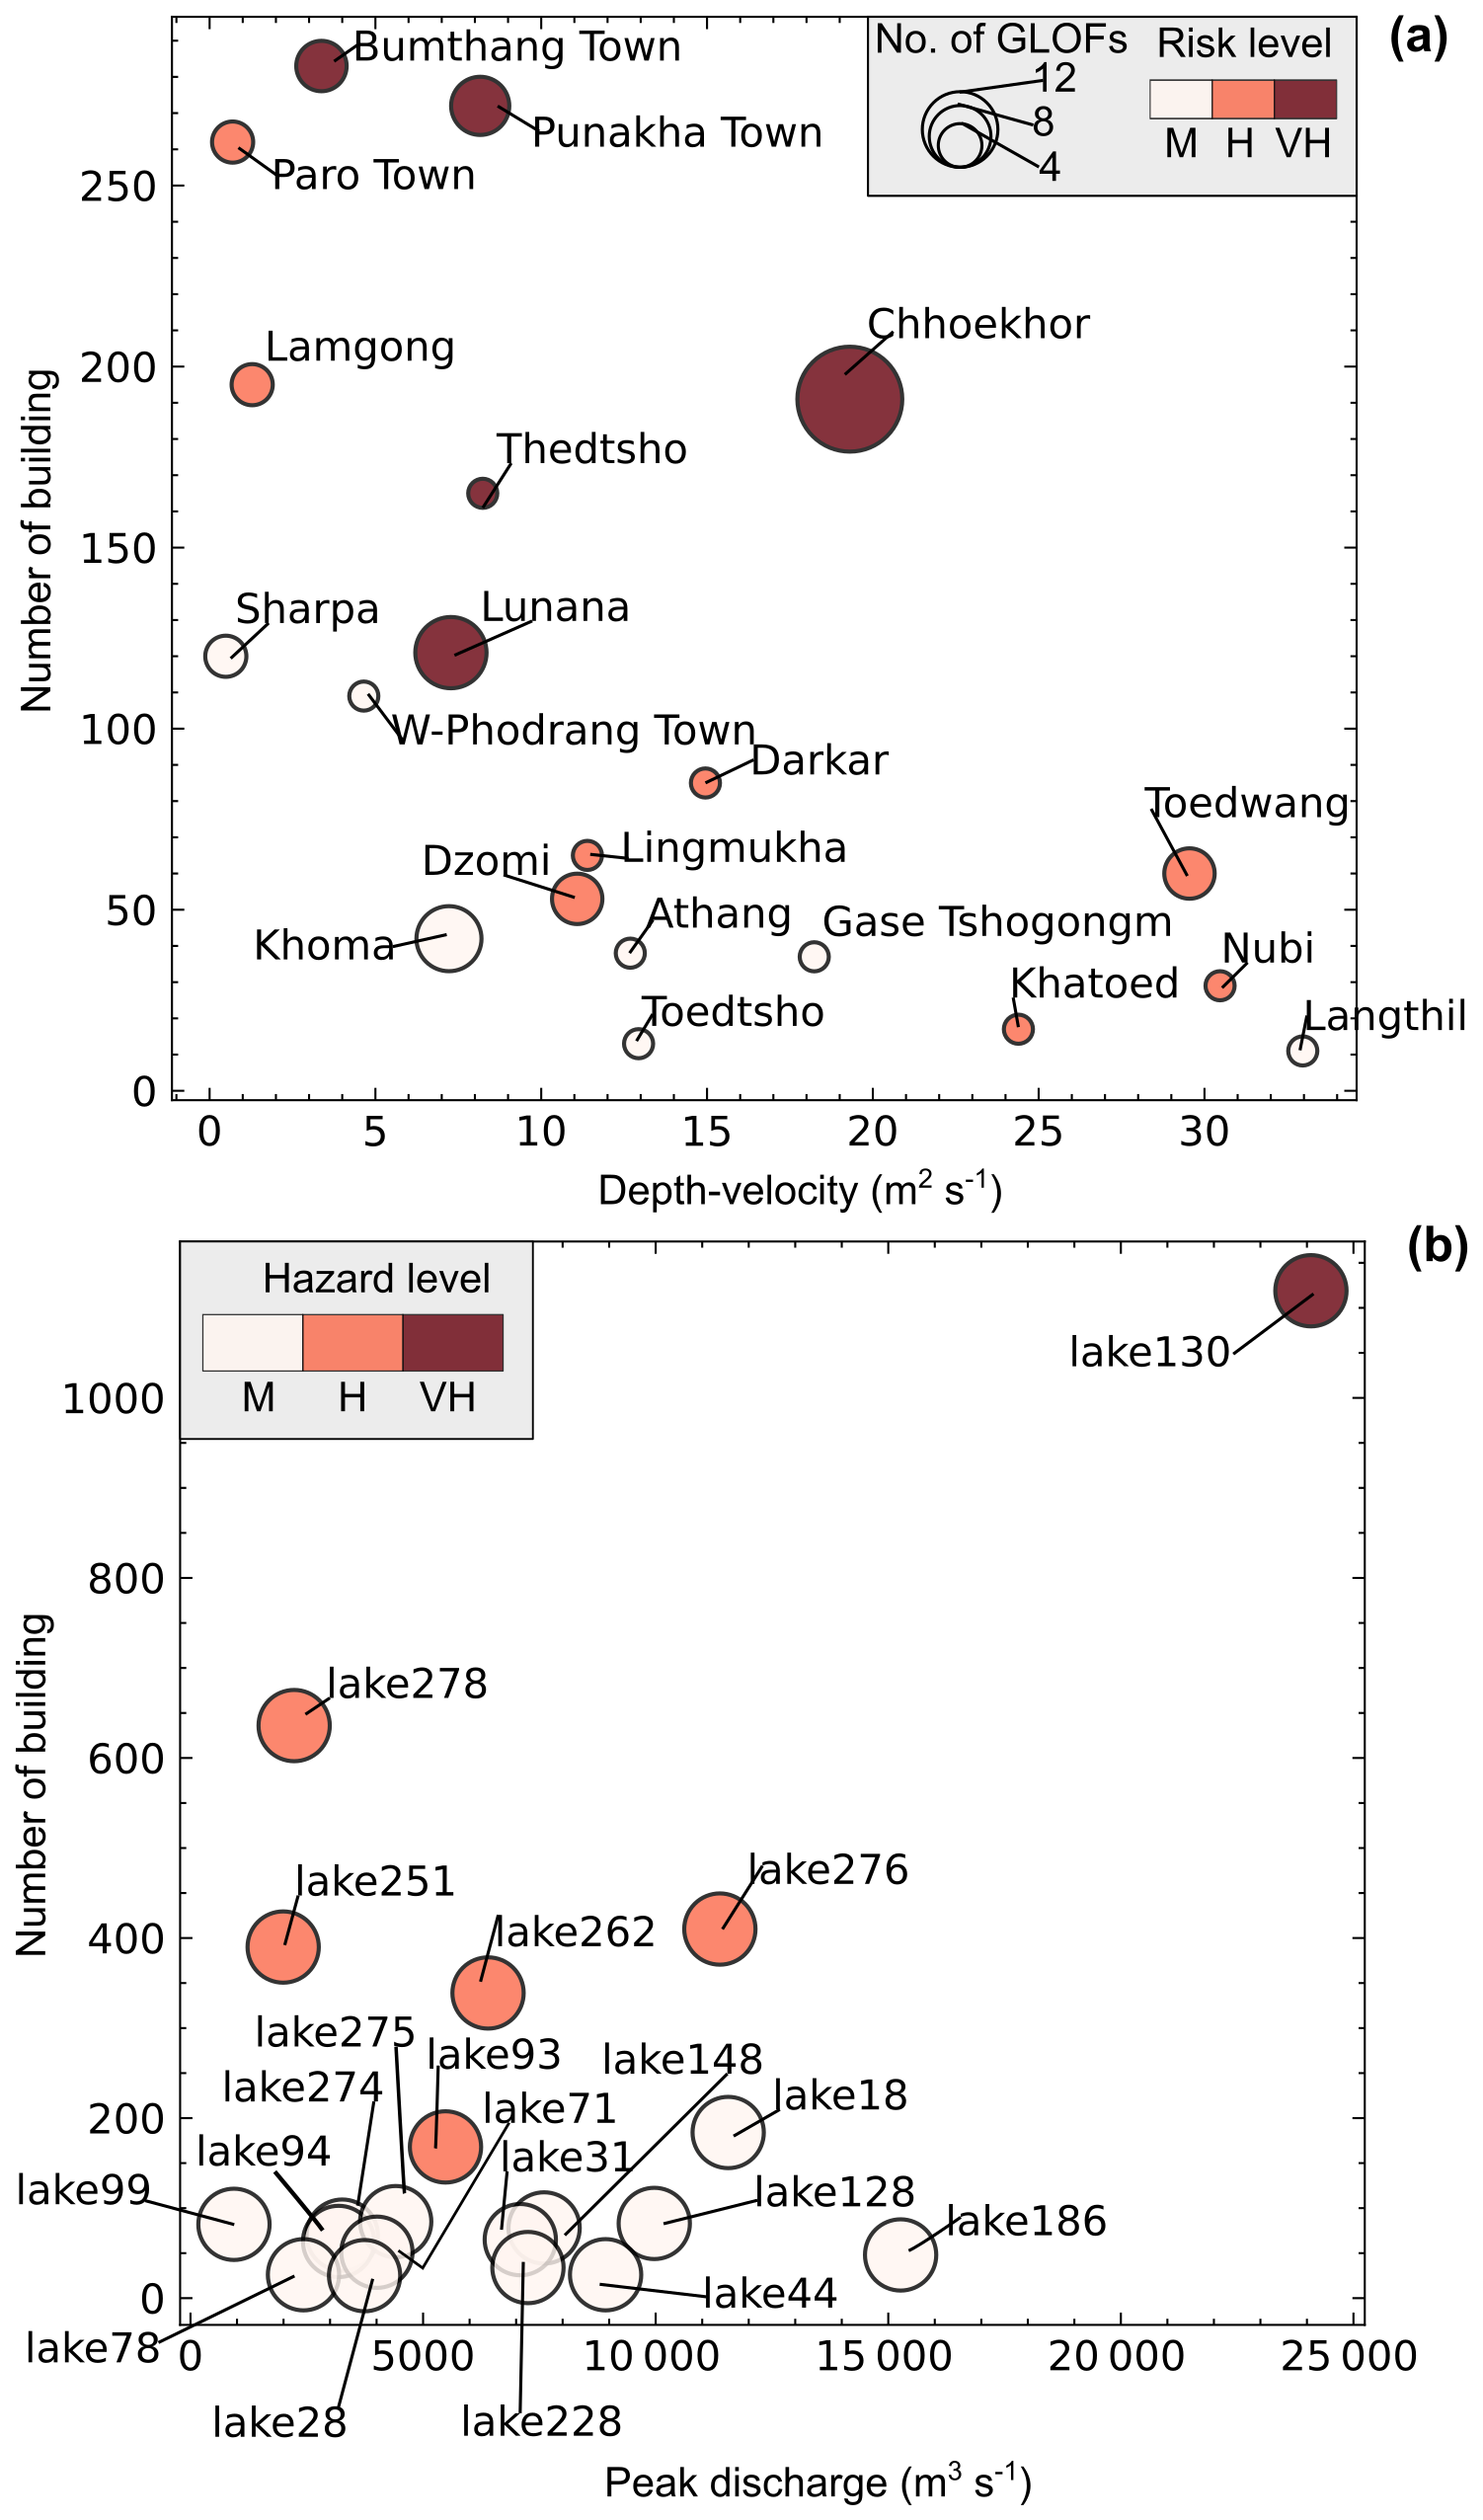
Figure 7Dot plot illustrating the influence of GLOF magnitude and downstream exposure on (a) GLOF risk computed in this study for downstream LGUs and (b) GLOF hazard for individual lakes. In panel (a), the GLOF magnitude is based on median depth-velocity across all the GLOFs that strike at least one building in the LGU. In panel (b), we considered peak discharge (Qp) as a proxy for GLOF magnitude. The colour associated with each dot indicates the LGU GLOF risk level in panel (a) and lake hazard level in panel (b). The size of the dots in panel (a) corresponds to the number of GLOFs from various glacial lakes that impact the respective community. For better visualisation, only the top 15 high hazard lakes and 15 high GLOF risk LGUs are displayed here.
We classified only one lake (Thorthormi Tsho) as a very high hazard glacial lake. This is because it is not only the largest glacial lake but is also located in the Punatsangchu basin, which is among Bhutan's most populated basins, resulting in exposure of up to 1119 buildings, again, an order of magnitude more exposure than the next lake associated with the highest exposure. These findings further highlight the importance of strengthening risk mitigation measures for Thorthormi Tsho and the affected downstream settlements.
Our study complements conventional PDGL assessment approaches by redefining which glacial lakes pose the greatest hazard to the downstream settlements. As a result, we identified three new high hazard glacial lakes, including lake93 (Phudung Tsho), lake251, and lake278 (Wonney Tsho), which are not recognised as high hazard or PDGL by any of the previous studies. Also, 53 of the previously identified 64 very highly susceptible to GLOFs lakes (Rinzin et al., 2021) are categorised as low GLOF hazard lakes. Conversely, 12 lakes classified as low or very low GLOF susceptibility emerge as moderate to high hazard in our study (Rinzin et al., 2021). Likewise, nine of the high hazard lakes monitored by NCHM (six in Punatsangchu basin, one each in Mangdechu, Chamkharchu and Kurichu basins) (NCHM, 2019) are categorized as low hazard in our study (Fig. 8). These discrepancies arise because we classified lakes as high hazard only if a potential GLOF would affect a significant number of downstream buildings, whereas earlier studies' definitions are motivated by the likelihood of producing GLOF based on characteristics of lake and surrounding terrains (Rinzin et al., 2021; NCHM, 2019) (Fig. 8). For example, lake278 in the Wangchu headwaters is classified as high hazard in our study because a potential GLOF could impact 636 buildings across seven LGUs in Paro while the earlier studies considered this lake as safe as it does not have geomorphological characteristics and lake condition to qualify as high hazard (Rinzin et al., 2021).
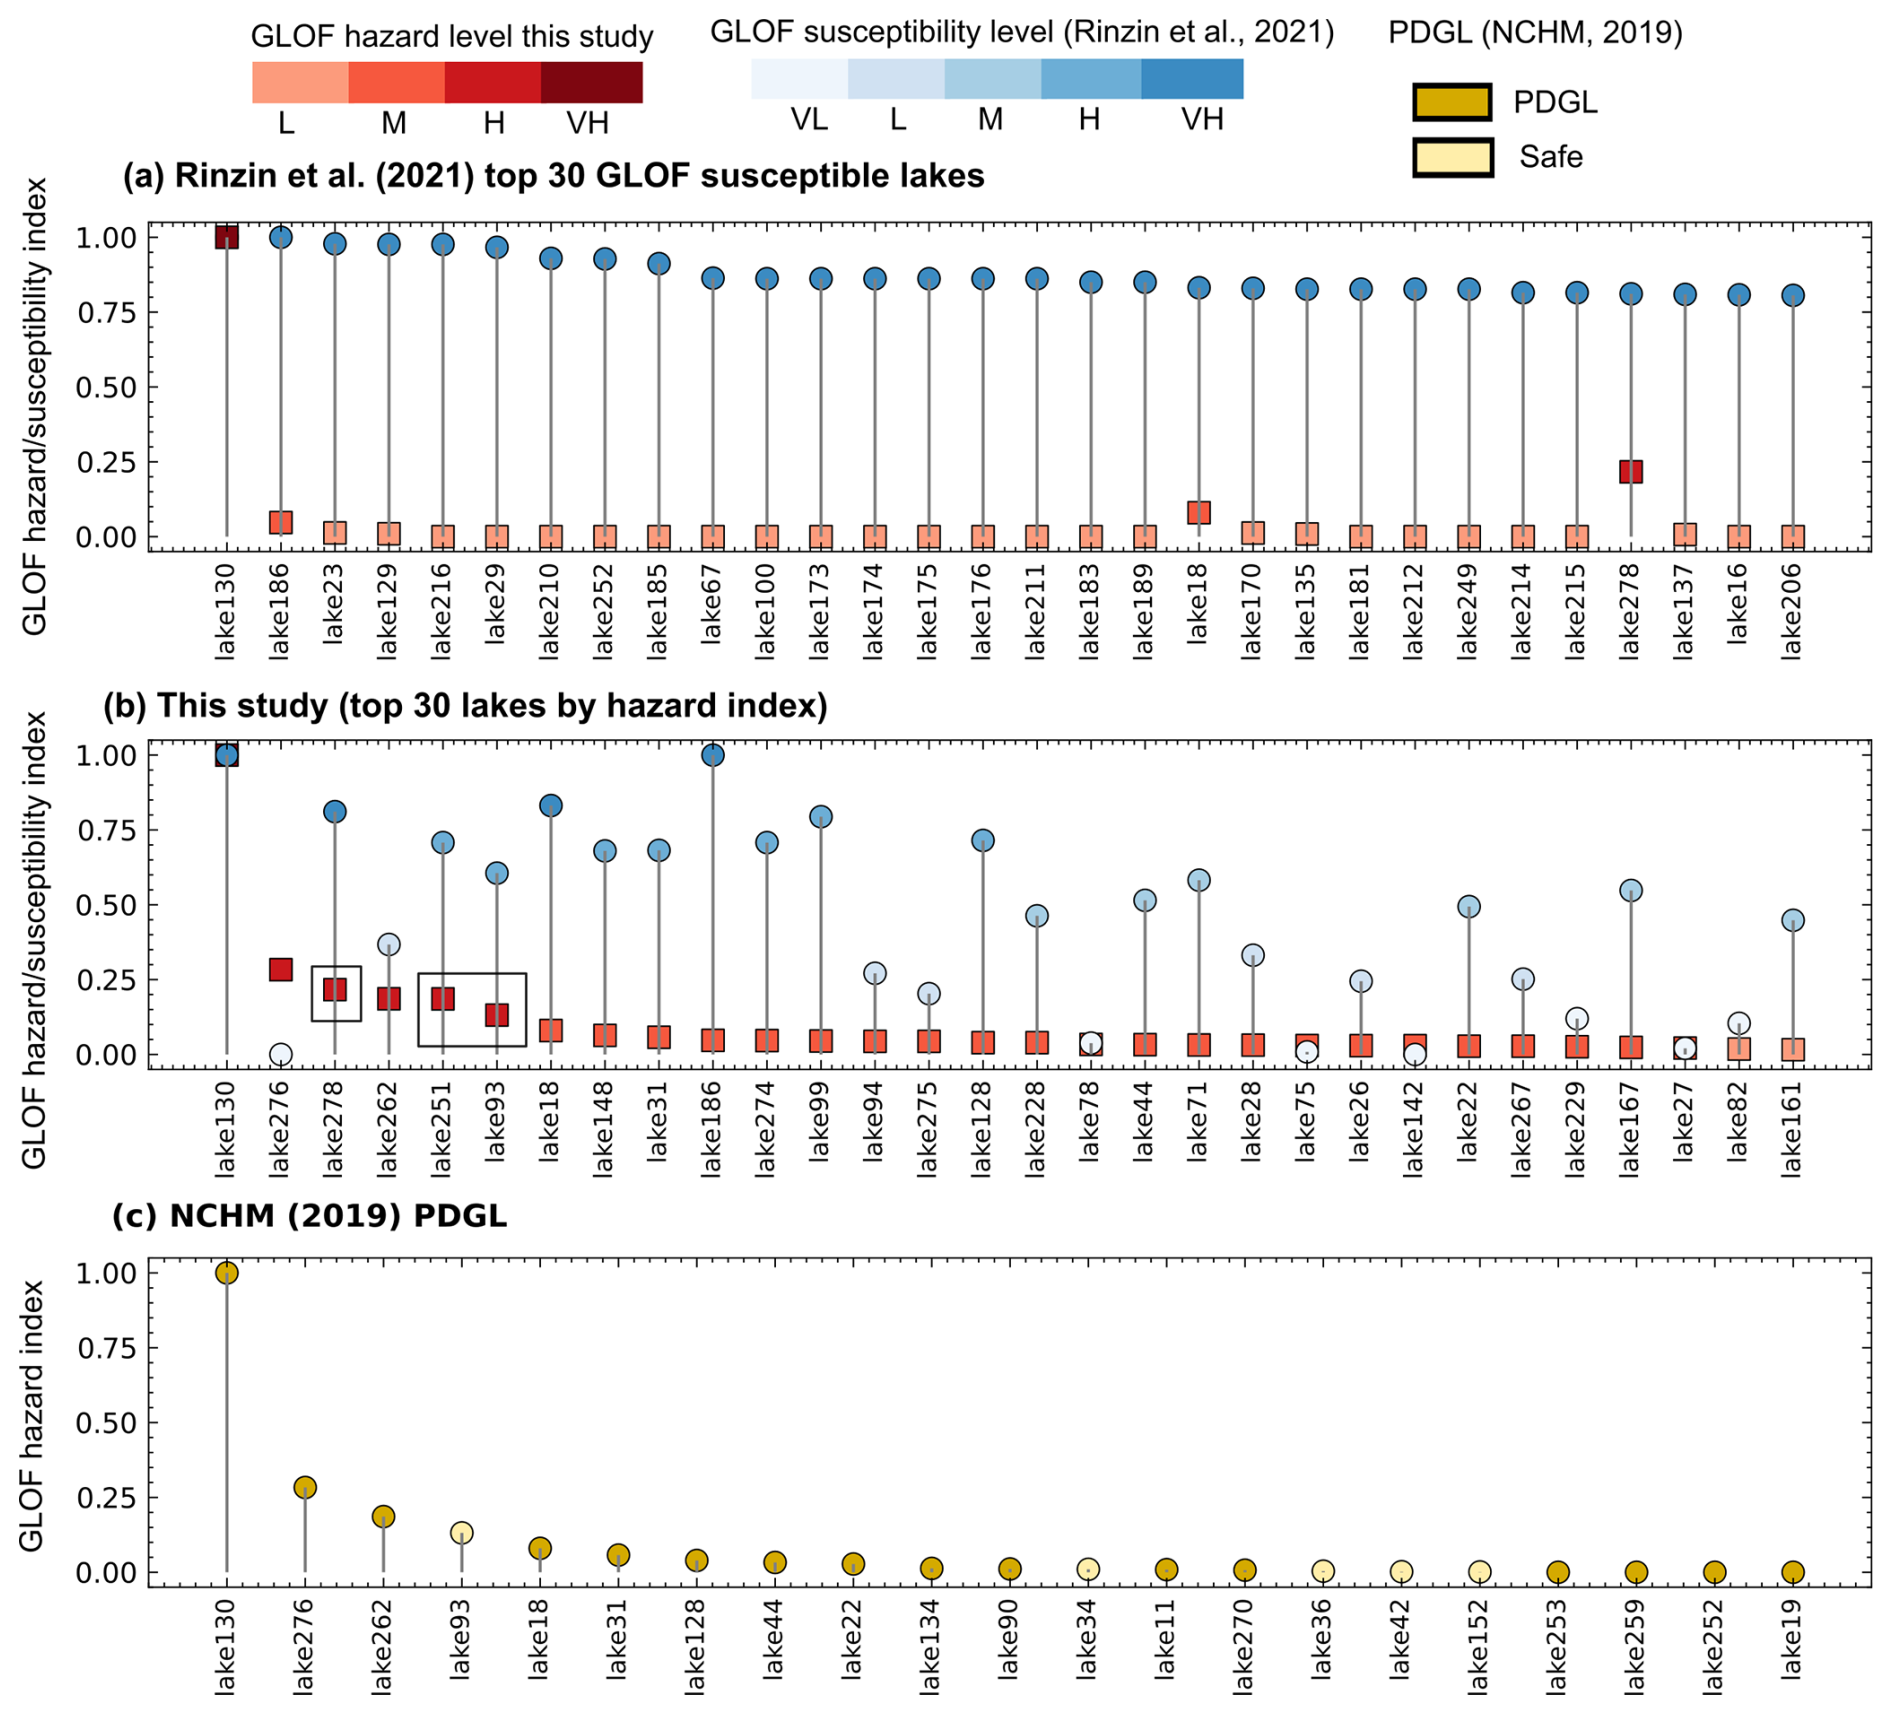
Figure 8Comparison (a, b) GLOF hazard index (DI) for the top 30 high hazard lakes determined in the current study and GLOF susceptibility score from Rinzin et al. (2021), and (c) hazard index (DI) for PDGLs in Bhutan identified by the NCHM (2019). The black bounding box in panel (b) shows the new high hazard lakes determined in this study for the first time.
By ranking GLOF risk for all 274 LGUs, we discovered potential new GLOF risk hotspots, such as Paro town and Lamgong gewog in Paro and Chhoekhor gewog in Bumthang. GLOF risk in these places was previously not quantified, and existing GLOF early warning systems in Bhutan currently do not cover these high GLOF risk LGUs (NCHM, 2021). We therefore recommend prioritising monitoring of glacial lakes in Bhutan based on all components of risk (hazard, exposure and vulnerability. Specifically, Bhutan's glacial lake monitoring and downstream risk mitigation efforts should expand beyond Lunana to include other high GLOF hazard lakes and vulnerable downstream settlements such as Paro Town and Chhoekhor gewog, while emphasising that higher granularity studies might be needed to guide bespoke risk reduction efforts in these respective areas.
5.2 Transboundary GLOF
None of the transboundary lakes were classified as very high or high hazard based on potential GLOF impacts in Bhutan. This is because damage was minimal, mainly inundating uninhabited parts of Bhutan, located in deep, inaccessible gorges. However, we identified GLOF from four lakes in the Drangmechu basin (located in Arunachal Pradesh, India) and 11 in the Kurichu basin (located in the Tibetan Autonomous Region, China), which could potentially impact several buildings in Bhutan. Furthermore, GLOF from 20 lakes located in the Indian and Chinese territories of the Himalaya enter Bhutan, although they do not impact any buildings (Fig. 9). The modelled transboundary GLOFs sourced from lakes located within Bhutan attenuate before they cross the international border between Bhutan and India. However, we acknowledge that some of the GLOF events in the future can impact settlements along transboundary river floodplains in India, especially under the worst-case scenarios and when their flows are amplified by the addition of material along the flow path, such as from a landslide deposit (Cook et al., 2018) and/or hydropower dams (Sattar et al., 2025b). Identifying potential transboundary GLOFs is vital, given their potential destructive power and long run-out distances and challenges stemming from the absence of transboundary GLOF risk mitigation mechanisms. For example, a recent GLOF from South Lhoknak Lake in the Indian Himalaya travelled over 300 km downstream, causing significant damage in Bangladesh (Sattar et al., 2025b). The absence of transboundary cooperation for GLOF risk mitigation (for example, flood magnitude communication, shared hydropower reservoir draw-down management) between Bhutan, China, and India complicates efforts to monitor and manage such risks. Establishing regional cooperation is essential to enhance early warning systems, facilitate data sharing, and implement coordinated risk reduction strategies, such as one proposed by Zhang et al. (2025a), thereby minimising the potential damage from future transboundary GLOFs.
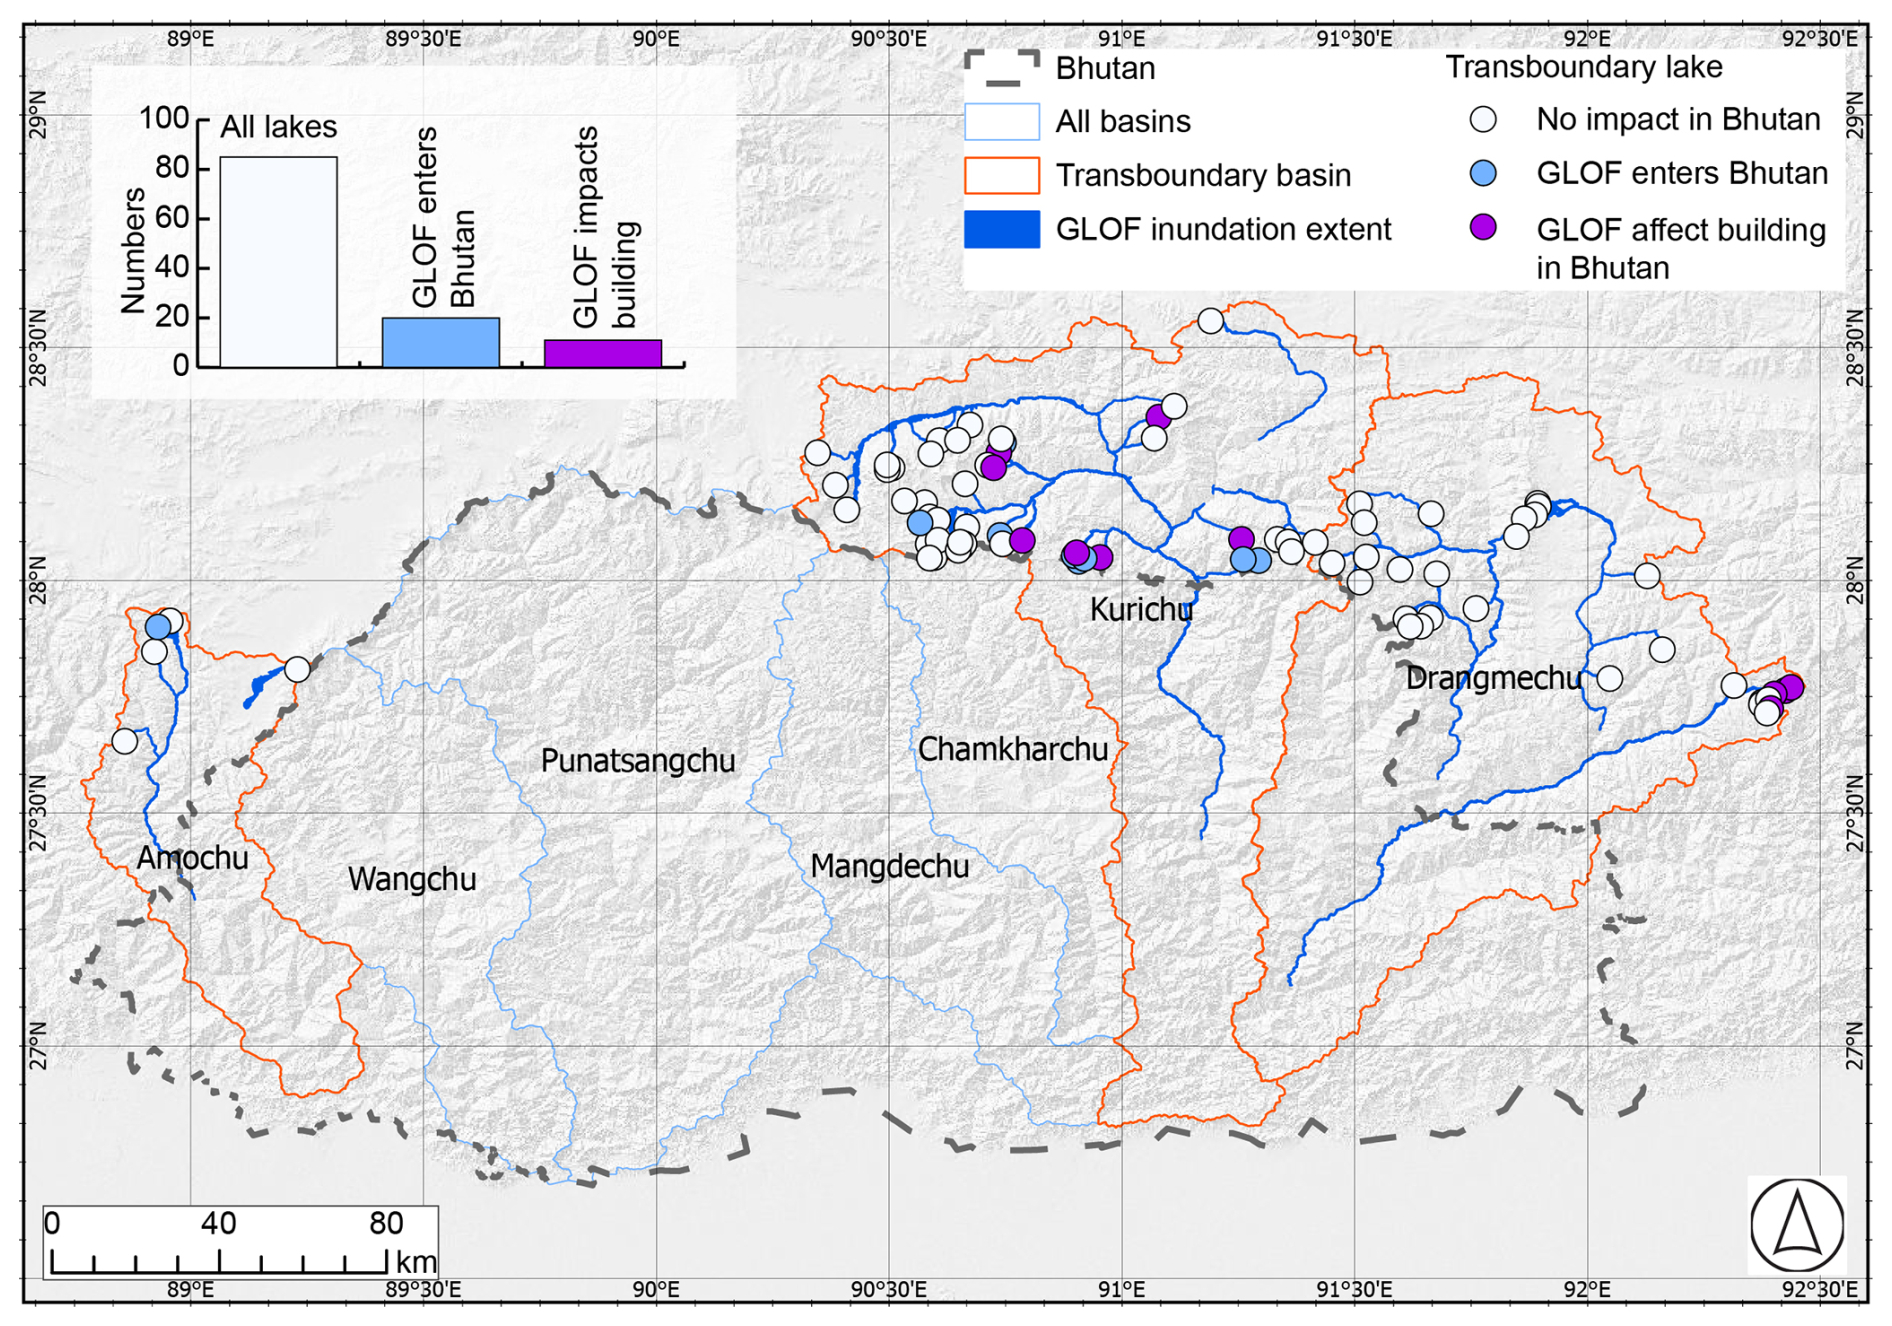
Figure 9The map shows the impact of GLOF in Bhutan, which originates from lakes located on the Chinese and Indian sides of transboundary basins. The inset bar graph shows the total number of lakes, lakes from which GLOFs enter Bhutan and lakes from which GLOF impacts buildings in Bhutan.
5.3 Significance, limitations and the way forward
5.3.1 Significance
Our approach of GLOF risk assessment using both flood magnitude and downstream exposure data provides local authorities and relevant stakeholders with valuable information to plan and prioritise wide-ranging risk mitigation activities. These activities may target either specific glacial lakes or downstream communities based on the hazard/risk index and level we have provided, whilst also incorporating practical factors, such as resource availability and logistical constraints. This study is particularly timely, as the Royal Government of Bhutan is planning to modernise and expand its network of flood monitoring and GLOF early warning systems (World Bank, 2024). This initiative, outlined in the roadmap for 2024–2034, aims to develop multi-hazard warning services, aligning closely with the practical applications and insights provided by our research. For example, our flood mapping and flow arrival time data can be used to appropriately locate GLOF monitoring stations for early warning systems (Wang et al., 2022). Likewise, some of the scattered buildings in LGUs such as Soe gewog in Paro could be impacted by GLOFs within as little as 10 min. This short lead time means it is likely not effective to install early warning systems for residents in these rapidly impacted areas. In this context, our flood extent mapping can effectively guide land-use zoning and support targeted decision-making for future development in these vulnerable locations.
5.3.2 Limitations and the way forward
Our work establishes a baseline GLOF mapping and risk assessment in Bhutan. However, we acknowledge that the magnitude of floods from glacial lakes will continue to evolve as glacier retreat drives the expansion of existing lakes within a topographically constrained basin, and due to the formation of new lakes within the depressions left by retreating glaciers (Zheng et al., 2021b; Furian et al., 2022). This increasing lake area is expected to amplify GLOF magnitude, as supported by our sensitivity analysis, which shows that the DV increases approximately by 2 orders of magnitude when the area increases from 0.01 to 5 km2. Concomitantly, the downstream settlements within the GLOF-prone areas are evolving, with population growth and infrastructure development leading to increased GLOF exposure (Nie et al., 2023; Uddin et al., 2021). The interplay of these factors means GLOF risk will likely increase in the future and highlights the need for dynamic and regularly updated GLOF flood mapping and risk assessments in the future.
We determined the minimum glacial lake area threshold (0.05 km2) for GLOF modelling based on the empirical evidence from the previous inventory (Shrestha et al., 2023; Komori et al., 2012). However, it is important to acknowledge that glacial lakes smaller than 0.05 km2 have also been known to produce GLOFs with a magnitude substantial enough to cause significant downstream damage (Sattar et al., 2025a), particularly when they combine with other floods like meteorological floods (Allen et al., 2015) or when the outburst flow entrains a large amount of debris (Petrakov et al., 2020; Cook et al., 2018). Thus, the future modelling efforts should also consider smaller lakes than the size threshold we considered here and more complex, sediment-laden rheologies and phase changes.
Our drainage volume and peak discharge calculations are based on empirical equations and the previous GLOF events, with incomplete documented characteristics (Shrestha et al., 2023). Employing such proxy parameters is reasonable for this study, as we aimed to provide an overview of GLOF risk in Bhutan based on the downstream impact. The modelled GLOF scenarios for each lake are directly comparable, enabling an assessment of the overall and relative levels of hazard, and representing a moderate scenario. We recognise, however, that this is just one set of scenarios while empirical relationships between the volume and area are associated with significant uncertainty (Schwanghart et al., 2016). Due to time and computational constraints, it was not feasible to simulate all potential variations. Future studies focusing on the detailed impact of specific glacial lakes or on specific downstream communities must be grounded on site-specific scenarios informed by situational triggering factors and dam composition and geometry. The study should also consider the site-specific worst-case scenario, considering the future climatic conditions.
While we mapped all types of exposed elements located within the GLOF flow inundation extent, our GLOF damage index is calculated solely based on the impact on the number of exposed buildings. This approach is grounded in the rationale that buildings represent the primary places where people reside and are therefore the most direct proxy for population exposure. However, critical infrastructure such as hydropower plants (e.g., in the Punatsangchu basin) and the international airport in Paro (Wangchu basin), which are vital to the national economy, were not included in our risk calculation. This omission stems from the considerable challenges involved in accurately estimating the economic cost of potential damage to such high-value infrastructure. When a GLOF intercepts hydropower dams, it can cause overtopping, excessive sedimentation, outages, and equipment damage, leading to significant revenue losses from the hydropower plants (Dunning et al., 2006) as well as cascading impacts on the low-lying settlements (Sattar et al., 2025b). Likewise, damage to the crucial infrastructure, such as Paro international airport, will hinder relief efforts after the GLOF disaster, delaying the recovery and escalating overall loss and damage. Therefore, future studies should also consider absolute economic impact of GLOF to aid relevant stakeholders and policymakers in developing appropriate strategies to mitigate risks to vital infrastructure.
The socio-economic indicators used here are the best available census data at the finest granularity in Bhutan. These indicators represent people's capability to respond to and recover from not only GLOF but also any natural or man-made hazards (Cutter et al., 2003). However, these indicators do not necessarily represent people's specific vulnerability to GLOF, as it also depends on other factors such as prior experience of natural hazards (Lloyd's Register Foundation, 2024). For example, we classified Lunana gewog as the most vulnerable gewog based on these socio-economic indicators (Fig. S5); however, how their prior experience influences their response capability remains beyond the scope of this study. Future studies focusing on specific downstream settlements or impact of a particular glacial lake should also consider the broader implications of vulnerability and resilience.
Looking forward, the glacial lake dataset can be updated using wide-ranging open-access remote sensing imagery. Similarly, platforms such as OpenStreetMap, which leverage crowdsourced data and are frequently updated, present a valuable resource for mapping evolving downstream buildings and other structure data. Likewise, hydrodynamic modelling for multiple glacial lakes with freely available and user-friendly models such as HEC-RAS is increasingly becoming feasible with the recent development in artificial intelligence and cloud-based computing platforms like Flood Platform (https://www.floodplatform.com/, last access: 5 February 2026), which enable integrating products from varied flood simulations/models into a common framework. We have developed a website: https://www.himalayanhazards.org/ (last access: 24 February 2026), which hosts glacial lake data and flood maps, serving as a valuable resource for periodic updates to flood damage assessments. By integrating up-to-date glacial lake flood magnitude information with evolving downstream exposure data, this platform can provide valuable information for informed decision-making and proactive risk management, such as tailored early warning systems, land use management and development.
Glacial lakes, which are growing in number and area in mountains globally, pose a serious GLOF threat to the communities living downstream of them. However, the destruction and damage caused during the GLOF event are not determined solely by flood magnitude or intensity but also depend on their interaction with downstream exposed elements. Despite this, traditional approaches to assessing the hazard posed by glacial lakes have been mainly based on the likelihood and magnitude of a lake to produce GLOF and often disregard the potential downstream impact. To address this gap, this study redefines the hazard classification of glacial lakes in Bhutan (one of the high GLOF risk countries globally) by combining GLOF hydrodynamic characteristics and downstream exposed buildings.
This study produced GLOF hydrodynamic characteristics for all glacial lakes in Bhutan that are greater than 0.05 km2 and located within 1 km of a glacier terminus. The analysis revealed that over 11 000 people, 2600 buildings, as well as other infrastructure such as roads, bridges and farmland are exposed to GLOF in Bhutan. A GLOF hazard index was developed by combining flood mapping data with downstream exposure metrics, enabling the ranking of glacial lakes based on their potential hazard. Thorthormi Tsho was identified as a very high hazard glacial lake in Bhutan. Furthermore, we identified five additional glacial lakes as having high GLOF hazard. Among these high hazard glacial lakes, three of them are newly identified (lake251 and lake278 in the headwaters of the Wangchu basin and lake93 in the Chamkharchu basin) and are not monitored by the existing early warning system in Bhutan.
For the first time, this study provides GLOF risk ranking for 20 districts and 274 local government administrative blocks (gewogs and towns) [LGUs] in Bhutan. In addition to the previously identified high GLOF risk gewogs and towns, we have identified five additional LGUs with similarly high GLOF risks. These include Chhoekhor and Bumthang town in Bumthang, Paro town and Lamgong in Paro, and Nubi in Trongsa districts. Most strikingly, some downstream LGUs such as Paro town and Lamgong gewog in Paro are not covered by the existing Bhutan early warning system, highlighting significant gaps in existing risk mitigation efforts.
This study underscores the criticality of incorporating flood mapping and downstream exposure and vulnerability data when defining GLOF risk. For Bhutan, the findings emphasise the urgent need to expand and strengthen GLOF risk mitigation strategies, including the enhancement of early warning systems and the implementation of targeted interventions in newly identified high-risk areas. These measures are essential to safeguarding vulnerable communities and infrastructure from the escalating threat of GLOFs in the context of ongoing climate change and glacial retreat.
The HEC-RAS 2D model we used here for simulating glacial lake outburst modelling can be accessed at https://www.hec.usace.army.mil/ (last access: 1 October 2025). The AW3D30 DEMS used here can be downloaded from the OpenTopography – Find Topography Data at https://portal.opentopography.org/datasets (last access: 1 April 2024). Bhutan 2017 housing and census data can be downloaded from the National Statistical Bureau of Bhutan at https://www.nsb.gov.bt/ (last access: 1 April 2024). Landover and landuse data used in this study can be accessed at https://rds.icimod.org/ (last access: 1 April 2024). The OpenStreetMap data can be assessed at https://www.openstreetmap.org/relation/184629 (last access: 1 April 2024). GLOF hydraulic data for each glacial lake can be accessed through the web portal Himalayan Hazard: https://www.himalayanhazards.org/ (last access: 24 February 2026) upon publication of this article.
The supplement related to this article is available online at https://doi.org/10.5194/nhess-26-1015-2026-supplement.
SR, SD and RC conceptualised the study. SR undertook data analysis, visualization, wrote the original draft and revised manuscript. SD and RC secured the funding, reviewed and revised manuscript, and provided overall supervsion on SR. SA, AS and SW reviewed and edited the manuscript. All authors contributed to the final manuscript.
The contact author has declared that none of the authors has any competing interests.
Publisher's note: Copernicus Publications remains neutral with regard to jurisdictional claims made in the text, published maps, institutional affiliations, or any other geographical representation in this paper. The authors bear the ultimate responsibility for providing appropriate place names. Views expressed in the text are those of the authors and do not necessarily reflect the views of the publisher.
The authors acknowledge the financial support of the Natural Environment Research Council (NERC) – IAPETUS Doctoral Training Partnership.
This research has been supported by the Natural Environment Research Council (NERC) – IAPETUS Doctoral Training Partnership (grant agreement no. IAP2-21-267).
This paper was edited by Ugur Öztürk and reviewed by Adam Emmer and one anonymous referee.
Allen, S., Frey, H., and Huggel, C.: Assessment of Glacier and Permafrost Hazards in Mountain Regions, Technical Guidance Document, GAPHAZ, https://doi.org/10.13140/RG.2.2.26332.90245, 2017.
Allen, S. K., Rastner, P., Arora, M., Huggel, C., and Stoffel, M.: Lake outburst and debris flow disaster at Kedarnath, June 2013: hydrometeorological triggering and topographic predisposition, Landslides, 13, 1479–1491, https://doi.org/10.1007/s10346-015-0584-3, 2015.
Allen, S. K., Linsbauer, A., Randhawa, S. S., Huggel, C., Rana, P., and Kumari, A.: Glacial lake outburst flood risk in Himachal Pradesh, India: an integrative and anticipatory approach considering current and future threats, Nat. Hazards, 84, 1741–1763, https://doi.org/10.1007/s11069-016-2511-x, 2016.
Allen, S. K., Zhang, G., Wang, W., Yao, T., and Bolch, T.: Potentially dangerous glacial lakes across the Tibetan Plateau revealed using a large-scale automated assessment approach, Sci. Bull., 64, 435–445, https://doi.org/10.1016/j.scib.2019.03.011, 2019.
Byers, A. C., Rounce, D. R., Shugar, D. H., Lala, J. M., Byers, E. A., and Regmi, D.: A rockfall-induced glacial lake outburst flood, Upper Barun Valley, Nepal, Landslides, 16, 533–549, https://doi.org/10.1007/s10346-018-1079-9, 2018.
Carr, J. R., Barrett, A., Rinzin, S., and Taylor, C.: Step-change in supraglacial pond area on Tshojo Glacier, Bhutan, and potential downstream inundation patterns due to pond drainage events, J. Glaciol., 71, e9, https://doi.org/10.1017/jog.2024.62, 2024.
Carrivick, J. L. and Tweed, F. S.: A global assessment of the societal impacts of glacier outburst floods, Global Planet. Change, 144, 1–16, https://doi.org/10.1016/j.gloplacha.2016.07.001, 2016.
Chow, V. T.: Open-channel Hydraulics, MacGraw-Hill Book Co, New York, ISBN: 0070107769, 1959.
Clausen, L. and Clark, P.: The development of criteria for predicting dambreak flood damages using modelling of historical dam failures, International conference on river flood hydraulics, John Wiley & Sons Ltd. Hydraulics Research Limited, Wallingford, England, 369–380, 1990.
Colavitto, B., Allen, S., Winocur, D., Dussaillant, A., Guillet, S., Munoz-Torrero Manchado, A., Gorsic, S., and Stoffel, M.: A glacial lake outburst floods hazard assessment in the Patagonian Andes combining inventory data and case-studies, Sci. Total Environ., 916, 169703, https://doi.org/10.1016/j.scitotenv.2023.169703, 2024.
Cook, K. L., Andermann, C., Gimbert, F., Adhikari, B. R., and Hovius, N.: Glacial lake outburst floods as drivers of fluvial erosion in the Himalaya, Science, 362, 53–57, https://doi.org/10.1126/science.aat4981, 2018.
Cook, S. J., Kougkoulos, I., Edwards, L. A., Dortch, J., and Hoffmann, D.: Glacier change and glacial lake outburst flood risk in the Bolivian Andes, The Cryosphere, 10, 2399–2413, https://doi.org/10.5194/tc-10-2399-2016, 2016.
Cutter, S. L. and Finch, C.: Temporal and spatial changes in social vulnerability to natural hazards, P. Natl. Acad. Sci. USA, 105, 2301–2306, https://doi.org/10.1073/pnas.0710375105, 2008.
Cutter, S. L., Boruff, B. J., and Shirley, W. L.: Social Vulnerability to Environmental Hazards, Soc. Sci. Quart., 84, 242–261, https://doi.org/10.1111/1540-6237.8402002, 2003.
Cutter, S. L., Barnes, L., Berry, M., Burton, C., Evans, E., Tate, E., and Webb, J.: A place-based model for understanding community resilience to natural disasters, Global Environ. Chang., 18, 598–606, https://doi.org/10.1016/j.gloenvcha.2008.07.013, 2008.
Das, S., Kar, N. S., and Bandyopadhyay, S.: Glacial lake outburst flood at Kedarnath, Indian Himalaya: a study using digital elevation models and satellite images, Nat. Hazards, 77, 769–786, https://doi.org/10.1007/s11069-015-1629-6, 2015.
Dunning, S. A., Rosser, N. J., Petley, D. N., and Massey, C. R.: Formation and failure of the Tsatichhu landslide dam, Bhutan, Landslides, 3, 107–113, https://doi.org/10.1007/s10346-005-0032-x, 2006.
Emmer, A.: Understanding the risk of glacial lake outburst floods in the twenty-first century, Nature Water, 2, 608–610, https://doi.org/10.1038/s44221-024-00254-1, 2024.
Evans, S. G.: The maximum discharge of outburst floods caused by the breaching of man-made and natural dams, Can. Geotech. J., 23, 385–387, https://doi.org/10.1139/t86-053, 1986.
Federal Emergency Management Agency: Direct physical damage–general building stock, HAZUS-MH Technical manual, Chap. 5, Federal Emergency Management Agency Washington, DC, https://www.fema.gov/sites/default/files/2020-09/fema_hazus_advanced-engineering-building-module_user-manual.pdf (last access: 5 February 2026), 2004.
Fujita, K., Sakai, A., Takenaka, S., Nuimura, T., Surazakov, A. B., Sawagaki, T., and Yamanokuchi, T.: Potential flood volume of Himalayan glacial lakes, Nat. Hazards Earth Syst. Sci., 13, 1827–1839, https://doi.org/10.5194/nhess-13-1827-2013, 2013.
Furian, W., Maussion, F., and Schneider, C.: Projected 21st-Century Glacial Lake Evolution in High Mountain Asia, Frontiers in Earth Science, 10, https://doi.org/10.3389/feart.2022.821798, 2022.
Hugonnet, R., McNabb, R., Berthier, E., Menounos, B., Nuth, C., Girod, L., Farinotti, D., Huss, M., Dussaillant, I., Brun, F., and Kaab, A.: Accelerated global glacier mass loss in the early twenty-first century, Nature, 592, 726–731, https://doi.org/10.1038/s41586-021-03436-z, 2021.
Japan Aerospace Exploration Agency: ALOS World 3D 30 meter DEM, Veriosn V3.2, OpenTopography [data set], https://doi.org/10.5069/G94M92HB, 2021.
Karra, K., Kontgis, C., Statman-Weil, Z., Mazzariello, J. C., Mathis, M., and Brumby, S. P.: Global land use/land cover with Sentinel 2 and deep learning, 2021 IEEE international geoscience and remote sensing symposium IGARSS, 4704–4707, https://doi.org/10.1109/IGARSS47720.2021.9553499, 2021.
Komori, J., Koike, T., Yamanokuchi, T., and Tshering, P.: Glacial Lake Outburst Events in the Bhutan Himalayas, Global Environmental Research, 16, 59–70, https://share.google/OI0bjh2OaeWPOswGm (last access: 5 February 2026), 2012.
Kropáček, J., Neckel, N., Tyrna, B., Holzer, N., Hovden, A., Gourmelen, N., Schneider, C., Buchroithner, M., and Hochschild, V.: Repeated glacial lake outburst flood threatening the oldest Buddhist monastery in north-western Nepal, Nat. Hazards Earth Syst. Sci., 15, 2425–2437, https://doi.org/10.5194/nhess-15-2425-2015, 2015.
Liu, K., Song, C., Ke, L., Jiang, L., Pan, Y., and Ma, R.: Global open-access DEM performances in Earth's most rugged region High Mountain Asia: A multi-level assessment, Geomorphology, 338, 16–26, https://doi.org/10.1016/j.geomorph.2019.04.012, 2019.
Lloyd's Register Foundation: World Risk Poll 2024 Report: Resilience in a Changing World, https://doi.org/10.60743/C0RM-H862, 2024.
Lützow, N., Veh, G., and Korup, O.: A global database of historic glacier lake outburst floods, Earth Syst. Sci. Data, 15, 2983–3000, https://doi.org/10.5194/essd-15-2983-2023, 2023.
Maurer, J. M., Schaefer, J. M., Russell, J. B., Rupper, S., Wangdi, N., Putnam, A. E., and Young, N.: Seismic observations, numerical modeling, and geomorphic analysis of a glacier lake outburst flood in the Himalayas, Science Advances, 6, eaba3645, https://doi.org/10.1126/sciadv.aba3645, 2020.
Ministry of Economic Affairs: Bhutan Sustainable Hydropower Development Policy 2021, Ministry of Economic Affairs, Thimphu, https://www.moenr.gov.bt/wp-content/uploads/2017/07/Sustainable-Hydropower-Development-Policy-2021-1.pdf (last access: 5 February 2026), 2021.
Mool, P. K., Wangda, D., Bajracharya, S. R., Joshi, S. P., Kunzang, K., and Gurung, D. R.: Inventory of Glaciers, Glacial Lakes and Glacial Lake Outburst Floods-Bhutan.pdf, International Centre for Integrated Mountain Development (ICIMOD), Kathmandu, Nepal, https://doi.org/10.53055/ICIMOD.373, 2001.
Nagai, H., Fujita, K., Sakai, A., Nuimura, T., and Tadono, T.: Comparison of multiple glacier inventories with a new inventory derived from high-resolution ALOS imagery in the Bhutan Himalaya, The Cryosphere, 10, 65–85, https://doi.org/10.5194/tc-10-65-2016, 2016.
Nagai, H., Ukita, J., Narama, C., Fujita, K., Sakai, A., Tadono, T., Yamanokuchi, T., and Tomiyama, N.: Evaluating the Scale and Potential of GLOF in the Bhutan Himalayas Using a Satellite-Based Integral Glacier–Glacial Lake Inventory, Geosciences, 7, https://doi.org/10.3390/geosciences7030077, 2017.
National Centre for Hydrology and Meteorology (NCHM): Reassessment of Potentially Dangerous Glacial Lakes in Bhutan, National Centre for Hydrology and Meteorology, Royal Government of Bhutan, Thimphu, Bhutan, ISBN: 978-99980-862-1-0, 2019.
National Centre for Hydrology and Meteorology (NCHM): Standard operating procedure (sop) for GLOF early warning system Punakha-Wangdue valley, https://www.nchm.gov.bt/attachment/ckfinder/userfiles/files/Final SOP.pdf (last access: 5 February 2026), 2021.
National Statistics Bureau of Bhutan (NSB): 2017 Population and housing census of Bhutan, National Statistics Bureau of Bhutan, Thimphu, Bhutan, ISBN: 978-99936-28-69-9, 2018.
Nie, Y., Liu, W., Liu, Q., Hu, X., and Westoby, M. J.: Reconstructing the Chongbaxia Tsho glacial lake outburst flood in the Eastern Himalaya: Evolution, process and impacts, Geomorphology, 370, https://doi.org/10.1016/j.geomorph.2020.107393, 2020.
Nie, Y., Liu, Q., Wang, J., Zhang, Y., Sheng, Y., and Liu, S.: An inventory of historical glacial lake outburst floods in the Himalayas based on remote sensing observations and geomorphological analysis, Geomorphology, 308, 91–106, https://doi.org/10.1016/j.geomorph.2018.02.002, 2018.
Nie, Y., Pritchard, H. D., Liu, Q., Hennig, T., Wang, W., Wang, X., Liu, S., Nepal, S., Samyn, D., Hewitt, K., and Chen, X.: Glacial change and hydrological implications in the Himalaya and Karakoram, Nature Reviews Earth & Environment, 2, 91–106, https://doi.org/10.1038/s43017-020-00124-w, 2021.
Nie, Y., Deng, Q., Pritchard, H. D., Carrivick, J. L., Ahmed, F., Huggel, C., Liu, L., Wang, W., Lesi, M., Wang, J., Zhang, H., Zhang, B., Lü, Q., and Zhang, Y.: Glacial lake outburst floods threaten Asia's infrastructure, Sci. Bull., 68, https://doi.org/10.1016/j.scib.2023.05.035, 2023.
Petrakov, D. A., Chernomorets, S. S., Viskhadzhieva, K. S., Dokukin, M. D., Savernyuk, E. A., Petrov, M. A., Erokhin, S. A., Tutubalina, O. V., Glazyrin, G. E., Shpuntova, A. M., and Stoffel, M.: Putting the poorly documented 1998 GLOF disaster in Shakhimardan River valley (Alay Range, Kyrgyzstan/Uzbekistan) into perspective, Sci. Total Environ., 724, https://doi.org/10.1016/j.scitotenv.2020.138287, 2020.
Petrucci, O.: The Impact of Natural Disasters: Simplified Procedures and Open Problems, in: Approaches to Managing Disaster, edited by: John, T., IntechOpen, Rijeka, Chap. 6, https://doi.org/10.5772/29147, 2012.
Rahmani, M., Muzwagi, A., and Pumariega, A. J.: Cultural Factors in Disaster Response Among Diverse Children and Youth Around the World, Curr. Psychiat. Rep., 24, 481–491, https://doi.org/10.1007/s11920-022-01356-x, 2022.
Rinzin, S., Zhang, G., and Wangchuk, S.: Glacial Lake Area Change and Potential Outburst Flood Hazard Assessment in the Bhutan Himalaya, Frontiers in Earth Science, 9, https://doi.org/10.3389/feart.2021.775195, 2021.
Rinzin, S., Dunning, S., Carr, R. J., Sattar, A., and Mergili, M.: Exploring implications of input parameter uncertainties in glacial lake outburst flood (GLOF) modelling results using the modelling code r.avaflow, Nat. Hazards Earth Syst. Sci., 25, 1841–1864, https://doi.org/10.5194/nhess-25-1841-2025, 2025.
Rinzin, S., Zhang, G., Sattar, A., Wangchuk, S., Allen, S. K., Dunning, S., and Peng, M.: GLOF hazard, exposure, vulnerability, and risk assessment of potentially dangerous glacial lakes in the Bhutan Himalaya, J. Hydrol., 619, https://doi.org/10.1016/j.jhydrol.2023.129311, 2023.
Rupper, S., Schaefer, J. M., Burgener, L. K., Koenig, L. S., Tsering, K., and Cook, E. R.: Sensitivity and response of Bhutanese glaciers to atmospheric warming, Geophys. Res. Lett., 39, L19503, https://doi.org/10.1029/2012gl053010, 2012.
Sattar, A., Emmer, A., Lhazom, T., Rai, S. K., and Azam, M. F.: Flood risk from small mountain lakes, Communications Earth & Environment, 6, https://doi.org/10.1038/s43247-025-02758-4, 2025a.
Sattar, A., Goswami, A., Kulkarni, A. V., Emmer, A., Haritashya, U. K., Allen, S., Frey, H., and Huggel, C.: Future Glacial Lake Outburst Flood (GLOF) hazard of the South Lhonak Lake, Sikkim Himalaya, Geomorphology, 388, https://doi.org/10.1016/j.geomorph.2021.107783, 2021.
Sattar, A., Allen, S., Mergili, M., Haeberli, W., Frey, H., Kulkarni, A. V., Haritashya, U. K., Huggel, C., Goswami, A., and Ramsankaran, R.: Modeling Potential Glacial Lake Outburst Flood Process Chains and Effects From Artificial Lake-Level Lowering at Gepang Gath Lake, Indian Himalaya, J. Geophys. Res.-Earth, 128, https://doi.org/10.1029/2022jf006826, 2023.
Sattar, A., Cook, K. L., Rai, S. K., Berthier, E., Allen, S., Rinzin, S., Van Wyk de Vries, M., Haeberli, W., Kushwaha, P., Shugar, D. H., Emmer, A., Haritashya, U. K., Frey, H., Rao, P., Gurudin, K. S. K., Rai, P., Rajak, R., Hossain, F., Huggel, C., Mergili, M., Azam, M. F., Gascoin, S., Carrivick, J. L., Bell, L. E., Ranjan, R. K., Rashid, I., Kulkarni, A. V., Petley, D., Schwanghart, W., Watson, C. S., Islam, N., Gupta, M. D., Lane, S. N., and Bhat, S. Y: The Sikkim flood of October 2023: Drivers, causes and impacts of a multihazard cascade, Science, 387, eads2659, https://doi.org/10.1126/science.ads2659, 2025b.
Schwanghart, W., Worni, R., Huggel, C., Stoffel, M., and Korup, O.: Uncertainty in the Himalayan energy–water nexus: estimating regional exposure to glacial lake outburst floods, Environ. Res. Lett.,11, 074005, https://doi.org/10.1088/1748-9326/11/7/074005, 2016.
Shrestha, F., Steiner, J. F., Shrestha, R., Dhungel, Y., Joshi, S. P., Inglis, S., Ashraf, A., Wali, S., Walizada, K. M., and Zhang, T.: A comprehensive and version-controlled database of glacial lake outburst floods in High Mountain Asia, Earth Syst. Sci. Data, 15, 3941–3961, https://doi.org/10.5194/essd-15-3941-2023, 2023.
Taylor, C., Robinson, T. R., Dunning, S., Rachel Carr, J., and Westoby, M.: Glacial lake outburst floods threaten millions globally, Nat. Commun., 14, 487, https://doi.org/10.1038/s41467-023-36033-x, 2023a.
Taylor, C. J., Robinson, T. R., Dunning, S., and Carr, J. R.: The rise of GLOF danger: trends, drivers and hotspots between 2000 and 2020, ESS Open Archive [preprint], https://doi.org/10.22541/essoar.168275988.80551902/v1, 2023b.
Uddin, K.: Land cover of HKH region, ICIMOD [data set], https://rds.icimod.org/Home/DataDetail?metadataId=1972511 (last access: 1 April 2024), 2021.
Uddin, K., Matin, M. A., Khanal, N., Maharjan, S., Bajracharya, B., Tenneson, K., Poortinga, A., Quyen, N. H., Aryal, R. R., Saah, D., Lee Ellenburg, W., Potapov, P., Flores-Anderson, A., Chishtie, F., Aung, K. S., Mayer, T., Pradhan, S., and Markert, A.: Regional Land Cover Monitoring System for Hindu Kush Himalaya, in: Earth Observation Science and Applications for Risk Reduction and Enhanced Resilience in Hindu Kush Himalaya Region: A Decade of Experience from SERVIR, edited by: Bajracharya, B., Thapa, R. B., and Matin, M. A., Springer International Publishing, Cham, 103–125, https://doi.org/10.1007/978-3-030-73569-2_6, 2021.
U.S. Army Corps of Engineers, Institute for Water Resources, and Hydrologic Engineering Center, CEIWR-HEC: HEC-RAS river analysis system, 2D modeling user's mannual, Institute for Water Resources, Hydrologic Engineering Center, Davis, USA, 289 pp., https://www.hec.usace.army.mil/confluence/rasdocs/r2dum/latest (last access: 5 February 2026), 2021.
Wang, W., Zhang, T., Yao, T., and An, B.: Monitoring and early warning system of Cirenmaco glacial lake in the central Himalayas, Int. J. Disast. Risk Re., 73, https://doi.org/10.1016/j.ijdrr.2022.102914, 2022.
World Bank: Bhutan – Institutional Strengthening and Modernization of Hydromet and Multi-hazard Early Warning Services in Bhutan: A Road Map for 2024-2034 (English)Institutional Strengthening and modernization of hydromet and multi-hazard early warning services in Bhutan: A road map for 2024 to 2034, World Bank Group, Washington, D.C., https://doi.org/10.1596/42315, 2024.
Zhang, G., Bolch, T., Yao, T., Rounce, D. R., Chen, W., Veh, G., King, O., Allen, S. K., Wang, M., and Wang, W.: Underestimated mass loss from lake-terminating glaciers in the greater Himalaya, Nat. Geosci., 16, 333–338, https://doi.org/10.1038/s41561-023-01150-1, 2023a.
Zhang, G., Carrivick, J. L., Emmer, A., Shugar, D. H., Veh, G., Wang, X., Labedz, C., Mergili, M., Mölg, N., Huss, M., Allen, S., Sugiyama, S., and Lützow, N.: Characteristics and changes of glacial lakes and outburst floods, Nature Reviews Earth & Environment, 5, 447–462, https://doi.org/10.1038/s43017-024-00554-w, 2024.
Zhang, G., Yao, T., Huss, M., Carrivick, J. L., Bolch, T., Li, X., Zheng, G., Peng, M., Wang, X., Steiner, J., Rashid, I., Rinzin, S., Wangchuk, S., Sattar, A., Tiwari, R. K., Quincey, D., and Ali, F.: A monitoring network for mitigating Himalayan glacial lake outburst floods, B. Am. Meteorol. Soc., 106, E2579–E2597, https://doi.org/10.1175/bams-d-24-0290.1, 2025a.
Zhang, T., Wang, W., An, B., and Wei, L.: Enhanced glacial lake activity threatens numerous communities and infrastructure in the Third Pole, Nat. Commun., 14, https://doi.org/10.1038/s41467-023-44123-z, 2023b.
Zhang, T., Wang, W., Kougkoulos, I., Cook, S. J., Li, S., Iribarren-Anacona, P., Watson, C. S., An, B., and Yao, T.: High frequency of moraine-dammed lake outburst floods driven by global warming, Nat. Commun., 16, 11173, https://doi.org/10.1038/s41467-025-67650-3, 2025b.
Zheng, G., Mergili, M., Emmer, A., Allen, S., Bao, A., Guo, H., and Stoffel, M.: The 2020 glacial lake outburst flood at Jinwuco, Tibet: causes, impacts, and implications for hazard and risk assessment, The Cryosphere, 15, 3159–3180, https://doi.org/10.5194/tc-15-3159-2021, 2021a.
Zheng, G., Allen, S. K., Bao, A., Ballesteros-Cánovas, J. A., Huss, M., Zhang, G., Li, J., Yuan, Y., Jiang, L., Yu, T., Chen, W., and Stoffel, M.: Increasing risk of glacial lake outburst floods from future Third Pole deglaciation, Nat. Clim. Change, 11, 411–417, https://doi.org/10.1038/s41558-021-01028-3, 2021b.
Zhou, H., Wang, J. A., Wan, J., and Jia, H.: Resilience to natural hazards: a geographic perspective, Nat. Hazards, 53, 21–41, https://doi.org/10.1007/s11069-009-9407-y, 2009.