the Creative Commons Attribution 4.0 License.
the Creative Commons Attribution 4.0 License.
 | 07 Feb 2025
Compound events in Germany in 2018: drivers and case studies
Elena Xoplaki
Florian Ellsäßer
Jens Grieger
Katrin M. Nissen
Joaquim G. Pinto
Markus Augenstein
Ting-Chen Chen
Hendrik Feldmann
Petra Friederichs
Daniel Gliksman
Laura Goulier
Karsten Haustein
Jens Heinke
Lisa Jach
Florian Knutzen
Stefan Kollet
Jürg Luterbacher
Niklas Luther
Susanna Mohr
Christoph Mudersbach
Christoph Müller
Efi Rousi
Felix Simon
Laura Suarez-Gutierrez
Svenja Szemkus
Sara M. Vallejo-Bernal
Odysseas Vlachopoulos
Frederik Wolf
Europe frequently experiences a wide range of extreme events and natural hazards, including heatwaves, extreme precipitation, droughts, cold spells, windstorms, and storm surges. Many of these events do not occur as single extreme events but rather show a multivariate character, known as compound events. We investigate the interactions between extreme weather events, their characteristics, and changes in their intensity and frequency, as well as uncertainties in the past, present, and future. We also explore their impacts on various socio-economic sectors in Germany and central Europe. This contribution highlights several case studies with special focus on 2018, a year marked by an exceptional sequence of compound events across large parts of Europe, resulting in severe impacts on human lives, ecosystems, and infrastructure. We provide new insights into the drivers of spatially and temporally compound events, such as heat and drought, and heavy precipitation combined with extreme winds, and their adverse effects on ecosystems and society, using large-scale atmospheric patterns. We also examine the interannual influence of droughts on surface water and the impact of water scarcity and heatwaves on agriculture and forests. We assess projected changes in compound events at different current and future global surface temperature levels, demonstrating the need for improved quantification of future extreme events to support adaptation planning. Finally, we address research gaps and future directions, stressing the importance of defining composite events primarily in terms of their impacts prior to their statistical characterisation.
- Article
(9601 KB) - Full-text XML
-
Supplement
(782 KB) - BibTeX
- EndNote


Extreme temperatures, strong extratropical low-pressure systems, and their associated extreme winds and heavy precipitation events can have devastating socio-economic impacts. Moreover, the combination of otherwise regular climate and weather phenomena can unfold their effects beyond the individual events (Ridder et al., 2020) and have devastating consequences and impacts (Ridder et al., 2022; Bevacqua et al., 2017, 2021, 2023, and references therein). Thus, human and natural systems that are usually able to handle the impacts of single extreme events are challenged by the co-occurrence of two or more extremes (compound events, CEs), which severely increase the risk of loss and damage (Toreti et al., 2019a). Events with additive and multiplicative effects are of utmost importance and can result from mutually reinforcing cycles and/or positive feedback between individual events. Interrelated events, e.g. through land surface–atmosphere interactions or atmospheric moisture conditions, modify extreme events (Wang et al., 2022). The effects may also develop through atmospheric dynamics that connect features such as the 2010 Russian heatwave and the 2010 flood in Pakistan (Barriopedro et al., 2011; Lau and Kim, 2012; Zscheischler et al., 2018) or through induced responses at distant areas of significant impact to the global system (Vogel et al., 2019).
The Intergovernmental Panel on Climate Change (IPCC; Seneviratne et al., 2012) defines CEs as (1) two or more extreme events occurring simultaneously or successively, (2) a combination of extreme events with underlying conditions that amplify the impact of the events, or (3) a combination of events that are not themselves extremes but lead to an extreme event or impact when combined. This definition is embedded within the IPCC risk framework under the umbrella of a combination of multiple drivers and/or hazards that contribute to societal or environmental risks. Also embedded in this framework is the understanding that response to an imminent risk can, in its own right, serve to reduce or to increase future risks. CEs often lead to disproportionate impacts on people and ecosystems (Seneviratne et al., 2012; Leonard et al., 2014; Caldeira et al., 2015; Bastos et al., 2021). Quantifying the probability of CEs in today's and the future's climate is of great importance, specifically for adaptation planning for various sectors, including agriculture, fisheries, river transport, energy supply, tourism, etc. (Zscheischler and Fischer, 2020). Recently, Zscheischler et al. (2020) extended the definition of CEs and classified them into (1) preconditioned events, where a weather-driven or climate-driven precondition aggravates the impacts of a climatic impact driver; (2) multivariate events, where multiple drivers and/or climatic impact drivers lead to an impact; (3) temporally compounding events, where a succession of hazards leads to an impact; and (4) spatially compounding events, where hazards in multiple connected locations cause an aggregated impact. Drivers include processes, variables, and phenomena in the climate and weather domain that may span multiple spatial and temporal scales (Zscheischler et al., 2020). Current research on weather and climate impacts, risks, and damages often underestimates the influence of CEs (Ridder et al., 2021). It is therefore essential to adapt research strategies and tools, such as models, to integrate compound weather and climate events, enabling a more accurate assessment of uncertainties, impacts, and risks. Further, anthropogenic climate change is expected to influence the frequency and intensity of CEs, and thus future planning for such changes requires reliable climate models that can represent these hazards, their underlying drivers, and their combinations. Despite this importance, studies evaluating climate model representation of CEs are still rare (Aalbers et al., 2023; Bevacqua et al., 2023; Manning et al., 2023). Further, the impact of climate change on dynamic changes in the atmosphere and, consequently, on the location and magnitude of extreme events and their compounds is less well understood (IPCC, 2023a). This also holds true for CEs, which are naturally even more complex due to their multivariate character, also in terms of the complexity of the atmospheric circulation state. For instance, the COVID-19 pandemic has brought the dynamics of compound hazards and risk–response feedback to the forefront of hydrometeorological hazard response and preparedness (Simpson et al., 2021; Zaitchik et al., 2022). Compound hazards are rare, and those that, for instance, involve a disease such as COVID-19 have no recent precedent. The more complex CEs become, the clearer are the limitations of the conventional statistical approaches to risk assessment (Zaitchik et al., 2022).
The development of integrated research on CEs is the objective of the European COST Action DAMOCLES (http://www.damocles.compoundevents.org, last access: 19 October 2024) that combines research efforts in this field and toward which several of the authors actively contribute. One of the main knowledge gaps identified concerns how the compound character of events is changing in a warming world and will continue to change during future decades. The question on how and why extreme weather events affecting specifically Germany and central Europe may change in a warming climate is the major topic of the climXtreme project (https://climxtreme.net/, last access: 19 October 2024), under the framework of which this work has been conducted, aiming to analyse and understand the dynamics of extreme climate events, their impacts, and potential future trends in a changing climate. To analyse hot and dry compounds, a variety of research questions and approaches are explored: at the global scale, the precursors of spatially and temporally CEs are analysed using large-scale atmospheric patterns and jet stream states. At the European scale, the detection and identification of events and the spatial representation of key climate variables in relation to heatwaves are investigated. Focusing on Germany, the interannual influence of droughts on surface water is analysed, and the impact of water scarcity and heatwaves on agriculture and forests is studied. Further, the CEs including precipitation and/or wind as a hazard are analysed focusing on a series of windstorms and convective storms with adverse impacts on ecosystems and society.
All case studies presented in this paper are selected from the calendar year 2018, which is of particular interest given the prolonged and persistent dry and hot conditions across large parts of Europe, as well as featured storms Eleanor and David (called Burglind and Friederike in Germany and hereafter) in January 2018 and several weeks of thunderstorm activity in May and June. The year 2018 was also characterised by strong wind gusts that co-occurred with heavy snowfall during the windstorm Friederike (Vautard et al., 2019) and a relatively dry spring with exceptionally high temperatures followed by an extremely dry summer with very warm mean temperatures over large areas of Europe (Munich RE, 2019; Zscheischler and Fischer, 2020). Total precipitation in central Europe was at the lowest percentiles relative to the 1976–2005 distribution; Germany experienced a reduction in precipitation of ∼ 53 % in July and ∼ 46 % in August compared to the period 1981–2010 (Deutscher Wetterdienst, 2018). The summer of 2018 in Germany was characterised by the most extreme combination of high temperatures as one of the warmest years on record (Kaspar et al., 2023) and as having the lowest precipitation since 1881 (Zscheischler and Fischer, 2020). The combination of the individual events caused tremendous adverse and detrimental impacts in larger areas of western Europe, with a peak over Germany, and in a variety of sectors, including agriculture, society (Manning et al., 2018; Toreti et al., 2019b; Zscheischler and Fischer, 2020; Conradt et al., 2023; Shyrokaya et al., 2024), forestry (Bastos et al., 2020; Buras et al., 2020; de Brito et al., 2020; Senf and Seidl, 2021; Knutzen et al., 2025), and ecology (Bastos et al., 2021), with impacts on soil and surface water (Liu et al., 2020; Brakkee et al., 2022; Hartick et al., 2021), the marine environment (Kaiser et al., 2023), and human health (Matzarakis et al., 2020; Conradt et al., 2023), causing fires (Munich Re 2019; Bastos et al., 2020), traffic disruptions, power outages, property damage by e.g. falling trees, and fatalities (Vautard et al., 2019). The exceptional heatwave of 2018 also caused many nuclear power plants to shut down because the rivers could not provide sufficient cooling capacity for the reactors (Vogel et al., 2019). In addition, Blauhut et al. (2022) surveyed stakeholders across Europe regarding their perceptions of the 2018–2019 drought and drought risk management in their respective countries. Germany was identified as being aware of drought risks but among the least prepared, lacking a formal management plan.
We study this exceptional year and the series of extremes and CEs at large scale, focusing on their detection, spatial representation, and long-term impacts on soil moisture at the continental scale, as well as the consequent agriculture and forestry impacts at the national scale. The paper first outlines the data and methodologies used for analysing the selected CEs in 2018, followed by a detailed analysis of each case study. These case studies are categorised into temperature–precipitation and precipitation–wind CE storylines, along with an evaluation of their impacts in Germany.
Different methodological approaches have been used, tailored to the different types of CEs, ranging from a better understanding of the selected event drivers to sectoral impact assessments. This section summarises these approaches and provides a basis for the study and analysis of the selected case studies separated into temperature–precipitation and precipitation–wind CEs. The temperature–precipitation storyline includes an analysis of the drivers of the hot summer of 2018, the detection of extreme events and spatial patterns, an assessment of the impact of the 2018 European drought on soil moisture and groundwater, and an evaluation of the sectoral impacts on agriculture and forestry. The storyline is complemented with an assessment of model simulations to realistically represent conditions similar to those of 2018 in Germany. The precipitation–wind storyline comprises the analysis of intense low-pressure systems in the winter of 2018, their life cycle, and their triggering role for compound precipitation and wind events, as well as severe convective storms during the 2018 warm season. Considering the nature of the various case studies and events during the warm season of 2018 and given the focus on compound events in this study, we aim to define the characteristics of the events analysed and their interrelationships. Additionally, a range of relative thresholds, such as the 90th, 95th, and 98th percentiles, appropriate for each variable and elaborated impact are used to define extremes, and we provide explanations for their application.
2.1 Drivers of the hot summer of 2018
To better understand the drivers of the hot summer of 2018, Rousi et al. (2022) identified jet states in the zonal mean zonal wind over the Eurasian sector at different pressure levels for the summer months in ERA5 data (Hersbach et al., 2020) using self-organising maps (SOMs; see Kohonen, 2013; Rousi et al., 2015). A comparative approach with different cluster numbers, clustering algorithms, and initialisations of SOMs led to a robust cluster of double jet states. Increased persistence of those jet states was connected to heatwave events, defined as a period of at least 3 consecutive days of daily maximum temperature threshold exceedance > 90th percentile following Fischer and Schär (2010) and a spatial extent over 40 000 km2 within a 4° × 4° spatial sliding window, similar to Stefanon et al. (2012), across western Europe (Rousi et al., 2022).
2.2 Detection of spatial patterns of extreme events
The analysis of the large-scale temperature and precipitation deficit patterns and their expression during the 2018 heatwave at the European scale is based on the cross-tail pairwise dependence matrix (cross-TPDM) and the extreme pattern index (EPI) proposed by Szemkus and Friederichs (2024). Typical spatial patterns of common extremes are derived by singular value decomposition of the cross-TPDM. The cross-TPDM is a measurement of extremal dependence, rooted in extreme value theory, and has comparable statistical properties to the cross-covariance matrix (Szemkus and Friederichs, 2024; Cooley and Thibaud, 2019). The singular vectors of cross-TPDM represent pairs of spatial patterns in which extremes in two variables are likely to occur simultaneously. Consequently, the expansion coefficients provide a time series for each singular vector that summarises the occurrence of extreme events within the respective pattern. The first 10 left and right expansion coefficients are then summarised in the EPI, which is high when individual patterns or a linear combination of leading patterns are particularly strongly pronounced. This pattern-based analysis thus provides a robust measurement of the heatwave and drought intensity over Europe. Before calculating the cross-TPDM and EPI, the ERA5 daily 2 m temperature and precipitation deficits for the summer months (June–August) of 2018 are standardised, and the annual cycle is removed. Precipitation deficits are calculated as the inverse of the 90 d accumulated precipitation.
2.3 Surface water storage of the dry summer of 2018
To analyse the drought characteristics of the summer of 2018, an ensemble of simulations for the hydrological year 2018/2019 is used (Hartick et al., 2021). The hydrological year 2018/2019 was initialised with land surface and subsurface conditions from the end of the hydrological year 2018 and simulated using different atmospheric boundary conditions. The proposed approach investigates the impact of hydrologic initialisation and soil and groundwater memory on water storage anomalies against the background of atmospheric variability and uncertainty on an interannual timescale. The varying atmospheric initial conditions were derived from the ERA-Interim data for each individual year between 1996 and 2018 and resulted in 22 realisations as the number of individual years within that period. Thus, the ensemble of realisations of the hydrological year 2018/2019 accounts for a large part of the atmospheric uncertainty. The analysis was performed for 20 European river basins. The 2018 drought was defined as the driest 10 % of the total water storage anomalies (S) occurring in 2018 within the climatological time series. Surface water availability for the 2018/2019 hydrological year was represented by surface water storage (Su), categorised into dry, Su,d, and wet, Su,w, anomalies. To ensure that an increased probability of Su,d in the hydrological year 2018/2019 was outside of regular climate variability, we compared the Su,d probability distribution of the described hydrological year 2018/2019 ensemble (Case a) with the probability distribution of Su,d within the climatological time series (Case b); see also the corresponding section below. Two beta distributions were generated, one for each case, by applying a prior with no information. We sampled each beta distribution 10 000 times and calculated the probability of Case a > Case b to determine the confidence that the probability of Su,d after a drought is greater than the climatological variability. In addition, we obtained the uncertainty of the confidence intervals by bootstrapping 1000 times over the climatological time series. The methodology provides a probabilistic insight into the impact of a groundwater drought on future surface water resources on an interannual timescale.
2.4 Soil moisture of the dry summer of 2018
In addition to the dry surface water anomaly in central Europe, soils showed moisture deficits (Liu et al., 2020; Bastos et al., 2020; Rousi et al., 2023; Conradt et al., 2023). This likely caused low groundwater levels (Brauns et al., 2020; Conradt et al., 2023), as infiltration of precipitation water is considered to be the most important groundwater source in central Europe (Brakkee et al., 2022). ERA5 soil moisture was evaluated for the four soil layers over the period 2018–2020 and compared against the climatology averaged over 1991–2020 in order to assess the strength of the soil moisture deficit and its persistence during the consecutive drought years 2018–2020. For this analysis, time series of daily means and centred 92 d running means were computed for all land points of the study area over 45–55° N and 4–16° E, covering Germany and adjacent regions. The evaluation of soil moisture in the lowest soil layer also gives an indication of the groundwater reservoir as it interacts with the aquifer in the modelling system (Cerlini et al., 2021).
2.5 Agricultural and hydrological drought of the year 2018
A lack of sufficient soil moisture, resulting from a shortage of precipitation and excess evapotranspiration, leads to agricultural drought. A lack of run-off and surface water results in hydrological drought (streamflow deficits) (IPCC, 2023b). To estimate the severity of agricultural and hydrological droughts across Europe during the summer of 2018, we employed the nitrogen version of the vegetation, crop, and hydrology model LPJmL (Schaphoff et al., 2018; von Bloh et al., 2018; Lutz et al., 2019; Herzfeld et al., 2021). The analysis is based on 69 years (1951–2019) obtained from model simulations driven with daily temperature, precipitation, and radiation data from the GSWP-W5E5 dataset (Kim, 2017; Cucchi et al., 2020; Lange et al., 2022) at 0.5 arcdeg resolution. To assess agricultural drought, the evapotranspiration deficit calculated as the ratio of actual evapotranspiration to potential evapotranspiration ( ratio) over the growing season of maize in each year is determined, and a generalised beta distribution (a three-parameter probability distribution for variables in a bounded interval) is fitted to the 69 annual values in each grid cell. An ratio of less than 1 indicates water deficit or water stress. For the assessment of the hydrological drought, the average river discharge (Dis) during the summer months (June, July, and August) of each year is determined, and a generalised gamma distribution (a three-parameter probability distribution for non-negative variables) is fitted to the 69 annual values in each grid cell. Using the fitted distributions, the return period of the conditions in 2018 is determined. To support comparability with other drought indices such as the Standardized Precipitation Evapotranspiration Index (SPEI), the drought severity is also calculated, which is the probability (inverse of return period) of a given year expressed as its distance from the mean (in number of standard deviations) in a standard normal distribution (McKee et al., 1993; Vicente-Serrano et al., 2010). For example, a return period of 44 years is equivalent to the 2.28th percentile, which is −2 standard deviations away from the mean and would be assigned a drought severity of −2.
2.6 Impact on the agricultural production of 2018
In comparison with the past 3 decades, the year 2018 was identified as a year with severe winter wheat yield losses estimated using a compilation of locally estimated scatterplot smoothing (LOESS; to take into account improvement of agricultural practises, Zampieri et al., 2017) detrended and gap-filled yield data at county level aggregated from a variety of sources, including the Regionaldatenbank Deutschland (Statistische Ämter des Bundes und der Länder, 2021) and the statistical offices of the federal states of Germany (datasets in JLUpub research data repository). The resulting annual gridded yield data were evaluated using the Standardized Yield Anomaly Index (SYAI) that expresses yield anomalies in terms of standard deviation from a 30-year time series. The analysis is based on the Heat Magnitude Day Index (HMDI) (Zampieri et al., 2017), the drought index SPEI (Vicente-Serrano et al., 2010), and the Combined Stress Index (CSI) (Zampieri et al., 2017) that accounts for stress compounds of heat and drought through a (ridge-regression-based) superimposition of HMDI and SPEI, using the temperature and precipitation series from E-OBS (Cornes et al., 2018). In order to derive crop-relevant results, all indices were evaluated for the most vulnerable stages of phenological crop development according to the specific region using the German Weather Service (DWD) phenological dataset (Kaspar et al., 2015). A spatially explicit linear regression between yield anomaly and stress indices was computed for time series covering the past 3 decades, and the coefficient of determination (R2) was calculated to express the proportion of yield anomaly that can be explained by heat, drought, or compound stress.
2.7 Loss and damage of compound vs. non-compound wind extreme events of the winter of 2018
The precipitation–wind storyline starts with a description of the synoptic situation during the winter season of 2018. The cyclone track analysis in this section is based on the cyclone-tracking methodology of Murray and Simmonds (1991) and Pinto et al. (2005) applied to ERA5 data (Hersbach et al., 2020).
Loss and damage in this section are defined according to the UN Framework Convention on Climate Change (UNFCCC) as the harm caused by anthropogenic (human-generated) climate change (UNFCCC, 2024; OECD, 2021, and references therein). For the quantitative assessment of the impact of CEs in terms of loss and damage, a compound wind and precipitation extreme is defined when both variables exceed their local 98th percentile (Martius et al., 2016). For winter events, these percentiles are calculated using data from the December to February season. Co-occurrence is defined when wind gusts and precipitation both exceed their respective 98th percentile at a specific grid box, with precipitation exceedance occurring on the same day, the day before, or the day after, within a 50 km radius around the grid box centre.
The daily loss data for residential buildings accumulated over Germany provided by the German Insurance Association (GDV) are categorised by days on which a CE occurred and days on which it did not. This results in two separate loss distributions for compound and non-compound events.
2.8 Concurrent heavy rain and storm extremes – estimation of probability of event occurrence
The estimation of the probability of occurrence of compound heavy rain and wind is carried out on precipitation and wind time series from DWD weather stations. Multivariate distributions in the form of copulas are used to determine the probability of occurrence of combined events. Copulas make it possible to model the dependency structure of the variables under consideration independently of their marginal distributions (e.g. Manning et al., 2024, and references therein). This allows for the use of any distribution function for the marginal distributions.
We carried out fitting tests for both the marginal distributions and the copulas. However, Archimedean copulas are generally preferred when dealing with hydrological parameters (Bender, 2015; Jane et al., 2020). In this particular case, the Frank copula (Frank, 1979) was chosen as the most appropriate option. The Frank copula is a one-parametric copula in which the copula parameter theta can be determined from the correlation between random variables. The approach treats the extremes of the two variables (rain and wind) separately. The annual maximum values (AMAXs) are extracted from the time series and tested for statistically significant trends using the Mann–Kendall test at a 5 % significance level. Stationary methods of extreme value statistics are applied, requiring the assumption of independence and identical distribution of all time series. Consequently, series with significant trends are homogenised using linear regression. The distribution parameters of the strong wind and precipitation datasets are then determined using maximum likelihood. In addition, the correlation between heavy rain and storms is calculated using the Kendall rank correlation. For each AMAX wind value, the concurrent precipitation value is selected and vice versa. To ensure the independence of precipitation events, wet episodes are separated by a dry period of at least as long as the accumulation period. Due to this restriction, not all AMAX wind events can be paired with a precipitation episode, even when precipitation is present; e.g. for longer precipitation durations (> 1 d) and considering a ±2 d window, no AMAX wind and precipitation episode pairs exist. Subsequently, these pairs of values are applied to adjust the marginal distributions and copulas, thereby determining the combined probabilities of occurrence.
2.9 Rockfall events
Rockfall is an impact that can be triggered by extreme precipitation (e.g. Nissen et al., 2022). Favourable preconditions, such as previous freeze–thaw cycles and enhanced subsurface moisture, increase the susceptibility to such events. A logistic regression model, describing the probability of rockfall in the central European low mountain ranges as a function of meteorological (pre-)conditions, was fitted using the Rupp and Damm (2020) database of rockfall events. To find the optimal statistical model, a large number of models including different atmospheric predictors and interaction terms between the predictors were compared. The best model was selected based on the logarithmic skill score determined during cross validation. The best-performing model includes the across-site percentile of a fissure water proxy D (precipitation minus potential evaporation determined for the last 5 d), the local percentile of daily precipitation, and the binary information if a freeze–thaw cycle has occurred within the last 9 d. It also considers the interaction between daily precipitation and D. By including several meteorological parameters, the statistical model describes the multivariate compounding nature of rockfall initialisation. By taking preconditions into account, the preconditioned compounding component is addressed. Using the statistical model, the probability of a rockfall event can be determined for each day from the meteorological conditions of the previous 9 d and the day itself. Details of the statistical model can be found in Nissen et al. (2022).
2.10 Convective cluster events of the summer of 2018
Convective cluster events (CCEs) are spatially connected areas of intense lightning activity that occur simultaneously in the same geographic region. CCEs can be detected using the Spatial-Temporal Density-Based Spatial Clustering of Applications with Noise (ST-DBSCAN) algorithm (Ester et al., 1996; Birant and Kut, 2007). The data used are cloud-to-ground lightning strokes from the European Cooperation for Lightning Detection (EUCLID) network (Schultz et. al., 2016). ST-DBSCAN is further developed and specifically adapted for the detection of the spatio-temporal clustering of lightning strokes (Augenstein et al., 2024). The algorithm identifies arbitrarily shaped clusters in a set of given points, which in this case are spatio-temporally close lightning strokes. For the identification of CCEs, thresholds from sensitivity studies have been used; i.e. if at least 40 lightning strokes occur within 20 min and 50 km, single lightning strikes are marked as belonging to a CCE. These thresholds have proven to be an “optimal” balance to distinguish between lightning clusters and noise.
2.11 Occurrence of extreme compound events from recent to near-term future climate conditions
The estimation of the projected changes in the frequency of CEs from recent to near-term future climate conditions is based on the 30-member CMIP6 MPI-GE (Olonscheck et al., 2023). The historical and SSP5-8.5 (Riahi et al., 2017) simulations for the periods 1975–2025 and 2025–2075 are used, representing climate conditions that for the CMIP6 MPI-GE have ranged from about a 1 to 3 °C increase in global mean surface temperature since pre-industrial times (Olonscheck et al., 2023). The projections cover Germany and more specifically the region defined by the 45–55° N and 4–16° E latitude–longitude domain. The compound heat and drought years are defined by the cumulative precipitation from May to October and the mean daily maximum temperature from June to August, spatially averaged over Germany. Extreme compound hot and dry years exceed the 20-year return levels for both precipitation deficit and maximum temperature individually, defined as the 5th and 95th percentiles, respectively, for the period 1975–2025. The compound precipitation–wind years are defined based on the winter (December to February) daily mean precipitation and daily maximum surface wind. The selection of events is based on the exceedance of the 98th percentile for wind and precipitation during the period from 1975 to 2025. For each grid cell, wind and precipitation events are identified when they exceed this threshold on the same day, while for precipitation alone, the exceedance can occur on either the same day or the day after. The cumulative effect for the whole season is the sum of all daily occurrences over all winter days and each grid cell. Extreme compound wind and precipitation years exceed the 20-year return levels for precipitation and wind individually, defined as the 95th percentile of each variable for the period 1975–2025.
2.12 Representation of moisture availability of 2018 in model simulations
The performance of model simulations in realistically representing drought conditions like those of 2018 and the 2018–2020 3-year drought cluster of events is assessed based on the estimated trend of the warm season (March to August) moisture availability in Germany. Drought conditions are described with the SPEI index (Vicente-Serrano et al., 2010) for observations, using ERA5 data (Hersbach et al., 2020) for the period 1979–2019, and for bilinearly interpolated (regular 0.5° long–lat grid) and extended to 2021 ensemble simulations of CMIP5 (Taylor et al., 2012; Aalbers et al., 2023) global circulation models and the EURO-CORDEX 0.11° (Giorgi et al., 2009) regional multi-model ensemble for the historical (1950–2005) and the near- to mid-term future (2006–2070) periods under RCP8.5. The linear trend of the 3-year running mean for the March to August intervals is calculated over the periods 1975–2021 for the simulations (1979–2019 for ERA5) and 2022–2070 in order to account for the transition from a dimming to a brightening regime in the 1970s (Wild, 2009, 2016).
3.1 Temperature–precipitation compound events during 2018
The exceptionally hot and dry conditions in 2018 extended over larger areas including central and northern Europe and were associated with impacts on various economic sectors (e.g. Toreti et al., 2019a; Zscheischler and Fischer, 2020; Bastos et al., 2020; Conradt et al., 2023; Shyrokaya et al., 2024).
3.1.1 Drivers of the hot summer of 2018
The 2018 heatwave was a spatially CE featuring concurrent heatwaves in Scandinavia and central Europe (Spensberger et al., 2020; Rousi et al., 2023). Prior to the 2018 heatwave, a striped high-pressure system formed over northern Europe in late June, during a combination of the positive phase of the North Atlantic Oscillation and the Rossby wave-7 pattern (Drouard et al., 2019; Kornhuber et al., 2019). Figure 1 presents the jet stream state during the 2018 summer and the heatwave day frequency for each grid point over the Eurasian sector. During the intense European summer heatwave, a large blocking system at 500 hPa and a double jet stream configuration are visible in the 250 hPa zonal wind field (Kornhuber et al., 2019, 2020; Rousi et al., 2023; see “Data and methods”, Sect. 2.1). Heatwave hot spots over Europe coincide with areas of weak winds between the polar and subtropical jets. Such large-scale atmospheric conditions are conducive to the occurrence of extreme events over Europe, in particular to heatwaves near the centre of the blocking system (see Kautz et al., 2022, for a review). In particular, the hot summers of 2003 (western and central Europe, Luterbacher et al., 2004; Fink et al., 2004; Fischer et al., 2007; García-Herrera et al., 2010) and 2010 (heatwave over western Russia, Barriopedro et al., 2011; Di Capua et al., 2021; Rousi et al., 2022) were characterised by similar large-scale conditions.
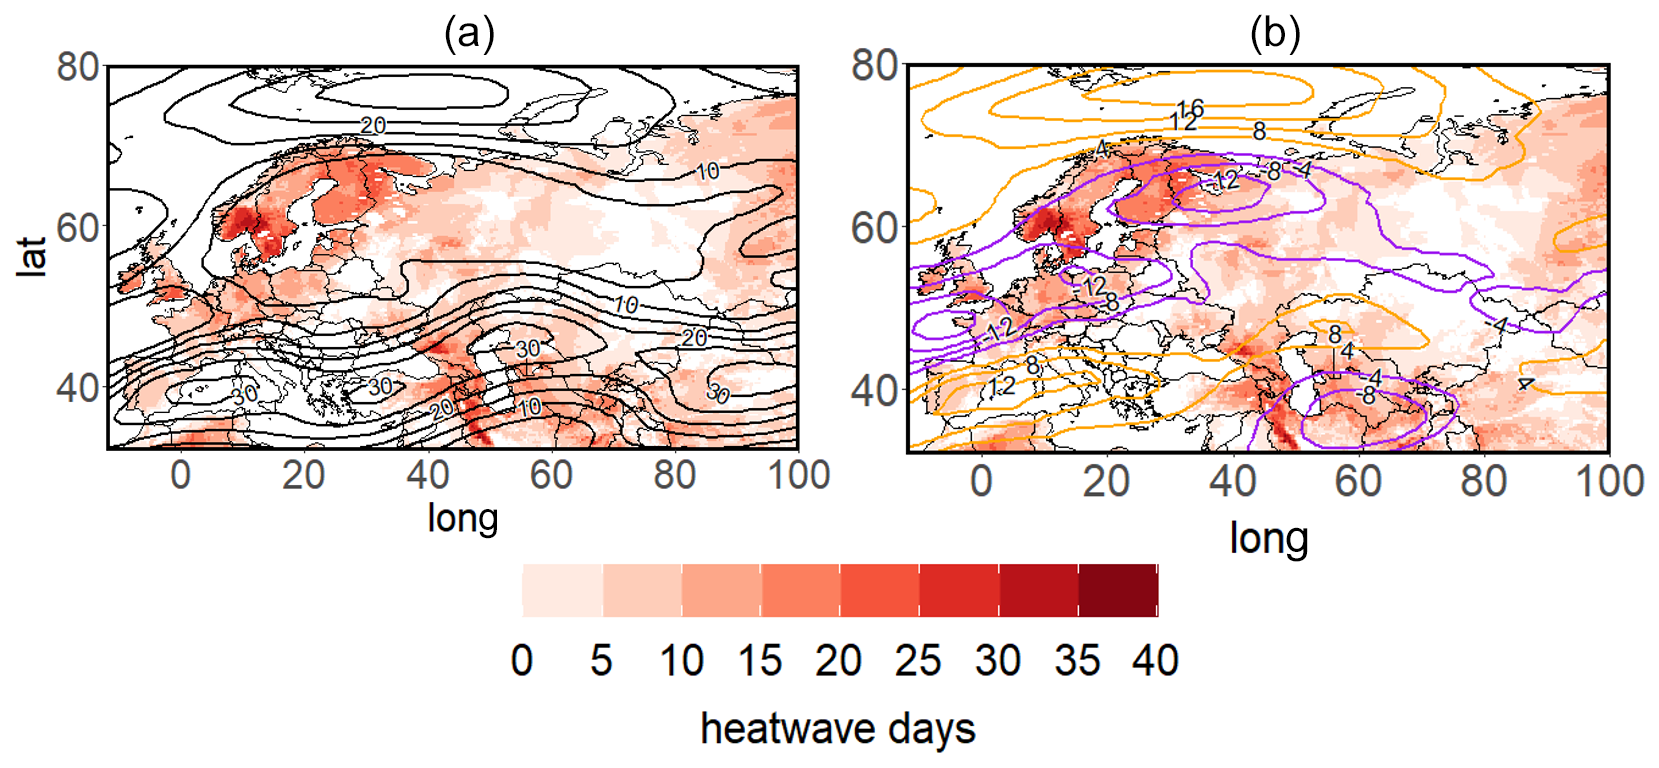
Figure 1Jet stream state (contour lines) and heatwave days in the summer of 2018 (shading). (a) Zonal wind at 250 hPa (black contours from 5 to 30 m s−1 every 5 m s−1). (b) Zonal wind anomalies at 250 hPa (anomalies based on 1979–2020 July climatology and plotted with contours from −16 to 16 m s−1 every 4 m s−1; negative anomalies are shown in purple contours and positive in orange) for the period of 4–25 July 2018, the longest period of consecutive double jet states. All fields stem from ERA5 reanalysis data (Hersbach et al., 2020).
3.1.2 Detection of spatial patterns of extreme events
During the summer of 2018, large-scale temperature (T2m) and precipitation deficit (PD) patterns characterise the exceptional conditions. Figure 2 shows the analysis of a typical pattern of common extremes and their expression during the 2018 heatwaves at the European scale based on cross-TPDM and EPI (see “Data and methods”, Sect. 2.2). In July–August 2018 the pronounced heatwave is accompanied by extreme EPIPD preceding the heatwave for several days. This heatwave is considered the most prominent event in the period under consideration (see also Liu et al., 2020). The negative eigenvector anomalies of the second mode (Fig. 2a, b, bottom left) mostly cover the regions identified as heatwave spots in Fig. 1. Thus, the anomalies in the second-mode expansion coefficients (Fig. 2a, b, bottom right) indicate the beginning of the heatwave, which initially affected northern Europe (i.e. Finland, Norway, and northwestern Russia). From the middle of June onward, there were extremes in PD, particularly in central Europe, as indicated by the third mode of the expansion coefficient (Fig. 2c, d, bottom right). By the end of July 2018, the heatwave extended to central Europe, as evidenced by the abrupt change of sign in the third-mode expansion coefficient (Fig. 2c, d, bottom right).
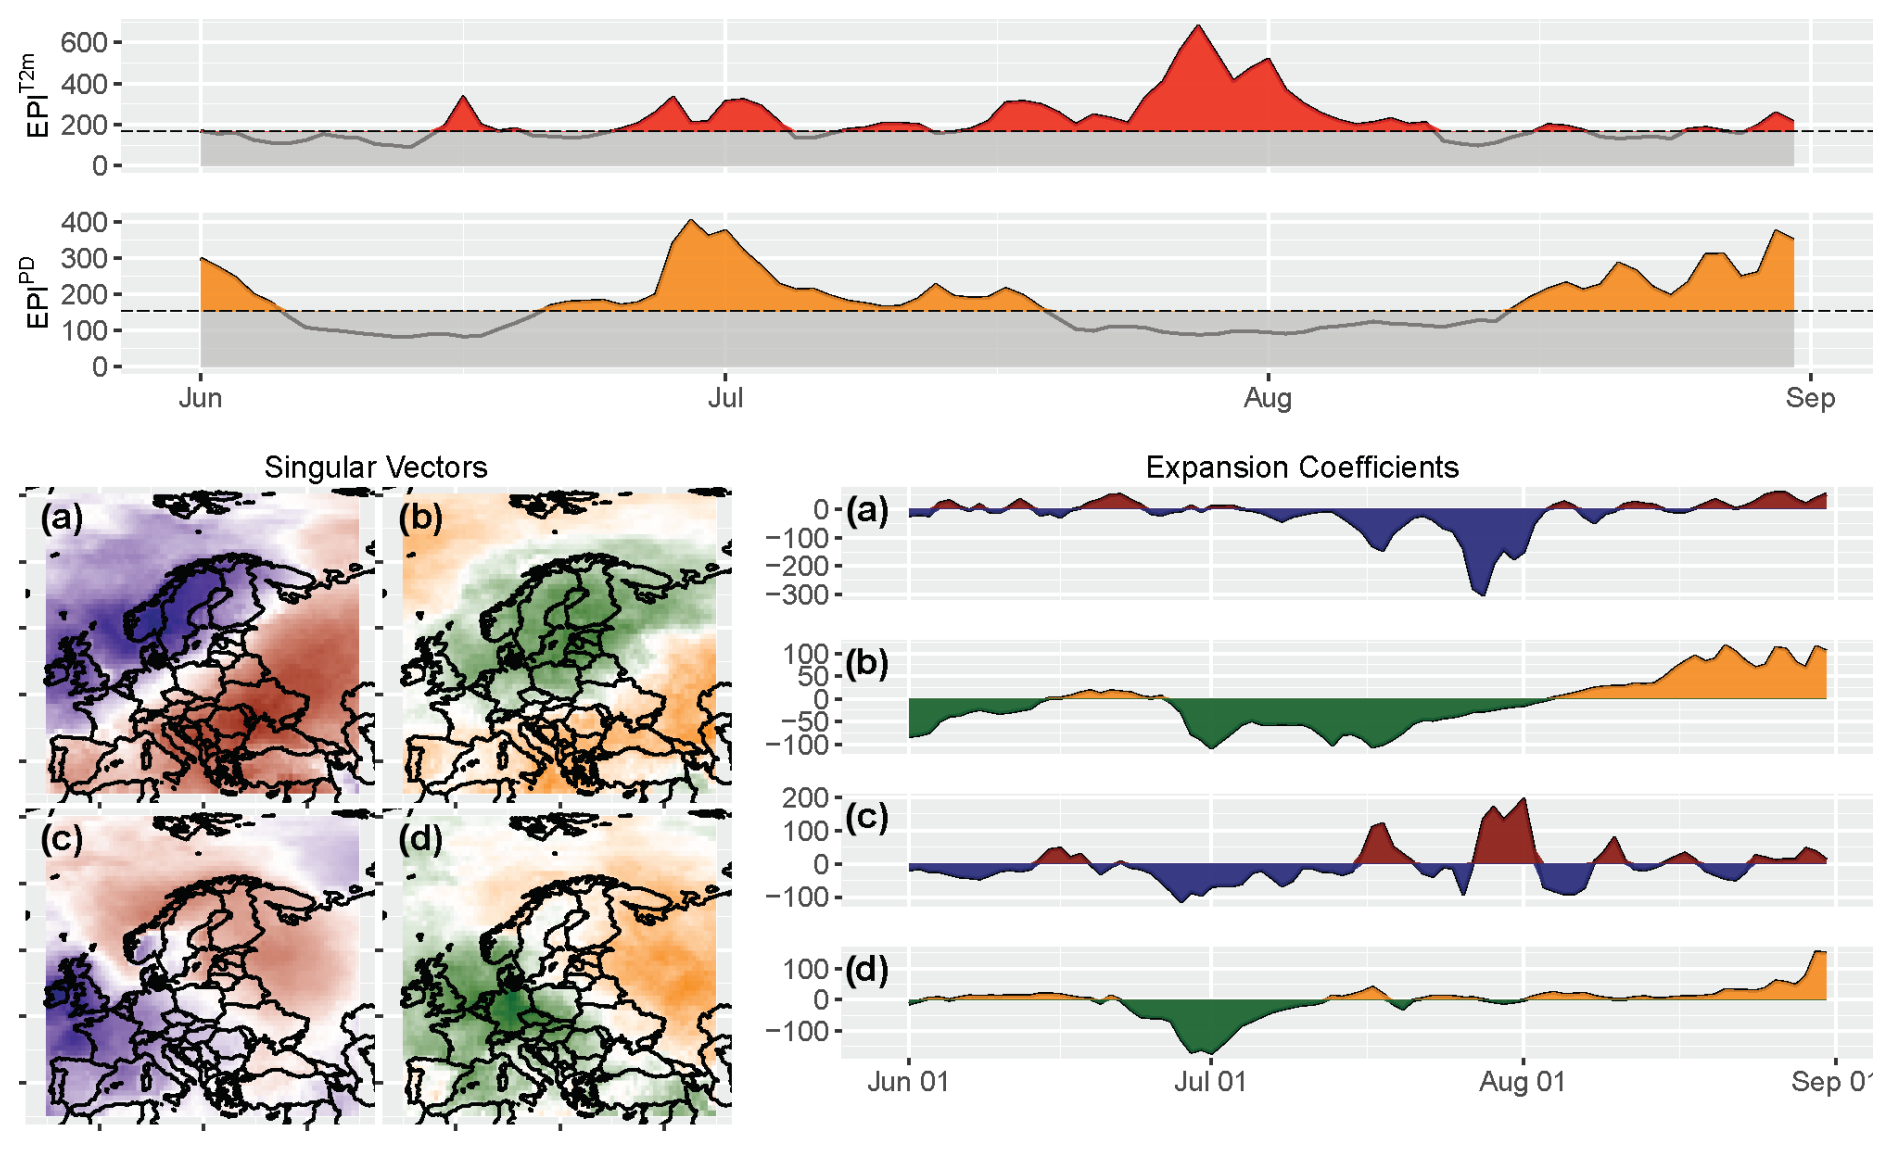
Figure 2Top: extreme pattern index (EPI) for T2m surface temperature (EPIT2m, red) and precipitation deficit (EPIPD, orange) for Northern Hemisphere 2018 summer months. Values exceeding the 80th percentile are considered to identify extreme events in PD and T2m from EPI and are highlighted in red and orange, respectively. Bottom left: second (a, b) and third (c, d) singular vectors (CVs) associated with large-scale temperature (blue/red) and precipitation deficit (green/orange) patterns. Bottom right: second (a, b) and third (c, d) expansion coefficients for Northern Hemisphere 2018 summer months. Positive values are plotted in red/orange and negative values in blue/green.
3.1.3 Surface water storage of the dry summer of 2018
The high temperature in 2018 was mainly due to increases in the amount of net surface radiation caused by the clear skies associated with reduced precipitation (Liu et al., 2020). Germany experienced a strong increase in net radiation of approximately +31 %. Liu et al. (2020) report that land cover played a critical role in determining the occurrence and strength of soil moisture–temperature coupling; i.e. cropland and grassland depletes soil moisture more readily than forests, thereby triggering a more rapid release of sensible fluxes, a major feature observed during the 2018 heatwave. During the 2018 heatwave, because of different soil moisture conditions, latent flux in Germany decreased by 12 %, and sensible flux significantly increased by 122 % (Liu et al. 2020). Further, Bastos et al. (2020) used 11 vegetation models and showed that spring conditions promoted increased vegetation growth, which, in turn, contributed to fast soil moisture depletion, amplifying the summer drought. Figure 3 presents the groundwater memory in the summer of 2019 of the ensuing hydrological year 2018/2019 for each of the 20 European river basins with respect to the following year's summer surface water storage (Su). The ensemble simulations indicate that following the 2018 drought, the conditional probability that the autumn of the hydrological year 2018/2019 (August to November 2018) is anomalously dry p(Su,d) is 95.5 % with a 100 ± 0.0 % confidence with respect to the climatological variability. In the following seasons, p(Su,d) and the associated confidence decrease due to the increasing influence of the uncertainty in the atmospheric conditions. Specifically, for winter p(Su,d) is 81.8 % with a confidence of 99.5 ± 0.3 %, for spring (March to May 2019) 63.6 % with a confidence of 80.2 ± 6.0 %, and for summer (June to August 2019) of the hydrological year 2019/2020 p(Su,d) 68.2 % with a confidence of 90.1 ± 3.7 % with respect to the climatological variability. Without considering the groundwater storage memory effect, a probability of a dry surface water anomaly p(Su,d) of ∼ 50 % would be expected due to the atmospheric uncertainty accounted for in the ensemble of realisations at the interannual timescale. Taking drought as a precondition for Su on this scale, the analysis shows that even 1 year later a p(Su,d) of 68 % is still well above 50 % at a confidence level of 90 ± 4 %. Thus, statistically, groundwater storage takes longer than a year to fully recover from a drought, influencing surface water storage, independent of the ambient atmospheric conditions (Lorenz et al., 2010; Orth and Seneviratne, 2012; Song et al., 2019). Recent evidence points to the fact that the impact of global warming on soil moisture drought severity in west-central Europe, such as the case in 2018, is increased. The drought risk is strongly enhanced by the drought intensification and increase in frequency, yielding a shorter recovery time between events for nature and society (Aalbers et al., 2023).
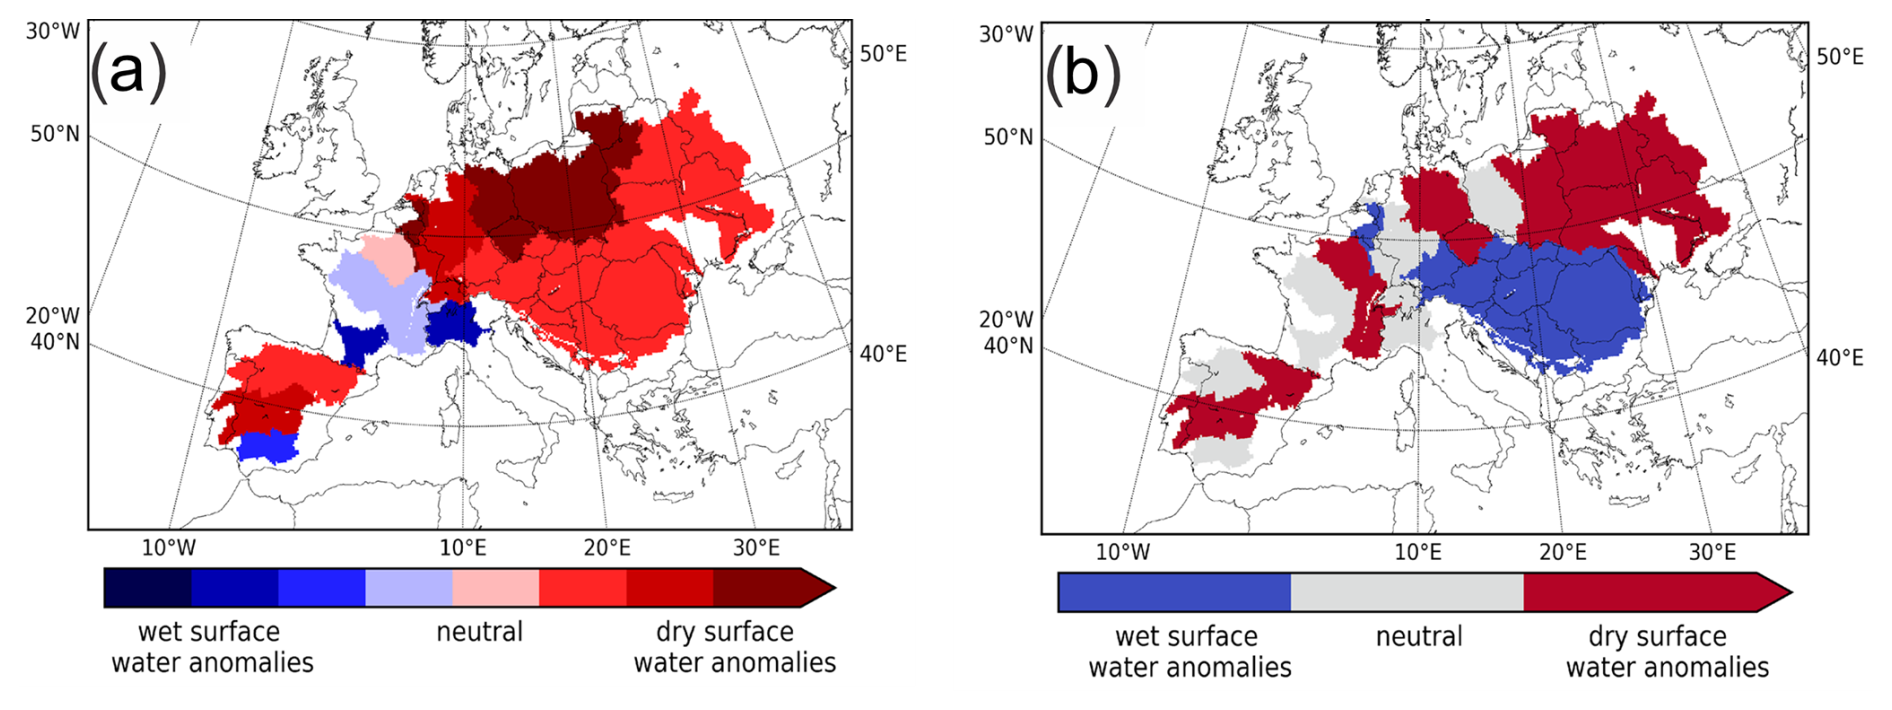
Figure 3Averaged impact of the yearlong 2018 drought on the following year's summer (June to August 2019) surface water storage (Su) anomaly per river basin (see “Data and methods”, Sect. 2.3). (a) Su anomaly in 2018 for each river basin in quartiles; (b) Su anomaly in the summer (June to August 2019) after 2018 initial conditions and (ensemble) mean of 22 atmospheric conditions.
3.1.4 Soil moisture of the dry summer of 2018
To address sectoral impacts (e.g. Conradt et al., 2023), we focus on the effects of the 2018 drought on agriculture and forestry in Germany. For this purpose, the temporal evolution of soil moisture deficits at different depths from the ERA5 dataset and agricultural data from German national institutes such as the Statistisches Bundesamt (Destatis) are analysed. Focusing on the temporal evolution of soil moisture, a deficit developed during the spring and early summer of 2018 (Rousi et al., 2023), which also reached the lowest soil layer with a temporal delay of about 3 months, as shown in Fig. 4. The dryness in 2018 was more intense than the usual soil moisture variability in the period 1991–2020, as shown by the soil moisture dropping below the range of ±1 standard deviation of the 1991–2020 mean soil moisture (shaded area). While the moisture in the three upper soil layers mostly recovered during the following winter of 2018/2019, the moisture did not percolate down to the lowest soil layer, which remained in a dry anomaly. The recurrent drying of the upper layers in the spring and summer of 2019 inhibited considerable infiltration so that the moisture deficit of the lower soil layer persisted until the winter of 2019/2020, when the relatively wet climatic conditions allowed for a recharge of the lower soil layer moisture reservoir (Brakkee et al., 2022) and thus probably also of the groundwater (e.g. Brauns et al., 2020). Hence, the lack of soil moisture reached the entire soil column and thus the entire root zone of the vegetation during the summers of 2018 and 2019, placing the vegetation under soil moisture stress (Tijdeman and Menzel, 2021).
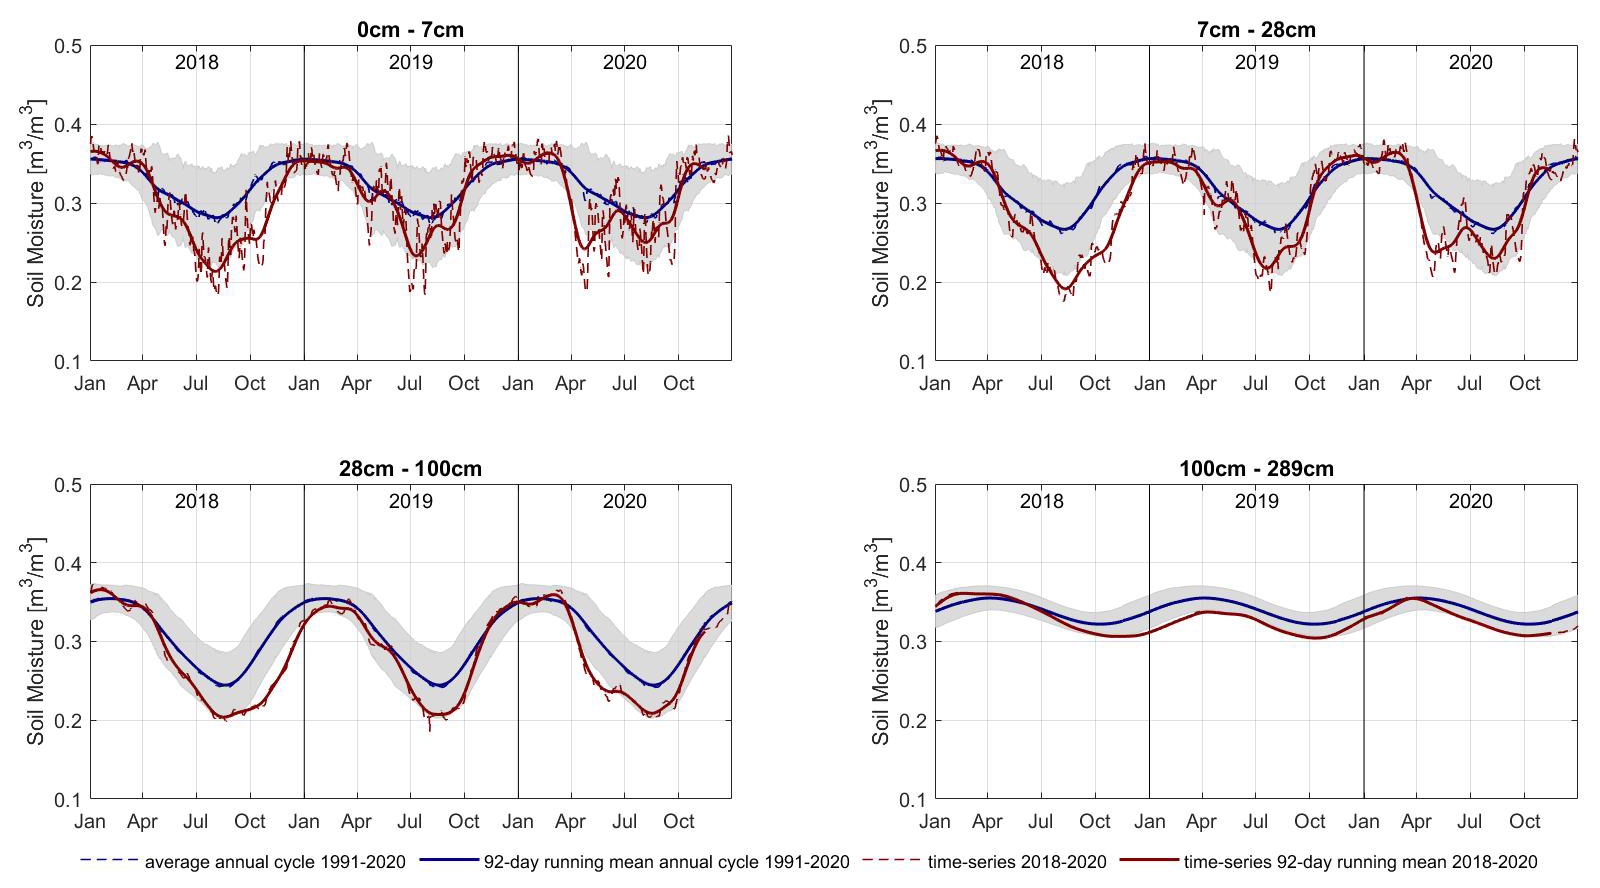
Figure 4ERA5 soil moisture in four different layers from the surface (0–7 cm) to a depth of 2.89 m (100–289 cm) with two intermediate layers of 7–28 and 28–100 cm depth. The dashed red line denotes the daily mean, and the solid red line denotes the 92 d running mean in 2018–2020. The annual cycle of soil moisture with a daily resolution (dashed blue line) and the average running mean (solid blue line) are also shown. The grey shading indicates a range of ±1 standard deviation of soil moisture over the period 1991–2020, indicating a normal year-to-year variability of the soil moisture.
3.1.5 Agricultural and hydrological drought of the year 2018
The anomalous soil moisture conditions are reflected in an anomalously low ratio over the summer months (June, July, August), indicating a severe agricultural drought (Fig. 5, left). In almost the entire northern part of Germany, the agricultural drought index exceeds −2.5, which is equivalent to a return period of more than 160 years, an estimate associated with uncertainties. However, the agricultural drought is not limited to northern Germany but comprises large parts of central, northern, and northeastern Europe. The low soil moisture conditions also lead to a hydrological drought (low river flow) over the summer months (Fig. 5, right). However, the severity and spatial patterns of hydrological drought differ from the pattern of agricultural drought because propagation from soil moisture drought to hydrological drought takes time and typically leads to a lagged occurrence (Van Loon and Van Lanen, 2012) and a longer persistence (see Sect. 3.1.3 on surface water storage). Another reason is that hydrological drought can spread along the river network, affecting regions unaffected by low soil moisture (e.g. along the Danube River in eastern Europe). Nevertheless, in many parts of Germany and northern Europe, agricultural and hydrological droughts coincided in the summer of 2018 (Blauhut et al., 2022), affecting the ability to irrigate as a means of alleviating the agricultural drought. This provides an example of how co-occurring impacts (droughts) can amplify each other, causing even greater secondary impacts (agricultural yields; see Sect. 3.1.6 for the impact on agricultural production), in a manner similar to how co-occurring meteorological conditions trigger CEs.
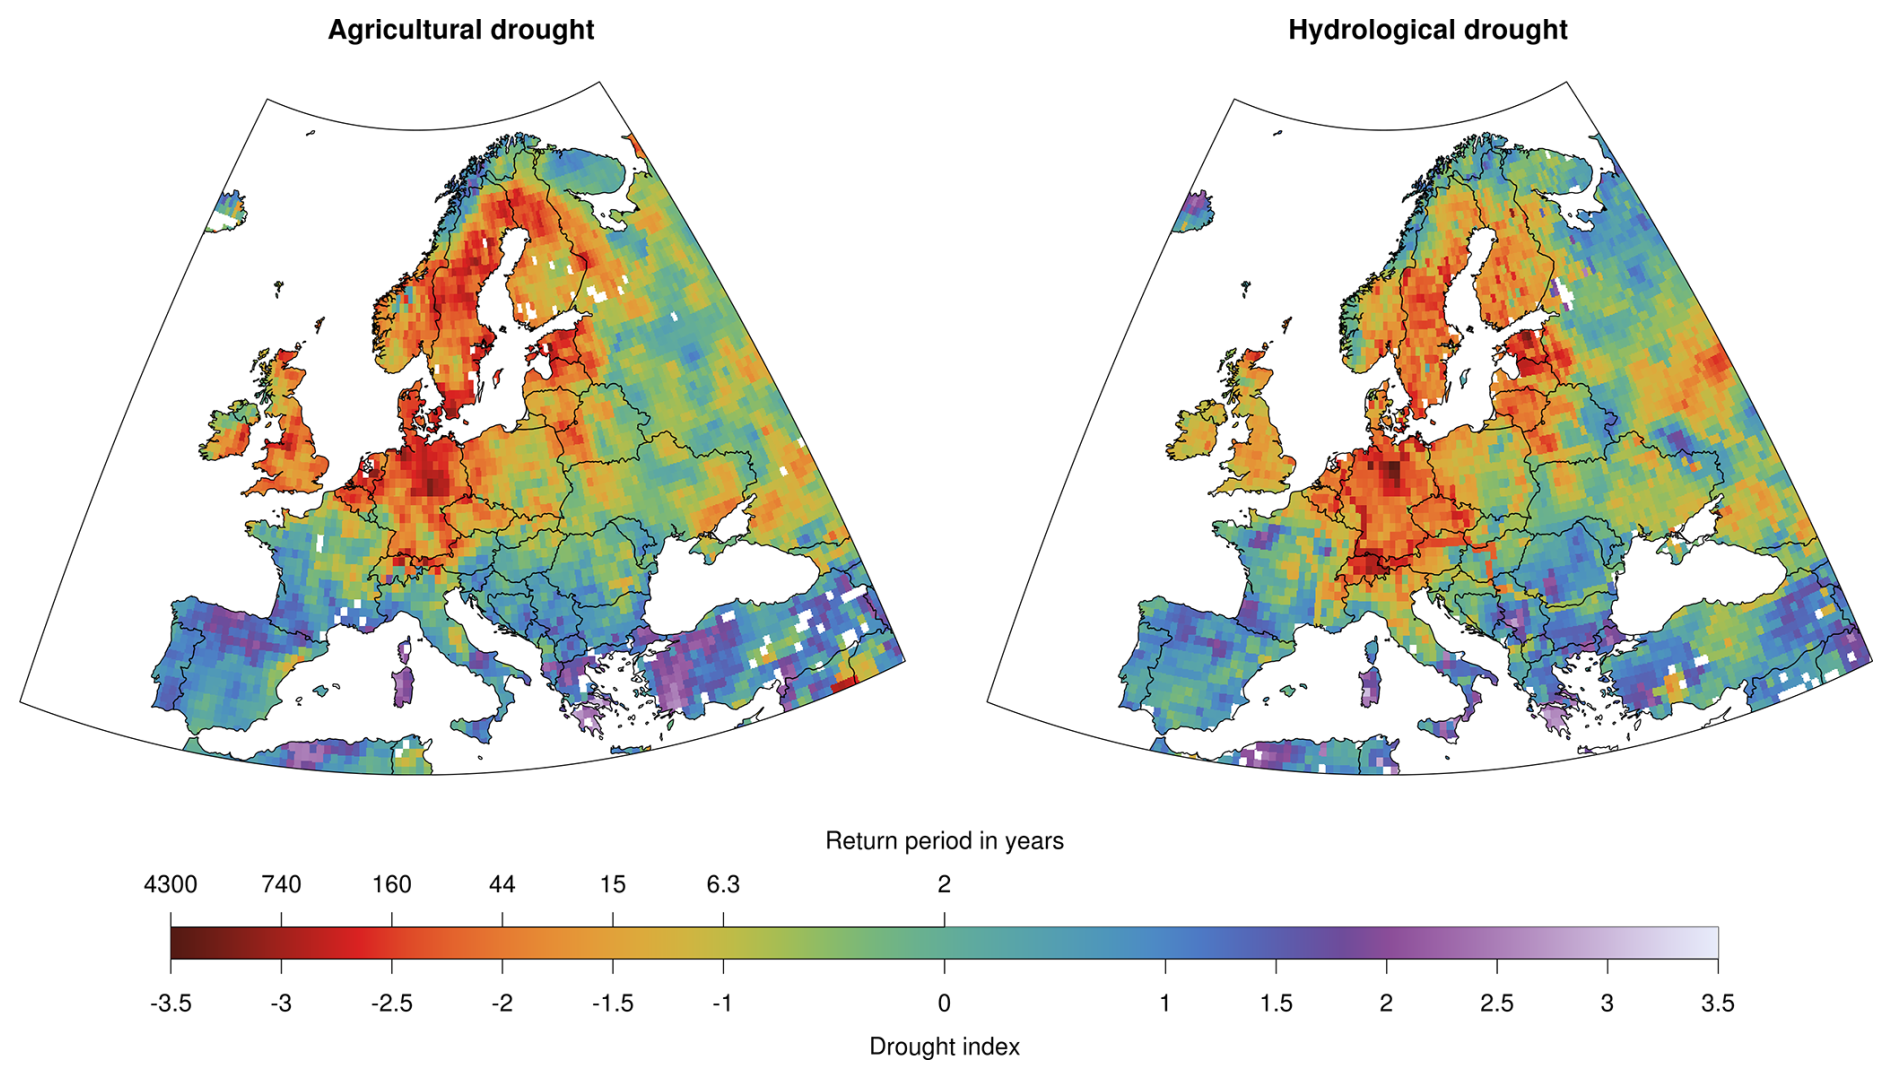
Figure 5Drought severity and return period of agricultural and hydrological droughts during the summer of 2018. Note that drought severity (as expressed by the drought index) and return period are closely related (see “Data and methods”, Sect. 2.5).
3.1.6 Impact on the agricultural production of 2018
In Germany, the hot and dry spring and summer of 2018 had an unprecedented impact on crop yields. Extremely low crop yields (Toreti et al., 2019a; Beillouin et al., 2020; Conradt et al., 2023, for northeastern Germany) led to large insurance claims over agricultural losses and financial support requests by farmers from governments in Germany (EUR 340 million), Sweden (EUR 116 million), and Poland (EUR 116 million) (D'Agostino, 2018; Munich RE, 2019). Winter wheat yields were more than 10 % below the 30-year average and 13 % below the previous 3 years. In some counties, yields were more than 40 % lower than in previous years. Regionally, winter wheat was particularly hard hit in eastern and northeastern Germany, with an average loss of 22 % compared to the last 3 decades. The HMDI and the SPEI indicate a severe heatwave and drought, respectively, which were most pronounced in central and northeastern Germany. Figure 6 shows the explained variance of yield anomalies and the stress indices HMDI, SPEI, and CSI (see “Data and methods”, Sect. 2.6), revealing a strong connection between these components. However, not all regions experienced such severe yield losses; winter wheat yield in southwestern Germany was hardly affected, with losses of only 1.2 % compared to the last 3-decade average. A hydrological seesaw with rather wet conditions in southern Europe and the resulting yield increases characterise the unique combination of climatic anomalies in Europe in 2018 (Toreti et al., 2019a). Winter wheat productivity was even positively affected in some regions.
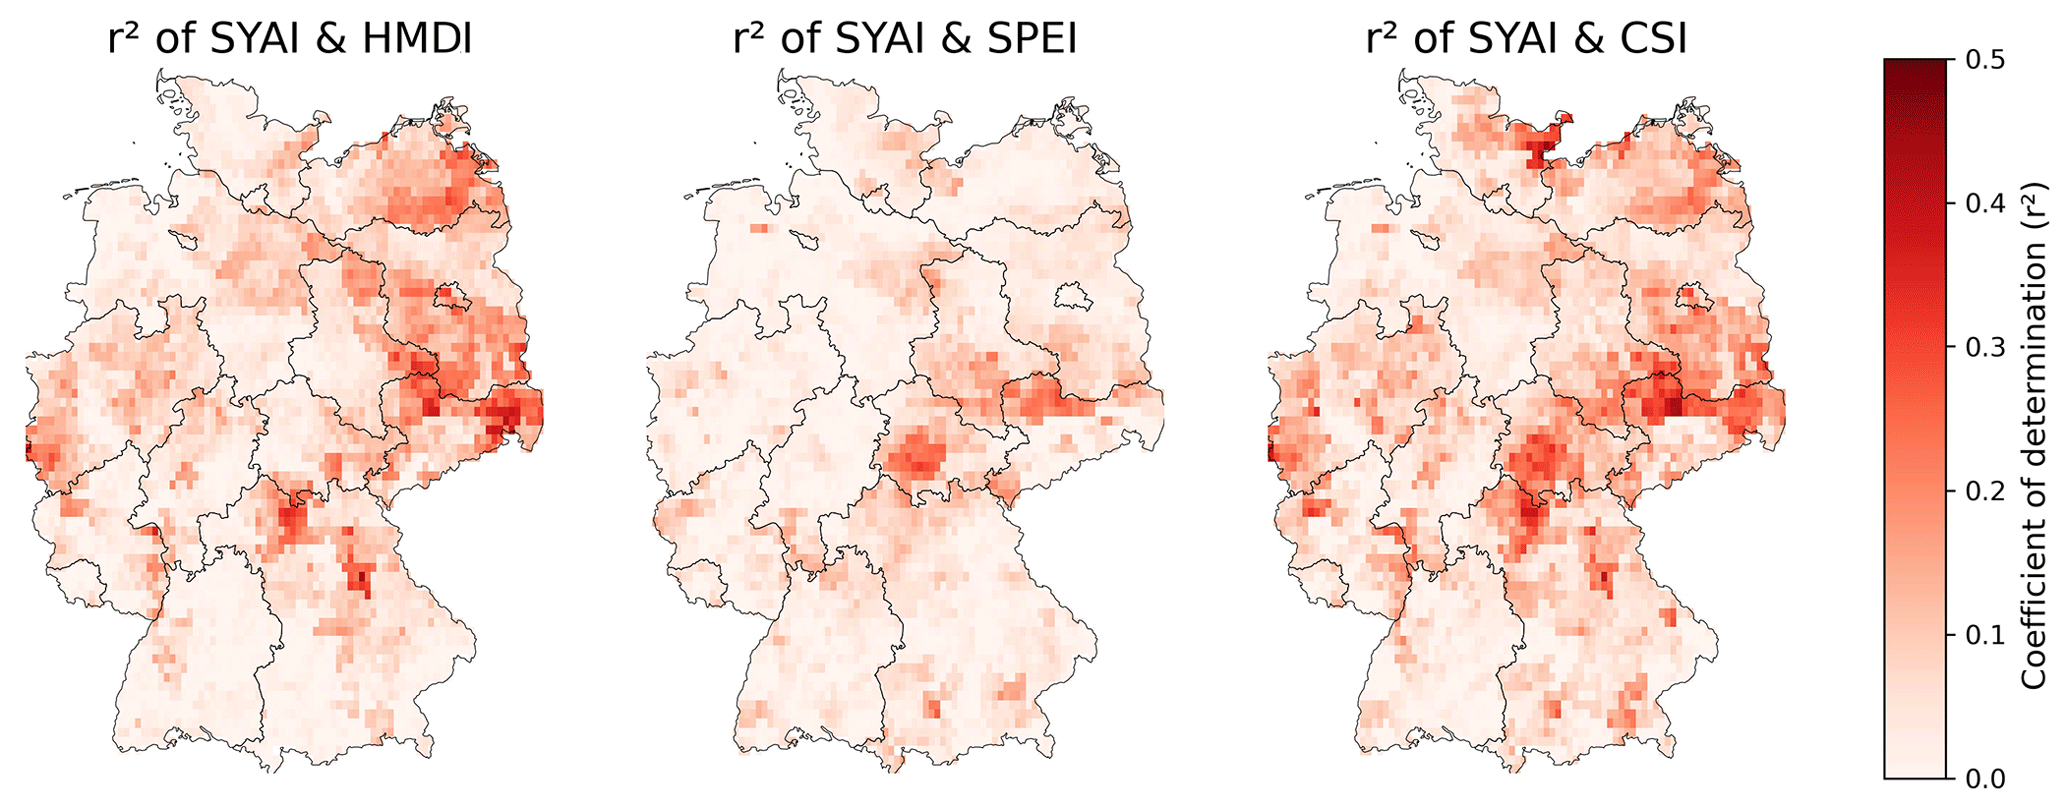
Figure 6Coefficient of determination of the Standardized Yield Anomaly Index (SYAI) and stress indices (Heat Magnitude Day Index, HMDI; Standardized Precipitation Evapotranspiration Index, SPEI; and Combined Stress Index, CSI) demonstrate the impact of heat, drought, and compound stress over the last 3 decades on winter wheat in Germany.
3.1.7 Impact on forests in 2018
The drought of 2018 was likely the largest source of severe forest disturbance in Europe in more than 170 years (Senf and Seidl, 2021), especially in central and northern Europe (Buras et al., 2020). Consequently, in the summer of 2018, about 11 % of the central European forest area experienced early wilting (Brun et al., 2020), resulting in a large reduction in greenness (Schuldt et al., 2020; the three aforementioned studies are based on NDVI data). The 2018 drought continued into 2019, making the consecutive European droughts of 2018 and 2019 unprecedented in the last 250 years (Hari et al., 2020). The low soil moisture content in 2018 and an increased water-vapour pressure deficit in the following 2 years were the main drivers of the forest disturbances of about 4.74 × 10⁶ ha in central Europe (Senf and Seidl, 2021). The likely cause of these forest damages was that trees under drought and heat stress experience carbon starvation (Bastos et al., 2020) and risk embolism, which causes failures in water transport (Allen et al., 2015; Schuldt et al., 2016). The drought and heatwave in that period facilitated outbreaks of bark beetle, enhancing the damage levels to forests. As such, insect outbreaks in central Europe showed a 2- to 3-fold increase in annual losses between 2017 and 2018 (Hlásny et al., 2021), and extraordinary mortality and damage occurred during 2018 in Sweden due to rapid beetle population growth (Öhrn et al., 2021). Although wildfires have decreased on a global scale recently, central Europe is likely to face larger and more frequent forest fires (Feurdean et al., 2020, Milanović et al., 2020; Carnicer et al., 2022), which can have severe environmental, economic, and social consequences (Lidskog et al., 2019).
3.2 Precipitation–wind compound events during 2018
In this section, CEs that involve heavy precipitation and strong winds are described. Examples include two January windstorms (Friederike and Burglind) and several weeks of convective activity in May and June of 2018.
3.2.1 Loss and damage of compound vs. non-compound wind extreme events in the winter of 2018
On 16 January, Windstorm Friederike formed as a low-pressure system near Newfoundland. Within the next 2 d, Friederike intensified and quickly travelled across the Atlantic (Fig. 7), losing its closed structure at 18:00 UTC on 17 January. Friederike re-intensified over the British Isles on 18 January while crossing the jet streak toward the northern jet exit region, a behaviour favourable for intense windstorm development (e.g. Pinto et al., 2009). The storm moved eastward over the North Sea, Germany, and Poland and weakened after 19 January over eastern Europe (Fig. 7a). Analysing the compound character of Friederike around peak intensity using hourly ERA5 reanalysis data (Fig. 7b, c), a typical near-surface wind and precipitation structure of intense extratropical cyclones is found (e.g. Dacre et al., 2012). Strong 10 m wind gusts (maximum values of 34 m s−1 relative to the Earth's surface) were present behind and to the right of the eastward-moving cyclone centre. Heavy precipitation occurred both at the warm front to the northeast of the centre, wrapping around as the cyclone approached its mature stage, and along the east-southwest-stretching cold front (Fig. S1a). During the 12 h period when Friederike passed through Germany from 06:00 to 18:00 UTC on 18 January, the persistently active warm front left a widespread footprint near the northern edge of the cyclone centre (Fig. 7b), with ERA5 accumulated precipitation exceeding 17 mm. Meanwhile, the cold front contributed to a high precipitation rate (> 4 mm h−1 based on ERA5) along a narrow west- to east-oriented band across northern France and southern Germany (Fig. 7c). The co-occurrence of strong winds and heavy snowfall gave to this storm the risk and damage characteristics of a CE (Fig. 7b, c). The highest damages were reported in Ireland, Great Britain, northern France, Belgium, the Netherlands, Germany, Czech Republic, and Poland, where gust measurements suggested wind speeds of the order of 100–150 km h−1. At higher altitudes the observed wind gusts reached 173 km h−1 at the Sněžka in Czech Republic and 203 km h−1 at Brocken in Germany (Haeseler et al., 2018). Wind and snowfall associated with Friederike caused further traffic disruption, power outages, property damage from falling trees, and several deaths. Friederike was the strongest storm affecting central Germany since Windstorm Kyrill in 2007.
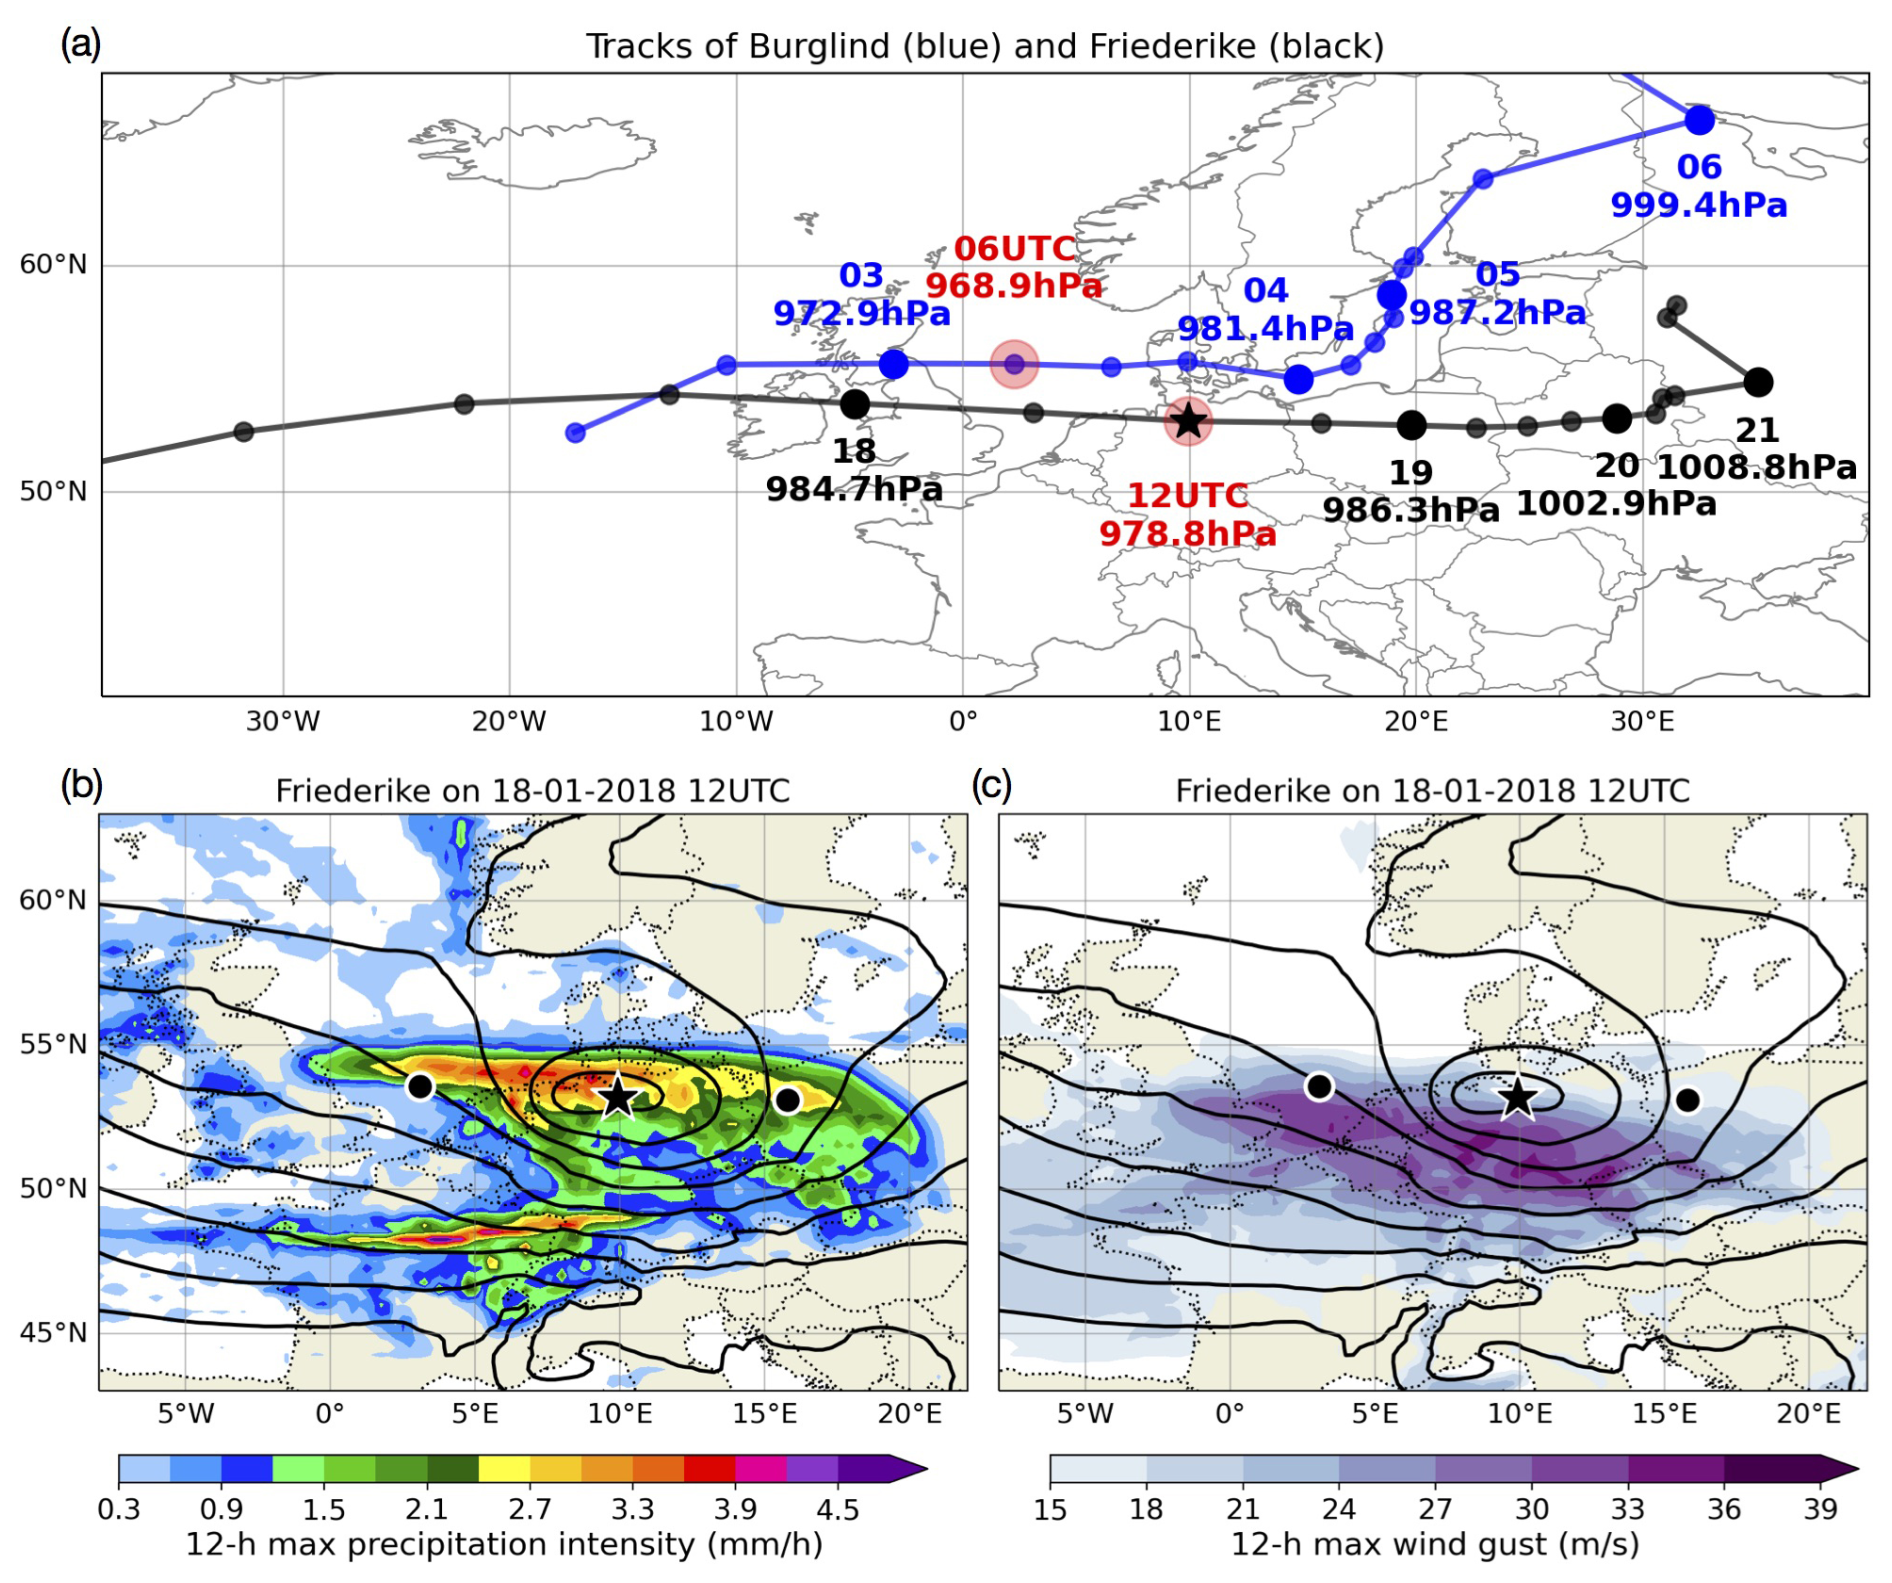
Figure 7(a) Cyclone tracks of windstorms Friederike (black) and Burglind (blue) in January 2018. The big circles show locations at 00:00 UTC on the day as indicated, with the central pressure noted below. The red circles indicate their lifetime peak intensity based on the minimum pressure. (b) Mean sea level pressure (thick contours; increasing from 960 hPa with 5 hPa intervals) at 12:00 UTC on 18 January 2018 (location of Friederike shown by the star) and maximum precipitation intensity (shaded) during the period 6 h before and after (locations shown by the black circles). (c) Same as (b) but for the wind gust at 10 m height (shaded). All fields are derived from the ERA5 reanalysis (Hersbach et al., 2020).
Another CE affecting Germany in the same month was the windstorm Burglind, which formed on 2 January 2018. The depression intensified rapidly as it moved eastward toward the British Isles (Fig. 7a). It reached a peak intensity of 968.9 hPa at 06:00 UTC on 3 January 2018 over the North Sea, followed by a weakening over the Baltic Sea. The long active cold front affected a large area of western Europe (Fig. S1b). Heavy precipitation with daily values > 30 mm led to rapid snowmelt and massive flooding in many regions. Around the time of the peak cyclone intensity, widespread areas were simultaneously affected by high precipitation intensities (> 4 mm h−1) and high wind gusts (∼ 100 km h−1) (Fig. S1c, d). Further detailed information on Burglind can be found in Eisenstein et al. (2022; see their Sect. 5). Compared to Storm Friederike, the compound features of Burgling were more strongly shaped by orography.
Although the co-occurrence of extreme wind and precipitation is discussed in previous studies for specific events (e.g. Fink et al., 2009, for Storm Kyrill) or globally (Martius et al., 2016; Messmer and Simmonds, 2021), there are no studies so far that quantitatively evaluate the effect in terms of loss damage. To distinguish between single extreme wind speed events and compound extreme wind speed and precipitation events, we follow the definition of Martius et al. (2016), where both variables are considered simultaneously (see “Data and methods”, Sect. 2.7). The loss damage distribution for compound and non-compound events determined from loss data of the GDV is depicted in Fig. 8. For Friederike, there are 3 d where a co-occurrence of wind and precipitation extremes can be identified over Germany, i.e. 17, 18, and 19 January 2018. The loss ratio for these 3 d is marked with blue dots in the right column of Fig. 8. The GDV Naturgefahrenreport (2019) reports EUR 900 million loss damage for Germany with respect to Friederike. To date, it was the most damaging winter storm of the last 10 years.
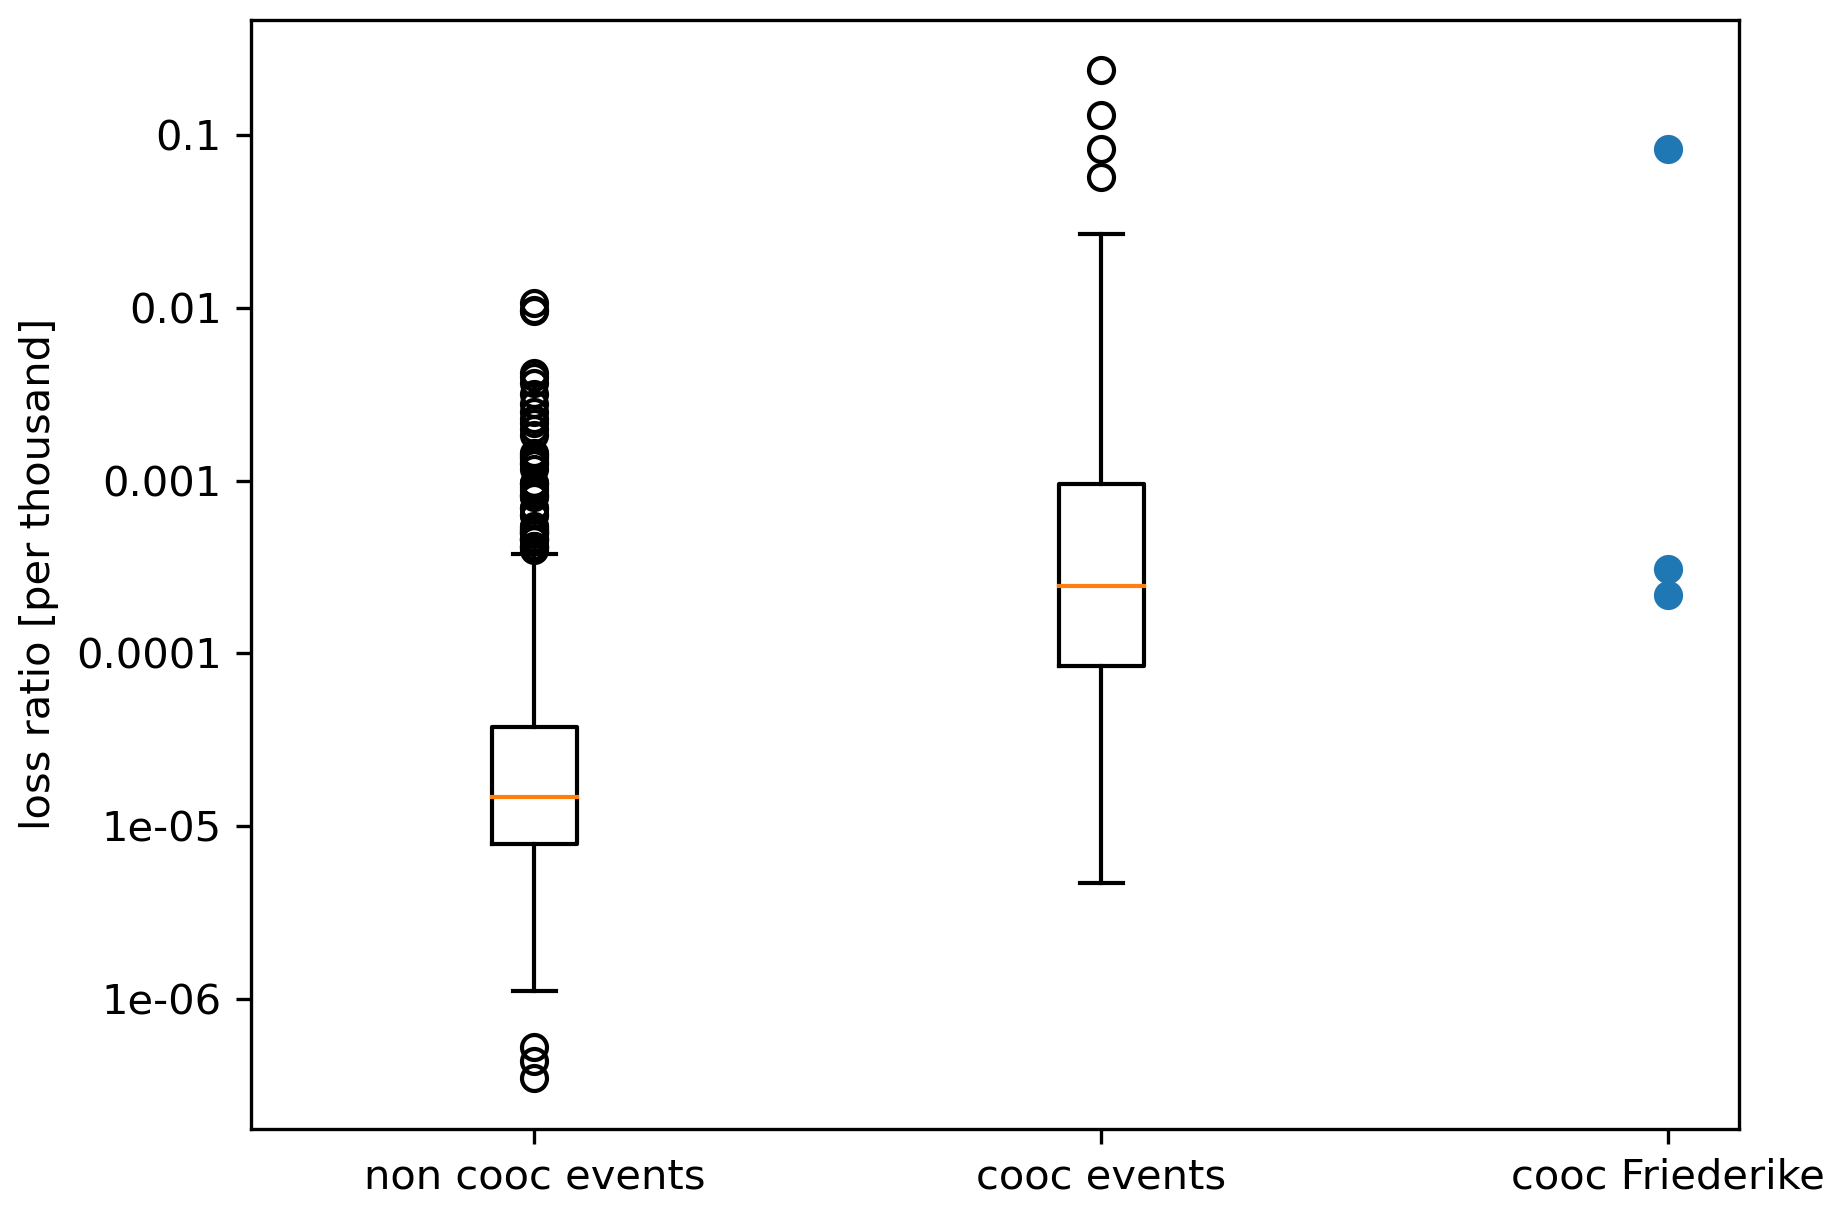
Figure 8Loss ratio of residential buildings (per thousand) accumulated over Germany for winter events from 1997–2016. Each dot represents 1 d. The left (non-cooc events) bar shows all days which cannot be linked to co-occurrence (cooc) of both extreme wind and precipitation, i.e. single extreme events. The middle bar (cooc events) shows all days which can be linked to co-occurrence of extreme wind and precipitation. The right bar shows the 3 d for the co-occurrence during Windstorm Friederike. The loss ratio is defined by loss normalised with the local sum of insured values.
3.2.2 Concurrent heavy rain and storm extremes – estimation of probability of event occurrence
In a detailed analysis of the probability of co-occurrence of extremes, based on copulas (see “Data and methods”, Sect. 2.8), the annual maximum values of hourly precipitation and wind speed data at the Münster Osnabrück International Airport station of DWD that are available from 1996 were analysed. The records show an increase in the intensity and frequency of the variables but lack a statistically significant trend. The occurrence probabilities for concurrent precipitation and wind extreme events are shown by the black isolines in Fig. 9. The grey dots are pseudo-observations (artificial precipitation and wind combinations generated using the copula function), while the black, red, and green dots mark the observed CEs at the station for each year, and the green dot represents Friederike. The distribution of the dots illustrates that – depending on the precipitation duration – wind or precipitation, individually, may not be extreme. A counterexample is the year 2020 windstorm Sabine (red dot; internationally known as Ciara), for which the simultaneous wind and hourly precipitation values both correspond to the respective annual maximum event of that year. The locations of the dots relative to the isolines define the return period of the event, where the return period of Windstorm Friederike at the Münster Osnabrück station exceeded 5 years and the one of Windstorm Sabine 100 years.
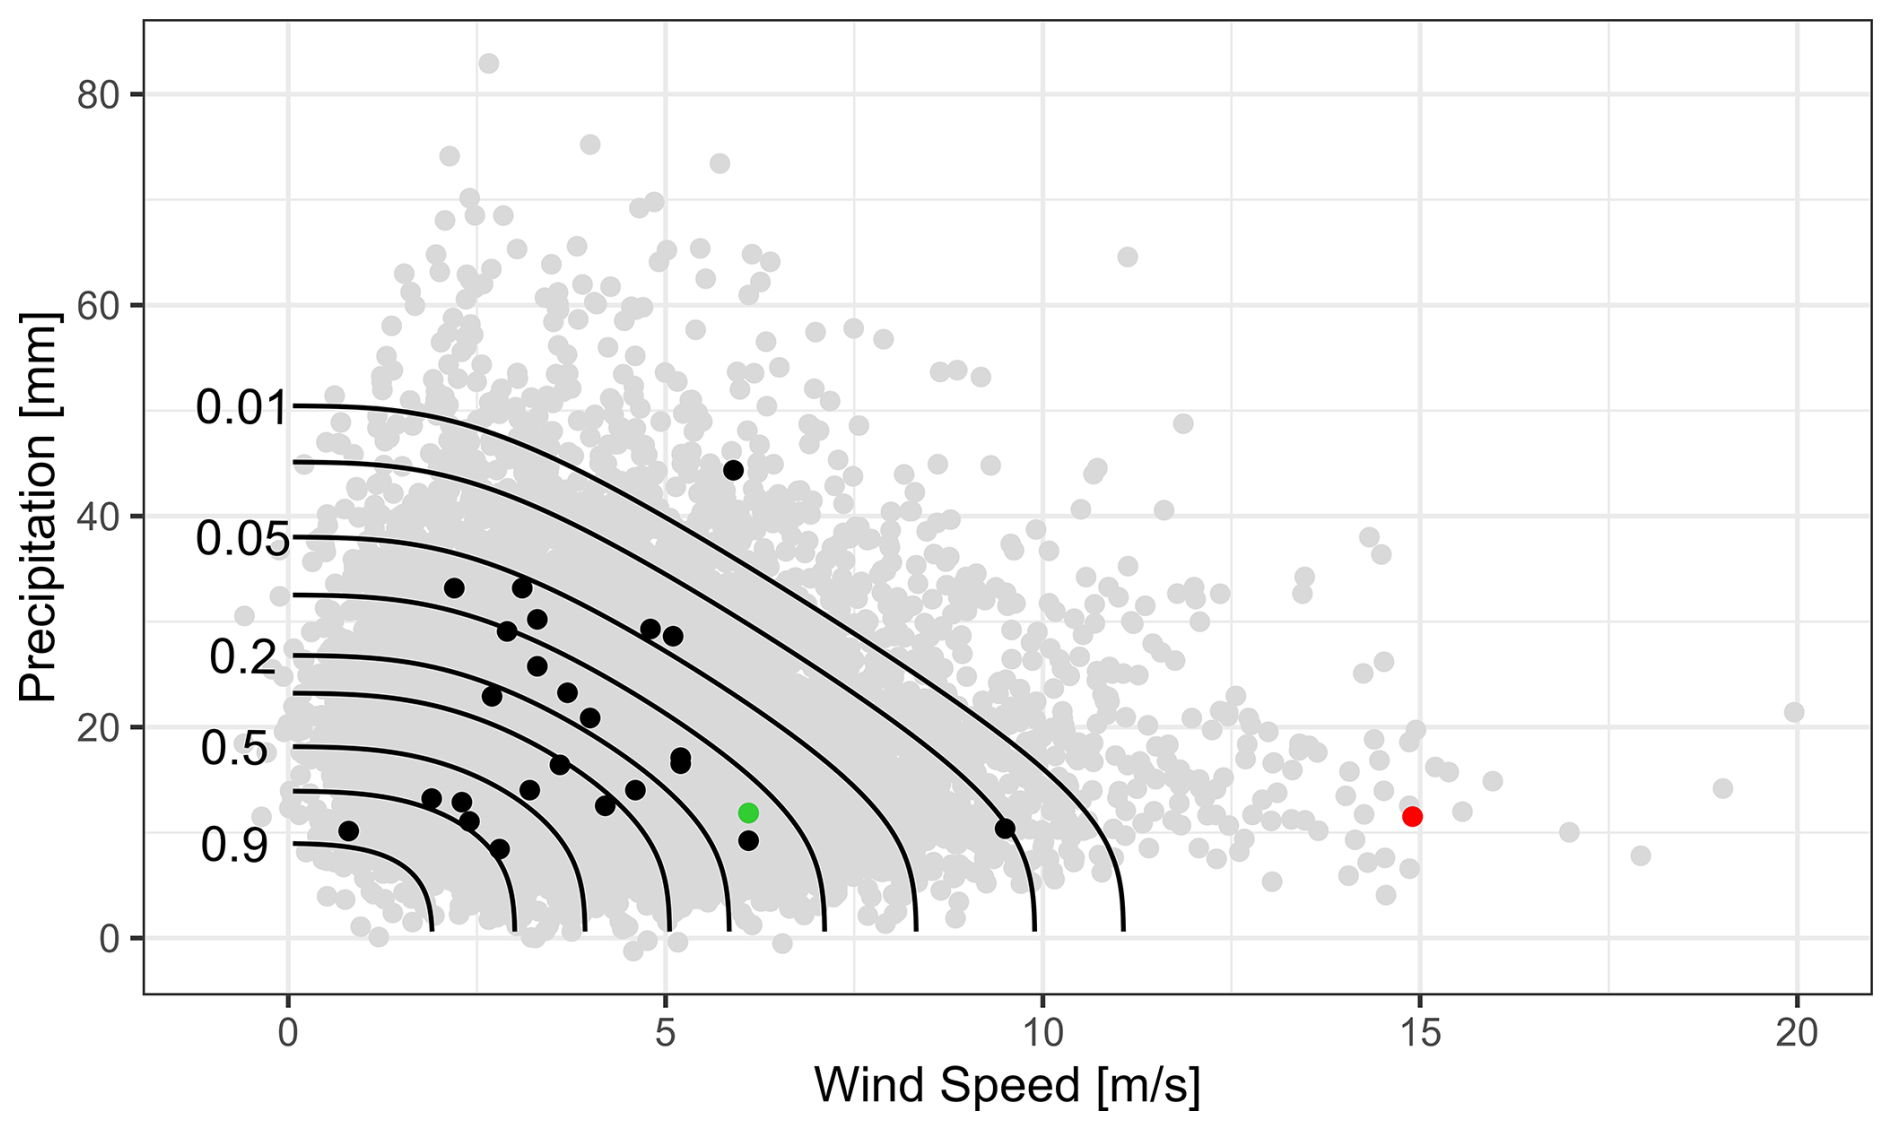
Figure 9Multivariate analyses for the temporal compound event heavy precipitation and strong wind determined with copula functions: quantile isolines (lines of equal probabilities), observed event combinations (black dots), and the pseudo-observations (grey dots). The green dot represents Storm Friederike (2018) and the red dot Storm Sabine (2020).
3.2.3 Rockfall events
Another hazard with CE triggers observed in connection with Friederike was a rockfall event. Although wind is normally not considered one of the triggering factors (D'Amato et al., 2016), such events may also occur as a consequence of the precipitation associated with a windstorm. It is well known that heavy precipitation can initiate landslides and rockfall events (e.g. Nissen et. al., 2022). Slope susceptibility is influenced by pore water/fissure water preconditions, rendering them events with multivariate and temporally compounding triggers. With respect to rockfall, another potentially triggering factor is freeze–thaw cycles prior to the event. In terms of reported hillslope failures, Storm Burglind was more effective than Storm Friederike. For Storm Friederike, only one rockfall event is registered in the landslide database for Germany. The event occurred near Göttingen in Lower Saxony. Figure 10 shows the relationship between the predictors (across-site percentile of a fissure water proxy D precipitation minus potential evaporation determined for the last 5 d, the local percentile of daily precipitation, and the binary information if a freeze–thaw cycle occurred within the last 9 d) and the rockfall probability expressed as the percentage change with respect to the climatological probability. The red dot indicates the conditions on 18 January 2018 in the area of the event associated with Friederike. The soil at the location was still wet after Storm Burglind at the beginning of the month and the fissure water (proxy D) at its 83rd percentile. The daily precipitation on the day of the event was 4.5 mm (REGNIE data, Rauthe et al., 2013), which corresponds to the 77th percentile for the given location, assuming immediate melting of the reported snow due to the above freezing air temperature at the event location. The probability of a rockfall event was further increased by pre-event thawing conditions. The logistic regression model suggests that the probability of rockfall on that day was increased by almost 250 % (3.5 times more likely) compared to the long-term climatology.

Figure 10Rockfall probability expressed as the percentage change with respect to the climatological probability (isolines) as a function of moisture preconditions (D), daily precipitation, and preceding freeze–thaw cycles. The red dot marks the conditions in the vicinity of Göttingen (Lower Saxony) on 18 January 2018.
3.2.4 Convective cluster events of the summer of 2018
The spatially and temporally compounding nature of severe convective storms (SCSs) can be demonstrated by the example of a 3-week series of SCSs in western and central Europe from 22 May to 12 June 2018, leading to an unusually high temporal accumulation of CCEs lasting several days (Fig. 11). During this period, an exceptional persistence of reduced stability combined with sufficient moist air masses caused high thunderstorm activity daily in France, Belgium, the Netherlands, Luxembourg, Germany, Switzerland, and/or Austria, associated with precipitation accumulations of up to 80 mm h−1 within 1 h and several flash floods (Mohr et al., 2020). The temporal compounding nature of the serial clustering of SCSs over several days to weeks over the same geographic region may increase the probability of flooding and damage. Figure 11b shows a large number of identified CCEs, especially those with a large spatial extent (> 5000 km2), during a 3-week period over western and central Europe, indicating high thunderstorm activity with unusual accumulation (Piper et al., 2016; Mohr et al., 2020). The repeating occurrence is caused by persistent synoptic conditions that favour thunderstorm development over several days to weeks. The presence of atmospheric blocking has been found to be highly conducive to such prolonged thunderstorm episodes, which typically occur on its western and/or eastern flanks (Piper et al., 2016; Mohr et al., 2020; Kautz et al., 2022). Based on statistical analyses, Mohr et al. (2019) found that a block over Scandinavia or over the Baltic Sea favoured the occurrence of thunderstorms in western and central Europe along the western flank of the blocking system due to the southwesterly advection of warm, moist, and unstable air masses. It is expected that low-frequency modes of climate variability, like the North Atlantic Oscillation (NAO) or East Atlantic (EA) pattern, could also have an impact on clustered thunderstorm activity over several days (Piper et al., 2019), as these patterns are connected with atmospheric blocking.
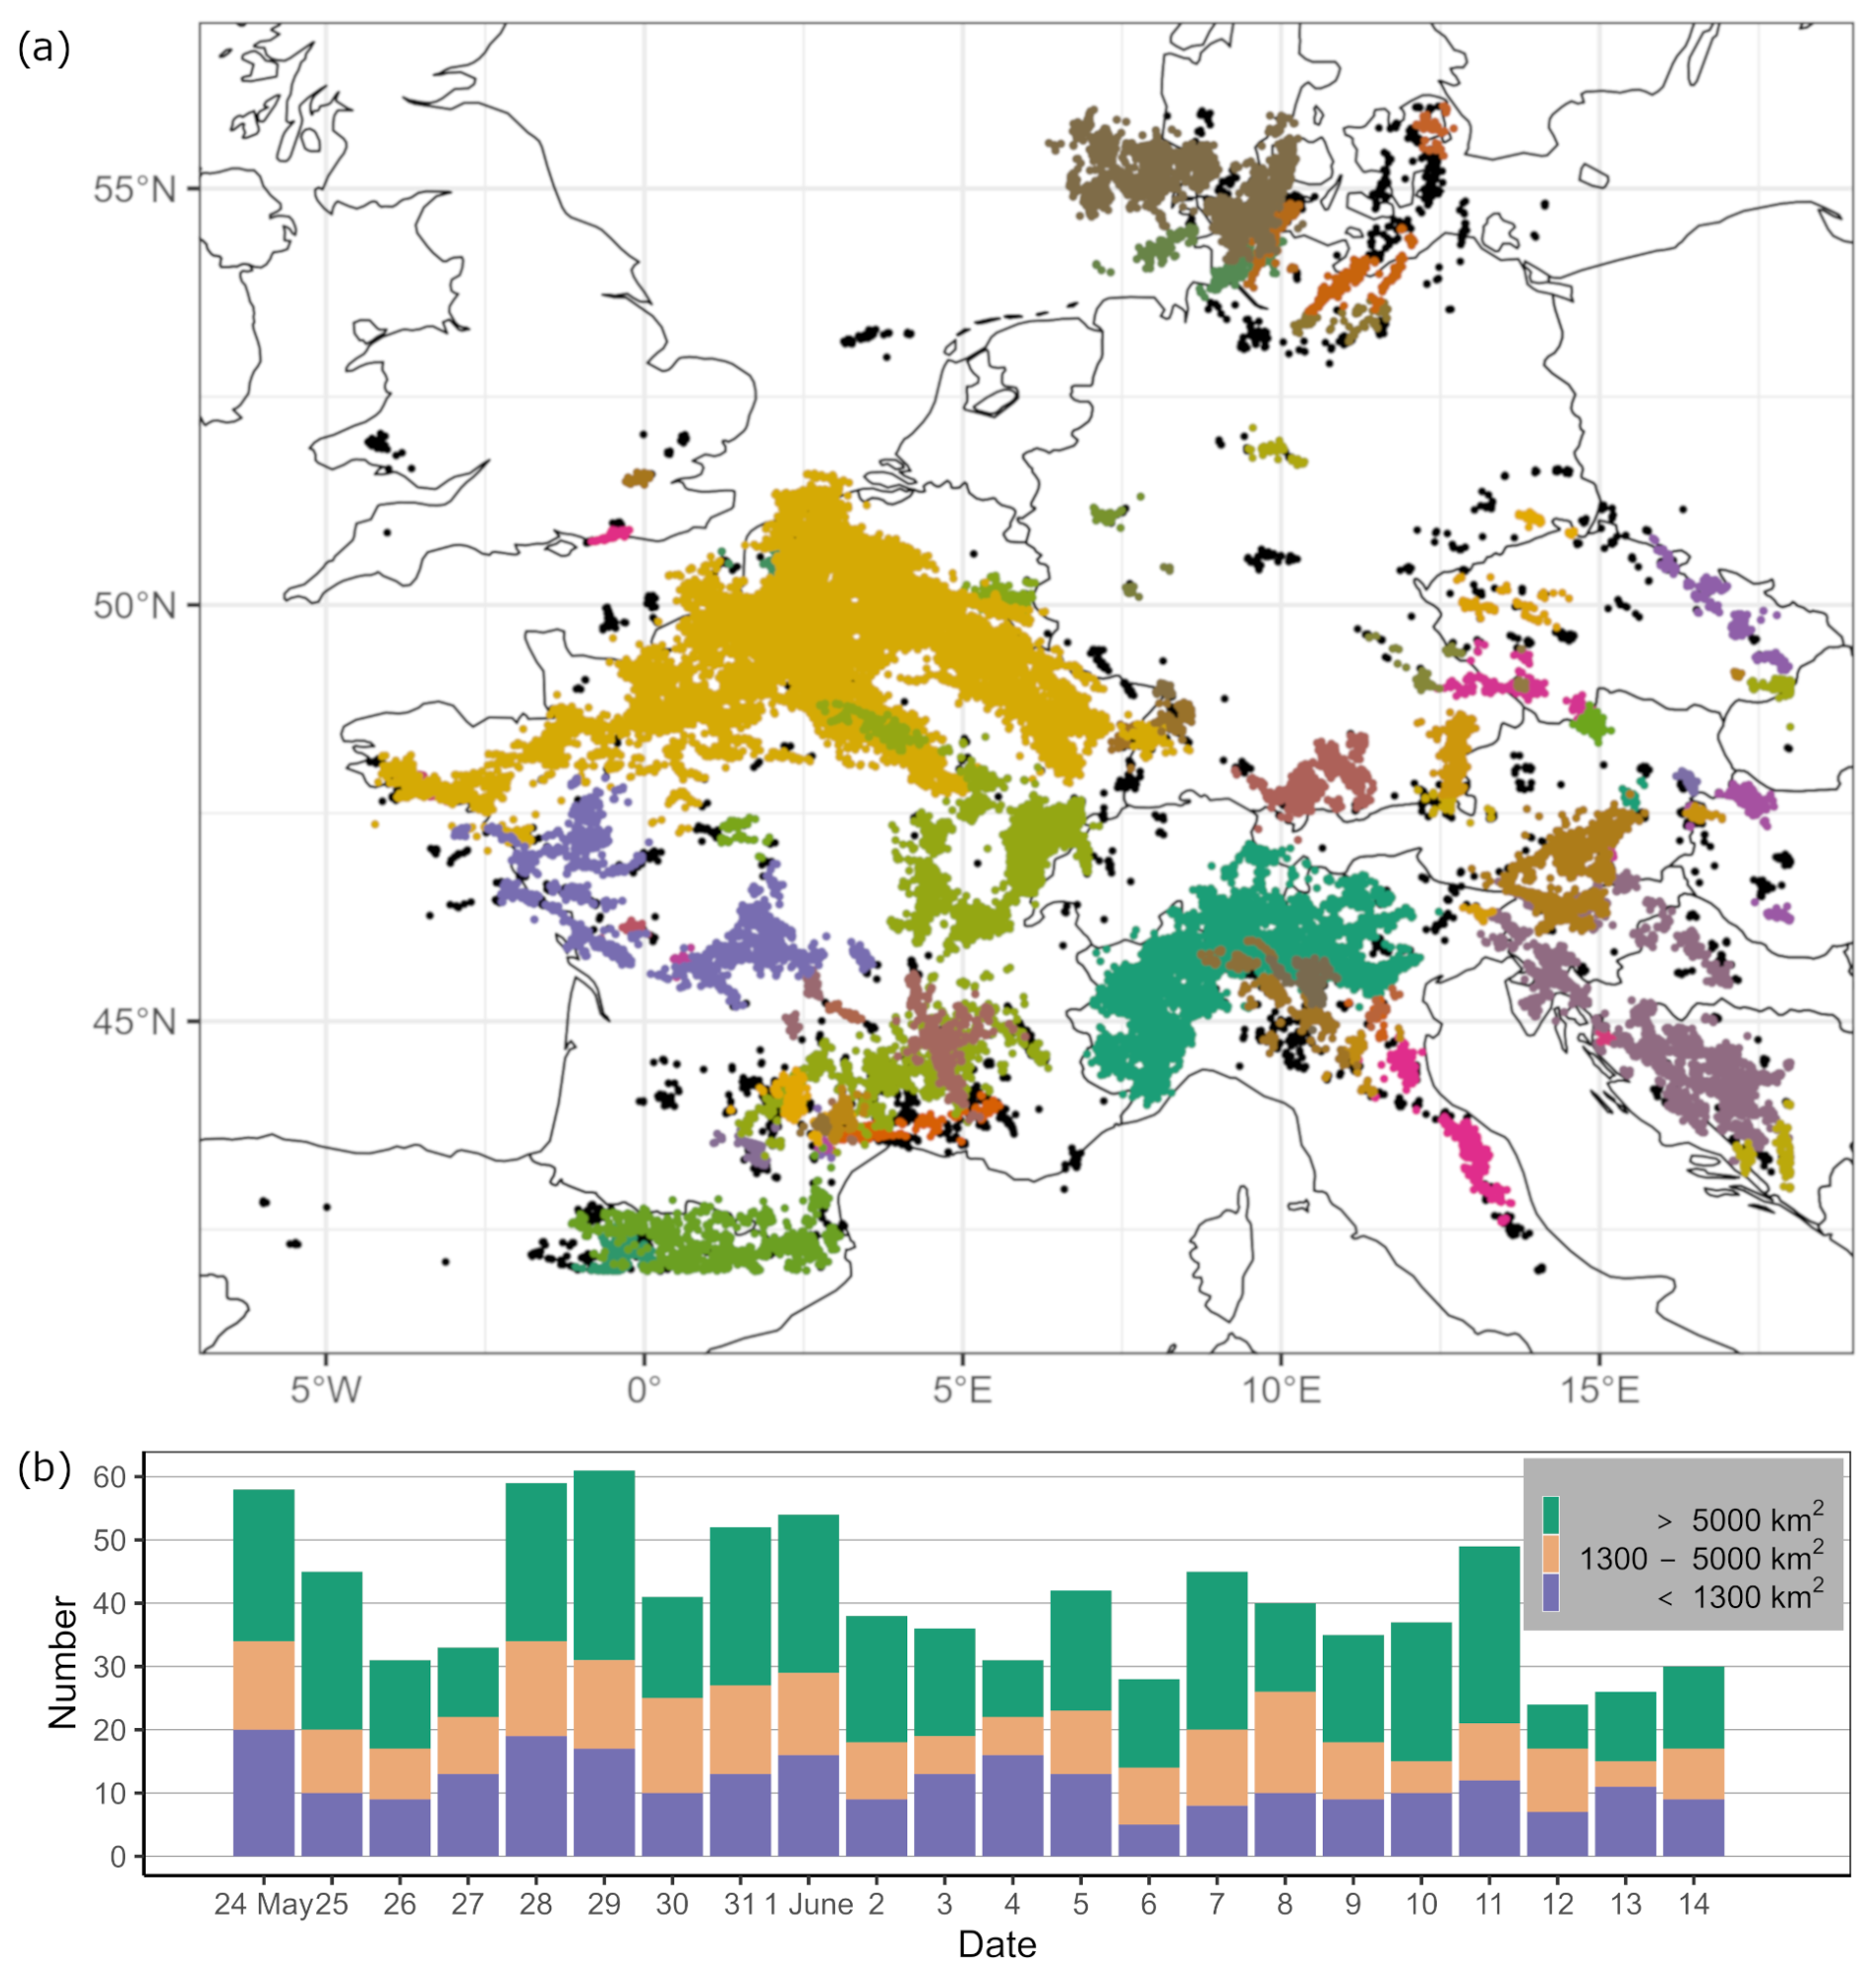
Figure 11(a) Lightning strokes on 28 May 2018 in western and central Germany. Each colour represents a convective cluster event (CCE) resulting from the ST-DBSCAN method (see “Data and methods” section); the black dots represent lightning strokes identified as noise. (b) Daily number of CCEs between the thunderstorm episode from 22 May to 12 June 2018. The colours represent CCEs of different sizes. Note that clusters that overlap are separated in time.
In this paper, we analysed in detail several extreme events that have affected Europe within the calendar year of 2018, starting with the windstorm series in January, followed by a period of heavy thunderstorms in May/June and an extended heatwave in July and August, which affected various parts of Europe, and the associated drought effects that extended well into the autumn season. Our analysis clearly revealed the multivariate and complex characteristics of the events, and thus they can undoubtedly be classified as CEs. The analysis of compound variables was used as a tool to investigate the impacts of human-made climate change. For the two overarching compound types collected in this contribution (hot and dry; wet and windy), we now analyse possible changes in their frequency of occurrence under future climate conditions. Recent studies have provided evidence that regionally extreme hot and dry conditions, such as the summer of 2018, are expected to become more frequent in the future (e.g. Toreti et al. 2019a; Zscheischler and Fischer, 2020; Aalbers et al., 2023; van der Wiel et al., 2021; Bevacqua et al., 2023). Figure 12 shows a comparison of the occurrence of CEs under recent (1975–2025) climate conditions, with a global mean surface temperature of 1 °C above pre-industrial levels, and under future (2025–2075) conditions of 3 °C above pre-industrial levels, based on the 30-member CMIP6 MPI-GE under SSP5-8.5 (see “Data and methods”, Sect. 2.11). For drought and heat events, our analysis reveals a clear increase in both the frequency and the intensity of extreme compound heat and drought years (Fig. 12, left). Over the past 50 years, extreme compound heat–drought events have occurred with a probability of 1.5 %, or about 1–2 times per century. Over the next 50 years, such extreme CEs are projected to become almost 10 times more frequent, occurring more than once every 10 years and reaching much higher temperatures and precipitation deficits.
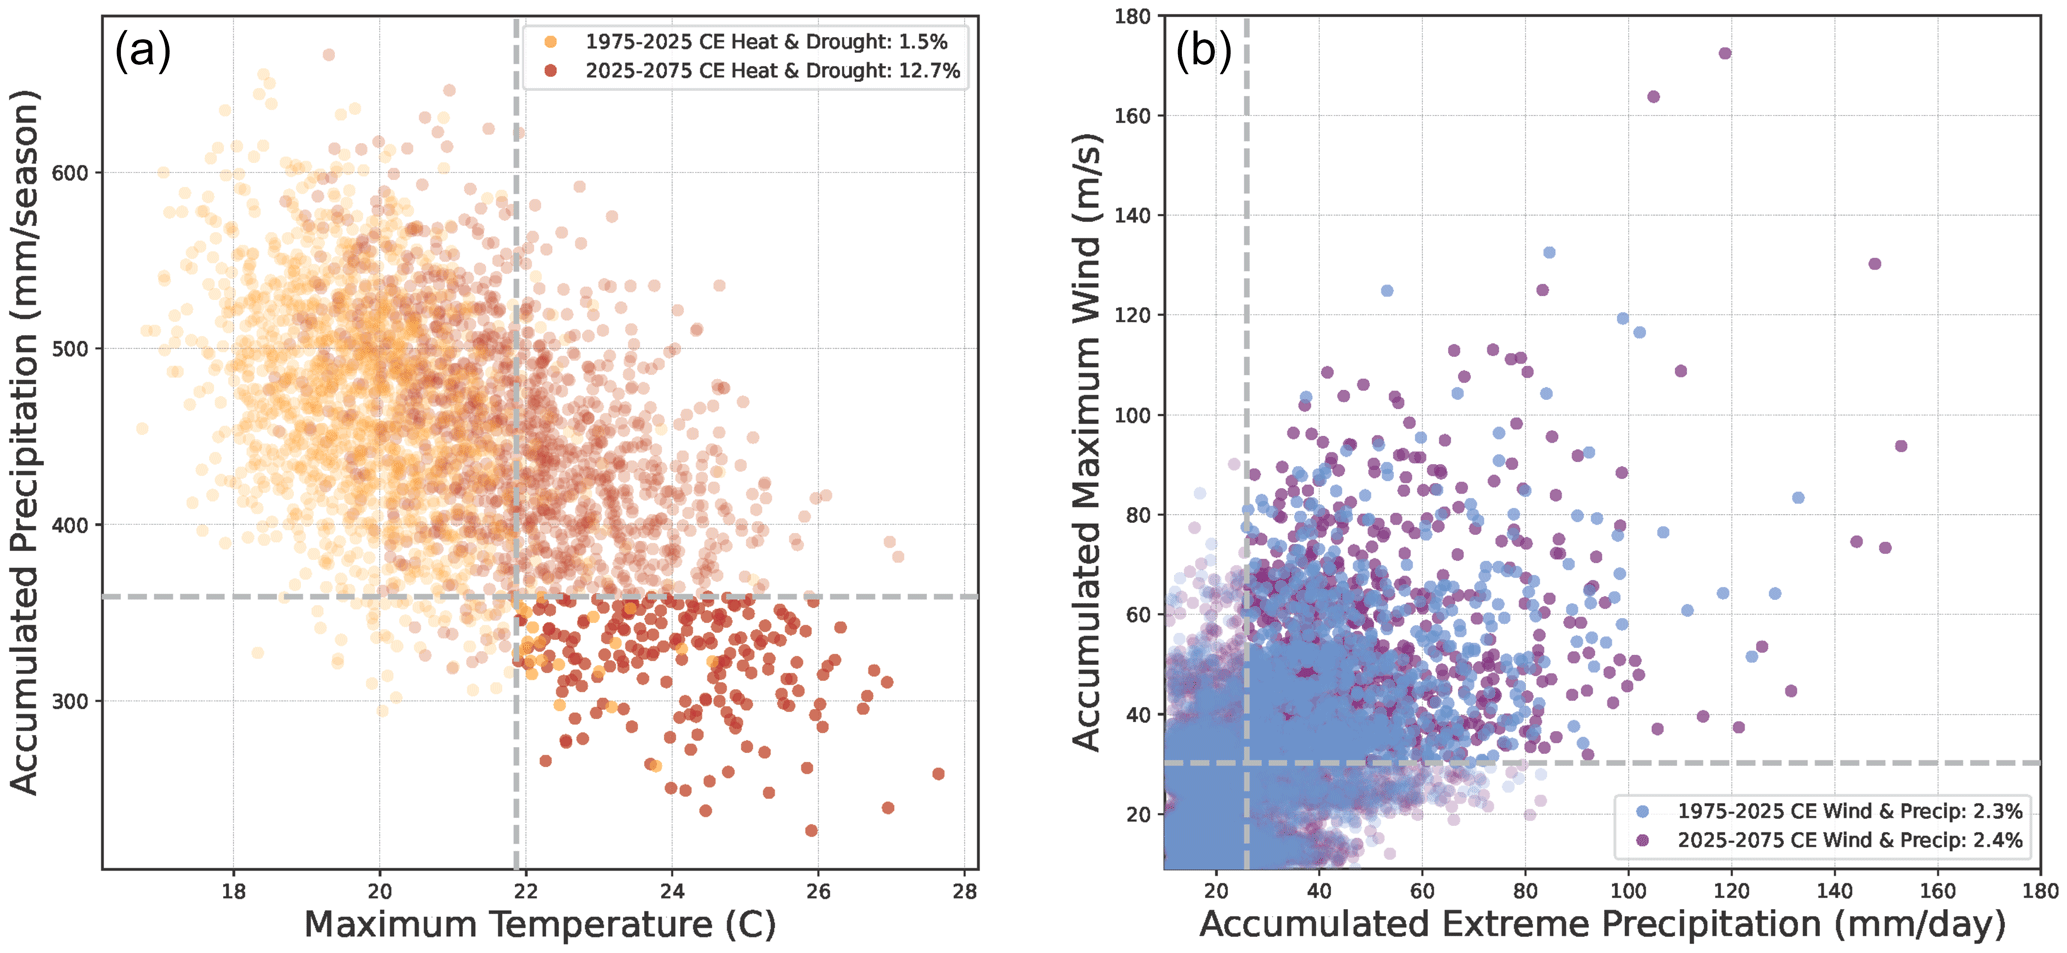
Figure 12Changes in temperature–precipitation (heat and drought, a) and precipitation–wind (wet and windy, b) compound year occurrence in terms of frequency and intensity, at 1 °C (1975–2025) and 3 °C (2025–2075) above pre-industrial levels based on the 30-member CMIP6 MPI-GE under SSP5-8.5 (Olonscheck et al., 2023) over Germany.
The likelihood of winters with extreme compound precipitation–strong wind events does not change significantly with global warming in the CMIP6 MPI-GE projections (Fig. 12b). Such wet and windy winters, where both precipitation and wind are extreme, are projected to occur about once every 50 years. However, although the number of projected events remains roughly the same, the intensity of the actual wind and precipitation levels reached during the most extreme compound wet–windy events increases substantially in the near future.
A factor that strongly modulates the occurrence of extremes in Europe is the soil moisture availability, as decreasing soil moisture availability initiates a suite of processes feeding back into an intensification of both heatwaves and droughts (Miralles et al., 2019). Figure 13 presents a comparison between the observed (ERA5), simulated (extended historical), and projected (RCP8.5) drought conditions via the SPEI moisture availability index (see “Data and methods”, Sect. 2.12). For the historical period of 1979–2019, the reanalysis shows trends in the 3-year running mean SPEI, with a clear drying tendency in central and southern Germany during the warm season, with lower values elsewhere in Germany (Fig. 13a). Part of this trend may be related to the multi-year drought of 2018–2020 at the end of the time series. However, the CMIP5 multi-model ensemble under observed (extended historical) greenhouse gas concentrations (Fig. 13b) fails at depicting the trends for the past few decades, while EURO-CORDEX (Fig. 13c) simulates an increased water availability across Germany. Future projections following the RCP8.5 scenario are roughly consistent between CMIP5 (Fig. 13d) and EURO-CORDEX (Fig. 13e). Both ensembles predict a considerable trend toward more impactful multi-year drought conditions under RCP8.5. Differences between the various sources of data may be related to specific characteristics and settings of the climate models, such as the treatment of anthropogenic aerosols, the inherited uncertainty and bias of climate models in replicating precipitation variability at regional and local scales, and differences in convective precipitation during the warm part of the year (Dyrrdal et al., 2017), as well as the use of multi-model ensembles that may mask the individual model's skill (Ridder et al., 2022). These examples demonstrate the need for further model development to improve models' ability to accurately reproduce observed CEs and their characteristics, thus reducing the uncertainty in future projections and contributing to improved prevention, risk management, and future preparedness.
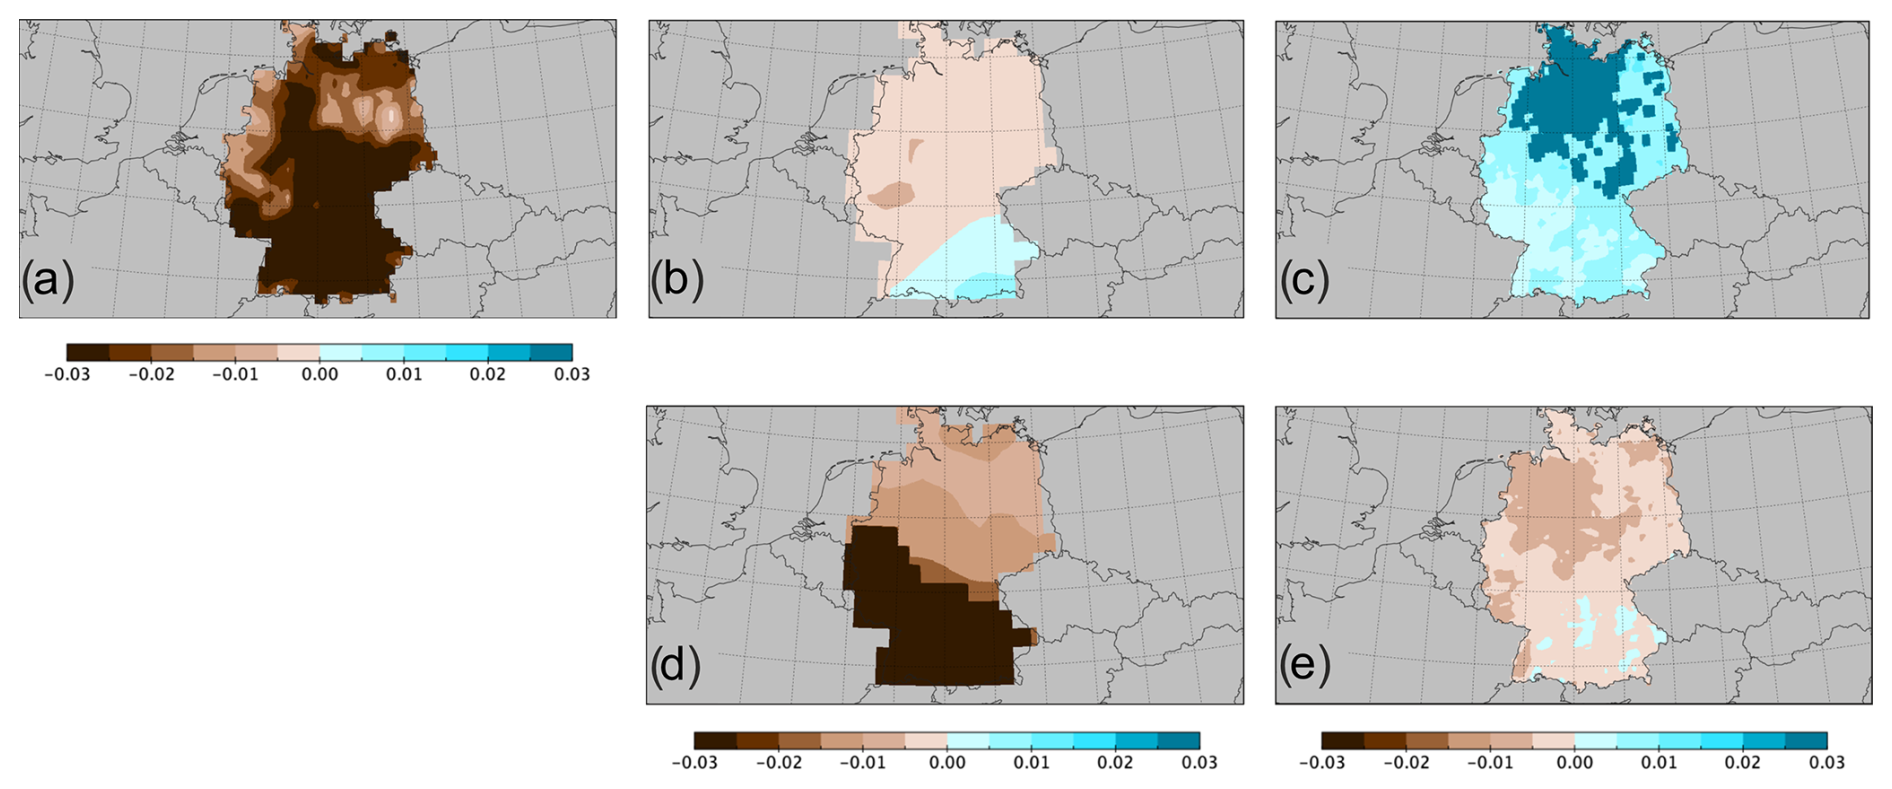
Figure 13Decadal trends, 1975–2021 and 2022–2077, of the 3-year running mean Standardized Precipitation Evapotranspiration Index for (a) ERA5, (b) the historical CMIP5 multi-model ensemble extended by Aalbers et al. (2023), (c) the EURO-CORDEX multi-model ensemble, (d) the RCP8.5 CMIP5 multi-model ensemble, and (e) the RCP8.5 EURO-CORDEX multi-model ensemble. Significant model ensemble grid points are shaded dark brown and dark green. Units are in standard deviation for spring and summer.
Compound climate events had severe impacts across Europe in 2018, as combinations of extreme weather events unfolded simultaneously or in succession, resulting in extensive socio-economic, environmental, and infrastructural damage. The study highlights two primary types of CEs: hot–dry and wet–windy, each amplifying the effects of individual weather extremes. A variety of statistical approaches and datasets have been explored and implemented, spanning different types of events and disciplines.
The summer of 2018 was marked by prolonged heatwaves and drought conditions across Europe, driven largely by persistent large-scale atmospheric blocking. Soil moisture declined sharply from spring through summer, imposing widespread stress on agriculture, forests, and water resources. These conditions led to significant agricultural losses, particularly in winter wheat yields, and imposed severe stress on European forests, resulting in large-scale forest fires and insect outbreaks.
The winter of 2018 saw a sequence of intense storms, including Friederike and Burglind, which brought strong winds and heavy precipitation, causing widespread flooding, property damage, and economic losses in multiple countries. The combination of sustained high winds and heavy precipitation further increased the risk of landslides and rockfalls, particularly in regions with saturated and thawing soils.
Projections indicate that, under progressing climate change, hot–dry events will increase in frequency and severity, while wet–windy events may retain similar frequencies but with greater intensity. Current adaptation and risk management strategies may be insufficient, as they often focus on single-event risks and may underestimate the compound hazards posed by concurrent extremes.
This study encourages further research on compound events to improve predictive capabilities and inform adaptation strategies. Integrated climate models that better represent the complex interactions of multiple extremes are crucial. Next steps involve validating the physical relationships between predictors and CEs to identify the underlying mechanisms that drive or modify these events, which could lead to more accurate analyses and predictions of CEs. Furthermore, given the complexity of CEs and their direct impacts, a redefinition of events based primarily on their relevant impacts, rather than purely statistical characteristics, is necessary to effectively assess and manage these risks.
These findings underscore the need for comprehensive climate adaptation approaches that address the interconnected nature of compound events, ensuring more effective preparedness for the compounded risks of future climate extremes.
Code is available from the authors upon request.
The ERA5 (https://doi.org/10.1002/qj.3803, Hersbach et al., 2020) reanalysis data are publicly available via the Copernicus Climate Change Service (https://doi.org/10.24381/cds.adbb2d47, Hersbach et al., 2023). The gridded observational dataset E-OBS (https://doi.org/10.1029/2017JD028200, Cornes et al., 2018) is publicly available on the European Climate Assessment & Dataset website (https://www.ecad.eu/download/ensembles/download.php, ECA&D, 2023). The observational datasets (https://doi.org/10.5194/asr-10-99-2013, Kaspar et al., 2013) and the phenological data from the German Weather Service (DWD) (https://doi.org/10.5194/asr-11-93-2014, Kaspar et al., 2015) are publicly available on the DWD website under their Open Data Portal (https://opendata.dwd.de/climate_environment/CDC/observations_germany/phenology/, DWD, 2023a; https://opendata.dwd.de/climate_environment/CDC/observations_germany/climate/, DWD, 2023b). The yield productivity data (https://doi.org/10.22029/jlupub-7177, Ellsäßer and Xoplaki, 2022a), the yield anomaly catalogue (https://doi.org/10.22029/jlupub-7176, Ellsäßer and Xoplaki, 2022b), and supplementary data (https://doi.org/10.22029/jlupub-7203, Ellsäßer and Xoplaki, 2022c) are publicly available in the JLUpub research data repository. Historic climate data from the GSWP-W5E5 dataset used for LPJmL5 simulations are available from https://doi.org/10.48364/ISIMIP.982724 (Lange et al., 2022). The historical data of atmospheric N deposition and atmospheric CO2 concentrations can be obtained from https://doi.org/10.48364/ISIMIP.600567 (Yang and Tian, 2020) and https://doi.org/10.48364/ISIMIP.664235.2 (Büchner and Reyer, 2022), respectively. All input data, model code, model outputs, and post-processing scripts that have been used to produce the LPJmL-related results in this paper are archived at the Potsdam Institute for Climate Impact Research and are available upon request. Lightning data from the EUCLID network are available by request via the Austrian Lightning Detection and Information System (https://www.aldis.at/en/contact/, ALDIS).
The supplement related to this article is available online at: https://doi.org/10.5194/nhess-25-541-2025-supplement.
EX and FE coordinated the interdisciplinary task force on compound events within climXtreme and this collaborative paper, conducted the agriculture case study analysis with Fig. 6 and the methods, and prepared the first and final drafts of the paper based on the contribution of the co-authors; ER contributed to the drivers of the hot summer of 2018 case study with Fig. 1; SvS and PF contributed to the detection of spatial patterns of extreme events and Fig. 2; LG and SK contributed to the surface water storage case study analysis and Fig. 3; LJ contributed to the soil moisture case study and Fig. 4; JH contributed to the analysis of the agricultural and hydrological droughts and Fig. 5; DG and FK contributed to the forestry case study; JGP and T-CC contributed to the windstorm description and prepared Figs. 7 and S1; JGP contributed to the compound events under climate change section; JG conducted the loss analysis for windstorms with Fig. 8 and contributed to the methods section; FS conducted the copula analysis and prepared Fig. 9; KMN contributed to the rockfall event case study analysis with Fig. 10, drafted the section on precipitation–wind compound events, and contributed to the compound events under climate change section; SM and MA analysed convective storms and provided Fig. 11; LSG did the CMIP6 MPI-GE projection study and prepared Fig. 12; KH contributed to the analysis of soil moisture representation and trends in model simulations with Fig. 13. NL and OV contributed to the temperature–precipitation compound events section; JL drafted different sections and versions of the paper. EX coordinated the writing and finalisation efforts. All authors contributed to writing and revisions of the manuscript.
At least one of the (co-)authors is a member of the editorial board of Natural Hazards and Earth System Sciences. The peer-review process was guided by an independent editor, and the authors also have no other competing interests to declare.
Publisher’s note: Copernicus Publications remains neutral with regard to jurisdictional claims made in the text, published maps, institutional affiliations, or any other geographical representation in this paper. While Copernicus Publications makes every effort to include appropriate place names, the final responsibility lies with the authors.
This article is part of the special issue “Past and future European atmospheric extreme events under climate change”. It is not associated with a conference.
We acknowledge the World Climate Research Programme's Working Group on Regional Climate, as well as the Working Group on Coupled Modelling, the former coordinating body of CORDEX and responsible panel for CMIP5. We also thank the climate modelling groups for producing and making available their model output. We also acknowledge the Earth System Grid Federation infrastructure, an international effort led by the US Department of Energy's Program for Climate Model Diagnosis and Intercomparison, the European Network for Earth System Modelling, and other partners in the Global Organization for Earth System Science Portals (GO-ESSP). We acknowledge the E-OBS dataset from the EU-FP6 project UERRA (http://www.uerra.eu, last access: 12 June 2023) and the Copernicus Climate Change Service, as well as the data providers in the ECA&D project (https://www.ecad.eu, last access: 12 June 2023). We sincerely thank the editor, Frank Kaspar, and the two anonymous reviewers for their valuable comments and suggestions, which have significantly improved the quality of this paper.
This research has been supported by the Bundesministerium für Bildung und Forschung (BMBF), project ClimXtreme (Elena Xoplaki, Florian Ellsäßer, Jürg Luterbacher, Niklas Luther, and Odysseas Vlachopoulos, grant no. 01LP1903C; Jens Grieger and Katrin M. Nissen, grant no. 01LP1903A; Joaquim G. Pinto, Hendrik Feldmann, Markus Augenstein, Ting-Chen Chen, and Susanna Mohr, grant no. 01LP1901A; Petra Friederichs and Svenja Szemkus, grant no. 01LP1902A; Daniel Gliksman, grant no. 01LP1903F; Laura Goulier and Stefan Kollet, grant no. 01LP1903G; Karsten Haustein and Florian Knutzen, grant no. 01LP1906A; Jens Heinke and Christoph Müller, grant no. 01LP1903D; Lisa Jach, grant no. 01LP1902D; Christoph Mudersbach and Felix Simon, grant no. 01LP1902M; Efi Rousi, grant no. 01LP1901E; Laura Suarez-Gutierrez, grant no. 01LP1901F; Sara M. Vallejo-Bernal and Frederik Wolf, grant no. 01LP1902J). Elena Xoplaki, Niklas Luther, and Odysseas Vlachopoulos were supported by the EU Horizon 2020 project CLINT (grant no. 101003876). Elena Xoplaki was supported by the German Federal Ministry for Economic Affairs and Climate Action, BMWK, project DAKI-FWS (grant no. 01MK21009I) and the Horizon Europe project MedEWSa (grant no. 101121192). Joaquim G. Pinto was supported by the AXA Research Fund (https://axa-research.org/en/project/joaquim-pinto, last access: 19 January 2025). Laura Suarez-Gutierrez was supported by the Horizon Europe framework programme under the Marie Skłodowska-Curie grant (no. 101064940). Sara M. Vallejo-Bernal was supported by the DFG training group NatRiskChange (grant no. GRK 2043/1).
This paper was edited by Frank Kaspar and reviewed by two anonymous referees.
Aalbers, E. E., van Meijgaard, E., Lenderink, G., de Vries, H., and van den Hurk, B. J. J. M.: The 2018 west-central European drought projected in a warmer climate: how much drier can it get?, Nat. Hazards Earth Syst. Sci., 23, 1921–1946, https://doi.org/10.5194/nhess-23-1921-2023, 2023.
Allen, C. D., Breshears, D. D., and McDowell, N. G.: On underestimation of global vulnerability to tree mortality and forest die-off from hotter drought in the Anthropocene, Ecosphere, 6, 1–55, 2015.
Augenstein, M., Mohr, S., and Kunz, M.: Influence of the North Atlantic Oscillation on annual spatio-temporal lightning clusters in western and central Europe, EGUsphere [preprint], https://doi.org/10.5194/egusphere-2024-2804, 2024.
Barriopedro, D., Fischer, E. M., Luterbacher, J., Trigo, R. M., and García-Herrera, R.: The hot summer of 2010: redrawing the temperature record map of Europe, Science, 332, 220–224, https://doi.org/10.1126/science.1201224, 2011.
Bastos, A., Ciais, P., Friedlingstein, P., Sitch, S., Pongratz, J., Fan, L., Wigneron, J. P., Weber, U., Reichstein, M., Fu, Z., Anthoni, P., Arneth, A., Haverd, V., Jain, A. K., Joetzjer, E., Knauer, J., Lienert, S., Loughran, T., McGuire, P. C., Tian, H., Viovy, N., and Zaehle, S.: Direct and seasonal legacy effects of the 2018 heat wave and drought on European ecosystem productivity, Sci. Adv., 6, eaba2724, https://doi.org/10.1126/sciadv.aba2724, 2020.
Bastos, A., Orth, R., Reichstein, M., Ciais, P., Viovy, N., Zaehle, S., Anthoni, P., Arneth, A., Gentine, P., Joetzjer, E., Lienert, S., Loughran, T., McGuire, P. C., O, S., Pongratz, J., and Sitch, S.: Vulnerability of European ecosystems to two compound dry and hot summers in 2018 and 2019, Earth Syst. Dynam., 12, 1015–1035, https://doi.org/10.5194/esd-12-1015-2021, 2021.
Beillouin, D., Schauberger, B., Bastos, A., Ciais, P., and Makowski, D.: Impact of extreme weather conditions on European crop production in 2018, Philos. T. R. Soc. B, 375, 20190510, https://doi.org/10.1098/rstb.2019.0510, 2020.
Bender, J.: Zur Ermittlung von hydrologischen Bemessungsgrößen an Flussmündungen mit Verfahren der multivariaten Statistik. Mitteilung des Forschungsinstituts Wasser und Umwelt der Universität Siegen, 9, http://dokumentix.ub.uni-siegen.de/opus/volltexte/2015/965/pdf/Dissertation_Jens_Bender.pdf (last access: 19 October 2024), 2015.
Bevacqua, E., Maraun, D., Hobæk Haff, I., Widmann, M., and Vrac, M.: Multivariate statistical modelling of compound events via pair-copula constructions: analysis of floods in Ravenna (Italy), Hydrol. Earth Syst. Sci., 21, 2701–2723, https://doi.org/10.5194/hess-21-2701-2017, 2017.
Bevacqua, E., De Michele, C., Manning, C., Couasnon, A., Ribeiro, A. F. S., Ramos, A. M., Vignotto, E., Bastos, A., Blesić, S., Durante, F., Hillier, J., Oliveira, S. C., Pinto, J. G., Ragno, E., Rivoire, P., Saunders, K., van der Wiel, K., Wu, W., Zhang, T., and Zscheischler, J.: Guidelines for studying diverse types of compound weather and climate events, Earth's Future, 9, e2021EF002340, https://doi.org/10.1029/2021EF002340, 2021.
Bevacqua, E., Suarez-Gutierrez, L., Jézéquel, A., Lehner, F., Vrac, M., Yiou, P., and Zscheischler J.: Advancing research on compound weather and climate events via large ensemble model simulations, Nat. Commun., 14, 2145, https://doi.org/10.1038/s41467-023-37847-5, 2023.
Birant, D. and Kut, A.: ST-DBSCAN: An algorithm for clustering spatial-temporal data, Data Knowl. Eng., 60, 208–221, https://doi.org/10.1016/j.datak.2006.01.013, 2007.
Blauhut, V., Stoelzle, M., Ahopelto, L., Brunner, M. I., Teutschbein, C., Wendt, D. E., Akstinas, V., Bakke, S. J., Barker, L. J., Bartošová, L., Briede, A., Cammalleri, C., Kalin, K. C., De Stefano, L., Fendeková, M., Finger, D. C., Huysmans, M., Ivanov, M., Jaagus, J., Jakubínský, J., Krakovska, S., Laaha, G., Lakatos, M., Manevski, K., Neumann Andersen, M., Nikolova, N., Osuch, M., van Oel, P., Radeva, K., Romanowicz, R. J., Toth, E., Trnka, M., Urošev, M., Urquijo Reguera, J., Sauquet, E., Stevkov, A., Tallaksen, L. M., Trofimova, I., Van Loon, A. F., van Vliet, M. T. H., Vidal, J.-P., Wanders, N., Werner, M., Willems, P., and Živković, N.: Lessons from the 2018–2019 European droughts: a collective need for unifying drought risk management, Nat. Hazards Earth Syst. Sci., 22, 2201–2217, https://doi.org/10.5194/nhess-22-2201-2022, 2022.
Brakkee, E., van Huijgevoort, M. H. J., and Bartholomeus, R. P.: Improved understanding of regional groundwater drought development through time series modelling: the 2018–2019 drought in the Netherlands, Hydrol. Earth Syst. Sci., 26, 551–569, https://doi.org/10.5194/hess-26-551-2022, 2022.
Brauns, B., Cuba, D., Bloomfield, J. P., Hannah, D. M., Jackson, C., Marchant, B. P., Heudorfer, B., Van Loon, A. F., Bessière, H., Thunholm, B., and Schubert, G.: The Groundwater Drought Initiative (GDI): Analysing and understanding groundwater drought across Europe, Proc. IAHS, 383, 297–305, https://doi.org/10.5194/piahs-383-297-2020, 2020.
Brun, P., Psomas, A., Ginzler, C., Thuiller, W., Zappa, M., and Zimmermann, N. E.: Large-scale early-wilting response of Central European forests to the 2018 extreme drought, Glob. Change Biol., 26, 7021–7035, https://doi.org/10.1111/gcb.15360, 2020.
Büchner, M. and Reyer, C.: ISIMIP3a atmospheric composition input data (v1.2), ISIMIP Repository [data set], https://doi.org/10.48364/ISIMIP.664235.2, 2022.
Buras, A., Rammig, A., and Zang, C. S.: Quantifying impacts of the 2018 drought on European ecosystems in comparison to 2003, Biogeosciences, 17, 1655–1672, https://doi.org/10.5194/bg-17-1655-2020, 2020.
Caldeira, M. C., Lecomte, X., David, T. S., Pinto, J. G., Bugalho, M. N., and Werner, C.: Synergy of extreme drought and plant invasion reduce ecosystem functioning and resilience, Sci. Rep., 5,15110, https://doi.org/10.1038/srep15110, 2015
Carnicer, J., Alegria, A., Giannakopoulos, C., Di Giuseppe, F., Karali, A., Koutsias, N., Lionello, P., Parrington, M., and Vitolo, C.: Global warming is shifting the relationships between fire weather and realized fire-induced CO2 emissions in Europe, Sci. Rep., 12, 10365, https://doi.org/10.1038/s41598-022-14480-8, 2022.
Cerlini, P. B., Silvestri, L., Meniconi, S., and Brunone, B.: Simulation of the water table elevation in shallow unconfined aquifers by means of the ERA5 soil moisture dataset: The Umbria region case study, Earth Interact., 25, 15–32, https://doi.org/10.1175/EI-D-20-0011.1, 2021.
Conradt, T., Engelhardt, H., Menz, C., Vicente-Serrano, S. M., Alvarez Farizo, B., Peña-Angulo, D., Domínguez-Castro, F., Eklundh, L., Jin, H., Boincean, B., Murphy, C., and López-Moreno, J. I.: Cross-sectoral impacts of the 2018–2019 Central European drought and climate resilience in the German part of the Elbe River basin, Reg. Environ. Change, 23, 32, https://doi.org/10.1007/s10113-023-02032-3, 2023.
Cooley, D. and Thibaud, E.: Decompositions of dependence for high-dimensional extremes, Biometrika, 106, 587–604, https://doi.org/10.1093/biomet/asz028, 2019.
Cornes, R. C., van der Schrier, G., van den Besselaar, E. J. M., and Jones, P. D.: An Ensemble Version of the E-OBS Temperature and Precipitation Data Sets, J. Geophys. Res.-Atmos., 123, 9391–9409, https://doi.org/10.1029/2017JD028200, 2018.
Cucchi, M., Weedon, G. P., Amici, A., Bellouin, N., Lange, S., Müller Schmied, H., Hersbach, H., and Buontempo, C.: WFDE5: bias-adjusted ERA5 reanalysis data for impact studies, Earth Syst. Sci. Data, 12, 2097–2120, https://doi.org/10.5194/essd-12-2097-2020, 2020.
Di Capua, G., Sparrow, S., Kornhuber, K., Rousi, E., Osprey, S., Wallom, D., van den Hurk, B., and Coumou, D.: Drivers behind the summer 2010 wave train leading to Russian heatwave and Pakistan flooding, npj Clim. Atmos. Sci., 4, 55, https://doi.org/10.1038/s41612-021-00211-9, 2021.
D'Agostino, V.: Drought in Europe summer 2018: Crisis management in an orderly chaos, Farm-Europe, https://www.farm-europe.eu/blog-en/drought-in-europe-summer-2018-crisis-management-in-an-orderly-chaos/ (last access: 19 October 2024), 2018.
D'Amato, J., Hantz, D., Guerin, A., Jaboyedoff, M., Baillet, L., and Mariscal, A.: Influence of meteorological factors on rockfall occurrence in a middle mountain limestone cliff, Nat. Hazards Earth Syst. Sci., 16, 719–735, https://doi.org/10.5194/nhess-16-719-2016, 2016.
Dacre, H. F., Hawcroft, M. K., Stringer, M. A., and Hodges, K. I.: An extratropical cyclone database: A tool for illustrating cyclone structure and evolution characteristics, B. Am. Meteorol. Soc., 93, 1497–1502, https://doi.org/10.1175/BAMS-D-11-00164.1, 2012.
de Brito, M., Kuhlicke, C., and Marx, A.: Near-real-time drought impact assessment: a text mining approach on the 2018/19 drought in Germany, Environ. Res. Lett., 15, 1040a9, https://doi.org/10.1088/1748-9326/aba4ca, 2020.
Deutscher Wetterdienst: Monatlicher Klimastatus Deutschland August 2018, DWD, Geschäftsbereich Klima und Umwelt, Offenbach, 29 pp., https://www.dwd.de/DE/derdwd/bibliothek/fachpublikationen/selbstverlag/selbstverlag_node.html (last access: 19 October 2024), 2018.
Drouard, M., Kornhuber, K., and Woollings, T.: Disentangling dynamic contributions to summer 2018 anomalous weather over Europe, Geophys. Res. Lett., 46, 12537–12546, 2019.
DWD: Open Data Portal – Phenology, Deutscher Wetterdienst, Offenbach, Germany, DWD [data set], https://opendata.dwd.de/climate_environment/CDC/observations_germany/phenology/, last access: 23 June 2023a.
DWD: Open Data Portal – Observations, Deutscher Wetterdienst, Offenbach, Germany, DWD [data set], https://opendata.dwd.de/climate_environment/CDC/observations_germany/climate/, last access: 23 June 2023b.
Dyrrdal, A. V., Stordal, F., and Lussana, C.: Evaluation of summer precipitation from EURO-CORDEX fine-scale RCM simulations over Norway, Int. J. Climatol., 38, 1661–1677, https://doi.org/10.1002/joc.5287, 2017.
ECA&D: E-OBS gridded dataset, ECA&D [data set], https://www.ecad.eu/download/ensembles/download.php (last access: 23 June 2023), 2023.
Eisenstein, L., Schulz, B., Qadir, G. A., Pinto, J. G., and Knippertz, P.: Identification of high-wind features within extratropical cyclones using a probabilistic random forest – Part 1: Method and case studies, Weather Clim. Dynam., 3, 1157–1182, https://doi.org/10.5194/wcd-3-1157-2022, 2022.
Ellsäßer, F. and Xoplaki, E.: Cropdata – spatial yield productivity data base for the ten most cultivated crops in Germany from 1989 to 2020 – version 1.0, JLUpub [data set], https://doi.org/10.22029/jlupub-7177, 2022a.
Ellsäßer, F. and Xoplaki, E.: Cropdata – yield anomaly catalogue for the ten most cultivated crops in Germany from 1989 to 2020 – version 1.0, JLUpub [data set], https://doi.org/10.22029/jlupub-7176, 2022b.
Ellsäßer, F. and Xoplaki, E.: Cropdata – supplementary data (for spatial yield productivity data base for the ten most cultivated crops in Germany from 1989 to 2020) – version 1.0, JLUpub [data set], https://doi.org/10.22029/jlupub-7203, 2022c.
Ester, M., Kriegel, H. P. Sander, J., Xu, X., Simoudis, E., Han, J., and Fayyad, U. M. (Eds.): A density-based algorithm for discovering clusters in large spatial databases with noise. Proceedings of the Second International Conference on Knowledge Discovery and Data Mining (KDD-96), AAAI Press, 226–231, ISBN 1-57735-004-9, 1996.
Feurdean, A., Vannière, B., Finsinger, W., Warren, D., Connor, S. C., Forrest, M., Liakka, J., Panait, A., Werner, C., Andrič, M., Bobek, P., Carter, V. A., Davis, B., Diaconu, A.-C., Dietze, E., Feeser, I., Florescu, G., Gałka, M., Giesecke, T., Jahns, S., Jamrichová, E., Kajukało, K., Kaplan, J., Karpińska-Kołaczek, M., Kołaczek, P., Kuneš, P., Kupriyanov, D., Lamentowicz, M., Lemmen, C., Magyari, E. K., Marcisz, K., Marinova, E., Niamir, A., Novenko, E., Obremska, M., Pędziszewska, A., Pfeiffer, M., Poska, A., Rösch, M., Słowiński, M., Stančikaitė, M., Szal, M., Święta-Musznicka, J., Tanţău, I., Theuerkauf, M., Tonkov, S., Valkó, O., Vassiljev, J., Veski, S., Vincze, I., Wacnik, A., Wiethold, J., and Hickler, T.: Fire hazard modulation by long-term dynamics in land cover and dominant forest type in eastern and central Europe, Biogeosciences, 17, 1213–1230, https://doi.org/10.5194/bg-17-1213-2020, 2020.
Fischer, E. M. and Schär, C.: Consistent geographical patterns of changes in high-impact European heatwaves, Nat. Geosci., 3, 398–403, https://doi.org/10.1038/ngeo866, 2010.
Fischer, E. M., Seneviratne, S. I., Vidale, P. L., Lüthi, D., and Schär, C.: Soil moisture–atmosphere interactions during the 2003 European summer heatwave, J. Climate, 20, 5081–5099, https://doi.org/10.1175/JCLI4288.1, 2007.
Fink, A. H., Brücher, T., Krüger, A., Leckebusch, G. C., Pinto, J. G., and Ulbrich, U.: The 2003 European summer heatwaves and drought – synoptic diagnosis and impacts, Weather, 59, 209–216, https://doi.org/10.1256/wea.73.04, 2004.
Fink, A. H., Brücher, T., Ermert, V., Krüger, A., and Pinto, J. G.: The European storm Kyrill in January 2007: synoptic evolution, meteorological impacts and some considerations with respect to climate change, Nat. Hazards Earth Syst. Sci., 9, 405–423, https://doi.org/10.5194/nhess-9-405-2009, 2009.
Frank, M. J.: On the simultaneous associativity of F(x,y) and , Aequationes Math., 19, 194–226, 1979.
García-Herrera, R., Díaz, J., Trigo, R. M., Luterbacher, J., and Fischer, E. M.: A Review of the European Summer Heat Wave of 2003, Crit. Rev. Env. Sci. Tec., 40, 267–306, https://doi.org/10.1080/10643380802238137, 2010.
Giorgi, F., Jones, C., and Arsar, G. R.: Addressing climate information needs at the regional level: the CORDEX framework, WMO Bulletin, 58, 175–183, 2009.
Haeseler, S., Lefebvre, C., Bissolli, P., Daßler, J., and Mamtimin, B.: Orkantief FRIEDERIKE wütet am 18. Januar 2018 über Europa. Deutsche Wetterdienst, https://www.dwd.de/DE/leistungen/besondereereignisse/stuerme/20180123_friederike_europa.pdf?__blob=publicationFile&v=9, last access: 19 October 2024.
Hari, V., Rakovec, O., Markonis, Y., Hanel, M., and Kumar, R.: Increased future occurrences of the exceptional 2018–2019 Central European drought under global warming, Sci. Rep., 10, 1–10, 2020.
Hartick, C., Furusho-Percot, C., Goergen, K., and Kollet, S.: An interannual probabilistic assessment of subsurface water storage over Europe using a fully coupled terrestrial model, Water Resour. Res., 57, e2020WR027828, https://doi.org/10.1029/2020WR027828, 2021.
Hersbach, H., Bell, B., Berrisford, P., Hirahara, S., Horányi, A., Muñoz-Sabater, J., Nicolas, J., Peubey, C., Radu, R., Schepers, D., Simmons, A., Soci, C., Abdalla, S., Abellan, X., Balsamo, G., Bechtold, P., Biavati, G., Bidlot, J., Bonavita, M., De Chiara, G., Dahlgren, P., Dee, D., Diamantakis, M., Dragani, R., Flemming, J., Forbes, R., Fuentes, M., Geer, A., Haimberger, L., Healy, S., Hogan, R. J., Hólm, E., Janisková, M., Keeley, S., Laloyaux, P., Lopez, P., Lupu, C., Radnoti, G., de Rosnay, P., Rozum, I., Vamborg, F., Villaume, S., and Thépaut, J.-N.: The ERA5 global reanalysis, Q. J. Roy. Meteor. Soc., 146, 1999–2049, https://doi.org/10.1002/qj.3803, 2020.
Hersbach, H., Bell, B., Berrisford, P., Biavati, G., Horányi, A., Muñoz Sabater, J., Nicolas, J., Peubey, C., Radu, R., Rozum, I., Schepers, D., Simmons, A., Soci, C., Dee, D., and Thépaut, J.-N.: ERA5 hourly data on single levels from 1940 to present, Copernicus Climate Change Service (C3S) Climate Data Store (CDS) [data set], https://doi.org/10.24381/cds.adbb2d47, 2023.
Hlásny, T., Zimová, S., Merganičová, K., Štěpánek, P., Modlinger, R., and Turčáni, M: Devastating outbreak of bark beetles in the Czech Republic: Drivers, impacts, and management implications, Forest Ecol. Manag., 490, 119075, https://doi.org/10.1016/j.foreco.2021.119075, 2021.
Herzfeld, T., Heinke, J., Rolinski, S., and Müller, C.: Soil organic carbon dynamics from agricultural management practices under climate change, Earth Syst. Dynam., 12, 1037–1055, https://doi.org/10.5194/esd-12-1037-2021, 2021.
IPCC: Weather and Climate Extreme Events in a Changing Climate, in: Climate Change 2021 – The Physical Science Basis: Working Group I Contribution to the Sixth Assessment Report of the Intergovernmental Panel on Climate Change, 1513–1766, Cambridge University Press, Cambridge, United Kingdom and New York, NY, USA, 1513–1766, https://doi.org/10.1017/9781009157896.013, 2023a.
IPCC: Climate Change 2022 – Impacts, Adaptation and Vulnerability: Working Group II Contribution to the Sixth Assessment Report of the Intergovernmental Panel on Climate Change, Cambridge University Press, Cambridge, UK and New York, NY, USA, 3056 pp., https://doi.org/10.1017/9781009325844, 2023b.
Jane, R., Cadavid, L., Obeysekera, J., and Wahl, T.: Multivariate statistical modelling of the drivers of compound flood events in south Florida, Nat. Hazards Earth Syst. Sci., 20, 2681–2699, https://doi.org/10.5194/nhess-20-2681-2020, 2020.
Kaiser, D., Voynova, Y. G., and Brix, H.: Effects of the 2018 European heatwave and drought on coastal biogeochemistry in the German Bight, Sci. Total Environ., 892, 164316, https://doi.org/10.1016/j.scitotenv.2023.164316, 2023.
Kaspar, F., Müller-Westermeier, G., Penda, E., Mächel, H., Zimmermann, K., Kaiser-Weiss, A., and Deutschländer, T.: Monitoring of climate change in Germany – data, products and services of Germany's National Climate Data Centre, Adv. Sci. Res., 10, 99–106, https://doi.org/10.5194/asr-10-99-2013, 2013.
Kaspar, F., Zimmermann, K., and Polte-Rudolf, C.: An overview of the phenological observation network and the phenological database of Germany's national meteorological service (Deutscher Wetterdienst), Adv. Sci. Res., 11, 93–99, 2015.
Kaspar, F., Friedrich, K., and Imbery, F.: Observed temperature trends in Germany: Current status and communication tools, Meteorol. Z., 4, 279–291, https://doi.org/10.1127/metz/2023/1150, 2023.
Kautz, L.-A., Martius, O., Pfahl, S., Pinto, J. G., Ramos, A. M., Sousa, P. M., and Woollings, T.: Atmospheric blocking and weather extremes over the Euro-Atlantic sector – a review, Weather Clim. Dynam., 3, 305–336, https://doi.org/10.5194/wcd-3-305-2022, 2022.
Kim, H.: Global Soil Wetness Project Phase 3 Atmospheric Boundary Conditions (Experiment 1), Data Integration and Analysis System (DIAS) [data set], https://doi.org/10.20783/DIAS.501, 2017.
Kohonen, T.: Essentials of the self-organizing map, Neural Networks, 37, 52–65, https://doi.org/10.1016/j.neunet.2012.09.018, 2013.
Kornhuber, K., Osprey, S., Coumou, D., Petri, S., Petoukhov, V., Rahmstorf, S., and Gray, L.: Extreme weather events in early Summer 2018 connected by a recurrent hemispheric wave pattern, Environ. Res. Lett., 14, 054002, https://doi.org/10.31223/osf.io/tq23m, 2019.
Kornhuber, K., Coumou, D., Vogel, E., Lesk, C., Donges, J. F., Lehmann, J., and Horton, R. M.: Amplified Rossby waves enhance risk of concurrent heatwaves in major breadbasket regions, Nat. Clim. Change, 10, 48–53, https://doi.org/10.1038/s41558-019-0637-z, 2020.
Knutzen, F., Averbeck, P., Barrasso, C., Bouwer, L. M., Gardiner, B., Grünzweig, J. M., Hänel, S., Haustein, K., Johannessen, M. R., Kollet, S., Müller, M. M., Pietikäinen, J.-P., Pietras-Couffignal, K., Pinto, J. G., Rechid, D., Rousi, E., Russo, A., Suarez-Gutierrez, L., Veit, S., Wendler, J., Xoplaki, E., and Gliksman, D.: Impacts on and damage to European forests from the 2018–2022 heat and drought events, Nat. Hazards Earth Syst. Sci., 25, 77–117, https://doi.org/10.5194/nhess-25-77-2025, 2025.
Lange, S., Mengel, M., Treu, S., and Büchner, M.: ISIMIP3a atmospheric climate input data (v1.0), ISIMIP Repository [data set], https://doi.org/10.48364/ISIMIP.982724, 2022.
Lau, W. K. M. and Kim, K.: The 2010 Pakistan Flood and Russian Heat Wave: Teleconnection of Hydrometeorological Extremes, J. Hydrometeorol., 13, 392–403, https://doi.org/10.1175/JHM-D-11-016.1, 2012.
Leonard, M., Westra, S., Phatak, A., Lambert, M., van den Hurk, B., McInnes, K., Risbey, J., Schuster, S., Jakob, D., and Stafford-Smith, M.: A compound event framework for understanding extreme impacts, WIRES Clim. Change, 5, 113–128, https://doi.org/10.1002/wcc.252, 2014.
Lidskog, R., Johansson, J., and Sjödin, D.: Wildfires, responsibility and trust: public understanding of Sweden'largest wildfire, Scand. J. Forest Res., 34, 319–328, 2019.
Liu, X., He, B., Guo, L., Huang, L., and Chen, D.: Similarities and differences in the mechanisms causing the European summer heatwaves in 2003, 2010, and 2018, Earth's Future, 7, e2019EF001386, https://doi.org/10.1029/2019EF001386, 2020.
Lorenz, R., Jaeger, E. B., and Seneviratne, S. I.: Persistence of heat waves and its link to soil moisture memory, Geophys. Res. Lett., 37, L09703, https://doi.org/10.1029/2010GL042764, 2010.
Lutz, F., Herzfeld, T., Heinke, J., Rolinski, S., Schaphoff, S., von Bloh, W., Stoorvogel, J. J., and Müller, C.: Simulating the effect of tillage practices with the global ecosystem model LPJmL (version 5.0-tillage), Geosci. Model Dev., 12, 2419–2440, https://doi.org/10.5194/gmd-12-2419-2019, 2019.
Luterbacher, J., Dietrich, D., Xoplaki, E., Grosjean, M. and Wanner, H.: European seasonal and annual temperature variability, trends and extremes since 1500, Science, 303, 1499–1503, https://doi.org/10.1126/science.1093877, 2004.
Manning, C., Widmann, M., Bevacqua, E., Van Loon, A. F., Maraun, D., and Vrac, M.: Soil moisture drought in Europe: a compound event of precipitation and potential evapotranspiration on multiple time scales, J. Hydrometeorol., 19, 1255–1271, https://doi.org/10.1175/JHM-D-18-0017.1, 2018.
Manning, C., Widmann, M., Maraun, D., Van Loon, A. F., and Bevacqua, E.: Large spread in the representation of compound long-duration dry and hot spells over Europe in CMIP5, Weather Clim. Dynam., 4, 309–329, https://doi.org/10.5194/wcd-4-309-2023, 2023.
Manning, C., Kendon, E. J., Fowler, H. J., Catto, J. F., Chan, S. C., and Sansom, P. G.: Compound wind and rainfall extremes: Drivers and future changes over the UK and Ireland, Weather and Climate Extremes, 44, 100673, https://doi.org/10.1016/j.wace.2024.100673, 2024.
Martius, O.; Pfahl, S., and Chevalier, C.: A global quantification of compound precipitation and wind extremes, Geophys. Res. Lett., 43, 7709–7717, https://doi.org/10.1002/2016GL070017, 2016.
McKee, T. B., Doesken, N. J., and Kleist, J.: The Relationship of Drought Frequency and Duration to Time Scales, 8th Conference on Applied Climatology, Anaheim, 17–22 January 1993, 179–184, 1993.
Matzarakis, A., Laschewski, G., and Muthers, S.: The heat health warning system in Germany – Application and warnings for 2005 to 2019, Atmosphere, 11, 170, https://doi.org/10.3390/atmos11020170, 2020.
Messmer, M. and Simmonds, I.: Global analysis of cyclone-induced compound precipitation and wind extreme events, Weather and Climate Extremes, 32, 100324, https://doi.org/10.1016/j.wace.2021.100324, 2021.
Milanović, M., Knapp, S., Pyšek, P., and Kühn, I.: Linking traits of invasive plants with ecosystem services and disservices, Ecosyst. Serv., 42, 2020, https://doi.org/10.1016/j.ecoser.2020.101072, 2020.
Miralles, D. G., Gentine, P., Seneviratne, S. I., and Teuling, A. J.: Land–atmospheric feedbacks during droughts and heatwaves: state of the science and current challenges, Ann. NY Acad. Sci., 1436, 19–35, https://doi.org/10.1111/nyas.13912, 2019
Mohr, S., Wandel, J., Lenggenhager, S., and Martius, O.: Relationship between atmospheric blocking and warm season thunderstorms over western and central Europe, Q. J. Roy. Meteor. Soc., 145, 3040–3056, https://doi.org/10.1002/qj.3603, 2019.
Mohr, S., Wilhelm, J., Wandel, J., Kunz, M., Portmann, R., Punge, H. J., Schmidberger, M., Quinting, J. F., and Grams, C. M.: The role of large-scale dynamics in an exceptional sequence of severe thunderstorms in Europe May–June 2018, Weather Clim. Dynam., 1, 325–348, https://doi.org/10.5194/wcd-1-325-2020, 2020.
Munich RE: Extreme storms, wildfires and droughts cause heavy nat cat losses in 2018. 08/01/2019 Media Information, https://www.munichre.com/en/company/media-relations/media-information-and-corporate-news/media-information/2019/2019-01-08-media-information.html (last access: 19 October 2024), 2019.
Murray, R. J. and Simmonds, I.: A numerical scheme for tracking cyclone centres from digital data. Part I: Development and operation of the scheme, Aust. Meteorol. Mag., 39, 155–166, 1991.
Naturgefahrenreport: Die Schaden-Chronik der deutschen Versicherer, Gesamtverband der Deutschen Versicherungswirtschaft, Gesamtverband der Deutschen Versicherungswirtschaft e. V., 56 pp., https://www.gdv.de/resource/blob/51710/e5eaa53a9ec21fb9241120c1d1850483/naturgefahrenreport-2019-schaden-chronik-data.pdf (last access: 19 October 2024), 2019.
Nissen, K. M., Rupp, S., Kreuzer, T. M., Guse, B., Damm, B., and Ulbrich, U.: Quantification of meteorological conditions for rockfall triggers in Germany, Nat. Hazards Earth Syst. Sci., 22, 2117–2130, https://doi.org/10.5194/nhess-22-2117-2022, 2022.
OECD: Managing Climate Risks, Facing up to Losses and Damages, OECD Publishing, Paris, https://doi.org/10.1787/55ea1cc9-en, 2021.
Öhrn, P., Berlin, M., Elfstrand, M., Krokene, P., and Jönsson, A. M.: Seasonal variation in Norway spruce response to inoculation with bark beetle-associated bluestain fungi one year after a severe drought, Forest Ecol. Manag., 496, 119443, https://doi.org/10.1016/j.foreco.2021.119443, 2021.
Olonscheck, D., Suarez-Gutierrez, L., Milinski, S., Beobide-Arsuaga, G., Baehr, J., Fröb, F., Hellmich, L., Ilyina, T., Kadow, C., Krieger, D., Li, H., Marotzke, J., Plésiat, E., Schupfner, M., Wachsmann, F., Wieners, K.-H., and Brune, S.: The new Max Planck Institute Grand Ensemble with CMIP6 forcing and high-frequency model output, Authorea, https://doi.org/10.22541/essoar.168319746.64037439/v1, 2023.
Orth, R. and Seneviratne, S. I.: Analysis of soil moisture memory from observations in Europe, J. Geophys. Res., 117, D15115, https://doi.org/10.1029/2011JD017366, 2012.
Pinto, J. G., Spangehl, T., Ulbrich, U., and Speth, P.: Sensitivities of a cyclone detection and tracking algorithm: individual tracks and climatology, Meteorol. Z., 14, 823–838, https://doi.org/10.1127/0941-2948/2005/0068, 2005.
Pinto, J. G., Zacharias, S., Fink, A. H., Leckebusch, G. C, and Ulbrich, U.: Factors contributing to the development of extreme North Atlantic cyclones and their relationship with the NAO, Clim. Dynam., 32, 711–737, https://doi.org/10.1007/s00382-008-0396-4, 2009.
Piper, D., Kunz, M., Ehmele, F., Mohr, S., Mühr, B., Kron, A., and Daniell, J.: Exceptional sequence of severe thunderstorms and related flash floods in May and June 2016 in Germany – Part 1: Meteorological background, Nat. Hazards Earth Syst. Sci., 16, 2835–2850, https://doi.org/10.5194/nhess-16-2835-2016, 2016.
Piper, D. A., Kunz, M., Allen, J. T., and Mohr, S.: Investigation of the temporal variability of thunderstorms in Central and Western Europe and the relation to large-scale flow and teleconnection patterns, Q. J. Roy. Meteor. Soc., 145, 3644–3666, https://doi.org/10.1002/qj.3647, 2019.
Rauthe, M., Steiner, H., Riediger, U., Mazurkiewicz, A., and Gratzki, A.: A Central European precipitation climatology – Part I: Generation and validation of a high-resolution gridded daily data set (HYRAS), Meteorol. Z., 22, 235–256, https://doi.org/10.1127/0941-2948/2013/0436, 2013.
Riahi, K., van Vuuren, D. P., Kriegler, E., Edmonds, J., O'Neill, B. C., Fujimori, S., Bauer, N., Calvin, K., Dellink, R., Fricko, O., Lutz, W., Popp, A., Crespo Cuaresma, J., KC, S., Leimbach, M., Jiang, L., Kram, T., Rao, S., Emmerling, J., Ebi, K., Hasegawa, T., Havlik, P., Humpenöder, F., Aleluia Da Silva, L., Smith, S., Stehfest, E., Bosetti, V., Eom, J., Gernaat, D., Masui, T., Rogelj, J., Strefler, J., Drouet, L., Krey, V., Luderer, G., Harmsen, M., Takahashi, K., Baumstark, L., Doelman, J. C., Kainuma, M., Klimont, Z., Marangoni, G., Lotze-Campen, H., Obersteiner, M., Tabeau, A., and Tavon, M.: The Shared Socioeconomic Pathways and their energy, land use, and greenhouse gas emissions implications: An overview, Global Environ. Chang., 42, 153–168, https://doi.org/10.1016/j.gloenvcha.2016.05.009, 2017.
Ridder, N., Pitman, A. J., Westra, S., Ukkola, A., Do, H., Bador, M., Hirsch, A. L., Evans, J. P., Di Luca, A., and Zscheischler, J.: Global hotspots for the occurrence of compound events, Nat. Commun., 11, 5956, https://doi.org/10.1038/s41467-020-19639-3, 2020.
Ridder, N. N., Pitman, A. J., and Ukkola, A. M.: Do CMIP6 climate models simulate global or regional compound events skillfully?, Geophys. Res. Lett., 48, e2020GL091152, https://doi.org/10.1029/2020GL091152, 2021.
Ridder, N. N., Ukkola, A. M., Pitman, A. J., and Perkins-Kirkpatrick, S. E.: Increased occurrence of high impact compound events under climate change, npj Clim. Atmos. Sci., 5, 3, https://doi.org/10.1038/s41612-021-00224-4, 2022.
Rupp, S. and Damm, B.: A national rockfall dataset as a tool for analysing the spatial and temporal rockfall occurrence in Germany, Earth Surf. Proc. Land., 45, 1528–1538, https://doi.org/10.1002/esp.4827, 2020.
Rousi, E., Anagnostopoulou, C., Tolika, K., and Maheras, P.: Representing teleconnection patterns over Europe: A comparison of SOM and PCA methods, Atmos. Res., 152, 123–137, https://doi.org/10.1016/j.atmosres.2013.11.010, 2015.
Rousi, E., Kornhuber, K., Beobide-Arsuaga, G., Luo, F., and Coumou, D.: Accelerated western European heatwave trends linked to more-persistent double jets over Eurasia, Nat. Commun., 13, 3851, https://doi.org/10.1038/s41467-022-31432-y, 2022.
Rousi, E., Fink, A. H., Andersen, L. S., Becker, F. N., Beobide-Arsuaga, G., Breil, M., Cozzi, G., Heinke, J., Jach, L., Niermann, D., Petrovic, D., Richling, A., Riebold, J., Steidl, S., Suarez-Gutierrez, L., Tradowsky, J. S., Coumou, D., Düsterhus, A., Ellsäßer, F., Fragkoulidis, G., Gliksman, D., Handorf, D., Haustein, K., Kornhuber, K., Kunstmann, H., Pinto, J. G., Warrach-Sagi, K., and Xoplaki, E.: The extremely hot and dry 2018 summer in central and northern Europe from a multi-faceted weather and climate perspective, Nat. Hazards Earth Syst. Sci., 23, 1699–1718, https://doi.org/10.5194/nhess-23-1699-2023, 2023.
Schaphoff, S., von Bloh, W., Rammig, A., Thonicke, K., Biemans, H., Forkel, M., Gerten, D., Heinke, J., Jägermeyr, J., Knauer, J., Langerwisch, F., Lucht, W., Müller, C., Rolinski, S., and Waha, K.: LPJmL4 – a dynamic global vegetation model with managed land – Part 1: Model description, Geosci. Model Dev., 11, 1343–1375, https://doi.org/10.5194/gmd-11-1343-2018, 2018.
Schuldt, B., Knutzen, F., Delzon, S., Jansen, S., Müller-Haubold, H., Burlett, R., and Leuschner, C.: How adaptable is the hydraulic system of European beech in the face of climate change-related precipitation reduction?, New Phytol., 210, 443–458, 2016.
Schuldt, B., Buras, A., Arend, M., Vitasse, Y., Beierkuhnlein, C., Damm, A., and Kahmen, A.: A first assessment of the impact of the extreme 2018 summer drought on Central European forests, Basic Appl. Ecol., 45, 86–103, 2020.
Seneviratne, S. I., Nicholls, N., Easterling, D., Goodess, C. M., Kanae, S., Kossin, J., Luo, Y., Marengo, J., McInnes, K., Rahimi, M., Reichstein, M., Sorteberg, A., Vera, C., and Zhang, X.: Changes in climate extremes and their impacts on the natural physical environment, in: Managing the Risks of Extreme Events and Disasters to Advance Climate Change Adaptation, edited by: Field, C. B., Barros, V., Stocker, T. F., Qin, D., Dokken, D. J., Ebi, K. L., Mastrandrea, M. D., Mach, K. J., Plattner, G.-K., Allen, S. K., Tignor, M., and Midgley, P. M., A Special Report of Working Groups I and II of the Intergovernmental Panel on Climate Change (IPCC), Cambridge University Press, Cambridge, UK, and New York, NY, USA, 109–230, ISBN 978-1-107-02506-6, 2012.
Senf, C. and Seidl, R.: Persistent impacts of the 2018 drought on forest disturbance regimes in Europe, Biogeosciences, 18, 5223–5230, https://doi.org/10.5194/bg-18-5223-2021, 2021.
Shyrokaya, A., Messori, G., Pechlivanidis, I., Pappenberger, F., Cloke, H. L., and Di Baldassarre, G.: Significant relationships between drought indicators and impacts for the 2018–2019 drought in Germany, Environ. Res. Lett., 19, 014037, https://doi.org/10.1088/1748-9326/ad10d9, 2024.
Simpson, N. P., Mach, K. J., Constable, A., Hess, J. Hogarth, R., Howden, M., Lawrence, J., Lempert, R. J., Muccione, R. J., Mackey, B., New, M. G., O'Neill, B., Otto, F., Pörtner, H.-O., Reisinger, A., Roberts, D., Schmidt, D. N., Seneviratne, S., Strongin, S., van Aalst, M., Totin, E., and Trisos, C. H.: A framework for complex climate change risk assessment, One Earth, 4, 489–501, https://doi.org/10.1016/j.oneear.2021.03.005, 2021.
Song, Y. M., Wang, Z. F., Qi, L. L., and Huang, A. N.: Soil Moisture Memory and Its Effect on the Surface Water and Heat Fluxes on Seasonal and Interannual Time Scales, J. Geophys. Res. Atmos., 124, 10730–10741, 2019.
Spensberger, C., Madonna, E., Boettcher, M., Grams, C. M., Papritz, L., Quinting, J. F., Röthlisberger, M., Sprenger, M., and Zschenderlein, P.: Dynamics of concurrent and sequential Central European and Scandinavian heatwaves, Q. J. Roy. Meteor. Soc., 146, 2998–3013, https://doi.org/10.1002/QJ.3822, 2020.
Statistische Ämter des Bundes und der Länder: Regionaldatenbank Deutschland, https://www.regionalstatistik.de/genesis/online/logon (last access: 19 October 2024), 2021.
Stefanon, M., D'Andrea, F., and Drobinski, P.: Heatwave classification over Europe and the Mediterranean region, Environ. Res. Lett., 7, 014023, https://doi.org/10.1088/1748-9326/7/1/014023, 2012.
Szemkus, S. and Friederichs P.: Spatial patterns and indices for heat waves and droughts over Europe using a decomposition of extremal dependency, Adv. Stat. Clim. Meteorol. Oceanogr., 10, 29–49, https://doi.org/10.5194/ascmo-10-29-2024, 2024.
Taylor, K. E., Stouffer, R. J., and Meehl, G. A.: An Overview of CMIP5 and the experiment design, B. Am. Meteorol. Soc., 93, 485–498, https://doi.org/10.1175/BAMS-D-11-00094.1, 2012.
Tijdeman, E. and Menzel, L.: The development and persistence of soil moisture stress during drought across southwestern Germany, Hydrol. Earth Syst. Sci., 25, 2009–2025, https://doi.org/10.5194/hess-25-2009-2021, 2021.
Toreti, A., Belward, A., Perez-Dominguez, I., Naumann, G., Luterbacher, J., Cronie, O., Seguini, L., Manfron, G., Lopez-Lozano, R., Baruth, B., Berg, M., Dentener, F., Ceglar, A., Chatzopoulos, T., and Zampieri, M.: The exceptional 2018 European water seesaw calls for action on adaptation, Earth's Future 7, 652–663, https://doi.org/10.1029/2019EF001170, 2019a.
Toreti, A., Cronie, O., and Zampieri, M.: Concurrent climate extremes in the key wheat producing regions of the world, Sci. Rep., 9, 5493, https://doi.org/10.1038/s41598-019-41932-5, 2019b.
UNFCCC: Loss and Damage, online guide, United Nations Framework Convention on Climate Change, 46 pp., https://unfccc.int/sites/default/files/resource/loss_and_damage_online_guide.pdf (last access: 19 October 2024), 2024.
van der Wiel, K., Lenderink, G., and de Vries, H.: Physical storylines of future European drought events like 2018 based on ensemble climate modelling, Weather and Climate Extremes, 33, 100350, https://doi.org/10.1016/j.wace.2021.100350, 2021.
Van Loon, A. F. and Van Lanen, H. A. J.: A process-based typology of hydrological drought, Hydrol. Earth Syst. Sci., 16, 1915–1946, https://doi.org/10.5194/hess-16-1915-2012, 2012.
Vautard, R., van Oldenborgh, G. J., Otto, F. E. L., Yiou, P., de Vries, H., van Meijgaard, E., Stepek, A., Soubeyroux, J.-M., Philip, S., Kew, S. F., Costella, C., Singh, R., and Tebaldi, C.: Human influence on European winter wind storms such as those of January 2018, Earth Syst. Dynam., 10, 271–286, https://doi.org/10.5194/esd-10-271-2019, 2019.
Vicente-Serrano, S. M., Beguería, S., and López-Moreno, J. I.: A Multiscalar Drought Index Sensitive to Global Warming: The Standardized Precipitation Evapotranspiration Index, J. Climate, 23, 1696–1718, https://doi.org/10.1175/2009JCLI2909.1, 2010.
Vogel, M. M., Zscheischler, J., Wartenburger, R., Dee, D., and Seneviratne, S. I.: Concurrent 2018 hot extremes across Northern Hemisphere due to human-induced climate change, Earth's future, 7, 692–703, https://doi.org/10.1029/2019EF001189, 2019.
von Bloh, W., Schaphoff, S., Müller, C., Rolinski, S., Waha, K., and Zaehle, S.: Implementing the nitrogen cycle into the dynamic global vegetation, hydrology, and crop growth model LPJmL (version 5.0), Geosci. Model Dev., 11, 2789–2812, https://doi.org/10.5194/gmd-11-2789-2018, 2018.
Wang, L., Wang, W. J., Du, H., Shen, X., Wu, Z., Ma, S., Liu, Z., and Jiang, M.: Was warming amplified under drought conditions across China in observations and future projections?, Earth's Future, 10, e2021EF002614, https://doi.org/10.1029/2021EF002614, 2022.
Wild, M.: Global dimming and brightening: A review, J. Geophys. Res., 114, D00D16, https://doi.org/10.1029/2008JD011470, 2009.
Wild, M.: Decadal changes in radiative fluxes at land and ocean surfaces and their relevance for global warming, WIRES Clim. Change, 7, 91–107, 2016.
Yang, J. and Tian, H.: ISIMIP3b N-deposition input data (v1.0), ISIMIP Repository [data set], https://doi.org/10.48364/ISIMIP.600567, 2020.
Zaitchik, B. F., Omumbo, J., Lowe, R., van Aalst, M., Anderson, L.O., Fischer, E., Norman, C., Robbins, J., Barciela, R., Trtanj, J., von Borries, R., and Luterbacher, J.: Planning for compound hazards during the COVID-19 pandemic: the role of climate information systems, B. Am. Meteorol. Soc., 103, E704–E709, 2022.
Zampieri, M., Ceglar, A., Dentener, F., and Toreti, A.: Wheat yield loss attributable to heat waves, drought and water excess at the global, national and subnational scales, Environ. Res. Lett., 12, 064008, https://doi.org/10.1088/1748-9326/aa723b, 2017.
Zscheischler, J. and Fischer, E. M.: The record-breaking compound hot and dry 2018 growing season in Germany, Weather and Climate Extremes, 29, 100270, https://doi.org/10.1016/j.wace.2020.100270, 2020.
Zscheischler, J., Westra, S., van den Hurk, B. J. J. M., Seneviratne, S. I., Ward, P. J., Pitman, A. AghaKouchak, A., Bresch, D. N., Leonard, M., Wahl, T., and Zhang, X.: Future climate risk from compound events, Nat. Clim. Change, 8, 469–477, https://doi.org/10.1038/s41558-018-0156-3, 2018.
Zscheischler, J., Martius, O., Westra, S., Bevacqua, E., Raymond, C., Horton, R. M., van den Hurk, B., AghaKouchak, A., Jézéquel, A., Mahecha, M. D., Maraun, D., Ramos, A. M., Ridder, N. N., Thiery, W., and Vignotto, E.: A typology of compound weather and climate events, Nat. Rev. Earth Environ., 1, 333–347, https://doi.org/10.1038/s43017-020-0060-z, 2020.
- Abstract
- Introduction
- Data and methods
- Compound events in the year 2018
- Compound events under climate change
- Conclusions – Lessons learned and future steps
- Code availability
- Data availability
- Author contributions
- Competing interests
- Disclaimer
- Special issue statement
- Acknowledgements
- Financial support
- Review statement
- References
- Supplement