the Creative Commons Attribution 4.0 License.
the Creative Commons Attribution 4.0 License.
 | 24 Oct 2025
Temporal persistence of postfire flood hazards under present and future climate conditions in southern Arizona, USA
Tao Liu
Luke A. McGuire
Ann M. Youberg
Charles J. Abolt
Adam L. Atchley
Changes to soil hydraulic properties that reduce infiltration capacity following fire can increase flash flood risks. These risks are exacerbated by rainfall intensification associated with a warming climate. However, the potential effects of climate-change-driven rainfall intensification on postfire floods remain largely unexplored. Using rainfall and runoff observations from a 49.4 km2 watershed in southern Arizona, USA, and a hydrologic model (KINEROS2), we examined the temporal evolution following a historic fire of three crucial hydrologic parameters: soil saturated hydraulic conductivity (Ksp), net capillary drive (Gp), and hydraulic roughness (nc). We explored how the effect of fire on these parameters may influence peak flow under future climate scenarios derived from CMIP6, specifically the medium emissions scenario (SSP2-4.5) and high emissions scenario (SSP5-8.5). Results demonstrate an increase in Ksp from 11 mm h−1 in the first postfire year to 60 mm h−1 in postfire year 3. Gp similarly increased from 19 mm in the first postfire year to 30 mm in the third, while nc was relatively constant. The highest simulated Qp occurred in the first postfire year. Under the SSP2-4.5 scenario, the likelihood of a 100-year flood is projected to be twice as large by the middle of the century relative to its historical magnitude. Simulations further indicate that the maximum expected discharge associated with a postfire flood, as derived from historical data, could be triggered by a 10-year rainstorm under the SSP5-8.5 scenario by the late century. Simulations also demonstrate that rainfall intensification will lead to greater persistence of elevated flood hazards following fire by the late century under both the SSP2-4.5 and the SSP5-8.5 scenarios.
- Article
(6620 KB) - Full-text XML
-
Supplement
(799 KB) - BibTeX
- EndNote


Effects of moderate- and high-severity fire on soil and vegetation promote increases in runoff and erosion (McGuire et al., 2024; Moody et al., 2013; Robichaud et al., 2016), which alter watershed responses to rainfall (Cannon et al., 2008). Modest rainfall can trigger floods and debris flows in recently burned areas (Esposito et al., 2023), with more extreme rainfall having the potential for devastating impacts on areas downstream (Kean et al., 2019; Lancaster et al., 2021). Increases in fire activity (Boer et al., 2016; Canadell et al., 2021; Senande-Rivera et al., 2022) and rainfall intensification (Westra et al., 2014; Fowler et al., 2021) driven by climate change have the potential to further exacerbate postfire flow hazards in the coming decades (Kean and Staley, 2021). Hydrologic models are a valuable tool for quantifying fire effects and assessing postfire flow hazards (McLin et al., 2001; Wu et al., 2021; Li et al., 2022; Liu et al., 2022; Yu et al., 2023), including how they may change under future climate scenarios. However, our ability to use hydrologic models for predicting and mitigating postfire flow hazards would be improved by a better understanding of how to update model parameters after a fire. This includes both the immediate changes following a fire and their temporal evolution as a function of time since the burn (Cydzik and Hogue, 2009; Ebel, 2020; Liu et al., 2021).
Increases in infiltration-excess overland flow are often associated with increases in flooding (Ebel, 2024; Xu et al., 2023) and debris flow hazards (Nyman et al., 2011) in the first several years following fire. Increases in infiltration-excess overland flow following fire result from reductions in interception (Stoof et al., 2012) and water storage in litter and duff (Robichaud et al., 2016) as well as from changes to soil hydraulic properties that reduce infiltration capacity (Ebel and Moody, 2017; Ebel, 2019). Soil burn severity significantly affects hydrologic response by altering key soil properties, with higher severities leading to reduced infiltration and increased runoff, particularly in the initial postfire events (Moody et al., 2016). The immediate effects and temporal persistence of fire-driven changes to soil hydraulic properties have been inferred from model calibration (Cydzik and Hogue, 2009; Liu et al., 2021) and studied using point-scale measurements (Liu et al., 2023; Perkins et al., 2022) and plot-scale rainfall simulation experiments (Robichaud et al., 2016). Fire effects on soil hydraulic properties and runoff are greatest immediately after fire and decay with time (Noske et al., 2016; Ebel and Martin, 2017; Saxe et al., 2018), which is consistent with the conceptual model of a window of disturbance following fire (Shakesby and Doerr, 2006). Ebel and Martin (2017) represent postfire changes in saturated hydraulic conductivity using a logistic curve, though the superposition of fire effects and seasonal variations in soil hydraulic properties can lead to more complex, non-monotonic relationships between soil hydraulic properties and time since fire (Perkins et al., 2022).
The intensity of runoff responses in burned areas also tends to be greatest immediately following fire, with subsequent decreases over time. More than 70 % of the largest postfire floods in the USA have occurred in the first 3 postfire years (Ebel, 2024). Temporal changes in susceptibility to extreme responses following fire are reflected in changes to rainfall intensity–duration (ID) thresholds, which are a commonly used tool to assess debris flow and flash flood likelihood in recently burned watersheds. Rainfall ID thresholds for floods and debris flows are lowest immediately following fire and increase over time (Cannon et al., 2008; Hoch et al., 2021; Thomas et al., 2021; Liu et al., 2022). Increases in infiltration capacity and hydraulic roughness contribute to increases in rainfall ID thresholds as a function of time since fire (McGuire et al., 2021; Thomas et al., 2021; Liu et al., 2022). Rainfall ID thresholds based on intensities averaged over durations of 15–60 min have been used to assess postfire runoff (Ebel, 2020) and floods (Moody and Martin, 2001; Liu et al., 2022). Changes in climate are expected to alter rainfall intensity–duration–frequency curves, with the greatest increases in rainfall intensity occurring over sub-hourly durations (Martel et al., 2021). Increases in rainfall intensity over sub-hourly durations could therefore have a strong effect on postfire flow hazards (Kean and Staley, 2021; Oakley, 2021). However, the combined effects of climate change and postfire hydrologic processes on projections of future flooding and debris flows have been poorly studied to date.
The primary objectives of this study are to (1) use observations of rainfall and runoff activity to better constrain temporal changes in effective hydrologic parameters following fire for watershed-scale flash flood simulations and (2) use the calibrated model to quantify changes in postfire flash flood peak discharges between the present day and the middle–late century due to rainfall intensification under future climate conditions. In regions like the southwestern USA, where short-duration, high-intensity rainfall events are common, severe flooding can occur with little warning. We focus, in particular, on postfire runoff driven by infiltration-excess overland flow since this is a primary driver of postfire flash flood and debris flow hazards (Schmidt et al., 2011; Ebel, 2020; Gorr et al., 2023). Our study utilizes data and observations from a 49.4 km2 watershed in southern Arizona, USA, that was burned by the 2020 Bighorn Fire. While this watershed is larger than those typically associated with flash floods (e.g., < 10 km2), postfire alterations to soil hydrologic properties, such as reduced infiltration capacity, can enhance infiltration-excess overland flow, leading to rapid streamflow responses to sub-hourly rainfall events, similar to flash flood dynamics observed in smaller watersheds. This work provides guidance for constraining fire effects on soil hydrologic parameters in similar environments, particularly within the southwestern USA where fire severity and area burned are increasing (Singleton et al., 2019).
Our study focused on the upper Cañada del Oro (CDO) watershed, which drains 49.4 km2 of the northern portion of the Santa Catalina Mountains to the north of Tucson, Arizona, USA (Fig. 1). The mean annual rainfall is about 640 mm, with a maximum of 1186 mm and minimum of 112 mm between 1980–2024 (Abatzoglou, 2011). Approximately 44 % of mean annual precipitation is delivered between June and September due to convective rainstorms associated with the North American monsoon (Adams and Comrie, 1997). According to NOAA Atlas 14 (Perica et al., 2025; https://hdsc.nws.noaa.gov/pfds/, last access: 30 September 2025), the estimated rainfall intensity for a 2-year storm event is approximately 77 mm h−1 over a 15 min duration and about 19 mm h−1 over a 60 min duration. Infiltration-excess overland flow during intense monsoon rainstorms is the primary mechanism for generating postfire floods and debris flows in Arizona (Raymond et al., 2020; Gorr et al., 2023).
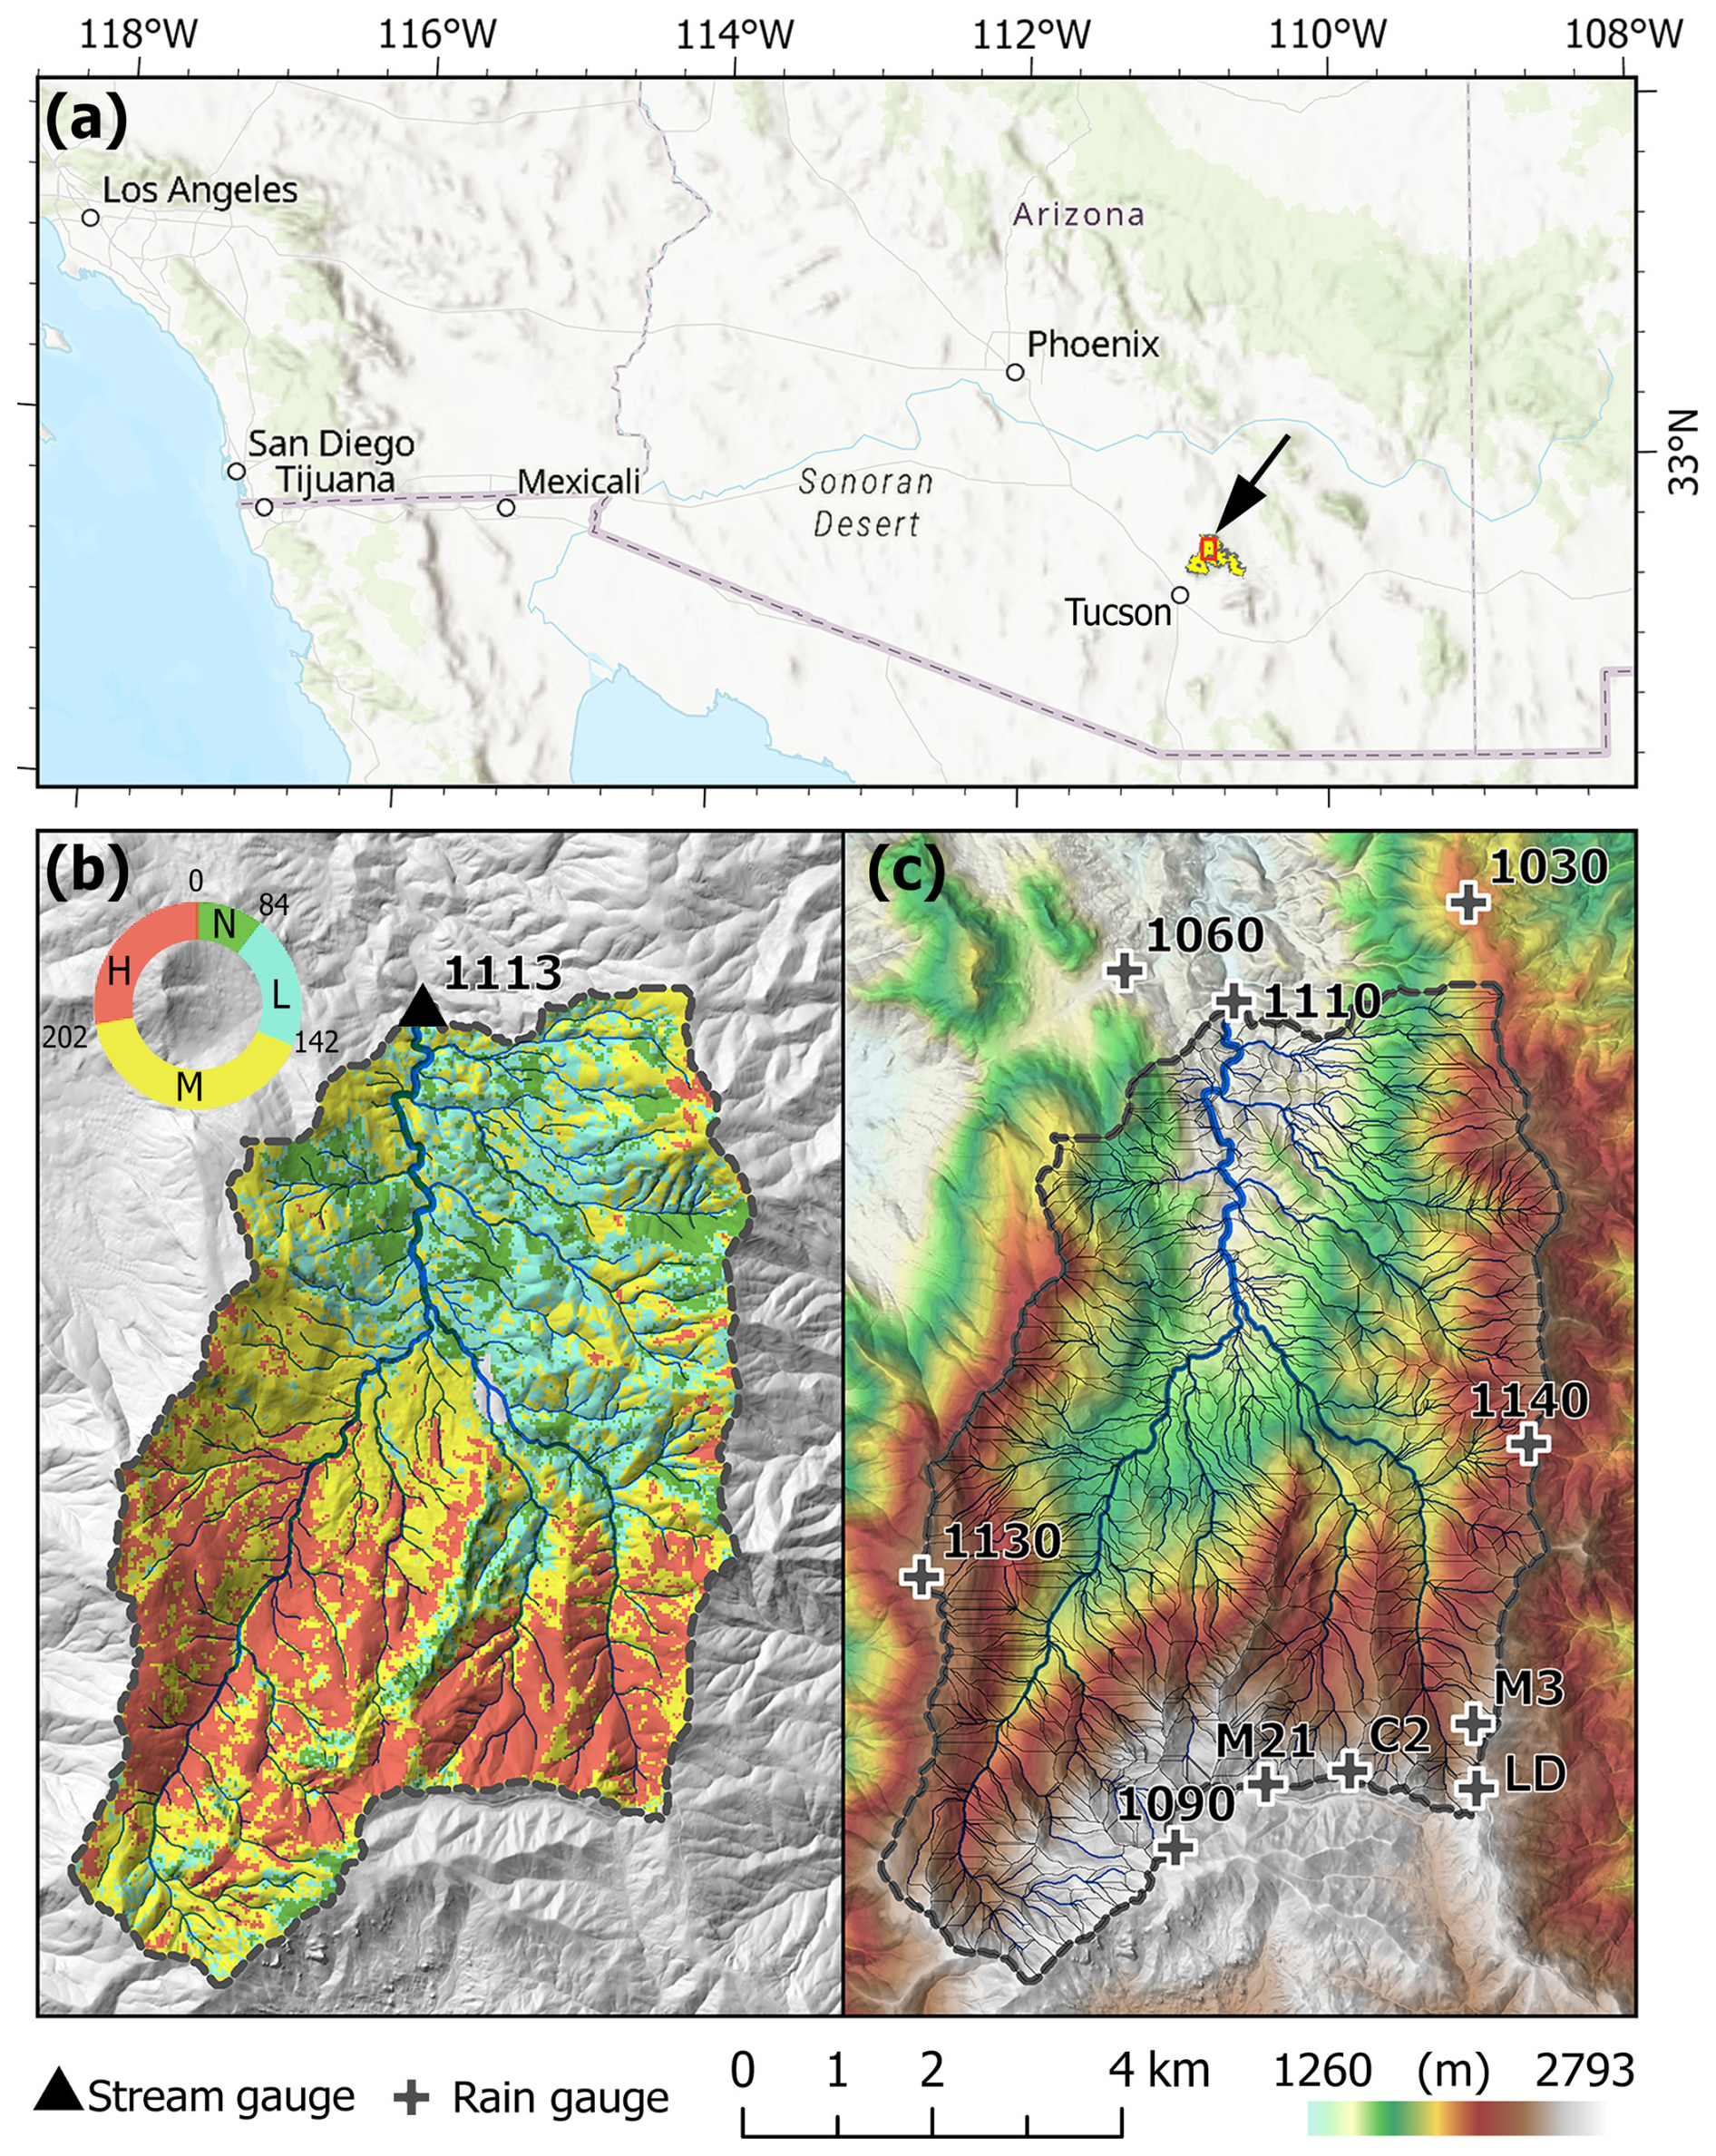
Figure 1(a) The location of the upper Cañada del Oro (CDO) watershed and the 2020 Bighorn Fire perimeter near Tucson, Arizona, USA. (b) Soil burn severity for the 2020 Bighorn Fire in the CDO watershed. Soil burn severity is classified as either unburned (N), low (L), moderate (M), or high (H) based upon an updated Burned Area Reflectance Classification (BARC) dataset from the US Forest Service Burned Area Emergency Response (BAER) team. The BARC thresholds used to define different soil burn severity classes are 84, 142, and 202. The black triangle indicates the location of the stream gauge (1113) installed by the Pima County Regional Flood Control District. (c) Digital elevation model with shaded relief showing the CDO watershed with locations of 10 rain gauges (black crosses). The upper CDO watershed KINEROS2 model discretization contains 1198 hillslope planes and 487 channel segments.
The Bighorn Fire, which ignited on 5 June 2020 and was contained on 23 July, burned 306.5 km2 of the Santa Catalina Mountains. The type and density of vegetation in the Santa Catalina Mountains vary substantially with elevation. The fire burned through a range of plant communities from Sonoran desertscrub at the lowest elevations to mixed conifer forest at higher elevations. Soil burn severity (SBS) was mapped by the Burned Area Emergency Response team (e.g., Parson et al., 2010) using a combination of remote sensing data, namely the differenced normalized burn ratio (dNBR), and field observations. Approximately 10 % of the area within the fire perimeter was classified as unburned or burned at very low severity, 21 % was burned at low severity, 41 % was burned at moderate severity, and 28 % was burned at high severity (Fig. 1b). In addition to burning during the Bighorn Fire in 2020, the CDO watershed was also burned by the 2003 Aspen Fire (10 % low severity, 15 % moderate severity, 55 % high severity).
3.1 Hydrologic monitoring
Temporal changes in soil hydrologic parameters were quantified by calibrating a model to a series of rainfall–runoff events that occurred in the CDO watershed at different times following the fire, as described in more detail in Sect. 3.2. Model calibration required rainfall, runoff, and soil moisture data. We utilized rainfall measurements collected by six Automated Local Evaluation in Real Time (ALERT) tipping-bucket rain gauges maintained by the Pima County Regional Flood Control District (PCRFCD) (Fig. 2d). Data from these gauges are available throughout the entire study period from July 2020 to September 2023. We further installed one tipping-bucket rain gauge (Onset HOBO RG3-M), which we refer to as the Loma Linda gauge (LD, Fig. 1), near the headwaters of the CDO in July 2020. Data are available for this gauge from July 2020 to October 2021, which includes the first two monsoon seasons following the fire (Fig. 1). Three additional tipping-bucket rain gauges, which we refer to as M21, M3, and C2, were installed near the headwaters of the CDO prior to the 2021 monsoon season and are used here to supplement data from the other gauges for the 2021 monsoon season (Fig. 1). We utilize data from all available rain gauges as input for the watershed-scale hydrologic model.
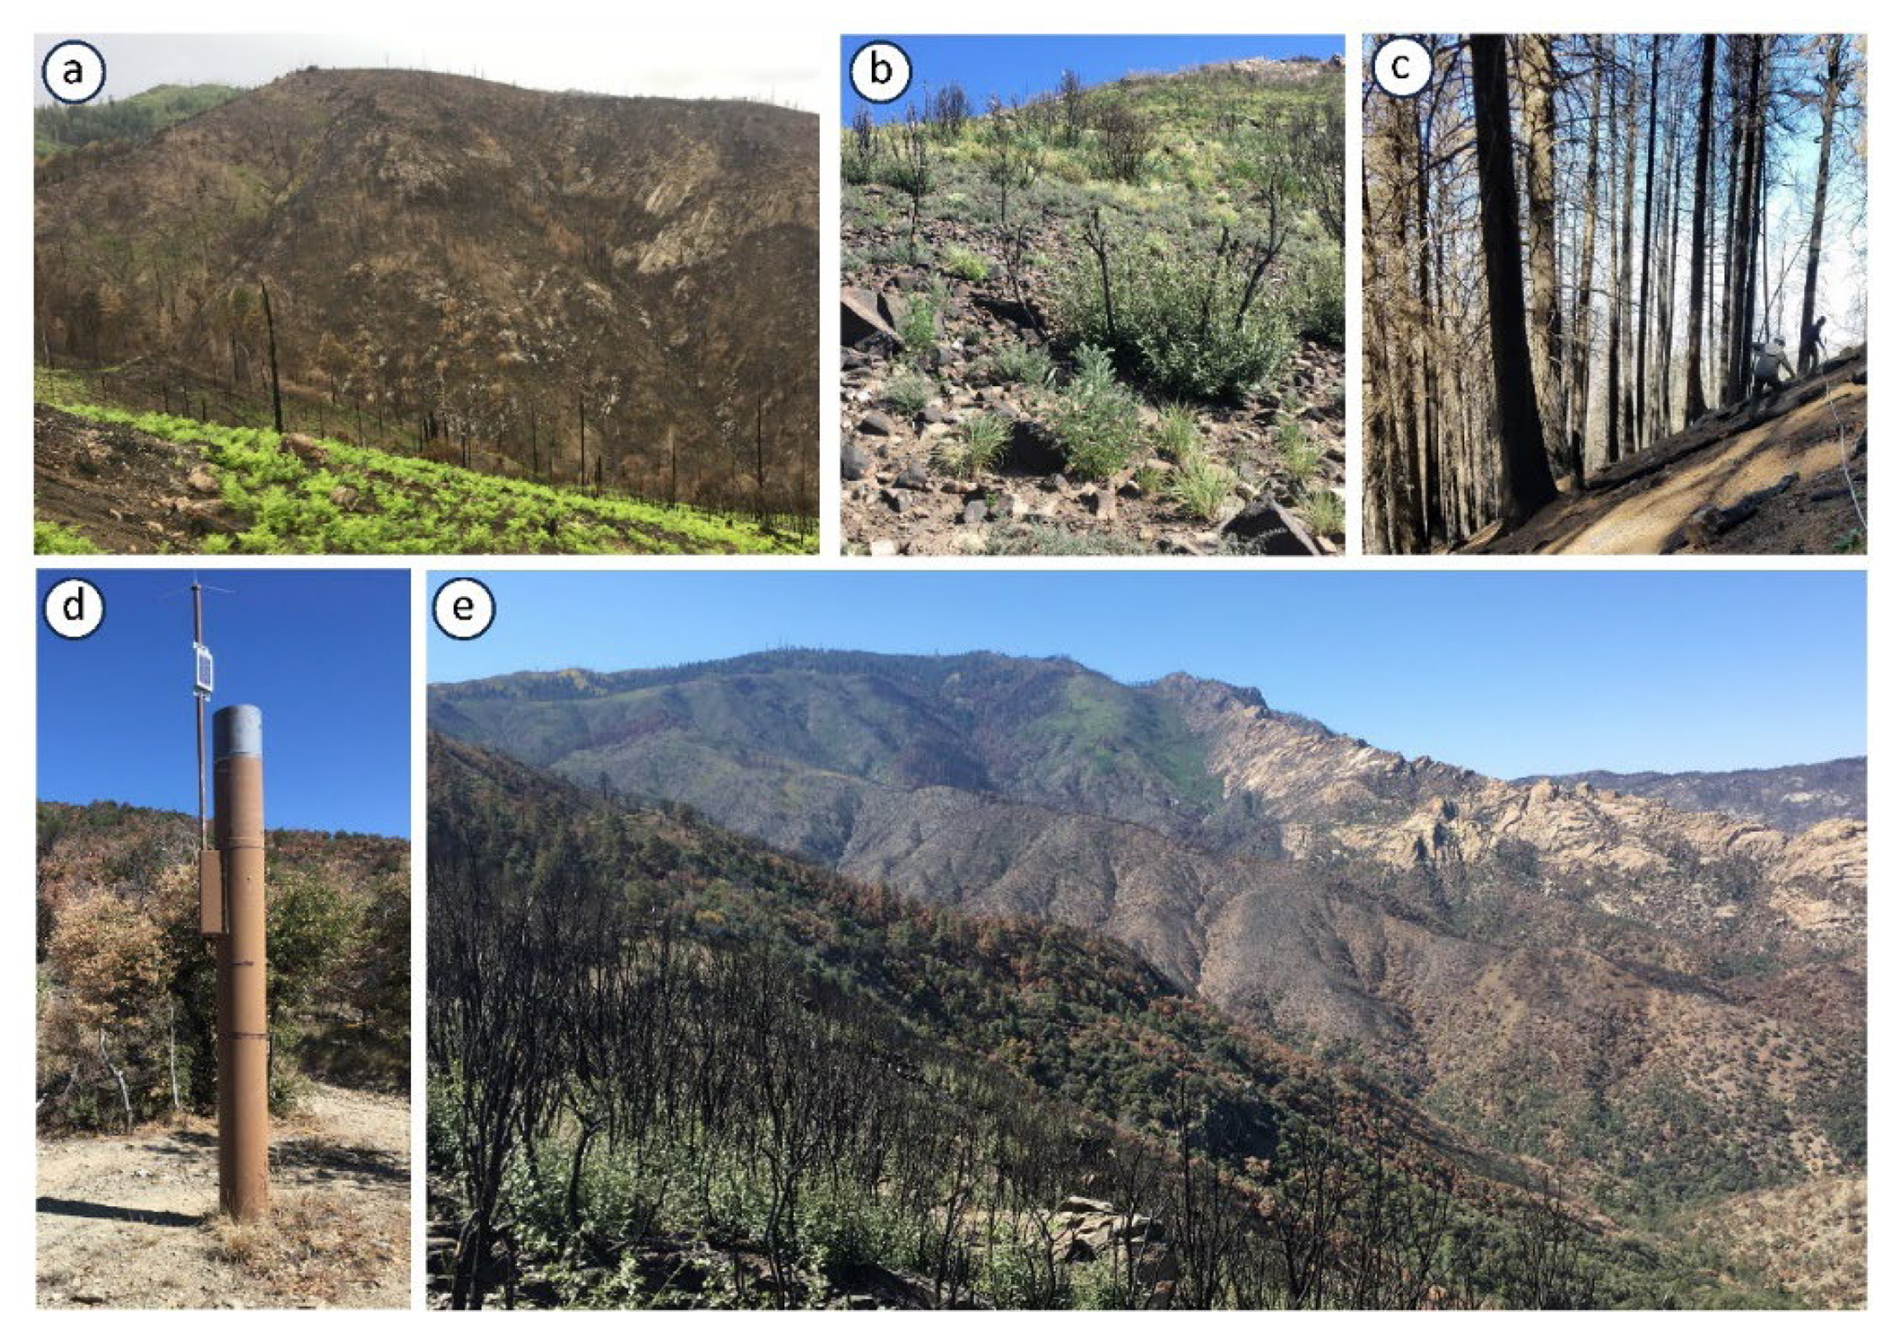
Figure 2(a) Photo taken on 7 July 2020 of small tributaries at the headwaters of the CDO watershed, near the MLFD rain gauge. The area burned primarily at moderate and high severity. (b) Photo taken in October 2020 of a hillslope, which burned at moderate severity in both the 2003 Aspen Fire and the 2020 Bighorn Fire, near the MLFD rain gauge. (c) Photo taken in October 2020 of a hillslope near the C2 rain gauge, which did not burn in the 2003 Aspen Fire and was burned at moderate severity in the 2020 Bighorn Fire. (d) The Automated Local Evaluation in Real Time (ALERT) rain gauge installed at Dan's Saddle (1140). (e) A view of the headwaters of the CDO watershed in October 2020.
Runoff hydrographs at the outlet of the CDO watershed were estimated from a pressure transducer maintained by PCRFCD. The pressure transducer is located approximately 0.6 m above the channel's lowest point. Flows with peak depths below 0.6 m would therefore not be detected. Stage data from the pressure transducer were converted to discharge using a rating table developed by PCRFCD in 2021. Once flow is detected by the pressure transducer, data are initially logged and transmitted every 5 min. The timing of subsequent data transmissions during a rainstorm may then occur at a coarser temporal resolution depending on the degree to which the pressure varies over time. On average, the gauge provided estimates of discharge at a time interval of approximately 5 min during runoff events (Fig. 3).
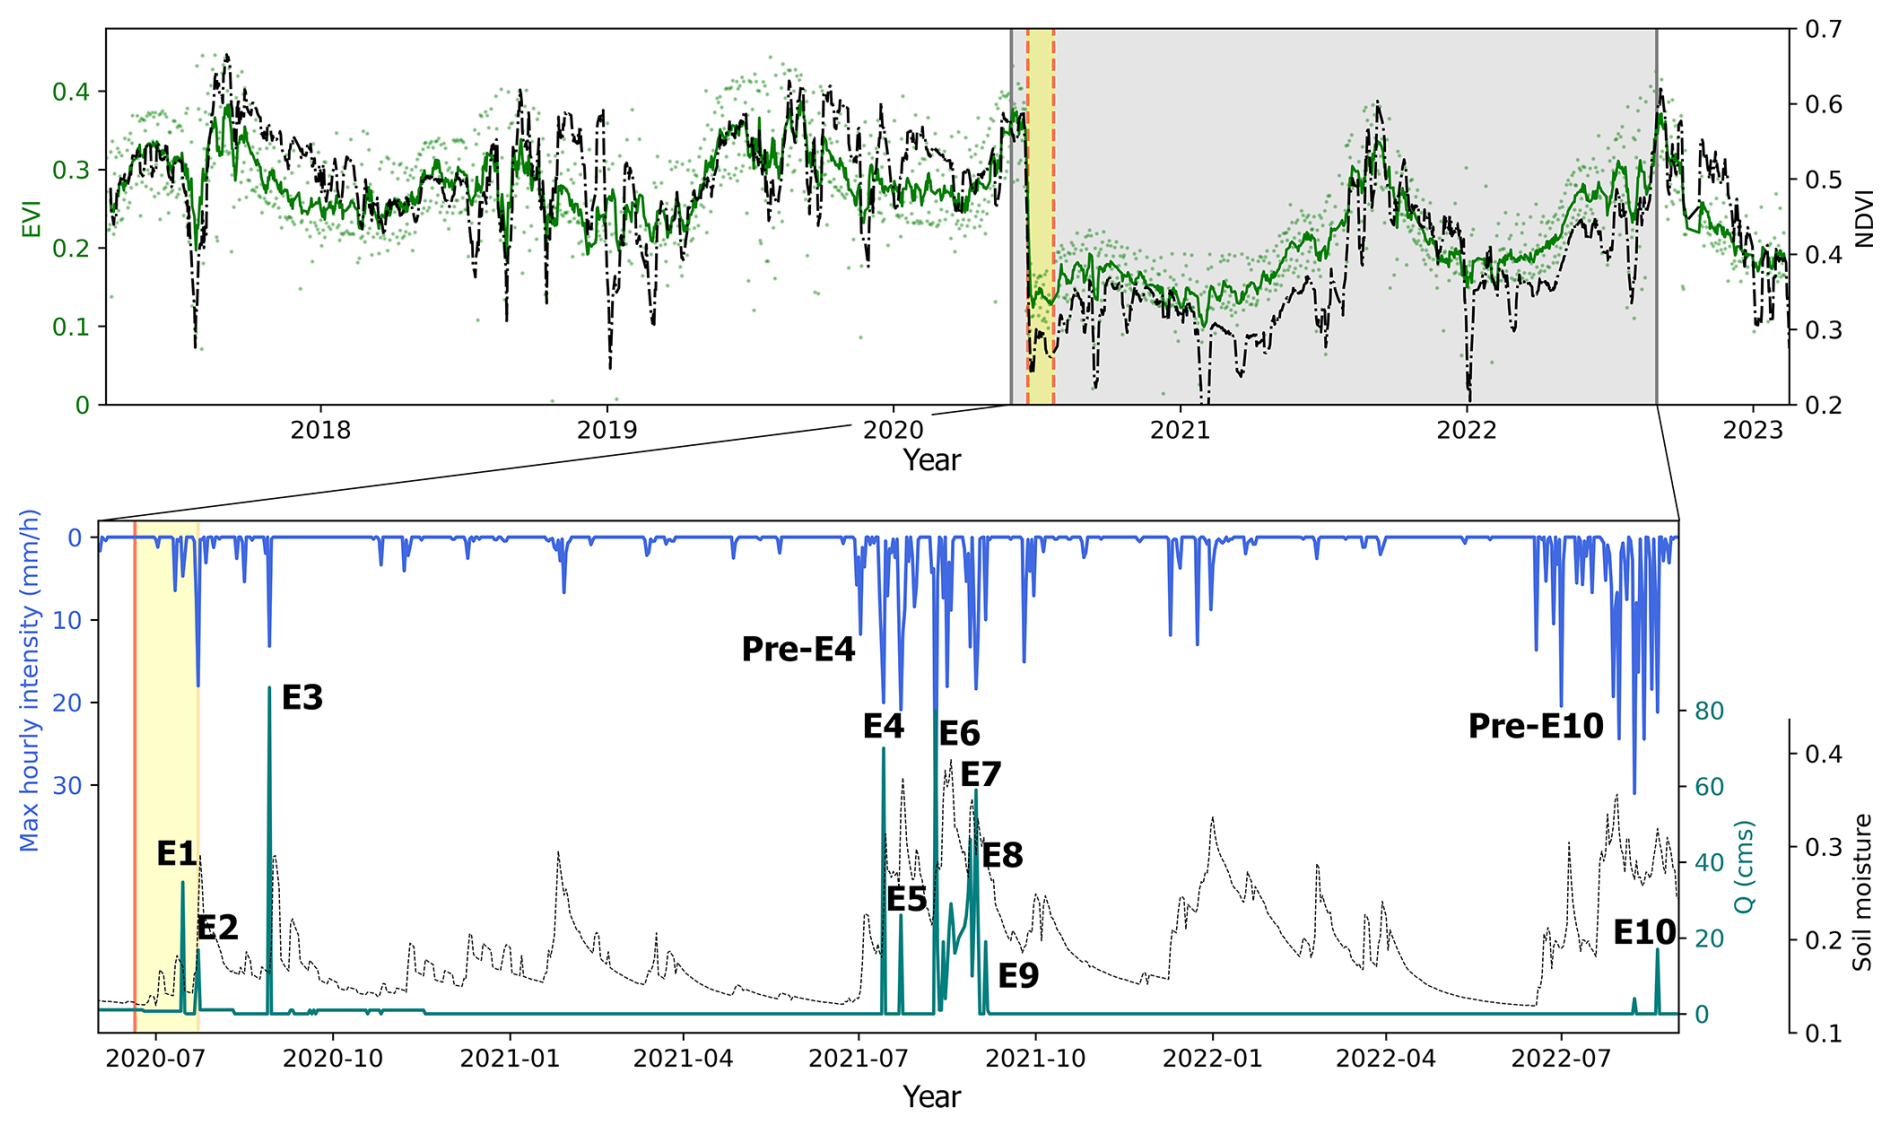
Figure 3The 12 simulated events occurred after the ignition of the 2020 Bighorn Fire. The enhanced vegetation index (EVI) and normalized difference vegetation index (NDVI) data, were derived from MODIS Terra satellite imagery at a resolution of 500 m. Rainfall measurements collected by six Automated Local Evaluation in Real Time (ALERT) tipping-bucket rain gauges maintained by the Pima County Regional Flood Control District (PCRFCD), supplemented by four additional gauges we installed during the study period (referenced in Fig. 1). The maximum hourly rainfall intensity was estimated using these rain gauge data with the Thiessen polygon method. Runoff hydrographs at the outlet of the CDO watershed were obtained from a PCRFCD-maintained streamflow gauge.
Table 1A summary of simulated rainfall–runoff events after the 2020 Bighorn Fire during 2020–2023 in the upper Cañada del Oro watershed.
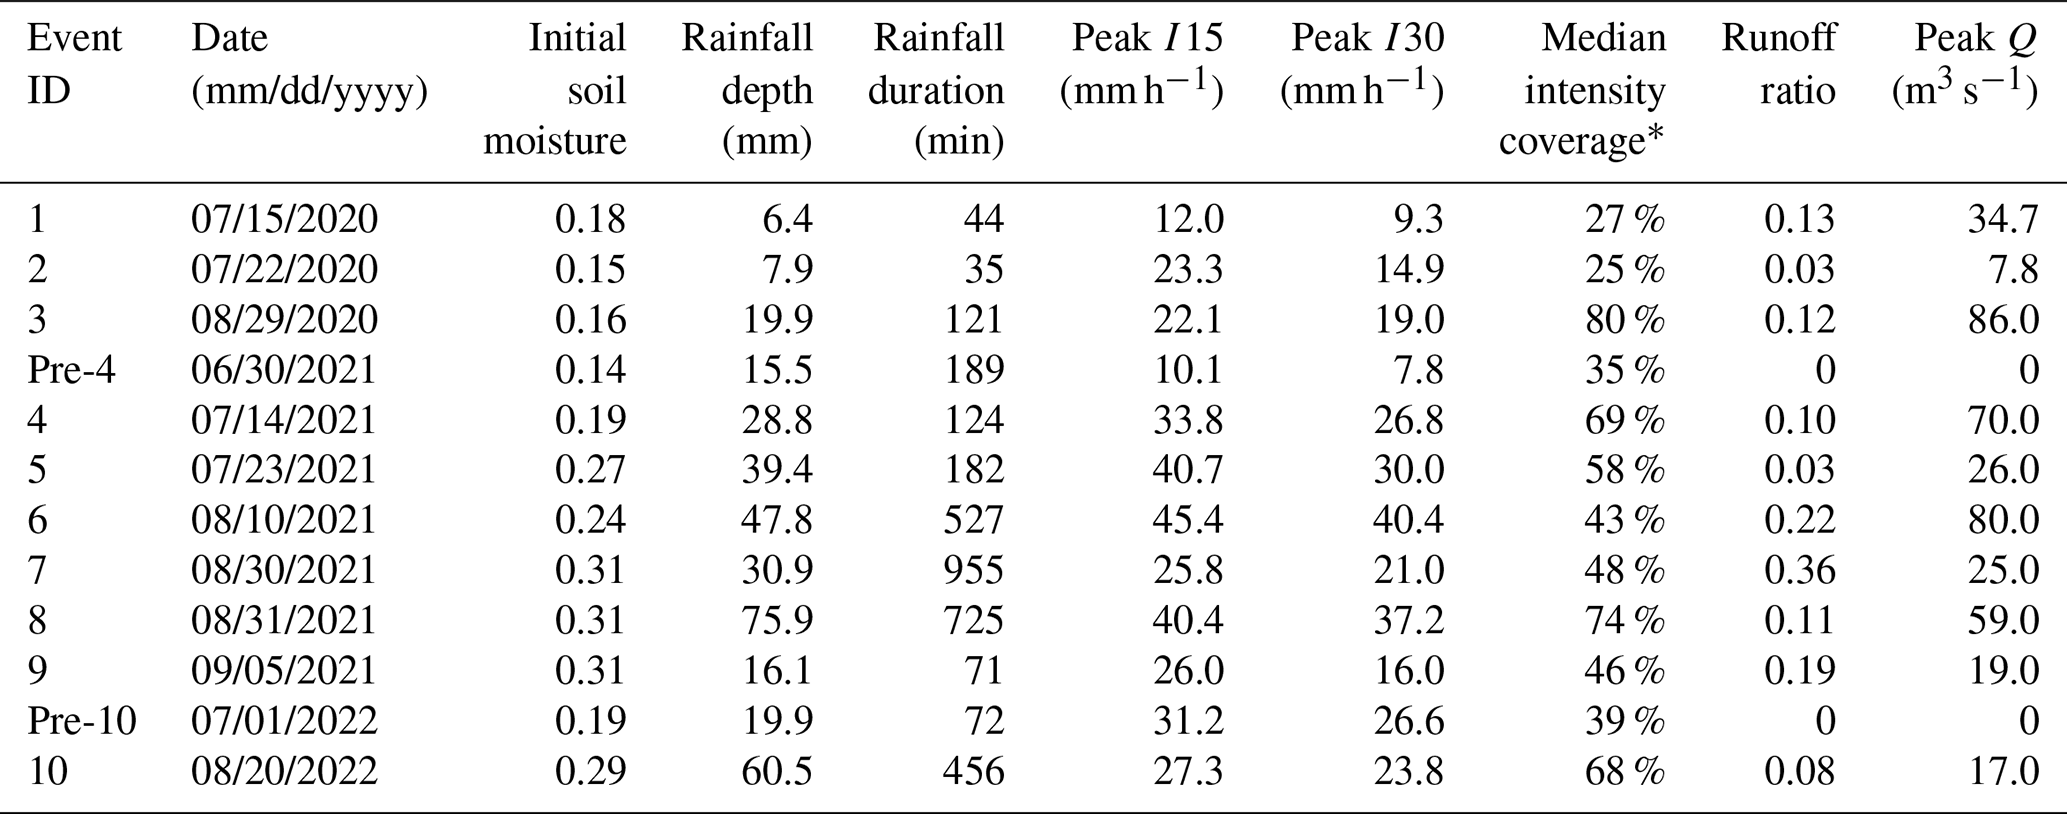
∗ Median intensity coverage: the proportion of the rainfall area where the intensity exceeds the median value of the entire rainfall field.
We selected storm events for hydrologic modeling by compiling all 10 events between the beginning of the 2020 monsoon season (June 2020) and the end of the 2023 monsoon season (September 2023) that produced high-intensity rainfall and a measurable flow response at the outlet of the upper CDO watershed (events 1–10 in Fig. 3 and Table 1). In addition, we selected two storms that produced high-intensity rainfall but no measurable flow response (pre-4 and pre-10 in Fig. 3 and Table 1). The daily volumetric soil moisture content (0–5 cm) for each event was obtained from Climate Forecast System Reanalysis (CFSR; Schneider et al., 2013).
3.2 Inferring roughness and soil hydrologic parameters
We used the KINEROS2 (K2) hydrologic model to simulate rainfall partitioning, overland flow generation, and flood routing for individual events in the upper CDO watershed with the goal of inferring temporal changes in hydrologic parameters as a function of time since fire. K2 is an event-scale, distributed-parameter, process-based watershed model, which has been used extensively for rainfall–runoff processes in semi-arid and arid watersheds (Smith et al., 1995; Goodrich et al., 2012). Its infiltration dynamics are modeled after the Parlange et al. (1982) approach, complementing the kinematic wave equations that efficiently simulate overland and channel flows in steep, mountainous regions (Woolhiser and Liggett, 1967). The model has been used in past studies to infer temporal changes in watershed-scale hydrologic and hydraulic parameters in burned watersheds (e.g., Chen et al., 2013; Liu et al., 2021).
K2 idealizes topography as a series of connected hillslope planes and channel segments. The upper CDO watershed was discretized into 1685 elements, including 1198 hillslope planes and a stream network of 487 channel segments based on a 1 m lidar-derived digital elevation model (DEM). The simulation files needed to run K2, including these structured hillslope and channel segments, and default parameterizations were prepared using the Automated Geospatial Watershed Assessment toolkit (AGWA; Miller et al., 2007). For all portions of the model domain, we calculated the initial soil saturation (SAT) from the top 5 cm soil moisture data (CFSR), normalized by soil porosity (0.39–0.44).
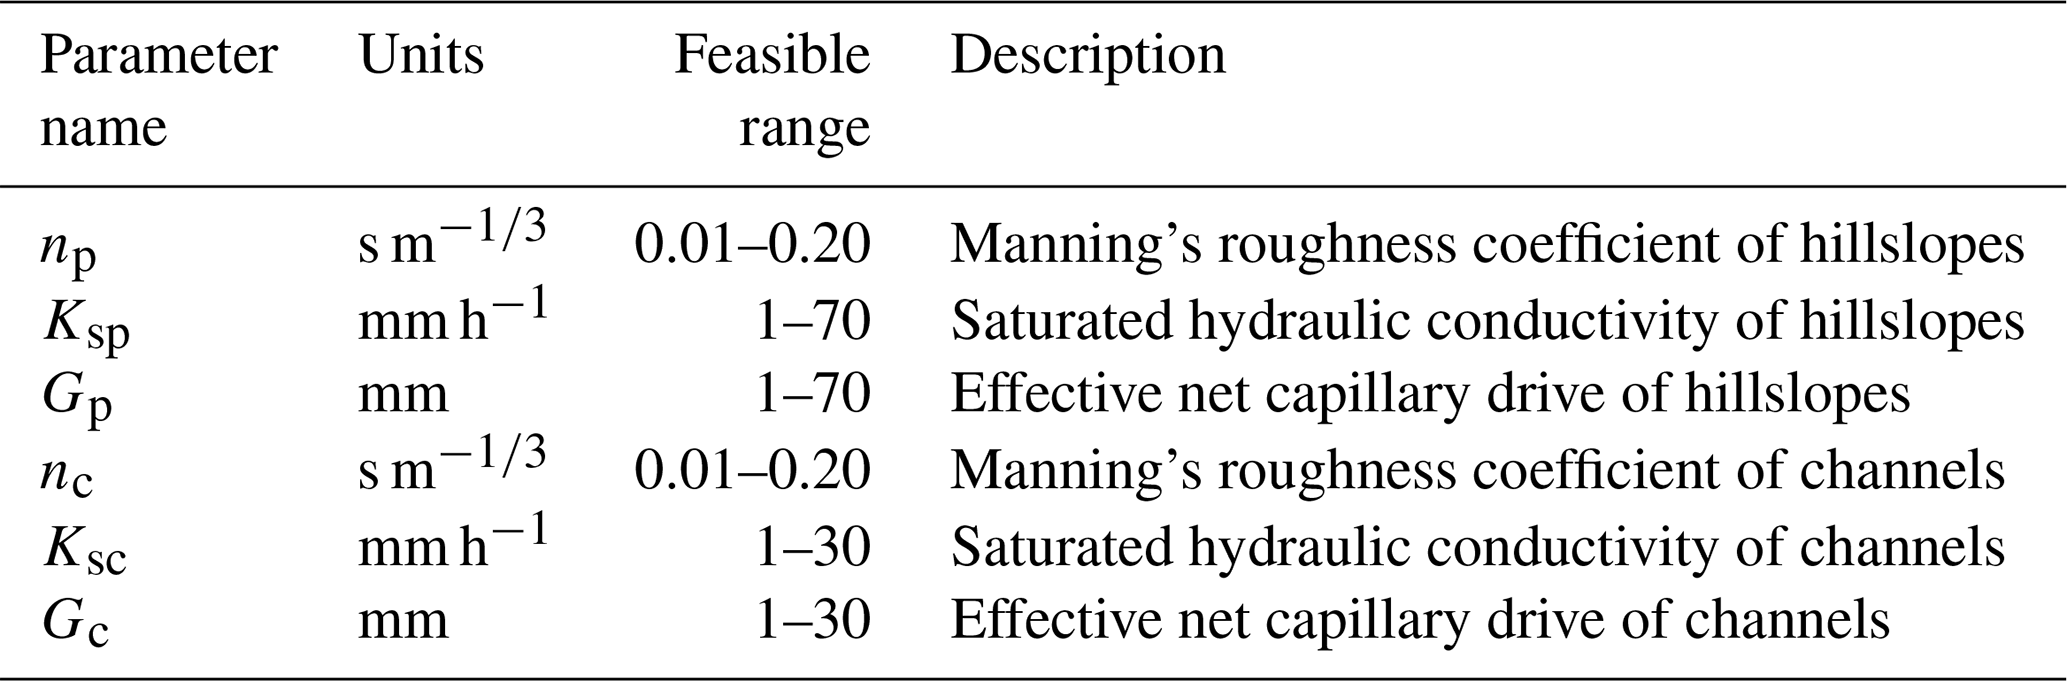
We selected six parameters (Table 2) for model calibration: soil hydraulic conductivity of hillslopes (Ksp) and channels (Ksc), net capillary drive of hillslopes (Gp) and channels (Gc), and Manning's n roughness of hillslopes (np) and channels (nc). Meles et al. (2024) considered these parameters to be the most influential in the simulated rainfall–runoff behavior. The values of these parameters were calibrated in areas burned at moderate or high severity, where they were assumed to be spatially invariant (Fig. 1b). The parameters for unburned and low-SBS hillslopes and channels were initially given default values from the AGWA lookup tables based on soil types and land cover properties. However, preliminary event-based model calibrations indicated that default values for Ksp and Gp, which control infiltration capacity on hillslopes, were lower than calibrated values for areas burned at moderate to high severity in postfire years 2 and 3. As a result, using default values for Ksp and Gp in unburned and low-severity areas would lead to simulations where runoff was being preferentially generated from low-severity and unburned areas as opposed to areas burned at moderate to high severity, which was inconsistent with observations. For this reason, we set values for Ksp and Gp equal to values calibrated for areas burned at moderate to high severity in postfire year 3. This is consistent with the assumption that soil hydrologic parameters had approximately returned to typical unburned values by postfire year 3.
A total of 6000 parameter sets were generated using a progressive Latin hypercube sampling strategy (Sheikholeslami and Razavi, 2017). For the events with measurable streamflow (events 1–10), we evaluated model performance for each parameter set by quantifying the match between the observed and simulated hydrographs during time periods when discharge was greater than 5 % of the event peak discharge. We determined best-fit parameters for each event by maximizing the Kling–Gupta efficiency (KGE; Gupta et al., 2009), with the top 100 KGE-ranked simulations used to estimate parameter uncertainty. For events pre-4 and pre-10, where there was no measurable streamflow observed, simulations that produced peak discharge rates between 0.5 and 1.5 m3 s−1 were used to infer minimum effective values for parameters. We were able to use this approach to determine minimum values for model parameters since modeled peak discharge increases with a decrease in any of the calibrated parameters. For example, the minimum Ksp can be estimated based on the lowest value of Ksp that results in a simulated peak discharge of less than 1.5 m3 s−1.
We determined estimates for model parameters as a function of time since fire based on calibration to all events where the model provided a good match for the observed runoff response, as quantified by the KGE metric. In cases where the model was not capable of reproducing the observed runoff response, as indicated by a low KGE value, we have low confidence in our ability to infer fire-driven changes in model parameters via calibration. Poor model performance, for example, could be attributed to rainfall characteristics and initial soil moisture conditions that promote saturated-excess overland flow rather than infiltration-excess overland flow, which K2 is better suited to represent. Therefore, we did not include values of model parameters inferred from events where no combination of K2 parameters resulted in a reasonable fit to the observed hydrograph.
Using the same 6000 parameter sets drawn from the progressive Latin hypercube sampling strategy and the corresponding model outputs, we conducted a sensitivity analysis using the Variogram Analysis of Response Surfaces (VARS) methodology (Razavi and Gupta, 2016a, b) with a goal of ranking parameter importance. We used the KGE to construct a model response surface to calculate VARS-TO, a sensitivity metric which is equivalent to Sobol's variance-based total-order effect, as explained in Razavi and Gupta (2015). The relative importance for each parameter, ranging from 0 to 1, was calculated by dividing the VARS-TO of the parameter by the sum of VARS-TOs across all parameters, offering a quantitative assessment of each parameter's influence on the model response (i.e., KGE).
3.3 Projected precipitation frequency estimates
Climate change is projected to increase precipitation extremes (Westra et al., 2014; Fowler et al., 2021). Sub-hourly precipitation rates, which significantly impact postfire hydrogeomorphic hazards, could intensify beyond the expected 7 % °C−1–8 % °C−1 increase predicted by the Clausius–Clapeyron (CC) relation (Prein et al., 2017; Cannon and Innocenti, 2019; Fowler et al., 2021). Here, we used gridded precipitation frequency estimates to represent rainfall intensification. We determined reference rainfall intensity–duration frequency curves for the CDO based on historical data from NOAA Atlas 14 (Perica et al., 2025; https://hdsc.nws.noaa.gov/pfds/). We then modified reference rainfall intensities, Iref, based on the projected change in mean annual temperature, ΔT (°C), at our study site according to (Martel et al., 2021)
where Ifut is the future rainfall intensity and Rsc=8 % °C−1 is a CC scaling factor.
The change in temperature was computed using data for our study site location from Localized Constructed Analogs version 2 (LOCA2; Pierce et al., 2023) for several future scenarios. The LOCA2 data are derived from 27 Coupled Model Intercomparison Project Phase 6 (CMIP6) sets of climate model simulations covering the period between 1950 and 2100 at a 6 km spatial resolution (Pierce et al., 2023). The future scenarios used here include the mid-21st century (2045–2074) and late-21st century (2075–2100) for both SSP2-4.5 and SSP5-8.5 scenarios. The SSP2-4.5 scenario represents the medium pathway of future greenhouse gas emissions with climate protection measures being taken, while the SSP5-8.5 scenario represents the upper boundary of future pathways (O'Neill et al., 2016). The LOCA2 data provide monthly minimum and maximum temperature for each of the 27 CMIP6 models. We computed the average of monthly minimum and maximum temperature to calculate the mean temperature change from the reference for each future period and warming scenario (Fig. S1 in the Supplement). We then used Eq. (1) to calculate the 15 min (I15) and 30 min (I30) rainfall intensities associated with annual recurrence intervals (ARIs) of 1, 2, 5, and 10 years.
We used Ifut to construct design rainstorms to explore postfire flash flood magnitude in the CDO watershed. The duration of all input hyetographs is 30 min. The 30 min input hyetograph has the shape of a Gaussian distribution with a total rainfall depth equal to . The depth of rainfall occurring in the middle 15 min of the design storm is equal to . We produced the 30 min hyetographs at the 1-, 2-, 5-, and 10-year ARIs for the reference and the four future climate scenarios (Figs. S2–S3). To account for the uncertainty associated with the spatial scale of rainfall over the watershed and its influence on flood magnitude (e.g., Ebel, 2024), we randomly selected continuous hillslope elements within the model domain to receive the designed rainstorm in 30 different configurations. The total area of the selected hillslopes accounted for 10 %, 30 %, 50 %, 70 %, and 90 % of the CDO watershed, respectively. The selected areas cover the portions of the watershed with different soil burn severity. As such, for a given ARI rainstorm (1, 2, 5, or 10 years) and a particular climate scenario (1 reference and 4 future climate scenarios), we ran 450 simulations (5 rainfall extent factors, 3 postfire years, and 30 configurations) to estimate peak discharge.
4.1 Hydrologic condition and model behavior
We performed 12 simulations of observed rainfall–runoff events, which exhibited distinct hydrologic conditions. Events 1–4, pre-4, and pre-10 commenced with relatively dry soil conditions, characterized by saturation levels below 0.43 (volumetric soil moisture divided by porosity). Conversely, the remaining five events were initiated from a comparatively wet state, with saturation between 0.55–0.84 (Fig. 4d). Furthermore, the rainfall durations varied substantially between these two groups of events. Events 1–5, pre-4, and pre-10 were relatively short-lived, lasting less than 2 h. In contrast, the other five events were characterized by longer durations, between 7.6–15.9 h (Fig. 4d). These disparities in hydrologic conditions suggest that the dominant mechanisms governing overland flow generation might differ between the two groups of events.
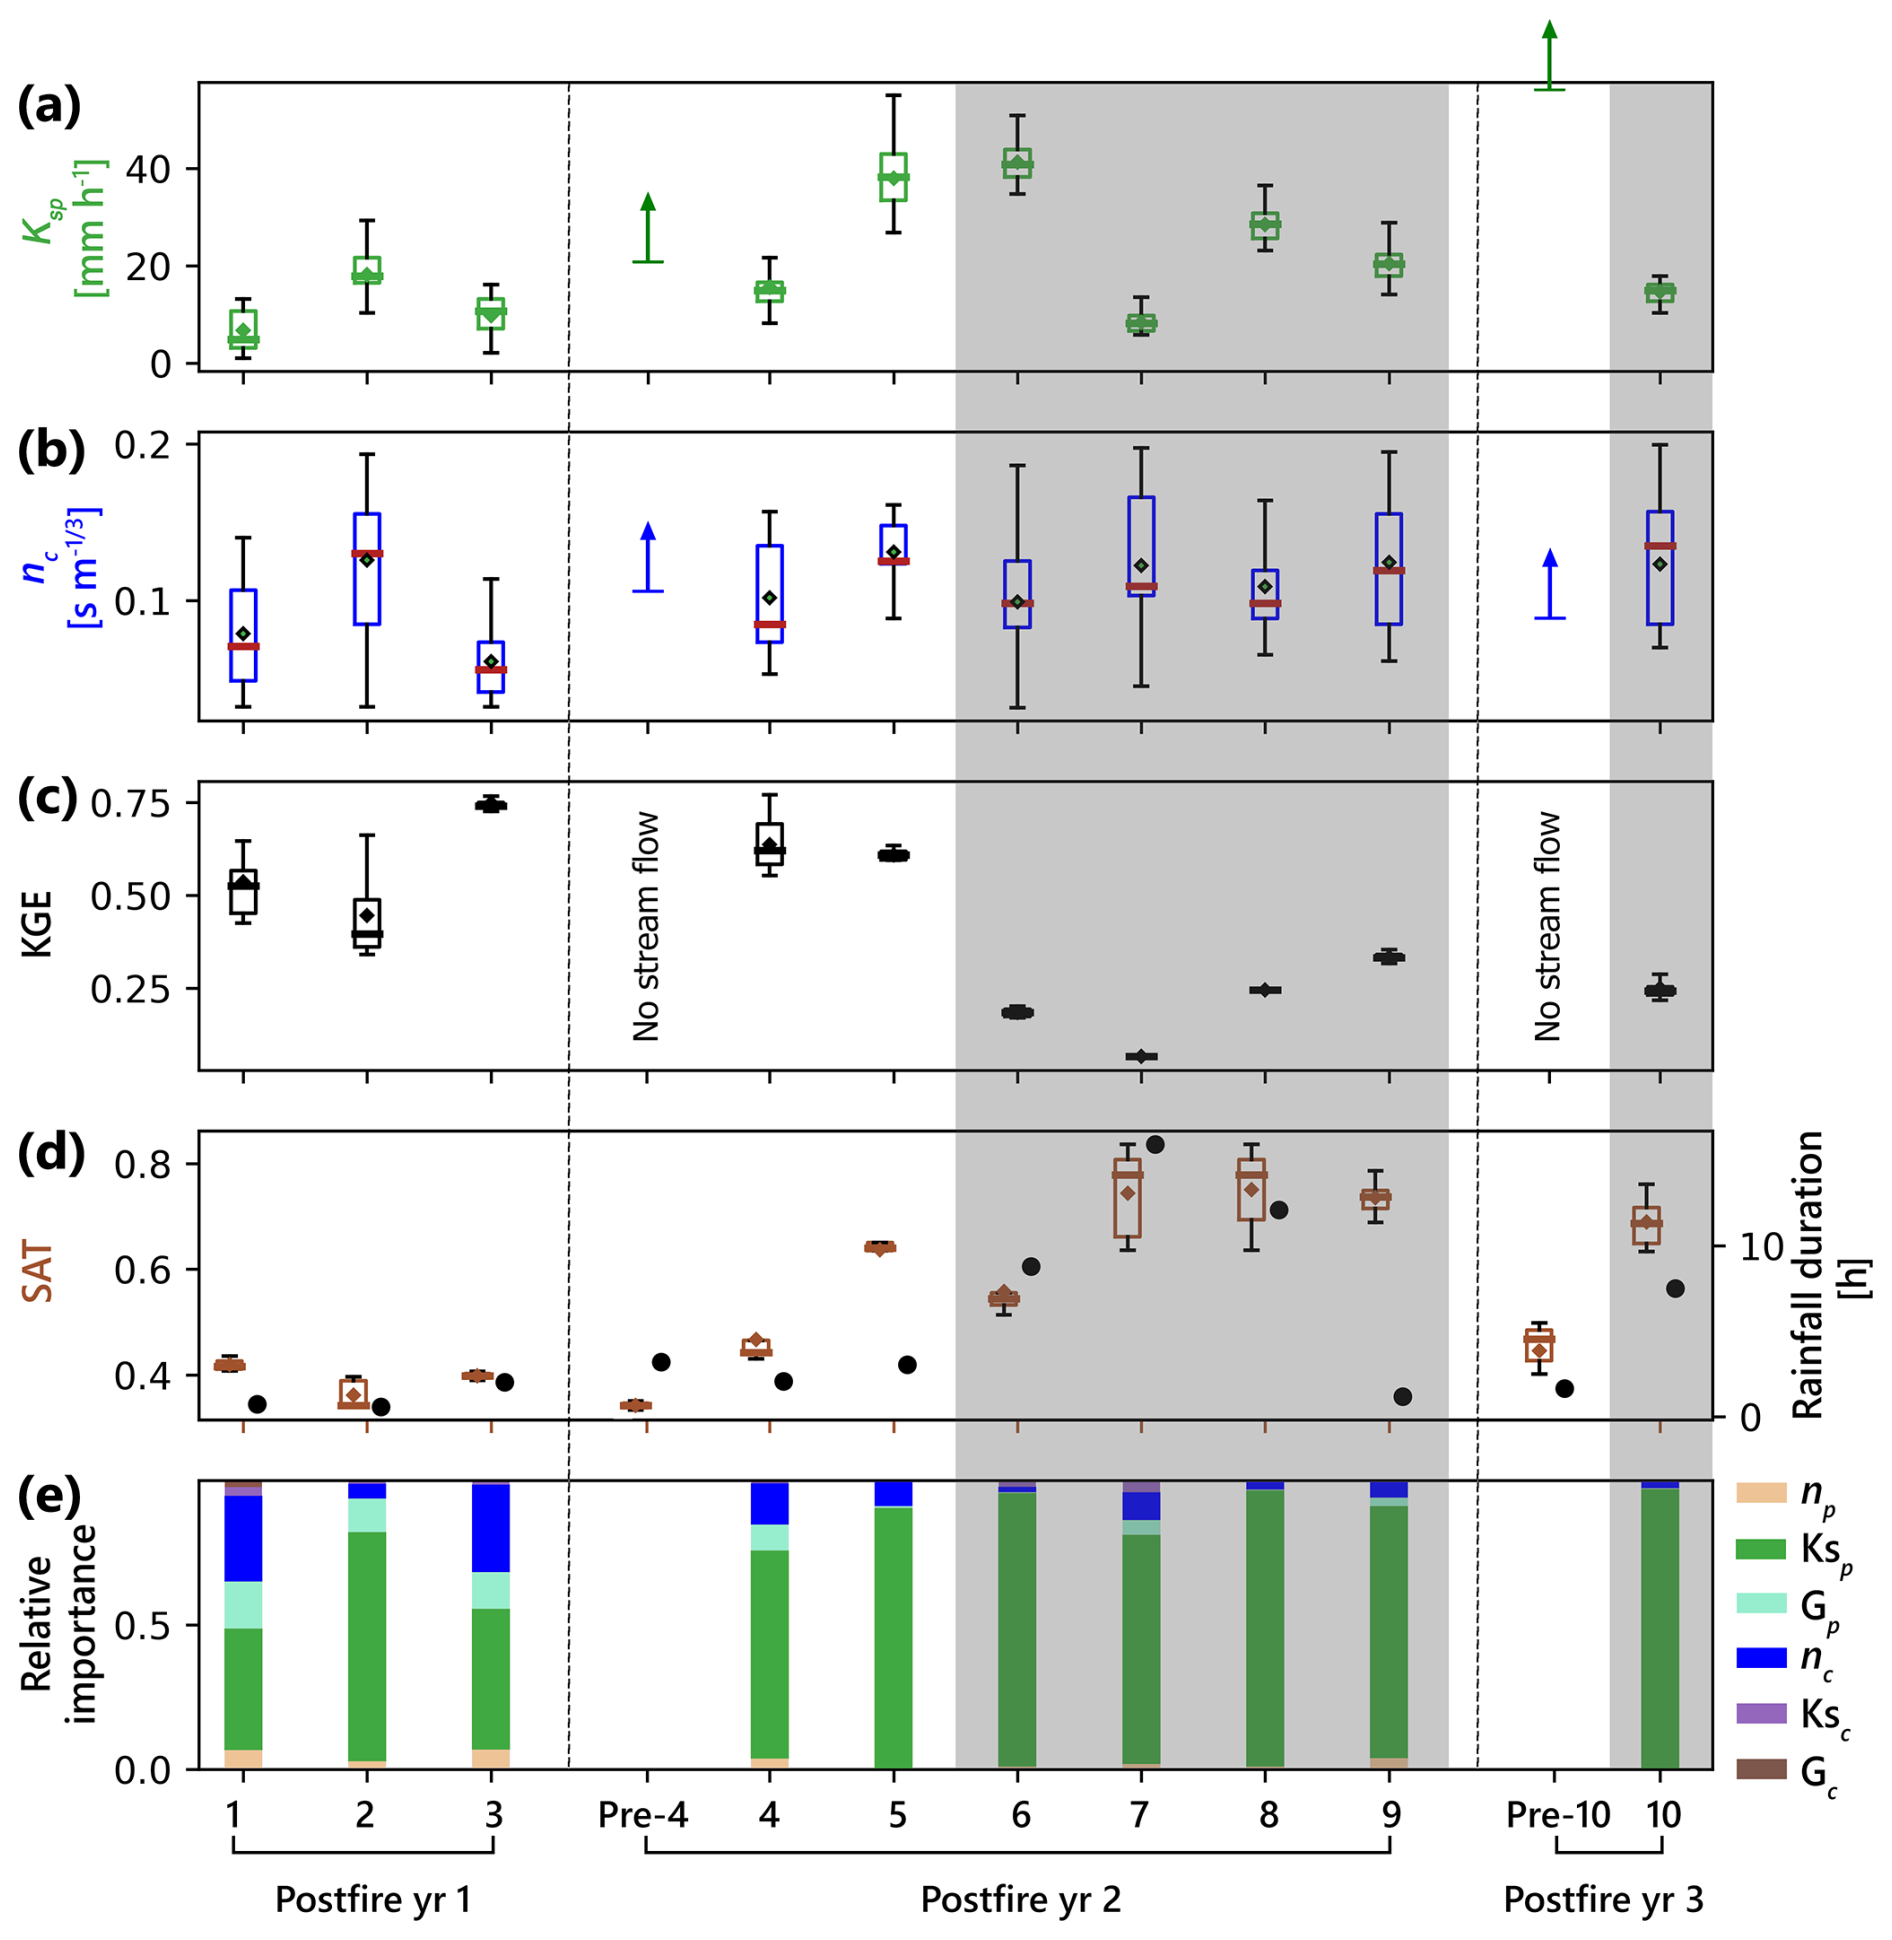
Figure 4Summary of calibrated hydrologic parameters (Ksp, nc), model performance (KGE), volumetric soil moisture divided by porosity (SAT), rainfall duration, and relative parameter importance for the simulated 12 events. Note the shaded simulations for events 6–9 and event 10 indicate that they are excluded from analyses to constrain changes in fire-affected model parameters as a function of time since fire due to poor model performance.
The hydrologic model, driven by observed rainfall data, demonstrated an adequate representation of rainfall–runoff processes in the CDO watershed for events 1–5 (Figs. 4 and 5). Among the top 100 simulations ranked by the KGE metric, the median KGE values for these five events ranged between 0.34 and 0.72, while the highest KGE values spanned 0.63 to 0.82. The simulated hydrographs effectively captured the peak discharge, timing, and runoff volume of the observed events (Fig. 5). In contrast, the model's performance for events 6–10 was relatively poor. The highest KGE values among the top 100 simulations for these events ranged from 0.07 to 0.35, while the median KGE values were considerably lower, ranging from 0.04 to 0.31.
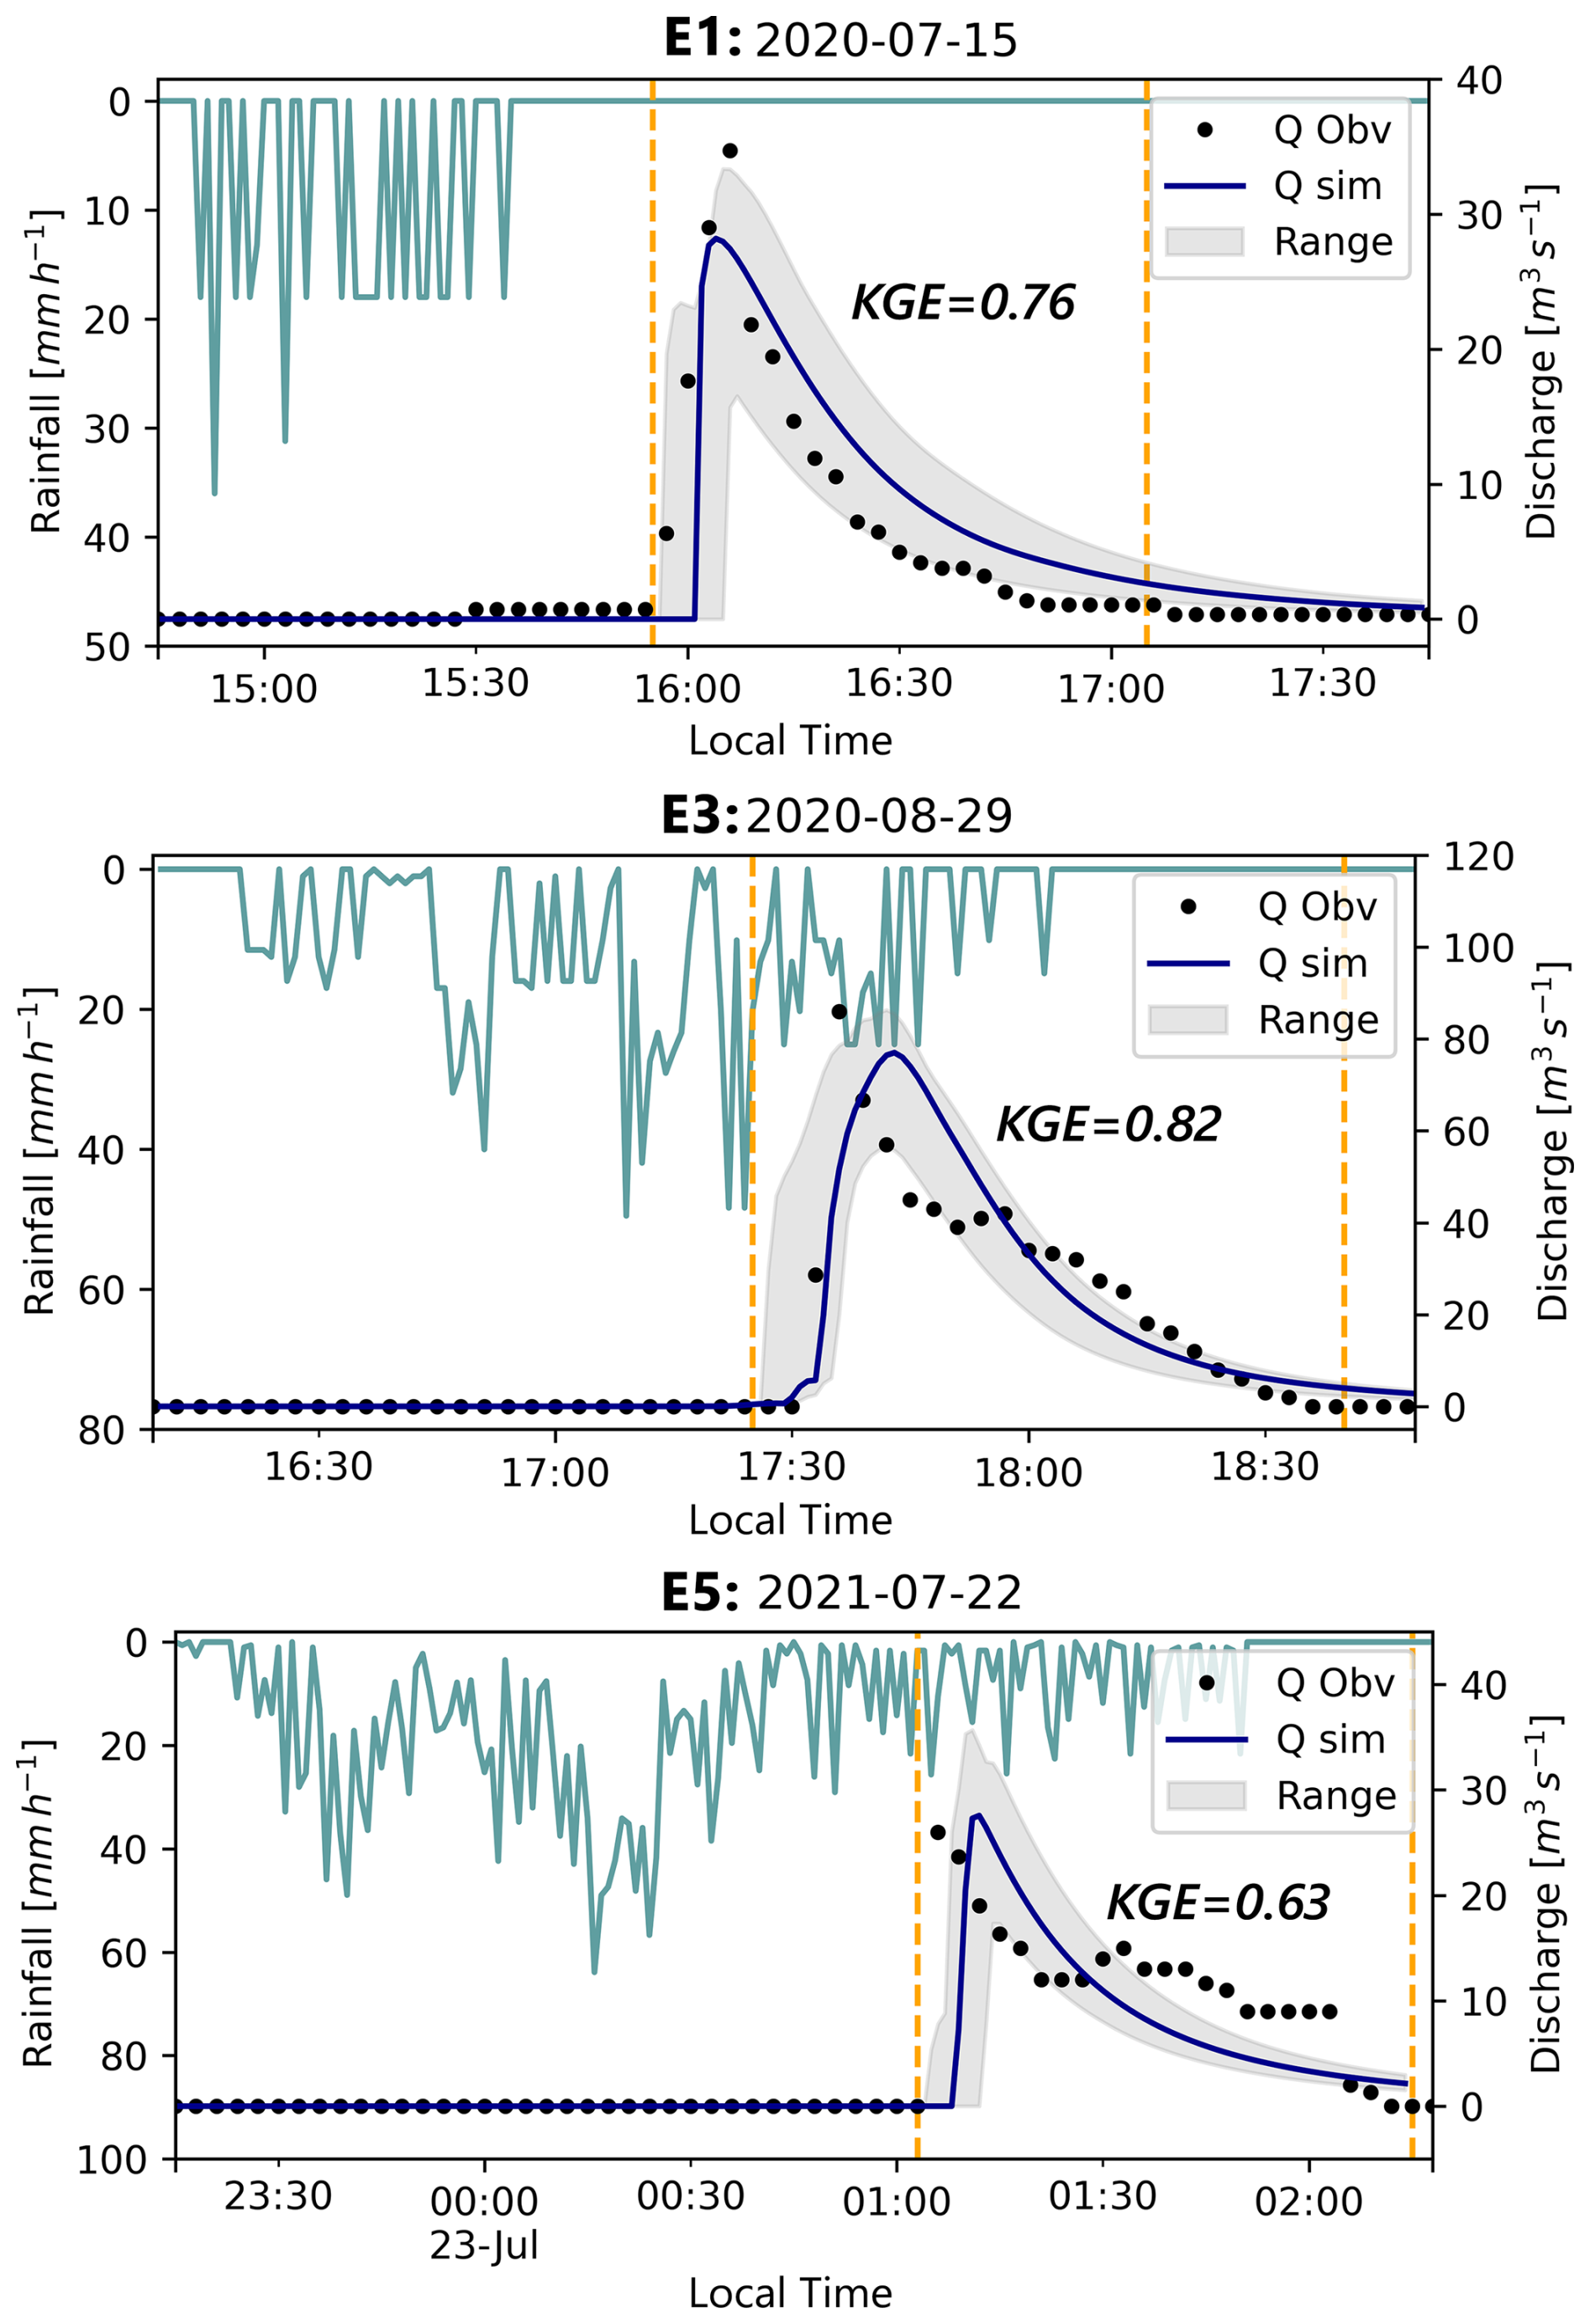
Figure 5The simulated hydrograph associated with the largest KGE (dark blue line) and the top 100 KGE-ranked simulations (gray area) overlaid on the observed rainfall (green lines) and discharge (black dots) for events 1, 3, and 5. Boundaries of the evaluation periods (i.e., data used to compute KGE) are indicated by the dashed orange lines.
The sensitivity analysis showed that Ksp was the most influential parameter across all 10 events when evaluating model performance using KGE (Fig. 4e). For events 6 and 8–10, Ksp was a particularly dominant factor governing rainfall–runoff processes, exhibiting a relative importance of 0.87–0.96 (Fig. 4e). In the case of events 1 and 3–5, the second most important parameter was nc, closely followed by Gp (Fig. 4e). The remaining parameters, such as np (Manning's roughness on hillslopes), Gc, and Ksc, exhibited negligible influence on model performance.
4.2 Changes in model parameters after fire
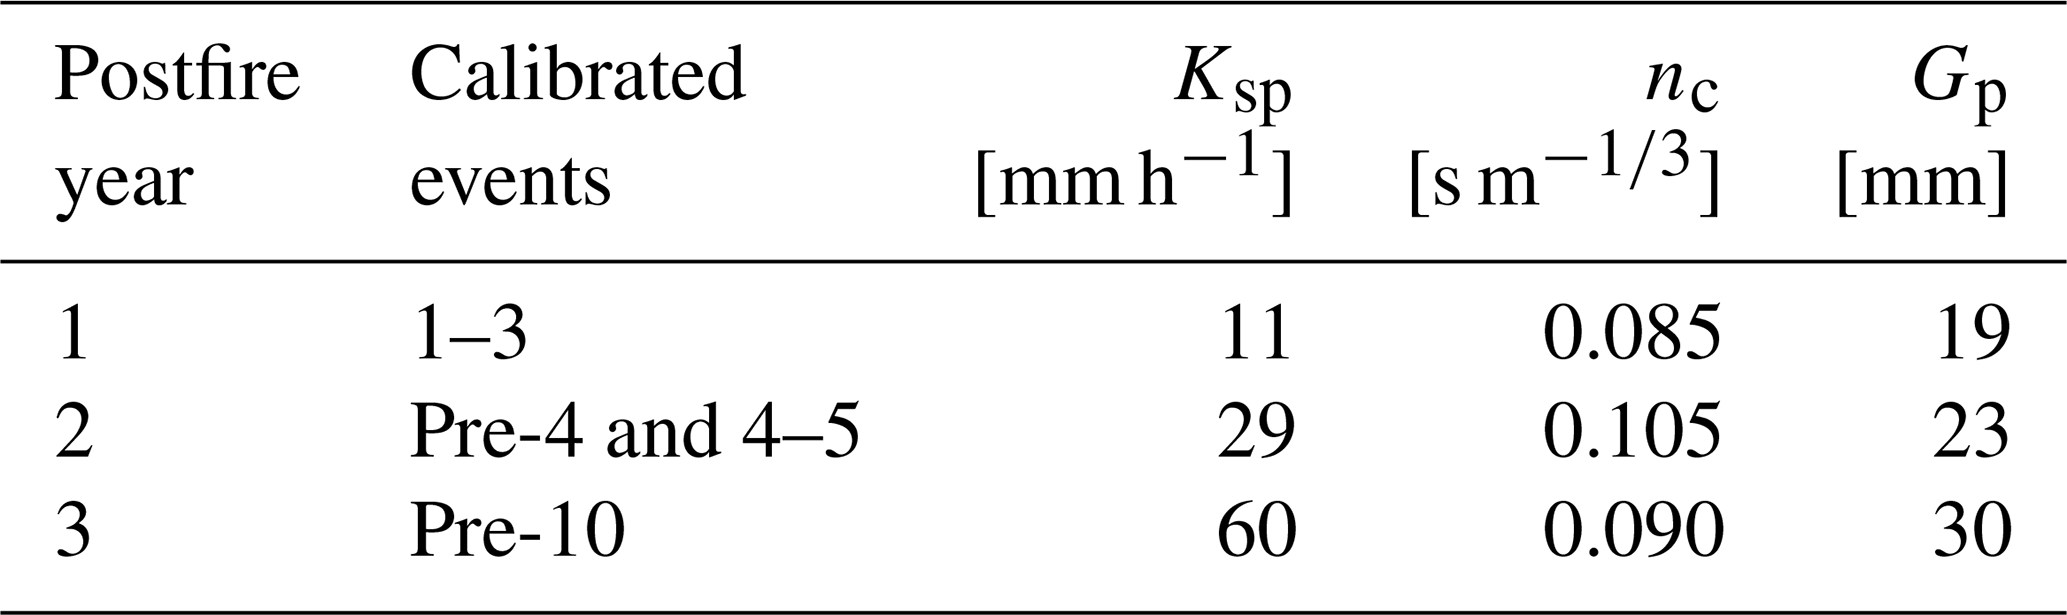
Since the model reproduced the observed runoff response (or lack thereof) reasonably well during events 1–5, pre-4, and pre-10, we utilize the calibrated model parameters from those events to quantify fire-affected model parameter values at different times since fire. To represent the effective hydrologic condition for the first postfire year, we used the average of the calibrated parameter values associated with the largest KGE from events 1–3. Similarly, the parameter sets associated with the best fits to events pre-4 and 4–5 were used to determine representative parameter values for the second postfire year, while event pre-10 was used to determine minimum values for representative parameters during the third postfire year. There is a substantial increase in Ksp from a minimum value of approximately 11 mm h−1 in the first postfire year to 29 and 60 mm h−1 in postfire years 2 and 3, respectively (Fig. 4a–b; Table 3). Over the 3-year study period, Ksp exhibited a rate of change of 24.0 mm h−1 yr−1 (R2=0.76), as determined by a linear regression analysis. The effective net capillary drive of hillslope planes (Gp) also presented an increasing trend with time since fire despite its more minor influence on simulated runoff relative to Ksp (Table 3; Fig. 4e). In contrast, the Manning's roughness coefficient of the channels, nc, remained relatively constant over time (Fig. 4b). The representative value for nc fluctuated between 0.085 and 0.105 s m over the first 3 postfire years.
Table 3Summary of model parameters for postfire years 1, 2, and 3.
4.3 Increasing flood magnitude in a warming future
On average, I15 associated with a given ARI increased relative to reference values by factors of 1.16, 1.23, 1.22, and 1.44 for scenarios SSP2-4.5 mid-21st century, SSP2-4.5 late-21st century, SSP5-8.5 mid-21st century, and SSP5-8.5 late-21st century (Figs. S2 and S3). We compared the peak discharge rates produced by rainstorms of varying ARIs covering half of the watershed in the first 3 postfire years under reference (1950–2014) and projected future climate scenarios (SSP2-4.5 and SSP5-8.5 for 2045–2074 and 2075–2100). Since we are interested primarily in relative changes, we normalized the peak discharge by dividing it by the mean peak discharge obtained from 30 simulations for postfire year 1 under the reference scenario. These simulations were designed to encapsulate uncertainties associated with the spatial distribution of rainfall events. Extreme discharge events become more pronounced with higher emissions pathways and greater ARIs in the CDO watershed (Fig. 6). For example, the maximum peak flow under the SSP5-8.5 late 21st century is 4.7 times the reference level for an ARI of 1 year. The ratio of the peak discharge associated with a 5-year ARI rainstorm in postfire year 1 under the SSP5-8.5 late 21st century is 10.4 times greater than that associated with the 1-year ARI rainstorm under the reference scenario. Simulated peak discharge decreases with time since fire (Fig. 6).
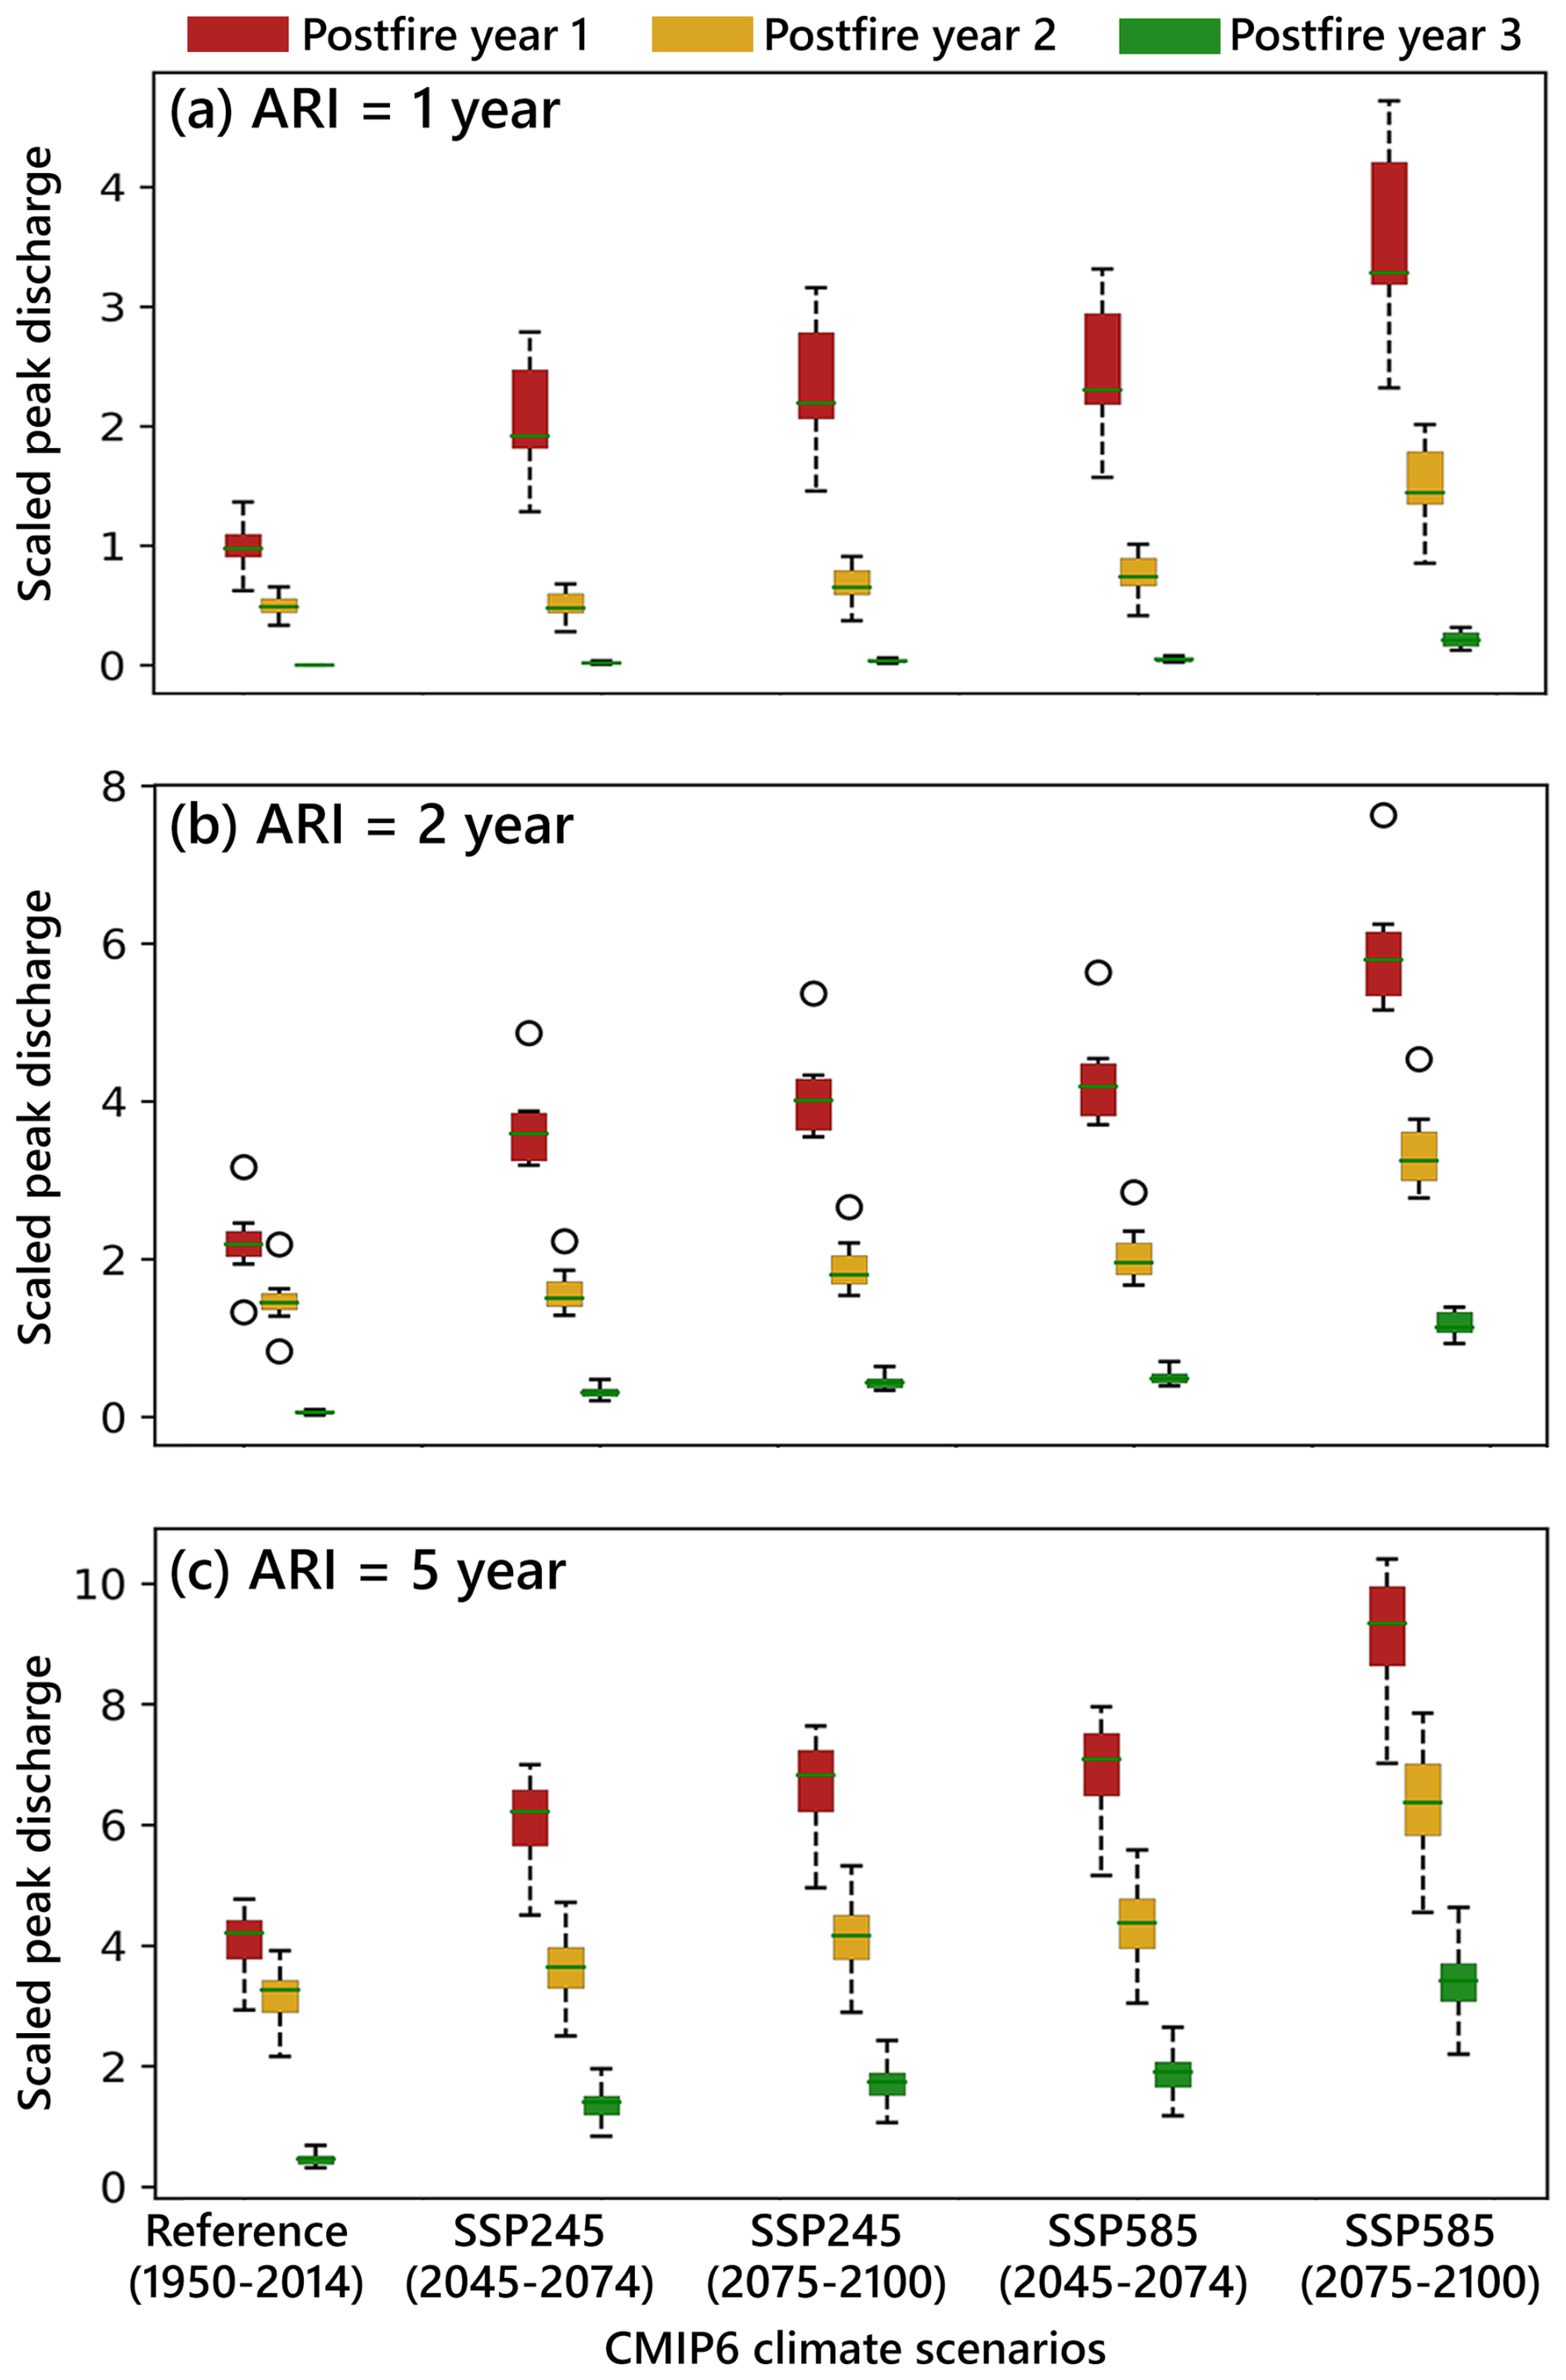
Figure 6The boxplots of the scaled peak discharge rates derived from 30 rainstorms over 50 % of the watershed at the 1-, 2-, and 5-year average recurrence intervals (ARI) in postfire years 1–3 for the reference and future scenarios at the CDO watershed. The peak discharges were scaled by the mean peak discharge from 30 simulations for runoff in response to a 1-year ARI rainstorm in postfire year 1 for the reference scenario. A total of 30 rainstorms were produced to account for the uncertainty in the location and spatial extent of rainfall over the CDO watershed.
For an ARI of 1 year in the postfire year 1, the average peak flows under the scenarios of SSP2-4.5 mid-21st century, SSP2-4.5 late-21st century, SSP5-8.5 mid-21st century, and SSP5-8.5 late-21st century were amplified by factors of 2.1, 2.4, 2.5, and 3.6, respectively, compared with the reference peak flow. The ratios of the average peak flows in postfire year 2 to the reference peak flow in postfire year 1 are 0.5, 0.7, 0.8, and 1.5 under scenarios SSP2-4.5 mid-21st century, SSP2-4.5 late-21st century, SSP5-8.5 mid-21st century, and SSP5-8.5 late-21st, respectively. For an ARI of 2 years, the ratios of the average peak flows under the four future scenarios in postfire year 2 to that of the reference level in postfire year 1 are 0.7, 0.9, 0.9, and 1.5. For an ARI of 5 years, the ratios are 0.9, 1.0, 1.1, and 1.6 (Fig. 6). The ratios of peak flows between postfire year 3 and the postfire year 1 reference level are all less than 1 regardless of the rainstorm's ARI. In summary, peak flows increase in magnitude as future greenhouse gas emissions move from the medium pathway to a high pathway. They also increase from the mid-century to late century regardless of the greenhouse gas emissions scenario.
The variability in peak flows increases with ARI as well as with the change from SSP2-4.5 to SSP5-8.5. Under the reference scenario, the normalized peak flow varies from 0.6–1.4 for a 1-year ARI, from 1.3–3.2 for a 2-year ARI, and from 2.9–4.8 for a 5-year ARI in the first postfire year (Fig. 6). For rainstorms at 1-year ARI in the postfire year 1, the range of the normalized peak flows increased from 0.6–1.4 in the reference period to 1.3–2.8 in the mid-century SSP2-4.5 scenario. It then broadened to 1.5–3.3 under both the late-century SSP2-4.5 and the mid-century SSP5-8.5 scenarios, eventually reaching 2.3–4.7 under the late-century SSP5-8.5 scenario. This suggests that extreme flash floods become more common and more severe in the future high pathway of emissions (Fig. 7).
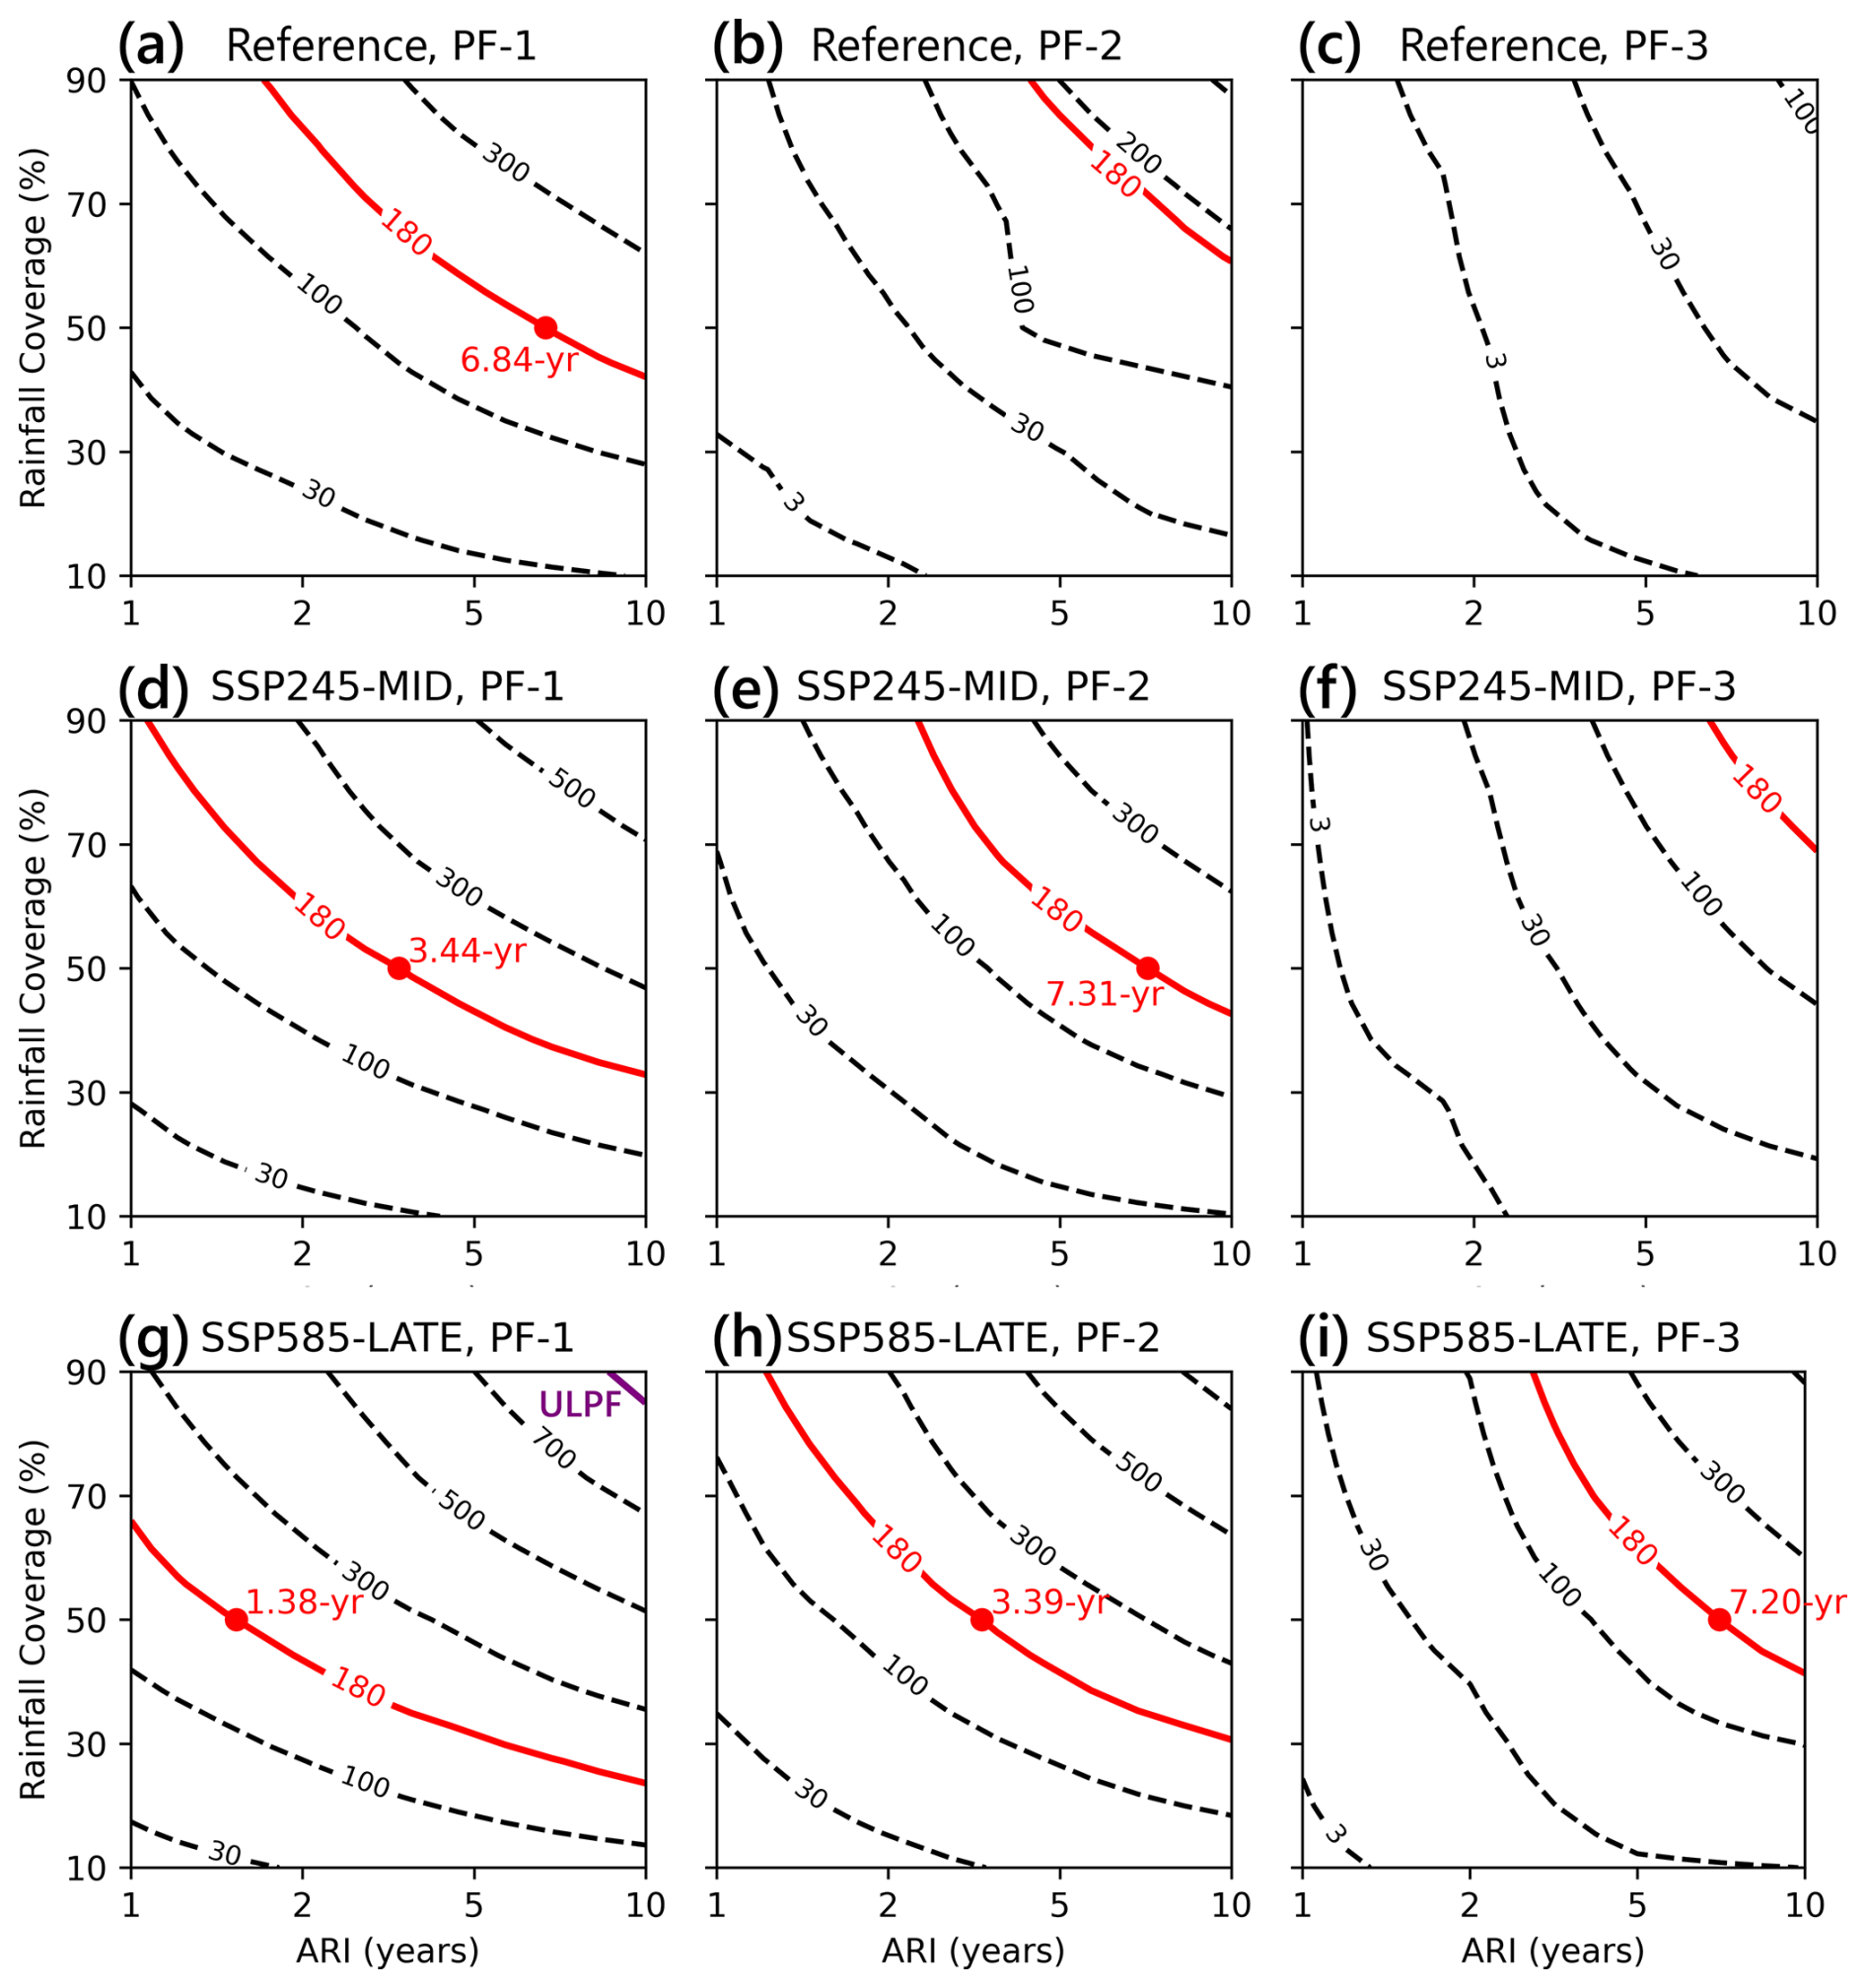
Figure 7Contours of peak discharge (m3 s−1) of simulated floods produced by design storms of varying average recurrence intervals (ARIs) and rainfall coverage (from 10 % to 90 %) during the first 3 postfire (PF) years for reference and future scenarios at the CDO watershed. The thick red contours represent the 100-year flood (180 m3 s−1), as derived from StreamStats (https://www.usgs.gov/streamstats; Paretti et al., 2014). Red dots indicate the ARIs of the storms that can produce a 100-year flood event when the spatial extent of rainfall is equal to half of the watershed area. Note the upper limit (909 m3 s−1) for postfire flood discharge (ULPF; Ebel, 2024) can only be produced by rainstorms with an ARI exceeding 8 years that cover more than 82 % of the watershed under the late-21st-century SSP5-8.5 scenario.
We present contours delineating peak discharge (m3 s−1) associated with rainstorms that cover 10 %, 30 %, 50 %, 70 %, and 90 % of the CDO watershed for 1-, 2-, and 5-year ARIs over the initial 3 postfire years in the reference and the two projected future scenarios at the CDO watershed (Fig. 7). Peak discharge increases with ARI, more extreme emissions pathways, and the extent of rainfall coverage within the watershed. In postfire year 1 under the reference climate scenario, a rainstorm with a roughly 7-year ARI that covers 50 % of the watershed would be needed to generate the discharge associated with the 100-year flood (180 m3 s−1), as derived from StreamStats (https://www.usgs.gov/streamstats, last access: 30 September 2025; Paretti et al., 2014). Under the SSP2-4.5 mid-century scenario, the same rainstorm characterized by an ARI of roughly 7 years with 50 % coverage across the watershed would produce a peak discharge equivalent to the 100-year flood even if it occurred during postfire year 2. Similarly, this same rainstorm would produce a discharge equivalent to that of the 100-year flood during postfire year 3 under the SSP5-8.5 late-century scenario. Simulations therefore demonstrate an increased persistence of postfire flood hazards under future climate scenarios due to rainfall intensification.
Additionally, a rainstorm with 50 % coverage across the watershed can produce a peak discharge equivalent to that of the 100-year flood with an ARI as short as 1.4 years in the SSP5-8.5 late-century scenario. The upper limit of peak discharge for a postfire flood (ULPF) in the CDO (909 m3 s−1), based on watershed area (Ebel, 2024), can be produced by rainstorms that have an ARI of approximately 10 years and a rainfall coverage percentage close to 90 % in the first postfire year under the SSP5-8.5 late-century scenario (Fig. 7g). No simulated rainstorms were capable of producing discharges that approached the ULPF (909 m3 s−1) under the reference or SSP2-4.5 scenarios.
5.1 Event selection and runoff generation mechanism
This study uses K2 model calibration to examine the temporal change in watershed-scale hydrologic model parameters following a fire. This methodology, which has been utilized in similar hydrologic studies within burned watersheds (Chen et al., 2013; Liu et al., 2021), provides insights into postfire hydrologic dynamics and watershed recovery. In past work using the K2 model to infer temporal changes in hydrologic parameters following fire (Liu et al., 2021), rainfall–runoff events were preferentially selected based on whether or not they exhibited characteristics consistent with infiltration-excess runoff, which aligns well with the K2 model's strength in capturing the dynamics of infiltration-excess overland flow using the Parlange et al. (1982) approximation. However, the model's effectiveness in simulating baseflow and subsurface flow is limited, leading to potential inaccuracies in representing watershed conditions when runoff is not primarily infiltration-excess dominated. Therefore, K2 model performance is likely to decrease when simulating events dominated by saturation excess overland flow. Further, inferred variations in model parameters from one event to another may be driven by a need to compensate, to varying degrees, for saturated-excess runoff generation processes not represented by the model, rather than reflecting changes in fire effects.
Among the 12 simulated events in this study, 5 (events 6–10) exhibit initial soil saturation (SAT, defined as soil moisture divided by porosity) equal to or greater than 0.55 or rainfall durations exceeding 7.6 h. Under these conditions, infiltration-excess overland flow is less likely to be the dominant runoff-generated mechanism. The model performance of these events is, as expected, relatively poor compared with other events (Fig. 4). We therefore excluded events 6–10 from our efforts to use K2 to quantify changes in soil hydrologic and hydraulic roughness parameters as a function of time since fire. The apparent shift from flood generation due primarily to infiltration-excess to saturation-excess overland flow, or a mix of the two mechanisms, in less than 2 years following fire is consistent with the relatively rapid increase in soil infiltration capacity inferred from model calibration of events 1–5 (Fig. 4; Table 3). This implies wildfire impacts persist for a limited period, defining a “window of disturbance” during which altered soil hydraulic properties significantly influence watershed runoff responses.
Postfire floods can stem from various overland flow generation mechanisms, including saturation-excess overland flow, subsurface storm flow, or combinations thereof (Ebel et al., 2012; Ebel, 2024). Runoff events excluded in this study, specifically events 6–10, are more likely to arise from a mixture of these runoff generation mechanisms. Utilizing a hydrologic model capable of capturing both surface and subsurface flow dynamics, such as ParFlow (e.g., Atchley et al., 2018), holds the potential to enhance data interpretation through continuous simulation, thereby allowing for the inference of temporal changes in watershed hydrologic properties. This comprehensive approach could enable simulation of the full spectrum of streamflow generation mechanisms, offering more general insights into the full range of flood generation processes prevalent in wildfire-prone, mountainous regions like the western United States. Such modeling efforts not only facilitate the understanding of large postfire floods under the assumption of infiltration-excess mechanisms but also provide crucial information for predicting baseflow and ecological flow. These insights could be informative for effective water resources management in burned watersheds.
5.2 Postfire trajectories of model parameters
Infiltration tends to decrease immediately after moderate- and high-severity fire (e.g., Ebel and Martin, 2017; Ebel, 2019), but there is substantial site-to-site variability (McGuire et al., 2024). In some cases, saturated hydraulic conductivity may increase or remain unchanged following fire (e.g., Rodríguez-Alleres et al., 2012; Raymond et al., 2020; McGuire et al., 2024). We infer the lowest values of Ksp from the first event immediately following the Bighorn Fire (Fig. 4a). Subsequently, we observe an increase in Ksp over time, with an average over three events of 11 mm h−1 in the first postfire year, 29 mm h−1 in the second postfire year, and greater than 60 mm h−1 in postfire year 3 (Table 3). This increase, averaging 24 mm h−1 yr−1, represents a more pronounced trend compared to estimates obtained from field measurements using tension infiltrometers (TI) following the Bighorn Fire. Estimates of field-saturated hydraulic conductivity derived from TIs across 35 study plots within the Bighorn Fire indicated relatively minimal change from 2021 to 2023 when data were separated by ecosystem type (Barra et al., 2025). In particular, there were no significant changes in field-saturated hydraulic conductivity between 2021 and 2023 in any of the three ecosystem groups, namely Madrean pine–oak woodlands, ponderosa pine and Emory oak forests, and mixed conifer forests. All three of these ecosystem groups are represented within the CDO watershed, with elevation being a primary control on vegetation species. We interpret estimates of Ksp inferred from the model as representing changes in this parameter within areas burned at moderate to high severity, though Barra et al. (2025) did not analyze trends in field-saturated hydraulic conductivity across all ecosystem types from 2021 to 2023 in areas burned at moderate to high severity. These data indicate an increase in the geometric mean of field-saturated hydraulic conductivity from 20 to 28 mm h−1 from 2021 to 2023, which is substantially less than what we infer with event-scale hydrologic modeling. Variations between estimates of Ksp inferred from the model and from TI measurements could be attributed to methodological differences. Estimates from TI measurements represent soil hydraulic properties associated primarily with the soil matrix, while estimates inferred from watershed-scale modeling represent both matrix and macropore flow. The more substantial postfire increases in Ksp inferred from the model could therefore indicate an increase in macropore flow with time since fire (e.g., Nyman et al., 2014) that is not captured as well by the TI measurements.
Other studies of postfire changes in field-saturated hydraulic conductivity in the southwest USA demonstrate substantial site-to-site variability. For instance, TI-derived estimates of field-saturated hydraulic conductivity from a forested area in New Mexico burned at moderate to high severity indicated an increase from 7 mm h−1 in the months following the fire to 42 mm h−1 in the third postfire year (Hoch et al., 2021). Similar measurements following the Pinal Fire in central Arizona demonstrated a decrease in field-saturated hydraulic conductivity from 36 to 15 mm h−1 between the first and fourth postfire years (Hoch et al., 2021). Liu et al. (2021) used the same approach applied here based on watershed-scale model calibration to infer an increase in Ksp from roughly 7 to 24 mm h−1 over a 4-year time period following a moderate- to high-severity fire in the Arroyo Seco watershed in the San Gabriel Mountains. Variations in the magnitude of fire-driven reductions in Ksp and the subsequent rate of change in Ksp with time since fire could result from either different physiographic features of these sites, such as soil and dominant vegetation types, or the different methods used to constrain Ksp (Ebel, 2019).
The trend of increasing net capillary drive (Gp) inferred from our model calibrations is generally consistent with other studies in the southwest USA that have documented relatively low values in Gp immediately after fire followed by subsequent increases over time (McGuire et al., 2021; Hoch et al., 2021). TI-derived estimates of sorptivity following the Bighorn Fire, for example, suggest increases in infiltration capacity associated with changes in capillarity with time since fire (Barra et al., 2025). Barra et al. (2025) observed an increasing trend between sorptivity and time since the 2020 Bighorn Fire (i.e., from 2021 to 2023) in both Madrean pine–oak woodlands and ponderosa pine and Emory oak forests. A synthesis study of soil hydraulic parameters in fire-affected soils found that sorptivity and wetting front potential were significantly lower in burned soils compared to unburned soils (Ebel and Moody, 2017). Liu et al. (2021), however, found no relationship between Gp and time since fire in their study of the Arroyo Seco watershed in southern CA. The lack of a trend in Gp as a function of time since fire (e.g., Liu et al., 2021) may be at least partially attributed to the more minor role that Gp appears to play in watershed-scale runoff responses based on the relative importance of this parameter in the events modeled in this study (Fig. 4).
In contrast to several past studies in the southwest USA, which have generally found that hydraulic roughness is lowest immediately following fire and then increases with time (Canfield et al., 2005; Liu et al., 2021), we found that hydraulic roughness was relatively constant with time since fire. Liu et al. (2021) inferred an increase in nc from roughly 0.09 to 0.3 over a time period of roughly 2 years after a fire in the San Gabriel Mountains, CA. Postfire dry ravel is common in the San Gabriel Mountains and can load channels with substantial amounts of relatively fine hillslope sediment, decreasing grain roughness in channels immediately after fire. We did not observe any evidence of widespread dry ravel in the CDO following the Bighorn Fire, which could account for the more muted change in nc as a function of time since fire compared to that found by Liu et al. (2021). Increases in hydraulic roughness as a function of time since fire could also result more generally from the preferential transport of fine sediment and the exposure of cobbles and boulders (Rengers et al., 2016), regardless of whether postfire dry ravel is an active process. We hypothesize that such a trend may also have been less pronounced at our site due to the preferential transport of fines following the fire in 2003.
Our findings support those of previous studies that have documented fire-induced reductions in soil infiltration capacity (e.g., due to reductions in Ksp and Gp). Our findings provide more detailed information, however, for the expected magnitude of fire-driven changes in common hydrologic model parameters and the rates at which they change as a function of time since fire. These findings provide valuable guidance for applying hydrologic models to simulate postfire runoff and related hydrologic hazards in similar infiltration-excess-dominated settings. We hypothesize that the postfire trajectories of the hydrologic model parameters inferred here depend on canopy and ground cover dynamics, soil physical and chemical properties, soil water repellency, and postfire hydroclimate conditions, including drought (Larson-Nash et al., 2018) and soil moisture (Barra et al., 2025). Barra et al. (2025) found that soil water repellency played an influential role in controlling field-saturated hydraulic conductivity and sorptivity roughly 1 year following the Bighorn Fire (i.e., in 2021). Since soil water repellency was not an influential control on either of these two soil hydraulic properties in 2023 (Barra et al., 2025), transient fire-driven changes to soil water repellency can provide one explanation for the model-inferred increases in Gp and Ksp. A positive relationship between exchangeable calcium, which can enhance soil aggregation (Muneer and Oades, 1989), and field-saturated hydraulic conductivity following the Bighorn Fire in 2023 could also point to postfire changes in soil structure as a factor driving variations in soil hydraulic properties with time since fire (Barra et al., 2025). Further investigation is warranted to unravel the intricate mechanisms driving postfire changes to soil physical and chemical properties across different geographical regions and how they relate to changes in hydrologic model parameters (Vieira et al., 2022; Nyman et al., 2014; Cai and Wang, 2025).
The model-inferred minimum in soil infiltration capacity during the fire postfire year is consistent with observations that the probability and severity of postfire flood and debris flow hazards are greatest during the first postfire rainy season. Consequently, it is crucial to closely monitor and assess the potential risks to downstream areas during this period. For instance, the first runoff event following the Bighorn Fire was produced by a rainstorm with a peak I15 of 12 mm h−1 and a duration of 44 min. It led to a flood with a peak discharge of 35 m3 s−1 (equivalent to a 5-year return period) at the outlet of the CDO watershed. In contrast, there was no measurable flow during event pre-10, which occurred in the third postfire year and had a peak I15 of 31 mm h−1 and a duration of 71 min. This difference in response between the first and third rainy season following the fire underscores the significant impact of immediate postfire conditions on flood severity.
In this study, the persistence of fire-driven reductions in infiltration capacity could continue to promote increases in hydrologic hazards throughout the first 1–2 years after fire. Understanding these dynamics is essential for implementing effective mitigation strategies and informing land management decisions in fire-prone areas, especially in the context of a warming future with anticipated increases in short-duration, high-intensity rainfall (e.g., Martel et al., 2021; Westra et al., 2014; Fowler et al., 2021).
5.3 Effects of rainfall intensification
The likelihood and magnitude of floods and debris flows can be substantially influenced by reductions in soil infiltration capacity and hydraulic roughness caused by fires (Liu et al., 2022). The watershed response to rainfall intensification is non-linear, particularly in burned areas where infiltration capacity is reduced. Intensified rainfall generates rapid runoff responses and more pronounced peak discharges, further enhanced by concentrated flow along preferential pathways created or accentuated by fire effects. These effects are expected to be exacerbated by the intensification of rainfall due to future warming. Amplification of postfire flow hazards may manifest as an increase in flow magnitude and/or a higher probability of occurrence. In this study, under the four future warming scenarios, peak flow rates are projected to be 2.1–3.6 times greater than the reference levels given a specific ARI of rainfall in the first year following the fire (Fig. 6). The increase in peak flow response can be driven by increased spatial rainfall coverage as well as by warming-induced rainfall intensification due to greenhouse gas emissions (Fig. 7). The effect of the spatial variation and rainfall coverage on runoff does not apply to smaller, low-order watersheds (less than 1 km2). Currently, a 100-year flood necessitates approximately a 7-year rainstorm covering 50 % of the CDO watershed in the first postfire year. However, under the SSP2-4.5 scenario, a similar flood could be triggered by a 3.4-year rainstorm by the mid-century, effectively doubling the likelihood of a 100-year flood under a medium pathway of greenhouse gas emissions with climate protection measures. In the scenario with the highest greenhouse gas emissions, such floods could become even more frequent, occurring with a 1.4-year rainstorm by the end of the century (Fig. 7g). The maximum postfire flood, as defined by the postfire flood envelope curve under current climate conditions (Ebel, 2024), could be triggered by a 10-year rainstorm covering most of the watershed by the late century under the highest greenhouse gas emissions scenario (SSP5-8.5). Warming-related rainfall intensification is similarly expected to increase the frequency of significant postfire debris flows, such as those experienced in Montecito, California, in 2018 (Kean and Staley, 2021).
Another critical aspect is the duration of flow amplification following a fire across various future warming scenarios. To answer this question, it at least requires understanding and quantifying (1) the temporal changes in runoff production within burned watersheds, (2) the magnitude of warming-related rainfall intensification, and (3) an effective tool, such as a hydrologic model, to integrate the effects of the watershed's fire-altered function and intensified rainfall. We assessed the trajectory of watershed-scale soil infiltration capacity and channel roughness following a fire, as discussed in Sect. 5.2. We used a method adapted from Martel et al. (2021), which is widely used in other studies and governmental practices worldwide (e.g., Bao et al., 2017; Cannon and Innocenti, 2019), to represent rainfall intensification across various future warming scenarios based on CMIP6-derived LOCA2 data. We calibrated a K2 hydrologic model, recognized for its efficacy in semi-arid and arid watershed rainfall–runoff processes (Smith et al., 1995; Goodrich et al., 2012), to estimate the runoff response to intensified rainfall in each postfire year in the studied watershed.
Our findings indicate that amplified peak flows with magnitudes currently expected only in the first postfire year could be met or exceeded even in the second postfire year under future climate scenarios due to rainfall intensification (Figs. 6 and 7). This conclusion is based on a rainfall coverage of 50 % across the studied watershed, or nearly 25 km2. We chose this specific coverage because the area enclosed by isohyets for intense, convective rainfall in the southwestern United States shows a scale change near 25 km2 (Osborn and Reynolds, 1963; Osborn et al., 1979), akin to the average storm size enclosed by median rainfall intensity isohyets for all 12 events occurring in the 3 years postfire (Table 1). Storm size could also be affected by a warming future (Bao et al., 2024), which suggests avenues for further investigation. Furthermore, our simulations indicate that floods in the first 2 postfire years are predominantly characterized by infiltration-excess overland flow, occurring when rainfall rates surpass effective soil infiltration capacity.
In this study, we used the K2 hydrologic model to simulate infiltration-excess overland flow at the watershed scale (49.4 km2) in response to several rainstorms during the first 3 years following the 2020 Bighorn Fire in the Santa Catalina Mountains in southern Arizona, USA. Results indicate that soil saturated hydraulic conductivity (Ksp) and net capillary drive (Gp) are lowest immediately following fire and increase with time since fire, while channel roughness (nc) remains relatively constant. Specifically, Ksp and Gp both increased from postfire minima of 11 mm h−1 and 19 mm, respectively, in the first year after the fire to more than 60 mm h−1 and 19 mm by the third year after the fire. Based on this postfire trajectory, we estimated peak flows in response to design rainstorms derived from historic data and intensified rainstorms under four future climate scenarios, namely SSP2-4.5 and SSP5-8.5 in both the mid-century and the late century. We found that the likelihood of a 100-year flood will double by the mid-century in the studied watershed under the medium emissions path (SSP2-4.5). Postfire flood maxima under the historical climate condition will be triggered by a 10-year rainstorm covering most of the watershed under the high emissions pathway (SSP5-8.5) by the late century. The amplification of peak flows is expected to persist during the first 2 postfire years under both the medium emissions pathway by the late century and the high emissions pathway from the mid-century onwards. These results improve understanding of postfire watershed hydrologic dynamics and provide information for assessing postfire hydrologic hazards, which can inform mitigation strategies and adaptive planning to address the challenges posed by increasing fire activity and rainfall intensification.
The KINEROS2 model simulation data used for analysis and visualization are available for research purposes at https://doi.org/10.5281/zenodo.12803607 (Liu, 2024).
The supplement related to this article is available online at https://doi.org/10.5194/nhess-25-4135-2025-supplement.
Conceptualization: TL, LAM, AMY. Data curation: TL, LAM, AMY. Formal analysis: TL, LAM. Funding acquisition: LAM, AMY, CJA. Investigation: TL, LAM, AMY, CJA. Methodology: TL, LAM. Supervision: LAM, AMY. Validation: TL, CJA, ALA. Visualization: TL. Writing – original draft: TL. Writing – review & editing: TL, LAM, AMY, CJA, ALA.
The contact author has declared that none of the authors has any competing interests.
Publisher's note: Copernicus Publications remains neutral with regard to jurisdictional claims made in the text, published maps, institutional affiliations, or any other geographical representation in this paper. While Copernicus Publications makes every effort to include appropriate place names, the final responsibility lies with the authors.
This material is based upon work supported by the U.S. Geological Survey under grant/cooperative agreement no. G23AC00447-00 and grant no. G25AP00142, the Pima County Regional Flood Control District under grant agreement no. RFCD-2020-003, and the Laboratory Directed Research and Development program of Los Alamos National Laboratory under project no. 20240448ER. We thank Lynn Orchard and Alireza Arabzadeh from the Pima County Regional Flood Control District for their assistance with rainfall and runoff data.
This research has been supported by the U.S. Geological Survey (grant nos. G23AC00447-00 and G25AP00142), the Pima County Regional Flood Control District under grant agreement no. RFCD-2020-003, and the Los Alamos National Laboratory (grant no. 20240448ER).
This paper was edited by Paolo Tarolli and reviewed by two anonymous referees.
Abatzoglou, J. T.: Development of gridded surface meteorological data for ecological applications and modelling, Int. J. Climatol., 33, 121–131, https://doi.org/10.1002/joc.3413, 2011.
Adams, D. K. and Comrie, A. C.: The North American Monsoon, Bulletin of the American Meteorological Society, 78, 2197–2213, https://doi.org/10.1175/1520-0477(1997)078<2197:tnam>2.0.co;2, 1997.
Atchley, A. L., Kinoshita, A. M., Lopez, S., Trader, L., and Middleton, R. H.: Simulating Surface and Subsurface Water Balance Changes Due to Burn Severity, Vadose Zone J., 17, 1–13, https://doi.org/10.2136/vzj2018.05.0099, 2018.
Bao, J., Sherwood, S. C., Alexander, L. V., and Evans, J. P.: Future increases in extreme precipitation exceed observed scaling rates, Nat. Clim. Chang., 7, 128–132, https://doi.org/10.1038/nclimate3201, 2017.
Bao, J., Stevens, B., Lukas, K., and Muller, C.: Intensification of daily tropical precipitation extremes from more organized convection, Sci. Adv., 10, eadj6801, https://doi.org/10.1126/sciadv.adj6801, 2024.
Barra, C., Fule, M., Beers, R., McGuire, L., Youberg, A., Falk, D., and Rasmussen, C.: Soil biogeochemical and hydraulic property response to wildfire across forested ecosystems of the Santa Catalina Mountains, Arizona, USA, Catena, 250, 108802, https://doi.org/10.1016/j.catena.2025.108802, 2025.
Boer, M. M., Bowman, D. M. J. S., Murphy, B. P., Cary, G. J., Cochrane, M. A., Fensham, R. J., Krawchuk, M. A., Price, O. F., De Dios, V. R., Williams, R. J., and Bradstock, R. A.: Future changes in climatic water balance determine potential for transformational shifts in Australian fire regimes, Environ. Res. Lett., 11, 065002, https://doi.org/10.1088/1748-9326/11/6/065002, 2016.
Cai, L. and Wang, M.: Simulating watershed hydrological response following a wildfire in southeast China with consideration of land cover changes, Catena, 250, 108755, https://doi.org/10.1016/j.catena.2025.108755, 2025.
Canadell, J. G., Meyer, C. P., Cook, G. D., Dowdy, A., Briggs, P. R., Knauer, J., Pepler, A., and Haverd, V.: Multi-decadal increase of forest burned area in australia is linked to climate change, Nat. Commun., 12, e7600, https://doi.org/10.1038/s41467-021-27225-4, 2021.
Canfield, H. E., Goodrich, D. C., and Burns, I. S.: Selection of Parameters Values to Model Post-Fire Runoff and Sediment Transport at the Watershed Scale in Southwestern Forests, Managing Watersheds for Human and Natural Impacts, https://doi.org/10.1061/40763(178)48, 2005.
Cannon, A. J. and Innocenti, S.: Projected intensification of sub-daily and daily rainfall extremes in convection-permitting climate model simulations over North America: implications for future intensity–duration–frequency curves, Nat. Hazards Earth Syst. Sci., 19, 421–440, https://doi.org/10.5194/nhess-19-421-2019, 2019.
Cannon, S. H., Gartner, J. E., Wilson, R. C., Bowers, J. C., and Laber, J. L.: Storm rainfall conditions for floods and debris flows from recently burned areas in southwestern Colorado and southern California, Geomorphology, 96, 250–269, https://doi.org/10.1016/j.geomorph.2007.03.019, 2008.
Chen, L., Berli, M., and Chief, K.: Examining Modeling Approaches for the Rainfall-Runoff Process in Wildfire-Affected Watersheds: Using San Dimas Experimental Forest, J. Am. Water Resour. Assoc., 49, 851–866, https://doi.org/10.1111/jawr.12043, 2013.
Cydzik, K. and Hogue, T. S.: Modeling Postfire Response and Recovery using the Hydrologic Engineering Center Hydrologic Modeling System (HEC-HMS), JAWRA J. Am. Water Resour. Assoc., 45, 702–714, https://doi.org/10.1111/j.1752-1688.2009.00317.x, 2009.
Ebel, B. A.: Measurement Method Has a Larger Impact Than Spatial Scale For Plot-Scale Field-Saturated Hydraulic Conductivity (Kfs) After Wildfire and Prescribed Fire in Forests, Earth Surf. Proc. Land., 44, 1945–1956, https://doi.org/10.1002/esp.4621, 2019.
Ebel, B. A.: Temporal evolution of measured and simulated infiltration following wildfire in the Colorado Front Range, USA: Shifting thresholds of runoff generation and hydrologic hazards, J. Hydrol., 585, 124765, https://doi.org/10.1016/j.jhydrol.2020.124765, 2020.
Ebel, B. A.: Upper limits for post-wildfire floods and distinction from debris flows, Sci. Adv., 10, eadk5713, https://doi.org/10.1126/sciadv.adk5713, 2024.
Ebel, B. A. and Martin, D. A.: Meta-analysis of field-saturated hydraulic conductivity recovery following wildland fire: Applications for hydrologic model parameterization and resilience assessment, Hydrological Processes, 31, 3682–3696, https://doi.org/10.1002/hyp.11288, 2017.
Ebel, B. A. and Moody, J. A.: Synthesis of soil-hydraulic properties and infiltration timescales in wildfire-affected soils, Hydrol. Process., 31, 324–340, https://doi.org/10.1002/hyp.10998, 2017.
Ebel, B. A., Moody, J. A., and Martin, D. A.: Hydrologic conditions controlling runoff generation immediately after wildfire, Water Resour. Res., 48, e2011WR011470, https://doi.org/10.1029/2011wr011470, 2012.
Esposito, G., Gariano, S. L., Masi, R., Alfano, S., and Giannatiempo, G.: Rainfall conditions leading to runoff-initiated post-fire debris flows in Campania, Southern Italy, Geomorphology, 423, 108557, https://doi.org/10.1016/j.geomorph.2022.108557, 2023.
Fowler, H. J., Lenderink, G., Prein, A. F., Westra, S., Allan, R. P., Ban, N., Barbero, R., Berg, P., Blenkinsop, S., Do, H. X., Guerreiro, S., Haerter, J. O., Kendon, E. J., Lewis, E., Schaer, C., Sharma, A., Villarini, G., Wasko, C., and Zhang, X.: Anthropogenic intensification of short-duration rainfall extremes, Nat. Rev. Earth Environ., 2, 107–122, https://doi.org/10.1038/s43017-020-00128-6, 2021.
Goodrich, D. C., Shea Burns, I., Unkrich, C. L., Semmens, D. J., Phillip Guertin, D., Rosario Hernandez, M., Yatheendradas, S., Kennedy, J. R., and Levick, L. R.: KINEROS2/AGWA: Model Use, Calibration, and Validation, Transactions of the ASABE, 55, 1561–1574, https://doi.org/10.13031/2013.42264, 2012.
Gorr, A. N., McGuire, L. A., Youberg, A. M., Beers, R., and Liu, T.: Inundation and flow properties of a runoff-generated debris flow following successive high-severity wildfires in northern Arizona, USA, Earth Surf. Proc. Land., 49, 622–641, https://doi.org/10.1002/esp.5724, 2023.
Gupta, H. V., Kling, H., Yilmaz, K. K., and Martinez, G. F.: Decomposition of the mean squared error and NSE performance criteria: Implications for improving hydrological modelling, J. Hydrol., 377, 80–91, https://doi.org/10.1016/j.jhydrol.2009.08.003, 2009.
Hoch, O. J., McGuire, L. A., Youberg, A. M., and Rengers, F. K.: Hydrogeomorphic Recovery and Temporal Changes in Rainfall Thresholds for Debris Flows Following Wildfire, J. Geophys. Res.-Earth, 126, e2021JF006374, https://doi.org/10.1029/2021jf006374, 2021.
Kean, J. W. and Staley, D. M.: Forecasting the Frequency and Magnitude of Postfire Debris Flows Across Southern California, Earths Future, 9, e2020EF001735, https://doi.org/10.1029/2020ef001735, 2021.
Kean, J. W., Staley, D. M., Lancaster, J. T., Rengers, F. K., Swanson, B. J., Coe, J. A., Hernandez, J. L., Sigman, A. J., Allstadt, K. E., and Lindsay, D. N.: Inundation, flow dynamics, and damage in the 9 January 2018 Montecito debris-flow event, California, USA: Opportunities and challenges for post-wildfire risk assessment, Geosphere, 15, 1140–1163, https://doi.org/10.1130/ges02048.1, 2019.
Lancaster, J. T., Swanson, B. J., Lukashov, S. G., Oakley, N. S., Lee, J. B., Spangler, E. R., Hernandez, J. L., Olson, B. P. E., DeFrisco, M. J., Lindsay, D. N., Schwartz, Y. J., McCrea, S. E., Roffers, P. D., and Tran, C. M.: Observations and Analyses of the 9 January 2018 Debris-Flow Disaster, Santa Barbara County, California, Environ. Eng. Geosci., 27, 3–27, https://doi.org/10.2113/eeg-d-20-00015, 2021.
Larson-Nash, S. S., Robichaud, P. R., Pierson, F. B., Moffet, C. A., Williams, C. J., Spaeth, K. E., Brown, R. E., and Lewis, S. A.: Recovery of small-scale infiltration and erosion after wildfires, J. Hydrol. Hydromech., 66, 261–270, https://doi.org/10.1515/johh-2017-0056, 2018.
Li, C., Handwerger, A. L., Wang, J., Yu, W., Li, X., Finnegan, N. J., Xie, Y., Buscarnera, G., and Horton, D. E.: Augmentation of WRF-Hydro to simulate overland-flow- and streamflow-generated debris flow susceptibility in burn scars, Nat. Hazards Earth Syst. Sci., 22, 2317–2345, https://doi.org/10.5194/nhess-22-2317-2022, 2022.
Liu, T.: Postfire flood simulation data, Zenodo [data set], https://doi.org/10.5281/zenodo.12803607, 2024.
Liu, T., McGuire, L. A., Wei, H., Rengers, F. K., Gupta, H., Ji, L., and Goodrich, D. C.: The timing and magnitude of changes to Hortonian overland flow at the watershed scale during the post-fire recovery process, Hydrol. Process., 35, e14208, https://doi.org/10.1002/hyp.14208, 2021.
Liu, T., McGuire, L. A., Oakley, N., and Cannon, F.: Temporal changes in rainfall intensity–duration thresholds for post-wildfire flash floods in southern California, Nat. Hazards Earth Syst. Sci., 22, 361–376, https://doi.org/10.5194/nhess-22-361-2022, 2022.
Liu, T., McGuire, L. A., Youberg, A., Gorr, A., and Rengers, F. K.: Guidance for parameterizing post-fire hydrologic models with in situ infiltration measurements, Earth Surf. Proc. Land., 48, 2368–2386, https://doi.org/10.1002/esp.5633, 2023.
Martel, J.-L., Brissette, F. P., Lucas-Picher, P., Troin, M., and Arsenault, R.: Climate Change and Rainfall Intensity–Duration–Frequency Curves: Overview of Science and Guidelines for Adaptation, J. Hydrol. Eng., 26, 03121001, https://doi.org/10.1061/(asce)he.1943-5584.0002122, 2021.
McGuire, L. A., Rengers, F. K., Oakley, N., Kean, J. W., Staley, D. M., Tang, H., de Orla-Barile, M., and Youberg, A. M.: Time Since Burning and Rainfall Characteristics Impact Post-Fire Debris-Flow Initiation and Magnitude, Environ. Eng. Geosci., 27, 43–56, https://doi.org/10.2113/eeg-d-20-00029, 2021.
McGuire, L. A., Ebel, B. A., Rengers, F. K., Vieira, D. C. S., and Nyman, P.: Fire effects on geomorphic processes, Nat. Rev. Earth Environ., e2024-557, https://doi.org/10.1038/s43017-024-00557-7, 2024.
McLin, S. G., Springer, E. P., and Lane, L. J.: Predicting floodplain boundary changes following the Cerro Grande wildfire, Hydrol. Process., 15, 2967–2980, https://doi.org/10.1002/hyp.385, 2001.
Meles, M. B., Goodrich, D. C., Unkrich, C. L., Gupta, H. V., Burns, I. S., Hirpa, F. A., Razavi, S., and Guertin, D. P.: Rainfall distributional properties control hydrologic model parameter importance, J. Hydrol. Reg. Stud., 51, 101662, https://doi.org/10.1016/j.ejrh.2024.101662, 2024.
Miller, S., Semmens, D., Goodrich, D., Hernandez, M., Miller, R., Kepner, W., and Guertin, D.: The Automated Geospatial Watershed Assessment Tool, Environmental Modelling & Software, 22, 365–377, https://doi.org/10.1016/j.envsoft.2005.12.004, 2007.
Moody, J. A. and Martin, D. A.: Post-fire, rainfall intensity-peak discharge relations for three mountainous watersheds in the western USA, Hydrol. Process., 15, 2981–2993, https://doi.org/10.1002/hyp.386, 2001.
Moody, J. A., Shakesby, R. A., Robichaud, P. R., Cannon, S. H., and Martin, D. A.: Current research issues related to post-wildfire runoff and erosion processes, Earth-Sci. Rev., 122, 10–37, https://doi.org/10.1016/j.earscirev.2013.03.004, 2013.
Moody, J. A., Ebel, B. A., Nyman, P., Martin, D. A., Stoof, C., and McKinley, R.: Relations between soil hydraulic properties and burn severity, Int. J. Wildland Fire, 25, 279–293, https://doi.org/10.1071/wf14062, 2016.
Muneer, M. and Oades, J. M.: The role of Ca-organic interactions in soil aggregate stability. III. Mechanisms and models, Aust. J. Soil Res., 27, 411–423, https://doi.org/10.1071/Sr9890411, 1989.
Noske, P. J., Nyman, P., Lane, P. N. J., and Sheridan, G. J.: Effects of aridity in controlling the magnitude of runoff and erosion after wildfire, Water Resour. Res., 52, 4338–4357, https://doi.org/10.1002/2015wr017611, 2016.
Nyman, P., Sheridan, G. J., Smith, H. G., and Lane, P. N. J.: Evidence of debris flow occurrence after wildfire in upland catchments of south-east Australia, Geomorphology, 125, 383–401, https://doi.org/10.1016/j.geomorph.2010.10.016, 2011.
Nyman, P., Sheridan, G. J., Smith, H. G., and Lane, P. N. J.: Modeling the effects of surface storage, macropore flow and water repellency on infiltration after wildfire, J. Hydrol., 513, 301–313, https://doi.org/10.1016/j.jhydrol.2014.02.044, 2014.
Oakley, N. S.: A Warming Climate Adds Complexity to Post-Fire Hydrologic Hazard Planning, Earths Future, 9, e2021EF002149, https://doi.org/10.1029/2021ef002149, 2021.
O'Neill, B. C., Tebaldi, C., van Vuuren, D. P., Eyring, V., Friedlingstein, P., Hurtt, G., Knutti, R., Kriegler, E., Lamarque, J.-F., Lowe, J., Meehl, G. A., Moss, R., Riahi, K., and Sanderson, B. M.: The Scenario Model Intercomparison Project (ScenarioMIP) for CMIP6, Geosci. Model Dev., 9, 3461–3482, https://doi.org/10.5194/gmd-9-3461-2016, 2016.
Osborn, H. B. and Reynolds, W. N.: Convective storm patterns in the southwestern United States, Int. Assoc. Sci. Hydrol. Bull., 8, 71–83, https://doi.org/10.1080/02626666309493339, 1963.
Osborn, H. B., Renard, K. G., and Simanton, J. R.: Dense networks to measure convective rainfall in the southwestern United States, Water Resour. Res., 15, 1701–1711, https://doi.org/10.1029/wr015i006p01701, 1979.
Paretti, N. V., Kennedy, J. R., Turney, L. A., and Veilleux, A. G.: Methods for estimating magnitude and frequency of floods in Arizona, developed with unregulated and rural peak-flow data through water year 2010, 2014–5211, Geological Survey Scientific Investigations Report, 1–61, https://doi.org/10.3133/sir20145211, 2014.
Parlange, J. Y., Lisle, I., Braddock, R. D., and Smith, R. E.: The Three-Parameter Infiltration Equation, Soil Sci., 133, 337–341, https://doi.org/10.1097/00010694-198206000-00001, 1982.
Parson, A., Robichaud, P. R., Lewis, S., Napper, C., and Clark, J.: Field guide for mapping post-fire soil burn severity, U.S. Department of Agriculture, Forest Service, Rocky Mountain Research Station, https://doi.org/10.2737/rmrs-gtr-243, 2010.
Perica, S., Dietz, S., Heim, S., Hiner, L., Maitaria, K., Martin, D., Pavlovic, S., Roy, I., Trypaluk, C., Unruh, D., Yan, F., Yekta, M., Zhao, T., Bonnin, G., Brewer, D., Chen, L.-C., Parzybok, T., and Yarchoan, J.: Precipitation-Frequency Atlas of the United States. Volume 6 Version 2.3, California, https://www.noaa.gov (last access: 12 October 2025), 2025.
Perkins, J. P., Carlos, D., Skye, C., Corina, C., Stock, J., Prancevic, J. P., Micheli, E., and Jay, J.: Multi-Stage Soil-Hydraulic Recovery and Limited Ravel Accumulations Following the 2017 Nuns and Tubbs Wildfires in Northern California, J. Geophys. Res.-Earth, 127, e2022JF006591, https://doi.org/10.1029/2022jf006591, 2022.
Pierce, D. W., Cayan, D. R., Feldman, D. R., and Risser, M. D.: Future Increases in North American Extreme Precipitation in CMIP6 Downscaled with LOCA, J. Hydrometeorol., 24, 951–975, https://doi.org/10.1175/jhm-d-22-0194.1, 2023.
Prein, A. F., Rasmussen, R. M., Ikeda, K., Liu, C., Clark, M. P., and Holland, G. J.: The future intensification of hourly precipitation extremes, Nat. Clim. Chang., 7, 48–52, https://doi.org/10.1038/nclimate3168, 2017.
Raymond, C. A., McGuire, L. A., Youberg, A. M., Staley, D. M., and Kean, J. W.: Thresholds for post‐wildfire debris flows: Insights from the Pinal Fire, Arizona, USA, Earth Surface Processes and Landforms, 45, 1349–1360, https://doi.org/10.1002/esp.4805, 2020.
Razavi, S. and Gupta, H. V.: What do we mean by sensitivity analysis? The need for comprehensive characterization of “global” sensitivity in Earth and Environmental systems models, Water Resour. Res., 51, 3070–3092, https://doi.org/10.1002/2014wr016527, 2015.
Razavi, S. and Gupta, H. V.: A new framework for comprehensive, robust, and efficient global sensitivity analysis: 1. Theory, Water Resour. Res., 52, 423–439, https://doi.org/10.1002/2015wr017558, 2016a.
Razavi, S. and Gupta, H. V.: A new framework for comprehensive, robust, and efficient global sensitivity analysis: 2. Application, Water Resour. Res., 52, 440–455, https://doi.org/10.1002/2015wr017559, 2016b.
Rengers, F. K., Tucker, G. E., Moody, J. A., and Ebel, B. A.: Illuminating wildfire erosion and deposition patterns with repeat terrestrial lidar, Journal of Geophysical Research: Earth Surface, 121, 588–608, https://doi.org/10.1002/2015jf003600, 2016.
Robichaud, P. R., Wagenbrenner, J. W., Pierson, F. B., Spaeth, K. E., Ashmun, L. E., and Moffet, C. A.: Infiltration and interrill erosion rates after a wildfire in western Montana, USA, Catena, 142, 77–88, https://doi.org/10.1016/j.catena.2016.01.027, 2016.
Rodríguez-Alleres, M., Varela, M. E., and Benito, E.: Natural severity of water repellency in pine forest soils from NW Spain and influence of wildfire severity on its persistence, Geoderma, 191, 125–131, https://doi.org/10.1016/j.geoderma.2012.02.006, 2012.
Saxe, S., Hogue, T. S., and Hay, L.: Characterization and evaluation of controls on post-fire streamflow response across western US watersheds, Hydrol. Earth Syst. Sci., 22, 1221–1237, https://doi.org/10.5194/hess-22-1221-2018, 2018.
Schmidt, K. M., Hanshaw, M. N., Howle, J. F., Kean, J. W., Staley, D. M., Stock, J. D., and Bawden, G. W.: Hydrologic conditions and terrestrial laser scanning of post-fire debris flows in the San Gabriel Mountains, CA, U.S.A., in: Italian Journal of Engineering Geology and Environment, 5th International Conference on Debris-Flow Hazards: Mitigation, Mechanics, Prediction and Assessment, Padua, Italy, 17 June 2011, 583–593, 2011.
Schneider, D. P., Deser, C., Fasullo, J., and Trenberth, K. E.: Climate Data Guide Spurs Discovery and Understanding, Eos, Trans. Am. Geophys. Union, 94, 121–122, https://doi.org/10.1002/2013eo130001, 2013.
Senande-Rivera, M., Insua-Costa, D., and Miguez-Macho, G.: Spatial and temporal expansion of global wildland fire activity in response to climate change, Nat. Commun., 13, 1208, https://doi.org/10.1038/s41467-022-28835-2, 2022.
Shakesby, R. and Doerr, S.: Wildfire as a hydrological and geomorphological agent, Earth-Sci. Rev., 74, 269–307, 2006.
Sheikholeslami, R. and Razavi, S.: Progressive Latin Hypercube Sampling: An efficient approach for robust sampling-based analysis of environmental models, Environ. Modell. Softw., 93, 109–126, https://doi.org/10.1016/j.envsoft.2017.03.010, 2017.
Singleton, M. P., Thode, A. E., Sánchez Meador, A. J., and Iniguez, J. M.: Increasing trends in high-severity fire in the southwestern USA from 1984 to 2015, Forest Ecol. Manag., 433, 709–719, https://doi.org/10.1016/j.foreco.2018.11.039, 2019.
Smith, R. E., Goodrich, D. C., Woolhiser, D. A., and Unkrich, C. L.: KINEROS – a Kinematic Runoff and Erosion Model, in: Computer Models ofWatershed Hydrology, edited by: Singh, V. P., Water Resources Publications, Fort Collins, CO, 697–732, 1995.
Stoof, C. R., Vervoort, R. W., Iwema, J., van den Elsen, E., Ferreira, A. J. D., and Ritsema, C. J.: Hydrological response of a small catchment burned by experimental fire, Hydrol. Earth Syst. Sci., 16, 267–285, https://doi.org/10.5194/hess-16-267-2012, 2012.
Thomas, M. A., Rengers, F. K., Kean, J. W., McGuire, L. A., Staley, D. M., Barnhart, K. R., and Ebel, B. A.: Postwildfire Soil-Hydraulic Recovery and the Persistence of Debris Flow Hazards, J. Geophys. Res.-Earth, 126, e2021JF006091, https://doi.org/10.1029/2021jf006091, 2021.
Vieira, D. C. S., Basso, M., Nunes, J. P., Keizer, J. J., and Baartman, J. E. M.: Event-based quickflow simulation with OpenLISEM in a burned Mediterranean forest catchment, Int. J. Wildland Fire, 31, 670–683, https://doi.org/10.1071/WF21005, 2022.
Westra, S., Fowler, H. J., Evans, J. P., Alexander, L. V., Berg, P., Johnson, F., Kendon, E. J., Lenderink, G., and Roberts, N. M.: Future changes to the intensity and frequency of short-duration extreme rainfall, Rev. Geophys., 52, 522–555, https://doi.org/10.1002/2014rg000464, 2014.
Woolhiser, D. A. and Liggett, J. A.: Unsteady, one-dimensional flow over a plane-The rising hydrograph, Water Resour. Res., 3, 753–771, https://doi.org/10.1029/wr003i003p00753, 1967.
Wu, J., Nunes, J. P., Baartman, J. E. M., and Faúndez Urbina, C. A.: Testing the impacts of wildfire on hydrological and sediment response using the OpenLISEM model. Part 1: Calibration and evaluation for a burned Mediterranean forest catchment, Catena, 207, 105658, https://doi.org/10.1016/j.catena.2021.105658, 2021.
Xu, Z., Zhang, Y., Blöschl, G., and Piao, S.: Mega Forest Fires Intensify Flood Magnitudes in Southeast Australia, Geophys. Res. Lett., 50, e2023GL103812, https://doi.org/10.1029/2023gl103812, 2023.
Yu, G., Liu, T., McGuire, L. A., Wright, D. B., Hatchett, B. J., Miller, J. J., Berli, M., Giovando, J., Bartles, M., and Floyd, I. E.: Process-Based Quantification of the Role of Wildfire in Shaping Flood Frequency, Water Resour. Res., 59, e2023WR035013, https://doi.org/10.1029/2023wr035013, 2023.