the Creative Commons Attribution 4.0 License.
the Creative Commons Attribution 4.0 License.
 | 20 Oct 2025
High-resolution monitoring of the Günz River: Assessing water quality risks for managed aquifer recharge
Thomas Baumann
Adapting to hydrological extremes through managed aquifer recharge using river water as a source requires a profound understanding of the quantity and quality dynamics of the river. While quantitative data with high temporal resolution is available at numerous gauging stations, qualitative data for many catchment areas is generally sparse or not available at all. In this work, a combination of risk-based watershed screening, continuous on-site monitoring, and laboratory analyses was carried out to improve this understanding of river quality dynamics. For on-site monitoring, a cost-efficient and reliable monitoring kit was developed to generate time-resolved data, which proved essential for capturing hydrochemical dynamics and can serve as a decision-support tool, reducing the parameter set required for quality control. It was installed at the Günz River in the southwest of Bavaria, Germany. The water quality measurements were combined with the risks arising from this rural watershed, where wastewater treatment plants and agriculture were the primary pollution sources. The contamination state improved during events with high water levels due to dilution, except for very few trace substances washed out from the topsoil. From a technical point of view, turbidity was defined as the most urgent parameter to consider in the water treatment before reuse due to particle-associated contaminant transport and the risk of clogging. The results demonstrated that the Günz River would be a suitable source for managed aquifer recharge with particle removal as a pre-treatment step. By linking identified watershed risks to river water quality, this study highlights the importance of understanding catchment processes for effective water management. The insights of this study contribute to optimizing high-resolution monitoring, advancing managed aquifer recharge implementation, and enhancing water resource resilience in similar catchments.
- Article
(5892 KB) - Full-text XML
- BibTeX
- EndNote


Human-induced changes to the world's largest rivers have been rapid, extensive, and in some cases irreversible, creating significant environmental threats (Best, 2019). These changes make rivers less resilient and more vulnerable to extreme events, a trend that contradicts climate change projections, which predict an increase in the magnitude and frequency of such extremes (Best and Darby, 2020). For floods, climate change not only leads to higher frequency but also increases risks and associated changes for people and cropland (Arnell and Gosling, 2016). Additionally, reduced minimum flows during summer months, often exacerbated by drought, decrease dilution capacity, potentially resulting in higher pollutant concentrations (Whitehead et al., 2009). In 2021, it was determined that only 38 % of water bodies in Europe were in good chemical status, meaning the environmental quality standards (EQS) for priority substances were met. Good ecological status was reached by 40 %, whereby the structure and functioning quality of surface water ecosystems were assessed (European Environment Agency, 2018). Meanwhile, millions of people rely or depend on river water quality and quantity and its ecosystem services like buffering floods (Best and Darby, 2020).
In addition to the challenges faced by rivers, the worldwide decline in groundwater levels represents another pressing environmental concern. Managed aquifer recharge (MAR) projects have emerged as a viable strategy to address this problem, gaining significant importance in recent decades (Dillon et al., 2019). MAR refers to the targeted recharge of groundwater aquifers, which has proven to have the potential to reverse groundwater trends (Jasechko et al., 2024). River water is the most popular water source for MAR, as can be derived from the MAR Portal, a global MAR inventory (IGRAC, 2020). The most widely used MAR techniques are induced bank filtration, where surface water is infiltrated by pumping from a nearby well, and surface spreading, which leads to areal recharge, e.g., via ponds. An objective of MAR implementation can be to provide additional subsurface water storage. For instance, aquifer storage and recovery (ASR) systems inject surface water into aquifers with a well for later recovery (Bartos et al., 2023). Such practices demonstrate the further benefits of MAR: enhancing groundwater supplies while providing an adaptation measure for the imbalance of the landscape water regime as excess water is kept in the region. However, if we want to use river water for MAR and thus counter the effects of climate change, it is inevitable to better understand the dynamics of quantity and quality.
Examples of safeguarding water quality can be derived from the drinking water sector. The World Health Organization (WHO) guidelines for drinking water quality serve as the leading international reference for ensuring safe drinking water. In 2004, the WHO introduced therein the concept of Water Safety Plan (WSP), a risk-based and preventive approach developed specifically for the water supply sector. The WSP focuses on identifying, assessing, and managing risks within a supply system, addressing potential hazards throughout the entire process, from the catchment area to water extraction, treatment, storage, and distribution (World Health Organization, 2022). Another example of taking a risk-based approach to ensuring water safety is the German Drinking Water Catchment Area Ordinance, with which the country has implemented the European Drinking Water Directive (TrinkwEGV, 2023). Here, as well, the aim is to protect the quality of groundwater and surface water in drinking water catchment areas through hazard analysis and risk assessment.
Land cover and pollution sources play a critical role in assessing risks to river water quality, as contaminants enter waterways through both diffuse and point-source emissions. In groundwater-fed rivers, additional anthropogenic activities such as landfills and mining must also be considered due to their potential impact on groundwater quality. The specific watershed under investigation helps refine the range of relevant risks. In urban areas, stormwater runoff carries a diverse range of contaminants, as identified by, e.g., Wijesiri and Goonetilleke (2019) and Song et al. (2019). In rural areas, water pollution primarily originates from domestic waste emissions, which depend on the percentage of the population connected to sewage systems and their treatment efficiency, as well as agricultural activities. In Germany, requirements for wastewater discharge in waters are outlined in the national wastewater ordinance (AbwV, 1997). While wastewater treatment plants (WWTPs) are designed to reduce effluent contaminants, their efficiency varies based on operational setup and the nature of the incoming wastewater. For instance, most WWTPs are not able to effectively remove artificial sweeteners unless equipped with a fourth treatment stage (Scheurer et al., 2011). In case of extreme weather events, polluted water can escape due to flooded WWTPs or overflows in the sewer system. On the other hand, dilution is extremely diminished at low water levels, which leads to higher concentrations of pollutants in the receiving waters (Bates et al., 2008). Looking at agricultural activities, runoff from manure and slurry application can introduce microbial contamination, while pesticides and fertilizers pose additional chemical and microbiological hazards. Infrastructure, including roads and railways, serves as another diffuse contamination source. Road salt (mainly NaCl) is frequently applied during the frost period to prevent icing on the roads. Furthermore, effluents from railway track drainage, for example, have been identified as sources of pollutants, including metals, polycyclic aromatic hydrocarbons (PAHs), and chemical herbicides (e.g., Burkhardt et al., 2008).
Even if a risk assessment of the watershed can guarantee intrinsic safety, the quality of the source water must be monitored and controlled for safety and health reasons, especially if further use is intended, e.g., for MAR. One of the primary concerns is nutrient pollution, mainly by nitrogen and phosphorus (e.g., Carpenter et al., 1998; Basu et al., 2010). Eutrophication, acidification, and biodiversity loss are just some of the reported effects of nutrient enrichment (e.g., Vitousek et al., 1997; Smith, 2003). Furthermore, heavy metals represent significant concerns when using river water for MAR (e.g., Briffa et al., 2020; Ma et al., 2021). Another critical constituent of concern is organic pollutants, including pharmaceuticals (e.g., Patel et al., 2019; Glaser et al., 2020b) and sweeteners (e.g., Lange et al., 2012). Due to the low removal efficiency of these compounds in WWTPs, they act as markers of anthropogenic influence in surface water bodies (e.g., Verlicchi et al., 2012; Scheurer et al., 2011; Oppenheimer et al., 2011). Pesticides are further organic contaminants resulting from agricultural practices detected in several countries' aquatic systems (e.g., Konstantinou et al., 2006; Huber et al., 2000; Cerejeira et al., 2003). Additionally, microorganisms, apart from being potentially pathogenic and posing a risk to the groundwater environment, can lead to biological clogging (e.g., Baveye et al., 1998). Finally, physical characteristics such as turbidity and sediment load in river water affect the recharge efficiency by causing physical clogging (e.g., Bartak et al., 2015; Zaidi et al., 2020; Lippera et al., 2023).
In recent decades, the further development of high-frequency water quality measurements has brought decisive progress for catchment area research (Bieroza et al., 2023). Hydrochemical studies at the catchment scale have been conducted for several rivers in Germany, e.g., the Dill catchment (Fröhlich et al., 2008) and the Ammer catchment (Müller et al., 2020), as well as for headwater catchments, e.g., in the Harz Mountains (Werner et al., 2019). A data set encompassing multiple catchments was, e.g., compiled by Ebeling et al. (2022), which allowed an analysis of water nutrients and runoff patterns in different hydroclimatic and anthropogenic environments. Targeted analysis of changes in chemical composition during rain events (e.g., Neale et al., 2020) or droughts (e.g., Saavedra et al., 2024) in small streams further improves our understanding of the effects of water extremes.
Addressing water quality and quantity issues in rivers requires high-frequency monitoring data combined with catchment-scale risk assessments. Given the significant variability introduced by factors such as climate, catchment characteristics, and hydrogeology, site-specific data sets are crucial for achieving a comprehensive understanding of river dynamics. In the context of using river water for MAR, we hypothesize that linking watershed risks with continuous monitoring and detailed chemical analysis enables a robust assessment of the suitability of the river water. Based on this, our objective was to develop and test a transferable methodology, demonstrating its potential in an exemplary watershed.
In this work, we monitored the quality and quantity of the Günz River in Bavaria, Germany, for 17 months with high temporal resolution. Daily, seasonal, and annual fluctuations were observed and explained by analyzing the watershed with a focus on water quality risks as well as considering hydroclimatic metrics. Together with this detailed watershed screening, anthropogenic influences could be distinguished from the ordinarily groundwater-dominated river water. The dynamics of floods and droughts helped to assess the impact of extreme events. Finally, we hypothesize that the applied methods allow an estimation of water quality risk associated with the infiltration of this water using a MAR scheme.
The Günz catchment (710 km2) is located in the southwest of Bavaria, Germany. This right tributary of the Danube is representative of a larger number of pre-alpine catchments. It originates from the confluence of an eastern (Östl. Günz: 36.8 km) and a western tributary (Westl. Günz: 31.9 km) (Bavarian Environment Agency, 2016). In this work, the watershed of the eastern tributary (107 km2) is investigated in detail, which is shown in Fig. 1. Our designed monitoring station is located 22.9 km after the river's origin. 12.4 km downstream of the station, a permanent water level gauge (Lauben) has been installed by the local water management authority since 1977 (Bavarian Environment Agency, 2024c). The nearest permanent groundwater gauge (Sontheim) is located 3 km southwest of our measuring station, which is outside the surface water catchment area (Bavarian Environment Agency, 2025). Since 2014, an association of seven municipalities has implemented a flood protection concept for the Günz Valley with five retention basins with a total volume of 8.15 Mio m3 (Water Board Kempten, 2024). Planning and funding is provided by the state of Bavaria. One of these (Engetried) is located 8.6 km upstream of the monitoring station.
Figure 1b displays the land use in the eastern Günz watershed, which is dominated by agriculture (61 %) with 85 % grassland and 15 % cropland (Bavarian Surveying and Mapping Authority, 2022b). Protected areas cover 12 % of the watershed area, with mainly water protection areas and flora-fauna-habitats (each 37 %) (Bavarian Environment Agency, 2023c).
Based on the Köppen–Geiger climate classification (1991–2020), the area falls within the humid continental climate (Dfb; Beck et al., 2023). The annual precipitation in the eastern Günz catchment was 1305 mm in 2023, with 1135 mm being the mean of the last ten years (2014–2023). As typical for continental climates, the highest precipitation is usually during the summer months. For the future climate (2071–2100) in this region, an increase in the average temperature of 1.1 °C (RCP2.6), 2.2 °C (RCP4.5), and 4.0 °C (RCP8.5) is projected for the respective emission scenarios. Mean precipitation is also expected to increase by 3.4 % (RCP2.6), 5.4 % (RCP4.5), and 2.0 % (RCP8.5) (Bavarian Environment Agency, 2023a).
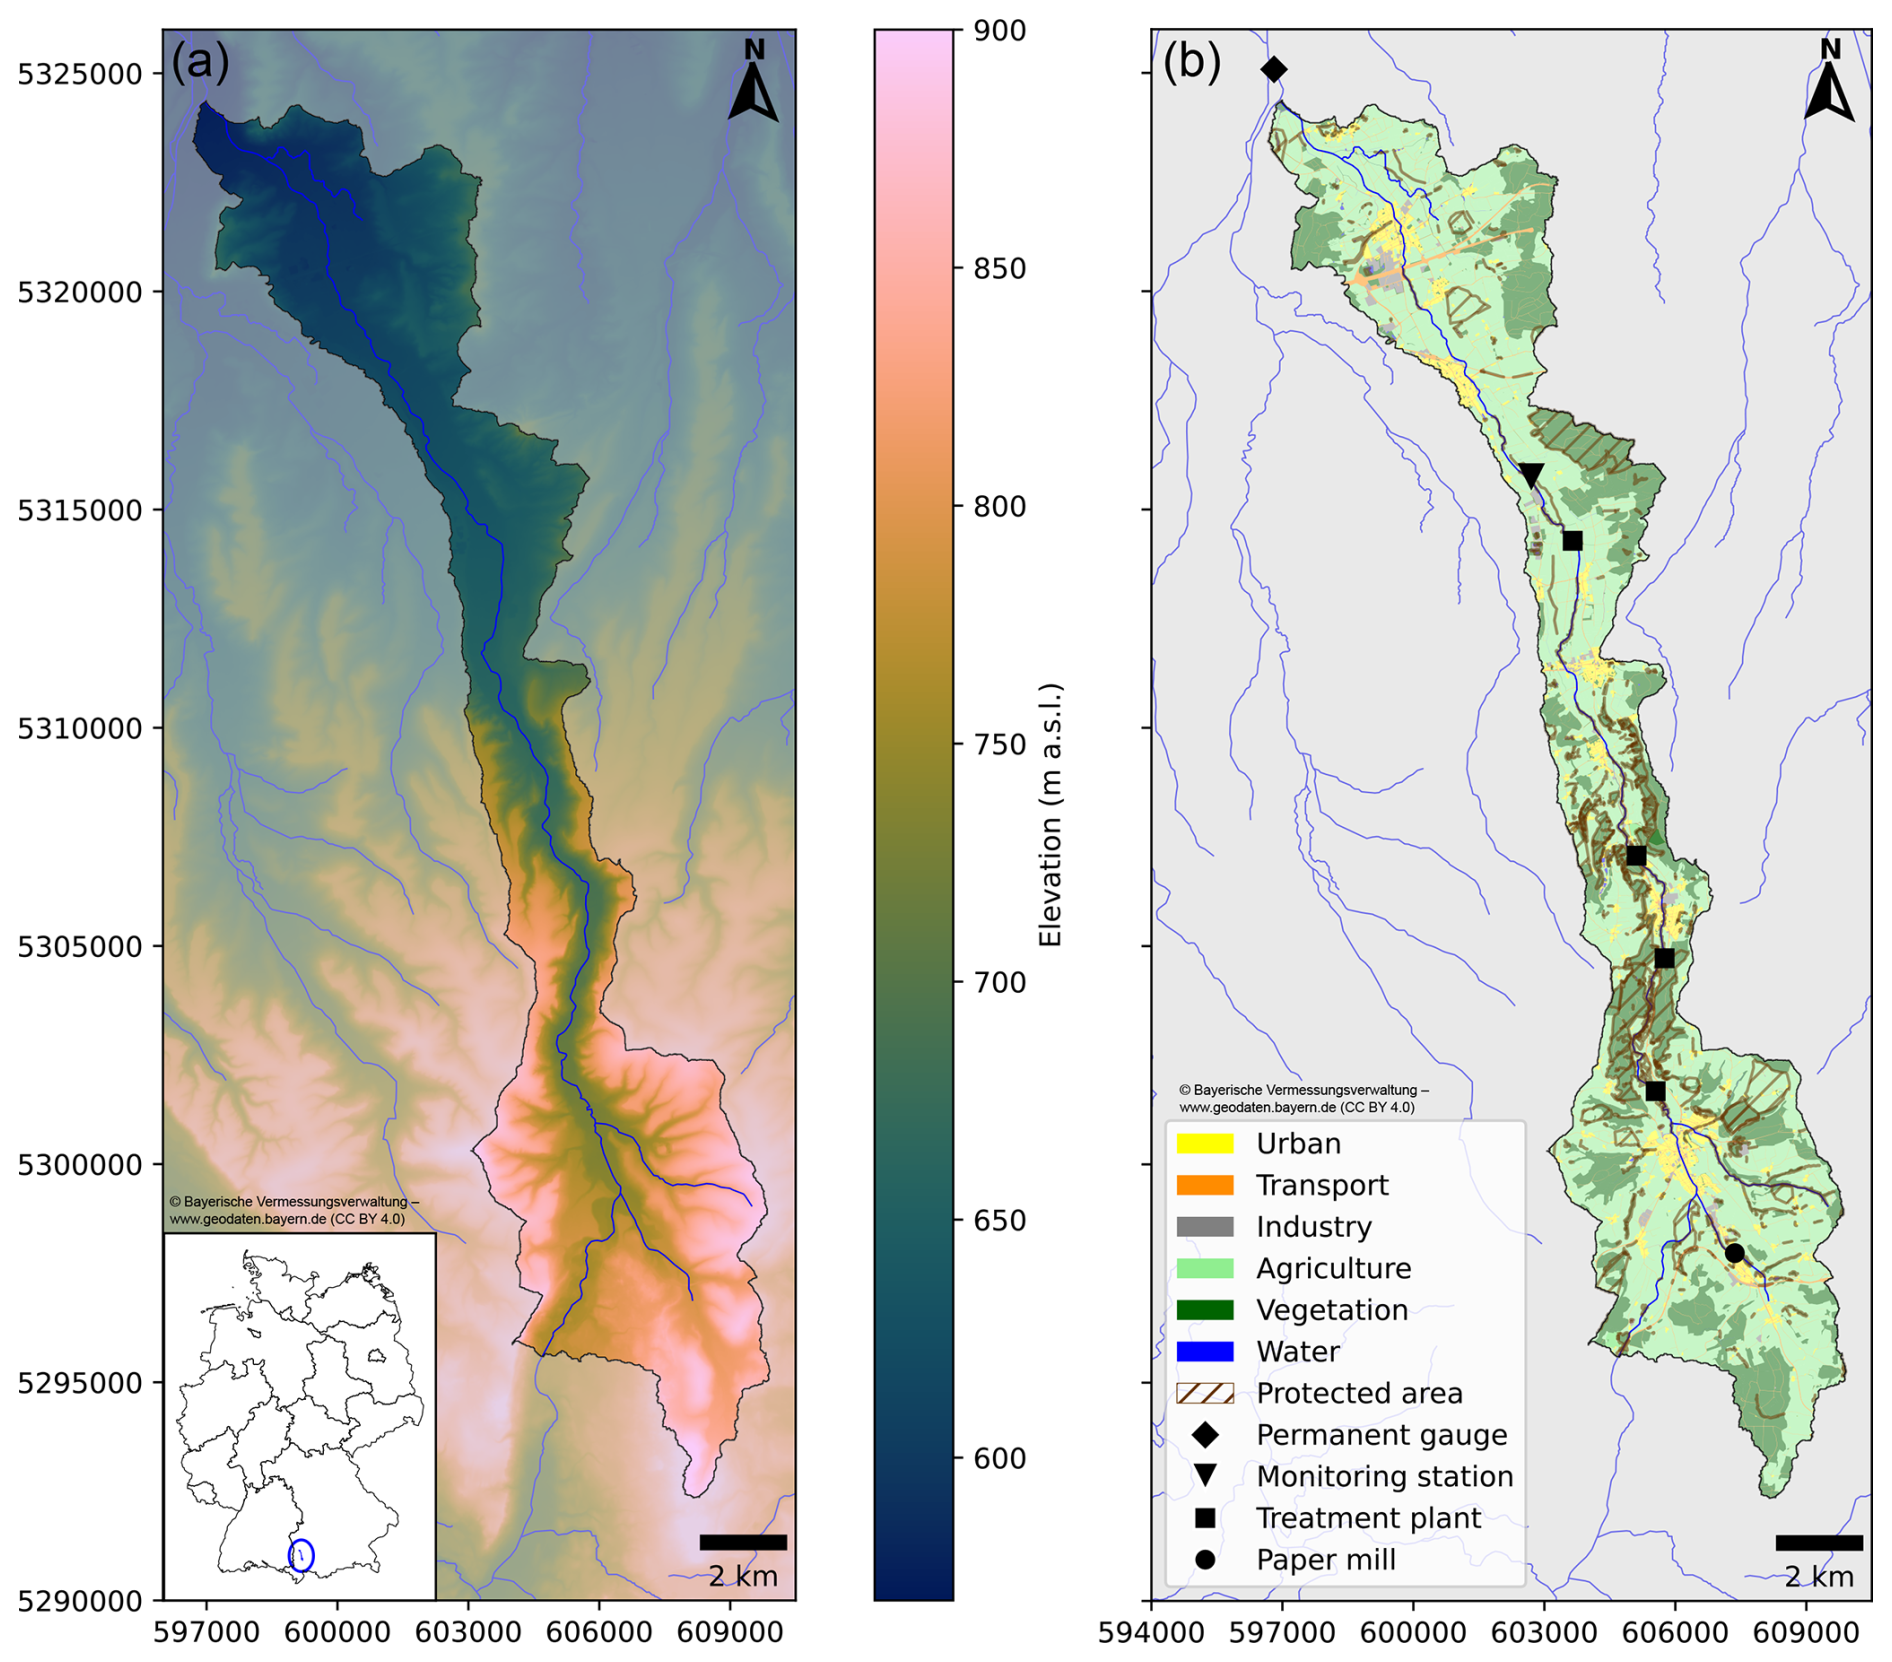
Figure 1Study area map of (a) elevation in the catchment, which is the eastern tributary of the Günz River in Bavaria, Germany (Bavarian Surveying and Mapping Authority, 2022a) and (b) land cover (Bavarian Surveying and Mapping Authority, 2022b). The overview map in (a) displays the study area location in Germany.
The geological setting in the study area is dominated by quaternary sediments lying on tertiary deposits from the Miocene (Bavarian Environment Agency, 2023b). The southern part of the catchment with the origin of the river consists of glacial and glacio-fluviatile sediments from the last glacial period. Up north, the catchment narrows as the river cuts through sediments from older glacial periods. Here, the valley floor is covered with Holocene sediments and hang slide masses. Around the monitoring station, the valley floor sees fluviatile gravel plains reaching a thickness in excess of 10 m. Most of the plateaus are covered with loess or loamy loess, and loam along the valley slopes is common. Older quaternary sediments are mostly set of carbonate material, while sediments of the last can contain crystalline scree. Hence, groundwater shows a calcium-magnesium-bicarbonate signature.
3.1 Watershed screening
The spatial scope of the screening was the watershed of the river water monitoring kit, which was delineated with the Python package pysheds (Bartos et al., 2023).
The land cover designation (urban, transport, industry, agriculture, vegetation, water) was analyzed using OpenData provided by the Bavarian Surveying and Mapping Authority (2022b). Actual land use and crops grown on the farmland were verified on site, with a special focus on the proportion of agriculture as it is the primary nutrient source. The distinction between different cultivation was used to narrow the emission risks down according to typical management practices (growing season, irrigation, fertilizer, pesticides).
Furthermore, settlements, commerce, and industry located in the watershed were considered. Information about WWTPs was collected from the Bavarian geoportal BayernAtlas (Bavarian Environment Agency, 2024a). As chemical post-treatment data was not freely available, direct assessment of individual WWTP's performance during flood events was not possible. Therefore, water sampling and analysis during these events were performed to assess the risks. Emissions from industrial and commercial dischargers cover a large potential input range. Direct dischargers were identified via BayernAtlas (Bavarian Environment Agency, 2024a). In a worst-case scenario, it was assumed that the dischargers only meet the requirements of the national wastewater ordinance. Each direct discharger in the watershed was considered separately to evaluate the associated risks.
To evaluate the potential contribution of infrastructure as a diffuse contamination source, we considered roads, railways, and similar structures within the study area. Road salt (primarily NaCl), commonly applied during frost periods to prevent icing, was assessed as a potential contributor to elevated sodium and chloride concentrations. Contaminants (metals, PAHs, chemical herbicides) occurring in railway track drainage were also included in the parameter set for the chemical analyses.
When considering the connection of river water to groundwater, the risks to groundwater quality must also be taken into account. This included identifying potential contamination sources such as landfills, mining activities, and other interventions in the subsurface. Additionally, hydrogeological conditions were considered, including groundwater coverage and the presence of subsurface structures that may reduce the natural filtration capacity of the soil, thereby increasing the risk of surface-derived contamination.
Based on data on the expected concentrations, the temporal patterns, and the distance to the river, contamination risks related to water reuse for MAR were assessed, and laboratory analyses were adjusted to ensure targeted monitoring of relevant contaminants.
3.2 River water monitoring kit
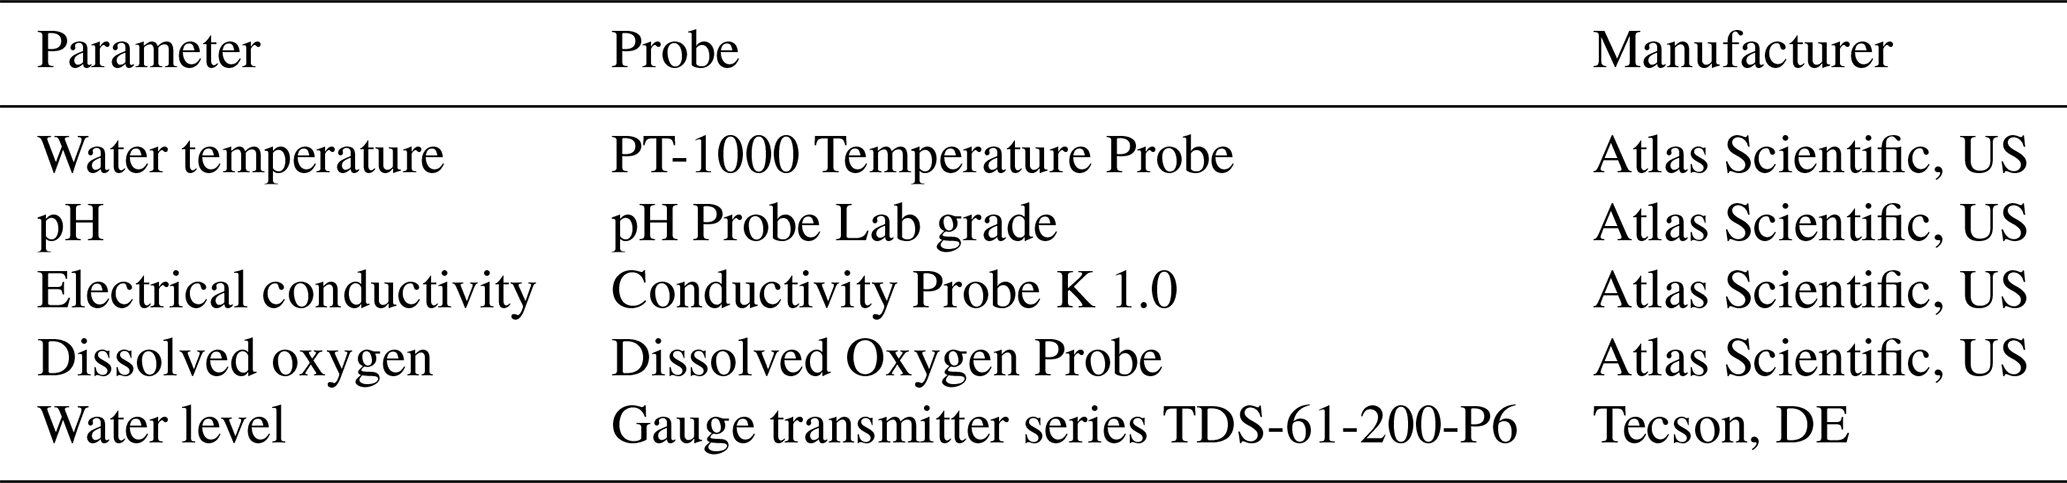
In order to monitor river water quality and quantity with a high temporal resolution, we designed and built a monitoring kit (Fig. 2). The enclosure contains a microcontroller (Raspberry Pi IO Board with Compute Module CM 4). Five probes, as listed in Table 1, were attached and programmed to measure every 10 min. The Atlas Scientific EZO™ class devices are connected via the Atlas Scientific Whitebox T3 and the respective circuit boards. For energy supply, a battery (12 V) and a solar panel (30 W, offgridtec, DE) were installed. The software was based on the I2C code provided by Atlas Scientific via GitHub (https://github.com/AtlasScientific/Raspberry-Pi-sample-code, last access: 13 October 2025, Atlas Scientific, 2023) and complemented by reading the pressure probe and transferring the data to a remote database using a LTE connection (1nce network). A detailed construction manual with links to all equipment used is provided on GitLab: https://gitlab.lrz.de/smart-sws/riverpi, last access: 13 October 2025.
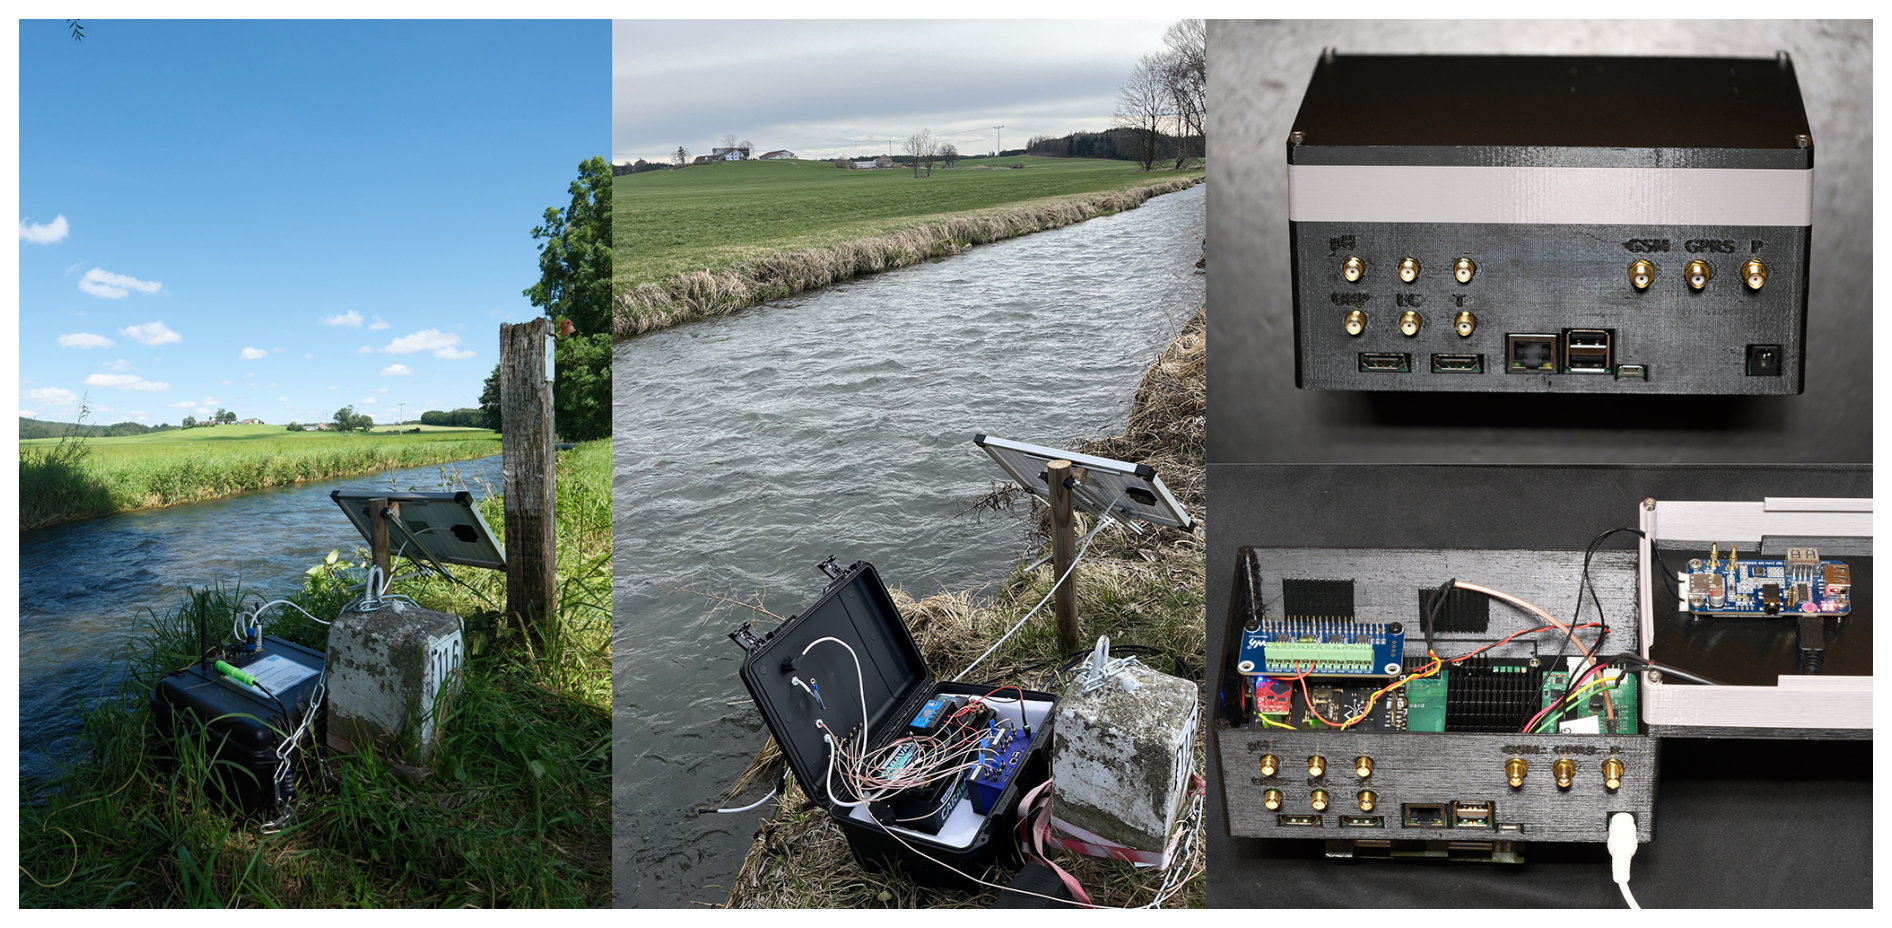
The measured water levels are linked to a discharge by defining a discharge curve. Therefore, manual velocity measurements were conducted with a dipping bar according to Jens (Hydro-Bios Kiel, DE). The discharge curve at the next upstream flood retention basin helped to compare and complement the curve. A radar sensor (Neptun, Sentinum, DE; provided by SPEKTER, DE) was installed in May 2024 for comparison and cross-validation of the water pressure sensor of the monitoring kit.
Water level measurements at upstream and downstream gauges were obtained from the public websites of the flood intelligence service Bavaria (Bavarian Environment Agency, 2024d). Precipitation, sunshine, and humidity data were downloaded from the German Weather Service (DWD) for the Günz catchment (DWD Climate Data Center, 2024) and clipped to the shape file of the delineated watershed. Within this watershed, the minimum, maximum, median, and sum of precipitation were determined at hourly intervals, which were then used for the correlation with river dynamics and precipitation event analyses. To better capture precipitation events spanning from one month to the next, data for contiguous precipitation events (separated by one or more days with precipitation < 0.1 mm) were evaluated instead of monthly statistics.
A time-lapse camera (BCC300M, Brinno, TW) was mounted at the monitoring station for visual feedback on the water level and apparent turbidity. The images were taken at 5-minute intervals and combined with a graphical representation of the rainfall intensity (cumulated for 5 minutes) into a video.
3.3 Water sampling
To connect water quality parameters to individual sources, we sampled the river at six points from the origin to the monitoring station three times in the monitoring period (April, May, and June 2024). Flow velocities were measured at each point as described above.
At the monitoring station, manual samples were taken at different flow conditions and times of the year to cover a broad spectrum of quality and quantity, resulting in 124 samples in total. Six times during the monitoring time, these samples were collected by an automatic sampler (Sigma 900, Hach, DE). It was added to the monitoring station, using the power supply of the kit and having the possibility to be remotely controlled by the microcontroller. The sampler was able to take up to 24 samples, each up to 575 mL, in programmable time intervals. Emissions from flooding were qualitatively monitored during the flood event in June 2024 using water samples before, during, and after the main flooding event. The focus was on inorganic and organic pollutants and the amount of particulate matter.
Groundwater was sampled in two adjacent wells, each three times (March/May 2023, April 2024, July 2024). Well 1 was located 710 m southeast of the monitoring station and had water levels of about 7.5 m below the wellhead. Well 2 was situated 630 m southwest of the station, with water levels at 9.0 m below wellhead. Continuous groundwater level data was publicly available for the permanent gauge Sontheim, which was used to compare with the river dynamics (Bavarian Environment Agency, 2025). The groundwater flow direction is northwest according to the hydrogeological map (Bavarian Environment Agency, 2024b).
3.4 Chemical analysis
On-site manual water chemistry monitoring was conducted with a portable multi-parameter device (ODEON, Aqualabo, FR) equipped with three digital sensors: oxygen (OPTOD), conductivity (C4E), and pH (PHEHT).
In the laboratory, the ion balance was assessed after filtration (syringe filters 0.22 µm, VWR International, DE) using ion chromatography. This was conducted with two Dionex ICS-1100 systems (Thermo Fisher Scientific, DE), which utilized Dionex IonPac™ AS9-HC and CS12A columns for anion and cation separation, respectively. Measurements were performed in triplicate and evaluated using seven to eight concentration standards (Merck KGaA, DE). The reported concentrations are the mean values of these triplicates. Analytical accuracy and reproducibility were ascertained with quality control samples and taken into account in the evaluation. Typical detection limits for each ion were as follows: Mg2+ = 0.082 mmol L−1, Ca2+ = 0.075 mmol L−1, Na+ = 0.043 mmol L−1, K+ = 0.013 mmol L−1, Cl− = 0.022 mmol L−1, = 0.016 mmol L−1, = 0.013 mmol L−1. Titration of bicarbonate () was done with the color-indicator methyl orange (until December 2023) or the Eco Titrator (Metrohm, DE) by adding hydrochloric acid (HCl) until the pH value of 4.3 was reached. The hydrochemical compositions were visualized with a Schoeller plot, where ion concentrations are plotted semi-logarithmic.
UV-Vis spectroscopy was performed with a Specord 50 Plus (Analytik Jena, DE). Each sample was measured twice after a reference measurement with ultrapure water. The signal is measured at 180° respective to the incident beam, and measurement inaccuracy is given with ± 0.01 in absorbance. Two sum parameters were determined: spectral absorption coefficients at 254 nm (SAC254) and at 550 nm expressed as turbidity in NTU. SAC254 is a measure for dissolved organic substances like humic substances and can be obtained in m−1 with Eq. (1):
where SAC(λ) is the spectral absorption coefficient (m−1) at the wavelength λ, A(λ) the absorbance of the water sample at the wavelength λ, d the optical path length of the cuvette (mm), and f a factor of 1000 (DIN 38404-3, 2005). For this measurement, the samples were filtered with 0.45 µm (syringe filters, TH. Geyer, DE). Turbidity is defined as the reduction in the transparency of a liquid caused by undissolved substances (DIN EN ISO 7027-1, 2016). Turbidity calibration was done with formazine standards of 100 NTU (Supelco, Sigma-Aldrich, Merck KGaA, DE). On the basis of the spectra obtained, a suitable wavelength of 550 nm was determined for the calibration, whereby the calibration line was generated from 5 standard solutions (100, 75, 50, 25, 5 NTU). The LOD was 3.1 NTU with this measurement setup.
Total suspended solids (TSS) in the river water samples were analyzed by filtration and subsequent weighing. A filter holder by Sartorius Stedim Biotech, DE, was used with 0.4 µm filters (Nuclepore 47 mm, Whatman, UK). Filtration was conducted in a laminar flow box (Spetec, DE). For weighing, a precision balance (ABP 200-5DM, KERN, DE) was utilized.
For a subset of samples, a detailed chemical analysis was done according to the parameters for the soil-groundwater impact pathway of the Federal Soil Protection Ordinance (BBodSchV, 2021) by WESSLING, DE. The samples were analyzed for heavy metals, volatile halogenated hydrocarbons (VHH), volatile aromatic hydrocarbons (VAH), polycyclic aromatic hydrocarbons (PAH), polychlorinated biphenyl (PCB), and further restricted substances (e.g., phenols). Additionally, selected water samples were analyzed for five artificial sweeteners (acesulfame K, cyclamate, saccharin, sucralose, aspartame) with LC-MS by WESSLING, DE (LOD: 0.025 µg L−1) and for 667 different pesticides (certified external lab) with GC-MS, LC-MS, and SPME-GC-MS.
4.1 Risk assessment of the watershed
The watershed of the monitoring station (Fig. 1b) incorporates an area of 75 km2. As for the whole eastern Günz catchment, the land use was dominated by agriculture (60 %) with mostly grassland (94 %) and some cropland (6 %) (Bavarian Surveying and Mapping Authority, 2022b). Livestock farming accounted for only a very small part of the grassland. In Bavaria, the Nature Conservation Act has been tightened to the effect that the widespread use of pesticides on permanent grassland has been prohibited since January 2022 as part of increased environmental protection measures (BayNatSchG, 2011). The main cultivated crop was maize, but there were also clover, cereals, and cup plants. Special crops such as hops, wine, or vegetables were not farmed. Although these fields were generally not irrigated, several herbicides were likely deployed during the cultivation period, which mainly lasted from April to August. Due to the crop diversity and the possibility of pesticide legacies, a large-scale pesticide analysis was required.
The watershed was crossed by a network of roads connecting the villages, although there were no roads of major importance. The largest town was Obergünzburg (population 6,700; Gemeindeverwaltung Markt Obergünzburg, 2024). A 6.7 km long double-track railroad line ran east-west in the south of the catchment area. Therefore, heavy metals, PAHs, and herbicides needed to be analyzed in order to assess the resulting risk from contaminated runoff.
Four WWTPs discharged in the Günz River in the watershed with population equivalents (PE) of 15 000, 400, 6000, and 4000 (Fig. 1b, listed from south to north). With an average of 150 L d−1 per PE, this summed up to a total wastewater volume of approx. 3 810 m3 d−1. At the MQ (1.9 m3 s−1), this corresponded to about 2 % of the total river water volume. The fraction of wastewater increased to 22 % at the lowest discharge measured during the reported period. While only the chemical (COD) and biochemical (BOD) oxygen demand was limited for WWTPs with PE < 5 000, larger plants must also comply with maximum concentrations for nitrogen (N) and phosphorus (P) under German law. Assuming the legally most unfavorable scenario, in which all four plants emit the maximum quantities, we would have a daily load of 359 g COD, 80 g BOD, 32 g N, and 5 g P (AbwV, 1997). Three of the facilities were built as activated sludge plants, which is the most common biological process (Zouboulis and Tolkou, 2014), while the smallest facility is an immersion rotary body reactor. None of the WWTPs in the watershed included quaternary treatment, which would further reduce micropollutants such as pharmaceutics. The partly discontinuous discharges arrived out of phase at the monitoring station due to different travel times.
A paper mill (Felix Schoeller Holding, DE) in the south of the catchment area was the only industrial direct discharger (Fig. 1b). The German ordinance stipulates the amount of suspended solids (50 mg L−1), BOD (25 mg L−1), N (20 mg L−1), and P (2 mg L−1), as well as production-related maximum fluxes of total organic carbon (TOC, 0.9 kg t−1 of product), COD (3 kg t−1), and adsorbable organic halides (AOX, 10 g t−1) for companies that produce paper, cardboard or cardboard packaging (AbwV, 1997). The company is located more than 20 m above the river and is not prone to flooding.
In this rural watershed, the cumulative effects of agricultural runoff and treated wastewater, in particular, can lead to increased nutrient levels in receiving waters. The main risks, therefore, come from agriculture, which can be assessed using nitrate and pesticides, and from WWTPs, where tracers such as artificial sweeteners can be used.
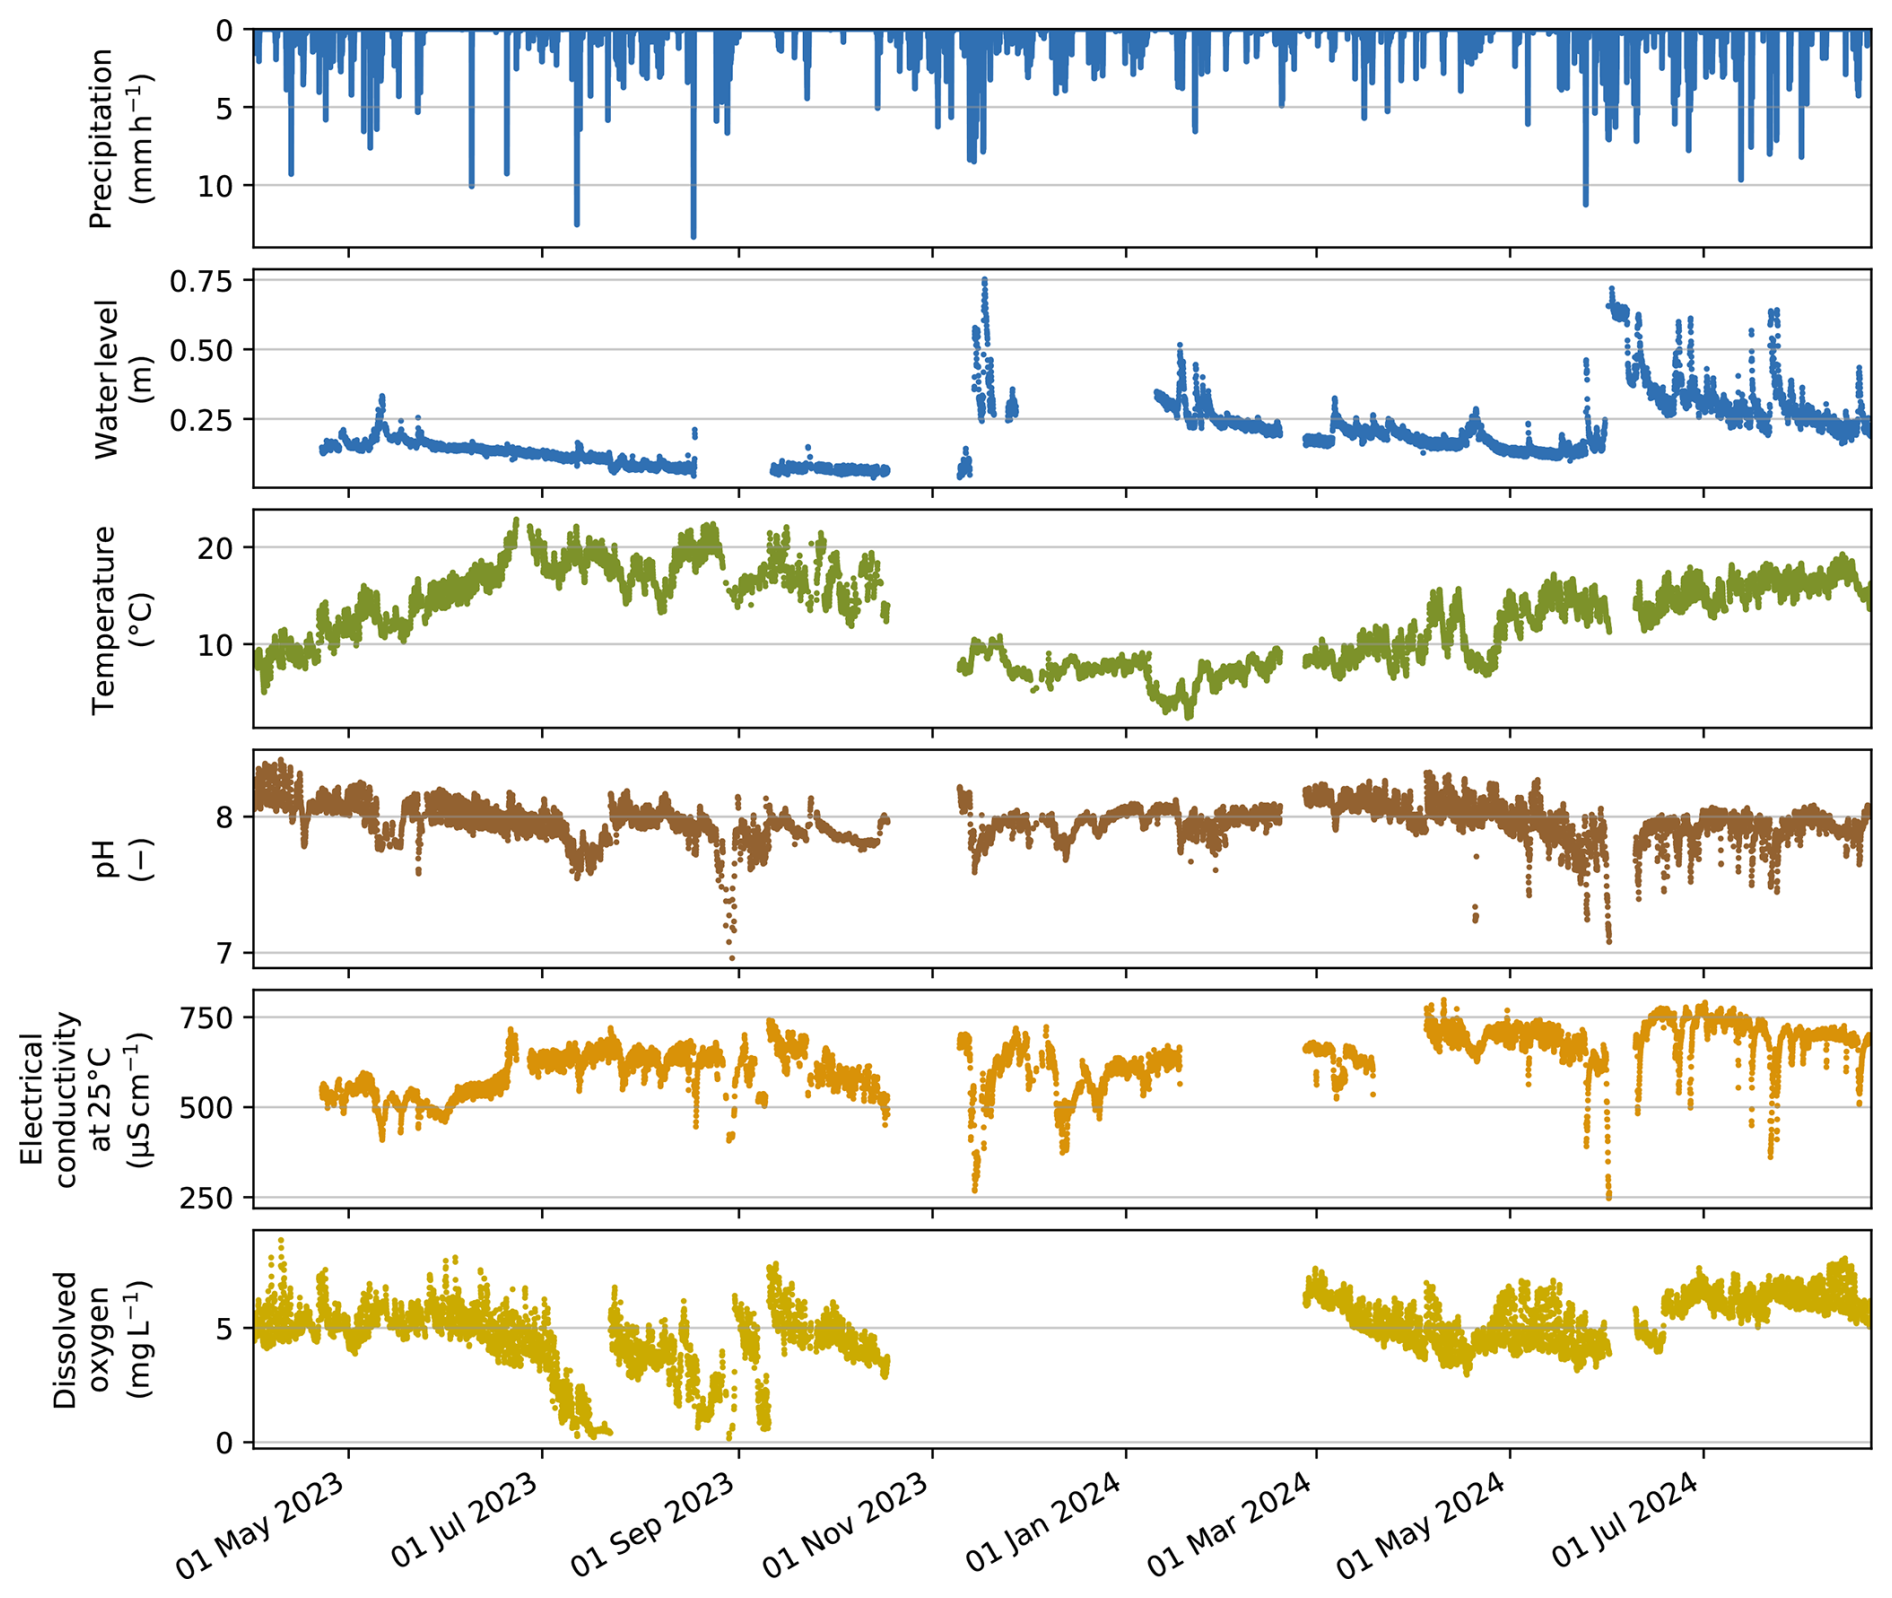
Figure 3Continuous measured data on water level, temperature, pH value, electrical conductivity, and dissolved oxygen, complemented with precipitation data (DWD Climate Data Center, 2024), from April 2023 to August 2024.
4.2 Quantity and quality of river water
Figure 3 shows the continuous measurements (every 10 min) of water level, temperature, electrical conductivity (EC), pH value, and dissolved oxygen (DO) at the monitoring station. Furthermore, hourly precipitation according to the measurements of the Climate Data Center (CDC) was determined for the watershed of the monitoring station and is plotted here (DWD Climate Data Center, 2024). The monitoring kit was in our laboratory for revisions, as measurements were temporarily interrupted starting from 18 October 2023 and from 18–26 February 2024. Due to moisture in the pressure compensation capillary, the pressure measurements for water levels were defective from 18 August to 11 September 2023 and from 27 November 2023 to 10 January 2024. DO measurements were erroneous from 9 November 2023 to 18 February 2024, and were excluded from the plot.
The largest precipitation event in the watershed, defined by the highest precipitation total in consecutive days, was in June 2024 with 212 mm in 8 d (a Vb cyclone (van Bebber, 1898), max. 7 mm h−1), followed by 194 mm in 13 d in November 2023, and 163 mm in 9 d in August 2023. Analogous, water levels were highest on average in June 2024, followed by December 2023, reflecting the fact that a significant proportion of the precipitation in November consisted of snow, which delayed the water level response. The slow flattening of the water level after December 2023 was caused by the snowmelt in the first half of 2024 and by the high precipitation events since June 2024. The analysis of precipitation amount in the 24 to 168 h prior to a rise in the water level showed no correlation. The dynamics of the water level changes were similar throughout the year, rendering the vegetation's influence or the seasons negligible. The groundwater level dynamics (Sontheim gauge) were almost identical to those of the river water levels. The flow velocity of the river at the monitored site was determined by superimposing the level measurements at the measuring point with the permanent gauge (12.4 km downstream) and the retention basin (8.6 km upstream) to approximately 1.8 m s−1. The discharge curve indicated a median discharge of 1.9 m3 s−1 with values from 0.2 to > 11.1 m3 s−1. Note that the discharge at the measuring station was valid up to a water level of 80 cm, above which the river left the riverbed.
The records of pH and EC showed quite similar patterns throughout the observation period. From June to October 2023, the DO probe recorded sharply declining values each over a few weeks at a time, which could not be explained by river water quality changes. Bio-fouling on the measuring device was suspected as the reason for this, which was remedied by copper gauze around the sensors on 18 October 2023 and thus confirmed.
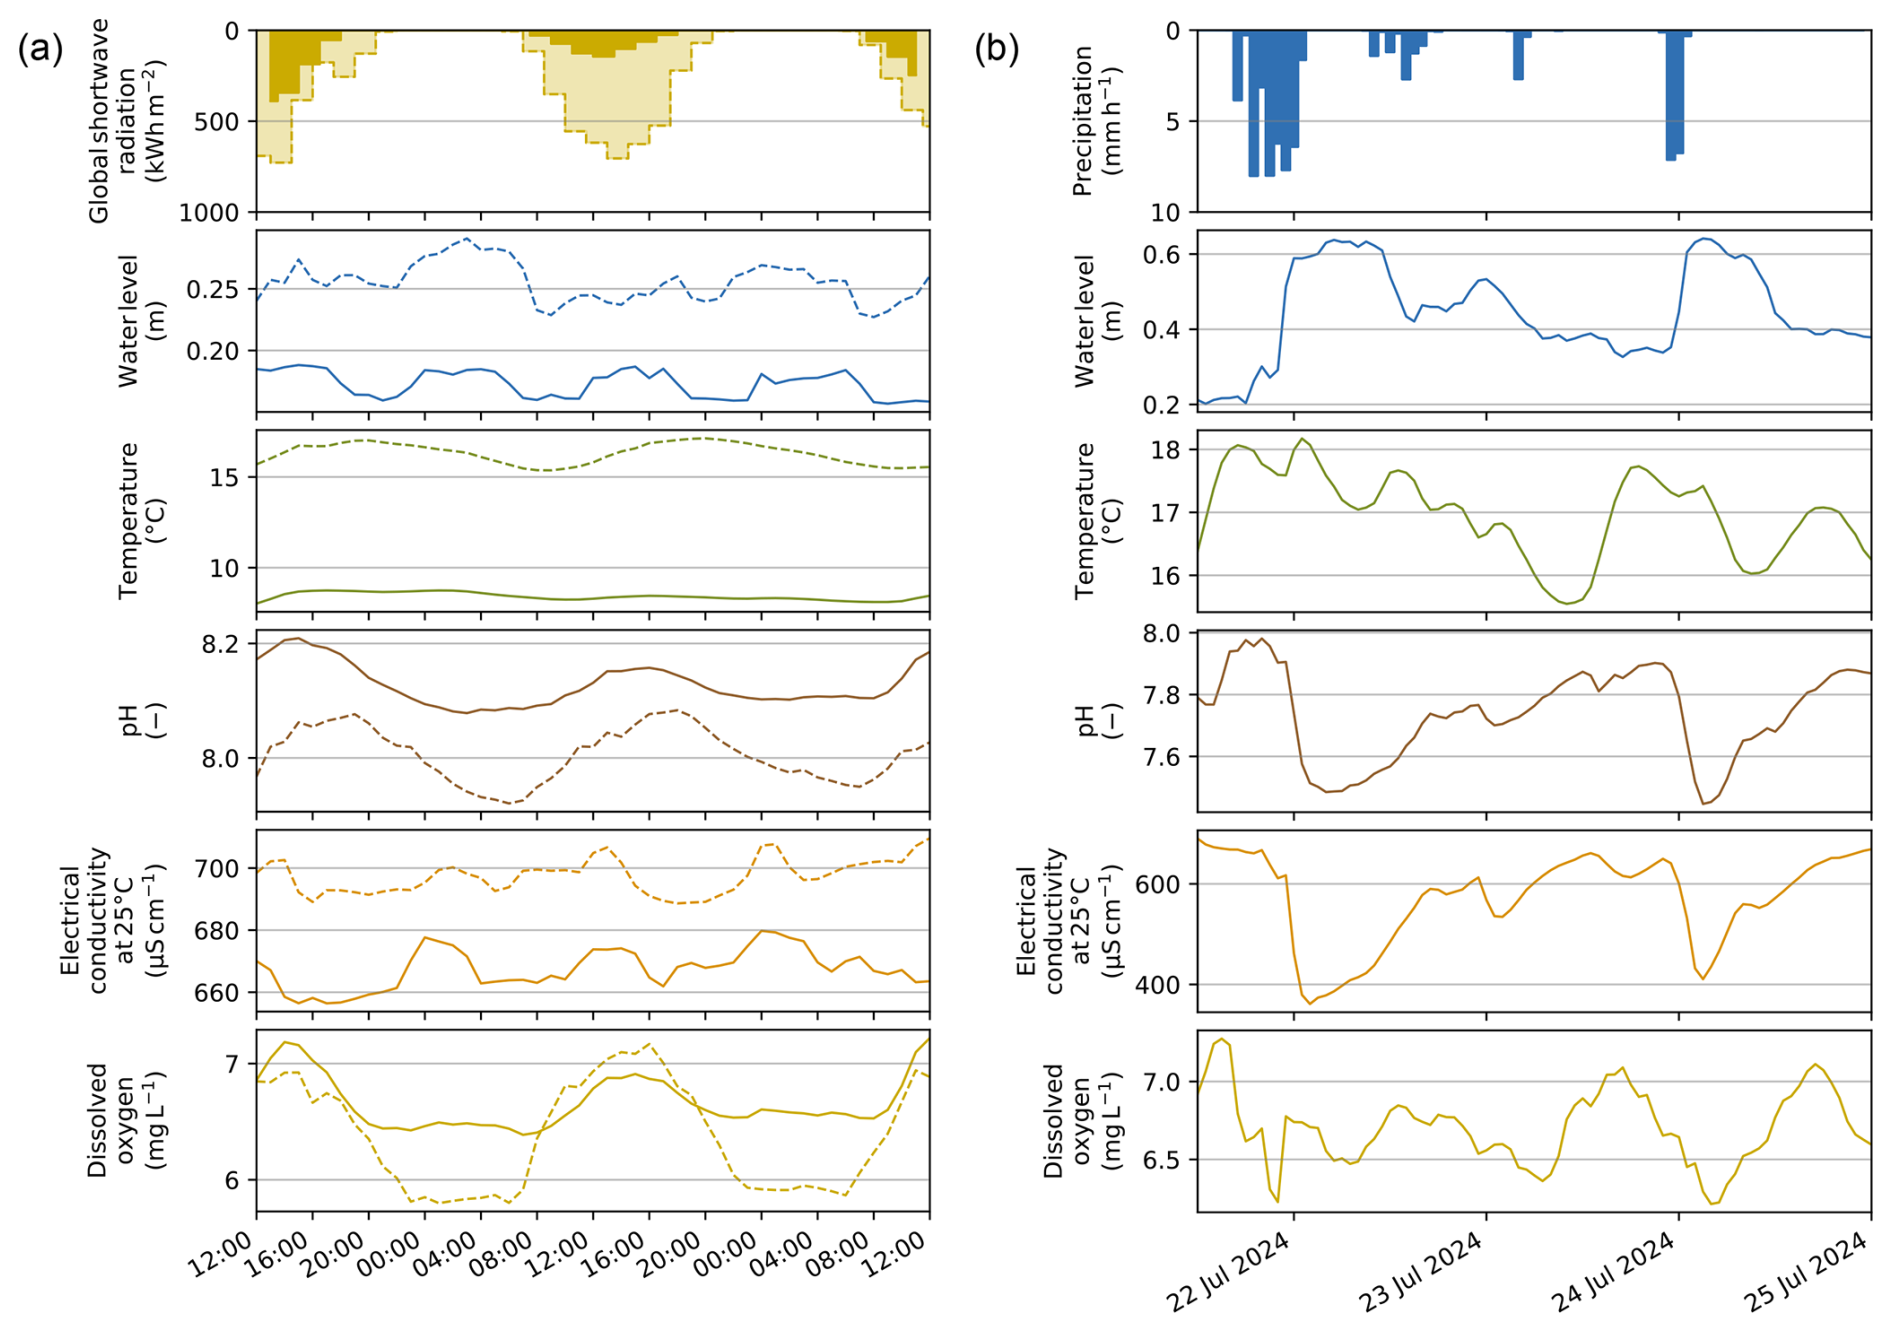
Figure 4Zoom on continuous measured data on water level, temperature, pH value, electrical conductivity, and dissolved oxygen, complemented with precipitation and radiation data (DWD Climate Data Center, 2024); (a) zoom on 48 h to visualize daily fluctuations for typical summer (dashed: 3–5 August 2024) and winter days (continuous: 27–29 February 2024); (b) zoom on flood event (3.5 d) in July 2024.
Zooms on the timeline in Fig. 3 are displayed in Fig. 4. From Fig. 4a, the daily fluctuations can be analyzed by zooming to 48 h, once in winter (27–29 February 2024) and once in summer (3–5 August 2024). As there was no precipitation in either period, the first subplot shows the short-wave global radiation at the location. While the weather was relatively dry in the days before the winter period, there was moderate precipitation in the days before the summer period, as is typical for these months. This is also reflected in the water level curve, with an average of 8 cm higher water levels in summer. The daily water level fluctuations originated from a small hydropower plant located about 10 km upstream of the monitoring station and were also used to calibrate the flow velocities of the river. In addition, irregular discharges from upstream WWTPs led to short-term slight increases in water levels. As the effect of photosynthesis was significantly higher in summer, the pH value was more dynamic than in winter. The absolute pH values cannot be directly compared due to a possible drift over the monitoring time. The increased EC value in summer was caused by the higher proportion of groundwater in the river, which resulted from the approximately 0.8 m higher groundwater level in July. The DO fluctuations matched the solar radiation well, which showed the effect of photosynthesis. Thus, the dynamics were higher in summer, as well.
In Fig. 4b, the effects of a flood event can be seen when zooming in on 21–24 July 2024, where 37 mm of precipitation fell on the first day. This led to an almost immediate rise in water levels. Such a rapid response of river dynamics to precipitation in the catchment was observed throughout the monitoring period. Simultaneously with the rise in water level, a decrease in pH and EC was measured, which can be attributed to the low mineralized rainwater (Stumm and Morgan, 1996). Ion analysis of water samples taken during several flood events showed reduced concentrations of all major ions. The fluctuations in DO during flooding were lower than the typical daily variations observed in summer, even after the event and under bright sunlight. Instead, they resembled the fluctuations typically seen in winter. This can be attributed to the high turbidity, which reduced the penetration depth of global radiation into the river water, thereby limiting photosynthetic activity and oxygen production. A second short but almost similarly intense rainfall during the night from 23–24 July 2024 showed analogous effects. Again, the water level remained high and reached a second maximum before dropping rapidly. This was attributed to groundwater flowing into the river after the heavy rainfall, which was consistent with the higher EC value but lower temperature. The biggest flood event in our monitoring period was on 1 June 2024. According to the permanent monitoring station downstream, the event has exceeded a 50-year flood (HF50) event (105 m3 s−1) in the morning hours with highest values measured of 108 m3 s−1 (Bavarian Environment Agency, 2024c). During the event, the water retention basin in Engetried (8.6 km upstream) was filled. Therefore, the water levels at the monitoring station remained almost constant at 0.64 m, reflecting the constant basin outflow of 10 m3 s−1 over 6 d until the basin was emptied.
The video recorded on 6 May 2024 (available at https://mediatum.ub.tum.de/1338693, last access: 10 February 2025) documents the evolution of water level and turbidity in the river during a thunderstorm event. Precipitation began at 14:10 in the upper catchment and reached the monitoring station at 15:40. By 16:00, the water level started to rise, and the river turned brown due to suspended material. This initial increase in water level and turbidity can be directly linked to intense precipitation in the immediate vicinity of the monitoring station. At 16:25, water levels remained elevated, but the brownish color faded. However, at 17:10, the river turned brown again despite an absence of local rainfall. This second turbidity increase, approximately three hours after the heavy rainfall in the upper catchment, corresponded to a flow velocity of roughly 2 m s−1, which was consistent with both measured and calculated values. Unlike the first event, the brownish color dissipated only gradually. No precipitation was recorded between 17:20 and 20:35.
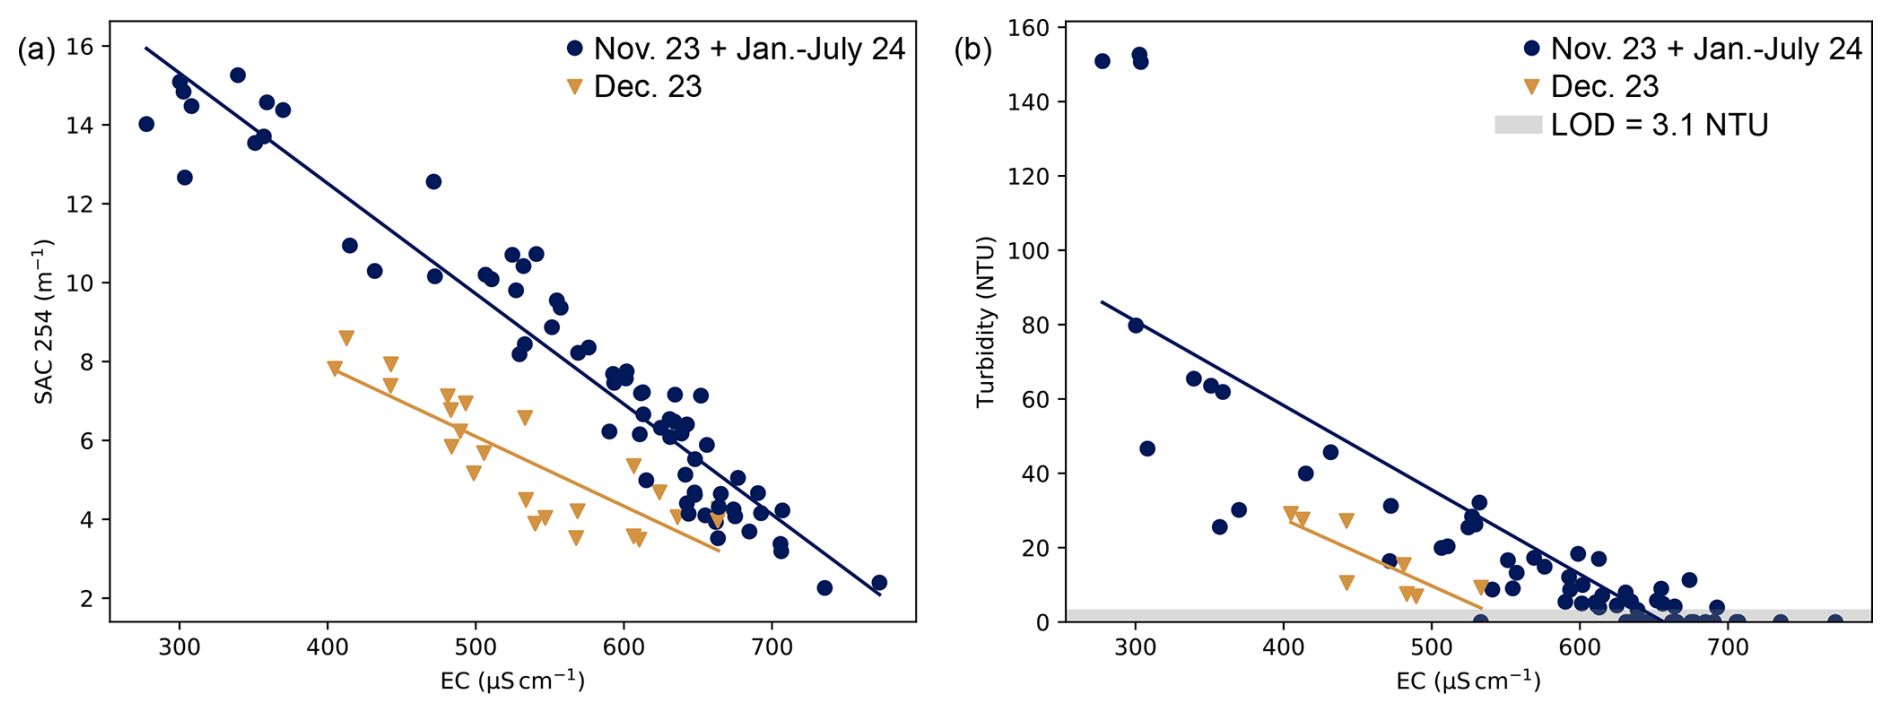
Figure 5a shows the correlation of SAC254 to EC. The SAC254 measurements showed more dissolved organic matter (DOM) at lower EC. This correlation resulted from organic matter input through land erosion during heavy precipitation. There was a significant difference between the samples from December 2023 (triangles, snow cover) and the samples obtained before and after the snowfall event (dots). At the same EC, samples from December showed generally lower SAC254. A linear least-squares fit of the data showed a slope of −0.028 and an intercept of 23.7 for the rain data (R2=0.92) and a slope of -0.018 and an intercept of 14.9 for the snow data (R2=0.71). The regression lines crossed the x-axis at 846 µS cm−1 and 829 µS cm−1, respectively. The EC of groundwater in the adjacent monitoring wells ranged between 630 and 860 µS cm−1 and a SAC254 below 2 m−1. These values aligned well with those observed on the far right side of the graph, suggesting that, during this period, the river was primarily supported by groundwater. The lower absolute slope and the smaller y-intercept of the regression line for the snowmelt samples indicated that water entering the river after snowmelt exhibited a lower SAC254 compared to water during and immediately after rain events. Seasonality did not appear to be a dominant factor in this catchment, as indicated by the rainfall data. Both regression models demonstrated robustness and could be used to assess the fraction of surface runoff contributing to river discharge, which reached up to 80 %.
We see a similar trend in Fig. 5b: Higher turbidity, indicating more suspended solids, at lower EC. Here, the linear least-squares fit of the data showed a slope of −0.227 and an intercept of 149.0 for the rain data (R2=0.68), and a slope of −0.180 and an intercept of 99.5 for the snow data (R2=0.64). Three points, all from consecutive measurements on the morning of 14 November 2023, showed greatly increased turbidity at low EC, which correlated with a steep rise in water level. When the water level rises in this way, a lot of suspended matter is stirred up. The timing of this event is also visible in Fig. 3. The points of December 2023 still stand out from the others, while not as pronounced. The snowmelt has diluted EC and turbidity almost evenly. In total, 97 % of the samples showed turbidities of less than 80 NTU with 38 % below the LOD of 3.1 NTU. Under normal conditions the measured turbidity was below 20 NTU (EC > 530 µS cm−1). The first flush effect, which brought higher turbidity, was also supported by TSS measurements. During the June flood event, TSS raised up to 44 mg L−1 after the first hours of higher precipitation (ca. 3 mm h−1). As the water level further increased and finally stayed roughly constant due to the restricted outflow of the upstream retention basin, TSS dropped to about 20 mg L−1. This can be attributed to fines settling in the retention basin. During median discharge, TSS was determined to be about 10 mg L−1.
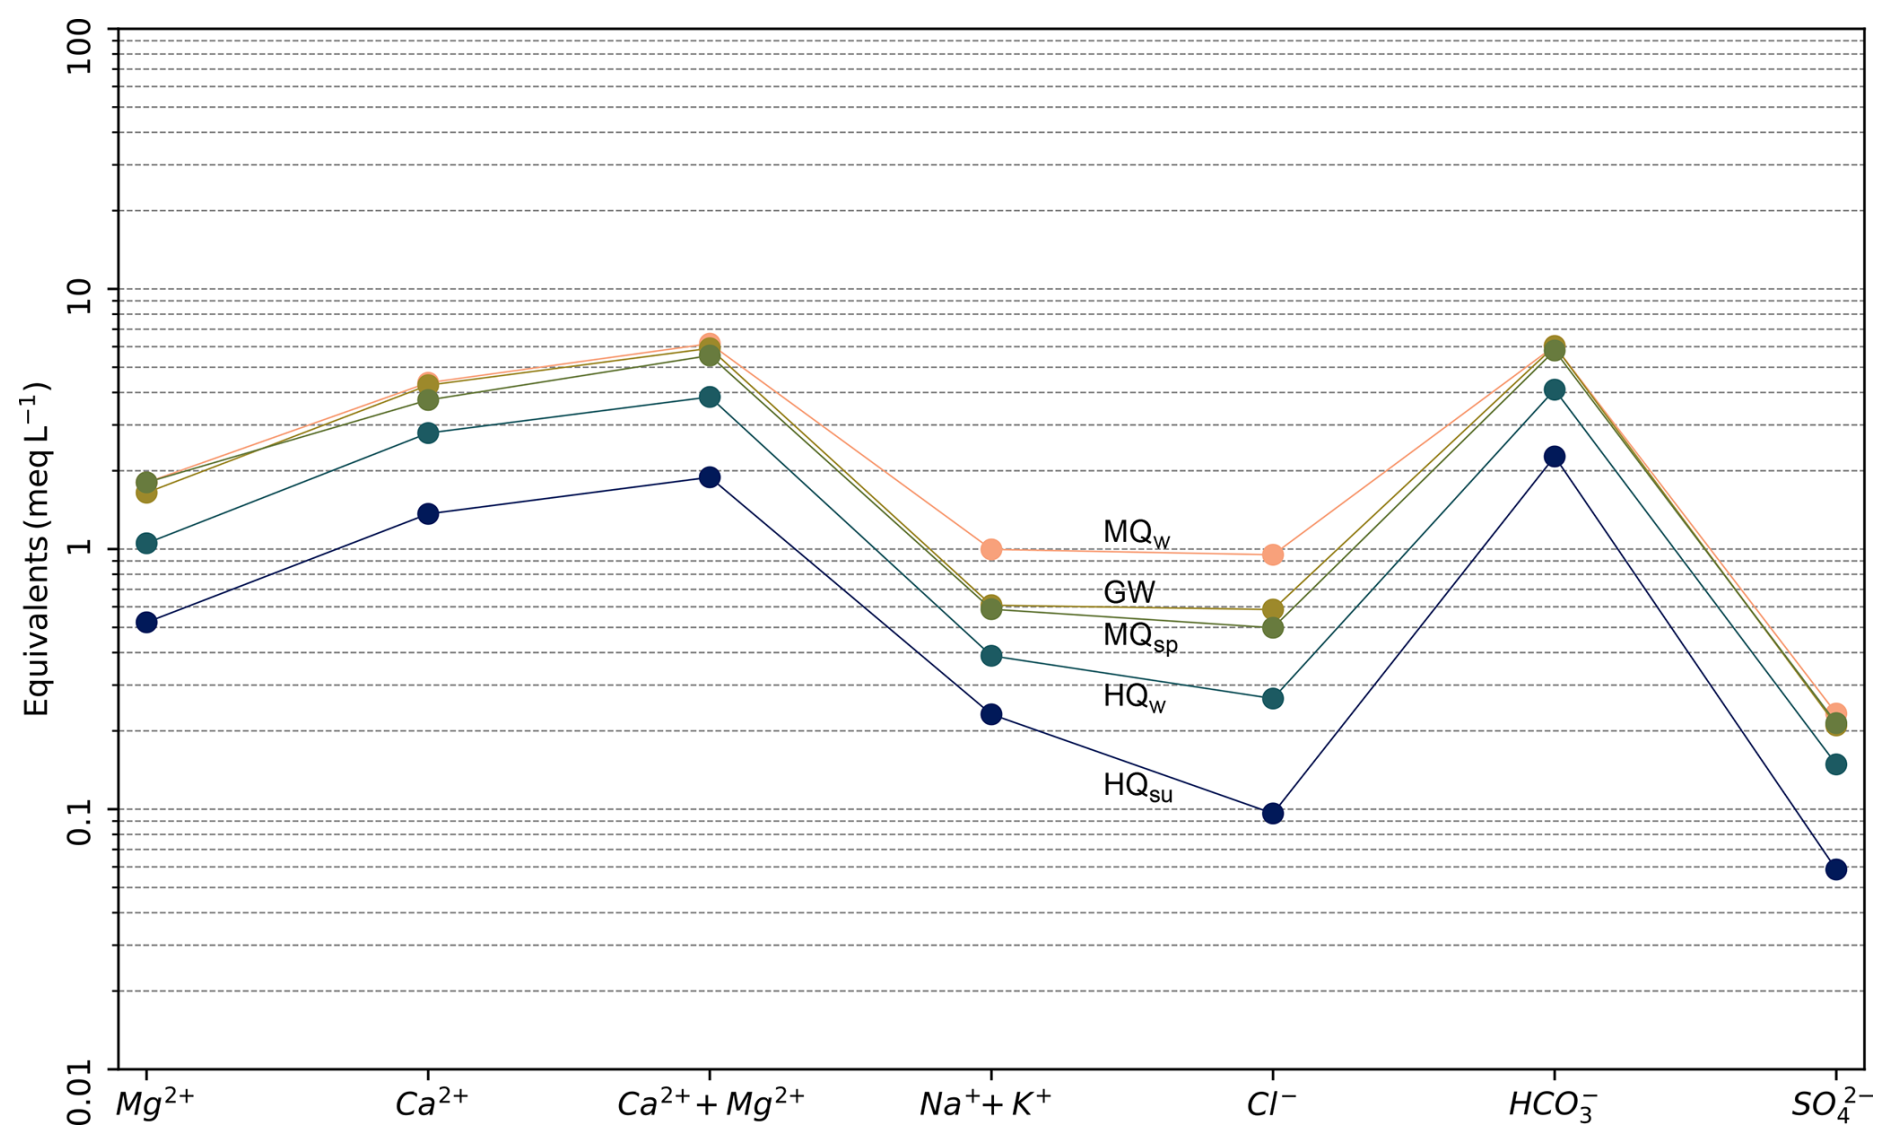
Figure 6Schoeller plot with major ion concentrations for five water samples: mean discharge in winter (7 December 2023, MQw), mean discharge in spring (4 April 2024, MQsp), high discharge in winter (7 November 2023, HQw), very high discharge in summer (1 June 2024, HQsu), and groundwater in well 1 (4 April 2024, GW).
Figure 6 shows major ion concentrations in meq L−1 for two samples taken during mean discharge, one in winter (7 December 2023, MQw) and one in spring (4 April 2024, MQsp), for a groundwater sample taken in well 1 (4 April 2024, GW), and for two samples at high flow rates in winter (7 November 2023, HQw) and summer (1 June 2024, HQsu). The highest values for Na+ and Cl− were measured for MQw, which could be attributed to the de-icing of roads with salt during this frost period. MQsp was representative of a large number of samples and was typical for carbonate aquifers. The high agreement between GW and MQsp indicates that the river was mainly supported by groundwater during this discharge regime. At high discharges (moderately high: HQw and extremely high: HQsu), the dilution and thus lower concentrations were clearly visible for all main ions, while the ratio remained more or less constant. The reduction in Ca2+ and Mg2+ also indicated the reduced groundwater influence during these events. During the monitoring period, no characteristic samples for dry discharge conditions could be collected. Groundwater samples were also taken from well 2 (not shown in Fig. 6). While the major ions were quite similar, significantly higher nitrate concentrations of up to 80 mg L−1 were measured there. As this could not be correlated with our watershed and the well is located downstream in relation to the groundwater flow direction, a separate underground watershed was assumed, and the measurements were not taken into further consideration. Yearly water chemistry fluctuations were observed for Na+ and Cl−, which significantly increased during the winter months due to road de-icing at the roads located partly directly on the river. In the frost season 2023, the concentration raised from 15 to 34 mg L−1 of chloride. Nitrate () concentrations were determined for 104 river water samples in the monitoring period. The median was 8.9 mg L−1 with a maximum of 11.3 mg L−1 (18 December 2023). No increase of during the growing season was measured. Furthermore, neither nitrate nor sodium chloride were found to accumulate. In the groundwater of well 1, similar concentrations as in the river were detected (6-14 mg L−1).
Three samples (September 2022, April 2023, June 2024) were analyzed to the parameters for the soil-groundwater impact pathway (BBodSchV, 2021). Two samples (April 2023 and June 2024) showed little concentrations of the element copper with 2.4 µg L−1 (April 2023) and 5.6 µg L−1 (June 2024). In one sample (April 2023), the PAH benzo(a)pyrene was detected with a concentration of 0.006 µg L−1. All other measurements showed concentrations below the detection limit.
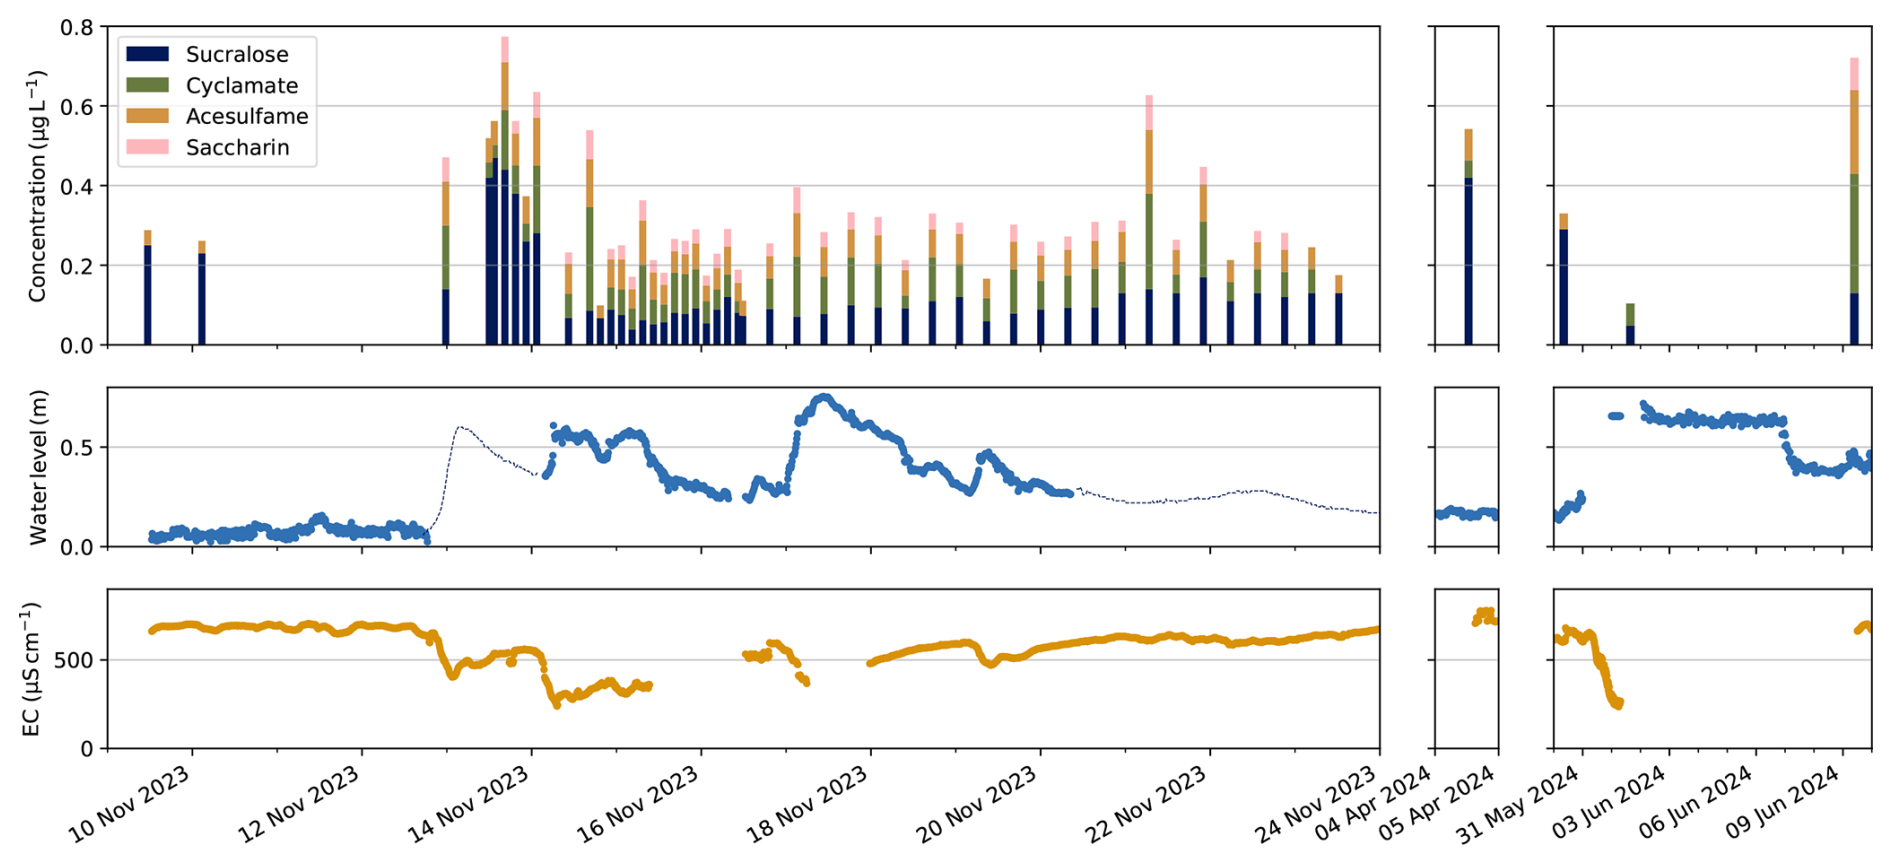
Figure 7Concentrations of four artificial sweeteners (sucralose, cyclamate, acesulfame, saccharin) over three periods (November 2023, April, and June 2024) plotted with the water level and EC measurements of the monitoring kit. In the periods in which no water level measurements were available from the monitoring kit, the timeline was supplemented with measurements from the Lauben gauge downstream (thin dashed line).
Figure 7 shows the determined concentrations of four artificial sweeteners (acesulfame K, cyclamate, saccharin, sucralose) together with the water level over time. Concentrations of the fifth analyzed sweetener, aspartame, were always below the LOD (0.025 µg L−1). Analyses were conducted mainly in November 2023, with some additional sampling in April and June 2024. Often, the highest concentrations (max. 0.47 µg L−1) were observed for sucralose, followed by cyclamate (max. 0.26 µg L−1). Acesulfame showed concentrations up to 0.21 µg L−1. The dynamics of cyclamate and acesulfame were quite similar, with cyclamate showing slightly greater fluctuations. Concentrations for saccharin were always below 0.1 µg L−1 (max. 0.087 µg L−1). No clear trend was observed in the sweetener concentrations with changing water levels. The relationship analysis between the concentrations and the time of measurement, as certain times of day can point to a discharger, also revealed no correlation. Therefore, the sweeteners could not be used as a quantitative indicator for the proportion of WWTPs. For most of the time, there was likewise no correlation between the EC and the sweetener concentrations. However, a similarly high dilution of the sweeteners was observed during the flood event in June, when the water retention basin upstream was filled.
The two surrounding groundwater wells were tested for pesticides in April 2024. While no pesticides were detected in well 2, well 1 revealed the insect-repellent diethyltoluamide (DEET, 0.23 µg L−1), which can be traced back to human use and is widespread in the environment (Merel and Snyder, 2016). Around the same time (April and May 2024), two samples of river water at average water levels were taken, which showed no concentrations above the detection limit of any pesticide. A third sample taken during a flood wave (1 June 2024) contained five pesticides: the herbicides dimethenamid1, which could be traced back to its application in maize fields (0.54 µg L−1), flufenacet (used as a precursor herbicide, 0.10 µg L−1), metolachlor2 (again originating from maize fields, 0.46 µg L−1), terbuthylazine (0.31 µg L−1), which might be tracked back to private ponds and industrial cooling systems, and the insect repellent diethyltoluamide (0.14 µg L−1) as in the groundwater well.
Following the river upstream in the watershed, the discharge increased depending on the morphology and inflowing streams. At medium water levels (4 April 2024), the discharge increased from 0.3 m3 s−1 1.6 km after the spring to 1.4 m3 s−1 at the monitoring station. The increase was related to tributaries and exfiltrating groundwater aquifers along the river. At the spring, slightly lower concentrations of the anthropogenically induced ions Na+, Cl−, and were measured. Shortly downstream, the influence of the only direct discharger in the catchment area, the paper industry, was evident in the concentrations of Na+ and . Further along the watershed, the water chemistry was homogeneous, matching the samples at the monitoring station. The turbidity correlated with the measured flow velocities, whereby the high turbulence downstream of the flood retention basin (Fig. 1) and the slowdown upstream were reproduced. The analysis of artificial sweeteners at six points in the watershed showed no clear trend but high dynamics. This indicated different treatment efficiencies at the WWTPs, while sucralose was generally worst eliminated. Furthermore, varying dilution proportions arose due to in-flowing streams and infiltrating groundwater along the watershed.
5.1 Monitoring kit
The designed monitoring set proved to be a cost-efficient and reliable instrument for continuous river water monitoring. Important advancements were to wrap the sensor holder with copper gauze to prevent biofouling and the installation of a bigger solar panel (100 W, offgridtec, DE) to bridge winter months. While we had some issues with very cheap pressure sensors (DC24V TL231, Fafeicy, CN) due to nonreliable air pressure compensation because of water entry, the Tecson pressure sensors proved to be stable. The comparison with the radar measurements generally showed a high level of agreement but with consistently more outliers in the radar, presumably due to turbulent water flow with small waves disturbing the reflection of the radar waves.
5.2 Water quality
The watershed screening revealed that the Günz River can be regarded as moderately modified in the section under consideration. The daily dynamics were dominated by a small hydropower plant with discontinuous operation (surge power plant). The flow regime during and after severe flooding events was controlled by the upstream retention basin, i.e., the peak discharge was limited while the basin was filling, and it remained high after the initial flooding and surface runoff until the basin went dry. The channelized sections through upstream villages further led to increasing flow velocities and faster responses to rain events. This was reflected in higher turbulence throughout the river and increased sediment transport at high water levels. During high flow, the turbidity increased and the EC decreased. While the former could be either the mobilization of fines from the riverbed or erosion by surface runoff, the latter, combined with the increase in SAC254, a proxy for organic matter concentrations, clearly pointed to surface runoff as the primary driver of turbidity in the river. The rapid decline in turbidity, despite sustained high water levels, suggested either that all mobilizable particles from the riverbed and banks had already been transported at the given flow velocity or that groundwater inflow was increasing. However, the latter is improbable, as accumulating surface runoff causes the river level to rise faster and higher than the surrounding aquifer, thereby restricting groundwater discharge into the river. A subsequent rise in turbidity at still-elevated water levels was unlikely due to riverbed sediment mobilization. Instead, the gradual decrease in turbidity indicated that the delayed increase was driven by surface runoff carrying elevated concentrations of fine particles. Some spikes showed turbidities of up to 153 NTU, which was still well below the maxima of 344 to 2200 NTU, which were measured during flood events at four rivers with relatively small catchments (100–150 km2) in southwestern Germany by Rügner et al. (2014). This can be attributed to the gentle slopes of the catchment, which are mostly forest and grassland, reducing the vulnerability to erosion. The threshold for turbidity in drinking water in Germany is 1 NTU (TrinkwV, 2023). The good correlation between EC and turbidity demonstrated that it is sufficient to measure EC continuously and add a turbidity calibration at different flow situations. This reduces the costs and complexity of the monitoring kit. Likewise, the correlation of SAC254 and EC could be used to calculate the proportion of surface runoff in the river discharge. Here, the type of precipitation (rain, snow) must be known. Both correlations are site-specific.
The water quality was shown to be anthropogenically influenced by agriculture, WWTPs, and a paper mill in the catchment area. In contrast to our expectations and literature data indicating that a lot of pollutant fluxes generally occur at high turbidity conditions related to storm events (e.g., Rügner et al., 2013; Müller et al., 2021), we did not observe a general increase of the concentrations. Instead, during flood events, all measurements clearly showed a dilution of water constituents. This was consistent with the structure of the regional sewer systems, which were predominantly designed as separate systems for surface water and wastewater. As a result, the risk of WWTP overloading and reduced treatment efficiency during high-flow conditions is minimized. The dilution also indicated that the mass flow into the river from other sources remains almost constant. As most of the pollutants were below the LOD, calculating the fluxes was not possible.
The only class of substances that did not follow the dilution pattern was pesticides, whose increasing concentrations showed that heavy rainfall during the growing season could mobilize significant concentrations from agricultural fields (sum of 1.55 µg L−1). The detected herbicides reflected the agricultural activities being mainly maize fields. The concentration threshold for pesticides according to the German Drinking Water Ordinance is 0.1 µg L−1 for individual ones, and 0.5 µg L−1 as the sum of all detected pesticides (TrinkwV, 2023). As the concentrations measured were three times as high, pre-treatment with suitable adsorption materials such as activated carbon is essential to reduce the concentrations to acceptable levels for infiltration. Contrary to expectations, no increase of during the growing season was observed. This could be due to the relatively small proportion of agricultural areas in the watershed (3 %) and high dispersion in the aquifer infiltrating the river, which compensated for annual variations.
For artificial sweeteners, no correlation with the discharge could be proven. However, lower concentrations were observed during flood events compared to low-flow conditions, highlighting the dilution effect of treated wastewater. Concentration fluctuations did not follow a distinct daily or weekly pattern, which would be expected if a single WWTP with constant discharge was the primary source, reflecting the emission pattern of artificial sweeteners at the end of the food chain. Instead, the catchment contains four WWTPs, resulting in overlapping discharge patterns due to varying travel times to the monitoring and sampling point. Although specific removal efficiencies for these WWTPs were not accessible, differences in treatment performance can be expected due to variations in technical standards at the time of their construction. Consequently, the emergence of a clear concentration pattern is unlikely. In any case, the flood event of June 2024 can be considered a worst-case scenario, and the observed dilution suggests that significantly higher pollution levels are improbable. In Germany, no thresholds for sweeteners are explicitly defined. According to the European River Memorandum, a limit value of 1 µg L−1 was suggested for microbially poorly degradable substances without known effects on biological systems for watercourses from which drinking water is obtained (IAWR et al., 2020). None of the measurements exceeded this concentration, but the concentrations for sucralose, cyclamate, and acesulfame were still not negligible as they added up to as high as 0.77 µg L−1 (13 November 2023). To further reduce the risks associated with inadequate removal in WWTPs, improved technologies, such as reactive barriers, have been shown to have the potential to increase removal efficiency (Valhondo et al., 2020). For nutrients discharged from WWTPs (especially N and P), the dilution factor was so high that they were not detectable and traceable at the monitoring site.
One single sample revealed the PAH benzo(a)pyrene (BaP). This highly toxic and carcinogenic substance is poorly soluble in water and, therefore, binds to organic material. It originates from combustion and has been detected in surface water as well as in air and soil (Bukowska et al., 2022; Boström et al., 2002). BaP has been shown to be formed in paper processing operations, which would fit with the paper mill in the watershed (e.g., Chalbot et al., 2006). With 6 ng L−1, the measured BaP concentration is below the limit value of 10 ng L−1 according to the German Drinking Water Ordinance (TrinkwV, 2023). Furthermore, the heavy metal copper was detected, but the values found were several hundred times below the drinking water threshold value of 2 mg L−1. These low concentrations indicate a less polluted area, while the many possible natural or anthropogenic sources make it challenging to clearly attribute the origin to a watershed characteristic.
5.3 Quantitative assessment of suitability for MAR
Based on river water monitoring as conducted in this work, the extent to which the water is suitable for MAR can be estimated. However, the basis of this use is the sufficient availability of water. Rivers require a certain flow for ecological functionality and biodiversity. Instead of defining this minimum flow as a constant threshold, an environmental flow, Yarnell et al. (2015) suggested retaining a functional flow regime. This share of the hydrograph must contain several peaks, e.g., at the beginning of the wet season and at the transition from the wet to dry season, whereby a large-magnitude peak, a low runoff during the dry season, and the interannual variability must be maintained. While the functional flow concept allows to analyze the amount of water retrospectively, projections on the amount of water available for MAR for future scenarios are difficult due to the lack of a sound reference case. Considering the flow dynamics observed during the monitoring period, with a median discharge of 1.9 m3 s−1, it appears feasible to divert at least 10 % of the flow. This would correspond to a water level reduction of only approx. 1.5 cm. Even a larger diversion fraction may be unlikely to have a significant impact on the overall flow dynamics; however, a more detailed investigation would be required to confirm this.
5.4 Qualitative assessment of suitability for MAR
According to the European Water Framework Directive (WFD), the quality and quantity of water bodies must be protected. Furthermore, the deterioration of surface and groundwater bodies is prohibited (WFD, 2000). Infiltration of water that is of better quality than the groundwater will improve the quality and quantity of the groundwater body, which is very much in line with the WFD principles. Some parameters at this site, such as turbidity and organic pollutants, must, therefore, be treated to prevent groundwater contamination, while others, such as nitrate, are already naturally lower in surface water and thus represent a qualitative improvement. The most critical parameter was identified to be turbidity - on the one hand, because of particle-associated contaminant fluxes and, on the other hand, because of the risk of clogging the treatment facility. Several studies found linear correlations between total suspended solids (TSS) and pollutants, like metals or PAH (e.g., Nasrabadi et al., 2018; Glaser et al., 2020a). The removal of solids must, therefore, be the first treatment stage if the infiltration of river water is also planned for high flow rates. Suitable adsorption materials can then further reduce the pollutant concentrations, whereby the resistance to clogging should still be taken into account.
5.5 Transferability and limitations
The methodology of this work is broadly transferable to other locations and is not limited to specific MAR systems but can be applied to various designs using river water as a source. However, we consider the rural–urban distinction and the size of the watershed as the main factors influencing its applicability. The catchment should not be too large, as the identification and assessment of potential risks must still be feasible on an individual basis. In urban areas, there are many other risks that need to be considered as demonstrated, e.g., by Song et al. (2019). Given the current lack of a clear legal framework for such plants in Germany, close cooperation with local authorities and extensive site-specific preliminary investigations are necessary before implementation of a MAR system.
As stated in the introduction, biological contamination poses a further risk when using river water for MAR (e.g., Baveye et al., 1998). Especially the increased transport of sediments and contaminants like nutrients can degrade microbiological water quality (e.g., Passerat et al., 2011; Garcia-Armisen and Servais, 2009; Droppo et al., 2009). This study focused on assessing dissolved inorganic and organic contaminants, while detailed (micro-)biological analyses were out of scope. MAR systems significantly impact ecosystem functions, especially those of the river and the groundwater. The assessment of changes to these functions by the proposed system should be an additional study.
The effects of climate change must furthermore be taken into account in the planning and operation of MAR systems to ensure their sustainability. On the one side, adaptation approaches like MAR are essential to balance the effects of a changing climate, which comes with increased frequency and intensity of water extremes. In addition, water demand is projected to increase for irrigation (Bernhardt et al., 2022) as well as for domestic use, causing declining groundwater levels (Wunsch et al., 2022). On the other hand, climate change has an impact on water quality, e.g., through higher water temperatures that promote eutrophication, through altered flow regimes that change sediment transport, and through further pollution caused by anthropogenic activities.
MAR with river water presents a highly valuable strategy to adapt to the imbalance of the landscape water regime. This, however, requires a deeper understanding of quality and quantity dynamics in rivers, which is often limited by data availability and quality. Conventional analytical methods are too slow for real-time decision support, making it crucial to ensure water quality in advance. A key step is risk-based watershed screening, followed by identifying a reduced set of parameters that reliably indicate water quality and can be continuously monitored on-site to provide timely, actionable insights.
In the rural Günz watershed, which stands representative for a larger number of pre-alpine catchments, the primary anthropogenic risks to river water quality were identified as pesticides from maize cultivation and pollutants from WWTP discharges. During flood events, a dilution effect was observed for nearly all water constituents. Nevertheless, freshly applied pesticides were washed out during heavy rainfall and showed increasing concentrations downstream of agricultural fields. Surface runoff was identified as the primary driver of turbidity in the river, which strongly increased in the case of high flow events. Turbidity reflected the soil properties in the catchment and was influenced by upstream water retention, snowmelt, and groundwater inflows. From a technical perspective, the high particle load poses a challenge due to the risk of clogging the infiltration system. However, removing fine particles also eliminates contaminants bound to these solids. Therefore, the proportion of fine particles was identified as the most urgent parameter to address for safe water reuse.
Artificial sweeteners showed no correlation with discharge or EC at the monitoring station due to varying source concentrations, different travel times, removal efficiencies, and discontinuous effluent discharges. Therefore, sweetener concentrations could not serve as a quantitative indicator for the proportion treated wastewater.
We conclude that water from the Günz River would be a suitable source for MAR. Regarding the technical design of the MAR system, the treatment unit has to be able to remove fines and must have adsorption materials that can cope with hydrophilic organic pollutants. Combinations of MAR with flood protection measures, such as retention basins, benefit from the settling of sediments in the retention basins after extreme flow conditions. This work provides a foundation for future MAR implementations and research, particularly in addressing microbiological risks and extending the applicability of the framework to more urbanized regions. The insights gained contribute to optimizing MAR implementation and enhancing water resource resilience in similar catchment systems.
For the river water monitoring kit, the source code, and detailed information on hardware used in this work are available on GitLab: https://gitlab.lrz.de/smart-sws/riverpi, last access: 13 October 2025. Collected data from the monitoring kit and the video footage are available at https://mediatum.ub.tum.de/1338693, last access: 10 February 2025.
LA: Conceptualization, Data curation, Formal analysis, Investigation, Methodology, Software, Validation, Visualization, Writing – original draft, and Writing – review and editing. TB: Conceptualization, Data curation, Formal analysis, Investigation, Funding acquisition, Methodology, Project administration, Resources, Software, Supervision, Validation, and Writing – review and editing.
The contact author has declared that neither of the authors has any competing interests.
Publisher's note: Copernicus Publications remains neutral with regard to jurisdictional claims made in the text, published maps, institutional affiliations, or any other geographical representation in this paper. While Copernicus Publications makes every effort to include appropriate place names, the final responsibility lies with the authors. Also, please note that this paper has not received English language copy-editing. Views expressed in the text are those of the authors and do not necessarily reflect the views of the publisher.
We want to thank J. Obel, Chair of Hydrogeology at the Technical University of Munich, for conducting laboratory analyses using ion chromatography. Furthermore, many thanks to the WESSLING team for conducting our detailed chemical analysis, as well as to our colleagues from the pesticide lab. The scientific color map batlow by Crameri (2023) was used in Figs. 1a, 6, and 7. ChatGPT-4o mini was used to improve python plot codes and sentence structure.
This research has been supported by the Federal Ministry of Research, Technology and Space (grant no. 02WEE1630A).
This paper was edited by Uwe Ulbrich and reviewed by three anonymous referees.
AbwV: Abwasserverordnung [Ordinance on Requirements for the Discharge of Wastewater into Waters] (Federal Law Gazette 2024 I No. 132), https://www.gesetze-im-internet.de/abwv/AbwV.pdf (last access: 13 October 2025), 1997. a, b, c
Arnell, N. W. and Gosling, S. N.: The impacts of climate change on river flood risk at the global scale, Climatic Change, 134, 387–401, https://doi.org/10.1007/s10584-014-1084-5, 2016. a
Atlas Scientific: Raspberry-Pi-sample-code, GitHub [code], https://github.com/AtlasScientific/Raspberry-Pi-sample-code (last access: 13 October 2025), 2023. a
Bartak, R., Grischek, T., and Hoche, D.: MAR with Untreated River Water: Clogging of Basins and Coliform Removal Rates, Journal of Hydrologic Engineering, 20, https://doi.org/10.1061/(ASCE)HE.1943-5584.0000980, 2015. a
Bartos, M., Smith, T. J., itati01, Debbout, R., Kraft, P., and Huard, D.: Pysheds, Zenodo [data set], https://doi.org/10.5281/zenodo.7942819, 2023. a, b
Basu, N. B., Destouni, G., Jawitz, J. W., Thompson, S. E., Loukinova, N. V., Darracq, A., Zanardo, S., Yaeger, M., Sivapalan, M., Rinaldo, A., and Rao, P. S. C.: Nutrient loads exported from managed catchments reveal emergent biogeochemical stationarity, Geophysical Research Letters, 37, https://doi.org/10.1029/2010GL045168, 2010. a
Bates, B., Kundzewicz, Z. W., Wu, S., and Palutikof, J., eds.: Climate Change and Water: Technical Paper of the Intergovernmental Panel on Climate Change, IPCC Secretariat, Geneva, ISBN 978-92-9169-123-4, 2008. a
Bavarian Environment Agency: Bach- und Flussgebiete: Tabelle Fließgewässer in Bayern [data set], https://www.lfu.bayern.de/wasser/gewaesserverzeichnisse/bf_gebiete/index.htm (last access: 13 October 2025), 2016. a
Bavarian Environment Agency: Bayerisches Klimainformationssystem (BayKIS): Klimatool der Zukunft [data set], https://klimainformationssystem.bayern.de/klimatool/klima-der-zukunft (last access: 13 October 2025), 2023a. a
Bavarian Environment Agency: Digitale Geologische Karte von Bayern 1 : 25 000 [data set], https://www.lfu.bayern.de/geologie/geo_karten_schriften/dgk25_uab/index.htm (last access: 13 October 2025), 2023b. a
Bavarian Environment Agency: UmweltAtlas Bayern [data set], https://www.umweltatlas.bayern.de (last access: 13 October 2025), 2023c. a
Bavarian Environment Agency: BayernAtlas: Abwasserbehandlungsanlagen [data set], https://geoportal.bayern.de/bayernatlas/ (last access: 13 October 2025), 2024a. a, b
Bavarian Environment Agency: Hydrogeologische Karte 1:100 000 [data set], https://www.lfu.bayern.de/geologie/hydrogeologie_karten_daten/hk100/index.htm (last access: 13 October 2025), 2024b. a
Bavarian Environment Agency: Gewässerkundlicher Dienst Bayern: Lauben/Günz [data set], https://www.gkd.bayern.de/de/fluesse/wasserstand/bayern/lauben-11582300 (last access: 13 October 2025), 2024c. a, b
Bavarian Environment Agency: Hochwassernachrichtendienst Bayern (Flood intelligence service Bavaria) [data set], https://www.hnd.bayern.de (last access: 13 October 2025), 2024d. a
Bavarian Environment Agency: Gewässerkundlicher Dienst Bayern: Sontheim 3/06 [data set], https://www.gkd.bayern.de/de/grundwasser/oberesstockwerk/iller_lech/sontheim-3-06-133030 (last access: 13 October 2025), 2025. a, b
Bavarian Surveying and Mapping Authority: OpenData: Digitales Geländemodell 1m (DGM1) [data set], https://geodaten.bayern.de/opengeodata/OpenDataDetail.html?pn=dgm1 (last access: 13 October 2025), 2022a. a
Bavarian Surveying and Mapping Authority: OpenData: ALKIS°-Tatsächliche Nutzung (TN) [data set], https://geodaten.bayern.de/opengeodata/OpenDataDetail.html?pn=tatsaechlichenutzung (last access: 13 October 2025), 2022b. a, b, c, d
Baveye, P., Vandevivere, P., Hoyle, B. L., DeLeo, P. C., and de Lozada, D. S.: Environmental Impact and Mechanisms of the Biological Clogging of Saturated Soils and Aquifer Materials, Critical Reviews in Environmental Science and Technology, 28, 123–191, https://doi.org/10.1080/10643389891254197, 1998. a, b
BayNatSchG: Gesetz über den Schutz der Natur, die Pflege der Landschaft und die Erholung in der freien Natur, GVBl. p. 82 BayRS 791-1-U, https://www.gesetze-bayern.de/Content/Document/BayNatSchG (last access: 13 October 2025), 2011. a
BBodSchV: Bundes-Bodenschutz- und Altlastenverordnung, Federal Law Gazette I p. 2598, 2716, https://www.gesetze-im-internet.de/bbodschv_2023/BBodSchV.pdf (last access: 13 October 2025), 2021. a, b
Beck, H. E., McVicar, T. R., Vergopolan, N., Berg, A., Lutsko, N. J., Dufour, A., Zeng, Z., Jiang, X., van Dijk, A. I. J. M., and Miralles, D. G.: High-resolution (1 km) Köppen-Geiger maps for 1901-2099 based on constrained CMIP6 projections, Scientific Data, 10, 724, https://doi.org/10.1038/s41597-023-02549-6, 2023. a
Bernhardt, J. J., Rolfes, L., Henseler, M., and Kreins, P.: Quantification of regional irrigation demands for agriculture in Bavaria, Johann Heinrich von Thünen-Institut, https://doi.org/10.3220/PB1659520516000, 2022. a
Best, J.: Anthropogenic stresses on the world's big rivers, Nature Geoscience, 12, 7–21, https://doi.org/10.1038/s41561-018-0262-x, 2019. a
Best, J. and Darby, S. E.: The Pace of Human-Induced Change in Large Rivers: Stresses, Resilience, and Vulnerability to Extreme Events, One Earth, 2, 510–514, https://doi.org/10.1016/j.oneear.2020.05.021, 2020. a, b
Bieroza, M., Acharya, S., Benisch, J., ter Borg, R. N., Hallberg, L., Negri, C., Pruitt, A., Pucher, M., Saavedra, F., Staniszewska, K., Van't Veen, S. G. M., Vincent, A., Winter, C., Basu, N. B., Jarvie, H. P., and Kirchner, J. W.: Advances in Catchment Science, Hydrochemistry, and Aquatic Ecology Enabled by High-Frequency Water Quality Measurements, Environmental Science & Technology, 57, 4701–4719, https://doi.org/10.1021/acs.est.2c07798, 2023. a
Boström, C.-E., Gerde, P., Hanberg, A., Jernström, B., Johansson, C., Kyrklund, T., Rannug, A., Törnqvist, M., Victorin, K., and Westerholm, R.: Cancer risk assessment, indicators, and guidelines for polycyclic aromatic hydrocarbons in the ambient air, Environmental Health Perspectives, 110 Suppl. 3, 451–488, https://doi.org/10.1289/ehp.110-1241197, 2002. a
Briffa, J., Sinagra, E., and Blundell, R.: Heavy metal pollution in the environment and their toxicological effects on humans, Heliyon, 6, e04691, https://doi.org/10.1016/j.heliyon.2020.e04691, 2020. a
Bukowska, B., Mokra, K., and Michałowicz, J.: Benzoapyrene-Environmental Occurrence, Human Exposure, and Mechanisms of Toxicity, International Journal of Molecular Sciences, 23, https://doi.org/10.3390/ijms23116348, 2022. a
Burkhardt, M., Rossi, L., and Boller, M.: Diffuse release of environmental hazards by railways, Desalination, 226, 106–113, https://doi.org/10.1016/j.desal.2007.02.102, 2008. a
Carpenter, S. R., Caraco, N. F., Correll, D. L., Howarth, R. W., Sharpley, A. N., and Smith, V. H.: Nonpoint Pollution of Surface Waters with Phosphorus and Nitrogen, Ecological Applications, 8, 559–568, https://doi.org/10.1890/1051-0761(1998)008[0559:NPOSWW]2.0.CO;2, 1998. a
Cerejeira, M. J., Viana, P., Batista, S., Pereira, T., Silva, E., Valério, M. J., Silva, A., Ferreira, M., and Silva-Fernandes, A. M.: Pesticides in Portuguese surface and ground waters, Water research, 37, 1055–1063, https://doi.org/10.1016/S0043-1354(01)00462-6, 2003. a
Chalbot, M.-C., Vei, I., Lykoudis, S., and Kavouras, I. G.: Particulate polycyclic aromatic hydrocarbons and n-alkanes in recycled paper processing operations, Journal of Hazardous Materials, 137, 742–751, https://doi.org/10.1016/j.jhazmat.2006.04.003, 2006. a
Crameri, F.: Scientific colour maps, Zenodo [data set], https://doi.org/10.5281/zenodo.8409685, 2023. a
Dillon, P., Stuyfzand, P., Grischek, T., Lluria, M., Pyne, R. D. G., Jain, R. C., Bear, J., Schwarz, J., Wang, W., Fernandez, E., Stefan, C., Pettenati, M., van der Gun, J., Sprenger, C., Massmann, G., Scanlon, B. R., Xanke, J., Jokela, P., Zheng, Y., Rossetto, R., Shamrukh, M., Pavelic, P., Murray, E., Ross, A., Bonilla Valverde, J. P., Palma Nava, A., Ansems, N., Posavec, K., Ha, K., Martin, R., and Sapiano, M.: Sixty years of global progress in managed aquifer recharge, Hydrogeology Journal, 27, 1–30, https://doi.org/10.1007/s10040-018-1841-z, 2019. a
DIN 38404-3: German standard methods for the examination of water, waste water and sludge – Physical and physical-chemical parameters (group C) – Part 3: Determination of absorption in the range of the ultraviolet radiation, Spectral absorptions coefficient (C3), https://doi.org/10.31030/9634006, 2005. a
DIN EN ISO 7027-1: Water quality – Determination of turbidity - Part 1: Quantitative methods, https://doi.org/10.31030/2399299, 2016. a
Droppo, I. G., Liss, S. N., Williams, D., Nelson, T., Jaskot, C., and Trapp, B.: Dynamic existence of waterborne pathogens within river sediment compartments. Implications for water quality regulatory affairs, Environmental Science & Technology, 43, 1737–1743, https://doi.org/10.1021/es802321w, 2009. a
DWD Climate Data Center: Recent hourly RADOLAN grids of precipitation depth (binary) [data set], https://opendata.dwd.de/climate_environment/CDC/grids_germany/hourly/radolan/recent/bin/ (last access: 13 October 2025), 2024. a, b, c, d
Ebeling, P., Kumar, R., Lutz, S. R., Nguyen, T., Sarrazin, F., Weber, M., Büttner, O., Attinger, S., and Musolff, A.: QUADICA: water QUAlity, DIscharge and Catchment Attributes for large-sample studies in Germany, Earth System Science Data, 14, 3715–3741, https://doi.org/10.5194/essd-14-3715-2022, 2022. a
European Environment Agency: European waters: Assessment of status and pressures 2018, https://doi.org/10.2800/303664, 2018. a
Fröhlich, H. L., Breuer, L., Frede, H.-G., Huisman, J. A., and Vaché, K. B.: Water source characterization through spatiotemporal patterns of major, minor and trace element stream concentrations in a complex, mesoscale German catchment, Hydrological Processes, 22, 2028–2043, https://doi.org/10.1002/hyp.6804, 2008. a
Garcia-Armisen, T. and Servais, P.: Partitioning and Fate of Particle-Associated E. coli in River Waters, Water Environment Research, 81, 21–28, https://doi.org/10.2175/106143008x304613, 2009. a
Gemeindeverwaltung Markt Obergünzburg: Ortsvorstellung Obergünzburg, https://www.oberguenzburg.de/kultur-und-tourismus/ortsvorstellung-oberguenzburg (last access: 13 October 2025), 2024. a
Glaser, C., Zarfl, C., Rügner, H., Lewis, A., and Schwientek, M.: Analyzing Particle-Associated Pollutant Transport to Identify In-Stream Sediment Processes during a High Flow Event, Water, 12, 1794, https://doi.org/10.3390/w12061794, 2020a. a
Glaser, C., Zarfl, C., Werneburg, M., Böckmann, M., Zwiener, C., and Schwientek, M.: Temporal and spatial variable in-stream attenuation of selected pharmaceuticals, Science of the Total Environment, 741, 139 514, https://doi.org/10.1016/j.scitotenv.2020.139514, 2020b. a
Huber, A., Bach, M., and Frede, H. G.: Pollution of surface waters with pesticides in Germany: modeling non-point source inputs, Agriculture, Ecosystems & Environment, 80, 191–204, https://doi.org/10.1016/S0167-8809(00)00145-6, 2000. a
IAWR, AWBR, ARW, RIWA-Rijn, IAWD, AWE, AWWR, RIWA-Meuse, and RIWA-Scheldt: European River Memorandum for Quality Assurance of Drinking Water Production, https://www.awwr.de/fileadmin/awwr_de/content/download/european_river_memorandum_2020_en.pdf (last access: 13 October 2025), 2020. a
IGRAC: MAR Portal, https://ggis.un-igrac.org/view/marportal (last access: 13 October 2025), 2020. a
Jasechko, S., Seybold, H., Perrone, D., Fan, Y., Shamsudduha, M., Taylor, R. G., Fallatah, O., and Kirchner, J. W.: Rapid groundwater decline and some cases of recovery in aquifers globally, Nature, 625, 715–721, https://doi.org/10.1038/s41586-023-06879-8, 2024. a
Konstantinou, I. K., Hela, D. G., and Albanis, T. A.: The status of pesticide pollution in surface waters (rivers and lakes) of Greece: Part I: Review on occurrence and levels, Environmental Pollution, 141, 555–570, https://doi.org/10.1016/j.envpol.2005.07.024, 2006. a
Lange, F. T., Scheurer, M., and Brauch, H.-J.: Artificial sweeteners–a recently recognized class of emerging environmental contaminants: a review, Analytical and Bioanalytical Chemistry, 403, 2503–2518, https://doi.org/10.1007/s00216-012-5892-z, 2012. a
Lippera, M. C., Werban, U., Rossetto, R., and Vienken, T.: Understanding and predicting physical clogging at managed aquifer recharge systems: A field-based modeling approach, Advances in Water Resources, 177, 104462, https://doi.org/10.1016/j.advwatres.2023.104462, 2023. a
Ma, S., Song, Y., Ye, X., Du, X., and Ma, J.: Clogging and Water Quality Change Effects of Typical Metal Pollutants under Intermittent Managed Aquifer Recharge Using Urban Stormwater, International Journal of Environmental Research and Public Health, 18, https://doi.org/10.3390/ijerph182413272, 2021. a
Merel, S. and Snyder, S. A.: Critical assessment of the ubiquitous occurrence and fate of the insect repellent N,N-diethyl-m-toluamide in water, Environment International, 96, 98–117, https://doi.org/10.1016/j.envint.2016.09.004, 2016. a
Müller, M. E., Werneburg, M., Glaser, C., Schwientek, M., Zarfl, C., Escher, B. I., and Zwiener, C.: Influence of Emission Sources and Tributaries on the Spatial and Temporal Patterns of Micropollutant Mixtures and Associated Effects in a Small River, Environmental Toxicology and Chemistry, 39, 1382–1391, https://doi.org/10.1002/etc.4726, 2020. a
Müller, M. E., Zwiener, C., and Escher, B. I.: Storm Event-Driven Occurrence and Transport of Dissolved and Sorbed Organic Micropollutants and Associated Effects in the Ammer River, Southwestern Germany, Environmental Toxicology and Chemistry, 40, 88–99, https://doi.org/10.1002/etc.4910, 2021. a
Nasrabadi, T., Ruegner, H., Schwientek, M., Bennett, J., Fazel Valipour, S., and Grathwohl, P.: Bulk metal concentrations versus total suspended solids in rivers: Time-invariant & catchment-specific relationships, PloS one, 13, e0191314, https://doi.org/10.1371/journal.pone.0191314, 2018. a
Neale, P. A., Braun, G., Brack, W., Carmona, E., Gunold, R., König, M., Krauss, M., Liebmann, L., Liess, M., Link, M., Schäfer, R. B., Schlichting, R., Schreiner, V. C., Schulze, T., Vormeier, P., Weisner, O., and Escher, B. I.: Assessing the Mixture Effects in In Vitro Bioassays of Chemicals Occurring in Small Agricultural Streams during Rain Events, Environmental Science & Technology, 54, 8280–8290, https://doi.org/10.1021/acs.est.0c02235, 2020. a
Oppenheimer, J., Eaton, A., Badruzzaman, M., Haghani, A. W., and Jacangelo, J. G.: Occurrence and suitability of sucralose as an indicator compound of wastewater loading to surface waters in urbanized regions, Water Research, 45, 4019–4027, https://doi.org/10.1016/j.watres.2011.05.014, 2011. a
Passerat, J., Ouattara, N. K., Mouchel, J.-M., Rocher, V., and Servais, P.: Impact of an intense combined sewer overflow event on the microbiological water quality of the Seine River, Water Research, 45, 893–903, https://doi.org/10.1016/j.watres.2010.09.024, 2011. a
Patel, M., Kumar, R., Kishor, K., Mlsna, T., Pittman, C. U., and Mohan, D.: Pharmaceuticals of Emerging Concern in Aquatic Systems: Chemistry, Occurrence, Effects, and Removal Methods, Chemical Reviews, 119, 3510–3673, https://doi.org/10.1021/acs.chemrev.8b00299, 2019. a
Rügner, H., Schwientek, M., Beckingham, B., Kuch, B., and Grathwohl, P.: Turbidity as a proxy for total suspended solids (TSS) and particle facilitated pollutant transport in catchments, Environmental Earth Sciences, 69, 373–380, https://doi.org/10.1007/s12665-013-2307-1, 2013. a
Rügner, H., Schwientek, M., Egner, M., and Grathwohl, P.: Monitoring of event-based mobilization of hydrophobic pollutants in rivers: calibration of turbidity as a proxy for particle facilitated transport in field and laboratory, Science of the Total Environment, 490, 191–198, https://doi.org/10.1016/j.scitotenv.2014.04.110, 2014. a
Saavedra, F., Musolff, A., von Freyberg, J., Merz, R., Knöller, K., Müller, C., Brunner, M., and Tarasova, L.: Winter post-droughts amplify extreme nitrate concentrations in German rivers, Environmental Research Letters, 19, 024007, https://doi.org/10.1088/1748-9326/ad19ed, 2024. a
Scheurer, M., Storck, F. R., Graf, C., Brauch, H.-J., Ruck, W., Lev, O., and Lange, F. T.: Correlation of six anthropogenic markers in wastewater, surface water, bank filtrate, and soil aquifer treatment, Journal of Environmental Monitoring, 13, 966–973, https://doi.org/10.1039/c0em00701c, 2011. a, b
Smith, V. H.: Eutrophication of freshwater and coastal marine ecosystems: a global problem, Environmental Science and Pollution Research International, 10, 126–139, https://doi.org/10.1065/espr2002.12.142, 2003. a
Song, Y., Du, X., and Ye, X.: Analysis of Potential Risks Associated with Urban Stormwater Quality for Managed Aquifer Recharge, International Journal of Environmental Research and Public Health, 16, https://doi.org/10.3390/ijerph16173121, 2019. a, b
Stumm, W. and Morgan, J. J.: Aquatic chemistry: Chemical equilibria and rates in natural waters, A Wiley-Interscience publication, John Wiley & Sons Inc, New York and Chichester and Brisbane and Toronto and Singapore, third Edn., ISBN 9780471511847, 1996. a
TrinkwEGV: Verordnung über Einzugsgebiete von Entnahmestellen für die Trinkwassergewinnung (Federal Law Gazette 2023 I No. 346), https://www.gesetze-im-internet.de/trinkwegv/TrinkwEGV.pdf (last access: 13 October 2025), 2023. a
TrinkwV: Trinkwasserverordnung [Ordinance on the Quality of Water Intended for Human Consumption], Federal Law Gazette 2023 I No. 159, https://www.gesetze-im-internet.de/englisch_trinkwv/englisch_trinkwv.pdf (last access: 13 October 2025), 2023. a, b, c
Valhondo, C., Martínez-Landa, L., Carrera, J., Díaz-Cruz, S. M., Amalfitano, S., and Levantesi, C.: Six artificial recharge pilot replicates to gain insight into water quality enhancement processes, Chemosphere, 240, 124826, https://doi.org/10.1016/j.chemosphere.2019.124826, 2020. a
van Bebber, W. J.: Die Wettervorhersage: Eine gemeinverständliche praktische Anleitung zur Wettervorhersage auf Grundlage der Zeitungs-Wetterkarten und Zeitungs-Wetterberichte : für alle Berufsarten, Enke, https://books.google.de/books?hl=de&lr=&id=02TzQ4VqZCQC (last access: 13 October 2025), 1898. a
Verlicchi, P., Al Aukidy, M., and Zambello, E.: Occurrence of pharmaceutical compounds in urban wastewater: removal, mass load and environmental risk after a secondary treatment – a review, Science of the Total Environment, 429, 123–155, https://doi.org/10.1016/j.scitotenv.2012.04.028, 2012. a
Vitousek, P. M., Aber, J. D., Howarth, R. W., Likens, G. E., Matson, P. A., Schindler, D. W., Schlesinger, W. H., and Tilman, D. G.: Human Alteration of the Global Nitrogen Cycle: Sources and Consequences, Ecological Applications, 7, 737–750, https://doi.org/10.1890/1051-0761(1997)007[0737:HAOTGN]2.0.CO;2, 1997. a
Water Board Kempten: Hochwasserschutz Günztal, https://www.wwa-ke.bayern.de/projekte/hws_guenztal (last access: 13 October 2025), 2024. a
Werner, B. J., Musolff, A., Lechtenfeld, O. J., de Rooij, G. H., Oosterwoud, M. R., and Fleckenstein, J. H.: High-frequency measurements explain quantity and quality of dissolved organic carbon mobilization in a headwater catchment, Biogeosciences, 16, 4497–4516, https://doi.org/10.5194/bg-16-4497-2019, 2019. a
WFD: Directive 2000/60/EC of the European Parliament and of the Council of 23 October 2000 establishing a framework for Community action in the field of water policy (Water Framework Directive), https://eur-lex.europa.eu/eli/dir/2000/60/oj (last access: 13 October 2025), 2000. a
Whitehead, P. G., Wilby, R. L., Battarbee, R. W., Kernan, M., and Wade, A. J.: A review of the potential impacts of climate change on surface water quality, Hydrological Sciences Journal, 54, 101–123, https://doi.org/10.1623/hysj.54.1.101, 2009. a
Wijesiri, B. and Goonetilleke, A.: Urban Water Quality, in: Urban Stormwater and Flood Management, edited by: Jegatheesan, V., Applied Environmental Science and Engineering for a Sustainable Future Ser, 49–68, Springer, Cham, ISBN 978-3-030-11817-4, https://doi.org/10.1007/978-3-030-11818-1_3, 2019. a
World Health Organization: Guidelines for drinking-water quality, ISBN 978-92-4-004506-4, 2022. a
Wunsch, A., Liesch, T., and Broda, S.: Deep learning shows declining groundwater levels in Germany until 2100 due to climate change, Nature Communications, 13, 1221, https://doi.org/10.1038/s41467-022-28770-2, 2022. a
Yarnell, S. M., Petts, G. E., Schmidt, J. C., Whipple, A. A., Beller, E. E., Dahm, C. N., Goodwin, P., and Viers, J. H.: Functional Flows in Modified Riverscapes: Hydrographs, Habitats and Opportunities, BioScience, 65, 963–972, https://doi.org/10.1093/biosci/biv102, 2015. a
Zaidi, M., Ahfir, N.-D., Alem, A., El Mansouri, B., Wang, H., Taibi, S., Duchemin, B., and Merzouk, A.: Assessment of clogging of managed aquifer recharge in a semi-arid region, Science of The Total Environment, 730, 139107, https://doi.org/10.1016/j.scitotenv.2020.139107, 2020. a
Zouboulis, A. and Tolkou, A.: Effect of Climate Change in Wastewater Treatment Plants: Reviewing the Problems and Solutions, in: Managing Water Resources under Climate Uncertainty, edited by: Shrestha, S., Anal, A. K., Salam, P. A., and van der Valk, M., Springer Water, 197–220, Springer-Verlag, ISBN 978-3-319-10466-9, https://doi.org/10.1007/978-3-319-10467-6_10, 2014. a