the Creative Commons Attribution 4.0 License.
the Creative Commons Attribution 4.0 License.
 | 17 Sep 2025
Monitoring agricultural and economic drought: the Australian Agricultural Drought Indicators (AADI)
Donald Gaydon
Mihir Gupta
Andrew Schepen
Peter Tan
Geoffrey Brent
Andrew Turner
Sean Bellew
Wei Ying Soh
Christopher Sharman
Peter Taylor
John Carter
Dorine Bruget
Zvi Hochman
Ross Searle
Yong Song
Patrick Mitchell
Yacob Beletse
Dean Holzworth
Laura Guillory
Connor Brodie
Jonathon McComb
Ramneek Singh
Drought events can have significant agricultural and economic impacts, and in many parts of the world their intensity appears to be increasing with climate change. However, drought measurement remains a highly contested space, with a multitude of indicators across both research and operational settings. This article presents a new drought monitoring and forecasting system: the Australian Agricultural Drought Indicators (AADI). Rather than use common meteorological indicators, AADI attempts to estimate specific agricultural and economic drought impacts. An integrated bio-physical and economic modelling system is developed, which translates gridded climate observations and forecasts into outcome-based indicators of crop yields, pasture growth and farm business profits. These indicators are validated against a range of ground-truth data drawn from survey and administrative sources. Results confirm the benefits of the outcome-based approach with the AADI showing higher correlation with both agricultural (crop yield, fodder demand) and economic outcomes (farm profits, regional incomes) compared with rainfall measures. The novel farm profit indicator also shows promise as a predictor of drought-induced financial stress and flow-on socio-economic impacts.
- Article
(9452 KB) - Full-text XML
- BibTeX
- EndNote


It is widely accepted that a universal definition of drought is, if not impossible, highly impractical (Wilhite and Glantz, 1985; Mishra and Singh, 2010; Lloyd-Hughes, 2014). Rather, drought is usually viewed in terms of its specific impacts: “agricultural drought” (e.g. crop failure or pasture loss), “hydrological drought” (e.g. low streamflow or dam storage) or “economic drought” (e.g. reduced farm profits, income or jobs) (Wilhite and Glantz, 1985). While these impacts are all somewhat dependent on rainfall deficit (i.e. “meteorological drought”), each is the product of unique bio-physical and human processes, and as such they are imperfectly correlated with each other.
As a result, a multitude of drought indicators have emerged both in the research literature and among operational systems, although, as Bachmair et al. (2016) note, “often with little consideration of which are most meaningful for describing drought impacts”. Validation of new indicators against ground-truth data is not common, with research often limited to indicator–indicator comparisons (Bachmair et al., 2016). Further, the selection of indicators for operational systems often reflects pragmatic factors (such as data availability and common practice) more than systematic assessment (Bachmair et al., 2016).
Among operational systems there has been a trend towards composite or weighted average indicators, typically referred to as “combined drought indicators” (CDIs). Examples include the US Drought Monitor, the European Drought Observatory (see Cammalleri et al., 2021), and in Australia the NACP Drought Monitor (Guillory et al., 2023) and the NSW Enhanced Drought Information System (EDIS). However, the design and interpretation of composite indicators remain somewhat subjective, and systematic validation is uncommon (Bachmair et al., 2016).
This study presents a new operational drought measurement and forecasting system: the Australian Agricultural Drought Indicators (AADI). This system measures agricultural drought impacts via an integrated bio-physical and economic modelling system. AADI combines existing models including APSIM (Holzworth et al., 2014) to simulate crop yields and AussieGRASS (Carter et al., 2000) and GrassGro (Moore et al., 1997) to simulate pasture growth, with these outputs then linked to the farmpredict model (Hughes et al., 2022b) to simulate farm business profits. These models form an operational system, which translates gridded climate observations and forecasts into outcome-based indicators, including winter and summer crop yields, pasture growth, and farm profits.
While the AADI approach differs from most comparable systems, the concept of outcome-based drought indicators is not a new one. In Australia, historical reliance on rainfall percentiles as drought indicators (Gibbs and Maher, 1967) has long been criticized given limited correlation with agricultural and economic outcomes in practice (Wilhite and Glantz, 1985; Hughes et al., 2022a). Economists have frequently argued drought indicators should be developed consistently with policy goals (i.e. economic drought programmes should be informed by economic indicators; see Thompson and Powell, 1998; Nelson et al., 2007; Hughes et al., 2022a).1 While current operational systems mostly use meteorological indicators (Bachmair et al., 2016), outcome-based measures are not without precedent,2 and further within the research literature, crop yield indicators are relatively common (see Stephens, 1998; Diodato and Bellocchi, 2008).
More novel is the inclusion in AADI of a farm profit indicator, as proposed by Hughes et al. (2022a). Here the farmpredict model is used to simulate sequences of farm profits based on climatic and bio-physical (crop and pasture growth) inputs for representative farms at each location. While AADI does not employ a CDI as such, the farm profit indicator performs a similar role, integrating a diverse range of metrological and agricultural data into a single value. In contrast with a CDI, farm profit has a clear conceptual basis and can also be easily validated against real-world data.
In Australia, drought indicators have historically been associated with agricultural subsidy programmes, leading to a decline in their popularity (see Hughes et al., 2024). This is despite a long-term shift in Australian drought policy away from short-term relief towards preparedness and resilience, more or less in line with the recommendations of the research community (see Freebairn, 1983; Botterill and Hayes, 2012; Wilhite et al., 2014). The 2018–2020 Australian drought events led to a re-evaluation however, with subsequent inquiries recognizing the value of indicators in supporting preparedness and encouraging proactive responses from government (see Commonwealth of Australia, 2021). AADI has been developed to complement this more modern policy focus, acting as a drought early warning system in the sense of Wilhite et al. (2014), albeit with an emphasis on government users (see Hughes et al., 2024).
Forecasting aspects of AADI, including estimates of forecast skill at various lead times, are presented in a separate article (Schepen et al., 2025). In the present article we provide an overview of the AADI system and its component models, input data and key assumptions. We then provide detailed validation results to assess how well these indicators are correlated with observed agricultural (crop yield, livestock fertility) and economic (farm profit, regional income) outcomes, drawing on a range of historical survey and administrative data. For reference, the validation performance of AADI is contrasted with that of rainfall percentiles.
2.1 The Australian Agricultural Drought Indicators (AADI) system
The Australian Agricultural Drought Indicator (AADI) system translates spatial climate data and forecasts into predictions of local agricultural outcomes (Fig. 1). The AADI system takes gridded historical and forecast climate data as inputs to agricultural simulation models; given other data and assumptions on the types of soil, pasture and agricultural activity prevailing at each grid cell, these models predict agricultural outcomes including pasture growth via the AussieGRASS system (Carter et al., 2000) and the GrassGro model (Moore et al., 1997; Donnelly et al., 2016), winter and summer crop yields via APSIM (Holzworth et al., 2014), and farm business profits via the farmpredict model (Hughes et al., 2022b).
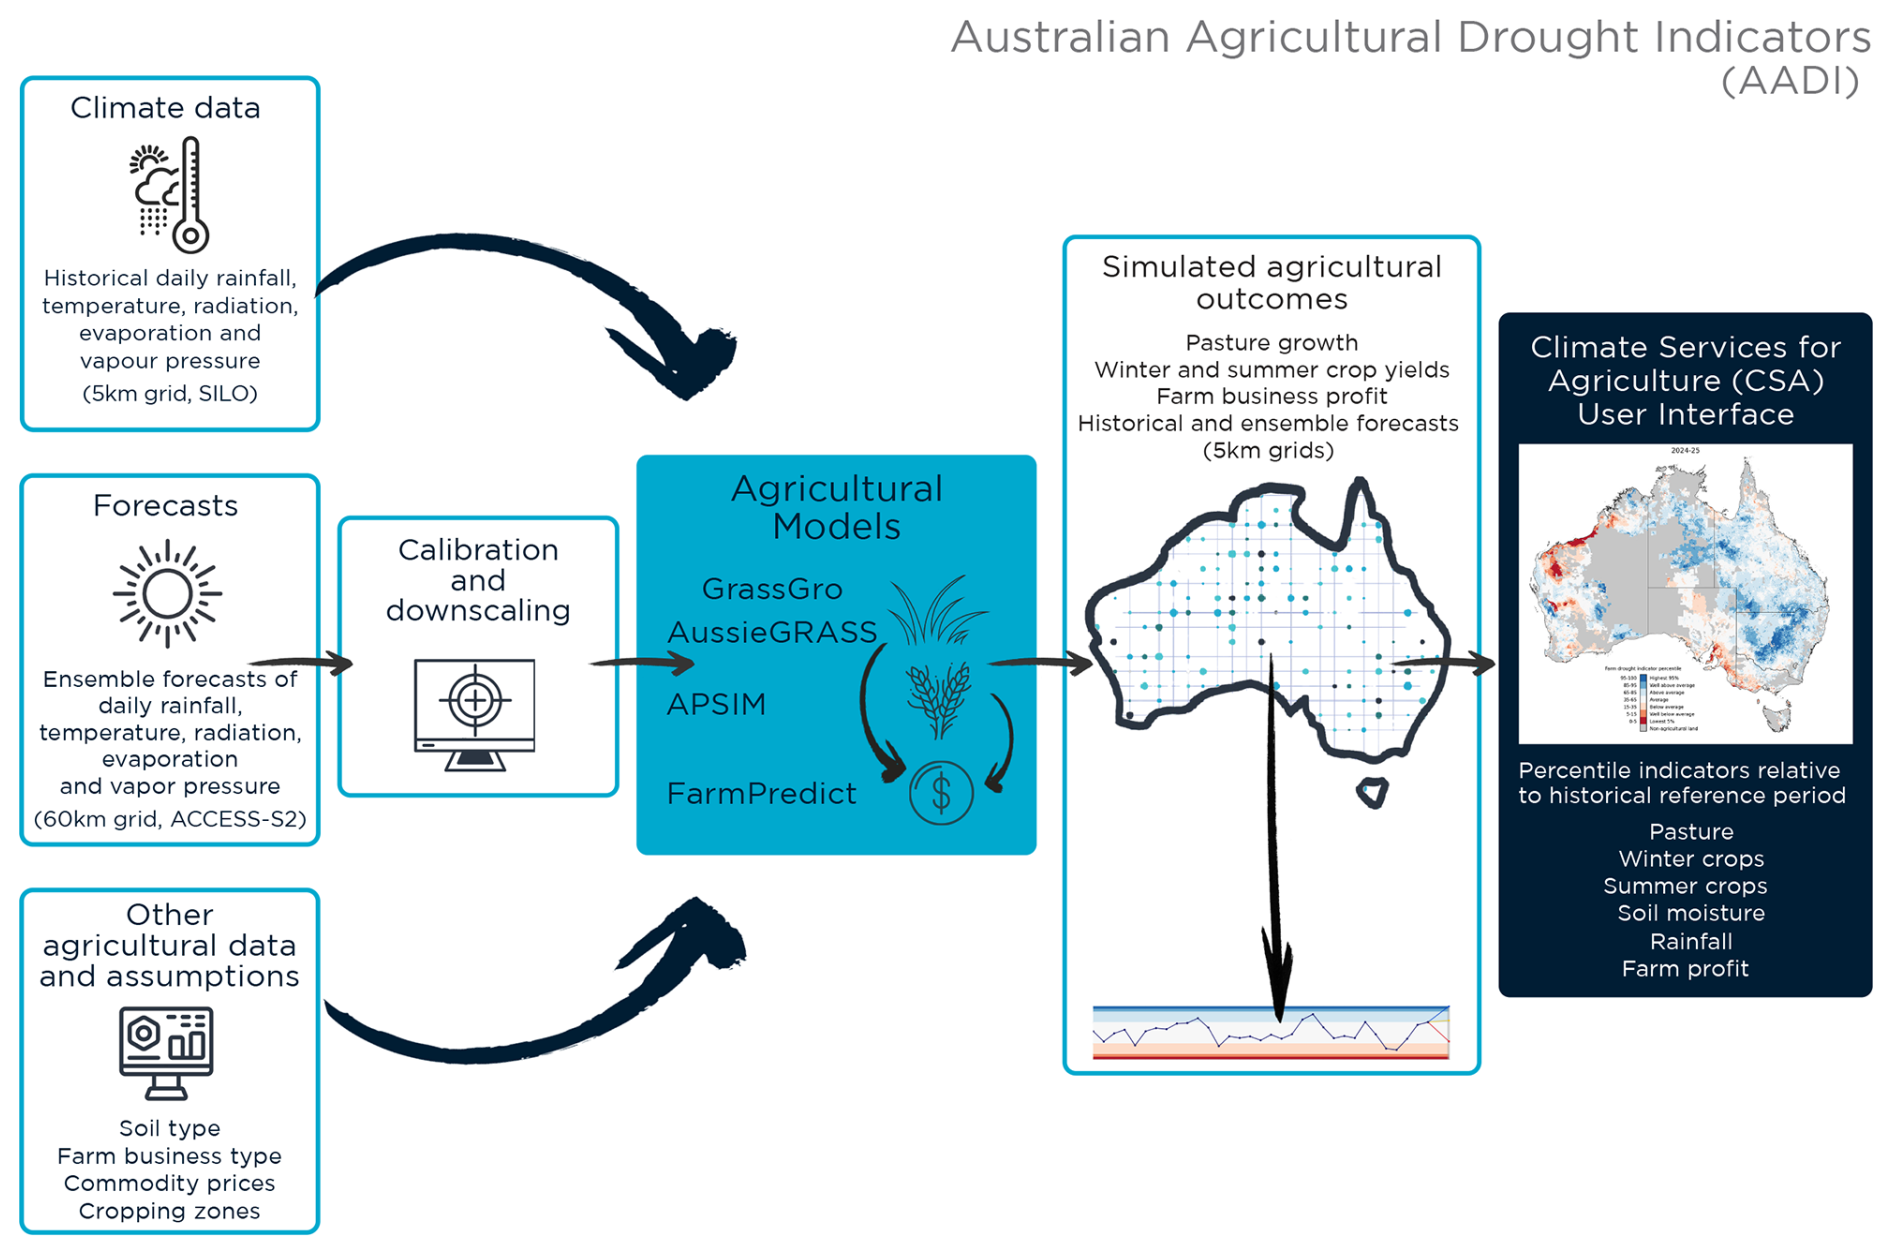
Figure 1Overview of the Australian Agriculture Drought Indicators system.
The AADI system has been designed to represent Australian dry-land broadacre agriculture (non-irrigated extensive livestock and cropping), which accounts for the vast majority (more than 90 %) of Australian agricultural land use and is highly vulnerable to drought impacts (relative to irrigation and other more intensive forms of agriculture; Hughes et al., 2022b).
The AADI system operates on a monthly cycle; at the beginning of each month, indicators are updated given observed weather data to the end of the previous month and the latest climate forecasts. Indicators are for annual (financial year) periods, so the updates make use of both observed data over the year to date and forecasts for the rest of the year. The indicators are generated across Australia for a defined “agricultural zone” (visible Fig. 1, right), which excludes areas with no agricultural activity (protected reserves, forests, etc.; see Hughes et al., 2024).
The final indicators are presented as percentile statistics, comparing current and forecast conditions at each location to a rolling 33-year historical reference period. Given the long-term effects of climate change on Australian temperatures and rainfall, older climate data are now less relevant to benchmarking current conditions or defining drought (see Hughes et al., 2022a). This rolling 33-year reference period is intended to strike a pragmatic balance: attempting to represent the present-day climate while being long enough to characterize climatological variability at each location.
Indicators are available for specific grid cells but can also be aggregated to produce regional estimates (at national, state or local government area (LGA) level), with weightings to account for the relative amount of agricultural activity at each location (see Hughes et al., 2024).
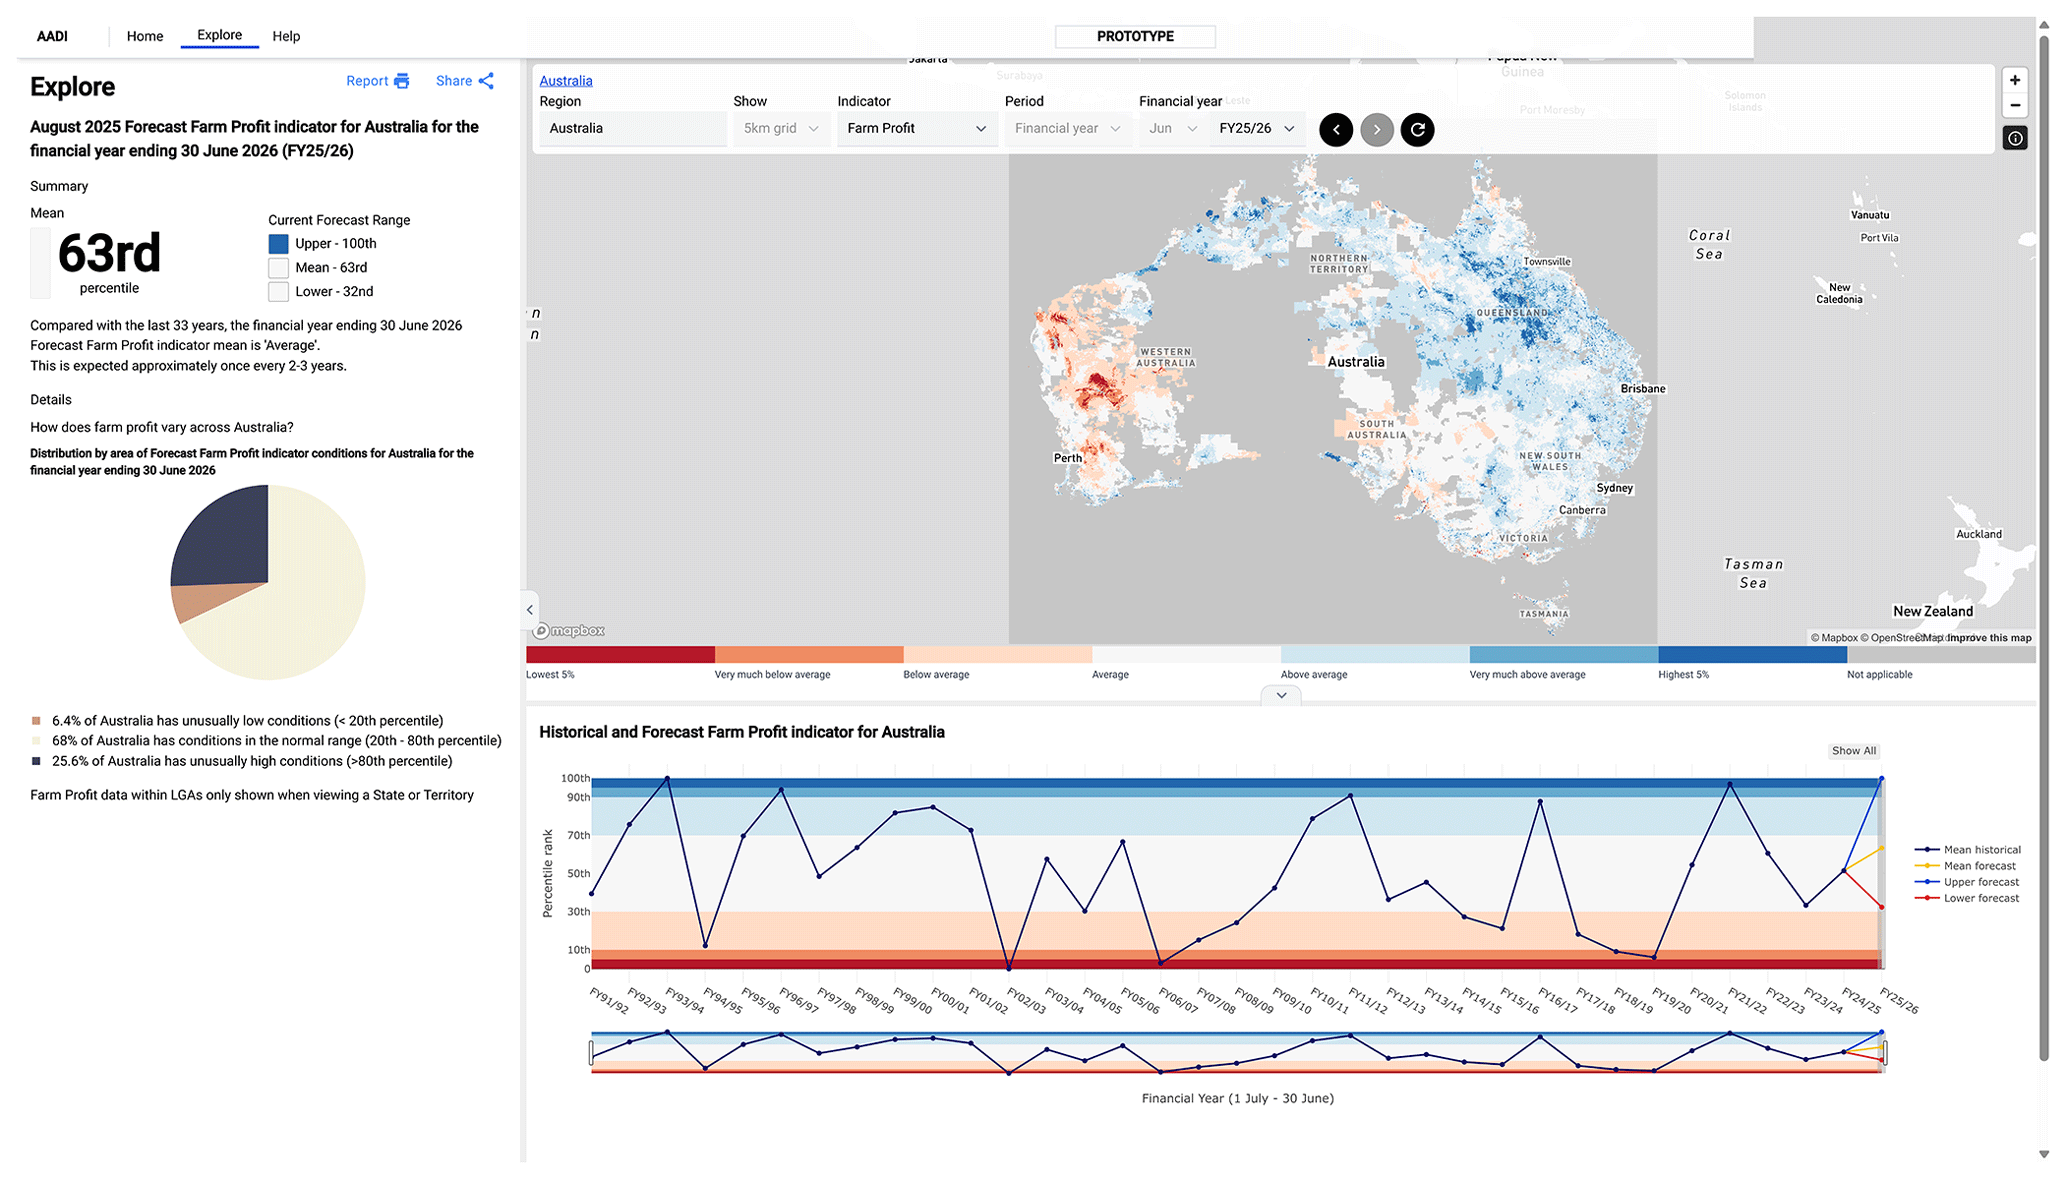
Figure 2Australian Agricultural Drought Indicators user interface (national farm profit indicator forecast for 2025–2026 on 1 August 2025). © Commonwealth of Australia 2025.
A user interface (Fig. 2) was developed to present AADI results, building on the existing Climate Services for Agriculture (CSA) platform, which also hosts the separate MyClimateView app (https://myclimateview.com.au/, last access: 15 November 2024; see Malakar et al., 2024). The user interface design focused exclusively on government users, particularly staff engaged in the implementation of drought response programmes (see Hughes et al., 2024). Key components of the AADI system are summarized below, with further documentation provided in Hughes et al. (2024).
2.1.1 Climate data
The AADI system operates on an 0.05° (approximately 5 km) grid drawing on interpolated historical daily weather data from the SILO database (Jeffrey et al., 2001). Weather variables used in AADI include rainfall (mm), minimum and maximum temperature (°C), shortwave radiation (MJ m−2), vapour pressure (hPa), and evaporation (mm).
Seasonal weather forecasts are obtained from the Bureau of Meteorology (BoM) Australian Community Climate and Earth-System Simulator Seasonal (ACCESS-S2) model (Wedd et al., 2022). ACCESS-S2 is a global climate model operating on a coarse 60 to 80 km grid. The AADI system includes a custom forecast-downscaling and calibration approach (outlined in detail by Schepen et al., 2025).
2.1.2 Soil data
The simulation models require a range of input data in addition to climate observations, including soil types, pasture types, livestock densities and farm business characteristics (e.g. farm size and enterprise mix). To support the AADI system, several new data layers were developed to provide the required bio-physical, agronomic and economic features at a grid scale.
Available state soil measurement datasets were combined to create new national high-resolution (90 m2) functional soil-type maps for Australia (Fig. A1). The new soils maps adopt the Soil Generic Group classification system, which divides Australian soils into 18 functional groups, each with distinct hydrologic properties that are required for crop and pasture modelling (Bartley et al., 2013).
The development of a national soil-type map involved applying digital soil mapping (DSM) (McBratney et al., 2003) methods to data from the National Soil Site Collation (NSSC) (Searle, 2014) along with other spatial environmental data (see Hughes et al., 2022a). The approach involved application of machine learning (random forests) to predict the probability of each of the 18 soil types existing at each location.
2.1.3 Farm business data
For AADI, a new synthetic dataset of farm business information was developed to provide inputs for farmpredict simulations. These synthetic data were derived from the annual Australian Agricultural and Grazing Industry Survey (AAGIS). AAGIS provides a rotating stratified sample of Australian broadacre (extensive crops and grazing) businesses, of around 1600 farms per year. For AADI, the AAGIS data spanning the most recently available 10 years (2012–2013 to 2021–2022) were used.
The new synthetic farm data were developed using a distance-weighted Gaussian kernel interpolation method. To protect the privacy of survey participants, a degree of random perturbation is applied to AAGIS data prior to interpolation. This process yields a set of synthetic or representative farm business data (one farm per grid cell) reflecting the “typical” broadacre farm at a given location, based on AAGIS farm businesses observed in proximity to that location in recent years (see Fig. A2).
2.1.4 Crop simulations
Cropping simulations make use of The Agricultural Production Systems SIMulator (APSIM) (Holzworth et al., 2014), specifically APSIM Next Generation 2022.12.7128 (Holzworth et al., 2018). Water-limited crop yield simulations are produced for wheat and sorghum, the two most common winter and summer broadacre crops in Australia. Water-limited yield represents yield that can be achieved using current best practices, technology and genetics for rainfed crops.
APSIM simulations are based on daily historical and forecast climate data along with soil-type data and management rules. To calibrate initial soil conditions, all APSIM runs begin with a 15-year “spin-up” period, which allows state variables to reach equilibrium. Wheat and sorghum simulations are undertaken for each grid cell within the defined winter and summer cropping zones (see Fig. A4). Simulations were conducted for multiple soil types in each grid cell, with results presented as an area-based weighted average. Crop sowing and fertilizer application rules for wheat and sorghum were specified on a regional basis (see Hughes et al., 2024). For wheat, simulations are based on the cultivar with the highest average grain yield at each grid cell, derived from historical (1989–1990 to 2021–2022) simulations of seven cultivars. All sorghum simulations are based on the “Buster” cultivar using a historically optimized plant density at each grid cell. Cropping simulations use historical mean CO2 levels (Lan et al., 2022) for each year from 1988 (see NOAA, 2023).
2.1.5 Pasture simulations
AADI pasture simulations make use of both the GrassGro model (Moore et al., 1997; Donnelly et al., 2016) and the AussieGRASS system (Carter et al., 2000). GrassGro is a process-based model that simulates pasture dynamics in response to grazing pressure from sheep or cattle under a specified enterprise type and management scenario. GrassGro is point-based and configured for a specific paddock and runs on a daily time step. AussieGRASS is a spatial implementation of the GRASP model (Rickert et al., 2000) of pasture growth developed to operate on an 0.05° grid across Australia. Within AADI, GrassGro was applied to simulate pasture growth for improved pastures across the Australian wheat–sheep and high-rainfall zones, while AussieGRASS is used for the Australian pastoral or “rangeland” zone (Fig. A3).
As with APSIM, GrassGro simulations make use of digital soil mapping derived from the NSSC, while AussieGRASS relies on an older soil dataset (Northcote, 1960–1968). Pasture simulations make use of daily-time-step historical and forecast climate data (rainfall, temperature and solar radiation) with AussieGRASS also requiring vapour pressure and potential evaporation. As with APSIM, both models employ a “spin-up” simulation period to initialize soil and pasture conditions. Other model assumptions including pasture composition, grazing pressure (i.e. stocking rates), tree density and fire scars (in the case of AussieGRASS) are detailed in Hughes et al. (2024).
2.1.6 Farm business simulations
Farm business simulations are derived using farmpredict (Hughes et al., 2022b), a statistical micro-simulation model of Australian broadacre farming businesses based on data from the AAGIS. The farmpredict model simulates production and financial outcomes at a farm business scale, given each farm's characteristics (e.g. its location, size, industry, capital and livestock holdings), prevailing climate conditions and commodity prices.
The model employs a machine learning approach (a multi-variable XGBoost stack; see Hughes et al., 2022b) to develop statistical links between farm production, climate and prices. A sample of around 45 000 observations from the AAGIS over the period 1991–1992 to 2021–2022 is used to train the model, with each farm linked via geocoding to historical SILO data. The model predicts crop and livestock outputs, input use, and stock (inventory) holdings (including livestock on-farm crop and wool storage). These outcomes are then combined within an accounting framework to simulate farm profit (see Hughes et al., 2022b).
For AADI, farmpredict was updated to take bio-physical data as inputs alongside existing weather data (i.e. rainfall and temperature), including simulated APSIM wheat and sorghum yields and simulated pasture variables from AussieGRASS (including pasture growth, total standing dry matter (TSDM), green leaf mass and pasture growth days). For AADI, farmpredict is applied to synthetic farm business data (Sect. 2.1.3), which define a single farm for each grid cell.
The farm profit indicator presented in the current AADI user interface (UI) is based on a “climate only” scenario, which, consistently with Hughes et al. (2022a), isolates the effects of climate variability on farm profits. In these simulations, global output and input prices are held fixed (although the spread between domestic and global grain prices can vary in response to climate data to capture domestic price increases in drought years; see Hughes et al., 2022a). A second scenario (“with prices”) was also developed which allows for annual variation in output and input prices along with climate variability. For this scenario, historical prices were de-trended to account for long-term trends in real output and input prices (particularly increases in sheep and lamb output prices).
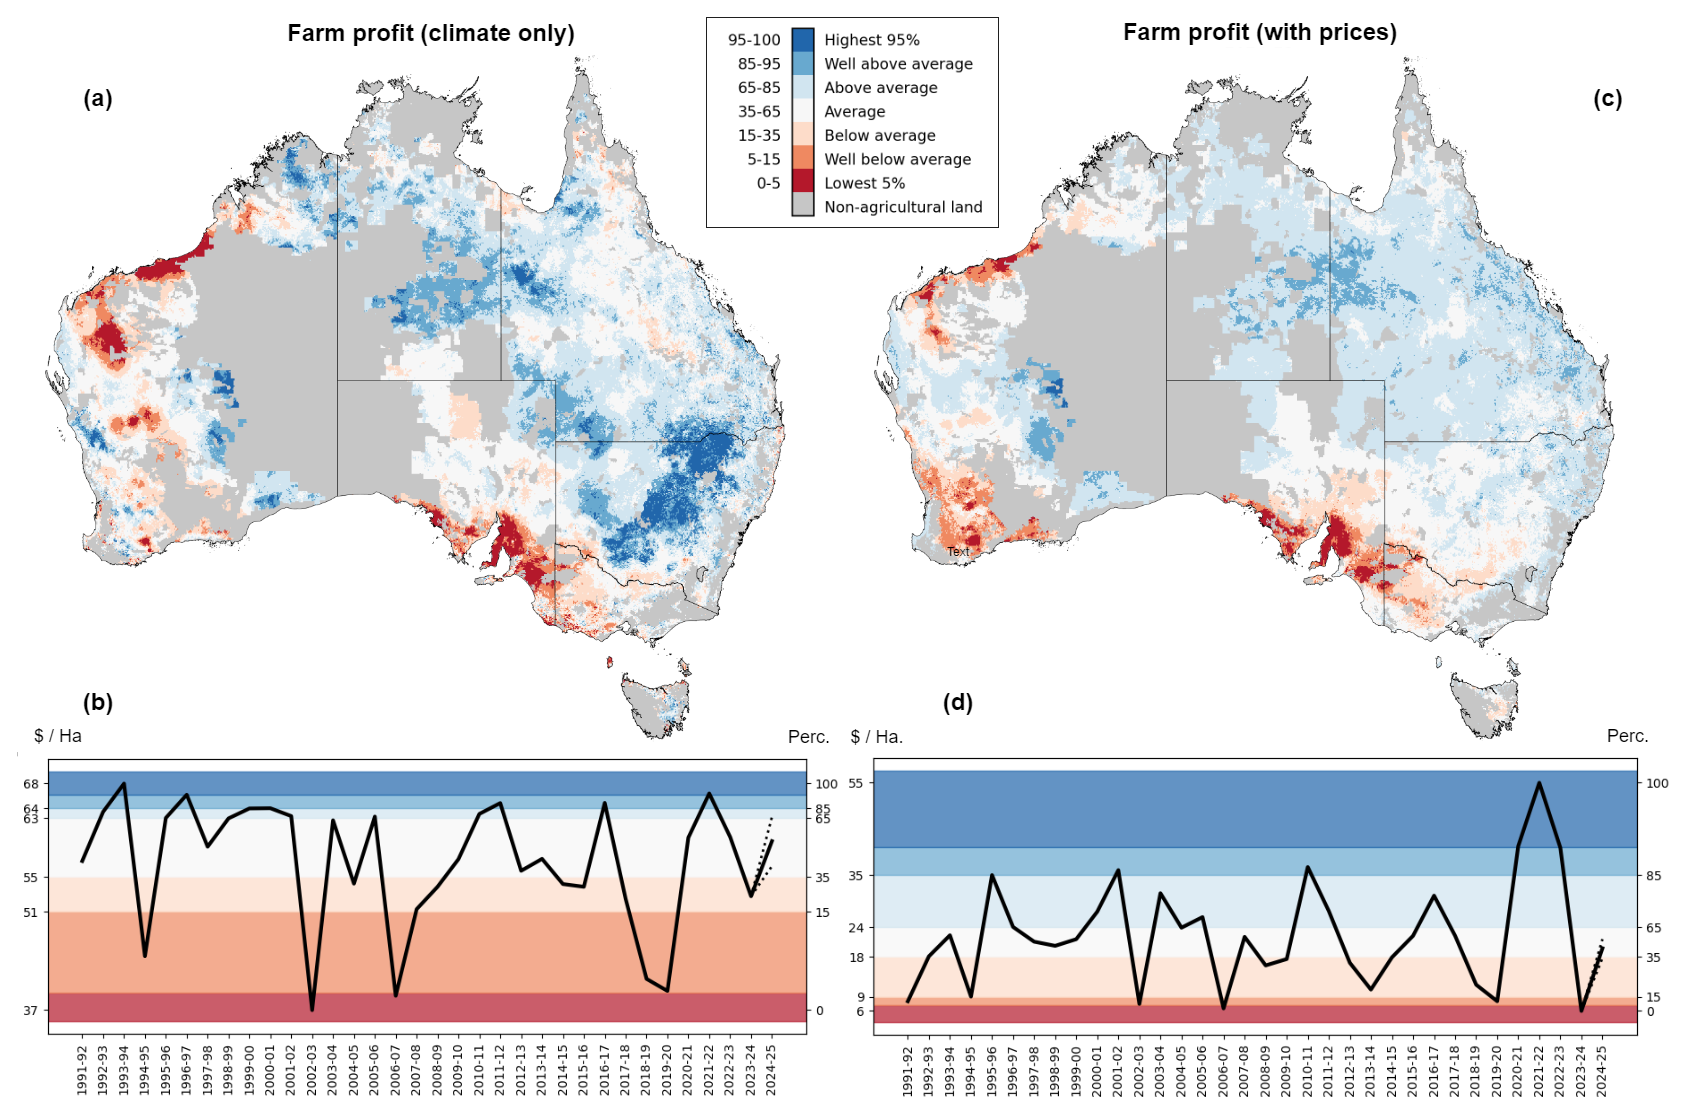
Figure 3(a) AADI farm profit (climate only) indicator forecast for 2024–2025 as of October 2024. (b) AADI national average farm profit (climate only) indicator time series of 1991–1992 to 2024–2025. (c) AADI farm profit (with prices) indicator forecast for 2024–2025 as of October 2024. (d) AADI national average farm profit (with prices) indicator time series of 1991–1992 to 2024–2025.
As shown in Fig. 3, the inclusion of commodity price effects has a significant influence on the results. While both indicators identify the similar drought years at a national scale (2002–2003, 2006–2007, 2018–2019 and 2019–2020), the relative rankings vary: price effects lessen the severity of the 2018–2019 drought (as commodity prices were favourable) and increase the severity of the 2006–2007 drought (which coincided with low commodity prices). More recently, 2023–2024 was an adverse year for farm businesses due to a dramatic fall in Australian livestock prices (compounded by below-average climate conditions).
2.2 Validation
The accuracy of the AADI can be assessed along two main dimensions: “forecast skill” and “indicator skill”. Here forecast skill refers to ability of forecasts at various lead times to reflect end-of-period (i.e. crop season or financial year) values, which depends on both weather forecast skill and the effects of antecedent conditions. AADI forecast skill is considered in detail in Schepen et al. (2025). Here the focus is on indicator skill: the extent to which end-of period indicators (derived from observed climate data) are correlated with real-world outcomes.
In the absence of forecast error, indicators will still differ from on-the-ground outcomes (e.g. crop yields, farm profits) due to a combination of model error and input data error. Each of the simulation models used in the AADI system (APSIM, AussieGRASS, GrassGro and farmpredict) has been previously calibrated and validated against specific site data. However, simulating models on a grid introduces additional error, since gridded agricultural data (such as soil type and farm business details) need be interpolated from a limited number of site observations (Richetti et al., 2024). Weather data are also subject to interpolation error given a limited number of weather station sites.
Table 1Regional observation data, sources and summary statistics.
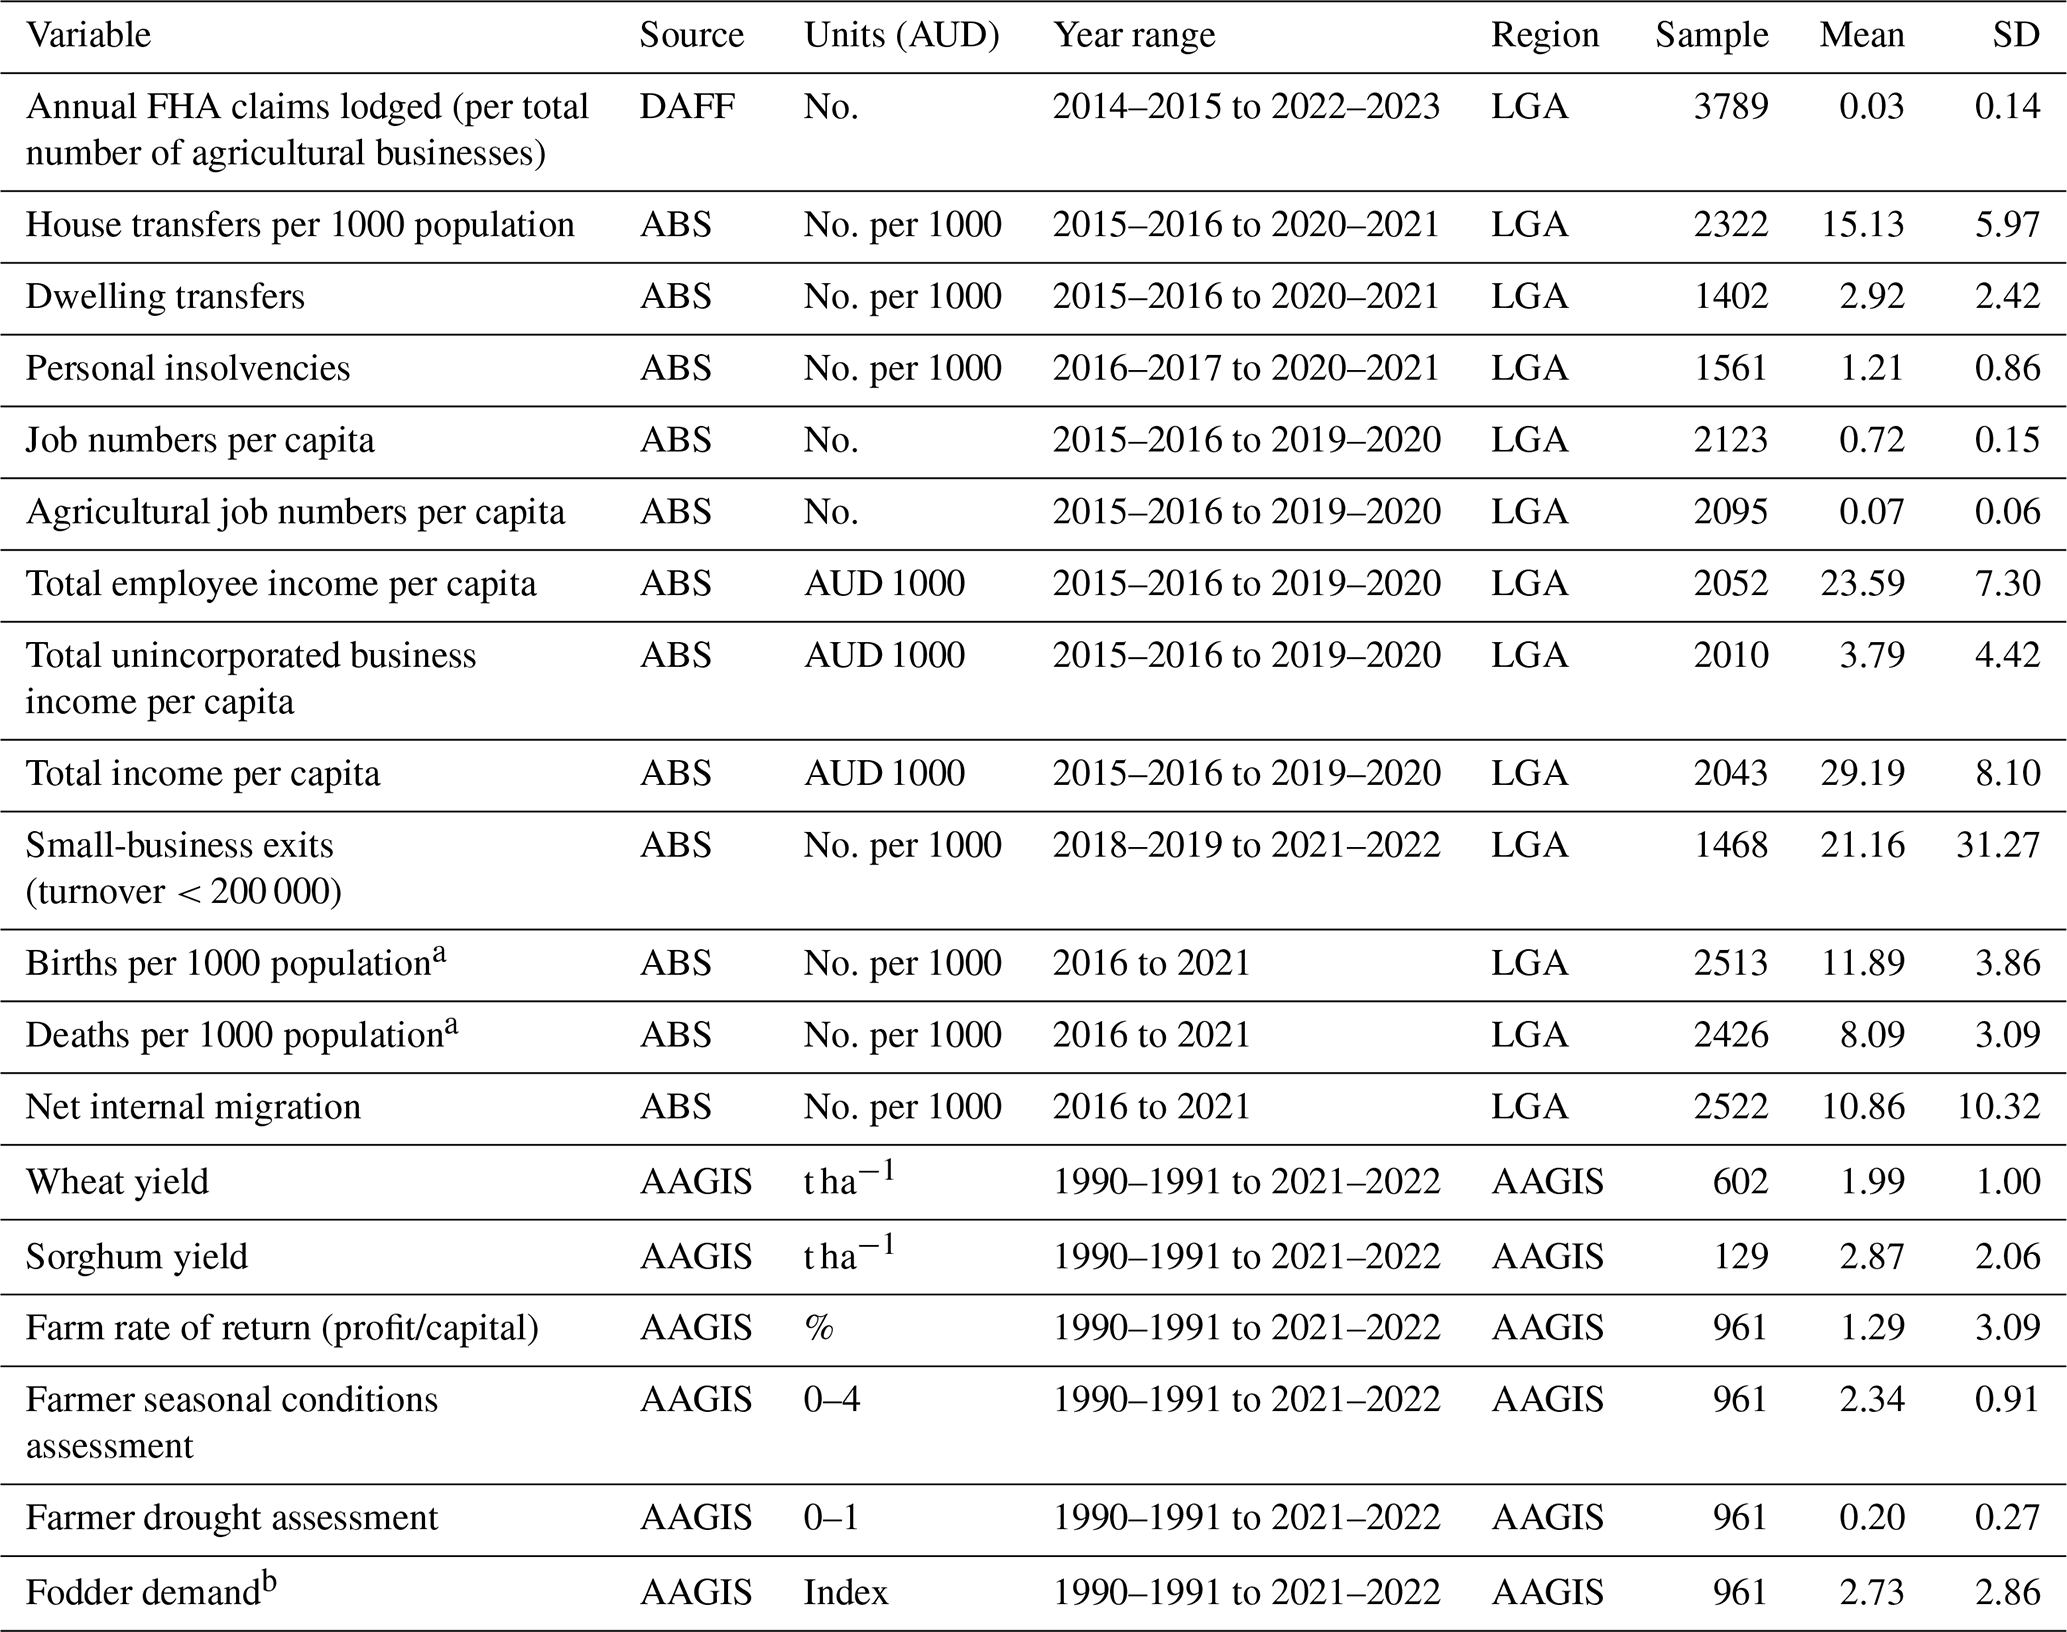
ABS: Australian Bureau of Statistics data by region https://dbr.abs.gov.au/ (last access: 1 December 2024); AAGIS: Australian Agricultural and Grazing Industry Survey (AAGIS) https://www.agriculture.gov.au/abares/research-topics/surveys/farm-definitions-methods (last access: 1 December 2024); DAFF: Australian Government Department of Agriculture, Fisheries and Forestry. a Demographic variables are calendar years 1 January to 31 December. All other data are financial years 1 July to 30 June. Demographic data are linked to financial-year data (ending 30 June in that year), allowing for some lag between drought impacts and demographic changes. b Purchased fodder quantity index (fodder expenditure/fodder price index) relative to total livestock holdings measured in dry sheep equivalent (DSE).
2.2.1 Data sources
In this study, we validate AADI against a range of public small-region observational data drawn from a range of sources (Table 1). These observational data are compared with historical AADI percentile values (for the period 1990–1991 to 2021–2022) that are aggregated to match the same regional scales. In addition to the four indicators in the current AADI UI (“climate only” farm profit, pasture growth, winter crop yield and summer crop yield), we also consider the “with prices” farm profit indicator, the AussieGRASS pasture biomass (total standing dry matter) indicator and rainfall percentiles. In Appendix B, we also present correlation maps at the grid scale, comparing AADI data against interpolated AAGIS variables. Agricultural production data are obtained from annual ABS and ABARES surveys, including a range of regional data from AAGIS over the period 1990–1991 to 2022–2023 (Table 1).
To test whether these indicators have predictive power beyond the farm level, we also consider socio-economic data at the local government area (LGA) level taken from the ABS “data by region” product (see Table 1). The ABS “data by region” product is a relatively new dataset derived largely from administrative data and offers small-region estimates for a selection of recent years. Administrative data are also obtained on the number of claims that have been made by Australian farmers under the Farm Household Allowance (FHA) programme (https://www.agriculture.gov.au/agriculture-land/farm-food-drought/drought/farm-household-allowance (last access: 1 December 2024) at the LGA level since 2014–2015.
Table 2Correlation of drought indicators with observed farm rate of return 1990–1991 to 2022–2023.
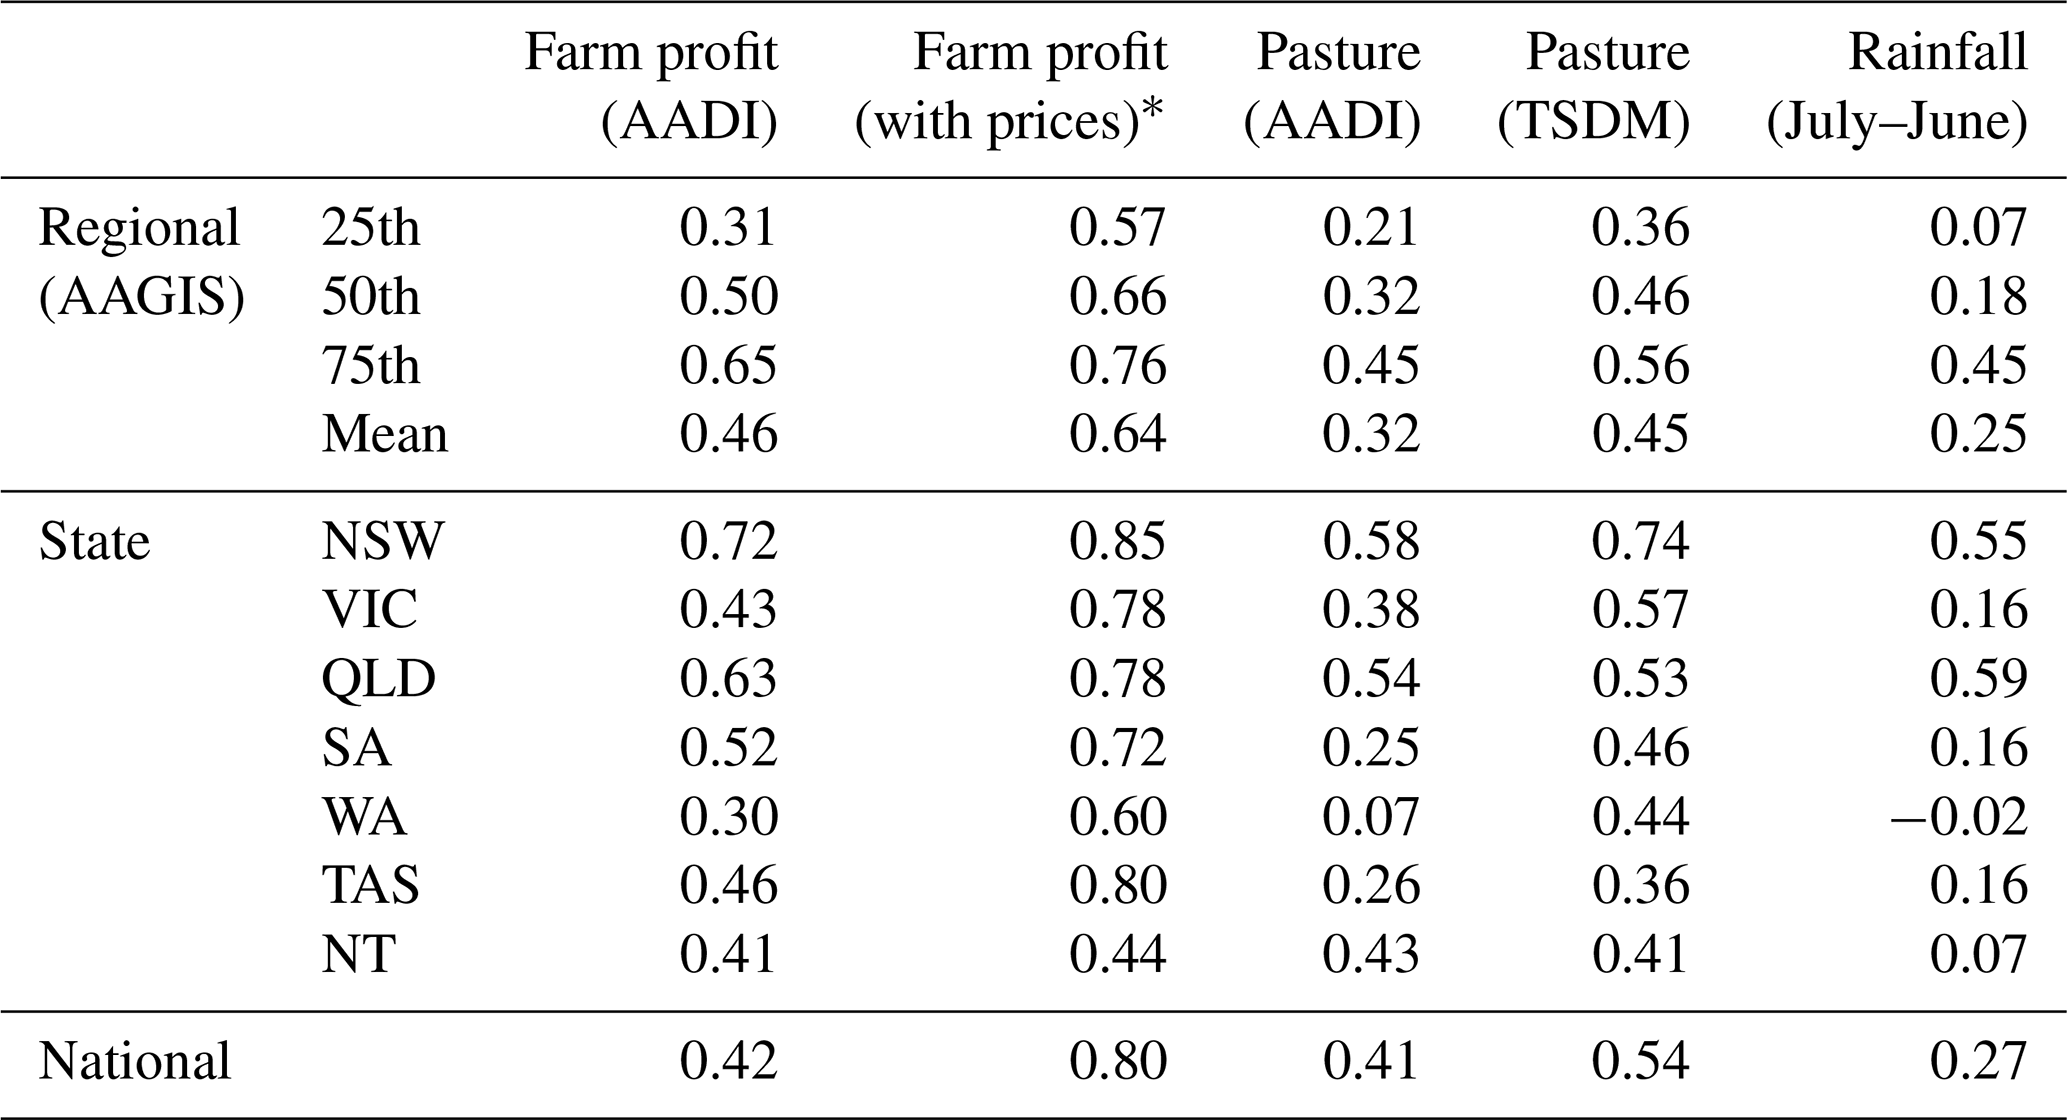
∗ Indicator with highest correlation.
Annual LGA level socio-economic data are subject to regression analysis to estimate the marginal effect of low (below 10th percentile) indicator values on socio-economic outcomes. Here, for each indicator and socio-economic measure, a fixed-effects regression is estimated, with a binary variable equal to 1 for percentile values less than 10 (and 0 otherwise), along with regional identifiers (fixed effects) and a linear time trend. An additional control variable is included for the mortality regression model: state level covid-19 death rates (with data obtained from the Australian Government; NNDSS, 2024).
3.1 Indicator skill
Correlation between the drought indicators and relevant agricultural outcomes is summarized in Tables 2 to 3 and Figs. 6 to 7. It is important to note that AADI historical percentiles are based on model scenarios which hold technology and management practices fixed and simulate historical climate (and price) variability. Further, outcome data have not been subject to de-trending or any other calibration. As such these correlation scores are intended for measuring the relative performance of the indicators (rather than an absolute assessment of the AADI system).
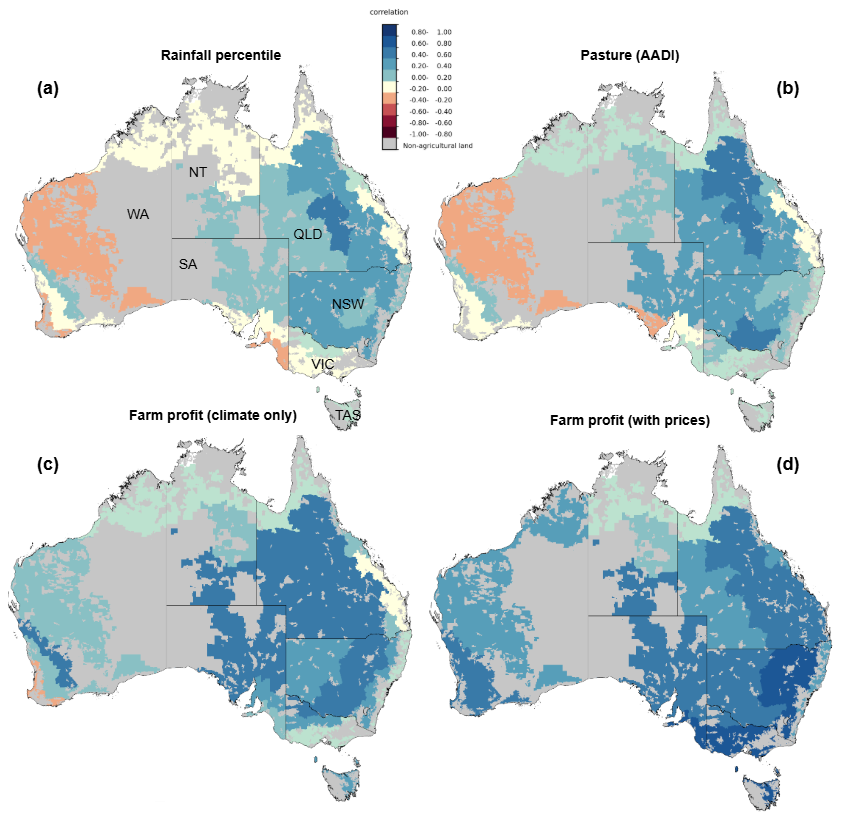
Figure 4Regional correlation of drought indicators with observed annual farm profit (AAGIS) from 1990–1991 to 2021–2022. (a) Annual rainfall percentile. (b) Pasture growth indicator (AussieGRASS). (c) Farm profit indicator (climate only). (d) Farm profit indicator (with prices).
As shown in Table 2 and Fig. 4, the farm profit (with prices) indicator has by far the strongest correlation with the historical rate of return data (farm profit relative to capital holdings), with a mean correlation of 0.64 at a regional scale. The inclusion of commodity price variability leads to a significant improvement in skill, relative to the farm returns (climate only) indicator (mean regional correlation of 0.46), although the “climate only” indicator still yields a non-trivial improvement over a simple rainfall percentile (mean regional correlation of 0.25). The inclusion of commodity price effects tends to yield a larger gain in skill in livestock-dominant regions (coastal, high-rainfall zones and inland, pastoral zones) given the greater relative exposure of these farms to price risk.
Correlation maps (Fig. 4) show that the skill of the profit indicators tends to be higher in eastern Australia, with lower correlation observed in parts of South Australia (SA) and Western Australia (WA) along with far north Queensland. Appendix B presents higher-resolution correlation maps using interpolated observational data (Fig. B2). These maps highlight some more specific areas of low correlation, including the SA Yorke peninsula (Fig. B2)
Table 3Correlation of drought indicators with observed crop and livestock productivity from 1990–1991 to 2022–2023.
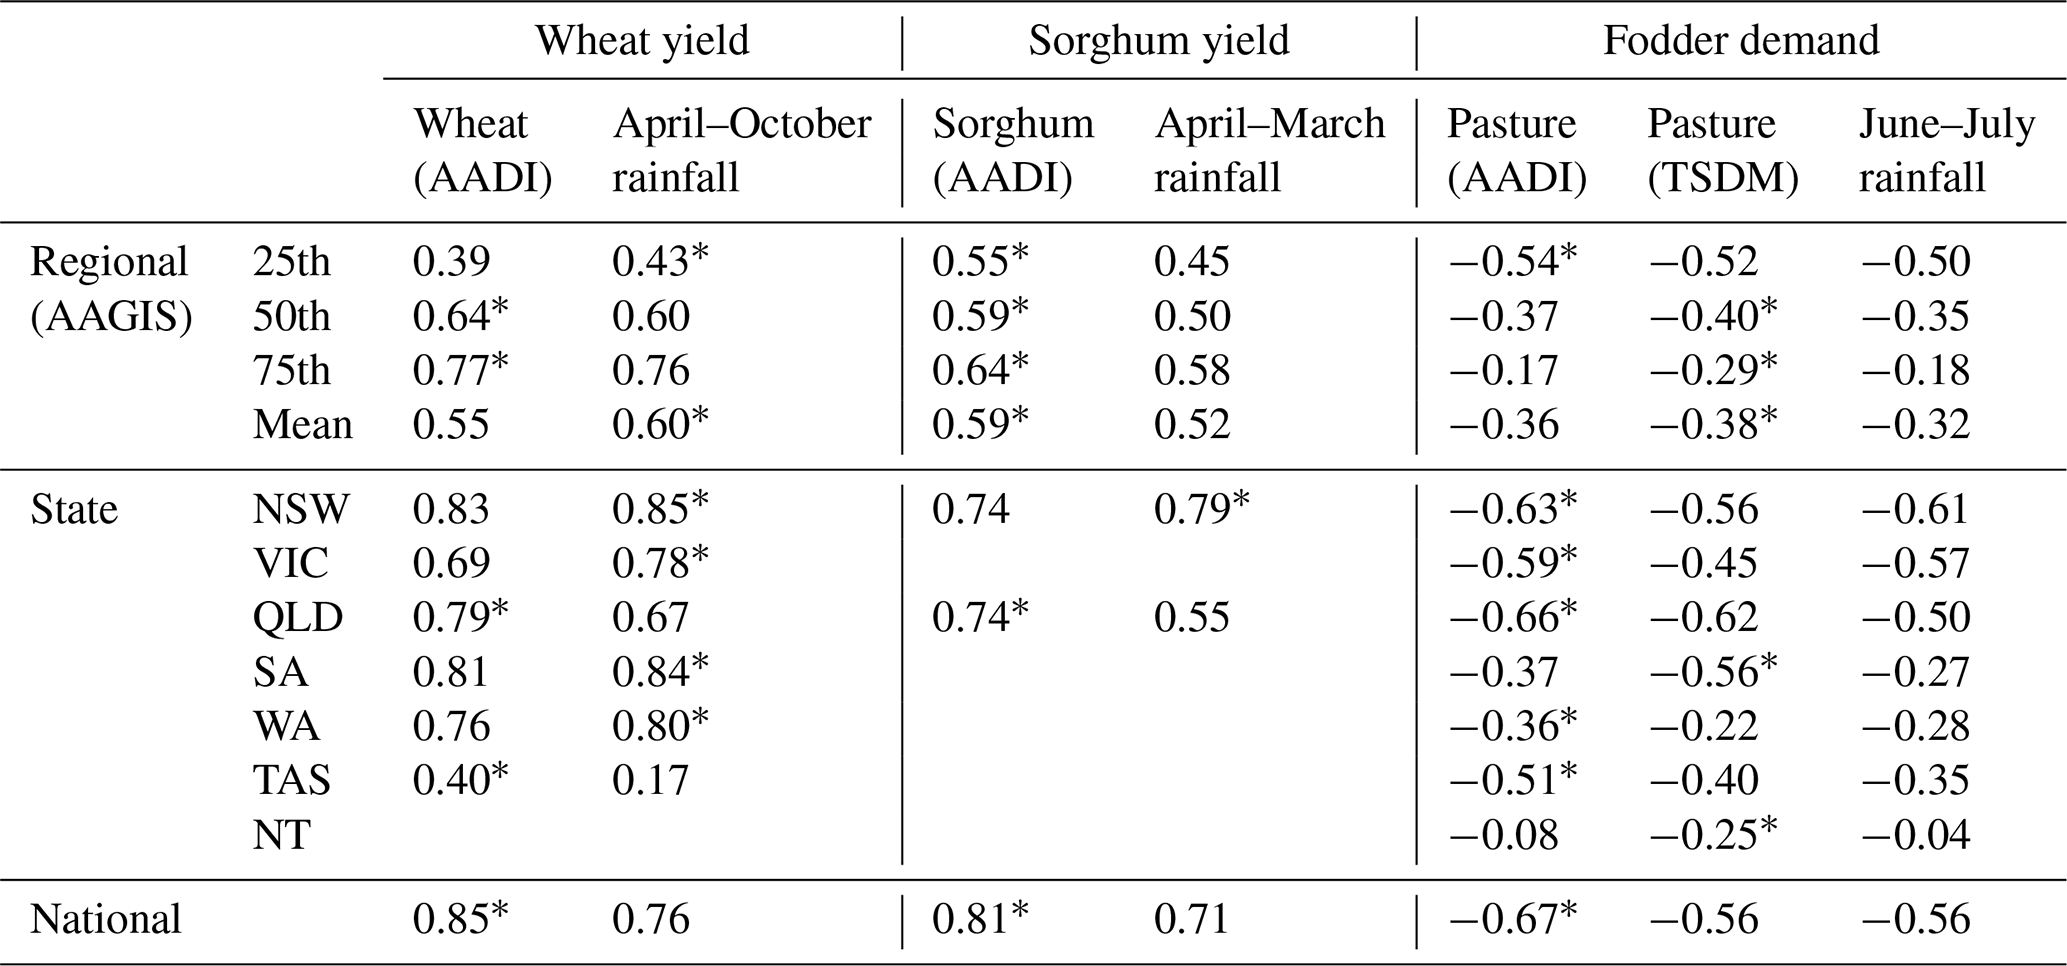
∗ Indicator with best correlation.
Table 3 presents correlation against agricultural production outcomes, including wheat yields, sorghum yields and fodder demand. Assessments of pasture indicators are difficult, given the lack of ground-truth data (pasture observations). Here we rely on fodder demand (hay/grain purchased to feed livestock) as a proxy for pasture condition (i.e. farms with good pasture require less purchased fodder, so negative correlation is expected; see Table 3 and Fig. 5c and d). Overall, the results show slightly better skill for the AADI pasture indicator in terms of fodder demand (relative to TSDM and rainfall), although performance of the AADI pasture indicator is weaker in SA and Northern Territory (NT). The TSDM indicator tends to perform better (relative to the AADI pasture growth measure) in the more remote rangeland areas (Figs. 5 and B2).
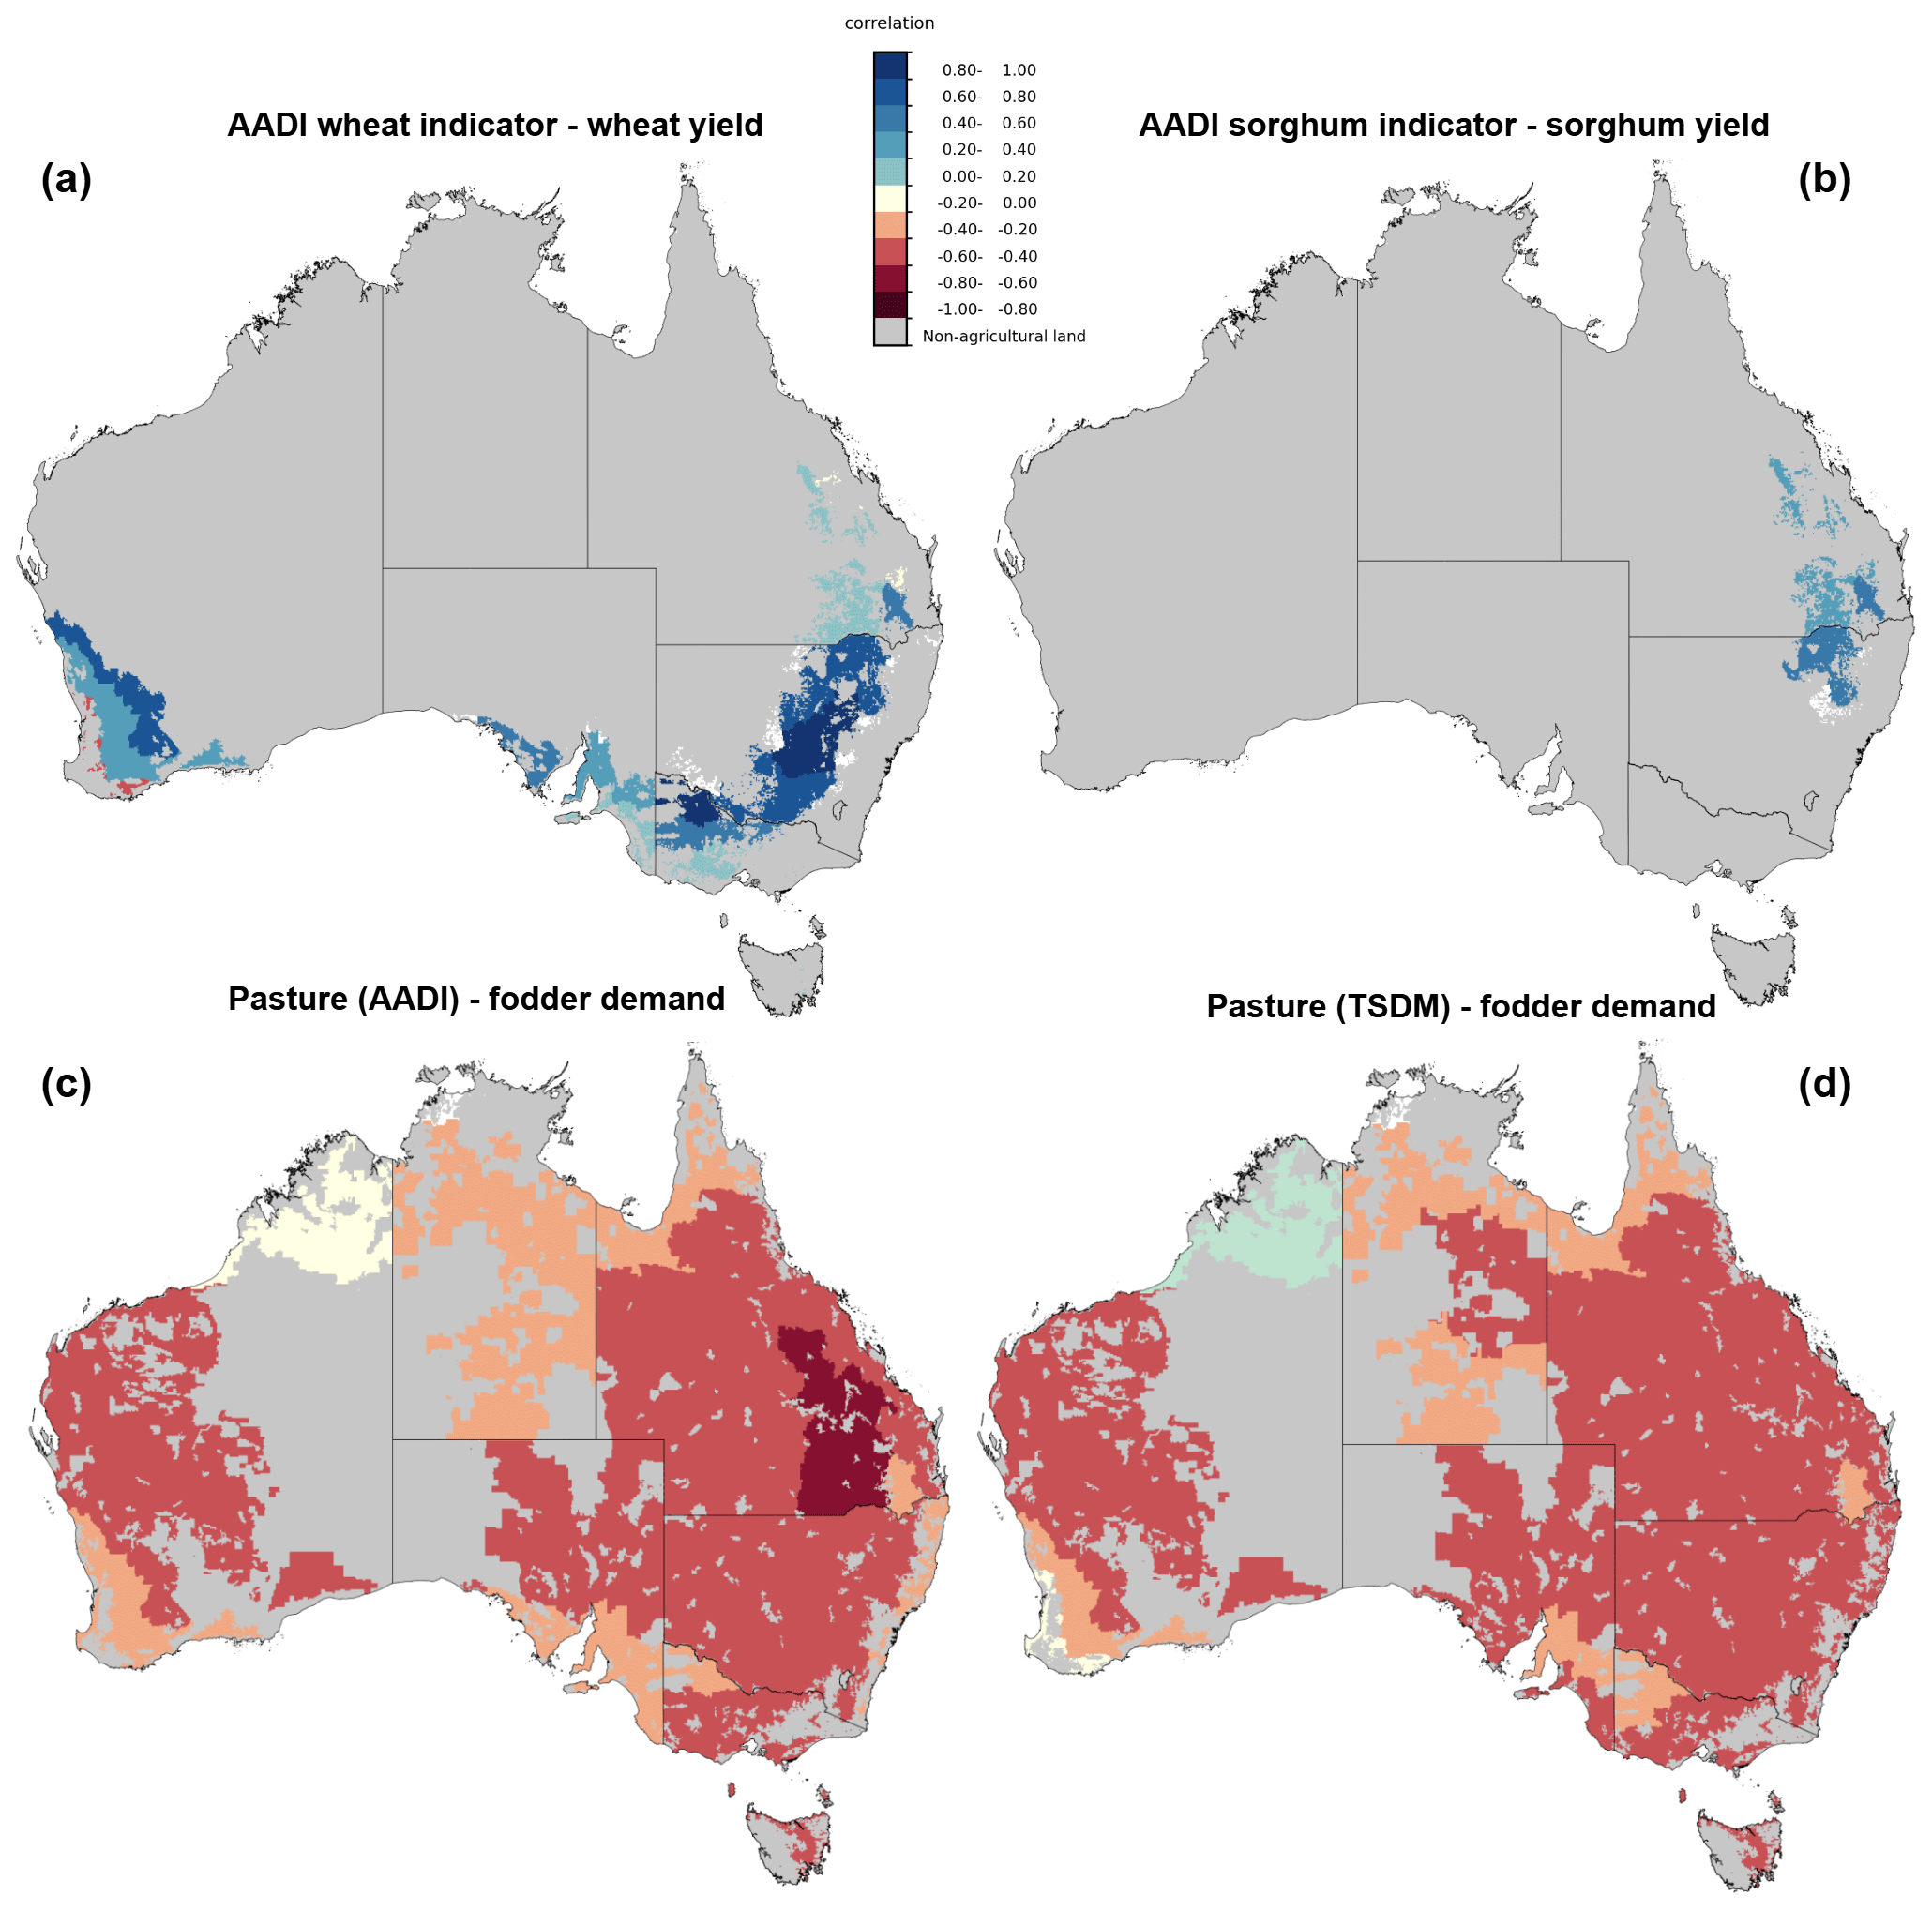
Figure 5Regional correlation with observed annual crop and livestock productivity data of 1990–1991 to 2021–2022. (a) AADI wheat yield indicator – wheat yields. (b) AADI sorghum yield indicator – sorghum yields. (c) AADI pasture growth indicator – fodder demand (negative correlation indicates better performance). (d) Pasture growth indicator (TSDM) – fodder demand (negative correlation indicates better performance).
As shown in Table 3, both APSIM-based crop indicators are well correlated with historical crop yield data (mean regional correlation of 0.55 for wheat and 0.59 for sorghum). In the majority of the AAGIS regions (11 of 17), the AADI wheat yield indicator outperforms growing-season (April–October) rainfall percentiles, with the largest gains in northern NSW and QLD. But in a number of southern and western cropping regions (e.g. southern VIC, SA and WA) growing-season rainfall shows higher correlation. More detailed assessments of crop indicator skill using interpolated gridded data are presented in Appendix B. Figure B2 shows that the AADI wheat indicator is weaker along the coastal fringe of the winter cropping zone. In contrast, the APSIM sorghum yield indicator generally outperforms rainfall across the summer cropping zone.
3.2 Farm household allowance
Data on the number of claims under the Australian Government's Farm Household Allowance (FHA) programme show a high level of correlation with AADI data, particularly the farm profit “with prices” indicator (Table 4, Figs. 6 and B1).
Table 4Correlation of drought indicators with Farm Household Allowance claims from 2014–2015 to 2022–2023 at regional, state and national scales.
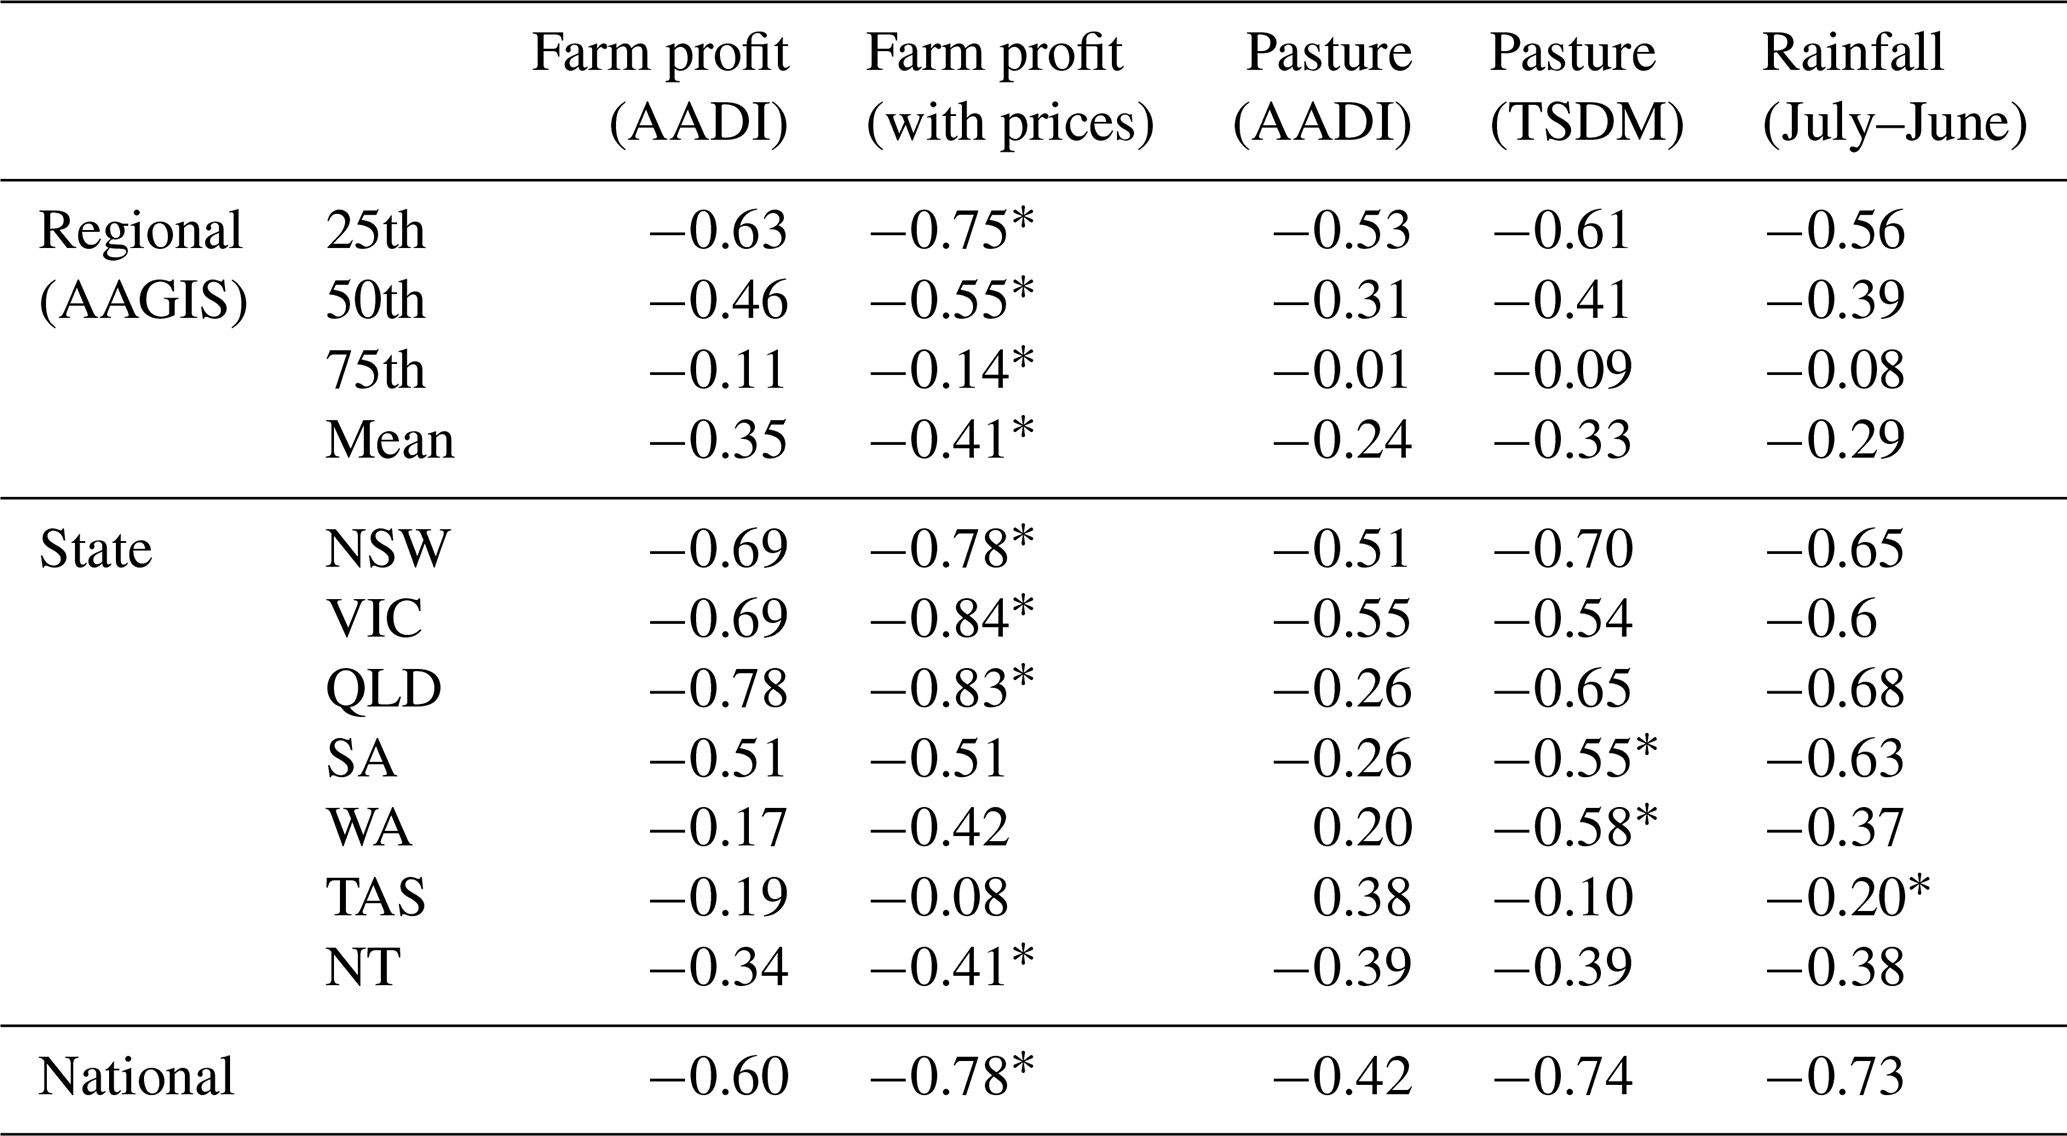
∗ Indicator with highest correlation.
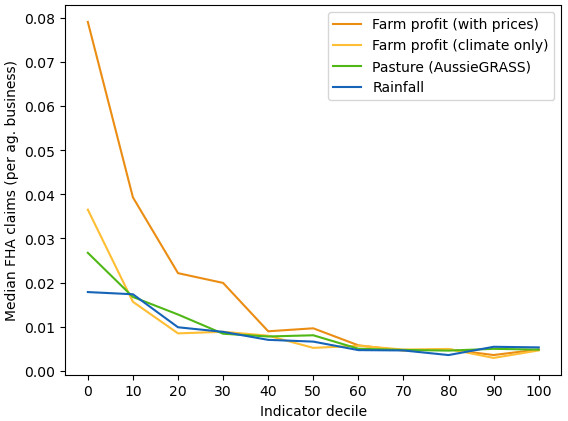
Figure 6Median regional FHA claims per total number of agricultural businesses, by indicator decile (2014–2015 to 2022–2023).
Given the nature of the FHA programme (income support for farms in financial hardship), it is logical that claims are better correlated with financial than with climatic indicators. Further, as would be expected, FHA claims are associated with severely adverse (e.g. less than 10th percentile) outcomes for farm profitability (see Figs. 6 and 7). Figure 6 demonstrates the large improvement in predictive power between the farm profit “with prices” indicator, with an effect size around double that of the “climate only” version (a result confirmed with regression analysis in Sect. 3.3).
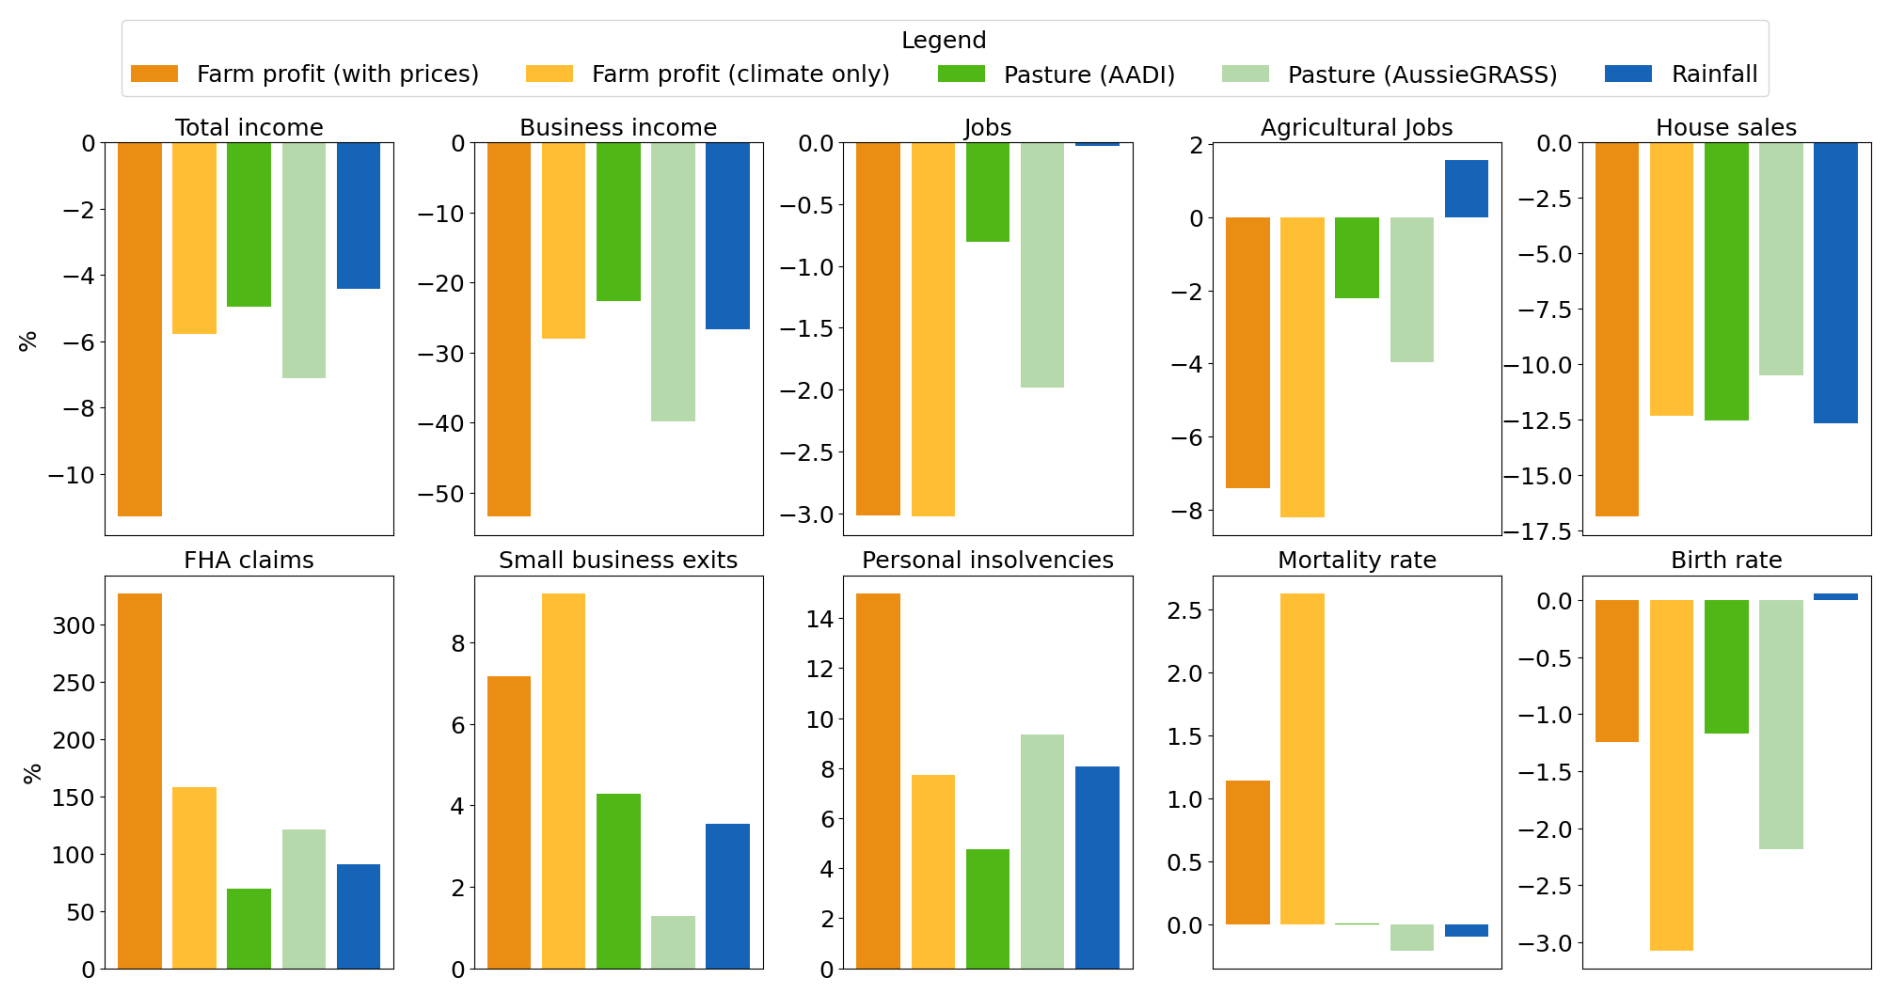
Figure 7Percentage effect of drought (indicator below 10th percentile) on selected regional socio-economic outcomes.
The level of correlation is particularly strong in eastern Australia (−0.78 NSW, −0.84 VIC and −0.83 QLD), with lower correlation observed in WA (−0.42; Table 4, Fig. B1). This may be partly a result of sample size, since the number of claims during this period was lower in WA (and the period 2014–2015 to 2022–2023 included fewer < 10th percentile values for the farm profit indicator in these regions).
Farmer drought self-assessments
Following Hughes et al. (2022a) we also consider how the indicators of the AADI correlate with farmer subjective self-assessments of drought (as reported by farmers participating in the annual AAGIS). These self-assessments are based on survey questions asking farmers to assess conditions over the preceding financial year (based on a 5-point scale ranging from drought to flood). These data have then been aggregated to the AAGIS region level to estimate proportion of farmers self-assessing as drought affected in each year.
Table 5Correlation of drought indicators with farmer drought self-assessments (AAGIS) from 1990–1991 to 2022–2023 at regional, state and national scales.
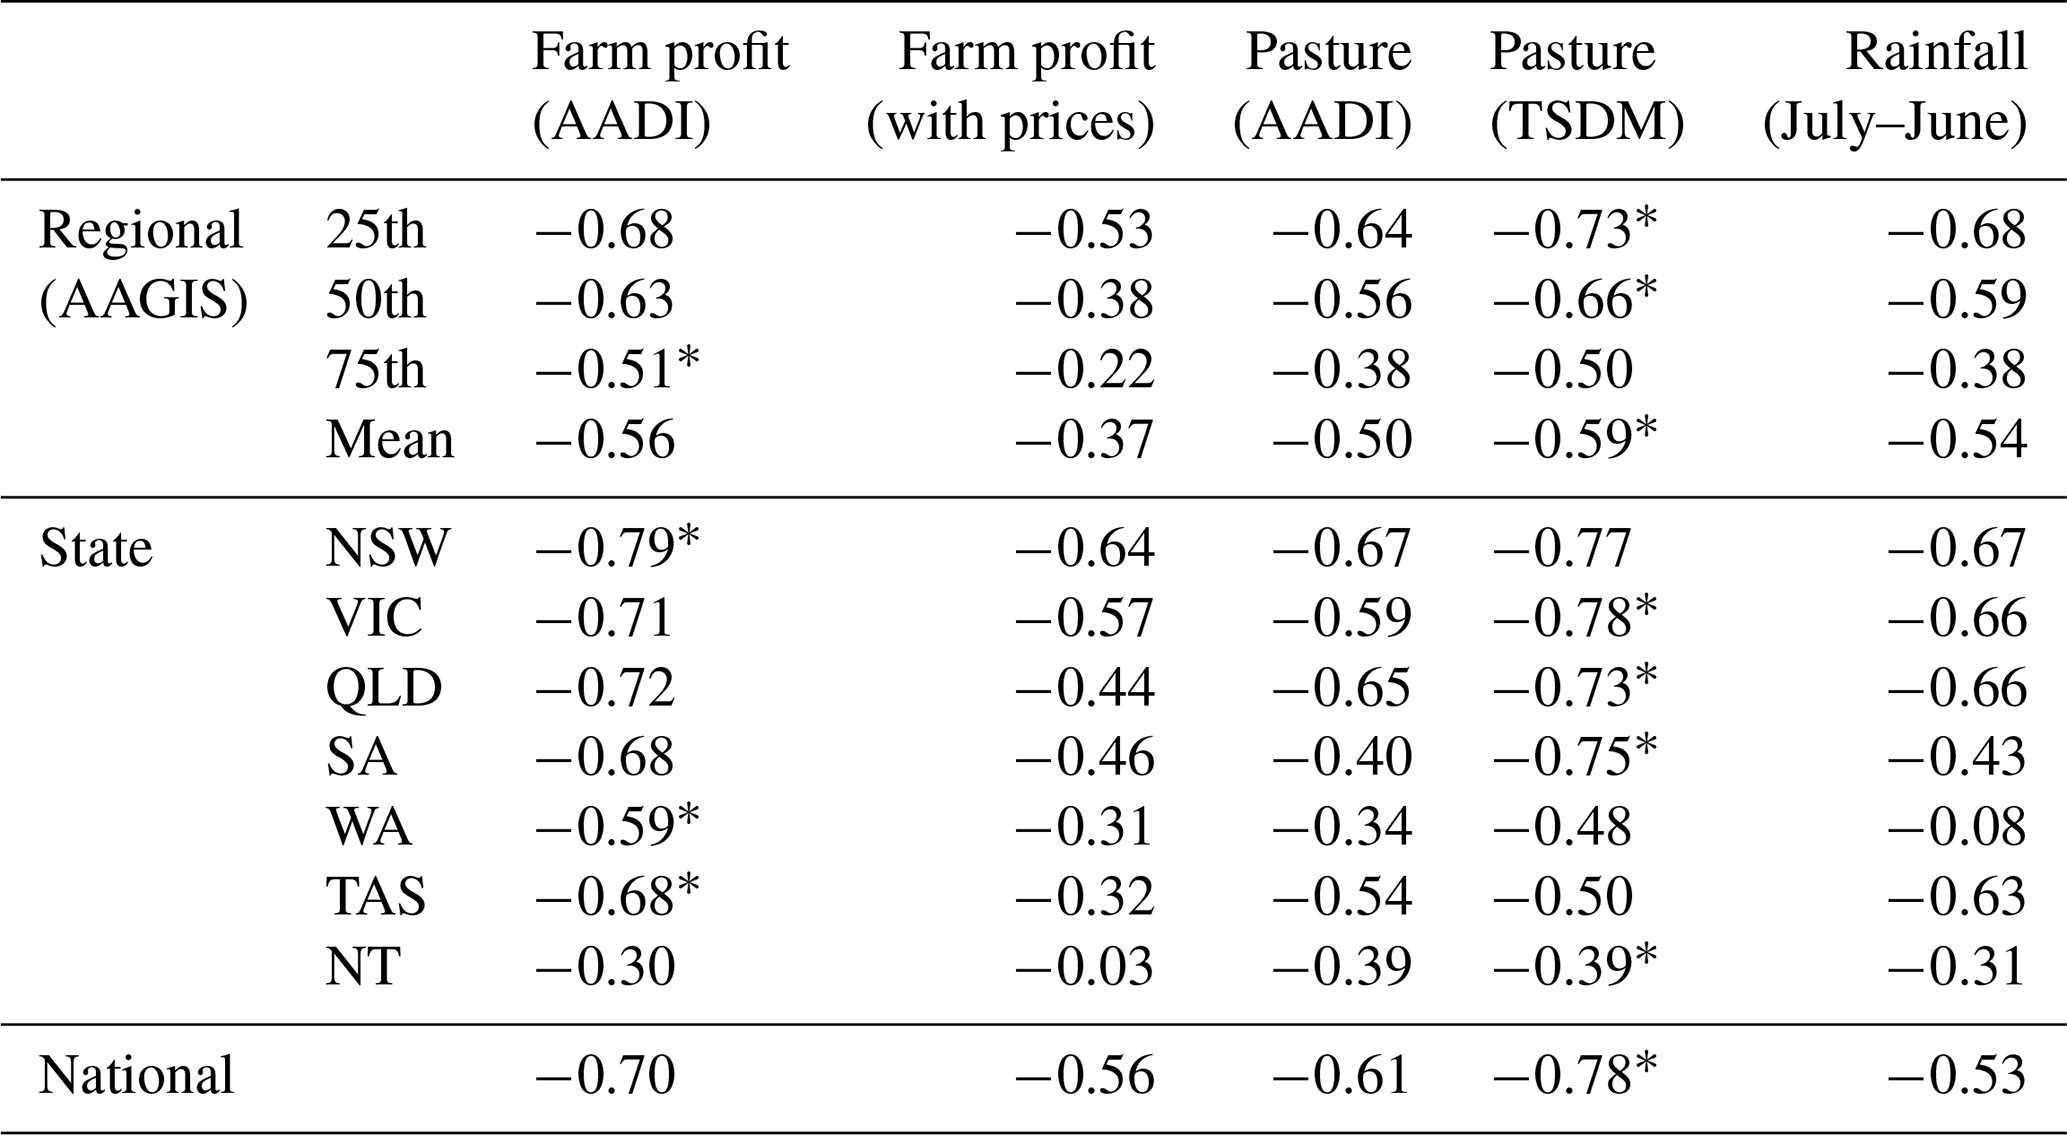
∗ Indicator with highest correlation.
As might be expected, the farm profit “climate only” indicator shows better correlation than the “with prices” version, consistent with the common perception that drought is derived from adverse weather conditions (rather than adverse economic conditions) (Table 5). Overall, the pasture (TSDM) indicator shows the highest correlation with farmer self-assessments of drought, with both the pasture (TSDM) and the farm profit (climate only) indicators offering gains compared with annual rainfall percentiles (Table 5).
3.3 Socio-economic outcomes
Tables 6 and 7 and Fig. 7 present regression results estimating the marginal effect of low (< 10th percentile) indicator values on a range of socio-economic indicators. These results show that farm profit is a superior indicator of socio-economic outcomes in regional areas. Across most of the variables considered, farm profit indicators show the largest and most statistically significant effects. Further, these responses are broadly consistent with prior expectations. For example, droughts (indicators < 10th percentile) are associated with declines in regional income, house sales, job numbers and birth rates and increases in FHA claims, personal insolvencies, small-business exits and mortality.
Table 6Percentage effect of drought (drought indicator below 10th percentile) on selected regional socio-economic outcomes.
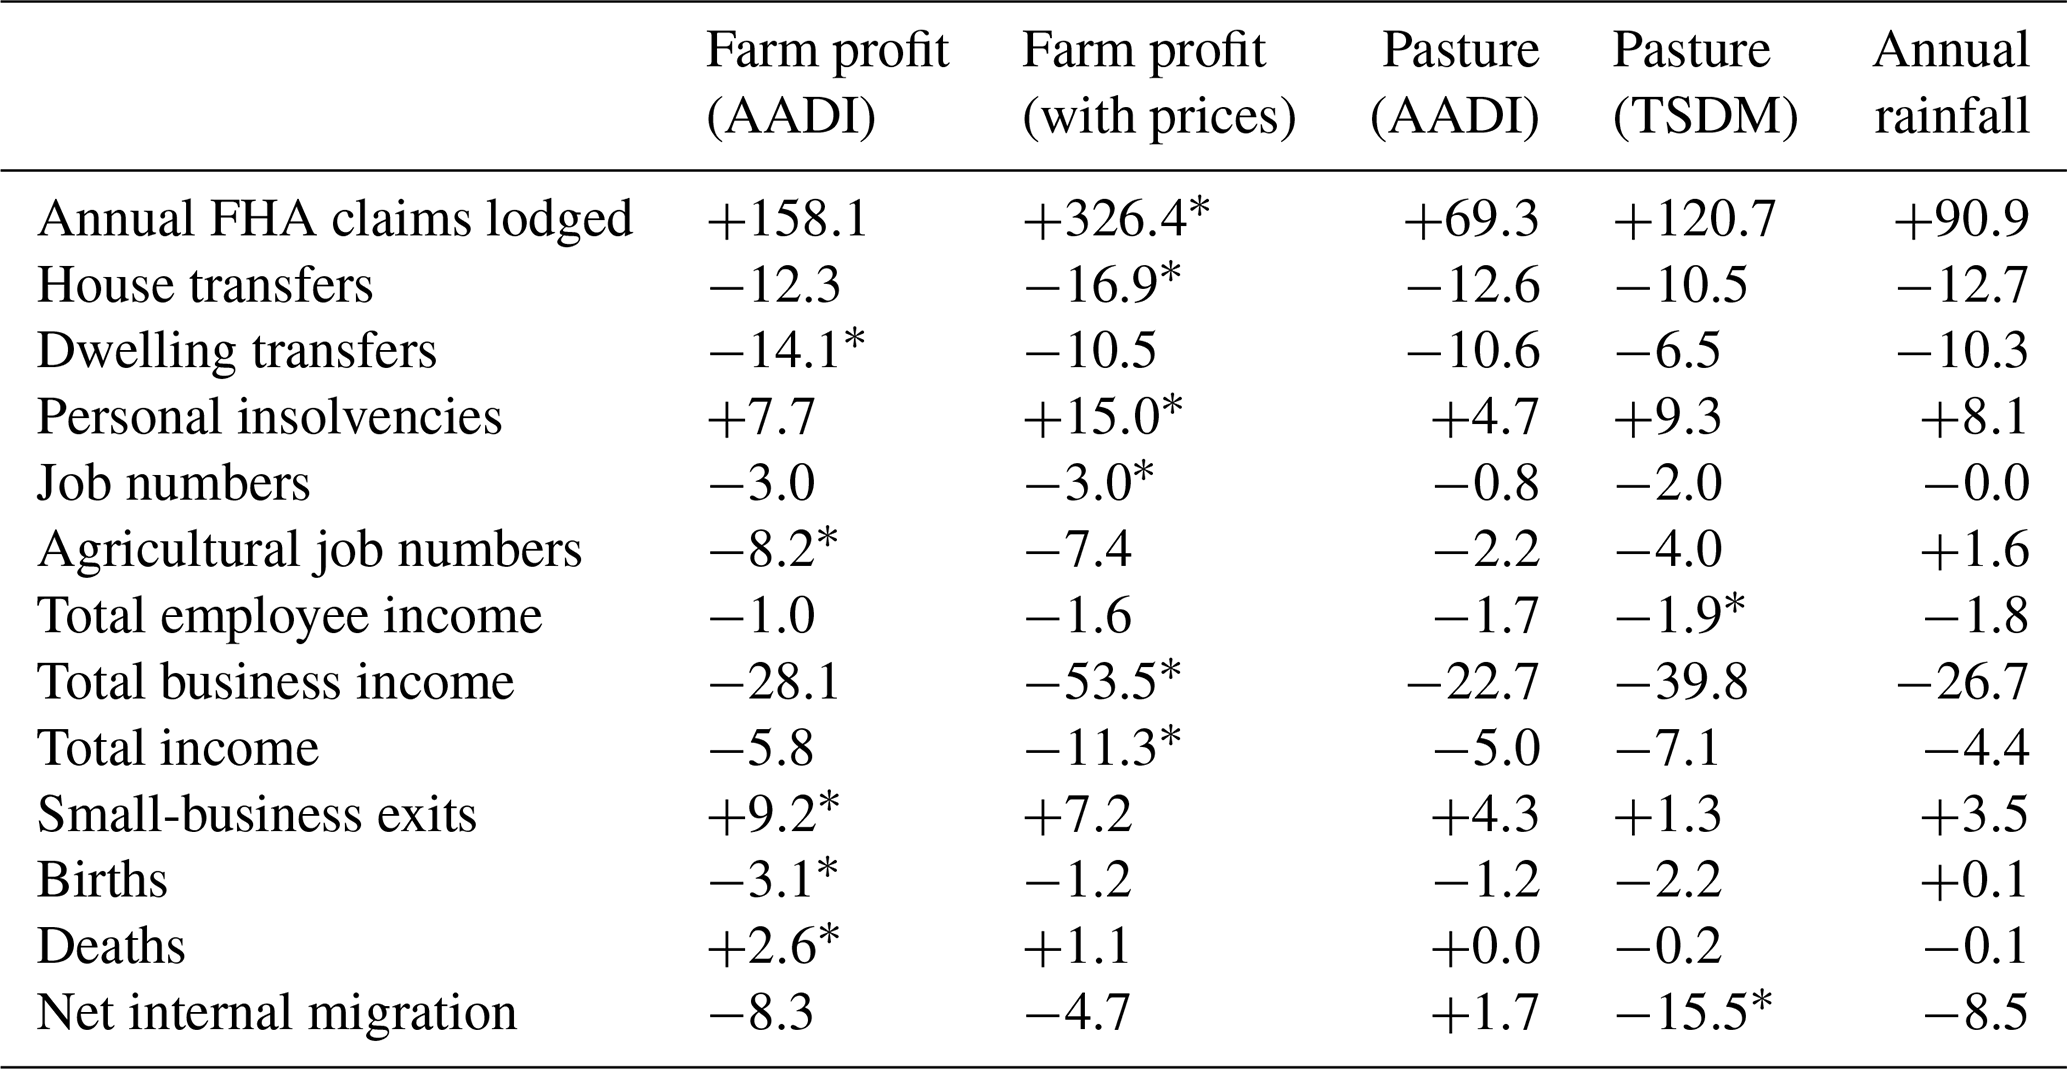
∗ Largest effect and statistically significant at 1 % level.
Table 7Marginal effect of drought (drought indicator below 10th percentile) on selected regional outcomes.
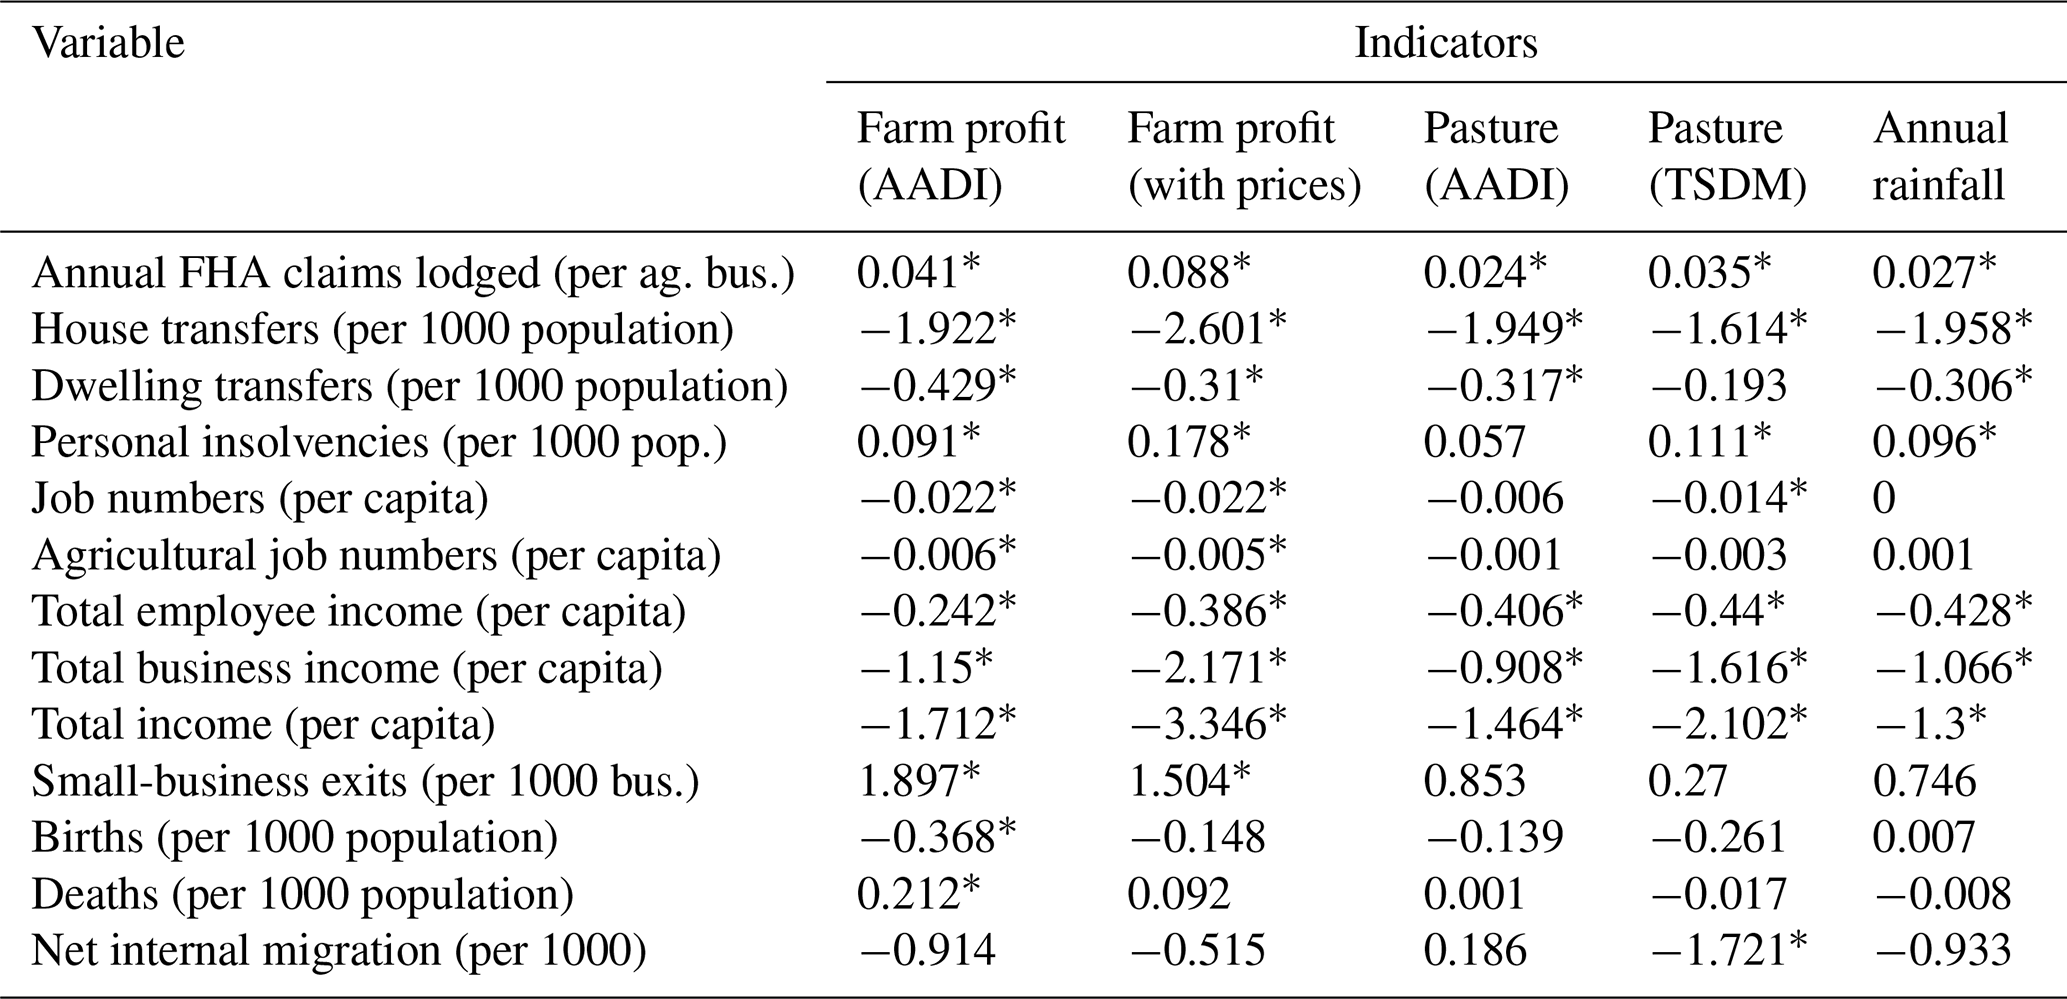
∗ Statistically significant at 1 % level.
As would be expected, the farm profit (with prices) indicator typically shows the largest effects on economic outcomes (Table 6). Farm profit shocks are associated with significant declines in business income (−54 %), total income (−11 %), jobs (−3 %) and house sales (−17 %) and significant increases in personal insolvencies (+15 %) and small-business exits (+7.2 %). As shown earlier, the farm profit “with prices” indicator is also strongly correlated with FHA claims, which increase from an average of 0.03 per agricultural business (in an above-10th-percentile year) to 0.11 (in a below-10th-percentile year).
While the correlations are generally weaker for demographic variables, significant effects are still observed for births, deaths and net migration. For births and deaths, the climate only version of the farm profit indicator shows the most significant and strongest effects: a −3 % effect on regional births and a +3 % effect on deaths. Net regional migration is also negatively affected by drought, with the strongest indicator being the pasture (TSDM) measure (+16 %).
Overall, the relative performance of the indicators is largely consistent with prior expectations. Economic impacts of drought within Australian regional areas are expected to be transmitted mostly via declines in farm business incomes and subsequent flow-on impacts across the local economy (see Fleming-Muñoz et al., 2023). As such, the farm profit “with prices” indicator tends to dominate in this context. In contrast, impacts on fertility, mortality and migration will depend on a wider set of casual factors beyond farm incomes, including, for example, direct weather effects on human physical and mental health (see, Hanigan et al., 2012, 2018; Fleming-Muñoz et al., 2023).
The Australian Agricultural Drought Indicators (AADI) are the product of an integrated modelling system which simulates specific agricultural outcomes (i.e. crop yields, pasture growth and farm profits) from gridded climate data. These results are used to derive outcome-based indicators intended to represent different aspects of agricultural drought. The key purpose of this paper was to evaluate these indicators by testing their performance against historical outcome data and contrasting that against a commonly used meteorological indicator (i.e. rainfall percentiles).
Overall, the results demonstrate the value of an outcome-based approach to drought. The indicators of the AADI have consistently higher correlation with a range of agricultural and economic outcomes. The farm profit (with prices) indicator – which accounts for both climatic and price variability – was found to be a particularly strong predictor of farm outcomes, in many cases offering large gains relative to the “climate only” indicator.
In line with the findings of Hughes et al. (2022a), the AADI farm profit (climate only) and pasture indicators proved more consistent with farmer self-assessments of drought than rainfall, and as would be expected the farm profit “with prices” indicator proved less consistent. While an indicator reflecting both price and climate effects is unconventional (at least relative to common perceptions of drought) it is a superior predictor of economic drought impacts and would likely be of use to AADI's intended government audience. For example, the farm profit indicator was able to predict historical demand for a key Australian Government drought programme. Analysis of FHA claim data found an effect size for the farm profit (with prices) indicator around 3 times that of a rainfall percentile (and around twice that of the farm profit “climate only” indicator, Table 5).
While models can predict outcomes better than climatic data alone, measurement errors (i.e. differences between indicators and on-the-ground outcomes) are unavoidable given the limits of the underlying models and the approximations required to perform simulations on national grids. This study provides a detailed picture of the skill of each of the indicators of the AADI and how this varies spatially. In future, estimates of indicator skill could be added to the operational system to inform end-users while also being used to guide system enhancements. While current performance may be adequate for the intended government use case, future improvements in skill could make other farm-level applications – such as index-based insurance or farmer decision support – more feasible by reducing “basis risk” (see Hughes et al., 2022a).
At a regional level, the performance of the farm profit indicators is weaker in some livestock-dominant regions, particularly the remote rangelands of Western Australia, far northern Australia and parts of coastal Queensland. To some extent this reflects the limitations of the farmpredict model, which currently performs better for cropping than for livestock farms (Hughes et al., 2022b). Higher-resolution maps also identify specific areas of weaker performance in southern Australia (Appendix B2), which warrants further consideration.
The APSIM-based crop yield indicators show good correlation with observed yields in most regions; however, the performance is lower along the coastal fringe of the cropping zone. In these areas, and in much of the South Australian cropping zone, the AADI wheat indicator is outperformed by growing-season rainfall. Future research could consider alternative specifications of APSIM or simpler statistical models as an alternative (for example Potgieter et al., 2022; Pang et al., 2022; Stephens, 1998). The current AADI pasture indicator is based on estimates of annual pasture growth (kg); however in the more remote rangeland regions, an indicator based on available pasture biomass (total standing dry matter) appears to have greater predictive power. Future research could consider whether the indicators of the AADI could be designed in a more flexible way to exploit the model or measure with the highest prevailing skill at each location.
Perhaps the most surprising result from this study is the ability of AADI to generalize beyond agriculture and predict broader socio-economic drought impacts. The AADI farm profit indicators were found to have superior correlation with a range of regional economic impacts, predicting drought-related decreases in regional incomes, jobs and house sales and increases in personal insolvencies and business exits. This study also found some correlation between the indicators and demographic outcomes, with drought linked to lower birth rates, higher mortality and negative net migration. While there has been some research measuring the effects of drought (as opposed to extreme heat) on mortality in the USA (Berman et al., 2017; Salvador et al., 2023; Lynch et al., 2020), the findings have been mixed. In Australia, research has been limited to mental health effects and suicide risk (Hanigan et al., 2012, 2018; Edwards et al., 2015), while fertility and migration have received limited attention in general. This study makes use of a relatively new dataset derived from administrative records. While beyond the scope of this study, future research could use these data to examine the transmission of socio-economic drought impacts in more detail.
A1 Soil data
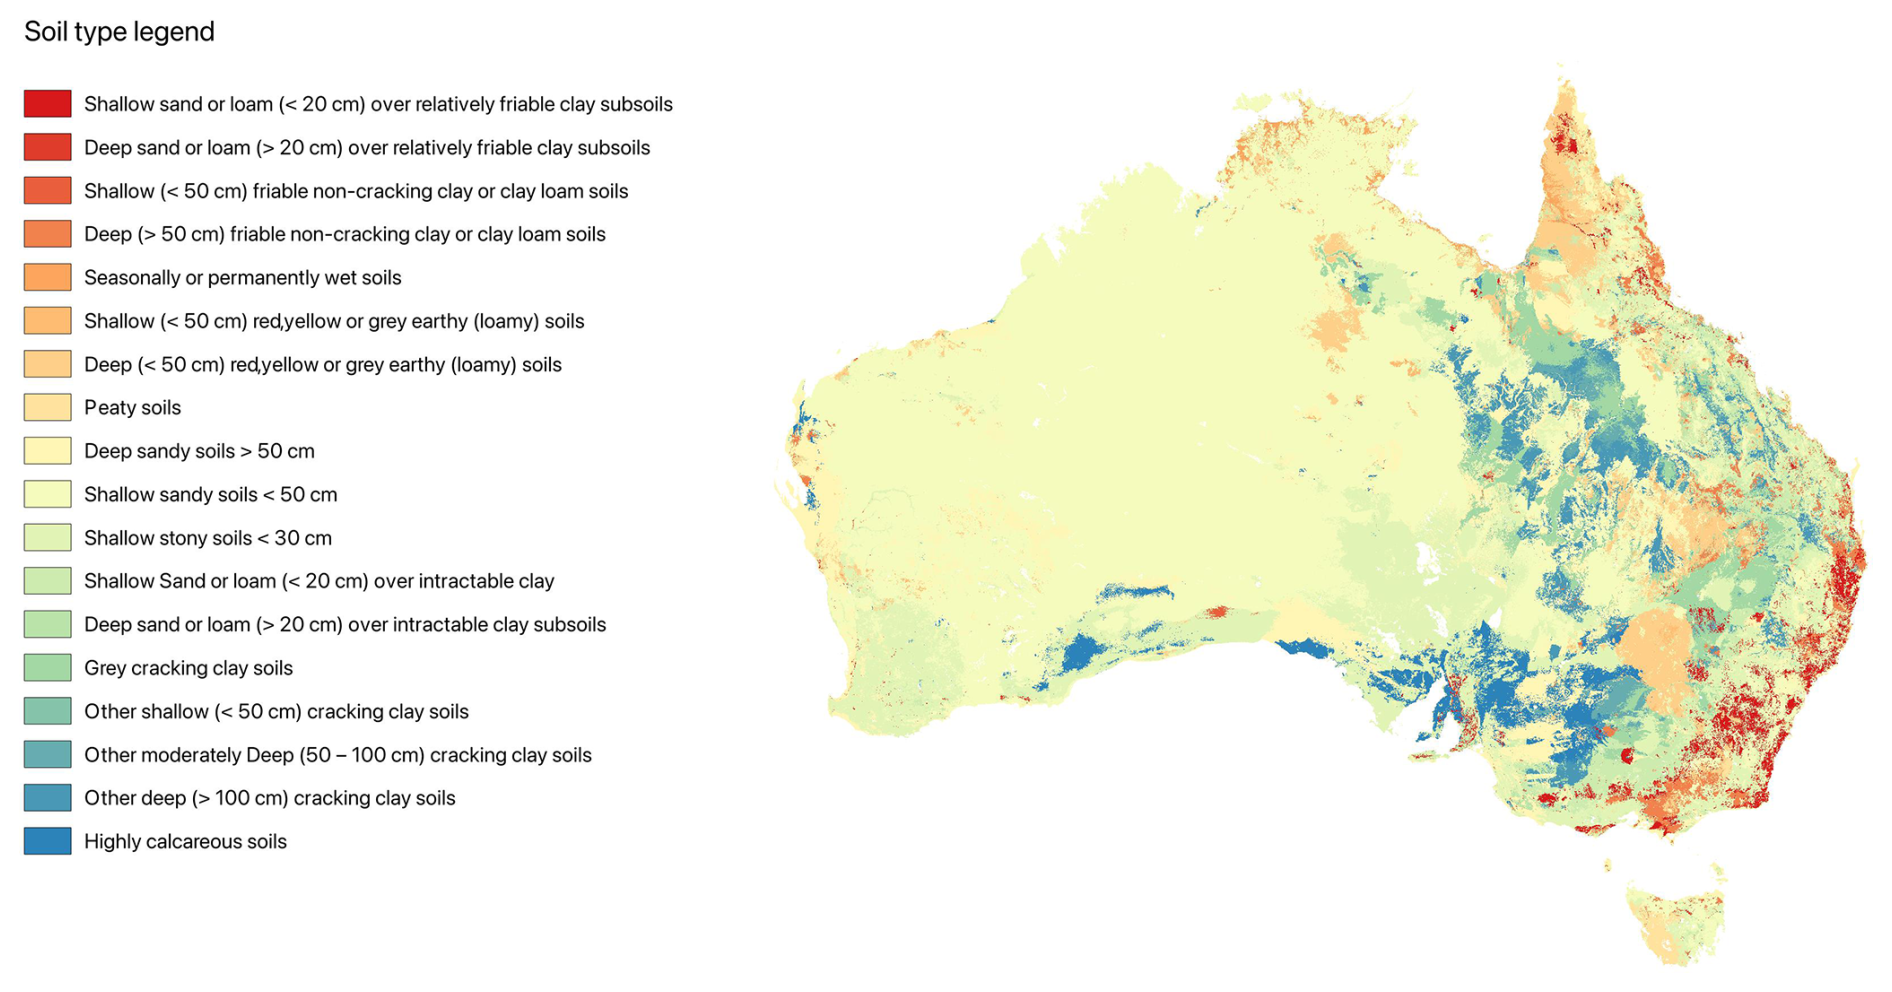
Figure A1National Soil Generic Group (SGG) dominant-class map.
A2 Farm business data
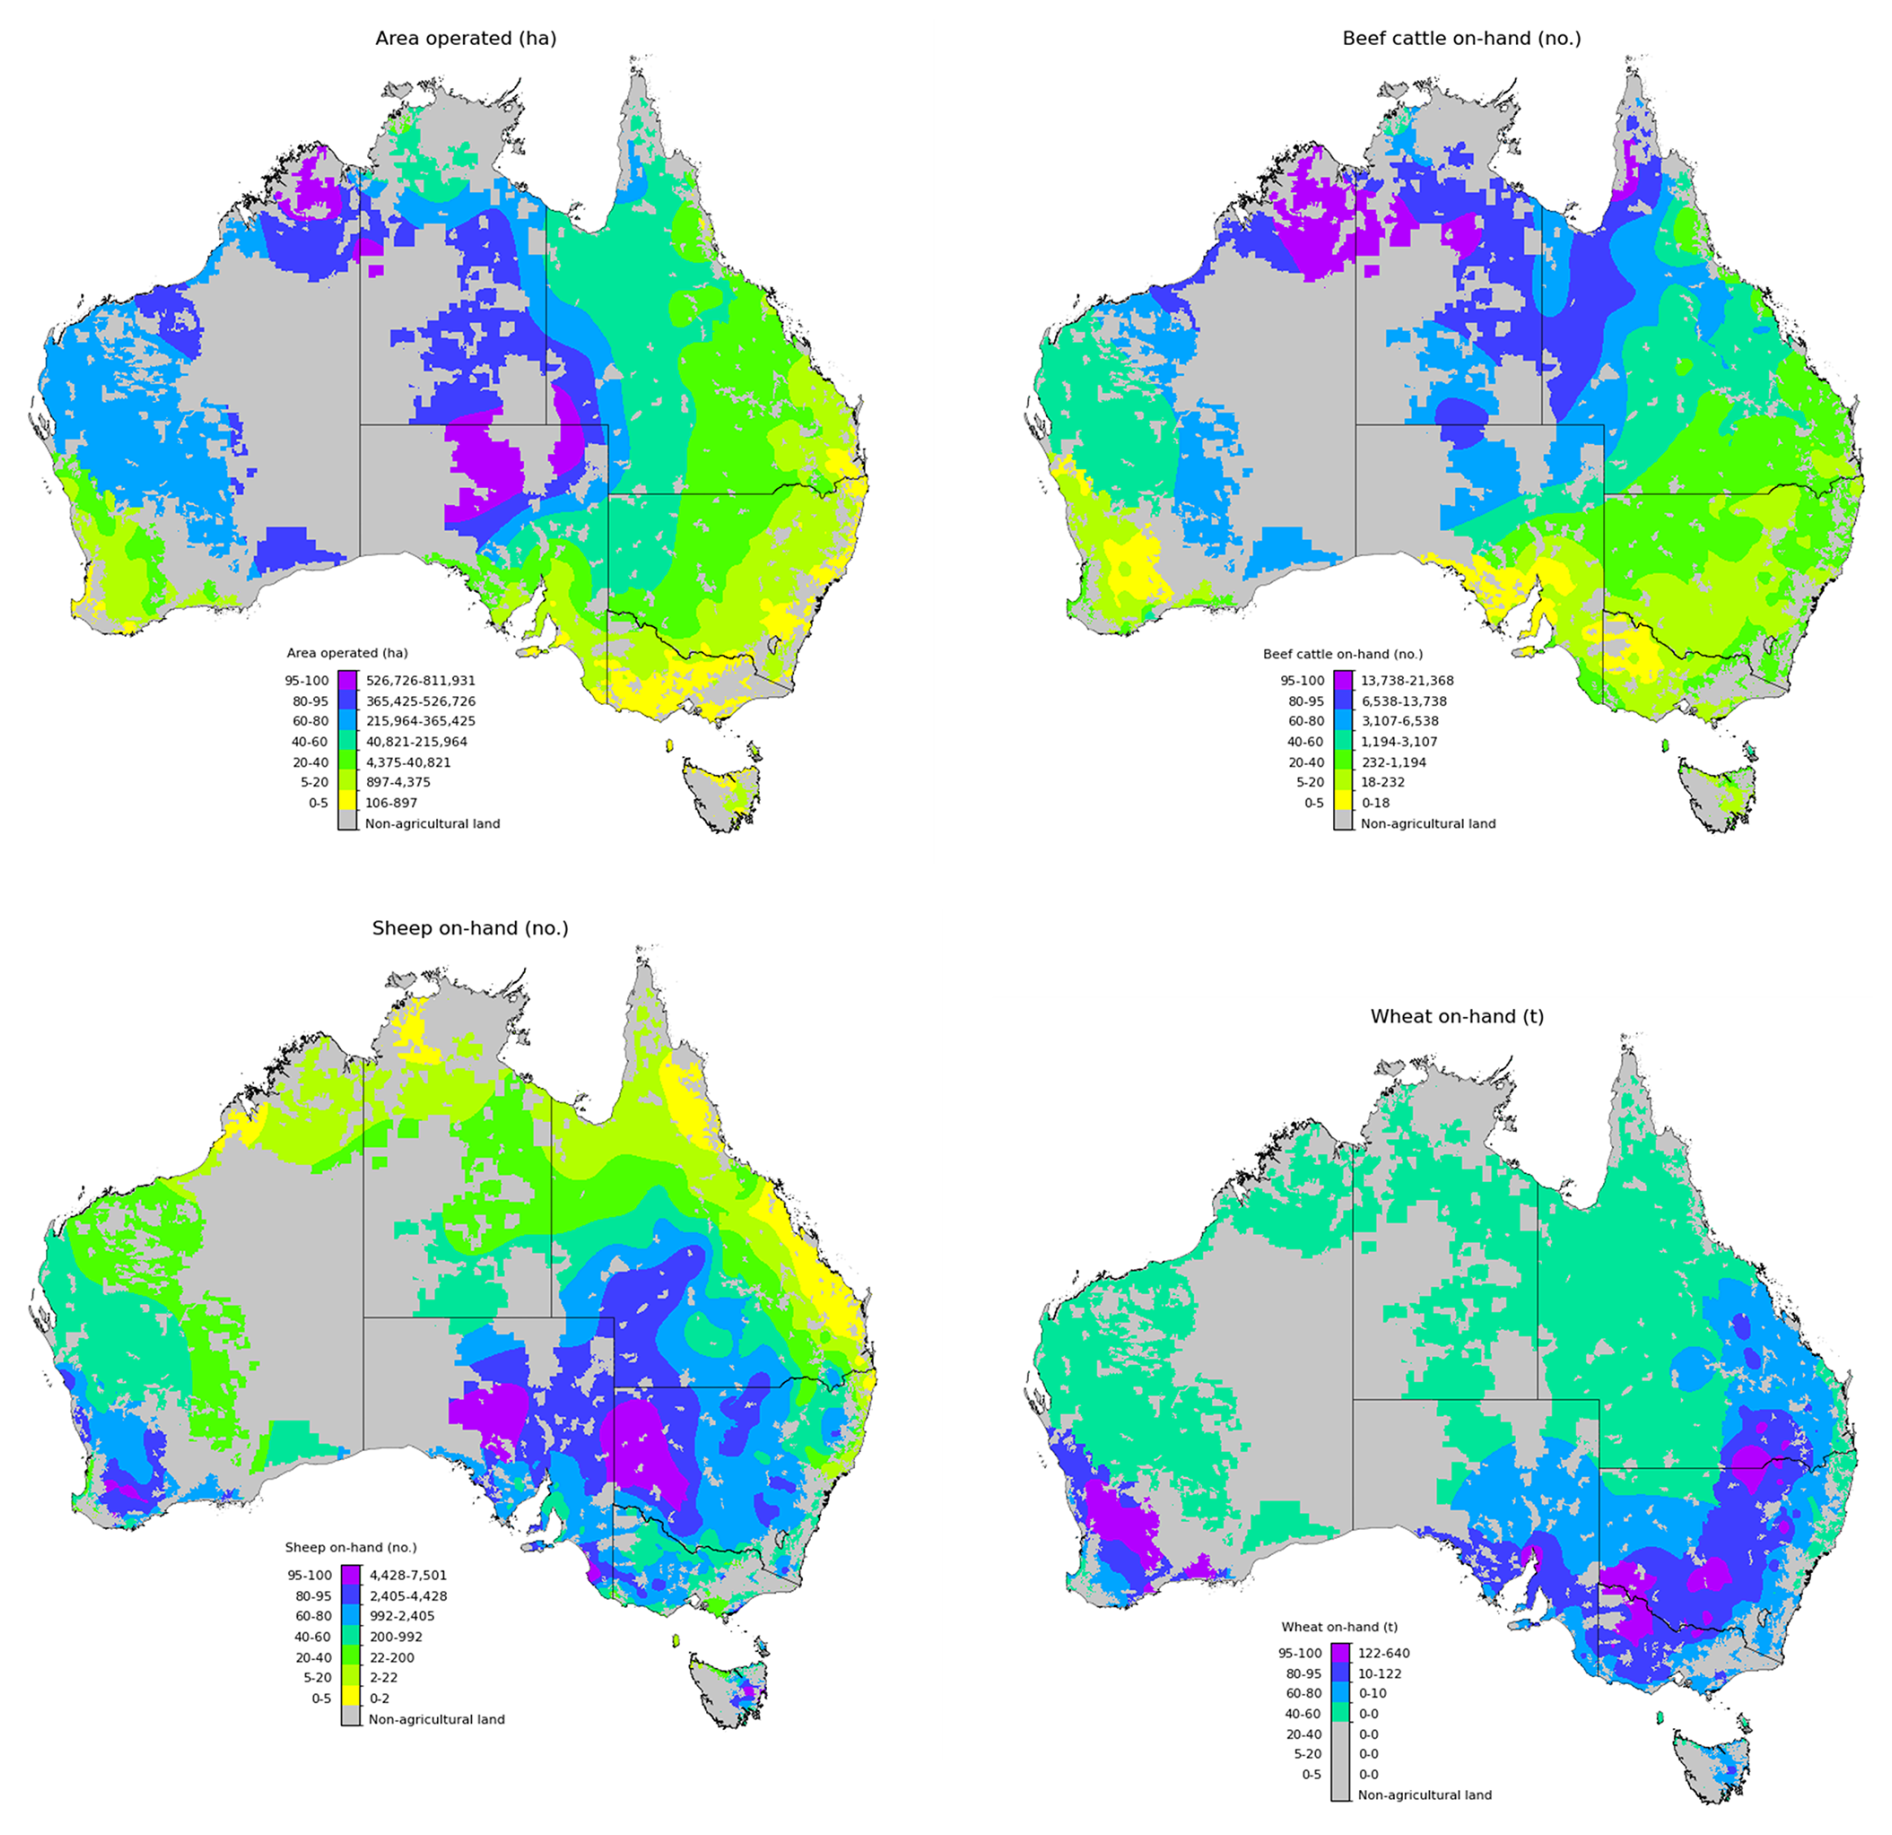
Figure A2Synthetic farm business data selected variables.
A3 Pasture simulations
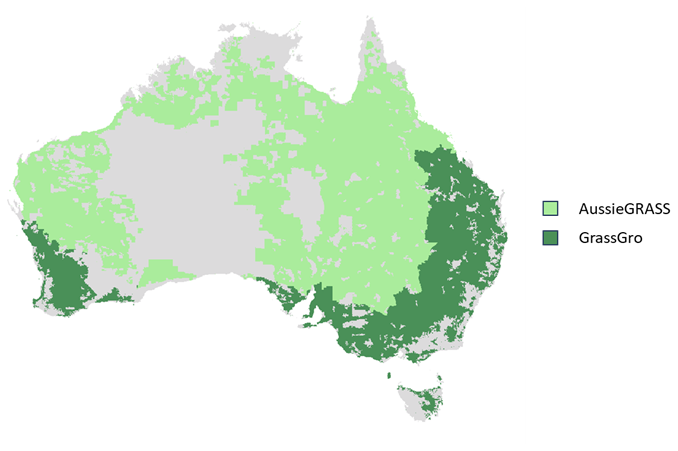
Figure A3Extent of AussieGRASS and GrassGro pasture growth data using in the AADI pasture indicator.
A4 Crop simulations
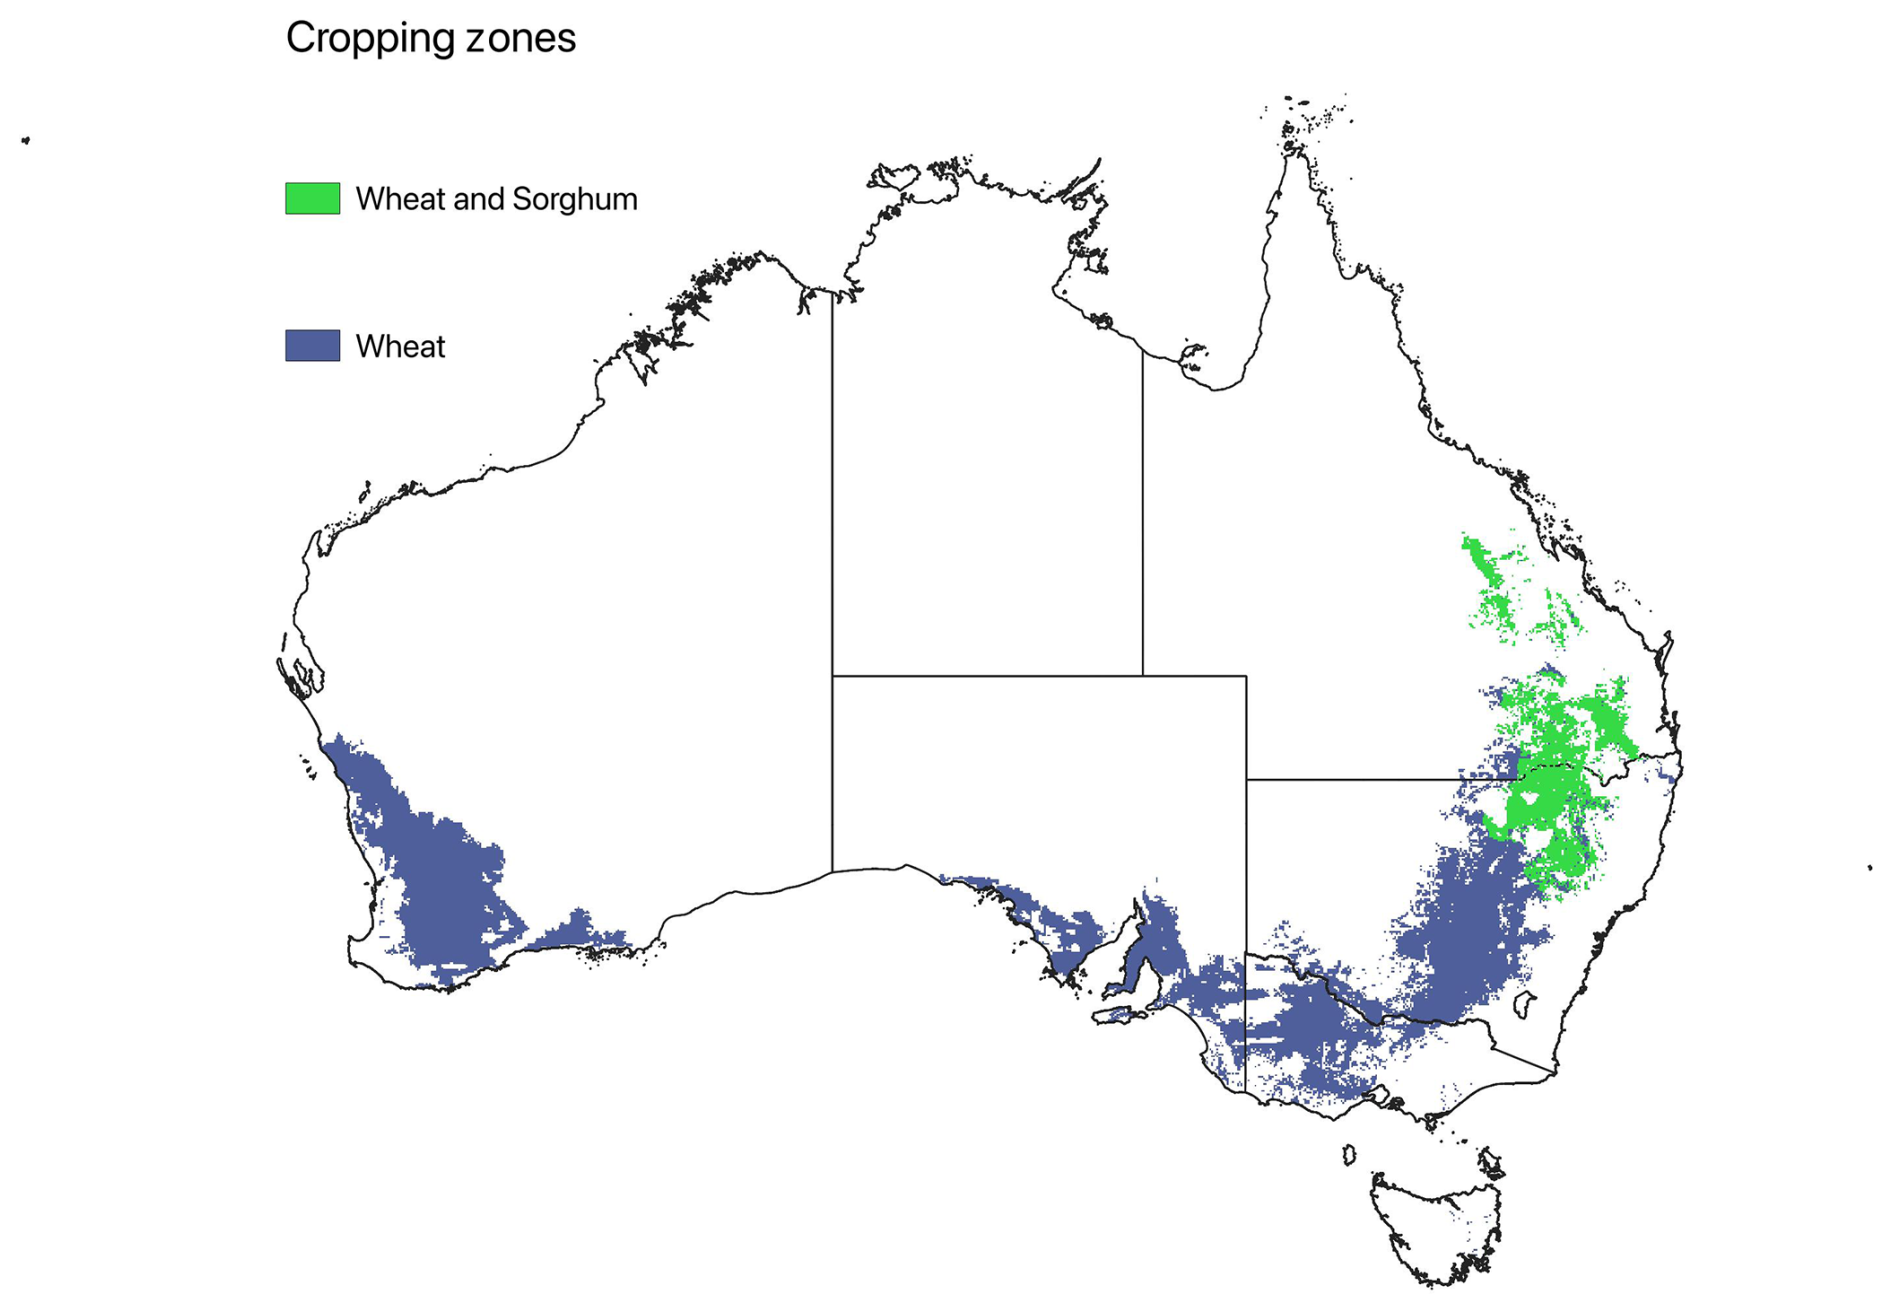
Figure A4Extent of AADI cropping simulations for the winter (wheat) and summer (sorghum) crop yield indicators.
B1 AADI correlation with farmer drought self-assessments and FHA claims
As shown in Fig. B1, the AADI farm profit (with prices) indicator (Fig. B1b) is better correlated with FHA claims than the climate only version (Fig. B1a), particularly in eastern Australia, while the farm profit (with climate) indicator shows better correlation with farmer drought self-assessments across most regions (Fig. B1c), compared to the farm profit (with prices) version (Fig. B1d).
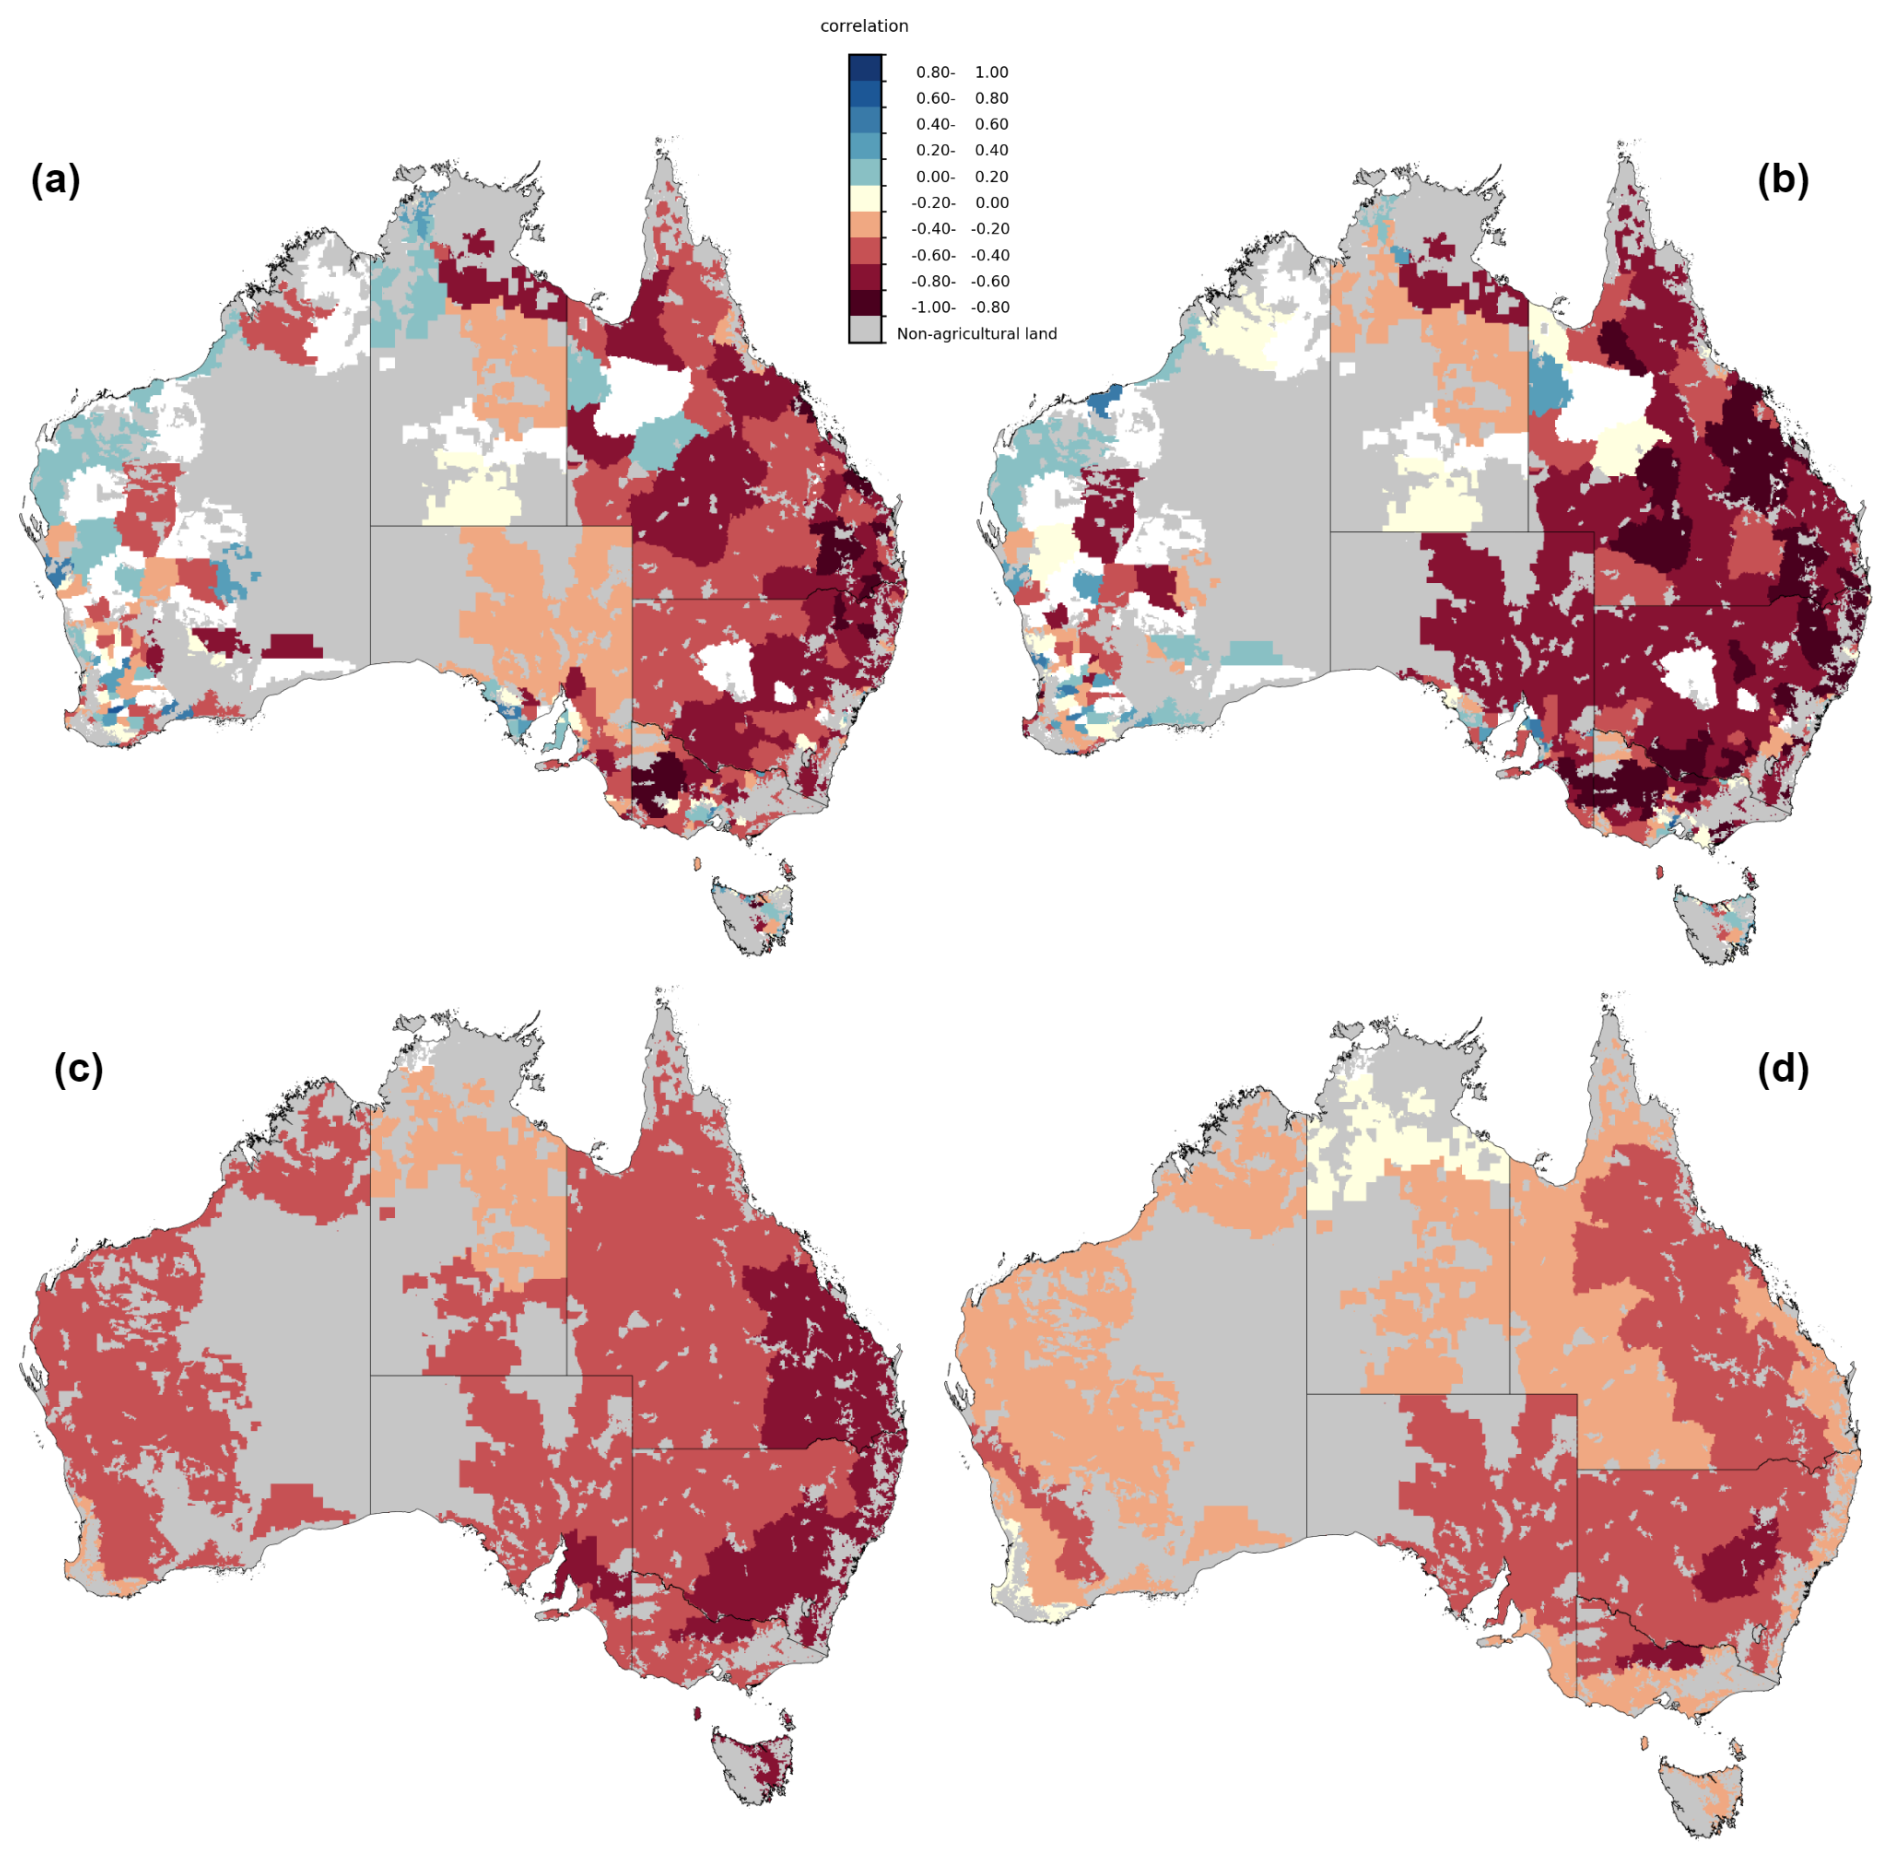
Figure B1(a) AADI farm profit (climate only) indicator correlation with FHA claims. (b) AADI farm profit (with prices) indicator correlation with FHA claims. (c) AADI farm profit (climate only) indicator correlation with farmer drought self-assessments. (d) AADI farm profit (with prices) indicator correlation with farmer drought self-assessments.
B2 AADI correlation with interpolated data
In this section the indicators of the AADI are evaluated at the 0.05° scale by measuring their correlation with gridded observational data. These gridded observation data are derived from geo-coded unit-record AAGIS data (individual farm survey respondents/farm business locations), which have been interpolated across the 0.05° grid using the same distance-weighted kernel smoothing method applied to the AADI farm business data (summarized in Sect. 2.1.1 of this article and in the AADI progress report; see Hughes et al., 2024).
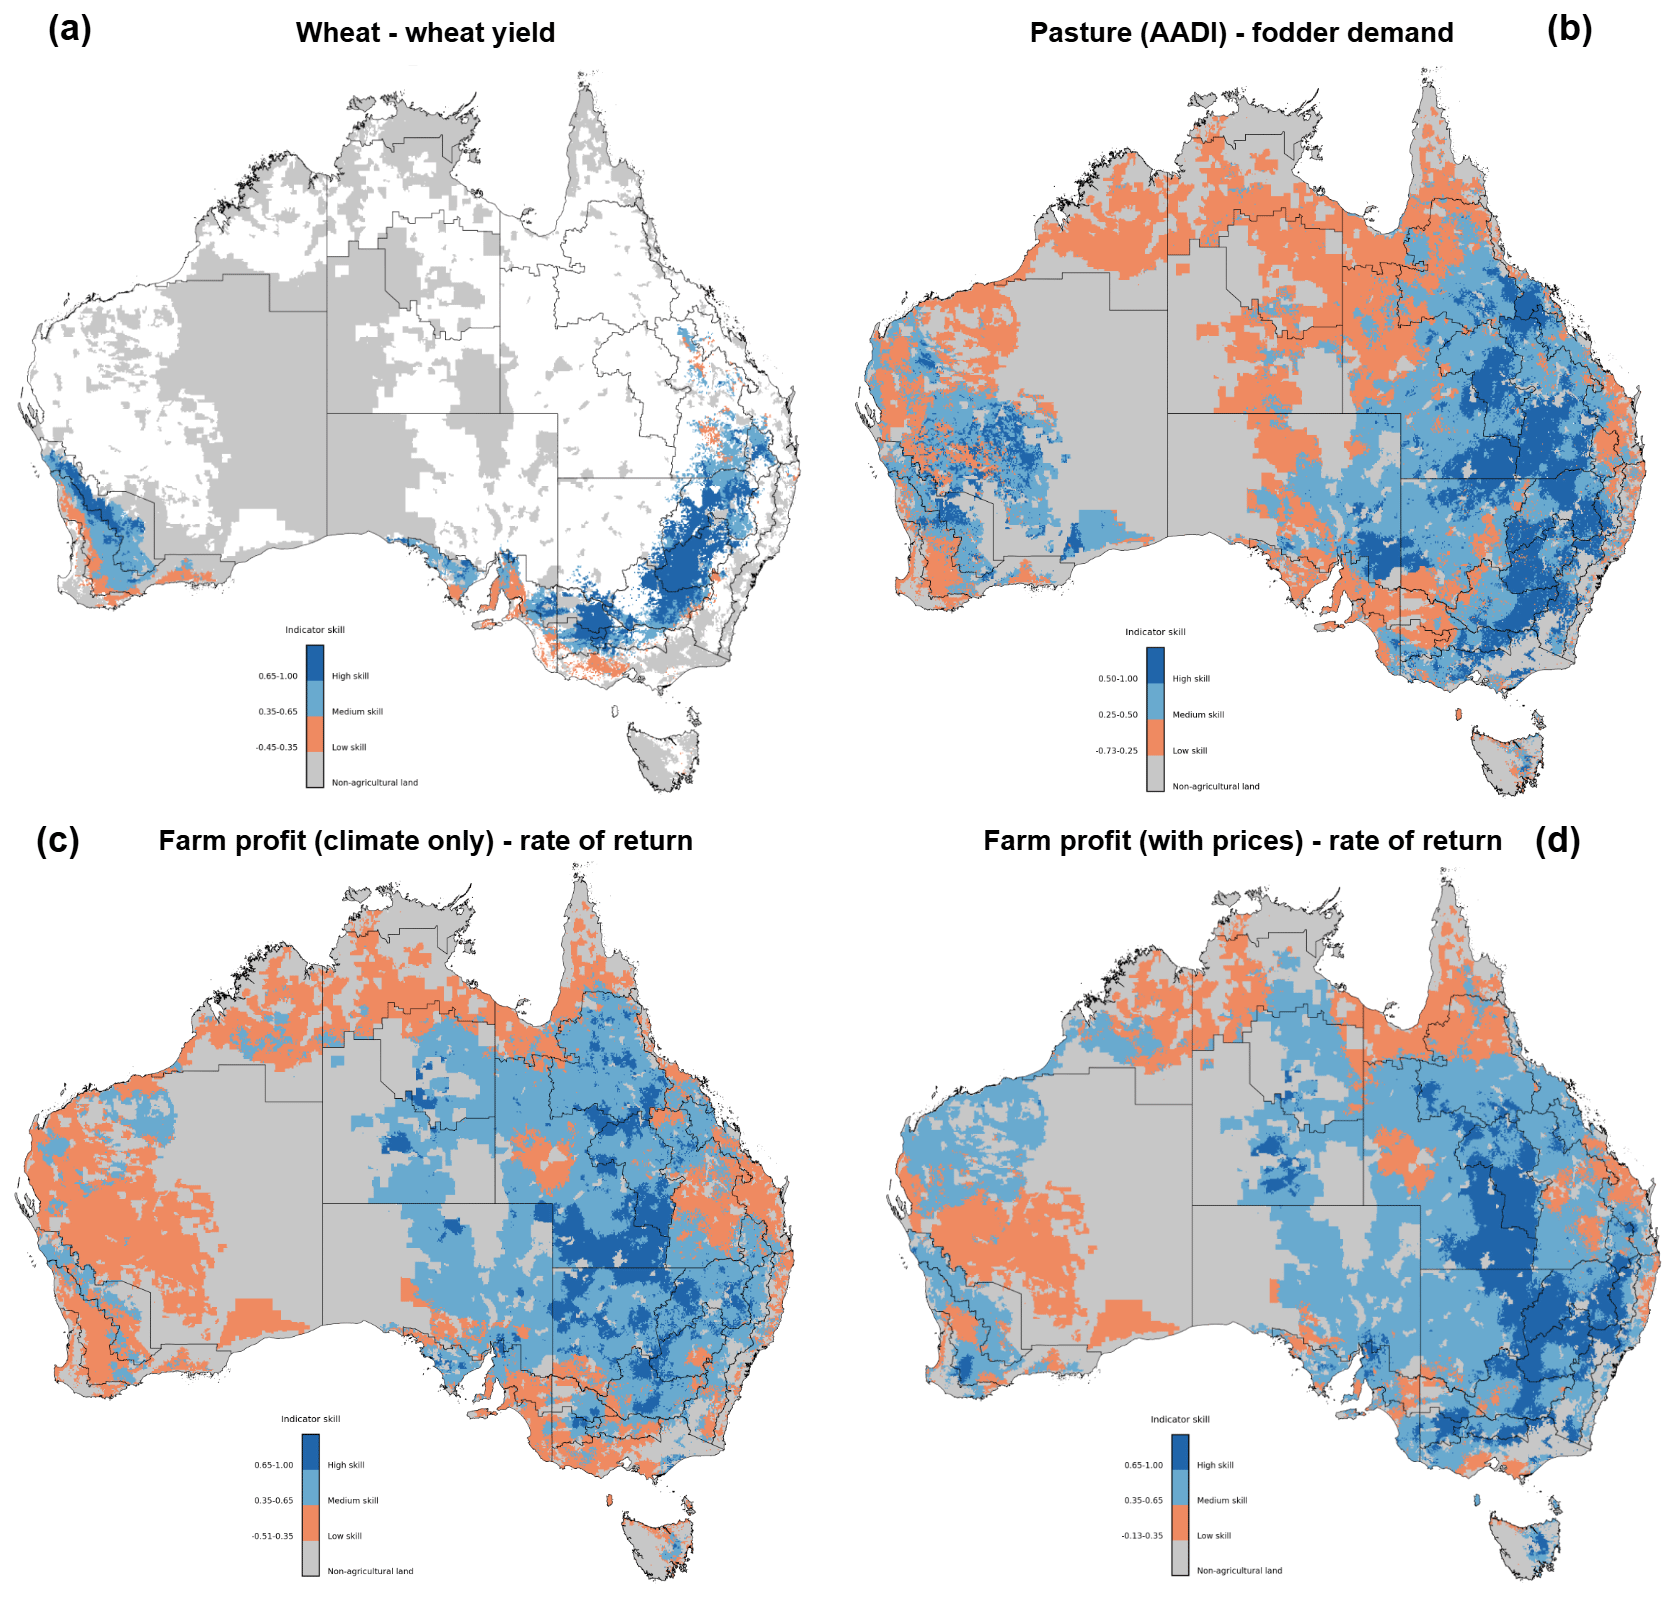
Figure B2(a) AADI wheat indicator: correlation with interpolated wheat yield (AAGIS) from 1990–1991 to 2022–2023 at the 0.05° grid scale. (b) Pasture (TSDM) indicator: correlation with interpolated farm profit (AAGIS) from 1990–1991 to 2022–2023 at the 0.05° grid scale. (c) AADI farm profit (climate only) indicator: correlation with the interpolated farm rate of return (AAGIS) from 1990–1991 to 2022–2023 at the 0.05° grid scale. (d) Farm profit (with prices) indicator: correlation with the interpolated farm rate of return (AAGIS) from 1990–1991 to 2022–2023 at the 0.05° grid scale.
Results are shown in Fig. B2. These maps show high-level patterns comparable to the regional results presented in the main article, just with much higher resolution. While these results show more precise patterns, they need to be treated with a degree of caution, given that the observational data are interpolated.
Datasets used to produce the validation results presented in this paper are available for download at Mendeley Data (https://doi.org/10.17632/8yhcr28wbk.1, Hughes, 2024). These datasets include observed outcome data (as outlined in Table 1) along with the indicators of the AADI aggregated to the same regional scales (LGA and AAGIS regions). FHA claim data are held by DAFF and could not be included in the datasets due to privacy constraints (all other data listed in Table 1 are included). Historical gridded farm simulation data generated from the AADI project are available via the ABARES website as the Australian Gridded Farm Data (https://www.agriculture.gov.au/abares/research-topics/surveys/farm-survey-data/australian-gridded-farm-data, ABARES, 2024a). ABARES AAGIS farm survey data are available online (https://www.agriculture.gov.au/abares/research-topics/surveys/farm-survey-data, ABARES, 2024b). ABS “data by region” are available online (https://dbr.abs.gov.au/, ABS, 2024). SILO climate data and a selection of AussieGRASS outputs are available via the Queensland Government “The Long Paddock” site (https://www.longpaddock.qld.gov.au/, Queensland Government, 2024).
NH, DG and MG provided project leadership for AADI. AS led the climate forecast calibration and downscaling with contributions from YS. DG and ZH contributed to AADI crop simulation modelling. RS developed the national soil data. PM and YB contributed to GrassGro pasture modelling. JC and DB undertook AussieGRASS modelling. NH, GB, AT, PT and MG contributed to AADI farmpredict modelling. CS and PT developed operational modelling and data systems for AADI. LG developed data ingestion processes for the AADI UI. JM led the design of the AADI UI. CB led the development of the AADI UI, with contributions from RS. NH, MG and SB undertook the validation analysis. NH wrote the manuscript with contributions from DG, AS, ZH and MG.
The contact author has declared that none of the authors has any competing interests.
Publisher's note: Copernicus Publications remains neutral with regard to jurisdictional claims made in the text, published maps, institutional affiliations, or any other geographical representation in this paper. While Copernicus Publications makes every effort to include appropriate place names, the final responsibility lies with the authors.
The AADI (formerly Drought Early Warning System, DEWS) project was funded by the Australian Government Department of Agriculture, Fisheries and Forestry (DAFF). The AADI UI was developed in collaboration with the Climate Services for Agriculture (CSA) project, which is funded by the Australian Government's Future Drought Fund. The AADI project team would like to acknowledge the contribution of participants in the DEWS/AADI Community of Practice, who provided helpful guidance and feedback during the development phase, along with DAFF staff who participated in UI design and testing. Andrew Moore from CSIRO also provided helpful comments on the choice of benchmarking variables for pasture indicators. The authors also wish to acknowledge the significant technical contribution of Heidi Horan in the configuration and fine-tuning of APSIM simulations for AADI.
This research has been supported by the Department of Agriculture, Fisheries and Forestry, Australian Government.
This paper was edited by David J. Peres and reviewed by Mirela-Adriana Anghelache and one anonymous referee.
ABARES: Australian Gridded Farm Data, ABARES [data set], https://www.agriculture.gov.au/abares/research-topics/surveys/farm-survey-data/australian-gridded-farm-data (last access: 1 January 2024), 2024a.
ABARES: Australian Agricultural and Grazing Industry Survey Data, ABARES [data set], https://www.agriculture.gov.au/abares/research-topics/surveys/farm-survey-data (last access: 1 January 2024), 2024b.
ABS: Data-by-region, ABS [data set], https://dbr.abs.gov.au/ (last access: 1 January 2024), 2024.
Bachmair, S., Stahl, K., Collins, K., Hannaford, J., Acreman, M., Svoboda, M., Knutson, C., Smith, K. H., Wall, N., Fuchs, B., Crossman, N. D., and Overton, I. C.: Drought indicators revisited: the need for a wider consideration of environment and society, WIRES Water, 3, 1154, https://doi.org/10.1002/wat2.1154, 2016.
Bartley, R., Thomas, M., Clifford, D., Phillip, S., Brough, D., Harms, D., Willis, R., Gregory, L., Glover, M., and Moodie, K.: Land suitability: technical methods, in: A Technical Report to the Australian Government for the Flinders and Gilbert Agricultural Resource Assessment (FGARA) Project, CSIRO Australia, https://doi.org/10.4225/08/584d97f34ddf4, 2013.
Berman, J. D., Ebisu, K., Peng, R. D., Dominici, F., and Bell, M. L.: Drought and the risk of hospital admissions and mortality in older adults in western USA from 2000 to 2013: a retrospective study, The Lancet Planetary Health, 1, e17–e23, https://doi.org/10.1016/S2542-5196(17)30002-5, 2017.
Botterill, L. C. and Hayes, M. J.: Drought triggers and declarations: science and policy considerations for drought risk management, Nat. Hazards, 64, 139–151, 2012.
Cammalleri, C., Arias-Muñoz, C., Barbosa, P., de Jager, A., Magni, D., Masante, D., Mazzeschi, M., McCormick, N., Naumann, G., Spinoni, J., and Vogt, J.: A revision of the Combined Drought Indicator (CDI) used in the European Drought Observatory (EDO), Nat. Hazards Earth Syst. Sci., 21, 481–495, https://doi.org/10.5194/nhess-21-481-2021, 2021.
Carter, J. O., Hall, W. B., Brook, K. D., McKeon, G. M., Day, K. A., and Paull, C. J.: AussieGRASS: Australian Grassland and Rangeland Assessment by Spatial Simulation, in: Applications of seasonal climate forecasting in agricultural and natural ecosystems – the Australian experience, edited by: Hammer, G., Nicholls, N., and Mitchell, C., Kluwer Academic Press, Netherlands, 229–249, https://doi.org/10.1007/978-94-015-9351-9, ISBN 978-0792362708, 2000.
Commonwealth of Australia: Federal Government's response to the drought, and the adequacy and appropriateness of policies and measures to support farmers, regional communities and the Australian economy, Commonwealth of Australia – Rural and Regional Affairs and Transport References Committee, https://www.aph.gov.au/Parliamentary_Business/Committees/Senate/Rural_and_Regional_Affairs_and_Transport/DroughtResponse/Report (last access: 1 December 2024), 2021.
Diodato, N. and Bellocchi, G.: Drought stress patterns in Italy using agro-climatic indicators, Clim. Res., 36, 1–12, https://doi.org/10.3354/cr00726, 2008.
Donnelly, J. R., Simpson, R. J., Salmon, L., Moore, A. D., Freer, M., and Dove, H.: Forage-livestock models for the Australian livestock industry, in: Agricultural System Models in Field Research and Technology Transfer, CRC Press, 9–32, https://doi.org/10.1201/9781420032413, 2016.
Edwards, B., Gray, M. and Hunter, B.: The impact of drought on mental health in rural and regional Australia, Social Indicators Research, 121, 177–194, 2015.
Fleming-Muñoz, D. A., Whitten, S., and Bonnett, G. D.: The economics of drought: A review of impacts and costs, Aust. J. Agr. Resour. Ec., 67, 496–525, https://doi.org/10.1111/1467-8489.12527, 2023.
Freebairn, J. W.: Drought assistance policy, Aust. J. Agr. Econ., 27, 185–199, 1983.
Gibbs, W. J. and Maher, J. V.: Rainfall deciles drought indicators, Bureau of Meteorology Bulletin, https://library2.deakin.edu.au/record=b1458806~S1 (last access: 1 September 2025), 1967.
Guillory, L., Pudmenzky, C., Nguyen-Huy, T., Cobon, D., and Stone, R.: A drought monitor for Australia, Environ. Model. Softw., 170, 105852, https://doi.org/10.1016/j.envsoft.2023.105852, 2023.
Hanigan, I. C., Butler, C. D., Kokic, P. N., and Hutchinson, M. F.: Suicide and drought in New South Wales, Australia, 1970–2007, P. Natl. Acad. Sci. USA, 109, 13950–13955, https://doi.org/10.1073/pnas.1112965109, 2012.
Hanigan, I. C., Schirmer, J., and Niyonsenga, T.: Drought and distress in southeastern Australia, EcoHealth, 15, 642–655, https://doi.org/10.1007/s10393-018-1339-0, 2018.
Holzworth, D. P., Huth, N. I., deVoil, P. G., Zurcher, E. J., Herrmann, N. I., McLean, G., Chenu, K., van Oosterom, E. J., Snow, V., Murphy, C., and Moore, A. D.: APSIM–evolution towards a new generation of agricultural systems simulation, Environmental Modelling & Software, 62, 327–350, 2014.
Holzworth, D., Huth, N. I., Fainges, J., Brown, H., Zurcher, E., Cichota, R., Verrall, S., Herrmann, N. I., Zheng, B., and Snow, V.: APSIM Next Generation: Overcoming challenges in modernising a farming systems model, Environmental Modelling & Software, 103, 43–51, 2018.
Hughes, N.: Australian Agricultural Drought Indicators (AADI) regional indicator evaluation data, V1, Mendeley Data [data set], https://doi.org/10.17632/8yhcr28wbk.2, 2024.
Hughes, N., Soh, W. Y., Boult, C., and Lawson, K.: Defining drought from the perspective of Australian farmers, Climate Risk Management, 35, 100420, https://doi.org/10.1016/j.crm.2022.100420, 2022a.
Hughes, N., Soh, W. Y., Lawson, K., and Lu, M.: Improving the performance of micro-simulation models with machine learning: The case of Australian farms, Econ. Model., 115, 105957, https://doi.org/10.1016/j.econmod.2022.105957, 2022b.
Hughes, N., Brent, G., Gaydon, D., Schepen, A., Mitchell, P., Hochman, Z., Carter, J., Sharman, C., Taylor, P., McComb, J., and Searle, R.: The Drought Early Warning System (aka AADI) project: progress report, ABARES research report, https://www.agriculture.gov.au/abares/research-topics/climate/drought/australian-agriculture-drought-indicators-progress-report (last access: 1 December 2024), 2024.
Jeffrey, S. J., Carter, J. O., Moodie, K. B., and Beswick, A. R.: Using spatial interpolation to construct a comprehensive archive of Australian climate data, Environ. Model. Softw., 16, 309–330, 2001.
Lan, X., K.W. Thoning, and E.J. Dlugokencky.: Trends in globally-averaged CH4, N2O, and SF6 determined from NOAA Global Monitoring Laboratory measurements, Version 2022-11, https://doi.org/10.15138/P8XG-AA10, 2022.
Lloyd-Hughes, B.: The impracticality of a universal drought definition, Theor. Appl. Climatol., 117, 607–611, https://doi.org/10.1007/s00704-013-1025-7, 2014.
Lynch, K. M., Lyles, R. H., Waller, L. A., Abadi, A. M., Bell, J. E., and Gribble, M. O.: Drought severity and all-cause mortality rates among adults in the United States: 1968–2014, Environ. Health-Glob., 19, 24, https://doi.org/10.1186/s12940-020-00597-8, 2020.
Malakar, Y., Snow, S., Fleming, A., Fielke, S., Jakku, E., Tozer, C., and Darbyshire, R.: Multi-decadal climate services help farmers assess and manage future risks, Nat. Clim. Change, 14, 44–49, 2024.
McBratney, A. B., Santos, M. M., and Minasny, B.: On digital soil mapping, Geoderma, 117, 3–52, 2003.
Mishra, A. K. and Singh, V. P.: A review of drought concepts, J. Hydrol., 391, 202–216, 2010.
Moore, A. D., Donnelly, J. R., and Freer, M.: GRAZPLAN: Decision support systems for Australian grazing enterprises. III. Pasture growth and soil moisture submodels, and the GrassGro DSS, Agr. Syst., 55, 535–582, 1997.
Nelson, R., Kokic, P. and Meinke, H.: From rainfall to farm incomes – transforming advice for Australian drought policy. II. Forecasting farm incomes, Australian Journal of Agricultural Research, 58, 1004–1012, 2007.
NNDSS (National Notifiable Disease Surveillance System): National Notifiable Disease Surveillance System Dashboard, https://nindss.health.gov.au/pbi-dashboard/ (last access: 1 December 2024), 2024.
NOAA: The National Oceanic and Atmospheric Administration (NOAA) US Department of Commerce, https://gml.noaa.gov/webdata/ccgg/trends/co2/co2_annmean_gl.txt (last access: 1 December 2024), 2023.
Northcote, K. H., Beckmann, G. G., Bettenay, E., Churchward, H. M., van Dijk, D. C., Dimmock, G. M., Hubble, G. D., Isbell, R. F., McArthur, W. M., Murtha, G. G., Nicolls, K. D., Paton, T. R., Thompson, C. H., Webb, A. A., and Wright, M. J.: Atlas of Australian Soils, Sheets 1 to 10, with explanatory data, CSIRO and Melbourne University Press, Melbourne, https://doi.org/10.25919/5f1632a855c17, 1960–1968.
Pang, A., Chang, M. W. L., and Chen, Y.: Evaluation of Random Forests (RF) for Regional and Local-Scale Wheat Yield Prediction in Southeast Australia, Sensors, 22, 717, https://doi.org/10.3390/s22030717, 2022.
Potgieter, A. B., Schepen, A., Brider, J., and Hammer, G. L.: Lead time and skill of Australian wheat yield forecasts based on ENSO-analogue or GCM-derived seasonal climate forecasts – A comparative analysis, Agr. Forest Meteorol., 324, 109116, https://doi.org/10.1016/j.agrformet.2022.109116, 2022.
Queensland Government: The Long Paddock site, https://www.longpaddock.qld.gov.au/ (last access: 1 January 2024), 2024.
Richetti, J., Lawes, R. A., Whan, A., Gaydon, D. S., and Thorburn, P. J.: How well does APSIM NextGen simulate wheat yields across Australia using gridded input data? Validating Continental-Scale Crop Model Simulations, Eur. J. Agron., 158, 127212, https://doi.org/10.1016/j.eja.2024.127212, 2024.
Rickert K. G., Stuth, J. W. and McKeon, G. M.: Modelling pasture and animal production. Field and Laboratory Methods for Grassland and Animal Production Research, edited by: LT Mannetje & RM Jones, CAB International, 29-66, 2000.
Salvador, C., Nieto, R., Vicente-Serrano, S. M., García-Herrera, R., Gimeno, L., and Vicedo-Cabrera, A. M.: Public Health Implications of Drought in a Climate Change Context: A Critical Review, Annu. Rev. Publ. Health, 44, 213–232, https://doi.org/10.1146/annurev-publhealth-071421-051636, 2023.
Schepen, A., Bolt, A., Bruget, D., Carter, J., Gaydon, D., Gupta, M., Hochman, Z., Hughes, N., Sharman, C., Tan, P., and Taylor, P.: Forecasting agricultural drought: the Australian Agriculture Drought Indicators, EGUsphere [preprint], https://doi.org/10.5194/egusphere-2024-4129, 2025.
Searle, R.: The Australian site data collation to support the GlobalSoilMap, in: “GlobalSoilMap: Basis of the global spatial soil information system. Proceedings 1st GlobalSoilMap Conference”, Orléans, France, 7–9 October 2013, edited by: Arrouays, D., McKenzie, N., Hempel, J., Richer de Forges, A., and McBratney, A. B., CRC Press, Boca Raton, FL, 127–132, 2014.
Stephens, D. J.: Objective criteria for estimating the severity of drought in the wheat cropping areas of Australia, Agr. Syst., 57, 301–323, https://doi.org/10.1016/S0308-521X(98)00022-5, 1998.
Stovold, R. G. H., Adams, M., Maier, S. W., Donald, G., Gherardi, S., and Broomhall, M.: Using Pasture Growth Rate Data in a National Agricultural Drought Assessment Monitoring Tool, in: Advances in Geoscience and Remote Sensing, InTech, 513–532, https://doi.org/10.1007/978-3-540-93962-7_25, 2009.
Thompson, D. and Powell, R.: Exceptional circumstances provisions in Australia – is there too much emphasis on drought?, Agricultural Systems, 57, 469–488, 1998.
Wedd, R., Alves, O., de Burgh-Day, C., Down, C., Griffiths, M., Hendon, H. H., Hudson, D., Li, S., Lim, E. P., Marshall, A. G., Shi, L., Smith, P., Smith, G., Spillman, C. M., Wang, G., Wheeler, M. C., Yan, H., Yin, Y., Young, G., and Zhou, X.: ACCESS-S2: the upgraded Bureau of Meteorology multi-week to seasonal prediction system, Journal of Southern Hemisphere Earth Systems Science, 72, 273–288, https://doi.org/10.1071/ES22026, 2022.
Wilhite, D. A. and Glantz, M. H.: Understanding: the drought phenomenon: the role of definitions, Water Int., 10, 111–120, 1985.
Wilhite, D. A., Sivakumar, M. V. K., and Pulwarty, R.: Managing drought risk in a changing climate: The role of national drought policy, Weather and Climate Extremes, 3, 4–13, 2014.
A recent example of this issue is the operation of the Australian Drought Communities Program during 2018–2020. This programme provided government funding to drought-affected regions, using rainfall percentiles to determine eligibility with mixed success (see Commonwealth of Australia, 2021).
In Australia, the former National Agricultural Monitoring System (NAMS) included crop and pasture growth indicators (Stovold et al., 2009), while the NSW EDIS includes a plant growth index in its CDI.