the Creative Commons Attribution 4.0 License.
the Creative Commons Attribution 4.0 License.
 | 11 Sep 2025
Can model-based avalanche forecasts match the discriminatory skill of human danger-level forecasts? A comparison from Switzerland
Ross S. Purves
Stephanie Mayer
Günter Schmudlach
Kurt Winkler
In recent years, physics-based snowpack models combined with machine-learning techniques have gained momentum in public avalanche forecasting. When integrated with spatial interpolation methods, these approaches enable fully model-driven predictions of snowpack stability or avalanche danger at any location. This raises a key question: are such spatially detailed model predictions sufficiently accurate for operational use? We evaluated the performance of three spatially interpolated model-driven forecasts of snowpack stability and avalanche danger in Switzerland over three winters. As a benchmark, we used the official public avalanche-danger forecasts, specifically focusing on the forecast danger level that includes the sub-levels. We assessed the ability of both model and human forecasts to discriminate between reference distributions of conditions – typically not associated with avalanche activity – and actual avalanche events that were either naturally released or triggered by humans by calculating event ratios as proxies for release probability. Our results show that event ratios clearly increased with higher predicted avalanche probability, lower snowpack stability, or higher forecast sub-level. Overall, both model predictions and human forecasts showed a comparable ability to discriminate between reference and event conditions, with the event ratio increasing exponentially with increasing model-predicted probabilities or forecast sub-levels. However, the human forecasts – which incorporate model output – achieved a small but statistically significant advantage in discriminatory skill. This indicates that while the models alone have not yet reached the full discriminatory power of human forecasters, their performance is already approaching operational usefulness in a setup such as that used in Switzerland. As model quality is expected to improve further in coming years, it is essential to ensure optimal integration into the operational forecasting workflow to realize the full potential of model-based support. Further research should explore how to implement this effectively, how to integrate real-time avalanche occurrence data into model prediction pipelines, and how to validate increasingly high-resolution avalanche forecasts.
- Article
(6241 KB) - Full-text XML
- BibTeX
- EndNote


Public avalanche forecasts aim to inform and warn recreational and professional forecast users about the danger of snow avalanches at a regional scale. In many countries, the expected probability of avalanche release given a specific triggering level and the potential size of avalanches are described by generalizing this information in one of five avalanche-danger levels (lowest of 1 (low) to highest of 5 (very high); EAWS, 2023; avalanche.org, 2024). Avalanche conditions are then communicated using a mix of formats, including tabular, graphical, or text formats that include a mix of symbols, classes, or words (e.g., Hutter et al., 2021). These forecasts are produced by professional forecasters making judgments based on a variety of data sources, including measurements, observations, numerical weather prediction models, and – increasingly – predictions from physics-based snowpack models such as Crocus or SNOWPACK (e.g., Morin et al., 2020). The latter models are often combined with statistical models or machine-learning approaches (e.g., Pérez-Guillén et al., 2022; Fromm and Schönberger, 2022; Hendrick et al., 2023), which aim to make complex multi-layered snow-cover simulations more accessible to forecasters by extracting and summarizing information relevant to the forecasting task (e.g., Horton et al., 2020; Herla et al., 2022; Maissen et al., 2024). While forecasting chains such as SAFRAN-Crocus-MEPRA have been used operationally for many years in France (Durand et al., 1999), recent advances now allow simulations at much higher spatial and temporal resolutions – down to hourly scales and specific points – compared to the broader scales typically used in regional avalanche forecasting (e.g., hundreds of km2; Techel, 2020). These high-resolution snow-cover predictions can serve as valuable practical tools for forecasters – helping them test assumptions and refine their mental models, for instance regarding expected snowpack conditions and the evolution of snowpack stability. Moreover, spatially interpolating point or gridded predictions allows predictions for arbitrary points in space and time, as well as backcasting for avalanche events at specific locations. In addition to providing reproducible forecasts at a higher resolution, model-based forecasting is likely to free up expert time for other tasks – for example, communicating with professional and recreational mountain users.
To date, distributed snow-cover simulations or interpolated model predictions have primarily been validated by comparison with forecasters’ expert judgment – such as the forecasted presence of weak layers, avalanche problems, or danger levels (e.g., Herla et al., 2024, 2025; Maissen et al., 2024). This form of indirect validation, where model outputs at very local scales are compared to regional forecasts or judgments prepared by experts, makes interpreting a lack of agreement challenging. When model predictions and human judgments/forecasts differ, it often remains unclear whether forecasters or models were wrong (e.g., Herla et al., 2025). Given recent advances in snow-cover and snow-stability modeling driven by developments in both physics-based modeling and machine learning, we therefore pose the following question: how close is public avalanche forecasting to transitioning from human-driven analysis to fully automated, model-driven methods? This raises another question: are high-resolution model predictions good enough to complement or even replace those made by professional forecasters? To answer this, we need a benchmark defining what good enough means. Given the challenges in validating avalanche forecasts in general, we define this benchmark through the use of traditional, primarily human-made public avalanche forecasts. Thus, we deem model-driven forecasts to be adequate when they independently forecast avalanche danger with a similar skill as expert forecasters, where both the human and the model forecasts are evaluated against objective data like avalanche occurrence.
Public avalanche-danger scales are based on the principle that the likelihood, number, and size of avalanches increase non-linearly with rising avalanche-danger levels (e.g., Schweizer et al., 2020; Techel et al., 2022; Winkler et al., 2021). In line with this core concept of public avalanche forecasting, we evaluate the discriminatory skill of spatially interpolated model predictions and human forecasts by comparing avalanche events with reference distributions that represent the base-rate conditions in the Swiss Alps over three forecasting seasons. This approach enables an objective, data-driven comparison of model-based and human forecasts. Specifically, we address the following questions: (1) Do spatially interpolated model predictions reflect the observed increase in avalanche occurrence – in terms of either natural avalanches or locations susceptible to human triggering? (2) Do fully data- and model-driven predictions of snowpack stability or avalanche danger distinguish between avalanche-relevant conditions with similar skill as that of human danger-level forecasts in the public avalanche bulletin?
2.1 Recent developments
Recent years have seen rapid growth in the use of models aiming to support avalanche forecasting. Based on physics-based snow-cover simulations using the SNOWPACK or Crocus models (Lehning et al., 2002; Vionnet et al., 2012), numerous statistical and machine-learning models have been developed to provide predictions of potential snow-cover instability (e.g., Monti et al., 2014; Richter et al., 2019; Mayer et al., 2022), the likelihood of natural-avalanche occurrence (Viallon-Galinier et al., 2023; Hendrick et al., 2023; Mayer et al., 2023), the presence and characterization of specific avalanche problems (e.g., Reuter et al., 2022; Perfler et al., 2023), predictions of danger levels (Fromm and Schönberger, 2022; Pérez-Guillén et al., 2022; Maissen et al., 2024), or similarity assessments of simulated snow-cover profiles (Bouchayer, 2017; Herla et al., 2021), allowing spatial clustering of distributed snow-cover simulations (e.g., Horton et al., 2025). Typically, these models are trained and validated using observations or judgments made by observers or professional forecasters (e.g., Pérez-Guillén et al., 2022; Herla et al., 2025; Pérez-Guillén et al., 2025). With the aim of supporting forecasters in their decision-making process, some models are now used in operational forecasting processes – for instance in Canada (Horton et al., 2023), France (Morin et al., 2020), or Switzerland (van Herwijnen et al., 2023).
2.2 Models used in Switzerland
In the following, we briefly introduce three models, which are used in this study. These models provided live predictions in Switzerland and were accessible to avalanche forecasters at the WSL Institute for Snow and Avalanche Research SLF, which is responsible for producing the national public avalanche forecast, during forecast production. These three models are used to assess dry-snow (slab) avalanche conditions.
2.2.1 Danger-level model
The danger-level model, a random-forest classifier (Breiman, 2001), was trained with a large dataset of danger levels that had undergone judgment-based quality control (Pérez-Guillén et al., 2022). The model uses features describing both meteorological conditions and snow-cover properties simulated with the SNOWPACK model. The classifier predicts probabilities (Pr(D=d)) for four of the five avalanche-danger levels (1 (low) to 4 (high)). From these, the most likely danger level can be extracted. In addition, two further model outputs are used operationally: (1) a continuous value derived from the probability-weighted sum of the danger levels, (Maissen et al., 2024; Pérez-Guillén et al., 2025), and (2) probability values linked to specific danger levels, such as Pr(D=4).
2.2.2 Instability model
The instability model assesses the snow-cover simulations provided by the SNOWPACK model with regard to the potential instability related to human triggering of avalanches (Mayer et al., 2022). The random-forest model uses six variables describing the potential weak layer and the overlying slab to predict the probability that a snow layer is potentially unstable. The output probability ranges from 0 (a layer is classified as stable by all the trees) to 1 (classified as unstable by all trees). All simulated layers are assessed using this procedure. In the setup used for forecasting, the layer with the highest probability of instability (Prinstab) is determined and considered to be decisive in characterizing this profile, as suggested by Mayer et al. (2022).
2.2.3 Natural-avalanche model
The natural-avalanche model is a simple one-parameter logistic regression model and comes in several variations: its input consists of either the 1 d or 3 d sum of the simulated new snow or the output of the instability model (Prinstab) (Mayer et al., 2023). Trained on a dataset of natural avalanches near automated weather stations (AWSs), models then predict the probability of at least one dry-snow avalanche of size 2 or larger occurring at the same aspect and elevation as used in the snow-cover simulations. In the operational setup, predictions from three models are combined using a weighted mean: the 1 and 3 d new-snow models each contribute a weight of 0.25, while the instability model based on Prinstab contributes 0.5 (Trachsel et al., 2024). Including both short-term snow accumulation and snowpack instability ensures that the combined forecast reflects both the triggering potential due to new-snow loading and the structural weaknesses in the snowpack. We refer to the resulting probability as PrnatAval.
2.2.4 Operational setup in Switzerland
In Switzerland, operational snow-cover simulations are available at the locations of 147 AWSs (Intercantonal Measurement and Information System IMIS, 2024), of which 142 are located throughout the Alps (Fig. 1a). Most of these stations are located at the elevation of potential avalanche starting zones (median elevation of 2265 m a.s.l. (meters above sea level), min–max of 1258–2953 m a.s.l.). For nowcast predictions, SNOWPACK is driven using half-hourly or hourly measurements obtained from the network of AWSs (Fig. 1b, step 1). Snow-cover simulations are performed with outputs written at 3 h intervals at the location of the AWS. Simulations are conducted for flat terrain and for four virtual slopes – north, east, south, and west – with slope angles of 38°, corresponding to typical avalanche terrain (Morin et al., 2020). In forecast mode (Fig. 1b, step 2), snow-cover simulations are initialized using the most recent nowcast simulations. Simulations are driven by the 1 km resolution numerical weather prediction (NWP) models operated by MeteoSwiss (COSMO1 until 2023/2024 (COSMO, 2025), ICON-EPS-CH1 from 2024/2025 onwards (MeteoSwiss, 2025)). All SNOWPACK input parameters obtained from the NWP models – such as wind speed, radiation, air temperature, humidity, and precipitation – are downscaled to the location of the AWS using the methods described in detail in Mott et al. (2023, Table 1). This provides forecast snow-cover simulations up to 27 h ahead with a temporal resolution of 3 h. Machine-learning (ML) models such as the danger-level model, the instability model, and the natural-avalanche model provide predictions for flat terrain and for the virtual slopes at the location of the AWS for each of the 3 h forecast and nowcast time steps. Operationally, model predictions are primarily visualized on maps, sometimes as time series of predictions aggregated by region or elevation. To ease recognition of spatial patterns, predictions are interpolated in two-dimensional space.
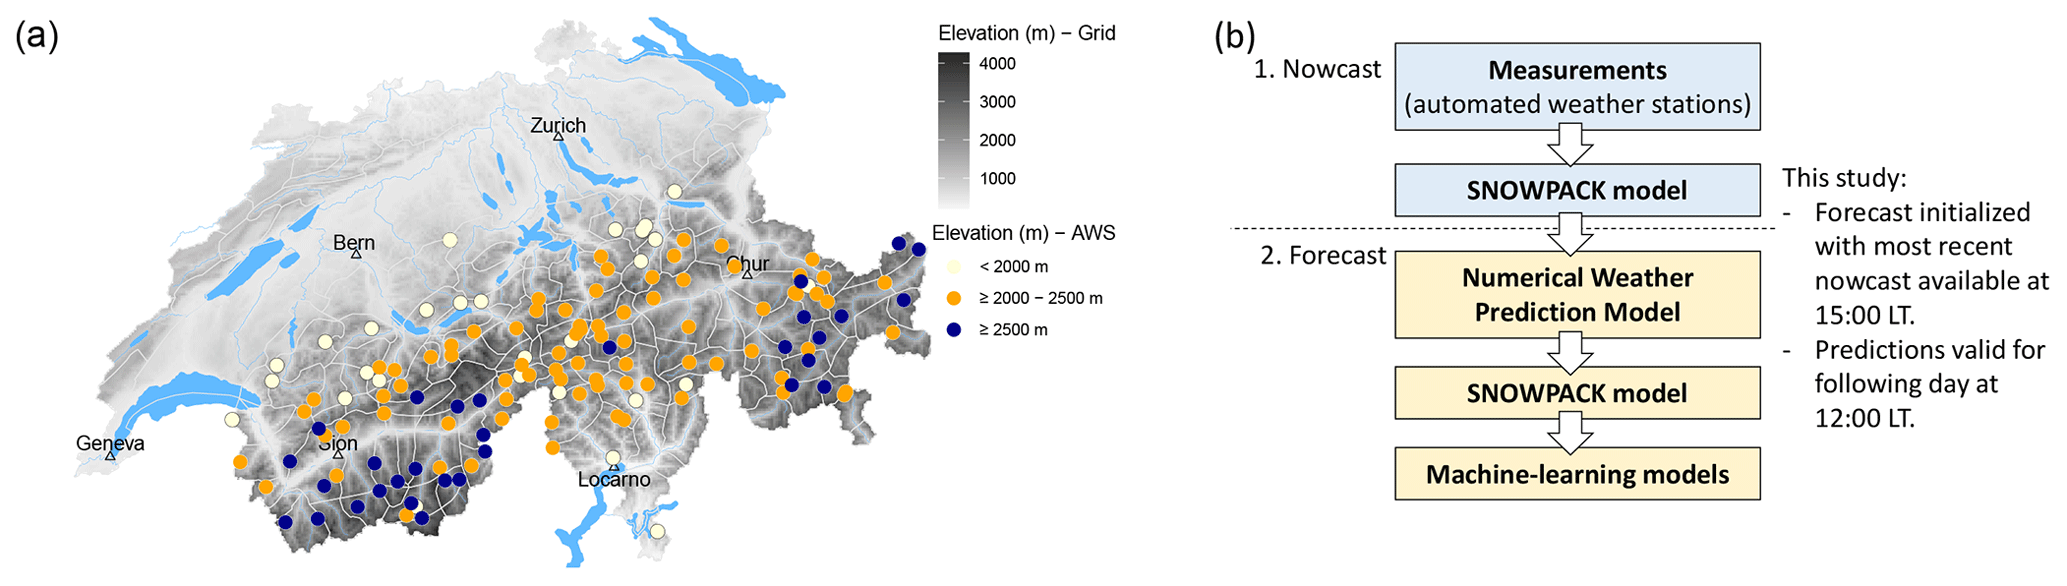
Figure 1(a) Distribution of automated weather stations (AWSs) in the Swiss Alps at which SNOWPACK simulations were run. DEM (Federal Office of Topography, swisstopo). (b) Schematic representation of the operational model pipeline for computing the nowcast and forecast predictions.
We structure this section on data (Sect. 3.1) and methods (Sect. 3.2) around our two research questions (RQs): (1) do spatially interpolated model predictions reflect the observed increase in avalanche occurrence – in terms of either natural avalanches or locations susceptible to human triggering? (2) Do fully data- and model-driven predictions of snowpack stability or avalanche danger discern conditions with similar skill as the human danger-level forecasts published in the public bulletin?
Figure 2 provides an overview of the study design and illustrates how the data and methods sections align with the two RQs. We first introduce the data: model predictions (Sect. 3.1.1), event and reference grid point datasets (Sect. 3.1.2), and the human avalanche forecast used as a benchmark for RQ2 (Sect. 3.1.4). We then describe the interpolation approach (Sect. 3.2.1) and the derivation of the event ratios used in both analyses (Sect. 3.2.3). Finally, for RQ2, we explain how model outputs are transformed and analyzed to enable direct comparison with human danger-level forecasts (Sect. 3.2.6). Each step in the methods corresponds to elements in Fig. 2 and links directly to the data processing and evaluations required to address the two research questions.
3.1 Data
We used data from three avalanche forecasting seasons (2022/2023 to 2024/2025).
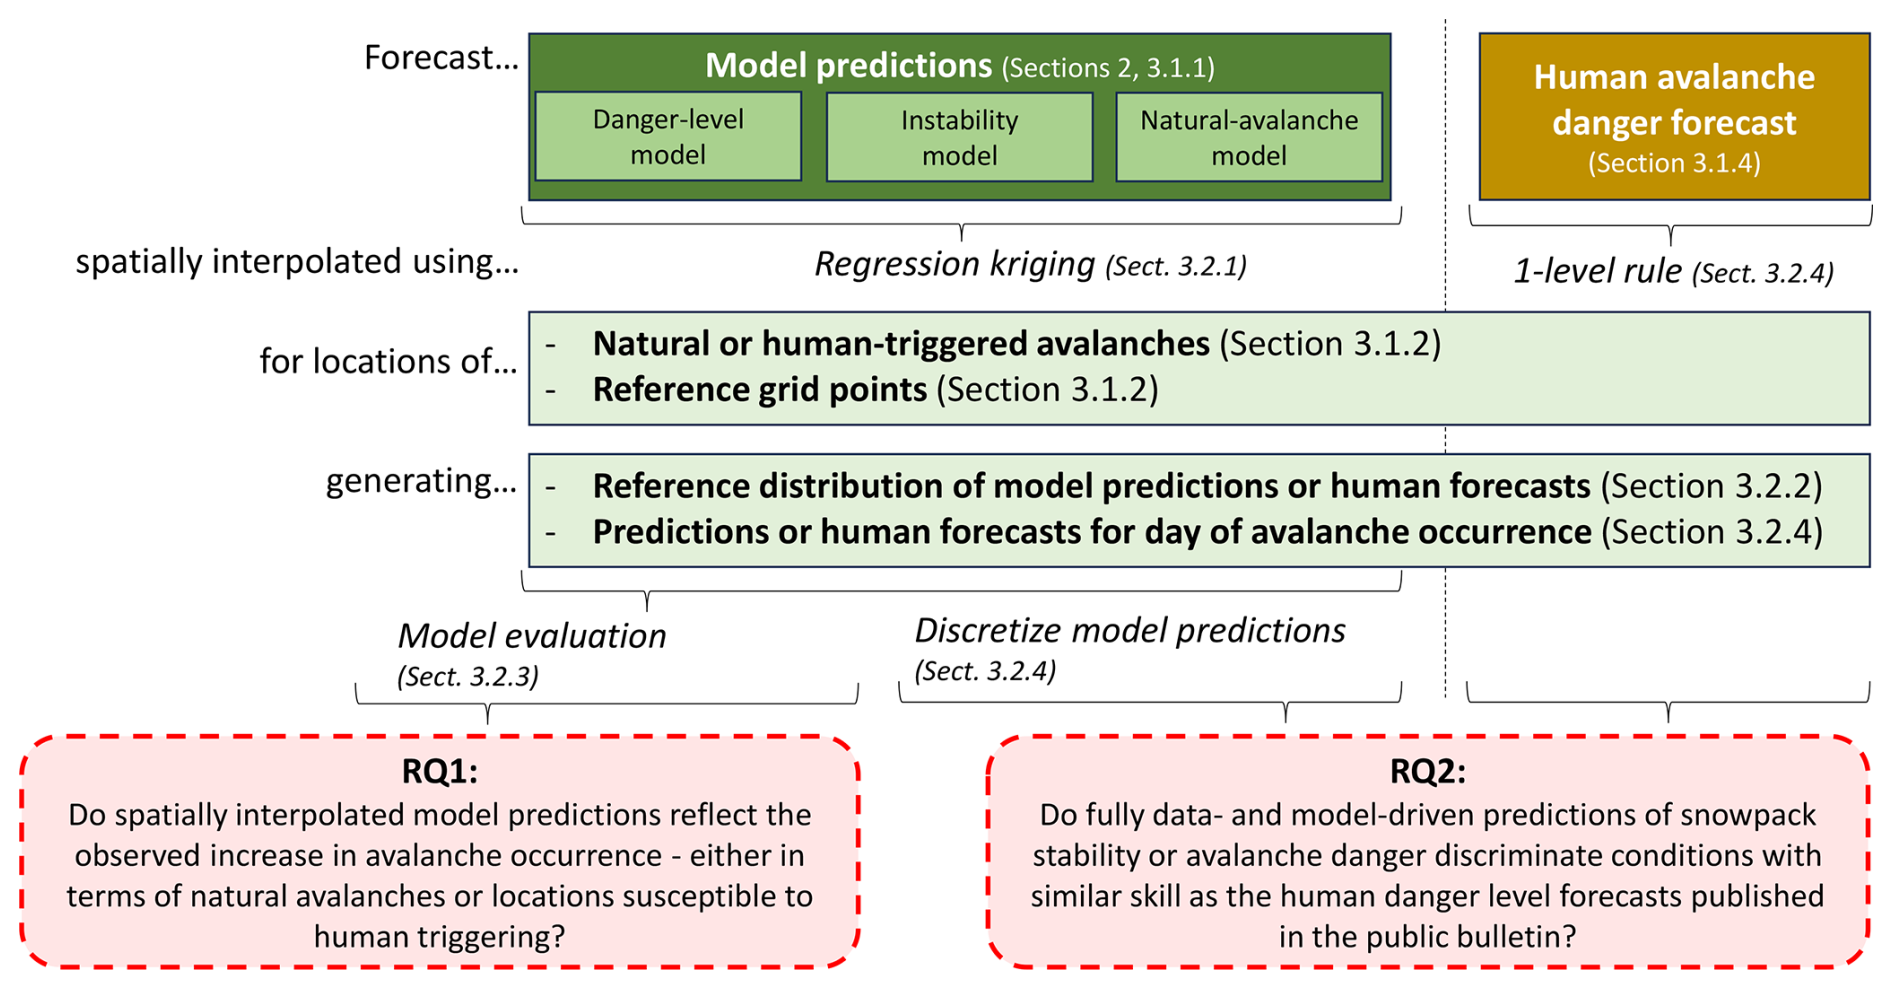
Figure 2Study layout. Forecasts – either model predictions (left) or human danger-level forecasts (right) – are interpolated to locations of interest using regression kriging (for models) or the one-level rule (for human forecasts). These locations include avalanche events and reference grid points. This results in two parallel datasets: one focused on natural-avalanche occurrence and one on locations susceptible to human triggering. From these, we derive distributions that reflect both the range of forecast conditions during the study period (base-rate distribution) and the conditions on event days. Depending on the research question (RQ, red boxes), only models are analyzed (RQ1) or model predictions are compared to human forecasts (RQ2).
3.1.1 Model predictions
We analyzed the model predictions resulting from the operational setup (Sect. 2.2.4). In all cases, predictions for specific aspects (e.g., N, E, S, W) were used: the probabilities obtained with the instability model (Prinstab) and the natural-avalanche model (PrnatAval). For the danger-level model, we derived the probability for danger level D≥3 (considerable), referred to as PrD≥3. We chose this formulation instead of using the most likely danger level or the continuous probability-weighted sum of the danger levels described in Sect. 2.2.1, as it simplifies the multiple-probability model output (one probability for each danger level) into a single and more easily interpretable probability value without losing too much information (see also Fig. A1 in the Appendix and Pérez-Guillén et al. (2025)). Converting the danger rating model output into a single value between 0 and 1 allowed us to use a consistent analysis approach for all three ML models.
For the purpose of this analysis, we relied exclusively on model predictions calculated in real time during the forecasting season. Crucially, this means our evaluation is not based on reanalysis data but instead on the forecasting of events in an operational context. We used simulations available at 15:00 local time (LT), the time when forecasters meet to discuss and produce the forecast for the following day (Fig. 1b). From these, we extracted the forecast predictions valid for the following day at 12:00 LT. Note that sometimes data were missing, either because the model was not available at the time (i.e., no data for the natural-avalanche model in forecast mode in 2022/2023 season, as it was only developed in 2023; Mayer et al., 2023) or due to a re-engineering of the data–model pipeline (no forecast predictions for the danger-level model for parts of the 2023/2024 season) (Table 1).
Table 1Data overview for the reference distribution (ref) and events (Ev) for the respective models and data subsets. Shown are the number of days or data points used in the analysis.
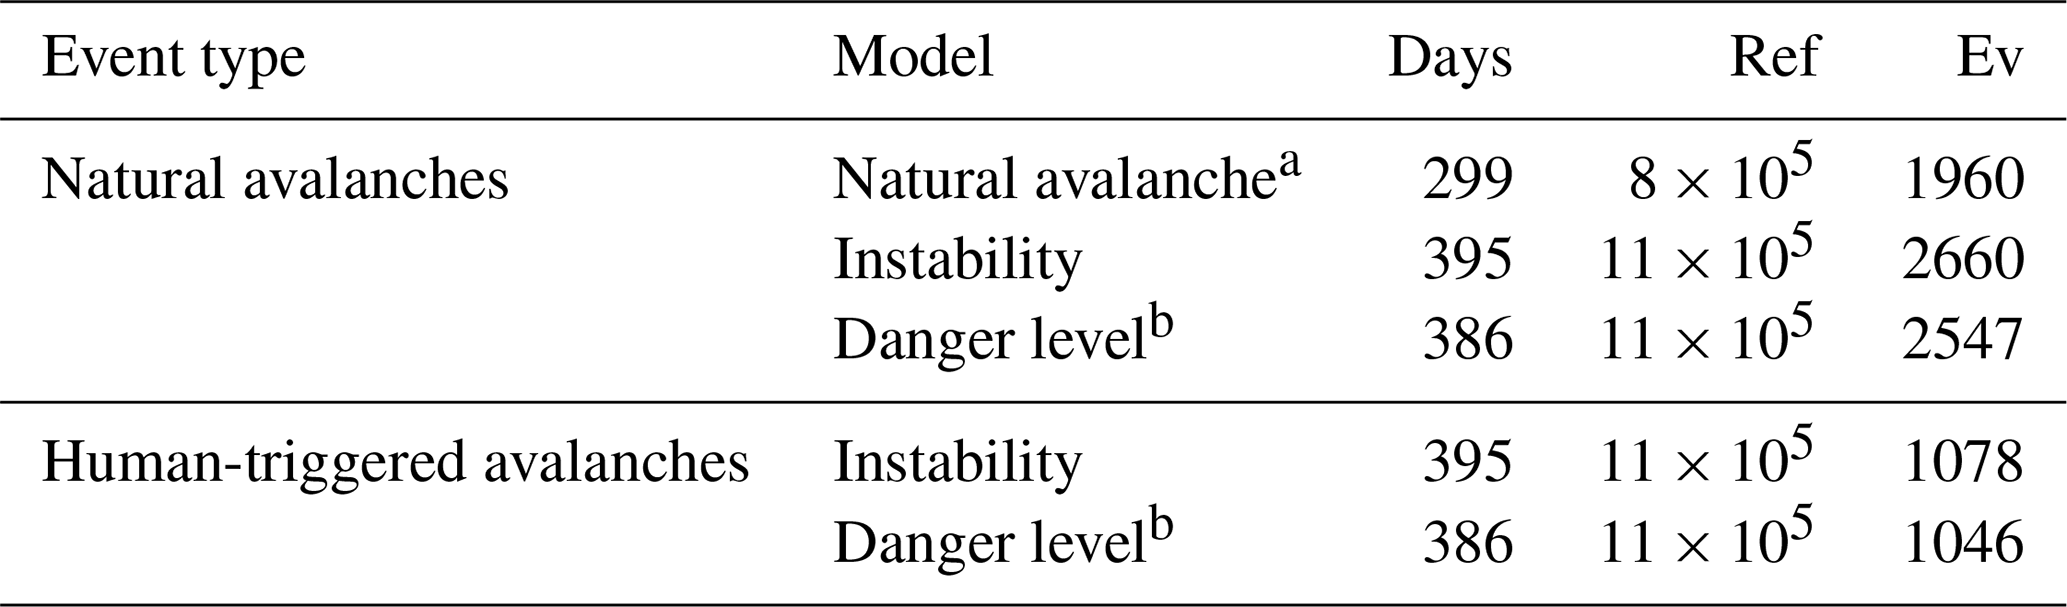
a No data in 2022/2023. b No data in December 2023 and January 2024.
3.1.2 Events and reference grid points
We consider the reported occurrence of an avalanche triggered by natural causes or by human load as an event. However, defining non-events is much more challenging since non-events are typically not reported, and the absence of an observed avalanche does not mean there was no avalanche (Hendrick et al., 2023; Mayer et al., 2023). We therefore also extracted a subset of grid points from a digital elevation model (Federal Office of Topography, swisstopo) to derive distributions representing the range of conditions over the study period as a reference.
Events: avalanches
In Switzerland, approximately 80 observers or members of local avalanche commissions provide daily reports of avalanches occurring in their area of observation. Apart from avalanches documented by these observers, additional reports may come from field observers, who are also part of the observer network, or from the general public. The reported details of avalanches include their locations and estimated time of occurrence, size categorized on a scale of 1 to 5 according to EAWS (2019), moisture content (classified as dry or wet), avalanche type (such as slab or loose-snow avalanche), and the triggering mechanism (such as natural release or human-triggered) following guidelines from SLF (2024). Location information generally refers to the top of the starting zone (coordinates, slope aspect, elevation). For the purpose of this analysis, we consider an event to have occurred at the location and date that were reported, neglecting potential uncertainties in the observed data.
-
Natural avalanches. We extracted all avalanches of size 2 or larger, classified as a dry-slab avalanche with the trigger type natural release. In total, 2977 avalanches fulfilled these criteria during the three seasons. These were located at a median elevation of 2510 m (interquartile range (IQR) of 2310–2700 m).
-
Human-triggered avalanches. For human-triggered avalanches, we considered reported dry-snow slab avalanches with the trigger type human if the avalanche was classified as size 2 or larger or if a person was caught in the avalanche. As a large share of these avalanches was reported by the public, we checked the location, size, and moisture content for plausibility whenever possible. In total, during the three seasons, 1223 avalanches fulfilled these criteria. Of these, 32 % (386) were avalanches with at least one person being caught. Human-triggered avalanches were located at a median elevation of 2480 m (IQR of 2250–2710 m).
Reference grid points
In many regions and on many days, we lacked reliable information on locations where avalanches did not occur. To overcome these limitations and to enable meaningful normalization of event frequencies, we defined a reference set of locations that captures the range of conditions typically encountered across the forecast area and time period – without making assumptions about avalanche occurrence or human activity.
This artificial set serves as a neutral baseline against which observed events can be compared. It allows us to compute event ratios (described in detail in Sect. 3.2.3) that are interpretable as relative likelihoods of avalanche occurrence under specific forecast- or model-predicted conditions. By anchoring the denominator in a consistent, well-distributed sample of terrain relevant to both natural-avalanche release and winter recreation (which is assumed to correlate with locations where human-triggered avalanches were recorded), we minimize biases due to missing or unevenly distributed non-event data since we normalize across potential avalanches rather than across all terrain.
To generate reference points, we randomly sampled 5 % of the grid points from a 1 km resolution elevation grid within an elevation range between 1600 and 3000 m a.s.l. This range was chosen to match the elevations at which most avalanche events were observed and where most of the AWSs are located (Sect. 2.2.4), as these are the elevations typically described in the public avalanche forecast and frequented by winter backcountry recreationists (e.g., Winkler et al., 2021). To better reflect the observed elevation distribution of avalanche occurrences, we used a kernel density estimate of the elevation distribution of observed avalanches to guide the random sampling of 5 % of grid points. As this approach did not fully cover all micro-regions, the smallest spatial units used in human forecasts (see white polygon boundaries in Fig. 3), we additionally sampled two random points above 1600 m a.s.l. from each of the remaining regions. The resulting reference set shown in Fig. 3 comprises 709 grid points with a median elevation of 2400 m (IQR of 2200–2600 m). It is therefore both geographically well distributed and representative of the elevation range relevant to avalanche forecasting and winter backcountry recreation, while permitting comparably efficient computation.
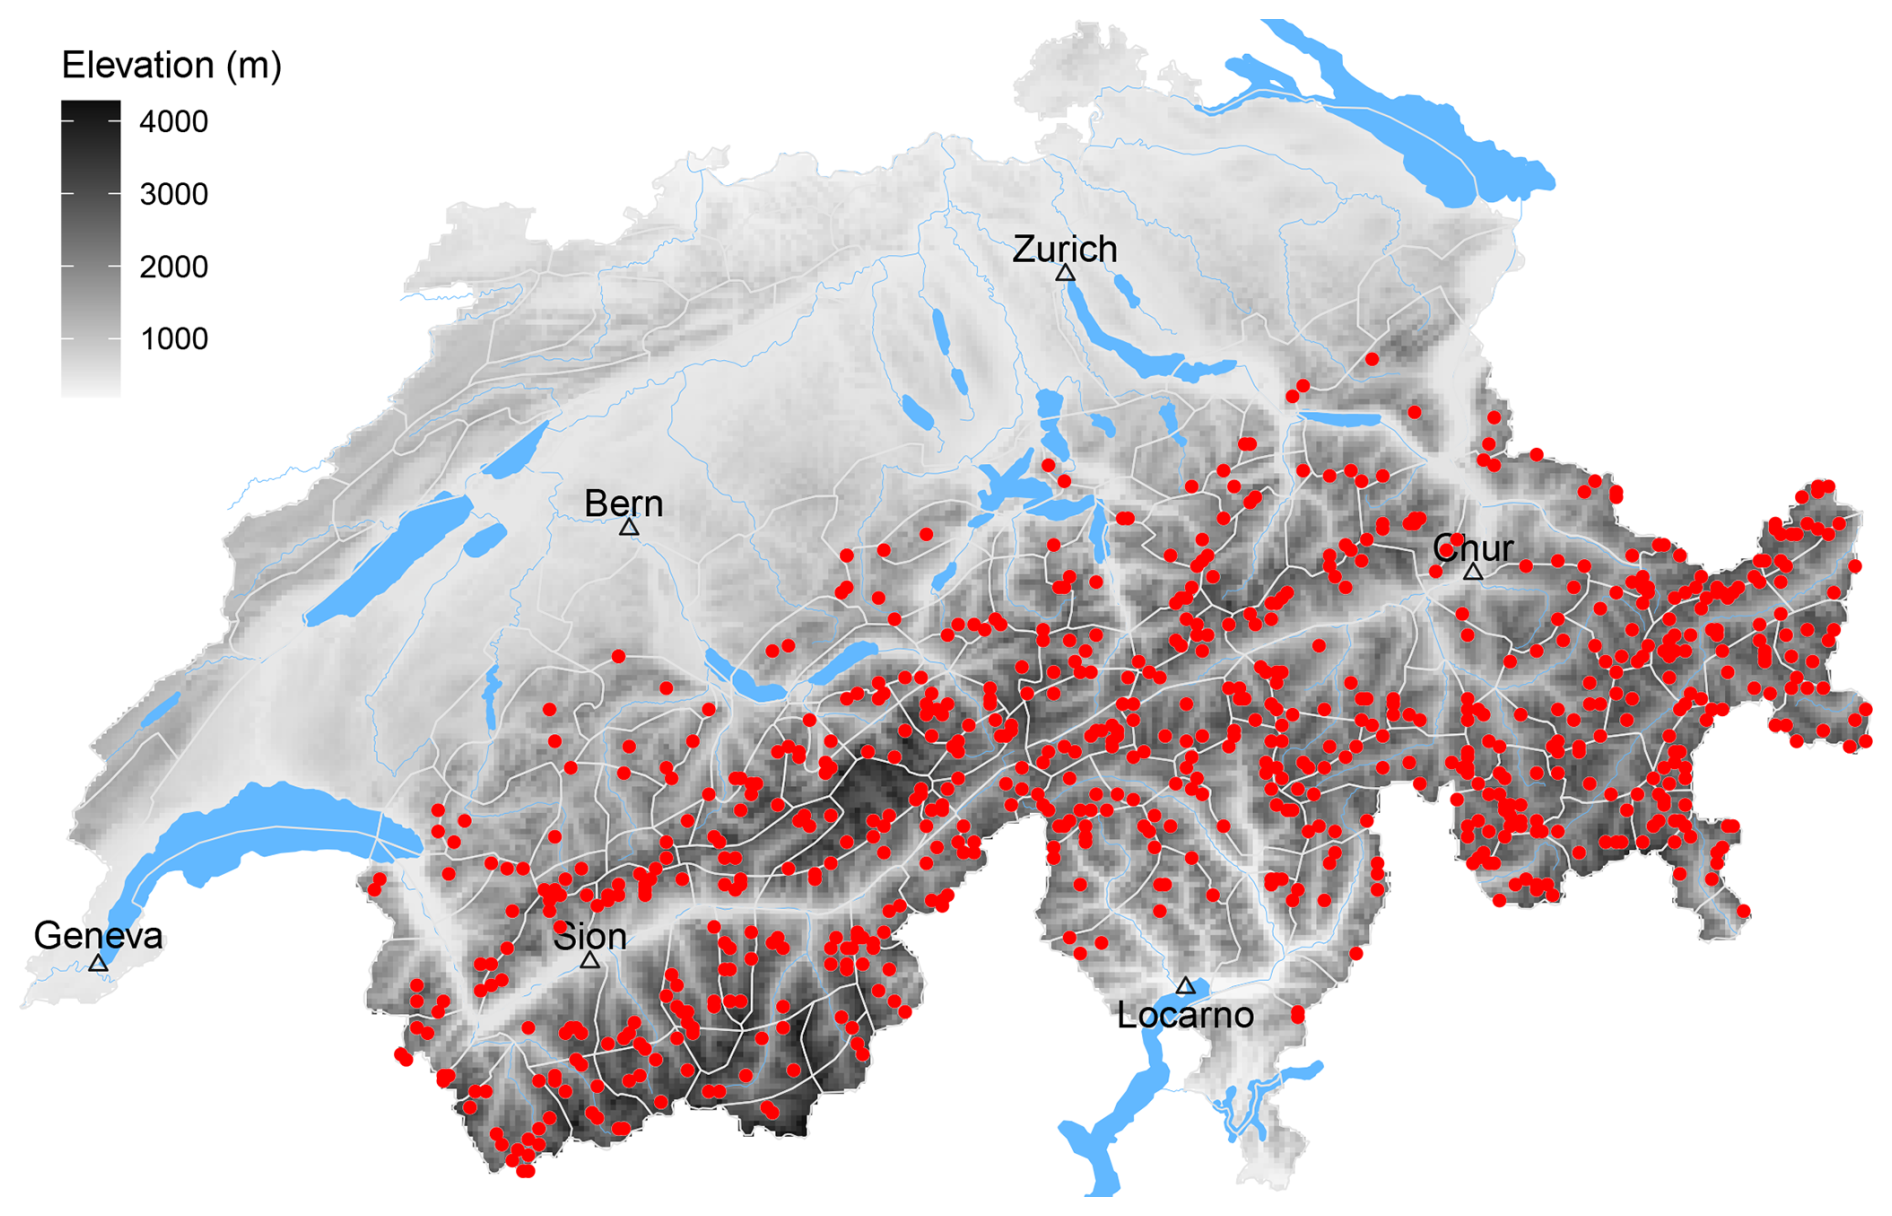
Figure 3Map of Switzerland showing the spatial distribution of the randomly sampled subset of grid points used to obtain reference distributions. White polygon outlines delimit the spatial extent of the micro regions, the smallest spatial units used in the human avalanche forecast. (DEM and rivers/lakes – Federal Office of Topography, swisstopo).
3.1.3 Snow-line estimates
The AWSs used for avalanche forecasting in Switzerland are primarily located at or above the treeline, with few stations situated below 1700 m (Sect. 2.2.4). Due to sparse data coverage at lower elevations, we required an estimate of the elevation below which no continuous snow cover existed on steep slopes and where avalanche release was therefore not possible. For this purpose, we used daily estimates of the snow line – the approximate elevation above which continuous snow cover was observed on steep north- and south-facing slopes – based on reports from study plots and field observers across Switzerland. The snow line is recorded in 200 m intervals (SLF, 2024). If the snow line could not be visually confirmed, no estimate was reported. On average, over 100 snow-line estimates were available per day for each aspect.
3.1.4 Public avalanche forecast
To answer RQ2, we used the public avalanche forecast as a benchmark forecast (Fig. 2).
We extracted the forecast danger level (D) and the associated sub-level qualifier (s, combined as Ds) from the forecast published daily by the WSL Institute for Snow and Avalanche Research SLF at 17:00 local time (LT). This forecast is valid until 17:00 LT the following day. We extracted information related to the severity of dry-snow avalanche conditions, including the sub-level refining the danger level and the indicated elevation threshold and aspect range. For danger level 1 (low), no sub-level, elevation threshold, or aspect range is provided (SLF, 2023).
Sub-levels have been used internally since 2017 (Techel et al., 2020b) and were publicly added to the Swiss avalanche forecast in December 2022 (Lucas et al., 2023). They provide a finer-grained and therefore more nuanced representation of the severity of avalanche conditions than the five danger levels do alone. In general, higher forecast sub-levels correspond to a greater number of locations prone to avalanche release and a higher likelihood of larger avalanches (Techel et al., 2022). In this study, we use the forecast sub-level as a proxy for the probability of avalanche release.
3.2 Methods
We begin by describing the methods common to both research questions and then outline additional steps specific to RQ2.
3.2.1 Spatial interpolation
We spatially interpolated point data – specifically, model predictions and snow-line estimates – to the locations of observed avalanche start zones and to the randomly sampled reference points in avalanche terrain. To do so, we employed regression kriging (RK) (Hengl et al., 2007), a geostatistical method that combines a deterministic regression model with kriging of the residuals. Compared to simple ordinary kriging, RK enables the inclusion of environmental gradients, such as the varying magnitude of change with elevation. Compared to purely deterministic interpolation, it reduces the bias introduced by un-modeled spatial autocorrelation. This hybrid method therefore offers improved interpolation accuracy and physical plausibility in mountainous terrain, where elevation-dependent and location-specific patterns dominate. This approach was well suited to our application, as it captures both spatial and elevational variation in avalanche conditions. In our implementation, elevation was used as a predictor in the regression component. The remaining spatial structure – unexplained by elevation – was interpolated using kriging, allowing us to better preserve local variability.
Some avalanche events were recorded on intermediate aspects (e.g., NE, SW). For these cases, we approximated model predictions by averaging between the corresponding cardinal directions. For example, for NE, we used the mean of the north and east predictions. We applied the same logic to snow-line estimates (Sect. 3.1.3): for east, we averaged north and south; for NE, we used a weighted mean of north (0.75) and south (0.25). For snow-line elevation, any point below or at the snow line was assigned Pr=0.
To optimize kriging performance, we tested several settings using leave-one-out cross-validation on a random subset of three cases per model. Following best practices (e.g., Hengl et al., 2007), we applied a logistic transformation to all Pr values prior to interpolation, setting Pr=0 and Pr=1 to 0.001 and 0.999, respectively. All interpolation steps were implemented in R using the sp and gstat packages (Pebesma, 2004; Gräler et al., 2016; Pebesma, 2018; Pebesma and Bivand, 2023).1
Although we interpolated to specific locations – such as the known coordinates of avalanche release zones – we emphasize that interpolation yields regional patterns not slope-specific predictions. As illustrated in Fig. 4, holding elevation and aspect constant, the resulting spatial variation primarily reflects larger-scale gradients. Within-region differences arise mainly from variations in elevation (captured in the regression component) and aspect-specific snow-cover modeling (reflected in the aspect dimension of the model inputs).
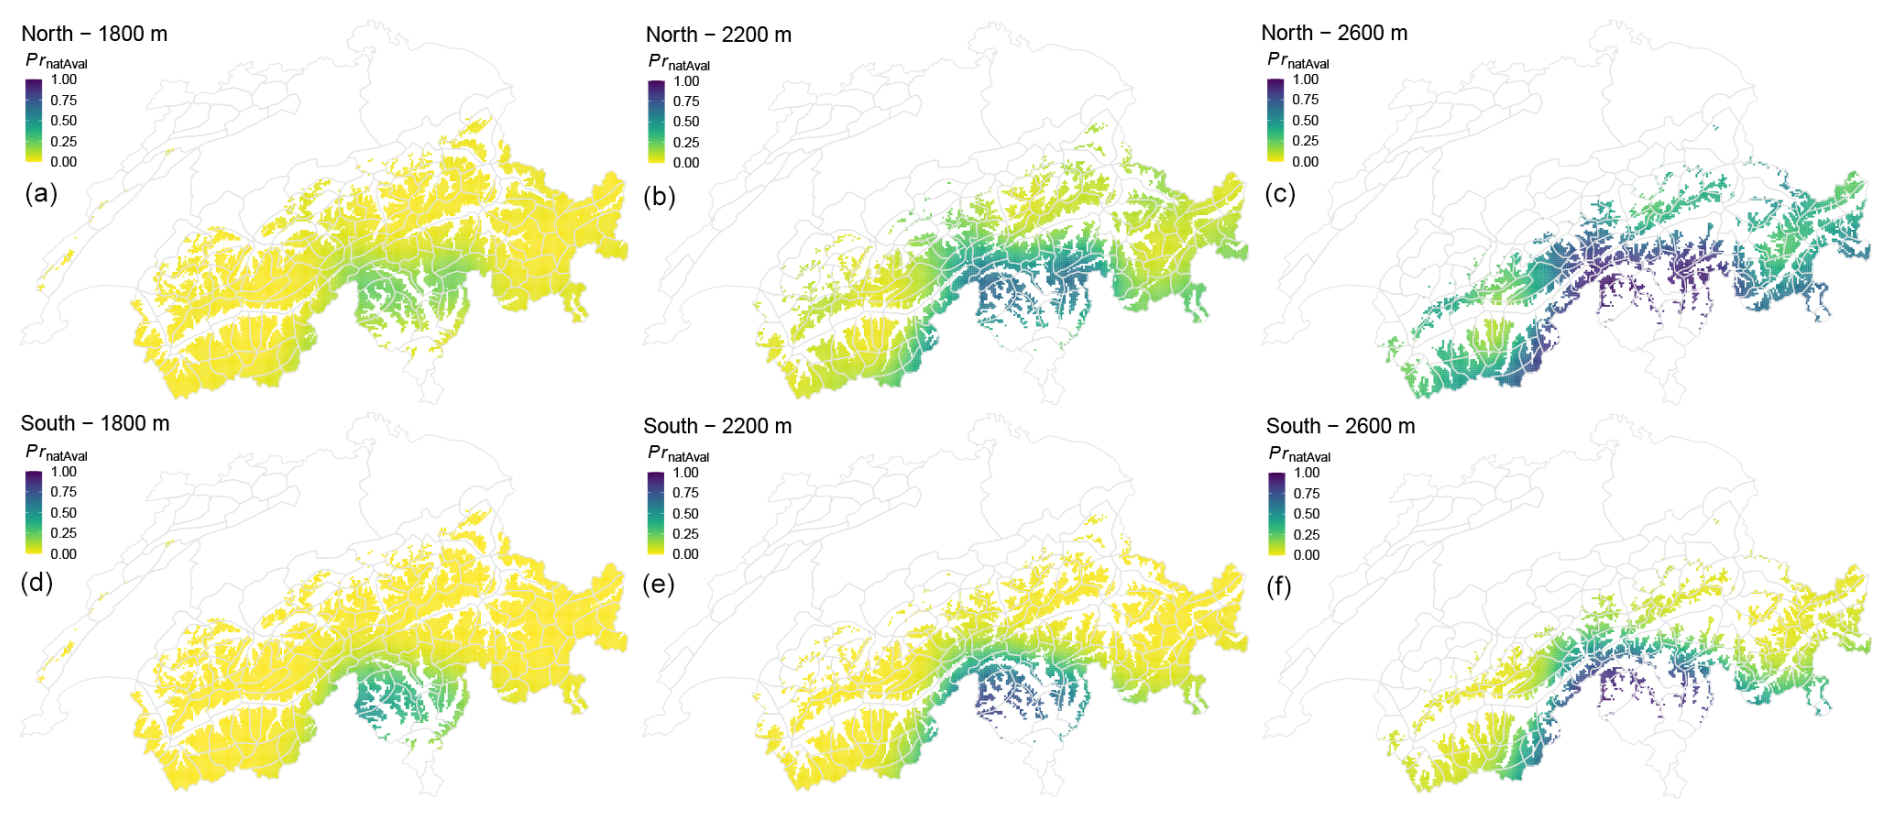
Figure 4Interpolated predictions (natural-avalanche model) valid for 11 March 2024 for three elevations (a, d: 1800 m, b, e: 2200 m; c, f: 2600 m) and two aspects (a–c: north, d–f: south). For readability, interpolation is shown for all grid points located above and up to 400 m below the indicated elevation, using a fixed elevation for interpolation.
3.2.2 Reference distributions of model predictions
To describe the forecast conditions over the three winter seasons, we derived base-rate distributions for both the model predictions and the human-generated danger levels. For each reference location and for each of the four primary aspects (north, east, south, west), we first interpolated the model-predicted probabilities using regression kriging (Sect. 3.2.1). These interpolations were performed for all days on which model output was available (Table 1).
3.2.3 Evaluating model predictions with event and reference distributions
To investigate whether the models capture the expected increase in avalanche occurrence with increasing predicted probabilities, we applied a bin-wise event ratio approach. We grouped the predicted probabilities into bins with a width of 0.05 and counted how many predictions fell into each bin for both the avalanche events (Ev) and the reference locations (ref). To quantify the relationship between the predicted probabilities and avalanche occurrence, we computed the event ratio Rm,i as
where N denotes the number of data points in bin i for model m. This event ratio quantifies how often avalanches occur relative to the reference baseline for each probability bin, revealing how well the model discerns avalanche-prone conditions relative to the background.
To account for sampling uncertainty – especially relevant given the relatively small number of events – we applied bootstrap sampling with replacement before calculating the event ratios, repeating the procedure 100 times.
To facilitate comparison across models, we also computed a relative ratio (RR) by normalizing the event ratio in each bin using the overall base-rate event ratio Rm, defined as
where Rm is the ratio of the number of all events and the number of all reference points for each model:
This normalization enables direct comparison of patterns across models, independent of absolute event frequencies.
Unless stated otherwise, we report Rm,i or RRm,i as the median from the 100 bootstrap samples and plot the corresponding 90 % intervals in the figures. To assess whether R increases monotonically with Pr, we calculated the Spearman rank-order correlation coefficient (ρ) between Rm,i and the midpoints of the corresponding probability bins Prm,i.
3.2.4 Analysis for RQ2: evaluating the discriminatory skill of model predictions and human forecasts
To address RQ2, we assessed how well interpolated model predictions and forecast sub-levels discriminate between conditions at reference locations and at avalanche events. To enable a direct comparison between continuous model outputs and the discrete sub-levels of the public avalanche forecasts, we applied a consistent procedure to assign forecast values to specific locations and to bin model probabilities. This was necessary because forecast avalanche danger is always the highest danger expected to be found in a region, usually for a specified range of terrain types, elevations, and aspects.
This involved two additional steps (see also Fig. 2).
Translating the regional avalanche-danger forecast to local points
We used the published danger level and sub-level (Ds) from the Swiss avalanche bulletin (see Sect. 3.1.4) as a benchmark for comparison. For each point of interest, we checked whether it was located within the elevation and aspect range specified in the forecast. If so, we assigned the published Ds to that location. Otherwise, we applied the one-level rule, subtracting one level to estimate local danger conditions. This rule-of-thumb has proven effective for approximating avalanche danger outside the specified forecast ranges (SLF, 2023; Winkler et al., 2021). The resulting adjusted value is referred to as .
This approach allowed us to assign a representative danger rating to each location and aspect, consistent with how forecasts are typically interpreted in practice (SLF, 2023). It also approximates the expected reduction in danger with decreasing elevation or less exposed aspects (Winkler et al., 2021), and thus forms the basis for both the reference distribution of human forecasts – comparable to the reference distributions obtained for model predictions (Sect. 3.2.2) – and the conditions present when avalanches occurred.
Finally, we merged the model predictions and human forecast values by location and date, retaining only cases where both and model predictions were available. The discriminatory power of both approaches is then evaluated using normalized event ratios, as described in Sect. 3.2.3. In addition, we calculate summary metrics to quantify discrimination strength. The following paragraphs outline the full procedure.
Binning model predictions to match forecast sub-levels
To compare spatially interpolated model predictions with the benchmark forecast (), we first transformed the continuous model outputs into a format compatible with the discrete forecast sub-levels. Since consists of a limited number of ordinal classes, we binned model predictions such that the relative frequency of values in each bin matched the frequency distribution of . This approach ensured that each bin corresponded to an equal-sized sub-group, reducing distortions in the event ratio (R) that might otherwise result from unequal sample sizes. It also enabled a fair and interpretable assessment of discriminatory performance across comparable categories.
To derive the bin thresholds, we ranked all model-predicted probabilities in ascending order and divided them according to the cumulative proportions of in the corresponding reference set. As shown in Fig. 5a, this procedure yields bin thresholds (thr) that align with sub-level frequencies. For example, in the subset combining the human avalanche forecasts and the corresponding instability model predictions, 36 % of all values were rated as 1 (low). Setting the upper threshold for bin 1 at Pr=0.32 ensured that 36 % of the model predictions fell into this bin. Thresholds for subsequent bins (e.g., 2–6) were derived in the same way based on the cumulative distribution. The resulting thresholds for all three models are shown in Fig. 5b. Due to the very limited number of event data points at for the human-triggered avalanche dataset, we combined the highest-three sub-levels into a single class representing danger level 4 (high) or bin 8. In contrast, for natural avalanches, a sufficient number of events was available even in the highest bins. To allow for meaningful comparisons across datasets and models, we again normalized the event ratios R using the base-rate ratio, obtaining RR (Eq. 2).
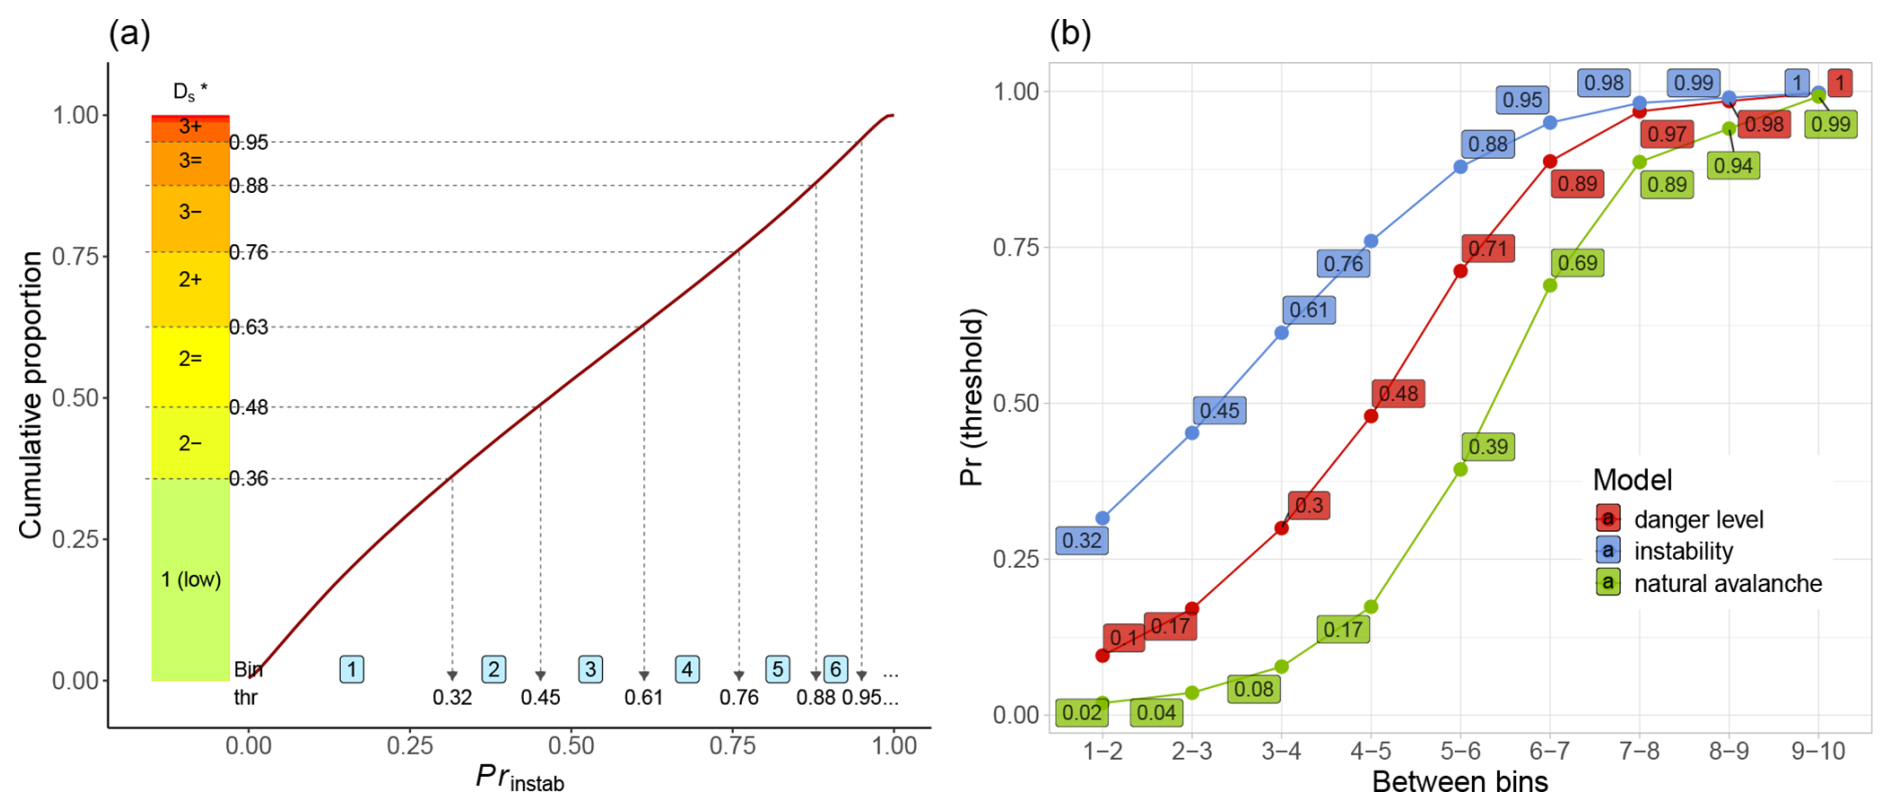
Figure 5(a) Example using the instability model: the cumulative distribution of predicted probabilities (Prinstab), with bin thresholds derived from the proportion of forecast sub-levels (y axis). Model-predicted probabilities are assigned to bins (light-blue labels 1 to 6) such that each bin contains the same proportion of data as the corresponding sub-level class. The bold line shows the cumulative distribution of ; dotted lines indicate the thresholds (thr) separating bins. Note that thresholds for and bins ≥7 are not shown. (b) Probability thresholds corresponding to sub-level bins for the three models in forecast mode. The values shown for the instability model match those in panel (a).
We selected this proportion-based binning strategy to allow for direct and fair comparisons with the human forecast, which is issued in fixed sub-level proportions. Alternative approaches such as unsupervised clustering or categorization based on internal model thresholds (e.g., the three-category classification in the instability model proposed by Mayer et al. (2022)) were considered. However, clustering lacks a direct correspondence to the forecast structure, and fixed thresholds are either unavailable or are inconsistent across models. In contrast, the proportion-matching method provides a consistent and interpretable framework for comparing discriminatory performance between models and human forecasts.
After assigning bins, we proceeded as described in Sect. 3.2.3: we counted the number of observations from avalanche events (Ev) and reference points (ref) in each bin or for each sub-level i and computed the corresponding event ratio Rm,i (Eq. 1) and relative event ratio RRm,i (Eq. 2) for each model m.
Evaluating the discriminatory power of model predictions and human forecasts
Lastly, to assess the discriminatory power between neighboring bins or sub-levels, we derived the factor F, which summarizes the average fold increase in the relative event ratio RR between adjacent bins. For model m and bin i, we define
From the resulting set of values Fm,i, we computed two summary metrics: the median fold increase and the total fold increase Ftotal,m, defined as the ratio of RR in the highest to the lowest bin:
Higher values of and Ftotal,m indicate a clearer separation of avalanche-relevant conditions, consistent with the expected non-linear increase in avalanche release probability across forecast sub-levels shown by Techel et al. (2022). Conversely, values of suggest that this expected monotonic increase between neighboring bins or sub-levels is not observed.
4.1 Model predictions
Figure 6 summarizes model predictions (Pr) for each of the three models (danger level, instability, natural avalanche) separated by avalanche type: natural avalanches (left column) and human-triggered avalanches (right column).
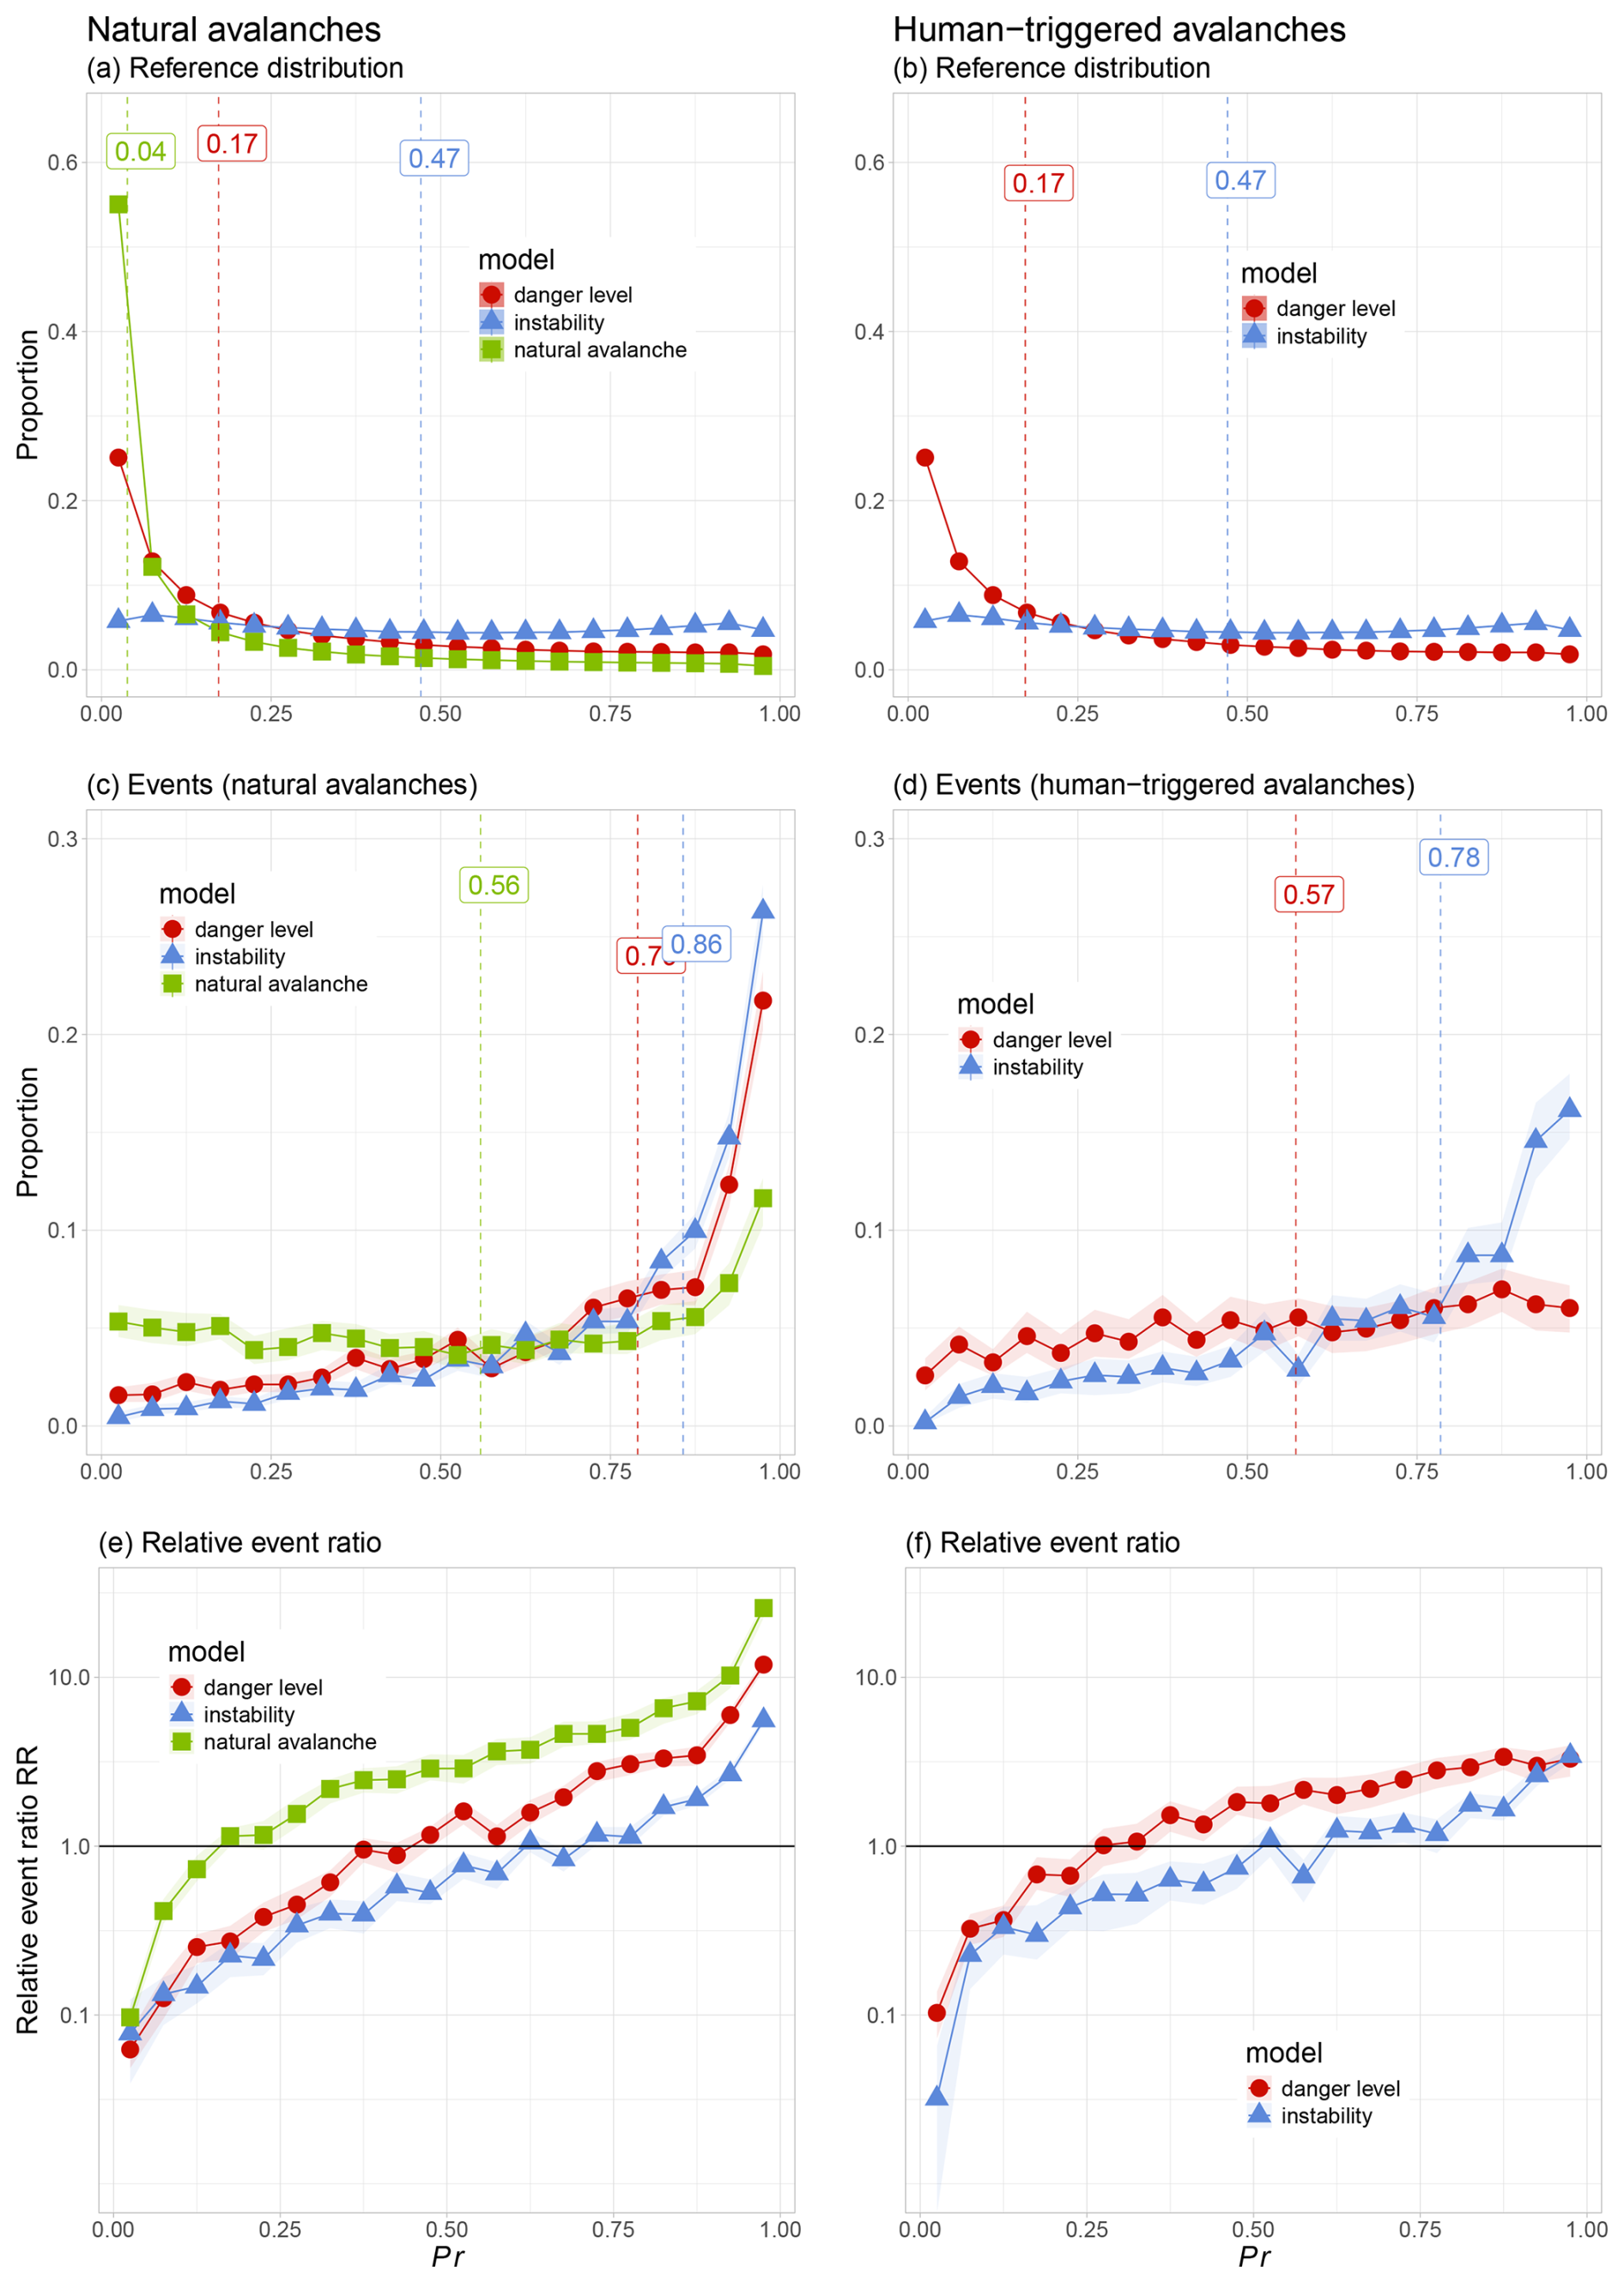
Figure 6Model predictions (Pr) for natural avalanches (left column) and human-triggered avalanches (right column). (a, b) Reference distributions, (c, d) event distributions, and (e, f) event ratios. Results are shown for each model. To facilitate comparison between models, proportions rather than absolute numbers are shown, where 100 % corresponds to the number of data points in Table 1. Median values are indicated by dashed vertical lines. Shading in panels (c) to (f) indicates the 90 % confidence interval. In panels (a) and (b), this is not visible due to minimal variation in the reference sampling.
4.1.1 Reference distributions
The reference distributions in Fig. 6a and b represent the full range of model-predicted conditions across the study period. Note that for the danger-level model and the instability model, the curves in Fig. 6a and b are identical, as they are based on the same underlying grid points and model predictions (see also Table 1).
For the natural-avalanche model, predictions were strongly skewed toward low probabilities: over 50 % of grid points had predicted probabilities PrnatAval<0.05. The danger-level model exhibited a similar but less pronounced skew, with approximately 25 % of predictions below . In contrast, the instability model showed a more even distribution of predictions across the probability range.
The median predicted probabilities further underscore these differences: for the natural-avalanche model, the median was PrnatAval=0.04, suggesting that natural-avalanche activity was rarely predicted at the reference locations on an average day. For the danger-level model, the median prediction was , indicating that conditions at reference points would typically have been predicted as levels 1 (low) or 2 (moderate). The instability model had a notably higher median value of Prinstab=0.47, although this still falls within the stable category defined by Mayer et al. (2022, stable if Prinstab<0.5).
4.1.2 Events
The model-predicted distributions differed strongly between the reference distributions and the event dataset (Fig. 6c and d). Focusing on natural avalanches first, we observe that avalanche events were approximately similarly distributed across the entire range of PrnatAval values (Fig. 6c), with a visible increase only for PrnatAval>0.85. For the other two models, the number of natural avalanches increased considerably and almost continuously with increasing Pr values. The median value was PrnatAval=0.56, indicating that, on average, the natural-avalanche model predicted a greater than 50 % chance of at least one natural dry-snow avalanche occurring on event days. The median values were high for the danger-level model () as well as for the instability model (Prinstab=0.86), which correspond to a model-predicted danger level well within danger level 3 (considerable) and to the level of potentially unstable according to the classification by Mayer et al. (2022, unstable if Prinstab≥0.77).
Human-triggered avalanches were more frequent when the danger-level model and the instability model predicted higher probabilities (Fig. 6d). This pattern was much more pronounced for the instability model, with many events when Prinstab≥0.8. Median Pr values were lower for the dataset of human-triggered avalanches (, Prinstab=0.78) compared to natural-avalanche events.
Pr values differed significantly between events and reference distributions for all models (Wilcoxon rank-sum test: p<0.001).
4.1.3 Event ratio
As shown in Fig. 6e, the relative event ratios, RR (Eq. 2), increased markedly with the increasing probability value across all models for the natural-avalanche dataset. The natural-avalanche model exhibited a strictly monotonic increase, with a perfect Spearman rank-order correlation (ρ=1) between neighboring bins. The other two models also showed strong monotonicity (ρ=0.99). Median increases between adjacent bins ranged from for the natural-avalanche model to for the danger-level model and for the instability model. The total increase in RR between the lowest and highest bins (corresponding to Pr<0.05 and Pr>0.95) ranged from 72 (instability model) to 266 (natural-avalanche model), highlighting the models’ ability to differentiate between stable and unstable conditions with respect to natural-avalanche occurrence.
Results for human-triggered avalanches (Fig. 6f) followed a similar pattern (ρ≥0.98), although the magnitude of increase was less pronounced. The corresponding median bin-to-bin increases were for the instability model and for the danger-level model.
4.2 Comparison with the benchmark forecast, the avalanche bulletin
Figure 7 shows the relative ratios RR; additional details on the distributions of events and non-events are provided in the Appendix (Figs. B1–B2).
Both the models and the bulletin forecasts exhibited monotonously increasing RR values with increasing bin number or sub-level, with one exception: in the human-triggered avalanche dataset (Fig. 7b), the final bin for the human forecast showed a drop, likely reflecting user adaptation to clearly dangerous conditions when danger level 4 (high) was published.
Overall, the results show that both model predictions and human forecasts discern avalanche occurrence with a comparable level of skill (Fig. 7a). In both datasets – natural and human-triggered avalanches – the relative event ratio (RR) increased steadily with higher model probabilities and forecast sub-levels, as expected. While the human forecasts showed slightly stronger increases, the differences were modest. The average increase between adjacent bins () ranged from 2.20 to 2.26 for the three model-specific datasets (instability, danger-level, and natural-avalanche models) of the human forecasts compared to 1.63 for the instability model, 2.07 for the natural-avalanche model, and 2.0 for the danger-level model. The total increase from the lowest to highest bin (Ftotal) varied between 1206 and 1274 for the three model-specific datasets of the human forecasts and from 286 (instability model) to 1163 (danger-level model). Statistically comparing the respective distributions of the 100 bootstrap samples for each of the model-specific datasets of human forecasts and models confirmed that these differences were significant in most cases (Wilcoxon rank-sum test, p<0.001), with the exception of the natural-avalanche model (p=0.08). These findings highlight the fact that even though the human forecasts achieved slightly better discrimination, the spatially interpolated model predictions – without human refinement – performed at a broadly similar level.
For human-triggered avalanches (Fig. 7b), the observed increases in the relative event ratio (RR) were less pronounced than for natural avalanches, reflecting smaller effect sizes associated with human triggering. Still, both the human forecasts and model predictions showed a consistent increase in RR with higher sub-levels and probabilities. The human forecasts achieved values between 1.53 and 1.67 compared to 1.46 and 1.48 for the models. Although the numerical differences were smaller than in the natural-avalanche dataset, they remained statistically significant (p<0.01). This again suggests that while expert forecasts showed slightly better discriminatory power, model predictions without human input still captured meaningful differences in triggering likelihood.
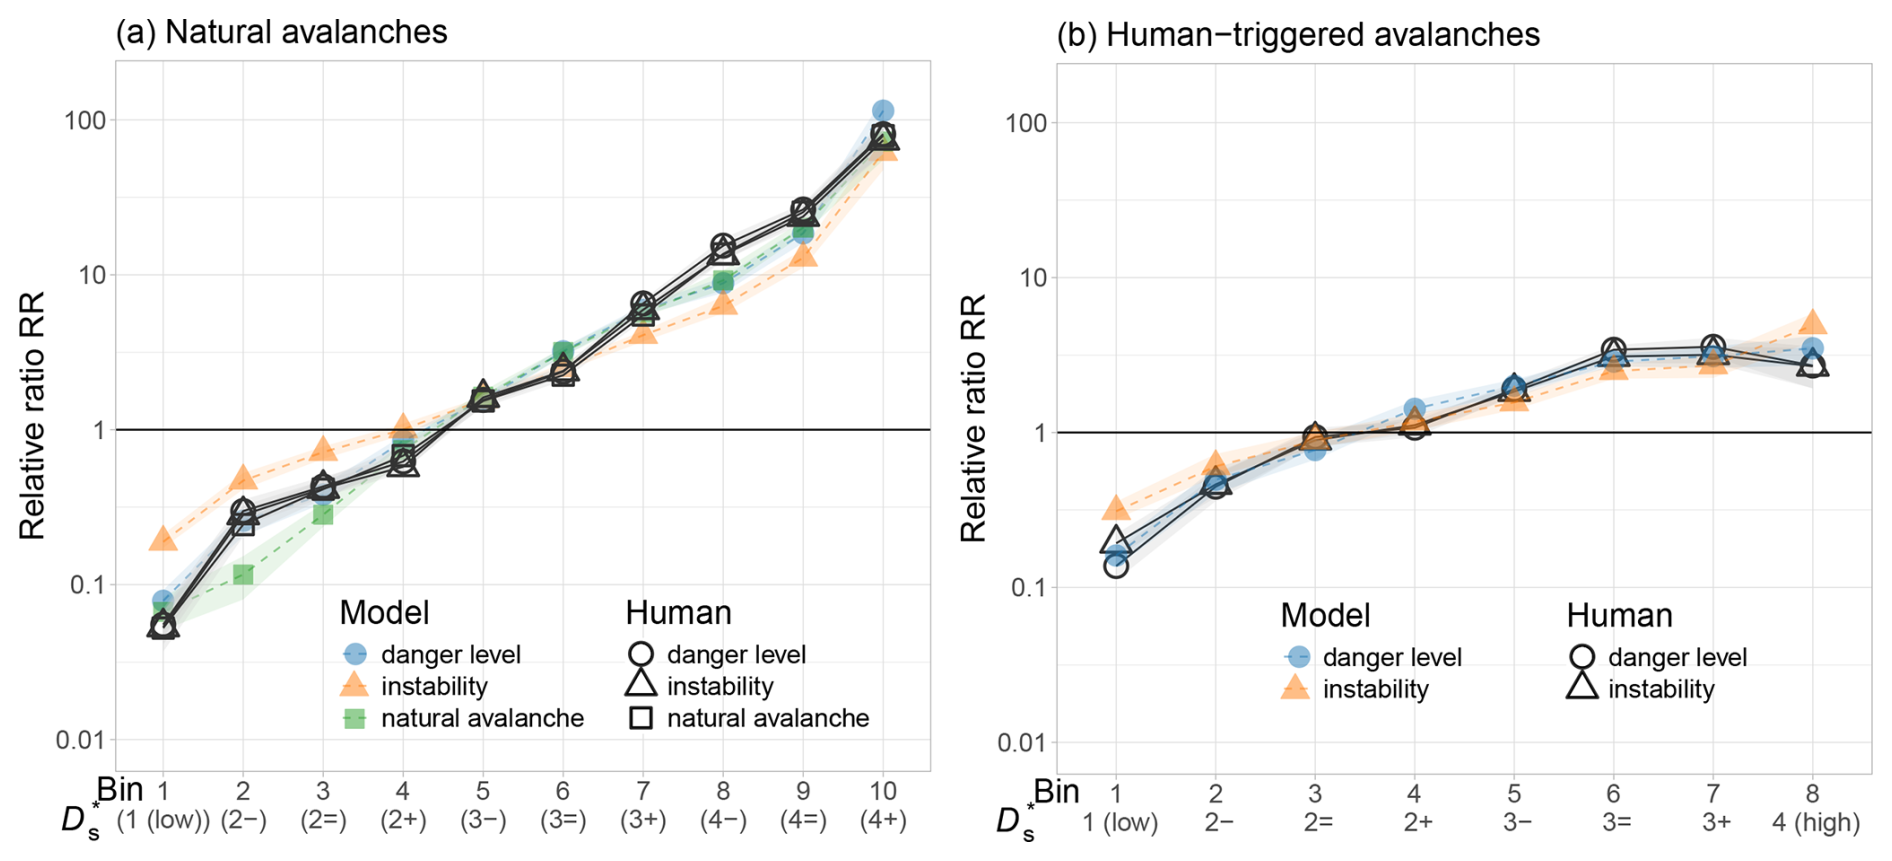
Figure 7Ratio of avalanche events to the reference distribution of model predictions and human sub-level forecasts normalized by the overall base-rate ratio (Eq. 2) for (a) natural avalanches and (b) human-triggered avalanches. Note the log scale on the y axis. Model predictions are shown with colored symbols; human forecasts for the same model subsets are shown with hollow black symbols.
This study addressed two research questions: (1) whether spatially interpolated model predictions for natural and human-triggered avalanches reflect observed variations in avalanche occurrence, and (2) whether these model-based predictions discern avalanche-relevant conditions as effectively as the human-generated sub-level forecasts published in the Swiss avalanche bulletin. We found that all three models captured patterns of avalanche occurrence well: model-predicted probabilities were strongly and positively correlated with the event ratio R (Fig. 6), our proxy for avalanche release probability. Both the model predictions and the human forecasts – interpreted using the one-level rule – showed clear, exponential increases in event ratio with rising bin or sub-level (Fig. 7), with the human forecasts maintaining a small but consistent advantage.
In the following, we discuss the comparable discriminatory skill of model and human forecasts, the challenges of verifying distributed predictions for rare and severe events, key assumptions and limitations of our study, and implications for the future of avalanche forecasting – particularly regarding the integration of model-driven processes.
5.1 Comparable discriminatory skill – but humans still maintain a slight lead
Model-driven forecasts can be considered successful when they independently achieve a level of discrimination comparable to that of expert-generated forecasts – and, crucially, do so at the spatial and temporal scales relevant to operational avalanche forecasting. Our results indicate that this aim is within reach: both model predictions and human forecasts showed consistently strong and exponential increases in the event ratio from stable to unstable conditions, suggesting that both approaches effectively reflect variations in avalanche occurrence probability.
However, this similarity must be interpreted in light of an important asymmetry. While forecasters had access to model output during forecast production – likely influencing the final danger levels – the model predictions were generated without access to any human-generated information such as avalanche observations, recent activity reports, or field assessments. The comparison was therefore unbalanced: it contrasts purely model-based predictions with human forecasts that integrated model data and benefited from broader situational awareness. Forecasters can draw on recent avalanche activity, on-the-ground snowpack observations, and knowledge of persistent weak layers – qualitative insights that are difficult to encode in current models but that meaningfully affect human forecast decisions. The fact that model predictions nonetheless performed at a comparable level highlights the maturity of these modeling approaches and suggests they may already offer a robust and reliable foundation in situations with limited observational data – for example, in remote regions.
In summary, our findings highlight the fact that model chains are no longer merely supplemental tools – they are approaching a level of discriminatory skill that qualifies them to be credible standalone components within avalanche forecasting workflows.
5.2 Verification of distributed predictions of rare and severe events
Avalanches are generally rare but potentially severe events. Exceptions are situations of widespread instability or when avalanches are very small. Public avalanche forecasts communicate the probability of these rare and severe events in a region through danger levels or using symbols or narrative text descriptions (e.g., EAWS, 2023; Hutter et al., 2021). They can therefore be considered a type of rare and severe event (RSE) forecast, following the notion of Murphy (1991). Verifying RSE forecasts is challenging due to the rarity of events, their localized nature, and the mismatch in scales between regional forecasts and local events. In practice, for a specific point in avalanche terrain within a region, the probability of avalanche occurrence is very low in most cases. We accommodated these challenges by interpolating to specific points and by evaluating the discriminatory power of human forecasts and model predictions, considering the increase in event ratio with increasing sub-level or model-predicted probability rather than by classifying forecasts and predictions using absolute terms as “right” or “wrong”. By doing so, we avoided comparing (distributed) model predictions and treating forecasters' best judgments as ground truth, as is often done due to a lack of objective data (e.g., Herla et al., 2025; Maissen et al., 2024). We consider this novel approach to be an important contribution of our study since it allows us to objectively link avalanche forecast danger levels to events and reference locations representing the range of avalanche terrain – a long-standing challenge (Schweizer et al., 2003).
Avalanche records are indicators of events; unfortunately, these are notoriously incomplete (e.g., Hafner et al., 2021). Automated avalanche detection systems using ground-based or airborne technologies have the potential to allow a much more systematic and continuous detection of events (e.g., Eckerstorfer et al., 2016; Fox et al., 2024; Hafner et al., 2022), particularly with regard to the occurrence and absence of natural avalanches. However, the avalanche detection rate is impacted by avalanche properties, including the type (wet or dry) and size of avalanches (e.g., Mayer et al., 2020; Hafner et al., 2021). Nonetheless, these systems likely provide the best means of obtaining increasingly complete avalanche records in the future, although they still do not resolve the issue of recording non-events under additional loads.
While an avalanche is a clear and objective indication that the snowpack was susceptible to triggering given a specific triggering mechanism (i.e., natural causes or additional loads from human activities) at the location and time of release, it remains conceptually and practically more challenging to be certain of non-events, as these require continuous monitoring of avalanche activity at a specific location and – in the case of triggering given additional loads, such as a skier – also requires knowledge about whether a person skied a slope without releasing an avalanche. To our knowledge, GPS tracks are currently the most widely used means to track actual terrain choices of backcountry users (e.g., Winkler et al., 2021; Degraeuwe et al., 2024; Sykes et al., 2025) and notionally also provide information on non-events.
5.3 Limitations
The datasets of natural and human-triggered avalanches represent only a small fraction of actual activity. Moreover, there is uncertainty related to the exact location and timing of avalanches. For human-triggered avalanches, starting-zone coordinates and release date were checked for plausibility (and corrected if needed); for natural avalanches, this was not possible.
We analyzed predictions made by an operational model pipeline in real time. We made no attempts to improve any part of the pipeline or to remove outliers, as these errors are part of the pipeline, as are human-made errors in the case of the human forecasts.
We focused on the probability of avalanche occurrence, due to either natural causes or human triggering. Avalanche size, which is expected to increase with increasing danger level (Schweizer et al., 2020; Techel et al., 2020a), was not analyzed in detail. Avalanche size, however, is reflected in human danger-level forecasts and is therefore also implicitly contained in the predictions of the danger-level model, as this model was trained using a historic dataset of quality-checked avalanche forecasts (Pérez-Guillén et al., 2022). In contrast, both the natural-avalanche model and the instability model were trained with a focus on estimating the probability of avalanche release due to natural causes or due to a human load.
For the purpose of our analysis, we assumed that the widely used one-level rule is a good approximation for applying the information provided in the human avalanche forecast to locations outside the aspects and elevations indicated in the public avalanche forecast. Even though this rule of thumb has been used for many years to apply the bulletin to avalanche terrain during the planning phase of ski tours (e.g., SLF, 2023), there are likely more suitable approaches, which reflect the more gradual – rather than step-wise – increase in avalanche danger with elevation and aspect (Winkler et al., 2021; Degraeuwe et al., 2024). Furthermore, for comparison between model predictions and human forecasts, we assigned rank-ordered model-predicted probabilities to bins equal in size to the proportion of the sub-levels. While this facilitated the comparison, it possibly split model predictions in an unfavorable way, potentially reducing the discrimination ability of model predictions.
For this analysis, we generated a reference distribution that reflects the range of conditions encountered across the three forecasting seasons. This distribution served as our benchmark for comparison. Such an approach is particularly suitable for evaluating the probability of natural-avalanche occurrence. However, human behavior in avalanche terrain is influenced by both forecasted and perceived conditions (e.g., Winkler et al., 2021). As a result, the reference distribution does not fully represent the true exposure of backcountry users, especially at higher danger levels: human presence in avalanche terrain tends to decrease at level 3 (considerable) and drops sharply at level 4 (high) (Winkler et al., 2021; Techel et al., 2024b). Nonetheless, the observed patterns in Fig. 7b resemble those found by Techel et al. (2024a)2. Conceptually, if users were unaware of conditions and did not adapt their behavior, the event ratio R would approximate the true probability of avalanche release due to human load, at least at a relative scale. Conversely, if users perfectly identified and avoided all unstable slopes, R would underestimate this probability. In reality, behavior likely falls between these extremes. Therefore, while we consider the reference distribution appropriate for validating the probability of natural-avalanche release, its representativeness for human-triggered avalanches remains uncertain – particularly because behavioral adaptations may differ depending on whether users see the human forecast (visible) or remain unaware of the model output (invisible).
5.4 Outlook and future directions
Our results show that avalanche forecasting model chains have matured substantially in recent years. Their ability to discern avalanche-relevant conditions is now broadly comparable to human-made regional danger-level forecasts when interpreted using a simple one-level rule.
This and other recent studies (e.g., Herla et al., 2024, 2025; Techel et al., 2022; Pérez-Guillén et al., 2025; Maissen et al., 2024; Trachsel et al., 2024) highlight the fact that the time has come to integrate model-based approaches more systematically into operational avalanche forecasting. Such integration could take different forms: models may be used as additional data sources, as intelligent summarizers of key information (e.g., Horton et al., 2025), or as independent second opinions that support decision-making (e.g., Purves et al., 2003; Maissen et al., 2024; Winkler et al., 2024).
To ensure constant alignment with real-world conditions, model chains must incorporate additional data streams – particularly real-time avalanche detection data – and remain robust when confronted with unfamiliar conditions that are not represented in the training data. Advances in snowpack physics and hybrid approaches such as physics-informed machine learning (Raissi et al., 2019) offer promising avenues. Equally important is the spatially consistent integration of uncertainty.
As model performance continues to improve and approaches – or surpasses – that of human forecasters, a shift toward more automated forecasting becomes increasingly feasible. In this context, forecasting systems must be not only accurate but also interpretable and resilient. Forecasting pipelines should include fallback strategies for data outages or infrastructure failures, with human expertise acting as a critical safeguard, especially in data-sparse or rapidly evolving situations.
We also anticipate that avalanche forecasts will be produced at increasingly high spatial and temporal resolutions. However, such forecasts must respect the limits imposed by data quality and availability. To ensure usability, clustering and aggregation techniques will be needed to communicate these detailed outputs effectively. As automation advances, the role of human forecasters may shift – from producing forecasts to interpreting, validating, and communicating them. These tasks will remain essential for ensuring trust, credibility, and user comprehension.
Eventually, model-based forecasts will also become directly available to end users. In principle, such products could already be offered today – as this study suggests – with minimal loss in predictive performance relative to human forecasts. However, interpreting these high-resolution outputs remains a challenge. Despite their apparent precision, model predictions are not slope specific. The platform Skitourenguru (https://www.skitourenguru.ch, last access: 5 September 2025) exemplifies one way to bridge this gap: combining regional forecasts with terrain-based heuristics to produce location-specific assessments (Winkler et al., 2021; Degraeuwe et al., 2024).
In sum, avalanche forecasting is undergoing a transformation akin to that seen in weather forecasting over the past decades (Young and Grahame, 2024). Data, computing power, and modeling capabilities have reached a point where machine-generated avalanche forecasts can rival human forecasts in many respects. Key questions now lie ahead: how can ML-based models be adapted to rare or yet-unseen conditions? How should high-resolution forecasts be communicated effectively? And what will be the evolving role of human expertise in an increasingly automated avalanche forecasting landscape?
We have shown that three spatially interpolated models predicting avalanche danger, the probability of avalanche release, and snowpack instability are capable of predicting expected increasing probabilities of avalanche release due to natural causes or human load. Moreover, the performance of these model predictions with regard to discerning avalanche conditions of different severities is broadly comparable to the skill of human forecasters in an operational setting, expressing this using danger levels including sub-level modifiers. Thus, fully data- and model-driven avalanche forecast pipelines – such as the ones discussed in this study – are ready to become an integral part of the avalanche forecasting process, mimicking changes to operational weather forecasting that have occurred over the last decades. Based on these findings, we conclude that public avalanche forecasting may be reaching a point where a transition from primarily human-made forecasts to machine-generated forecasts is appropriate. The extensive network of real-time data and observations in Switzerland coupled with high-resolution weather forecasting model output may provide a particularly appropriate setting for such developments. Nonetheless, more work is needed, including improving each step of the forecasting pipelines, reliably predicting infrequently occurring conditions, validating distributed or spatially interpolated predictions, optimally integrating models in the forecasting process, and – lastly but crucially – effectively communicating highly spatially and temporally resolved forecasts and their uncertainties to forecast users.
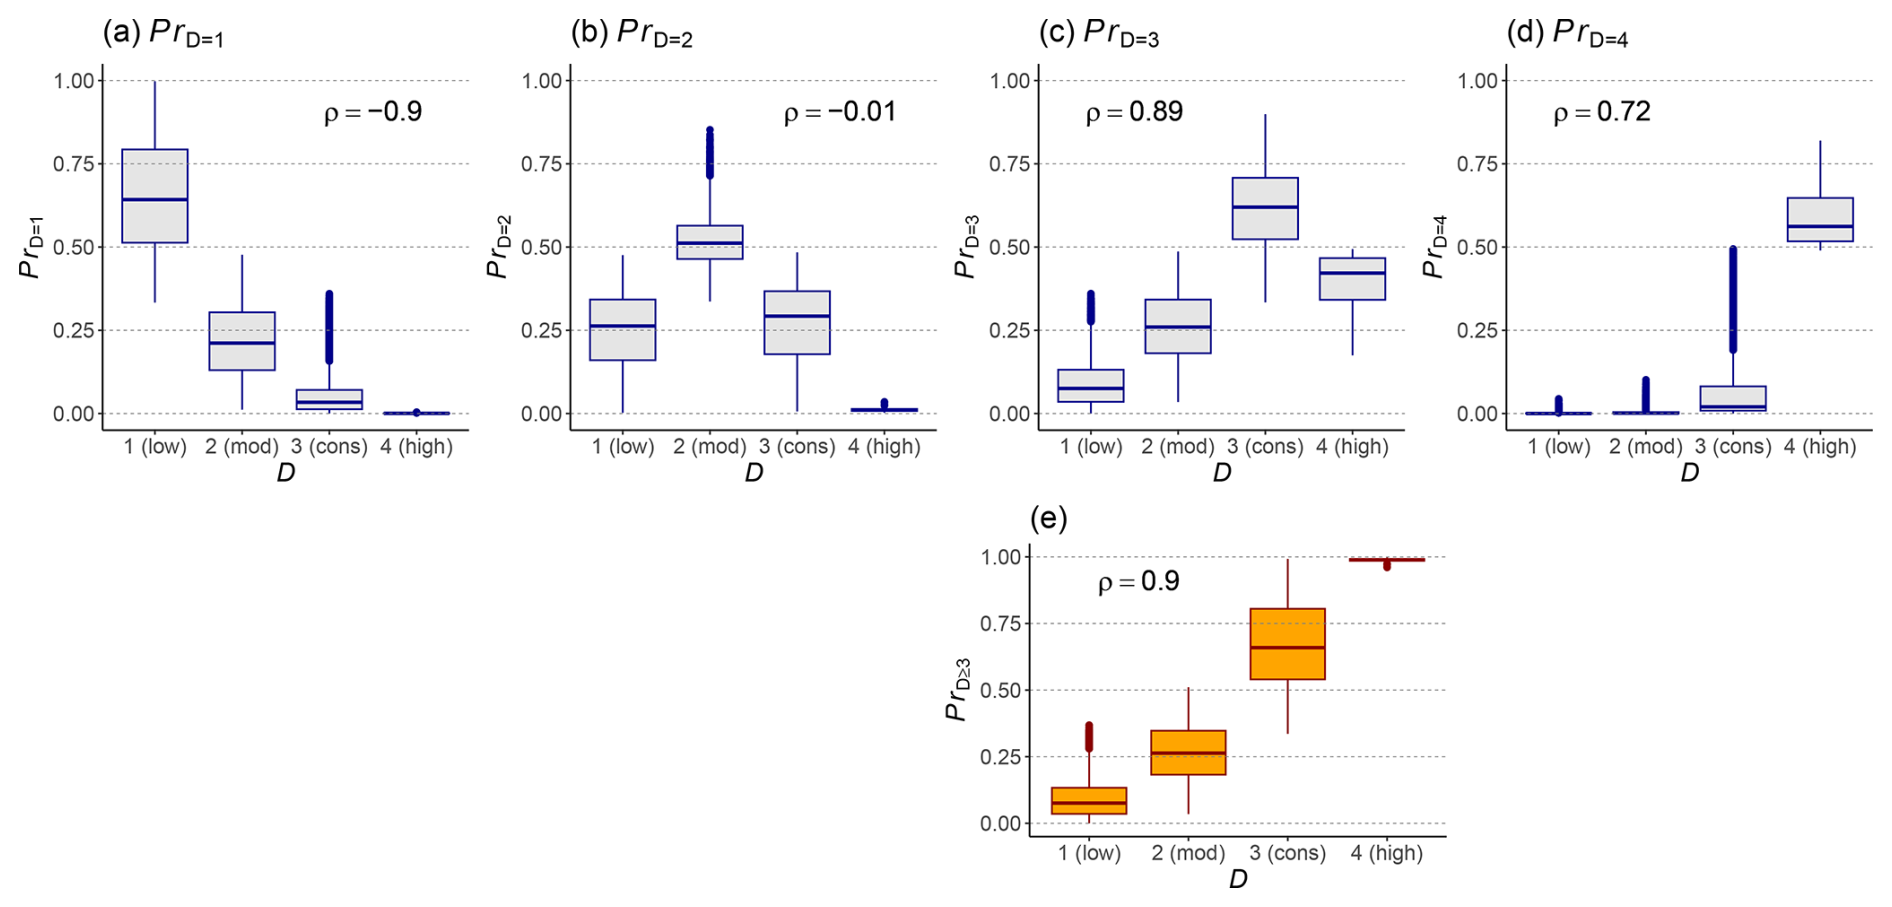
Figure A1Relationship between the model-predicted danger level D and the predicted probabilities for individual danger levels PrD=1, PrD=2, PrD=3, and PrD=4 shown in panels (a)–(d) and for PrD≥3 in panel (e). All predictions were generated by the danger-level model in forecast mode for the 2022/2023 season (n=56 000). Each panel also shows the corresponding Spearman rank correlation coefficient ρ between D and the predicted probability. Panel (e) shows the aggregated probability PrD≥3, which was used in the main analysis of this study. It has, together with PrD=1, the highest (absolute) correlation with D. For an in-depth analysis, refer to Pérez-Guillén et al. (2025).
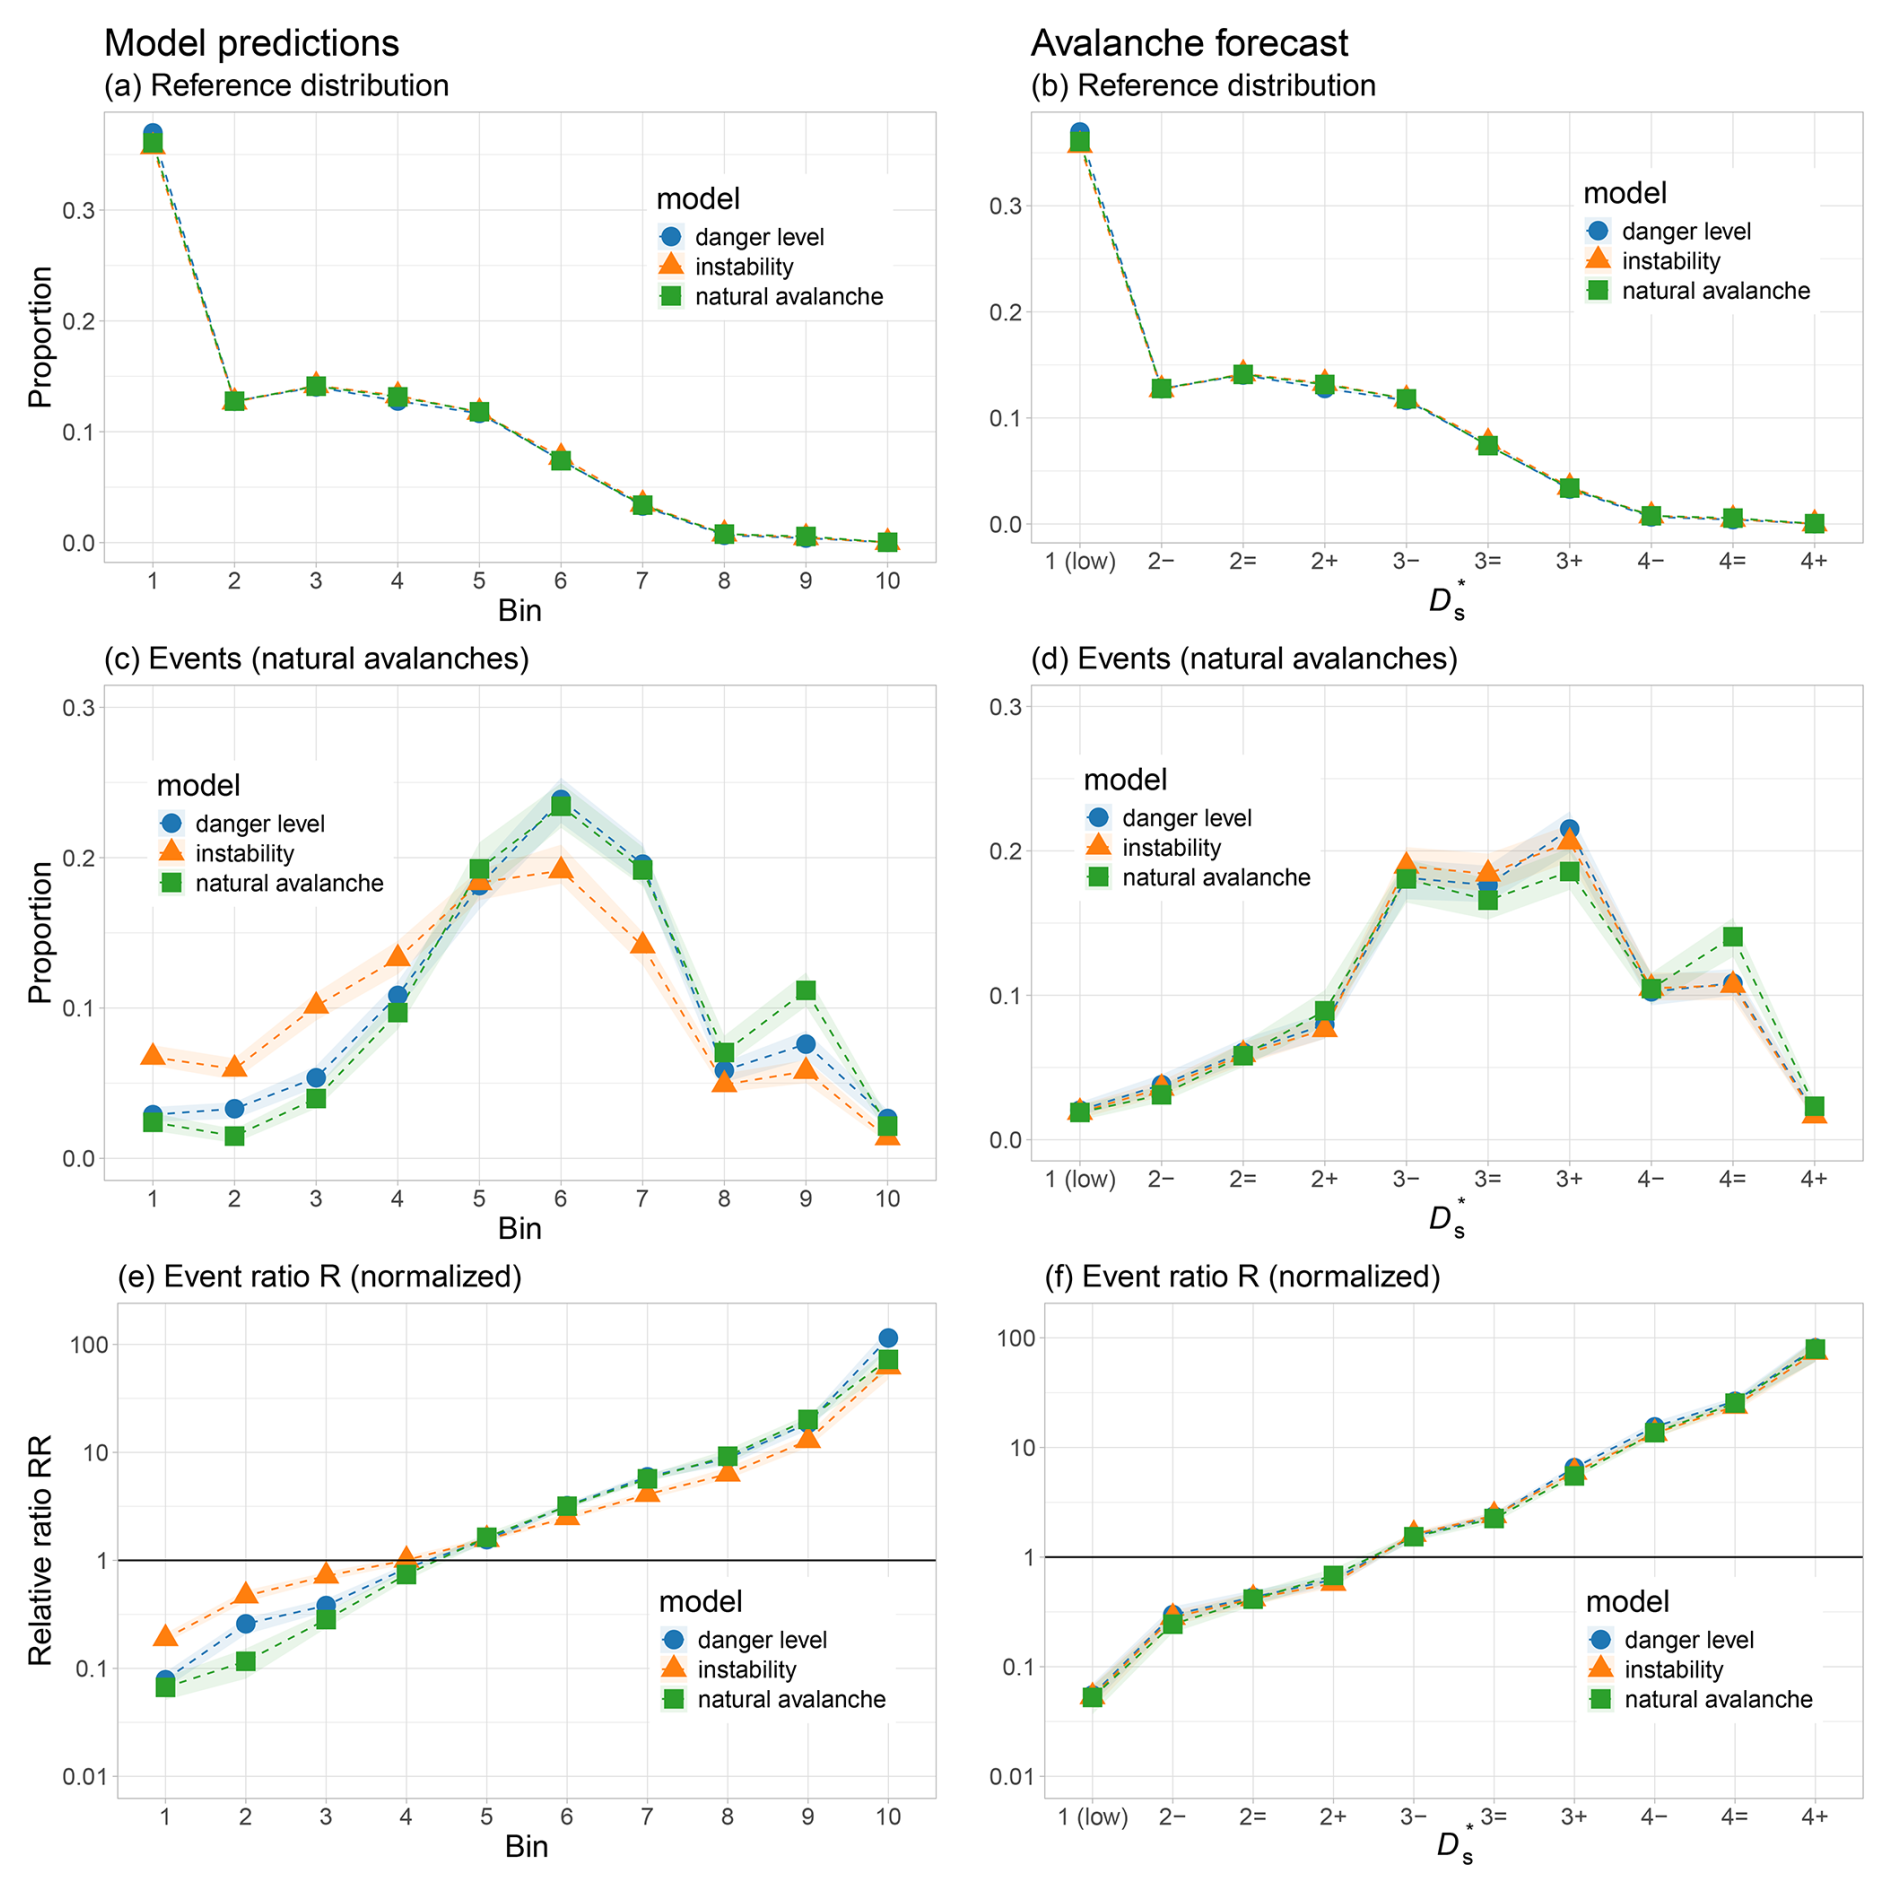
Figure B1Natural avalanches. (a, c, e) Model predictions and (b, d, f) human avalanche forecasts. (a, b) Reference distributions, (c, d) events (natural avalanches), and (e, f) the relative ratio RR (Eq. 2).
The data are available at the following data repository: https://doi.org/10.16904/envidat.535 (Techel and Schmudlach, 2024). The R code is available at https://doi.org/10.5281/zenodo.17060394 (Techel et al., 2025).
FT – conceptualization, methodology, data curation, formal analysis, and writing (original draft). SM – methodology and writing (review and editing). RSP – writing (review and editing). GS – writing (review and editing). KW – methodology and writing (review and editing).
The contact author has declared that none of the authors has any competing interests.
Publisher’s note: Copernicus Publications remains neutral with regard to jurisdictional claims made in the text, published maps, institutional affiliations, or any other geographical representation in this paper. While Copernicus Publications makes every effort to include appropriate place names, the final responsibility lies with the authors.
We greatly appreciate the in-depth constructive reviews by Florian Herla, Christoph Mitterer, and Pascal Haegeli. We thank Marc Ruesch and Andrea Helfenstein, who implemented the operational SNOWPACK model pipeline during 2023/2024, including the three models described in Sect. 2. We also benefited from Katia Soland working in parallel on her master's thesis (supervised by Frank Techel and Ross Purves), in which she explored kriging algorithms using the instability model and a larger data set of backcountry touring data (Soland, 2024). Marc Ruesch, Andrea Helfenstein, Cristina Pérez-Guillén, and Katia Soland provided feedback on an extended abstract of this paper that was submitted to the International Snow Science Workshop 2024 in Tromsø, Norway (Techel et al., 2024a). We acknowledge the use of ChatGPT-4o (OpenAI) to support language editing and code debugging of the original manuscript.
This paper was edited by Pascal Haegeli and reviewed by Florian Herla and Christoph Mitterer.
avalanche.org: North American Public Avalanche Danger Scale, https://avalanche.org/avalanche-encyclopedia/human/resources/north-american-public-avalanche-danger-scale/, last access: 12 August 2024. a
Bouchayer, C.: Synthesis of distributed snowpack simulation relevant for avalanche hazard forecasting, MSc. thesis, University Grenoble Alpes, France, https://doi.org/10.13140/RG.2.2.21665.20329, 2017. a
Breiman, L.: Random forests, Machine Learning, 45, 5–32, https://doi.org/10.1023/A:1010933404324, 2001. a
COSMO: COSMO – Consortium for small-scale modeling, https://www.cosmo-model.org/content/model/cosmo/overview.htm, last access: 6 May 2025. a
Degraeuwe, B., Schmudlach, G., Winkler, K., and Köhler, J.: SLABS: An improved probabilistic method to assess the avalanche risk on backcountry ski tours, Cold Reg. Sci. Technol., 221, 104169, https://doi.org/10.1016/j.coldregions.2024.104169, 2024. a, b, c
Durand, Y., Giraud, G., Brun, E., Mérindol, L., and Martin, E.: A computer-based system simulating snowpack structures as a tool for regional avalanche forecasting, J. Glaciol., 45, 469–484, 1999. a
EAWS: Standards: avalanche size, https://www.avalanches.org/standards/avalanche-size/ (last access: 13 May 2022), 2019. a
EAWS: Standards: European Avalanche Danger Scale, Tech. rep., https://www.avalanches.org/standards/avalanche-danger-scale/ (last access: 7 July 2024), 2023. a, b
Eckerstorfer, M., Bühler, Y., Frauenfelder, R., and Malnes, E.: Remote sensing of snow avalanches: Recent advances, potential, and limitations, Cold Reg. Sci. Technol., 121, 126–140, https://doi.org/10.1016/j.coldregions.2015.11.001, 2016. a
Fox, J., Siebenbrunner, A., Reitinger, S., Peer, D., and Rodríguez-Sánchez, A.: Automating avalanche detection in ground-based photographs with deep learning, Cold Reg. Sci. Technol., 223, 104179, https://doi.org/10.1016/j.coldregions.2024.104179, 2024. a
Fromm, R. and Schönberger, C.: Estimating the danger of snow avalanches with a machine learning approach using a comprehensive snow cover model, Machine Learning with Applications, 10, 100405, https://doi.org/10.1016/j.mlwa.2022.100405, 2022. a, b
Gräler, B., Pebesma, E., and Heuvelink, G.: Spatio-Temporal Interpolation using gstat, The R Journal, 8, 204–218, https://journal.r-project.org/archive/2016/RJ-2016-014/index.html (last access: 5 September 2025), 2016. a
Hafner, E. D., Techel, F., Leinss, S., and Bühler, Y.: Mapping avalanches with satellites – evaluation of performance and completeness, The Cryosphere, 15, 983–1004, https://doi.org/10.5194/tc-15-983-2021, 2021. a, b
Hafner, E. D., Barton, P., Daudt, R. C., Wegner, J. D., Schindler, K., and Bühler, Y.: Automated avalanche mapping from SPOT 6/7 satellite imagery with deep learning: results, evaluation, potential and limitations, The Cryosphere, 16, 3517–3530, https://doi.org/10.5194/tc-16-3517-2022, 2022. a
Hendrick, M., Techel, F., Volpi, M., Olevski, T., Pérez-Guillén, C., van Herwijnen, A., and Schweizer, J.: Automated prediction of wet-snow avalanche activity in the Swiss Alps, J. Glaciol., 69, 1365–1378, https://doi.org/10.1017/jog.2023.24, 2023. a, b, c
Hengl, T., Heuvelink, G. B., and Rossiter, D. G.: About regression-kriging: From equations to case studies, Comput. Geosci., 33, 1301–1315, https://doi.org/10.1016/j.cageo.2007.05.001, 2007. a, b
Herla, F., Horton, S., Mair, P., and Haegeli, P.: Snow profile alignment and similarity assessment for aggregating, clustering, and evaluating snowpack model output for avalanche forecasting, Geosci. Model Dev., 14, 239–258, https://doi.org/10.5194/gmd-14-239-2021, 2021. a
Herla, F., Haegeli, P., and Mair, P.: A data exploration tool for averaging and accessing large data sets of snow stratigraphy profiles useful for avalanche forecasting, The Cryosphere, 16, 3149–3162, https://doi.org/10.5194/tc-16-3149-2022, 2022. a
Herla, F., Haegeli, P., Horton, S., and Mair, P.: A large-scale validation of snowpack simulations in support of avalanche forecasting focusing on critical layers, Nat. Hazards Earth Syst. Sci., 24, 2727–2756, https://doi.org/10.5194/nhess-24-2727-2024, 2024. a, b
Herla, F., Haegeli, P., Horton, S., and Mair, P.: A quantitative module of avalanche hazard – comparing forecaster assessments of storm and persistent slab avalanche problems with information derived from distributed snowpack simulations, Nat. Hazards Earth Syst. Sci., 25, 625–646, https://doi.org/10.5194/nhess-25-625-2025, 2025. a, b, c, d, e
Horton, S., Nowak, S., and Haegeli, P.: Enhancing the operational value of snowpack models with visualization design principles, Nat. Hazards Earth Syst. Sci., 20, 1557–1572, https://doi.org/10.5194/nhess-20-1557-2020, 2020. a
Horton, S., Haegeli, P., Klassen, K., Floyer, J., and Helgeson, G.: Adopting SNOWPACK models into an operational forecasting program: successes, challenges, and future outlook, in: Proceedings International Snow Science Workshop, Bend, Oregon, 2023, 1544–1549, https://arc.lib.montana.edu/snow-science/item.php?id=3095 (last access: 5 September 2025), 2023. a
Horton, S., Herla, F., and Haegeli, P.: Clustering simulated snow profiles to form avalanche forecast regions, Geosci. Model Dev., 18, 193–209, https://doi.org/10.5194/gmd-18-193-2025, 2025. a, b
Hutter, V., Techel, F., and Purves, R. S.: How is avalanche danger described in textual descriptions in avalanche forecasts in Switzerland? Consistency between forecasters and avalanche danger, Nat. Hazards Earth Syst. Sci., 21, 3879–3897, https://doi.org/10.5194/nhess-21-3879-2021, 2021. a, b
Intercantonal Measurement and Information System IMIS: IMIS measuring network, Intercantonal Measurement and Information System IMIS [data set], https://doi.org/10.16904/envidat.406, 2024. a
Lehning, M., Bartelt, P., Brown, R., Fierz, C., and Satyawali, P.: A physical SNOWPACK model for the Swiss avalanche warning; Part II. Snow microstructure, Cold Reg. Sci. Technol., 35, 147–167, 2002. a
Lucas, C., Trachsel, J., Eberli, M., Grüter, S., Winkler, K., and Techel, F.: Introducing sublevels in the Swiss avalanche forecast, in: Proceedings International Snow Science Workshop ISSW 2023, Bend, Oregon, USA, 8–13 October 2023, 240–247, https://arc.lib.montana.edu/snow-science/objects/ISSW2023_P1.19.pdf (last access: 5 September 2025), 2023. a
Maissen, A., Techel, F., and Volpi, M.: A three-stage model pipeline predicting regional avalanche danger in Switzerland (RAvaFcast v1.0.0): a decision-support tool for operational avalanche forecasting, Geosci. Model Dev., 17, 7569–7593, https://doi.org/10.5194/gmd-17-7569-2024, 2024. a, b, c, d, e, f, g
Mayer, S., van Herwijnen, A., Ulivieri, G., and Schweizer, J.: Evaluating the performance of an operational infrasound avalanche detection system at three locations in the Swiss Alps during two winter seasons, Cold Reg. Sci. Technol., 173, 102962, https://doi.org/10.1016/j.coldregions.2019.102962, 2020. a
Mayer, S., van Herwijnen, A., Techel, F., and Schweizer, J.: A random forest model to assess snow instability from simulated snow stratigraphy, The Cryosphere, 16, 4593–4615, https://doi.org/10.5194/tc-16-4593-2022, 2022. a, b, c, d, e, f
Mayer, S., Techel, F., Schweizer, J., and van Herwijnen, A.: Prediction of natural dry-snow avalanche activity using physics-based snowpack simulations, Nat. Hazards Earth Syst. Sci., 23, 3445–3465, https://doi.org/10.5194/nhess-23-3445-2023, 2023. a, b, c, d
MeteoSwiss: ICON forecasting system, MeteoSwiss, https://www.meteoswiss.admin.ch/weather/warning-and-forecasting-systems/icon-forecasting-systems.html, last access: 6 May 2025. a
Monti, F., Schweizer, J., and Fierz, C.: Hardness estimation and weak layer detection in simulated snow stratigraphy, Cold Reg. Sci. Technol., 103, 82–90, https://doi.org/10.1016/j.coldregions.2014.03.009, 2014. a
Morin, S., Horton, S., Techel, F., Bavay, M., Coléou, C., Fierz, C., Gobiet, A., Hagenmuller, P., Lafaysse, M., Ližar, M., Mitterer, C., Monti, F., Müller, K., Olefs, M., Snook, J. S., van Herwijnen, A., and Vionnet, V.: Application of physical snowpack models in support of operational avalanche hazard forecasting: A status report on current implementations and prospects for the future, Cold Reg. Sci. Technol., 170, 102910, https://doi.org/10.1016/j.coldregions.2019.102910, 2020. a, b, c
Mott, R., Winstral, A., Cluzet, B., Helbig, N., Magnusson, J., Mazzotti, G., Quéno, L., Schirmer, M., Webster, C., and Jonas, T.: Operational snow-hydrological modeling for Switzerland, Frontiers in Earth Science, 11, https://doi.org/10.3389/feart.2023.1228158, 2023. a
Murphy, A.: Probabilities, odds, and forecasts of rare events, Weather and Forecasting, 6, 302–307, https://doi.org/10.1175/1520-0434(1991)006<0302:POAFOR>2.0.CO;2, 1991. a
Pebesma, E.: Simple features for R: Standardized support for spatial vector data, R J., 10, 439–446, https://doi.org/10.32614/RJ-2018-009, 2018. a
Pebesma, E. and Bivand, R.: Spatial Data Science: With applications in R, Chapman and Hall/CRC, https://doi.org/10.1201/9780429459016, 2023. a
Pebesma, E. J.: Multivariable geostatistics in S: the gstat package, Comput. Geosci., 30, 683–691, https://doi.org/10.1016/j.cageo.2004.03.012, 2004. a
Pérez-Guillén, C., Techel, F., Hendrick, M., Volpi, M., van Herwijnen, A., Olevski, T., Obozinski, G., Pérez-Cruz, F., and Schweizer, J.: Data-driven automated predictions of the avalanche danger level for dry-snow conditions in Switzerland, Nat. Hazards Earth Syst. Sci., 22, 2031–2056, https://doi.org/10.5194/nhess-22-2031-2022, 2022. a, b, c, d, e
Pérez-Guillén, C., Techel, F., Volpi, M., and van Herwijnen, A.: Assessing the performance and explainability of an avalanche danger forecast model, Nat. Hazards Earth Syst. Sci., 25, 1331–1351, https://doi.org/10.5194/nhess-25-1331-2025, 2025. a, b, c, d, e
Perfler, M., Binder, M., Reuter, B., Prinz, R., and Mitterer, C.: Assessing avalanche problems for operational avalanche forecasting based on different model chains, in: Proceedings, International Snow Science Workshop, Bend, Oregon, 8–13 October 2023, 128–134, https://arc.lib.montana.edu/snow-science/objects/ISSW2023_O4.05.pdf (last access: 5 September 2025), 2023. a
Purves, R., Morrison, K., Moss, G., and Wright, D.: Nearest neighbours for avalanche forecasting in Scotland: development, verification and optimisation of a model, Cold Reg. Sci. Technol., 37, 343–355, https://doi.org/10.1016/S0165-232X(03)00075-2, 2003. a
Raissi, M., Perdikaris, P., and Karniadakis, G.: Physics-informed neural networks: A deep learning framework for solving forward and inverse problems involving nonlinear partial differential equations, J. Comput. Phys., 378, 686–707, https://doi.org/10.1016/j.jcp.2018.10.045, 2019. a
Reuter, B., Viallon-Galinier, L., Horton, S., van Herwijnen, A., Mayer, S., Hagenmuller, P., and Morin, S.: Characterizing snow instability with avalanche problem types derived from snow cover simulations, Cold Reg. Sci. Technol., 194, 103462, https://doi.org/10.1016/j.coldregions.2021.103462, 2022. a
Richter, B., Schweizer, J., Rotach, M. W., and van Herwijnen, A.: Validating modeled critical crack length for crack propagation in the snow cover model SNOWPACK, The Cryosphere, 13, 3353–3366, https://doi.org/10.5194/tc-13-3353-2019, 2019. a
Schweizer, J., Kronholm, K., and Wiesinger, T.: Verification of regional snowpack stability and avalanche danger, Cold Reg. Sci. Technol., 37, 277–288, https://doi.org/10.1016/S0165-232X(03)00070-3, 2003. a
Schweizer, J., Mitterer, C., Techel, F., Stoffel, A., and Reuter, B.: On the relation between avalanche occurrence and avalanche danger level, The Cryosphere, 14, 737–750, https://doi.org/10.5194/tc-14-737-2020, 2020. a, b
SLF: Avalanche bulletin interpretation guide, WSL Institute for Snow and Avalanche Research SLF, September 2023 edn., https://www.slf.ch/fileadmin/user_upload/SLF/Lawinenbulletin_Schneesituation/Wissen_zum_Lawinenbulletin/Interpretationshilfe/Interpretationshilfe_EN.pdf (last access: 12 August 2024), 2023. a, b, c, d
SLF: SLF-Beobachterhandbuch (observational guidelines), 57 pp., Davos, WSL-Institut für Schnee- und Lawinenforschung, https://www.dora.lib4ri.ch/wsl/islandora/object/wsl:37922/datastream/PDF (last access: 5 September 2025), 2024. a, b
Soland, K.: Towards automating avalanche forecasts: A kriging model to interpolate modeled snow instability in the Swiss Alps, https://lean-gate.geo.uzh.ch/typo3conf/ext/qfq/Classes/Api/download.php/mastersThesis/1048 (last access: 5 September 2025), 2024. a
Sykes, J., Haegeli, P., Atkins, R., Mair, P., and Bühler, Y.: Development of operational decision support tools for mechanized ski guiding using avalanche terrain modeling, GPS tracking, and machine learning, Nat. Hazards Earth Syst. Sci., 25, 1255–1292, https://doi.org/10.5194/nhess-25-1255-2025, 2025. a
Techel, F.: On consistency and quality in public avalanche forecasting: a data-driven approach to forecast verification and to refining definitions of avalanche danger, PhD thesis, Department of Geography, University of Zurich, Zurich Switzerland, https://doi.org/10.5167/uzh-199650, 2020. a
Techel, F. and Schmudlach, G.: Evaluating the predictive performance of human avalanche forecasts and model predictions in Switzerland, EnviDat [data set], https://doi.org/10.16904/envidat.535, 2024. a
Techel, F., Müller, K., and Schweizer, J.: On the importance of snowpack stability, the frequency distribution of snowpack stability, and avalanche size in assessing the avalanche danger level, The Cryosphere, 14, 3503–3521, https://doi.org/10.5194/tc-14-3503-2020, 2020a. a
Techel, F., Pielmeier, C., and Winkler, K.: Refined dry-snow avalanche danger ratings in regional avalanche forecasts: consistent? And better than random?, Cold Reg. Sci. Technol., 180, 103162, https://doi.org/10.1016/j.coldregions.2020.103162, 2020b. a
Techel, F., Mayer, S., Pérez-Guillén, C., Schmudlach, G., and Winkler, K.: On the correlation between a sub-level qualifier refining the danger level with observations and models relating to the contributing factors of avalanche danger, Nat. Hazards Earth Syst. Sci., 22, 1911–1930, https://doi.org/10.5194/nhess-22-1911-2022, 2022. a, b, c, d
Techel, F., Helfenstein, A., Mayer, S., Pérez-Guillén, C., Purves, R., Ruesch, M., Schmudlach, G., Soland, K., and Winkler, K.: Human vs Machine – Comparing model predictions and human forecasts of avalanche danger and snow instability in the Swiss Alps, in: Proceedings International Snow Science Workshop, Tromsø, Norway, 23–29 September 2024, 31–38, https://arc.lib.montana.edu/snow-science/item.php?id=3108 (last access: 5 September 2025), 2024a. a, b
Techel, F., Mayer, S., Purves, R. S., Schmudlach, G., and Winkler, K.: Forecasting avalanche danger: human-made forecasts vs. fully automated model-driven predictions, Nat. Hazards Earth Syst. Sci. Discuss. [preprint], https://doi.org/10.5194/nhess-2024-158, in review, 2024b. a
Techel, F., Purves, R., Mayer, S., Schmudlach, G., and Winkler, K.: Can model-based avalanche forecasts match the discriminatory skill of human danger-level forecasts? A comparison from Switzerland (data, code), Zenodo [data set], https://doi.org/10.5281/zenodo.17060394, 2025.
Trachsel, J., Richter, B., Staehly, S., Mayer, S., Wahlen, S., van Herwijnen, A., and Techel, F.: Combining model predictions and radar avalanche detections for operational avalanche forecasting, in: Proceedings International Snow Science Workshop, Tromsø, Norway, 23–29 September 2024, 1079–1084, https://arc.lib.montana.edu/snow-science/item.php?id=3271 (last access: 5 September 2025), 2024. a, b
van Herwijnen, A., Mayer, S., Pérez-Guillén, C., Techel, F., Hendrick, M., and Schweizer, J.: Data-driven models used in operational avalanche forecasting in Switzerland, in: International Snow Science Workshop ISSW 2023, Bend, Oregon, USA, 8–13 October 2023, https://arc.lib.montana.edu/snow-science/objects/ISSW2023_P1.33.pdf (last access: 5 September 2025), 2023. a
Viallon-Galinier, L., Hagenmuller, P., and Eckert, N.: Combining modelled snowpack stability with machine learning to predict avalanche activity, The Cryosphere, 17, 2245–2260, https://doi.org/10.5194/tc-17-2245-2023, 2023. a
Vionnet, V., Brun, E., Morin, S., Boone, A., Faroux, S., Le Moigne, P., Martin, E., and Willemet, J.-M.: The detailed snowpack scheme Crocus and its implementation in SURFEX v7.2, Geosci. Model Dev., 5, 773–791, https://doi.org/10.5194/gmd-5-773-2012, 2012. a
Winkler, K., Schmudlach, G., Degraeuwe, B., and Techel, F.: On the correlation between the forecast avalanche danger and avalanche risk taken by backcountry skiers in Switzerland, Cold Reg. Sci. Technol., 188, 103299, https://doi.org/10.1016/j.coldregions.2021.103299, 2021. a, b, c, d, e, f, g, h, i
Winkler, K., Trachsel, J., Knerr, J., Niederer, U., Weiss, G., Ruesch, M., and Techel, F.: SAFE – a layer-based avalanche forecast editor for better integration of model predictions, in: Proceedings International Snow Science Workshop, Tromsø, Norway, 23–29 September 2024, 124–131, https://arc.lib.montana.edu/snow-science/item.php?id=3123 (last access: 5 September 2025), 2024. a
Young, M. V. and Grahame, N. S.: The history of UK weather forecasting: the changing role of the central guidance forecaster. Part 7: Operational forecasting in the twenty-first century: graphical guidance products, risk assessment and impact-based warnings, Weather, 79, 72–80, https://doi.org/10.1002/wea.4488, 2024. a