the Creative Commons Attribution 4.0 License.
the Creative Commons Attribution 4.0 License.
 | 13 Jun 2025
Estimating the mass of tephra accumulated on roads to best manage the impact of volcanic eruptions: the example of Mt Etna, Italy
Manuel Stocchi
Alexander Garcia
Michele Prestifilippo
Laura Sandri
Costanza Bonadonna
Simona Scollo
Explosive eruptions release significant quantities of tephra, which can spread and settle on the ground, potentially leading to various types of damage and disruption to public infrastructure, including road networks. The quantification of the tephra load is, therefore, of significant interest to evaluate and reduce environmental and socio-economic impact, as well as for managing crises. Tephra dispersal and deposition is a function of multiple factors, including the mass eruption rate (MER), tephra characteristics (size, shape, density), top plume height (HTP), grain size distribution (GSD), and local wind field. In this work, we quantified the tephra mass deposited on the main road network on the east-southeast flanks of Mt Etna (Italy) during lava fountains that occurred in 2021, which reached heights of hundreds of metres. We focused on road connections of municipalities significantly affected by these events such as Milo, Santa Venerina, and Zafferana Etnea. First, we analysed a sequence of 39 short-lasting and intense lava fountains detected by the X-band weather radar, applying a volcanic ash radar retrieval approach that permits us to compute the main eruption source parameters (ESPs), such MER, HTP, and GSD. When radar measurements were unavailable for a specific event, we analysed images acquired both by the Spinning Enhanced Visible and InfraRed Imager (SEVIRI) radiometer and by the visible and/or thermal infrared camera of the Istituto Nazionale di Geofisica e Vulcanologia, Osservatorio Etneo (Catania), to derive the main ESPs. Second, we used the computed ESPs as inputs to run two different numerical models, Tephra2 and Fall3D, and to reproduce tephra dispersal and accumulation on the road network. Finally, we produce, for the first time, georeferenced estimates of tephra mass deposited on the whole road network of three municipalities, allowing us to identify the main roads which have been mostly impacted by tephra accumulation, as well as to estimate the total mass of primary tephra that has been removed from roads. Such information represents a valuable input for planning and quick management of the short-term tephra load hazard for future explosive events on Mt Etna.
- Article
(8468 KB) - Full-text XML
- BibTeX
- EndNote


The estimation of tephra mass deposited on the ground, following a volcanic explosive eruption, remains a key piece of information that is not covered well in the literature. In fact, tephra dispersal and fallout is by far the most widespread volcanic hazard affecting both local and distal areas (Jenkins et al., 2015; Barsotti et al., 2018; Bonadonna et al., 2021b), including the impact on public health (Baxter, 1990; Horwell and Baxter, 2006), roof/building collapse (Spence et al., 2005), dangerous road conditions (Blong, 1996; Wilson et al., 2012; Jenkins et al., 2014; Blake et al., 2017), contamination of water reservoirs and vegetation (Wilson et al., 2012; Ágústsdóttir, 2015), damage to electrical infrastructure (Bebbington et al., 2008; Wardman et al., 2012; Wilson et al., 2012, Dominguez et al., 2021), transportation system disruptions (Casadevall, 1994; Guffanti et al., 2009; Wilson et al., 2012), and the impact on telecommunication networks (Wilson et al., 2012). Even tephra associated with relatively low-intensity eruptions may induce various disrupting effects on transport infrastructure such as aeroplane engine failure and visibility reduction during both primary tephra fall and ash remobilization (Sarna-Wojcicki et al., 1981; Bonadonna et al., 2021b; Johnston and Daly, 1995; Wilson et al., 2014). In particular, tephra accumulation, although not causing significant physical damage to the road network, can cause wide disruption including reduction of skid resistance, obscuration of road markings, and damage to car air filters (Blake et al., 2016, 2017). Tephra particles are also very abrasive, with the degree of abrasiveness dependent on the hardness of the material forming the particles as well as their shape and angularity (Blong, 1984; Johnston, 1997; Labadie, 1994; Heiken et al., 1995; Miller and Casadevall, 1999; Gordon et al., 2005; Wilson et al., 2012; Blake et al., 2017).
During volcanic eruptions, routes may be required for the evacuation of residents and to allow emergency services and civil protection personnel to access the affected areas. Road networks are critical for society under normal operating conditions and especially during emergencies (e.g. Bonadonna et al., 2021a; Hayes et al., 2022), for both immediate and long-term recovery, including clean-up and disposal of pyroclastic material and restoration of services and commerce (Blake et al., 2017).
In this work, for the first time, we quantify the tephra mass accumulated on the road network of east and southeast sectors of Mt Etna, which were preferentially affected during the sequence of explosive events of 2021. Usually, the eruptive sequences at Mt Etna are characterized by short-lasting explosive events, with durations of a few hours, separated by periods that can last from a few hours to a few days (Calvari et al., 2018; Andronico et al., 2021; Calvari et al., 2022). Most studies on exposed critical infrastructure have focussed on larger events and tephra-fallout accumulations greater than 10 kg m−2 (Wilson et al., 2012; Blake et al., 2017; Scollo et al., 2013). However, areas around Mt Etna are more frequently impacted by rates and volumes of smaller tephra accumulation (Scollo et al., 2013). Limited quantitative data available for explosive activity have hampered a reliable quantification of the impact of the tephra deposition at Mt Etna. To investigate its impact on road networks and better characterize its behaviour, we analysed a sequence of lava fountains that occurred between February and October 2021, focusing our analysis on 39 events that generated volcanic plumes dispersed by wind mostly towards the east-southeast flanks of the volcano (directions between 90 and 130° from north). These episodes began at the South-East Crater (SEC) as initial Strombolian activity that, with time, evolved to lava fountain activity, also named paroxysm.
Remote sensing is routinely used for monitoring the eruptive activity of Mt Etna; the Istituto Nazionale di Geofisica e Vulcanologia, Osservatorio Etneo (INGV-OE), runs a remote sensing network that includes both ground-based (such as thermal infrared and visible cameras) and satellite-based sensors (Scollo et al., 2019). An X-band weather radar located at Catania–Fontanarossa Airport, which is part of the monitoring network of the Italian department of civil protection (DPC), allowed us to monitor and analyse Mt Etna's eruptions as well (Marzano et al., 2020; Mereu et al., 2020). Using these sensors, we could observe in almost all cases the temporal evolution of explosive activity and characterize it quantitatively in terms of mass eruption rate (MER) and top plume height (HTP). These two parameters are among the main input variables for advection–dispersion models (Scollo et al., 2008a; Biass et al., 2017; Tadini et al., 2022; Takishita et al., 2021), such as Tephra2 and Fall3D (Bonadonna et al., 2005; Costa et al., 2006; Folch et al., 2009, 2020), which have been used in this work to simulate the tephra dispersion and calculate the deposit load at the ground. For each of the 39 events, we estimate the tephra deposited on the road network in order to identify the roads mostly exposed to tephra accumulation and to evaluate both the ground mass load that is expected to be removed and the costs involved in clean-up operations. The deposited tephra creates disruptions, especially on main roads, considering the large stretches of roadway that may face hazardous driving conditions. Moreover, analysing the simulations using both models, we investigate their sensitivity to variations in tephra granulometric characteristics and assess the associated uncertainties. The numerical output from a single simulation is a georeferenced map of tephra load, which is useful to analyse the impact of deposited tephra fallout on roads (Scollo et al., 2009, 2013; Costa et al., 2012; Bonadonna et al., 2005; Barsotti et al., 2018; Bonadonna et al., 2021a).
Studying the lava fountain events of Mt Etna in 2021 provides valuable insights for future planning during similar events. By examining the past eruptions, we can predict tephra deposits, providing useful information for decision-makers to develop better clean-up strategies. Indeed, for future eruptions, it is important to consider creating a model that uses real-time data to improve predictions and clean-up plans. Overall, this research can help crisis management and enhance safety in volcanic regions. Additionally, recent regional legislation (DA no. 8/Gab. 22/04/2024, https://www.regione.sicilia.it, last access: 20 March 2025) permits the use of the volcanic tephra for building applications; in this new framework, this study represents an initial effort to estimate the volume of tephra that may be reused rather than disposed of, transforming a potential problem into a resource.
The work is organized as follows. Section 2 provides a brief description of Mt Etna's lava fountain activity. Section 3 presents ground- and satellite-based sensor data, along with the main eruption source parameters (ESPs) retrieved from them, and the methodology employed to analyse the model results. Section 4 validates the results against previously published data for a specific event (28 February 2021). Section 5 discusses the modelling outputs and provides conclusive remarks.
Mt Etna, one of the most active volcanoes in the world, is a stratovolcano on the east coast of Sicily, Italy. It rises to more than 3300 m in altitude and has four main summit craters: North-East Crater (NEC), Voragine (VOR), Bocca Nuova (BN), and South-East Crater (SEC). Between February and October 2021, approximately 60 paroxysmal episodes occurred from the SEC. Of these, 39 episodes lasted several hours and were dispersed towards the ESE (Calvari et al., 2021). Lava fountains, which are formed by a hot inner core consisting of a mix of liquid clots, pyroclasts, and magmatic gases, are often observed during paroxysmal episodes at Mt Etna and can rise several hundred metres above the volcanic vent (Wilson et al., 1995; Taddeucci et al., 2015). Moreover, during those events it is likely that an eruption column of almost 10–15 km above sea level (a.s.l.) can form above the lava fountains. Usually, lava fountains are divided into three phases (e.g. Alparone et al., 2003; Mereu et al., 2020; Calvari and Nunnari, 2022): (1) resumption phase, which commonly begins with slow initial effusion from the vent, followed by a progressive increase in explosive activity; (2) paroxysmal phase, lasting from 10 to 120 min, during which there is a rapid transition from Strombolian activity to sustained lava fountains that rise up to an altitude of 2–6 km above the vent; and (3) conclusive phase, during which the eruptive episode gradually ceases.
3.1 Sensors and outputs
For the analyses in this work, we select all the Mt Etna eruptions characterized by a tephra plume dispersed towards the east-southeast flanks of the volcano. These events, listed in Table 1, have been observed using different sensors that are briefly described below:
- a.
The first is the X-band weather radar (XWR), located at the airport of Catania, 32 km SSE of Mt Etna summit craters (Fig. 1). The scanning agility in elevation and azimuth of this sensor allows it to probe the tephra cloud in any weather condition, both during the day and night (Mereu et al., 2022, 2023; Montopoli, 2016; Vulpiani et al., 2016). By applying the volcanic ash radar retrieval (VARR) methodology (e.g. Marzano et al., 2012, 2020; Mereu et al., 2015, 2020) to measure the radar reflectivity factor, we estimate (i) the top plume height HTP (km) above sea level, which is the maximum height reached by the eruption column, calculated as the maximum altitude of the radar-detected volume above the volcanic vent contaminated by the minimum detectable tephra concentration; (ii) the mass eruption rate QM (kg s−1), which is estimated by the spatiotemporal variation of tephra concentration detected above the Mt Etna summit when probing the volcanic plume; (iii) the total erupted mass TEM (kg), which is the total mass of pyroclastic material erupted during the explosive event; and (iv) the ash-fall rate Ra (kg m−2 h), which is useful to derive the tephra load, integrating this quantity over a time interval and assuming that the radar measurements closer to the ground are indicative of tephra deposited on the ground from the vertical column above a considered position (Mereu et al., 2015).
- b.
The second is the Etna Catania Visible (ECV) calibrated camera, located in Catania about 30 km from Mt Etna's summit craters (Scollo et al., 2019; Aravena et al., 2023; Fig. 1); it allows us to monitor the altitude of the dispersed plume during the daylight hours when the visibility is not compromised by the meteorological cloud cover. In this way, we can derive the time sequence of HTP.
- c.
The Spinning Enhanced Visible and InfraRed Imager (SEVIRI), which is on board the Meteosat Second Generation (MSG) satellites, is a multispectral radiometer that produces daytime brightness temperature (BT) images with 3 km resolution. By selecting the BT along the Mt Etna summit in the channel of 10.8 µm, which is more sensitive to the tephra dielectric signature, we infer HTP by looking for the altitude in which the detected BT can be found in the temperature profile as a function of altitude, which is derived from the hydro-meteorological service of Agenzia Regionale per la Protezione Ambientale (ARPA) in Emilia-Romagna (Scollo et al., 2009; Romeo et al., 2023).
- d.
The Etna Nicolosi Thermal (ENT) infrared camera is located in Nicolosi at about 15 km from the summit of Mt Etna (Fig. 1), which measures the thermal activity associated with lava fountains. It is worth highlighting that when the radar measurements were not available and the volcanic plume was not easily detectable by the satellite sensor or by the visible calibrated camera, we have identified the incandescent jet region (IJR) by analysing the ENT images, which is a proxy of the lava fountain height. As described in Mereu et al. (2020), the time sequence of maximum height of the IJR can be converted to exit velocity vex (m s−1) of pyroclastic material using the Bernoulli equation under the following approximations: (i) most of the pyroclastic material is sufficiently large to be considered as accelerated projectiles confined in this IJR and (ii) atmospheric density variations and drag effects are negligible. Assuming a trustworthy value of tephra–gas mixture density and of surface venting, we can deduce QM with the surface flow approach (SFA), described in Marzano et al. (2020) and Mereu et al. (2022). It is worth noting that HTP obtained from various sensors, such as XWR, ECV, and SEVIRI, exhibits a comparable time trend, as shown in Freret-Lorgeril et al. (2021) and Scollo et al. (2019). The complete ESP dataset for each of the Mt Etna events considered in this study is displayed in Table 1. Real-time estimation of ESPs can be challenging, especially during the initial phase, increasing the uncertainty in short-term forecasts of plume dispersal (Scollo et al., 2008a). Furthermore, we also collected qualitative information about the eruptions, such as plume height (based on VONA1 reports; Scollo et al., 2019; Corradini et al., 2018), the presence of tephra fallout, and the start and end times of Strombolian and lava fountain activities (based on bulletins and reports available on the INGV-OE website: https://www.ct.ingv.it/, last access: 20 March 2025).
Table 1Input parameters used for setting the numerical dispersion model Tephra2 and Fall3D: starting time and ending time of paroxysm (dd/mm/yy, hh:mm), duration Δt (s), top plume height HTP (m a.s.l.) and above volcano vent (a.v.v.), and total erupted mass TEM (kg).
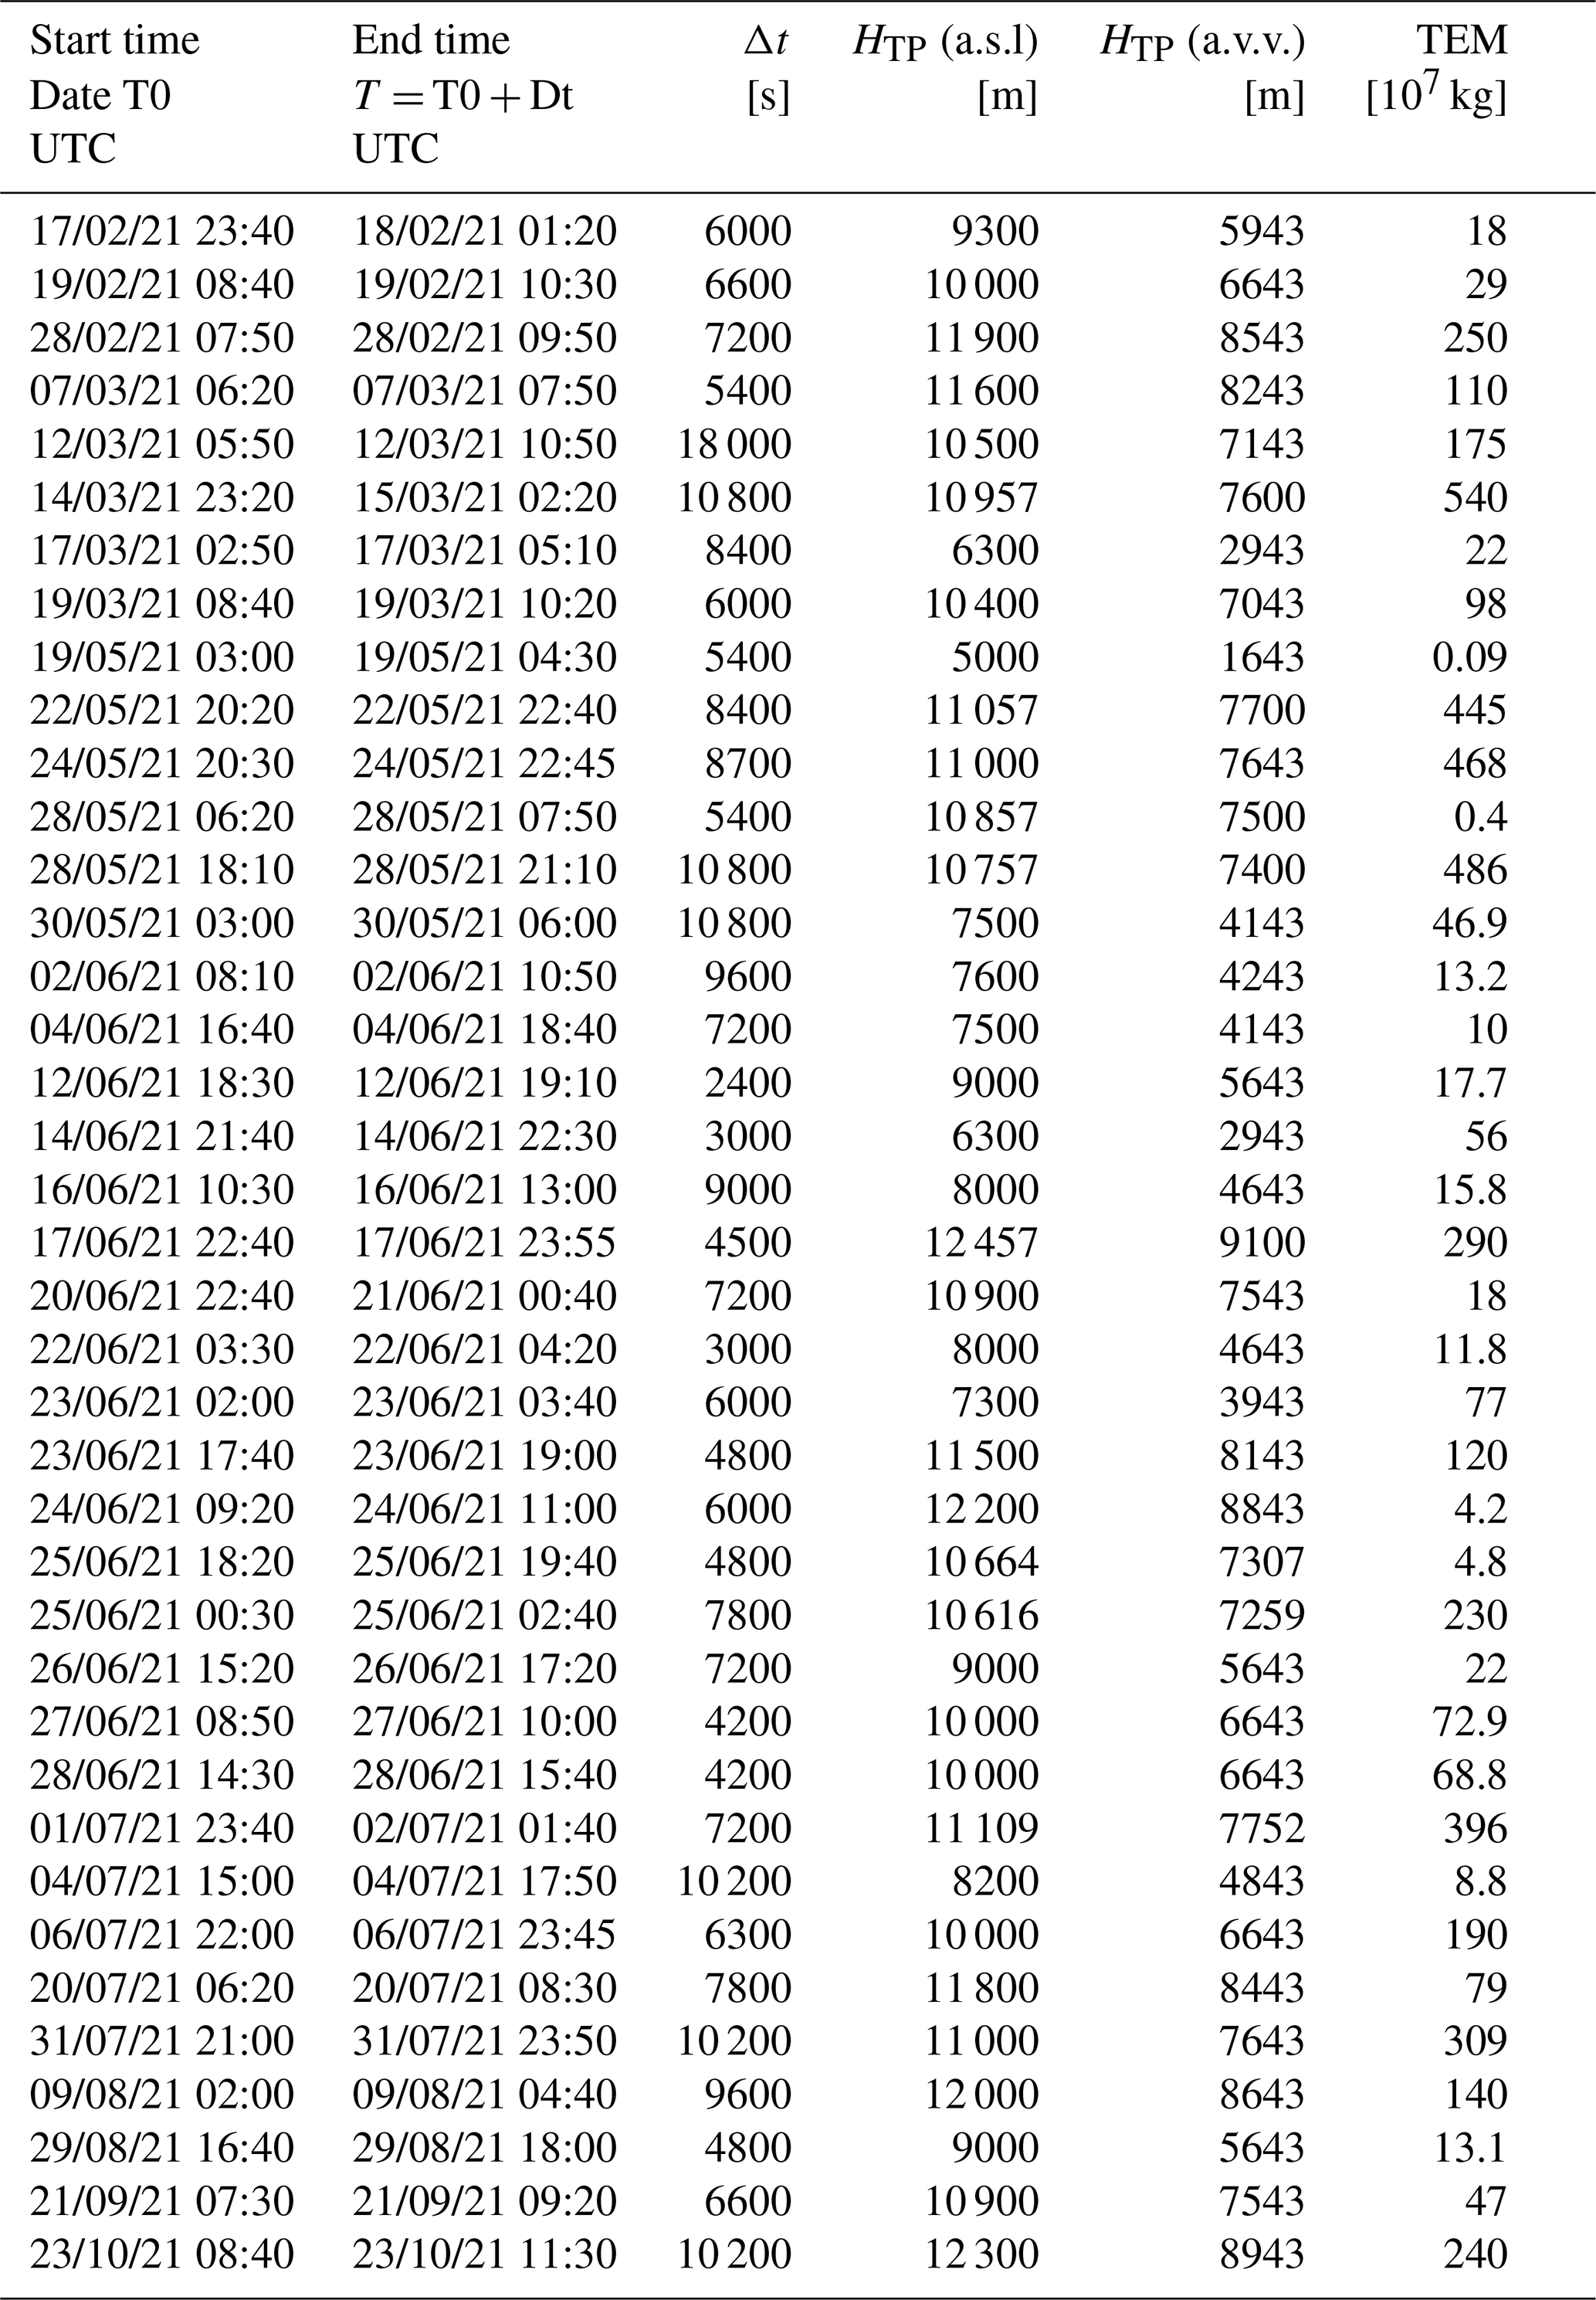
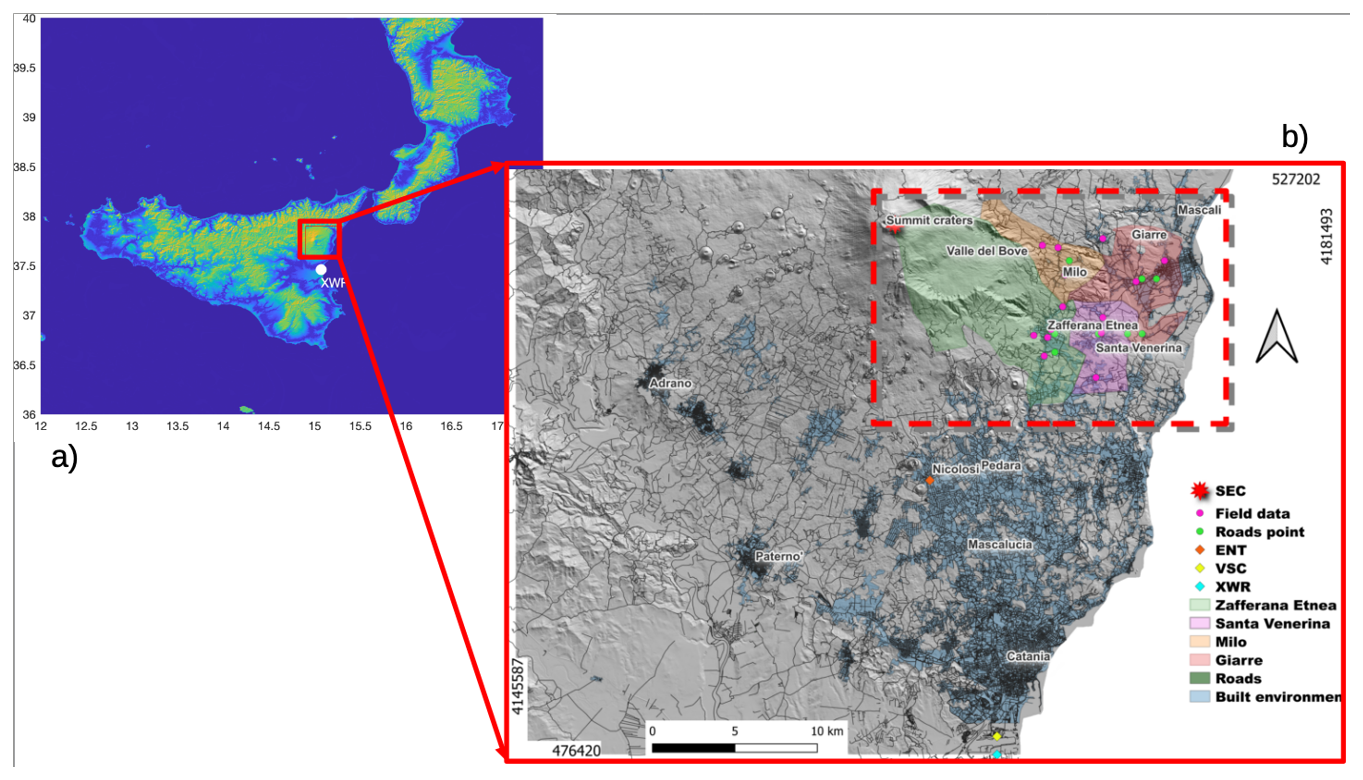
Figure 1(a) Map of southern Italy (Sicily and Calabria), with the red square showing the Mt Etna area framed in the right panel; (b) georeferenced map of road network (dark lines) of the Mt Etna volcano area (shapefiles with the road data are publicly available from the Regione Sicilia website: https://www.regione.sicilia.it/, last access: 20 March 2025). The universal transverse Mercator (UTM) coordinates (zone 33S) are shown in the lower-left part and in the upper-right part of the picture, respectively. The areas of four municipalities, of which three are under examination, and the built-up environment are highlighted with different colours, whereas the sensors, field data, and road points are identified by coloured symbols as listed in the legend on the right side: ground-based sensors employed in this work (the visible camera (VSC), the thermal infrared camera ENT, and the X-band radar XWR); the South-East Carter (SEC); 14 field data as derived by Pardini et al. (2023); and eight road points. The rectangle highlighted with the dotted red line identifies the area examined in detail in Figs. 3 and 7.
On the other hand, each sensor previously described allows us to measure some features of the lava fountains, which need further elaborations to obtain the ESPs. In this work, HTP (km) and QM (kg s−1) quantities are directly derived by processing XWR measurements. When it was not possible to determine HTP from XWR, ECV frames, or SEVIRI data, we used the ENT images to retrieve the QM estimates by applying the SFA (Marzano et al., 2020; Mereu et al., 2022). Integrating the SFA in time, we obtain TEM (kg), whereas applying the empirical relation of Mastin et al. (2009), which links QM to HTP, we get the HTP above the Mt Etna summit crater (which is located about 3357 m a.s.l.). We used the inverse Mastin equation in those cases where HTP was derived from VSC or SEVIRI imagery to obtain the QM time sequence. The starting and ending times for each Mt Etna explosive eruption can be straightforwardly inferred from (i) XWR-based QM estimates, with QM > 5×10⁵ kg s−1; (ii) temporal range, where the ENT camera identifies the lava fountain feeding the explosive phase; and (iii) time range in which a quick development of the volcanic cloud is observed by the ECV frames or SEVIRI images. Regarding the wind data for Tephra2 simulations, we consider a horizontally constant wind field computed as the mean wind velocity between the Mt Etna summit craters and the maximum value of the HTP sequence, while for Fall3D simulations we use the whole meteorological profile. These data, which are used to feed the ash dispersion models, are derived from the European Centre for Medium-Range Weather Forecasts (ECMWF) ERA5 reanalysis (https://www.ecmwf.int/en/forecasts/datasets/reanalysis-datasets/era5, last access: 20 March 2025). The grain size distribution usually refers to the volcanic particle size, indicated by the relation ϕ = −log 2(D), where D stands for sphere-equivalent mean diameter (measured in mm). The parameter ϕ refers to the whole deposit, assumed as a Gaussian distribution characterized by a maximum, minimum, mean, and standard deviation equal to −6, 10, 1, and 3, respectively. In order to consider all possible cases, in this work we vary the median ϕ value between −1 to +1 with a step of 0.5. The georeferenced location and the elevation of the SEC are considered to complete the set of input parameters used, as listed in Table 1. It is worth noting that for each event listed in Table 1 we consider the UTM coordinates (zone 33S) of the vent in easting (500024.03 m) and northing (4177699.5 m) or, equivalently, in longitude (15.000273° E) and latitude (37.746592° N). We repeat each simulation, varying the median ϕ values so that we obtain a total of 195 simulations from each numerical model.
3.2 Models
3.2.1 Modelling tephra fallout
In this study, we simulate the transport, dispersal, and deposition of tephra with two different numerical Eulerian models: the semi-analytical model Tephra2 and the full computational model Fall3D. We run both models on a grid covering the area 37–38.5° N, 14.5–16° E with a spatial resolution of ∼ 500 m. Tephra2 allows us to evaluate the ground tephra deposition by employing the advection–diffusion theory (Bonadonna et al., 2005; Bonadonna, 2006; Connor and Connor, 2006; Volentik et al., 2009; Biass et al., 2016, 2017), taking the following as inputs: HTP; TEM; ϕ; the density of lithics and juveniles (volcanic particles released from the column, which varies widely from ∼ 500 kg m−3 in highly vesicular clasts to ∼ 2700 kg m−3 in dense ones); the diffusion coefficient (K), which accounts for atmospheric processes including atmospheric diffusion and cloud gravitational spreading; the fall time threshold (FTT), an empirical threshold that defines the transition between two different laws of atmospheric diffusion; and the plume ratio (PR), a factor describing the mass distribution in the plume for a horizontally uniform wind field. In the Tephra2 model, it is assumed that a vertical eruption column forms above the vent. The column is discretized, and particles fall from every part of its height. The total tephra mass is vertically distributed within the eruption column according to a probability density function that represents the mass as a function of height. The model provides three different mass distributions: uniform, log-normal, and beta. The total grain size distribution (GSD) for the eruption is estimated by assuming a normal distribution in ϕ units (Bonadonna et al., 2005).
Fall3D (v8.0; Folch et al., 2020) models both the particle concentration in the atmosphere (i.e. tephra cloud evolution) and the particle loading at ground level, based on a 3D time-dependent Eulerian scheme (Costa et al., 2006; Folch et al., 2009, 2012). The model solves the advection–diffusion–sedimentation (ADS) equation over a topographical 3D domain, with several modelling options, including particle aggregation and source terms, among others. The meteorological data used in the simulations are obtained by interpolating the outputs of a meteorological model into the simulation domain. The simulations conducted for this work were performed with no aggregation, using the one-dimensional buoyant plume theory (Folch et al., 2016) as a model for the source term. The meteorological data were retrieved from the ECMWF ERA5 Reanalysis database (Hersbach et al., 2023). This methodology has the potential to track the evolution of particle concentration during an eruption, but the main limitation is the computational cost (Costa et al., 2006). Fall3D uses the same ESP inputs listed in Table 1, but instead of TEM it considers QM. Figure 2 shows the simulated tephra load (kg m−2) maps for two of the largest-TEM eruptions (108 and 109 kg), assuming ϕ = 0.5. Generally, we note a greater spreading of tephra deposition to the ground in Tephra2 simulations with respect to Fall3D. Both numerical models generate output files in netCDF format (e.g. https://www.unidata.ucar.edu/software/netcdf/, last access: 20 March 2025), containing georeferenced data on tephra load (kg m−2) on the ground in UTM coordinates (zone 33S for Mt Etna), with a grid spacing of 500 m. The limitations of both models, as a function of variation of input parameters listed in Table 1, as well as considerations of topography, column mass distribution models, bulk particle shape, and particle terminal fall velocity, are described in detail in Scollo et al. (2008b).
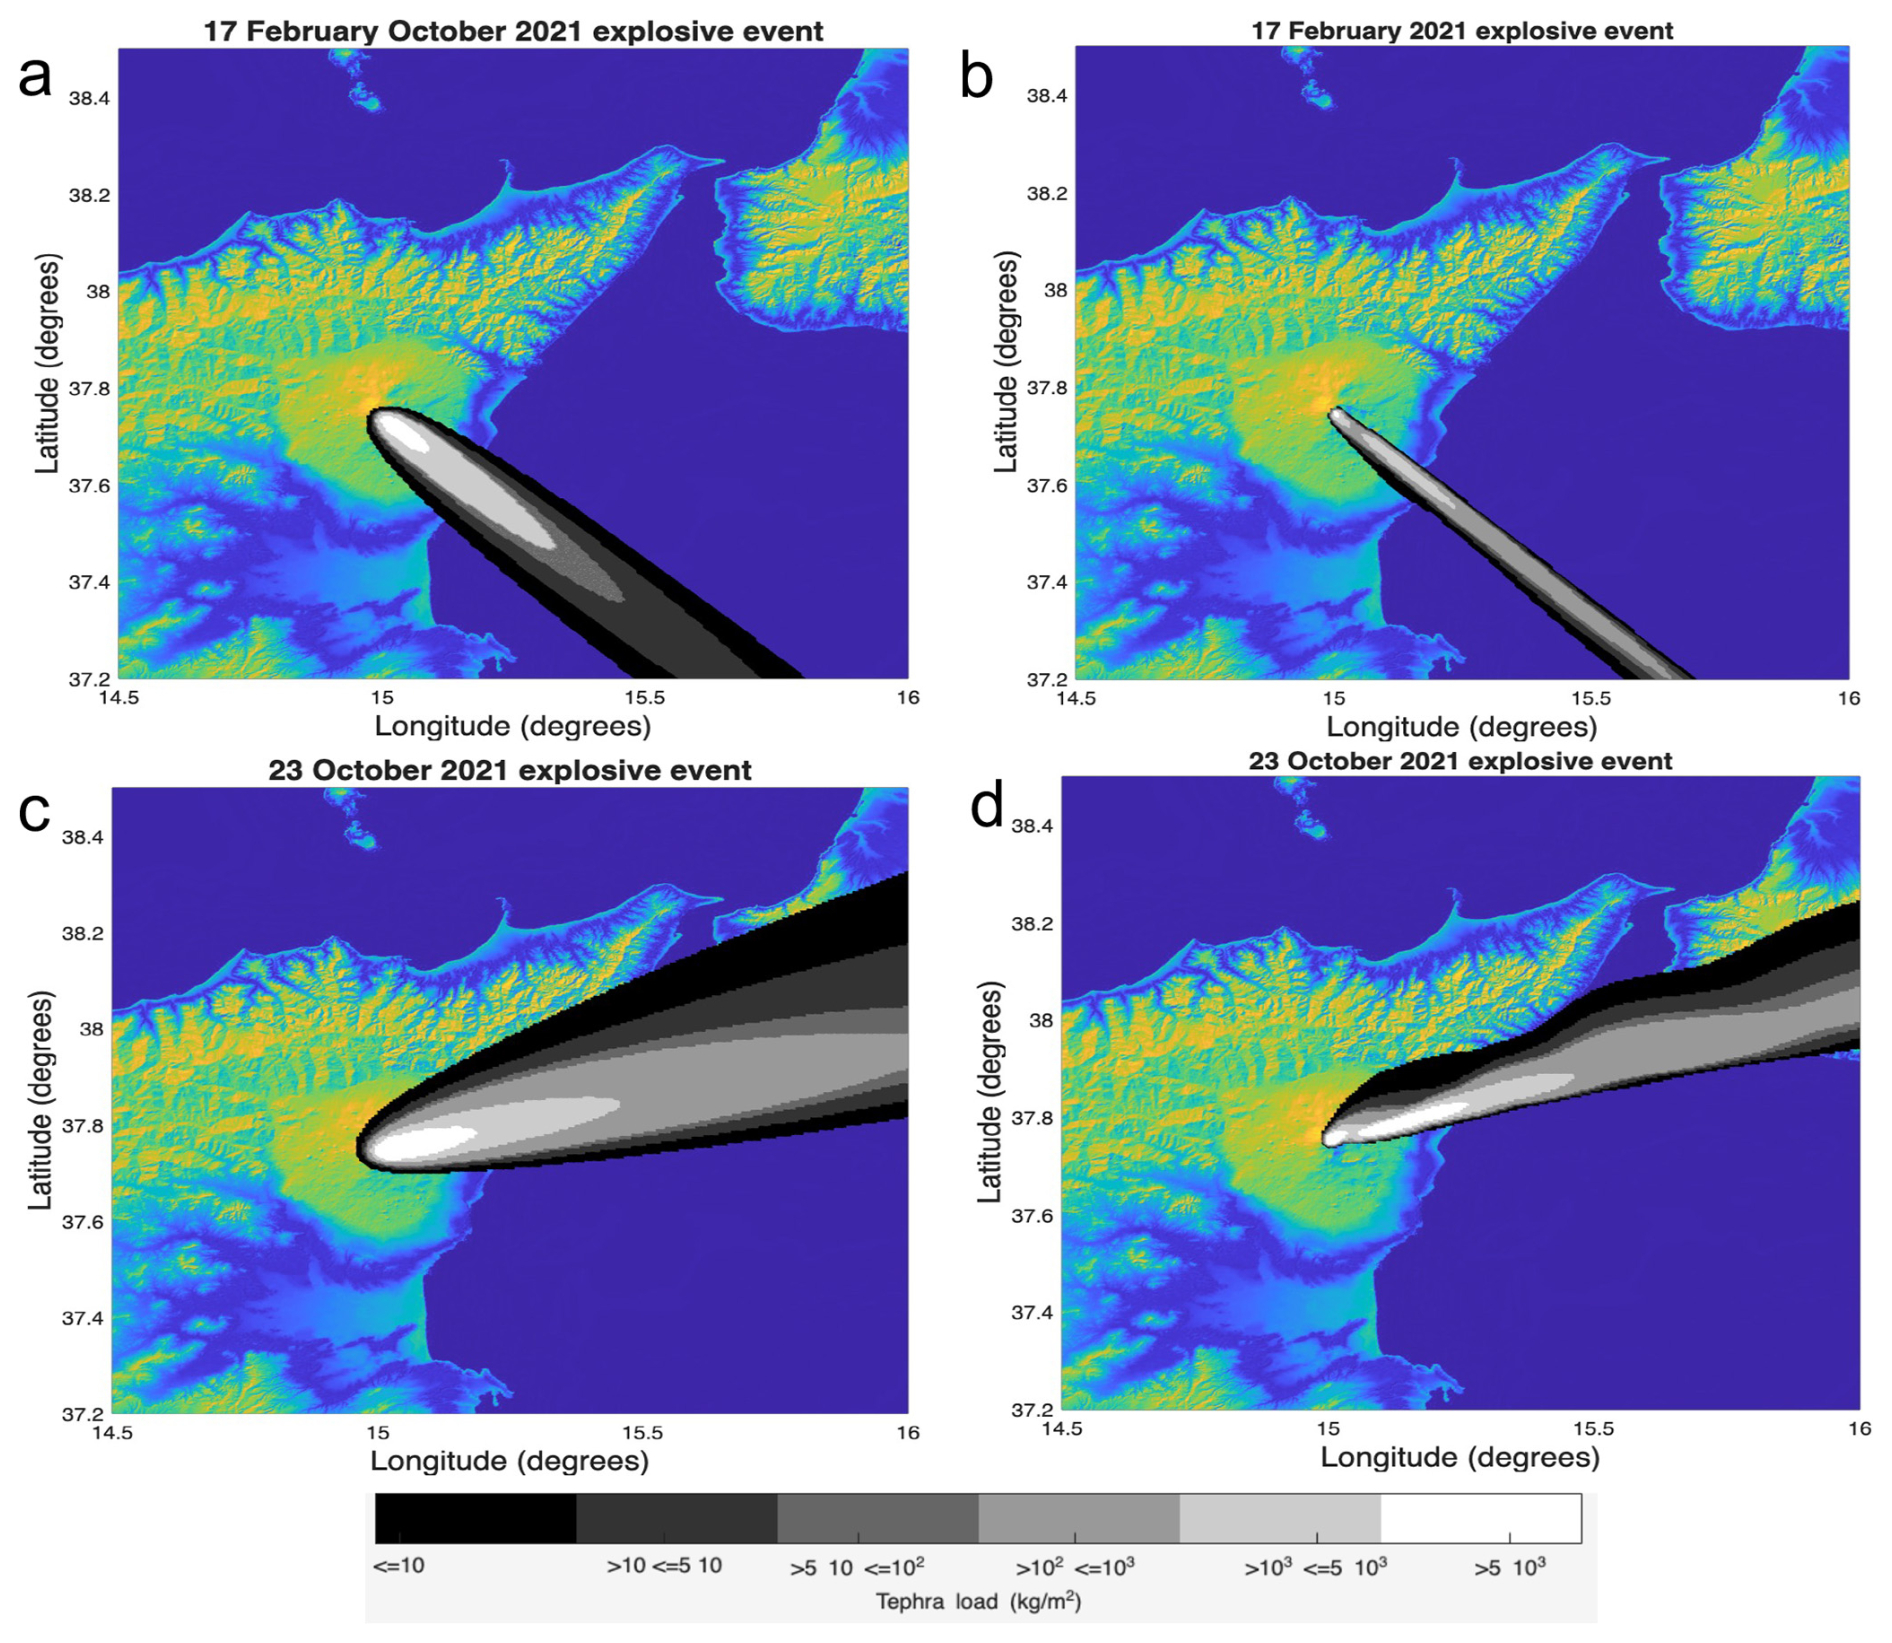
Figure 2Maps of tephra load (kg m−2) for the Mt Etna lava fountain event of 17 February 2021 (a–b) and of 23 October 2021 (c–d), using the Tephra2 (a–c) and Fall3D (b–d) models. Tephra deposition is plotted as uniform isomass contour lines in greyscale, ranging from black for values lower than 10 kg m−2 to white for values greater than 5×10³ kg m−2. The colour scale is the same in all panels. This is a Global Self-consistent Hierarchical High-resolution Geography (GSHHG) map from MATLAB.
3.2.2 Calculating the tephra load and mass on the road network
Since our main interest in this work is to calculate the tephra load in the road network, we increase the grid spacing of the tephra load data to 5 m using linear interpolation. Afterwards, we use the Quantum Geographical Information System (QGIS) tool to determine the intersection between the downscaled tephra load data and the areas covered by the road network. While the tracks of the road network in the study area are publicly available (geospatial vector data in shapefile format, as shown in Fig. 1, from the Regione Sicilia website; https://www.regione.sicilia.it/, last access: 20 March 2025), an accurate estimate of the area of roads is not yet available. In order to estimate the area of the roads, we selected several roads in the study area and measured their width using both QGIS, integrating an OpenStreetMap layer (https://wiki.openstreetmap.org/wiki/QGIS, last access: 20 March 2025), and satellite images from Google Earth (https://earth.google.com/web/, last access: 20 March 2025), obtaining an average width of approximately 6 m. Assuming that the roads are generally composed of two carriageways, this value is in agreement with the prescribed widths for urban and extra-urban roads according to the Italian law on roads (Art. 2 del Testo Unico, which ranges from 2.8 and 4 m per carriageway). To consider an uncertainty in this gross measurement, we set the road width to 6 ± 0.5 m. The case study is focused on the road networks located within the municipal area of Milo, Santa Venerina, and Zafferana Etnea towns. For a given road segment, we calculate the corresponding road area (m2) and then using the tephra load (kg m−2) we calculate the total mass (kg) deposited on each road segment. Figure 3 (which covers the area in the rectangle shown with a dotted red line in Fig. 1) shows the simulated tephra load (kg m−2) on the georeferenced road network within the Milo (light orange area), Santa Venerina (light pink area), and Zafferana Etnea (light green area) municipalities for the event on 28 February 2021.
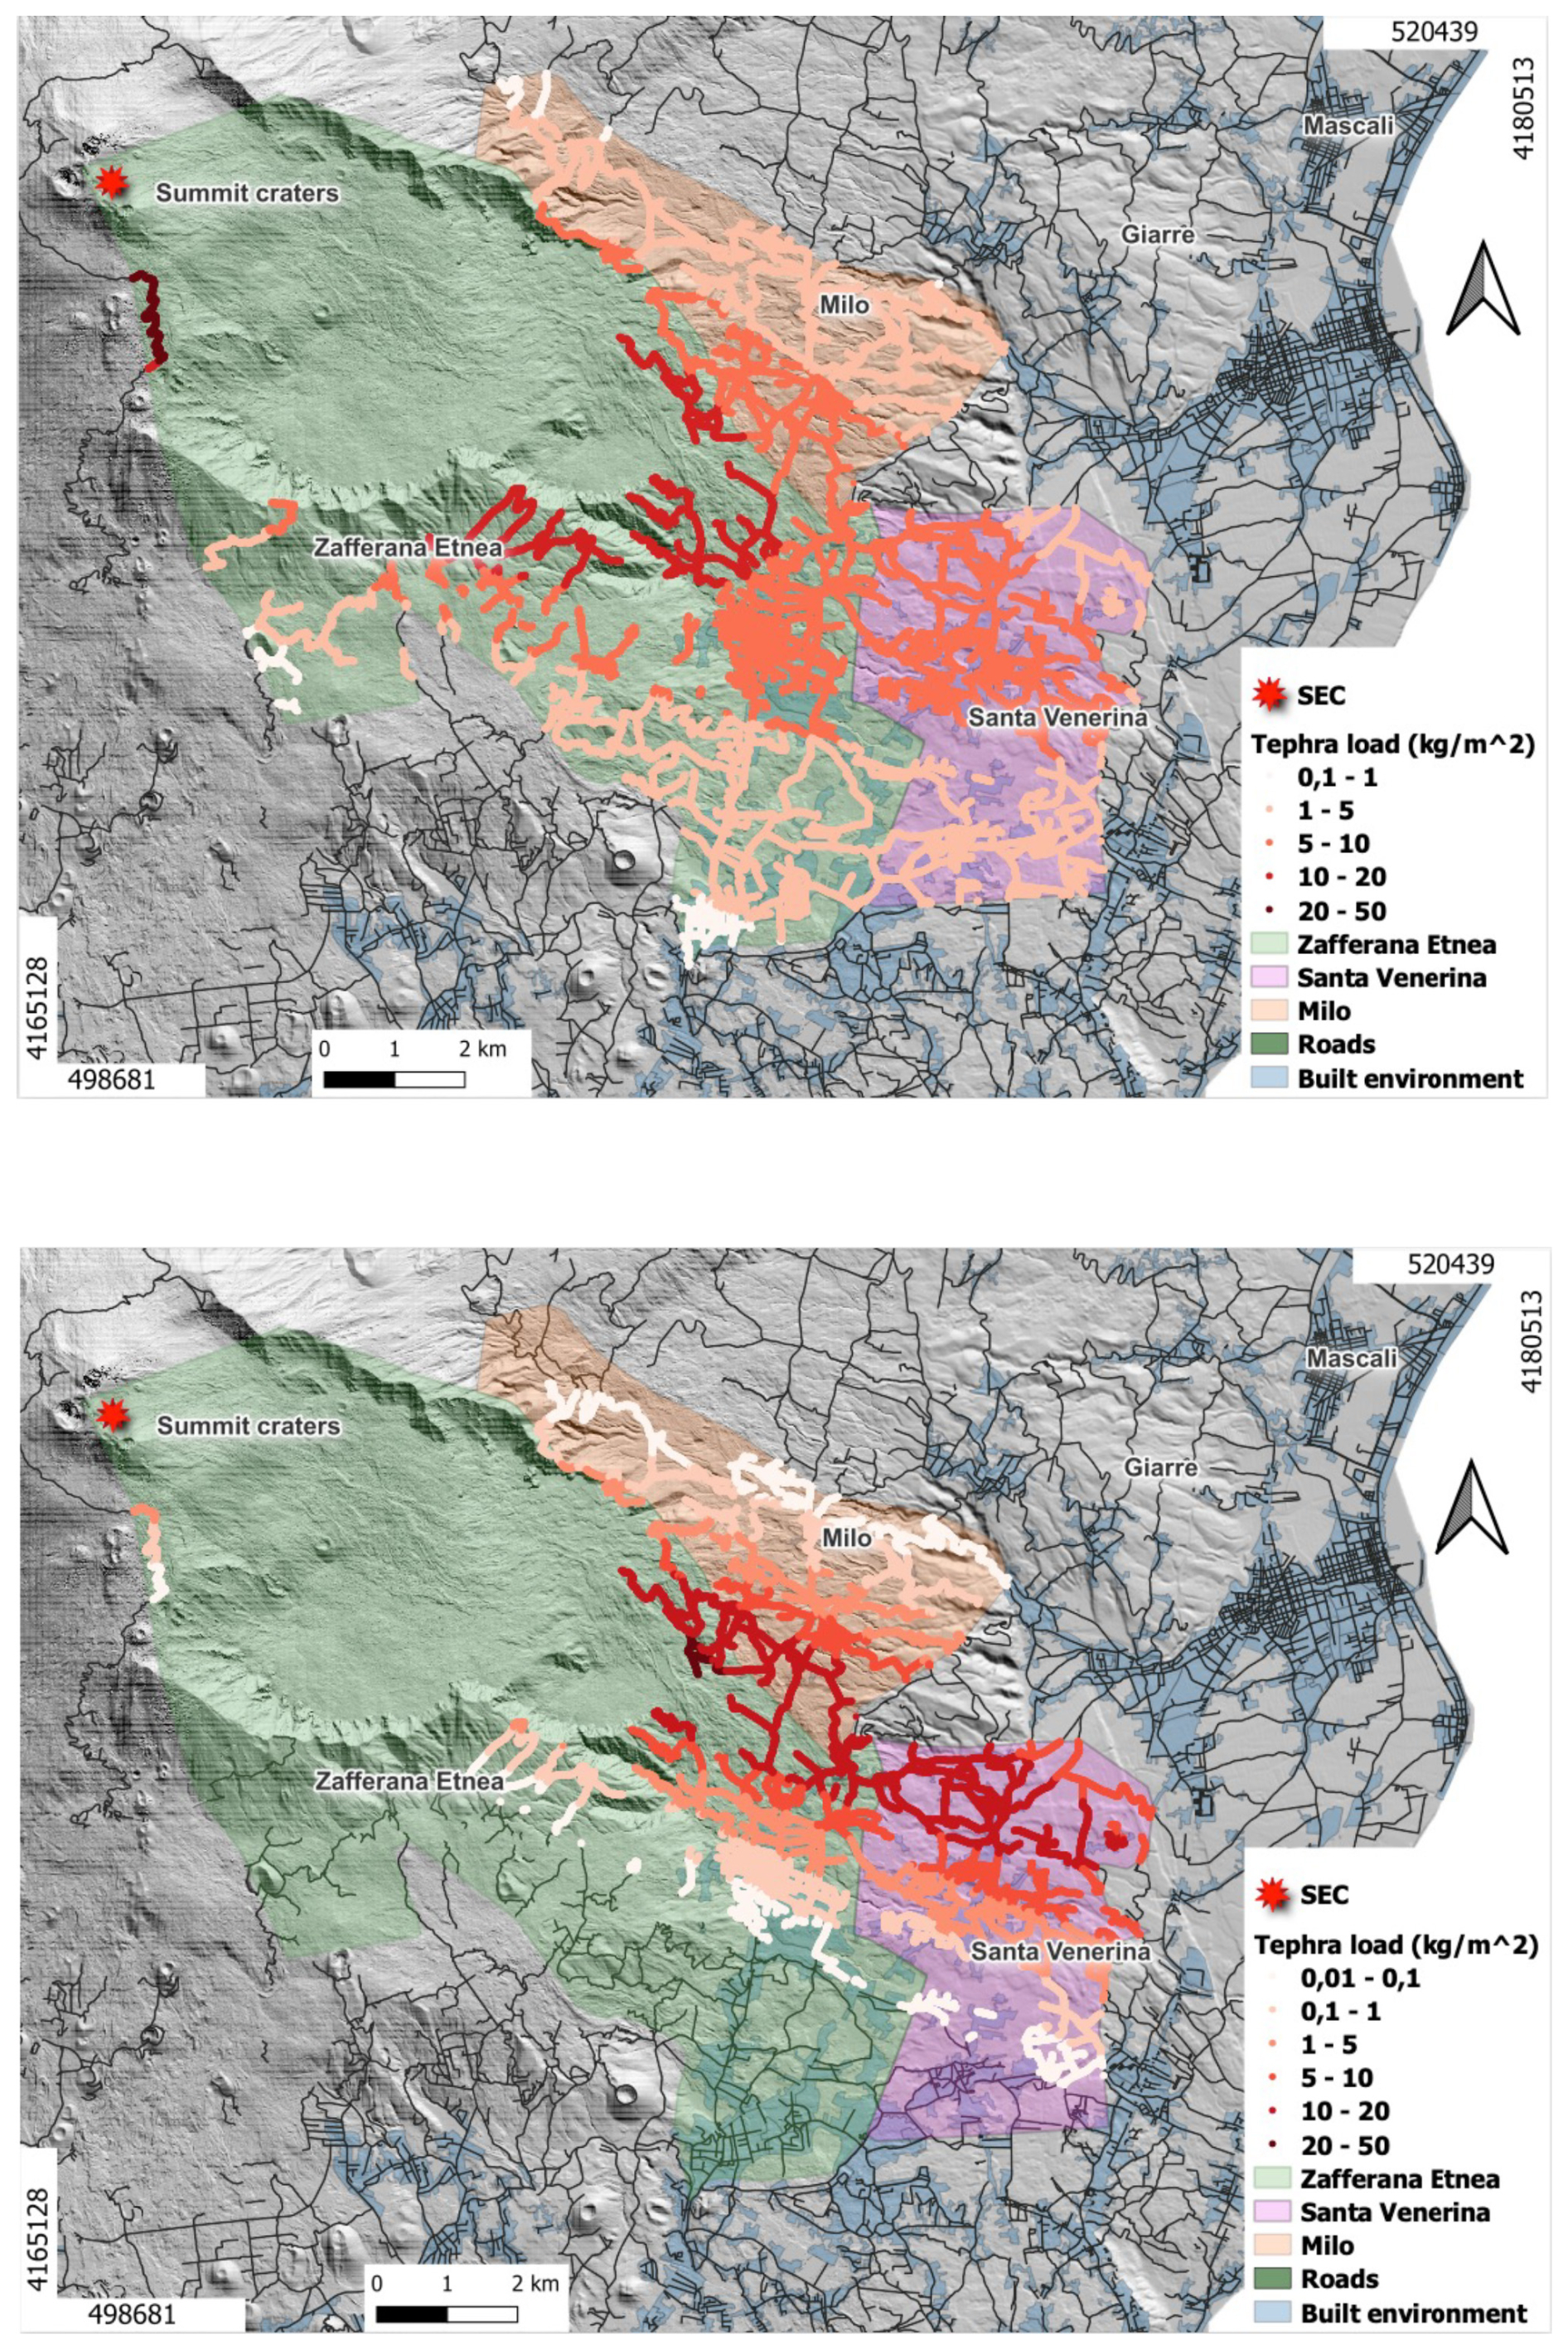
Figure 3Tephra load (kg m−2) on the road network of Milo, Santa Venerina, and Zafferana Etnea municipalities computed for the Mt Etna explosive event on 28 February 2021, assuming ϕ = 0.5 and using both Tephra2 (a) and Fall3D (b) models. The tephra deposits on the road graph are shown in a red scale for selected threshold levels of the tephra load values (as shown in the legend); georeferenced map of the road network (dark lines) of the Mt Etna volcano area (shapefiles with the road data is publicly available from the Regione Sicilia website: https://www.regione.sicilia.it/, last access: 20 March 2025).
4.1 Validation: case study on 28 February 2021
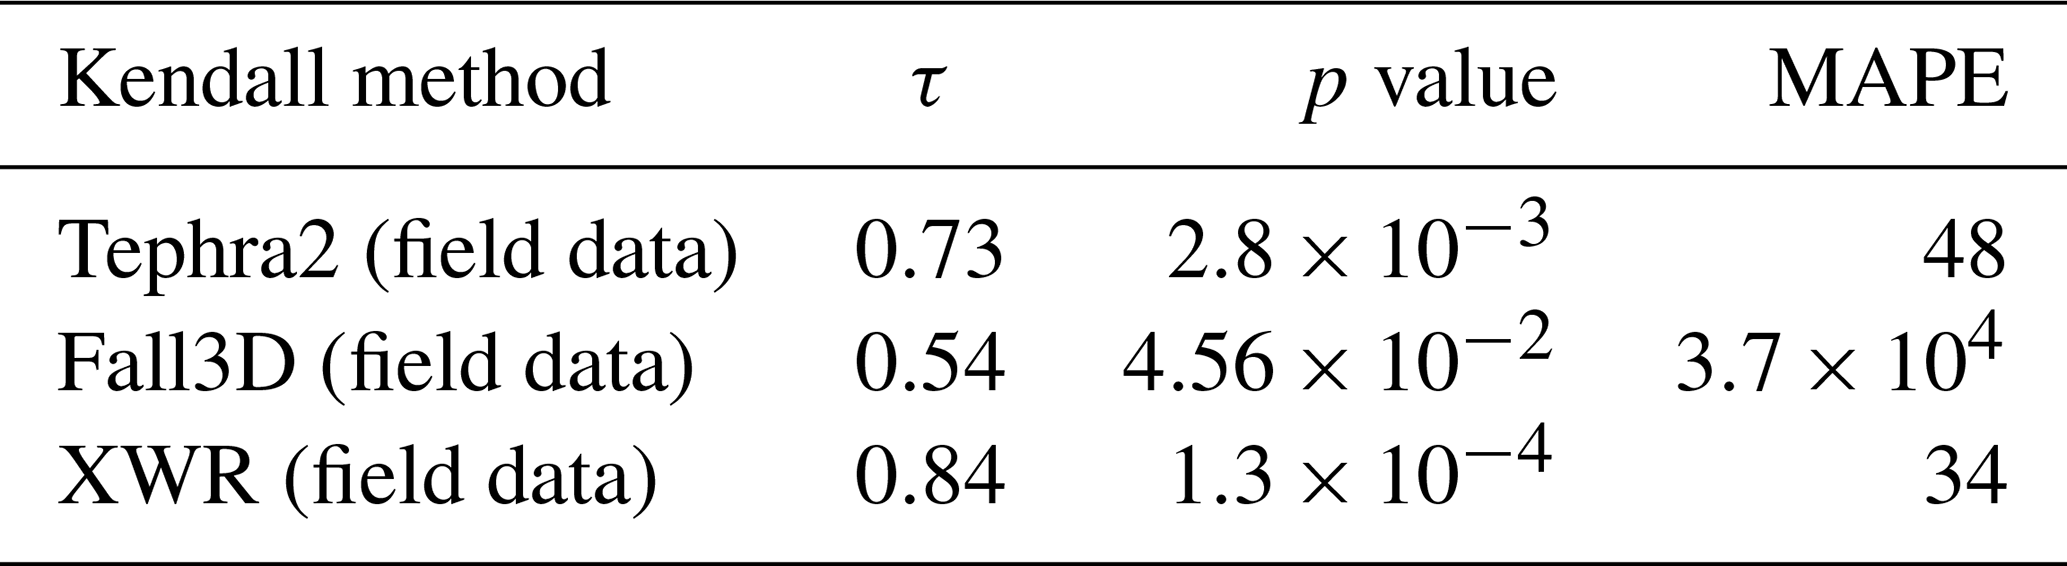
To verify the results obtained in this study, we focus our attention on the case study of the event on 28 February 2021, which has been observed by the XWR and analysed by Pardini et al. (2023). Table 2 shows the coordinates (latitude, longitude) of 14 points in which field measurements of tephra load are available (from literature, e.g. Pardini et al., 2023) in the selected municipalities (see Fig. 1) as well as the results of tephra load derived from the Tephra2 and Fall3D models, fixing the parameter ϕ to 0.5. The XWR retrievals are obtained considering the tephra load rate (kg m−2 s) related to the first four elevations, which is equal to a few km of altitude with respect to the ground, and integrating it for the whole time sampling of the radar. In this way we can retrieve the tephra load (kg m−2) related to the whole lava fountain. The correlation between the ground field data (Pardini et al., 2023) and the estimated values using Tephra2, Fall3D, and XWR are plotted, respectively, in Fig. 4a, b, and c. We observe that taking as reference the observed values reported by Pardini et al. (2023), Tephra2 tends to overestimate while Fall3D tends to underestimate the tephra load values. This is evident from most of the points dispersed above and below the bisector, as well as from the differences in the slope of the regressive curves with respect to the bisector shown in Fig. 4a and b. These discrepancies could be due to different dispersal settings used in the numerical model. In contrast, a good correlation between field data and XWR data is observed (Fig. 4c), where the points mostly distribute around the bisector, and the regressive straight line is almost parallel to it. To evaluate the degree of agreement between field data and tephra load estimates, we implemented a non-parametric test (namely Kendall's τ correlation). Table 3 summarizes Kendall's τ coefficients, the p values for testing the null hypothesis of no correlation against the alternative hypothesis of a non-zero correlation, and the mean absolute percentage error (MAPE) between predicted/estimated data and the observed field data. A Kendall's τ value closer to 1 indicates a better correlation between the field data and the model/estimate data, whereas a low p value (< 1 %) indicates a significant correlation. This test confirms that the estimates of both XWR and Tephra2 exhibit a better correlation with the field measurements, as indicated by the respective higher τ and lower p values. The MAPE calculation further supports this conclusion.
Table 2Mt Etna eruption on 28 February 2021: tephra load (kg m−2) on 14 sites, each one identified by the latitude and longitude, as deduced by Pardini et al. (2023), data computed from Tephra2 and Fall3D models (fixing ϕ = 0.5) and retrieved by XWR are also included.
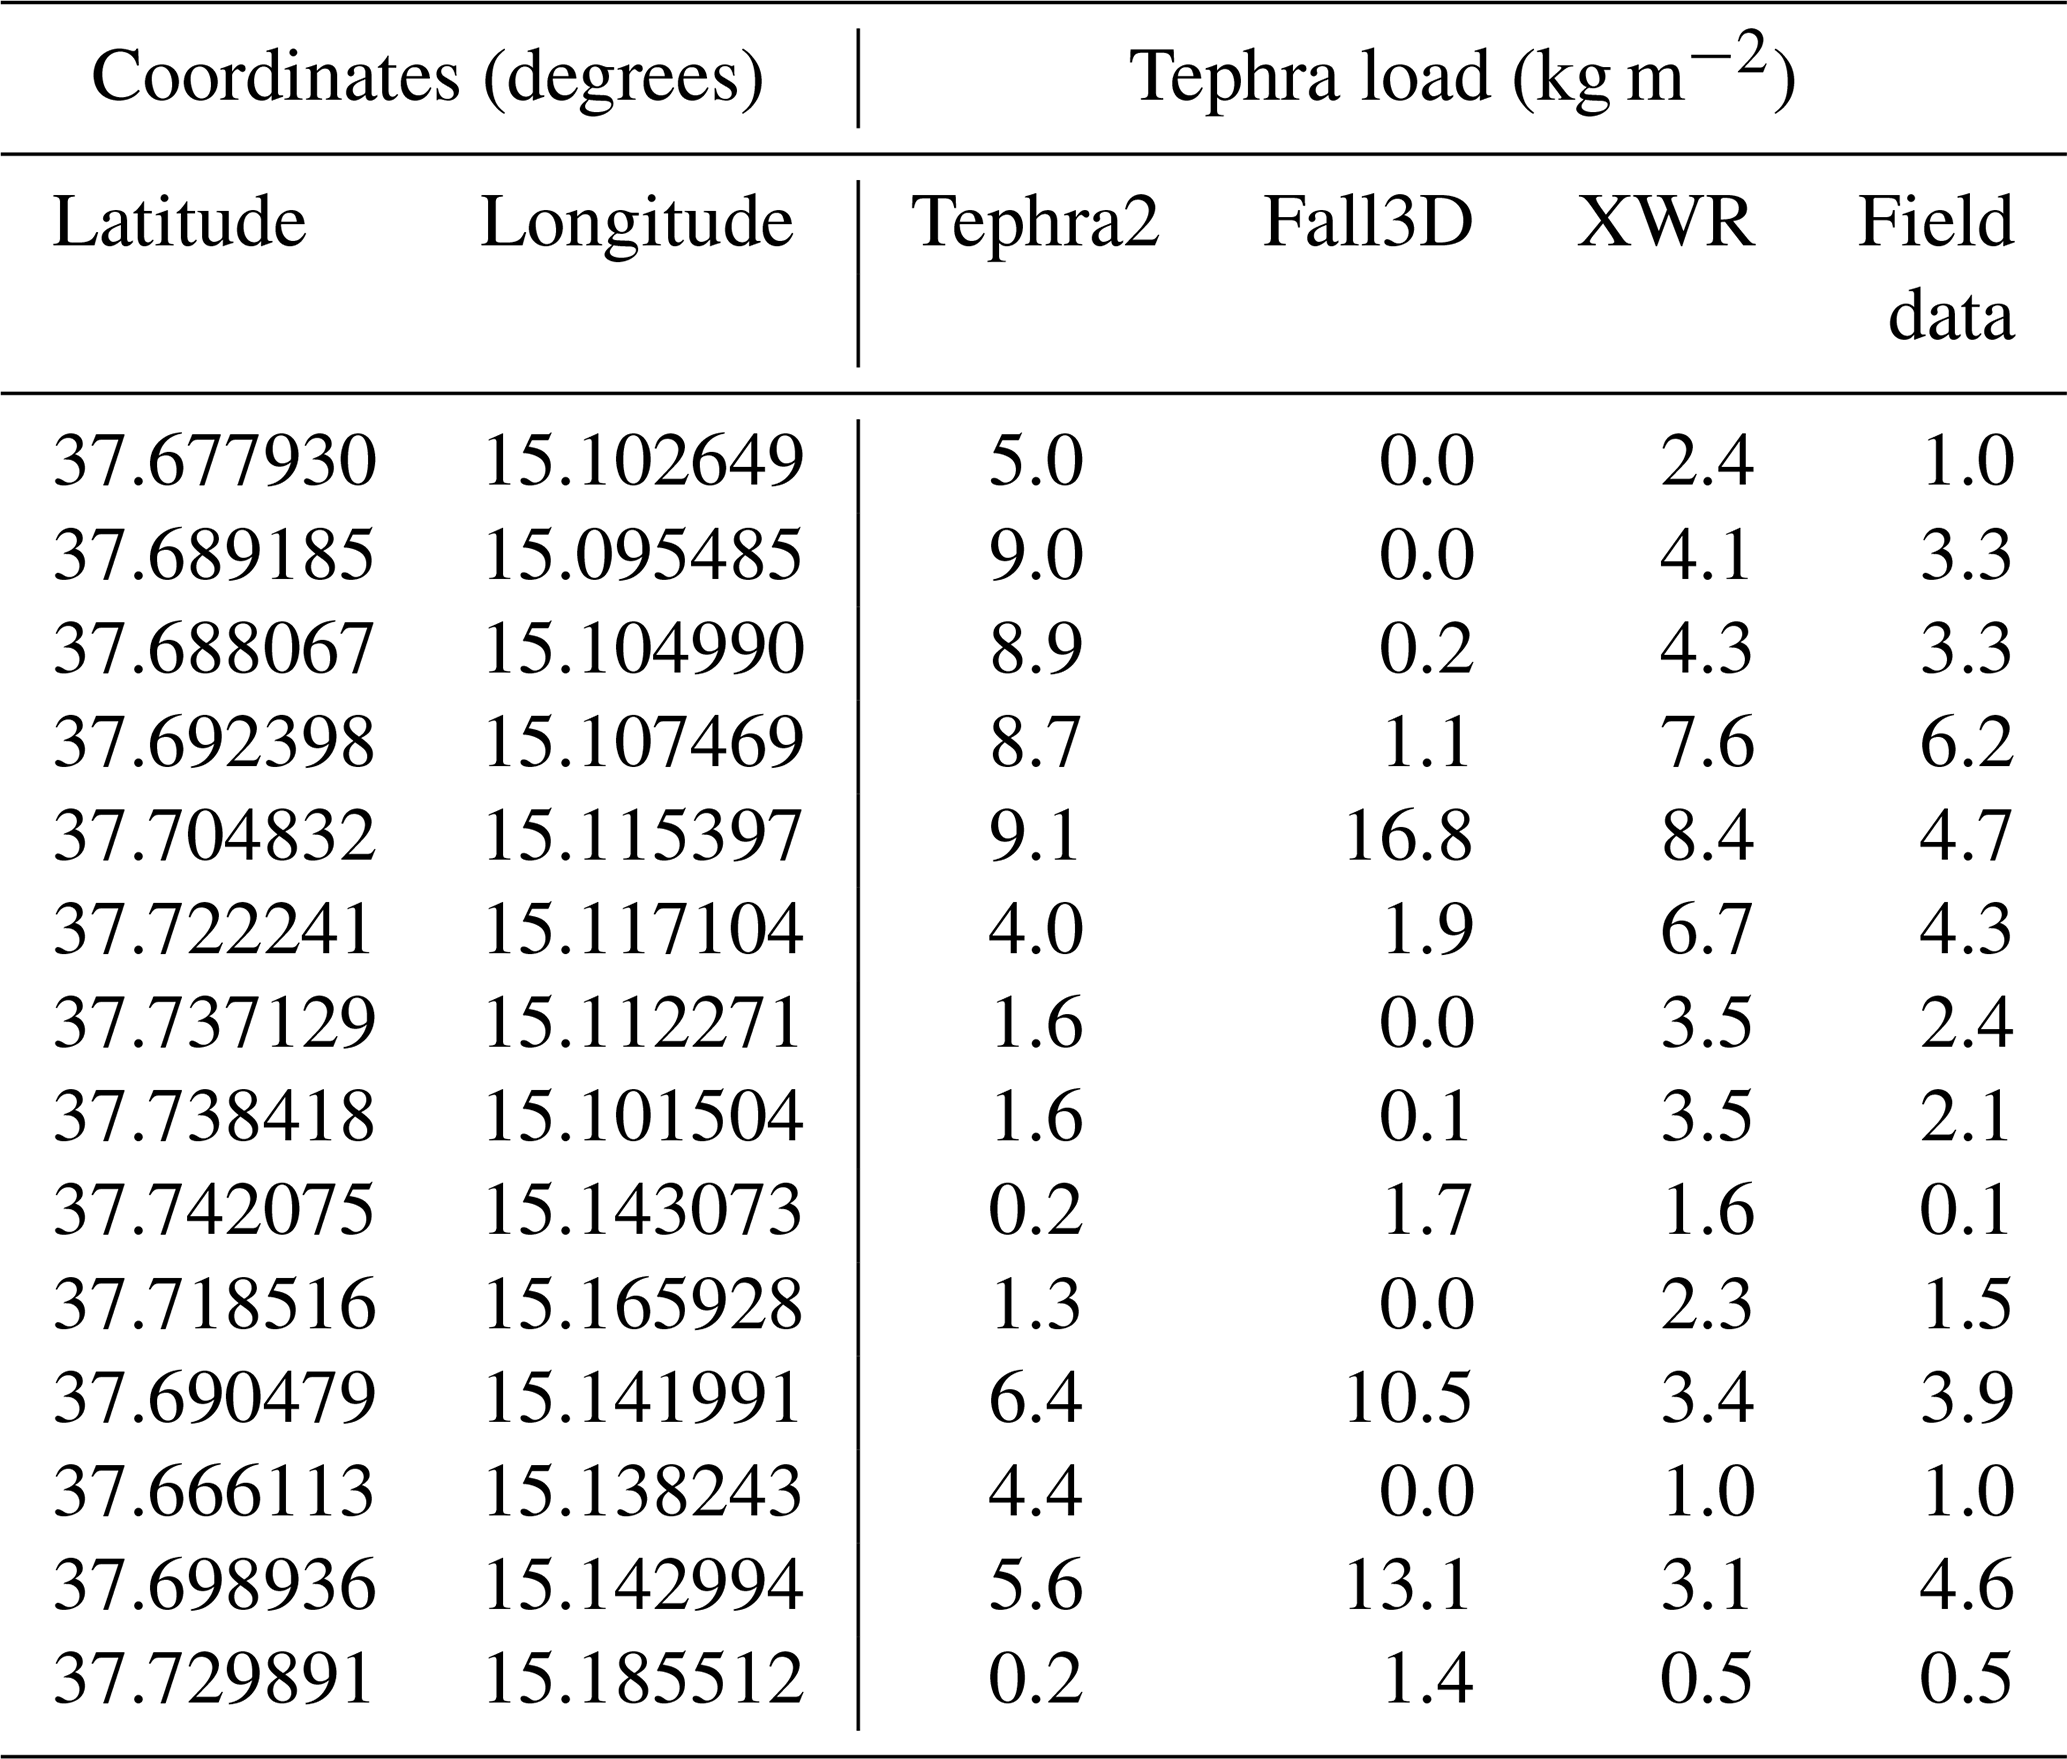
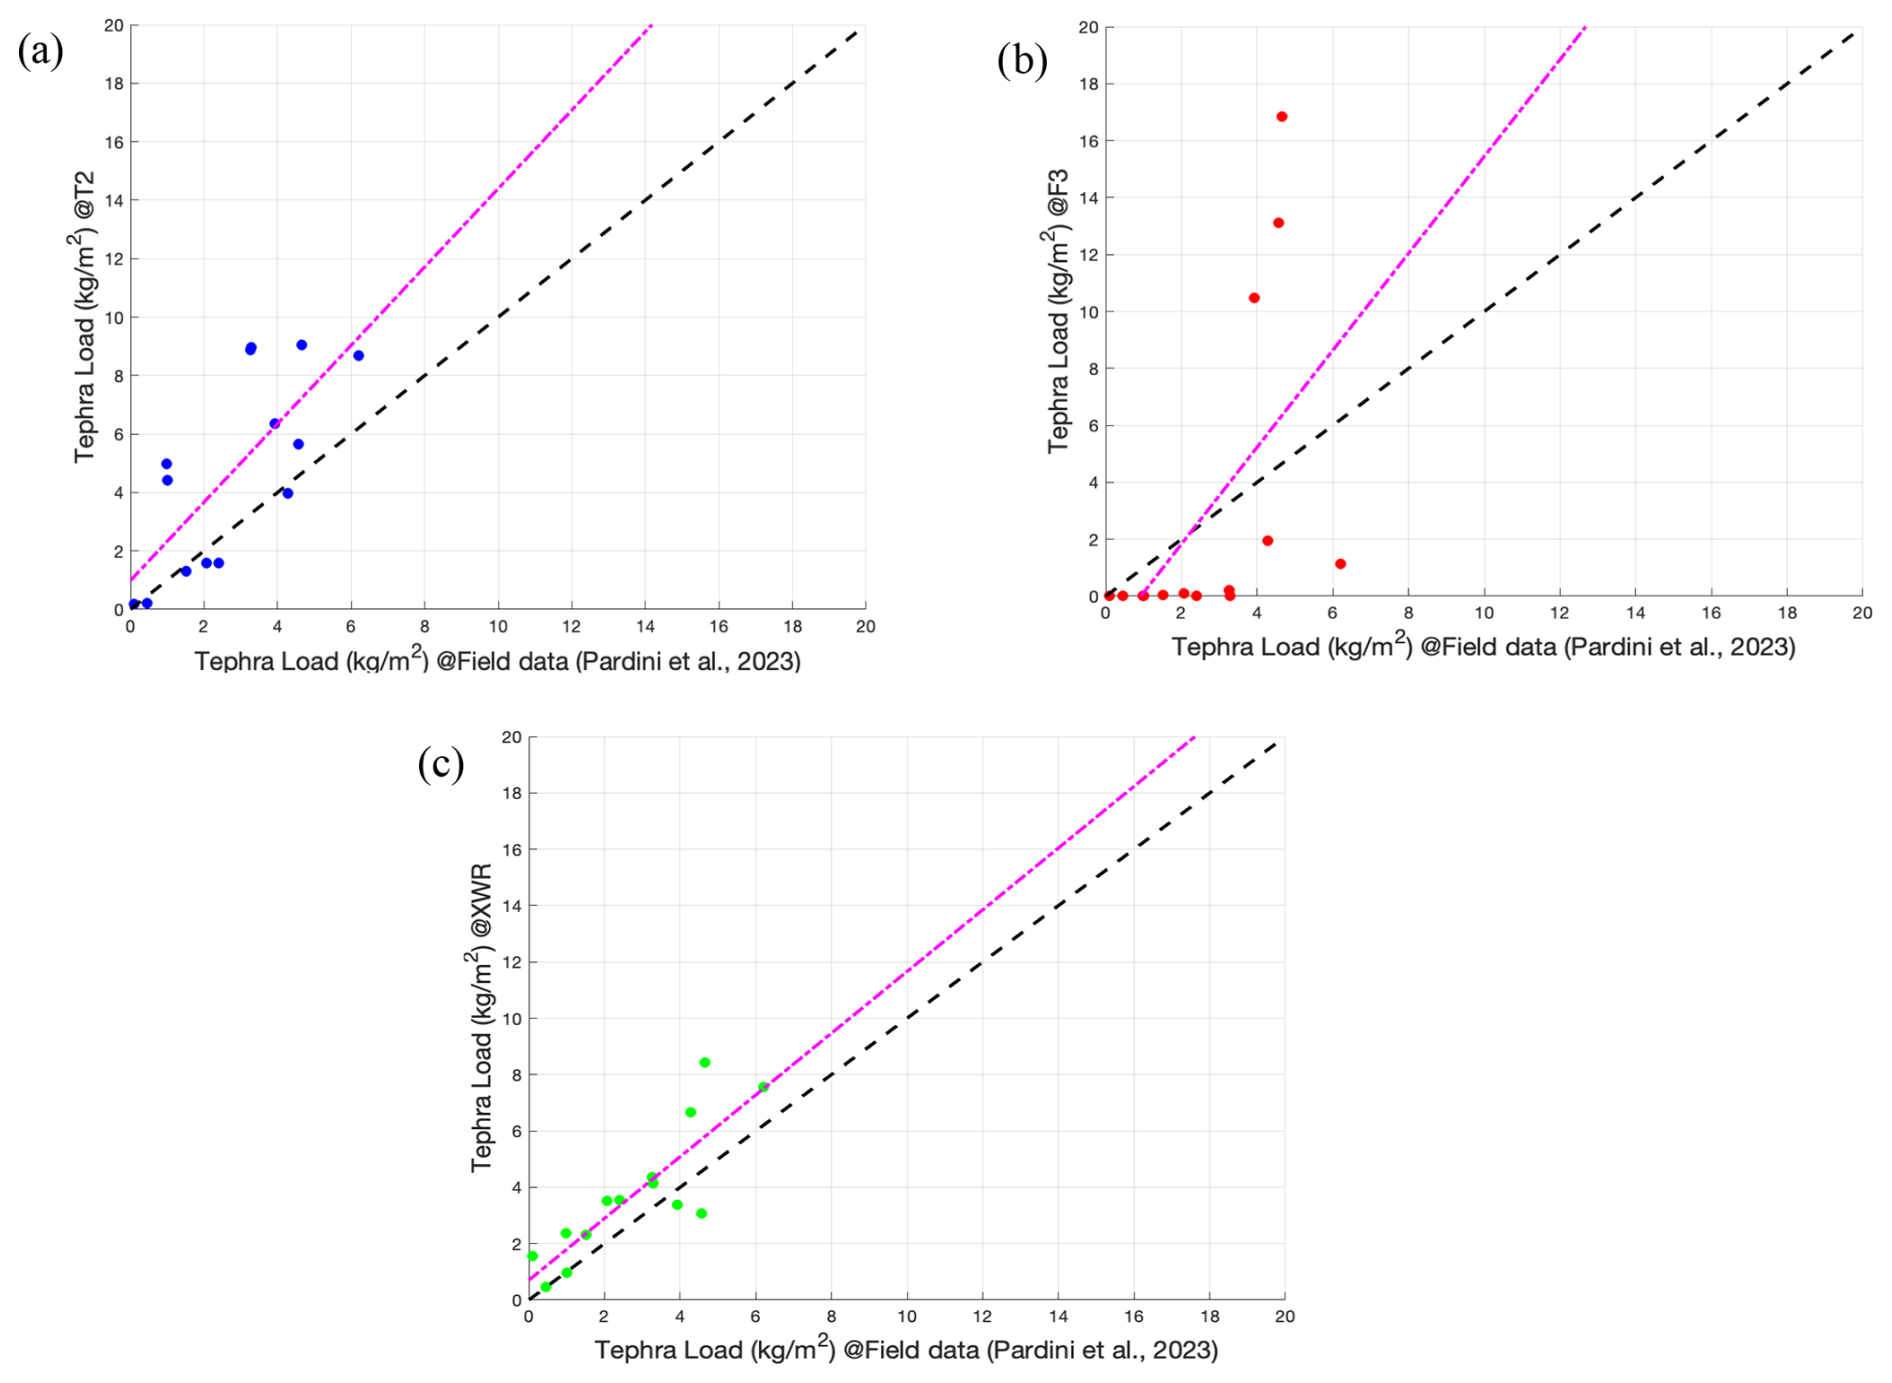
Figure 4Tephra load correlation: the coloured points represent the field data (Pardini et al., 2023) as a function of the results from Tephra2, Fall3D, and XWR results (blue, red, and green dots), as listed in Table 2 and respectively shown in panels (a), (b), and (c). The dashed dark line represents the bisector, while the magenta line represents the regressive straight line.
Table 3Kendall's τ correlation coefficient, p value, and mean absolute percentage error (MAPE) computed for the Mt Etna eruption on 28 February 2021.
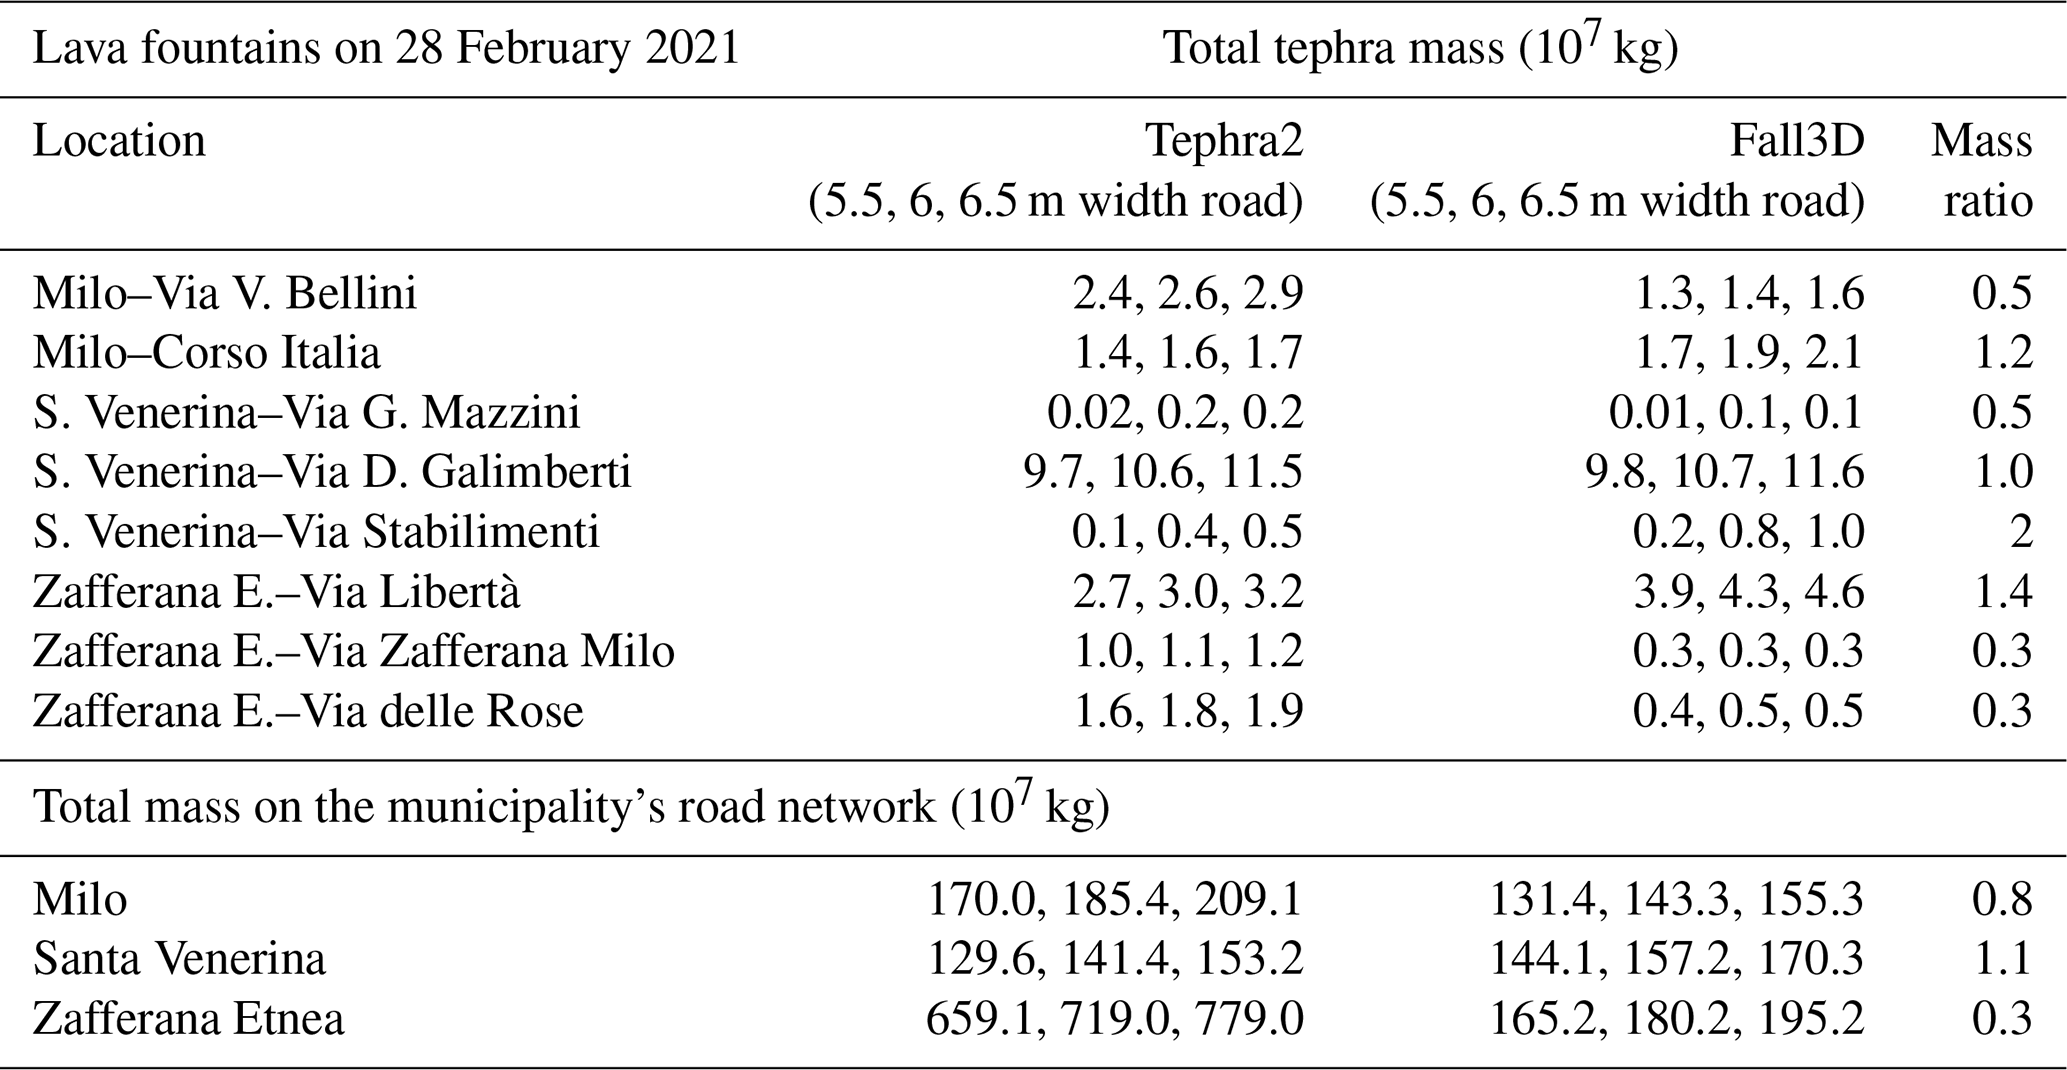
Assuming a width of 6 ± 0.5 m for each road, we convert the tephra load to tephra mass (kg) for the event of 28 February 2021, assuming ϕ = 0.5. We selected a few roads, characterized by their larger extension, for each municipality: Via Bellini and Corso Italia in Milo; Via Mazzini, Via Galimberti, and Via Stabilimenti in Santa Venerina; and Via Libertà, Via Zafferana Milo, and Via delle Rose in Zafferana Etnea. We summarize in Table 4 the total tephra mass for streets of Milo, Santa Venerina, and Zafferana Etnea as derived from the Tephra2 and Fall3D models. The total mass computed for the selected roads in Milo by Tephra2 and Fall3D shows a comparable order of magnitude (107 kg), whereas for the two selected roads in Zafferana Etnea reveal a disagreement of 1 order of magnitude. However, the values computed for all municipalities show a maximum variability between approximately 5 times the tephra deposit collected on the ground (Scollo et al., 2007). The Tephra2 outcomes are generally larger than those of Fall3D, with the ratio between Fall3D and Tephra2 ranging from 0.3 to 1.4 for the roads and from 0.3 to 1.1 for towns. The variability in road width gives rise to an uncertainty in tephra mass of approximately ±9 %. The last three rows in Table 4 show the total mass computed on the whole road network of the three municipalities, highlighting the comparable results (same order of magnitude of about 109 kg). It is worth noting that the total mass derived from Tephra2 in Zafferana Etnea municipality is four times larger than the total mass derived from Fall3D. This variability can be observed in Fig. 3. Not all roads are affected by tephra load, as shown in Fig. 3b, and this can be attributed to dissimilarity in the dispersal laws implemented in each model (Scollo et al., 2008b; Bonadonna et al., 2005; Folch et al., 2012, 2016). It is important to note that during a typical explosive event at Mt Etna only a few kilograms of tephra accumulate on a limited number of streets across the three municipalities. This aspect is closely related to the intensity of the explosive event, the amount of pyroclastic material erupted, and the wind dispersal pattern.
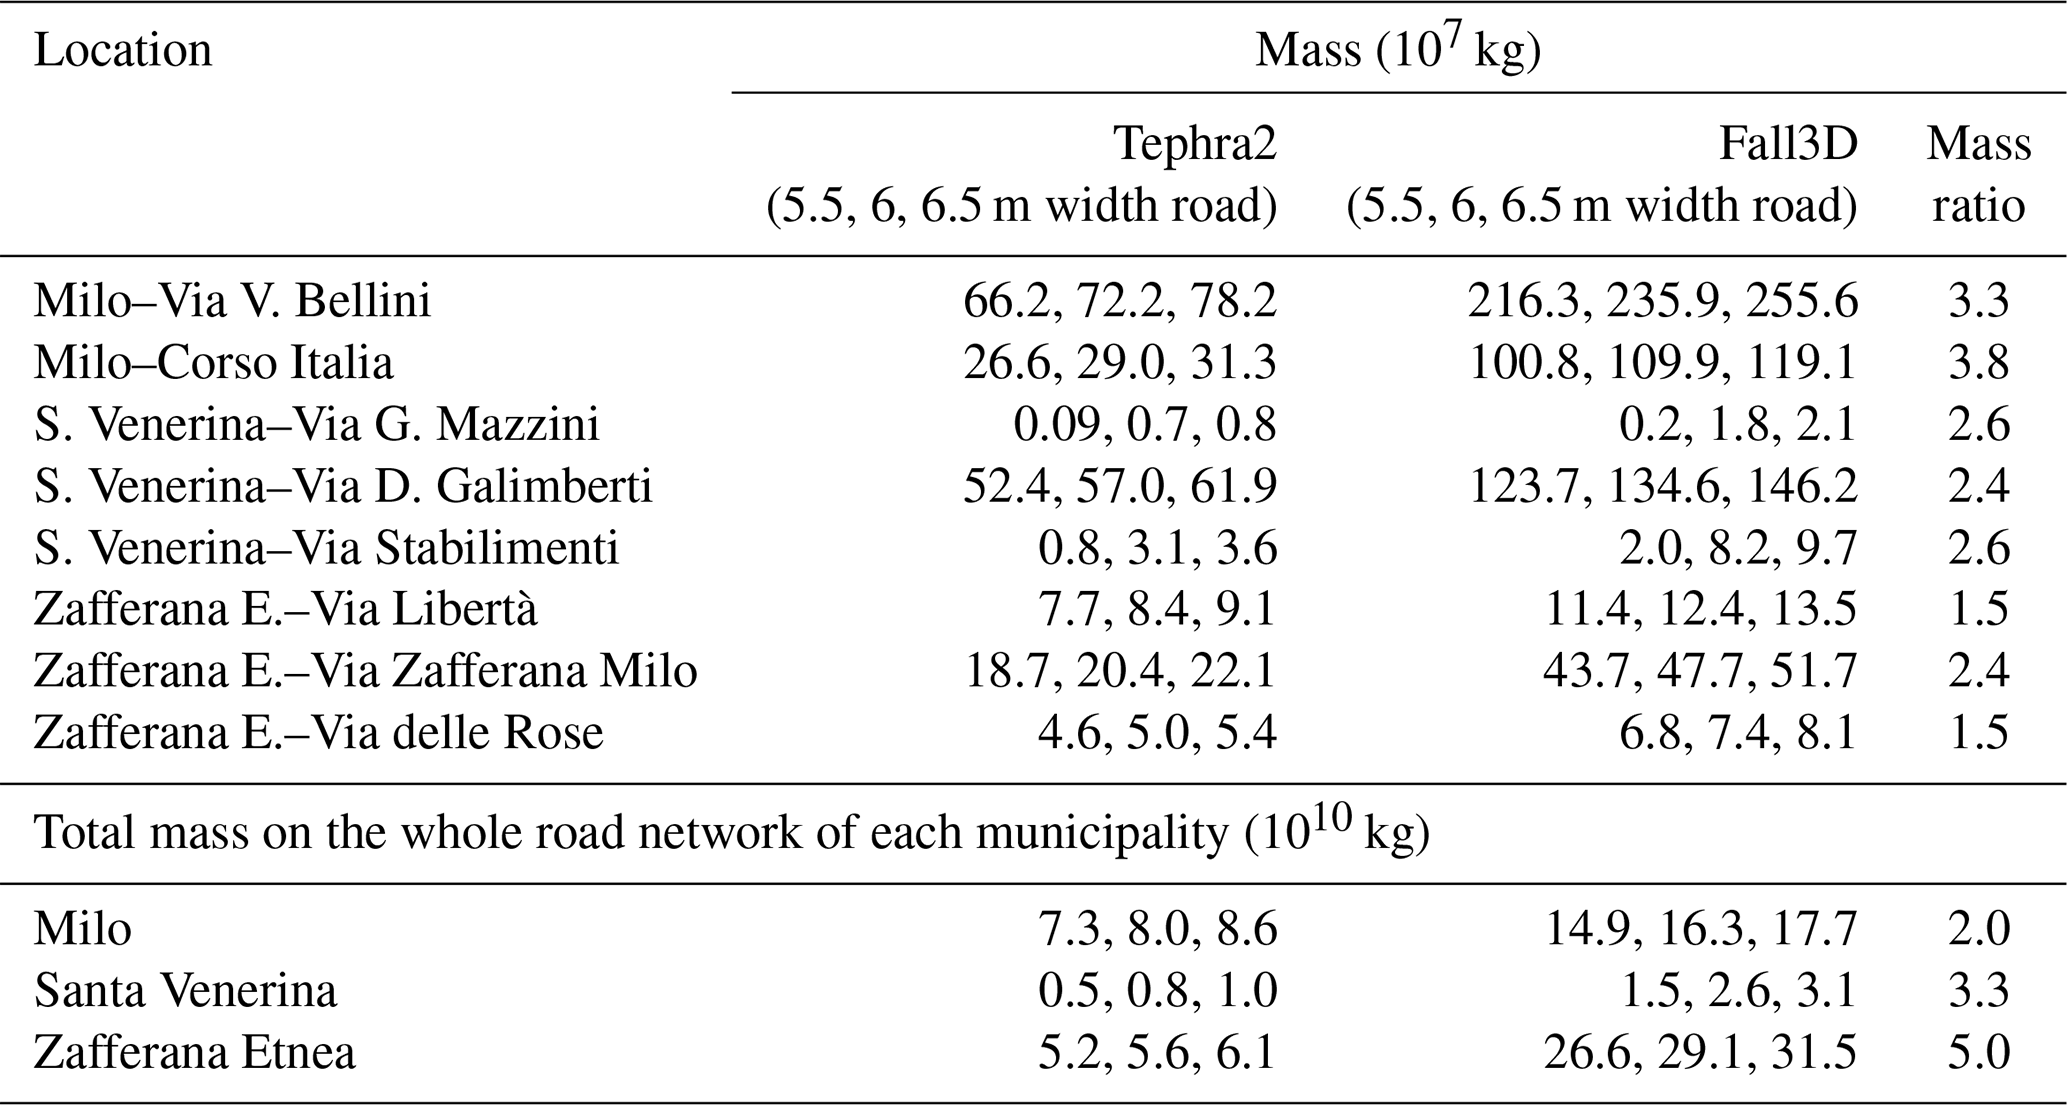
Table 4Total tephra mass (kg) computed on main roads selected for Milo, Santa Venerina, and Zafferana Etnea for the Mt Etna eruption on 28 February 2021 as derived from the results obtained using Tephra2 and Fall3D models (fixing ϕ = 0.5 and assuming a road width of 6 ± 0.5 m). The total mass on the road network of Milo, Santa Venerina, and Zafferana for three road widths (5.5, 6, and 6.5 m) is presented in the last three rows. On the right column, we include the mass ratio between Fall3D and Tephra2 results.
4.2 Tephra mass on specific road points
We investigate how the tephra load, derived from both models, can be used to assess the accumulated tephra mass on the road network for the selected municipalities, assuming a cell size of 5 × 5 m in the interpolated tephra load map. It is important to highlight that deposited tephra causes disruptions on main roads, specifically in terms of the kilometres of roadways that may face critical driving conditions. The location of the Mt Etna volcano, along with the prevailing westerly and northwesterly winds at high altitude, favours tephra fallout and dispersal primarily towards the east (31 %), southeast (35 %), and northwest (29 %), with only 6 % directed towards the south. These patterns are derived from the ERA5 reanalysis wind data during 39 eruptive events that occurred in 2021. These results are consistent with the historical statistical distribution of wind direction and velocity from the 1990–2007 period at altitudes between 5 and 10 km, as derived from meteorological forecast data (Barsotti et al., 2010; Scollo et al., 2013). The deposited tephra mass, derived from the two models, is computed by selecting eight road points (shown in Fig. 1) across different roads in the municipalities of Milo, Santa Venerina (Sven), Zafferana Etnea (Zaff), and Giarre municipalities: provincial roads (SP41, SP92, SP8, and SP59); the highway (E45); and the state road (SS114). To increase the number of road points on the southeast flank of Mt Etna, we also include road points from E45 and SP114 in the municipality of Giarre. In Fig. 5, we show the time-cumulative tephra mass for different median ϕ values at specific points in the selected roads, as computed by Tephra2 (Fig. 5a) and Fall3D (Fig. 5b). Generally, increasing the median ϕ increases the deposited tephra mass and vice versa. Obviously, this estimate depends on the collection point; if the mass deposited in the proximal area increases for a given ϕ, it decreases in the distal one, since the total mass deposited is conserved. The highest simulated tephra mass values from both models are found at SP59 in Milo, with Tephra2 recording values between 2750 and 3375 kg and Fall3D showing results between 3000 and 4250 kg at the end of the paroxysm sequence. This location is approximately 12 km from the summit of Mt Etna, making it the closest among the analysed points. In contrast, SP92 in Zafferana Etnea shows lower ash loads, with Tephra2 reporting a tephra load of about 725 to 800 kg and Fall3D indicating results between 250 and 450 kg at the end of the paroxysm sequence. While Zafferana Etnea is also near Mt Etna (12.2 km away), it is situated further south than Milo. We can evaluate these results considering the tolerance boundaries, usually considered as more or less 5 times the estimated values (Scollo et al., 2007). Indeed, the variability of tephra mass for all the road points computed with Tephra2 ranges between limit values of 750–3375 kg, whereas the variability derived from Fall3D is between 250 and 4250 kg. The time-cumulative function derived from Tephra2 presents larger steps in concomitance with events on 14 March, 22 May, 28 May, and 1 July 2021 for SP59 in Milo; E45, SP49, and SS114 in Santa Venerina; and SP8 in Zafferana Etnea, whereas E45 and SS114 in Milo show a larger step during the event on 24 May 2021. During the other events, the tephra mass is not large enough to generate major steps in the time-cumulative function. For most road points, the total accumulated tephra mass stabilizes at values between 500 and 1250 kg after the paroxysm of 20 July 2021, except for SP59 in Milo. The time-cumulative function obtained with Fall3D shows larger steps during the events on 28 May, 2 June, 27 June, and 31 July 2021 for SP59 in Milo. E45 and SS114 in Milo show a larger step on 27 June 2021, whereas SP41, E45, and SS114 in Santa Venerina exhibit a large step on 29 August 2021, as well as SP92 on 17 June 2021. In Zafferana Etnea, SP8 shows a gradual increase in the tephra mass in time alternating with long periods of stability. The time-cumulative tephra masses for SP41, E45, and SS114 in Santa Venerina and SS114 in Milo stabilize between 1325 and 2075 kg, starting from the beginning of August. Also, in the case of Fall3D, SP59 in Milo is confirmed as the most impacted road point due to accumulation of tephra in time, where the time-cumulated tephra increases more than at the other target points (with larger steps) and then stabilizes starting from August. These results suggest that, following the 2021 cluster of Mt Etna lava fountains, the roads of Milo and Santa Venerina municipalities have been the most impacted from tephra deposition in time.
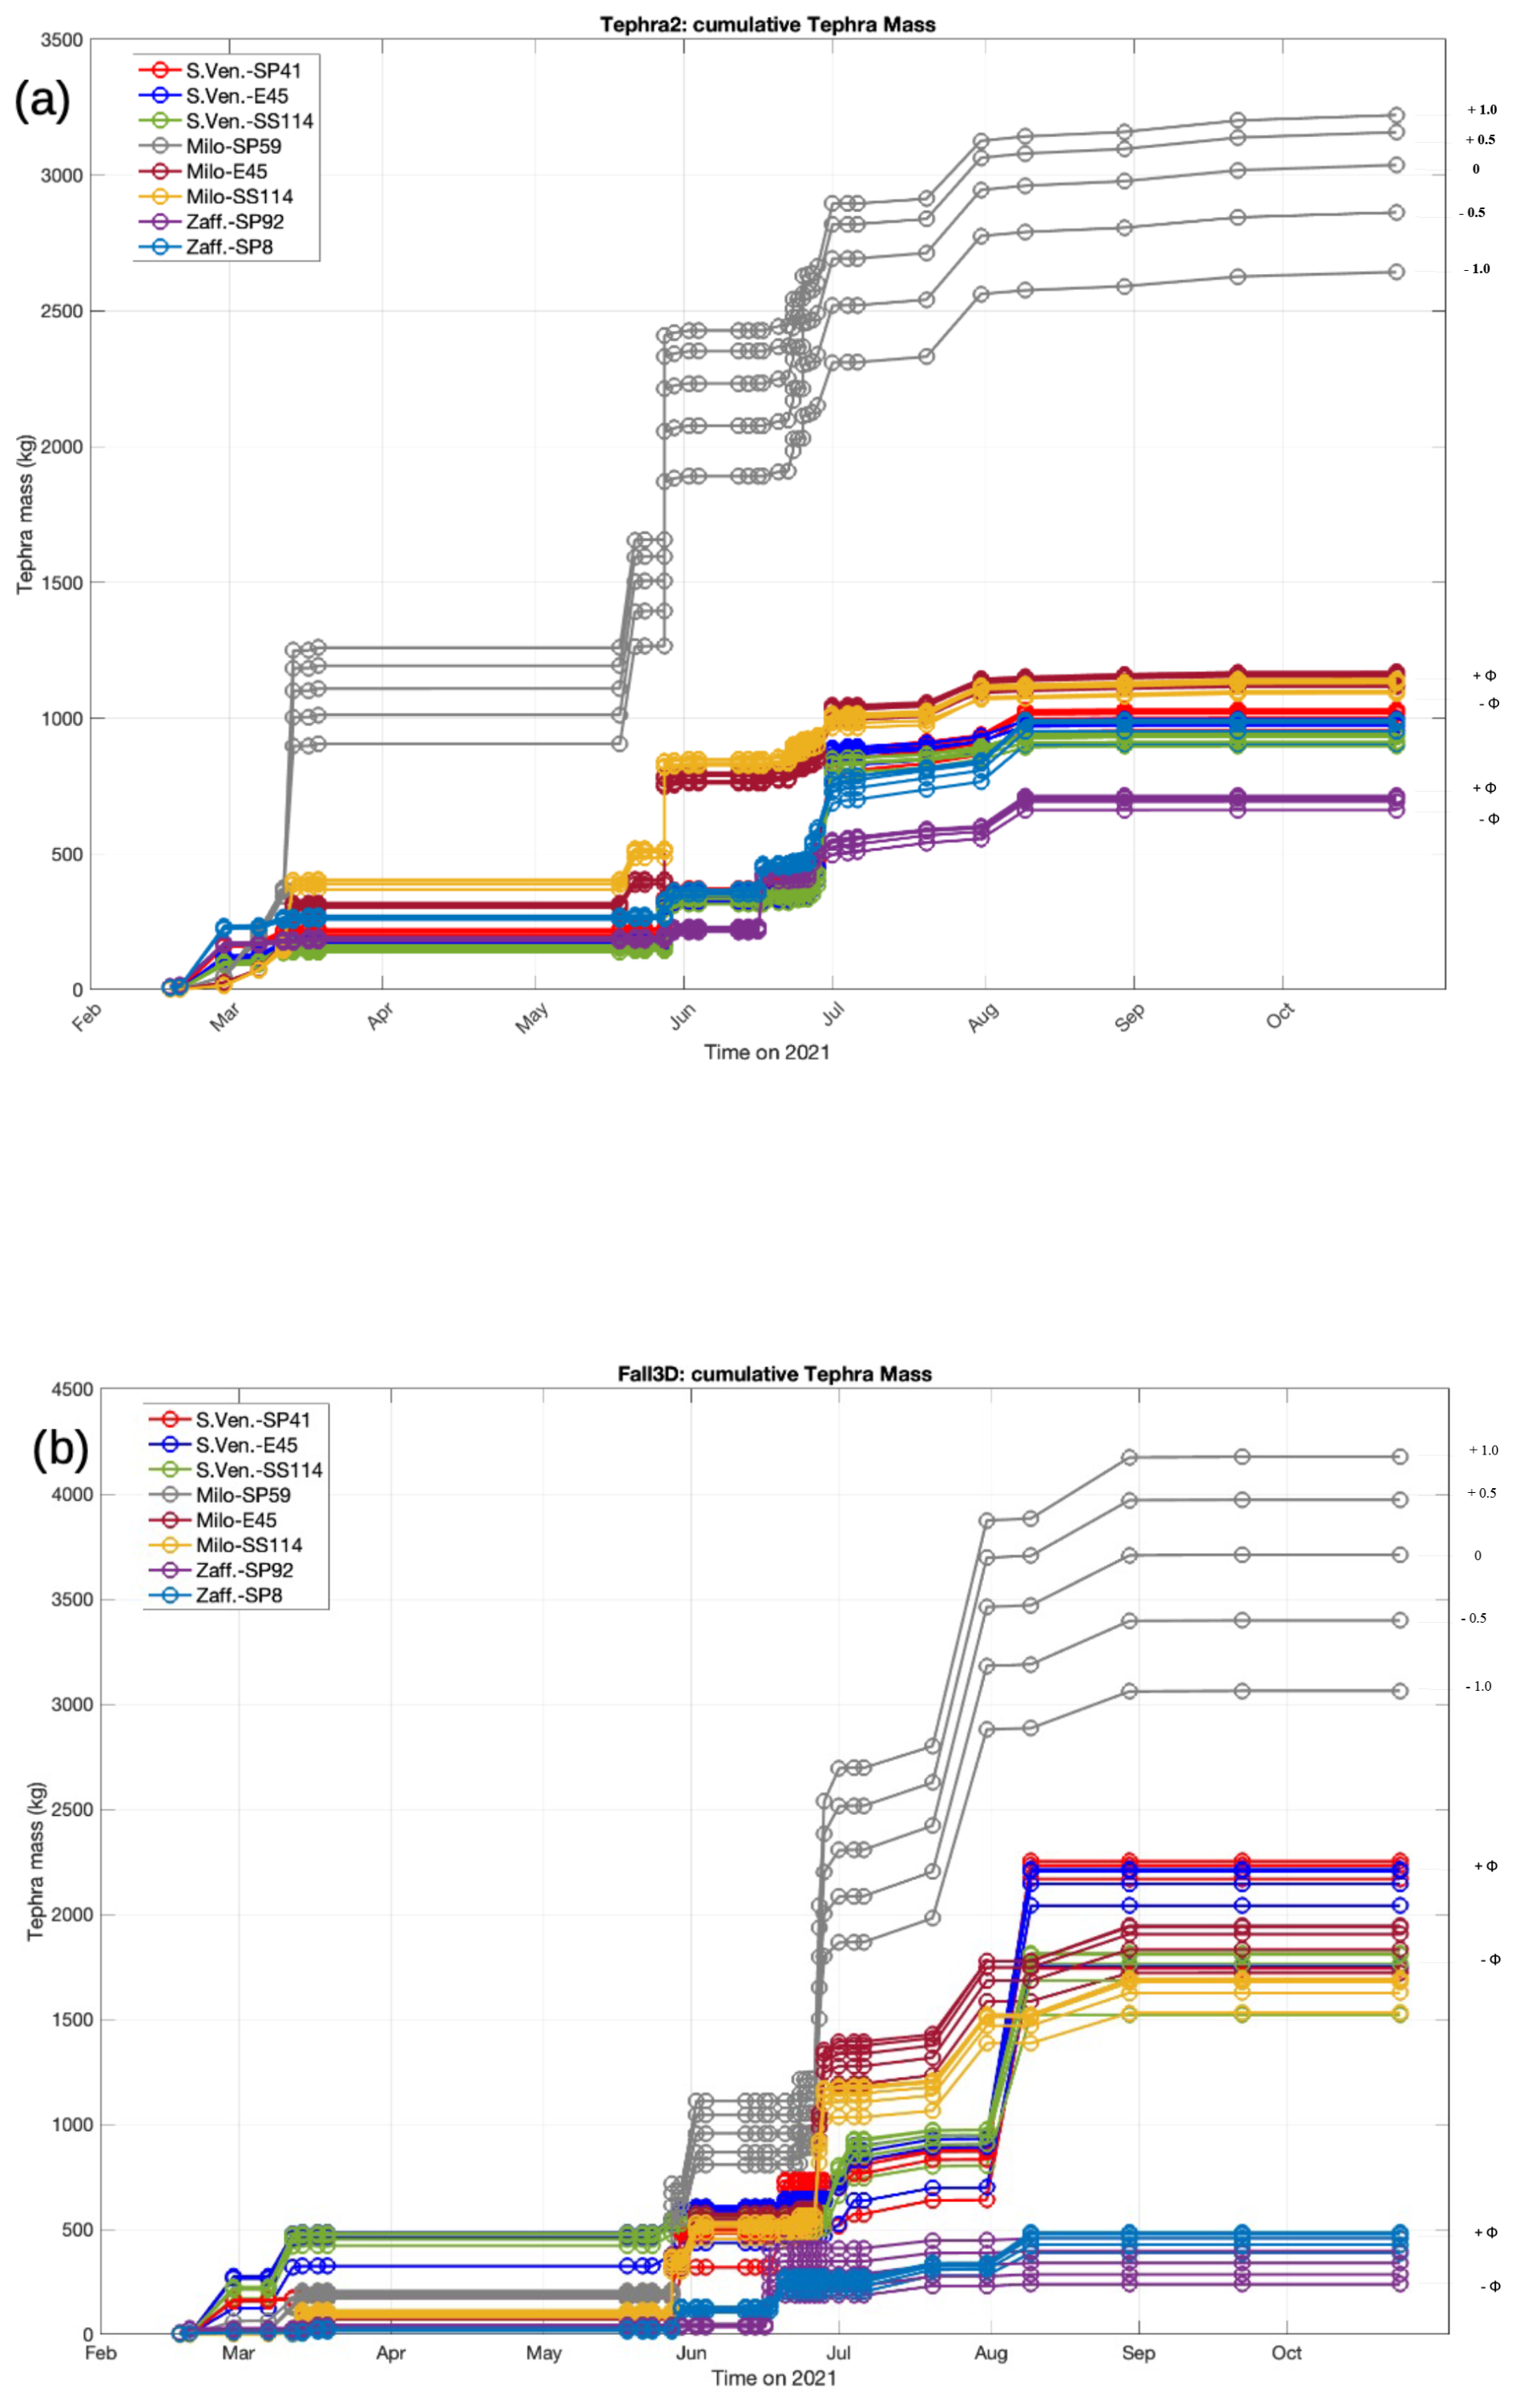
Figure 5The time series of cumulative tephra mass simulated by the Tephra2 (a) and Fall3D (b) models for all analysed explosive events at Mt Etna in 2021, which shows plumes dispersing to the east and southeast. Each road point is represented by a unique colour and symbol. We display the cumulative tephra mass corresponding to each road point and vary the median value of ϕ. The larger the mean grain size, the higher the accumulated load for that road point, as indicated on the right side of each figure.
4.3 Total mass accumulated on selected roads
In this section, we quantify the total tephra mass deposited on selected main roads previously listed in Table 3 for each municipality. Figure. 6a, b, and c are related, respectively, to the time-cumulative mass in Milo (a), Santa Venerina (b), and Zafferana Etnea (c), computed on selected roads of known area. Analysing the panels in Fig. 6, we observe some rapid increases in the cumulative trend of tephra mass mainly for the Fall3D simulations (dashed grey line) with respect to Tephra2 (dark continuous line) simulations. These rapidly increasing trends are found in Milo on 12 March, 28 May, and 27 June 2021; in Santa Venerina on 30 May and 17 June 2021; and in Zafferana Etnea. Generally, all the selected roads show a large step in the estimated cumulative tephra mass on 19 February, regardless of the model used. The largest step of total mass is found around June and July, as confirmed by the plots shown in Fig. 6a.
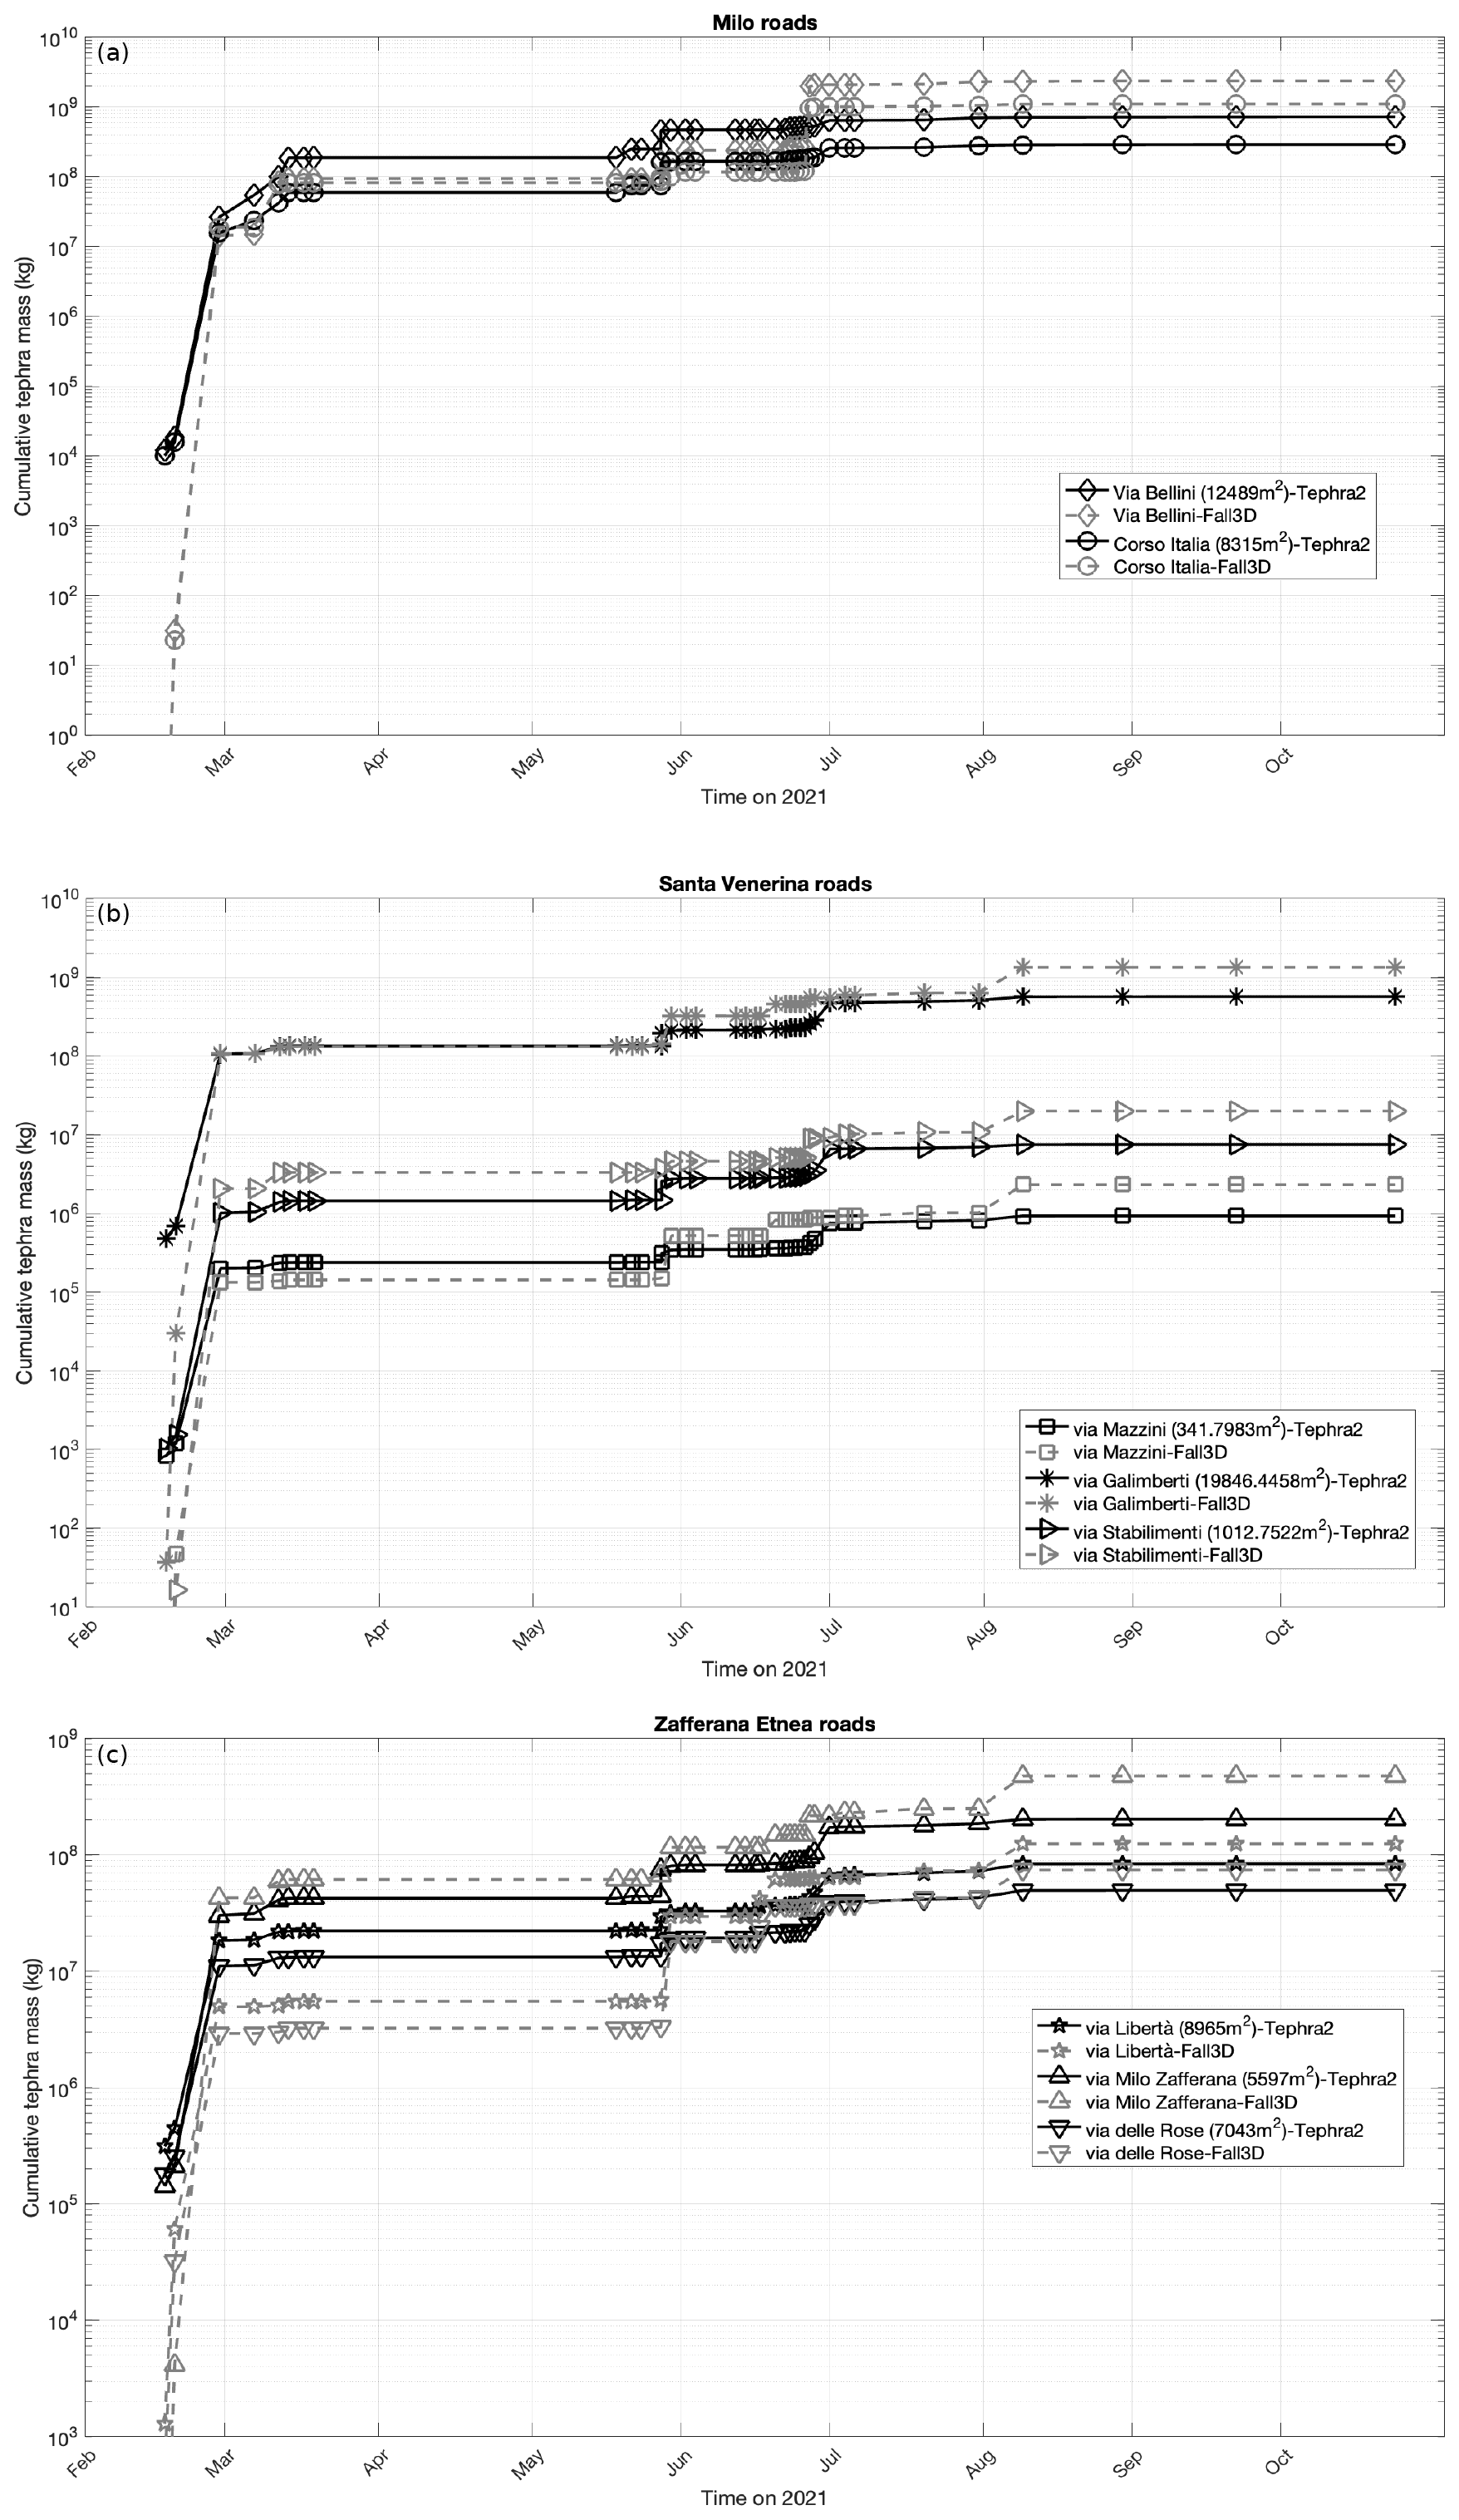
Figure 6Cumulative tephra mass on selected roads for Milo (a), Santa Venerina (b), and Zafferana Etnea (c), respectively, for all Mt Etna explosive events analysed here and simulated using the Tephra2 (dark continuous line) and Fall3D (dashed grey line) models. Each road is plotted with different symbols and identified by the relative area (m2, assuming a road width of 6 m), as listed in the legend.
In Table 5 we summarize the total tephra mass deposited during the 39 Mt Etna events in 2021 for the selected roads in each municipality. The last three rows show the total tephra mass computed for the complete road network of each town. The Fall3D estimates are generally larger than those from Tephra2, with the ratio ranging from 1.5 to 3.8 for the roads and from 2.0 to 5.0 for the towns, though the variability can be as much as a factor of 5 in either direction. We observe that during about 1 year of Mt Etna's paroxysms, in the nearest municipalities under examination, the estimated value of total tephra mass accumulated in the main streets ranges between 106–109 kg. A difference of at most 1 order of magnitude in the total accumulated mass according to the two models is found. It is worth noting that these values are computed under the worst conditions, i.e. without considering the tephra mobilization due to external factors, such as rain or wind, during the complete time range or assuming no road cleaning after each event. Therefore, this tephra mass represents a computed estimate of the total amount of tephra mass that theoretically had to be removed from the roads and disposed of during and after the 2021 crisis.
Table 5Total mass accumulated over 39 Mt Etna events on the selected roads for Milo, Santa Venerina, and Zafferana Etnea municipalities, as simulated by the Tephra2 and Fall3D models (fixing ϕ = 0.5 and assuming a road width of 6 ± 0.5 m). The total mass on the whole road network of Milo, Santa Venerina, and Zafferana for three road widths (5.5, 6, and 6.5 m) is in the last three rows. On the right column, the mass ratios between Fall3D and Tephra2 are shown.
4.4 Total mass accumulated on the full road network
Similarly to Fig. 3, Fig. 7 shows the cumulative tephra load (kg m−2) on the georeferenced road map within the Milo (light orange area), Santa Venerina (light pink area), and Zafferana Etnea (light green area) municipalities for all 39 Mt Etna lava fountains, computed using Tephra2 (Fig. 7a) and Fall3D (Fig. 7b) models.
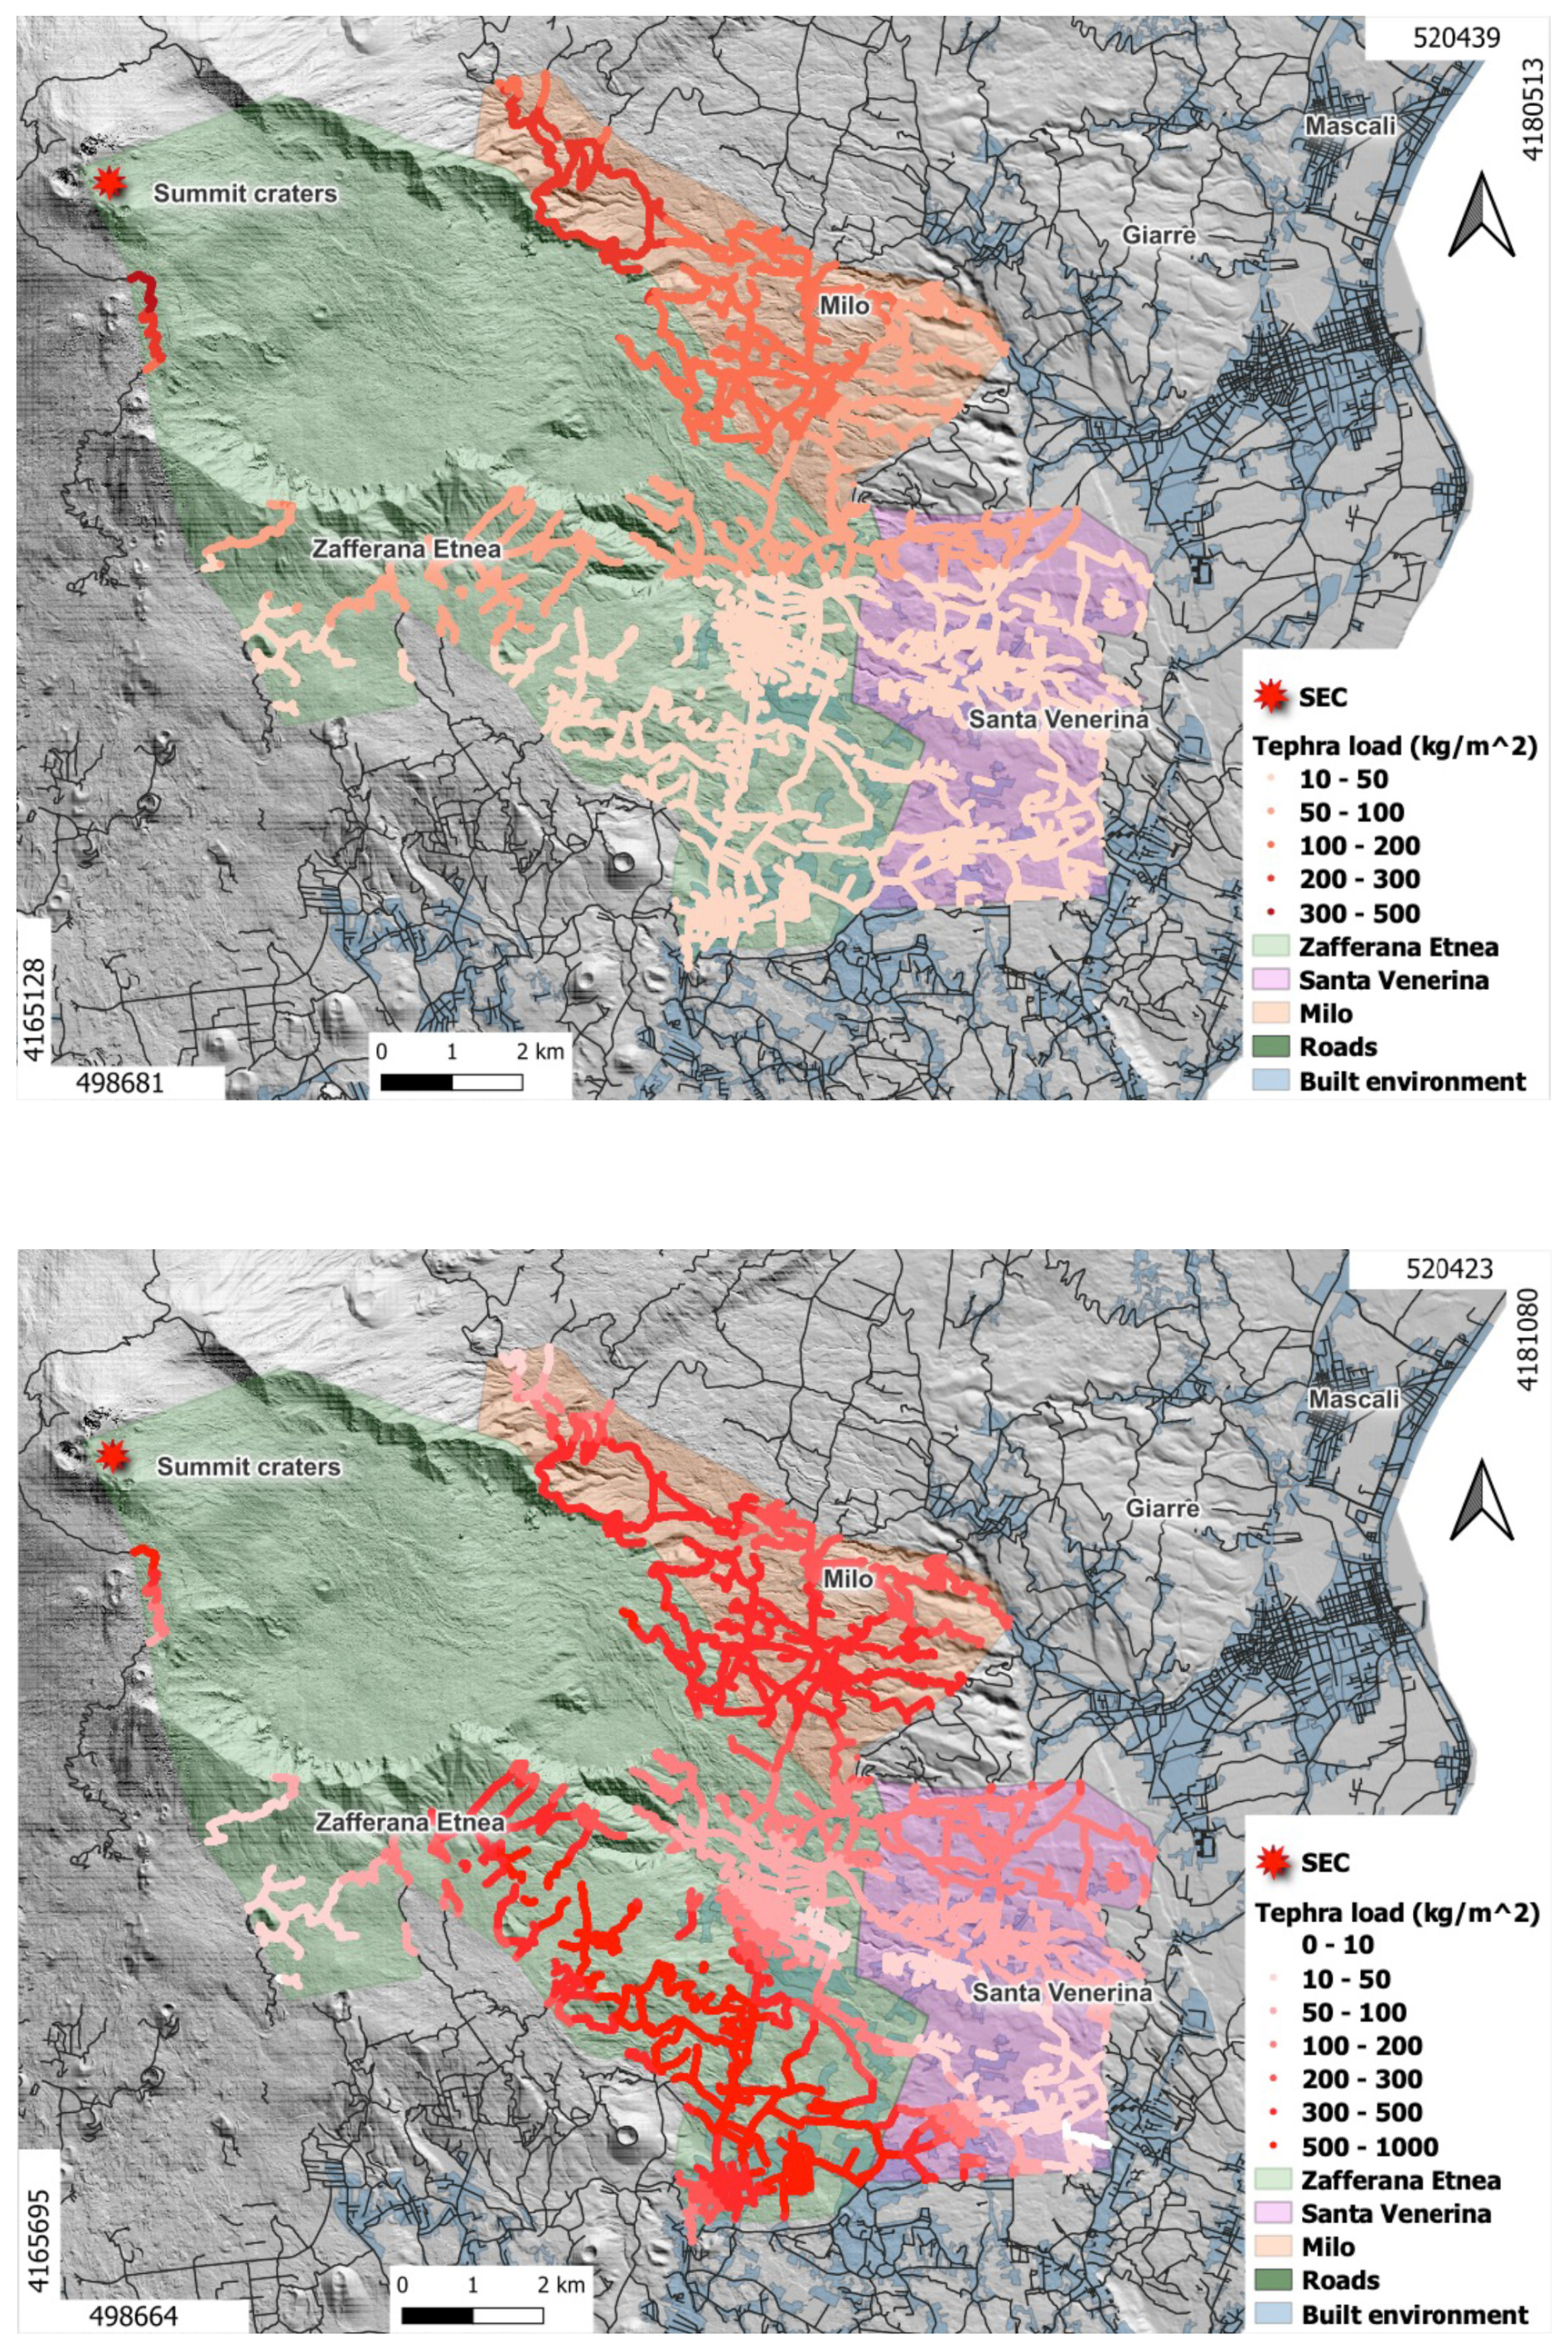
Figure 7Cumulative tephra load (kg m−2) for all 39 Mt Etna lava fountains analysed in this work, computed on the whole road network of Milo, Santa Venerina, and Zafferana Etnea using (a) Tephra2 and (b) Fall3D models, assuming ϕ = 0.5. The road graph is highlighted in bold, and it is coloured with a red scale as a function of deposited tephra values; georeferenced maps of the road network (dark lines) of the Mt Etna volcano area (shapefiles with the road data is publicly available from the Regione Sicilia website: https://www.regione.sicilia.it/, last access: 20 March 2025).
Considering the area of each road, we compute the time-cumulative tephra mass (kg) relative to Milo, Santa Venerina, and Zafferana over the whole road network, as computed by both numerical models (Fig. 8). Normally, the cumulative tephra mass derived from Tephra2 (dark continuous line) after an initial rapid growth tends to stabilize, in contrast with the trends obtained using Fall3D (dashed grey line), which present rapid increases in estimates throughout the sequence. These leaps in Milo are for the events on 28 May, 23 June (17:40–19:00 UTC), and 27 June 2021; in Santa Venerina on 28 February, 23 June, and 27 June 2021; and in Zafferana Etnea on 28 February and 17 June 2021. The maximum value of tephra mass deposited on the whole road network in the three municipalities ranges between 1010 and 1012 kg.
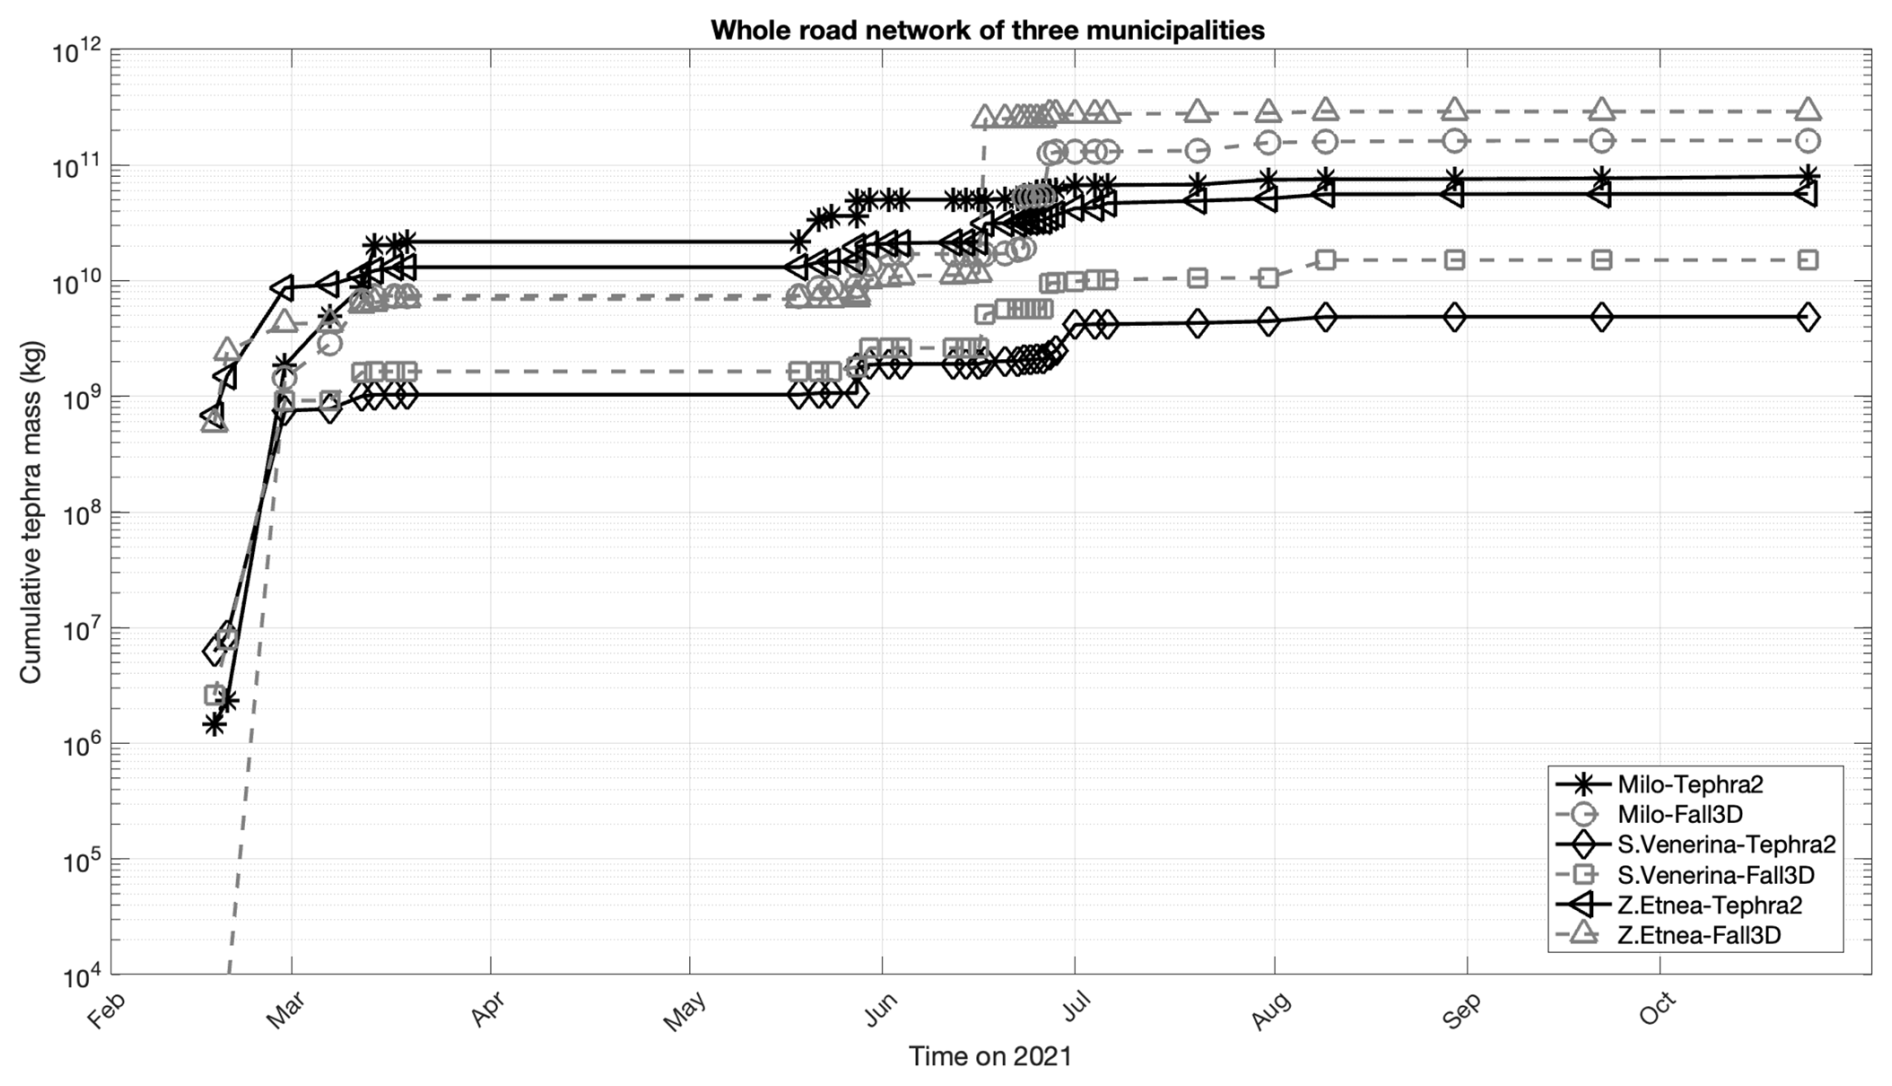
Figure 8Cumulative tephra mass for all 2021 Mt Etna lava fountains analysed in this work, simulated using Tephra2 (dark continuous line) and Fall3D (dashed grey line) models for the whole road network in Milo, Santa Venerina, and Zafferana Etnea.
4.5 Analysis of variability in tephra mass results
The estimates of tephra mass, as a function of the uncertainty variation related to ESPs used as input to initialize both numerical models and the specific limitations of the two dispersal models, are already documented in the literature (Scollo et al., 2008b). In the present work, we evaluated the potential mass load and total mass accumulated on the road networks of several target towns. Due to the complexity of the Fall3D model, requiring significant computational resources compared to Tephra2, the number of simulations considered for each analysed eruption was limited to the GSD variability. However, the comparison between the results provided by the two models allows for a first analysis of the variability in tephra mass estimates. The evaluation of the results for the case study on 28 February 2021 (Table 2), observed by the XWR and analysed by Pardini et al., (2023), allowed us to confirm Tephra2 as a useful numerical model for rapid assessment of tephra dispersal and deposition on road points, as well as for quickly evaluating the relative tephra-fallout hazard. We need to highlight that this analysis is only based on one case and considers single road points; it could show that it might not be a representative sample of the model behaviour. These results are consistent with the distribution of field data in relation to XWR measurements and model outcomes shown in Fig. 4a, b, and c. Kendall's τ correlation coefficient and the MAPE presented in Table 3 further support our findings. We also highlight the high performance of XWR in measuring these quantities, although these observations are not always available in real time. By shifting focus from individual road points to selected roads for the same Mt Etna eruption event on 28 February 2021, we observe that the Fall3D estimates are comparable or double those of Tephra2, with a ratio between their results from 0.3 to 2. When considering the entire sequence of 39 Mt Etna eruptive events, Fall3D estimates are higher than those of Tephra2 for the main roads in the three municipalities and for the entire road network selected in this work. Furthermore, assuming a variability of road width (±0.5 m) in our computations, we estimate a variability in tephra mass of approximately ±9 %. All of this information allows us to outline a more comprehensive framework for estimating the mass of tephra accumulated on roads, which is essential for managing the impact of volcanic eruptions.
In this work, we assessed, for the first time, the cumulated tephra mass on the road networks in three selected towns on Mt Etna's eastern flank during several paroxysms that occurred in 2021. This accumulated mass is a theoretical estimate of the amount of material that had to be removed from the roads and disposed of during the 2021 volcanic activity. We have focussed on three target municipalities located on the eastern flank, i.e. Milo, Santa Venerina, and Zafferana Etnea. According to the law at the time of the eruption, such material had to be handled and disposed of as special waste (Art. 35 decreto legge 77/2021). At the time of writing this paper, a new law allows the use of this material for other purposes (DA n. 8/Gab. 22/04/2024, https://www.regione.sicilia.it, last access: 20 March 2025) as, for example, building construction. By processing measurements derived from visible and thermal cameras of INGV-OE and, when available, from the analysis of SEVIRI images and the XWR data, we can retrieve the main ESPs, which is useful inputs to run numerical models. In this way, we can simulate and evaluate the cumulated tephra load on roads in time. By processing these results with the QGIS tool, we were able to identify the roads that were more exposed to tephra deposition. Specific thresholds of tephra load that can damage the main roads, and the necessary actions to mitigate the tephra effects are defined and known in the literature (e.g. Jenkins et al., 2015; Bonadonna et al., 2021b; Table 8 in Bonadonna et al., 2021a). We consider that the results of this analysis can be a valuable source of information to support the management of volcanic crises and for planning the reinstatement of road networks after a crisis.
It is known that effective and realistic transport management strategies are essential for volcanic contingency planning in sectors where key infrastructure are at risk, such as the road networks. Evaluating tephra mass using different models allowed us to assess epistemic uncertainty and to estimate the sensitivity of each model to the input ESPs and the variability of the median ϕ. It is worth highlighting that, in this work, we have neglected the uncertainties in the ESP values (such as QM, TEM, and HTP), but this analysis is already available in the literature (see Scollo et al., 2008b). However, these values are affected by various sources of uncertainty, including pre- and post-processing of data, as well as instrument sensitivity and accuracy, all of which can significantly impact the model outputs (see Mereu et al., 2023). This can lead to larger uncertainties in the simulated tephra load in addition to those related to the different model settings and the physical assumptions implemented in each numerical model. Moreover, in this work we are not considering the effect of rain which can remain trapped in the tephra deposit. Furthermore, depending on the rain's intensity, the road traffic safety can worsen (e.g. by making the transport network particularly slippery) or can be improved (e.g. by washing the road surface of the ash deposit).
As a final consideration, we point out the importance of the validation of the results of tephra load simulation obtained with two different numerical models by comparing their output with ground sampling data (in our case available from Pardini et al., 2023) as well as with the XWR retrievals for the Mt Etna explosive activity on 28 February 2021. The tephra deposit estimations, as listed in Tables 2 and 3, highlight the good agreement among the ground sampling, XWR retrievals, and the output of numerical models. This observation gives us confidence to use the two different models in evaluating not only qualitatively but also quantitatively the tephra deposited during the recent Mt Etna paroxysms. In this way, it is possible to provide plausible values of ground-cumulated tephra mass on roads and identify which routes in the road network of the target towns may be most impacted in the next eruptions.
We consider that the analyses and the results proposed in this paper provide interesting inputs for supporting decision-making and crisis management. Indeed, such analyses may support planning for clean-up operations following volcanic eruptions, which is essential for effective volcanic risk management (Hayes et al., 2019). Post-eruption clean-up of tephra deposits on roads is a widespread and costly activity, both in terms of time and resources, and frequently it is an unplanned activity (Hayes et al., 2019). Combining different cleaning methods, such as sweeping, suction, spraying, and air blasting, could help speed up tephra-fallout removal from high-priority roads used in the management of these events, especially before markings are fully covered (with thicknesses ranging from 1 to 10 mm), to ensure safety during cleaning operations. Understanding the economic impact on affected areas (Hayes et al., 2015; Magill et al., 2006) also contributes to better risk management. Geospatial analysis methods are documented well in the literature for estimating the duration of cleaning up roads (Hayes et al., 2017), although these operations are influenced by complex interactions between physical factors (e.g. erupted volume, column height, grain size, wind speed and direction, and rainfall) and social factors (e.g. social priorities, prior planning, previous experience, and infrastructure interdependencies) (Hayes et al., 2015). Moreover, the presented results may support decision-makers in different ways, e.g. for planning and consequently for better management of a future volcanic crisis due to explosive activity of Mt Etna volcano, as well as for getting valuable information about the order of magnitude of the total mass of tephra available for preparing the subsequent disposal and/or reuse.
Image and analysis data can be requested from the corresponding author.
AG, SS, LS, and LM: conceptualization; LM, MP, and MS: data curation; LM and AG: formal analysis; AG and SS: funding acquisition; LM, SS, LS, and AG: investigation; LM and AG: methodology; AG and SS: project administration; AG, MP, MS, SS, LM, and CB: resources; LM: software; SS, AG, LS, and CB: supervision; AG, SS, LS, and LM: validation; LM: writing (original draft preparation); LM, AG, SS, MP, MS, and CB: writing (review and editing).
The contact author has declared that none of the authors has any competing interests.
Publisher's note: Copernicus Publications remains neutral with regard to jurisdictional claims made in the text, published maps, institutional affiliations, or any other geographical representation in this paper. While Copernicus Publications makes every effort to include appropriate place names, the final responsibility lies with the authors.
This work was performed in the framework of the INGV project Pianeta Dinamico (D53J19000170001), funded by MUR (Ministero dell'Università e della Ricerca, Fondo finalizzato al rilancio degli investimenti delle amministrazioni centrali dello Stato e allo sviluppo del Paese, legge 145/2018). Fall3D simulations have been performed thanks to the computational resources of the ADA cluster of Istituto Nazionale di Geofisica e Vulcanologia, Sezione di Bologna. Manuel Stocchi was funded by the PNIR – Programma Nazionale Infrastrutture di Ricerca – with the CIR01_00013 project. Costanza Bonadonna was funded by SNSF project no. 200021_188757. The maps shown in this paper were generated using the QGIS geographic information system (http://www.qgis.org, last access: 20 March 2025).
This work was supported by the INGV project Pianeta Dinamico (CUP D53J19000170001) funded by MIUR (“Fondo finalizzato al rilancio degli investimenti delle amministrazioni centrali dello Stato e allo sviluppo del Paese”, legge 145/2018), Tema 8 – PANACEA (2021) and VT_DYNAMO (2023).
This paper was edited by Giovanni Macedonio and reviewed by Alvaro Aravena and one anonymous referee.
Ágústsdóttir, A. M.: Ecosystem approach for natural hazard mitigation of volcanic tephra in Iceland: building resilience and sustainability, Nat. Hazards, 78, 1669–1691, https://doi.org/10.1007/s11069-015-1795-6, 2015.
Alparone, S., Andronico, D., Lodato, L., and Sgroi, T.: Relationship between tremor and volcanic activity during the Southeast Crater eruption on Mount Etna in early 2000, J. Geophys. Res., 108, 2241, https://doi.org/10.1029/2002JB001866, 2003.
Andronico, D., Cannata, A., Di Grazia, G., and Ferrari, F.: The 1986–2021 paroxysmal episodes at the summit craters of Mt. Etna: Insights into volcano dynamics and hazard, Earth-Sci. Rev., 220, 103686, https://doi.org/10.1016/j.earscirev.2021.103686, 2021.
Aravena, A., Carparelli, G., Cioni, R., Prestifilippo, M., and Scollo, S.: Toward a real-time analysis of column height by visible cameras: an example from Mt. Etna, in Italy, Remote Sensing, 15, 2595, https://doi.org/10.3390/rs15102595, 2023.
Barsotti, S., Andronico, D., Neri, A., Del Carlo, P., Baxter, P. J., Aspinall, W. P., and Hincks, T.: Quantitative assessment of volcanic ash hazards for health and infrastructure at Mt. Etna (Italy) by numerical simulation, J. Volcanol. Geoth. Res., 192, 85–96, 2010.
Barsotti, S., Di Rienzo, D. I., Thordarson, T., Björnsson, B. B., and Karlsdóttir, S.: Assessing Impact to Infrastructures Due to Tephra Fallout From Öræfajökull Volcano (Iceland) by Using a Scenario-Based Approach and a Numerical Model, Front. Earth Sci., 6, 196, https://doi.org/10.3389/feart.2018.00196, 2018.
Baxter, P. J.: Medical effects of volcanic eruptions, B. Volcanol., 52, 532, https://doi.org/10.1007/BF00301534, 1990.
Bebbington, M., Cronin, S. J., Chapman, I., and Turnera, M. B.: Quantifying volcanic ash fall hazard to electricity infrastructure, J. Volcanol. Geoth. Res., 177, 4, https://doi.org/10.1016/j.jvolgeores.2008.07.023, 2008.
Biass, S., Bonadonna, C., Traglia, F., Pistolesi, M., Rosi, M., and Lestuzzi, P.: Probabilistic evaluation of the physical impact of future tephra fallout events for the Island of Vulcano, Italy, B. Volcanol., 78, 1–22, https://doi.org/10.1007/s00445-016-1028-1, 2016.
Biass, S., Todde, A., Cioni, R., Pistolesi, M., Geshi, N., and Bonadonna, C.: Potential impacts of tephra fallout from a large-scale explosive eruption at Sakurajima volcano, Japan, B. Volcanol., 79, 73, https://doi.org/10.1007/s00445-017-1153-5, 2017.
Blake, D. M., Wilson, T. M., and Gomez, C.: Road marking coverage by volcanic ash, Environ. Earth Sci. 75, 1–12, 2016.
Blake, D. M., Wilson, T. M., Cole, J. W., Deligne, N. I., and Lindsay, J. M.: Impact of Volcanic Ash on Road and Airfield Surface Skid Resistance, Sustainability, 9, 1389, https://doi.org/10.3390/su9081389, 2017.
Blong, R. J.: Volcanic Hazards: A Sourcebook on the Effects of Eruptions, Sydney, Australia, Academic Press Inc., 79–94, ISBN: 9780121071806, 1984.
Blong, R. J.: Volcanic hazards risk assessment, in: Monitoring and Mitigation of Volcano Hazards, edited by: Scarpa, R. and Tilling, R. I., Springer, Berlin, 675–698, ISBN: 978-3540607137, 1996.
Bonadonna, C.: Probabilistic modelling of tephra dispersal, in: Statistics in Volcanology, edited by: Mader, H., Cole, S., and Connor, C. B., IAVCEI Series, Vol. 1, Geological Society of London, https://doi.org/10.1029/2003JB002896, 2006.
Bonadonna, C., Connor, C. B., Houghton, B. F., Connor, L., Byrne, M., Laing, A., and Hincks, T. K.: Probabilistic modeling of tephra dispersal: Hazard assessment of a multiphase rhyolitic eruption at Tarawera, New Zealand, J. Geophys. Res., 110, B03203, https://doi.org/10.1029/2003JB002896, 2005.
Bonadonna, C., Frischknecht, C., Menoni, S., Romerio, F., Gregg, C. E., Rosi, M., Biass, S., Asgary, A., Pistolesi, M., Guobadia, D., Gattuso, A., Ricciardi, A., and Cristiani, C.: Integrating hazard, exposure, vulnerability and resilience for risk and emergency management in a volcanic context: the ADVISE model, Journal of Applied Volcanology, 10, 7, https://doi.org/10.1186/s13617-021-00108-5, 2021a.
Bonadonna, C., Biass, S., Menoni, S., and Chris, E. G.: Assessment of risk associated with tephra-related hazards, in: Forecasting and Planning for Volcanic Hazards, Risks, and Disasters, edited by: Papale, P., Elsevier, Chap. 8, 329–378, 2021b.
Calvari, S. and Nunnari, G.: Comparison between Automated and Manual Detection of Lava Fountains from Fixed Monitoring Thermal Cameras at Etna Volcano, Italy, Remote Sens., 14, 2392, https://doi.org/10.3390/rs14102392, 2022.
Calvari, S., Cannavò, F., Bonaccorso, A., Spampinato, L., and Pellegrino, A. G.: Paroxysmal Explosions, Lava Fountains and Ash Plumes at Etna Volcano: Eruptive Processes and Hazard Implications, Front. Earth Sci., 6, 107, https://doi.org/10.3389/feart.2018.00107, 2018.
Calvari, S., Bonaccorso, A., and Ganci, G.: Anatomy of a Paroxysmal Lava Fountain at Etna Volcano: The Case of the 12 March 2021, Episode, Remote Sensing, 13, 3052, https://doi.org/10.3390/rs13153052, 2021.
Calvari, S., Biale, E., Bonaccorso, A., Cannata, A., Carleo, L., Currenti, G., Di Grazia, G., Ganci, G., Iozzia, A., Pecora, E., Prestifilippo, M., Sciotto, M., and Scollo, S.: Explosive Paroxysmal Events at Etna Volcano of Different Magnitude and Intensity Explored through a Multidisciplinary Monitoring System, Remote Sensing, 14, 4006, https://doi.org/10.3390/rs14164006, 2022.
Casadevall, T. J.: The 1989–1990 eruption of redoubt volcano, Alaska: impacts on aircraft operations, J. Volcanol. Geoth. Res., 62, 301–316, https://doi.org/10.1016/0377-0273(94)90038-8, 1994.
Connor, L. G. and Connor, C. B.: Inversion is the key to dispersion: Understanding eruption dynamics by inverting tephra fallout, in: Statistics in Volcanology, edited by: Mader, H., Cole, S., and Connor, C. B., Geological Society, London, 1, 231–242, https://doi.org/10.1144/IAVCEI001.18, 2006.
Corradini, S., Guerrieri, L., Lombardo, V., Merucci, L., Musacchio, M., Prestifilippo, M., Scollo, S., Silvestri, M., Spata, G., and Stelitano, D.: Proximal monitoring of the 2011–2015 Etna lava fountains using MSG-SEVIRI data, Geosciences, 8, 140, https://doi.org/10.3390/geosciences8040140, 2018.
Costa, A., Macedonio, G., and Folch, A.: A three-dimensional Eulerian model for transport and deposition of volcanic ashes, Earth Planet. Sc. Lett., 241, 634–647, 2006.
Costa, A., Folch, A., Macedonio, G., Giaccio, B., Isaia, R., and Smith, V. C.: Quantifying volcanic ash dispersal and impact of the Campanian Ignimbrite super-eruption, Geophys. Res. Lett., 39, L10310, https://doi.org/10.1029/2012GL051605, 2012.
Dominguez, L., Bonadonna, C., Frischknecht, C., Menoni, S., and Garcia, A.: Integrative Post-event Impact Assessment Framework for Volcanic Eruptions: A Disaster Forensic Investigation of the 2011–2012 Eruption of the Cordoìn Caulle Volcano (Chile), Front. Earth Sci., 9, 645945, https://doi.org/10.3389/feart.2021.645945, 2021.
Folch, A., Costa A. and Macedonio, G.: FALL3D: A computational model for transport and deposition of volcanic ash. Computers and Geosciences 35, 1334–1342, 2009.
Folch, A., Costa, A. and Basart, S.: Validation of the FALL3D ash dispersion model using observations of the 2010 Eyjafjallajökull volcanic ash clouds, Atmospheric environment volume 48, Pages 165-183, 2012.
Folch, A., Costa, A., and Macedonio, G.: FPLUME-1.0: An integral volcanic plume model accounting for ash aggregation, Geosci. Model Dev., 9, 431–450, https://doi.org/10.5194/gmd-9-431-2016, 2016.
Folch, A., Mingari, L., Gutierrez, N., Hanzich, M., Macedonio, G., and Costa, A.: FALL3D-8.0: a computational model for atmospheric transport and deposition of particles, aerosols and radionuclides – Part 1: Model physics and numerics, Geosci. Model Dev., 13, 1431–1458, https://doi.org/10.5194/gmd-13-1431-2020, 2020.
Freret-Lorgeril, V., Bonadonna, C., Corradini, S., Donnadieu, F., Guerrieri, L., Lacanna, G., Marzano, F. S., Mereu, L., Merucci, L., Ripepe, M., Scollo, S., and Stelitano, D.: Examples of Multi-Sensor Determination of Eruptive Source Parameters of Explosive Events at Mount Etna, Remote Sensing, 13, 2097, https://doi.org/10.3390/rs13112097, 2021.
Gordon, K. D., Cole, J. W., Rosenberg, M. D., and Johnston, D. M.: Effects of volcanic ash on computers and electronic equipment, Nat. Hazards, 34, 231–262, 2005.
Guffanti, M., Mayberry, G. C., and Casadevall, T. J.: Volcanic hazards to airports, Nat. Hazards, 51, 287–302, https://doi.org/10.1007/s11069-008-9254-2, 2009.
Hayes, J. L., Wilson, T. M., and Magill, C.: Tephra fall clean-up in urban environments, J. Volcanol. Geoth. Res., 304, 359–377, 2015.
Hayes, J., Wilson, T. M., Deligne, N. I., Cole, J., and Hughes, M.: A model to assess tephra clean-up requirements in urban environments, Journal of Applied Volcanology, 6, 1, https://doi.org/10.1186/s13617-016-0052-3, 2017.
Hayes, J. L., Wilson, T. M., Carol Stewart, C., Villarosa, G., Salgado, P., Beigt, D., Outes, V., Deligne, N. I., and Leonard, G. S.: Tephra clean-up after the 2015 eruption of Calbuco volcano, Chile: a quantitative geospatial assessment in four communities, Journal of Applied Volcanology, 8, 7, https://doi.org/10.1186/s13617-019-0087-3, 2019.
Hayes, J. L., Biass, S., Jenkins, S. F., Meredith, E. S., and Williams, G. T.: Integrating criticality concepts into road network disruption assessments for volcanic eruptions, Journal of Applied Volcanology, 11, 8, https://doi.org/10.1186/s13617-022-00118-x, 2022.
Heiken, G., Murphy, M., Hackett, W., and Scott, W.: Volcanic hazards to energy infrastructure – ash fallout hazards and their mitigation: Proceedings, World Geothermal Congress, Florence, Italy, 18–31 May 1995, 4, 2795–2798, 1995.
Hersbach, H., Bell, B., Berrisford, P., Biavati, G., Horányi, A., Muñoz Sabater, J., Nicolas, J., Peubey, C., Radu, R., Rozum, I., Schepers, D., Simmons, A., Soci, C., Dee, D., and Thépaut, J.-N.: ERA5 hourly data on single levels from 1940 to present, Copernicus Climate Change Service (C3S) Climate Data Store (CDS) [data set], https://doi.org/10.24381/cds.adbb2d47, 2023.
Horwell, C. J. and Baxter, P. J.: The Respiratory Health Hazards of Volcanic Ash: A Review for Volcanic Risk Mitigation, B. Volcanol., 69, 1–24, https://doi.org/10.1007/s00445-006-0052-y, 2006.
Jenkins, S. F., Spence, R. J. S., Fonseca, J. F. B. D., Solidum, R. U., and Wilson, T. M.: Volcanic risk assessment: quantifying physical vulnerability in the built environ ment, J. Volcanol. Geoth. Res., 276 105–120, 2014.
Jenkins, S., Barsotti, S., Hincks, T. K., Neri, A., Phillips, J. C., Sparks, R. S. J., Sheldrake, T., and Vougioukalakis, G.: Rapid emergency assessment of ash and gas hazard for future eruptions at Santorini Volcano, Greece, Journal of Applied Volcanology, 4, 16, https://doi.org/10.1186/s13617-015-0033-y, 2015.
Johnston, D. M. and Daly, M.: Auckland erupts!!!, New Zealand Science Monthly, 8, 6–7, 1995.
Johnston, D. M.: Physical and Social Impacts of Past and Future Volcanic Eruptions in New Zealand, PhD thesis, Massey University, Palmerston North, New Zealand, https://mro.massey.ac.nz/items/74dd7a9f-3024-4270-8fec-867c40444706 (last access: 20 March 2025), 1997.
Labadie, J. R.: Volcanic Ash Effects and Mitigation, Adapted from a Report Prepared in 1983 for the Air Force Office of Scientific Research and the Defence Advanced Research Projects Agency, https://www.nrc.gov/docs/ML0913/ML091330800.pdf (last access: 20 March 2025), 1994.
Magill, C., Blong, R., and McAneney, J.: VolcaNZ – A volcanic loss model for Auckland, New Zealand, J. Volcanol. Geoth. Res., 149, 329–345, 2006.
Marzano, F. S., Picciotti, E., Vulpiani, G. and Montopoli, M.: Synthetic signatures of volcanic ash cloud particles from X-band dual-polarization radar, IEEE T. Geosci. Remote, 50, 193–211, https://doi.org/10.1109/TGRS.2011.2159225, 2012.
Marzano, F. S., Mereu, L., Scollo, S., Donnadieu, F., and Bonadonna, C.: Tephra mass eruption rate from ground-based X-band and L-band microwave radars during the November 23, 2013 Etna Paroxysm, IEEE T. Geosci. Remote, 58, 3314–3327, https://doi.org/10.1109/tgrs.2019.2953167, 2020.
Mastin, L. G., Guffanti, M., Servranckx, R., Webley, P., Barsotti, S., Dean, K., Durant, A., Ewert, J. W., Neri, A., Rose, W. I., Schneider, D., Siebert, D., Stunder, B., Swanson, G., Tupper, A., Volentik, A., and Waythomas, C. F.: A multidisciplinary effort to assign realistic source parameters to models of volcanic ash-cloud transport and dispersion during eruptions, J. Volcanol. Geoth. Res., 186, 10–21, https://doi.org/10.1016/j.jvolgeores.2009.01.008, 2009.
Mereu, L., Marzano, F. S., Montopoli, M., and Bonadonna, C.: Retrieval of tephra size spectra and mass flow rate from C-band radar during the 2010 Eyjafjallajökull eruption, Iceland, IEEE T. Geosci. Remote, 53, 5644–5660, https://doi.org/10.1109/tgrs.2015.2427032, 2015.
Mereu, L., Scollo, S., Bonadonna, C., Freret-Lorgeril, V., and Marzano, F. S.: Multisensor characterization of the incandescent jet region of lava fountain-fed tephra plumes, Remote Sensing, 12, 3629, https://doi.org/10.3390/rs12213629, 2020.
Mereu, L., Scollo, S., Bonadonna, C., Donnadieu, F., Freret Lorgeril, V., and Marzano, F. S.: Ground-based remote sensing of volcanic mass flow: Retrieval techniques and uncertainty analysis of Mt. Etna eruptions in 2015, IEEE J. Sel. Top. Appl., 15, 504–518, https://doi.org/10.1109/jstars.2021.3133946, 2022.
Mereu, L., Scollo, S., Garcia, A., Sandri, L., Bonadonna, C., and Marzano, F. S.: A new radar-based statistical model to quantify mass eruption rate of volcanic plumes, Geophys. Res. Lett., 50, e2022GL100596, https://doi.org/10.1029/2022GL100596, 2023.
Miller, T. P. and Casadevall, T. J.: Volcanic ash hazards to aviation, in: Encyclopedia of Volcanoes, 1st edn., edited by: Sigurdsson, H., Houghton, B., Rymer, H., Stix, J., and McNutt, S., Academic Press, San Diego, CA, USA, 915–930, https://doi.org/10.1016/C2015-0-00175-7, 1999.
Montopoli, M.: Velocity profiles inside volcanic clouds from three-dimensional scanning microwave dual-polarization Doppler radars, J. Geophys. Res.-Atmos., 121, 7881–7900, https://doi.org/10.1002/2015JD023464, 2016.
Pardini, F., De' Michieli Vitturi, M., Andronico, D., Esposti Ongaro, T., Cristaldi, A., and Neri, A.: Real-time probabilistic assessment of volcanic hazard for tephra dispersal and fallout at Mt. Etna: the 2021 lava fountain episodes, B. Volcanol., 85, 6, https://doi.org/10.1007/s00445-022-01614-z, 2023.
Romeo, F., Mereu, L., Scollo, S., Papa, M., Corradini, S., Merucci, L., and Marzano, F. S.: Volcanic Cloud Detection and Retrieval Using Satellite Multisensor Observations, Remote Sens., 15, 888, https://doi.org/10.3390/rs15040888, 2023.
Sarna-Wojcicki, A. M., Shipley, S., Waitt, R. B., Dzurisin, D., and Wood, S. H.: Areal distribution, thickness, mass, volume, and grain size of air-fall ash from the six major eruptions of 1980, in: The 1980 Eruptions of Mount Saint Helens, USGS Numbered Series 1250, edited by: Lipman, P. W. and Mullineaux, D. R., U.S. Government Publishing Office, Washington, DC, USA, 577–600, https://scholarworks.boisestate.edu/geo_facpubs/161 (last access: 20 March 2025), 1981.
Scollo, S., Del Carlo, P., and Coltelli, M.: Tephra fallout of 2001 Etna flank eruption: Analysis of the deposit and plume dispersion, J. Volcanol. Geoth. Res., 160, 147–164, https://doi.org/10.1016/j.jvolgeores.2006.09.007, 2007.
Scollo, S., Tarantola, S., Bonadonna, C., Coltelli, M., and Saltelli, A.: Sensitivity analysis and uncertainty estimation for tephra dispersal models, J. Geophys. Res., 113, B06202, https://doi.org/10.1029/2006JB004864, 2008a.
Scollo, S., Folch, A., and Costa, A.: A parametric and comparative study of different tephra fallout models, J. Volcanol. Geoth. Res., 176, 199–211, 2008b.
Scollo, S., Prestifilippo, M., Spata, G., D'Agostino, M., and Coltelli, M.: Monitoring and forecasting Etna volcanic plumes, Nat. Hazards Earth Syst. Sci., 9, 1573–1585, https://doi.org/10.5194/nhess-9-1573-2009, 2009.
Scollo, S., Coltelli, M., Bonadonna, C., and Del Carlo, P.: Tephra hazard assessment at Mt. Etna (Italy), Nat. Hazards Earth Syst. Sci., 13, 3221–3233, https://doi.org/10.5194/nhess-13-3221-2013, 2013.
Scollo, S., Prestifilippo, M., Bonadonna, C., Cioni, R., Corradini, S., Degruyter, W., Rossi, E., Silvestri, M., Biale, E., Carparelli, G., Cassisi, C., Merucci, L., Musacchio, M., and Pecora, E.: Near-Real-Time Tephra Fallout Assessment at Mt. Etna, Italy, Remote Sens., 11, 2987, https://doi.org/10.3390/rs11242987, 2019.
Spence, R. J. S., Kelman, I., Baxter, P. J., Zuccaro, G., and Petrazzuoli, S.: Residential building and occupant vulnerability to tephra fall, Nat. Hazards Earth Syst. Sci., 5, 477–494, https://doi.org/10.5194/nhess-5-477-2005, 2005.
Taddeucci, J., Edmonds, M., Houghton, B., James, M. R., and Vergniolle, S.: Hawaiian and Strombolian Eruptions, in: The Encyclopedia of Volcanoes, Elsevier Inc., Amsterdam, The Netherland, University of Rhode Island, Narragansett, RI, USA, 485–503, https://doi.org/10.1016/B978-0-12-385938-9.00027-4, 2015.
Tadini, A., Gouhier, M., Donnadieu, F., de'Michieli Vitturi, M., and Pardini, F.: Particle sedimentation in numerical modelling: a case study from the Puyehue-Cordón Caulle 2011 eruption with the PLUME-MoM/HYSPLIT models, Atmosphere, 13, 784, https://doi.org/10.3390/atmos13050784, 2022.
Takishita, K., Poulidis, A. P. and Iguchi, M.: Tephra4D: a python-based model for high-resolution tephra transport and deposition simulations–applications at Sakurajima volcano, Japan, Atmosphere, 12, 331, https://doi.org/10.3390/atmos12030331, 2021.
Volentik, A. C. M., Connor, C. B., Connor, L. J., and Bonadonna, C.: Aspects of volcanic hazards assessment for the Bataan nuclear power plant, Luzon Peninsula, Philippines, in: Volcanic and tectonic hazard assessment for nuclear facilities, edited by: Connor, C., Chapman, N. A., and Connor, L., Cambridge University Press, Cambridge, https://digitalcommons.usf.edu/geo_facpub/1038 (last access: 20 March 2025), 2009.
Vulpiani, G., Ripepe, M., and Valade, S.: Mass discharge rate retrieval combining weather radar and thermal camera observations, J. Geophys. Res.-Sol. Ea., 121, 5679–5695, https://doi.org/10.1002/2016jb013191, 2016.
Wardman, J. B., Wilson, T., Bodger, P. S., Cole, J. W., and Johnston, D. M.: Investigating the electrical conductivity of volcanic ash and its effects on HV power systems, Phys. Chem. Earth, 45–46, 128–145, https://doi.org/10.1016/j.pce.2011.09.003, 2012.
Wilson, L., Parfitt, E. A., and Head, J. W.: Explosive volcanic eruptions-VIII. The role of magma recycling in controlling the behaviour of Hawaiian-style lava fountains, Geophys. J. Int., 121, 215–225, 1995.
Wilson, T. M, Stewart, C., Sword-Daniels, V., Leonard, G. S., Johnston, D. M., Cole, J. W., Wardman, J., Wilson, G., and Barnard, S. T.: Volcanic ash impacts on critical infrastructure, Phys. Chem. Earth, 45–46, 5–23, https://doi.org/10.1016/j.pce.2011.06.006, 2012.
Wilson, G., Wilson, T. M., Deligne, N. I., and Cole, J. W.: Volcanic hazard impacts to critical infrastructure: A review, J. Volcanol. Geotherm. Res., 286, 148–182, 2014.
Volcano Observatory Notices for Aviation