the Creative Commons Attribution 4.0 License.
the Creative Commons Attribution 4.0 License.
 | 11 Jan 2024
Brief communication: The Lahaina Fire disaster – how models can be used to understand and predict wildfires
Timothy W. Juliano
Fernando Szasdi-Bardales
Neil P. Lareau
Kasra Shamsaei
Branko Kosović
Negar Elhami-Khorasani
Eric P. James
Hamed Ebrahimian
Following the destructive Lahaina Fire in Hawaii, our team has modeled the wind and fire spread processes to understand the drivers of this devastating event. The results are in good agreement with observations recorded during the event. Extreme winds with high variability, a fire ignition close to the community, and construction characteristics led to continued fire spread in multiple directions. Our results suggest that available modeling capabilities can provide vital information to guide decision-making and emergency response management during wildfire events.
- Article
(6028 KB) - Full-text XML
- BibTeX
- EndNote


The wildland urban interface (WUI) fire that destroyed the town of Lahaina, HI, on 8–9 August 2023 ranks as the deadliest fire in the past 100 years in the USA. As of 22 September, nearly 100 lives were lost with 22 people missing (Maui Police Department, 2023), and about 2200 structures were damaged or destroyed with an estimated rebuilding cost of USD 5.5 billion (University of Hawai'i News, 2023). The large-scale weather conditions during the event were characterized by a high-pressure region northeast of Maui and Hurricane Dora to the south, creating strong east-to-west winds impinging on Maui and, thus, a favorable environment for a downslope windstorm along the island's lee (west-facing) slopes. The goal of this brief communication is to provide physical insight into the meteorological drivers and fire spread processes leading to this tragedy. Specifically, we show the following:
-
A severe downslope windstorm with more than 30 m s−1 sustained winds drove the initial east-to-west fire spread into and through Lahaina.
-
Subsequent fire spread to the north, south, and east was driven by the inland migration of a hydraulic jump and associated turbulent flow, causing highly variable fire spread through the built environment.
-
A combination of fire spotting due to high winds, construction types, and building density in the region led to fast fire spread inside the community.
Combined, the fire's initial rapid westerly spread and subsequent lateral spread conspired to make it challenging to predict the fire behavior and make decisions related to evacuation and response.
-
We use the Weather Research and Forecasting (WRF) model (Skamarock et al., 2019) initialized from High-Resolution Rapid Refresh (HRRR; Dowell et al., 2022) analysis fields to simulate the downslope wind storm. The model is configured using two domains, with the outer and inner domains resolved at 900 and 100 m horizontal grid cell spacing and covering regions of 162 and 36 km2, respectively. The inner domain, centered on west Maui, is run in large-eddy simulation (LES) mode, allowing it to explicitly resolve the dominant scales of turbulence.
-
We subsequently use the wind fields extracted from WRF-LES at 15 min intervals to drive the Streamlined Wildland-Urban Interface Fire Tracing (SWUIFT) model for urban fire spread (Masoudvaziri et al., 2021). The SWUIFT model captures both near-field and far-field transport mechanisms of fire spread (i.e., radiation and fire spotting) between buildings and vegetation inside a community. SWUIFT is selected to simulate the fire spread considering that the fire ignition at Lahaina is close to the community (i.e., urban area), while well-established fire models have been developed with natural vegetation as the primary fuel. SWUIFT operates with a 5 min temporal resolution and a 10 m grid spacing. An area of about 9.3 ha, east of Lahainaluna Road and the Lahaina Bypass, is ignited inside vegetation to initiate the simulation. This area is close to the location where a flareup of the Lahaina Fire was reported to have occurred before 15:30 (County of Maui, 2023).
WRF and SWUIFT are, respectively, well-validated models for simulating downslope windstorm-driven fires and WUI fire spread. The models' capabilities have been recently demonstrated simulating the Marshall Fire (Juliano et al., 2023), the Tubbs Fire (Masoudvaziri et al., 2023), and the Camp Fire (Shamsaei et al., 2023; Szasdi-Bardales et al., 2024), to name a few. The fire spread simulation does not consider the effects of structure hardening and suppression, with the latter likely not a factor during the event given the extreme fire weather conditions. The wind and fire spread simulations focus on the events of 8 August 2023, when the fire initiated and spread in Lahaina, and we report all times according to the local Hawaii–Aleutian time zone.
3.1 Meteorological drivers
Figure 1 shows the flow fields before and during the fire's active burning to highlight the evolution of the atmospheric vertical structure and near-surface winds. Because the flow is turbulent and our simulation is a single realization of the event (rather than, say, an ensemble), we use time averages rather than single snapshots to capture the important changes in the location of flow features (e.g., the mean location of the hydraulic jump) as they pertain to the evolution of fire. These data show the following:
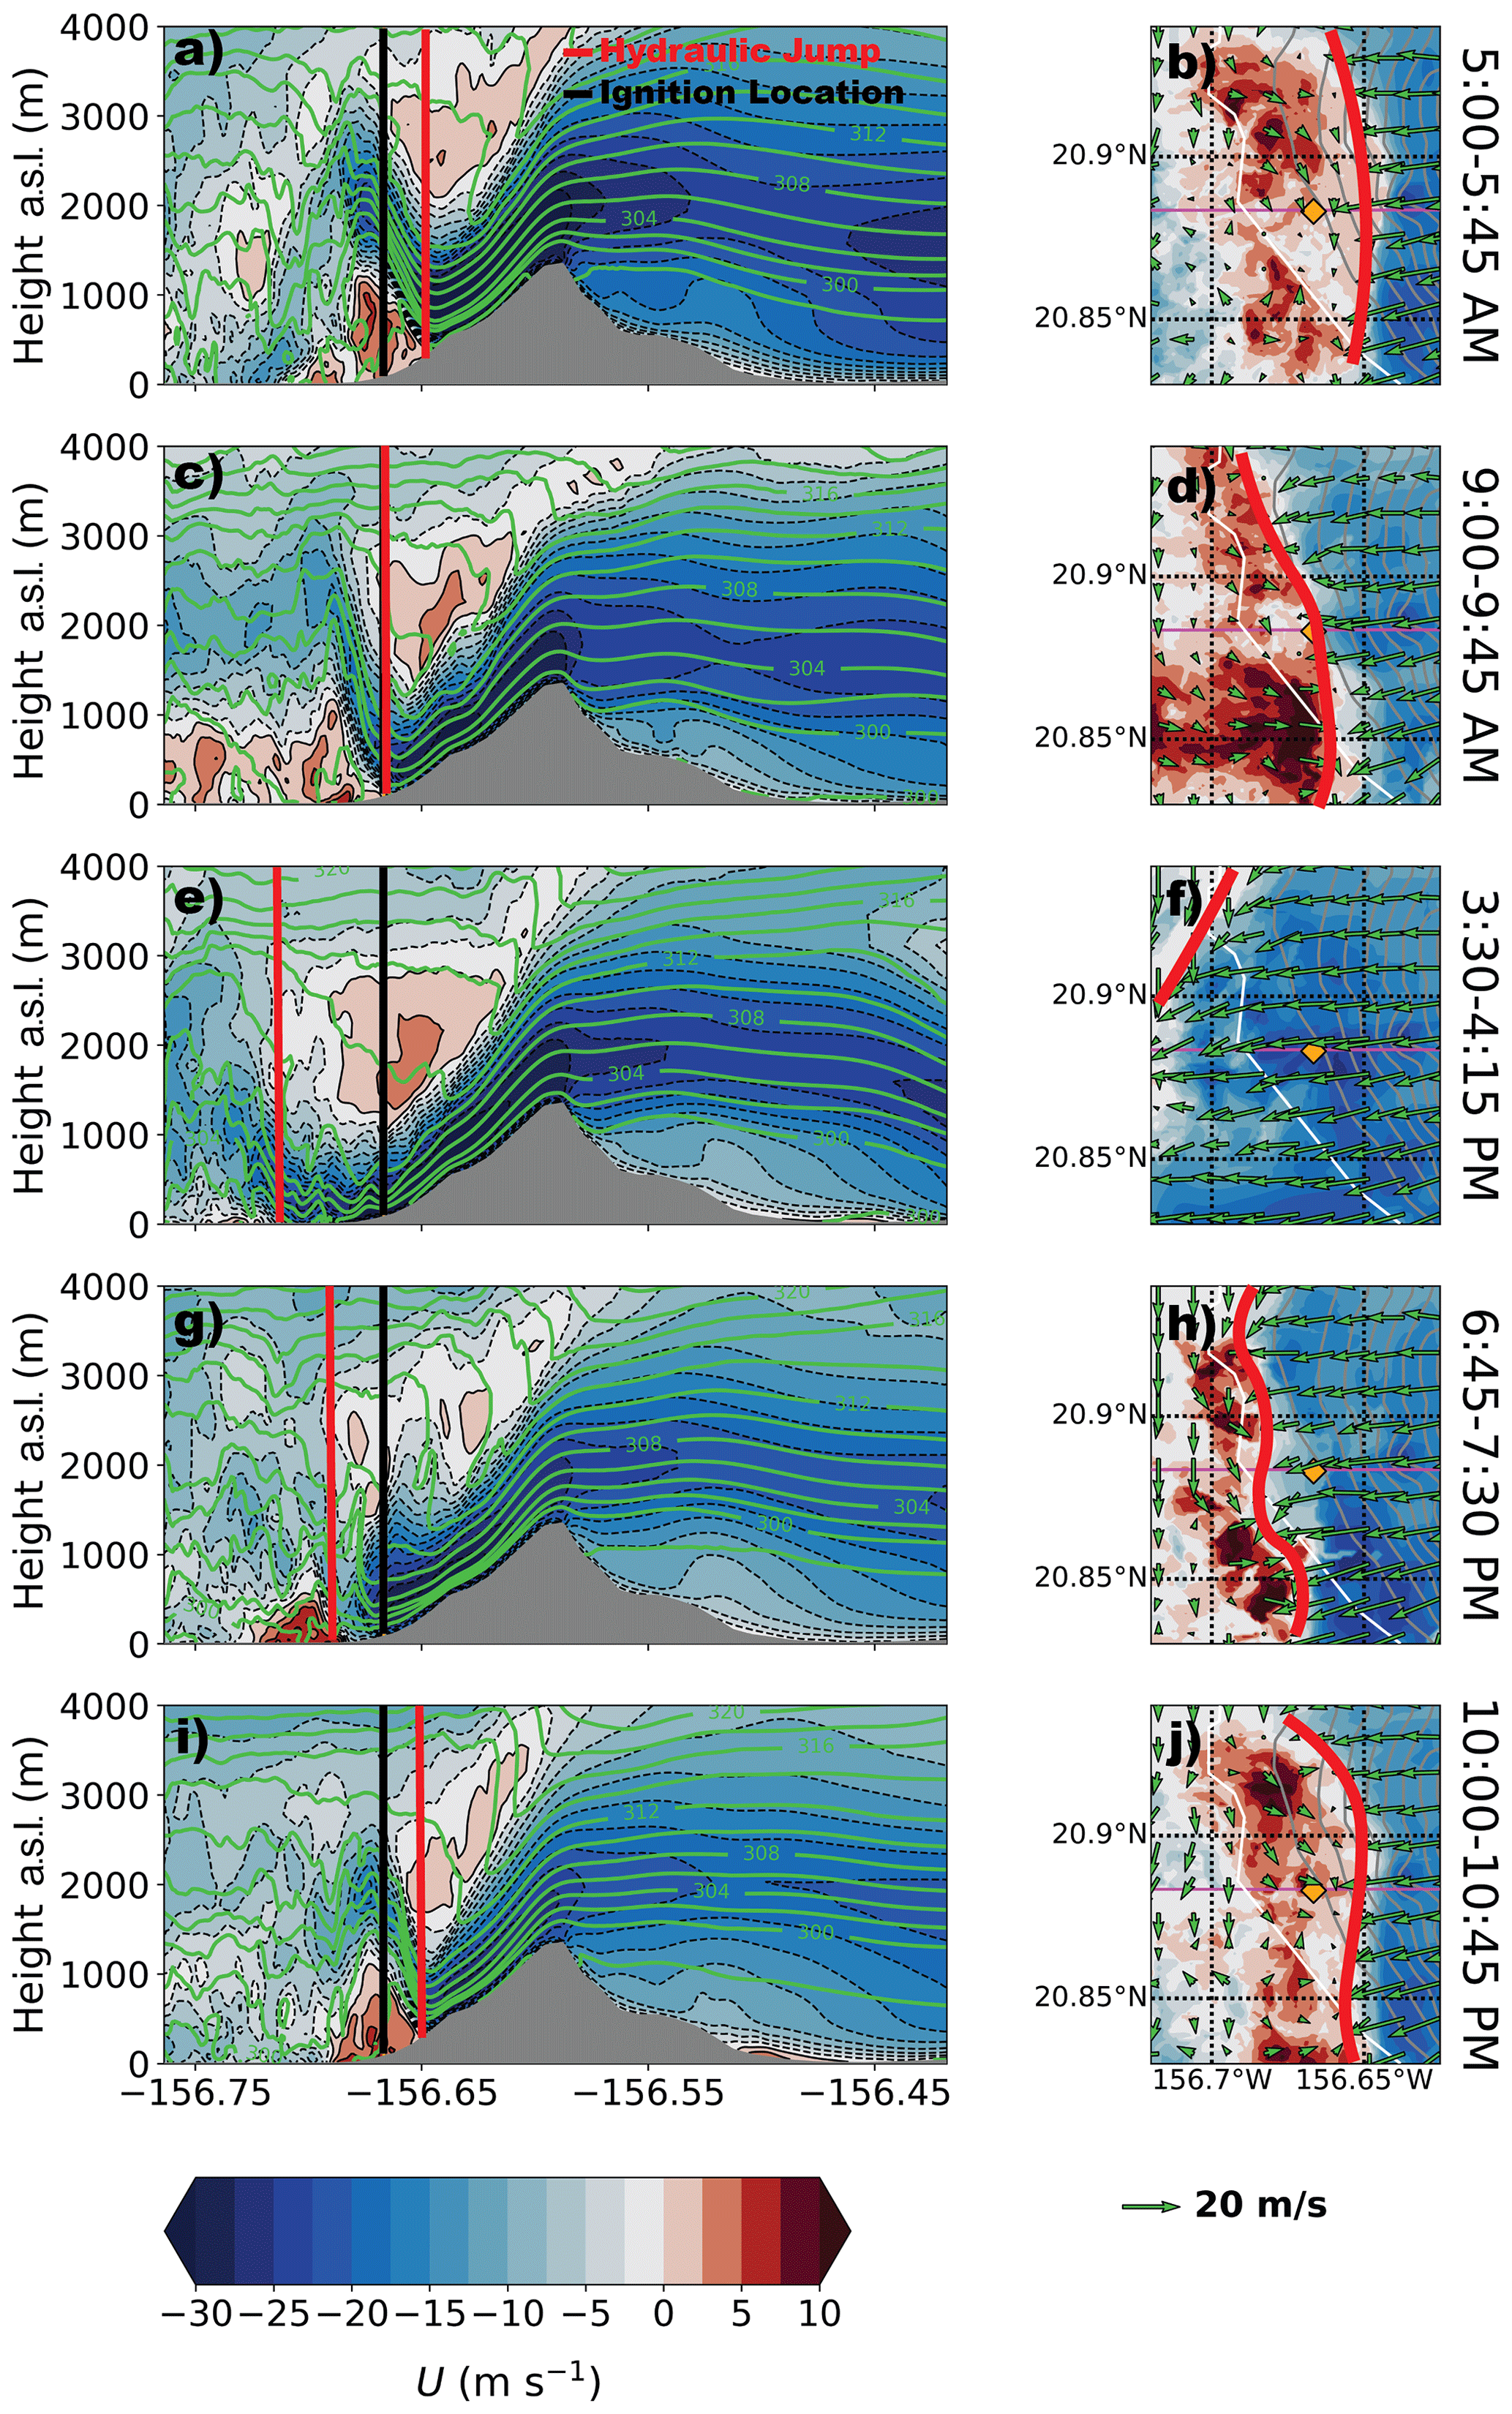
Figure 1WRF-LES results showing the U-wind component at various times during the event. (a, c, e, g, i) Vertical cross-sections slicing east–west through Lahaina (along ∼ 20.88∘ N). Color-filled contours show the U wind according to the colorbar, and green contours show the potential temperature. The terrain is color filled in gray, and the approximate location of the fire ignition (−156.667∘ W) is shown by the vertical black line. (b, d, f, h, j) X–Y plan views of the U wind (color-filled according to the same colorbar) and wind vectors (speed according to the key) at 10 m a.s.l. The white line marks the coastline, while the gray contours show the elevation at 100 m intervals. The approximate location of the fire ignition (20.883∘ N, −156.667∘ W) is shown by the orange diamond, and the magenta line shows the cross-section location. The approximate location of the hydraulic jump and flow reversal in all panels is shown with a red line. All fields are time-averaged according to the displayed time periods.
-
On the morning of the fire (05:00–05:45), strong winds (> 30 m s−1) flow down the western slope of Pu'u Kukui toward Lahaina (black line, Fig. 1) but detach from the surface in a “hydraulic” jump (red line, Fig. 1a, b) before reaching the town. Drivers for these downslope winds and the hydraulic jump are the well-understood interaction of an approaching stable flow to a topographic barrier along with a self-induced critical layer (e.g., Durran and Klemp, 1987). The critical layer traps energy near the surface. It is self-induced in that the upstream wind profile does not have a flow reversal with height, and the observed flow reversal (i.e., positive zonal winds above the plunging flow) is thus inferred to result from wave breaking processes. Approximately two-thirds of the way down the slope, WRF-LES also simulates regions of low-level reversed flow (red contours), coincident with the initial development of the hydraulic jump. Near the jump region, the mean kinetic energy contained in the fast-moving flow is converted into turbulence kinetic energy (e.g., Ball, 1956), leading to a highly variable low-level flow field.
-
By 09:00–09:45, the leading edge of the downslope winds and the hydraulic jump (red line, Fig. 1c, d) moves westward and closer to the town of Lahaina, near the location of the presumed ignition (County of Maui, 2023). This transition marks the onset of extreme winds capable of driving extreme fire spread. By mid-afternoon (15:30–16:15), during the initial fire spread phase, the leading edge of the strong downslope flow extends to just offshore from Lahaina (red line, Fig. 1e, f). The resulting downslope windstorm places the strongest winds (> 35 m s−1) just east of downtown Lahaina, near the location of the presumed ignition (County of Maui, 2023). The attached flow field means that coherent near-surface sustained winds of ∼ 30–35 m s−1 affect much of the town, likely accounting for the video and photographic documentation of downed trees and power lines along with structure damage prior to the fire's arrival. Unfortunately, there are no known wind observations within the region of interest with which to compare these simulated results. The attached flow is the driver for the initial northeast–southwest fire spread through downtown Lahaina and eventual arrival at the coast.
-
Starting around 18:45, the location of the hydraulic jump begins to retrogress, now moving back to the east toward Lahaina (Fig. 1g, h). During the following nighttime hours (22:00–22:45), the location of the hydraulic jump continues to move inland (i.e., eastward), retreating partially up the slope of Pu'u Kukui (red line Fig. 1i, j). This placed Lahaina in the turbulent rotor region beneath the jump, with mean winds reversing, now flowing from the west-to-east in contrast with the earlier period of strong east-to-west flow during the ignition. The mean-flow reversal and extreme variability of the wind are, as we show in the next section, drivers of the fire spread during the second half of the fire.
3.2 Fire spread
Figure 2 shows the results of SWUIFT's simulation driven by the WRF-LES wind field. Since the fire spread evolves more rapidly than the changes in the background flow field (e.g., Fig. 1), the results of the fire spread focus on a narrow time window of 16:30–20:30. The simulation of fire spread indicates that the initial fire run, from 15:30–16:30, progresses in a narrow along-wind path from the ignition location to the oceanfront (Fig. 2a). The fire moves from vegetation (dark green shading) to structures (red and blue) and continues to burn the structures, including those on Front Street between Baker Street and Papalaua Street. At 17:30 and 18:30 (Fig. 2b, c), the fire front slowly widens in the across-wind direction, burning structures to the north and south of the initial along-wind run. By 19:30, the effects of the hydraulic jump's retrogressive migration (e.g., Fig. 1g, h) and turbulent flows are noticeable, causing accelerated fire spread toward the north, south, and east (Fig. 2d). The change in winds during this time transformed what had been “flanking and backing fire” into “episodic head fire runs” in all directions. The results at 20:30 (Fig. 2e) show that the continued retrogression of the hydraulic jump facilitated the fire reaching structures in the southern portion of Lahaina while also continuing with its northward expansion.
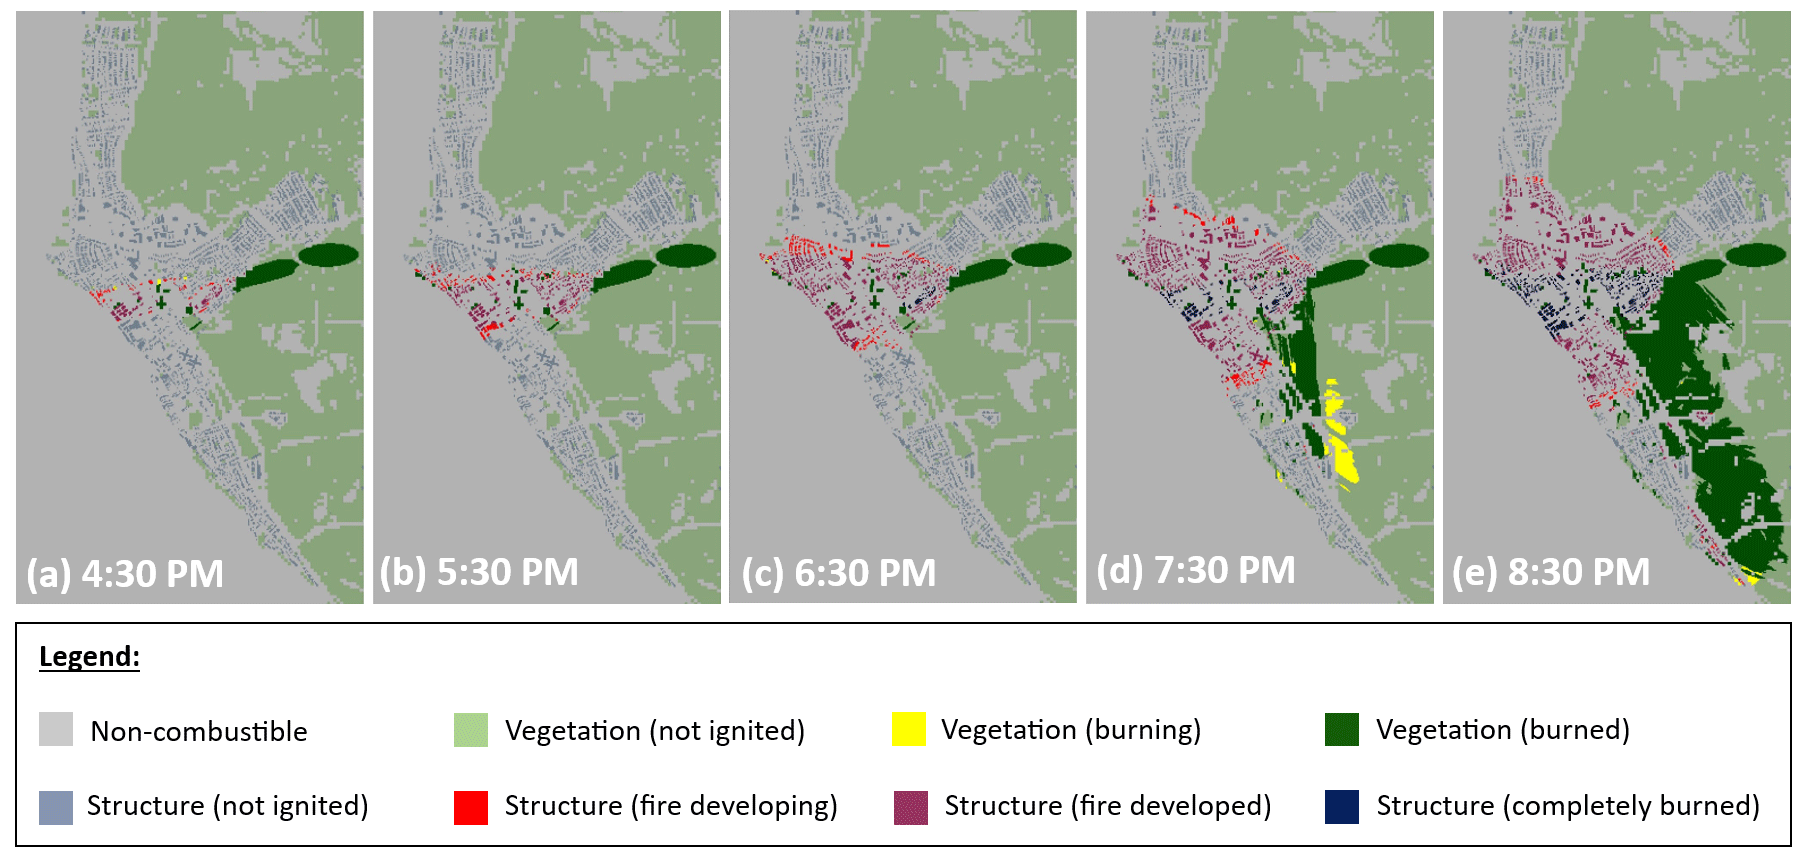
Figure 2(a–e) SWUIFT simulation results at regular time intervals showing fire spread inside Lahaina, HI, on 8 August 2023. The colors indicate non-combustible areas (e.g., roadways), the status of vegetation (not ignited, burning, burned), and structures (not ignited, fire developing, fire developed, completely burned).
The simulation results are in good agreement with observations from witness reports and recorded videos. For example, a video shows the town's historic Front Street on fire at 17:19 (Bogel-Burroughs et al., 2023), records indicate that people close to Front Street and Papalaua Street jump into the ocean before 18:00 (Alfonseca, 2023; AP News, 2023), and northern Lahaina begins to burn at around 19:30 (AP News, 2023), etc. Overall, based on the model results, wind-driven fire spotting causes the fire to jump across the community and radiation leads to fire spread between closely spaced structures. Lack of structure hardening in parts of the community, especially inside the historic town, increases vulnerability and the likelihood of ignition.
Figure 3 shows the fire perimeters predicted by the SWUIFT simulation at 1 h intervals until 20:30 against the final fire perimeter reported after the incident (Pacific Disaster Center, 2023). Most of downtown Lahaina and the impacted area to the south is ignited by 20:30. It can be hypothesized that the fire continued to spread to the north after 20:30.
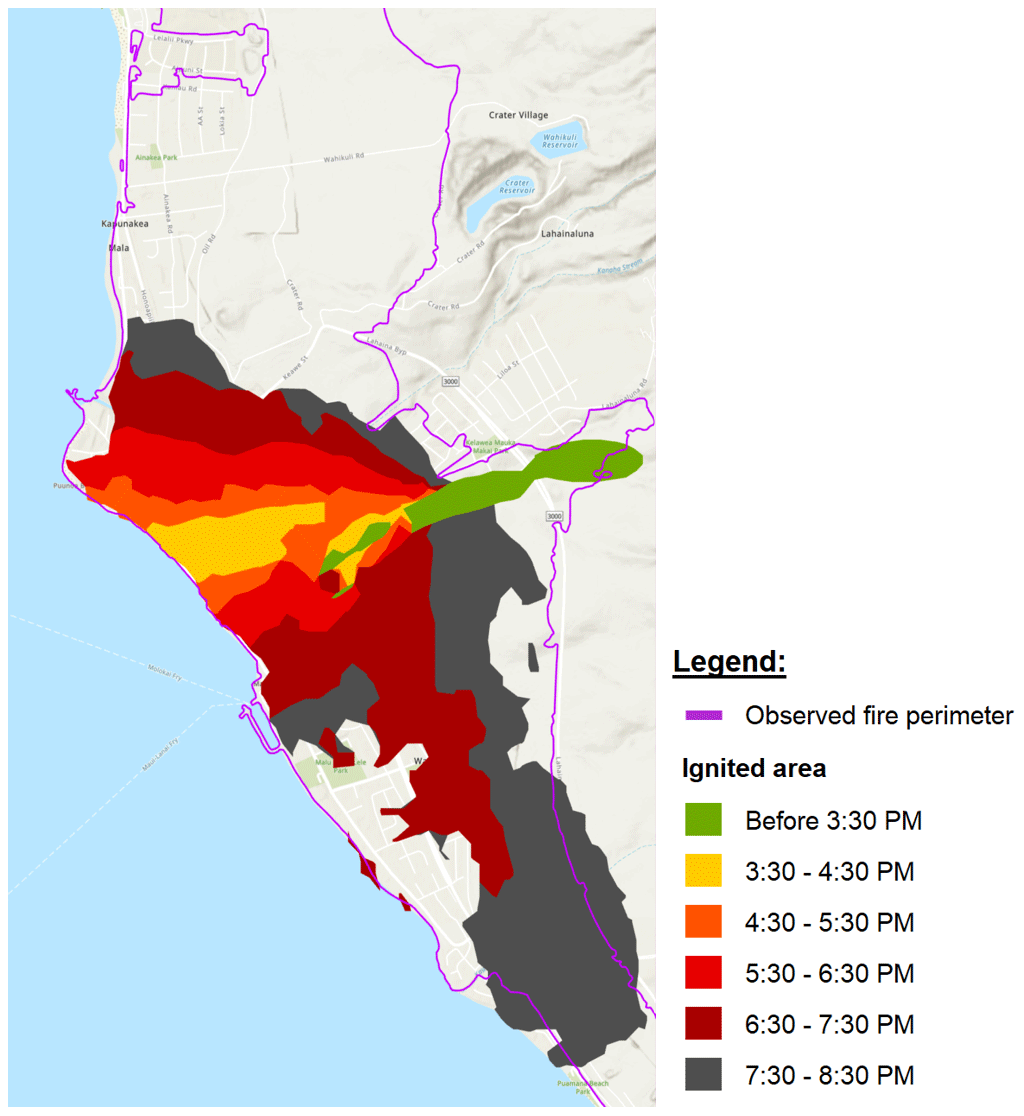
Figure 3Fire perimeters from the SWUIFT simulation at 1 h intervals compared against the observed final fire perimeter.
The meteorological drivers and fire spread processes are one factor in making the Lahaina Fire so deadly and destructive. The extreme winds (> 35 m s−1) made escape from the initial fire run challenging, especially considering the numerous downed trees and power lines. The subsequent, and rather abrupt, shift in the winds to onshore (westerly) and extreme variability was particularly insidious in that it allowed continued fire spread in all directions, and thus, those fleeing the initial east-to-west run did not have a safe haven apart from the ocean. In other words, it was not a simple situation of moving out of the path of the fire. While previous studies have highlighted the role of downslope windstorms in driving fire into the built environment (e.g., Nauslar et al., 2018; Mass and Ovens, 2019; Abatzaglou et al., 2023), the somewhat unique aspect of this case is the subsequent role of the hydraulic jump and turbulent flow in impacting the fire spread after the initial run. The fire spread resulting from a highly turbulent region under the hydraulic jump is irregular and, therefore, harder to plan for. Similar processes appear to have been at play during the Marshall Fire, wherein the location of the hydraulic jump may have impacted the fire spread characteristics (Juliano et al., 2023). While the Marshall Fire ignited several kilometers away from the built environment, leaving little warning time before the fire spread into the nearby communities, the Lahaina Fire ignited within the built environment. These two cases contrast with other cases where the fire burns inside the wildland for an appreciable time before reaching a WUI area (e.g., Tubbs and Camp Fires in California). There are many additional aspects of this tragedy that require investigation, including the role of building construction types, evacuation planning and orders, blocked egress, and, sadly, the impact of marginalized population demographics on the ability to flee to safety. As has occurred in other high-impact fires, many of the fire's victims were elderly.
Although further systematic studies are essential to improve simulation accuracy and validate with the actual fire behavior and wind speeds, the results presented herein demonstrate our ability to characterize reasonably well the disaster that transpired on the evening of 8 August 2023 in Lahaina. Furthermore, the models used in this study can produce such predictions fast enough to be useful for decision-making. While the modeling capabilities exist in the research environment, developing an active-fire decision-support technology platform to streamline data sources and integrate data with models to yield actionable information in the near-real time is currently missing. Such a technology platform requires the capability to monitor and identify the ignition and fire perimeters in near-real time. It, moreover, needs to collect and process data identifying the weather and fire spatial domain (e.g., meso- or synoptic-scale forcing), wildland fuel characteristics, WUI domain and fuel characteristics, evacuation routes, and community and social demographics. Once the domains and inputs are defined, the next step is to simulate ensemble scenarios of fire spread in the wildland and WUI to account for uncertainties and process the outcomes into useful information that can inform decision-making for various stakeholders. The process is computationally intensive and requires cloud computing and advanced data communication capabilities.
While the SWUIFT simulation for Lahaina took 30 min to run, the WRF simulation for this study took 12 h wall-clock time to simulate about 38.5 h of the event, i.e., almost 3:1 real-to-simulated time ratio. It is important to note that the WRF simulation was run on 288 CPU processors on the U.S. NSF NCAR-Wyoming Cheyenne Supercomputer. For operational purposes, it would be possible to further optimize and streamline simulations to achieve 5:1 or 6:1 real-to-simulated time ratio on currently available CPU-based platforms.
In summary, timely dissemination of information on potential extreme fire behavior to authorities can facilitate informed decision-making, bolster emergency response management, and preserve human lives. The Lahaina Fire and presented results underscore the critical technology deficit that currently exists in wildfire management, which places fire response in a reactive position, regularly lagging behind the fight due to a lack of situational awareness and predictive capabilities. Development of a unified active-fire decision support system, capable of collecting, integrating, and infusing data sources, as well as providing faster-than-real-time physics-informed predictive capabilities, can revolutionize the landscape of fire response and empower our future of coexisting with wildfires.
The data used to make the figures in the paper can be requested from the first or corresponding authors.
NPL, TWJ, BK, NEK, and HE contributed to the conceptualization. TWJ, FSB, EPJ, and KS conducted data curation and formal analysis. NPL, TWJ, FSB, and NEK prepared the visualizations. NPL, TWJ, BK, FSB, NEK, and HE wrote the manuscript.
The contact author has declared that none of the authors has any competing interests.
Publisher’s note: Copernicus Publications remains neutral with regard to jurisdictional claims made in the text, published maps, institutional affiliations, or any other geographical representation in this paper. While Copernicus Publications makes every effort to include appropriate place names, the final responsibility lies with the authors.
The U.S. National Science Foundation (NSF) National Center for Atmospheric Research (NCAR) is a major facility sponsored by the NSF under cooperative agreement no. 1852977. We would like to acknowledge the use of computational resources (https://doi.org/https://doi.org/10.5065/D6RX99HX (Computational and Information Systems Laboratory, 2019)) at the NCAR-Wyoming Supercomputing Center provided by the NSF and the State of Wyoming and supported by NCAR’s Computational and Information Systems Laboratory.
This work is supported through the National Science Foundation’s Leading Engineering for America’s Prosperity, Health, and Infrastructure (LEAP-HI) program by grant no. CMMI-1953333. The opinions and perspectives expressed in this study are those of the authors and do not necessarily reflect the views of the sponsor.
This paper was edited by Mario Parise and reviewed by two anonymous referees.
Abatzoglou, J. T., Kolden, C. A., Williams, A. P., Sadegh, M., Balch, J. K., and Hall, A.: Downslope wind-driven fires in the western United States, Earths Future, 11, e2022EF003471, https://doi.org/10.1029/2022EF003471, 2023.
Alfonseca, K.: Timeline: How the deadly wildfires took over Maui day by day, ABC News, https://abcnews.go.com/US/timeline-deadly-wildfires-maui-day-day/story?id=102253075 (last access: 31 October 2023), 2023.
AP News: This is how the Lahaina wildfire unfolded, The Associated Press, https://apnews.com/us-news/interactive (last access: 31 October 2023), 2023.
Ball, F. K.: The theory of strong katabatic winds, Aust. J. Phys., 9, 373–386, https://doi.org/10.1071/ph560373, 1956.
Bogel-Burroughs, N., Kovaleski, Serge F., Hubler, S., and Mellen, R.: How fire turned Lahaina into a death trap, The New York Times, https://www.nytimes.com/2023/08/15/us/hawaii-maui-lahaina-fire.html?searchResultPosition=3 (last access: 31 October 2023), 2023.
Computational and Information Systems Laboratory: Cheyenne: HPE/SGI ICE XA System (U.S. NSF NCAR Community Computing). Boulder, CO: U.S. National Science Foundation National Center for Atmospheric Research, https://doi.org/10.5065/D6RX99HX, 2019.
County of Maui: Press releases: Lahaina fire flareup forces Lahaina Bypass road closure; shelter in place encouraged, https://www.mauicounty.gov/CivicAlerts.aspx?AID=12632 (last access: 31 August 2023), 2023.
Dowell, D. C., Alexander, C. R., James, E. P., Weygandt, S. S., Benjamin, S. G., Manikin, G. S., Blake, B. T., Brown, J. M., Olson, J. B., Hu, M., Smirnova, T. G., Ladwig, T., Kenyon, J. S., Ahmadov, R., Turner, D. D., Duda, J. D., and Alcott, T. I.: The High-Resolution Rapid Refresh (HRRR): An hourly updating convection-allowing forecast model. Part I: Motivation and system description, Weather Forecast., 37, 1371–1395, 2022.
Durran, D. R. and Klemp, J. B.: Another look at downslope winds. Part II: Nonlinear amplification beneath wave-overturning layers, J. Atmos. Sci., 44, 3402–3412, 1987.
Juliano, T. W., Lareau, N., Frediani, M. E., Shamsaei, K., Eghdami, M., Kosiba, K., Wurman, J., DeCastro, A., Kosović, B., and Ebrahimian, H.: Toward a better understanding of wildfire behavior in the wildland-urban interface: A case study of the 2021 Marshall Fire, Geophys. Res. Lett., 50, e2022GL101557, https://doi.org/10.1029/2022GL101557, 2023.
Masoudvaziri, N., Szasdi Bardales, F. J., Keskin, O. K., Sarreshtehdari, A., Sun, K., and Elhami Khorasani, N.: Streamlined wildland-urban interface fire tracing (SWUIFT): modeling wildfire spread in communities, Environ. Model. Softw., 143, 105097, https://doi.org/10.1016/j.envsoft.2021.105097, 2021.
Masoudvaziri, N., Elhami Khorasani, N., and Sun, K.: Toward probabilistic risk assessment of wildland-urban interface communities for wildfires, Fire Technol., 59, 1379–1403, 2023.
Maui Police Department: Release of information from the Maui Police Department as of 9/22/2023, http://www.mauipolice.com/uploads/1/3/1/2/131209824/092223_mpd_credible_list.pdf (last access: 31 October 2023), 2023.
Mass, C. F. and Ovens, D.: The Northern California wildfires of 8–9 October 2017: The role of a major downslope wind event, B. Am. Meteorol. Soc., 100, 235–256, 2019.
Nauslar, N. J., Abatzoglou, J. T., and Marsh, P. T.: The 2017 North Bay and Southern California fires: A case study, Fire, 1, 18, https://doi.org/10.3390/fire1010018, 2018.
Pacific Disaster Center: Damage Assessment Release as of 8/17/2023, https://www.pdc.org/maui-wildfire/ (last access: 31 November 2023), 2023.
Shamsaei, K., Juliano, T. W., Roberts, M., Ebrahimian, H., Kosovic, B., Lareau, N. P., and Taciroglu, E.: Coupled fire-atmosphere simulation of the 2018 Camp Fire using WRF-Fire, Int. J. Wildland Fire, 32, 195–221, 2023.
Skamarock, W. C., Klemp, J. B., Dudhia, J., Gill, D. O., Liu, Z., Berner, J., Wang, W., Powers, J. G., Duda, M. G., Barker, D. M., and Huang, X. Y.: A description of the advanced research WRF version 4, NCAR Tech. Note NCAR/TN-556+ Str 145, https://doi.org/10.5065/1dfh-6p97, 2019.
Szasdi-Bardales, F., Shamsaei, K., Lareau, N., Juliano, T.W., Kosovic, B., Ebrahimian, H., and Elhami-Khorasani, N.: Integrating dynamic wildland fire position input with a community fire spread simulation: a case study of the 2018 Camp Fire, Fire Safety Jorunal, 143, 104076, https://doi.org/10.1016/j.firesaf.2023.104076, 2024.
University of Hawai'i News: Estimated $5.5B needed to rebuild from Lāhainā fire, https://www.hawaii.edu/news/2023/08/14/estimated-5-5b-needed-rebuild-lahaina/ (last access: 31 August 2023), 2023.