the Creative Commons Attribution 4.0 License.
the Creative Commons Attribution 4.0 License.
 | 04 Sep 2024
Demonstrating the use of UNSEEN climate data for hydrological applications: case studies for extreme floods and droughts in England
Nick Dunstone
Gillian Kay
Victoria A. Bell
Jamie Hannaford
Meteorological and hydrological hazards present challenges to people and ecosystems worldwide, but the limited length of observational data means that the possible extreme range is not fully understood. Here, a large ensemble of climate model data is combined with a simple grid-based hydrological model to assess unprecedented but plausible hydrological extremes in the current climate across England. Two case studies are selected – dry (summer 2022) and wet (autumn 2023) – with the hydrological model initialised from known conditions and then run forward for several months using the large climate ensemble. The modelling chain provides a large set of plausible events including extremes outside the range from use of observed data, with the lowest flows around 28 % lower on average for the summer 2022 drought study and the highest flows around 42 % higher on average for the autumn 2023 flood study. The temporal evolution and spatial dependence of extremes are investigated, including the potential timescale of the recovery of flows to normal levels and the chance of persistent extremes. Being able to plan for such events could help improve the resilience of water supply systems to drought and improve flood risk management and incident response.
- Article
(8572 KB) - Full-text XML
-
Supplement
(431 KB) - BibTeX
- EndNote


Meteorological and hydrological hazards – storms, floods, and droughts – present challenges to people, infrastructure, and ecosystems globally (Beevers et al., 2022; Mokhtari et al., 2023). The relatively limited period of available observational data means that the possible range of extremes of such events is often not fully understood. For example, Thompson et al. (2017) show that in SE England there is a 7 % chance of exceeding the current observed rainfall record in at least one month in any given winter, with a 34 % chance of breaking a regional record somewhere in England and Wales. Similarly, Kent et al. (2022) investigate plausible summer rainfall extremes, showing an approximately 1 % chance per year of exceeding current daily rainfall records in the UK in the current climate. Chan et al. (2023) show an approximately 9 % chance of a summer month with lower rainfall than the observed driest summer in SE England in the current climate. When such unprecedented events do inevitably occur, they can lead to very severe impacts (Bertola et al., 2023). This is not just because of their unprecedented magnitude but also due to inherent unpreparedness, given that water supply systems, flood infrastructure, and related risk management strategies are typically adapted to historical ranges of variability (Kjeldsen and Prosdocimi, 2016).
One possible way to assess how events may unfold is the use of a so-called “storyline” approach; a storyline is typically defined as a “physically self-consistent unfolding of past events, or of plausible future events or pathways” (Shepherd et al., 2018). This approach has been advocated in the context of future climate change as a way of circumventing the deep uncertainties associated with future climate projections by placing more emphasis on driving factors and plausibility than probability (Shepherd et al., 2018). In this context it has links to so-called H scenarios, which are plausible but high-end scenarios of climate change (Reynard et al., 2017). But storylines can equally be applied in the context of past events by developing plausible counterfactuals, i.e. alternative ways that those events could have unfolded even in the current climate (Sillmann et al., 2021). For example, Chan et al. (2022) developed storylines for the UK drought of 2010–2012 by applying changes to the observed event based on (i) antecedent conditions (applying progressively drier conditions), (ii) temporal sequencing (adding a dry winter before or after the observed event), and (iii) climate change. The results showed the importance of hydrological initial conditions and the vulnerability of catchments in Britain to a “third dry winter”. Such studies can aid preparedness by enabling planning for events similar to, but more extreme than, known events (with known responses and impacts). However, the development of storylines in this way requires expert judgement on plausibility, and on the factors important to the development of a particular event. Possible spatial factors may also be neglected; for example Chan et al. (2022) apply the same storylines for catchments across Britain, treating catchments essentially independently.
The use of large ensembles of climate data can reduce the need for expert judgement and enable spatially consistent analyses and estimation of likelihoods. The extreme winter rainfall study of Thompson et al. (2017) was based on a large ensemble of high-resolution initialised global climate simulations (termed “UNSEEN”, UNprecedented Simulated Extremes using ENsembles), thus “directly sampling more extreme cases than the available observations, allowing the identification of unprecedented rainfall events to assess their likelihood in the real world”. Statistical modelling could also be used to estimate the probability of unprecedented rainfall from observations, and this is increasingly done in practice in UK water resources management using stochastic simulation (e.g. Dawkins et al., 2022). However, the use of a dynamical model is judged to better preserve physical plausibility and spatial dependence (Thompson et al., 2017). Data from either could be used to drive hydrological models to enable subsequent assessment of potentially unprecedented hydrological extremes, but the likely better representation of spatial structures in dynamical models is important if large or multiple (not independent) catchments are being considered. Chan et al. (2024) used a large ensemble of seasonal global model hindcast data to drive catchment-based hydrological models for 16 catchments (plus a groundwater model for 10 boreholes) in the Anglian region of England, and used the summer 2022 drought as a case study to explore plausible storylines of development into 2023. Brunner and Slater (2022) show that pooling reforecast ensemble members of European river flows enables more robust estimates of very extreme flood events (those occurring less than twice in 100 years), with reduced uncertainty bounds compared to observation-based estimates.
Here, an expanded version of the UNSEEN ensemble of Thompson et al. (2017) is used in combination with a simple grid-based hydrological model for Great Britain (GB), to assess unprecedented but plausible hydrological extremes in the current climate. For hydrological modelling, the antecedent conditions (e.g. water stored in the soil and groundwater) are an important factor in subsequent river flows. Thus two case studies are selected, one very dry (summer 2022, associated with a major national-scale drought) and one very wet (autumn 2023, associated with persistent and large-scale flooding), with the hydrological model initialised from known conditions at the start of each case study, then run forward for a number of months using the large ensemble of UNSEEN climate data. The case studies are used to illustrate the potential of the approach to provide unprecedented but plausible temporal and spatial hydrological extremes.
2.1 The UNSEEN climate datasets
The UNSEEN dataset used in this study comes from two hindcast ensembles of the Met Office Decadal Prediction System version 3 (DePreSys3; Dunstone et al., 2016), which is based on the Hadley Centre global coupled model (GCM) HadGEM3-GC2 (Williams et al., 2015). The model has an atmospheric grid resolution of ∼ 60 km in the midlatitudes, and an ocean resolution of 0.25 °. The first ensemble is initialised every 1 November and the second is initialised every 1 May, and each has 40 ensemble members (realisations) but they are run for different lengths of time:
-
16-month periods starting in each November from 1959 up to 2021;
-
11-month periods starting in each May from 1960 up to 2022.
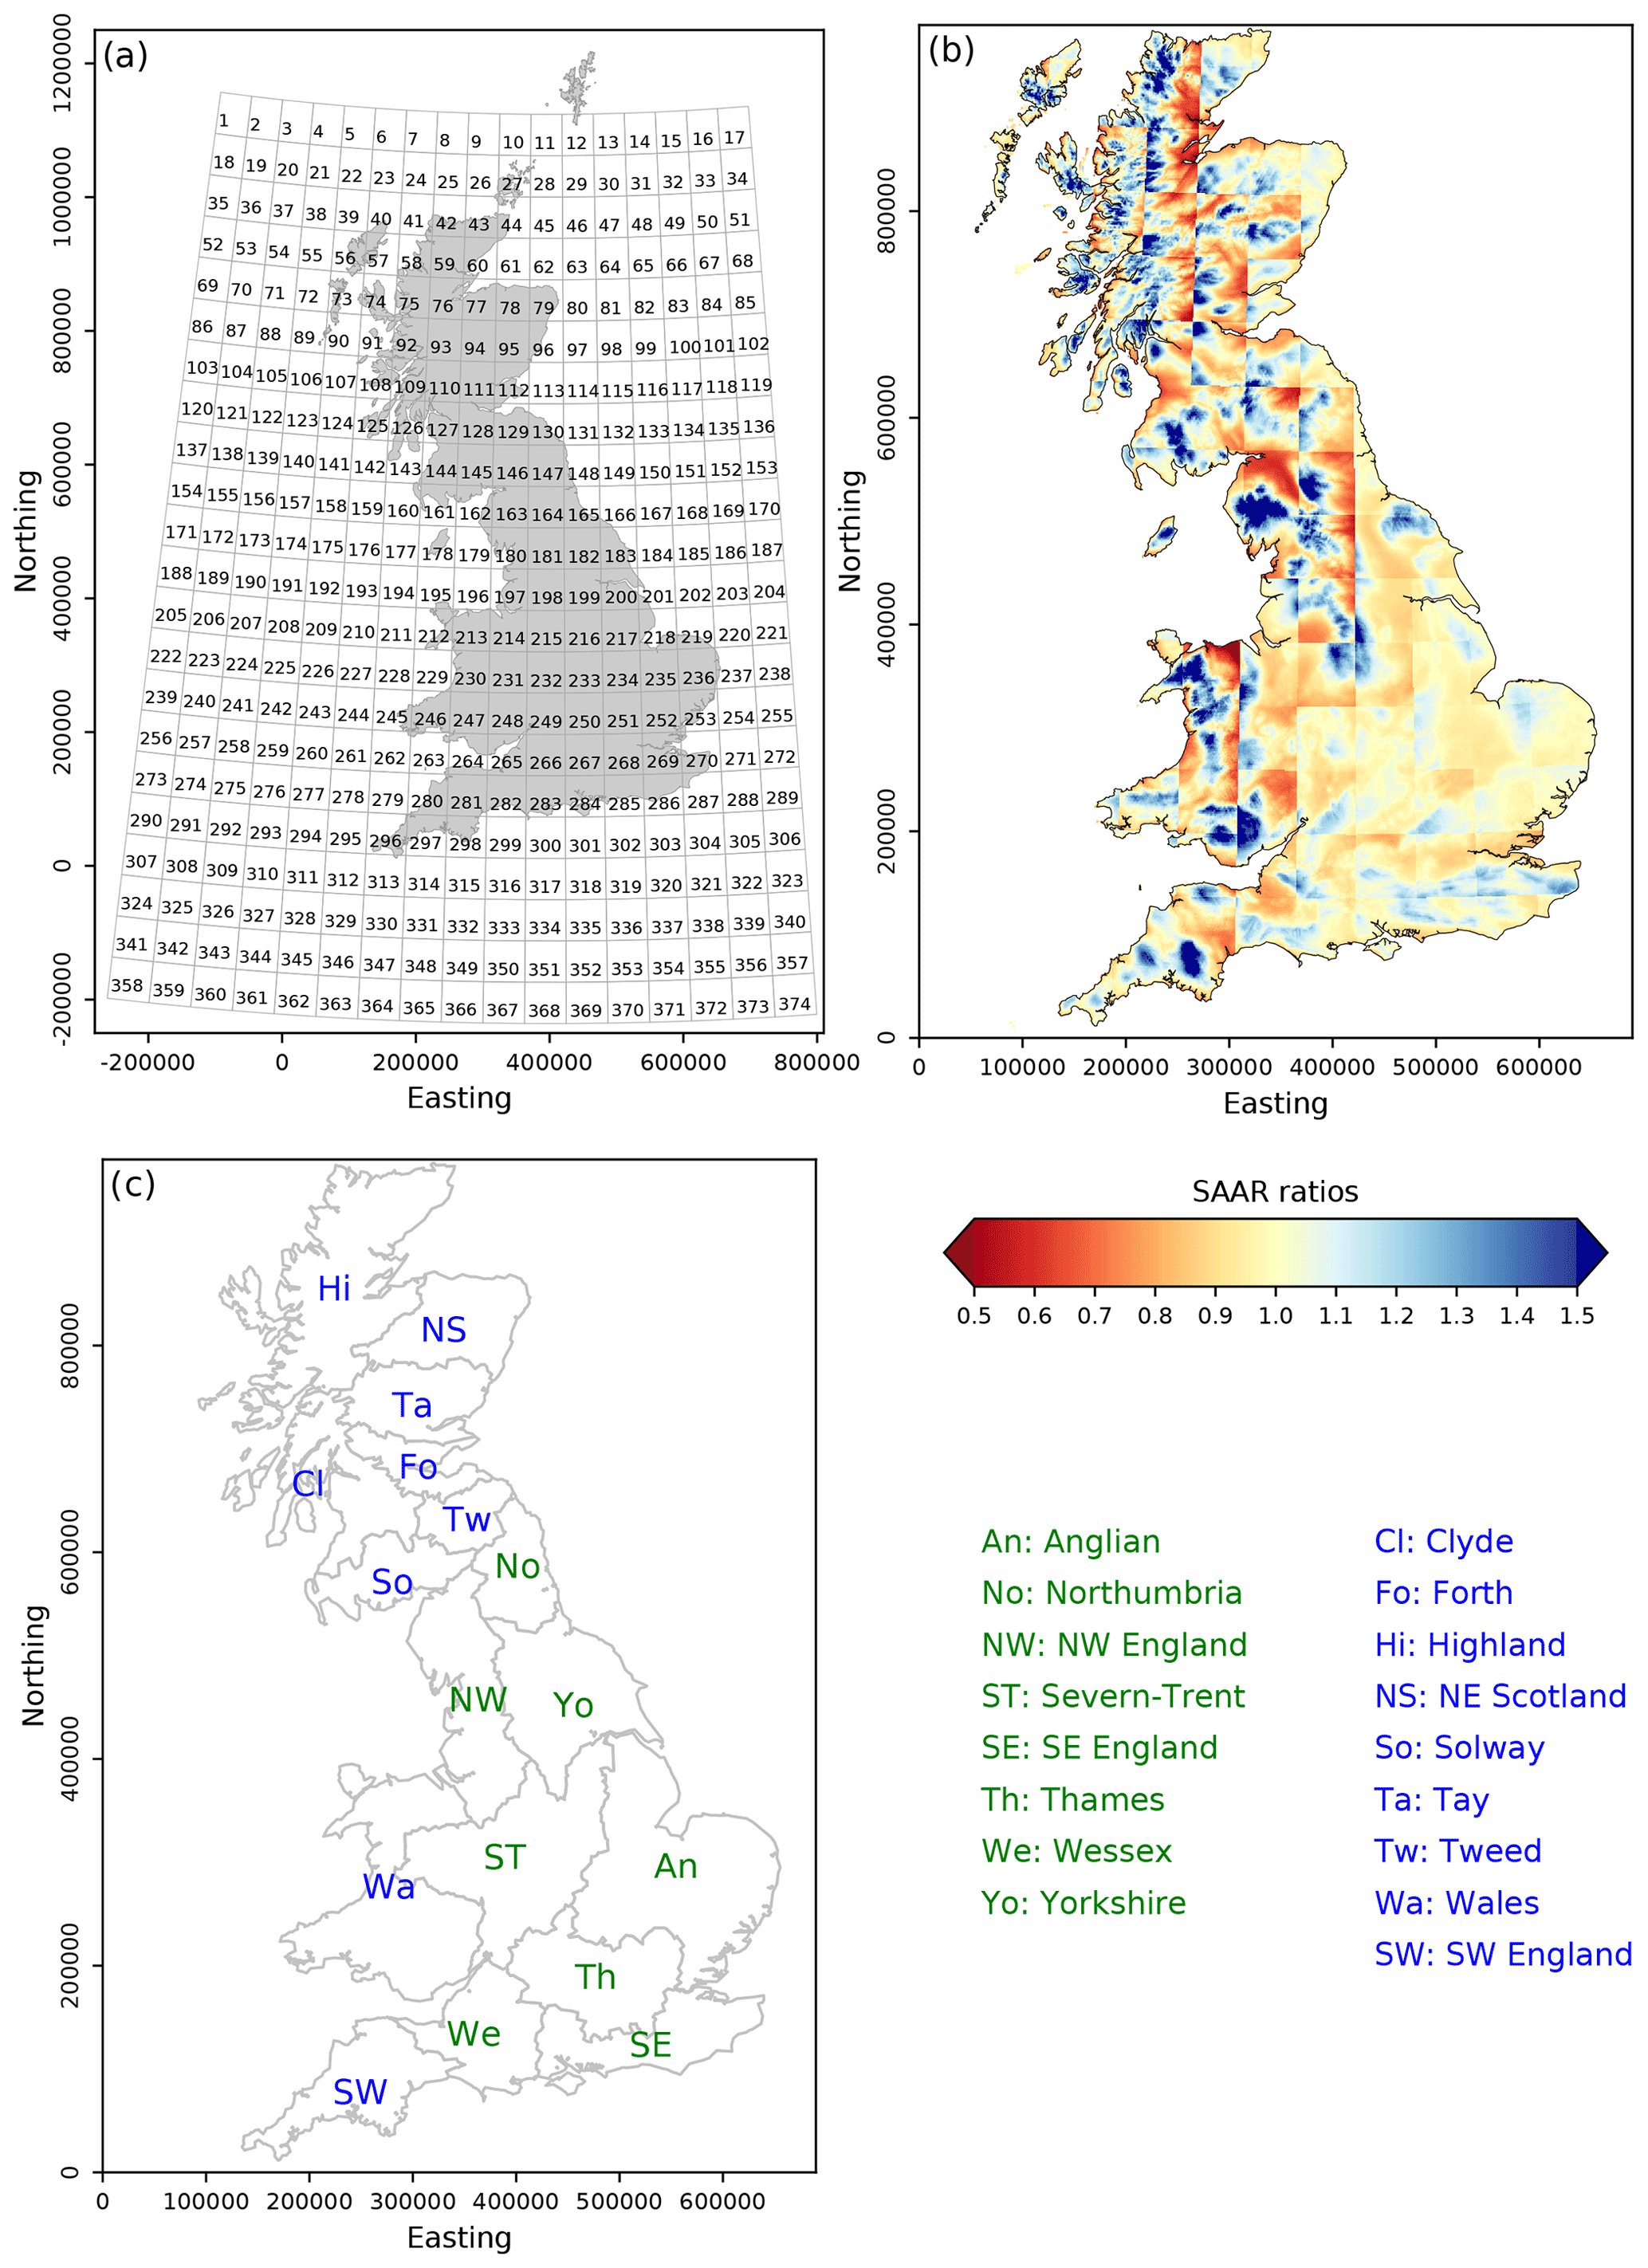
Figure 1(a) Identifying GCM grid boxes on the GB national grid. (b) The standard average annual rainfall (SAAR) ratios used for downscaling GCM rainfall to the 1 km grid. (c) The 17 UK Hydrological Outlook regions, with the eight regions used here on the left-hand list (green) and the rest on the right-hand list (blue).
Differences between ensemble members are solely due to natural variability; i.e. there are no changes to GCM structure or parameterisation. Monthly rainfall rates (mm d−1) are provided on a lat–long grid, for a region covering most of the UK (Fig. 1a). The data for each realisation in an n-month period are considered dependent.
The GCM rainfall data are processed via the two steps below.
-
Bias-corrected using simple monthly factors. Biases in the temporal and spatial patterns of the GCM rainfall data are corrected as simply as possible, using monthly 60 km grids of correction factors. These are derived for each month of the November-initialised and May-initialised data separately (i.e. there are 16 resulting grids of correction factors for the November-initialised runs and 11 for the May-initialised runs), by comparing the GCM monthly mean precipitation across all initialisation years and realisations against monthly mean observed precipitation from HadUK-Grid 1 km data for 1961–2020 (Met Office et al., 2021) averaged up to the GCM grid. The grids of correction factors are then smoothed using a 3 × 3 grid around each cell, with a weight of for the centre cell and for each of the eight surrounding cells (unless any surrounding cell has missing data, in which case its weight is added to that of the centre cell). A similar bias correction is derived for regional climate model (RCM) precipitation data by Kay (2021). Maps of the correction factors are shown in Figs. S1 and S2 in the Supplement; these show that the GCM rainfall is typically too low (correction factor > 1) in August and September but is too high in other months in some parts of the country.
-
Downscaled to the 1 km GB national grid. The hydrological model (Sect. 2.2) requires 1 km inputs, which are derived from the ∼ 60 km lat–long data by identifying the GCM grid box to use for each 1 km grid box (Fig. 1a) and distributing the data non-uniformly over the 1 km grid boxes within each GCM grid box using ratios of 1 km to GCM grid box mean standard average annual rainfall (SAAR) (Bell et al., 2007; Kay et al., 2023b). The SAAR ratios are shown in Fig. 1b; these show greater variation in ratios (and therefore in the downscaled rainfall data) within 60 km grid boxes in the north and west, which are typically hillier, with much less variation in ratios within grid boxes in the flatter south and east. The ratios thus principally indicate topographic effects on spatial rainfall distribution, including rain-shadow effects.
2.2 The hydrological model
Grid-to-Grid (G2G) is a grid-based runoff production and routing model, operating on a 1 km grid at a 15 min time step across Great Britain (Bell et al., 2009). It is used for operational flood forecasting for England, Wales, and Scotland (Price et al., 2012; Cranston et al., 2012) and has been used to estimate the potential future impacts of climate change on river flows across Britain (e.g. Kay et al., 2023a). However, the short time step of the model (required for stability of the routing scheme given the 1 km grid scale) means that runs take an amount of time that is not insignificant. For a seasonal forecasting application, where a relatively large number of runs were required using coarse (temporal and spatial) climate data, a simple monthly water balance model (WBM) was developed, based upon G2G (Bell et al., 2013, 2017).
The WBM uses data from long historical runs of G2G (1 km grids of the long-term means of monthly actual evaporation (AE), flow, and subsurface water storage) as well as information on the network of flow paths used by G2G, and it is initialised using an estimate of subsurface water storage on a 1 km grid across GB, also taken from G2G for the required date. The WBM forms one component of the UK Hydrological Outlook (UKHO; Prudhomme et al., 2017), where it is initialised using a G2G estimate of subsurface water storage derived using the most recent observations of rainfall and potential evaporation (PE) and then run forward, driven by an ensemble of Met Office rainfall forecasts for 1 and 3 months ahead, to provide forecasts of regional mean river flows. The results are combined with those from a number of other forecasting approaches to produce a monthly hydrological outlook for the UK (https://hydoutuk.net, last access: August 2024, https://ukho.ceh.ac.uk, last access: March 2024).
Bell et al. (2017) provide an assessment of the performance of the WBM compared to G2G, driving both with observed 5 km gridded rainfall data (1962–2010) and initialising the WBM from G2G at the start of each month. Regional means of standardised 1 km river flows for 17 regions across GB (those in Fig. 1b), for 1 and 3 months ahead, show correlations of over 0.8 in all cases.
2.3 Applying the climate data – two case studies
As described in Sect. 2.2, the WBM needs to be initialised using an estimate of subsurface water storage on a 1 km grid across GB, which is generally taken from a run of G2G driven by observed rainfall and PE data. Here, the WBM is initialised for two case study events:
-
summer 2022 drought and
-
autumn 2023 flood.
Table 1The time periods covered by the November- and May-initialised UNSEEN climate ensembles, and their use in each case study. The grey boxes indicate UNSEEN data months regarded as spin-up. The vertical green lines indicate the WBM initialisation for each case study (end of July 2022 for the summer 2022 drought study and end of October 2023 for the autumn 2023 flood study).
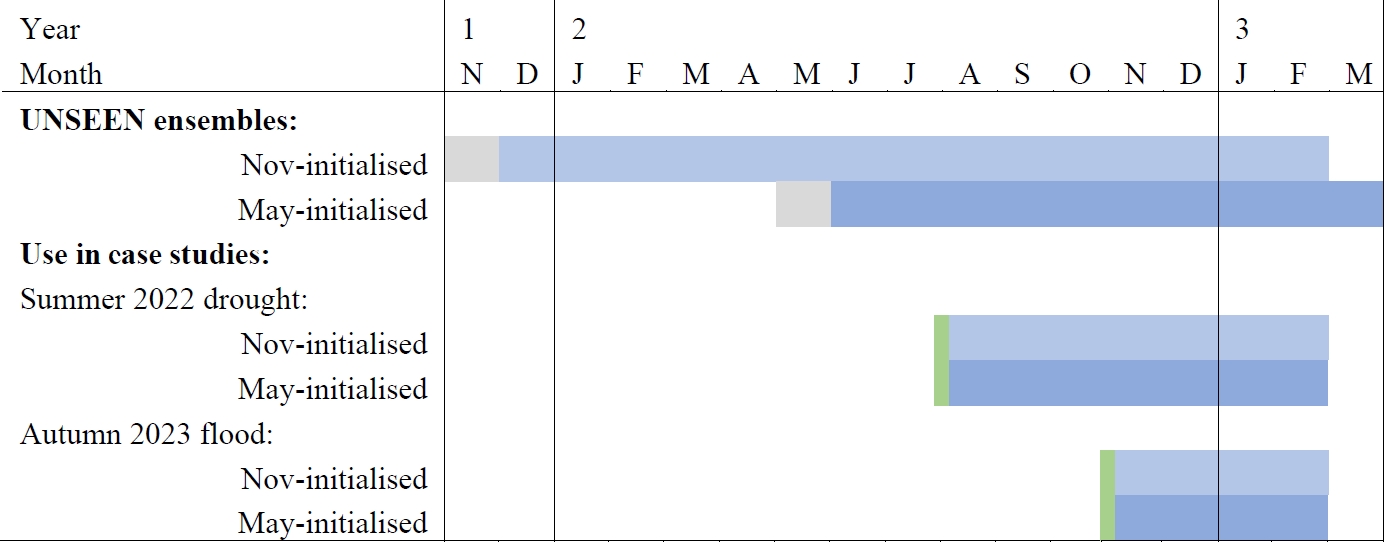
For each case study, the G2G model is run with daily observed data up to the end of the previous month to produce the initial conditions used by the monthly WBM. The observed data consist of 1 km HadUK-Grid precipitation (Met Office et al., 2021) and MORECS PE (Hough and Jones, 1997). Then the WBM is run forward for a number of months using both UNSEEN ensembles for all realisations and all initialisation years (1961–2022), regardless of the year in which the UNSEEN climate data were initialised (hereafter “WBM UNSEEN”; Table 1).
For each case study, the WBM is also run forward for the same period using all years of historical HadUK-Grid 1 km precipitation data (1961–2022), not just the year corresponding to the case study (hereafter “WBM Obs”). This is analogous to the “ensemble streamflow prediction” method used as part of the UKHO (Harrigan et al., 2018), where an ensemble of historical sequences of daily weather data is used to drive a lumped hydrological model from given initial conditions for catchments across the UK.
The use of UNSEEN (and observed) data from all years allows the widest examination of possible subsequent rainfall pathways following summer 2022 and autumn 2023. The relatively long lead times of the UNSEEN data used here (Table 1), and hence the relatively weak predictable UK rainfall signals, result in a large dataset with a wide range of possible outcomes including well-sampled dry (after summer 2022) and wet (after autumn 2023) extreme tails. The WBM Obs ensemble provides a “benchmark” that enables an assessment of the added value of the WBM UNSEEN ensemble.
For droughts, which typically evolve relatively slowly due to accumulated rainfall deficits, the monthly time step of the modelling chain is likely sufficient. Floods can develop and recede much more quickly, so a finer time step would ideally be required (particularly for smaller/flashier catchments), but the monthly system can still give an indication of the flood potential; this is discussed further in Sect. 4.2.
2.3.1 Summer 2022 drought
July 2022 was exceptionally warm and dry in the UK, with widespread record-breaking maximum temperatures and extremely low rainfall across England (< 70 % of average for the majority of the country but < 10 % over large parts of the south and east including Anglian) (Barker et al., 2024; Hannaford et al., 2022). The preceding 4 months had also been dry (< 90 % of average across the whole country, with < 70 % in large areas, particularly in the south and east) (Sefton et al., 2022), leading to river flows and reservoirs reaching exceptionally low levels across much of England, particularly in catchments in the south, and the introduction of temporary use bans by several water companies in southern England (Barker et al., 2024; Hannaford et al., 2022).
Here we ask the question, “how much worse might the situation have become?” To do this, the WBM is initialised from G2G subsurface conditions from the end of July 2022 and run to the end of February 2023 (7 months), with every UNSEEN initialisation year and realisation and with every observed data year. This gives 4960 WBM UNSEEN runs for each month (2 ensembles × 62 initialisation years × 40 realisations) vs. only 62 historical sequences for WBM Obs, hence enabling a more robust assessment of rare low extremes.
2.3.2 Autumn 2023 flood
October 2023 was exceptionally wet across most of England, with rainfall totals exceeding 150 % of the average widely (apart from the southwest and northwest) and exceeding 250 % in some areas (particularly in the north and east) (Hannaford et al., 2023). September had also been relatively wet (exceeding 110 % of the average across much of the country, apart from the far southeast and some limited pockets elsewhere, and exceeding 150 % in some areas in the northwest, northeast, and southwest), and, while August was near-average, July also saw exceptional rainfall across the country, leading to notable rainfall accumulations over this 3-month period (Sefton et al., 2023a). This led to river flows reaching notably high levels across much of England, with elevated flood risk in many areas.
We again ask the question, “how much worse might the situation become?” In a similar way to the summer 2022 analysis, the WBM is initialised from G2G subsurface conditions from the end of October 2023 and run to the end of February 2024 (4 months), with every UNSEEN initialisation year and realisation and with every observed data year. This again gives 4960 WBM UNSEEN runs for each month vs. only 62 for WBM Obs, hence enabling a more robust assessment of rare high extremes.
2.4 Flow analyses
The WBM provides monthly mean river flows on a 1 km grid, but in the UKHO these are typically standardised (by dividing by long-term mean flow from a set of observation-driven runs), and the standardised flows are displayed on a 1 km grid or averaged across 17 regions (Fig. 1c). This WBM approach was originally developed to provide an indication of the relative magnitude of monthly and regional mean river flows across GB using spatially coarse GloSea5 rainfall forecasts (Bell et al., 2017). A very similar approach is used here; although the DePreSys3 hindcasts have an improved spatial resolution, they are still relatively coarse, and focusing on regional mean flows greatly simplifies subsequent analyses and plotting. The results focus on eight regions of England: NW England, Northumbria, Severn-Trent, Yorkshire, Thames, Anglian, Wessex, and SE England (Fig. 1c).
2.4.1 Fidelity tests
Fidelity tests on WBM flow estimates are performed in a similar way to that applied to the UNSEEN rainfall data (Thompson et al., 2017, their Fig. 2). That is, for each case study and region,
-
the WBM UNSEEN-simulated flows (May- and November-initialised) are resampled 1000 times, with each sample randomly selected from the 40 × 2 available realisations for the year, producing a time series of the same length as the WBM Obs time series;
-
for each resample, the mean, standard deviation, skewness, and kurtosis statistics are calculated;
-
the same statistics are calculated for the WBM Obs-simulated flows;
-
if, for all four statistics, the WBM Obs flow value sits within the 2.5 %–97.5 % range of the values from the 1000 resamples of the WBM UNSEEN simulations, then the WBM UNSEEN simulations are considered to have passed the test (i.e. the distributions of WBM Obs and WBM UNSEEN flow values for the region and month are considered indistinguishable), and if the test is only failed for one of the four statistics, then this is noted.
Passing the fidelity tests gives confidence in the ability of the WBM and UNSEEN GCM precipitation to simulate appropriate distributions of monthly mean river flows in a region, given the WBM initialisation for each case study.
2.4.2 Extreme flows
For each case study, the monthly time series of regional mean flows from the full set of years and realisations of WBM UNSEEN are plotted as the median and range (5th–95th percentiles and overall min and max). The November- and May-initialised ensembles are combined together. For comparison, the median and range from WBM Obs are also shown.
For historical context, the time series of monthly regional mean flows for the previous 2 years are shown for each region, along with long-term mean flow ranges derived for the preceding years (from 1963). These are derived from runs of the WBM driven by observed data for 1963–2023, with initialisation (using G2G data) at the start of every month (hereafter “WBM Obs 1 m”). For each region, long-term mean flow ranges are derived by extracting the 5th, 13th, 28th, 72nd, 87th, and 95th percentiles for each month, along with the overall min and max. These percentiles are chosen to match those defining the seven classes used in the UKHO: “exceptionally low” (< 5th), “notably low” (5th–13th), “below normal” (13th–28th), “normal” (28th–72nd), “above normal” (72nd–87th), “notably high” (87th–95th), and “exceptionally high” (> 95th) (https://ukho.ceh.ac.uk, March 2024).
The WBM Obs 1 m run described above is not directly comparable to the WBM UNSEEN and WBM Obs ensemble runs, since the former is re-initialised from G2G for every month, whereas the latter are only initialised at the start of each case study and then run forward for the n months of each study (where n is 7 for the summer 2022 drought and 4 for the autumn 2023 flood). To demonstrate any difference this may make, a further run is performed using observed driving data for each case study but only initialising at the start and then running forward for n months (hereafter “WBM Obs n-m”).
2.4.3 Temporal and spatial variation in extreme flows
The UNSEEN-derived extreme flows are assessed, for each case study, by selecting and plotting the ensemble member giving the most extreme flows for each month of the simulation and investigating how these vary temporally (for consecutive months) and spatially (for neighbouring regions). The UNSEEN ensemble member is defined by the ensemble (November or May), the initialisation year, and the realisation number (out of 40); see Sect. 2.1.
2.4.4 Recovery or persistence of extreme flows
The long-term mean flow bands (Sect. 2.4.2) are used to assess the chance of flows recovering to normal by each month in each region for each case study. For example, for the summer 2022 drought case study, in each region each ensemble member is assessed to see whether the flows have reached the normal flow band (or higher) by month m but are still in a lower flow band for each month of the simulation prior to month m. Similarly, for the autumn 2023 flood case study, in each region each ensemble member is assessed to see whether the flows have reached the normal flow band (or lower) by month m but are still in a higher flow band for each month of the simulation prior to month m. The number of ensemble members recovering to normal is then expressed as a percentage of the full ensemble and plotted for each region and each case study. In a similar way, the chance of flows remaining at least exceptionally low (high) is assessed for summer 2022 (autumn 2023).
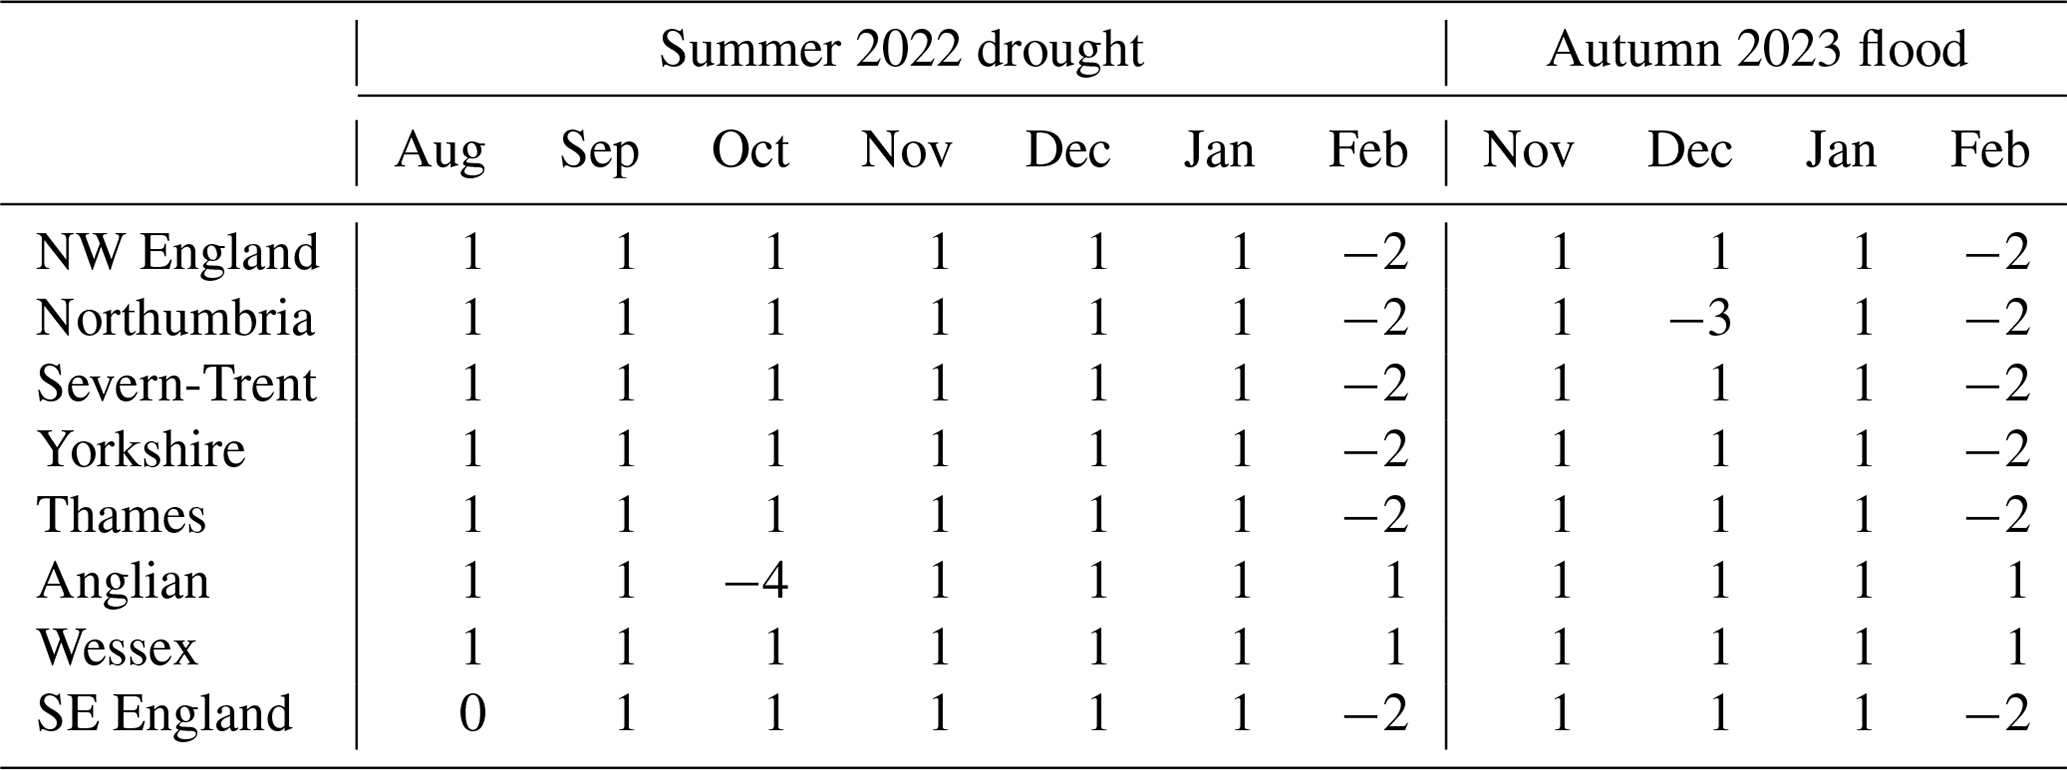
Table 2The results of fidelity tests for the summer 2022 drought (left) and autumn 2023 flood (right) case studies. “1” indicates a pass for all four statistics, while ≤ 0 indicates a fail for at least one statistic. If there is only a FAIL on one statistic then the negative number indicates which one (−1 mean, −2 SD, −3 skewness, −4 kurtosis).
3.1 Fidelity tests
The results of the flow fidelity tests are summarised in Table 2 for the each case study, indicating a pass (“1”) or fail (≤ 0) for each month and region, with a negative number indicating which statistic the test failed on if it only failed on one of the four. These show overall pass rates of 86 % and 78 % for the summer 2022 drought and autumn 2023 flood events, respectively. Note that there are no failures only on the mean (“−1”) because of the correction applied to GCM precipitation data for mean monthly rainfall (Sect. 2.1).
Most of the failures occur in February; the pass rates leaving out February are 96 % and 96 %, respectively. The failures in February are only related to the standard deviation (“−2”), which is due to this being too low for rainfall in the climate model runs (Kelder et al., 2022). This is partly due to the extremely wet February 2020 (Davies et al., 2021); removing this from the February fidelity testing leads to passes in six out of eight regions for both the summer 2022 drought and the autumn 2023 flood (compared to only two when February 2020 is included). In each case, the test still fails in Thames and SE England. There are limited failures in months other than February but notably for SE England in August – the latter fails on both skewness and kurtosis which seems to be due to the WBM UNSEEN ensemble providing more extreme high flows than the WBM Obs ensemble, but lower flows are better represented.
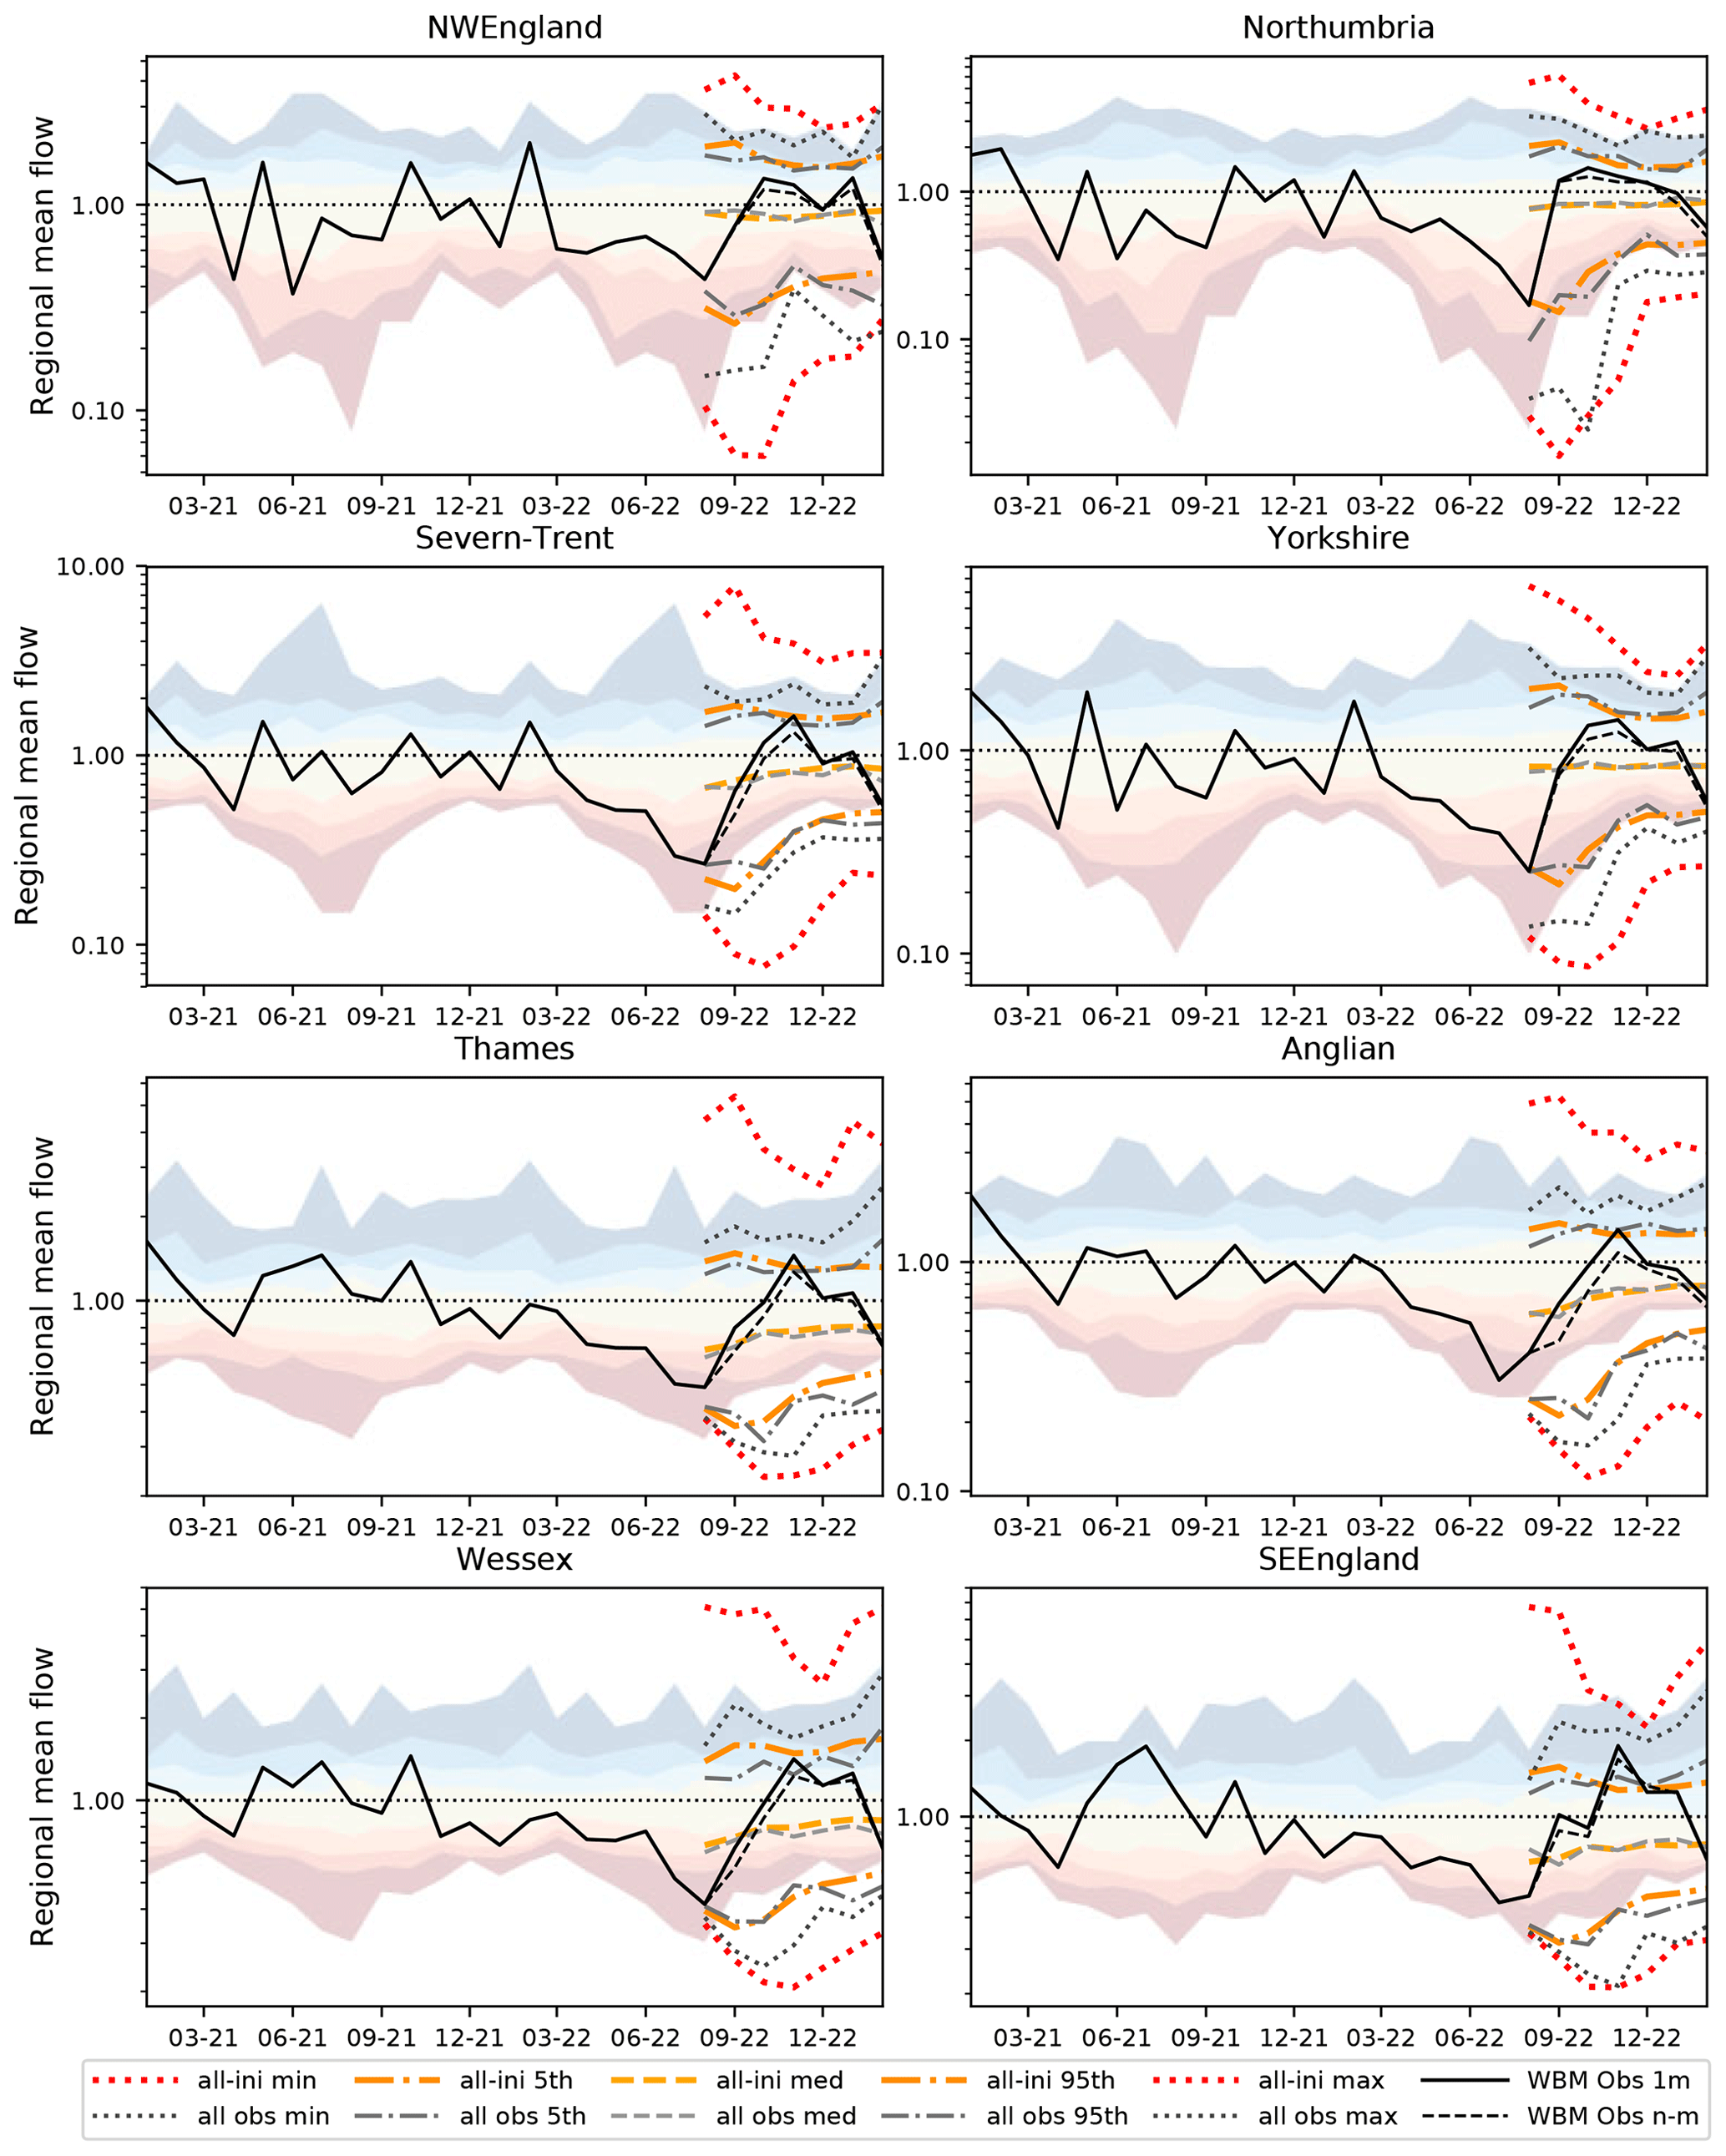
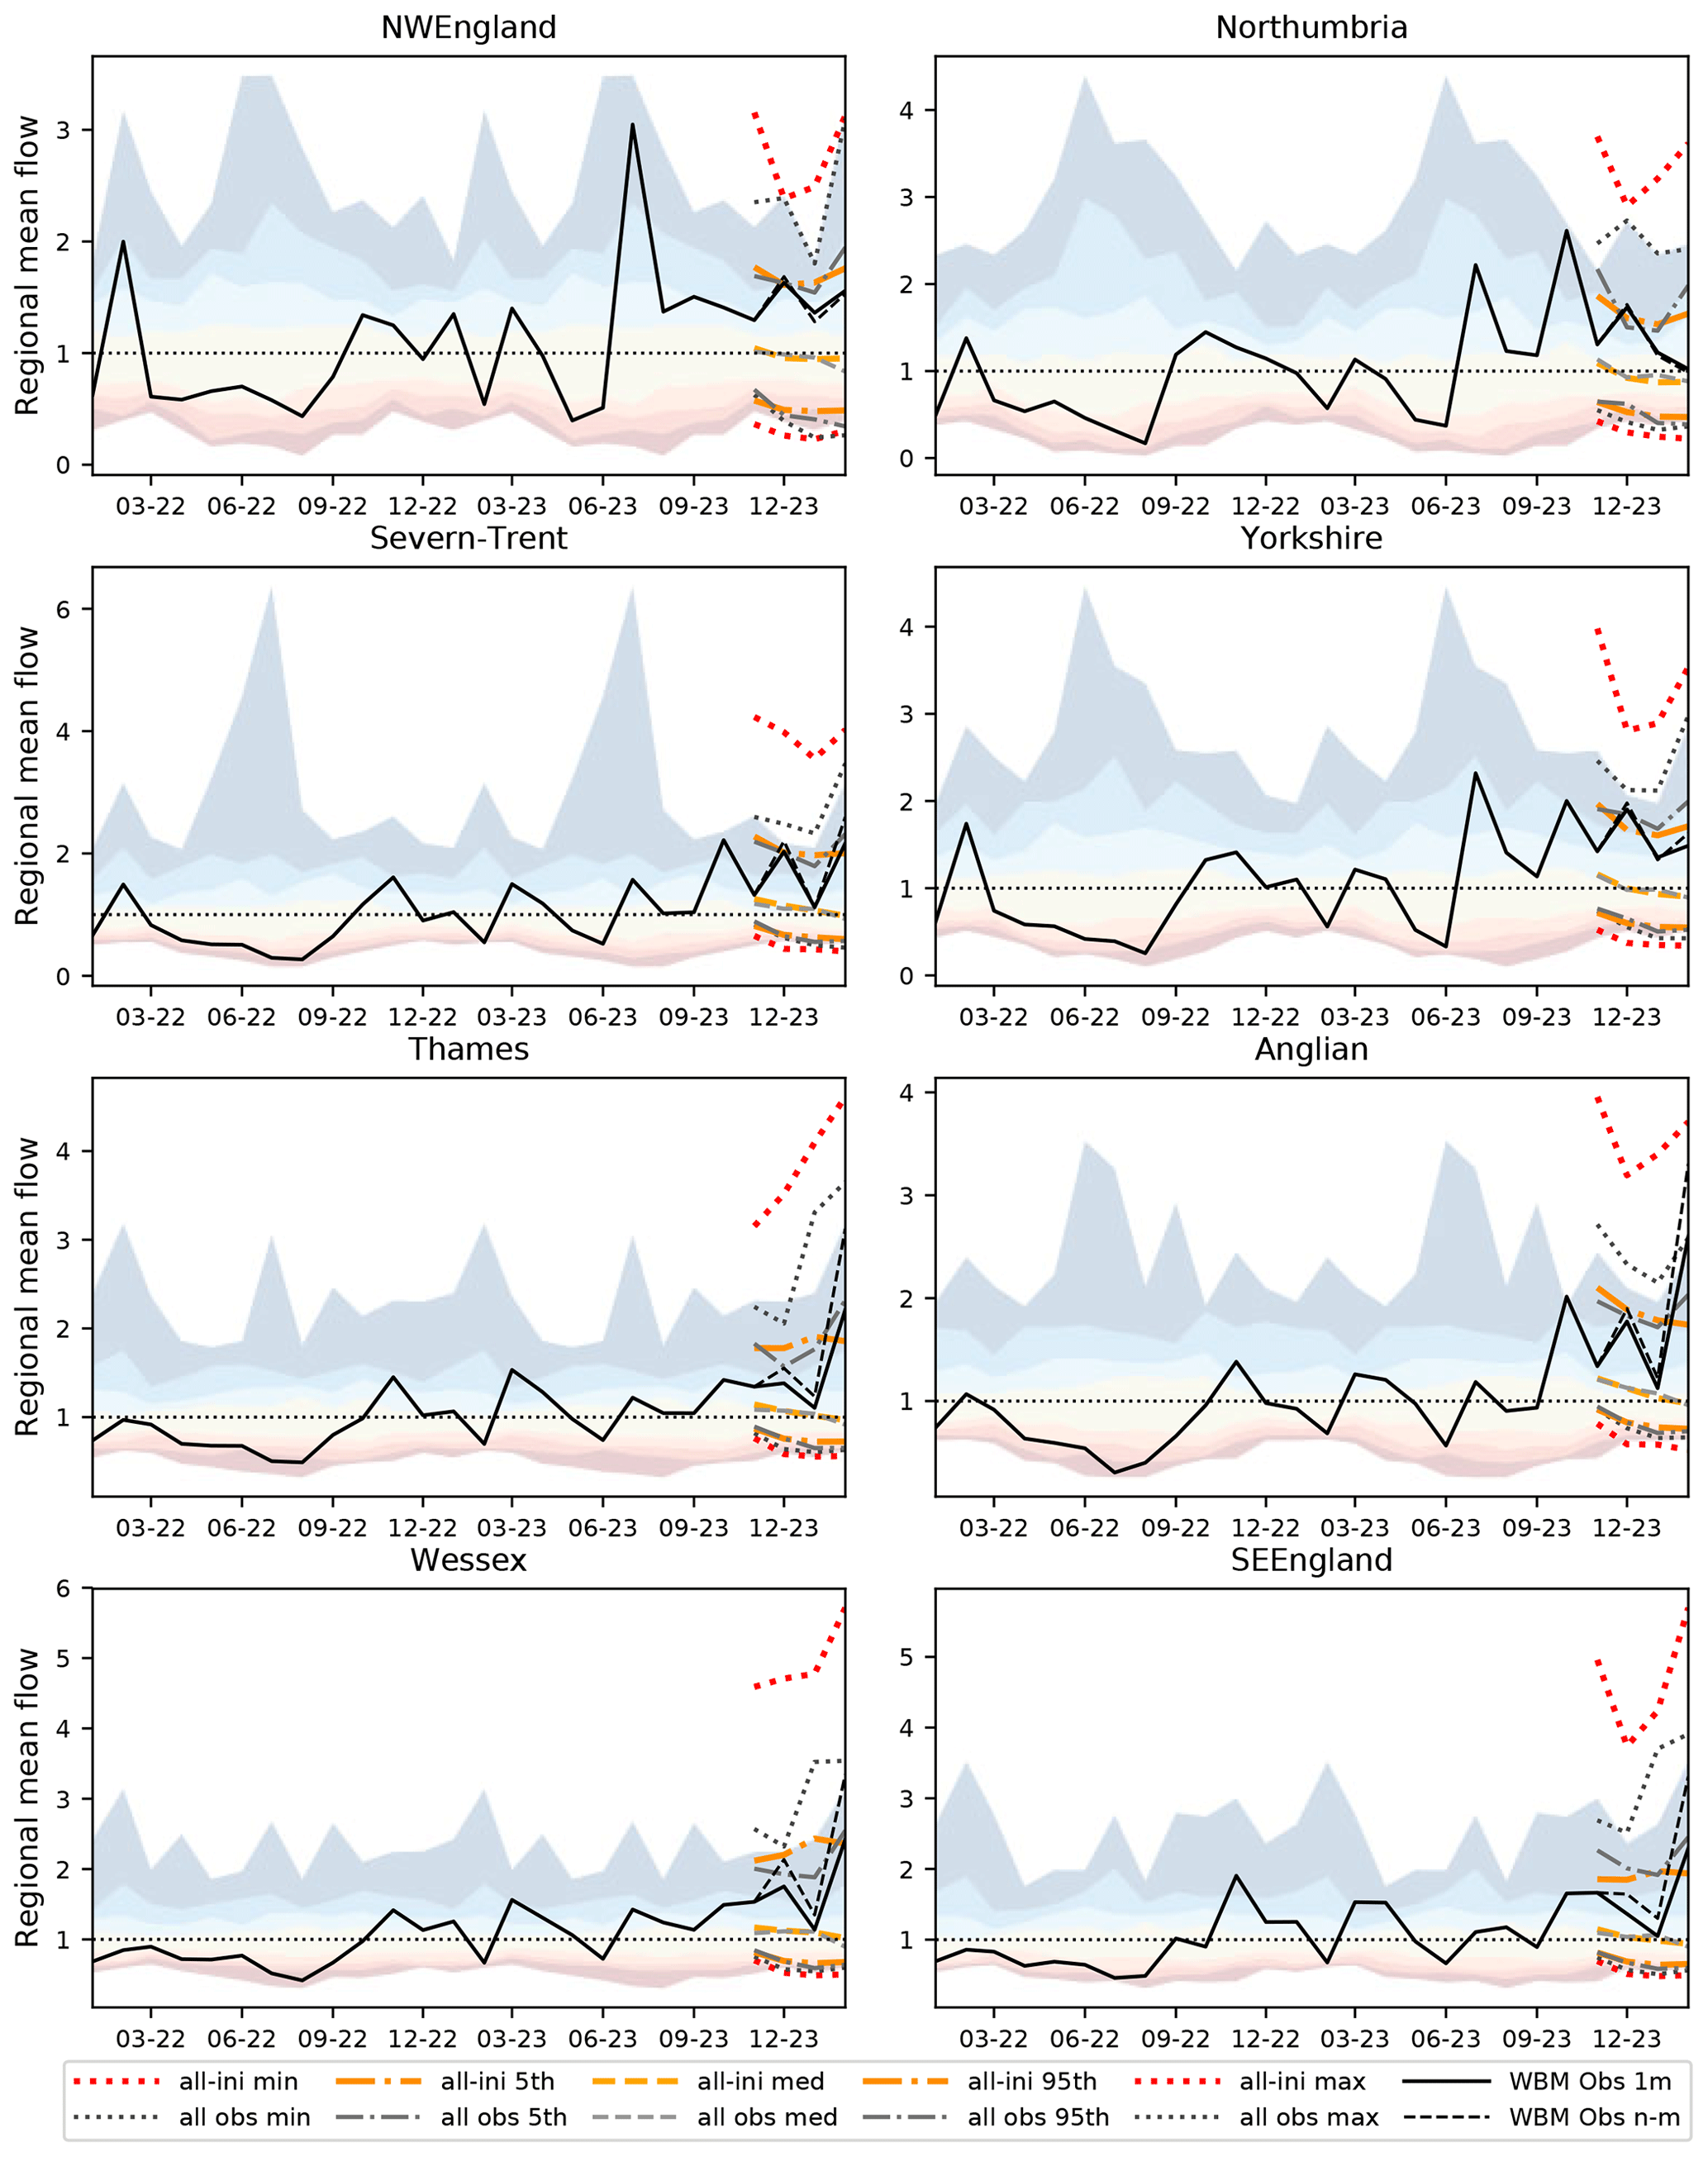
Figure 2Regional mean flows for the summer 2022 drought case study. The dashed/dash-dotted/dotted lines show the median/5th–95th/min–max across the ensemble using all the observed driving data (grey) and all the UNSEEN driving data (orange/red) for the WBM initialised from the end of July 2022. The WBM flows driven by observed data for January 2021–February 2023 and initialised at the start of every month are also shown (WBM Obs 1 m; solid black line), as are the WBM flows driven by observed data for August 2022–February 2023 but only initialised at the start (WBM Obs n-m; dashed black line). For historical context, the coloured areas show the ranges from WBM Obs 1 m for 1963–2020: min, 5th, 13th, 28th, 72nd, 87th, 95th, and max percentiles. Note the log scale on the y axis to emphasis lower flows.
3.2 Extreme flows
Plots of the median and range of regional mean flows are shown in Fig. 2 for the summer 2022 drought case study and Fig. 3 for the autumn 2023 flood case study. These show that using the large ensemble of UNSEEN data gives more extreme flows than using all of the historical observed data (dotted red lines vs. dotted grey lines), although the 5th, 50th, and 95th percentiles from WBM UNSEEN and WBM Obs are all similar (dashed and dash-dotted orange vs. dashed and dash-dotted grey), as expected from the fidelity tests. It should be emphasised that, for both WBM UNSEEN and WBM Obs, the min and max (dotted lines) represent the overall envelope of the ensemble of simulations for each month, so they do not necessarily represent a plausible monthly evolution of the flows (see Sect. 3.3). On average across the eight regions, for the 7 months of the summer 2022 drought case study, the low envelope of the WBM UNSEEN flows is 28 % lower than that of the WBM Obs flows and, for the 4 months of the autumn 2023 flood case study, the high envelope of the WBM UNSEEN flows is 42 % higher than that of the WBM Obs flows.
Figure 2 also shows that the simulations from WBM Obs 1 m (solid black line; initialised at the start of every month) and WBM Obs n-m (dashed black line; only initialised at the start of the case study period) are very similar. However, Fig. 3 shows that the WBM Obs n-m simulation tends to over-estimate high flows relative to the WBM Obs 1 m re-initialised simulation; see Sect. 4.2 of the Discussion.
The effect of initialisation is clear in all regions but longer-lasting in some. For example, for the summer 2022 drought study, the conditions in July 2022 are obviously very dry (below normal in all regions and exceptionally low in some). In Severn-Trent the max from WBM Obs (top dotted grey) has increased from below the long-term max to match it by February 2023, whereas in Thames the WBM Obs max is still well below the long-term max by then. In all regions though, the min from WBM Obs (lower dotted grey) stays below the long-term min.
Similarly, for the autumn 2023 flood study, the conditions in October 2023 are very wet (above normal in all regions and exceptionally high in some). In Northumbria the max from WBM Obs (top dotted grey) has decreased from above the long-term max to match it by December 2023, whereas in Anglian the WBM Obs max is still well above the long-term max even by February 2024. This is due to the presence of significant groundwater stores in regions in the south and east of England, which typically respond much more slowly to weather conditions than the shallower stores typically found in the north and west of England (Svensson et al., 2015). The WBM has information about the spatial differences in subsurface stores from the data it takes from long historical runs of G2G (Sect. 2.2).
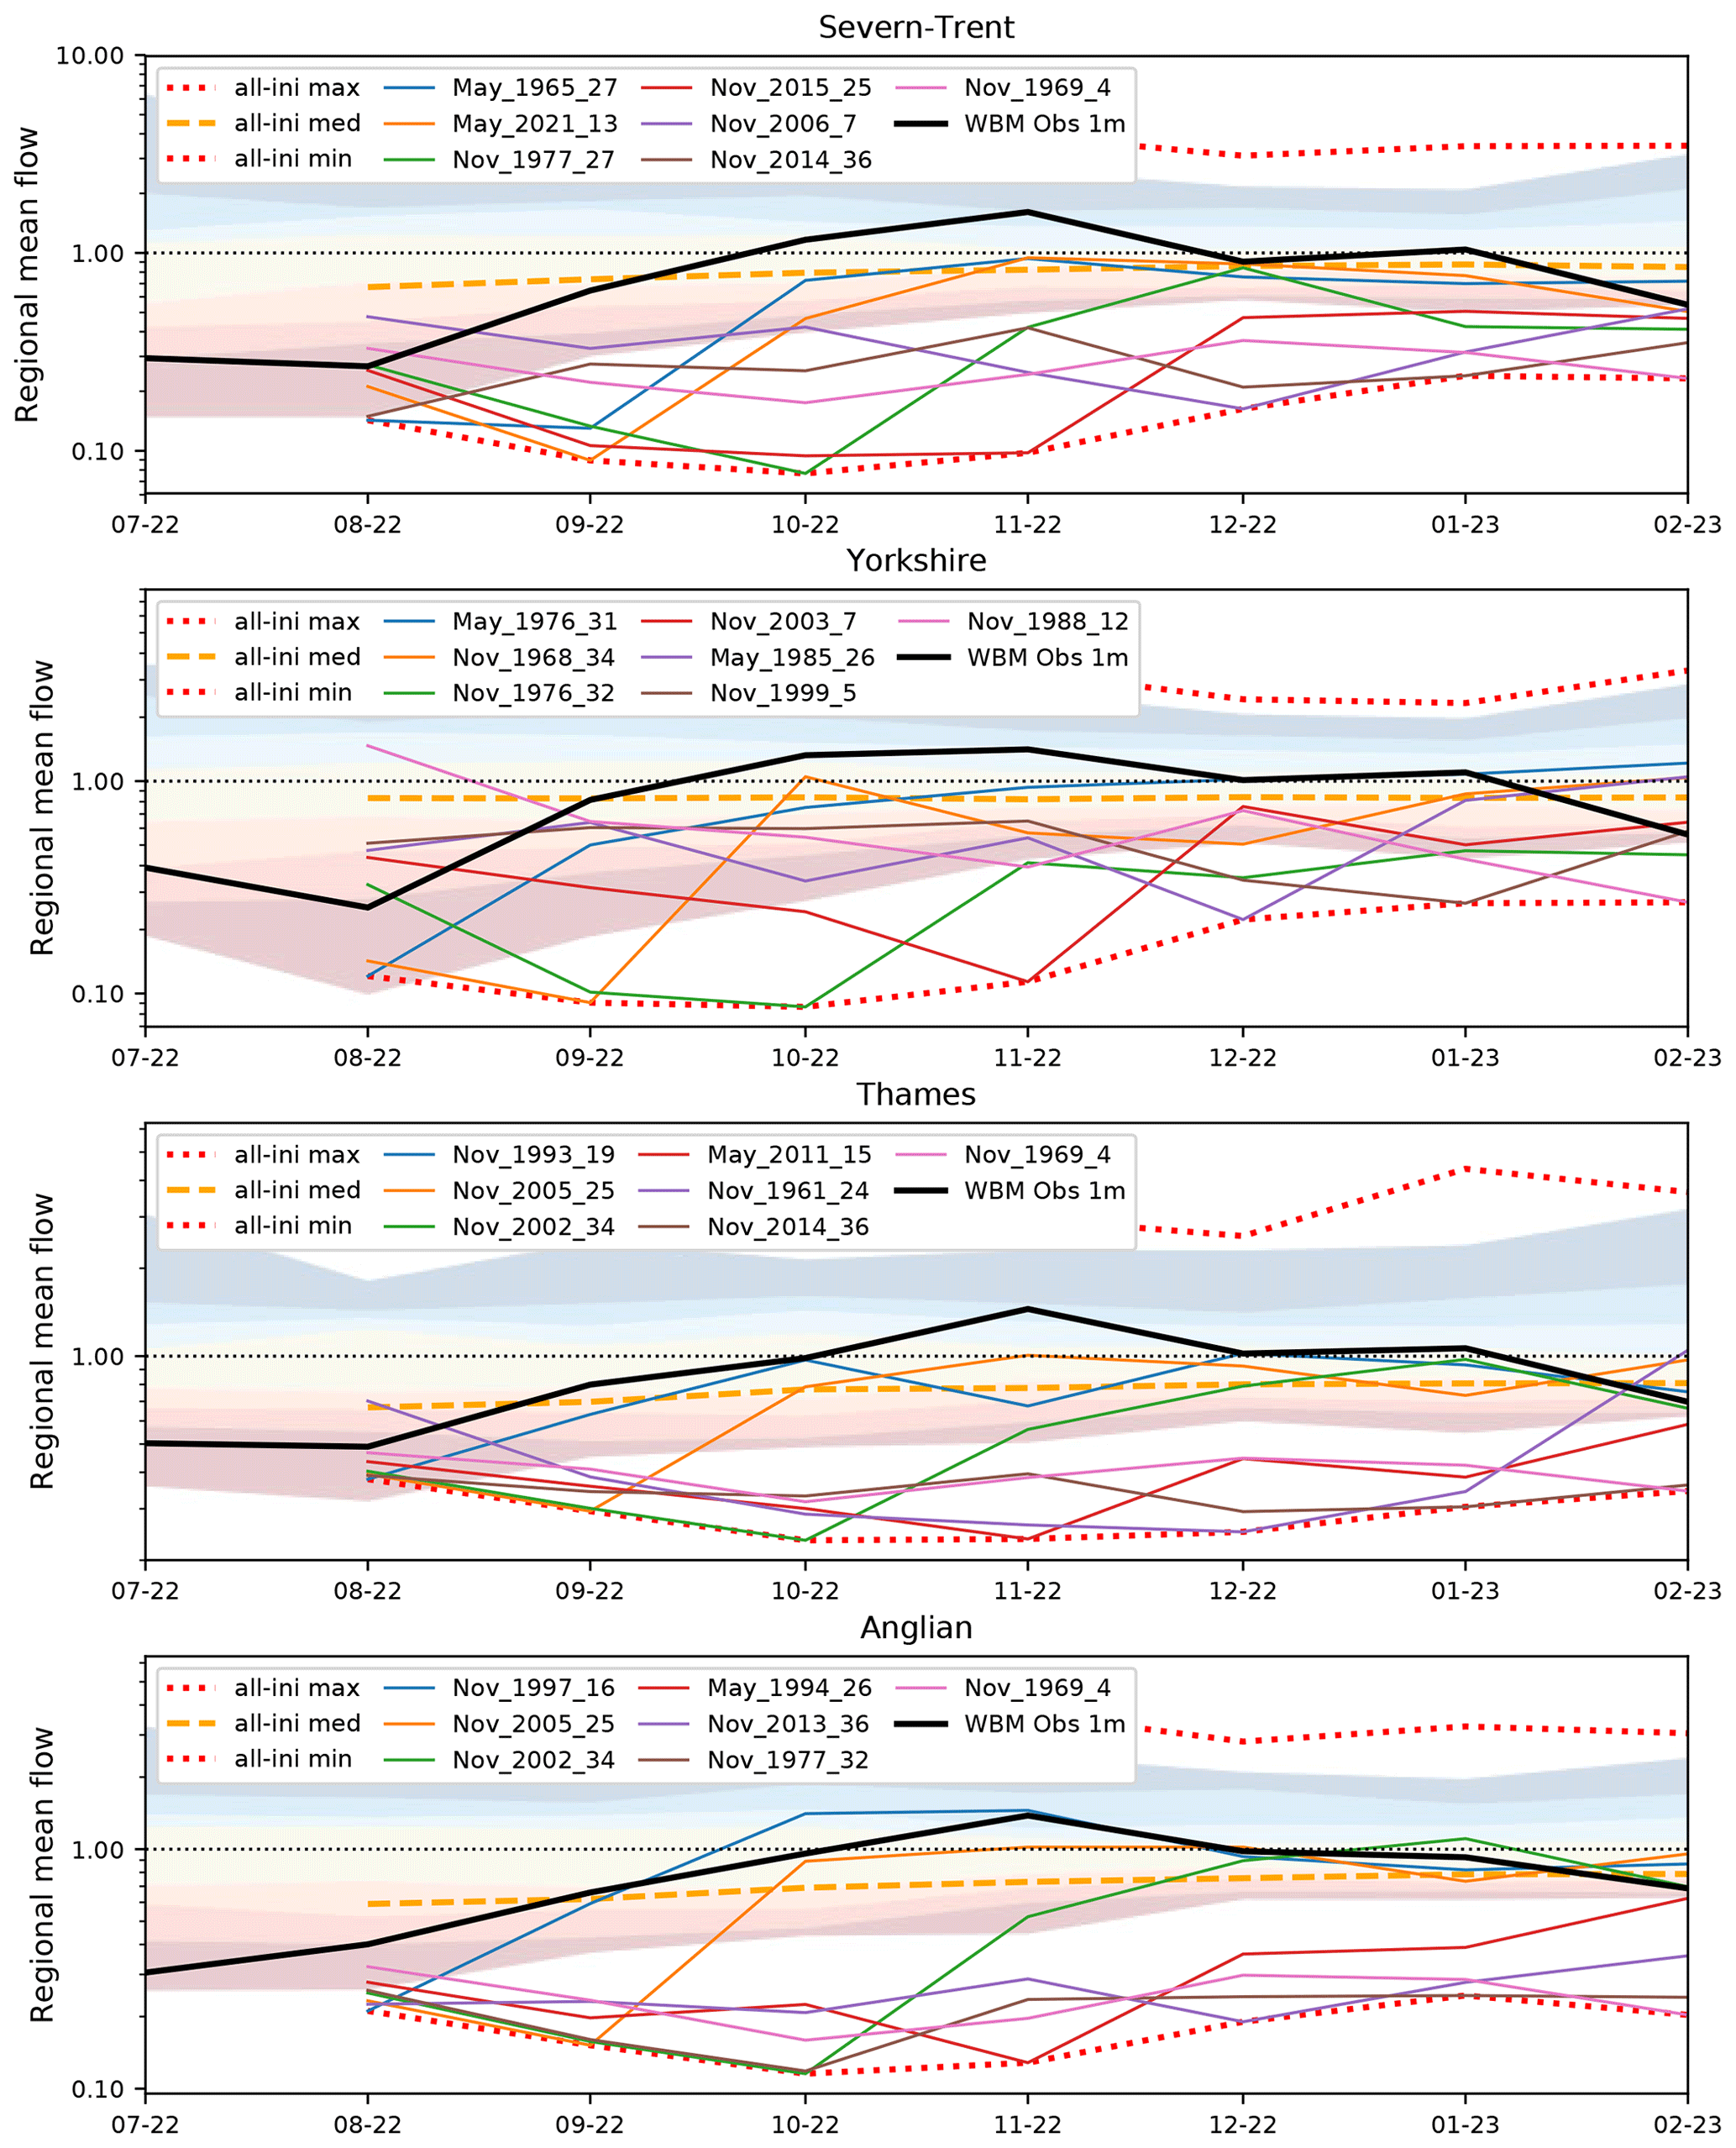
Figure 4Regional mean flows for the summer 2022 drought case study for the ensemble member giving the lowest flow in each month (coloured solid lines in order from August 2022 to February 2023, with labels identifying the ensemble member by ensemble (November or May), initialisation year, and realisation number). As in Fig. 2, the dashed/dotted lines show the median/min–max across the ensemble using all the UNSEEN driving data (orange) for the WBM initialised from the end of July 2022, and the WBM flows driven by observed data for July 2022–February 2023 and initialised at the start of every month are also shown (WBM Obs 1 m; solid black line). For historical context, the coloured areas show the ranges from WBM Obs 1 m for 1963–2020: min, 5th, 13th, 28th, 72nd, 87th, 95th, and max percentiles.
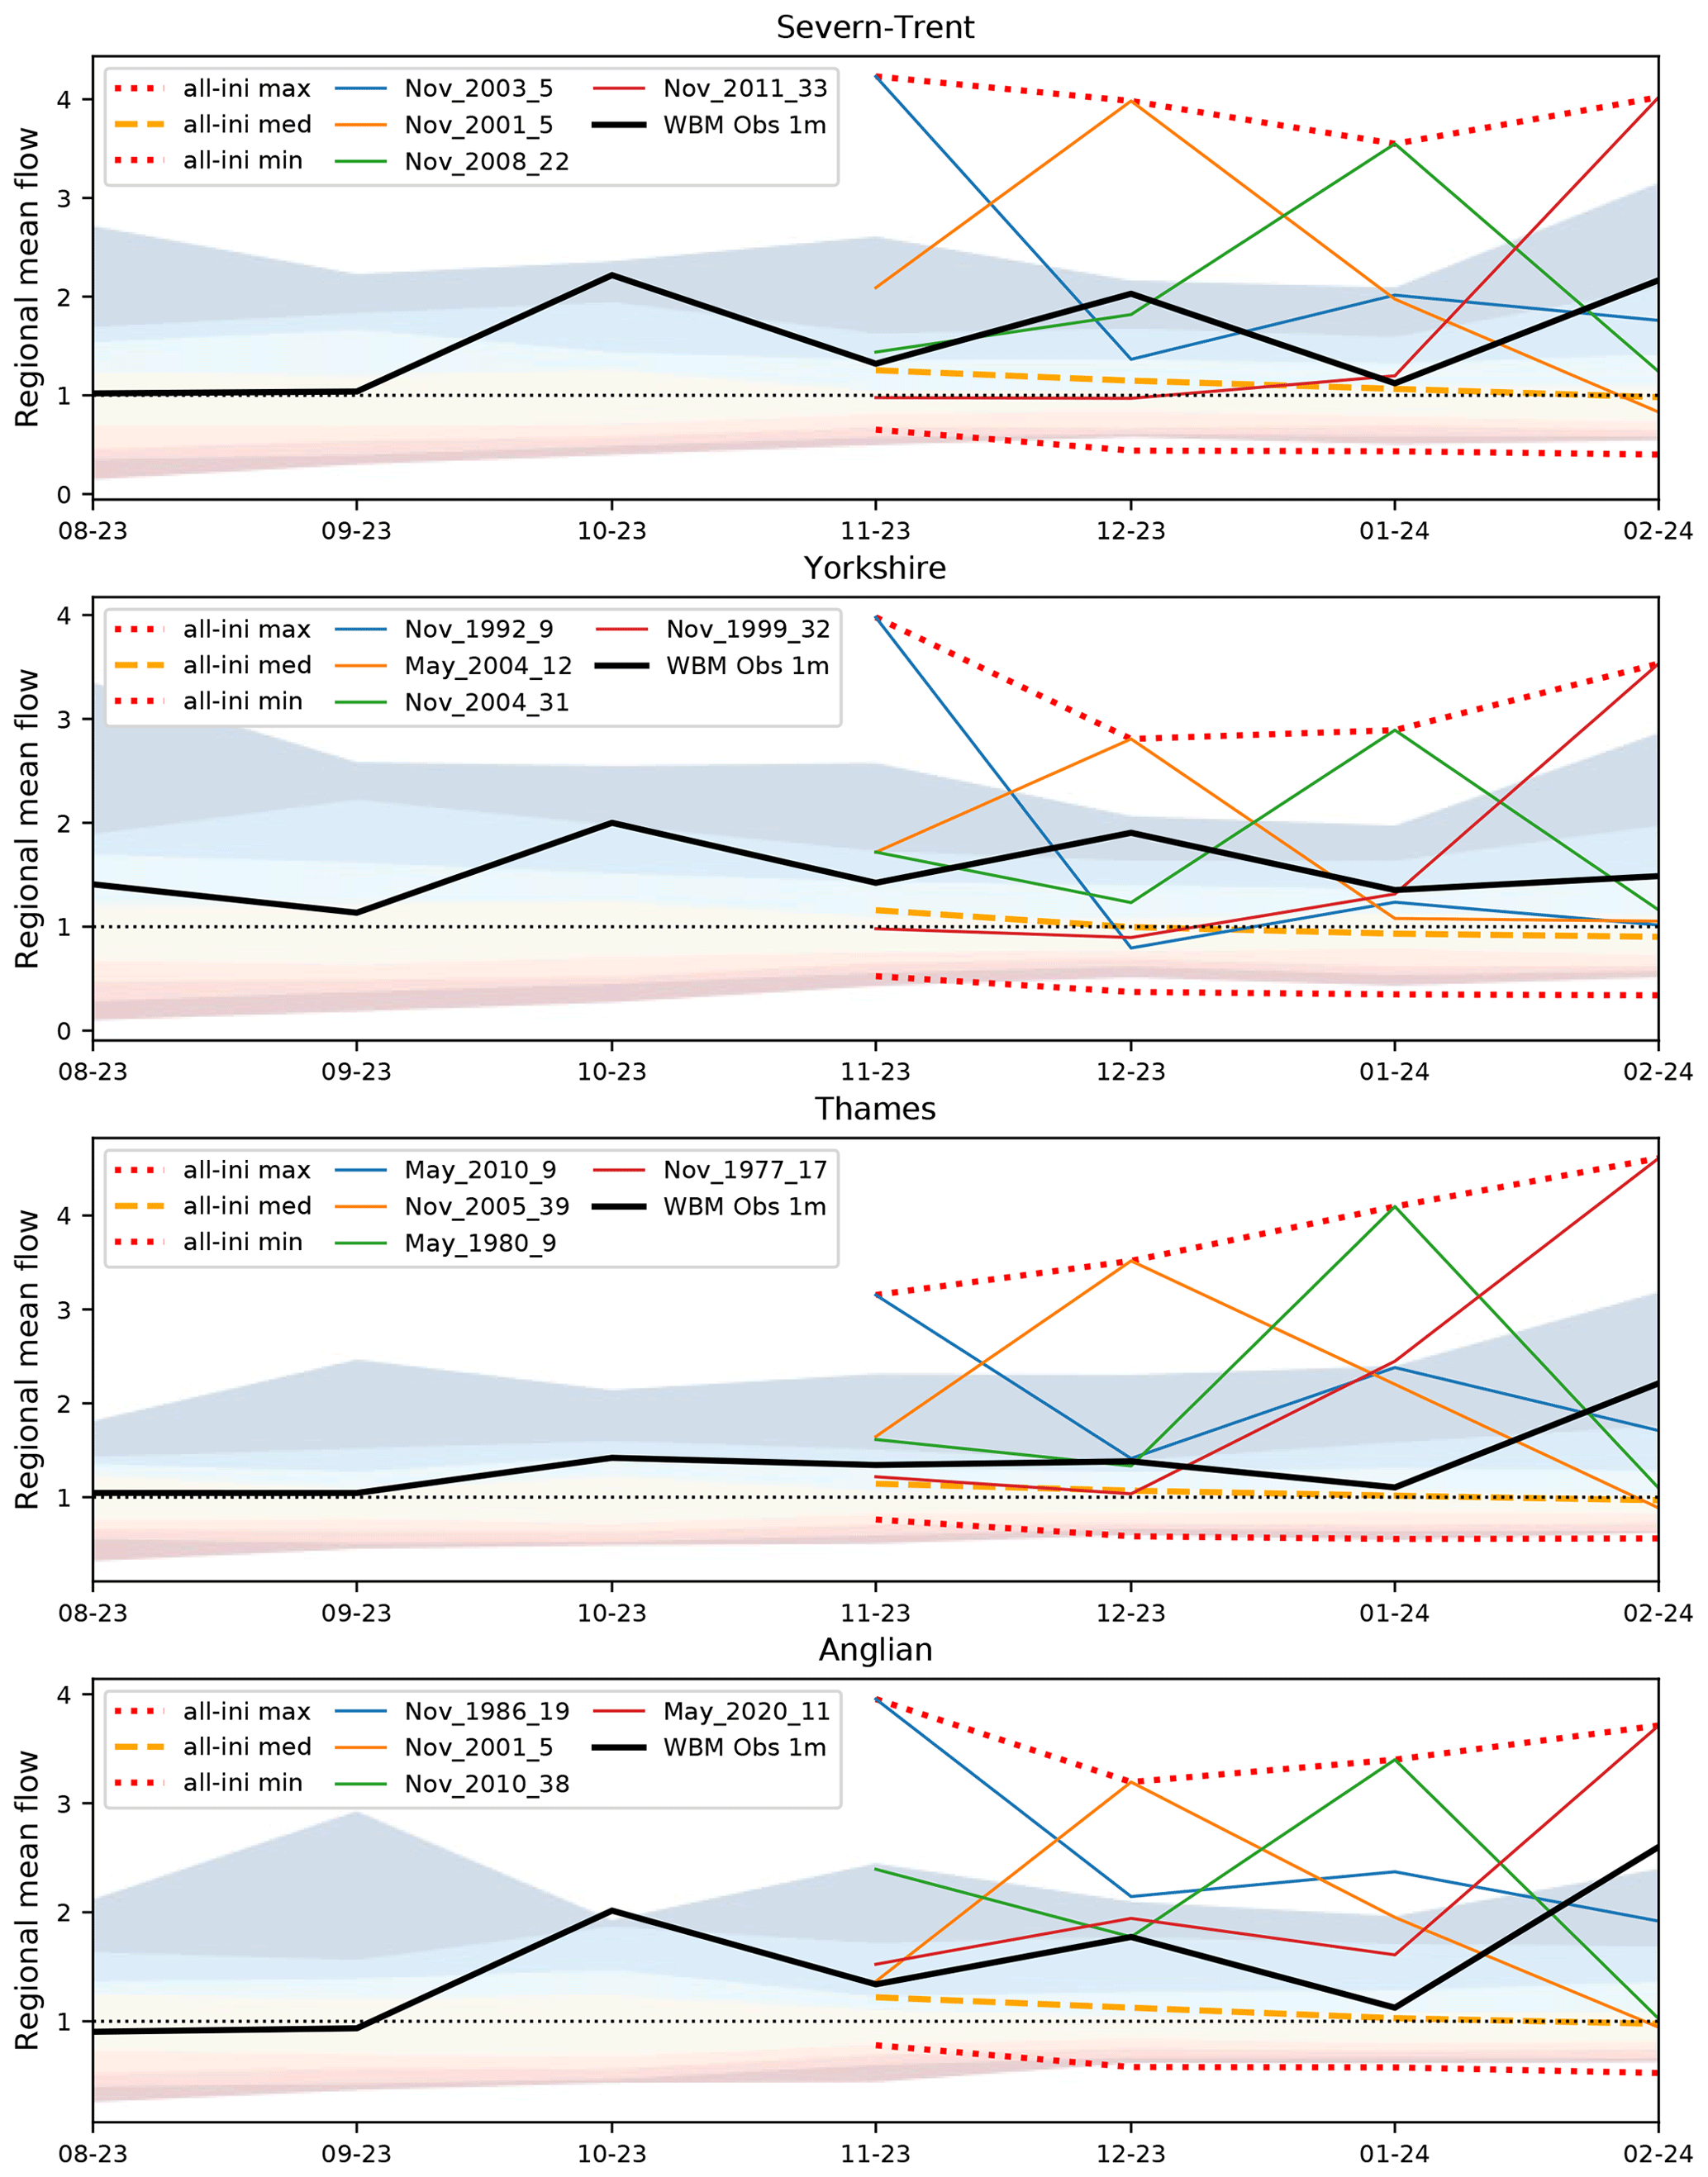
Figure 5As in Fig. 4 but showing regional mean flows for the autumn 2023 flood case study for the ensemble member giving the highest flow in each month (coloured solid lines in order from November 2023 to February 2024). For historical context, the coloured areas show the ranges from WBM Obs 1 m for 1963–2021: min, 5th, 13th, 28th, 72nd, 87th, 95th, and max percentiles.
3.3 Temporal and spatial variation in extreme flows
It is important to note that the WBM UNSEEN extremes for consecutive months are often not given by the same UNSEEN climate ensemble member (ensemble, initialisation year, and realisation; Sect. 2.1). Similarly, the extremes for different regions, even neighbouring ones, are often not given by the same ensemble member. This is illustrated for four regions for the summer 2022 drought (Fig. 4) and for the autumn 2023 flood (Fig. 5). Similarly, the WBM Obs extremes for consecutive months will likely not be given by the same ensemble member.
For the summer 2022 drought, Fig. 4 shows that each of the ensemble members giving the lowest flows in August, September, or October 2022 has a fast recovery in flows through the autumn. In contrast, the ensemble members giving the lowest flows in late autumn and early winter 2022 are often low (but not the lowest) earlier in the year too, particularly in the Thames and Anglian regions, which are more influenced by more slowly responding groundwater systems. In no cases is the ensemble member giving the lowest flows for 1 month also that giving the lowest flows for the following month. In only three cases does the ensemble member giving the lowest flows in a given month and region also give the lowest flows for that month in a neighbouring region (September and October 2022 in Thames and Anglian and January 2023 in Thames and Severn-Trent).
For the autumn 2023 flood, Fig. 5 shows that in no cases is the ensemble member giving the highest flows for 1 month also that giving the highest flows for the following month, and only rarely is the ensemble member giving the highest flows in a given month also very extreme in earlier/later months. The only real exception is the ensemble member which gives the highest flows in Anglian in November 2023, which also gives flows higher than previous observed records (although not the highest from the UNSEEN ensemble) for December 2023 and January 2024, falling back into the exceptionally high range in February 2024. In only one case does the ensemble member giving the highest flows in a given month and region also give the highest flows for that month in a neighbouring region (December 2023 in Anglian and Severn-Trent).
These results also need to be interpreted in the context of the fidelity test results. In particular, in most regions the fidelity tests were failed in February (Table 2), although this was mostly related to the extreme February observed in 2020, so it may be that the results can otherwise be seen as representative. The fidelity tests were also failed in the first month (August) of the summer 2022 drought study in SE England, so those results may be less reliable.
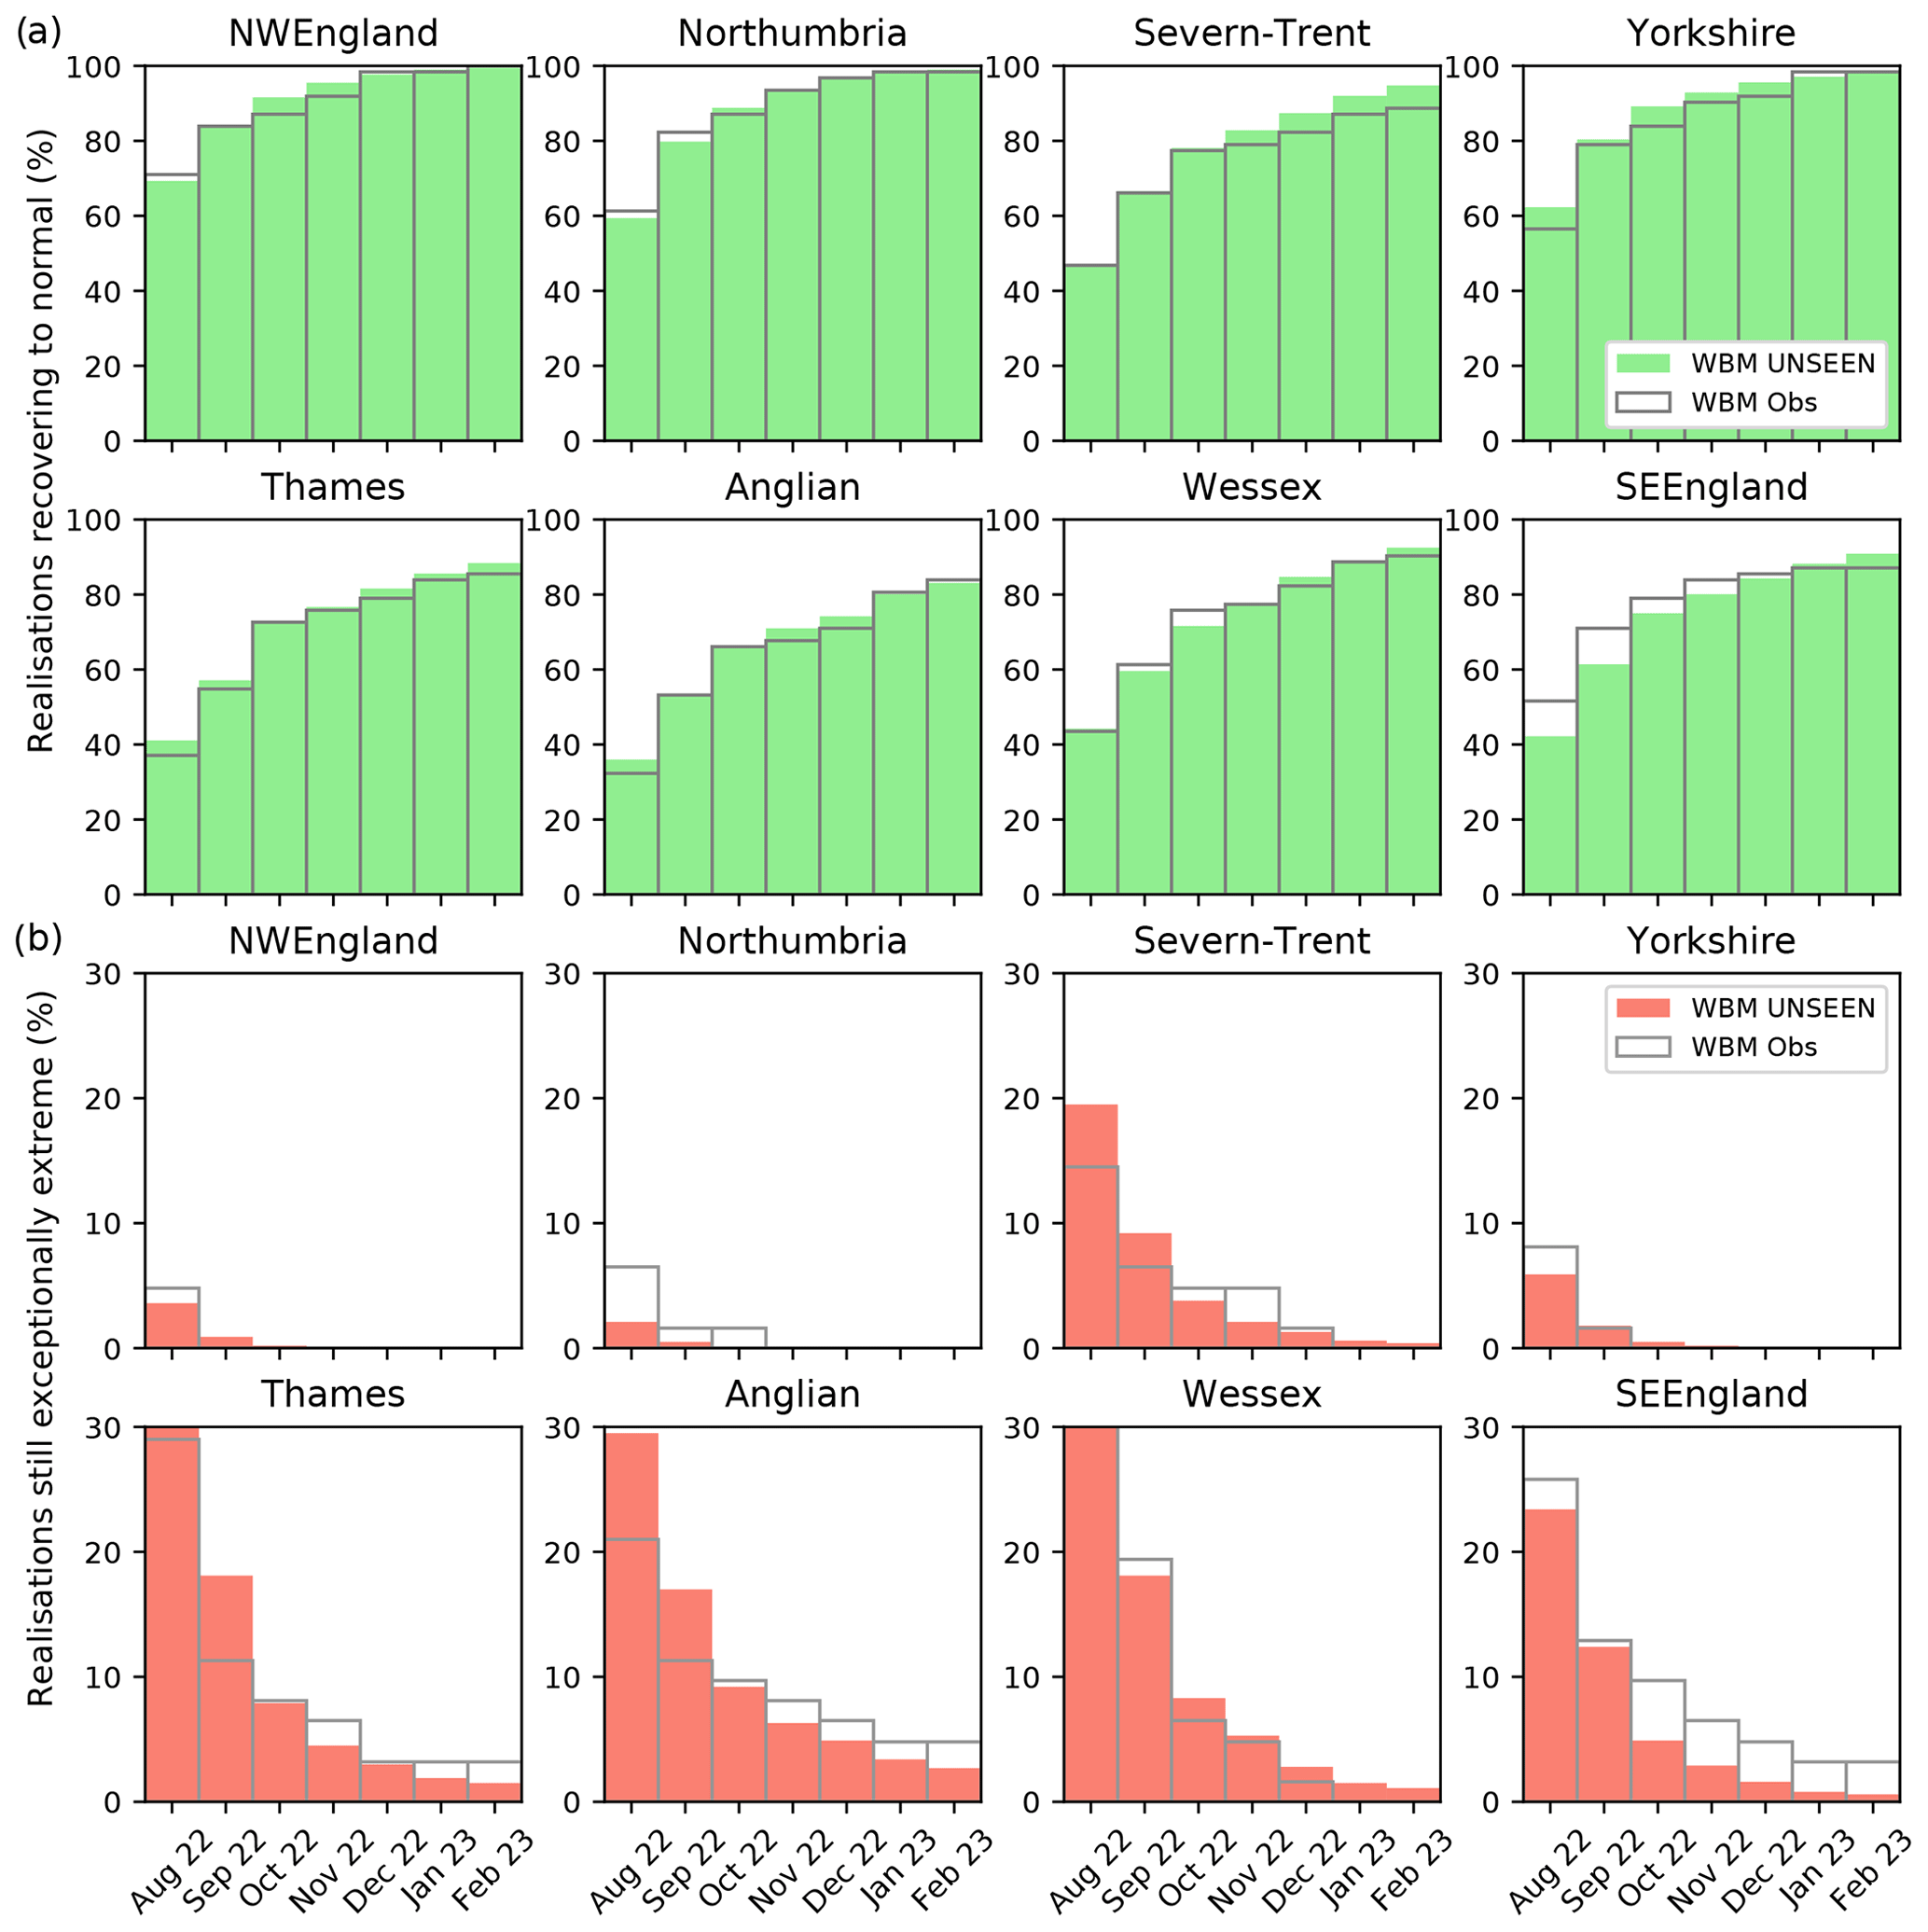
Figure 6The percentage of ensemble members showing (a) the recovery of flows to (at least) normal by each month and (b) flows remaining at least exceptionally extreme by each month, for the summer 2022 drought case study.
3.4 Recovery or persistence of extreme flows
The chance of flows recovering to normal, or remaining exceptionally low (or lower), by each month in each region for the summer 2022 drought is shown in Fig. 6. Flows in more northerly regions (NW England, Northumbria, Yorkshire) were very likely to have recovered to normal by early 2023, whereas other regions show a slower recovery (from a lower starting point) – Anglian shows only around an 80 % chance of recovery by early 2023 (Fig. 6a). Conversely, the analysis of persistence of extremes shows around a 3 % chance of flows remaining exceptionally low in early 2023 in the Anglian region, with a zero chance of persistent low flows in northerly regions (Fig. 6b).
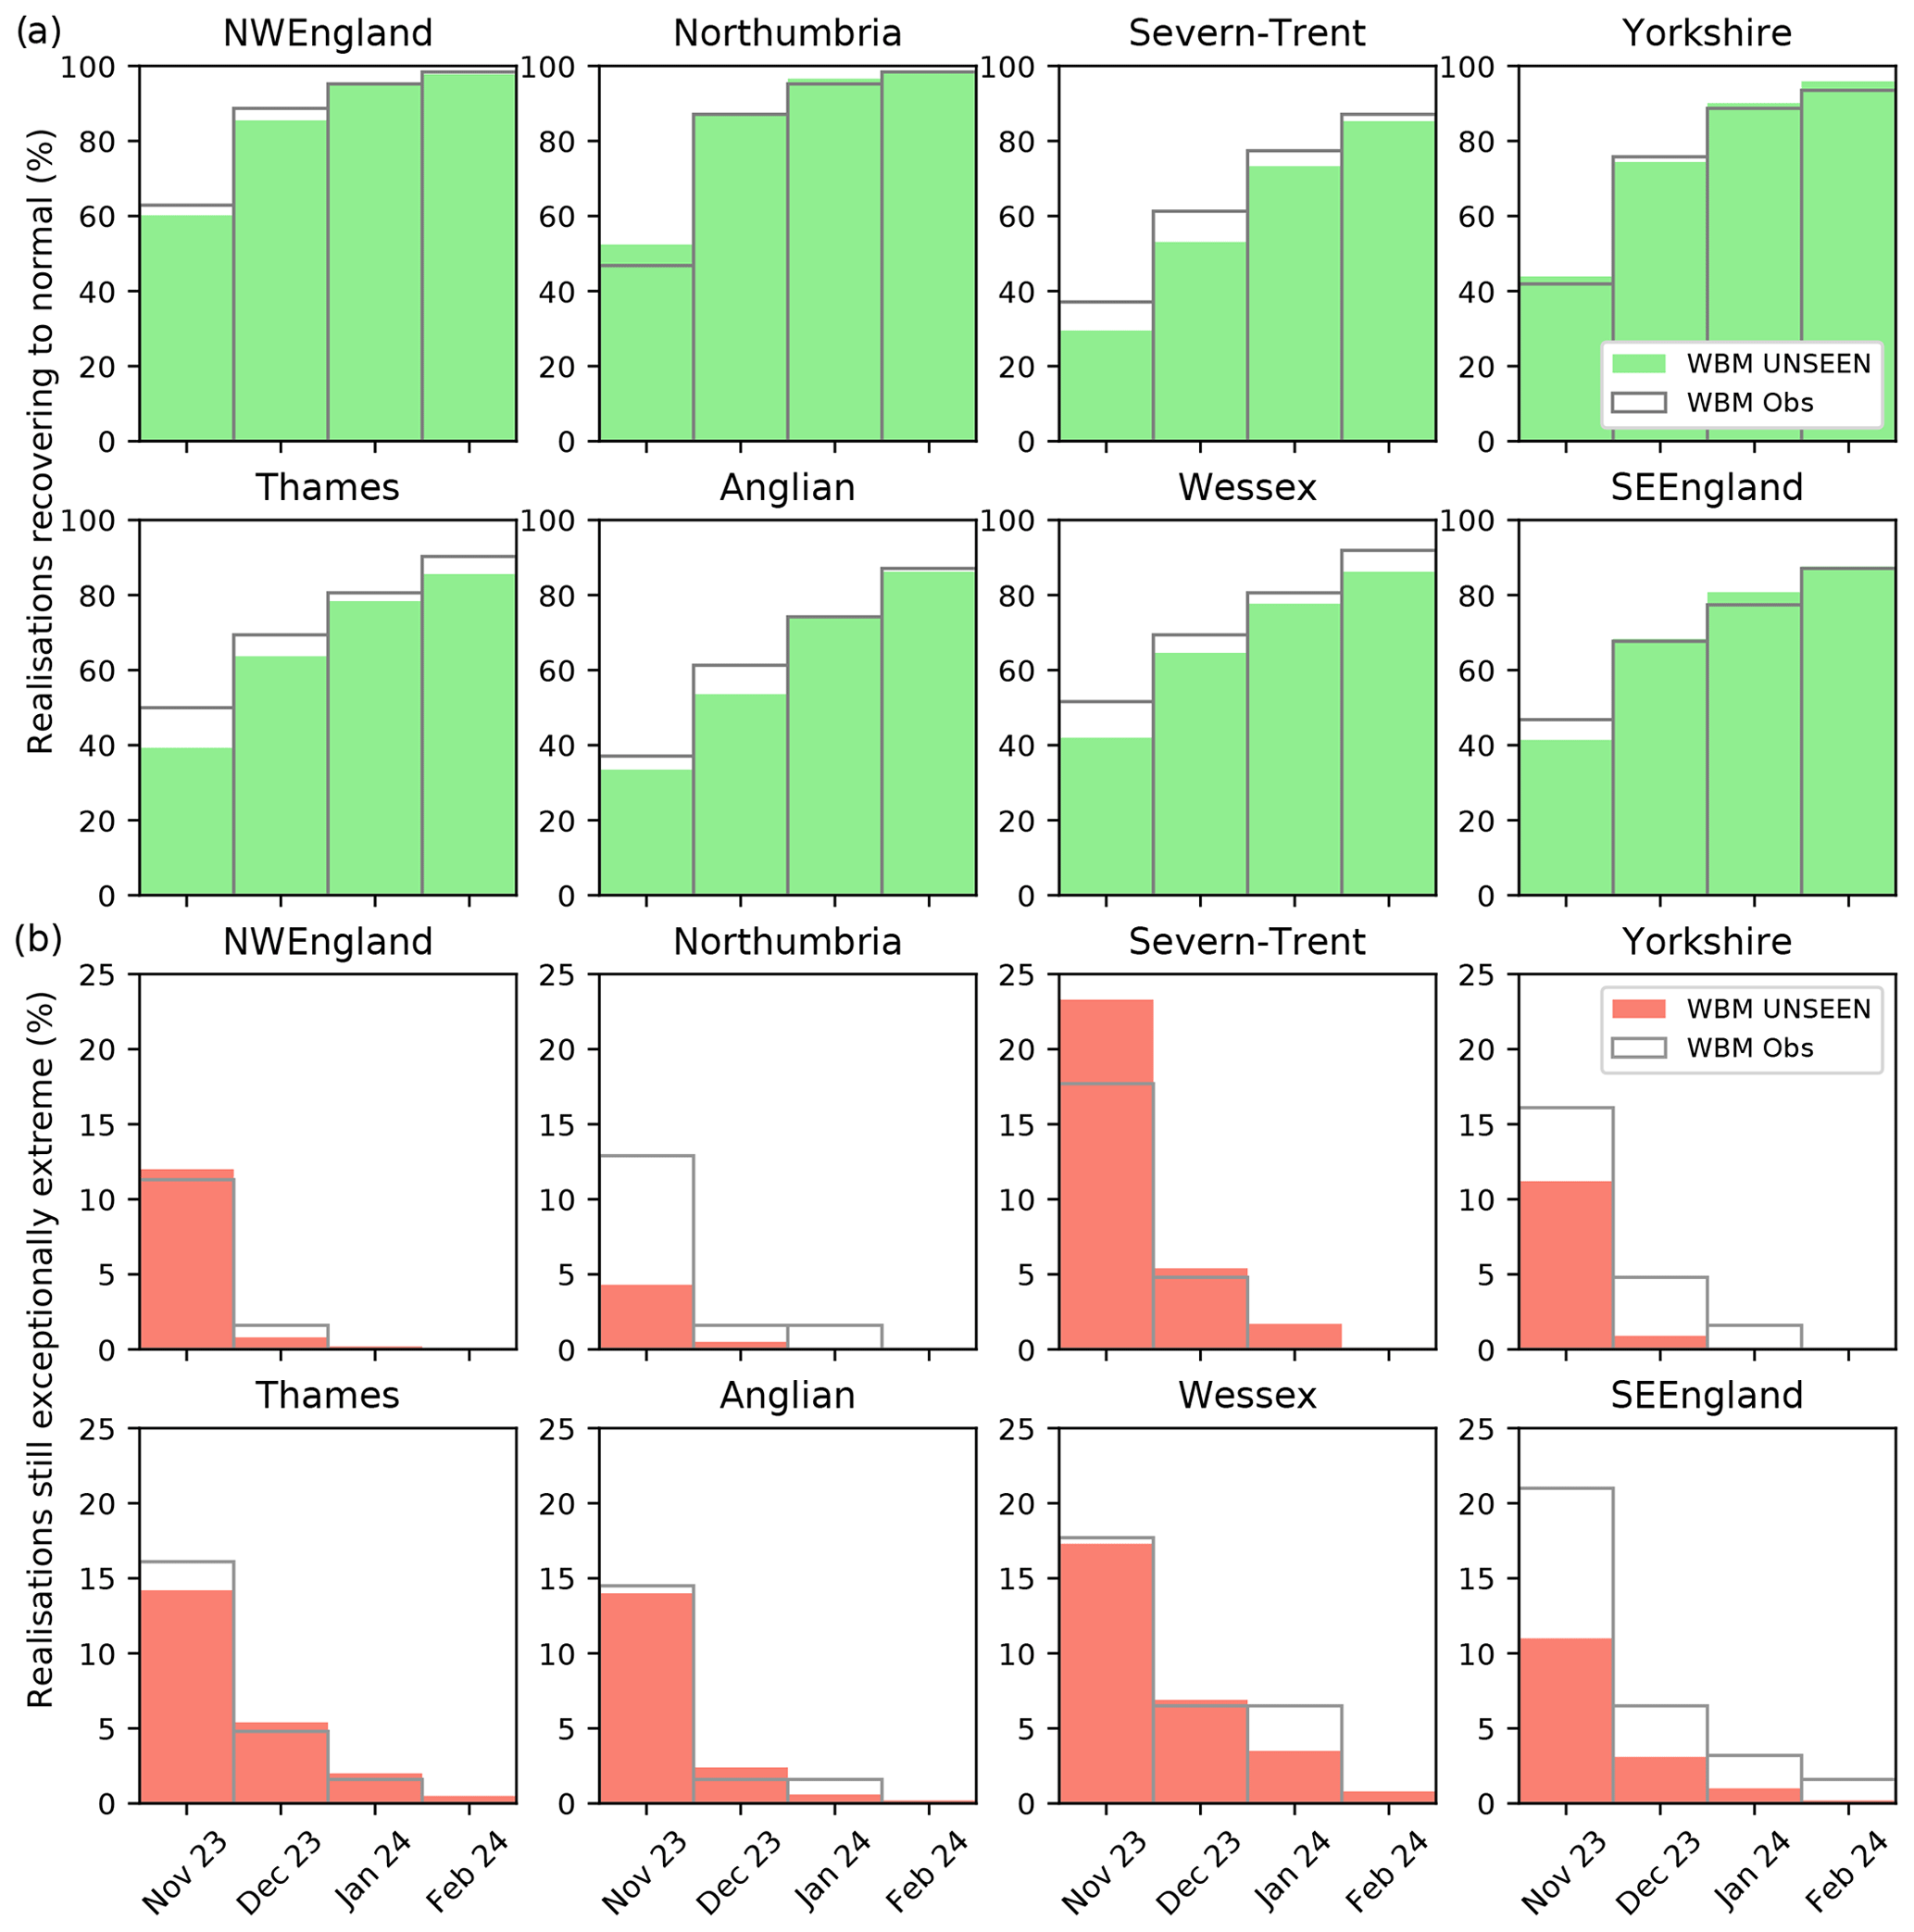
For the autumn 2023 flood, flows in regions in the north are very likely to have recovered to normal by early 2024, whereas flows in regions in the south and east show only around a 70 %–85 % chance of recovery by then, with Anglian and Severn-Trent the worst (Fig. 7a). Conversely, the analysis of the persistence of extremes shows around a 3 % chance of flows remaining exceptionally high (or higher) in early 2023 in the Wessex region, with a zero chance of persistent high flows in the northerly regions (Fig. 7b).
For both case studies, there are differences between the monthly percentages of recovery and persistence estimated from the WBM UNSEEN ensemble and the WBM Obs ensemble (coloured bars vs. outlined bars). The percentages derived from the WBM UNSEEN ensemble appear to vary more smoothly from month to month than those derived from the much smaller WBM Obs ensemble, and the larger ensemble size means that the rarer persistent extremes should be estimated more robustly. The general patterns for recovery to normal flows are relatively similar, but the patterns for persistence of exceptionally extreme flows are more different. In some regions there are persistent extremes in the WBM UNSEEN ensemble that do not exist at all in the WBM Obs ensemble (e.g. Wessex for the summer 2022 drought lasting into 2023 and Thames and Severn-Trent for the autumn 2023 flood lasting into 2024), but in other regions there are persistent extremes in the WBM Obs ensemble which do not exist in the WBM UNSEEN ensemble (e.g. SE England for the summer 2022 drought lasting into 2023 and Yorkshire for the autumn 2023 flood lasting into 2024).
4.1 Case study outcomes
Both the flood and the drought case studies demonstrate the potential of using the large ensemble of UNSEEN climate data in combination with a simple grid-based national-scale hydrological model. The modelling chain provides a large set of plausible events including extremes outside the range from use of observed data, with the lowest flows around 28 % lower on average for the summer 2022 drought study and the highest flows around 42 % higher on average for the autumn 2023 flood study. It enables the investigation of the temporal evolution and spatial dependence of extremes, including the potential timescale and speed of recovery of flows to a normal range and possible persistence of extremes across a number of months.
For the summer 2022 drought case study, Fig. 4 shows the existence of ensemble members giving very low flows through to February 2023, particularly in the Thames and Anglian regions which are more influenced by more slowly responding groundwater systems. In reality, recovery of regional mean flows to normal happened relatively quickly in autumn 2022 (black line), although there were localised drought concerns in parts of eastern England into summer 2023 and concerns about a further drought developing more widely in early 2023 following a dry winter (Sefton et al., 2023b); some ensemble members show this possibility (e.g. realisation 19 from November 1993 in Thames – blue line in Fig. 4).
Chan et al. (2024) also used the summer 2022 drought as a case study to explore storylines of development of extremes into 2023 but using a different seasonal hindcast dataset and only looking at selected catchments and boreholes in the Anglian region of England. They split their large ensemble into four clusters (based on atmospheric circulation indices) and showed that the clusters characterising drier-than-average winters resulted in continuation of the drought into 2023. This highlights a further advantage of the use of large ensembles of climate model data – the ability to characterise the large-scale drivers of extreme events.
For the autumn 2023 flood case study, Fig. 5 shows that the ensemble member giving the highest flows in the Anglian region in November 2023 also gave flows higher than previous records for December 2023 and January 2024, before falling back into the exceptionally high range in February 2024. Also, the ensemble member giving the highest flows in December 2023 in Anglian gave the highest flows in the neighbouring Severn-Trent region. In reality, after a wet December in 2023 (Turner et al., 2024), severe flooding occurred over much of England very early in January 2024, with over 250 flood warnings issued by the Environment Agency and over 1000 properties flooded (https://floodlist.com/europe/united-kingdom/storm-henk-floods-january-2024, August 2024). Flows then dropped back to some extent later in January 2024, following drier weather across much of England (Sefton et al., 2024), before rising again in February 2024, which was exceptionally wet across much of England, leading to record high flows in some catchments (Sefton et al., 2024); some ensemble members show this possibility (e.g. realisation 11 from May 2020 in Anglian – dark red line in Fig. 5).
For each case study, the selection of ensemble members illustrating temporal and spatial variation (Sect. 3.3) focused on those that gave the most extreme flows for any given region and month. However, Sect. 3.4 includes a summary of the percentage of ensemble members where flows remained at least exceptionally extreme by each month. This illustrates a clear possibility of persistent extremes in some regions in the south and east, with the chance of at least exceptionally low flows persisting from summer 2022 into 2023 being ∼ 3 % in Anglian and the chance of at least exceptionally high flows persisting from autumn 2023 into 2024 being ∼ 3 % for Wessex. The selection of ensemble members could also focus on any that give extremely low/high flows across multiple regions to enable study of possible spatially extensive extreme events.
4.2 Limitations of the models and data
The WBM applied here is a very simple monthly hydrological model, which has both advantages and disadvantages. The monthly time step of the model means that it runs very quickly, so it can easily be used for large climate ensembles such as those applied here. However, it also assumes climatological actual evaporation (AE, derived from long historical runs of G2G). The effect of this will likely be less in so-called water-limited areas in the south and east of England (where AE is generally limited by soil water availability, especially in summer) and in so-called energy-limited areas in the north and west of England (where AE is generally limited by potential evaporation), but it could have a larger effect in the more energy–water-balanced areas in between (Kay et al., 2013) and also during more extreme wet/dry periods when AE should probably be higher/lower. This could be the reason for the possible over-estimation of high flows from the WBM Obs n-m run, relative to the WBM Obs 1 m run, which is re-initialised from G2G at the start of each month (Fig. 3). Future work will investigate this possibility and assess whether simple adjustments can be made to the WBM to improve simulation of extreme events.
The WBM also does not account for snow at all; although G2G has an optional snow module (Bell et al., 2016), it is not applied to the long historical runs used to provide data for the setup of the WBM or to the runs used for WBM initialisation. The lack of snow accounting will not have a significant effect for most regions of England most of the time, particularly given the monthly time step of the WBM, as there are very few large and/or long-lasting accumulations of snow in most of England, although it is more important in parts of Scotland (Kay, 2016).
The monthly time step of the WBM, as well as the resolution of the UNSEEN data, is likely sufficient for investigating extremely low flows and droughts, which typically evolve relatively slowly due to rainfall deficits over extended periods of time. For extremely high flows and floods, a finer time step would really be required as they can develop and recede much more quickly, particularly for smaller or flashier catchments. Despite this, the WBM can give a good indication of the flood potential for most of England because the main driver of floods here is soil moisture excess rather than extreme precipitation or snowmelt (Berghuijs et al., 2019). One potential approach could be to use a simple and fast-running model, like the WBM, to run a large ensemble and then to select individual members of interest based on the outcomes from those runs. A much smaller set of runs of a more detailed model, like G2G, could then be performed using the particular members of interest to gain the extra temporal (and spatial) detail, provided (at least) daily precipitation data are available. Only monthly rainfall totals are available for the UNSEEN ensembles applied here, but future options will be investigated.
A simple bias correction was applied to the UNSEEN climate data before use to drive the hydrological model (Sect. 2.1). Applying this correction improved the results of the fidelity testing (not shown), although February in particular still has issues (related to the standard deviation of February rainfall being too low; Sect. 3.1). Bias correction was also applied to climate data prior to use for hydrological modelling by Chan et al. (2023, 2024). Brunner and Slater (2022) apply a bias correction to simulated river flows but highlight that, compared to observation-based estimates of extreme floods, their method can “introduce biases arising from the simulated meteorology and hydrological model”.
The UNSEEN climate datasets provide a large ensemble of alternative historical climate realisations, allowing the direct sampling of more extreme meteorological events than the available observations and a better assessment of the likelihood of events (Thompson et al., 2017; Kelder et al., 2020). When combined with a simple hydrological model, this similarly allows the direct sampling of more extreme hydrological events and better assessment of likelihood. Both are conditional on a demonstration of fidelity for the event of interest.
An important issue for the hydrological modelling component is antecedent conditions. Here, two recent periods, one very dry and one very wet, were selected as case studies to initialise and run the simple hydrological model with the large ensemble of UNSEEN climate data. These case studies illustrate the potential of the approach to assess the temporal evolution and spatial dependence of unprecedented but plausible hydrological extremes. Clearly other periods could be similarly simulated and investigated, for example the summer 1976 drought, which was one of the most extreme and extensive meteorological and hydrological droughts in recent history (Rudd et al., 2017), and the widespread flooding of winter 2013/14, which was the wettest winter in Britain since records began (Kay et al., 2018). The method could also be applied to other countries/regions, with an appropriate hydrological model and using the same or similar global climate ensemble data.
Future work could include analysing the large-scale atmospheric drivers of selected hydrological extremes, whether a record extreme for an individual month or persistently extreme for a number of months, which could improve understanding of extreme events and their evolution. More detailed hydrological modelling, with (at least) daily precipitation data, would ideally be used for flood case studies, when results could also be investigated at a finer spatial scale, and additional hydrodynamic modelling (or pre-modelled design floods) could then provide information on flood extents and impacts (e.g. Kay et al., 2018). Similarly, additional water resource system modelling could provide information on drought impacts (e.g. Borgomeo et al., 2014). Soil moisture extremes could also be investigated, with consequent impacts for agriculture as well as a range of natural hazards (e.g. Kay et al., 2022), and other variables like groundwater levels could be investigated in a similar framework.
Being able to plan for unprecedented but plausible hydrological extremes is important in terms of improving the resilience of water supply systems to drought (Chan et al., 2024) and improving flood risk management and incident response (Brunner and Slater, 2022; Ganapathy et al., 2024). The UK water industry now has a statutory obligation to demonstrate resilience to droughts that are more extreme than those recorded in the past, including very rare events (e.g. 1 in 200 and 1 in 500 years) (Counsell and Durant, 2023). Similarly, for fluvial flood risk management there is a statutory requirement to plan for very extreme (rare) events that may lie outside observational envelopes. In practice this is achieved through stochastic methods (e.g. using weather generators to produce long precipitation series that are then run through hydrological and supply system models) or statistical methods (pooling flood events from many catchments or probable maximum precipitation/flood analyses). The UNSEEN modelling chain described here provides a physically informed alternative to complement these primarily statistical approaches, with potential for use in both long-term water resource/flood risk planning and emergency drought/flood response contexts.
The use of methods such as those presented here, deriving unprecedented events from historical case studies, can aid preparedness by enabling planning for events similar to, but more extreme than, known events (with known responses and impacts). Increasing resilience to potential extremes in the current climate will also provide some resilience to the effects of climate change, which is expected to increase both floods and droughts in the future in the UK (e.g. Lane and Kay, 2021; Kay et al., 2021; Rudd et al., 2019, 2023).
The data are available from the authors upon reasonable request.
The supplement related to this article is available online at: https://doi.org/10.5194/nhess-24-2953-2024-supplement.
Conceptualisation and methodology: all authors. Formal analysis and visualisation: ALK. Funding acquisition: JH. Writing – original draft: ALK. Writing – review and editing: all authors.
The contact author has declared that none of the authors has any competing interests.
Publisher's note: Copernicus Publications remains neutral with regard to jurisdictional claims made in the text, published maps, institutional affiliations, or any other geographical representation in this paper. While Copernicus Publications makes every effort to include appropriate place names, the final responsibility lies with the authors.
This work was supported by the Natural Environment Research Council award number NE/X019063/1 (Hydro-JULES). Thanks go to UKCEH colleague Wilson Chan for comments on the draft manuscript.
This research has been supported by the Natural Environment Research Council (grant no. NE/X019063/1).
This paper was edited by Brunella Bonaccorso and reviewed by Ben Maybee and one anonymous referee.
Barker, L. J., Hannaford, J., Magee, E., Turner, S., Sefton, C., Parry, S., Evans, J., Szczykulska, M., and Haxton, T.: An appraisal of the severity of the 2022 drought and its impacts, Weather, 79, 208–219, https://doi.org/10.1002/wea.4531, 2024.
Beevers, L., Popescu, I., Pregnolato, M., Liu, Y., and Wright, N.: Identifying hotspots of hydro-hazards under global change: A worldwide review, Front. Water, 4, 879536, https://doi.org/10.3389/frwa.2022.879536, 2022.
Bell, V. A., Kay, A. L., Jones, R. G., and Moore, R. J.: Development of a high resolution grid-based river flow model for use with regional climate model output, Hydrol. Earth Syst. Sci., 11, 532–549, https://doi.org/10.5194/hess-11-532-2007, 2007.
Bell, V. A., Kay, A. L., Jones, R. G., Moore, R. J., and Reynard, N. S.: Use of soil data in a grid-based hydrological model to estimate spatial variation in changing flood risk across the UK, J. Hydrol., 377, 335–350, https://doi.org/10.1016/j.jhydrol.2009.08.031, 2009.
Bell, V. A., Davies, H. N., Kay, A. L., Marsh, T. J., Brookshaw, A., and Jenkins A.: Developing a large-scale water-balance approach to seasonal forecasting: application to the 2012 drought in Britain, Hydrol. Process., 27, 3003–3012, https://doi.org/10.1002/hyp.9863, 2013.
Bell, V. A., Kay, A. L., Davies, H. N., and Jones, R. G.: An assessment of the possible impacts of climate change on snow and peak river flows across Britain, Climatic Change, 136, 539–553, https://doi.org/10.1007/s10584-016-1637-x, 2016.
Bell, V. A., Davies, H. N., Kay, A. L., Brookshaw, A., and Scaife, A. A.: A national-scale seasonal hydrological forecast system: development and evaluation over Britain, Hydrol. Earth Syst. Sci., 21, 4681–4691, https://doi.org/10.5194/hess-21-4681-2017, 2017.
Berghuijs, W. R., Harrigan, S., Molnar, P., Slater, L. J., and Kirchner, J. W.: The relative importance of different flood-generating mechanisms across Europe, Water Resour. Res., 55, 4582–4593, https://doi.org/10.1029/2019WR024841, 2019.
Bertola, M., Blöschl, G., Bohac, M., Borga, M., Castellarin, A., Chirico, G. B., Claps, P., Dallan, E., Danilovich, I., Ganora, D., Gorbachova, L., Ledvinka, O., Mavrova-Guirguinova, M., Montanari, A., Ovcharuk, V., Viglione, A., Volpi, E., Arheimer, B., Aronica, G. T., Čanjevac, O. B. , Csik, A., Frolova, N., Gnandt, B., Gribovszki, Z., Gül, A., Günther, K., Guse, B., Hannaford, J., Harrigan, S., Kireeva, M., Kohnová, S., Komma, J., Kriauciuniene, J., Kronvang, B., Lawrence, D., Lüdtke, S., Mediero, L., Merz, B., Molnar, P., Murphy, C., Oskoruš, D., Osuch, M., Parajka, J., Pfister, L., Radevski, I., Sauquet, E., Schröter, K., Šraj, M., Szolgay, J., Turner, S., Valent, P., Veijalainen, N., Ward, P. J., Willems, P., and Zivkovic, N.: Megafloods in Europe can be anticipated from observations in hydrologically similar catchments, Nat. Geosci., 16, 982–988, 2023.
Borgomeo, E., Hall, J. W., Fung, F., Watts, G., Colquhoun, K., and Lambert, C.: Risk-based water resources planning: Incorporating probabilistic nonstationary climate uncertainties, Water Resour. Res., 50, 6850–6873, 2014.
Brunner, M. I. and Slater, L. J.: Extreme floods in Europe: going beyond observations using reforecast ensemble pooling, Hydrol. Earth Syst. Sci., 26, 469–482, https://doi.org/10.5194/hess-26-469-2022, 2022.
Chan, W. C. H., Shepherd, T. G., Facer-Childs, K., Darch, G., and Arnell, N. W.: Storylines of UK drought based on the 2010–2012 event, Hydrol. Earth Syst. Sci., 26, 1755–1777, https://doi.org/10.5194/hess-26-1755-2022, 2022.
Chan, W. C. H., Arnell, N. W., Darch, G., Facer-Childs, K., Shepherd, T. G., Tanguy, M., and van der Wiel, K.: Current and future risk of unprecedented hydrological droughts in Great Britain, J. Hydrol., 625, 130074, https://doi.org/10.1016/j.jhydrol.2023.130074, 2023.
Chan, W. C. H., Arnell, N. W., Darch, G., Facer-Childs, K., Shepherd, T. G., and Tanguy, M.: Added value of seasonal hindcasts to create UK hydrological drought storylines, Nat. Hazards Earth Syst. Sci., 24, 1065–1078, https://doi.org/10.5194/nhess-24-1065-2024, 2024.
Counsell, C. and Durant, M.: Water supply: observed and projected, in: Environment Agency, 2023. Annex to the review of the research and scientific understanding of drought, Environment Agency, Bristol, 669 pp., https://www.gov.uk/government/publications/review-of-the-research-and-scientific-understanding-of-drought (last access: August 2024), 2023.
Cranston, M., Maxey, R., Tavendale, A., Buchanan, P., Motion, A., Cole, S., Robson, A., Moore, R. J., and Minett, A.: Countrywide flood forecasting in Scotland: challenges for hydrometeorological model uncertainty and prediction, in: Weather Radar and Hydrology, Proc. Exeter Symp., April 2011, edited by: Moore, R. J., Cole, S. J., and Illingworth, A. J., IAHS Publ. no. 351, 538–543, 2012.
Davies, P. A., McCarthy, M., Christidis, N., Dunstone, N., Fereday, D., Kendon, M., Knight, J. R., Scaife, A. A., and Sexton, D.: The wet and stormy UK winter of 2019/2020, Weather, 76, 396–402, 2021.
Dawkins, L. C., Osborne, J. M., Economou, T., Darch, G. J. C., and Stoner, O. R.: The Advanced Meteorology Explorer: a novel stochastic, gridded daily rainfall generator, J. Hydrol., 607, 127478, https://doi.org/10.1016/j.jhydrol.2022.127478, 2022.
Dunstone, N., Smith, D., Scaife, A. Hermanson, L., Eade, R., Robinson, N., Andrews, M., and Knight J.: Skilful predictions of the winter North Atlantic Oscillation one year ahead, Nat. Geosci. 9, 809–814, https://doi.org/10.1038/ngeo2824, 2016.
Ganapathy, A., Hannah, D. M., and Agarwal, A.: Improved estimation of extreme floods with data pooling and mixed probability distribution, J. Hydrol., 629, 130633, https://doi.org/10.1016/j.jhydrol.2024.130633, 2024.
Hannaford, J., Turner, S., Alton, J., Lewis, M., and Clemas, S.: Hydrological summary for the United Kingdom: July 2022, UK Centre for Ecology & Hydrology, Wallingford, UK, 12 pp, 2022.
Hannaford, J., Suman, G., Howson, T., Bloomfield, J., Clemas, S.: Hydrological summary for the United Kingdom: October 2023, UK Centre for Ecology & Hydrology, Wallingford, UK, 12 pp, 2023.
Harrigan, S., Prudhomme, C., Parry, S., Smith, K., and Tanguy, M.: Benchmarking ensemble streamflow prediction skill in the UK, Hydrol. Earth Syst. Sci., 22, 2023–2039, https://doi.org/10.5194/hess-22-2023-2018, 2018.
Hough, M. N. and Jones, R. J. A.: The United Kingdom Meteorological Office rainfall and evaporation calculation system: MORECS version 2.0-an overview, Hydrol. Earth Syst. Sci., 1, 227–239, https://doi.org/10.5194/hess-1-227-1997, 1997.
Kay, A. L.: A review of snow in Britain: the historical picture and future projections, Prog. Phys. Geog., 40, 676–698, https://doi.org/10.1177/0309133316650617, 2016.
Kay, A. L.: Simulation of river flow in Britain under climate change: baseline performance and future seasonal changes, Hydrol. Process., 35, e14137, https://doi.org/10.1002/hyp.14137, 2021.
Kay, A. L., Bell, V. A., Blyth, E. M., Crooks, S. M., Davies, H. N., and Reynard, N. S.: A hydrological perspective on evaporation: historical trends and future projections in Britain, J. Water Clim. Change, 4, 193–208, https://doi.org/10.2166/wcc.2013.014, 2013.
Kay, A. L., Booth, N., Lamb R., Raven, E. Schaller, N., and Sparrow, S.: Flood event attribution and damage estimation using national-scale grid-based modelling: Winter 2013/14 in Great Britain, Int. J. Climatol., 38, 5205–5219, https://doi.org/10.1002/joc5721, 2018.
Kay, A. L., Davies, H. N., Lane, R. A., Rudd, A. C., and Bell, V. A.: Grid-based simulation of river flows in Northern Ireland: model performance and future flow changes, J. Hydrol. Regional Studies, 38, 100967, https://doi.org/10.1016/j.ejrh.2021.100967, 2021.
Kay, A. L., Lane, R. A., and Bell, V. A.: Grid-based simulation of soil moisture in the UK: future changes in extremes and wetting and drying dates, Environ. Res. Lett., 17, 074029, https://doi.org/10.1088/1748-9326/ac7a4e, 2022.
Kay, A. L., Bell, V. A., Davies, H. N., Lane, R. A., and Rudd, A. C.: The UKSCAPE-G2G river flow and soil moisture datasets: Grid-to-Grid model estimates for the UK for historical and potential future climates, Earth Syst. Sci. Data, 15, 2533–2546, https://doi.org/10.5194/essd-15-2533-2023, 2023a.
Kay, A. L., Rudd, A. C., and Coulson, J.: Spatial downscaling of precipitation for hydrological modelling: assessing a simple method and its application under climate change in Britain, Hydrol. Process., 37, e14823, https://doi.org/10.1002/hyp.14823, 2023b.
Kelder, T., Müller, M., Slater, L. J., Marjoribanks, T. I., Wilby, R. L., Prudhomme, C., Bohlinger, P., Ferranti, L., and Nipen, T.: Using UNSEEN trends to detect decadal changes in 100-year precipitation extremes, Climate and Atmospheric Science, 3, 47, 2020.
Kelder, T., Marjoribanks, T. I., Slater, L. J., Prudhomme, C., Wilby, R. L., Wagemann, J., and Dunstone, N.: An open workflow to gain insights about low-likelihood high-impact weather events from initialized predictions, Meteorol. Appl., 29, e2065, https://doi.org/10.1002/met.2065, 2022.
Kent, C., Dunstone, N., Tucker, S., Scaife, A. A., Brown, S., Kendon, E. J., Smith, D., McLean, L., and Greenwood, S.: Estimating unprecedented extremes in UK summer daily rainfall, Environ. Res. Lett., 17, 014041, https://doi.org/10.1088/1748-9326/ac42fb, 2022.
Kjeldsen, T. R. and Prosdocimi, I.: Assessing the element of surprise of record-breaking flood events, J. Flood Risk Manag., 11, S541–S553, 2016.
Lane, R. A. and Kay, A. L.: Climate change impact on the magnitude and timing of hydrological extremes across Great Britain, Front. Water, 3, 684982, https://doi.org/10.3389/frwa.2021.684982, 2021.
Met Office, Hollis, D., McCarthy, M., Kendon, M., Legg, T., and Simpson, I.: HadUK-Grid gridded and regional average climate observations for the UK, CEDA, http://catalogue.ceda.ac.uk/uuid/4dc8450d889a491ebb20e724debe2dfb (last access: August 2024), 2021.
Mokhtari, M., Faridi, P., Masoodi, M., and Mehran Ahmadi, S.: Perspective Chapter: A Global View of Natural Hazards Related Disasters (Internet), in: Natural Hazards – New Insights, edited by: Mokhtari, M., IntechOpen, https://doi.org/10.5772/intechopen.111582, 2023.
Price, D., Pilling, C., Robbins, G., Lane, A., Boyce, G., Fenwick, K., Moore, R. J., Coles, J., Harrison, T., and Van Dijk, M.: Representing the spatial variability of rainfall for input to the G2G distributed flood forecasting model: operational experience from the Flood Forecasting Centre, in: Weather Radar and Hydrology, Proc. Exeter Symp., April 2011, edited by: Moore, R. J., Cole, S. J., and Illingworth, A. J., International Association of Hydrological Sciences, IAHS Publ., 351, 532–537, 2012.
Prudhomme, C., Hannaford, J., Harrigan, S., Boorman, D., Knight, J., Bell, V., Jackson, C., Svensson, C., Parry, S., Bachiller-Jareno, N., Davies, H., Davis, R., Mackay, J., McKenzie, A., Rudd, A., Smith, K., Bloomfield, J., Ward, R., and Jenkins, A.: Hydrological Outlook UK: an operational streamflow and groundwater level forecasting system at monthly to seasonal time scales, Hydrolog. Sci. J., 62, 2753–2768, https://doi.org/10.1080/02626667.2017.1395032, 2017.
Reynard, N. S., Kay, A. L., Anderson, M., Donovan, B., and Duckworth, C.: The evolution of climate change guidance for fluvial flood risk management in England, Prog. Phys. Geog., 41, 222–237, https://doi.org/10.1177/0309133317702566, 2017.
Rudd, A. C., Bell, V. A., and Kay, A. L.: National-scale analysis of simulated hydrological droughts (1891–2015), J. Hydrol., 550, 368–385, 2017.
Rudd, A. C., Kay, A. L., and Bell, V. A.: National-scale analysis of future river flow and soil moisture droughts: potential changes in drought characteristics, Climatic Change, 156, 323–340, https://doi.org/10.1007/s10584-019-02528-0, 2019.
Rudd, A. C., Kay, A. L., and Sayers, P. B.: Climate change impacts on flood peaks in Britain for a range of global mean surface temperature changes, J. Flood Risk Manag., 16, e12863, https://doi.org/10.1111/jfr3.12863, 2023.
Sefton, C., Barker, L., Lewis, M., and Clemas, S.: Hydrological summary for the United Kingdom: June 2022, UK Centre for Ecology & Hydrology, Wallingford, UK, 12 pp, 2022.
Sefton, C., Magee, E., Howson, T., Crane, E., and Clemas, S.: Hydrological summary for the United Kingdom: September 2023, UK Centre for Ecology & Hydrology, Wallingford, UK, 12 pp, 2023a.
Sefton, C., Suman, G., Smith, R., Crane, E., and Clemas, S.: Hydrological summary for the United Kingdom: February 2023, UK Centre for Ecology & Hydrology, Wallingford, UK, 12 pp, 2023b.
Sefton, C., Armitage, R., Smith, R., Bloomfield, J., and Clemas, S.: Hydrological summary for the United Kingdom: February 2024, Wallingford, UK, UK Centre for Ecology & Hydrology, 12 pp., 2024.
Shepherd, T. G., Boyd, E., Calel, R. A., et al.: Storylines: an alternative approach to representing uncertainty in physical aspects of climate change, Climatic Change 151, 555–571, https://doi.org/10.1007/s10584-018-2317-9, 2018.
Sillmann, J., Shepherd, T. G., van den Hurk, B., Hazeleger, W., Martius, O., Slingo, J., and Zscheischler, J.: Event-based storylines to address climate risk, Earths Future, 9, e2020EF001783, https://doi.org/10.1029/2020EF001783, 2021.
Svensson, C., Brookshaw, A., Scaife, A. A., Bell, V. A., Mackay, J. D., Jackson, C. R., Hannaford, J., Davies, H. N., Arribas, A., and Stanley, S.: Long-range forecasts of UK winter hydrology, Environ. Res. Lett., 10, 064006, https://doi.org/10.1088/1748-9326/10/6/064006, 2015.
Thompson, V., Dunstone, N. J., Scaife, A. A., Smith, D. M., Slingo, J. M., Brown, S., and Belcher, S. E.: High risk of unprecedented UK rainfall in the current climate, Nat. Commun., 8, 107, https://doi.org/10.1038/s41467-017-00275-3, 2017.
Turner, S., Magee, E., Howson, T., Crane, E., and Clemas, S.: Hydrological summary for the United Kingdom: December 2023, UK Centre for Ecology & Hydrology, Wallingford, UK, 12 pp, 2024.
Williams, K. D., Harris, C. M., Bodas-Salcedo, A., Camp, J., Comer, R. E., Copsey, D., Fereday, D., Graham, T., Hill, R., Hinton, T., Hyder, P., Ineson, S., Masato, G., Milton, S. F., Roberts, M. J., Rowell, D. P., Sanchez, C., Shelly, A., Sinha, B., Walters, D. N., West, A., Woollings, T., and Xavier, P. K.: The Met Office Global Coupled model 2.0 (GC2) configuration, Geosci. Model Dev., 8, 1509–1524, https://doi.org/10.5194/gmd-8-1509-2015, 2015.