the Creative Commons Attribution 4.0 License.
the Creative Commons Attribution 4.0 License.
 | 30 Jan 2024
Rain-on-snow responses to warmer Pyrenees: a sensitivity analysis using a physically based snow hydrological model
Josep Bonsoms
Esteban Alonso-González
César Deschamps-Berger
Marc Oliva
Climate warming is changing the magnitude, timing, and spatial patterns of mountain snowpacks. A warmer atmosphere may also induce precipitation phase shifts, resulting in a decreased snowfall fraction (Sf). The combination of Sf and snowpack directly influences the frequency and intensity of rain-on-snow (ROS) events, a common cause of flash-flood events in snow-dominated regions. In this work, we investigate ROS patterns and their sensitivity to temperature and precipitation changes in the Pyrenees by modeling ROS through a physically based snow model. This model is forced with reanalysis climate data for elevations of 1500, 1800, and 2400 m perturbed using a range of temperature and precipitation values consistent with 21st century climate projections. ROS patterns are characterized by their frequency, rainfall quantity, and snow ablation. The highest ROS frequency for the historical climate period (1980–2019) is found in the 2400 m zones of the southwest Pyrenees (17 d yr−1). The maximum ROS rainfall amount is detected in 1800 m areas of the southeast (45 mm d−1, autumn), whereas the highest ROS ablation is found in the 2400 m zones of the northwest (−10 cm d−1, summer). When air temperature increases from 1 to 4 ∘C compared to the historical climate period, ROS rainfall amount and frequency increase at a constant rate during winter and early spring for all elevation zones. For the rest of the seasons, non-linear responses of ROS frequency and ablation to warming are found. Overall, ROS frequency decreases in the shoulders of the season across eastern low-elevation zones due to snow cover depletion. However, ROS increases in cold, high-elevation zones where long-lasting snow cover exists until late spring. Similarly, warming induces greater ROS ablation (+10 % ∘C−1) during the coldest months of the season, 2400 m elevations, and northern sectors, where the deepest snow depths are found. In contrast, small differences in ROS ablation are found for warm and marginal snowpacks. These results highlight the different ROS responses to warming across the mountain range, suggest similar ROS sensitivities in near-mid-latitude zones, and will help anticipate future ROS impacts in hydrological, environmental, and socioeconomic mountain systems.
- Article
(938 KB) - Full-text XML
-
Supplement
(690 KB) - BibTeX
- EndNote


Mountain snowpacks supply large hydrological resources to the lowlands (García-Ruiz et al., 2011; Viviroli et al., 2011; Immerzeel et al., 2020), with important implications for ecological (Wipf and Rixen, 2010) and socioeconomic systems, providing hydroelectricity (Beniston et al., 2018) and supporting winter tourism activities (Spandre et al., 2019). However, climate warming is altering mountain snowfall patterns (Hock et al., 2019) by decreasing the snowfall fraction (Sf) (Lynn et al., 2020), leading in some cases to rain-on-snow (ROS) events in snow-covered areas, where they did not occur (often) before. The upward temperature trend in mountain regions (Pepin et al., 2022) is likely to change future ROS frequency in snow-dominated areas (López-Moreno et al., 2021).
ROS has relevant impacts on mountain ecosystem dynamics (Hock et al., 2019). The liquid water percolation in the snowpack due to a ROS event creates ice layers and could alter its stability (Rennert et al., 2009). In severe ROS events, water percolation reaches the ground, and the subsequent water freezing causes latent heat releases, leading to soil (and permafrost) warming (Westermann et al., 2011). Positive heat fluxes during ROS events enhance snow runoff (Corripio and López-Moreno, 2017), especially in warm and wet snowpacks (Würzer et al., 2016). ROS can also induce snow avalanches in mountain zones (Conway and Raymond, 1993), contribute to flash flood events (Surfleet and Tullos, 2013), affect tundra ecosystems (Hansen et al., 2014), and impact herbivore populations (Kohler and Aanes, 2004).
Different ROS frequency trends have been found over the previous decades. In the western United States, from 1949 to 2003, McCabe et al. (2007) found a general ROS frequency decrease at 1500 m but an increase in high elevations. Similarly, the analysis of six major German basins from 1990 to 2011 revealed a downward ROS frequency trend during spring at low and high elevations (Freudiger et al., 2014). In contrast, from 1979 to 2014, no winter ROS frequency trends were found across the entire Northern Hemisphere (Cohen et al., 2015). ROS projections for the end of the 21st century suggest a general ROS frequency increase in cold regions and high-elevation zones (Hock et al., 2019). This is projected for Alaska (Bieniek et al., 2018), Norway (Mooney and Li, 2021), the western United States (Musselman et al., 2018), Canada (Il Jeong and Sushama, 2018), or Japan (Ohba and Kawase, 2020). In European mid-latitude mountain ranges, such as the Alps, ROS frequency is expected to increase at high-elevation areas but decrease at low-elevation sectors (Beniston and Stoffel, 2016; Morán-Tejeda et al., 2016). López-Moreno et al. (2021) compared the ROS sensitivity to climate warming across 40 global basins and detected the highest ROS frequency decreases in low-elevation and warm Mediterranean mountain sites. Despite the increasing understanding of ROS spatiotemporal past and future trends, little is known about the ROS sensitivity to climate warming across southern European mountain ranges, such as the Pyrenees.
Here, we examine the ROS sensitivity to temperature and precipitation changes for low (1500 m), middle (1800 m), and high (2400 m) elevations of the Pyrenees. ROS responses to temperature and precipitation are analyzed using a physically based snow model, forced with reanalysis climate data (1980–2019 period) perturbed according to a range of temperature and precipitation changes consistent with 21st century climate projections for the mountain range (Amblar-Francés et al., 2020). Previous studies in alpine zones have shown different ROS responses to warming depending on the area and month of the season (e.g., Morán-Tejeda et al., 2016). For this reason, results are focused on these two factors. First, we analyze height of snow (HS) and snowfall fraction (Sf) responses to temperature and precipitation since these are the main variables that control ROS events (López-Moreno et al., 2021). Next, we examine ROS patterns and their response to warming using three key ROS indicators, namely
- a.
number of ROS days for a season (ROS frequency),
- b.
average rainfall quantity during a ROS day (ROS rainfall amount), and
- c.
average daily snow ablation during a ROS day (ROS ablation).
The study area is presented in Sect. 2. Section 3 describes the data and methods. Section 4 presents the results. Finally, in Sect. 5 we discuss the anticipated ROS spatiotemporal changes, their socio-environmental impacts, and hazards.
The Pyrenees mountain range is located between the Atlantic Ocean (west) and the Mediterranean Sea (east) and constitutes the largest (∼ 450 km) mountain range of the Iberian Peninsula. Elevation increases towards the central massifs, where the highest peaks are found (e.g., Aneto, 3404 m a.s.l.). Glaciers expanded during the Little Ice Age and nowadays are only found the highest mountain summits (Vidaller et al., 2021). The regional annual 0 ∘C isotherm lies at approximately 2700 m (Del Barrio et al., 1990) and at about 1600 m during the cold season (López-Moreno and Vicente-Serrano, 2007). The elevation lapse rate is roughly 0.5∘ per 100 m, being slightly lower during winter (Navarro-Serrano and López-Moreno, 2017). Average annual precipitation is approximately 1000 mm yr−1 at 1000 m (Bonsoms and Ninyerola, 2023). Maximum values are found in the northwestern (NW) massifs, decreasing towards the southeastern (SE) area (Lemus-Canovas et al., 2019). Precipitation is predominantly (> 90 %) solid above 1600 m from November to May (López-Moreno, 2005). Due to the mountain alignment, relief configuration, and the distance to the Atlantic Ocean, seasonal snow accumulations on the northern slopes (approximately 500 cm per season) almost double those recorded in the SE area at the same elevations (roughly 2000 m) (Bonsoms et al., 2021a). In the western and central area of the southern slopes of the range (SW sector, Fig. 1), snow accumulation is influenced by Atlantic wet and mild flows, which are linked with negative North Atlantic Oscillation (NAO) phases (SW and W synoptic weather types) (López-Moreno, 2005; Alonso-González et al., 2020b; Bonsoms et al., 2021b). Positive Western Mediterranean Oscillation (WeMO) phases (NW and NE synoptic weather types) control the snow patterns in the northeastern (NE) slopes of the range (Bonsoms et al., 2021b). Generally, snow ablation starts in February at low elevations and in May at high elevation. The energy available for snow ablation during spring is controlled by net radiation, while turbulent heat flux increases toward the SE zones of the mountain range (Bonsoms et al., 2022).
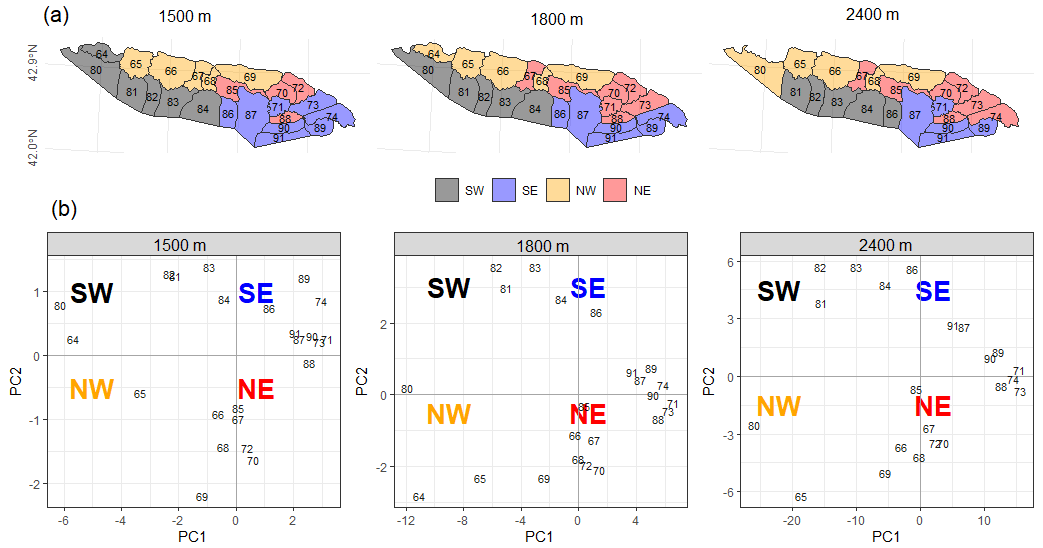
Figure 1(a) Pyrenean massifs sectors (colors) for 1500, 1800, and 2400 m. Massifs were categorized through principal component analysis (PCA) applied to monthly height of snow (HS) data for each massif and elevation range, considering all months and years of the historical climate period (1980–2019). (b) PCA scores for each massif at 1500, 1800, and 2400 m elevation. The black numbers represent the SAFRAN massif's identity numbers as defined by Vernay et al. (2022). Note that the 2400 m elevation range does not include massif number 64, as this massif does not reach that elevation.
3.1 Snow model description
The snowpack is simulated using the energy and mass balance snow model FSM2 (Essery, 2015). The FSM2 model was forced at an hourly resolution for each massif and elevation range (see Sect. 3.3) during the historical climate period (1980–2019) and perturbed using a range of values of temperature and precipitation changes consistent with 21st century climate projections (see Sect. 3.4). Sf was quantified using a threshold approach. Precipitation was considered snowfall when the temperature was < 1 ∘C, in accordance with previous ROS research in the study zone (Corripio and López-Moreno, 2017) and the average rain–snow temperature threshold for the Pyrenees (Jennings et al., 2018). Snow cover fraction is calculated by a linear function of snow depth, and snow albedo is estimated based on a prognostic function with the new snowfall. Snow thermal conductivity is estimated based on snow density, and liquid water percolation is calculated based on a gravitational drainage. The compaction rate is simulated from overburden and thermal metamorphism. Atmospheric stability is estimated through Richardson number stability functions to simulate latent and sensible heat fluxes. The selected FSM2 configuration includes three snow layers and four soil layers. The full details of the FSM2 configuration used in the present study are shown in Table S1 in the Supplement. This FSM2 model and configuration were previously validated in the Pyrenees by Bonsoms et al. (2023). FSM2 has been successfully used in snow model sensitivity studies in alpine zones (Günther et al., 2019) and implemented in a variety of alpine conditions, including the mountains of the Iberian Peninsula (Alonso-González et al., 2019), Spanish Sierra Nevada (Collados-Lara et al., 2020), and forest environments (Mazzotti et al., 2020). The FMS2 has also been integrated in snow data assimilation schemes in combination with remote-sensing data (Alonso-González et al., 2022).
3.2 Atmospheric forcing data
The FSM2 model was forced with the SAFRAN meteorological system reanalysis dataset for flat terrain (Vernay et al., 2022). The SAFRAN meteorological system integrates meteorological simulations, remote-sensing cloud cover data, and instrumental records through data assimilation. SAFRAN is forced with a combination of ERA-40 reanalysis (1958 to 2002) and the numerical weather prediction model ARPEGE (2002 to 2020). The SAFRAN system was originally designed for hazard forecasting (Durand et al., 1999, 2009). SAFRAN has been extensively validated as meteorological forcing data for snow modeling in complex alpine terrain (Revuelto et al., 2018; Deschamps-Berger et al., 2022), studying long-term snow evolution (Réveillet et al., 2022), avalanche hazard forecasting (Morin et al., 2020), snow climate projections (Verfaillie et al., 2018), snow depth (López-Moreno et al., 2020), and spatiotemporal trends in energy heat fluxes (Bonsoms et al., 2022).
3.3 Spatial areas
The SAFRAN system provides data at an hourly resolution from 0 to 3600 m, in intervals of 300 m, grouped by massifs. The SAFRAN massifs (polygons in Fig. 1) were selected for their relative topographical and climatological similarities (Durand et al., 1999). We chose SAFRAN specific elevation bands of 1500 m (low), 1800 m (middle), and 2400 m (high). To preserve the main spatial differences across the mountain range, reduce data dimensionality, and capture the maximum variance; massifs with similar interannual snow characteristics were grouped into sectors using principal component analysis (PCA). PCA is a widely applied statistical method for climatological and snow spatial regionalization (e.g., López-Moreno and Vicente-Serrano, 2007; Schöner et al., 2019; Alonso-González et al., 2020a; Matiu et al., 2021; Bonsoms et al., 2022). A PCA was applied to HS data for all months and years of the historical climate period. Massifs were categorized into four groups based on the maximum correlation to the first (PC1) and second (PC2) scores. Pyrenean sectors were named southwest (SW), southeast (SE), northwest (NW), and northeast (NE) according to their geographical position. Figure 1 displays the resulting Pyrenean regionalization for elevations of 1500, 1800, and 2400 m, as well as the SAFRAN massifs.
3.4 Sensitivity analysis
ROS season extension was determined based on ROS occurrences during the historical climate period. For the purposes of this research, seasons are categorized as follows: October and November (autumn); December, January, and February (winter); March, April, May, and June (spring); and July (summer). August and September are excluded due to the absence of regular snow cover. Sf, HS, and ROS sensitivity to air temperature and precipitation are analyzed by perturbing climate data (López-Moreno et al., 2013; Pomeroy et al., 2015; Marty et al., 2017; Musselman et al., 2017b; Rasouli et al., 2019; Alonso-González et al., 2020a; López-Moreno et al., 2021). Specifically, SAFRAN reanalysis climate data were perturbed according to Spanish Meteorological Agency air temperature and precipitation projections for the 21st century in the Pyrenees (Amblar-Francés et al., 2020). Precipitation was increased (+10 %), left unchanged (0 %), and decreased (−10 %). Air temperature (∘C) was perturbed between +1 and +4 ∘C in steps of 1 ∘C. Incoming longwave radiation was increased due to warming, by applying the Stefan–Boltzmann law, using the Stefan–Boltzmann constant (σ; W m−2 K−4), and the hourly atmospheric emissivity (ϵt) derived from SAFRAN air temperature and incoming longwave radiation:
where Ta is air temperature and LWin is incoming longwave radiation. An increase in air temperature of 1 ∘C can be interpreted as a low-emission scenario for the region, while 2 and 4 ∘C would represent projections for middle- and high-emission scenarios, respectively (Pons et al., 2015). The range of ±10 % for precipitation includes the expected changes in precipitation according to most climate models, irrespective of the emission scenario (López-Moreno et al., 2008; Pons et al., 2015; Amblar-Francés et al., 2020).
3.5 ROS definition and indicators
The average sensitivity of HS and Sf to temperature and precipitation (expressed as % ∘C−1 of local warming) is calculated as the average seasonal HS and Sf anomalies compared to the historical climate period, divided by degree of warming. ROS days are classified when the daily rainfall amount is ≥10 mm and HS≥0.1 m (Musselman et al., 2018; López-Moreno et al., 2021). ROS frequency corresponds to the number of ROS days. ROS rainfall amount (mm d−1) represents the average daily rainfall (mm) during a ROS day. ROS ablation is the average daily snow ablation (cm d−1) during a ROS day. The average daily snow ablation is determined by the daily average HS difference between 2 consecutive days (Musselman et al., 2017a). Only the days when a negative HS difference occurred were selected.
We present an analysis of Sf, HS, and ROS patterns in response to temperature and precipitation changes. The spatiotemporal dynamics of ROS are examined in terms of frequency, rainfall quantity, and snow ablation. Given the identified non-linear sensitivity of ROS to temperature, the values of ROS indicators are displayed as a function of changes in temperature and precipitation amounts, categorized by elevation and sectors, namely SW, SE, NW, and NE.
4.1 HS and Sf response to temperature and precipitation changes
Figure 2 show the response of HS and Sf to temperature and precipitation. The seasonal variability of HS and Sf is primarily influenced by temperature, season, elevation, and spatial sectors. As shown in Figs. 2 and S1, S2, and S3 in the Supplement, precipitation variability plays a moderate to low role in seasonal HS evolution. At an elevation of 2400 m, an upward trend in precipitation (> 10 %) can counterbalance small temperature increments (< 1 ∘C) from December to February (Fig. S3). Consequently, precipitation was excluded from further analysis. While snow at 1500 and 1800 m elevations is rarely simulated during summer, marginal snow cover at 2400 m elevation can persist until June and July, particularly in the wettest sectors of the range (NW and SW). The response of seasonal HS and Sf to temperature exhibits large seasonality. The average HS reduction is 39 % ∘C−1, 37 % ∘C−1, and 28 % ∘C−1 for 1500, 1800, and 2400 m elevations, respectively. However, important differences are found depending on the season and degree of warming (Figs. 2 and 3). Maximum HS and Sf reductions occur at 1500 and 1800 m elevations during the shoulders of the season (autumn and spring). At these elevations, the maximum HS decreases (52 % over the historical climate period) are simulated for spring when the temperature is increased 1 ∘C. The greatest HS decreases in areas at 2400 m elevation are simulated for summer (54 % HS decrease for 1 ∘C). If temperatures reach maximum values (+4 ∘C), seasonal HS is reduced by 92 %, 89 %, and 79 % for elevations of 1500, 1800, and 2400 m, respectively.
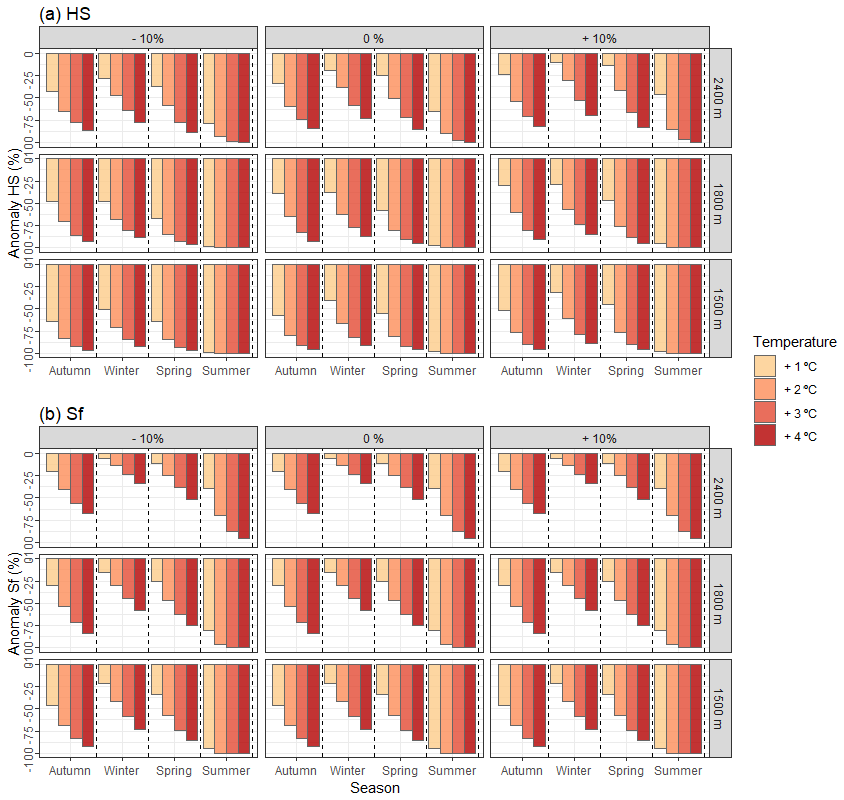
Figure 2Seasonal (a) height of snow (HS) and (b) snowfall fraction (Sf) anomalies with respect to the historical climate period (1980–2019). Data are shown by different increments of temperature (colors) grouped by precipitation changes and elevations (boxes).
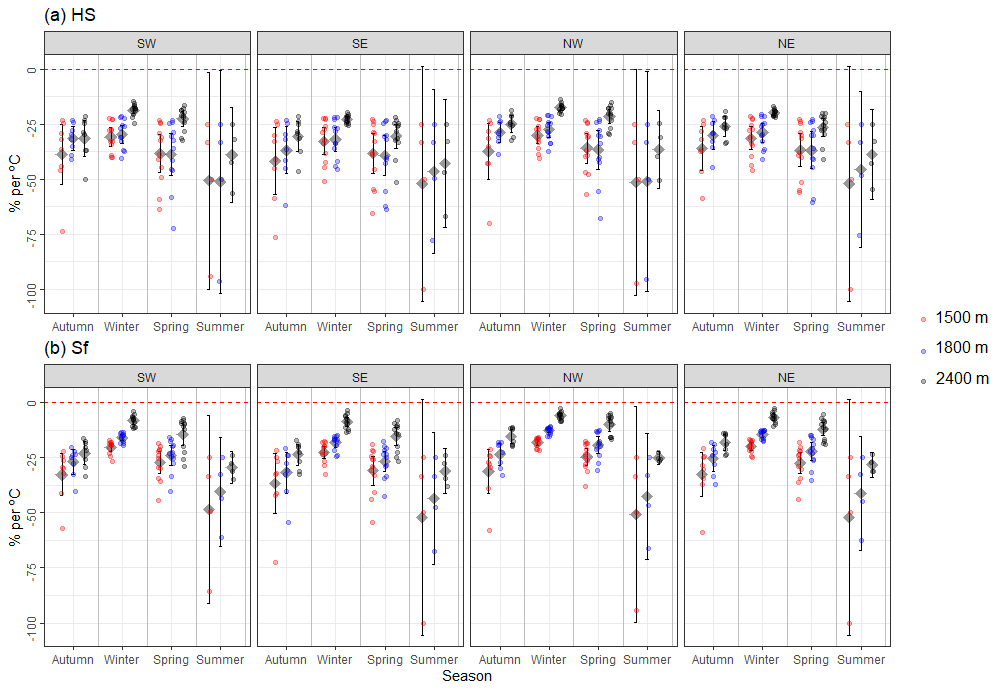
Figure 3Seasonal (a) height of snow (HS) and (b) snowfall fraction (Sf) anomalies over the historical climate period (1980–2019). Data are shown by elevation (colors), season (x axis), and sectors (boxes). Points represent the average seasonal HS and Sf anomalies grouped by the month of the season and increment of temperature (from 1 to 4 ∘C, with increments of 1 ∘C). The black diamond point indicates the mean, whereas the upper and lower error bars show the Gaussian confidence based on the normal distribution. Data represent the average of the simulated precipitation change (from −10 % to 10 %, with increments of 10 %).
Sf shows lower sensitivity to warming than HS, with maximum reductions in autumn. On average, Sf decreases by 29 % ∘C−1, 22 % ∘C−1, and 12 % ∘C−1 for elevations of 1500, 1800, and 2400 m, respectively. An increase of 4 ∘C leads to Sf reductions of 80 %, 69 %, and 49 % for elevations of 1500, 1800, and 2400 m. Regardless of the elevation band and season, the SE sector exhibits the greatest HS and Sf decreases (41 % ∘C−1 and 35 % ∘C−1, respectively). In contrast, minimum reductions are expected on the northern slopes (NW and NE).
4.2 ROS frequency
During the historical climate period, the annual ROS frequency totals, on average, 10, 12, and 10 d per season for elevations of 1500, 1800, and 2400 m. However, there are large differences depending on the sector. The annual ROS frequency at 1500 m elevation for the historical climate period is 17, 8, 10, and 7 d yr−1 for SW, SE, NW, and NE sectors, respectively (Figs. 4 and S1). The highest annual ROS frequency is simulated at 1800 m elevation, where it is 17, 9, 12, and 9 for SW, SE, NW, and NE sectors. Within 1500 and 1800 m elevations, the maximum ROS frequency is detected in the SW during winter and spring (7 d per season, for both elevations and seasons). The SE and NE Pyrenees exhibit a similar seasonality. The maximum ROS frequency at 1500 m elevation is found in winter (4 and 3 d per season for SE and NE, respectively) and during spring at 1800 m elevation (4 and 3 d for SE and NE, respectively). ROS is rarely simulated in the SE during the latest month of spring (May), which contrasts with the simulated values for the SW (2 and 3 d per month for 1500 and 1800 m elevations, respectively). Comparisons between seasons at 2400 m reveal the maximum ROS frequency during summer, especially in the SW (7 d per season), followed by NW (6 d per season) and NE (2 d per season).
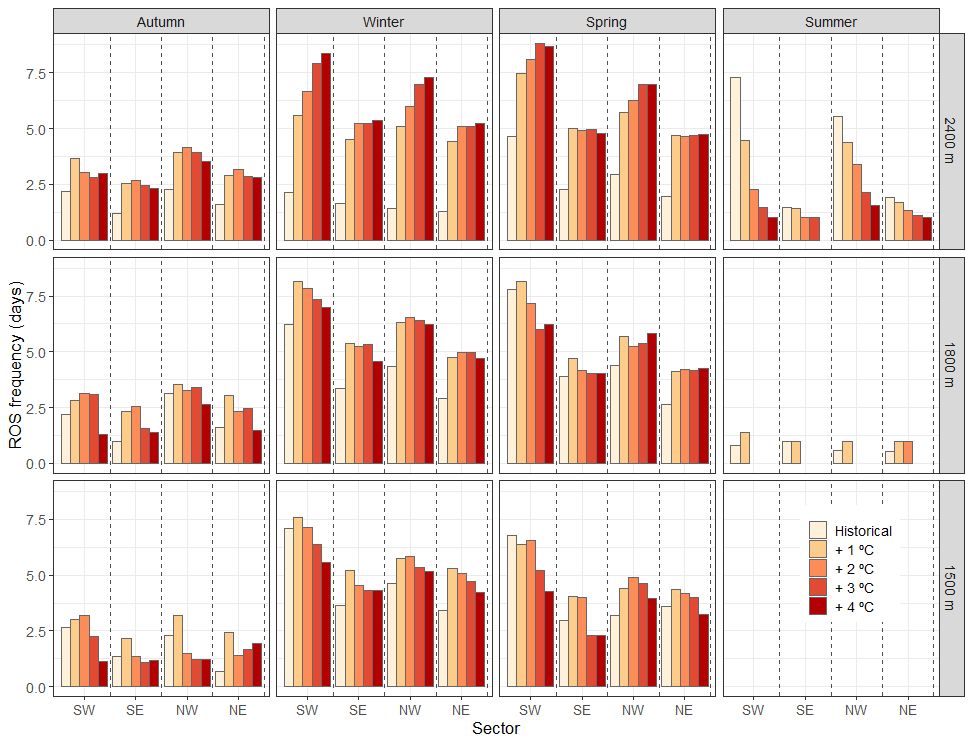
Figure 4ROS frequency (days). Data are presented for the historical climate period (1980–2019) with different increments of temperature (colors), grouped by sector (x axis), and elevations and seasons (boxes). Data represent the average of simulated precipitation change, ranging from −10 % to 10 %, with increments of 10 %.
The ROS frequency response to warming varies depending on the month, increment of temperature, elevation, and sector (Figs. 4, 5 and S4). ROS tends to disappear in October at 1500 m elevation for ≥ 1 ∘C, except in SW. The highest increases are simulated during the winter for temperature lower than 3 ∘C, particularly in NE, where ROS frequency increases by 1 d per month over the historical climate period for 1 ∘C. ROS frequency progressively increases in March and April for all sectors but tends to decrease in May (for ≥ 3 ∘C) and June and July (for ≥ 1 ∘C). At 1800 m elevation, ROS frequency increases in all regions from November to February (around 1 d per month, for ≥ 1 ∘C up to ≤ 3 ∘C). At 1500 m, similar increases are expected in NW and SW during the earliest months of spring for ≤ 2 ∘C (Fig. S4). Conversely, during the latest months of spring in SW, warming reduces ROS events. In addition, ROS events in June are expected to disappear for temperature increases higher than 1 ∘C. Finally, 2400 m elevation shows the largest ROS frequency variations (around 1 d per month for 1 ∘C). Maximum ROS frequency increases (3 d per month) are found in SW for more than +3 ∘C.
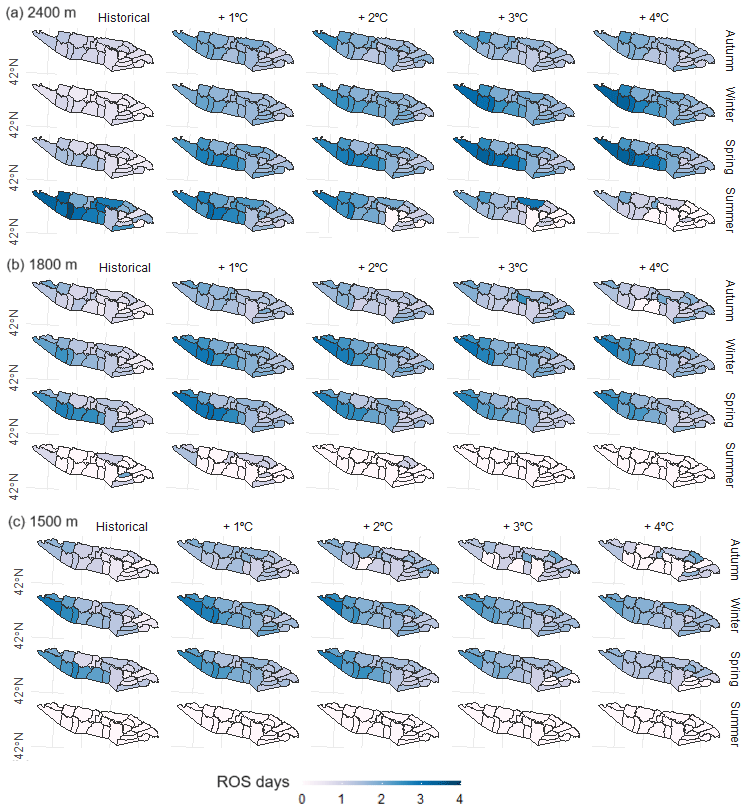
Figure 5ROS frequency (days) for (a) 1500 m, (b) 1800 m, and (c) 2400 m elevations. Data are presented for the historical climate period (1980–2019), increments of temperature (left to right), and seasons (rows). Data represent the average of the simulated precipitation change (ranging from −10 % to 10 %, with increments of 10 %).
4.3 ROS rainfall amount
The spatial and temporal distribution of ROS rainfall amount is presented in Figs. 6 and 7. The average ROS rainfall amount at 1500 m elevation per year is 23, 28, 21, and 20 mm d−1 for SW, SE, NW, and NE sectors, respectively. Similar values are found at 1800 m elevation. The SE sector experiences the highest ROS rainfall amount during autumn and summer (around 40 mm d−1 at 1500 and 1800 m elevations). At 2400 m elevation, however, the maximum ROS rainfall amount values are found in SW and NW during autumn. Here, the largest ROS rainfall amount spatial and seasonal distribution ranges from SW (29 mm d−1, autumn), NW (28 mm d−1, summer), and SE (24 mm d−1, autumn) to NE (23 mm d−1, autumn).
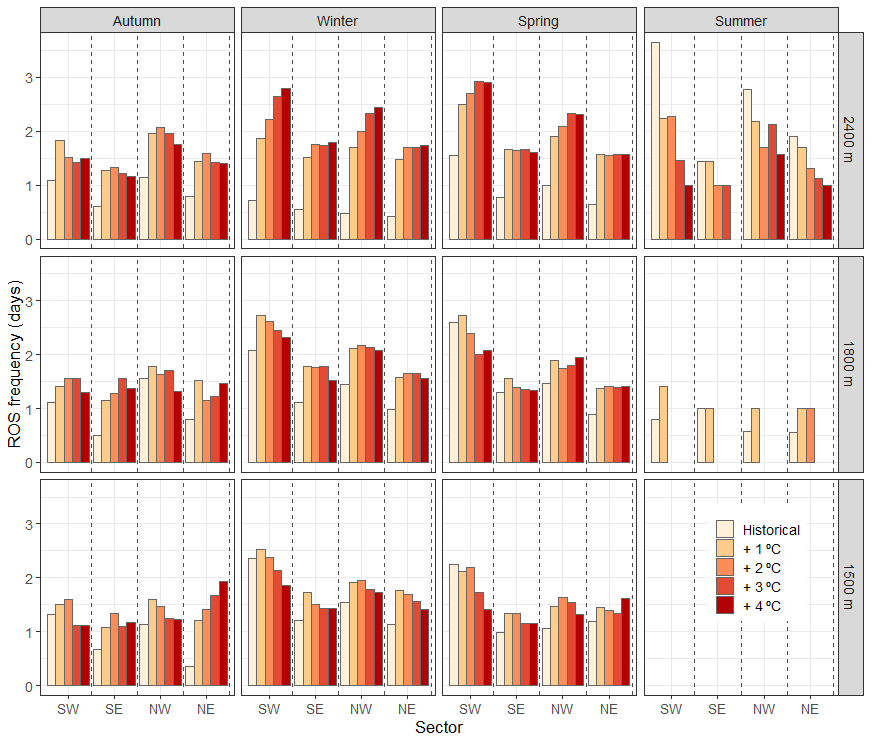
Figure 6Average ROS rainfall amount (mm d−1). Data are presented for the historical climate period (1980–2019) with different increments of temperature (colors), grouped by sector (x axis), and elevations and seasons (boxes). Data represent the average of the simulated precipitation changes (ranging from −10 % to 10 %, with increments of 10 %).
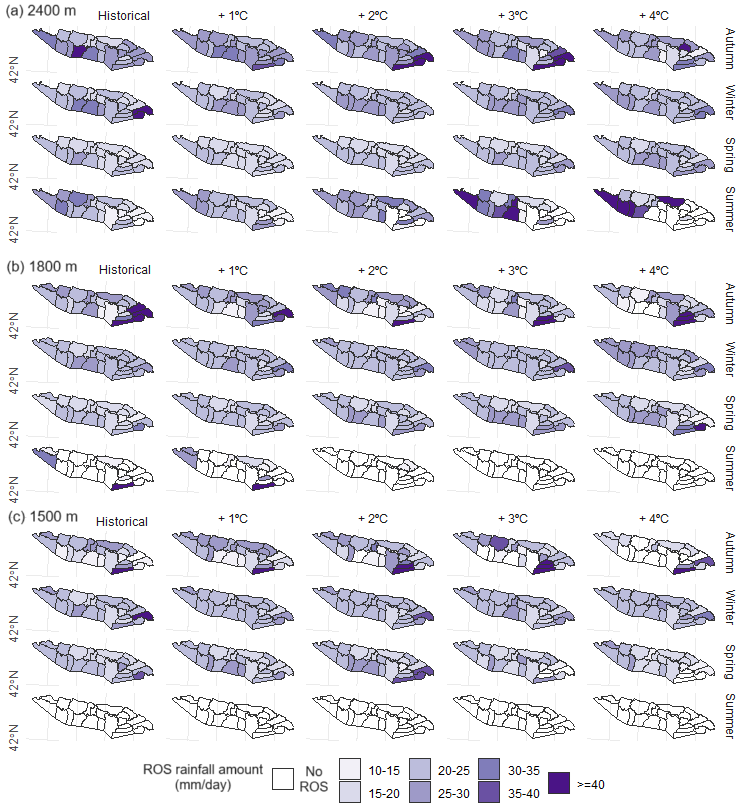
Figure 7Average ROS rainfall amount (mm d−1) for (a) 1500 m, (b) 1800 m, and (c) 2400 m elevation. Data are shown for the historical climate period (1980–2019), increments of temperature (columns), and seasons (rows). Data represent the average of the simulated precipitation changes (ranging from −10 % to 10 %, in increments of 10 %).
ROS rainfall amount progressively increases due to warming (4 % ∘C−1, 4 % ∘C−1, and 5 % ∘C−1 for 1500, 1800, and 2400 m elevations, respectively; Table S2). Small differences are found by elevation and sector. At 1500 m elevation, ROS rainfall amount increases until +3 ∘C and generally decreases for +4 ∘C during the earliest (October to December) and latest (April and May) months of the snow season (Fig. S5). Similar patterns are found at 1800 m elevation. ROS rainfall amount increases up to +4 ∘C, except in the SE sector for specific months. The latter sector also shows maximum ROS rainfall amount values in autumn due to torrential rainfall. At 2400 m elevation, ROS rainfall amount increases at a constant rate of around 5 % ∘C−1. The maximum increases are simulated in SW during summer when ROS rainfall amount almost doubles the historical climate period (+40 % for +4 ∘C).
For most sectors and elevations, the ROS frequency and ROS rainfall amount typically increase during winter and early spring (Fig. 8). The most important increases in ROS frequency and ROS rainfall amount are simulated at 2400 m. Conversely, smaller changes in ROS frequency are observed at elevations of 1500 and 1800 m, particularly with large increments of temperature, despite an expected increase in ROS rainfall amount (< 10 mm d−1). Similarly, during summer, ROS frequency generally decreases across all elevations due to severe warming and snow cover depletion.
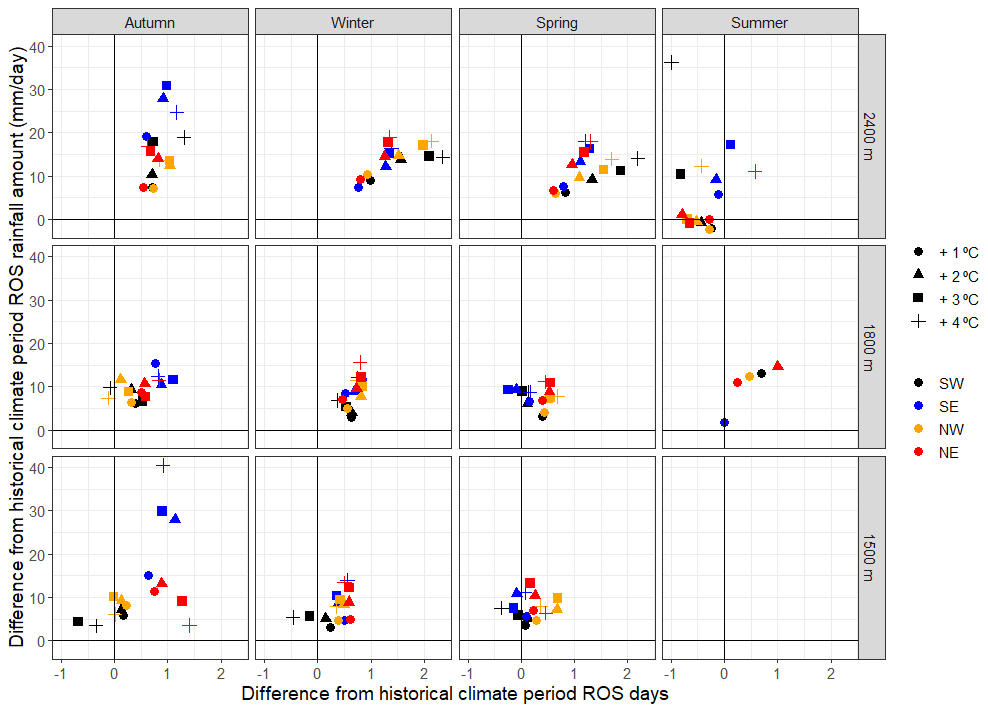
Figure 8Scatterplot between ROS rainfall amount (mm d−1) difference from the historical climate period (1980–2019) (y axis) and ROS days difference from the historical climate period (x axis). Data are calculated as the average difference between (a) the values of the historical climate period values and (b) the values resulting from the different increments of temperature, only for the massifs where ROS frequency exists in panels (a) and (b). Data are presented for each season (columns), elevation (rows), sector (color), and increment of temperature (point shape). Data represent the average of the simulated precipitation change (ranging from −10 % to 10 %, in increments of 10 %).
4.4 ROS ablation
ROS ablation is presented in Figs. 9, 10, and S6. ROS ablation ranges from −10 cm d−1 in NW at 2400 m elevation (summer) to −5 cm d−1 in NE at 2400 m elevation (winter). ROS ablation nearly doubles the average daily snow ablation for all days in a season (Fig. S6). A comparison with the reference historical climate period reveals contrasting ROS ablation changes depending on the season, elevation, and sector. Overall, ROS ablation progressively increases due to warming in coldest zones and months of the season. The largest ROS ablation increments are detected in autumn and winter. ROS ablation in autumn increases at a generally constant rate in SW (11 % ∘C−1), NE (19 % ∘C−1), and NW (4 % ∘C−1). ROS ablation also increases during winter in SW (11 % ∘C−1), NW (14 % ∘C−1), and NE (34 % ∘C−1). The maximum ROS ablation due to warming is found for 1800 m elevation during autumn (Fig. 9). ROS ablation exhibits slow and no changes in the warmest zone (SE), as well as in the warmest months of the season, regardless of the elevation band.
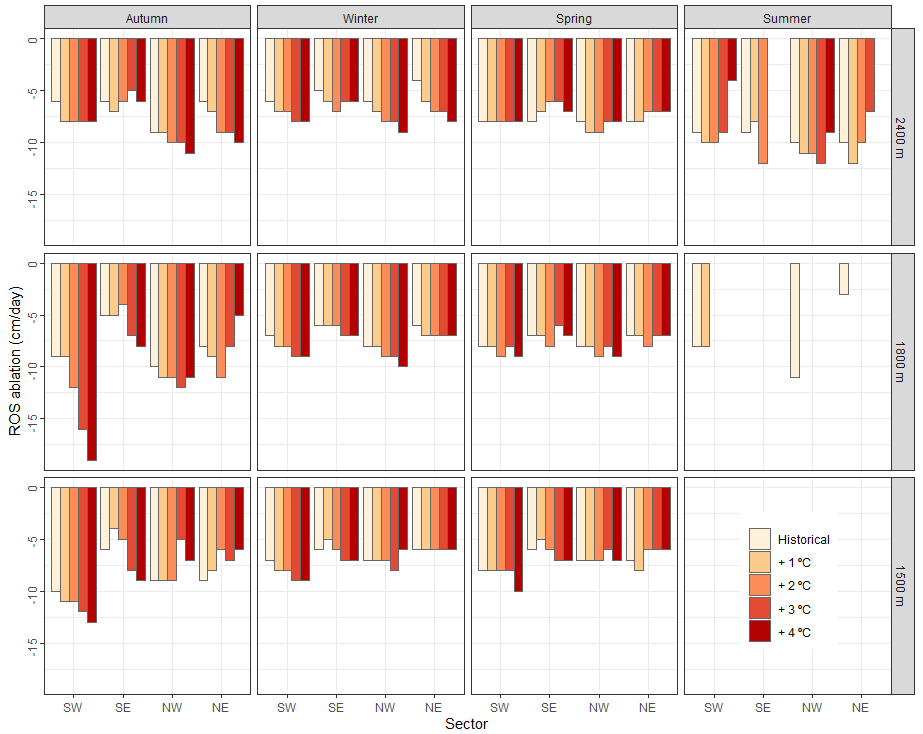
Figure 9Average ROS ablation (cm d−1) for the historical climate period (1980–2019) and increments of temperature (colors), sectors (x axis), and elevations and seasons (boxes). Data represent the average of simulated precipitation change (ranging from −10 % to 10 %, in increments of 10 %).
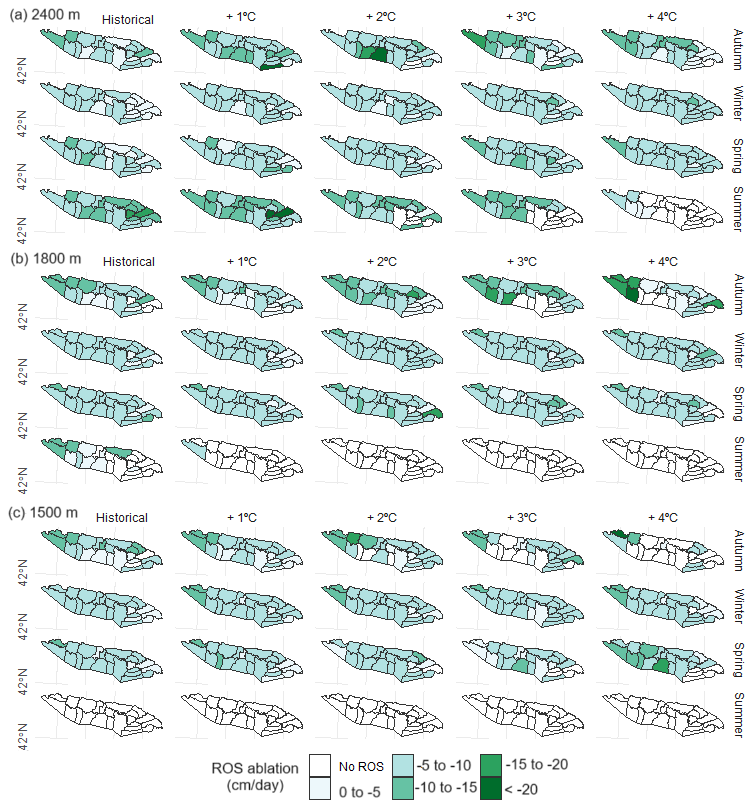
Figure 10Average ROS ablation (cm d−1) for (a) 1500 m, (b) 1800 m, and (c) 2400 m elevations. Data are presented for the historical climate period (1980–2019), increments of temperature (columns), and seasons (rows). Data represent the average of simulated precipitation change (ranging from −10 % to 10 %, in increments of 10 %).
The temperature in the Pyrenees statistically significant increased from 1980 to 2015 (ca. +0.2 ∘C per decade), although no statistically significant precipitation trends have been detected for the same period (OPCC-CTP, 2018). This has been attributed to the strong spatial variability as well as inter-annual and long-term variability of precipitation (Vicente-Serrano et al., 2017; Peña-Angulo et al., 2020). Similarly, snow trends have showed contrasting spatiotemporal patterns depending on the study period and sector. From around 1980 to 2010, non-statistically significant positive trends were generally observed in snow days and snow accumulations at elevations > 1000 m (Buisan et al., 2016), 1800 m (Serrano-Notivoli et al., 2018), and > 2000 m (Bonsoms et al., 2021b). However, long-term trends (1957 to 2017) reveal statistically significant decreases in snow depth at 2100 m, with large variability depending on the sector and the snow indicator (López-Moreno et al., 2020). Climate projections for the end of the 21st century suggest an increase in temperature (> 3 ∘C), coupled with small precipitation shifts (≤ 10 %) from autumn to spring (Amblar-Francés et al., 2020). In this climate context, spatial and temporal ROS patterns are likely to change. To anticipate future ROS patterns, we analyzed ROS sensitivity to warming through three key indicators: ROS frequency, rainfall amount, and ablation.
5.1 ROS spatial variability
HS decreases by 39 % ∘C−1, 37 % ∘C−1, and 28 % ∘C−1 for 1500, 1800, and 2400 m elevations, respectively. Similarly, Sf decreases by 29 % ∘C−1, 22 % ∘C−1, and 12 % ∘C−1 for 1500, 1800, and 2400 m elevations. These results provide evidence of an elevation-dependent snow sensitivity to temperature change and are consistent with snow sensitivity to climate works in near-alpine sectors, such as the Alps (e.g., Martin et al., 1994). HS and Sf exhibit maximum reductions for 1 ∘C, suggesting non-linear HS decreases, in accordance with previous snow sensitivity to climate change reported in the central Pyrenees (López-Moreno et al., 2013). The reported increase in ROS rainfall amount in this work, independent of the increment of temperature and elevation, is explained by the Sf reduction expected for all sectors (Fig. 3). Large increments of warming decrease ROS frequency due to snow cover depletion in early autumn and late spring (Fig. 2). However, for the rest of the seasons, and even with snow cover reductions, the snowpack does not fully disappear, leading to ROS frequency increases due to more rainy days.
The 2400 m elevation shows the largest variation over the historical climate period as well as ROS rainfall amount and frequency (Fig. 8) because of the thicker snowpack and duration compared to 1500 and 1800 m areas. Thus, the 2400 m elevation snow duration lasts until spring and summer, when the largest shift from snowfall to rainfall is found. On the other hand, the 1800 m elevation shows the maximum ROS rainfall amount since the amount of moisture for condensation decreases while air masses increase height (Roe and Baker, 2006). SW and NW annual ROS frequency almost doubles (17 and 12 d yr−1, respectively) the ROS frequency recorded in SE and NE (9 d yr−1, for both sectors). The maximum ROS frequency for a season is found in SW and NW due to thicker snowpacks in this sector (i.e., López-Moreno, 2005; López-Moreno and Vicente-Serrano, 2007; Navarro-Serrano and López-Moreno, 2017; Bonsoms et al., 2021b). Thus, snow cover lasts longer until spring when minimum Sf values are found. SW and NW sectors are the most exposed to SW and W air flows (negative NAO phases) (López-Moreno, 2005), which bring wet and mild conditions over the mountain range, leading to most ROS-related floods in the range (Morán-Tejeda et al., 2019). The maximum ROS rainfall amount is generally detected in May, except in NE (at 2400 m elevation) and SE (all elevations), where ROS rainfall amount tends to disappear in October under large (> 2 ∘C) increments of temperature. The seasonal snow accumulation in the eastern Pyrenees is lower than average due to the lower influence of Atlantic climate in these sectors of the range. In addition, the SE is closer to the 0 ∘C due to higher-than-average sublimation and latent and radiative heat fluxes (Bonsoms et al., 2022), and for this reason in this sector each increment of temperature has larger effects on the Sf, HS, and ROS frequency reduction (Figs. 2 and 3). The largest ROS rainfall amount is detected in SE during autumn (Figs. 6, 7 and S5). This is because sector is exposed to Mediterranean low-pressure systems (negative WeMO phases), which usually trigger heavy rainfall events during autumn (Lemus-Canovas et al., 2021), when snow cover may have already developed at a sufficiently high elevation.
5.2 Comparison with other studies
Recent ROS trends in other mid-latitude areas align with the ROS analysis presented here. Freudiger et al. (2014) analyzed the ROS trends at the Rhine, Danube, Elbe, Weser, Oder, and Ems (central Europe) basins for the period 1950–2011. They observed an overall ROS frequency increase in ROS frequency during January and February from 1990 to 2011, which is consistent with the simulated increase in ROS rainfall amount and frequency in winter for the Pyrenees across all elevations and temperature range increases. Similarly, in the Sitter River (NE Switzerland), a ROS frequency increase of around 40 % (at elevations below 1500 m) and 200 % (at elevations above 2500 m) was detected from 1960 to 2015 (Beniston and Stoffel, 2016). In the western United States, ROS frequency trends showed an upward trend at high elevations and a downward trend at low elevations (McCabe et al., 2007). Similar results were found in southern British Columbia (Loukas et al., 2002) and in Oregon (United States) (Surfleet and Tullos, 2013). The same ROS frequency increases were detected from 1980 to 2010 in Norway at high-elevation mountain zones, while decreases were found at low-elevation zones (Pall et al., 2019). However, in contrast to our results and previous studies, at a hemispheric scale, winter Northern Hemisphere ROS frequency trends during the 1979–2014 period showed no clear trends (Cohen et al., 2015).
Results presented in this work provide further evidence of ROS frequency increases in high-elevation zones, aligning with climate projections and studies on ROS sensitivity to temperature. The elevation-dependent pattern of ROS, previously reported in the Swiss Alps (Morán-Tejeda et al., 2016), is consistent with findings at the Sitter River catchment (NE Switzerland), where a temperature increases of 2 to 4 ∘C over the 1960–2015 period resulted in a 50 % increase in ROS frequency at elevations above 2500 m (Beniston and Stoffel, 2016). Other studies indicate that for climate projections involving ROS definitions that include snow melting (Musselman et al., 2018), natural climate variability contributes to a large extent (70 %) to ROS variability (Schirmer et al., 2022). Li et al. (2019) analyzed future ROS frequency in the conterminous United States and detected a non-linear trend in ROS events due to warming, consistent with the varied ROS rainfall amount and frequency responses simulated in our work based on different temperature increments. Climate projections for the middle to end of the 21st century indicate positive ROS frequency and rainfall trends in western United States and Canada (Il Jeong and Sushama, 2018). Similarly, ROS frequency is projected to decrease in the warmest months of the season in low-elevation areas of western United States but increase at high elevations (Musselman et al., 2018). The same trend is projected for Norwegian mountains (Mooney and Li, 2021). López-Moreno et al. (2021) analyzed ROS sensitivity to warming in 40 worldwide basins and found a decrease in ROS events in warm mountain areas. However, they detected ROS frequency increases in cold-climate mountains with large snow accumulation despite warming. Consistent with our results, they identified large seasonal differences and ROS frequency decreases in Mediterranean mountains due to snow cover depletion in the last months of the snow season.
5.3 ROS ablation
Warming increases ROS ablation from autumn to winter in deep snowpacks and in the coldest sectors of the range. This is attributed to the higher energy for snow ablation and the conditions closer to the 0 ∘C isotherm compared to the historical climate period. Data show no changes and decreases in ROS ablation in the SE during spring since the snowpack is already near to the isothermal conditions. These findings are consistent with results simulated in both cold and warm Pyrenean sites (López-Moreno et al., 2013) and Northern Hemisphere sites (Essery et al., 2020). The ROS ablation indicator is indirectly affected by the magnitude decreases in HS (30 % ∘C−1; Fig. 3), resulting in lower ROS ablation. Previous literature has highlighted the diverse effects of warming on snow ablation patterns. Higher-than-average temperatures advance the peak HS date by an average of 5 d ∘C−1 in elevations of 1800 and 2400 m (Bonsoms and Ninyerola, 2023), leading to earlier onsets of snow ablation, low solar radiation fluxes (López-Moreno et al., 2013; Lundquist et al., 2013; Pomeroy et al., 2015; Musselman et al., 2017a; Sanmiguel-Vallelado et al., 2022), and earlier depletion of snow before the maximum advection of heat fluxes into the snowpack (Bonsoms et al., 2022). Slower snowmelt rates in a warmer climate have been detected in the western United States (Musselman et al., 2017a) and across the entire Northern Hemisphere (Wu et al., 2018). Low or nonexistent changes in snow ablation on warm and marginal snowpacks have been previously detected in the central Pyrenees (López-Moreno et al., 2013), in forest and open areas (Sanmiguel-Valellado et al., 2022), across the entire range (Bonsoms et al., 2022), and in other Iberian mountain ranges outside the Pyrenees (Alonso-González et al., 2020a).
ROS ablation is larger than the average snow ablation during a snow ablation day (Fig. S6) due to higher SEB positive fluxes. Several have examined SEB during ROS events, revealing varying SEB contributions based on the geographical area (Mazurkiewicz et al., 2008; Garvelmann et al., 2014; Würzer et al., 2016; Corripio and López-Moreno, 2017; Li et al., 2019). The energy available for melting during ROS days ranges from net radiation in the Pacific Northwest (Mazurkiewicz et al., 2008) to LWin and turbulent heat fluxes in mountain areas of the conterminous United States (Li et al., 2019) or the Swiss Alps (e.g., Würzer et al., 2016). In general, studies in mid-latitude mountain ranges have indicated that turbulent heat fluxes contribute between 60 % and 90 % of the energy available for snow ablation during ROS days (e.g., Marks et al., 2001; Garvelmann et al., 2014; Corripio and López-Moreno, 2017). The meteorological analysis of a ROS event in the central Pyrenees (at > 2000 m) revealed that ROS ablation exceeds that of a normal ablation day due to the substantial advection of LWin and, especially, sensible heat fluxes (Corripio and López-Moreno, 2017). LWin increases owing to high cloud cover and warm air, commonly observed during ROS events (Moore and Owens, 1984). Future research should analyze the SEB controls during ROS events across the entire mountain range, as well as the hydrological responses of ROS to climate warming.
5.4 ROS socio-environmental impacts and hazards
Temperature-induced changes in the seasonal snowpack and during ROS days suggest remarkable hydrological shifts, including earlier peak flows (Surfleet and Tullos, 2013), rapid streamflow peaks during high-precipitation events in frozen soils (Shanley and Chalmers, 1999), accelerated soil moisture depletion, and reduced river discharges in spring due to earlier snowmelt in the season (Stewart, 2009). The shortening of the snow season due to warming, as reported in this work, has also the potential to alter alpine phenological patterns (i.e., Wipf and Rixen, 2010) and expand forest cover (Szczypta et al., 2015). Although vegetation branches intercept a large amount of snowfall, intermediate and high vegetation shield shortwave radiation, diminish snow wind transport, and reduce turbulent heat fluxes (López-Moreno and Latron, 2008; Sanmiguel-Valellado et al., 2022).
The higher ROS rainfall amount and frequency (Fig. 8) are likely to result in increased hazards and impacts in the mountain ecosystem. Heavy ROS rainfall amounts alter snow metamorphism on saturated snowpacks, leading to rapid water percolation (Singh et al., 1997). Subsequent water refreezing alters snowpack conditions, creating an ice layer in the snowpack that may reach the surface (Rennert et al., 2009). ROS events can cause plant damage (Bjerke et al., 2017), and the ice encapsulation of vegetation in tundra ecosystems can trigger severe wildlife impacts, including starvation among vertebrate herbivores and higher competition between species (Hansen et al., 2014). However, to date, no study has analyzed ROS-related impacts within a changing climate and its impacts on flora and fauna across southern European mountains.
Snow albedo decay due to positive heat fluxes and rainfall in ROS events (Corripio and López-Moreno, 2017) leads to faster snow ablation, even in the subsequent days (e.g., Singh et al., 1997). The combination of changes in internal snowpack processes, increased ROS rainfall amount, and more energy for snow ablation during spring could enhance snow runoff, especially during warm and wet snowpack conditions (Würzer et al., 2016). In snow-dominated regions, ROS can lead to a specific type of avalanching (Conway and Raymond, 1993) and floods (Surfleet and Tullos, 2013). The latter represents the most environmentally damaging risk in Spain (Llasat et al., 2014), with around 50 % of the floods in the Iberian Peninsula attributed to ROS events (Morán-Tejeda et al., 2019). Over half of the historical (1940 to 2012) flood events in the Ésera River catchment (central Pyrenees) occurred during spring (Serrano-Notivoli et al., 2017), coinciding with the snow ablation season. ROS floods have economic impacts; for example, a ROS flood event on June (2013) in the Garonne River (Val d'Aran, central Pyrenees) cost approximately EUR 20 million to the public insurance (Llasat et al., 2014).
5.5 Limitations
This study assesses the sensitivity of ROS responses to temperature and precipitation changes, enhancing our understanding of the non-linear ROS spatiotemporal variations in different sectors and elevations of the Pyrenees. Instead of presenting diverse outputs from climate model ensembles (López-Moreno et al., 2008, 2011), we provide ROS sensitivity values per 1 ∘C, allowing for comparability with other regions and seasons. The temperature and precipitation change values used in this sensitivity analysis are based on established climate projections for the region (Amblar-Francés et al., 2020). However, precipitation projections in the Pyrenees exhibit high uncertainties among different models, emission scenarios, and temporal periods (López-Moreno et al., 2008).
The SAFRAN meteorological system used in this work relies on a topographical spatial division and exhibits and accuracy of around 1 ∘C in air temperature and approximately 20 mm in monthly cumulative precipitation (Vernay et al., 2022). Precipitation phase partitioning methods are subject to uncertainties under close-to-isothermal conditions (Harder and Pomeroy, 2014). Hydrological models are also prone to errors in snowpack prediction (Essery, 2015). However, FSM2 is a multiphysics snowpack model that has been validated previously in the Pyrenees (Bonsoms et al., 2023) and compared against different snowpack models (Krinner et al., 2018), providing evidence of its robustness.
The anticipated reductions in snowfall fraction and height of snow due to climate warming are likely to alter ROS spatiotemporal patterns across the Pyrenees, and, thus, a comprehensive understanding of ROS is needed to anticipate future climate and environmental conditions. This study analyzed ROS sensitivity to temperature by using a physically based snow model with perturbed reanalysis climate data (1980–2019 period) for elevation areas at 1500, 1800, and 2400 m in the Pyrenees. ROS sensitivity to temperature is assessed based on frequency, rainfall intensity, and snow ablation.
Throughout the historical climate period, the annual ROS frequency averages 10, 12, and 10 d per season for elevations at 1500, 1800, and 2400 m, respectively. Higher-than-average annual ROS frequencies are simulated at 1800 m elevation in SW (17 d yr−1) and NW (12 d yr−1), contrasting with the minimum detected in SE (9 d yr−1). Overall, ROS frequency decreases during summer at 2400 m elevation for temperatures exceeding 1 ∘C. When temperature is progressively increased, the greatest ROS frequency increases are found for SW at 2400 m elevation (around 1 d per month ∘C−1). ROS frequency is highly sensitive to warming during the snow onset and offset months when various factors come into play. On the one hand, Sf decreases due to warming, leading to rainfall increases. On the other hand, warming depletes the snowpack in the warmest and driest sectors of the range. Consequently, results suggest a general decrease in ROS frequency for most of the SE massifs, where the snowpack is near the isothermal conditions in the historical climate period. During spring, the highest ROS frequency increases are simulated in SW and NW sectors, as these sectors are less exposed to radiative and turbulent heat fluxes and record higher-than-average seasonal snow accumulations.
ROS rainfall amount generally increases due to warming, regardless of the sector and elevation, although it is constrained by the number of ROS days. The most substantial and constant increments are simulated in spring, with ROS rainfall amount rising at rates of 7 % ∘C−1, 6 % ∘C−1, and 3 % ∘C−1 for 1500, 1800, and 2400 m, respectively. The increase in ROS rainfall amount is influenced by Sf reductions, which decrease at rates of 29 % ∘C−1, 22 % ∘C−1, and 12 % ∘C−1 for 1500, 1800, and 2400 m elevations, respectively. The maximum values of ROS rainfall amount are detected in SE (28 mm d−1), especially at 1800 m elevation during autumn (45 mm d−1), as this sector is exposed to subtropical Mediterranean flows.
Finally, ROS ablation exhibits contrasting patterns depending on the season, sector, and elevation. Generally, ROS ablation increases in cold snowpacks, such as those simulated at 2400 m elevation and during cold seasons (autumn and winter). In these cases, ROS ablation follows a constant ablation rate of around +10 % ∘C−1. However, in the SE and at 1500 m elevation, where marginal and isothermal snowpacks are found, no changes or decreases in ROS ablation are detected due to snowpack reductions in a warmer climate. These results demonstrate the high sensitivity of snow to climate within a mid-latitude mountain range and suggest significant changes with regards to water resources management.
FSM2 is an open-access snow model (Essery, 2015; https://doi.org/10.5194/gmd-8-3867-2015) provided at https://github.com/RichardEssery/FSM2 (Essery, 2023). The SAFRAN climate dataset (Vernay et al., 2022; https://doi.org/10.5194/essd-14-1707-2022) is available through AERIS at https://www.aeris-data.fr/landing-page/?uuid=865730e8-edeb-4c6b-ae58-80f95166509b#v2020.2 (last access: 16 December 2022). Data are available upon request from the first author (josepbonsoms5@ub.edu).
The supplement related to this article is available online at: https://doi.org/10.5194/nhess-24-245-2024-supplement.
JB, JILM, and EAG designed the work. JB analyzed the data and wrote the manuscript. JB, JILM, EAG, CDB, and MO provided feedback and edited the manuscript. JILM and MO supervised the project and acquired funding.
The contact author has declared that none of the authors has any competing interests.
We utilized DeepL (https://www.deepl.com/translator, last access: 18 January 2024) to correct grammar in certain sentences of the manuscript.
Publisher's note: Copernicus Publications remains neutral with regard to jurisdictional claims made in the text, published maps, institutional affiliations, or any other geographical representation in this paper. While Copernicus Publications makes every effort to include appropriate place names, the final responsibility lies with the authors.
This work falls within the research topics examined by the research group Antarctic, Arctic and Alpine Environments (ANTALP; 2017-SGR-1102) funded by the Government of Catalonia, HIDROIBERNIEVE (CGL2017-82216-R) and MARGISNOW (PID2021-124220OB-100), from the Spanish Ministry of Science, Innovation and Universities. Josep Bonsoms is supported by a pre-doctoral university professor FPI grant (no. PRE2021-097046) funded by the Spanish Ministry of Science, Innovation and Universities. The authors are grateful to Pascal Haegeli, Samuel Morin, and an anonymous reviewer for their review of this paper.
This research has been supported by the Ministerio de Ciencia e Innovación (grant nos. PRE2021-097046, 2017-SGR-1102, PID2021-124220OB-100, and CGL2017-82216-R).
We acknowledge support of the publication fee by the CSIC Open Access Publication Support Initiative through its Unit of Information Resources for Research (URICI).
This paper was edited by Pascal Haegeli and reviewed by Samuel Morin and one anonymous referee.
Alonso-González, E., López-Moreno, J. I., Navarro-Serrano, F., Sanmiguel-Vallelado, A., Revuelto, J., Domínguez-Castro, F., and Ceballos, A.: Snow climatology for the mountains in the Iberian Peninsula using satellite imagery and simulations with dynamically downscaled reanalysis data, Int. J. Climatol., 40, 477–491, https://doi.org/10.1002/joc.6223, 2019.
Alonso-González, E., López-Moreno, J. I., Navarro-Serrano, F., Sanmiguel-Vallelado, A., Aznárez-Balta, M., Revuelto, J., and Ceballos, A.: Snowpack Sensitivity to Temperature, Precipitation, and Solar Radiation Variability over an Elevational Gradient in the Iberian Mountains, Atmos. Res., 243, 104973, https://doi.org/10.1016/j.atmosres.2020.104973, 2020a.
Alonso-González, E., López-Moreno, J. I., Navarro-Serrano, F. M., and Revuelto, J.: Impact of North Atlantic Oscillation on the snowpack in Iberian Peninsula mountains, Water-Sui., 12, 105, https://doi.org/10.3390/w12010105, 2020b.
Alonso-González, E., Aalstad, K., Baba, M. W., Revuelto, J., López-Moreno, J. I., Fiddes, J., Essery, R., and Gascoin, S.: The Multiple Snow Data Assimilation System (MuSA v1.0), Geosci. Model Dev., 15, 9127–9155, https://doi.org/10.5194/gmd-15-9127-2022, 2022.
Amblar-Francés, M. P., Ramos-Calzado, P., Sanchis-Lladó, J., Hernanz-Lázaro, A., Peral-García, M. C., Navascués, B., Dominguez-Alonso, M., Pastor-Saavedra, M. A., and Rodríguez-Camino, E.: High resolution climate change projections for the Pyrenees region, Adv. Sci. Res., 17, 191–208, https://doi.org/10.5194/asr-17-191-2020, 2020.
Beniston, M. and Stoffel, M.: Rain-on-snow events, floods and climate change in the Alps: Events may increase with warming up to 4 ∘C and decrease thereafter, Sci. Total Environ., 571, 228–236, https://doi.org/10.1016/j.scitotenv.2016.07.146, 2016.
Beniston, M., Farinotti, D., Stoffel, M., Andreassen, L. M., Coppola, E., Eckert, N., Fantini, A., Giacona, F., Hauck, C., Huss, M., Huwald, H., Lehning, M., López-Moreno, J.-I., Magnusson, J., Marty, C., Morán-Tejéda, E., Morin, S., Naaim, M., Provenzale, A., Rabatel, A., Six, D., Stötter, J., Strasser, U., Terzago, S., and Vincent, C.: The European mountain cryosphere: a review of its current state, trends, and future challenges, The Cryosphere, 12, 759–794, https://doi.org/10.5194/tc-12-759-2018, 2018.
Bieniek, P. A., Bhatt, U. S., Walsh, J. E., Lader, R., Griffith, B., Roach, J. K., and Thoman, R. L.: Assessment of Alaska rain-on-snow events using dynamical downscaling, J. Appl. Meteorol. Clim., 57, 1847–1863, https://doi.org/10.1175/JAMC-D-17-0276.1, 2018.
Bjerke, J. W., Treharne, R., Vikhamar-Schuler, D., Karlsen, S. R., Ravolainen, V., Bokhorst, S., Phoenix, G. K., Bochenek, Z., and Tømmervik, H.: Understanding the drivers of extensive plant damage in boreal and Arctic ecosystems: insights from field surveys in the aftermath of damage, Sci. Total Environ., 599–600, 1965–1976, 2017.
Bonsoms, J. and Ninyerola, M.: Comparison of linear, generalized additive models and machine learning algorithms for spatial climate interpolation, Theor. Appl. Climatol. [preprint], https://doi.org/10.1007/s00704-023-04725-5, 2023.
Bonsoms, J., Franch, F. S., and Oliva, M.: Snowfall and snow cover evolution in the Eastern Pre-Pyrenees (NE Iberian Peninsula), Cuadern. Investig./Geographical Research Letters, 47, 291–307, https://doi.org/10.18172/cig.4879, 2021a.
Bonsoms, J., González, S., Prohom, M., Esteban, P., Salvador-Franch, F., López-Moreno, J. I., and Oliva, M.: Spatio-temporal patterns of snow in the Catalan Pyrenees (NE Iberia), Int. J. Climatol., 41, 5676–5697, https://doi.org/10.1002/joc.7147, 2021b.
Bonsoms, J., López-Moreno, J. I., González, S., and Oliva, M.: Increase of the energy available for snow ablation in the Pyrenees (1959–2020) and its relation to atmospheric circulation, Atmos. Res., 275, 106228, https://doi.org/10.1016/j.atmosres.2022.106228, 2022.
Bonsoms, J., López-Moreno, J. I., and Alonso-González, E.: Snow sensitivity to temperature and precipitation change during compound cold–hot and wet–dry seasons in the Pyrenees, The Cryosphere, 17, 1307–1326, https://doi.org/10.5194/tc-17-1307-2023, 2023.
Buisan, S. T., López-Moreno, J. I., Saz, M. A., and Korchendorfer, J.: Impact of weather type variability on winter precipitation, temperature and annual snowpack in the Spanish Pyrenees, Clim. Res., 69, 79–92, https://doi.org/10.3354/cr01391, 2016.
Cohen, J., Ye, H., and Jones, J.: Trends and variability in rain-on-snow events, Geophys. Res. Lett., 42, 7115–7122, https://doi.org/10.1002/2015GL065320, 2015.
Collados-Lara, A. J., Pulido-Velazquez, D., Pardo-Igúzquiza, E., and Alonso-González, E.: Estimation of the spatio-temporal dynamic of snow water equivalent at mountain range scale under data scarcity, Sci. Total Environ., 741, 140485, https://doi.org/10.1016/j.scitotenv.2020.140485, 2020.
Conway, H. and Raymond, C. F.: Snow stability during rain, J. Glaciol., 39, 635–642, https://doi.org/10.3189/s0022143000016531, 1993.
Corripio, J. G. and López-Moreno, J. I.: Analysis and predictability of the hydrological response of mountain catchments to heavy rain on snow events: A case study in the Spanish Pyrenees, Hydrology, 4, 20, https://doi.org/10.3390/hydrology4020020, 2017.
Del Barrio, G., Creus, J., and Puigdefabregas, J.: Thermal Seasonality of the High Mountain Belts of the Pyrenees, Mt. Res. Dev., 10, 227–233, 1990.
Deschamps-Berger, C., Cluzet, B., Dumont, M., Lafaysse, M., Berthier, E., Fanise, P., and Gascoin, S.: Improving the Spatial Distribution of Snow Cover Simulations by Assimilation of Satellite Stereoscopic Imagery, Water Resour. Res., 58, e2021WR030271, https://doi.org/10.1029/2021WR030271, 2022.
Durand, Y., Giraud, G., Brun, E., Mérindol, L., and Martin, E.: A computer-based system simulating snowpack structures as a tool for regional avalanche forecasting, J. Glaciol., 45, 469–484, https://doi.org/10.3189/s0022143000001337, 1999.
Durand, Y., Laternser, M., Giraud, G., Etchevers, P., Lesaffre, B., and Mérindol, L.: Reanalysis of 44 yr of climate in the French Alps (1958–2002): Methodology, model validation, climatology, and trends for air temperature and precipitation, J. Appl. Meteorol. Clim., 48, 429–449, https://doi.org/10.1175/2008JAMC1808.1, 2009.
Essery, R.: A factorial snowpack model (FSM 1.0), Geosci. Model Dev., 8, 3867–3876, https://doi.org/10.5194/gmd-8-3867-2015, 2015.
Essery, R., Kim, H., Wang, L., Bartlett, P., Boone, A., Brutel-Vuilmet, C., Burke, E., Cuntz, M., Decharme, B., Dutra, E., Fang, X., Gusev, Y., Hagemann, S., Haverd, V., Kontu, A., Krinner, G., Lafaysse, M., Lejeune, Y., Marke, T., Marks, D., Marty, C., Menard, C. B., Nasonova, O., Nitta, T., Pomeroy, J., Schädler, G., Semenov, V., Smirnova, T., Swenson, S., Turkov, D., Wever, N., and Yuan, H.: Snow cover duration trends observed at sites and predicted by multiple models, The Cryosphere, 14, 4687–4698, https://doi.org/10.5194/tc-14-4687-2020, 2020.
Essery, R.: FSM2, GitHub [code], https://github.com/RichardEssery/FSM2, last access: 15 January 2023.
Freudiger, D., Kohn, I., Stahl, K., and Weiler, M.: Large-scale analysis of changing frequencies of rain-on-snow events with flood-generation potential, Hydrol. Earth Syst. Sci., 18, 2695–2709, https://doi.org/10.5194/hess-18-2695-2014, 2014.
García-Ruiz, J. M., López-Moreno, J. I., Vicente-Serrano, S. M., Lasanta-Martínez, T., and Beguería, S.: Mediterranean water resources in a global change scenario, Earth-Sci. Rev., 105, 121–139, https://doi.org/10.1016/j.earscirev.2011.01.006, 2011.
Garvelmann, J., Pohl, S., and Weiler, M.: Variability of observed energy fluxes during rain-on-snow and clear sky snowmelt in a midlatitude mountain environment, J. Hydrometeorol., 15, 1220–1237, https://doi.org/10.1175/JHM-D-13-0187.1, 2014.
Günther, D., Marke, T., Essery, R., and Strasser, U.: Uncertainties in Snowpack Simulations–Assessing the Impact of Model Structure, Parameter Choice, and Forcing Data Error on Point-Scale Energy Balance Snow Model Performance, Water Resour. Res., 55, 2779–2800, https://doi.org/10.1029/2018WR023403, 2019.
Hansen, B. B., Isaksen, K., Benestad, R. E., Kohler, J., Pedersen, Å. Ø., Loe, L. E., Coulson, S. J., Larsen, J. O., and Varpe, Ø.: Warmer and wetter winters: characteristics and implications of an extreme weather event in the High Arctic, Environ. Res. Lett., 9, 114021, https://doi.org/10.1088/1748-9326/9/11/114021, 2014.
Harder, P. and Pomeroy, J.: Hydrological model uncertainty due to precipitation-phase partitioning methods, Hydrol. Process., 28, 4311–4327, https://doi.org/10.1002/hyp.9799, 2014.
Hock, R., Rasul, G., Adler, C., Cáceres, B., Gruber, S., Hirabayashi, Y., Jackson, M., Kääb, A., Kang, S., Kutuzov, S., Milner, A., Molau, U., Morin, S., Orlove, B., and Steltzer, H.: High Mountain Areas, in: IPCC Special Report on the Ocean and Cryosphere in a Changing Climate, edited by: Pörtner, H.-O., Roberts, D. C., Masson-Delmotte, V., Zhai, P., Tignor, M., Poloczanska, E., Mintenbeck, K., Alegría, A., Nicolai, M., Okem, A., Petzold, J., Rama, B., and Weyer, N. M., Cambridge University Press, Cambridge, UK and New York, NY, USA, 131–202, https://doi.org/10.1017/9781009157964.004, 2019.
Il Jeong, D. and Sushama, L.: Rain-on-snow events over North America based on two Canadian regional climate models, Clim. Dynam., 50, 303–316, https://doi.org/10.1007/s00382-017-3609-x, 2018.
Immerzeel, W. W., Lutz, A. F., Andrade, M., Bahl, A., Biemans, H., Bolch, T., Hyde, S., Brumby, S., Davies, B. J., Elmore, A. C., Emmer, A., Feng, M., Fernández, A., Haritashya, U., Kargel, J. S., Koppes, M., Kraaijenbrink, P. D. A., Kulkarni, A. v., Mayewski, P. A., Nepal, S., Pacheco, P., Painter, T. H., Pellicciotti, F., Rajaram, H., Rupper, S., Sinisalo, A., Shrestha, A. B., Viviroli, D., Wada, Y., Xiao, C., Yao, T., and Baillie, J. E. M.: Importance and vulnerability of the world's water towers, Nature, 577, 364–369, https://doi.org/10.1038/s41586-019-1822-y, 2020.
Jennings, K. S., Winchell, T. S., Livneh, B., and Molotch, N. P.: Spatial variation of the rain-snow temperature threshold across the Northern Hemisphere, Nat. Commun., 9, 1148, https://doi.org/10.1038/s41467-018-03629-7, 2018.
Kohler, J. and Aanes, R.: Effect of winter snow and ground-icing on a Svalbard reindeer population: Results of a simple snowpack model, Arct. Antarct. Alp. Res., 36, 333–341, https://doi.org/10.1657/1523-0430(2004)036[0333:EOWSAG]2.0.CO;2, 2004.
Krinner, G., Derksen, C., Essery, R., Flanner, M., Hagemann, S., Clark, M., Hall, A., Rott, H., Brutel-Vuilmet, C., Kim, H., Ménard, C. B., Mudryk, L., Thackeray, C., Wang, L., Arduini, G., Balsamo, G., Bartlett, P., Boike, J., Boone, A., Chéruy, F., Colin, J., Cuntz, M., Dai, Y., Decharme, B., Derry, J., Ducharne, A., Dutra, E., Fang, X., Fierz, C., Ghattas, J., Gusev, Y., Haverd, V., Kontu, A., Lafaysse, M., Law, R., Lawrence, D., Li, W., Marke, T., Marks, D., Ménégoz, M., Nasonova, O., Nitta, T., Niwano, M., Pomeroy, J., Raleigh, M. S., Schaedler, G., Semenov, V., Smirnova, T. G., Stacke, T., Strasser, U., Svenson, S., Turkov, D., Wang, T., Wever, N., Yuan, H., Zhou, W., and Zhu, D.: ESM-SnowMIP: assessing snow models and quantifying snow-related climate feedbacks, Geosci. Model Dev., 11, 5027–5049, https://doi.org/10.5194/gmd-11-5027-2018, 2018.
Lemus-Canovas, M., Lopez-Bustins, J. A., Trapero, L., and Martin-Vide, J.: Combining circulation weather types and daily precipitation modelling to derive climatic precipitation regions in the Pyrenees, Atmos. Res., 220, 181–193, https://doi.org/10.1016/j.atmosres.2019.01.018, 2019.
Lemus-Canovas, M., Lopez-Bustins, J. A., Martín-Vide, J., Halifa-Marin, A., Insua-Costa, D., Martinez-Artigas, J., Trapero, L., Serrano-Notivoli, R., and Cuadrat, J. M.: Characterisation of extreme precipitation events in the Pyrenees: From the local to the synoptic scale, Atmosphere-Basel, 12, 665, https://doi.org/10.3390/atmos12060665, 2021.
Li, D., Lettenmaier, D. P., Margulis, S. A., and Andreadis, K.: The Role of Rain-on-Snow in Flooding Over the Conterminous United States, Water Resour. Res., 55, 8492–8513, https://doi.org/10.1029/2019WR024950, 2019.
Llasat, M. C., Marcos, R., Llasat-Botija, M., Gilabert, J., Turco, M., and Quintana-Seguí, P.: Flash flood evolution in North-Western Mediterranean, Atmos. Res., 149, 230–243, https://doi.org/10.1016/j.atmosres.2014.05.024, 2014.
López-Moreno, J. I.: Recent variations of snowpack depth in the central Spanish Pyrenees, Arct. Antarct. Alp. Res., 37, 253–260, https://doi.org/10.1657/1523-0430(2005)037[0253:RVOSDI]2.0.CO;2, 2005.
López-Moreno, J. I. and Latron, J.: Spatial heterogeneity in snow water equivalent induced by forest canopy in a mixed beech-fir stand in the Pyrenees, Ann. Glaciol. 49, 83–90, https://doi.org/10.3189/172756408787814951, 2008.
López-Moreno, J. I. and Vicente-Serrano, S. M.: Atmospheric circulation influence on the interannual variability of snowpack in the Spanish Pyrenees during the second half of the 20th century, Hydrol. Res., 38, 38–44, https://doi.org/10.2166/nh.2007.030, 2007.
López-Moreno, J. I., Goyette, S., and Beniston, M.: Climate change prediction over complex areas: spatial variability of uncertainties and predictions over the Pyrenees from a set of regional climate models, Int. J. Climatol., 28, 1535–1550, https://doi.org/10.1002/joc.1645, 2008.
López-Moreno, J. I., Goyette, S., Vicente-Serrano, S. M., and Beniston, M.: Effects of climate change on the intensity and frequency of heavy snowfall events in the Pyrenees, Climatic Change, 105, 489–508, https://doi.org/10.1007/s10584-010-9889-3, 2011.
López-Moreno, J. I., Pomeroy, J. W., Revuelto, J., and Vicente-Serrano, S. M.: Response of snow processes to climate change: Spatial variability in a small basin in the Spanish Pyrenees, Hydrol. Process., 27, 2637–2650, https://doi.org/10.1002/hyp.9408, 2013.
López-Moreno, J. I., Soubeyroux, J.M., Gascoin, S., Alonso-González, E., Durán-Gómez, N., Lafaysse, M., Vernay, M., Carmagnola, C., and Morin, S.: Long-term trends (1958–2017) in snow cover duration and depth in the Pyrenees, Int. J. Climatol., 40, 1–15, https://doi.org/10.1002/joc.6571, 2020.
López-Moreno, J. I., Pomeroy, J. W., Morán-Tejeda, E., Revuelto, J., Navarro-Serrano, F. M., Vidaller, I., and Alonso-González, E.: Changes in the frequency of global high mountain rain-on-snow events due to climate warming, Environ. Res. Lett., 16, 094021, https://doi.org/10.1088/1748-9326/ac0dde, 2021.
Loukas, A., Vasiliades, L., and Dalezios, N. R.: Potential climate change impacts on flood producing mechanisms in southern British Columbia, Canada using the CGCMA1 simulation results, J. Hydrol., 259, 163–188, https://doi.org/10.1016/S0022-1694(01)00580-7, 2002.
Lundquist, J. D., Dickerson-Lange, S. E., Lutz, J. A., and Cristea, N. C.: Lower forest density enhances snow retention in regions with warmer winters: A global framework developed from plot-scale observations and modeling, Water Resour. Res., 49, 6356–6370, https://doi.org/10.1002/wrcr.20504, 2013.
Lynn, E., Cuthbertson, A., He, M., Vasquez, J. P., Anderson, M. L., Coombe, P., Abatzoglou, J. T., and Hatchett, B. J.: Technical note: Precipitation-phase partitioning at landscape scales to regional scales, Hydrol. Earth Syst. Sci., 24, 5317–5328, https://doi.org/10.5194/hess-24-5317-2020, 2020.
Marks, D., Link, T., Winstral, A., and Garen, D.: Simulating snowmelt processes during rain-on-snow over a semi-arid mountain basin, Ann. Glaciol., 32, 195–202, https://doi.org/10.3189/172756401781819751, 2001.
Martin, E., Brun, E., and Durand, Y.: Sensitivity of the French Alps snow cover to the variation of climatic variables, Ann. Geophys., 12, 469–477, https://doi.org/10.1007/s00585-994-0469-6, 1994.
Marty, C., Schlögl, S., Bavay, M., and Lehning, M.: How much can we save? Impact of different emission scenarios on future snow cover in the Alps, The Cryosphere, 11, 517–529, https://doi.org/10.5194/tc-11-517-2017, 2017.
Matiu, M., Crespi, A., Bertoldi, G., Carmagnola, C. M., Marty, C., Morin, S., Schöner, W., Cat Berro, D., Chiogna, G., De Gregorio, L., Kotlarski, S., Majone, B., Resch, G., Terzago, S., Valt, M., Beozzo, W., Cianfarra, P., Gouttevin, I., Marcolini, G., Notarnicola, C., Petitta, M., Scherrer, S. C., Strasser, U., Winkler, M., Zebisch, M., Cicogna, A., Cremonini, R., Debernardi, A., Faletto, M., Gaddo, M., Giovannini, L., Mercalli, L., Soubeyroux, J.-M., Sušnik, A., Trenti, A., Urbani, S., and Weilguni, V.: Observed snow depth trends in the European Alps: 1971 to 2019, The Cryosphere, 15, 1343–1382, https://doi.org/10.5194/tc-15-1343-2021, 2021.
Mazurkiewicz, A. B., Callery, D. G., and McDonnell, J. J.: Assessing the controls of the snow energy balance and water available for runoff in a rain-on-snow environment, J. Hydrol., 354, 1–14, https://doi.org/10.1016/j.jhydrol.2007.12.027, 2008.
Mazzotti, G., Essery, R., Webster, C., Malle, J., and Jonas, T.: Process-Level Evaluation of a Hyper-Resolution Forest Snow Model Using Distributed Multisensor Observations, Water Resour. Res., 56, e2020WR027572, https://doi.org/10.1029/2020WR027572, 2020.
McCabe, G. J., Clark, M. P., and Hay, L. E.: Rain-on-snow events in the Western United States, B. Am. Meteorol. Soc., 88, 319–328, https://doi.org/10.1175/BAMS-88-3-319, 2007.
Mooney, P. A. and Li, L.: Near future changes to rain-on-snow events in Norway, Environ. Res. Lett., 16, 064039, https://doi.org/10.1088/1748-9326/abfdeb, 2021.
Morán-Tejeda, E., López-Moreno, J. I., Stoffel, M., and Beniston, M.: Rain-on-snow events in Switzerland: Recent observations and projections for the 21st century, Clim. Res., 71, 111–125, https://doi.org/10.3354/cr01435, 2016.
Morán-Tejeda, E., Fassnacht, S. R., Lorenzo-Lacruz, J., López-Moreno, J. I., García, C., Alonso-González, E., and Collados-Lara, A. J.: Hydro-meteorological characterization of major floods in Spanish mountain rivers, Water-Sui., 11, 2641, https://doi.org/10.3390/W11122641, 2019.
Morin, S., Horton, S., Techel, F., Bavay, M., Coléou, C., Fierz, C., Gobiet, A., Hagenmuller, P., Lafaysse, M., Ližar, M., Mitterer, C., Monti, F., Müller, K., Olefs, M., Snook, J. S., van Herwijnen, A., and Vionnet, V.: Application of physical snowpack models in support of operational avalanche hazard forecasting: A status report on current implementations and prospects for the future, Cold Reg. Sci. Technol., 170, 102910, https://doi.org/10.1016/j.coldregions.2019.102910, 2020.
Musselman, K. N., Clark, M. P., Liu, C., Ikeda, K., and Rasmussen, R.: Slower snowmelt in a warmer world, Nat. Clim. Change, 7, 214–219, https://doi.org/10.1038/nclimate3225, 2017a.
Musselman, K. N., Molotch, N. P., and Margulis, S. A.: Snowmelt response to simulated warming across a large elevation gradient, southern Sierra Nevada, California, The Cryosphere, 11, 2847–2866, https://doi.org/10.5194/tc-11-2847-2017, 2017b.
Musselman, K. N., Lehner, F., Ikeda, K., Clark, M. P., Prein, A. F., Liu, C., Barlage, M., and Rasmussen, R.: Projected increases and shifts in rain-on-snow flood risk over Western North America, Nat. Clim. Change, 8, 808–812, https://doi.org/10.1038/s41558-018-0236-4, 2018.
Navarro-Serrano, F. and López-Moreno, J. I.: Análisis espacio-temporal de los eventos de nevadas en el pirineo Español y su relación con la circulación atmosférica, Cuadern. Investig./Geographical Research Letters, 43, 233–254, https://doi.org/10.18172/cig.3042, 2017.
Ohba, M. and Kawase, H.: Rain-on-Snow events in Japan as projected by a large ensemble of regional climate simulations, Clim. Dynam., 55, 2785–2800, https://doi.org/10.1007/s00382-020-05419-8, 2020.
OPCC-CTP: Climate change in the Pyrenees: Impacts, vulnerabilities and adaptation, Bases of knowledge for the future climate change adaptation strategy in the Pyrenees, Jaca, Spain, 147 pp., https://www.opcc-ctp.org/sites/default/files/editor/opcc-informe-en-paginas.pdf (last access: 25 December 2022), 2018
Pall, P., Tallaksen, L. M., and Stordal, F.: A Climatology of Rain-on-Snow Events for Norway, J. Climate, 32, 6995–7016, https://doi.org/10.1175/JCLI-D-18-0529.1, 2019.
Pepin, N. C., Arnone, E., Gobiet, A., Haslinger, K., Kotlarski, S., Notarnicola, C., Palazzi, E., Seibert, P., Serafin, S., Schöner, W., Terzago, S., Thornton, J. M., Vuille, M., and Adler, C.: Climate Changes and Their Elevational Patterns in the Mountains of the World, Rev. Geophys., 60, e2020RG000730, https://doi.org/10.1029/2020RG000730, 2022.
Peña-Angulo, D., Vicente-Serrano, S., Domínguez-Castro, F., Murphy, C., Reig, F., Tramblay, Y., Trigo, R., Luna, M. Y., Turco, M., Noguera, I., Aznarez-Balta, M., Garcia-Herrera, R., Tomas-Burguera, M., and Kenawy, A.: Long-term precipitation in SouthWestern Europe reveals no clear trend attributable to anthropogenic forcing, Environ. Res. Lett., 15, 094070, https://doi.org/10.1088/1748-9326/ab9c4f, 2020.
Pomeroy, J. W., Fang, X., and Rasouli, K.: Sensitivity of snow processes to warming in the Canadian Rockies, in: Proceedings of the 72nd Eastern Snow Conference, Sherbrooke, Québec, Canada, 9–11 June 2015, 22–33, 2015.
Pons, M., López-Moreno, J., Rosas-Casals, M., and Jover, E.: The vulnerability of Pyrenean ski resorts to climate-induced changes in the snowpack, Clim. Change, 131, 591–605, https://doi.org/10.1007/s10584-015-1400-8, 2015.
Rasouli, K., Pomeroy, J. W., and Whitfield, P. H.: Hydrological responses of headwater basins to monthly perturbed climate in the North American Cordillera, J. Hydrometeorol., 20, 863–882, https://doi.org/10.1175/JHM-D-18-0166.1, 2019.
Rennert, K. J., Roe, G., Putkonen, J., and Bitz, C. M.: Soil thermal and ecological impacts of rain on snow events in the circumpolar arctic, J. Climate, 22, 2302–2315, https://doi.org/10.1175/2008JCLI2117.1, 2009.
Réveillet, M., Dumont, M., Gascoin, S., Lafaysse, M., Nabat, P., Ribes, A., Nheili, R., Tuzet, F., Ménégoz, M., Morin, S., Picard, G., and Ginoux, P.: Black carbon and dust alter the response of mountain snow cover under climate change, Nat. Commun., 13, 5279, https://doi.org/10.1038/s41467-022-32501-y, 2022.
Revuelto, J., Lecourt, G., Lafaysse, M., Zin, I., Charrois, L., Vionnet, V., Dumont, M., Rabatel, A., Six, D., Condom, T., Morin, S., Viani, A., and Sirguey, P.: Multi-criteria evaluation of snowpack simulations in complex alpine terrain using satellite and in situ observations, Remote Sens.-Basel, 10, 1171, https://doi.org/10.3390/rs10081171, 2018.
Roe, G. H. and Baker, M. B.: Microphysical and Geometrical Controls on the Pattern of Orographic Precipitation, J. Atmos. Sci., 63, 861–880, https://doi.org/10.1175/JAS3619.1, 2006.
Sanmiguel-Vallelado, A., McPhee, J., Esmeralda Ojeda Carreño, P., Morán-Tejeda, E., Julio Camarero, J., and López-Moreno, J. I.: Sensitivity of forest–snow interactions to climate forcing: Local variability in a Pyrenean valley, J. Hydrol., 605, 127311, https://doi.org/10.1016/j.jhydrol.2021.127311, 2022.
Schirmer, M., Winstral, A., Jonas, T., Burlando, P., and Peleg, N.: Natural climate variability is an important aspect of future projections of snow water resources and rain-on-snow events, The Cryosphere, 16, 3469–3488, https://doi.org/10.5194/tc-16-3469-2022, 2022.
Schöner, W., Koch, R., Matulla, C., Marty, C., and Tilg, A. M.: Spatio-temporal patterns of snow depth within the Swiss-Austrian Alps for the past half century (1961 to 2012) and linkages to climate change, Int. J. Climatol., 39, 1589–1603, https://doi.org/10.1002/joc.5902, 2019.
Serrano-Notivoli, R., Mora, D., Ollero, A., Sánchez-Fabre, M., Sanz, P., and Saz, M.: Floodplain occupation and flooding in the central Pyrenees, Cuadern. Investig./Geographical Research Letters, 43, 309–328, https://doi.org/10.18172/cig.3057, 2017.
Serrano-Notivoli, R., Buisan, S. T., Abad-Pérez, L. M., Sierra-Álvarez, E., Rodríguez-Ballesteros, C., López-Moreno, J. I., and Cuadrat, J. M.: Tendencias recientes en precipitación, temperatura y nieve de alta montaña en los Pirineos (Refugio de Góriz, Huesca), in: El clima: aire, agua, tierra y fuego, Asociación Española de Climatología y Ministerio para la Transición Ecológica – Agencia Estatal de Meteorología, Madrid, Spain, 267, 1060–280, 2018.
Shanley, J. B. and Chalmers, A.: The effect of frozen soil on snowmelt runoff at Sleepers River, Hydrol. Process., 13, 1843–1857, https://doi.org/10.1002/(SICI)1099-1085(199909)13:12/13<1843::AID-HYP879>3.0.CO;2-G, 1999.
Singh, P., Spitzbart, G., Hübl, H., and Weinmeister, H. W.: Hydrological response of snowpack under rain-on-snow events: a field study, J. Hydrol., 202, 1–20, 1997.
Spandre, P., François, H., Verfaillie, D., Lafaysse, M., Déqué, M., Eckert, N., George, E., and Morin, S.: Climate controls on snow reliability in French Alps ski resorts, Sci. Rep.-UK, 9, 8043, https://doi.org/10.1038/s41598-019-44068-8, 2019.
Stewart, I. T.: Changes in snowpack and snowmelt runoff for key mountain regions, Hydrol. Process., 23, 78–94, https://doi.org/10.1002/hyp.7128, 2009.
Surfleet, C. G. and Tullos, D.: Variability in effect of climate change on rain-on-snow peak flow events in a temperate climate, J. Hydrol., 479, 24–34, https://doi.org/10.1016/j.jhydrol.2012.11.021, 2013.
Szczypta, C., Gascoin, S., Houet, T., Hagolle, O., Dejoux, J.-F., Vigneau, C., and Fanise, P.: Impact of climate and land cover changes on snow cover in a small Pyrenean catchment, J. Hydrol., 521, 84–99, https://doi.org/10.1016/j.jhydrol.2014.11.060, 2015.
Verfaillie, D., Lafaysse, M., Déqué, M., Eckert, N., Lejeune, Y., and Morin, S.: Multi-component ensembles of future meteorological and natural snow conditions for 1500 m altitude in the Chartreuse mountain range, Northern French Alps, The Cryosphere, 12, 1249–1271, https://doi.org/10.5194/tc-12-1249-2018, 2018.
Vernay, M., Lafaysse, M., Monteiro, D., Hagenmuller, P., Nheili, R., Samacoïts, R., Verfaillie, D., and Morin, S.: The S2M meteorological and snow cover reanalysis over the French mountainous areas: description and evaluation (1958–2021), Earth Syst. Sci. Data, 14, 1707–1733, https://doi.org/10.5194/essd-14-1707-2022, 2022 (data available at: https://www.aeris-data.fr/landing-page/?uuid=865730e8-edeb-4c6b-ae58-80f95166509b#v2020.2, last access: 16 December 2022).
Vicente-Serrano, S. M., Rodríguez-Camino, E., Domínguez-Castro, F., El Kenawy, A., and Azorín-Molina, C.: An updated review on recent trends in observational surface atmospheric variables and their extremes over Spain, Cuadern. Investig./Geographical Research Letters, 43, 209–232, https://doi.org/10.18172/cig.3134, 2017.
Vidaller, I., Revuelto, J., Izagirre, E., Rojas-Heredia, F., Alonso-González, E., Gascoin, S., René, P., Berthier, E., Rico, I., Moreno, A., Serrano, E., Serreta, A., and López-Moreno, J. I.: Toward an ice-free mountain range: Demise of Pyrenean glaciers during 2011–2020, Geophys. Res. Lett., 48, e2021GL094339, https://doi.org/10.1029/2021GL094339, 2021.
Viviroli, D., Archer, D. R., Buytaert, W., Fowler, H. J., Greenwood, G. B., Hamlet, A. F., Huang, Y., Koboltschnig, G., Litaor, M. I., López-Moreno, J. I., Lorentz, S., Schädler, B., Schreier, H., Schwaiger, K., Vuille, M., and Woods, R.: Climate change and mountain water resources: overview and recommendations for research, management and policy, Hydrol. Earth Syst. Sci., 15, 471–504, https://doi.org/10.5194/hess-15-471-2011, 2011.
Westermann, S., Boike, J., Langer, M., Schuler, T. V., and Etzelmüller, B.: Modeling the impact of wintertime rain events on the thermal regime of permafrost, The Cryosphere, 5, 945–959, https://doi.org/10.5194/tc-5-945-2011, 2011.
Wipf, S. and Rixen, C.: A review of snow manipulation experiments in Arctic and alpine tundra ecosystems, Polar Res., 29, 95–109, https://doi.org/10.1111/j.1751-8369.2010.00153.x, 2010.
Wu, X., Che, T., Li, X., Wang, N., and Yang, X.: Slower Snowmelt in Spring Along With Climate Warming Across the Northern Hemisphere, Geophys. Res. Lett., 45, 12331–12339, https://doi.org/10.1029/2018GL079511, 2018.
Würzer, S., Jonas, T., Wever, N., and Lehning, M.: Influence of initial snowpack properties on runoffformation during rain-on-snow events, J. Hydrometeorol., 17, 1801–1815, https://doi.org/10.1175/JHM-D-15-0181.1, 2016.