the Creative Commons Attribution 4.0 License.
the Creative Commons Attribution 4.0 License.
 | 03 Mar 2023
Scenario-based modelling of waves generated by sublacustrine explosive eruptions at Lake Taupō, New Zealand
Matthew W. Hayward
Emily M. Lane
Colin N. Whittaker
Graham S. Leonard
William L. Power
Volcanogenic tsunami and wave hazard remains less understood than that of other tsunami sources. Volcanoes can generate waves in a multitude of ways, including subaqueous explosions. Recent events, including a highly explosive eruption at Hunga Tonga-Hunga Ha'apai and subsequent tsunami in January 2022, have reinforced the necessity to explore and quantify volcanic tsunami sources. We utilise a non-hydrostatic multilayer numerical method to simulate 20 scenarios of sublacustrine explosive eruptions under Lake Taupō, New Zealand, across five locations and four eruption sizes. Waves propagate around the entire lake within 15 min, and there is a minimum explosive size required to generate significant waves (positive amplitudes incident on foreshore of > 1 m) from the impulsive displacement of water from the eruption itself. This minimum size corresponds to a mass eruption rate of 5.8×10⁷ kg s−1, or VEI 5 equivalent. Inundation is mapped across five built areas and becomes significant near shore when considering only the two largest sizes, above VEI 5, which preferentially impact areas of low-gradient slope. In addition, novel hydrographic output is produced showing the impact of incident waves on the Waikato River inlet draining the lake and is potentially useful for future structural impact analysis. Waves generated from these explosive source types are highly dispersive, resulting in hazard rapidly diminishing with distance from the source. With improved computational efficiency, a probabilistic study could be formulated and other, potentially more significant, volcanic source mechanisms should be investigated.
- Article
(13313 KB) - Full-text XML
- BibTeX
- EndNote


Lake Taupō (Taupō-nui-a-Tia) is a large caldera lake (∼ 616 km2) in the centre of New Zealand's North Island overlying most of Taupō volcano at the south of the Taupō Volcanic Zone (TVZ). The lake drains into the Waikato River, the longest in the country, which supplies water throughout the central North Island and Auckland. The setting of the lake and surrounding infrastructure is shown in Fig. 1. Controlled at the lake outlet by gates, the water is utilised in hydroelectric power generation through the use of a number of nearby dams downstream. The lake hosts many thriving industries such as trout fishing, geothermal exploitation and tourism, particularly along the southern and western shores, and as such the shore is populated; the largest centre at the Waikato River outlet is the namesake township Taupō.
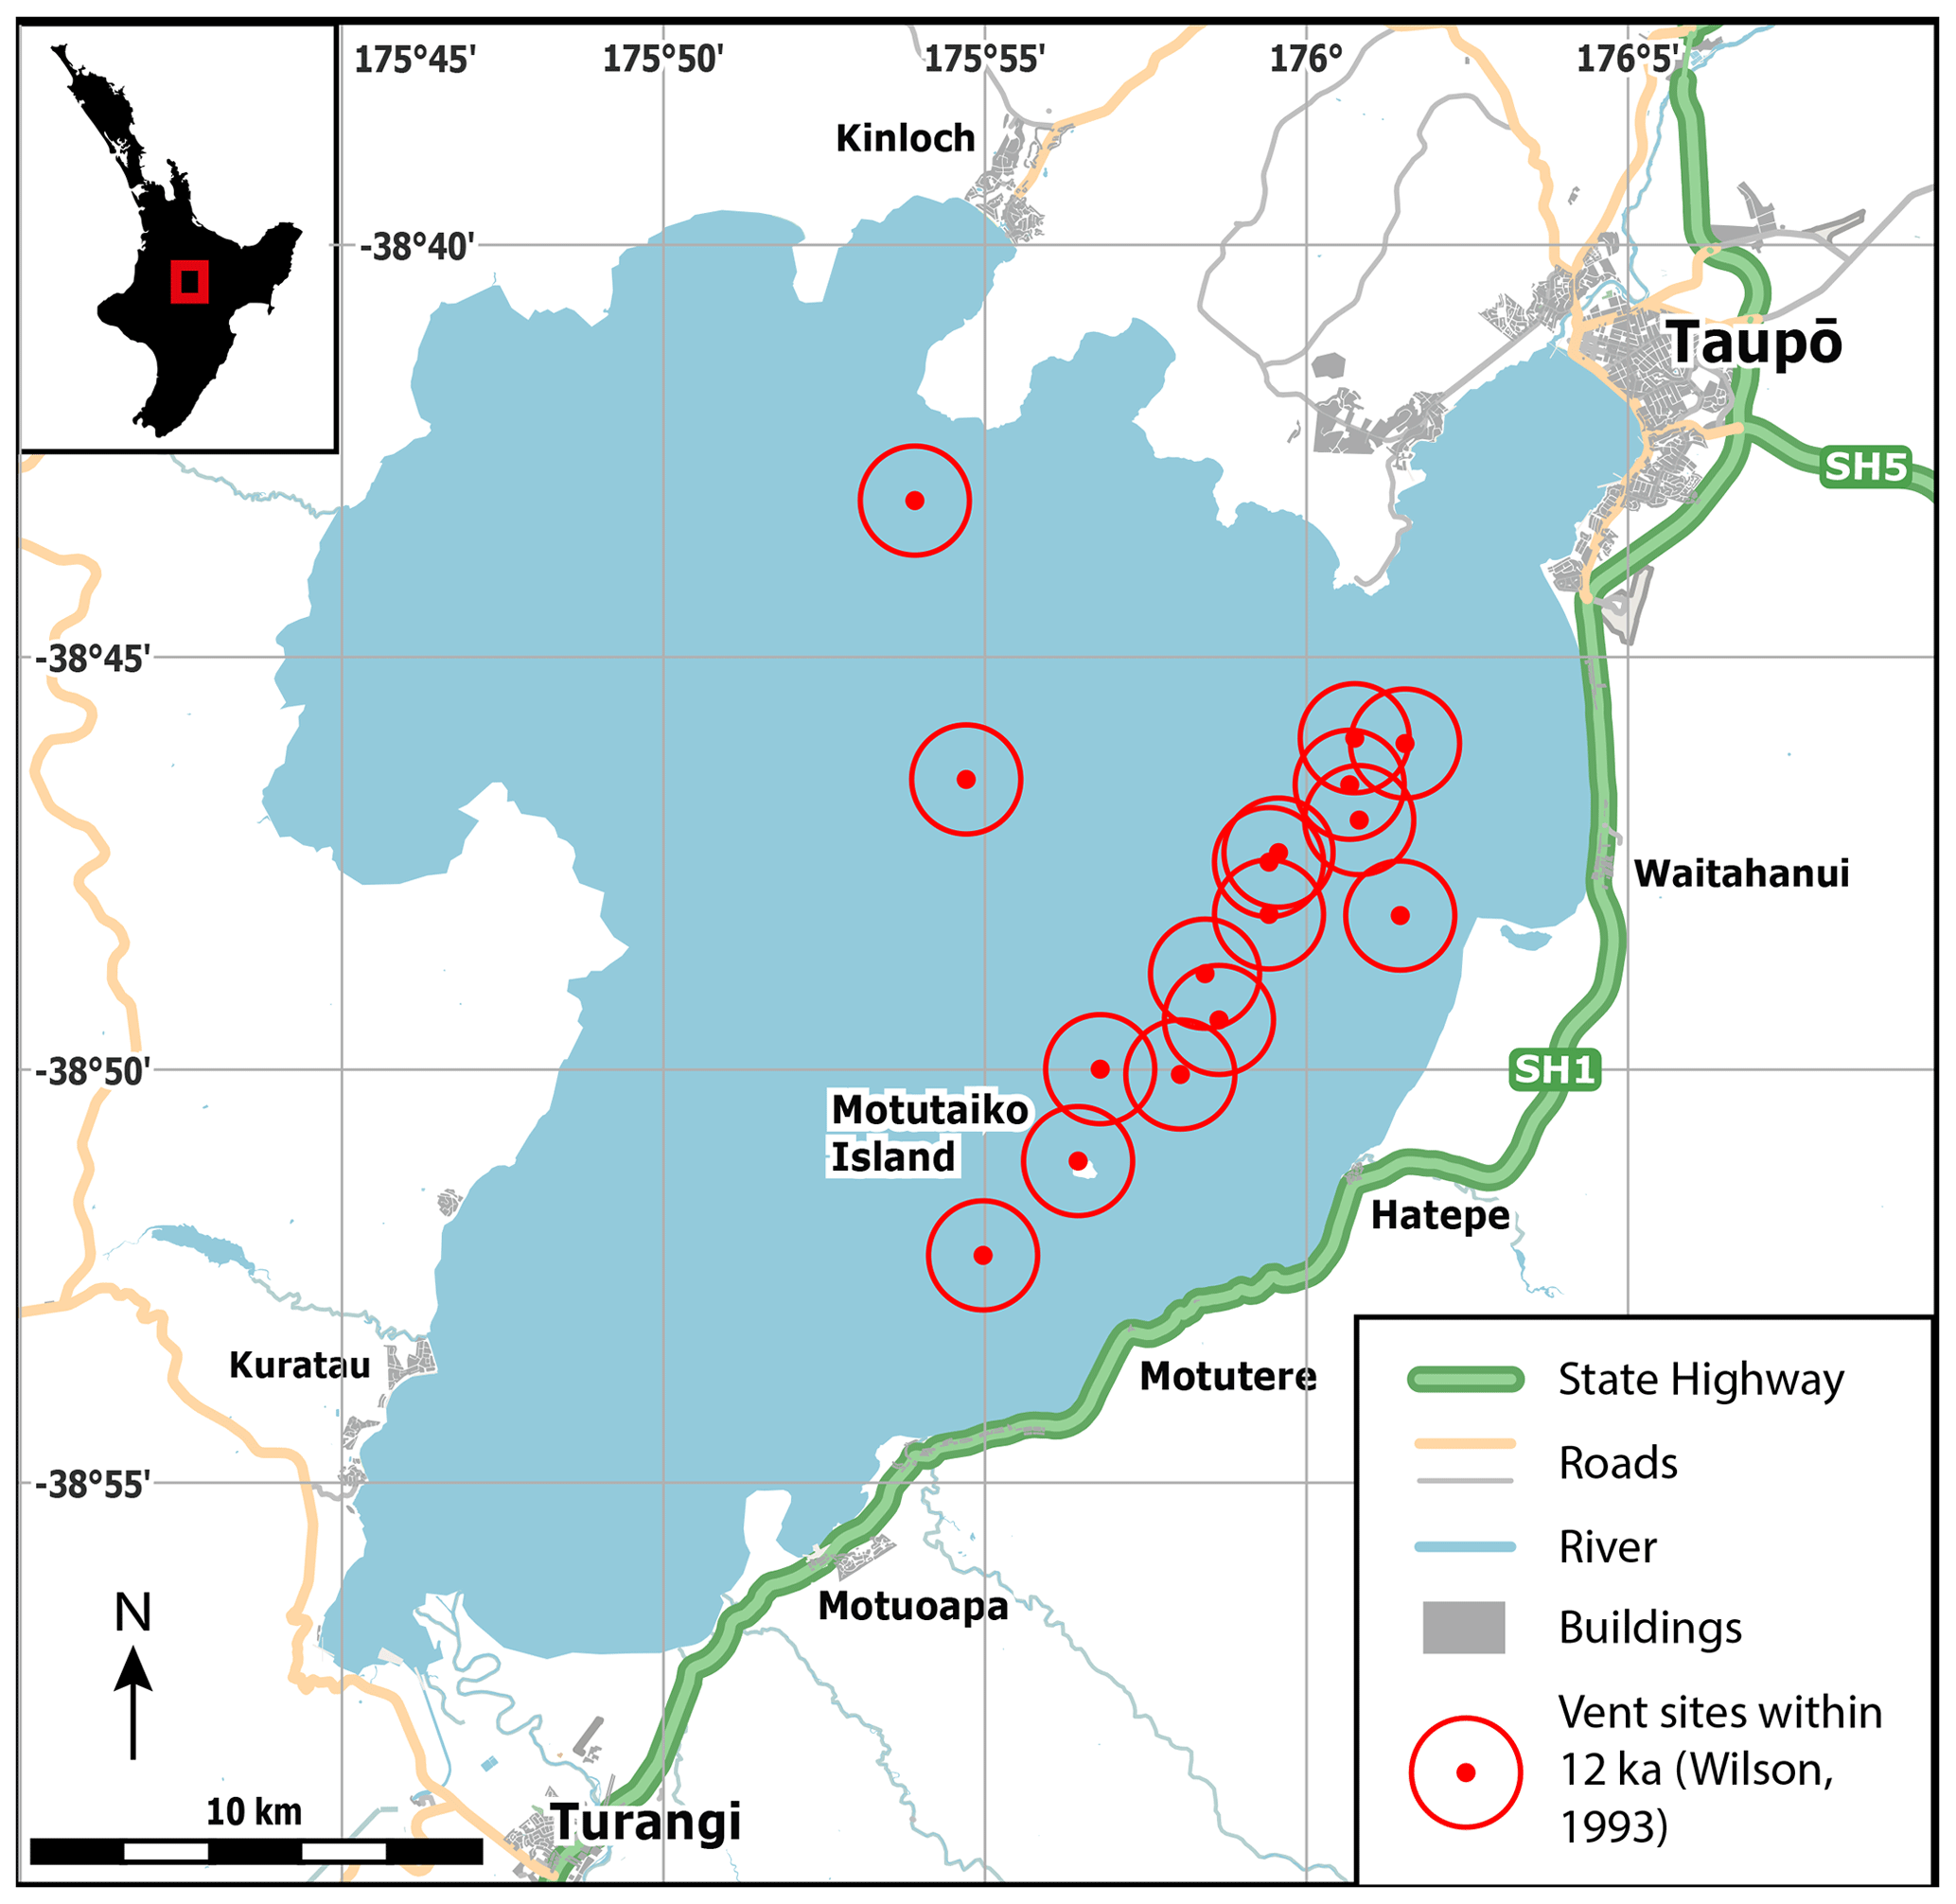
Figure 1Setting of Lake Taupō with buildings and road infrastructure, where major state highways are highlighted. Currently submerged vent site locations that have erupted within 12 kyr from Wilson (1993). Data sourced from OpenStreetMap. Map data © OpenStreetMap contributors 2022. Distributed under the Open Data Commons Open Database License (ODbL) v1.0.
However, Lake Taupō conceals most of one of the world's most frequently active caldera volcanoes (Barker et al., 2020). Underneath this area exists a large magmatic system, the TVZ, a product of subduction of the Pacific Plate under the continental Zealandia part of the Australian Plate (Cole and Lewis, 1981; Cole, 1990; Gamble et al., 1996). The 350 km-long TVZ forms the southern part of a back-arc basin behind the Tonga–Kermadec subduction zone. Most of the eruptive centres are aligned along the intra-arc Taupō rift. One of the volcanoes in this system, the Taupō volcano, is responsible for the youngest known supereruption, the Oruanui eruption at ∼ 25.5 ka, which produced over 530 km3 dense-rock equivalent (DRE) of magma. This eruption culminated in a caldera collapse of the local area which, after infilling, became part of the modern lake (Davy and Caldwell, 1998; Wilson, 2001; Vandergoes et al., 2013; Allan, 2013). In the time since, smaller eruptions of a wide range of eruptive volumes (across 4 orders of magnitude) have occurred within a relatively concentrated vent location range (shown in Fig. 1), with at least 25 identified within 12 kyr (Wilson, 1993; Barker et al., 2020). The largest of these, the Taupō Plinian eruption, occurred on ∼ 232 CE and, at 35 km3 DRE, was one of the largest eruptions globally in the past 5000 years (Wilson and Walker, 1985; Houghton et al., 2010). This resulted in the further reshaping of the caldera and lake shore (Davy and Caldwell, 1998).
Tsunami generation from volcanic sources has been an area of developing interest in recent years, primarily due to events at Anak Krakatau in December 2018, causing 426 casualties (Grilli et al., 2019; Williams et al., 2019; Ye et al., 2020), and most recently at Hunga Tonga-Hunga Ha'apai (HTHH, January 2022), a highly explosive near-surface submarine eruption which generated a local tsunami with high run-up around the Tonga archipelago and induced a significant tsunami across the Pacific and beyond (Klein, 2022; Carvajal et al., 2022; Omira et al., 2022; Lynett et al., 2022). Volcanogenic waves can be caused by a number of different mechanisms, including subaqueous explosions or jets, flank collapse or pyroclastic density current flow into water, and caldera collapse (Duffy, 1992; Egorov, 2007; Paris et al., 2014). As wave-making sources, these are not necessarily mutually exclusive in that it is possible that one or more of these could be responsible for tsunamis from a single event, as demonstrated by long debate over the Krakatau tsunami of 1883 (Nomanbhoy and Satake, 1995; Maeno and Imamura, 2011) and the various interpretations of data resulting from HTHH in 2022.
Compounding the complexity of the source mechanism(s) responsible for a volcanogenic tsunami is a lack of understanding of each individual mechanism due to a lack of data and modelling efforts (Behrens et al., 2021). This is a common problem with low frequency and high variability events such as volcanic tsunamis, resulting in difficulty understanding the risks and hazards posed by such events (Paris, 2015). Progress in recent years has been sparked by the attention gained by the recent tsunamigenic events and research such as Ward and Day (2001) on flank collapses at La Palma. The resulting debates (Ward and Day, 2005; Pararas-Carayannis, 2002), additional research and improvements in modelling assumptions and techniques have helped improve comprehension of the hazards associated with volcanic tsunamis, particularly flank collapses (Abadie et al., 2012; Tehranirad et al., 2015); however, far more work is needed on the remaining possible mechanisms to build a more complete model of what wave hazards different volcanoes can truly pose (Paris et al., 2014, 2019; Battershill et al., 2021).
This work presents a scenario-based case study of waves produced by subaqueous explosive eruptions under Lake Taupō, simulated using numerical methods. In an effort to capture a wide range of dispersive and non-linear properties of the generated wavefields, we utilise a non-hydrostatic (NH) multilayer scheme within the Basilisk computational fluid dynamics (CFDs) framework introduced by Popinet (2020). This numerical method has been tested and validated against records of waves generated by instantaneous disturbances and explosives at the field scale (Hayward et al., 2022b), and in the present work it is applied to investigate direct and secondary hazards posed by volcanogenic tsunamis in Lake Taupō in terms of incident wave heights and velocities, inundation, impacts across the built environment on the shore and impacts on infrastructure including tsunami-induced pressures on the Waikato outlet control gates. The aims of this work are to present a detailed case study of volcanic wave hazard from idealised explosive subaqueous sources. By utilising an appropriate numerical scheme for the types of generated waves and with high resolution digital terrain models (DTMs), this work will provide a basis on which future probabilistic hazard and risk assessments can be developed to take into account this potential volcanic hazard source.
To accomplish this, this paper follows a structure of describing the methodology in terms of the numerical scheme, wave generation model and simulated scenarios, before describing the generated results concerning tsunami propagation across the lake, inundation and potential infrastructure impacts. Finally, these are discussed with attention given to hazard implications and model formation based on the presented framework.
Volcanically generated tsunamis originate from a wide variety of differing sources, not all of which are syn-eruptive. These tsunamis can greatly expand the propagation range of hazard arising from a volcano, often achieving regional impact (Paris et al., 2014; Paris, 2015). Each source poses multiple challenges to any modelling effort regarding their complex physical mechanisms, uncertainties in energy transfer potential, recurrence likelihood and, crucially, the difficulties of simulating the wavefield generation (Esposti Ongaro et al., 2021; Behrens et al., 2021). The wave dynamics from these sources vary considerably. These may be short-period, localised and dispersive compared to seismically generated tsunamis because the sources produce high vertical accelerations, steep sloped waves and are generally smaller in horizontal extent than fault ruptures, incorporating non-linear and non-hydrostatic effects (Guyenne and Grilli, 2003; Grilli and Watts, 2005; Glimsdal et al., 2013; Paris and Ulvrová, 2019).
Numerical solutions to these problems in the past used linear wave theory (e.g. Ward and Day, 2001) and codes solving the shallow water equations (SWE) (e.g. Mader, 2001; Ulvrová et al., 2014; Ulvrova et al., 2016; Heidarzadeh et al., 2020), which are very frequently used for the efficient solution for seismogenic tsunami magnitudes and travel times (Popinet, 2011; LeVeque et al., 2011). While these are appropriate when the characteristic wavelength L is larger than the water (or ocean) depth h, a different approach is required where these waves reach shores and other situations where non-linear and non-hydrostatic effects are significant (Esposti Ongaro et al., 2021; Hayward et al., 2022b).
2.1 Numerical scheme
In this study we utilise a non-hydrostatic, multilayer numerical scheme which is part of the open-source computational fluid dynamics (CFDs) framework Basilisk (Popinet, 2013). This free software is used in numerous CFD applications from viscoelastic investigations to multiphase jet and bubble dynamics by solving the Navier–Stokes equations. Also included are numerous free-surface schemes that can be readily applied to tsunami, wave transformation, atmospheric flows (Schilperoort et al., 2022) and coastal hydrodynamics (East et al., 2020).
The Basilisk framework enables the efficient solution of the relevant governing equations for the various pre-written schemes by iterating across adaptive quad-tree-based grids. This grid refinement is programmable to adapt the resolution contingent on a specified wavelet-estimated discretisation error of any chosen field; for instance, in tsunami models it is the free-surface elevation field that is typically used for refinement criteria. In addition, flexibility within the framework allows parallelism by either OpenMP or MPI, and some growing support for general-purpose GPU execution with OpenACC. In combination, this refinement, multi-core and multi-node capability allows the code to efficiently tackle many CFD problems, especially those with resolution requirements of irregular shape or of distance between areas of refinement.
The free-surface solvers within Basilisk come in a number of classes, including two which solve the SWE and Boussinesq-type equations that are commonly applied to tsunami applications (Popinet, 2015). Recently, a multilayer system was devised by Popinet (2020) to describe the motion of multiple layers of incompressible fluids, which is only briefly outlined here. The scheme is constructed in a modular way to reduce or introduce complexity as required and adjust the model to an appropriate level for the application. Starting from the hydrostatic solver which is effectively the stacked Saint–Venant equations (or SWE), the Coriolis acceleration, buoyancy terms (small density variations), vertical layer remapping, viscosity and diffusion can be added as required.
Described here is an extension which adds terms to account for vertical momentum and non-hydrostatic pressure. As for the multilayer scheme in general, the domain consists of n layers which are horizontally gridded (Eulerian) but vertically discrete (Lagrangian). The system approximates the incompressible Euler equations with a free surface and gravity, by equations
where, in the x–z reference frame, k is the layer index, g gravitational acceleration, hk layer thickness, uk, wk the horizontal and vertical velocity components, ϕk the non-hydrostatic pressure, η the free-surface height (sum of layer thicknesses and bathymetry height zb), and
the height of layer interfaces.
This equation set corresponds to change of layer thickness over time (Eq. 1), the conservation of momentum (Eqs. 2, 3) and the conservation of mass (Eq. 4). The dispersion relation is implemented using a “Keller box scheme” and wave breaking is approximated by limiting the maximum vertical velocity and introducing a slope-limiting term. Bottom friction is implemented by adding a quadratic term which is applied across all cells at each time step, (e.g. Popinet, 2011; Beetham et al., 2016). Popinet (2020) delivers greater detail on the specifics of the scheme, comparison against other similar models and validation benchmarks such as for standing waves, breaking Stokes waves, viscous hydraulic jumps and case studies such as wave dispersion over varying bathymetry and the 2011 Tohoku tsunami.
2.2 Wave generation model
Wave generation from subaqueous eruptions is poorly understood as it involves a wide range of complex processes including high-energy, dynamic interactions between pressurised magma and water (Egorov, 2007). Lack of direct observations or experimental research and a low recurrence rate (7 % of tsunami sources as determined by Harbitz et al., 2014) have left this range of tsunami sources in the shadow of more commonly discussed tsunamigenic events such as earthquakes and landslides (Paris, 2015). As a result, the preparedness levels for such events are far lower along with higher uncertainties regarding spatial extent and any likely hazards or impacts, as demonstrated by the HTHH event.
The analogous problem of wave generation from subaqueous chemical explosions was explored for military purposes during the 20th century. These few trials were instigated in exploration of alternative uses for nuclear devices and returned results and data of varying quality using explosives of yields between 9.5×10⁸ to 1.8×10¹⁰ J and one 23 kT device. These observations and data resulted in the development of theories about how waves are generated from explosions, where, following detonation, a gas bubble rapidly expands and meets the free surface, provided it is closer than the maximum expansion. This interaction causes the release of the bubble in the form of a cavity and jets of water. An initial, dissipative bore is generated first, before the gravitational collapse of the cavity and subsequent alternating bores and jets until rest, producing further waves. (Whalin et al., 1970; Le Méhauté, 1971; Le Méhauté and Wang, 1996; Wang et al., 2018)
Directly modelling this process using numerical methods is incredibly computationally expensive and most effort within the explosive and bubble dynamics research communities usually focuses on properties of the oscillating bubble itself or the dynamic loading on ship hulls caused by pressure shocks (e.g. Liu et al., 2003; Shin, 2004; Liu et al., 2018; Li et al., 2018). Investigations involving interactions with the free surface remain uncommon (Daramizadeh and Ansari, 2015; Xu et al., 2020) and, owing to the additional resources necessary to compute a larger domain, simulating the resultant wavefield is impractical.
An approximation of the disturbance can be used to propagate waves in a purely hydrodynamic solver to investigate wave impacts away from the source. Le Méhauté and Wang (1996) present a two-parameter cavity model to represent the initial conditions of such a system, where the parameters correspond to the physical dimensions of the cavity and are tuned by relationships derived empirically through inverse methods on experimental time series of explosively generated waves. These empirical functions describe the relationship between the initial displacement of the free surface (η0) needed to generate equivalent waves and the physical characteristics of the explosion including explosive energy E, explosive depth z, water depth h and other physical conditions such as the bed characteristics and the shallowness of the explosion.
The initialised surface model is described as a smooth-rimmed cavity:
where parameters R and ηc describe the radius and depth of the cavity respectively and are empirically related to the explosion or eruption characteristics. As described by Le Méhauté and Wang (1996), these can be determined by considering a depth relation D which is used as a classification to determine the cavity parameters. The parameter is a function of explosion energy E and water depth h,
where c=406.2 is a constant. For this depth relation D, three categories are given:
For deep cases, further determination of the relation of the charge depth z to energy E is needed; in the present study no deep cases are considered. In the intermediate case
where constants a and b vary to account for charge depth as described by Le Méhauté and Wang (1996).
For shallow cases, where the explosion would disrupt the whole water column and bed surface,
To introduce the volcanic scenario, it is clear that any eruption or explosion does not occur midway through the water column but instead on the flank or in the edifice of a volcano, therefore the water and explosion (or charge) depths at this point are equivalent, especially in locations of shallow bathymetry such as those selected in this study. This has implications when considering depth classification, in that an explosion that is small or at a sufficiently large depth to fit in the deep class in Eq. (8) will not be capable of generating waves, restricting cases to the other depth classes. Furthermore, Sato and Taniguchi (1997) present relations of explosive energy to eruption parameters such as volcanic crater diameter or ejecta volume V as
In determining appropriate ejecta volumes for various “magnitude” eruptions, the mass ejection rate (MER) for an eruption can be estimated and multiplied by a characteristic duration which represents the initial explosive stages of a potentially long-running eruption.
This semi-analytical method and variants thereof have been used to simulate the 1996 eruption at Karymskoye Lake, Russia, by Torsvik et al. (2010) and Ulvrová et al. (2014), and utilised to investigate submarine eruptions at Kolumbo Volcano (Ulvrová et al., 2014), Taal Caldera Lake, the Philippines (Paris and Ulvrová, 2019; Pakoksung et al., 2021), and at Campi Flegrei, Italy (Paris et al., 2019), all using either SWE or Boussinseq-type equation based methods. For the multilayer scheme, the explosive source model has been tested for waves generated by chemical detonations in Mono Lake, California (Hayward et al., 2022b).
2.3 Numerical simulations
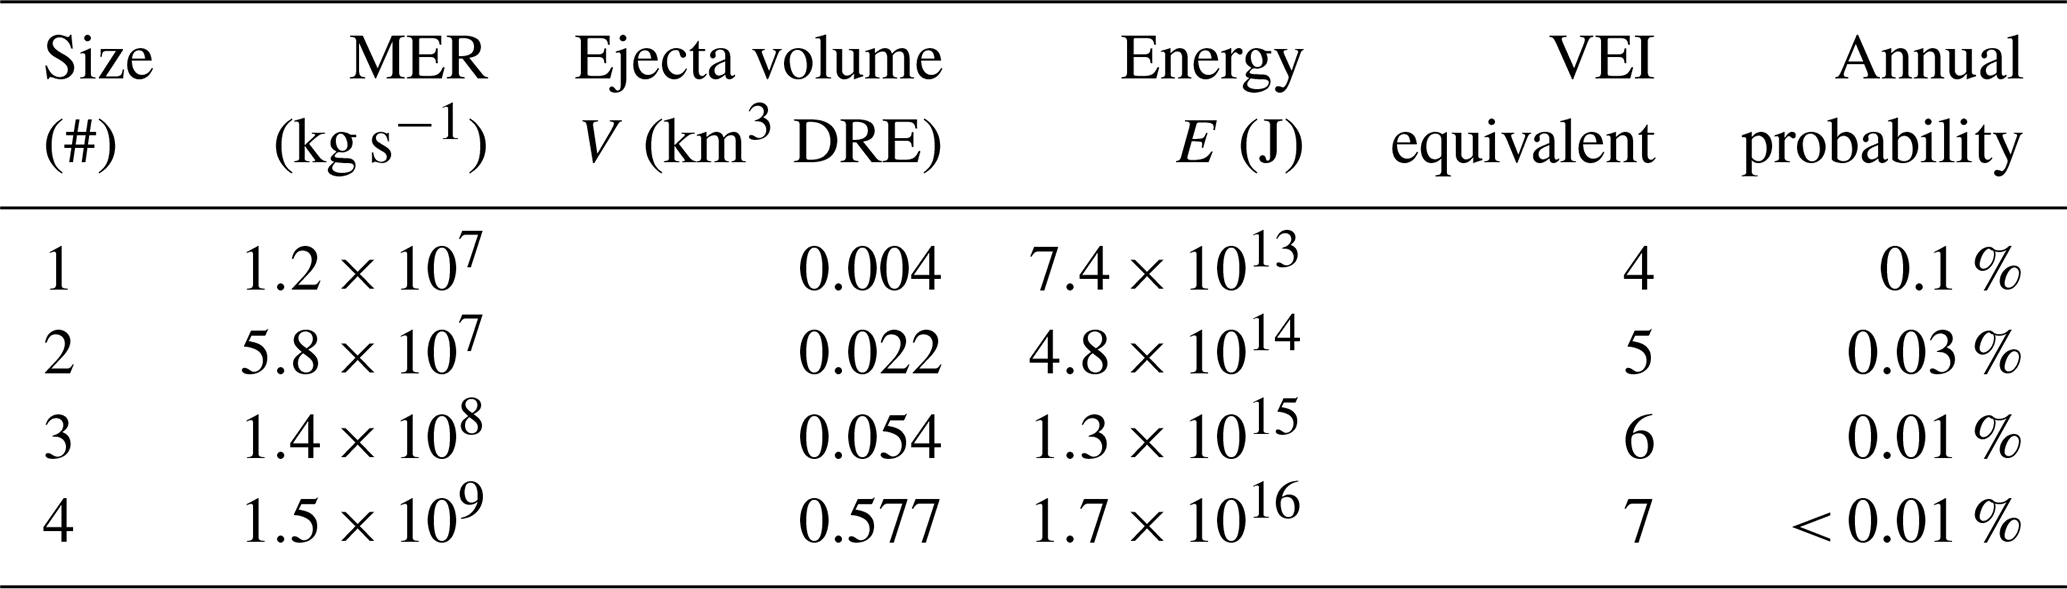
In total, 20 scenarios are simulated, comprising four sizes of eruption events at five differing locations across Lake Taupō. These are detailed in Fig. 2 and Tables 1 and 2, with an overall summary in Table 3. The eruption sizes are closely tied to the scenarios modelled by Barker et al. (2019), which considered 0.1, 1, 5 and 50 km3 DRE eruptions and where we use the MER of each scenario across a much shorter timescale (that of an eruptive explosion at the initial stage) to calculate an ejecta volume V and, by Eq. (12), an energy E to input into the initialisation model. This is tabulated in Table 1. These sizes, which correlate with eruptions of Taupō volcano through the Holocene (Wilson, 1993), are compared in Table 1 to equivalent volcanic explosivity index (VEI) magnitudes as described by Barker et al. (2019), and refer to annual probabilities estimated by Stirling and Wilson (2002). While larger events of supereruption magnitude have occurred, these are not modelled in the present work as these eruptions would have far larger implications for the local area (and beyond) in the form of caldera collapse, lake modification or destruction, and deposit effects, where any generated tsunami would likely be relatively irrelevant.
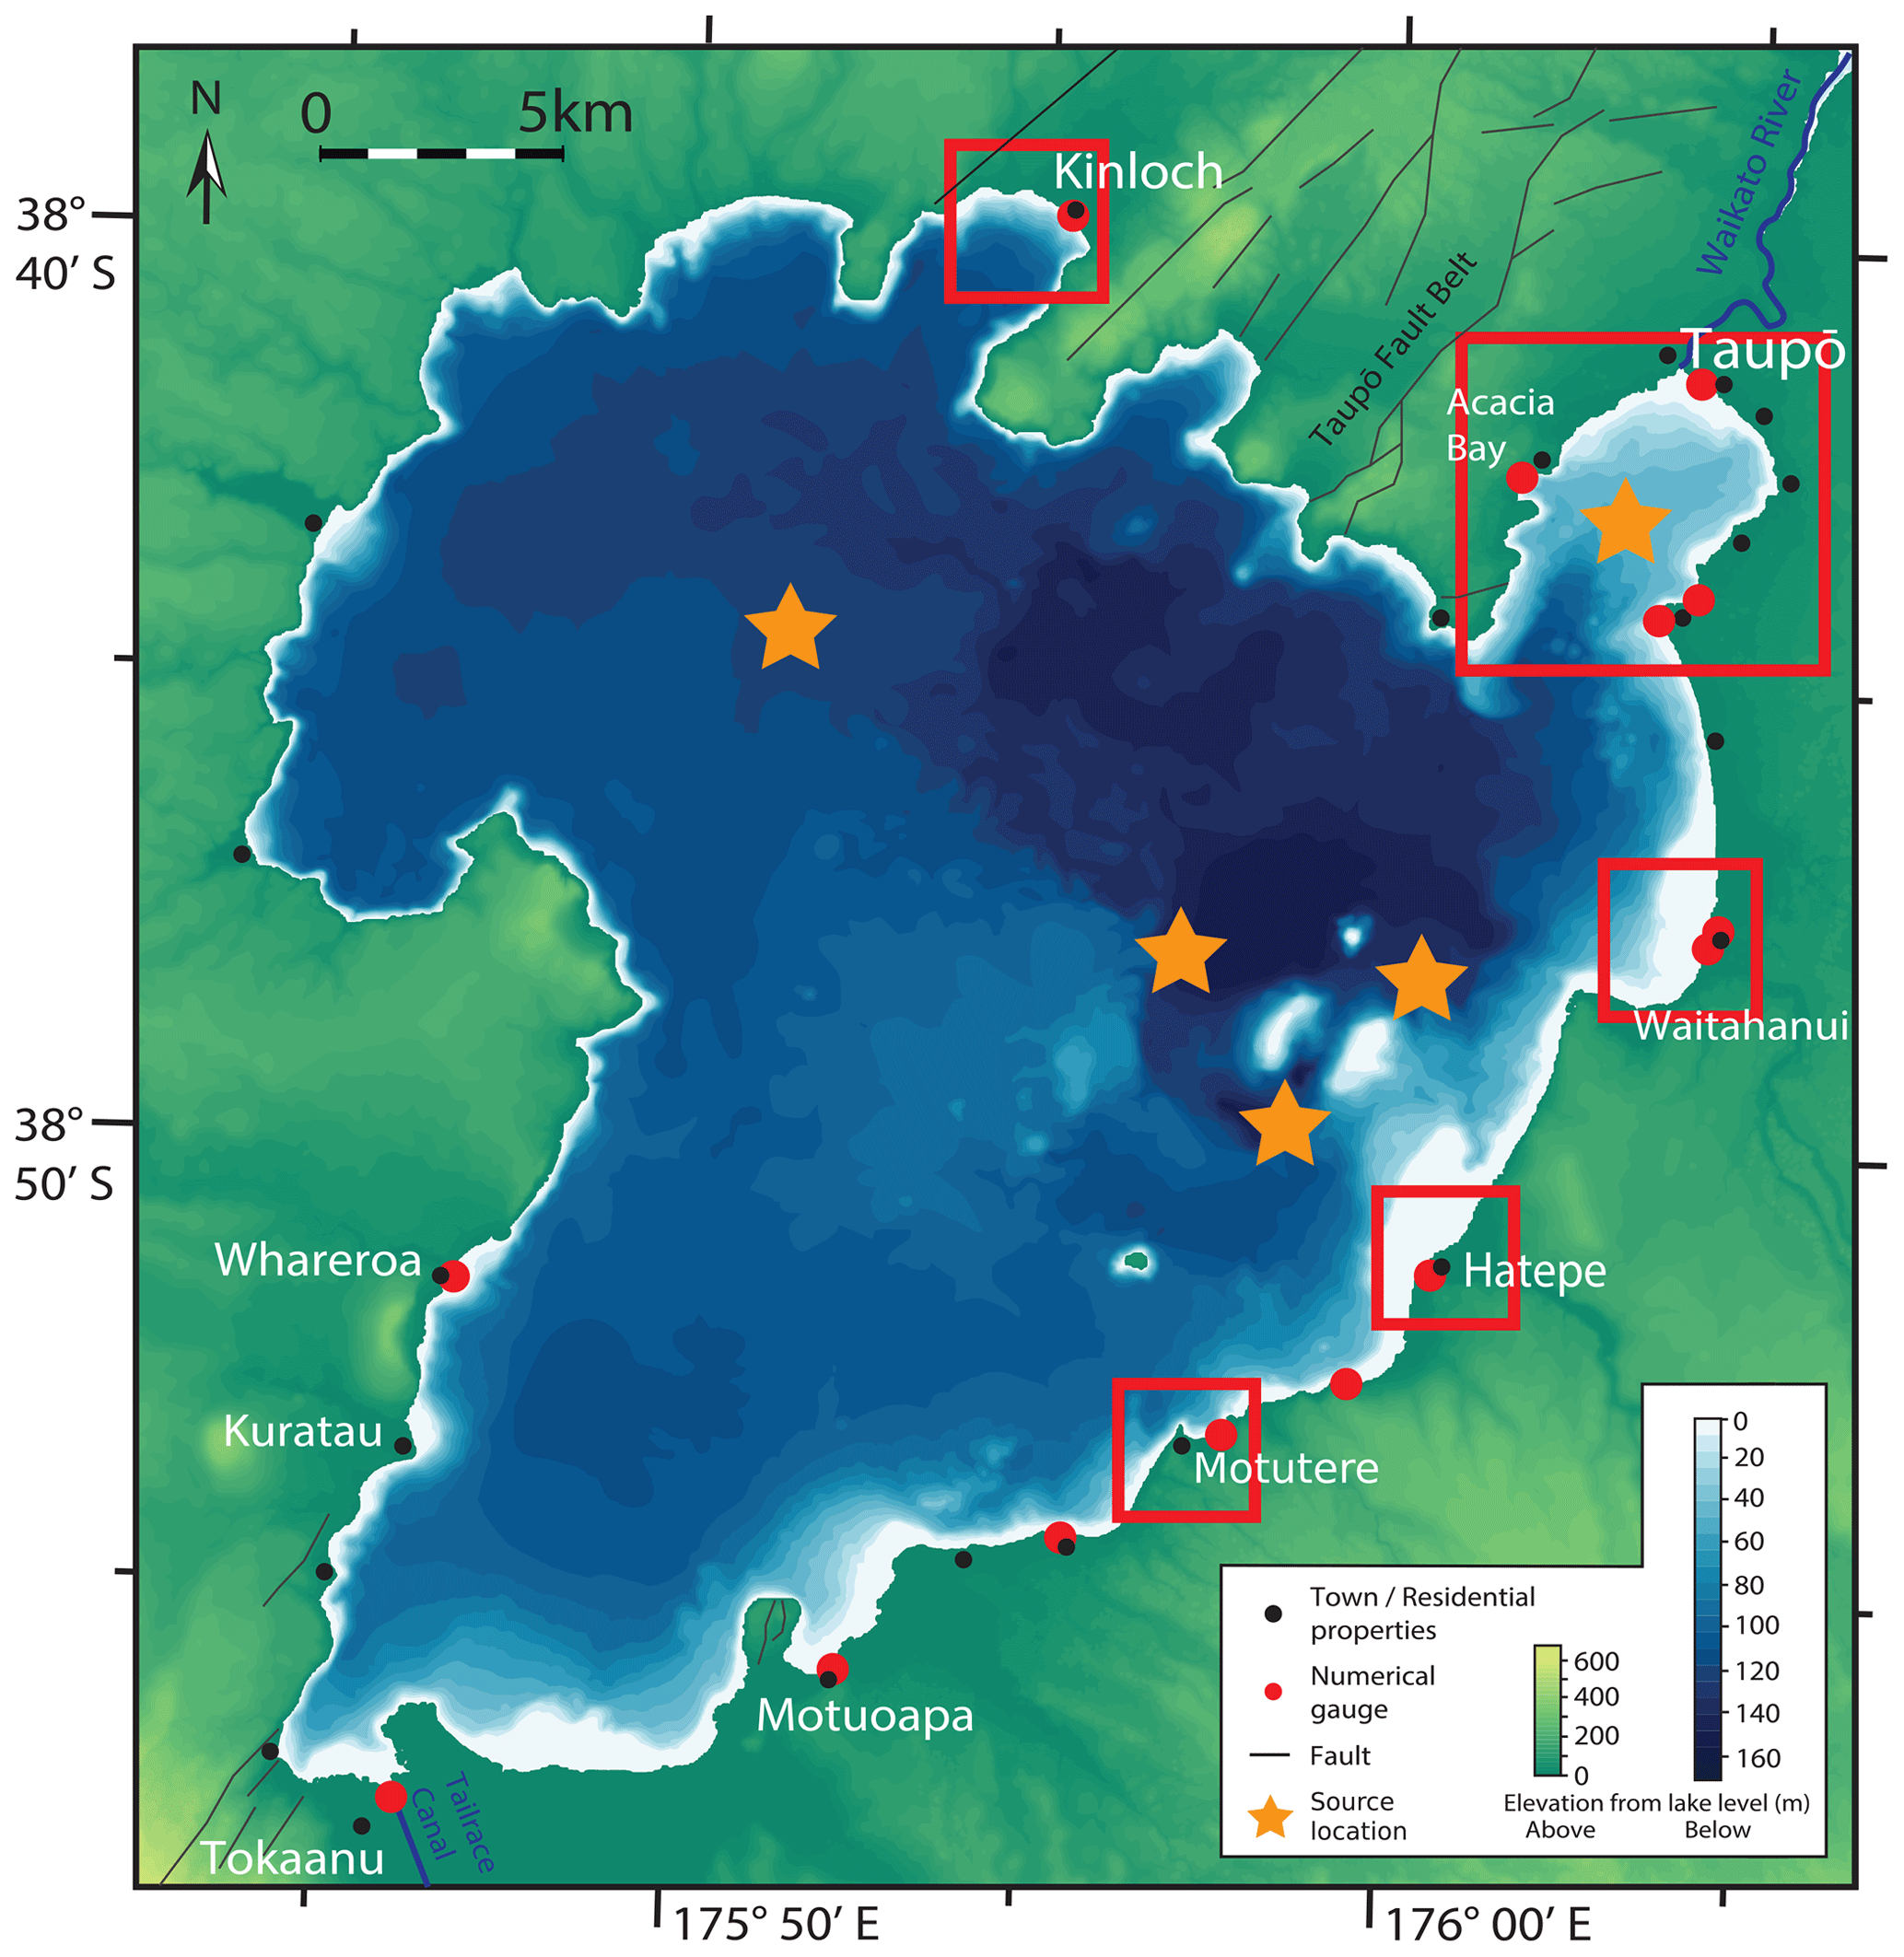
Figure 2Illustration of the model domain and applied digital elevation model. Left: structural features including faults, elevation and bathymetry; geographical locations including settlement areas, the Waikato River and Tailrace Canal; modelling locations including discrete numerical gauge and source locations (detailed in Table 2). Right: focus regions as used in inundation mapping, Taupō centre (light blue), Taupō area (red) Waitahanui (orange), Hatepe (dark blue), Motutere (green) and Kinloch (purple).
Table 1Eruption sizes used in the Taupō model, where MER is chosen from Barker et al. (2019). Annual probabilities from Stirling and Wilson (2002).
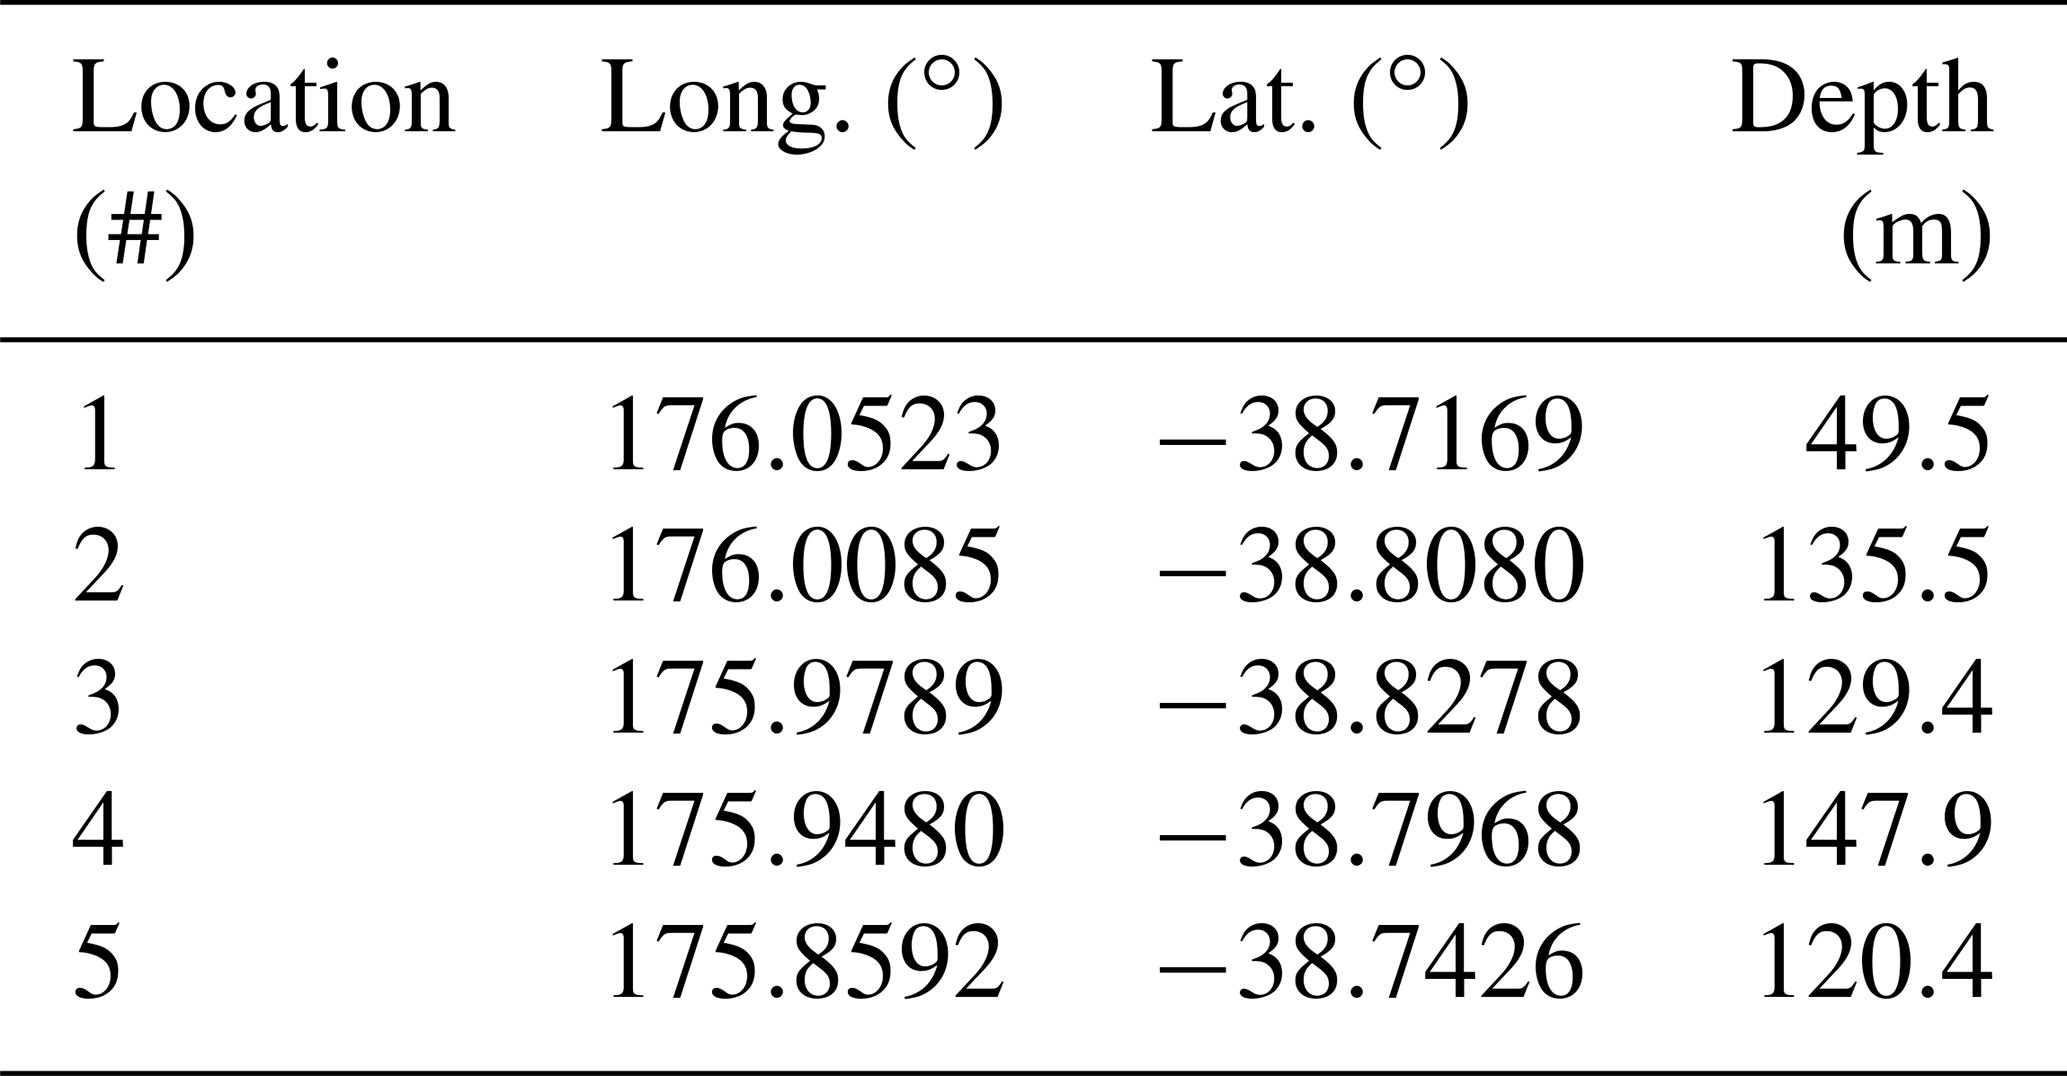
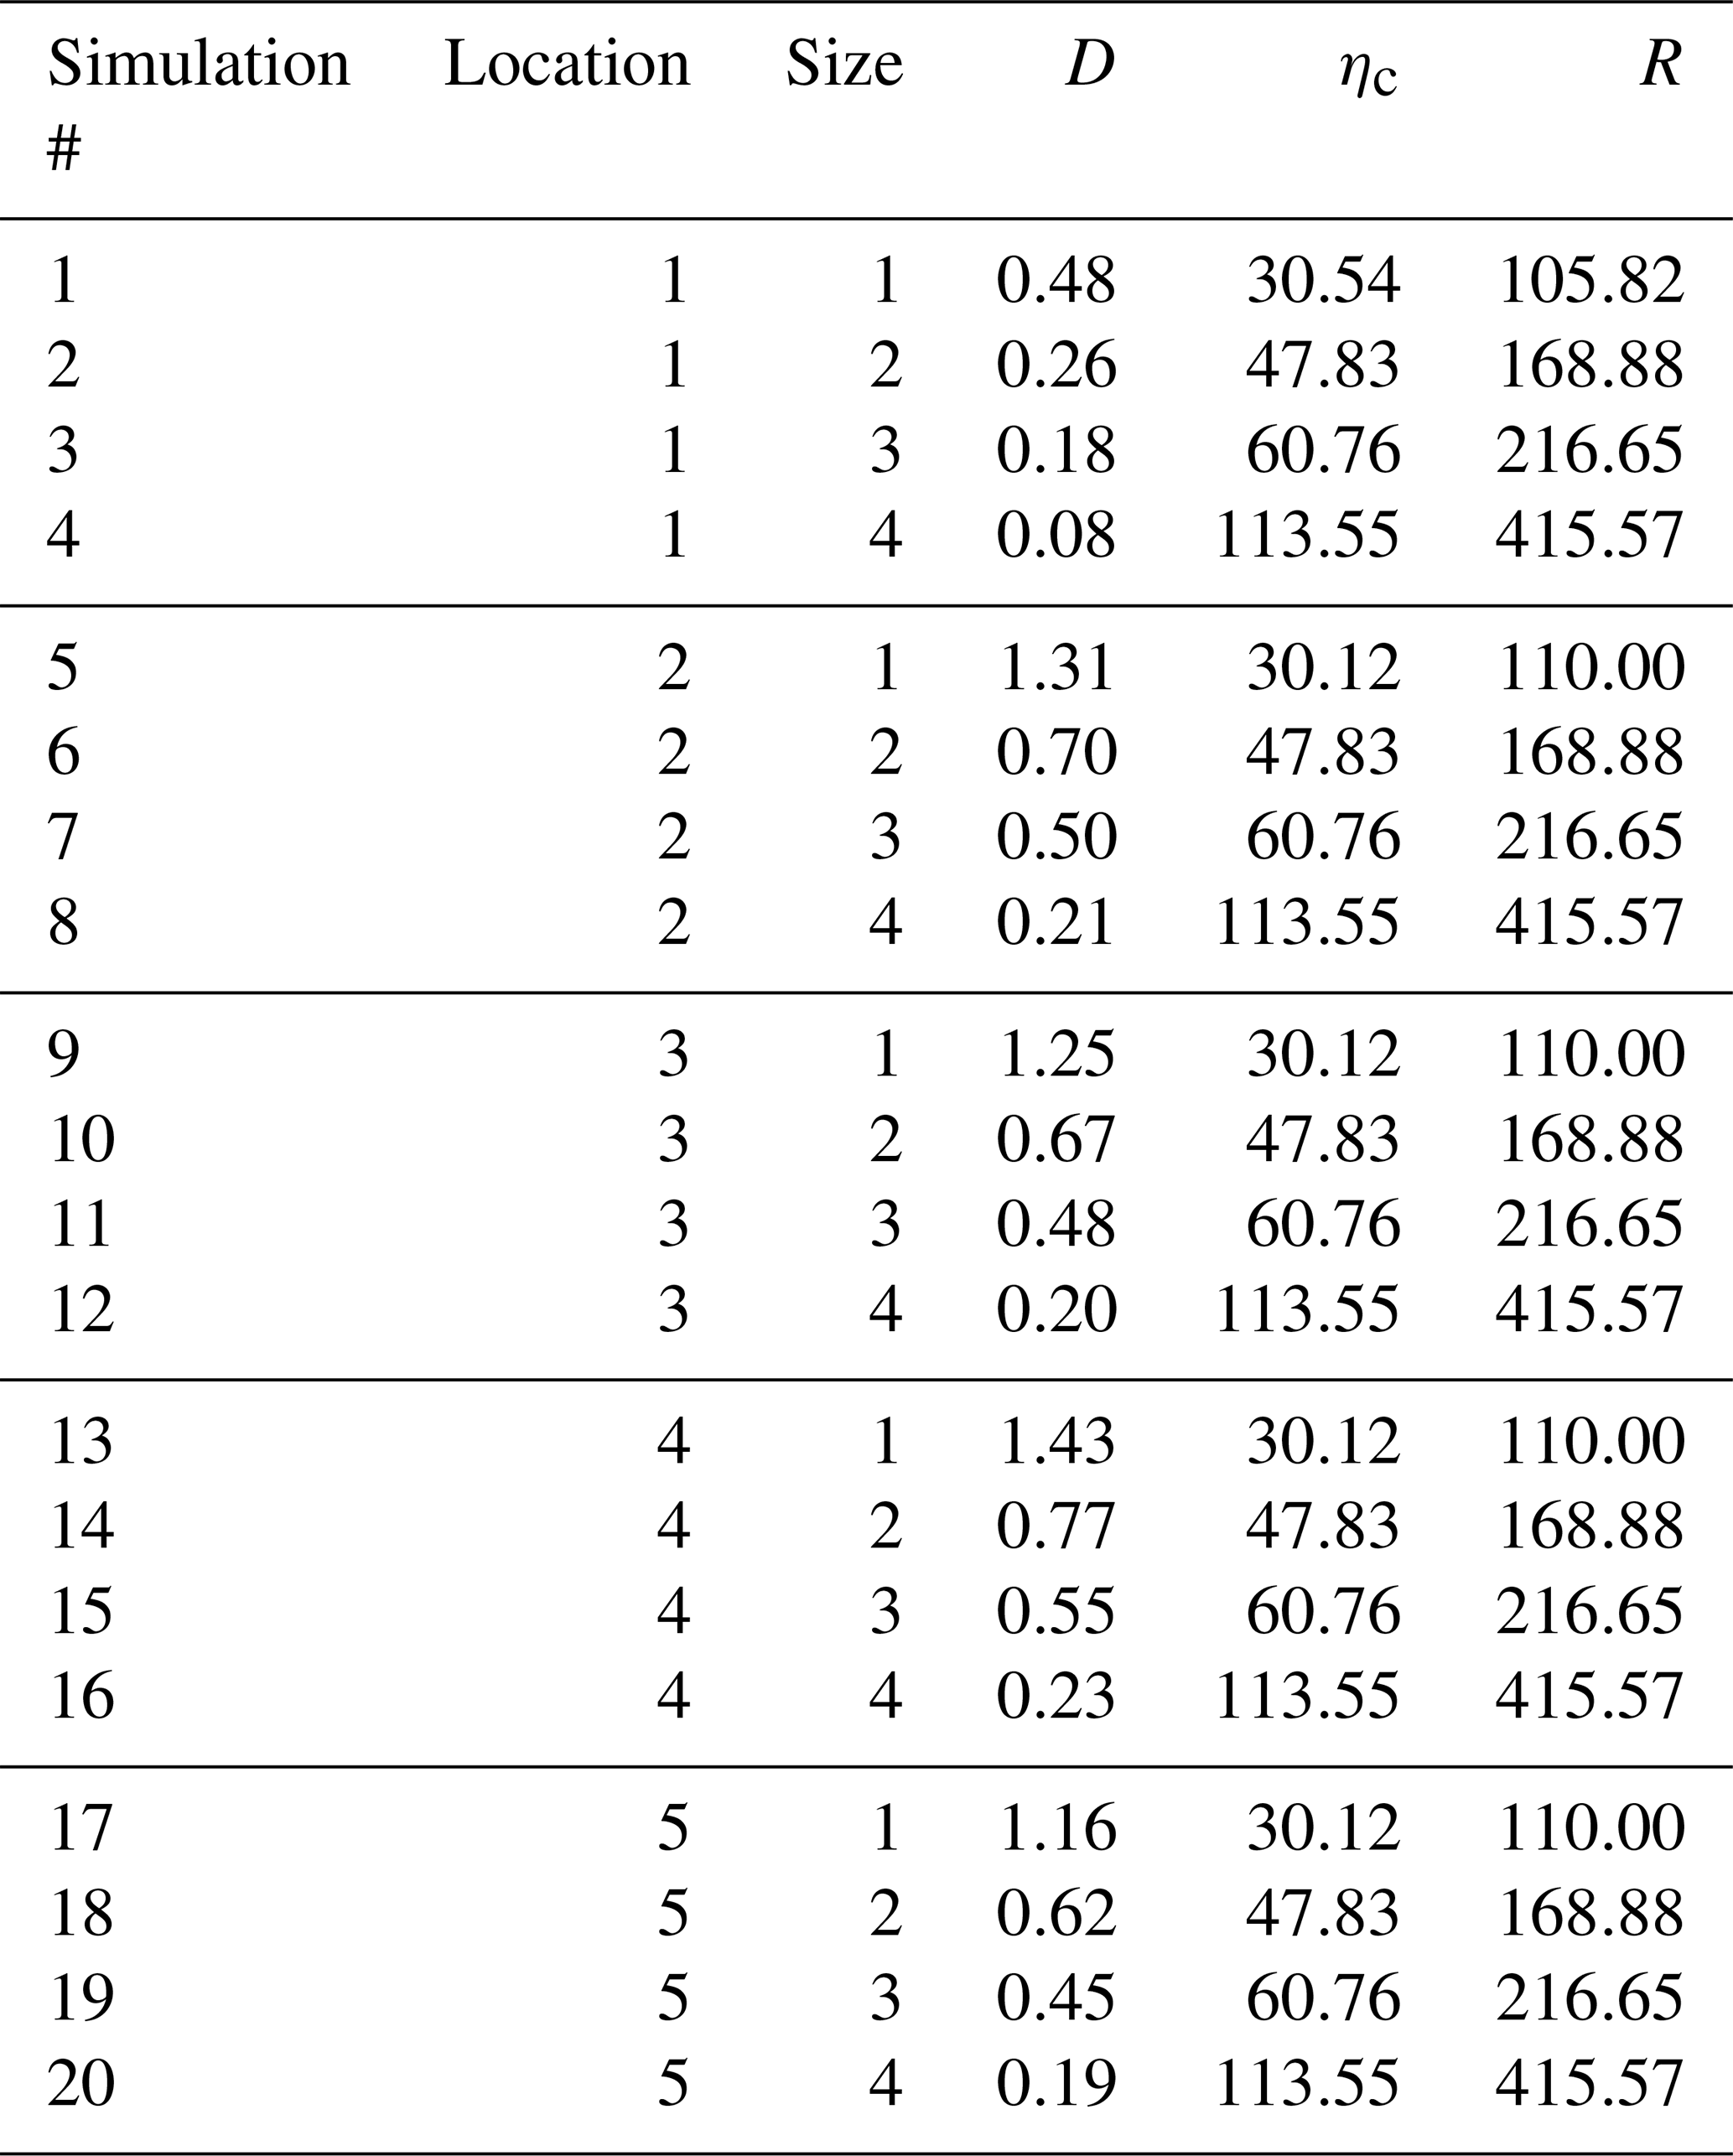
We selected the five event locations specified in Table 2 according to two criteria. In the first instance, three are placed across a region of Holocene activity (as shown in Fig. 1) and active hydrothermal venting (De Ronde et al., 2002) at locations around the Horomatangi Reefs. The remaining two event locations, one near Taupō, another in the western lake, are at other areas which have experienced lower, but not insignificant, activity to ensure modelling coverage.
An elevation model (Fig. 2) is constructed using a combined bathymetric model of Lake Taupō (Irwin, 1972; Rowe et al., 2002) and lidar measurements of the surrounding shoreline and Taupō township from 2006–2016, of which datasets were provided by the Waikato Regional Council. These are combined and projected to the New Zealand Transverse Mercator using the NZ Geodetic Datum 2000. The vertical datum is Moturiki 1953.
The numerical scheme is set up for each simulation to model the terrain with a lake level set at 356.9 m, a typical yearly maximum lake level as measured by the operating utility company and a maximum refinement level of 12 resulting in a maximum horizontal grid resolution of 8 m. All runs were executed for 1400 s of simulated time, with five vertical layers, this being guided by previous numerical work at the lake (Hayward et al., 2022b). No special considerations for domain boundaries are needed as flows do not encroach upon these because of the elevation profile.
The conventional outputs of maximum wave heights, velocities and numerical time series for gauges are produced. Specific locations and regions (shown in Fig. 2) are focused on in terms of numerical gauges and field outputs, typically located on infrastructure, e.g. State Highway 1 or the near shores beside buildings. In addition, arrays of gauges were put on four cross-sections of the Waikato River inlet, shown in Fig. 3, to calculate hydrographs of the downstream discharge and towards the control gates. The resolution of numerical gauges across each section is set to match the maximum horizontal grid resolution of the simulation. Discharge components are computed at each gauge by calculating the cross-sectional area of the section's gauge multiplied by the average horizontal velocity (perpendicular to the section) across the vertical layers. The total discharge is then the sum of these components at each time step to create the hydrograph.

Figure 3The Waikato River inlet from Lake Taupō, with terrain detail. Cross-sections where hydrographs of the river are calculated are given in red, and the lake-river control gate is given in navy blue.
3.1 Tsunami propagation and wave heights
Numerical simulations were computed for all described scenarios. In each of these, waves propagate throughout the entire lake, interacting with areas of variable depth bathymetry (e.g. the Horomatangi Reefs) and affected by the shore morphology around the lake's perimeter and Motutaiko Island.
All scenarios were computed until a simulated time of 1400 s was reached using eight cores on a single node. Computation time averaged 18.7 h per simulation, ranging from 0.5 to 53.3 h. Longer computation times were needed for larger source sizes and locations near the Horomatangi reefs (source locations 2–4). This was because of the interaction of larger, steeper waves with both the reef's shallow bathymetry and any nearby shorelines, requiring smaller time steps and longer calculation times within each time step.
Figures 4 and 5 show the maximum crest amplitudes and velocities incident at the foreshore around the entire perimeter of Lake Taupō, illustrating, in particular, the geographical variations. As would be expected, the larger sources produce greater incident amplitudes and horizontal velocities. Across the different source locations, the shore points experiencing the highest wave crest amplitude incidence are often the areas closest to the source, and other areas of the lake can be “sheltered” by morphological barriers, for example, the fourth source location towards the west of the lake generates waves which have lower impact near Taupō township. There is no preferential direction of propagation, with directly facing shores of all directions and of the same proximity experiencing similar wave incidence. Figure 6 compares the crest amplitude and velocity data between the different simulations. This shows that a positive relationship exists between both crest heights and horizontal wave velocities at the shore and the explosion energy (and, therefore, also ejecta volume and MER). The scenarios near Taupō township exemplify that the closer proximity to the source increases the maximum crest height and horizontal velocity for higher magnitude explosions.
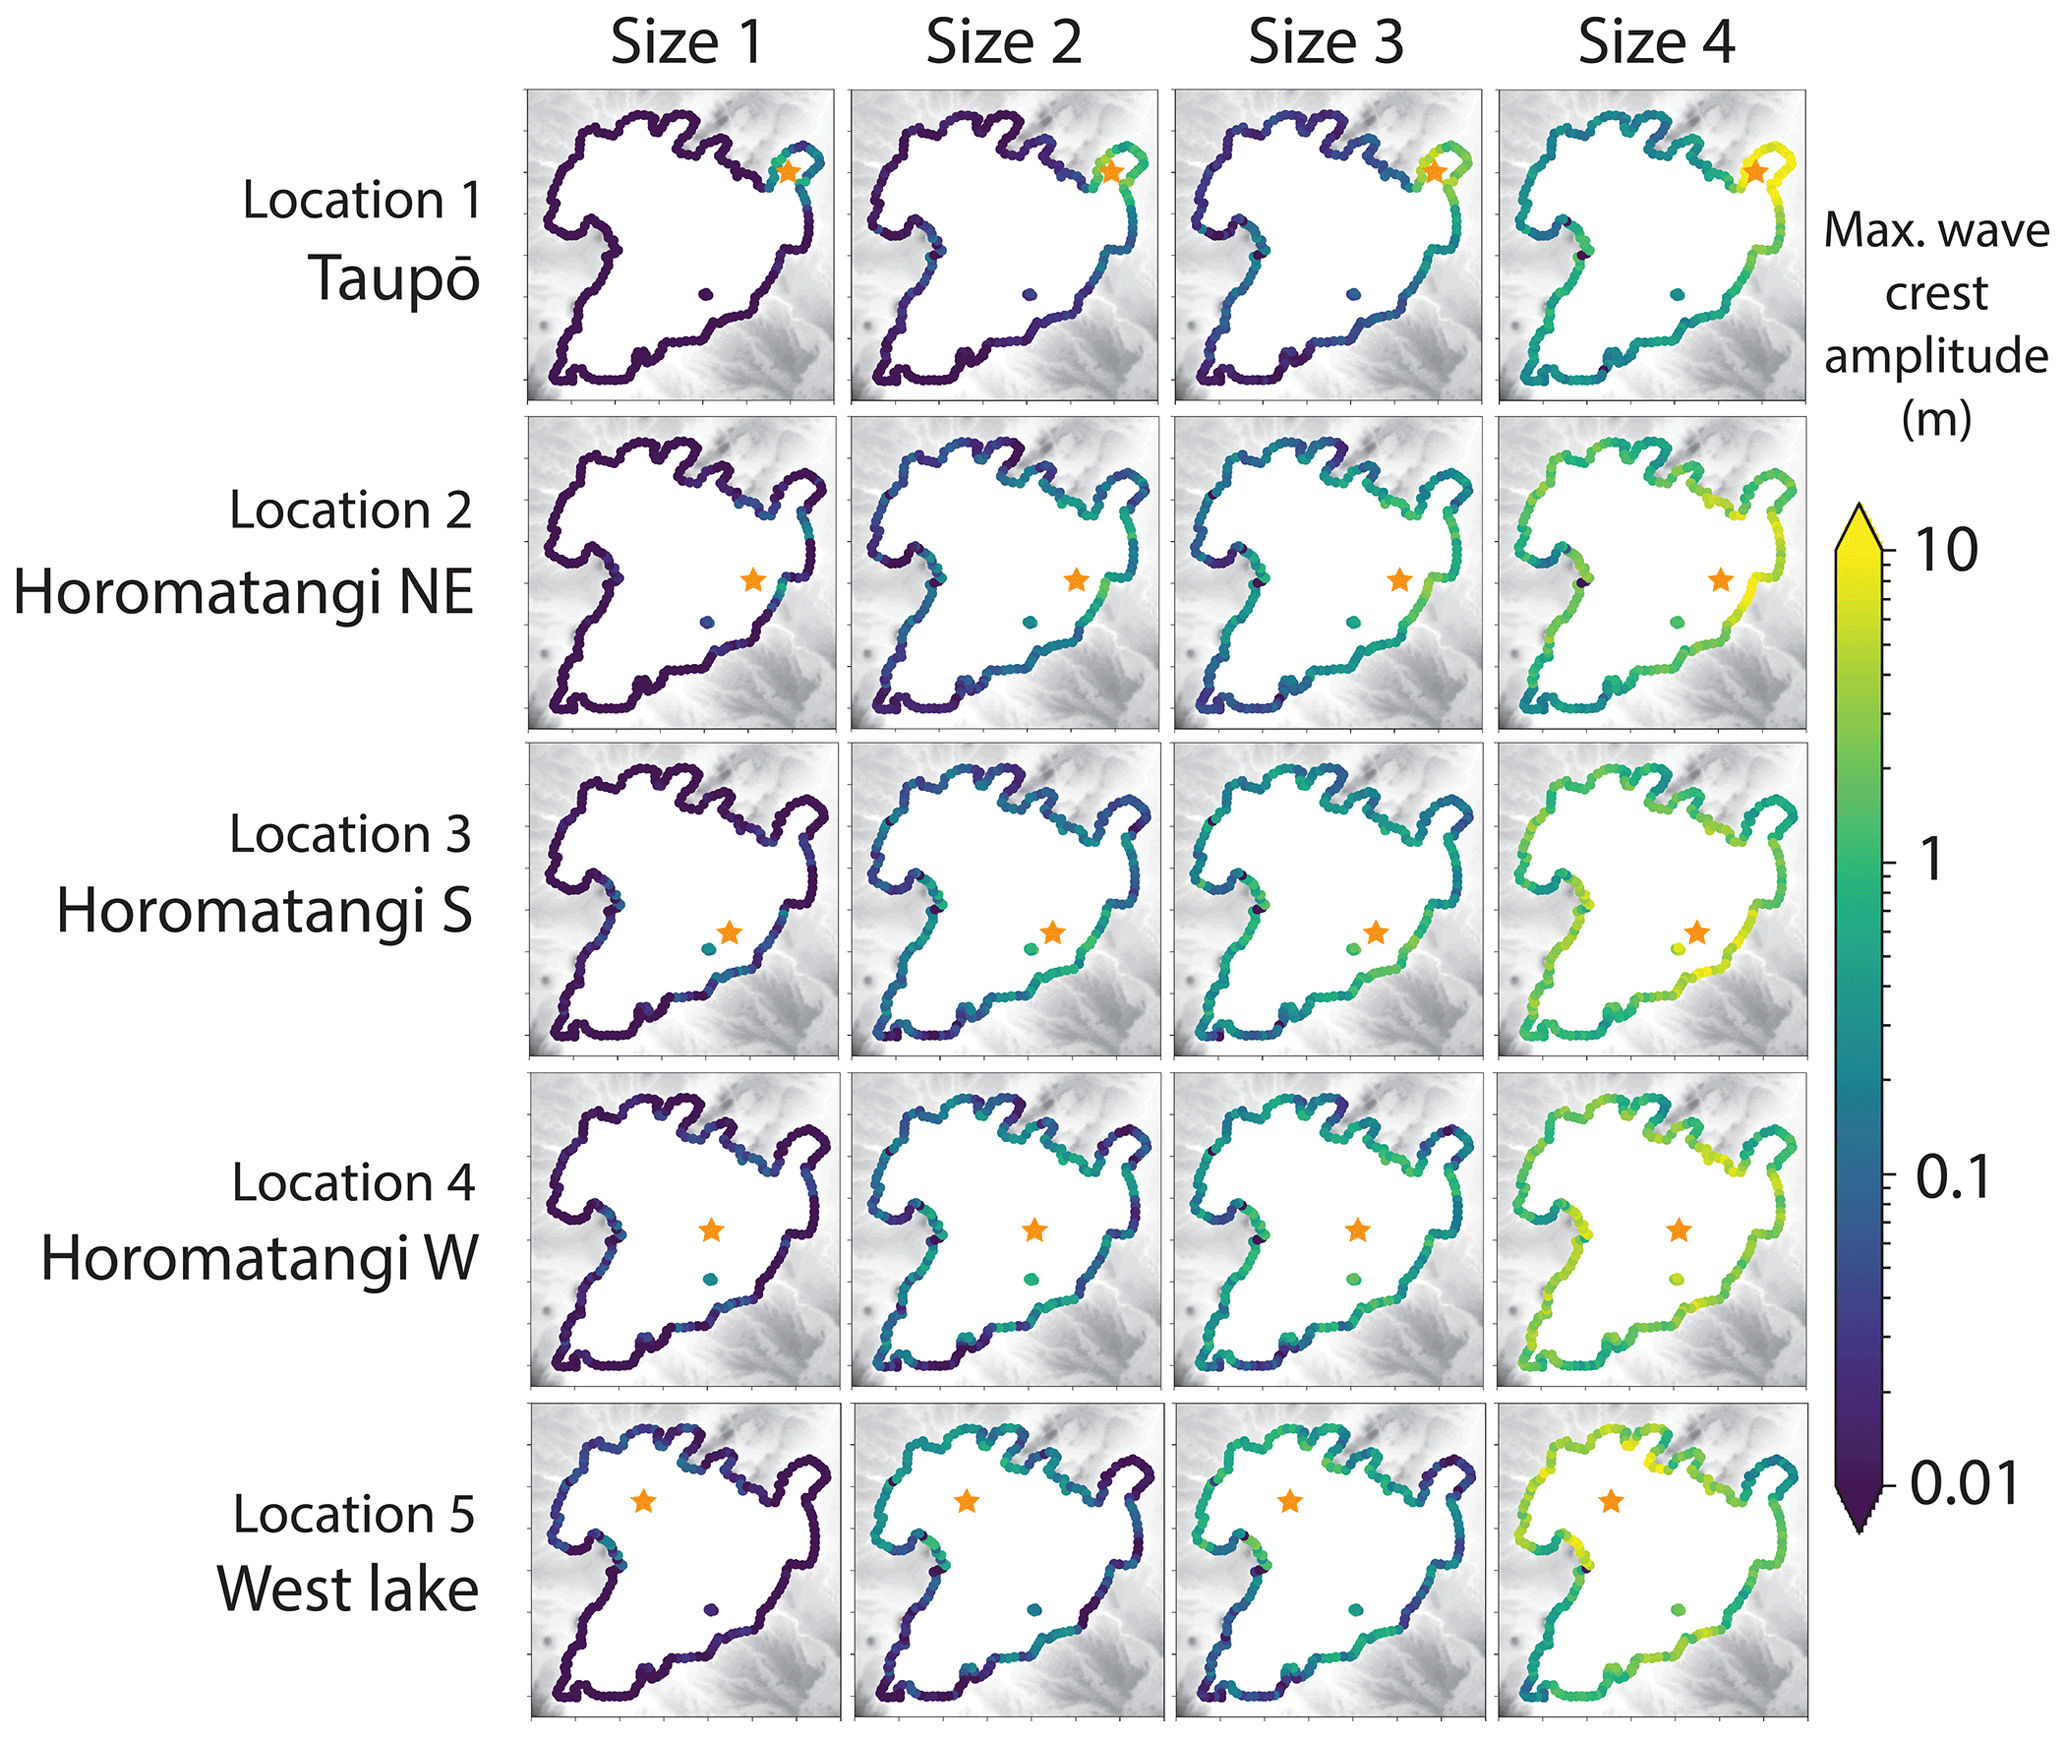
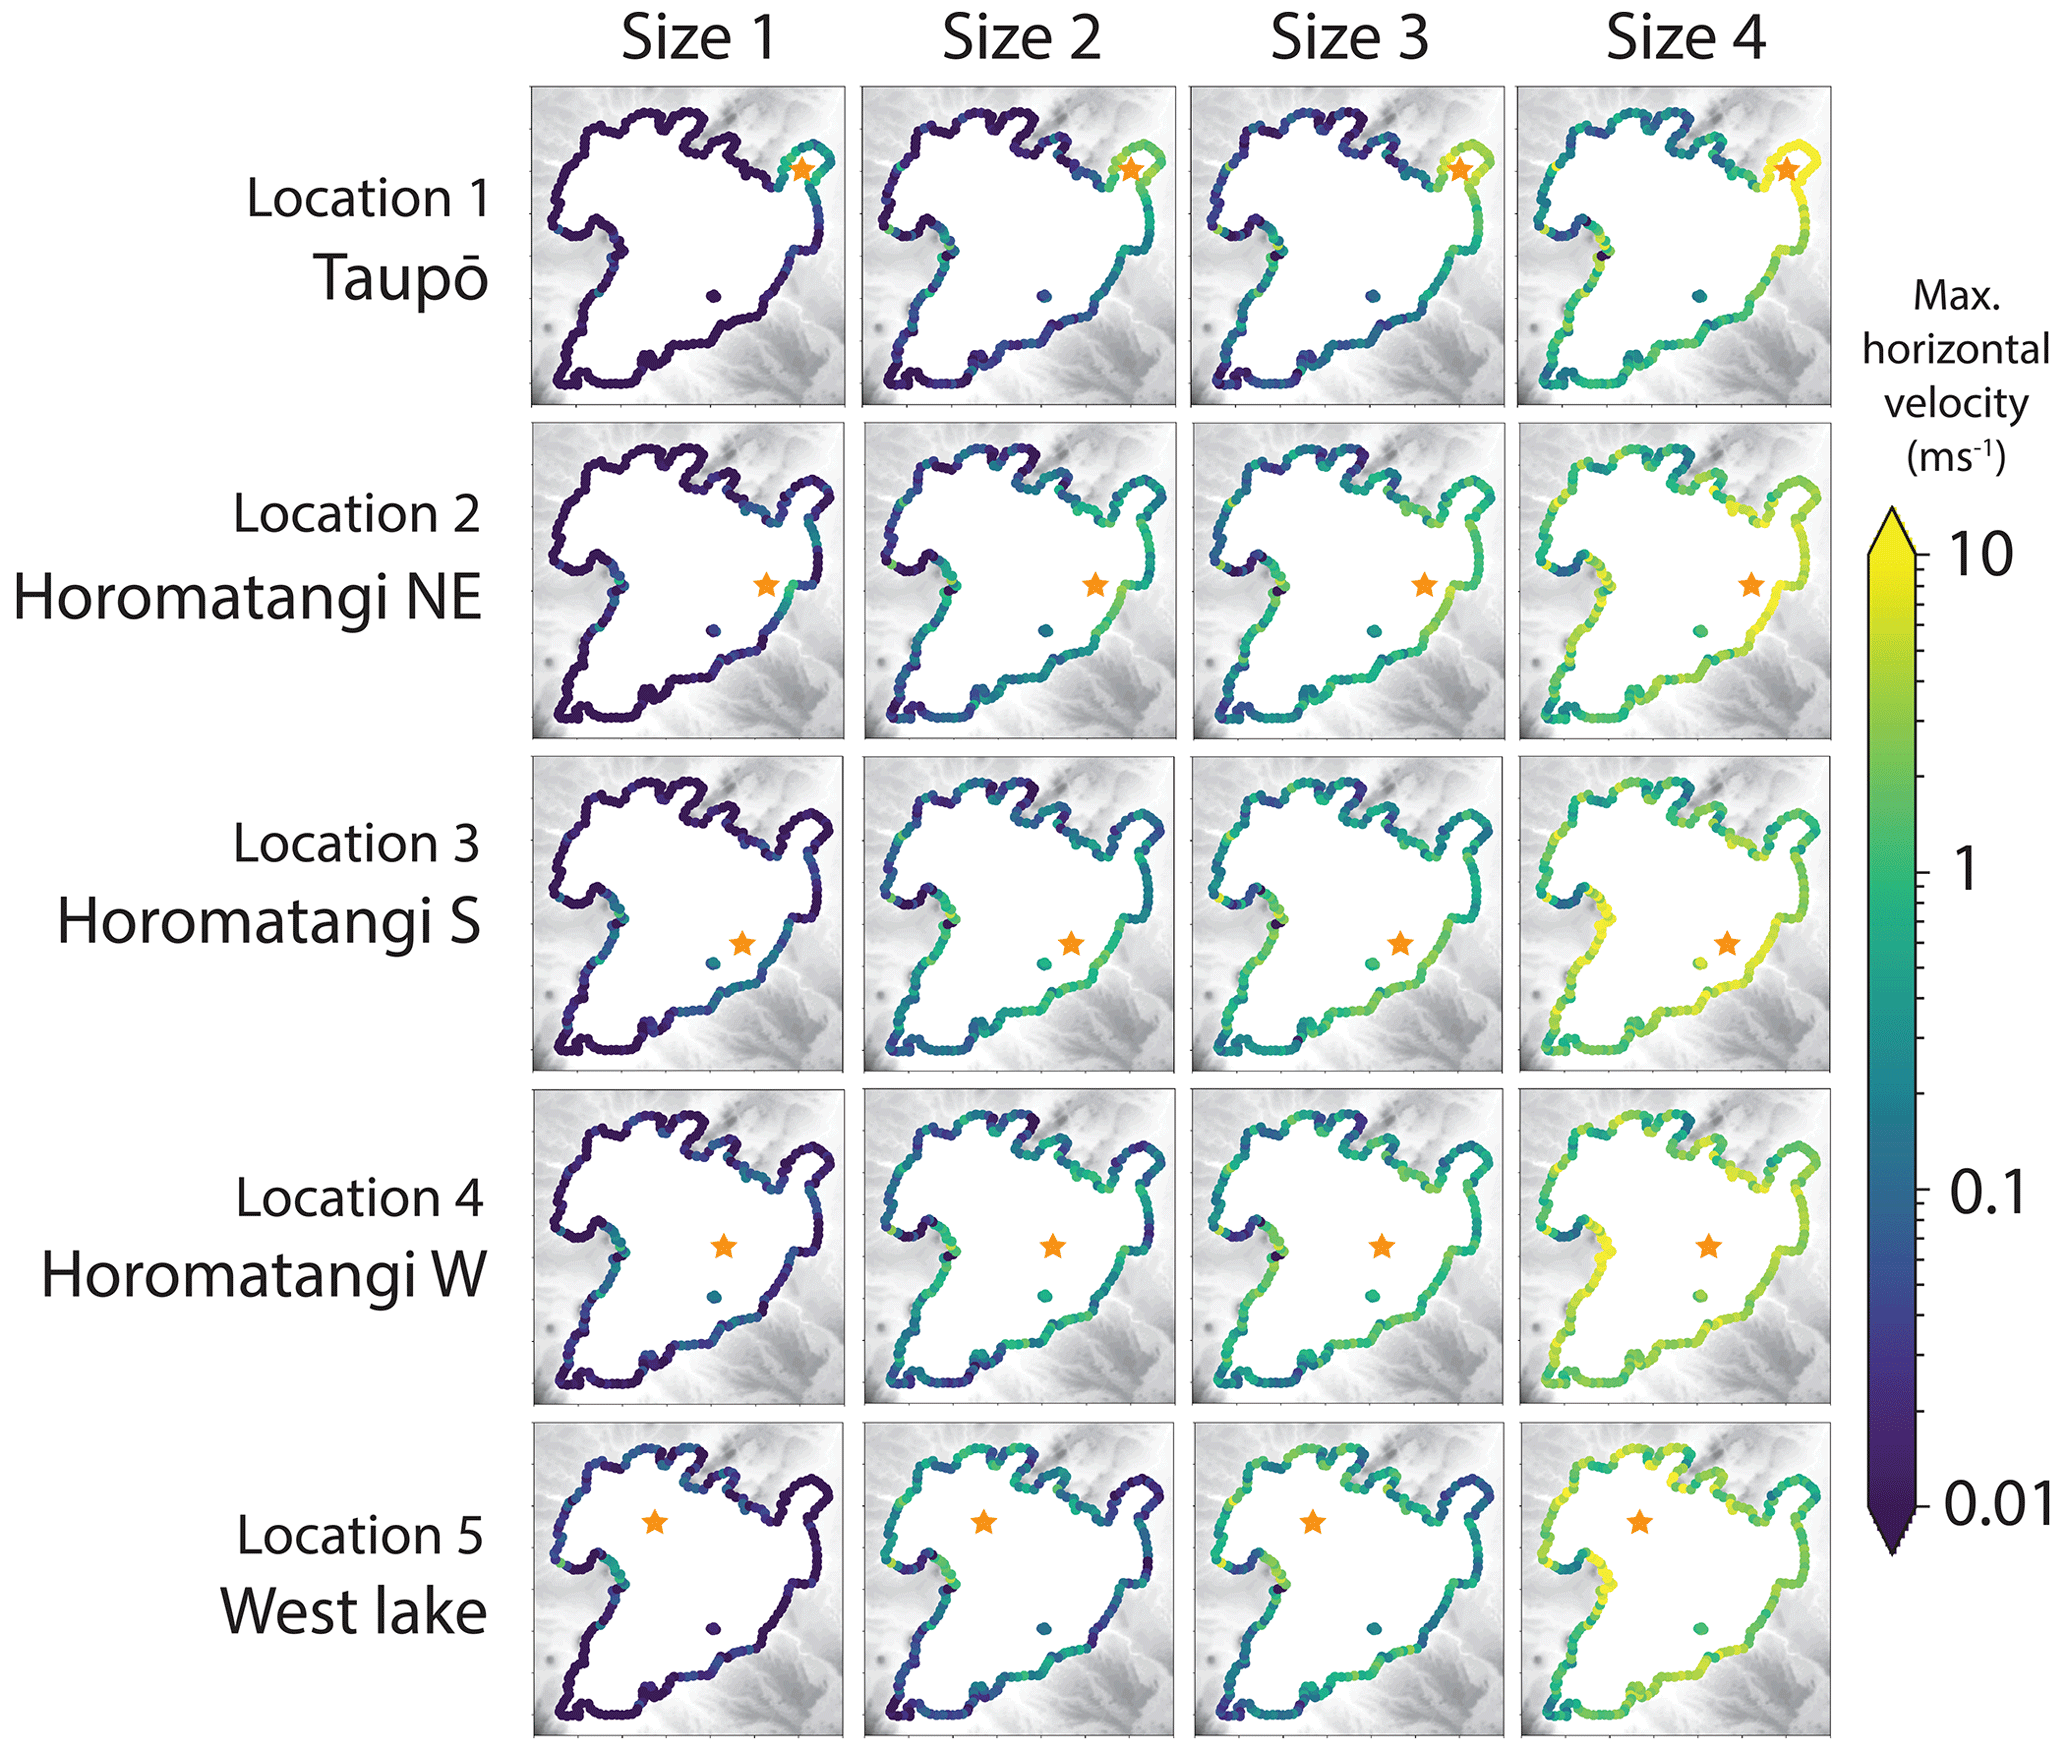
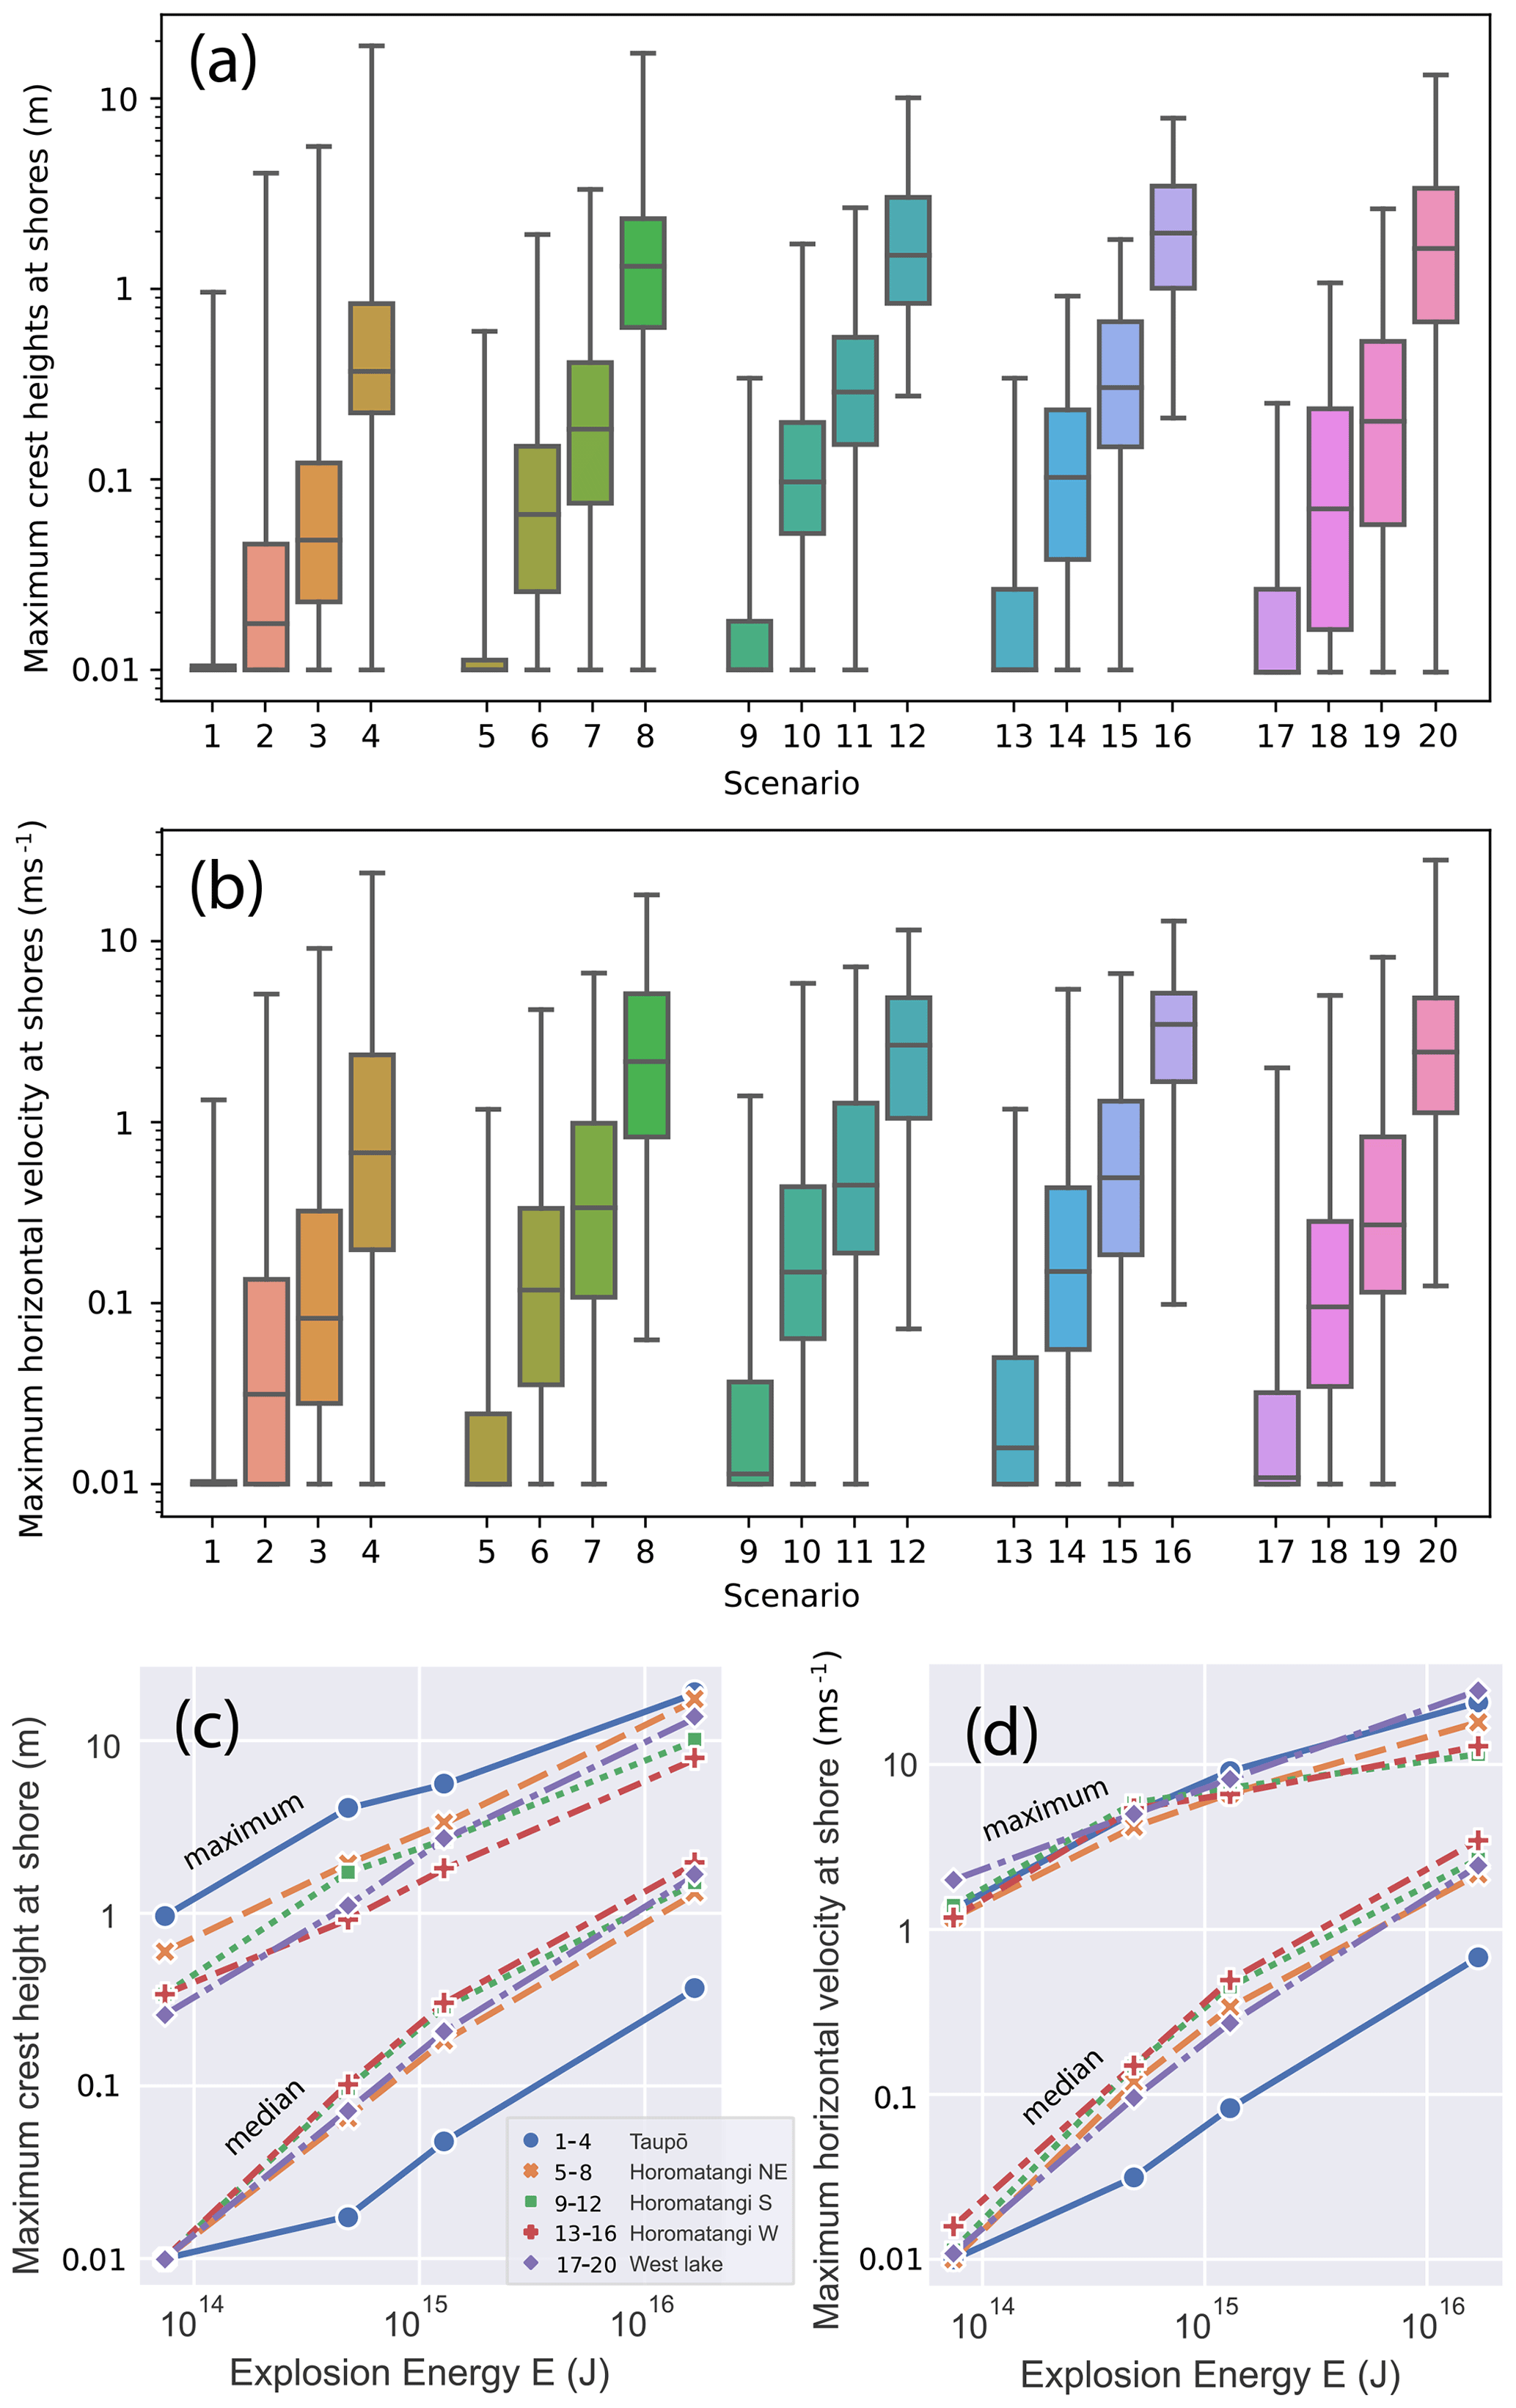
Figure 6(a, b) Box plots quantifying the range of maximum crest heights and horizontal velocities reached respectively around the foreshore for each scenario. (c, d) Plots of maximum and median values (measured over whole Taupō shoreline) of the maximum wave amplitude (c) and maximum speed (d) plotted against explosion size for the different source locations. Within the legend, numbers relate to the scenario and colours to the source locations.
First arrival times from the different source locations are illustrated in Fig. 7, and these are mostly independent of source size. For all scenarios, waves propagate throughout the entire lake within 15 min. Initial phase velocities start from approximately 40 m s−1 for the deeper locations (2–5) and approximately 23 m s−1 for the Taupō location (1), with these varying primarily due to the difference in water depth as sources of the same size generate similar wavelengths. Maximum crest heights throughout the lake do not always coincide with the first arrival, however, as the generated waves exhibit strong frequency dispersion across most of the lake. This leads to a longer duration between the arrival of the first wave and the arrival of the wave with the largest crest amplitude as the distance from the source increased. At shores with a gentler gradient, such as at Taupō, Waitahanui and Hatepe, wave shoaling resulted in bore formation as the depth change slows the group to beyond breaking, stacking the individual waves onto each other.
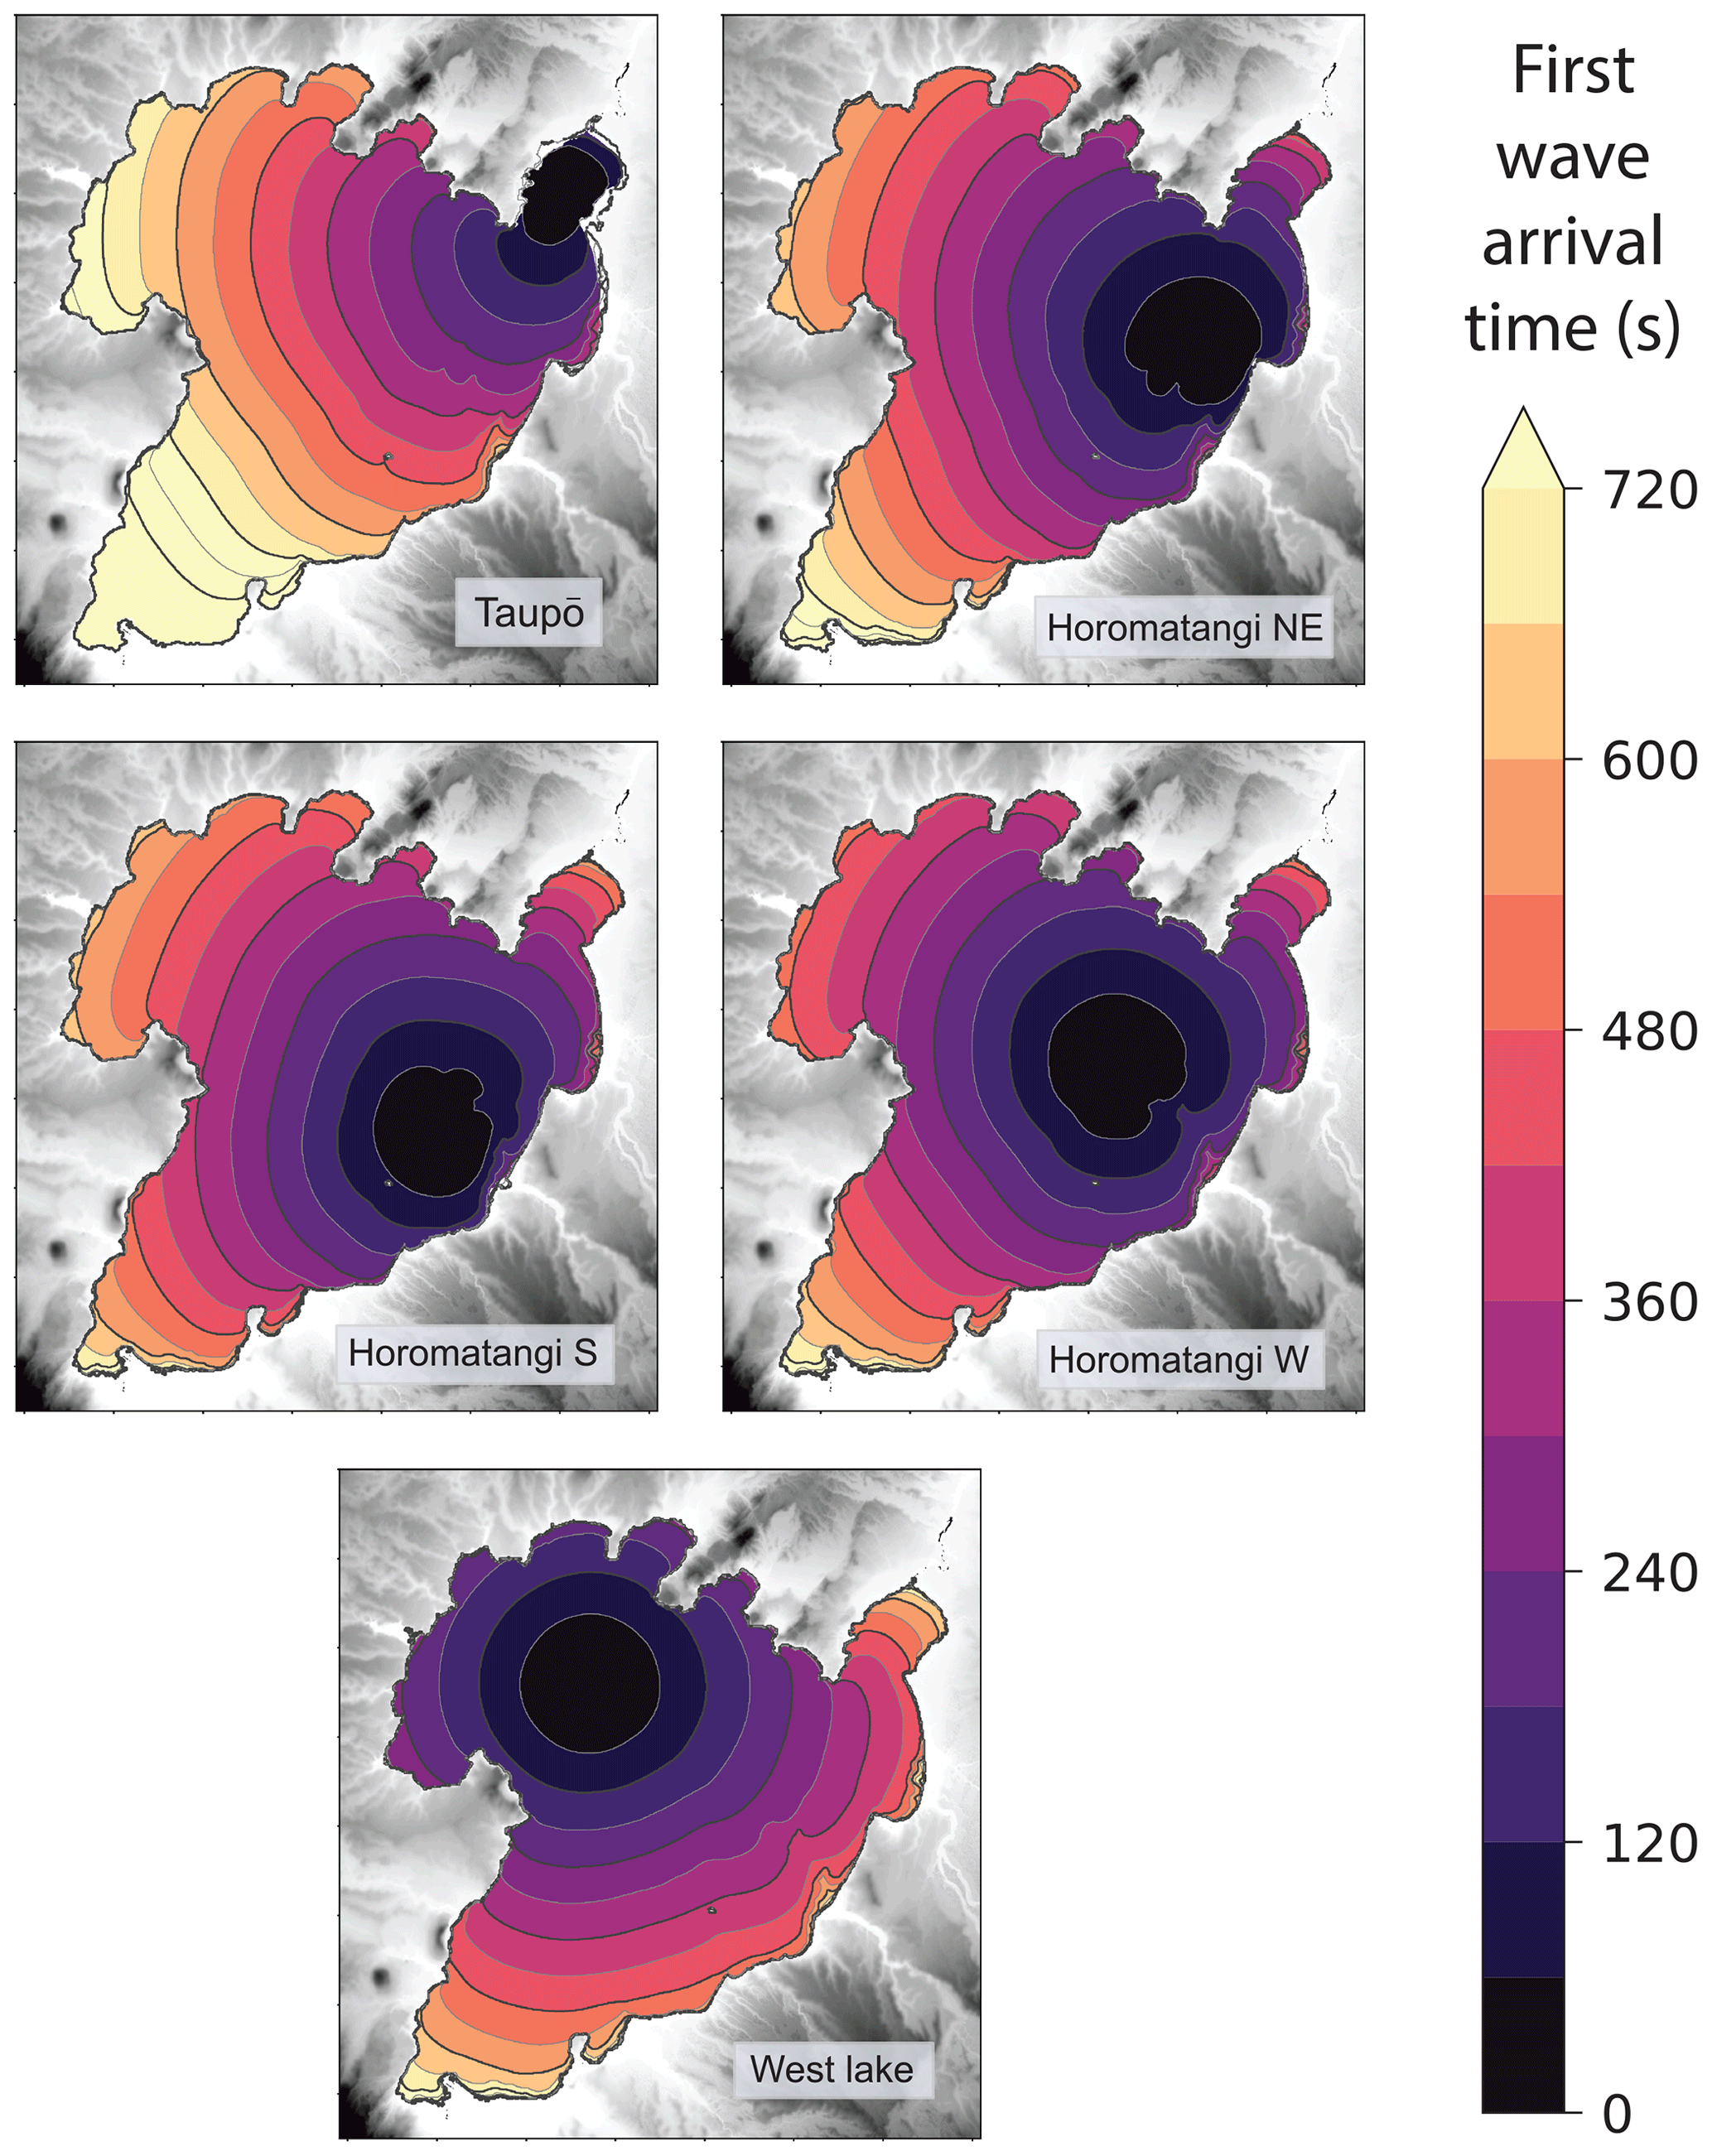
Figure 7First wave arrival times for each source location. Contours are plotted at each 60 s.
It is crucial to consider velocity as well as wave amplitude as part of assessing any tsunami impact not just beyond the shore but also within the lake to consider, for example, the impact on boats and other floating bodies, which could result in their unmooring and displacement, damaging not just themselves but also becoming a further mobile hazard (Lynett et al., 2012; Nosov et al., 2013; Azadbakht and Yim, 2015; Borrero et al., 2015). The range of scenarios across Lake Taupō shows that, for waves from sublacustrine eruptions, the induced horizontal flow velocities decrease at a similar, if slightly lower, rate to the amplitude of generated waves with distance from the source. While only the magnitude of horizontal velocity is considered here, it would be further beneficial to utilise the capabilities of non-hydrostatic multilayer modelling to analyse the current direction in addition to harbour-scale rotational patterns or vorticity, which would contribute to potential hazard (Lynett et al., 2012).
3.2 Inundation and potential infrastructure impacts
Given the numerical capability of the multilayer scheme to simulate run-up as demonstrated by Hayward et al. (2022a), an investigation of inundation caused by subaqueous explosions was undertaken. Five areas, illustrated in Fig. 2, are bounded to investigate any inundation beyond the foreshore experienced in any of the 20 scenarios.

Figure 8Inundation contours by size for the five boxed areas shown in Fig. 2, where only the closest source for each location is shown. Map imagery © OpenStreetMap contributors 2022. Distributed under the Open Data Commons Open Database License (ODbL) v1.0.
Figure 8 illustrates, for each area, the maximum inundation extent for each source size at the closest location, where the exceedance threshold is 1 cm. The inundation extents are laid over OpenStreetMap data and are plotted at the simulation end time. The two smaller source sizes show a similar pattern of negligible inundation in all areas, with only beaches and very low (< 0.5 m) elevations above the lake experiencing minor, if any, flooding. Size 3 is similarly limited in reach but generally has higher amplitude wave incidence and hence some notable areas of flooding, e.g. Hatepe near the stream and parts of Acacia Bay and Rainbow Point near Taupō. Size 4, in contrast, precipitates significant waves in all illustrated areas, inundating most of Motutere, Hatepe, and large areas of Kinloch and Taupō's eastern shore.
The comparisons between source sizes demonstrate that hazardous waves only eventuate at directly facing shoreside areas from source size two and significant inundation of proximal (within 10 km) low-lying shorelines besides shores begins between source sizes 3 and 4. It is worth noting that these scenarios conditionally assume an ideal volcanic event taking place, i.e. one which actually occurs under the lake at an intermediate depth range and is sufficiently explosive in eruptive characteristics.
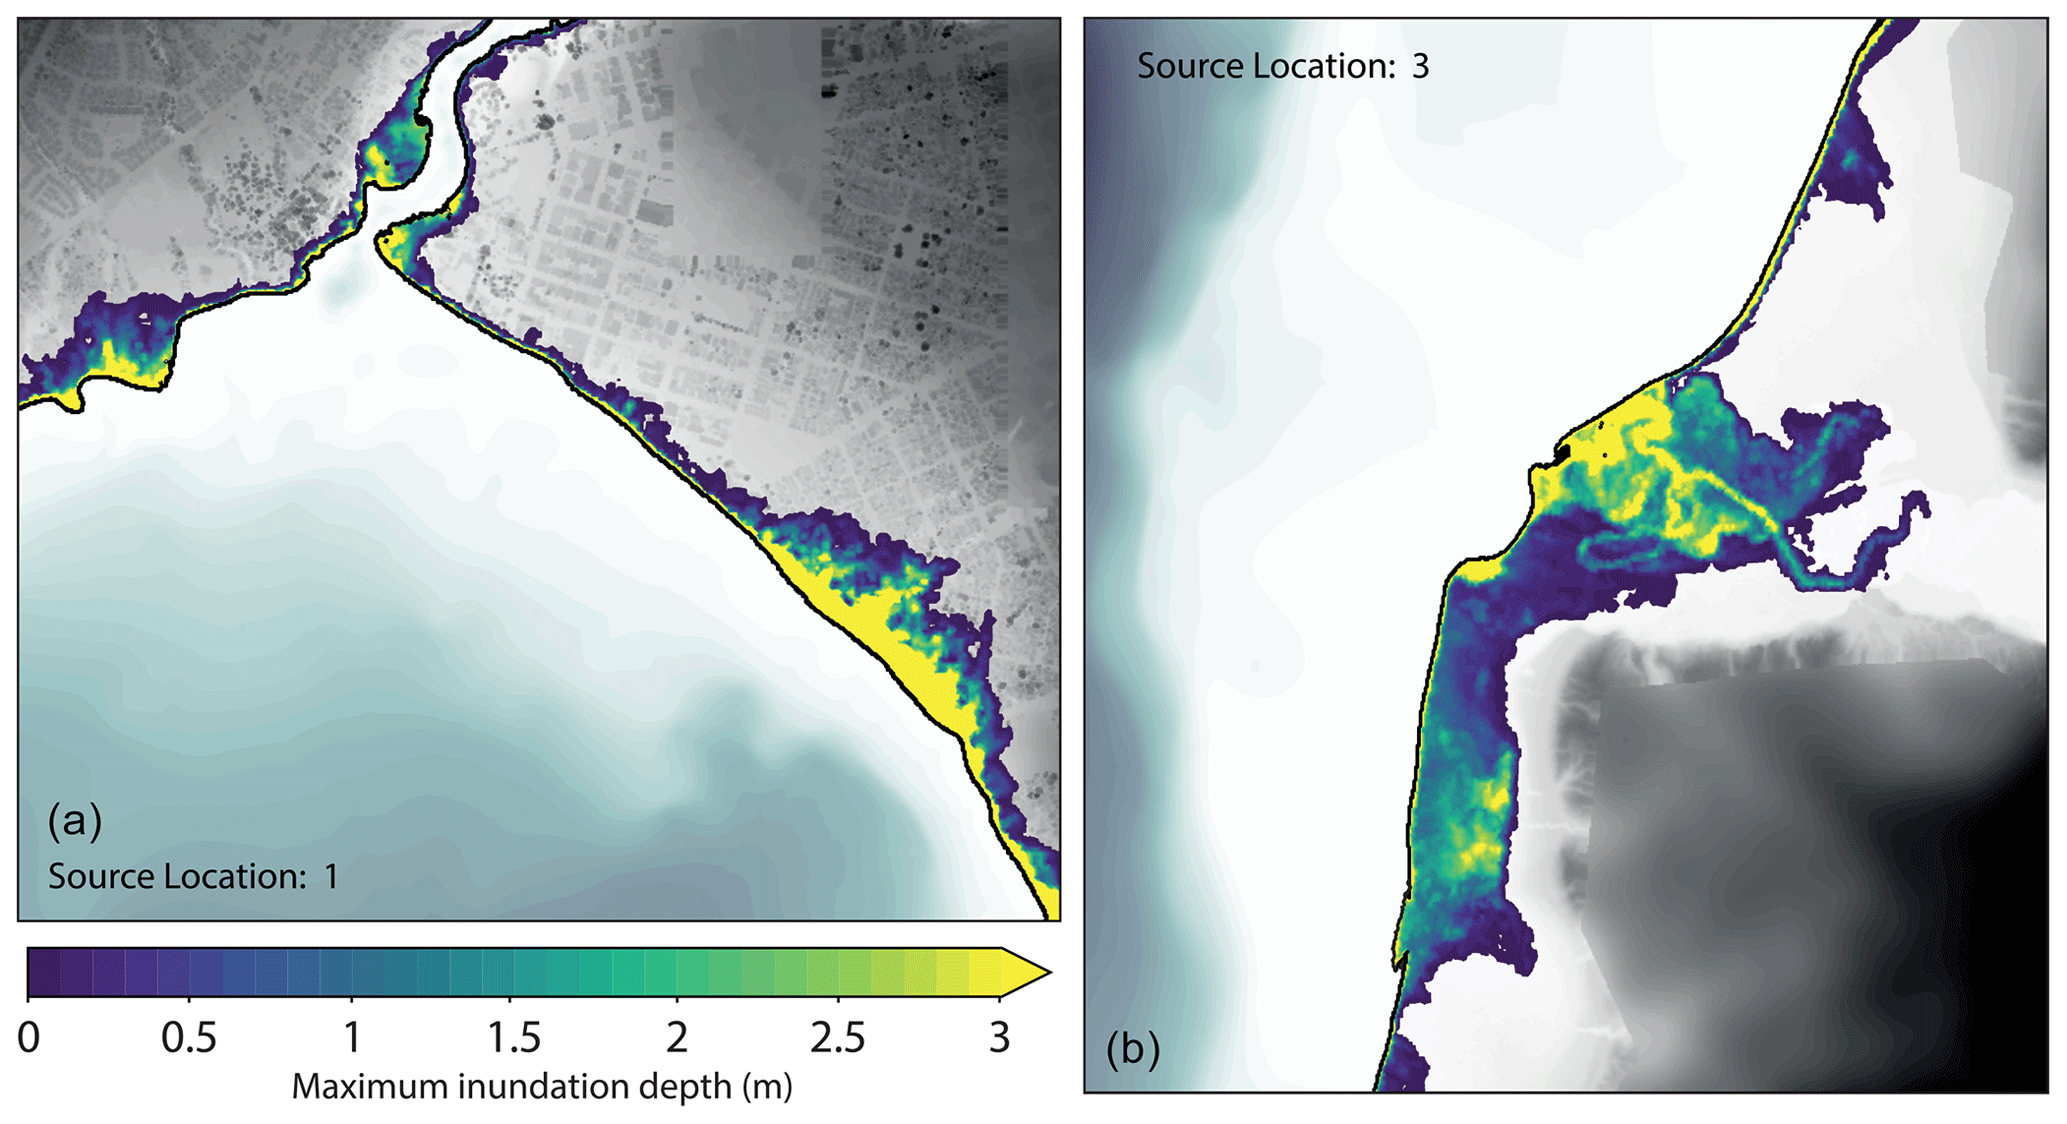
Figure 9Map of maximum inundation heights at Taupō (a) and Hatepe (b) for largest size and closest source, overlaying shaded DTM detail.
Figure 9 shows more detailed flow depths for the closest and largest individual scenarios at Taupō and Hatepe. In the Hatepe area, the preferential propagation of the incident waves up the tributary stream is clearly demonstrated, as is the lack of inundation on the north-eastern shore where the land rises more steeply out of the lake. The wave breaking induced here is also evidenced at the shore to the south. Only low-lying land around the lake experiences any significant inundation, particularly around the plain adjacent to the stream. In addition, ponding of water is also experienced in slightly depressed areas. At Taupō, the slightly higher CBD area is not inundated, while the flatter suburban areas to the east and the surrounding shores beyond the inlet to the Waikato River are inundated. Note that also in the same figure, the high-resolution lidar incorporated into the DTM is visible. This level of detail is necessary to ensure validity when simulating wave run-up around infrastructure and the built environment, which can act as barriers or artificial channels.
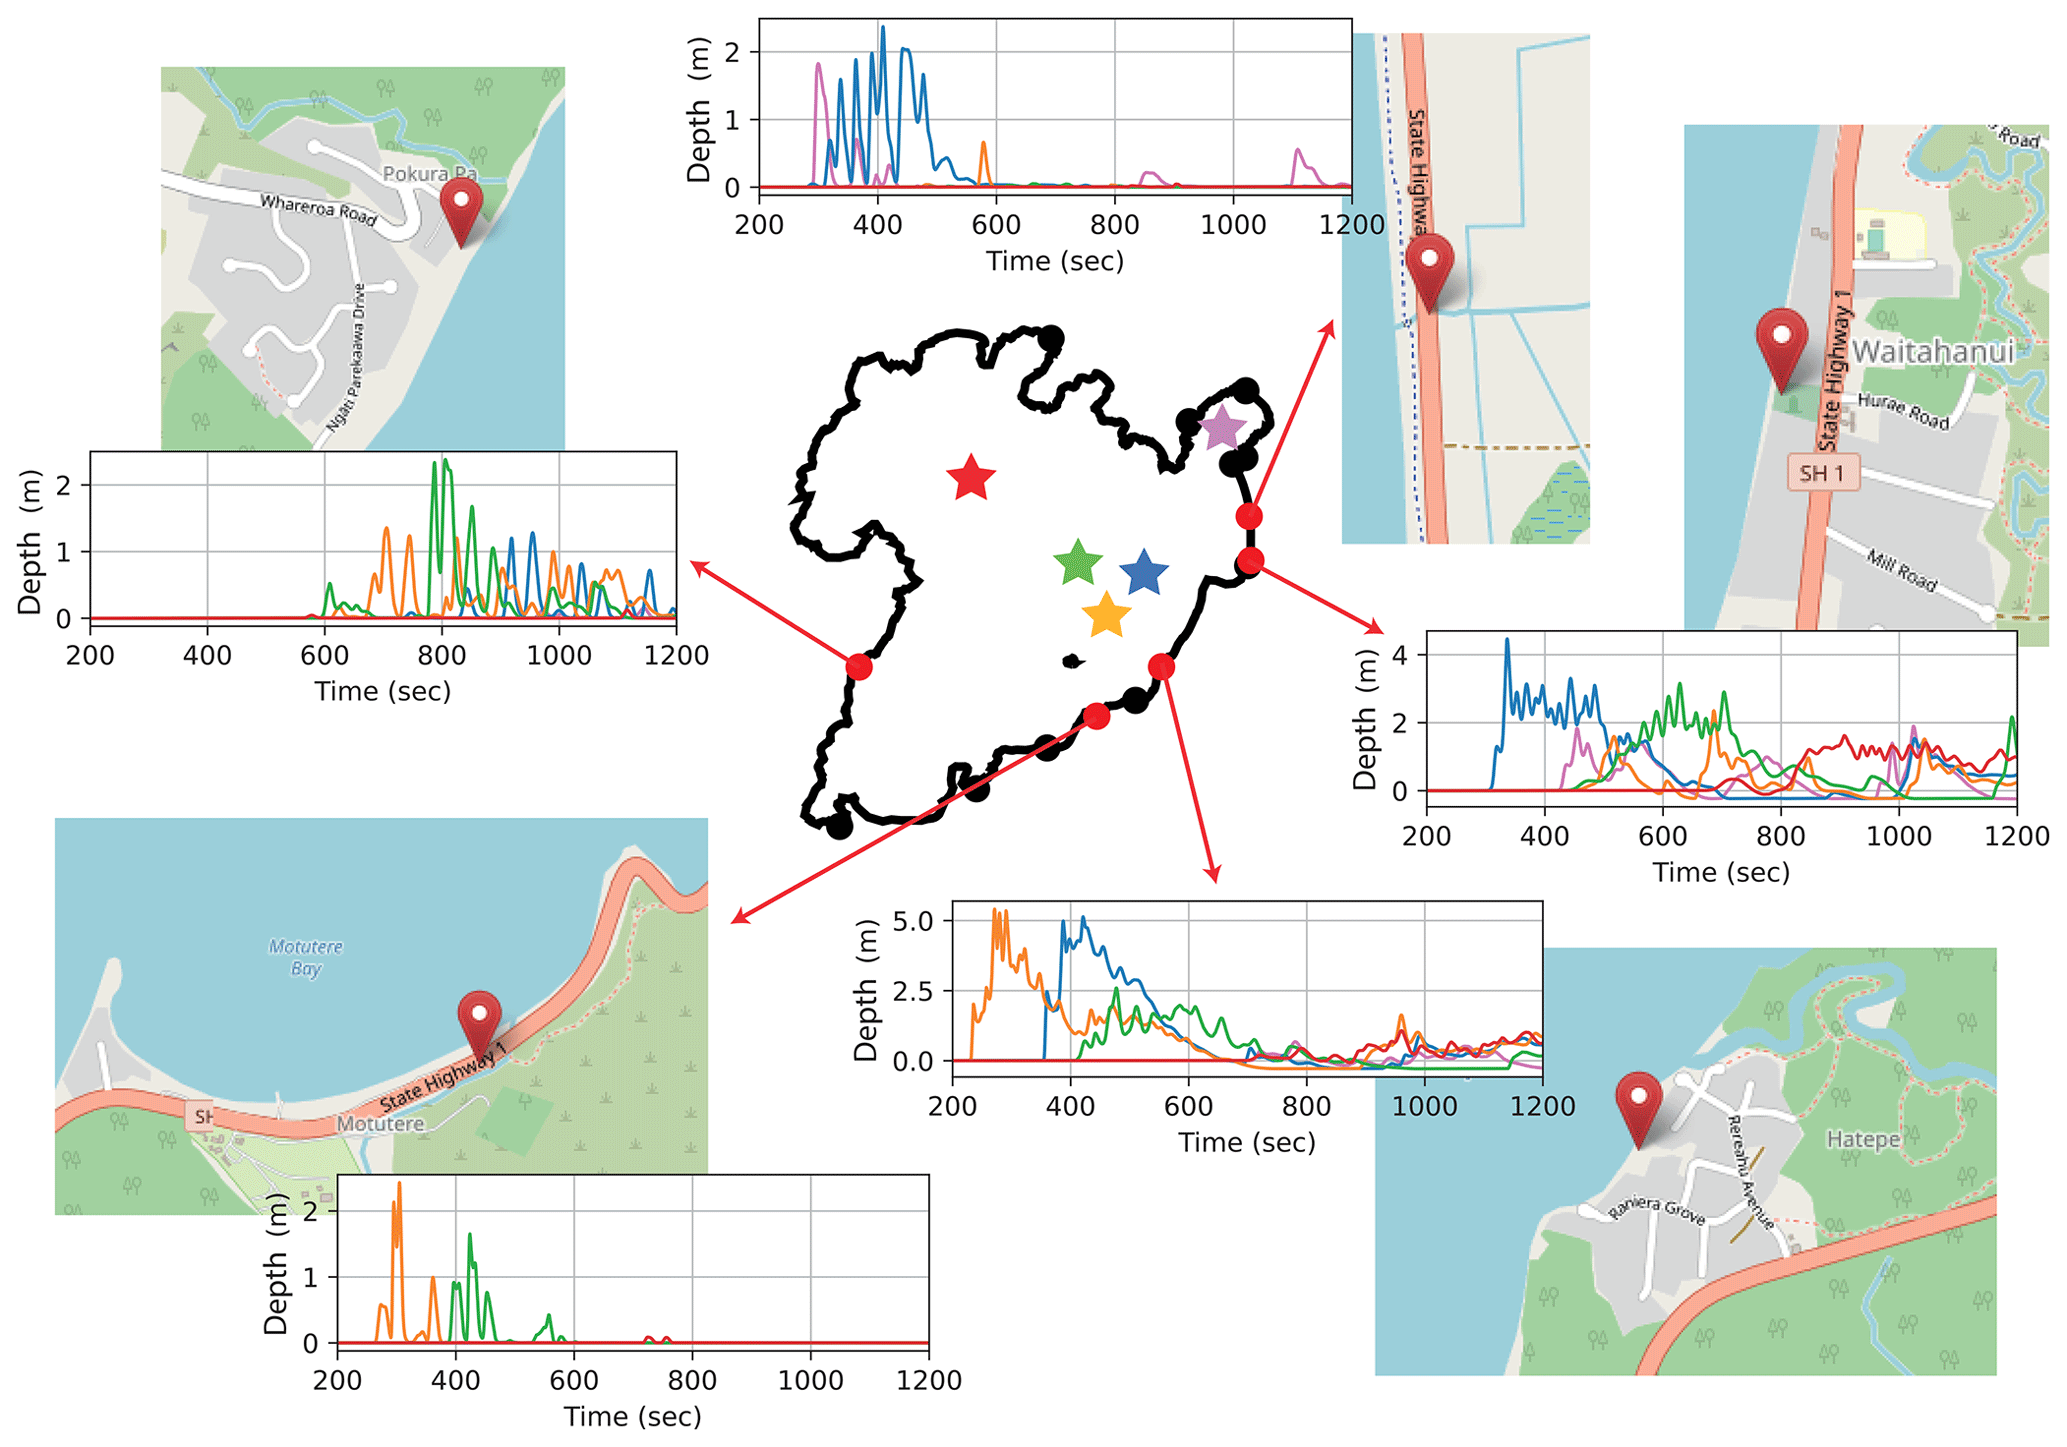
Figure 10Inundation depth time series for the largest size sources, coloured by location and indicated by stars in the central map. Map imagery © OpenStreetMap contributors 2022. Distributed under the Open Data Commons Open Database License (ODbL) v1.0.
Figure 10 shows tsunami time series at numerical gauges located on or at areas of the built environment, including lake-facing building perimeters and State Highway 1, the main arterial north-to-south road. The time series for the largest source at each source location are plotted and show how the different source locations affect the arrival time and the magnitude of incident wave heights.
The two eastern gauges placed on the shore periphery (at Hatepe and Waitahanui) display the changing arrival times for each location which correlates with distance and the inundation profile. In these areas, the tsunami is characterised by an undulating bore as the dispersive wave train stacks upon itself, causing a rapid increase in inundation heights followed by a slower retreat with additional, smaller surges sometimes following. It can also be seen that for the two source locations at a distance, in the west lake and near Taupō, waves generally arrive much later and, while still registering significant heights for this source size, are lower than for the nearer locations. The western gauge (at Whareroa) reveals slightly different run-up characteristics of rapid, successive heights of comparable magnitude. These brief, and therefore lower strength, inundation episodes are likely due to steeper slope gradients and the quicker change of water depth near shore resulting in individual wave phases reflecting close to shore rather than producing a longer bore as in the eastern locations.
The two numerical gauges placed on State Highway 1 demonstrate the high variability of significant inundation on the highways near shore. At the southernmost location, near Motutere, two of the Horomatangi sources (yellow and green) cause significant inundation, but the other (blue) does not, despite being of similar distance from the source, likely due to the presence of the Horomatangi reefs. For the location north of Waitahanui, the reverse is seen where one Horomatangi source location, and even the source near Taupō, has far more impact than the other two. The further source location to the west registers minor (< 0.1 m) inundation of these roads at the same source size, and neither gauge received significant inundation for any of the smaller sizes. This indicates that, for these pieces of infrastructure that are relatively near the shore, any impact depends strongly on not just the source size but also the location, as distance heavily controls inundation extent, as does the presence of any significant bathymetric barriers such as the Horomatangi reefs.
The effects of incident waves on the inlet of the Waikato River are also considered, and hydrographs are plotted in Figs. 11 and 12. Only results from the Taupō source location are shown as no other location produced significant impacts. Figure 11 shows a comparison between different source sizes for flow at the river inlet. As the source sizes vary with magnitude, so do the maximum discharge rates as numerically measured at the inlet; the largest size returns a considerably higher peak discharge. Also evident are the small changes in arrival time, which can be explained somewhat by the height of the generated waves at this location, but is mainly due to the larger horizontal span of the source, which effectively moves it closer to the inlet. Figure 12 shows the time series for three sections going progressively downstream for the largest size source. It can be seen that the peak discharge points for each section progress “downstream”, coinciding with the initial wave that flows through the inlet. As this happens, the wave encounters curves and a cut-off in the form of the control gate, which dampens and reflects a portion of the energy back towards the lake. This gate is not manually emplaced – it is incorporated in the DTM from lidar survey and as such is as high as the road it carries, and could potentially be overtopped by high enough waves. For these sources, the gate is not overtopped. The flux down this channel is therefore reflected back down producing a trough that is equivalent to a negative (or reverse) discharge from the inlet back towards the lake. Combined with the minor frequency dispersion (which occurs after the entry into the channel due to a small deepening), this reduces the peak discharge by 72 % when the wave travels from the inlet (section A) down to section C and a reduction of flux by 62 %. This type of output can be utilised as a starting point to investigate any cascading hazard down the river system; for instance, in this case, any structural effects by the induced flow on the Waikato River control gate in Taupō. Any damage could potentially impact resources or land further down the river, including several hydroelectric power stations situated downstream, the first being 13 km away.
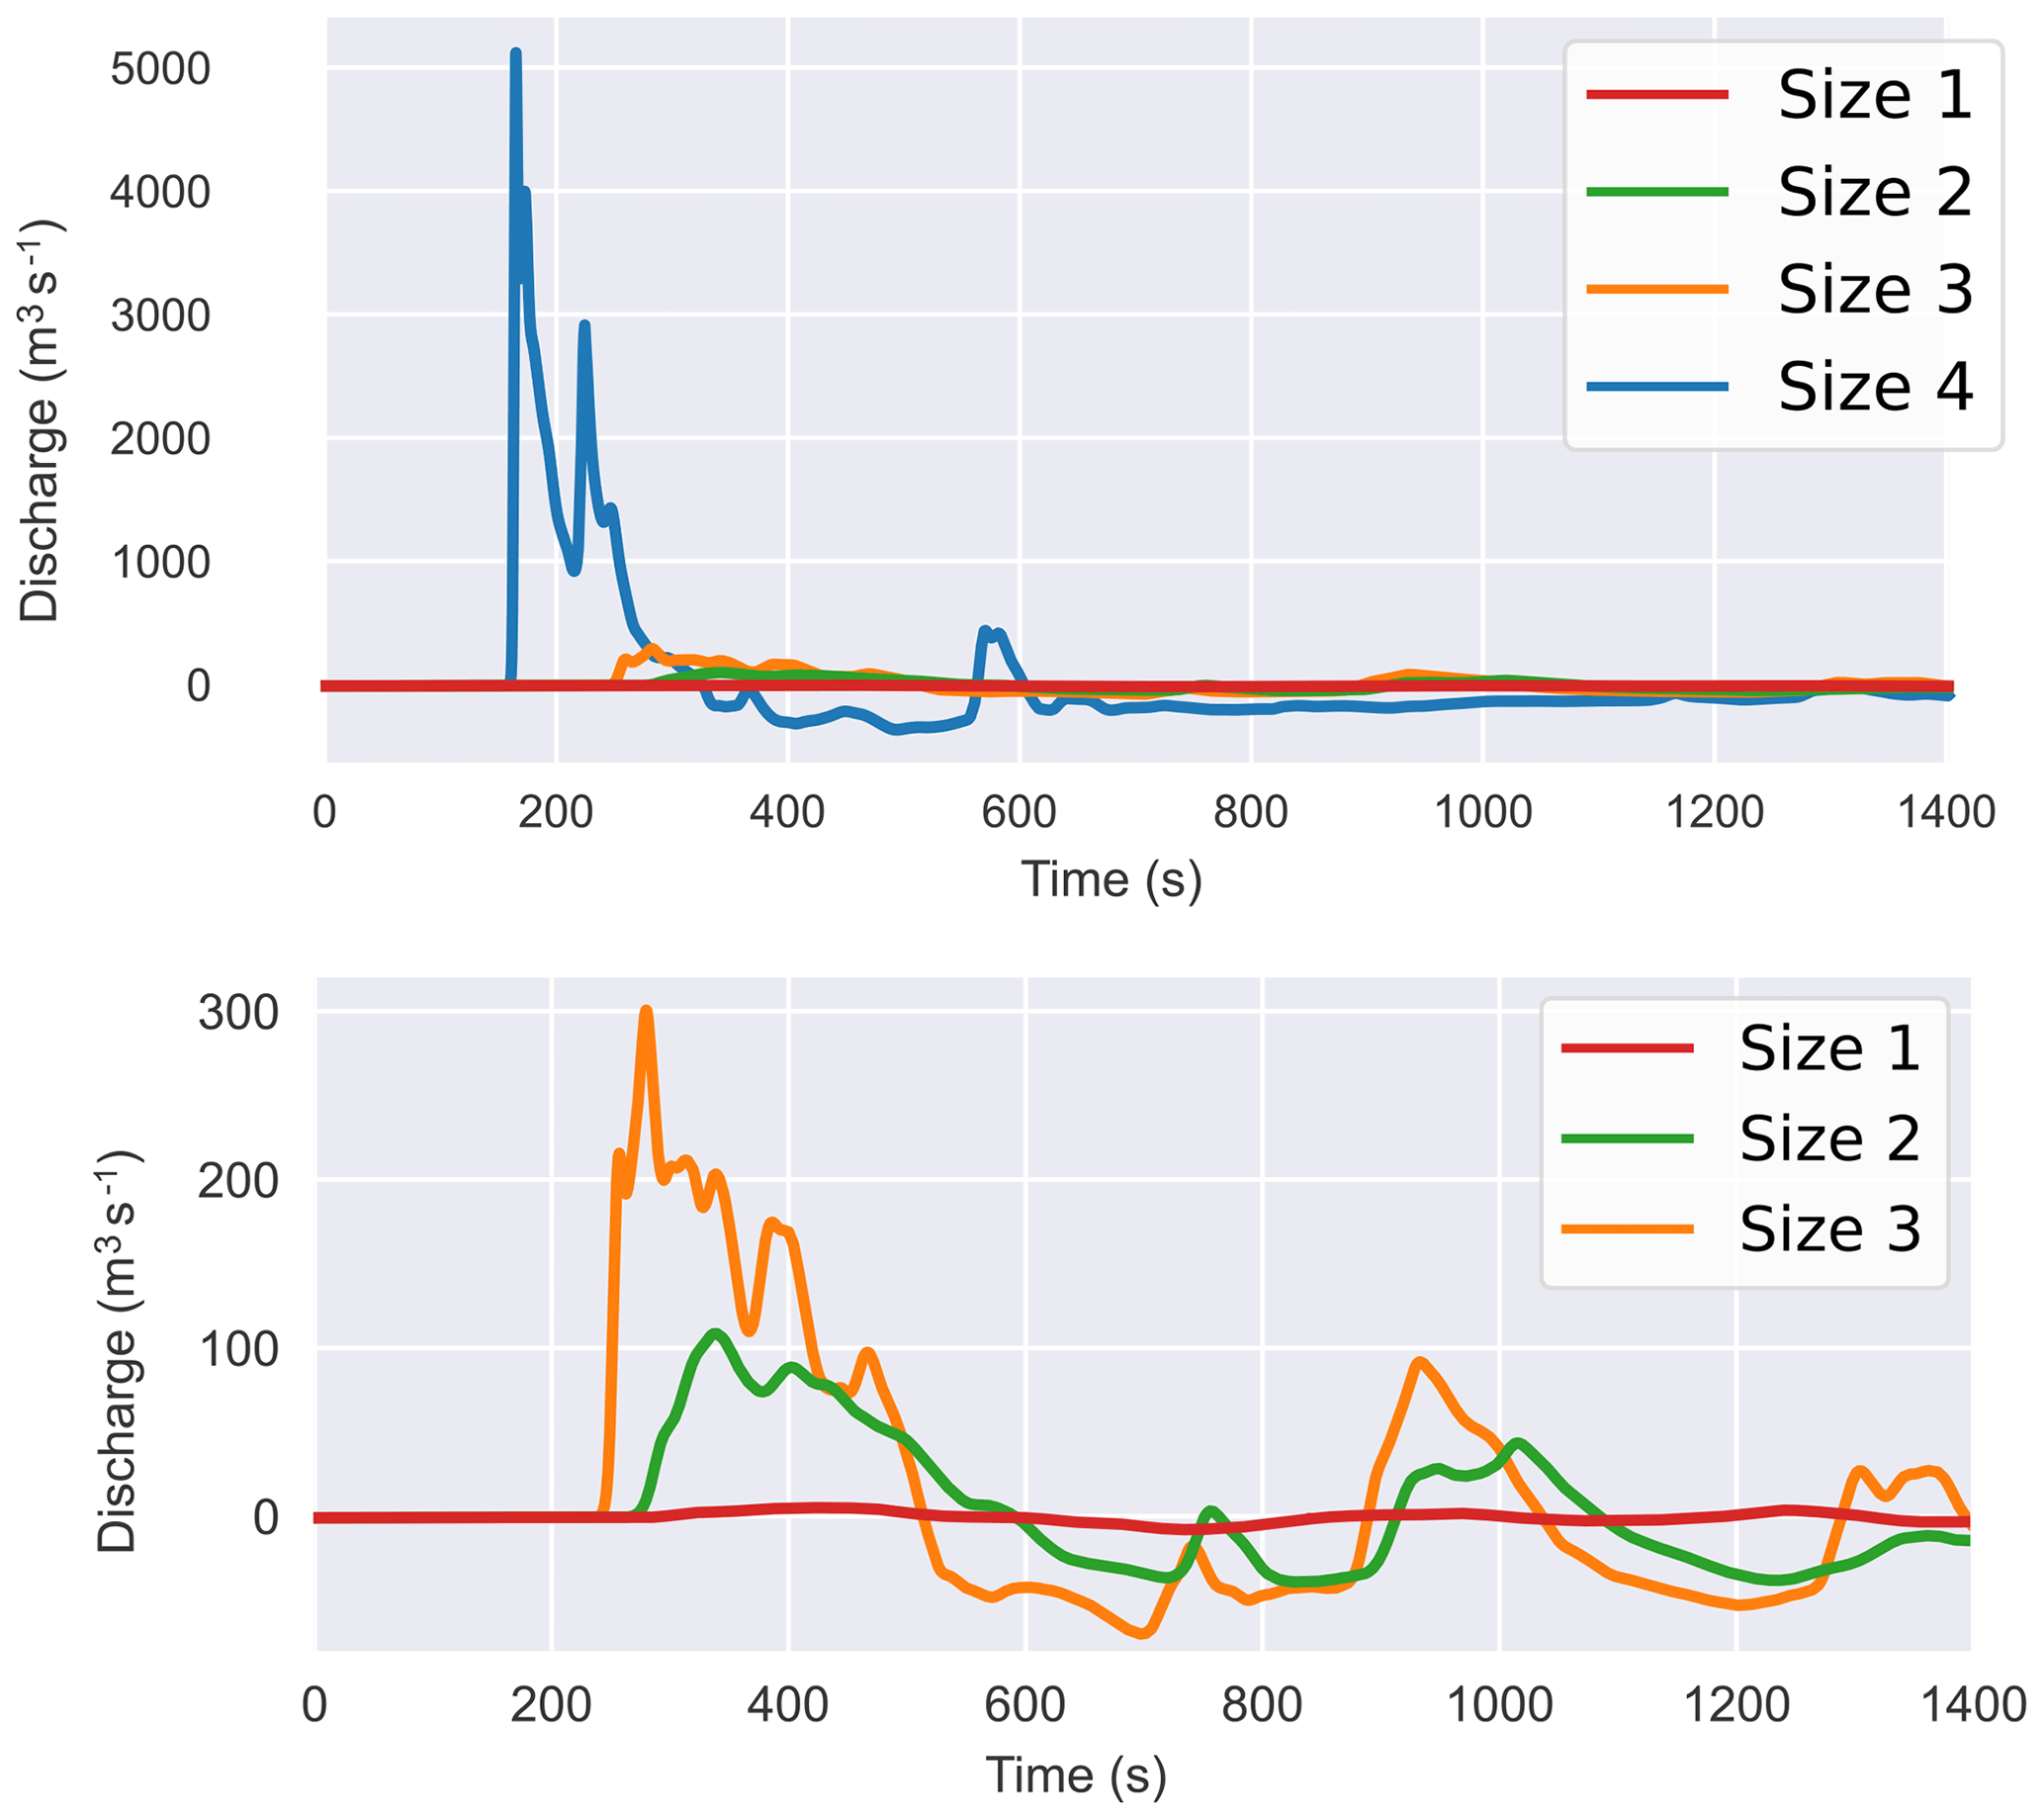
Figure 11Discharge at Waikato River inlet measured across section A, as illustrated in Fig. 3, for the different size sources located at Taupō.
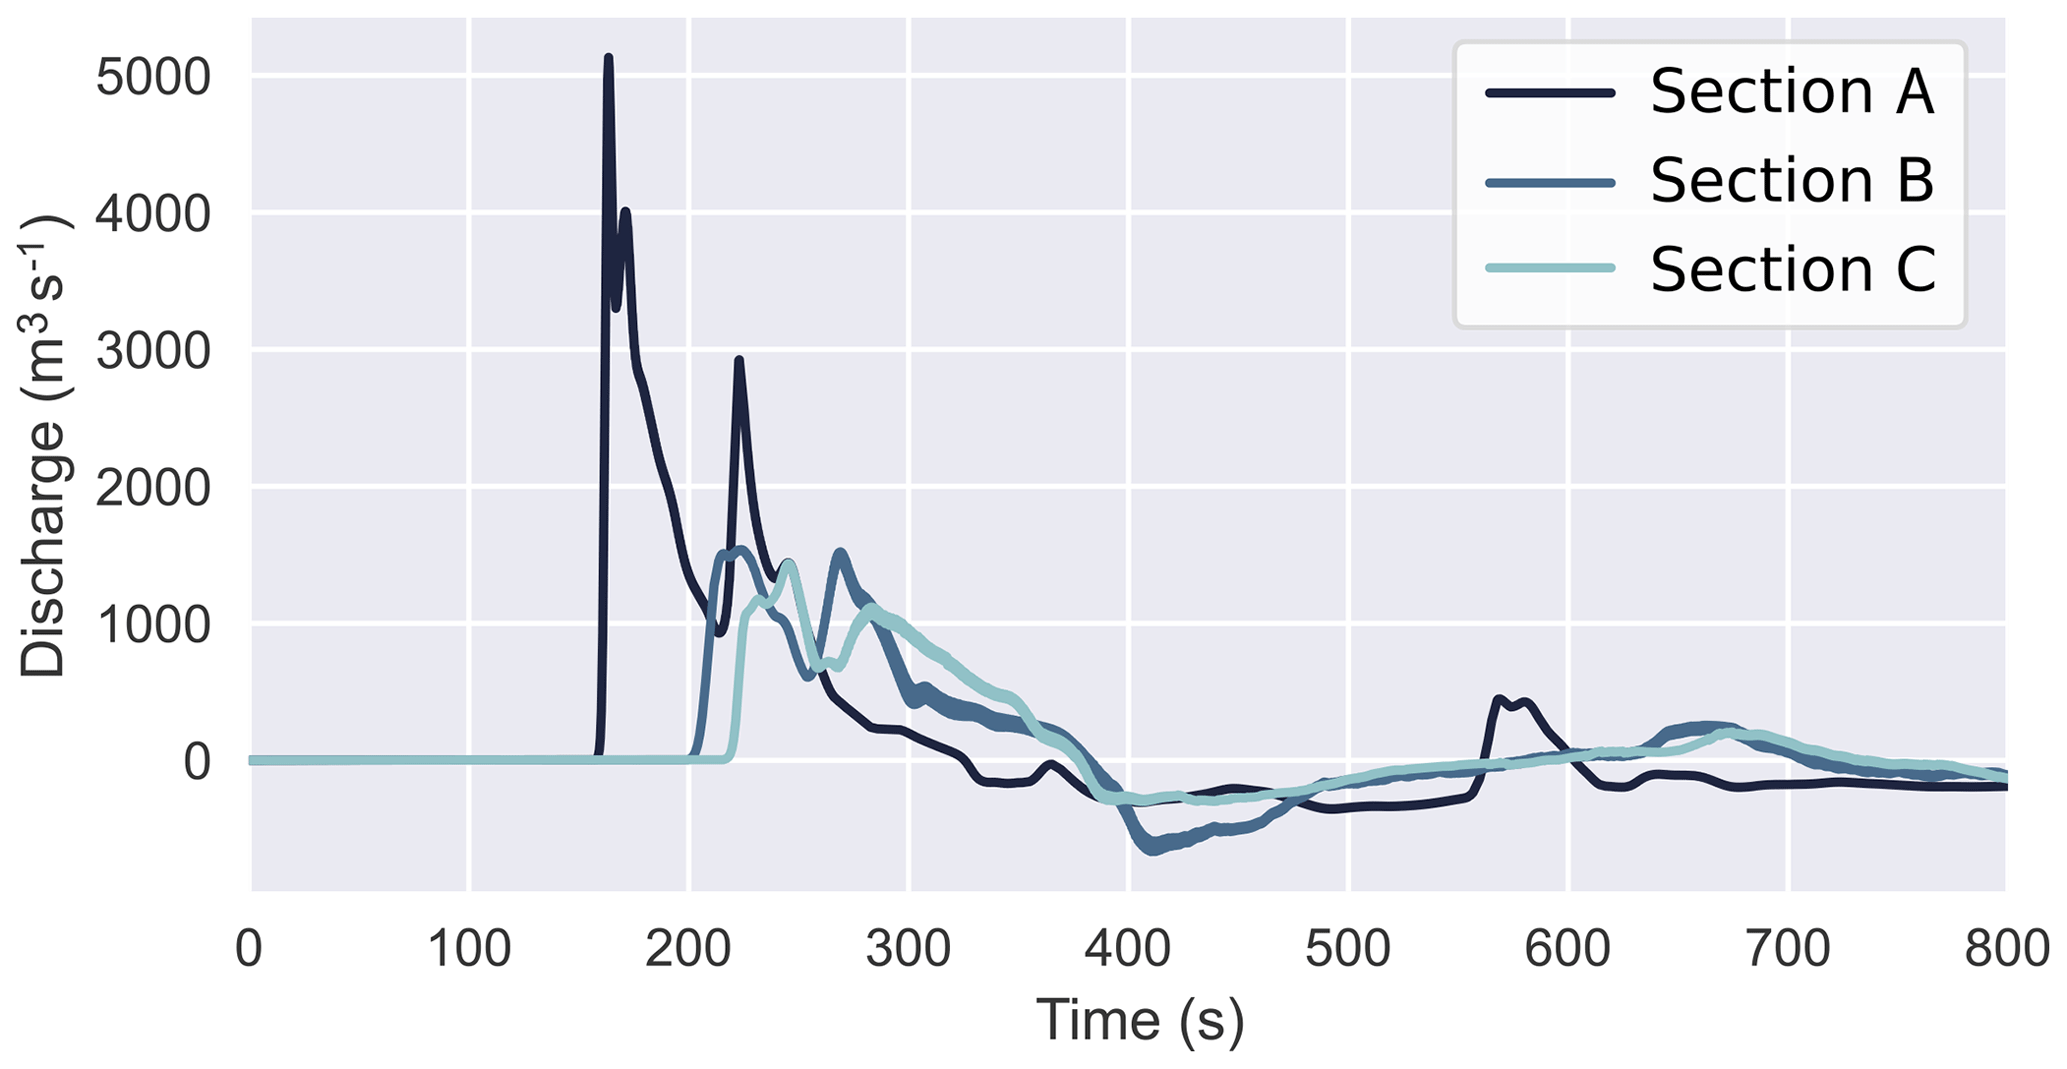
Figure 12Time series plot of discharge for the largest, nearest source at each Waikato River inlet section.
Our results suggest that significant waves that pose a hazard to the immediate lake foreshore can be generated from sublacustrine eruptions, given an event of sufficient magnitude and explosivity. Across the metrics presently tested, it is seen that events of magnitude size 2 and above have the ability to generate significant waves (of crest heights > 1 m). However, these only start to become prolific around most of the lake at approximately sizes 3 and 4 rather than just near-source. Below size 2, however, effects of the waves are minor or negligible in terms of incident crest heights and velocities near shore. Inundation and on-land impacts are similarly very sensitive to source size and location, with the most significant hazard beginning above size 3, especially when nearby.
Submerged or otherwise, volcanic eruptions pose a wide range of other hazards of varying strength and extent. Identification of threshold eruption magnitudes for tsunami or other wave hazards in this case study augments the discussion on how much this source mechanism contributes to the broader hazards posed by a volcanic eruption. For Lake Taupō, any eruption that meets or exceeds the minimum size investigated here is very likely to be accompanied by other simultaneous hazards, including ashfall (Barker et al., 2019) and widespread pyroclastic density currents which could themselves generate further tsunami waves. (Wilson, 1993; Self, 2006). This can have potential implications for eruption evacuation measures, in that any evacuation route that requires transportation links adjacent to the lake shore should be assessed for potential compromise from any resulting tsunami. Approaching the suggested threshold for hazardous wave generation leads to the assumption that most, if not all, of the areas in hazard zones for incident waves are also within the hazard range of other volcanic impacts either through proximity for the lower magnitude range or via the likely cataclysmic effects of the caldera-forming higher magnitude range.
The relatively low strength of waves generated from eruption-sized explosions is not unexpected or contrary to current thought; the idea of a “tsunami bomb” type weapon has been previously well researched and led to conclusions that, even with high-yield nuclear devices, significantly large waves are rarely generated and are usually restricted to near-source or harbour resonance effects (Le Méhauté and Wang, 1996). This is primarily caused by the very low efficiency (at most 5 %) of energy transfer from explosive source to wave generation (Le Méhauté, 1971). However, this does not disqualify the need for investigation, as spurred by applications based on asteroid–ocean impact, ocean–island flank collapse and the recent tsunami-generating eruption at Hunga Tonga-Hunga Ha'apai in early 2022. This numerical modelling scenario exercise suggests that any explosivity from an eruption, given a preferential intermediate water depth, is a relatively poor wavemaker and, combined with the high dispersiveness of the generated waves, is likely only an inundation threat locally near-source and for powerful eruptions. This is not to dispute, however, the ability of submarine volcanism as a whole for tsunami generation; highly explosive events are, in turn, capable of causing other wave generating mechanisms such as pyroclastic density current submergence, landslides and meteotsunamis.
The initialisation model used in this study is based on empirical relationships which are now, for the most part, around half a century old (Le Méhauté and Wang, 1996). Combined with the other assumptions required to consider an eruptive source for impulsive displacement from an explosion, this has motivated the use of numerical methods for this application. However, despite the prohibitive difficulty in performing experimental analysis on many parts of the system, some avenues remain which could be used to potentially improve or reformulate the initial conditions used for modelling. These primarily involve investigating some of the assumptions made in this model, such as how any variation in source duration or depth can influence wave generation efficiency or the impact of source directionality (Shen et al., 2021a, b). Ideally, these would contribute to formulating a new initial condition model which could be more representative of a broader range of potential subaqueous eruption cases.
As the volcanic source mechanism generates highly dispersive waves, the NH multilayer scheme is sufficiently capable of resolving the resulting wave group and its interaction across the whole domain, including propagation over variable bathymetry and run-up near-shore over complex urban terrain. However, while currently feasible for most readily available computers to run with light parallelism, these models are still computationally expensive. In this scenario case, simulations regularly required over a whole day to compute each using a moderate level of resources. This can, therefore, be quite prohibitive towards any ensemble- or Monte Carlo-style probabilistic study where a wide range of forcing parameters need to be tested and sensitivity analysis needs to be undertaken; efforts needed for these studies can require hundreds of runs or more. General-purpose computing using GPUs is growing in popularity as a method to greatly increase simulation throughput in CFDs (Cohen and Molemaker, 2009; Kono et al., 2018). Basilisk is currently written solely for processing with CPUs, with a number of its features written solely for the purpose of improving runtimes (e.g. grid adaptivity). However, attempts are beginning to be made to perform similar modelling, especially for solving the SWE (e.g. Bosserelle et al., 2022). Any attempt to expand numerical efforts into volcanically generated waves and tsunamis needs to exploit this and other methods to improve efficiency and throughput to have any reasonable aspiration to complete probabilistic assessments, let alone forecasting.
We have shown and demonstrated a basic framework of what any tsunami hazard analysis of a subaqueous volcanic explosion should try to include: wave incidence in terms of heights and velocities, arrival times and hazard duration, inundation levels, and output data which can inform any likely local infrastructure impacts.
In the case of subaqueous volcanic explosions in Lake Taupō, it is found that there is a minimum eruption explosivity (approximately a mass eruption rate of 5.8×10⁷ kg s−1, equivalent to VEI 5) needed to generate locally significant waves directly from the displacement of water. Any waves generated by the impulsive explosive forcing are highly dispersive and result in rapidly reducing hazard at a distance from the source, making the most affected areas where low-gradient run-ups exist. The scenario-based investigation includes additional hazard outputs, including hydrographs of incident waves down the Waikato inlet channel for use in structural impact analysis for the control gates downstream.
This scenario-based exercise demonstrates the necessary steps needed to fill in details of the possible effects of volcanic eruptions at caldera lakes or near coastlines, and how this type of effort can contribute to any wider volcanic hazard mapping project. The techniques demonstrated here are readily capable of simulating designed situations for the purposes of hazard study; however, greater computational efficiency and throughput are required to be able to perform probabilistic analysis, even with the high level of abstraction of the source mechanism. Alternatively, investigation of waves generated by subaqueous eruptions could instead be advanced with experimental study or direct numerical simulation of the wave generating processes themselves.
All simulation data were output using functions of the CFD code and framework Basilisk, described earlier in this paper. The code is free software, open-source and available on a dedicated website (http://basilisk.fr/, last access: 1 March 2023; Popinet, 2013). The simulation data, lower-resolution DEMs and Python scripts used to produce the figures included in this work are available from https://doi.org/10.5281/zenodo.6867585 (Hayward, 2022).
Conceptualisation: MWH, GSL, CNW, EML, WLP. Investigation, validation, formal analysis, writing – original draft preparation: MWH. Funding acquisition, supervision: CNW, EML, WLP. Writing – review & editing: CNW, EML, GSL, WLP.
The contact author has declared that none of the authors has any competing interests.
Publisher’s note: Copernicus Publications remains neutral with regard to jurisdictional claims in published maps and institutional affiliations.
We wish to thank Simon J. Barker for very helpful discussions prior to conceptualisation in which the chosen scenarios were built upon. We wish to thank Sanjay Wadhwa for use of the bathymetric model of Lake Taupō courtesy of MBIE/NIWA contract C01X1005 (Cumulative Effects of Stressors on Aquatic Ecosystems) and Waikato Regional Council for lidar datasets of the Lake Taupō foreshore and surrounding topography. We acknowledge the use of New Zealand eScience Infrastructure (NeSI) high-performance computing facilities as part of this research.
This research has been supported by the Marsden Fund (grant no. 17-NIW-017 awarded to NIWA).
This paper was edited by Rachid Omira and reviewed by Raphael Paris and one anonymous referee.
Abadie, S. M., Harris, J. C., Grilli, S. T., and Fabre, R.: Numerical modeling of tsunami waves generated by the flank collapse of the Cumbre Vieja Volcano (La Palma, Canary Islands): Tsunami source and near field effects, J. Geophys. Res.-Oceans, 117, C05030, https://doi.org/10.1029/2011jc007646, 2012. a
Allan, A. S. R.: The Oruanui eruption: Insights into the generation and dynamics of the world's youngest supereruption, PhD thesis, Victoria University of Wellington, http://hdl.handle.net/10063/2975 (last access: 1 March 2023), 2013. a
Azadbakht, M. and Yim, S. C.: Simulation and estimation of tsunami loads on bridge superstructures, J. Waterw. Port C., 141, 04014031, https://doi.org/10.1061/(ASCE)WW.1943-5460.0000262, 2015. a
Barker, S. J., Van Eaton, A. R., Mastin, L. G., Wilson, C. J. N., Thompson, M. A., Wilson, T. M., Davis, C., and Renwick, J. A.: Modeling ash dispersal from future eruptions of Taupo supervolcano, Geochem. Geophy. Geosy., 20, 3375–3401, https://doi.org/10.1029/2018gc008152, 2019. a, b, c, d
Barker, S. J., Wilson, C. J. N., Illsley-Kemp, F., Leonard, G. S., Mestel, E. R. H., Mauriohooho, K., and Charlier, B. L. A.: Taupō: an overview of New Zealand's youngest supervolcano, New Zeal. J. Geol. Geop., 64, 1–27, https://doi.org/10.1080/00288306.2020.1792515, 2020. a, b
Battershill, L., Whittaker, C., Lane, E., Popinet, S., White, J., Power, W., and Nomikou, P.: Numerical simulations of a fluidized granular flow entry into water: insights into modeling tsunami generation by pyroclastic density currents, J. Geophys. Res.-Sol. Ea., 126, e2021JB022855, https://doi.org/10.3389/feart.2021.628652, 2021. a
Beetham, E., Kench, P. S., O'Callaghan, J., and Popinet, S.: Wave transformation and shoreline water level on Funafuti Atoll, Tuvalu, J. Geophys. Res.-Oceans, 121, 311–326, https://doi.org/10.1002/2015JC011246, 2016. a
Behrens, J., Løvholt, F., Jalayer, F., Lorito, S., Salgado-Gálvez, M. A., Sørensen, M., Abadie, S., Aguirre-Ayerbe, I., Aniel-Quiroga, I., Babeyko, A., Baiguera, M., Basili, R., Belliazzi, S., Grezio, A., Johnson, K., Murphy, S., Paris, R., Rafiana, I., De Risi, R., Rossetto, T., Selva, J., Taroni, M., Del Zoppo, M., Armigliato, A., Bureš, V., Cech, P., Cecioni, C., Christodoulides, P., Davies, G., Dias, F., Bayraktar, H. B., González, M., Gritsevich, M., Guillas, S., Harbitz, C. B., Kânoglu, U., Macías, J., Papadopoulos, G. A., Polet, J., Romano, F., Salamon, A., Scala, A., Stepinac, M., Tappin, D. R., Thio, H. K., Tonini, R., Triantafyllou, I., Ulrich, T., Varini, E., Volpe, M., and Vyhmeister, E.: Probabilistic tsunami hazard and risk analysis: a review of research gaps, Front. Earth Sci., 9, 114, https://doi.org/10.3389/feart.2021.628772, 2021. a, b
Borrero, J. C., Lynett, P. J., and Kalligeris, N.: Tsunami currents in ports, Philos. T. Roy. Soc. A, 373, 20140372, https://doi.org/10.1098/rsta.2014.0372, 2015. a
Bosserelle, C., Lane, E. M., and Harang, A.: BG-Flood: A GPU adaptive, open-source, general inundation hazard model, in: Proceedings of the Australasian Coasts and Ports Conference 2021, 30 November–3 December 2021, Christchurch, New Zealand, Engineers Australia, Australia, 152–153, ISBN 978-0-473-64705-6, 2022. a
Carvajal, M., Sepúlveda, I., Gubler, A., and Garreaud, R.: Worldwide signature of the 2022 Tonga volcanic tsunami, Geophys. Res. Lett., 49, e2022GL098153, https://doi.org/10.1029/2022GL098153, 2022. a
Cohen, J. and Molemaker, M. J.: A fast double precision CFD code using CUDA, Parallel Computational Fluid Dynamics: Recent Advances and Future Directions, DEStech Publications, Inc., 414–429, ISBN 978-1-60595-022-8, 2009. a
Cole, J.: Structural control and origin of volcanism in the Taupo volcanic zone, New Zealand, B. Volcanol., 52, 445–459, https://doi.org/10.1007/BF00268925, 1990. a
Cole, J. and Lewis, K.: Evolution of the Taupo-Hikurangi subduction system, Tectonophysics, 72, 1–21, https://doi.org/10.1016/0040-1951(81)90084-6, 1981. a
Daramizadeh, A. and Ansari, M.: Numerical simulation of underwater explosion near air–water free surface using a five-equation reduced model, Ocean Eng., 110, 25–35, https://doi.org/10.1016/j.oceaneng.2015.10.003, 2015. a
Davy, B. W. and Caldwell, T. G.: Gravity, magnetic and seismic surveys of the caldera complex, Lake Taupo, North Island, New Zealand, J. Volcanol. Geoth. Res., 81, 69–89, https://doi.org/10.1016/s0377-0273(97)00074-7, 1998. a, b
De Ronde, C. E. J., Stoffers, P., Garbe-Schönberg, D., Christenson, B. W., Jones, B., Manconi, R., Browne, P. R. L., Hissmann, K., Botz, R., Davy, B. W., Schmitt, M., and Battershill, C. N.: Discovery of active hydrothermal venting in Lake Taupo, New Zealand, J. Volcanol. Geoth. Res., 115, 257–275, https://doi.org/10.1016/s0377-0273(01)00332-8, 2002. a
Duffy, D. G.: On the generation of oceanic surface waves by underwater volcanic explosions, J. Volcanol. Geoth. Res., 50, 323–344, https://doi.org/10.1016/0377-0273(92)90100-r, 1992. a
East, H. K., Perry, C. T., Beetham, E. P., Kench, P. S., and Liang, Y.: Modelling reef hydrodynamics and sediment mobility under sea level rise in atoll reef island systems, Global Planet. Change, 192, 103196, https://doi.org/10.1016/j.gloplacha.2020.103196, 2020. a
Egorov, Y.: Tsunami wave generation by the eruption of underwater volcano, Nat. Hazards Earth Syst. Sci., 7, 65–69, https://doi.org/10.5194/nhess-7-65-2007, 2007. a, b
Esposti Ongaro, T., de'Michieli Vitturi, M., Cerminara, M., Fornaciai, A., Nannipieri, L., Favalli, M., Calusi, B., Macías, J., Castro, M. J., Ortega, S., González-Vida, J. M., and Escalante, C.: Modeling Tsunamis Generated by Submarine Landslides at Stromboli Volcano (Aeolian Islands, Italy): A Numerical Benchmark Study, Front. Earth Sci., 9, 274, https://doi.org/10.3389/feart.2021.628652, 2021. a, b
Gamble, J., Woodhead, J., Wright, I., and Smith, I.: Basalt and sediment geochemistry and magma petrogenesis in a transect from oceanic island arc to rifted continental margin arc: the Kermadec–Hikurangi Margin, SW Pacific, J. Petrol., 37, 1523–1546, https://doi.org/10.1093/petrology/37.6.1523, 1996. a
Glimsdal, S., Pedersen, G. K., Harbitz, C. B., and Løvholt, F.: Dispersion of tsunamis: does it really matter?, Nat. Hazards Earth Syst. Sci., 13, 1507–1526, https://doi.org/10.5194/nhess-13-1507-2013, 2013. a
Grilli, S. T. and Watts, P.: Tsunami generation by submarine mass failure. I: Modeling, experimental validation, and sensitivity analyses, J. Waterw. Port C., 131, 283–297, https://doi.org/10.1061/(ASCE)0733-950X(2005)131:6(283), 2005. a
Grilli, S. T., Tappin, D. R., Carey, S., Watt, S. F., Ward, S. N., Grilli, A. R., Engwell, S. L., Zhang, C., Kirby, J. T., Schambach, L., and Muin, M.: Modelling of the tsunami from the December 22, 2018 lateral collapse of Anak Krakatau volcano in the Sunda Straits, Indonesia, Sci. Rep., 9, 1–13, https://doi.org/10.1038/s41598-019-48327-6, 2019. a
Guyenne, P. and Grilli, S.: Computations of Three-Dimensional Overturning Waves In Shallow Water: Dynamics And Kinematics, in: The Thirteenth International Offshore and Polar Engineering Conference, 25–30 May 2003, Honolulu, Hawaii, USA, OnePetro, ISBN 1-880653-60−5, 2003. a
Harbitz, C. B., Løvholt, F., and Bungum, H.: Submarine landslide tsunamis: how extreme and how likely?, Nat. Hazards, 72, 1341–1374, https://doi.org/10.1007/s11069-013-0681-3, 2014. a
Hayward, M. W.: Data for figures of explosive volcanic tsunami generation, propagation and inundation around Lake Taupō, Zenodo [data set], https://doi.org/10.5281/zenodo.6867585, 2022. a
Hayward, M. W., Whittaker, C. N., Lane, E. M., and Power, W. L.: Submarine explosive volcanism – numerical modelling of tsunami propagation and run-up, in: Proceedings of the 20th Australasian Coasts and Ports Conference, 20 November–3 December 2021, Christchurch, New Zealand, Engineers Australia, Australia, 280–285, ISBN 978-0-473-64705-6, 2022a. a
Hayward, M. W., Whittaker, C. N., Lane, E. M., Power, W. L., Popinet, S., and White, J. D. L.: Multilayer modelling of waves generated by explosive subaqueous volcanism, Nat. Hazards Earth Syst. Sci., 22, 617–637, https://doi.org/10.5194/nhess-22-617-2022, 2022b. a, b, c, d
Heidarzadeh, M., Ishibe, T., Sandanbata, O., Muhari, A., and Wijanarto, A. B.: Numerical modeling of the subaerial landslide source of the 22 December 2018 Anak Krakatoa volcanic tsunami, Indonesia, Ocean Eng., 195, 106733, https://doi.org/10.1016/j.oceaneng.2019.106733, 2020. a
Houghton, B. F., Carey, R. J., Cashman, K. V., Wilson, C. J. N., Hobden, B. J., and Hammer, J. E.: Diverse patterns of ascent, degassing, and eruption of rhyolite magma during the 1.8 ka Taupo eruption, New Zealand: evidence from clast vesicularity, J. Volcanol. Geoth. Res., 195, 31–47, https://doi.org/10.1016/j.jvolgeores.2010.06.002, 2010. a
Irwin, J.: Lake Taupo, provisional bathymetry, 1 : 50 000, NZ Oceanographic Institute Chart, Lake Series, National Library of New Zealand, NLNZ ALMA 9912203103502836, 1972. a
Klein, A.: Tongan volcano erupts, New Sci., 253, 7, https://doi.org/10.1016/S0262-4079(22)00074-4, 2022. a
Kono, F., Nakasato, N., Hayashi, K., Vazhenin, A., and Sedukhin, S.: Evaluations of OpenCL-written tsunami simulation on FPGA and comparison with GPU implementation, J. Supercomput., 74, 2747–2775, https://doi.org/10.1007/s11227-018-2315-8, 2018. a
Le Méhauté, B.: Theory of explosion-generated water waves, Adv. Hydrosci., 7, 1–79, 1971. a, b
Le Méhauté, B. and Wang, S.: Water Waves Generated By Underwater Explosion, World Scientific, ISBN 978-981-02-2083-9, 1996. a, b, c, d, e, f
LeVeque, R. J., George, D. L., and Berger, M. J.: Tsunami modelling with adaptively refined finite volume methods, Acta Numer., 20, 211–289, 2011. a
Li, T., Wang, S., Li, S., and Zhang, A.-M.: Numerical investigation of an underwater explosion bubble based on FVM and VOF, Appl. Ocean Res., 74, 49–58, https://doi.org/10.1016/j.apor.2018.02.024, 2018. a
Liu, M., Liu, G., Lam, K., and Zong, Z.: Smoothed particle hydrodynamics for numerical simulation of underwater explosion, Comput. Mech., 30, 106–118, 2003. a
Liu, Y. L., Zhang, A. M., Tian, Z. L., and Wang, S. P.: Numerical investigation on global responses of surface ship subjected to underwater explosion in waves, Ocean Eng., 161, 277–290, https://doi.org/10.1016/j.oceaneng.2018.05.013, 2018. a
Lynett, P., McCann, M., Zhou, Z., Renteria, W., Borrero, J., Greer, D., Fa’anunu, O., Bosserelle, C., Jaffe, B., La Selle, S., Ritchie, A, Snyder, A., Nasr, B., Bott, J., Graehl, N., Synolakis, C., Ebrahimi, B., and Cinar, G. E.: Diverse tsunamigenesis triggered by the Hunga Tonga-Hunga Ha’apai eruption, Nature, 609, 728–733, 2022. a
Lynett, P. J., Borrero, J. C., Weiss, R., Son, S., Greer, D., and Renteria, W.: Observations and modeling of tsunami-induced currents in ports and harbors, Earth Planet. Sc. Lett., 327, 68–74, https://doi.org/10.1016/j.epsl.2012.02.002, 2012. a, b
Mader, C. L.: Modeling the La Palma landslide tsunami, Science of Tsunami Hazards, 19, 150–170, 2001. a
Maeno, F. and Imamura, F.: Tsunami generation by a rapid entrance of pyroclastic flow into the sea during the 1883 Krakatau eruption, Indonesia, J. Geophys. Res.-Sol. Ea., 116, B09205, https://doi.org/10.1029/2011JB008253, 2011. a
Nomanbhoy, N. and Satake, K.: Generation mechanism of tsunamis from the 1883 Krakatau eruption, Geophys. Res. Lett., 22, 509–512, https://doi.org/10.1029/94gl03219, 1995. a
Nosov, M. A., Moshenceva, A. V., and Kolesov, S. V.: Horizontal motions of water in the vicinity of a tsunami source, Pure Appl. Geophys., 170, 1647–1660, https://doi.org/10.1007/s00024-012-0605-2, 2013. a
Omira, R., Ramalho, R., Kim, J., González, P. J., Kadri, U., Miranda, J., Carrilho, F., and Baptista, M.: Global Tonga tsunami explained by a fast-moving atmospheric source, Nature, 609, 734–740, https://doi.org/10.1038/s41586-022-04926-4, 2022. a
Pakoksung, K., Suppasri, A., and Imamura, F.: Probabilistic Tsunami Hazard Analysis of Inundated Buildings Following a Subaqueous Volcanic Explosion Based on the 1716 Tsunami Scenario in Taal Lake, Philippines, Geosciences, 11, 92, https://doi.org/10.3390/geosciences11020092, 2021. a
Pararas-Carayannis, G.: Evaluation of the threat of mega tsunami generation from postulated massive slope failures of island stratovolcanoes on La Palma, Canary Islands, and on the island of Hawaii, Science of Tsunami Hazards, 20, 251–277, 2002. a
Paris, R.: Source mechanisms of volcanic tsunamis, Philos. T. Roy. Soc. A, 373, 20140380, https://doi.org/10.1098/rsta.2014.0380, 2015. a, b, c
Paris, R. and Ulvrová, M.: Tsunamis generated by subaqueous volcanic explosions in Taal Caldera Lake, Philippines, B. Volcanol., 81, 14, https://doi.org/10.1007/s00445-019-1272-2, 2019. a, b
Paris, R., Switzer, A. D., Belousova, M., Belousov, A., Ontowirjo, B., Whelley, P. L., and Ulvrova, M.: Volcanic tsunami: A review of source mechanisms, past events and hazards in Southeast Asia (Indonesia, Philippines, Papua New Guinea), Nat. Hazards, 70, 447–470, https://doi.org/10.1007/s11069-013-0822-8, 2014. a, b, c
Paris, R., Ulvrová, M., Selva, J., Brizuela, B., Costa, A., Grezio, A., Lorito, S., and Tonini, R.: Probabilistic hazard analysis for tsunamis generated by subaqueous volcanic explosions in the Campi Flegrei caldera, Italy, J. Volcanol. Geoth. Res., 379, 106–116, https://doi.org/10.1016/j.jvolgeores.2019.05.010, 2019. a, b
Popinet, S.: Quadtree-adaptive tsunami modelling, Ocean Dynam., 61, 1261–1285, https://doi.org/10.1007/s10236-011-0438-z, 2011. a, b
Popinet, S.: Basilisk [code], Darcs, http://basilisk.fr/ (last access: 1 March 2023), 2013. a, b
Popinet, S.: A quadtree-adaptive multigrid solver for the Serre–Green–Naghdi equations, J. Comput. Phys., 302, 336–358, https://doi.org/10.1016/j.jcp.2015.09.009, 2015. a
Popinet, S.: A vertically-Lagrangian, non-hydrostatic, multilayer model for multiscale free-surface flows, J. Comput. Phys., 148, 109609, https://doi.org/10.1016/j.jcp.2020.109609, 2020. a, b, c
Rowe, D. K., Shankar, U., James, M., and Waugh, B.: Use of GIS to predict effects of water level on the spawning area for smelt, Retropinna retropinna, in Lake Taupo, New Zealand, Fisheries Manag. Ecol., 9, 205–216, https://doi.org/10.1046/j.1365-2400.2002.00298.x, 2002. a
Sato, H. and Taniguchi, H.: Relationship between crater size and ejecta volume of recent magmatic and phreato-magmatic eruptions: Implications for energy partitioning, Geophys. Res. Lett., 24, 205–208, https://doi.org/10.1029/96gl04004, 1997. a
Schilperoort, B., Coenders-Gerrits, M., Rodríguez, C. J., van Hooft, A., van de Wiel, B., and Savenije, H.: Detecting nighttime inversions in the interior of a Douglas fir canopy, Agr. Forest Meteorol., 321, 108960, https://doi.org/10.1016/j.agrformet.2022.108960, 2022. a
Self, S.: The effects and consequences of very large explosive volcanic eruptions, Philos. T. Roy. Soc. A, 364, 2073–2097, https://doi.org/10.1098/rsta.2006.1814, 2006. a
Shen, Y., Whittaker, C. N., Lane, E. M., White, J. D. L., Power, W., and Nomikou, P.: Laboratory experiments on tsunamigenic discrete subaqueous volcanic eruptions. Part 1: Free surface disturbances, J. Geophys. Res.-Oceans, 126, e2020JC016588, https://doi.org/10.1029/2020jc016588, 2021a. a
Shen, Y., Whittaker, C. N., Lane, E. M., White, J. D. L., Power, W., and Nomikou, P.: Laboratory experiments on tsunamigenic discrete subaqueous volcanic eruptions. Part 2: Properties of generated waves, J. Geophys. Res.-Oceans, 126, e2020JC016587, https://doi.org/10.1029/2020jc016587, 2021b. a
Shin, Y. S.: Ship shock modeling and simulation for far-field underwater explosion, Comput. Struct., 82, 2211–2219, https://doi.org/10.1016/j.compstruc.2004.03.075, 2004. a
Stirling, M. and Wilson, C.: Development of a volcanic hazard model for New Zealand: first approaches from the methods of probabilistic seismic hazard analysis, Bulletin of the New Zealand Society for Earthquake Engineering, 35, 266–277, https://doi.org/10.5459/bnzsee.35.4.266-277, 2002. a, b
Tehranirad, B., Harris, J. C., Grilli, A. R., Grilli, S. T., Abadie, S., Kirby, J. T., and Shi, F.: Far-field tsunami impact in the North Atlantic basin from large scale flank collapses of the Cumbre Vieja Volcano, La Palma, Pure Appl. Geophys., 172, 3589–3616, https://doi.org/10.1007/s00024-015-1135-5, 2015. a
Torsvik, T., Paris, R., Didenkulova, I., Pelinovsky, E., Belousov, A., and Belousova, M.: Numerical simulation of a tsunami event during the 1996 volcanic eruption in Karymskoye lake, Kamchatka, Russia, Nat. Hazards Earth Syst. Sci., 10, 2359–2369, https://doi.org/10.5194/nhess-10-2359-2010, 2010. a
Ulvrová, M., Paris, R., Kelfoun, K., and Nomikou, P.: Numerical simulations of tsunamis generated by underwater volcanic explosions at Karymskoye lake (Kamchatka, Russia) and Kolumbo volcano (Aegean Sea, Greece), Nat. Hazards Earth Syst. Sci., 14, 401–412, https://doi.org/10.5194/nhess-14-401-2014, 2014. a, b, c
Ulvrova, M., Paris, R., Nomikou, P., Kelfoun, K., Leibrandt, S., Tappin, D., and McCoy, F.: Source of the tsunami generated by the 1650 AD eruption of Kolumbo submarine volcano (Aegean Sea, Greece), J. Volcanol. Geoth. Res., 321, 125–139, https://doi.org/10.1016/j.jvolgeores.2016.04.034, 2016. a
Vandergoes, M. J., Hogg, A. G., Lowe, D. J., Newnham, R. M., Denton, G. H., Southon, J., Barrell, D. J., Wilson, C. J., McGlone, M. S., Allan, A. S., Almond, P. C., Petchey, F., Dabell, K., Dieffenbacher-Krall, A. C., and Blaauw, M.: A revised age for the Kawakawa/Oruanui tephra, a key marker for the Last Glacial Maximum in New Zealand, Quaternary Sci. Rev., 74, 195–201, https://doi.org/10.1016/j.quascirev.2012.11.006, 2013. a
Wang, S.-P., Zhang, A.-M., Liu, Y.-L., Zhang, S., and Cui, P.: Bubble dynamics and its applications, J. Hydrodyn., 30, 975–991, https://doi.org/10.1007/s42241-018-0141-3, 2018. a
Ward, S. N. and Day, S.: Cumbre Vieja volcano–potential collapse and tsunami at La Palma, Canary Islands, Geophys. Res. Lett., 28, 3397–3400, https://doi.org/10.1029/2001GL013110, 2001. a, b
Ward, S. N. and Day, S.: Tsunami thoughts, CSEG Recorder, 38–44, https://csegrecorder.com/articles/view/tsunami-thoughts (last access: 1 March 2023), 2005. a
Whalin, R. W., Pace, C. E., and Lane, W. F.: Mono Lake Explosion Test Series, 1965: Analysis of Surface Wave and Wave Runup Data, Waterways Experiment Station, US Army Technical Report N-70-12, 1970. a
Williams, R., Rowley, P., and Garthwaite, M. C.: Reconstructing the Anak Krakatau flank collapse that caused the December 2018 Indonesian tsunami, Geology, 47, 973–976, https://doi.org/10.1130/g46517.1, 2019. a
Wilson, C. J. N.: Stratigraphy, chronology, styles and dynamics of late Quaternary eruptions from Taupo volcano, New Zealand, Philos. T. Roy. Soc. A, 343, 205–306, https://doi.org/10.1098/rsta.1993.0050, 1993. a, b, c, d
Wilson, C. J. N.: The 26.5 ka Oruanui eruption, New Zealand: an introduction and overview, J. Volcanol. Geoth. Res., 112, 133–174, https://doi.org/10.1016/s0377-0273(01)00239-6, 2001. a
Wilson, C. J. N. and Walker, G. P. L.: The Taupo eruption, New Zealand I. General aspects, Philos. T. Roy. Soc. A, 314, 199–228, https://doi.org/10.1098/rsta.1985.0019, 1985. a
Xu, L.-Y., Wang, S.-P., Liu, Y.-L., and Zhang, A.-M.: Numerical simulation on the whole process of an underwater explosion between a deformable seabed and a free surface, Ocean Eng., 219, 108311, https://doi.org/10.1016/j.oceaneng.2020.108311, 2020. a
Ye, L., Kanamori, H., Rivera, L., Lay, T., Zhou, Y., Sianipar, D., and Satake, K.: The 22 December 2018 tsunami from flank collapse of Anak Krakatau volcano during eruption, Sci. Adv., 6, eaaz1377, https://doi.org/10.1126/sciadv.aaz1377, 2020. a