the Creative Commons Attribution 4.0 License.
the Creative Commons Attribution 4.0 License.
 | 21 Feb 2023
An interdisciplinary agent-based evacuation model: integrating the natural environment, built environment, and social system for community preparedness and resilience
Chen Chen
Charles Koll
Haizhong Wang
Michael K. Lindell
Previous tsunami evacuation simulations have mostly been based on arbitrary assumptions or inputs adapted from non-emergency situations, but a few studies have used empirical behavior data. This study bridges this gap by integrating empirical decision data from surveys on local evacuation expectations and evacuation drills into an agent-based model of evacuation behavior for two Cascadia subduction zone (CSZ) communities that would be inundated within 20–40 min after a CSZ earthquake. The model also considers the impacts of liquefaction and landslides from the earthquake on tsunami evacuation. Furthermore, we integrate the slope-speed component from least-cost distance to build the simulation model that better represents the complex nature of evacuations. The simulation results indicate that milling time and the evacuation participation rate have significant nonlinear impacts on tsunami mortality estimates. When people walk faster than 1 m s−1, evacuation by foot is more effective because it avoids traffic congestion when driving. We also find that evacuation results are more sensitive to walking speed, milling time, evacuation participation, and choosing the closest safe location than to other behavioral variables. Minimum tsunami mortality results from maximizing the evacuation participation rate, minimizing milling time, and choosing the closest safe destination outside of the inundation zone. This study's comparison of the agent-based model and the beat-the-wave (BtW) model finds consistency between the two models' results. By integrating the natural system, built environment, and social system, this interdisciplinary model incorporates substantial aspects of the real world into the multi-hazard agent-based platform. This model provides a unique opportunity for local authorities to prioritize their resources for hazard education, community disaster preparedness, and resilience plans.
- Article
(8102 KB) - Full-text XML
- BibTeX
- EndNote


Recent devastating earthquakes and tsunamis have placed immense burdens on their affected communities, such as the 2011 Tohoku tsunami (Mori et al., 2011), the 2009 American Samoa tsunami (Lindell et al., 2015), and the 2018 Indonesia Sulawesi tsunami (Sassa and Takagawa, 2019). Due to a small evacuation time window between the end of earthquake shaking and the arrival of the first tsunami wave, a high level of evacuation efficiency is essential for minimizing the loss of life in low-lying coastal communities subject to local tsunamis (Wang et al., 2016; Raskin and Wang, 2017). To reduce evacuation clearance time (the sum of authorities' decision time, warning dissemination time, households' preparation time, and evacuation travel time) and thus maximize survival rates during tsunamis, researchers and practitioners have developed evacuation simulations to support decision-making, public education, and community emergency planning and management.
1.1 Previous ABMSs for earthquake and tsunami evacuation
Agent-based modeling and simulation (ABMS), as a type of a highly effective computational simulation model, has been applied to many research fields (Mas et al., 2013; Mostafizi et al., 2019a). The unique characteristics of ABMS include a bottom-up structure and the ability to model heterogeneous agents and their interactions with other agents. These unique characteristics meet the needs of a disaster evacuation simulation (Gilbert, 2007). The bottom-up structure provides an opportunity to analyze how changes in evacuation behavior affect the overall evacuation result. One concern about using ABMS is the computational expense, but this is less of an issue as computing costs continue to decrease (Lindell et al., 2019).
This increase in computational power has allowed disaster researchers to apply ABMS to (1) simulate evacuation in large-scale communities and (2) integrate different layers of data to comprehensively analyze evacuation with consideration of interactions between the natural environment, built environment, and social system. Table 1 identifies recent tsunami evacuation ABMS studies and their content.
Chen and Zhan (2008)Dawson et al. (2011)Karon and Yeh (2011)Mas et al. (2012)Mas et al. (2013)Wang et al. (2016)Mostafizi et al. (2019a)Table 1Recent earthquake and tsunami ABMS studies.
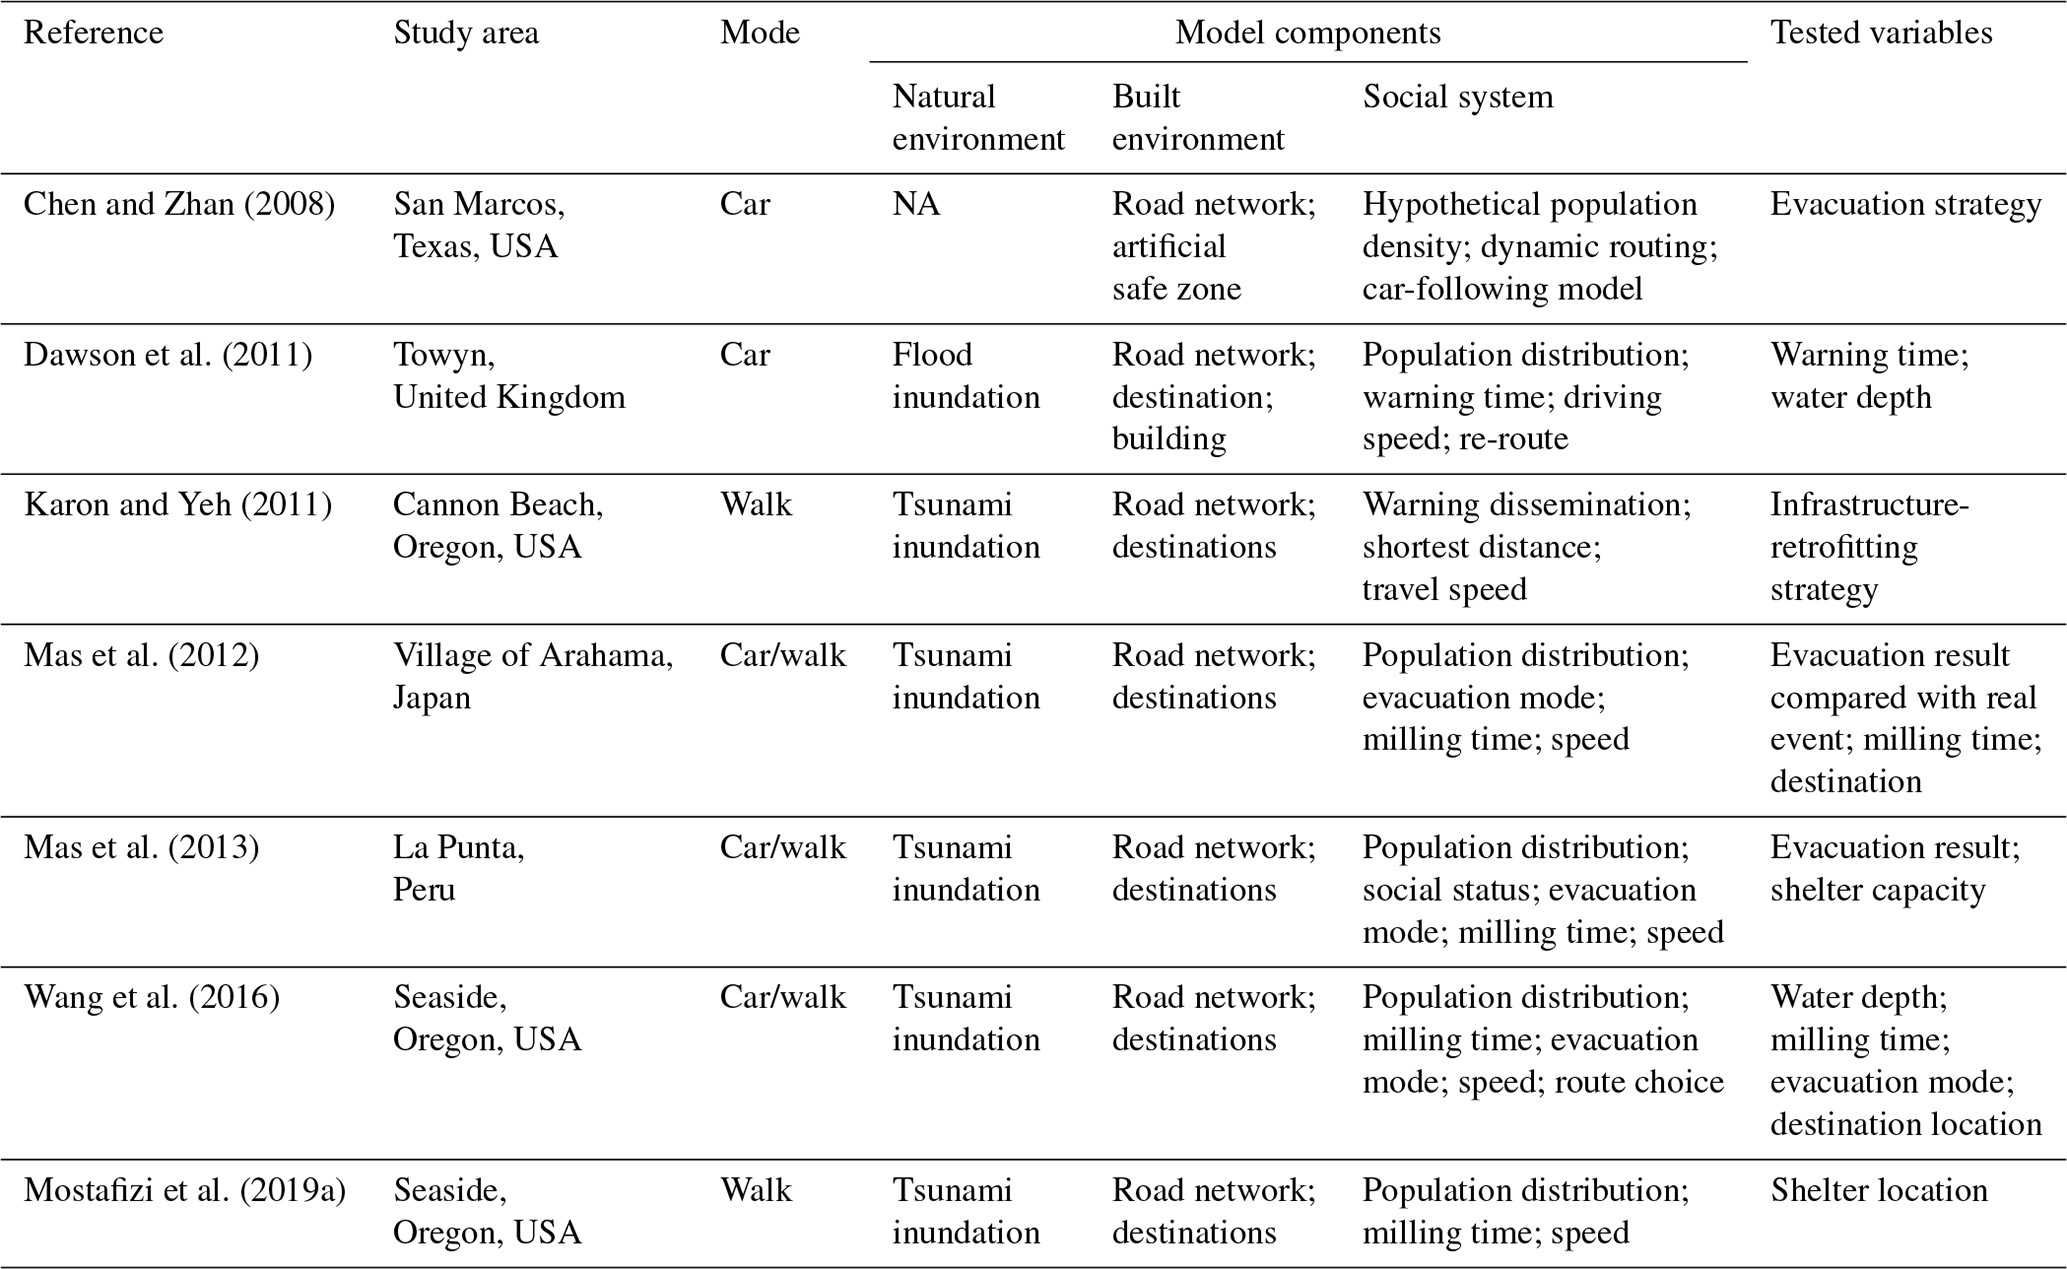
NA: not available.
In the absence of empirical behavior data, early-stage evacuation ABMSs were based on arbitrary assumptions, as had been the case for large-scale evacuation models (Lindell and Perry, 1992; Lindell and Prater, 2007). Chen and Zhan (2008) investigated the effectiveness of simultaneous and staged evacuation strategies using an ABMS for San Marcos, Texas. Although this study considered evacuees' car-following and dynamic-routing behaviors, it was based on many arbitrary assumptions about evacuation behavior, such as homogeneous milling time within a zone, a single evacuation mode, and evacuees selecting quickest evacuation route and destination. To reduce reliance on assumptions, Mas et al. (2012) built an evacuation ABMS that included more empirical data from the natural system, built environment, and social system. In this model, agents are characterized by probabilistic distributions of milling time, evacuation mode choice, evacuation destination, and travel speed. By comparing the simulation with data from the 2011 Japanese earthquake and tsunami, the authors concluded that the results from this simulation are consistent with the real event and can be used to analyze evacuation and shelter demand for future events. In 2013, Mas et al. (2013) expanded this ABMS to the city of La Punta, Peru, to conduct a vertical and horizontal shelter analysis.
Practitioners and researchers have relied on similarities between the 2011 Japanese earthquake event and the geologically similar Cascadia subduction zone (CSZ) to encourage Oregon coastal residents to prepare for local tsunamis. Karon and Yeh (2011) used GIS (geographic information system) to build an evacuation ABMS by integrating tsunami inundation, warning transmission, and travel speed to examine the impact of failures of critical infrastructure in Cannon Beach, Oregon. To model heterogeneous agent behaviors, Wang et al. (2016) established a scenario-based tsunami evacuation ABMS for Seaside, Oregon. This study examined the impact of variance in agent behaviors such as milling time, evacuation mode choice, and travel speed. In addition, it also included the impact of a tsunami, but not an earthquake, on the built environment such as damage to streets, bridges, and buildings. A later version of this study, Mostafizi et al. (2019a), used a similar ABMS platform to identify optimum shelter locations considering the population distribution, heterogeneous agent milling time, and walking speed. However, as with previous studies, agents were assumed to evacuate to the closest shelter, which may not accurately represent people's destination choices when threatened by a tsunami.
One common limitation of those evacuation models is that they have evacuation assumptions about the four evacuation time components – authorities' decision delay time, households' warning receipt and decision time, households' evacuation preparation time, and households' evacuation travel time. Warning receipt time, for example, can vary across communities and households. Nagarajan et al. (2012) used an ABMS to test the warning dissemination speed through formal channels transmitted by officials and informal channels transmitted by neighbors. They found that even a small proportion of people who were willing to warn their neighbors have a considerable impact on reducing warning dissemination time. Several previous ABMS studies have also assumed arbitrary probability functions for milling time to represent the variance in evacuation departure times (Mas et al., 2012; Wang et al., 2016; Mostafizi et al., 2019a).
In addition, some recent evacuation simulations have also employed assumptions about the distribution of evacuees' walking speeds. For instance, Wang et al. (2016) and Mostafizi et al. (2019a) assumed a normal distribution of evacuee walking speeds for which the mean was built based on a study of pedestrians walking on streets in non-emergency situations (Knoblauch et al., 1996). This assumption is likely to underestimate travel speeds in a tsunami evacuation and thus overestimate tsunami mortality rates. However, mortality rates might not be overestimated if travel speed is actually reduced by additional barriers such as landslides, liquefaction, and other earthquake disturbances to the evacuation route system.
Failure to consider “shadow evacuation” by residents of areas outside the tsunami inundation zone can lead to unnecessary evacuation that overwhelms the evacuation route system and impedes travel by people in the inundation zone (Lindell et al., 2019). Instead of assigning a probabilistic distribution to walking speed, Wood and Schmidtlein (2012) used a deterministic hiking function (Tobler, 1993) to define a least-cost distance (LCD) model for tsunami evacuation. This hiking function not only captured the impact of slope on walking speed but also assumed daily walking conditions rather than emergency conditions. Overall, existing evacuation models have assumed that pedestrians' travel behavior in daily situations represents the corresponding behavior in evacuations, but field or experimental data to confirm this assumption are needed.
Most of the aforementioned studies used census data to identify agents' evacuation departure locations, so the scenarios assumed people were at home. However, a disaster may happen at any time of the day. To account for the variance in evacuees' locations, Dawson et al. (2011) developed a flood management ABMS to support flood emergency planning and evaluate flood incident management measures. The authors used empirical survey data to integrate warning time and used the National Travel Survey to determine people's locations and travel states (e.g., work, home, or school).
1.2 Other models for earthquake and tsunami evacuation
Although scenario-based ABMSs have been employed to support evacuation decision-making for entire communities (or large areas), jurisdictions are also interested in the question of how quickly people should evacuate from different sub-areas in a community. Geographers used the LCD method to build the beat-the-wave (BtW) model to estimate the maximum travel time that people need to walk out of a tsunami inundation zone (Wood and Schmidtlein, 2012). This model defined the distance cost by two variables – the evacuation route's slope and its land cover. To determine the walking speed, they employed Tobler's hiking function (Tobler, 1993) and the energy cost of the terrain category (Soule and Goldman, 1972). The output of this model provides the spatial distributions of maximum evacuation times to “beat the wave” and can be used for preparedness planning and education. The Oregon Department of Geology and Mineral Industries (DOGAMI) has implemented this model to identify Oregon coastal communities' evacuation route maps and to estimate evacuation travel times (DOGAMI, 2020; Gabel et al., 2019).
Although DOGAMI has used the LCD method because it is relatively easy to calculate and provides reasonable evacuation time estimates (ETEs), it does have some limitations. First, it cannot examine social-system variables that influence tsunami evacuation outcomes (such as population distribution; milling time; and the choice of transportation mode, evacuation route, and evacuation destination). Second, it cannot incorporate dynamic travel costs due to crowding or congestion. Agent-based models can overcome those limitations but are sometimes criticized as difficult to implement due to the magnitude of data required. As noted earlier, those data include the distribution of population locations, evacuees' behaviors, and wave arrival time. However, the ABMS and LCD approaches are not incompatible, so a mixed-method approach could be used to better model the complex nature of evacuation (Wood and Schmidtlein, 2012).
1.3 Research objectives and questions
The preceding literature review has revealed the need for an evacuation ABMS that can simultaneously consider the natural environment, built environment, and social system to analyze complex evacuation scenarios. Although some studies have incorporated layers from those three systems, most of the data inputs were arbitrary assumptions – a problem that has plagued large-scale evacuation modeling (Lindell et al., 2019). To more completely integrate the three systems, this study established an ABMS for tsunami evacuation that integrates (1) the natural environment and its disruptions; (2) the built environment and its disruptions; and (3) the social system, as defined by people's protective actions – especially their evacuation behavior.
Specifically, this ABMS integrates human decisions and evacuation logistics into an ABMS platform using empirical behavior data that were collected through survey questionnaires and evacuation drills from coastal residents facing tsunami threats. This integration operationalizes the Protective Action Decision Model (PADM) (Lindell and Perry, 2012) within an ABMS by incorporating agents’ heterogeneous behavior in emergencies, such as (1) evacuation participation; (2) choices of transportation mode, evacuation routes, and destinations; and (3) travel speeds. Furthermore, to accurately model the complex nature of evacuation, this ABMS also includes the impact of landslides and liquefaction on the road network during evacuation. Incorporating the essential components of the LCD model (slope and road surface) combines the advantages of the ABMS and BtW models (Wood and Schmidtlein, 2012). ABMS models are implemented for Coos Bay, Oregon, and sensitivity analyses are conducted in this study to answer the following questions:
-
How do the evacuation participation rate, milling time, mode choice, destination choice, and travel speed affect mortality rates?
-
Which of these variables have greater impact on mortality rates, and which of them can be addressed in tsunami evacuation preparedness?
-
How do the results from the ABMS compare with the results from the BtW model?
This interdisciplinary ABMS not only can serve as an evacuation planning tool for local agencies but also can be an educational and assessment tool for coastal residents to better prepare for the next threat.
2.1 Agent-based modeling environment
Simulating evacuation is a computationally intensive problem due to the large scale of the built and natural environments and the complexity of agent behaviors. Therefore, an ABMS typically has a high computational cost when applied to large-scale evacuation (Lindell et al., 2019). To overcome this issue, the tsunami evacuation ABMS was built using the Julia programming language, which is a just-in-time compiled language, allowing for high performance and computational speed (Bezanson et al., 2012). The high speed of the Julia language allows researchers to model large communities with detailed heterogeneous agent behaviors. This study's ABMS modeling environment allows users to modify parameters for natural, built, and social systems and also allows for stochastic inputs. Figure 1 shows the ABMS visualization and real-time evacuation monitors. The details of the evacuation model environment are discussed in Sect. 2.3.
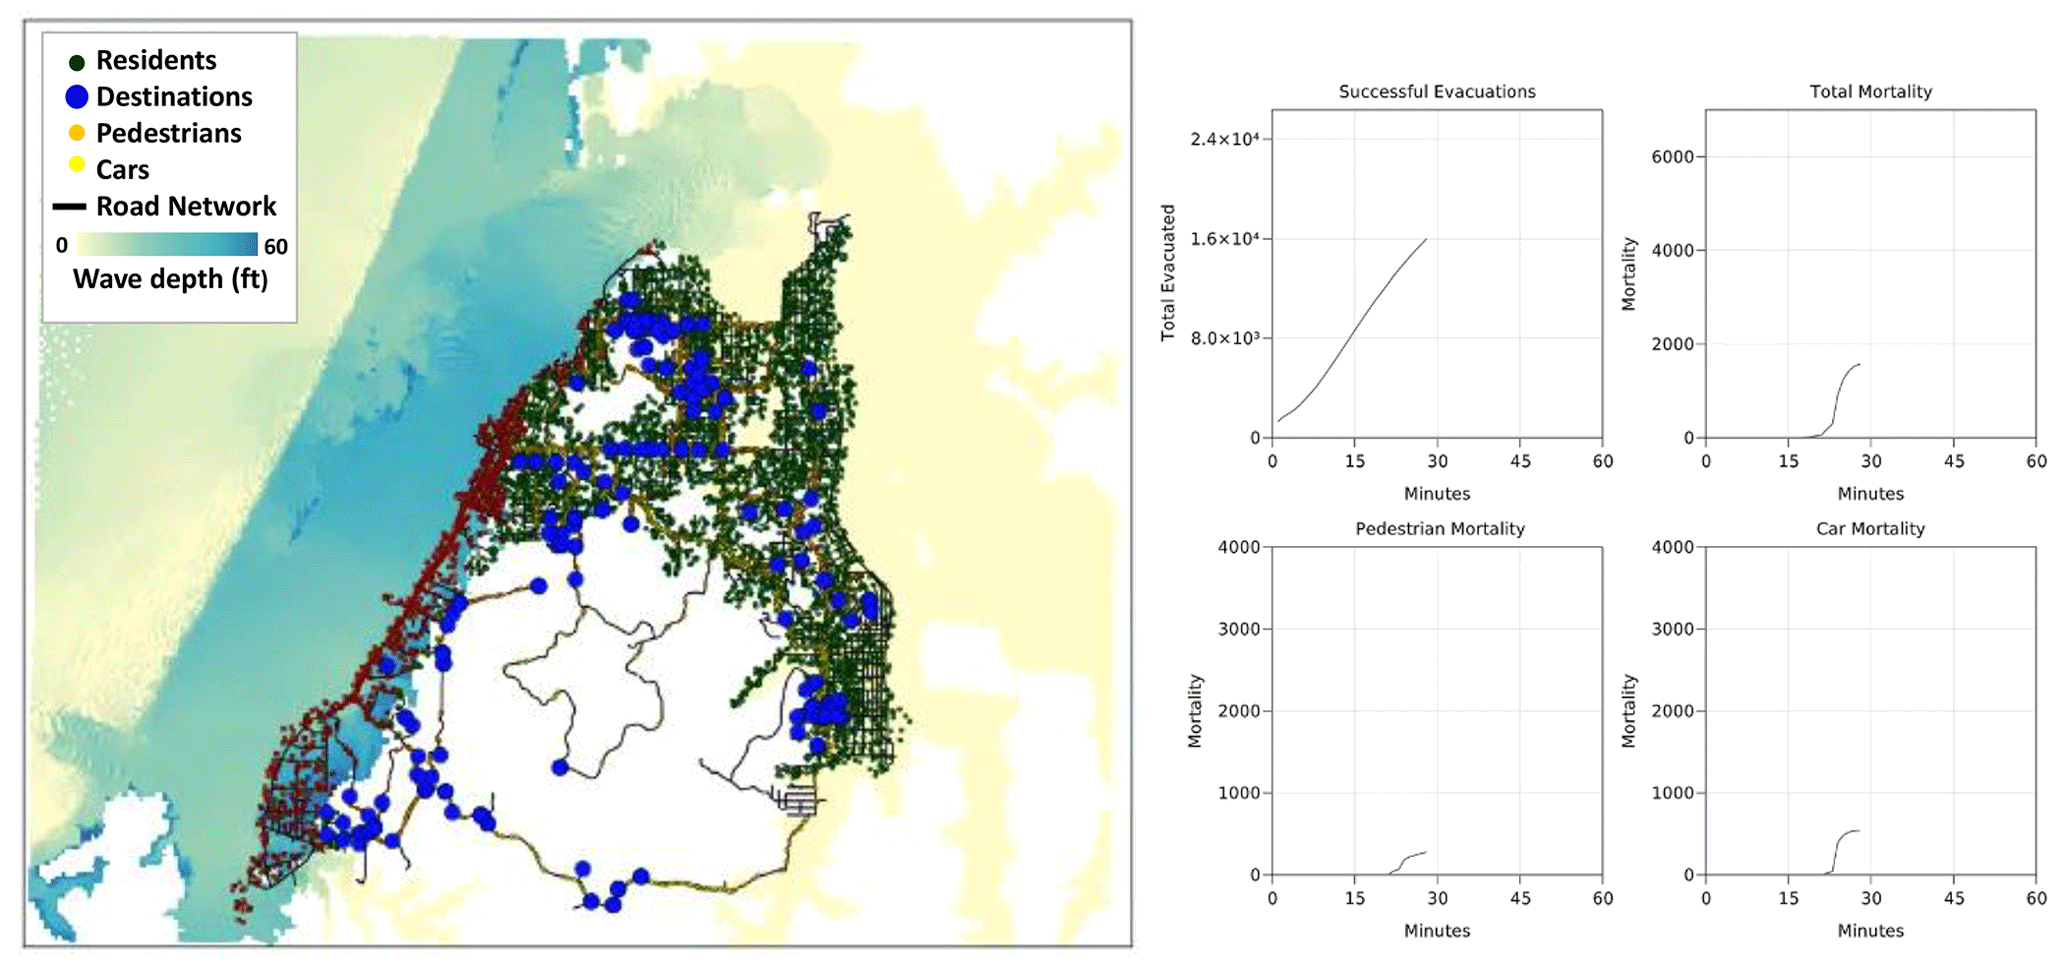
Figure 1Simulation model visualization of Coos Bay, Oregon (1 ft = 0.30 m).
2.2 Study area
A series of CSZ tsunami evacuation studies have used Seaside, Oregon, as a study community because of its high level of vulnerability to local tsunamis (Connor, 2005; Wood et al., 2015; Wang et al., 2016; Chen et al., 2020, 2021). However, other communities that differ from Seaside in their geographic and demographic characteristics should also be examined. This study chose the Coos Bay peninsula as a case study due to four features. First, it has a distinctly vulnerable geography. As Fig. 1 indicates, this peninsula is surrounded by bay water on its north, east, and west sides. In addition, its hilly spine in the middle provides ready access to higher ground for evacuation destinations. The bay serves as the second and the sixth largest estuary in Oregon and on the US west coast, respectively (CLW, 2015). Second, this community is located on the southern margin of the CSZ, where the rupture probability is higher and tsunami wave arrival time is shorter than communities farther north (Priest et al., 2014; Chen et al., 2021). Third, the Coos Bay peninsula has a total population of about 26 129, which is the largest population among Oregon coastal communities (United State Census Bureau, 2020). Moreover, a large proportion of the population (about 25 %) resides within the inundation zone. Fourth, this community has a high level of social vulnerability due to its demographic characteristics. The local population has a higher percentage of disabled residents and is poorer and less educated than the overall US population (United State Census Bureau, 2020; Chen et al., 2021).
2.3 Model components
To more accurately model tsunami evacuation, this study proposes an ABMS that integrates components of the natural environment, built environment, and social system. Specifically, this ABMS includes the components shown in Table 2.

2.3.1 Social system and agent behavior
According to the PADM, people make protective action decisions based on environmental/social cues and warnings, which are affected by personal characteristics such as pre-existing beliefs about the hazard, protective actions, and community stakeholders (Lindell and Perry, 2012; Lindell, 2018). The large number of these variables, the difficulty in measuring them, and their heterogeneity among agents makes it difficult to model this part of the evacuation process (Mas et al., 2012). Previous evacuation simulation models (Mas et al., 2012; Wang et al., 2016; Mostafizi et al., 2017, 2019b) assumed that residents evacuate in the most efficient manner (such as selecting the closest shelter) but ignored the heterogeneity in evacuation decisions and actions (Gwynne et al., 1999). One main reason is that these models lacked empirical data on evacuation decisions and actions. To fill that gap, the evacuation model in this study integrates data on people's evacuation decisions and actions that were collected from questionnaire surveys and evacuation drills.
This study employed the PADM as the framework for a mail-based household questionnaire survey that collected data on household evacuation intentions in the Coos Bay area between May and September 2020. There were 258 respondents who returned the questionnaire, which covers their evacuation intentions, expected milling process, and choices of transportation modes and destinations, as well as psychological variables and demographic characteristics. More information can be found in Chen et al. (2021). Probability distributions on these variables are utilized to model the heterogeneous evacuation actions from the data shown in Table 2.
The analyses that follow are based on the ETE model in which the time to clear the risk area is a function of authorities' decision time, warning dissemination time, evacuation preparation time, and evacuation travel time (Lindell et al., 2019). Evacuation preparation time, which is often called “milling” (Wood et al., 2018), has two components – (1) psychological preparation, which involves information seeking and processing to make evacuation decisions, and (2) logistical preparation, which involves performing essential tasks (e.g., packing bags and securing the home) before leaving (Lindell and Perry, 2012). Evacuation travel time is a function of evacuees' choices of transportation mode, evacuation route, and evacuation destination.
Modeling evacuation from a distant tsunami requires data on authorities' decision time and warning receipt time. In the absence of these data, the results of the following analyses do not apply to distant tsunamis. Modeling evacuation from a local tsunami is simpler because long and strong earthquake shaking is a reliable environmental cue to tsunami onset. Consequently, people who recognize this environmental cue have authorities' decision time and warning dissemination time equal to zero.
Moreover, the following analyses include sensitivity analyses that examine the impact of a plausible range of variation in the input variables on the estimated tsunami mortality rate. As discussed below, these sensitivity analyses can provide useful information for decision-making and emergency planning.
Evacuation participation (0: stay; 1: leave) is the protective action that an individual agent selects in response to earthquake shaking or a tsunami warning in this model. According to the Coos Bay community survey, 81 % of the respondents intend to evacuate, regardless of their location inside (“compliant evacuees”) or outside (“shadow evacuees”) of the tsunami inundation zone. Thus, 81 % is used as the evacuation participation rate in this model, with a sensitivity analysis on how a change in this rate would impact tsunami mortalities. Evacuees' origins are determined by their locations when an earthquake occurs or a tsunami warning is received. Thus, there is spatial and temporal variability in the distribution of population locations based on factors such as time of day, season, and weather (Wang et al., 2016). This study utilized 2020 US census (United State Census Bureau, 2020) data to define the origins of 26 363 agents. The scenario examined in this study assumes that all residents are at home, as on a weekend or at night.
The tsunami evacuation intentions questionnaire asked respondents to report how much time they expected it would take them to prepare to evacuate. As shown in Eq. (1),
where x means the milling time and f(x) means the probability of having that milling time for an individual. Applying a maximum likelihood estimation to the survey data produced α=1.659 and β=6.494 as the estimated parameters of the gamma function for the milling time distribution. As Fig. 2 indicates, both the Weibull and lognormal distributions provided poorer fits (Akaike information criterion, AIC; Bayesian information criterion, BIC) to the data.
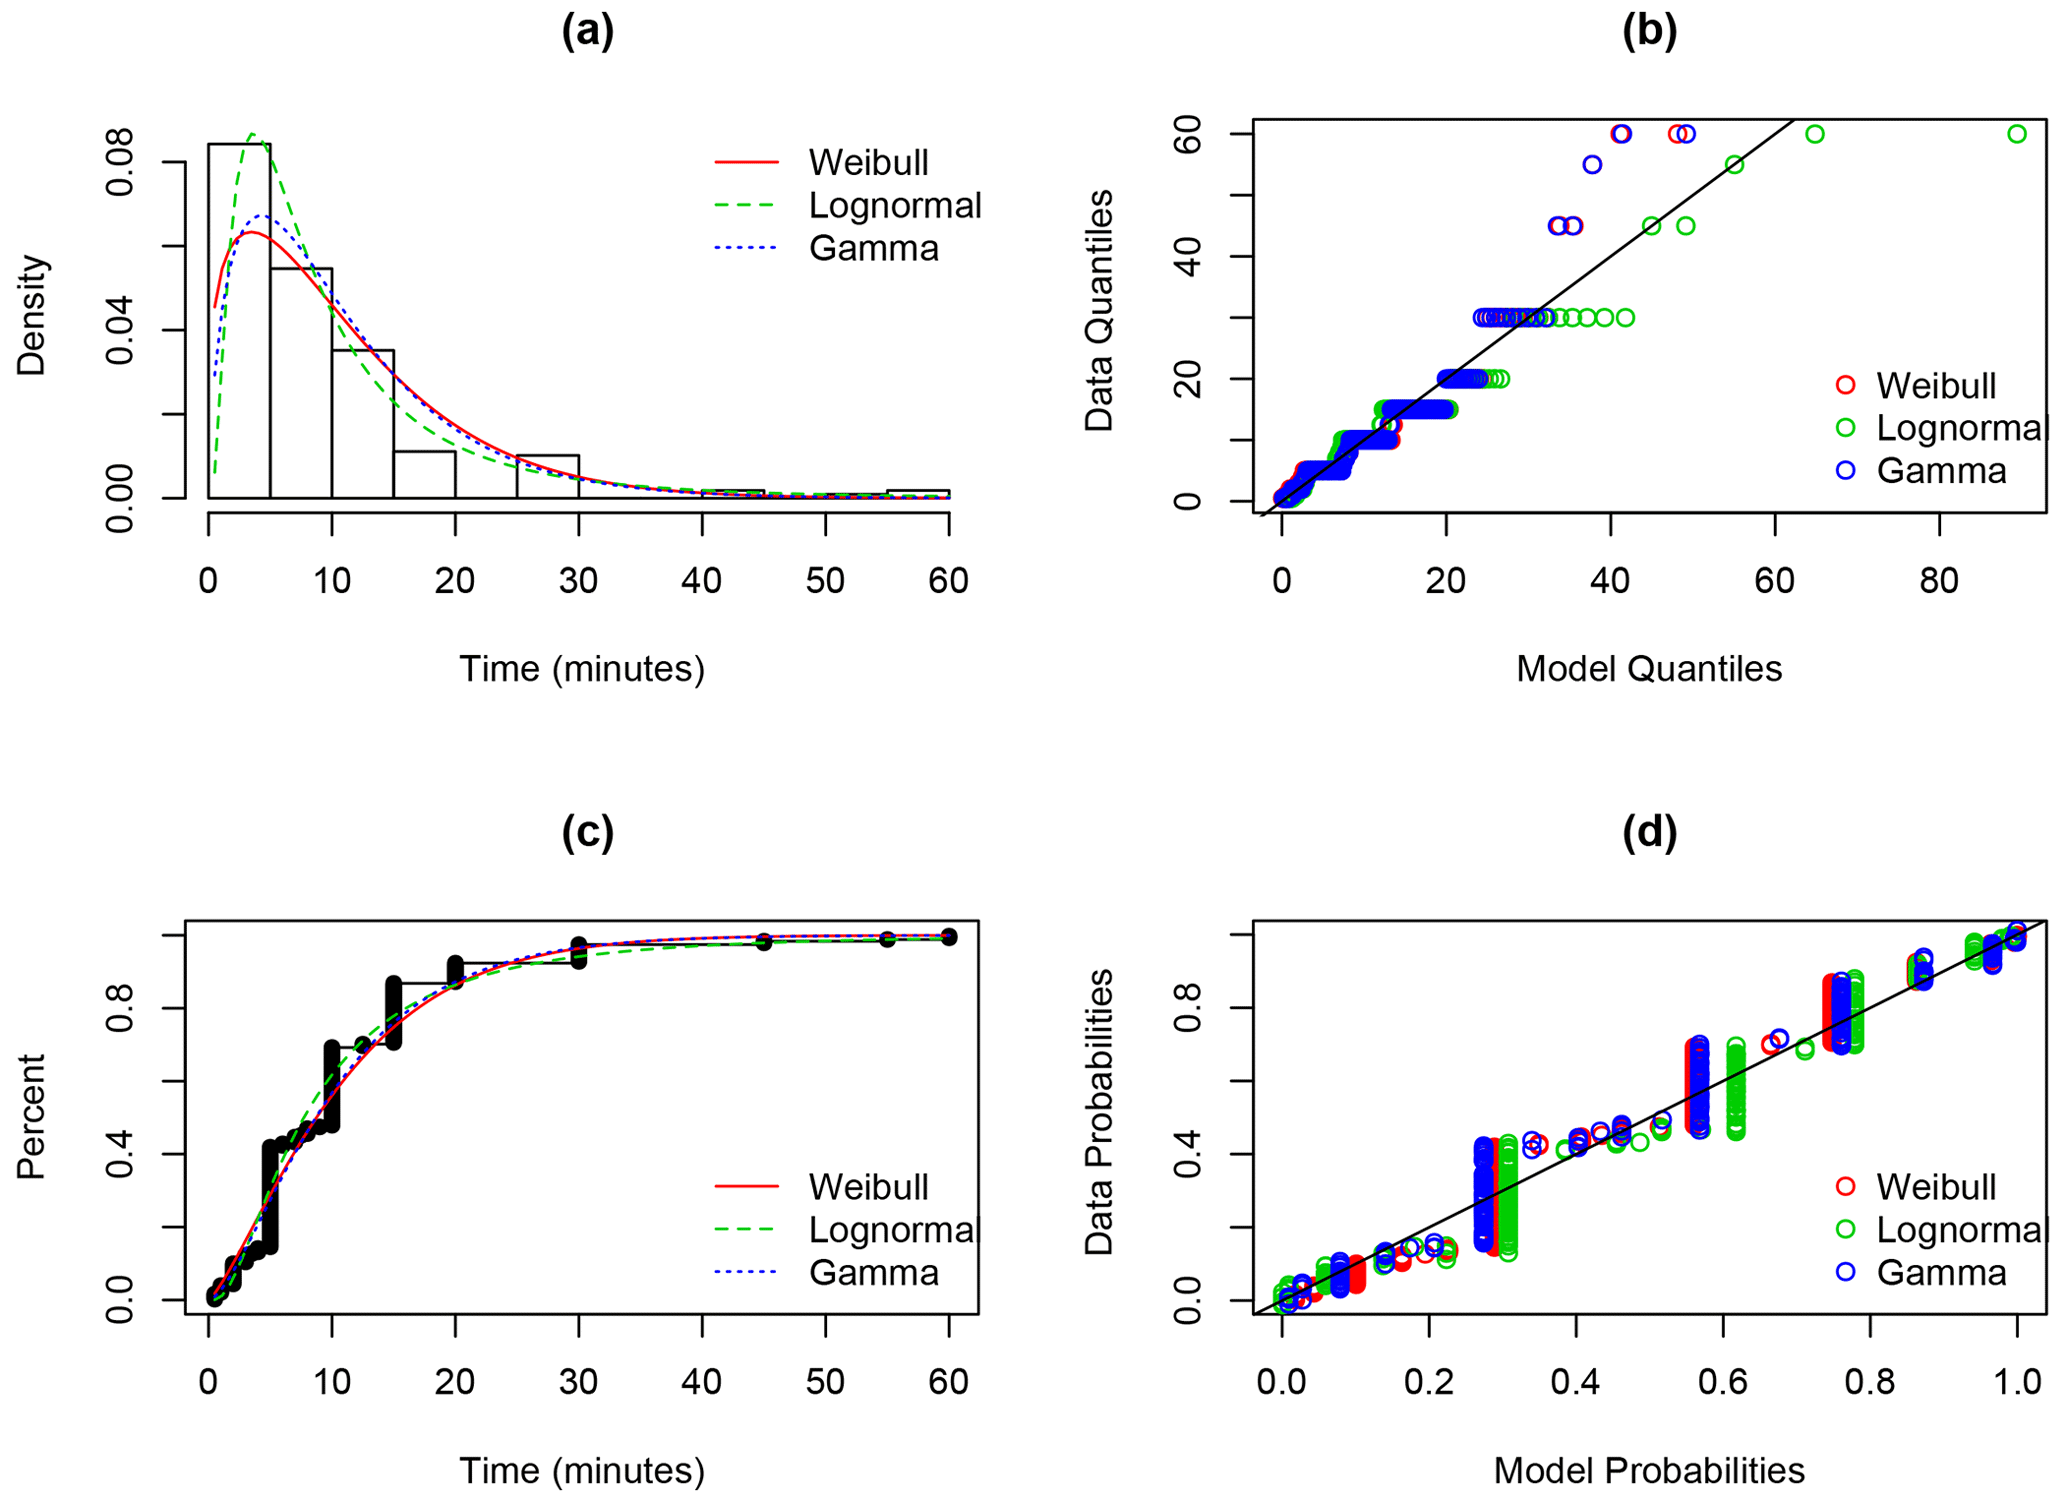
Figure 2Expected preparation time from survey data and fitted models: (a) data histogram and probability density function, (b) quantile–quantile plot, (c) cumulative density function, and (d) probability–probability plot.
Transportation mode choice is a critical factor that affects evacuation success. Agents can choose to evacuate either by foot or by personal vehicle in this model (0: car; 1: foot). In Coos Bay, 70 % of the survey respondents reported that they would evacuate by car, and only 27 % expected to evacuate by foot (Chen et al., 2021).
Destination choice is also obtained from the survey, and a probability of choosing a specific destination is assigned to each evacuee based on their distance from the available destinations. A gamma function yields the best goodness-of-fit statistics among the three candidate functions for the destination selection probability, shown in Fig. 3. Probability functions were developed separately for evacuation by foot and by car, with maximum likelihood estimation yielding α=1.920 and β=500 for evacuation by foot and α=1.646 and β=1.745 for evacuation by car.
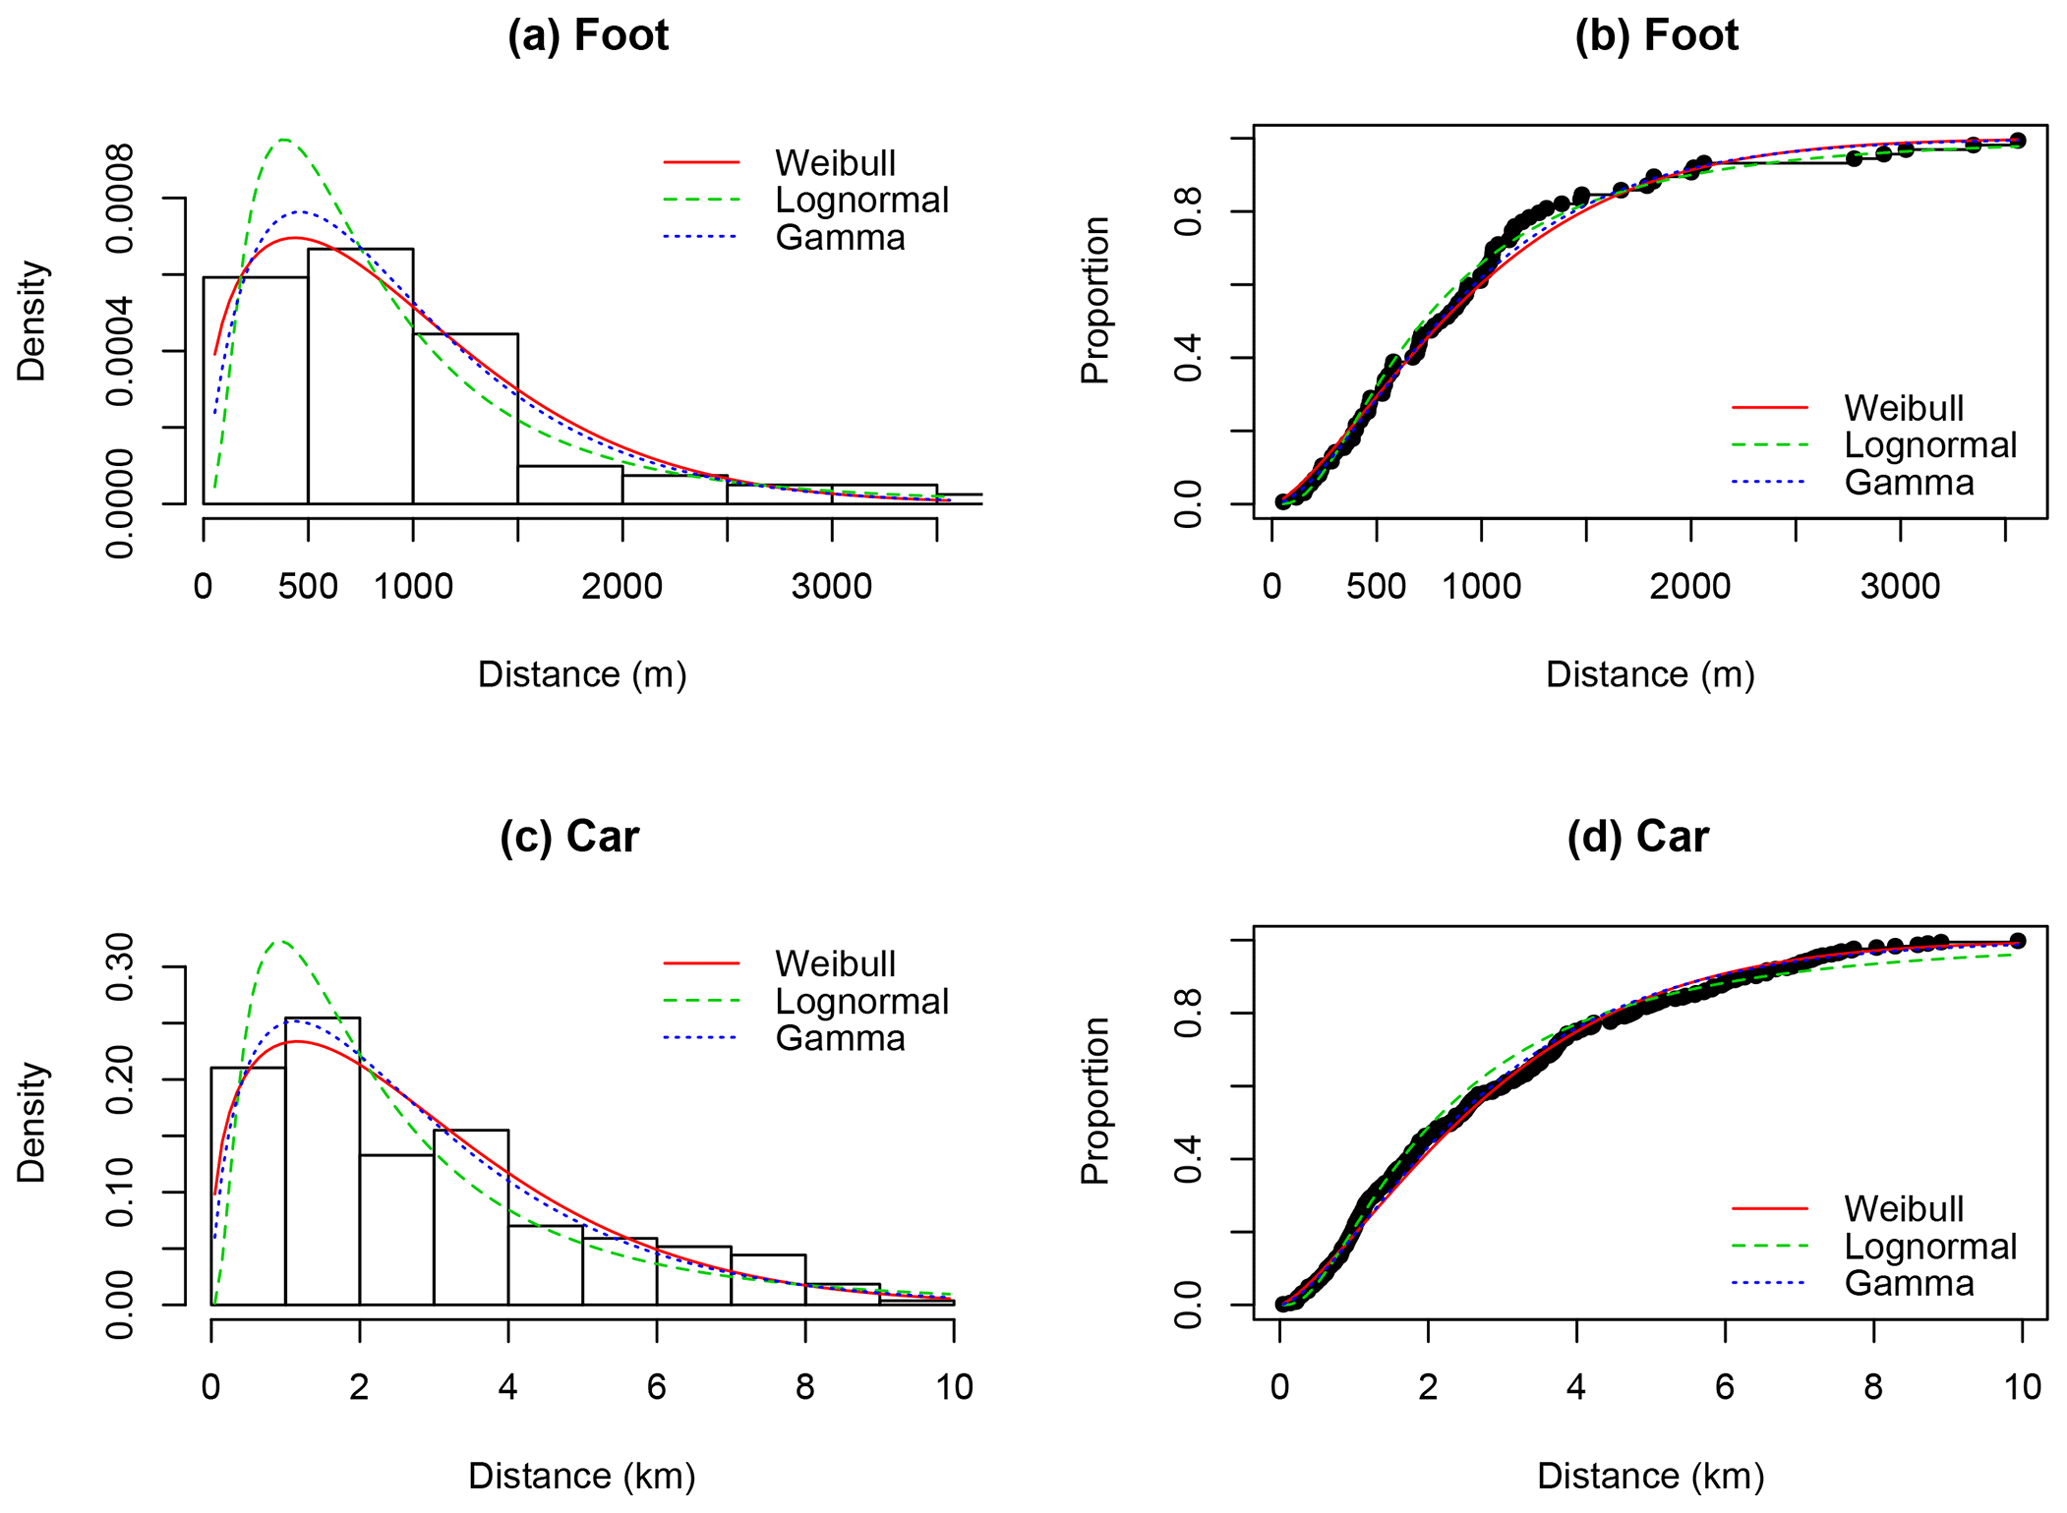
Figure 3Intended evacuation destination from survey data and fitted models. Panels (a) and (c) are probability density functions; panels (b) and (d) are cumulative distribution functions.
After agents choose their expected evacuation destinations, the model assigns them to the shortest route that is calculated by the A* algorithm (Hart et al., 1968) on the road network. To simulate the behavior of people who encounter an evacuation impediment such as flood on the road while evacuating, agents divert to an alternate route. Specifically, when agents observe that the next intersection is inundated by water or damaged by hazards (i.e., see Sect. 2.3.3), they select a different leg of the intersection. The model assumes an equal probability of choosing each of the unblocked legs.
The mechanism for assigning a travel speed varies, depending on which transportation mode an agent chooses (foot or car). Driving speed is determined by the IDM car-following model (Treiber et al., 2000) and the vehicle speed limit on that roadway. Pedestrian walking speed is determined by the slope of the ground on which the pedestrians are walking, through an advanced hiking function (Tobler, 1993; Wood and Schmidtlein, 2012). To adjust for differences in walking speeds between daily walking and a tsunami evacuation, we modified the hiking function based on tsunami evacuation drill data that were collected from 2016–2018 (Cramer et al., 2018). In these evacuation drills, 136 evacuees' trajectory data (source: author) were recorded by GNSS-embedded (global navigation satellite system) mobile devices. Data on walking speed and slope were used to modify the hiking function; the modified function is shown in Eq. (2).
To reduce computational cost and optimize simulation speed, the model assigns an average slope to the road segment between each pair of intersections, and agents who walk on that segment will have the walking speed that is determined by Eq. (2). When conducting sensitivity analyses for different values of walking speed, the modified hiking function is disabled when a fixed walking speed is used. Moreover, pedestrian walking speed is reduced based on the conservative value when liquefaction and landslide block a road surface (Schmidtlein and Wood, 2015; Gabel et al., 2019). More details are discussed in Sect. 2.3.3.
2.3.2 Built environment
The model's built-environment components include the road network and non-retrofitted bridges. The transportation network was obtained from OpenStreetMap (OSM, 2021) and updated manually by the authors based on the 2020 Google Earth satellite image (Google, 2021). All roads are considered to be two-way one-lane streets, as a conservative assumption (Wang et al., 2016). This model also assumes that all agents, whether as pedestrians or in cars, follow the road network to their destinations. Alternative evacuation routes are not included in this simulation, such as swimming across streams or cutting through open fields or parking lots.
Non-retrofitted bridges were located using a study by Gabel et al. (2019). These bridges are not expected to survive after an M9 CSZ earthquake (Gabel et al., 2019), so they are assumed to be undrivable and unwalkable in this analysis. These bridges are the following:
-
Virginia Ave. on Pony Creek, (1) in Fig. 4
-
Vermont Ave. on Pony Creek, (2) in Fig. 4
-
Broadway Ave. on Pony Creek, (3) in Fig. 4.
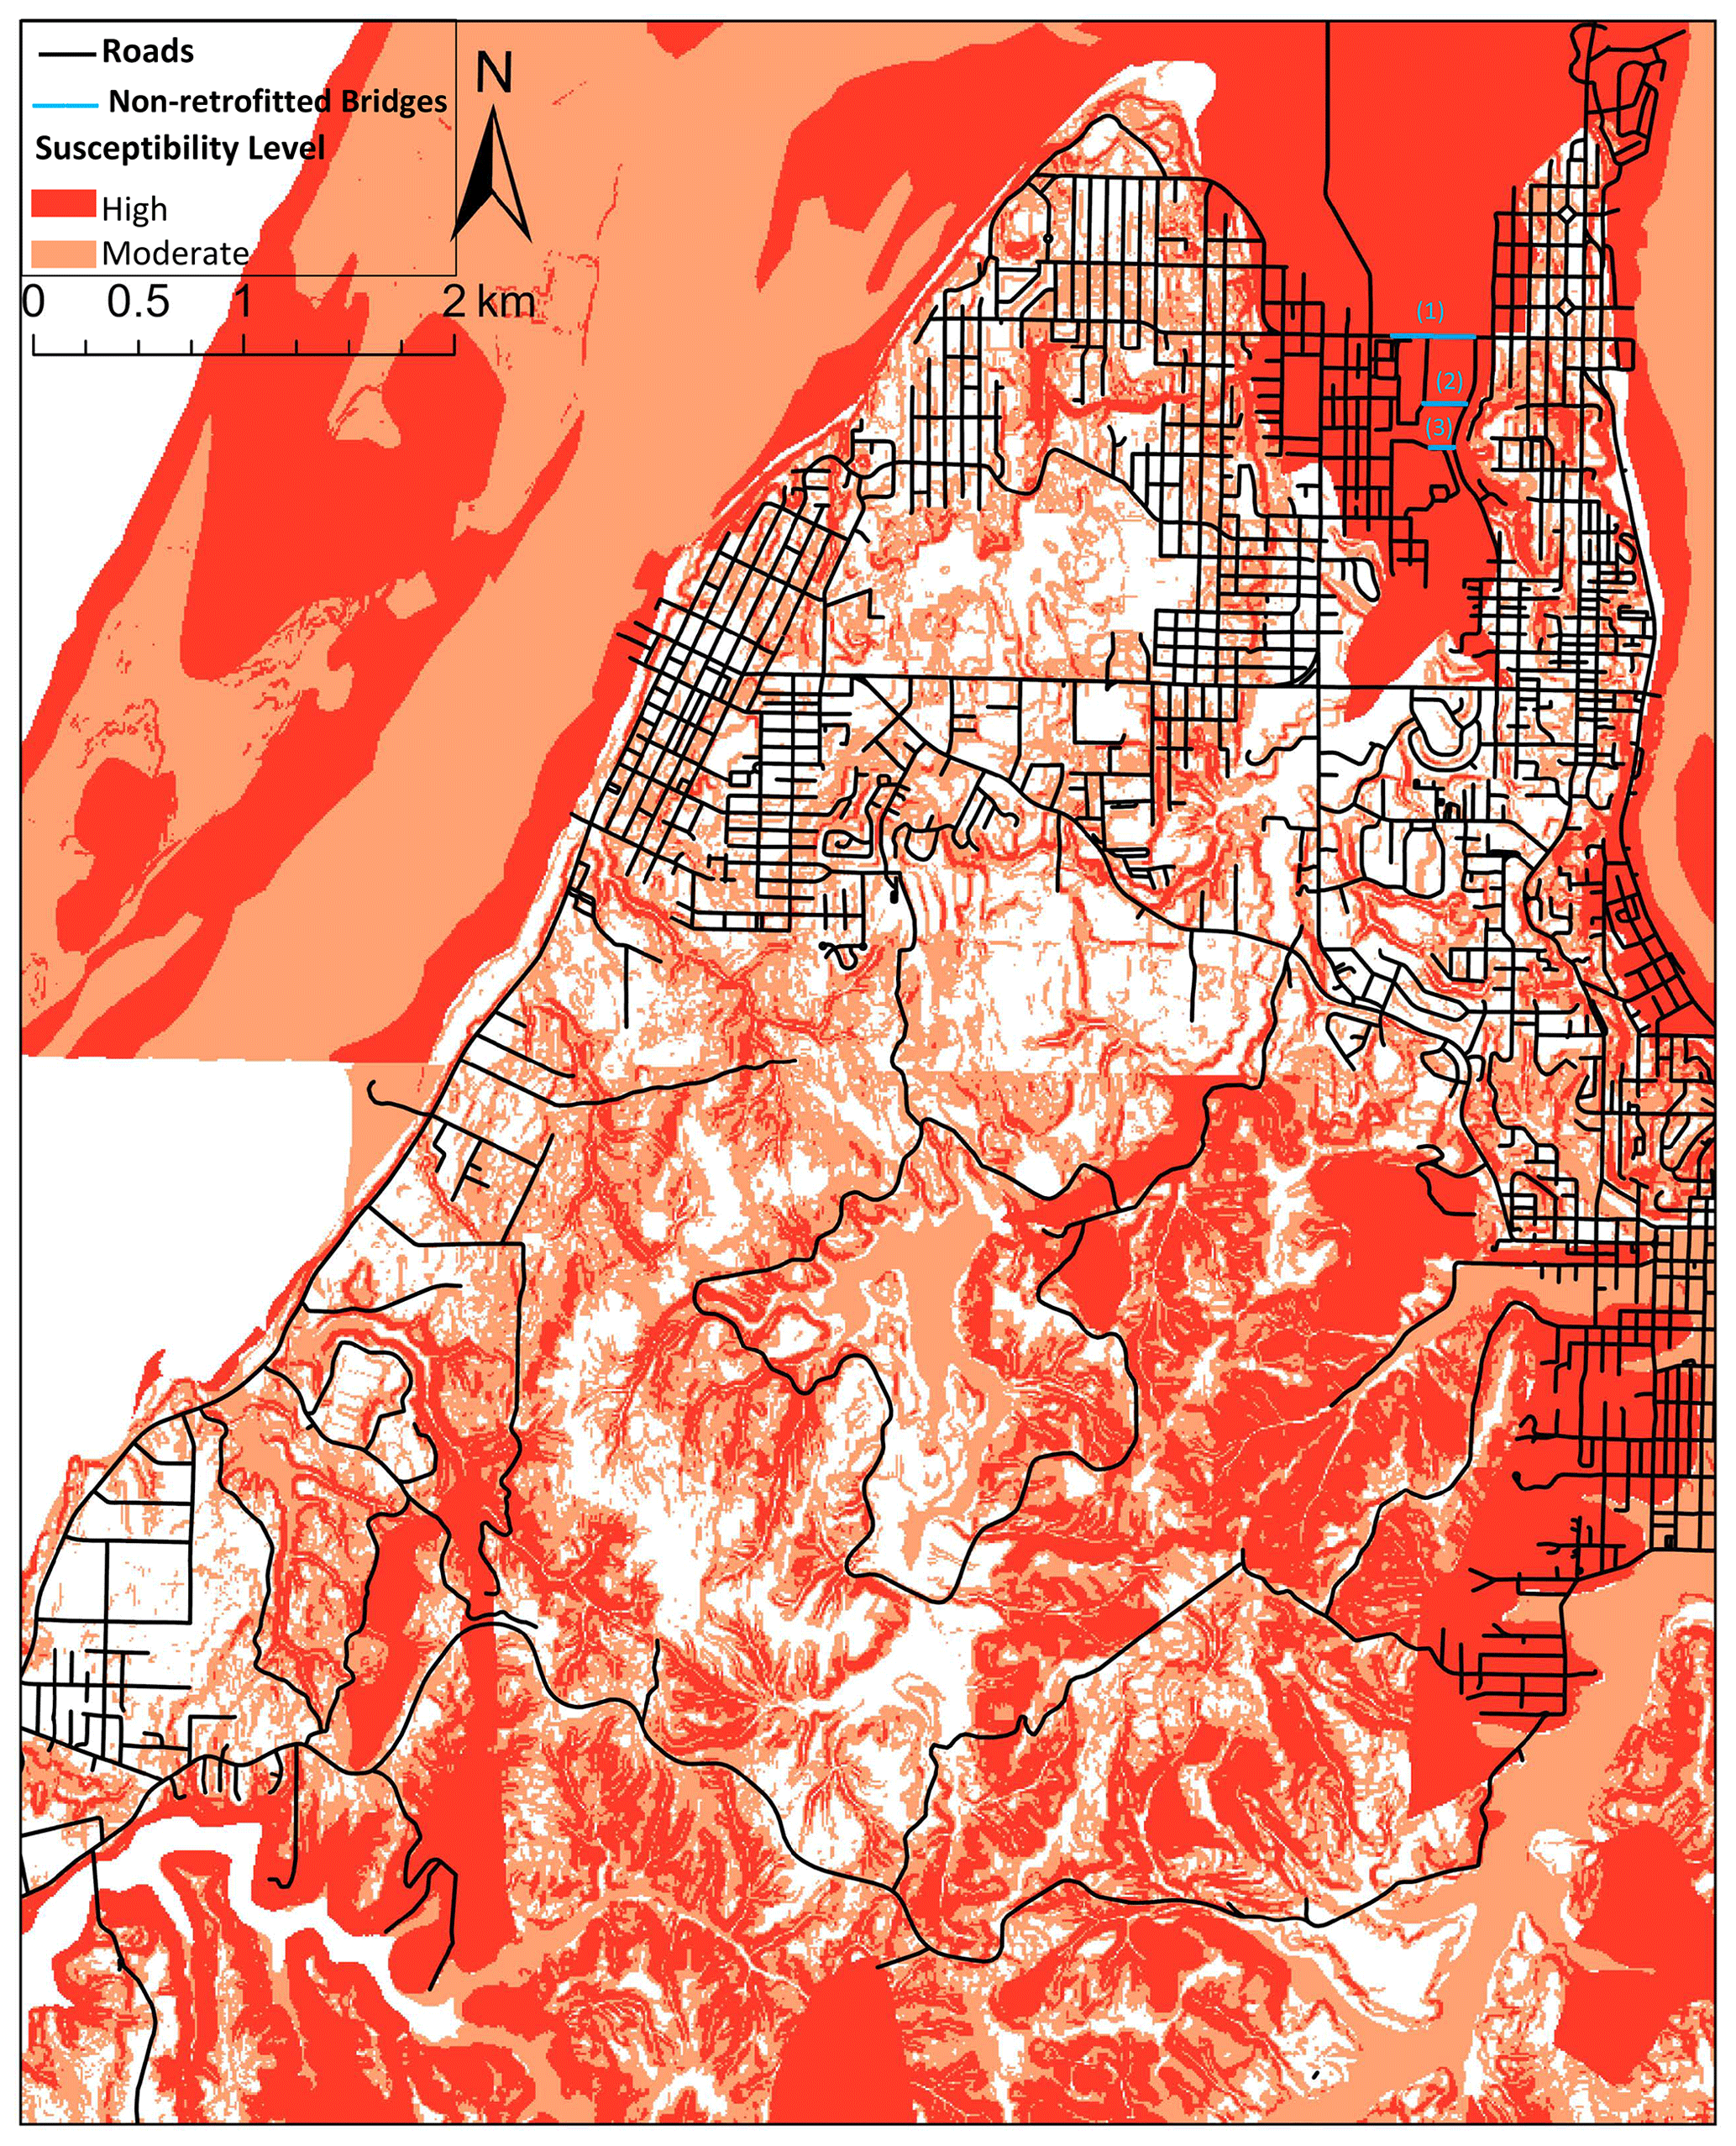
Figure 4Coos Bay landslide and liquefaction susceptibility.
2.3.3 Natural environment
Natural-environment components that are integrated in this model include tsunami inundation, terrain elevation and slope, liquefaction susceptibility, and landslide susceptibility.
Tsunami inundation layer. This model simulates an M9 CSZ earthquake and tsunami using the XXL tsunami inundation model (Witter et al., 2011; Priest et al., 2013). The tsunami inundation layer includes variation in the flow depth and velocity every 30 s for each 15 m grid cell from the time the tsunami is generated to 8 h after it reaches the Coos Bay peninsula. The inundation model assumes “bare earth”, so the impact of large buildings on water flow was not included.
Topographical elevation and slope. A 10 m digital elevation model created by the U.S. Geological Survey (USGS) (Oregon Geospatial Enterprise Office, 2017) is included as the surface topographical elevation data. In this simulation, elevation data are utilized to calculate the surface slope to inform agents' walking speed using the modified hiking function shown in Eq. (2). The slope is calculated by using elevation change (Δy) divided by the Euclidean distance (Δx) change between two points, expressed as (slope ).
Landslides and liquefaction. Evacuation routes can become undrivable and even unwalkable due to liquefaction, rockfalls, and lateral spreading (Gabel et al., 2019). Susceptibility to both landslide and liquefaction for Coos Bay (Franczyk et al., 2019) is included in this model to estimate which road segments will be disrupted.
Landslide susceptibility is calculated based on proximity to landslide deposits, susceptible geologic units, slope angles, and existing landslide inventory. Areas are classified into four susceptibility levels – low, moderate, high, and very high (Burns et al., 2016; Franczyk et al., 2019). Liquefaction susceptibility is calculated from the cohesionless sediments, based on Youd and Perkins (1978) and Madin and Burns (2013). Areas are classified into five susceptibility levels – very low, low, moderate, high, and very high. This produces conservative liquefaction levels because it assumes relatively shallow groundwater (Madin and Burns, 2013).
Table 3 shows the landslide and liquefaction susceptibility levels that are used in this simulation. The spatial areas having a moderate or higher susceptibility level of either landslide or liquefaction are assumed to be disrupted after an M9 CSZ earthquake. We consider the moderate level as a threshold to be conservative and realistic. This threshold also has been used by local authorities (Gabel et al., 2019) to build the Coos Bay BtW model. As shown in Fig. 4, 54 % of the transportation network is exposed to at least a moderate level of liquefaction-landslide susceptibility and 21 % is exposed to at least a high level. Thus, the transportation network is likely to be significantly disrupted after an M9 earthquake.
Table 3Landslide and liquefaction susceptibility for network disruption in ABMS.
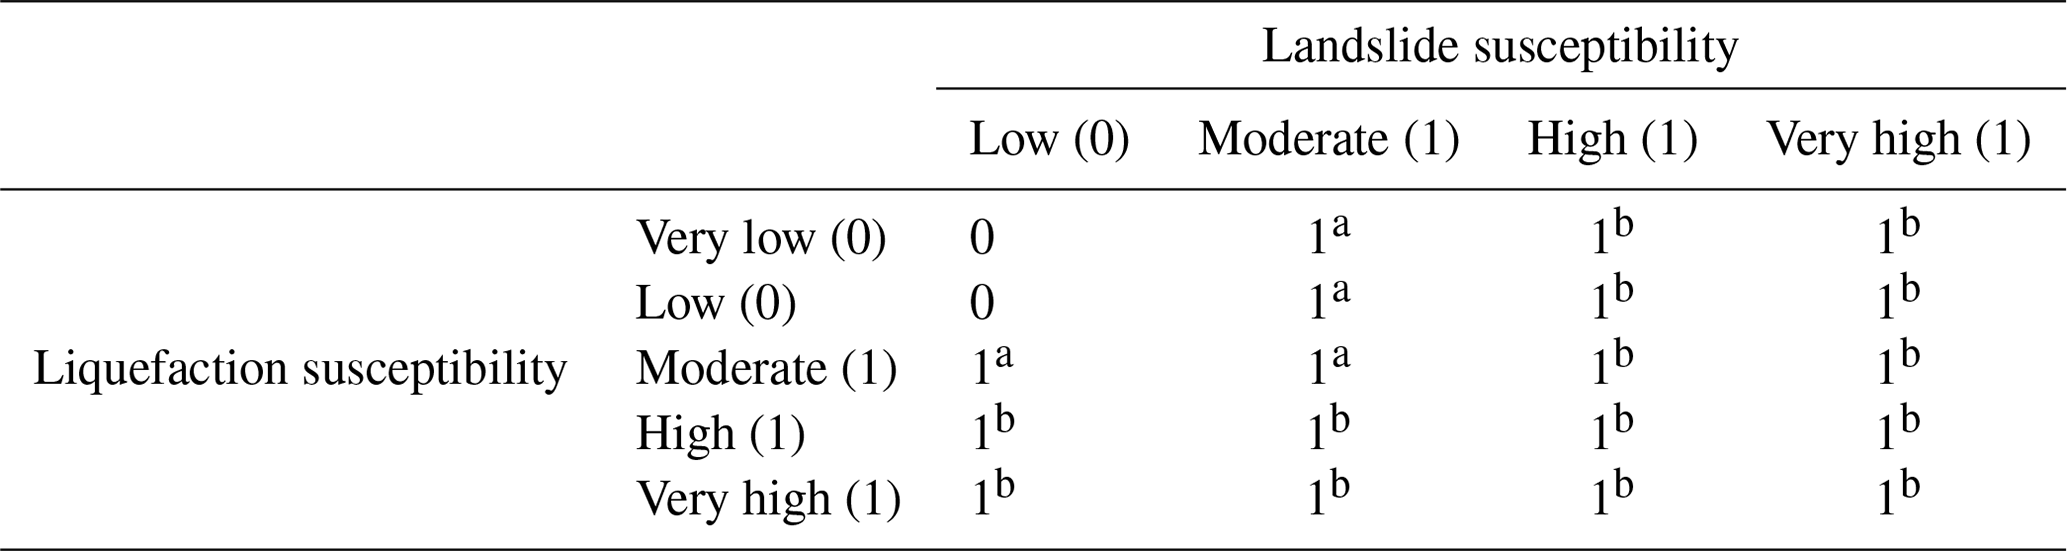
Using a disjunctive decision rule, a spatial area with an index value of at
least a moderate (54 %) or high (21 %) level is assumed to be disrupted after an M9 earthquake.
a Combined susceptibility level – moderate.
b Combined susceptibility level – high.
In this simulation, a street that is predicted to be disrupted by landslide or liquefaction is assigned a rocky or muddy road surface that prevents evacuees from driving through the impediment and makes walking the only feasible transportation mode from that point. Wood and Schmidtlein (2012) adapted a speed conservation value from Soule and Goldman (1972), which is applied to the travel speed of people walking on muddy or rocky terrain surfaces. These values are shown in Table 4.
Table 4Speed conservation values used in modeling pedestrian walking speed (Wood and Schmidtlein, 2012). Speed conservation values adapted from Soule and Goldman (1972).
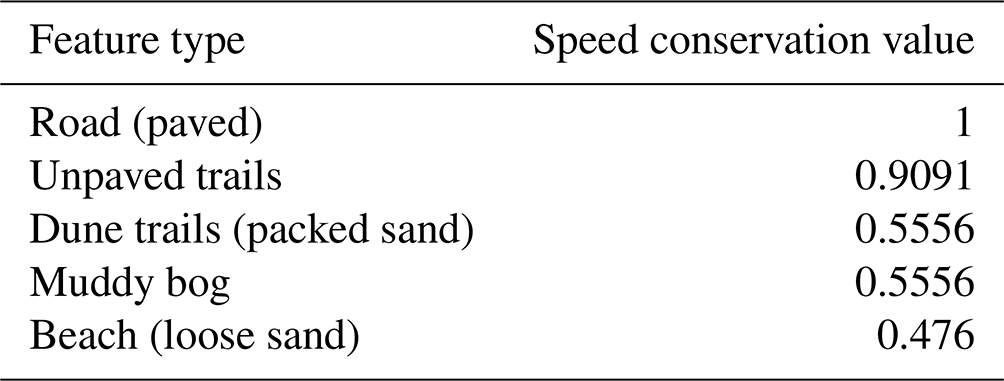
Figure 5 shows the overall visualization of one run of the model from 0 to 60 min after the M9 earthquake. The model assumes that (1) the deformation of the subduction zone completes and tsunami is triggered at the source when t=0 min, (2) people start the milling process and evacuate either by foot or by car, and (3) the first tsunami wave (the highest in a CSZ M9 scenario) arrives in the Barview area (due to being the most westward) at t= 15–20 min and starts to inundate to the west shoreline of the peninsula. The first wave arrives at the north side around t=30 min and the east side of Coos Bay around t=40 min. Most mortalities are observed on roads located in the west shoreline area, followed by the north and east sides.
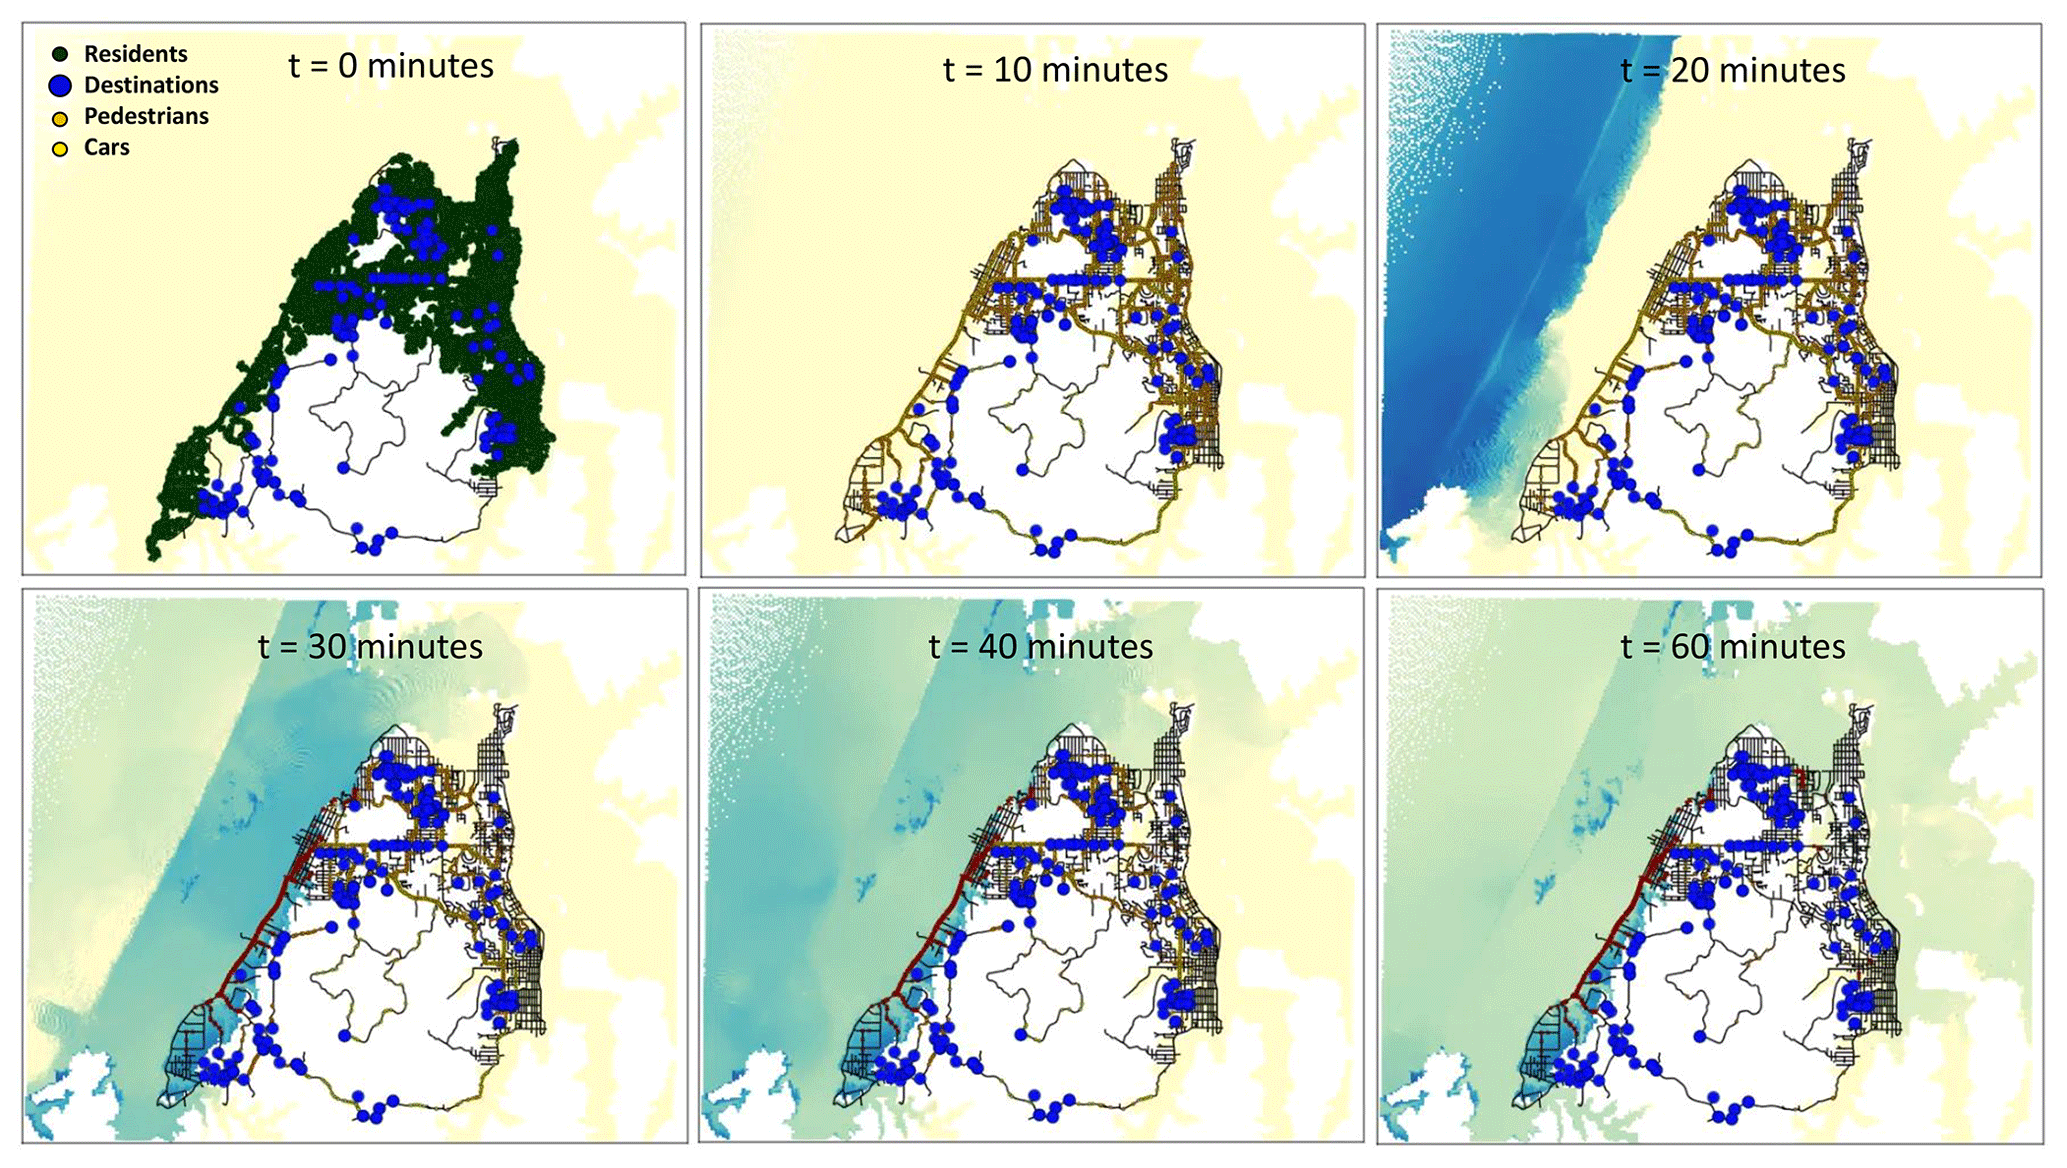
Figure 5Model screenshot by time.
Two scenarios are examined in this study. Scenario 1 assumes that the tsunami is the only cause of disaster impacts in the community. Consequently, the road network functions at full capacity until it is inundated by the tsunami waves. Thus, Scenario 1 provides a baseline for assessing the sensitivity of the modeling results to a plausible range of variation in the values of the input variables. Scenario 2 assumes that an M9 earthquake damages the road network and impedes the evacuation process. According to this scenario, driving may not be possible due to the heavy disruption of roads in large-scale landslides, liquefaction, lateral spreading, dropped power lines, debris, and traffic congestion. This assumption has also been applied to previous studies of earthquake and tsunami preparedness in Washington (WGS, 2021), Oregon (DOGAMI, 2020), and California (Cal OES, 2021).
3.1 Scenario 1: variable testing with no network disruption
Sensitivity analysis is applied to examine the impact of variation in each model variable on the expected tsunami mortality rate. A Monte Carlo method is employed to capture the probabilistic nature of the inputs and to create an interpretive mean.
3.1.1 Evacuation decision and milling time
Figure 6 shows the sensitivity analysis for the impact of the evacuation participation rate and milling time on the mortality rate among the inundation zone population (100 % measures only the population living in the inundation zone). Consistent with previous studies (Mas et al., 2013; Wang et al., 2016), these two variables have a significant impact on the estimated mortality rate. The larger the percentage of people who decide to evacuate and the less time people delay before departure, the lower the mortality rate will be. However, the impact of milling time on the mortality rate is complex, which yields two conclusions.
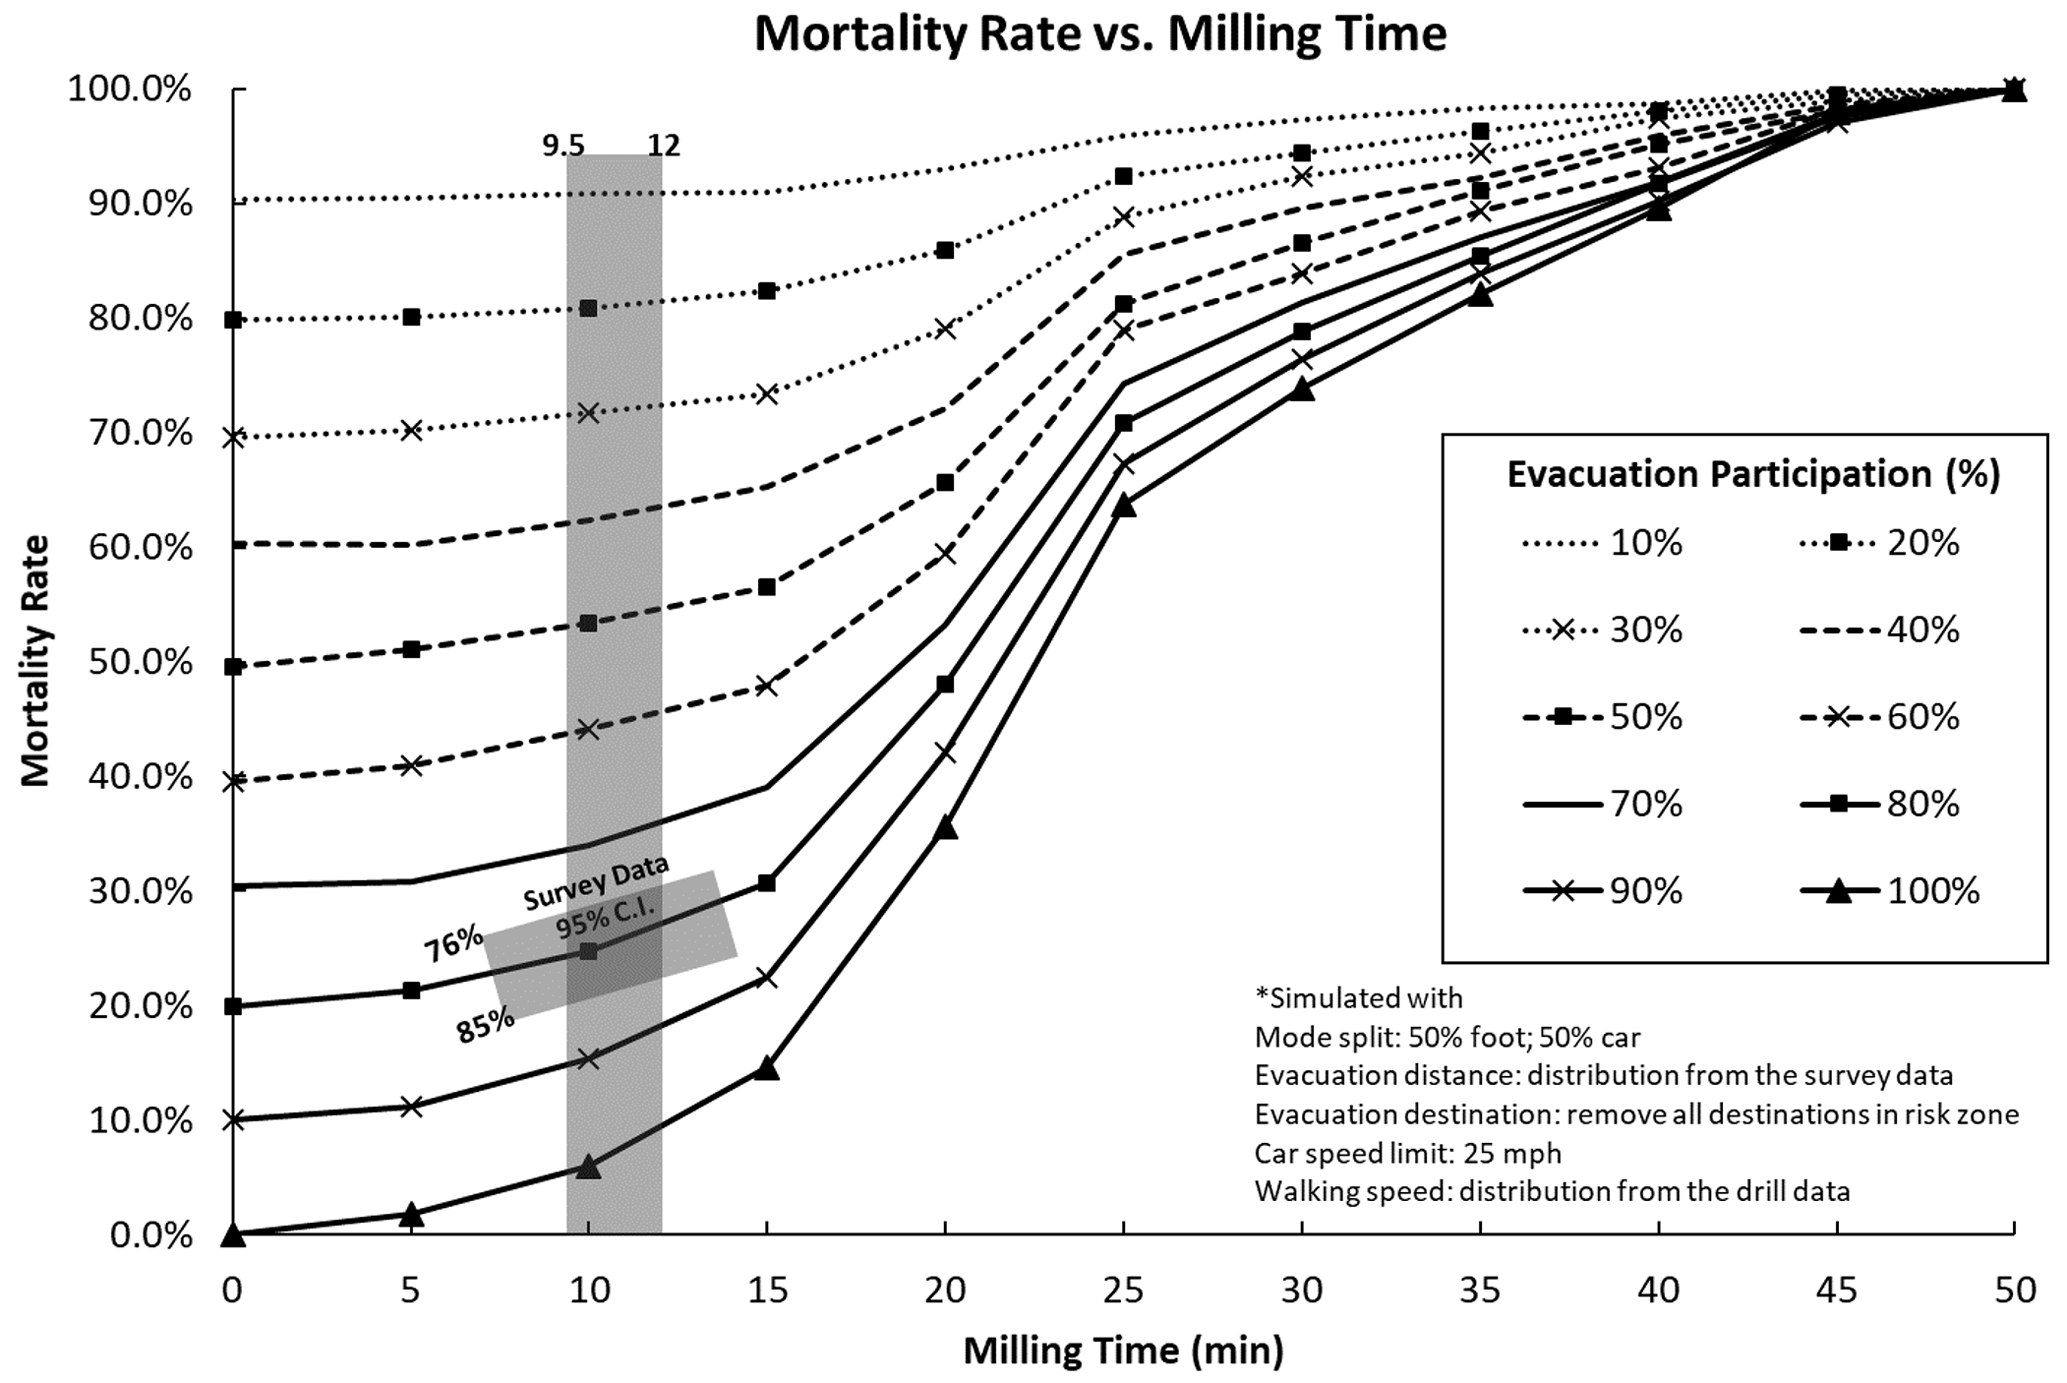
Figure 6Estimated mortality rate of the inundation zone population as a function of milling time and evacuation participation.
First, the change in the evacuation participation rate shows a smaller impact when milling time increases. For example, there is no decrease in mortality rate when evacuation participation changes from 10 % to 100 % at 50 min of milling time, whereas there is an 88 % mortality rate decrease when evacuation participation changes from 10 % to 100 % at 5 min of milling time. That is, the effect of decreasing milling time depends on the evacuation participation rate.
Second, the curves that represent high evacuation participation rates in Fig. 6 show an “S” shape that indicates the rate of change in mortality is much larger in the middle range of the x axis from 15 to 25 min. Given that the first tsunami wave will arrive on the west side of the Coos Bay peninsula around 15 min after the earthquake, the mortality rate will increase substantially as milling time increases past that threshold. Conversely, when milling time is less than 5 min and 100 % of people decide to evacuate, the curve shows that the mortality rate is extremely low (less than 2 %). Thus, the results indicate that reducing the milling time is an important objective for tsunami preparedness programs, but it will be most effective when the evacuation participation rate is high.
This result confirms the policy of public authorities on the US west coast (WGS, 2021; DOGAMI, 2020; Cal OES, 2021) of emphasizing “Do Not Wait” in their tsunami educational brochures and other outreach products to encourage people to depart as soon as possible after earthquake shaking subsides. Although our simulation findings support this recommendation, gaps remain in the response from local residents. Comparing the survey results of the two variables from Coos Bay (gray areas) with the sensitivity analysis curves shows that the mortality rate is fairly low if based on residents' intended milling time, but it can still be improved by further decreasing milling time and encouraging more people to evacuate. The same holds true for Crescent City, California (Chen et al., 2021).
3.1.2 Mode choice and walking speed
Coastal authorities in the CSZ advise evacuating by foot if possible, not only because of potential traffic congestion but also because the road network is likely to be so disrupted that driving may not be feasible to evacuate from a local tsunami. Of course, roads could be flooded by a distant tsunami for which no earthquake shaking could be felt. However, distant tsunamis such as those from the 1964 Alaska and 2011 Japanese tsunamis will take hours to reach the Oregon coast. Consequently, people will have the option of driving when distant tsunamis threaten. Thus, research is needed to examine authorities' recommendation to evacuate by foot and help emergency managers decide when to advise pedestrian evacuation instead of vehicular evacuation. This section analyzes the impact of mode choice and walking speed during evacuation from a local tsunami and answers the following question. Can walking beat driving? If so, in what situations?
Figure 7 shows how the choice of walking speed and mode influence tsunami mortality estimates. As walking speed increases beyond 1 m s−1, the estimated mortality rate decreases as the walking percentage increases. Conversely, as walking speed decreases below 1 m s−1, the estimated mortality rate decreases as fewer people choose to walk. This result indicates that if everyone can walk faster than 1 m s−1, it is beneficial for more people to evacuate on foot. Given that 0.91 m s−1 is a slow walking speed and 1.22 m s−1 is the threshold for a moderate walking speed for unimpaired adults (Knoblauch et al., 1996; Langlois et al., 1997; Wood and Schmidtlein, 2012; Fraser et al., 2014), it follows that evacuating on foot is better than evacuating by car if people can walk faster than the threshold for a slow walking speed. This finding also implies that if people who can walk faster than 1 m s−1 choose to walk, road network capacity can be saved for mobility-impaired people so they can avoid traffic congestion during their evacuation. This is consistent with the finding that 30 % evacuation by car and 70 % evacuation by foot is the critical threshold for tsunami evacuation in Seaside (Mostafizi et al., 2019b). Similarly, vehicular traffic capacity can be saved for those 30 % of the risk area population so they can reach safety in time. However, the following question remains. Who should evacuate by car? Even though our finding suggests that most unimpaired people should walk to save traffic capacity for the vulnerable population, risk area residents may behave differently. The survey results show that only 21 % of the respondents (95 % confidence interval (C.I.): 16 %–27 %) expect to evacuate by foot in Coos Bay (Chen et al., 2021), even though Oregon authorities encourage everyone to do so (DOGAMI, 2020). It is unclear whether this disparity is due to people not having received this recommendation or if they have received it and have chosen not to comply with it.
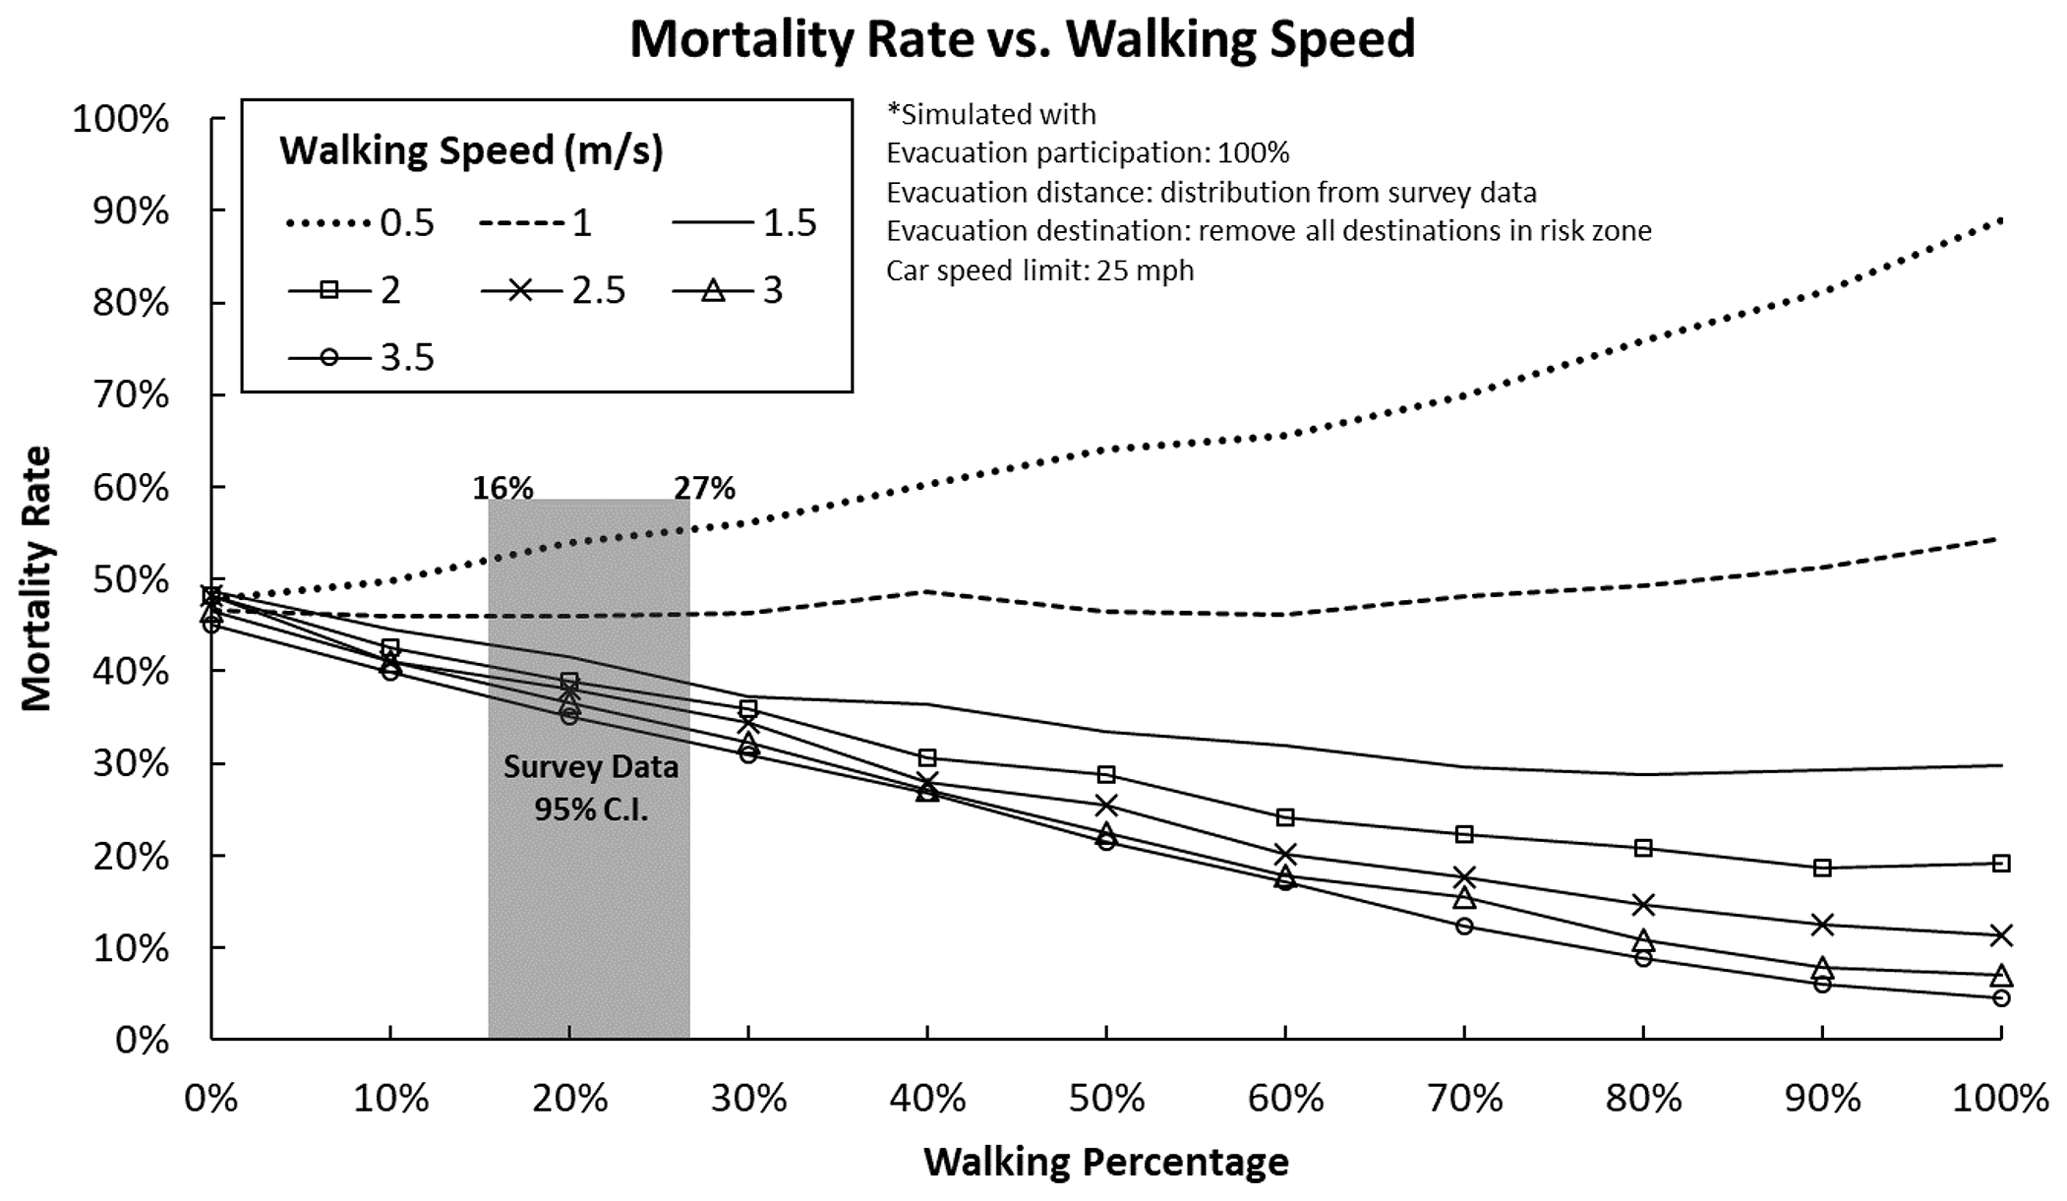
It should be noted that the results shown in Fig. 7 describe the overall picture of evacuation in Coos Bay, but the situation may be different for people living in unique areas that are a long distance from safety, so smaller-scale ABMS or BtW analyses are needed. However, given that the high-ground spine in the middle of the Coos Bay peninsula provides a nearby evacuation destination, few people are likely to be in that situation.
3.1.3 Other variables and combinations of variables
Many variables may vary during the evacuation, and local authorities need to prioritize resources by deciding which variables or combinations of variables have the greatest impact on expected mortalities. Figure 8 shows the impact on the mortality rate of variation in the plausible range of single and multiple variables. The estimated mortality rate for the Coos Bay inundation zone is just over 57 % if all of the variables are at their most probable values (the vertical line in the center of the figure) and the bottom bar shows that there is almost no variation in mortality rate as car speed varies from its plausible lower bound (15 mph; 1 mph = 1.61 km h−1) to its plausible upper bound (35 mph), whereas it ranges from 45 %–85 % if milling time ranges from 0–20 min. However, the results show that variation in milling time and evacuation decision have the greatest impact on expected mortality when these variables are analyzed individually. This result is consistent with the discussion for Figs. 6 and 7 and previous simulation research (Mas et al., 2013; Mostafizi et al., 2019b). Variation in distance to destination also has a relatively large impact range. Specifically, the lowest mortality occurs when evacuees choose the closest destination and increases when they choose farther destinations. This is because agents tend to spend more time traveling on the roads within the inundation area when they choose farther destinations. This is especially true for residents living on the west coastal shoreline where the Cape Arago Highway stretches along the shoreline in the inundation zone as the only major road to connect this area to other regions in Coos Bay. When a tsunami strikes, some people who lack knowledge about the inundation area and first-wave arrival time may travel on this highway to seek safety farther inland. We observed this “overshooting” behavior in the survey data from both Coos Bay and Crescent City (Chen et al., 2021). The maximum car speed has the lowest impact (2 % on the mortality rate) of all variables, which is consistent with findings from Mostafizi et al. (2019b) showing the impact range of max car speed is about 2.5 percentage points from 15–35 mph. This finding confirms that driving travel speed is not determined by the maximum speed one can drive at any moment but, rather, by overall road capacity and traffic conditions, which are well-described in traffic flow theory.
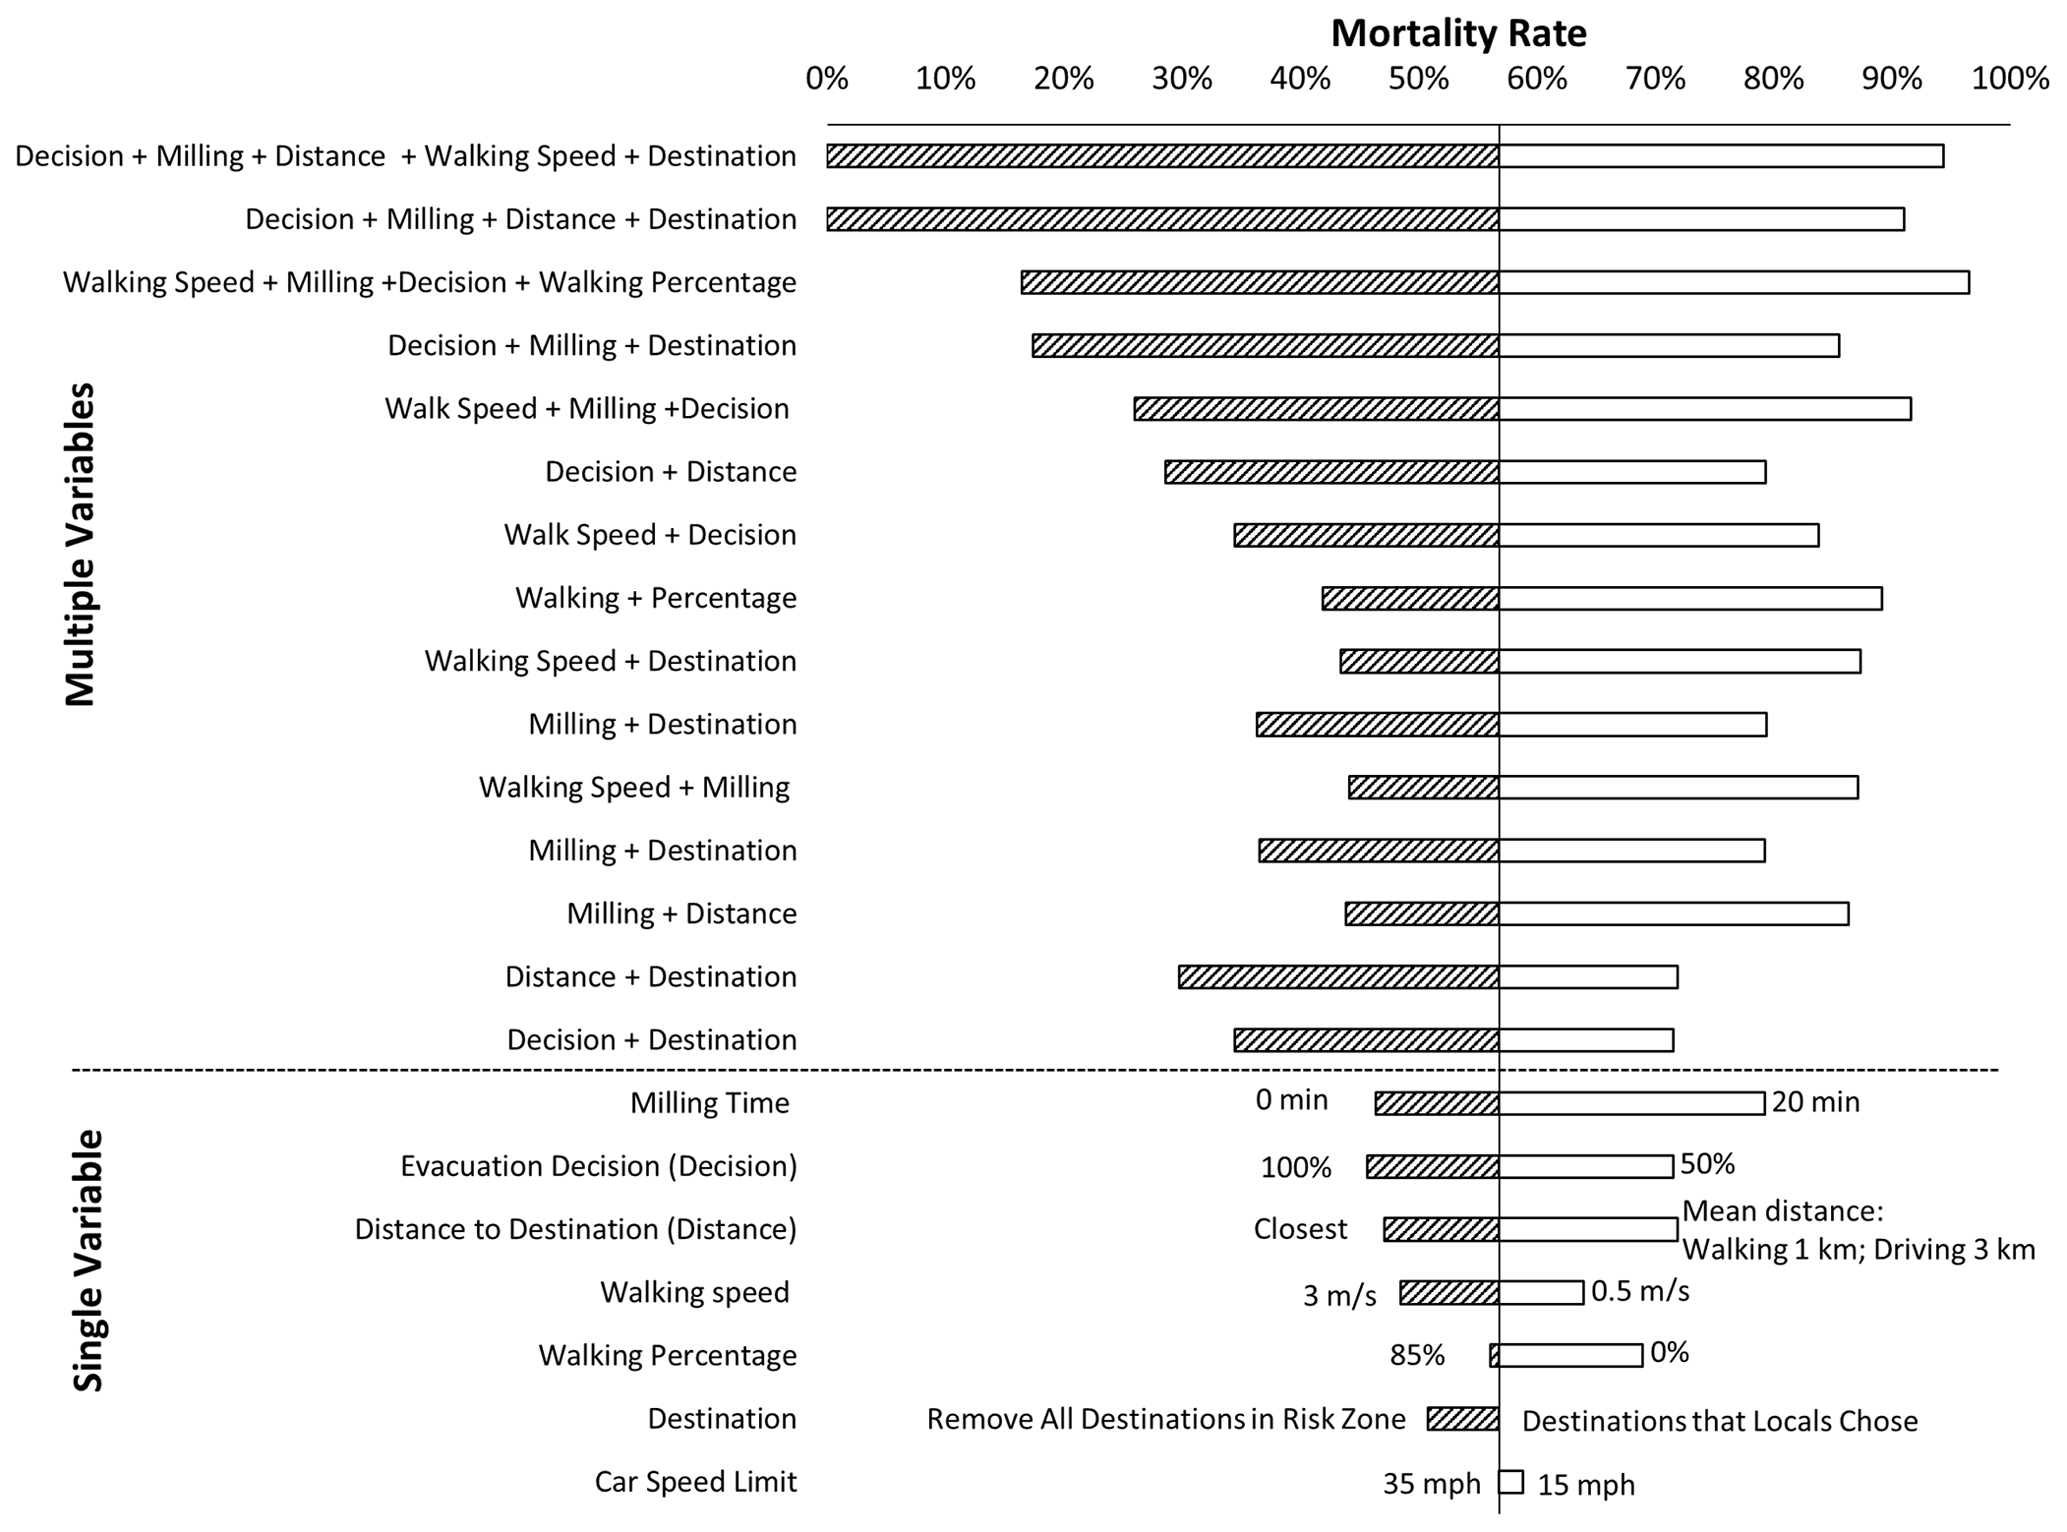
The upper panel in Fig. 8 shows the impact range of simultaneously changing two or more variables to their lowest plausible levels. Although decision + distance and walking speed + decision have the largest ranges of impact for any pair of variables, there is a similar impact range for other pairs. However, the results show even greater reductions in mortality estimates when more than two variables are at their lowest plausible levels. For example, when optimizing evacuation participation and milling time and removing destinations in the inundation zone, the estimated mortality rate shrinks to less than 20 %. When optimizing evacuation participation and milling time and choosing the closest destinations outside of the inundation zone (the bar second to the top), the results show that almost all residents can be saved. Moreover, increasing walking speed from 1.3 to 5 m s−1 in addition to four other factors (the top bar) produces a similar result. This result indicates that even evacuees who walk slowly are very likely to reach safety in time if they leave immediately for a destination outside of the inundation zone by the shortest route. Local authorities should emphasize this finding when deciding what information to communicate in their tsunami preparedness programs.
3.2 Scenario 2: considering network disruption when only walking is available
This section analyzes how network disruptions impact tsunami mortalities when walking is the only option due to road network disruption of the type described in Sect. 2.3.3. Three scenarios are included in this analysis: (1) when areas with at least moderate landslide-liquefaction susceptibility are disrupted, (2) when only areas with at least high landslide-liquefaction susceptibility are disrupted, and (3) when there is no network disruption.
As Fig. 9 indicates, there is a nonlinear decrease in estimated mortality as walking speed increases for all three scenarios. That the slopes of the lines decrease as walking speed increases indicates that the marginal effect of changing walking speed on estimated mortality is larger in the lower part of the range. For example, an increase from 0.5 m s−1 (slow walk) to 1 m s−1 (normal walk) would yield a 24 percentage point decrease in estimated mortality. However, when areas of the road network with at least moderate susceptibility are disrupted, the model shows an increase of 9 percentage points in estimated mortality for all walking speeds in the 0.25–1.5 m s−1 range, compared with the results for no disruption. When only areas with a high level of susceptibility are disrupted, there is only a slight decrease in estimated mortality, compared with the results for moderate disruption. When walking speed increases to 1.5 m s−1 (fast walk), the impact of network disruption is minimal and almost all people can successfully evacuate. Previous research on Seaside (Wang et al., 2016) found a similar decrease to the one shown in Fig. 9. In their study, estimated mortality decreased to zero when walking speed increased to 2 m s−1 when there was no disruption. This similarity suggests that similar results would be found in communities whose inundation zones have similarly ready access to high ground.

The results from the ABMS is consistent with the results from the BtW model established for Coos Bay (Gabel et al., 2019) with slight differences shown in Fig. 9. The similarity between the two models is likely due to the similar input parameters. For example, the survey data from Coos Bay suggest a gamma distribution (α=1.66, β=6.49) to model milling time with mean of 10.77 min; this distribution is used in the ABMS to define agents' milling time, whereas the BtW model assumes a 10 min fixed milling time (Gabel et al., 2019). The slight differences between the two results are also due to the inputs of the two models: the parameters are stochastic in the ABMS but fixed in the BtW model, even though they have similar means. The resulting similarities provide convergent validation of the two models so that jurisdictions can choose either one depending on the purpose of study. The two models should not be considered mutually exclusive; a mixed-method model could be applied to more accurately assess evacuation results (Wood and Schmidtlein, 2012). However, the convergence is based on the assumption that the survey respondents have accurate estimates of the time it takes them to prepare to leave. This is probably the case for those who have “grab and go” kits but is less likely for those who do not. In particular, research on the planning fallacy suggests that the survey data are underestimates for some respondents (Buehler et al., 2010).
Although previous tsunami evacuation simulations have considered the natural environment, built environment, and social system in their models, many data inputs were arbitrary assumptions or adapted from studies of non-emergency situations, so the simulation results may not accurately reflect what would happen in a tsunami evacuation. The present study addressed this limitation by integrating behavior data from community surveys into an ABMS for a CSZ community. Four distinct contributions of this study are the following: (1) using the PADM as a guide for collecting data on people's expected evacuation behavior and the integration of these data into the ABMS, (2) using empirical data from evacuation drills to refine people's evacuation walking speeds, (3) considering the impact of earthquake-caused landslides and liquefaction on tsunami evacuation as a substantial aspect of the multi-hazard situation, and (4) integrating the LCD component from the Wood and Schmidtlein (2012) BtW model – conservation of walking speed by surface terrain and slope. By integrating the natural environment, built environment, and social system, this model incorporates substantial aspects of the real world into a multi-hazard ABMS. The simulation results indicate that milling time and evacuation participation have significant nonlinear impacts on tsunami mortality estimates, which is consistent with Wang et al. (2016). The impact of milling time on the mortality rate shows an “S” curve, so the impact of milling time on estimated mortality varies the most when evacuation participation is highest. When comparing which transportation mode people should take, the model result shows that more people can reach safety in time when they choose to walk and are able to walk faster than 1 m s−1 (slow walk). These findings support an important point for tsunami education programs in CSZ communities. Since the majority of Coos Bay respondents expected to evacuate by car instead of on foot, local authorities need to emphasize the need for pedestrian evacuation in their tsunami education programs.
This study also makes a significant contribution to understanding the impact of different variables on tsunami mortality estimates. Evacuation success is more sensitive to walking speed, milling time, evacuation participation, and choice of the closest safe location than to other variables. Consistent with previous research, car speed has little impact on evacuation results. Further, this study also compared the sensitivities of different combinations of variables. Tsunami mortality estimates are minimized when maximizing evacuation participation, minimizing milling time, and choosing the closest safe destination outside of the inundation zone. Furthermore, to validate this model, this study compared the ABMS results with the BtW model results from Gabel et al. (2019) for Coos Bay. Even though the BtW model relies on a geographical information system rather than an ABMS, this study's preliminary comparison indicates a good match between results from the two models.
Finally, every study has limitations, as does this one. The agent decision and behavior is based on survey data and drill data, rather than data from an actual tsunami evacuation, so the results might not accurately predict the response to an actual tsunami. Future research should investigate (1) the impact of more complex agent–agent interactions, such as leader–follower behaviors and grouping behaviors (Chen et al., 2020), as well as car abandonment (Wang et al., 2016); (2) the impact of building damage from earthquake before tsunami (Gomez-Zapata et al., 2021); (3) authorities' decision and warning dissemination processes for distant tsunamis; and (4) validation of the model using data from actual tsunami evacuations.
The model codes and data used in this paper are available on request from the corresponding author, Chen Chen (chen.chen10@okstate.edu).
CC developed the method and model, performed the analysis, and wrote the paper. CK developed the model and revised the paper. HW and MKL developed the method, performed the analysis, and revised the paper.
The contact author has declared that none of the authors has any competing interests.
Any opinions, findings, and conclusion or recommendations expressed in this research are those of the authors and do not necessarily reflect the view of the funding agency.
Publisher’s note: Copernicus Publications remains neutral with regard to jurisdictional claims in published maps and institutional affiliations.
The authors would like to acknowledge the National Science Foundation for funding. We are also thankful to Laura Gabel and Jonathan Allan from DOGAMI for providing tsunami inundation model, as well as their constructive suggestions and advice. This project was approved by the Oregon State University Human Research Protection Program (HRPP) and Institutional Review Board (IRB) and follows the regulations to protect participants (project reference no. 0489).
This research has been supported by the National Science Foundation (grant nos. CMMI 1563618, CMMI 1826407, and CMMI 1826455).
This paper was edited by Animesh Gain and reviewed by Erick Mas and one anonymous referee.
Bezanson, J., Karpinski, S., Shah, V. B., and Edelman, A.: Julia: A Fast Dynamic Language for Technical Computing, arXiv [preprint], arXiv:1209.5145, 24 September 2012. a
Buehler, R., Peetz, J., and Griffin, D.: Finishing on time: When do predictions influence completion times?, Organ. Behav. Hum. Dec., 111, 23–32, https://doi.org/10.1016/j.obhdp.2009.08.001, 2010. a
Burns, W. J., Mickelson, K. A., and Madin, I. P.: Landslide Susceptibility Overview Map of Oregon, Oregon Department of Geology and Mineral Industries, Tech. Rep. REPORT O-16-02, https://www.oregongeology.org/pubs/ofr/p-O-16-02.htm (last access: 4 May 2021), 2016. a
Cal OES: How to Survive a Tsunami, California Governor's Office of Emergency Services, https://www.conservation.ca.gov/cgs/Documents/Tsunami/How-to-Survive-a-Tsunami.pdf, last access: 13 May 2021. a, b
Chen, C., Buylova, A., Chand, C., Wang, H., Cramer, L. A., and Cox, D. T.: Households’ intended evacuation transportation behavior in response to earthquake and tsunami hazard in a Cascadia Subduction Zone city, Transp. Res. Record, 2674, 99–114, https://doi.org/10.1177/0361198120920873, 2020. a, b
Chen, C., Lindell, M. K., and Wang, H.: Tsunami preparedness and resilience in the Cascadia Subduction Zone: A multistage model of expected evacuation decisions and mode choice, Int. J. Disast. Risk Re., 59, 102244, https://doi.org/10.1016/j.ijdrr.2021.102244, 2021. a, b, c, d, e, f, g, h
Chen, X. and Zhan, F. B.: Agent-based modelling and simulation of urban evacuation: relative effectiveness of simultaneous and staged evacuation strategies, J. Oper. Res. Soc., 59, 25–33, https://doi.org/10.1057/palgrave.jors.2602321, 2008. a, b
CLW: Geographic Features of the Coos Estuary and Lower Coos Watershed, The Communities, Lands & Waterways Data Source, http://www.partnershipforcoastalwatersheds.org/wordpress/wp-content/uploads/2015/08/FINAL-Geographic-Features-Data-Summary.pdf (last access: 4 December 2020), 2015. a
Connor, D.: Outreach assessment: How to implement an effective tsunami preparedness outreach program, State of Oregon Department of Geology and Mineral Industries Open File Report OFR O-05-10, Nature of the Northwest Information Center, Portland, OR, https://www.oregongeology.org/pubs/ofr/O-05-10_onscreen.pdf (last access: 14 January 2021), 2005. a
Cramer, L., Cox, D. T., and Wang, H.: Preparing for The Really Big One: The Importance of Understanding the Local Culture of Resiliency, in: Coastal Heritage and Cultural Resilience, Springer Press, New York, NY, 243–264, ISBN: 978-3-319-99025-5, 2018. a
Dawson, R. J., Peppe, R., and Wang, M.: An agent-based model for risk-based flood incident management, Nat. Hazards, 59, 167–189, https://doi.org/10.1007/s11069-011-9745-4, 2011. a, b
DOGAMI: Larger-Extent Evacuation Brochures, State of Oregon Department of Geology and Mineral Industries, https://www.oregongeology.org/tsuclearinghouse/pubs-evacbro.htm, last access: 30 November 2020. a, b, c, d
Franczyk, J. J., Burns, W. J., and Calhoun, N. C.: Statewide Landslide Information Database for Oregon (SLIDO), Release 4.0, Oregon Department of Geology and Mineral Industries, Tech. Rep. ORS 516.030, https://www.oregongeology.org/slido/data.htm (last access: 5 April 2021), 2019. a, b
Fraser, S. A., Wood, N. J., Johnston, D. M., Leonard, G. S., Greening, P. D., and Rossetto, T.: Variable population exposure and distributed travel speeds in least-cost tsunami evacuation modelling, Nat. Hazards Earth Syst. Sci., 14, 2975–2991, https://doi.org/10.5194/nhess-14-2975-2014, 2014. a
Gabel, L. L. S., O’Brien, F. E., Bauer, J. M., and Allan, J. C.: Tsunami evacuation analysis of communities surrounding the Coos Bay estuary: Building community resilience on the Oregon coast, Oregon Department of Geology and Mineral Industries, Tech. Rep. O-19-07, https://www.oregongeology.org/pubs/ofr/p-O-19-07.htm (last access: 5 April 2021), 2019. a, b, c, d, e, f, g, h, i
Gilbert, N.: Agent-Based Models (Quantitative Applications in the Social Sciences), SAGE Publication Ltd, ISBN: 978-1-4129-4964-4, 2007. a
Gomez-Zapata, J. C., Brinckmann, N., Harig, S., Zafrir, R., Pittore, M., Cotton, F., and Babeyko, A.: Variable-resolution building exposure modelling for earthquake and tsunami scenario-based risk assessment: an application case in Lima, Peru, Nat. Hazards Earth Syst. Sci., 21, 3599–3628, https://doi.org/10.5194/nhess-21-3599-2021, 2021. a
Google: Google Earth, https://www.google.com/earth/versions/, last access: 4 May 2021. a
Gwynne, S., Galea, E. R., Owen, M., Lawrence, P. J., and Filippidis, L.: A review of the methodologies used in evacuation modelling, Fire Mater., 23, 383–388, 1999. a
Hart, P., Nilsson, N., and Raphael, B.: A Formal Basis for the Heuristic Determination of Minimum Cost Paths, IEEE T. Syst. Sci. Cyb., 4, 100–107, https://doi.org/10.1109/TSSC.1968.300136, 1968. a
Karon, J. and Yeh, H.: Comprehensive Tsunami Simulator for Cannon Beach, Oregon, City of Cannon Beach, Tech. rep., https://www.ci.cannon-beach.or.us/sites/default/files/fileattachments/demo_emergency_management/page/18691/cannon-beach-tsunami-final-report-may-2011.pdf (last access: 23 April 2021), 2011. a, b
Knoblauch, R. L., Pietrucha, M. T., and Nitzburg, M.: Field studies of pedestrian walking dpeed and start-up time, Transp. Res. Record, 1538, 27–38, https://doi.org/10.1177/0361198196153800104, 1996. a, b
Langlois, J. A., Keyl, P. M., Guralnik, J. M., Foley, D. J., Marottoli, R. A., and Wallace, R. B.: Characteristics of older pedestrians who have difficulty crossing the street, Am. J. Public Health, 87, 393–397, https://doi.org/10.2105/AJPH.87.3.393, 1997. a
Lindell, M. K.: Communicating imminent risk, in: Handbooks of sociology and social research, 2nd edn., edited by: Rodríguez, H., Donner, W., and Trainor, J., Springer, New York, 449–477, ISBN: 978-3-319-63253-7, 2018. a
Lindell, M. K. and Perry, R. W.: Behavioral foundations of community emergency planning, Hemisphere Publishing Corp, Washington, DC, US, xi, 309 pp., ISBN: 978-0-89116-620-7, 1992. a
Lindell, M. K. and Perry, R. W.: Theoretical modifications and additional evidence: the protective action decision model, Risk Anal., 32, 616–632, https://doi.org/10.1111/j.1539-6924.2011.01647.x, 2012. a, b, c
Lindell, M. K. and Prater, C. S.: Critical Behavioral Assumptions in Evacuation Time Estimate Analysis for Private Vehicles: Examples from Hurricane Research and Planning, J. Urban Plan. D., 133, 18–29, https://doi.org/10.1061/(ASCE)0733-9488(2007)133:1(18), 2007. a
Lindell, M. K., Prater, C. S., Gregg, C. E., Apatu, E. J., Huang, S.-K., and Wu, H. C.: Households' immediate responses to the 2009 American Samoa earthquake and tsunami, Int. J. Disast. Risk Re., 12, 328–340, https://doi.org/10.1016/j.ijdrr.2015.03.003, 2015. a
Lindell, M. K., Murray-Tuite, P., Wolshon, B., and Baker, E. J.: Large-Scale Evacuation: The Analysis, Modeling, and Management of Emergency Relocation from Harzardous Areas, Routledge, p. 22, 2019. a, b, c, d, e
Madin, I. P. and Burns, W. J.: Ground motion, ground deformation, tsunami inundation, coseismic subsidence, and damage potential maps for the 2012 Oregon Resilience Plan for Cascadia Subduction Zone Earthquakes, Tech. Rep. REPORT O-13-06, https://www.oregongeology.org/pubs/ofr/p-O-13-06.htm (last access: 4 May 2021), 2013. a, b
Mas, E., Suppasri, A., Imamura, F., and Koshimura, S.: Agent-based simulation of the 2011 Great East Japan Earthquake/Tsunami evacuation: An integrated model of tsunami inundation and evacuation, Journal of Natural Disaster Science, 34, 41–57, https://doi.org/10.2328/jnds.34.41, 2012. a, b, c, d, e
Mas, E., Adriano, B., and Koshimura, S.: An integrated simulation of tsunami hazard and human evacuation in La Punta, Peru, Journal of Disaster Research, 8, 285–295, https://doi.org/10.20965/jdr.2013.p0285, 2013. a, b, c, d, e
Mori, N., Takahashi, T., Yasuda, T., and Yanagisawa, H.: Survey of 2011 Tohoku earthquake tsunami inundation and run-up, Geophys. Res. Lett., 38, L00G14, https://doi.org/10.1029/2011GL049210, 2011. a
Mostafizi, A., Wang, H., Cox, D., Cramer, L. A., and Dong, S.: Agent-based tsunami evacuation modeling of unplanned network disruptions for evidence-driven resource allocation and retrofitting strategies, Nat. Hazards, 88, 1347–1372, https://doi.org/10.1007/s11069-017-2927-y, 2017. a
Mostafizi, A., Wang, H., Cox, D., and Dong, S.: An agent-based vertical evacuation model for a near-field tsunami: Choice behavior, logical shelter locations, and life safety, Int. J. Disast. Risk Re., 34, 467–479, https://doi.org/10.1016/j.ijdrr.2018.12.018, 2019a. a, b, c, d, e
Mostafizi, A., Wang, H., and Dong, S.: Understanding the multimodal evacuation behavior for a near-field tsunami, Transp. Res. Record, 2673, 480–492, https://doi.org/10.1177/0361198119837511, 2019b. a, b, c, d
Nagarajan, M., Shaw, D., and Albores, P.: Disseminating a warning message to evacuate: A simulation study of the behaviour of neighbours, Eur. J. Oper. Res., 220, 810–819, https://doi.org/10.1016/j.ejor.2012.02.026, 2012. a
Oregon Geospatial Enterprise Office: Oregon 10m Digital Elevation Model (DEM), Oregon Spatial Data Library [data set], https://spatialdata.oregonexplorer.info/geoportal/details;id=7a82c1be50504f56a9d49d13c7b4d9aa (last access: 4 May 2021), 2017. a
OSM: OpenStreetMap, https://www.openstreetmap.org/, last access: 3 May 2021. a
Priest, G. R., Witter, R. C., Zhang, Y. J., Wang, K., Goldfinger, C., Stimely, L. L., English, J. T., Pickner, S. G., Hughes, K. L. B., Wille, T. E., and Smith, R. L.: Tsunami inundation scenarios for Oregon, Oregon Department of Geology and Mineral Industries, Tech. Rep. Open_file Report O-13-19, https://www.oregongeology.org/pubs/ofr/O-13-19.pdf (last access: 20 August 2021), 2013. a
Priest, G. R., Zhang, Y., Witter, R. C., Wang, K., Goldfinger, C., and Stimely, L.: Tsunami impact to Washington and northern Oregon from segment ruptures on the southern Cascadia Subduction Zone, Nat. Hazards, 72, 849–870, https://doi.org/10.1007/s11069-014-1041-7, 2014. a
Raskin, J. and Wang, Y.: Fifty-Year Resilience Strategies for Coastal Communities at Risk for Tsunamis, Nat. Hazards Rev., 18, B4016003, https://doi.org/10.1061/(ASCE)NH.1527-6996.0000220, 2017. a
Sassa, S. and Takagawa, T.: Liquefied gravity flow-induced tsunami: first evidence and comparison from the 2018 Indonesia Sulawesi earthquake and tsunami disasters, Landslides, 16, 195–200, https://doi.org/10.1007/s10346-018-1114-x, 2019. a
Schmidtlein, M. C. and Wood, N. J.: Sensitivity of tsunami evacuation modeling to direction and land cover assumptions, Appl. Geogr., 56, 154–163, https://doi.org/10.1016/j.apgeog.2014.11.014, 2015. a
Soule, R. G. and Goldman, R. F.: Terrain coefficients for energy cost prediction, J. Appl. Physiol., 32, 706–708, https://doi.org/10.1152/jappl.1972.32.5.706, 1972. a, b, c
Tobler, W.: Three Presentations on Geographical Analysis and Modeling: Non-Isotropic Geographic Modeling; Speculations on the Geometry of Geography; and Global Spatial Analysis (93-1), National Center for Geographic Information and Analysis, University of California at Santa Barbara, 26 pp., https://escholarship.org/uc/item/05r820mz (last access: 26 October 2020), 1993. a, b, c
Treiber, M., Hennecke, A., and Helbing, D.: Congested traffic states in empirical observations and microscopic simulations, Phys. Rev. E, 62, 1805–1824, https://doi.org/10.1103/PhysRevE.62.1805, 2000. a
United State Census Bureau: QuickFacts: United States; Crescent City city, California; North Bend city, Oregon; Coos Bay city, Oregon, Tech. rep., https://www.census.gov/quickfacts/fact/table/US,crescentcitycitycalifornia,northbendcityoregon,coosbaycityoregon/PST045219, last access: 4 December 2020. a, b, c
Wang, H., Mostafizi, A., Cramer, L. A., Cox, D., and Park, H.: An agent-based model of a multimodal near-field tsunami evacuation: Decision-making and life safety, Transportat. Res. C Emerg., 64, 86–100, https://doi.org/10.1016/j.trc.2015.11.010, 2016. a, b, c, d, e, f, g, h, i, j, k, l, m
WGS: Tsunami Hazards in Washington State, Washtington Geological Survey, Washington State Department of Natural Resources, Tech. rep., https://www.dnr.wa.gov/publications/ger_tsunami_hazards_brochure.pdf, last access: 13 May 2021. a, b
Witter, R. C., Zhang, Y., Wang, K., Priest, G. R., Goldfinger, C., Stimely, L. L., English, J. T., and Ferro, P. A.: Simulating tsunami inundation at Bandon, Coos County, Oregon, using hypothetical Cascadia and Alaska earthquake scenarios, Oregon Department of Geology and Mineral Industries, Tech. Rep. Special Paper 43, https://www.oregongeology.org/tsuclearinghouse/resources/sp-43/SP-43_onscreen144dpi.pdf (last access: 20 August 2021), 2011. a
Wood, M. M., Mileti, D. S., Bean, H., Liu, B. F., Sutton, J., and Madden, S.: Milling and public warnings, Environ. Behav., 50, 535–566, https://doi.org/10.1177/0013916517709561, 2018. a
Wood, N. J. and Schmidtlein, M. C.: Anisotropic path modeling to assess pedestrian-evacuation potential from Cascadia-related tsunamis in the US Pacific Northwest, Nat. Hazards, 62, 275–300, https://doi.org/10.1007/s11069-011-9994-2, 2012. a, b, c, d, e, f, g, h, i, j
Wood, N. J., Jones, J., Spielman, S., and Schmidtlein, M. C.: Community clusters of tsunami vulnerability in the US Pacific Northwest, P. Natl. Acad. Sci. USA, 112, 5354–5359, https://doi.org/10.1073/pnas.1420309112, 2015. a
Youd, T. L. and Perkins, D. M.: Mapping Liquefaction-Induced Ground Failure Potential, J. Geotech. Eng.-ASCE, 104, 433–446, https://doi.org/10.1061/AJGEB6.0000612, 1978. a