the Creative Commons Attribution 4.0 License.
the Creative Commons Attribution 4.0 License.
 | 28 Nov 2023
Effects of web geographic information system (GIS) technology and curriculum approaches on education for disaster risk reduction
Jiali Song
Hiroyuki Yamauchi
Takashi Oguchi
Takuro Ogura
Yosuke Nakamura
Jipeng Wang
Disaster risk reduction education (DRRE) is a strategy to mitigate the harmful effects of disasters. The implementation of DRRE in schools is on the rise, and web geographic information system (GIS) technology in DRRE is becoming increasingly prevalent. However, little knowledge exists about whether students can improve their understanding of disaster risk reduction (DRR) through web GIS technology and which factors affect their learning of web hazard maps. This study has provided materials and curricula for DRR education in Chinese and Japanese high schools and utilized them eight times in the classroom between 2020 and 2022. These classes had three forms of implementation due to the COVID-19 pandemic: online, on-site and online–on-site mixed. The students first answered a pretest. Then they learned about DRR using the explanatory web pages and the web hazard maps by answering quizzes shown on the pages. After that, they answered a posttest and a questionnaire. Most students exhibit improved results after utilizing the digital DRR materials. This improvement is pronounced for the on-site implementations, while the mixed online–on-site implementation proves less effective. The pretest scores for the implementations using local disaster cases are low, but the subsequent improvement is significant. The ability of students to utilize electronic devices affects the learning of GIS-related content rather than other aspects. The daily use of online maps and attention to disaster prevention and mitigation affect the learning of all the materials. Increasing the use of online hazard maps is key to realizing social DRR.
- Article
(4156 KB) - Full-text XML
- BibTeX
- EndNote


Annual disaster losses have been observed to be between ∼ 0.1 % and ∼ 0.5 % of global GDP, and much larger loss potentials currently exist (Pielke, 2019). Disaster risk reduction (DRR) is the concept of reducing the potential impacts or losses that a population or area may face in particular hazards. It includes policies, strategies and sound practices that could lessen the susceptibility to disaster risk of highly vulnerable communities (Reyes et al., 2011). Disaster risk reduction education (DRRE) is also a way to reduce the negative results of disasters (La Longa et al., 2012; Mulyasari et al., 2015). Muñoz et al. (2020) indicate that changes in political administration will halt, interrupt or delay progress if authorities do not genuinely and seriously integrate DRR into education.
The importance of schools regarding DRRE is unquestionable. Schools can channel the knowledge, and thus awareness, of risk in different ways (Bernhardsdottir et al., 2016). Integrating formal and informal DRRE information into schools can reach every home and community, and that learning is sustained for future generations (Petal, 2008), of which formal education is considered the primary way for individuals to acquire knowledge, skills and competencies that can influence their adaptability. It offers not only the spatial thinking skills required to understand early warnings and evacuation plans but also the decision-making ability required to understand and minimize risk (Muttarak and Lutz, 2014; Shiwaku and Fernandez, 2011; United Nations International Strategy for Disaster Reduction (UNISDR), 2015).
Digital learning has evolved from a supplementary teaching aid to an essential component of contemporary pedagogy in the current educational landscape. It provides students with alternative learning pathways and increased learning motivation (Segrave and Holt, 2003; Soroka, 2020; Mishra et al., 2020). In addition, students today are familiar with mobile technologies from an early age and can work with tablets, computers and smartphones. Web geographic information systems (GISs) originate from a combination of web technology and GISs. They are a type of GIS that use web technologies to make geospatial data accessible to the public regardless of whether or not they have background knowledge about GISs. The incorporation of web GIS technology into DRRE efforts has been recognized as valuable by numerous governments, owing to its extensive possibilities. However, it is important to take into consideration that the effective incorporation of this technology is contingent upon the availability and usability of digital tools. The implementation of such measures may present difficulties in regions characterized by a digital divide, particularly in economically disadvantaged nations.
In Indonesia, Ariyanti et al. (2018) developed SIMBAK, a web-based geographic information system for school mapping and disaster mitigation in areas prone to volcanic eruptions. The system identifies schools within disaster-prone areas, providing school profiles and navigation. The feasibility of SIMBAK was assessed through questionnaires distributed to administrative officers, school operators and users. Through its National Disaster Management Agency, the Indonesian government has developed and launched a mobile application called InaRISK Personal to help citizens become more aware of disasters. Sari et al. (2020) evaluated this application's effectiveness for senior high school students, focusing on readability (including response time and accuracy) and overall satisfaction, in comparison with traditional printed disaster maps. The study engaged 361 students from the 11th and 12th grades, employing quasi-experimental methods with pre- and post-questionnaire assessments. They found that the application on mobile devices has provided higher map readability and user satisfaction compared to printed maps. However, such government-developed DRR applications tend to be elaborate in function and complicated for beginners. In Japan, the combination of web GISs and DRR has also received attention in recent years. Uchida et al. (2020) established an ICT-based (information and communication technology-based) disaster prevention and mitigation program in collaboration with Kanagawa Prefecture. The program was implemented in junior high and high schools in 2017 and 2018 and comprised a two-part workshop: town watching using the Disaster Information Tweeting System (DITS) and group discussions employing the Disaster Information Mapping System (DIMS). The workshop engaged 326 participants in activities such as observation of disaster-prone areas and interactive discussions. Post-workshop questionnaires revealed a largely positive reception of the education initiative. Li et al. (2022) explored the integration of ESRI's ArcGIS Online in geography teaching, using the 2021 Zhengzhou torrential rain as a case study in China. The authors applied web GIS functions like smart mapping and 3D web maps to enhance students' spatial thinking and regional cognition. This approach demonstrated the practicality of web GISs in DRRE, offering potential benefits for geography teachers and developers. The study, however, lacked an evaluation of students' feedback to understand learning outcomes.
Shirai et al. (2017) found that electronic maps are suitable for creating hazard maps and help students comprehend hazards. Paper maps have been the essential medium for depicting and understanding geographic information for centuries. Although numerous studies in recent years have demonstrated the benefits of digital maps in DRR education, few have compared the efficacy of web-based maps and paper maps in disaster mitigation education. Song et al. (2022) created online DRR educational materials for Japanese and Chinese high school students using web GISs and geospatial data and compared them with paper hazard maps. According to the surveys, students think that web maps can provide plentiful and accurate information that needs to be included in DRR education. However, some students noted the difficulty in understanding the process of determination of the disaster-affected areas. During the investigation, it was found that the frequency of past use of digital devices and the internet appeared to have a significant influence on learning DRR knowledge using web hazard maps. Only a few orientations exist about whether students can improve their understanding of DRR through GIS technology and what factors can affect students' learning of web hazard maps.
Therefore, this study improved the DRRE materials based on the previous research by Song et al. (2022) and investigates the factors influencing students' use of electronic maps to learn DRR knowledge and how much the materials improve students' understanding of electronic maps and DRR information. The research findings of Song et al. (2022) laid the groundwork for the research in this area. The improvement and in-depth examination in this study is of great importance for increasing educators' and policymakers' awareness and confidence in the use of electronic maps in DRR education. They can better understand the benefits and limitations of electronic maps in DRR education and take the necessary steps to strengthen and promote their application in the classroom. In addition, this study also improves curriculum approaches corresponding to the constructed teaching materials for student practice that can be used in schools and suggests optimal guidelines for future research and applications. For this purpose, pretests, posttests and questionnaire surveys are conducted during the courses.
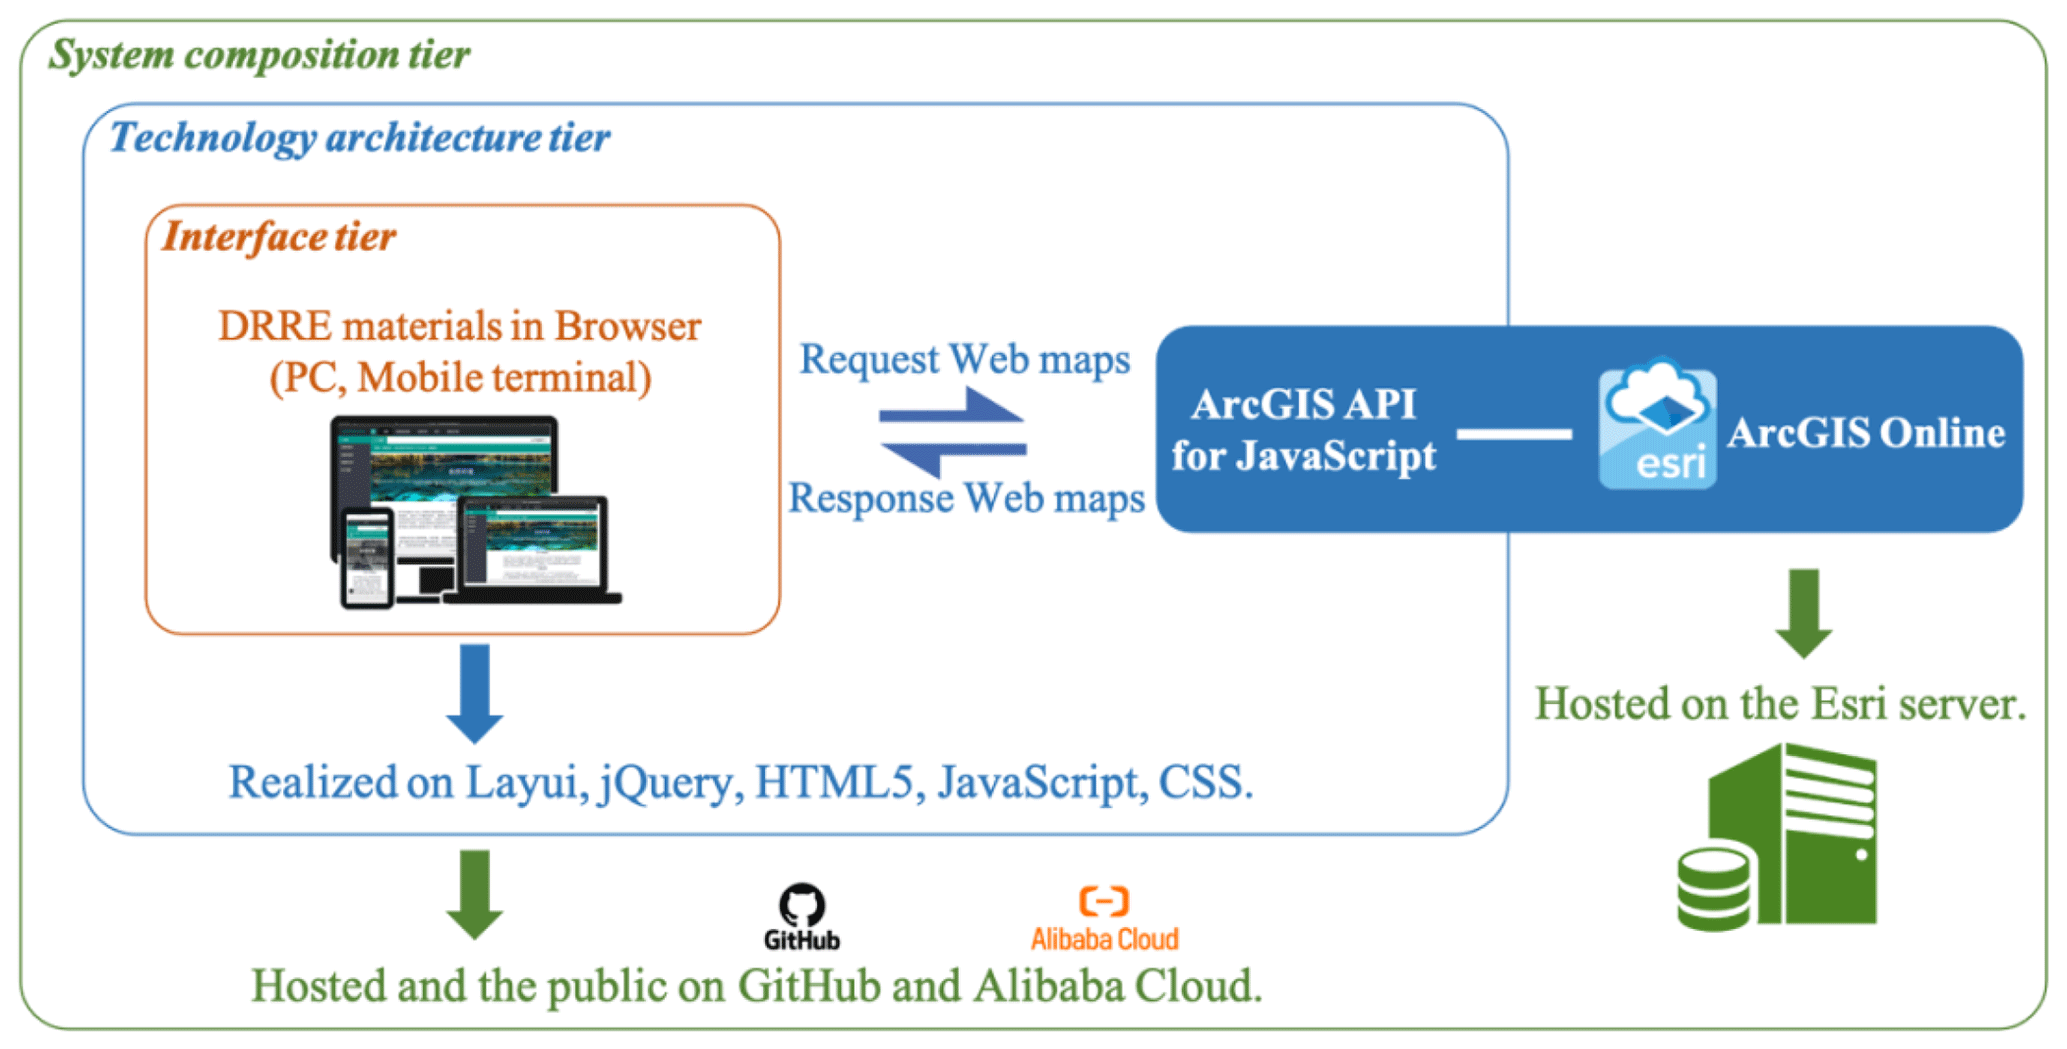
The constructed DRRE materials follow the logical structure shown in Fig. 1. A responsive educational system was built using programming libraries, including HTML5 and jQuery. It looks and works similarly on any device, including mobile phones, tablets and laptop/desktop PCs. The interface used an open-source web user interface front-end framework called Layui (https://layui.dev/, last access: 22 November 2023) that applies the development models of HTML/CSS/JS and is suitable for the rapid development of a tidy web interface with relatively few codes. The maps and layers in the constructed system were arranged using the ESRI ArcGIS API for JavaScript, one of the web GIS tools with the functionality of GIS operations using a simple web browser. The entire website was hosted on Alibaba Cloud, China's largest cloud service provider.
DRR can be systematically infused into education by elaborating its full scope and sequence (Petal, 2008), and general environmental education should be incorporated into disaster education (Tanaka, 2005). Therefore, students need to learn the basics of maps, GISs and the natural environment before learning DRR using hazard maps. The map section mainly introduces some basic knowledge of maps, including their concept, regulation, classification and form (digital and analog). The section about GISs introduces some fundamental knowledge, technology and utilization including map creation. The natural environment section covers topography, climate, rivers, land use and natural disasters. The DRR section explains the use of web hazard maps to learn various types of DRR. It includes the concept of hazard maps and DRR in relation to earthquakes, tsunamis, sediment disasters, volcanic disasters, wind and snow disasters, and floods.
Figure 2 shows the interface of the DRRE materials, with the main menu bar at the top of the page. The bar includes the titles of the four sections, i.e., maps, GIS, natural environment and DRR, with another item entitled “tests and questionnaires”. A user first selects one of these items. A deputy menu bar on the left side of the page displays the sub-menus corresponding to the contents of the selected element. Users can click on the items in the deputy menu bar to open the corresponding sub-page, which is displayed in the middle part of the materials. The tab bar below the main menu bar shows different sub-pages. If the user clicks on another item in the deputy menu bar, a new sub-page with a tab bar will appear, while the previous sub-page is retained behind. A quiz related to the contents of each sub-page is shown at the bottom of the sub-page.
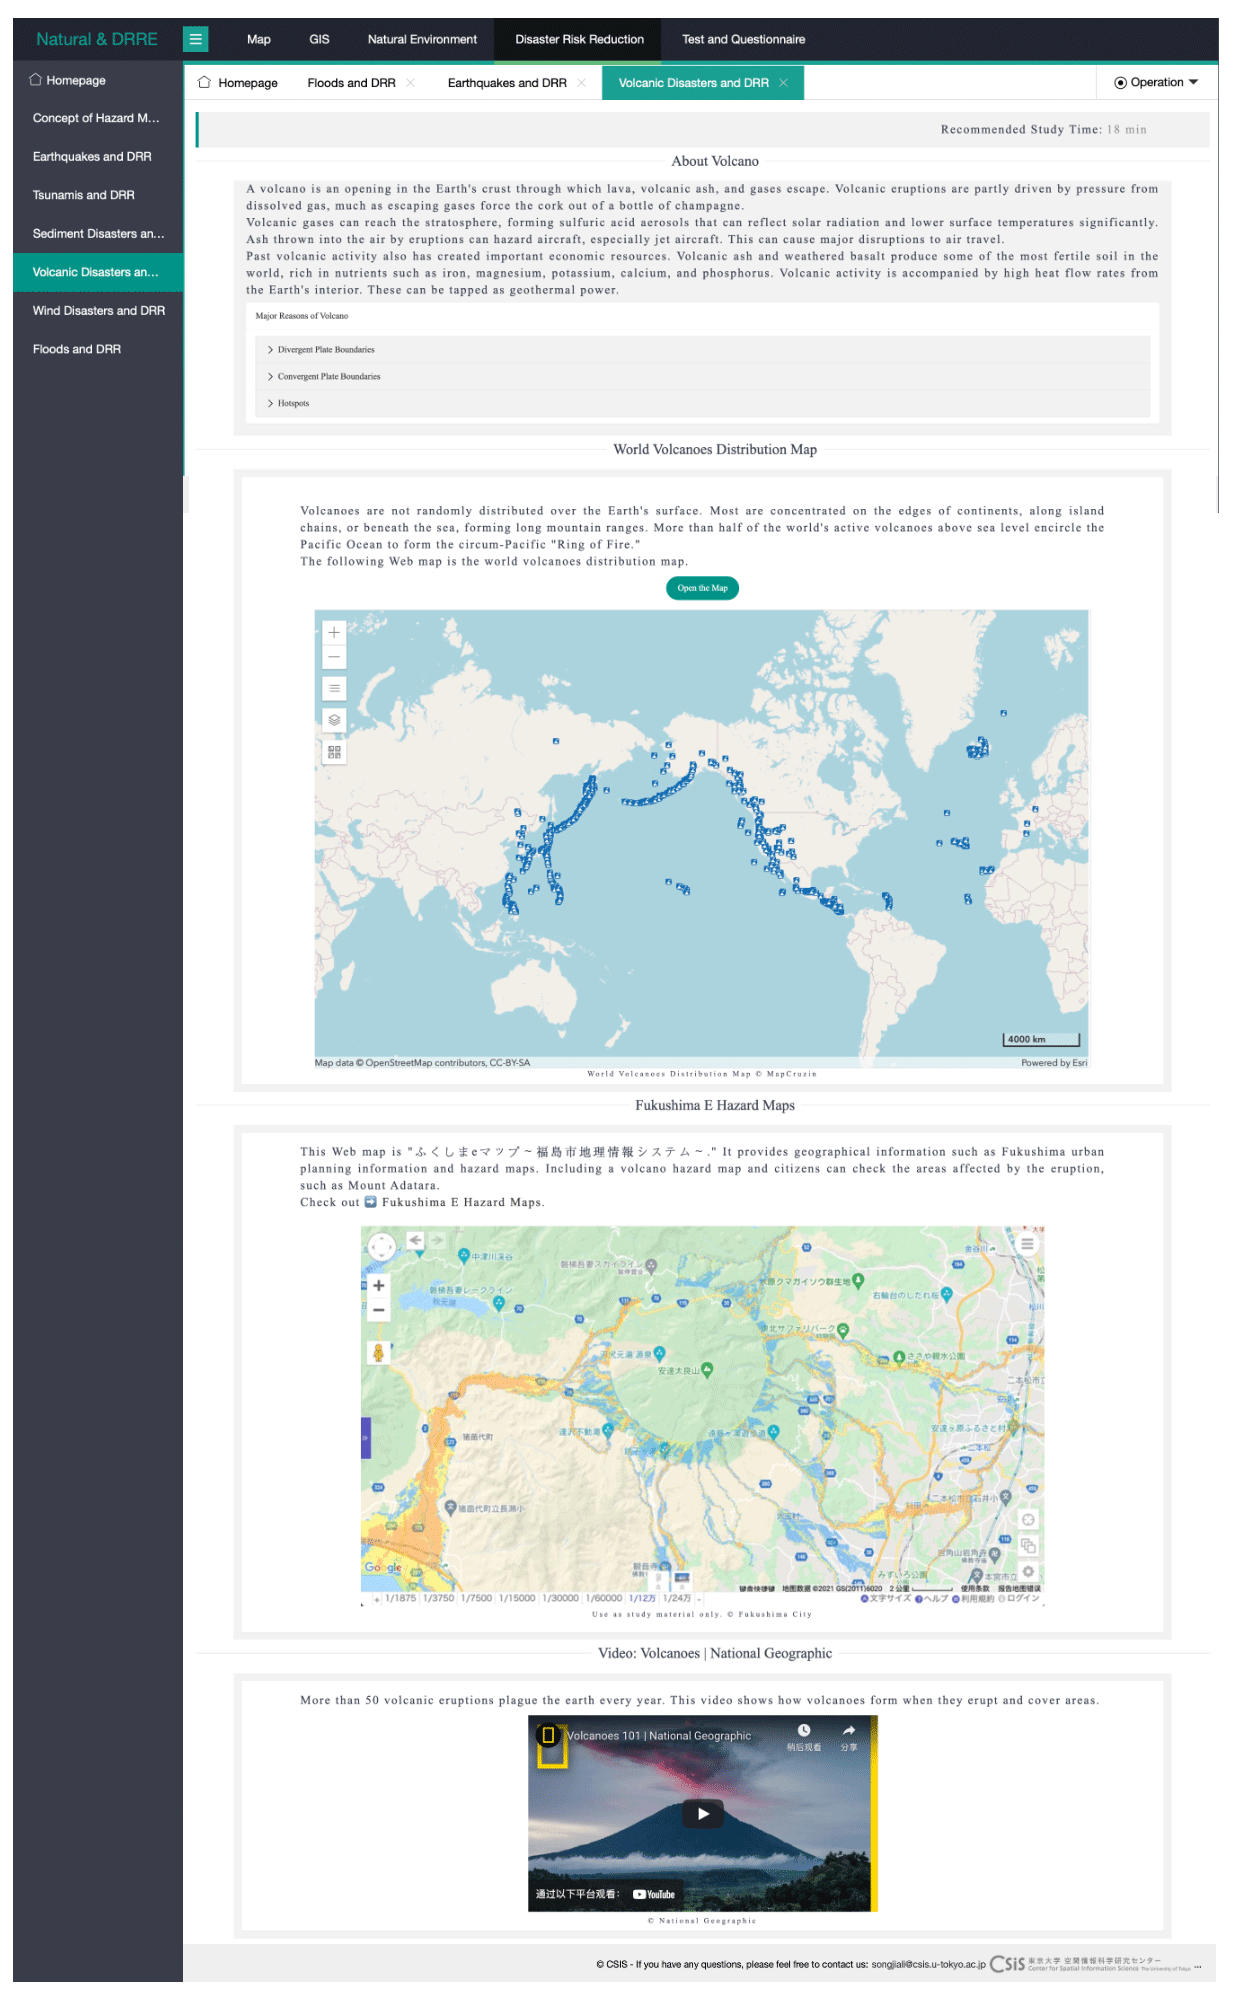
Figure 2Interface of the DRRE materials. This figure translates Chinese or Japanese text to English from the original page (the material URL is http://srdm.net.cn/, last access: 23 November 2023, developed by the first author).
The materials utilize a local server provided by the Center for Spatial Information Science at the University of Tokyo, due to the increased number of access devices during implementations. Users access this server through the domain name in Alibaba Cloud. The number of possible HTTP(s) connections is 240 min−1, and that of Transmission Control Protocol (TCP) connections is 30.
From 2020 to 2022, the materials and curriculum were utilized eight times in high school classes in China and Japan (Table 1). Schools in Jilin, China, and Kanagawa, Japan, frequently experience earthquakes and floods, unlike other pilot schools. The Chinese version of the DRRE materials focused on flood disasters in Jilin Province, whereas the Japanese version addressed the flood disaster in Kanagawa. During the COVID-19 pandemic, three forms of implementation were leveraged: online, on-site and a mixed online–on-site approach. The mixed form, in which students were in classrooms but the instructors taught through conference software, was used in four Japanese high school classes. The program reached 526 students, with 226 participating online, 238 on-site and 62 in mixed online–on-site sessions. Of these, 238 were male, and 288 were female.
Table 1Schools and participants of the implementations.
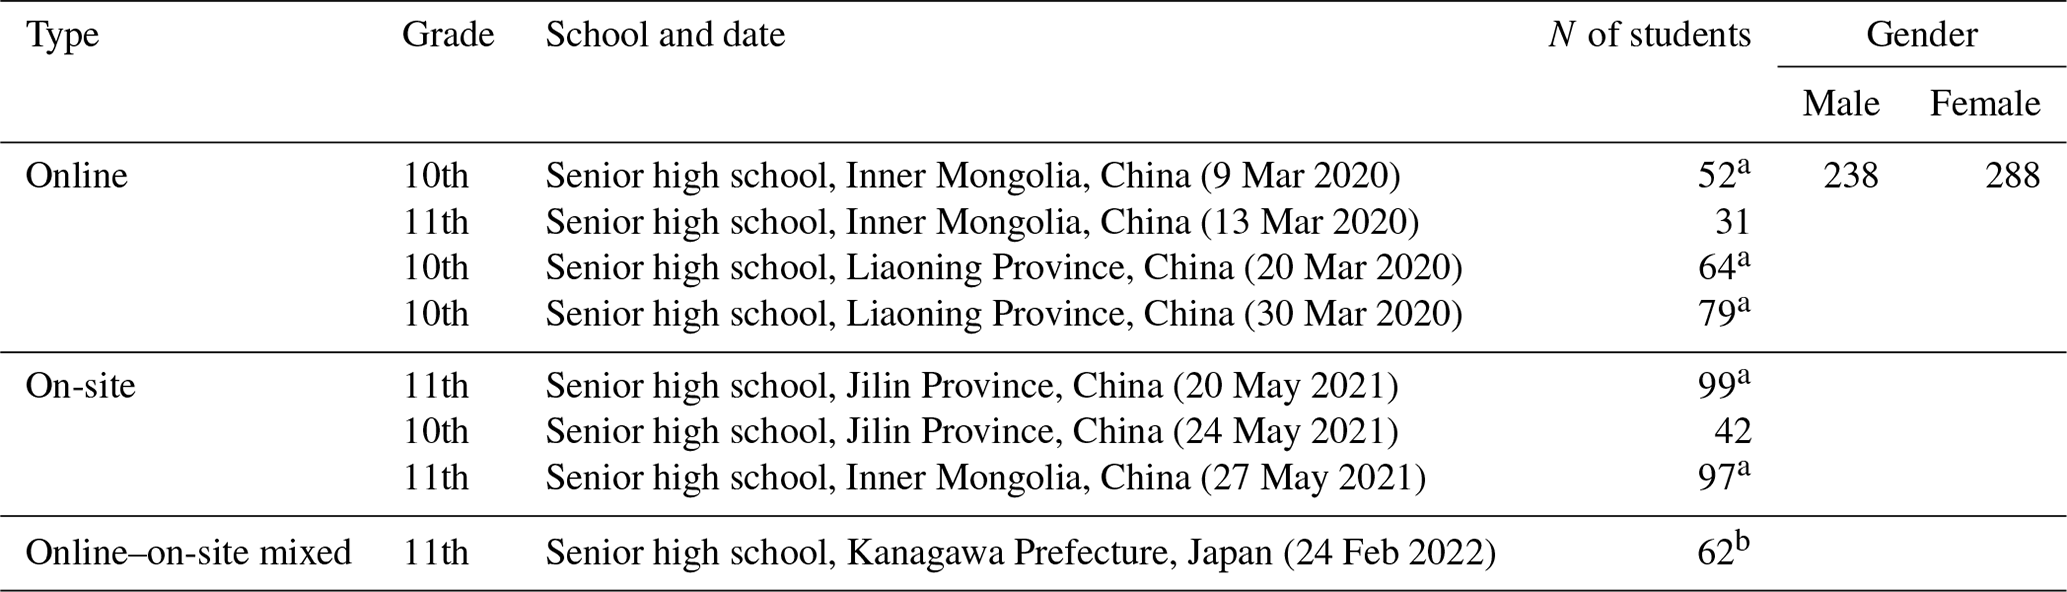
a Implemented in two classes. b Implemented in four classes.
DingTalk was used during the implementations in China. It is a communication and collaboration platform developed by Alibaba Group. After coronavirus cases surged in China, DingTalk's new features for schools include live-streamed classes for up to 300 students and online testing and grading features (QUARTZ, 2020). Most schools in China have been using it for online education. Zoom, another video conferencing tool, was used for the implementation in Japan. Many government agencies, schools and non-profit organizations have chosen it for online lectures, meetings, webinars, etc. (Serhan, 2020). It has been widespread in Japan since the beginning of the pandemic.
Although curriculum details were modified depending on the target class and country, the common aspects were as follows. Each student has one electronic device to use the learning materials. At the beginning of the class, students took a pretest. Then they studied the material and answered quizzes on each tab page. At the end of the class, students answered a posttest and a questionnaire. The intended length of a single class was 90–110 min. However, the on-site implementation in China took 2 class hours, whereas implementations in Japan were shortened to 50 min due to the epidemic. The curriculum consisted of three procedures.
The first procedure. A pretest is conducted to evaluate the students' knowledge. Then a 30 min session is devoted to explaining the contents organized within the main and sub-menu bars of the DRRE materials. The main menu categorizes the content into four primary sections: map, GIS, natural environment and DRR. The subcategories under the map section encompass the concept, rules, types and electronic maps. The GIS section covers basics, related technologies, applications and electronic map creation. The natural environment section elaborates on terrain, climate, rivers, land use and DRR. Lastly, the DRR section delves into specific hazards, such as earthquakes, floods, landslides, volcanoes and winds. The instructors share the screen to demonstrate the use of learning materials during the online implementation. The on-site implementation uses a projected screen to introduce the usage of the materials.
The second procedure. Students freely use the DRRE materials, during which the school teacher and the authors provide guidance to address challenges in utilizing the materials and electronic maps. Most students use mobile phones to participate in the online implementation. Figure 3a shows screen captures sent from Chinese students while they were learning how to operate the materials. Figure 3b shows two photos of the on-site implementations. Students utilized the equipment in a computer room, available in most high schools in China. In China, the use of smartphones in schools is usually not allowed, so unlike online implementations, smartphones were seldom used during on-site implementations. Figure 3c shows photos of the online–on-site mixed implementation in Japan. The author taught online, and the school teacher assisted on-site. Many students used smartphones, which was allowed in the Japanese high school. Some students who did not have smartphones used tablets provided by the school.
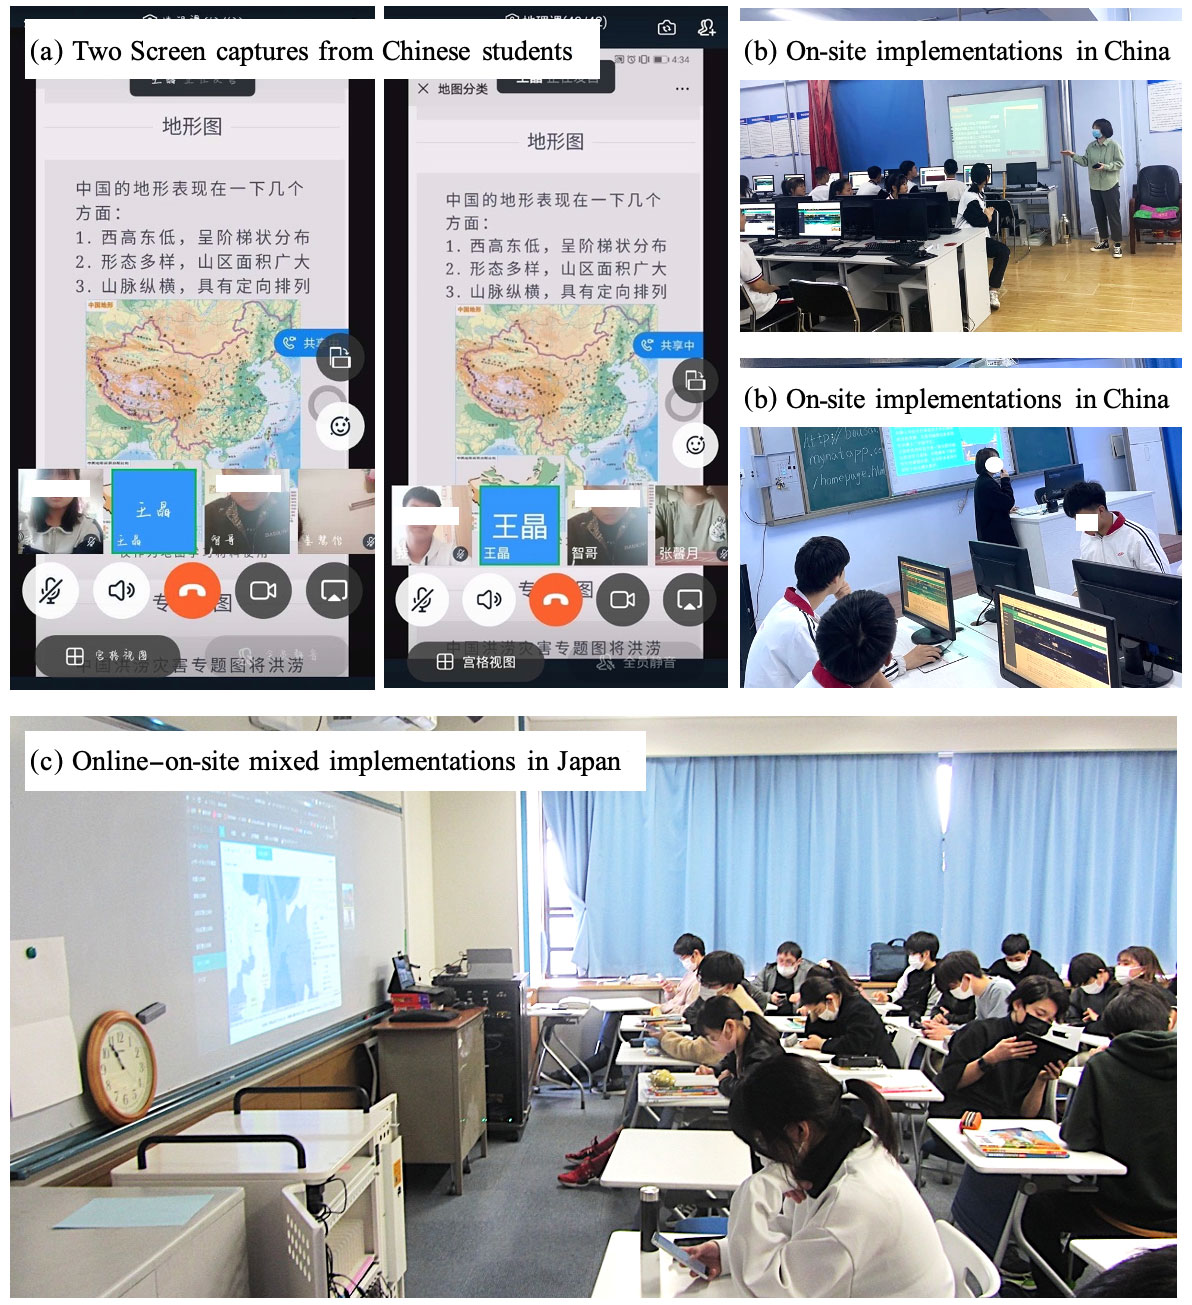
Figure 3Screen captures and photos of three implementation forms in China and Japan (photos taken by the authors; the material URL used in the Fig. 3a is http://srdm.net.cn/, last access: 23 November 2023, developed by the first author).
The third procedure. Students answered a posttest, and the results were compared to those of the pretest. Finally, students were asked to fill out a questionnaire concerning their perceptions of the materials and the curriculum and other information about the students (Table A1).
Among the possible experimental research designs (Fraenkel et al., 1993; QuestionPro, 2022), the pretest–posttest design is prevalent in educational and social science research (Kim and Willson, 2010). This method can validate the experiment in the preliminary research phase and tell the researchers how their intervention will affect the study (VOXCO, 2022). Therefore, a pretest and a posttest evaluate the learning outcomes of students. The questions in these tests were produced based on questions asked in Chinese high school geography textbooks. The effectiveness of this approach was assessed through statistical comparisons between pretest and posttest scores to analyze learning gains. Future studies may extend the research period and incorporate additional quantitative measures for further validation.
Pretest questions consist of five parts (Table A2). The first part is the description of the name and gender. The second part gives two basic questions about maps. The third part asks about GISs and related technologies. The fourth part asks questions about the natural environment, such as topography and rivers in China. The fifth part gives questions about the usage of web hazard maps and disaster-related questions. The contents of the posttest are similar to those of the pretest but somewhat different in most cases, and most questions in the posttest are a bit more difficult than those in the pretest (Table A3). Due to the time constraint of the implementation in Japan with a shorter class hour, it was necessary to shorten the time for both the pretest and posttest. Therefore, the tests in Japan only consist of the first and fifth parts.
The implementations collected 526 valid test results and questionnaires. A preliminary analysis of the obtained data indicated that none of the data are normally distributed. Therefore, the nonparametric tests were used in the analysis because of suitability for data with a non-normal distribution (Pappas and Depuy, 2004).
4.1 General information about DRR learning
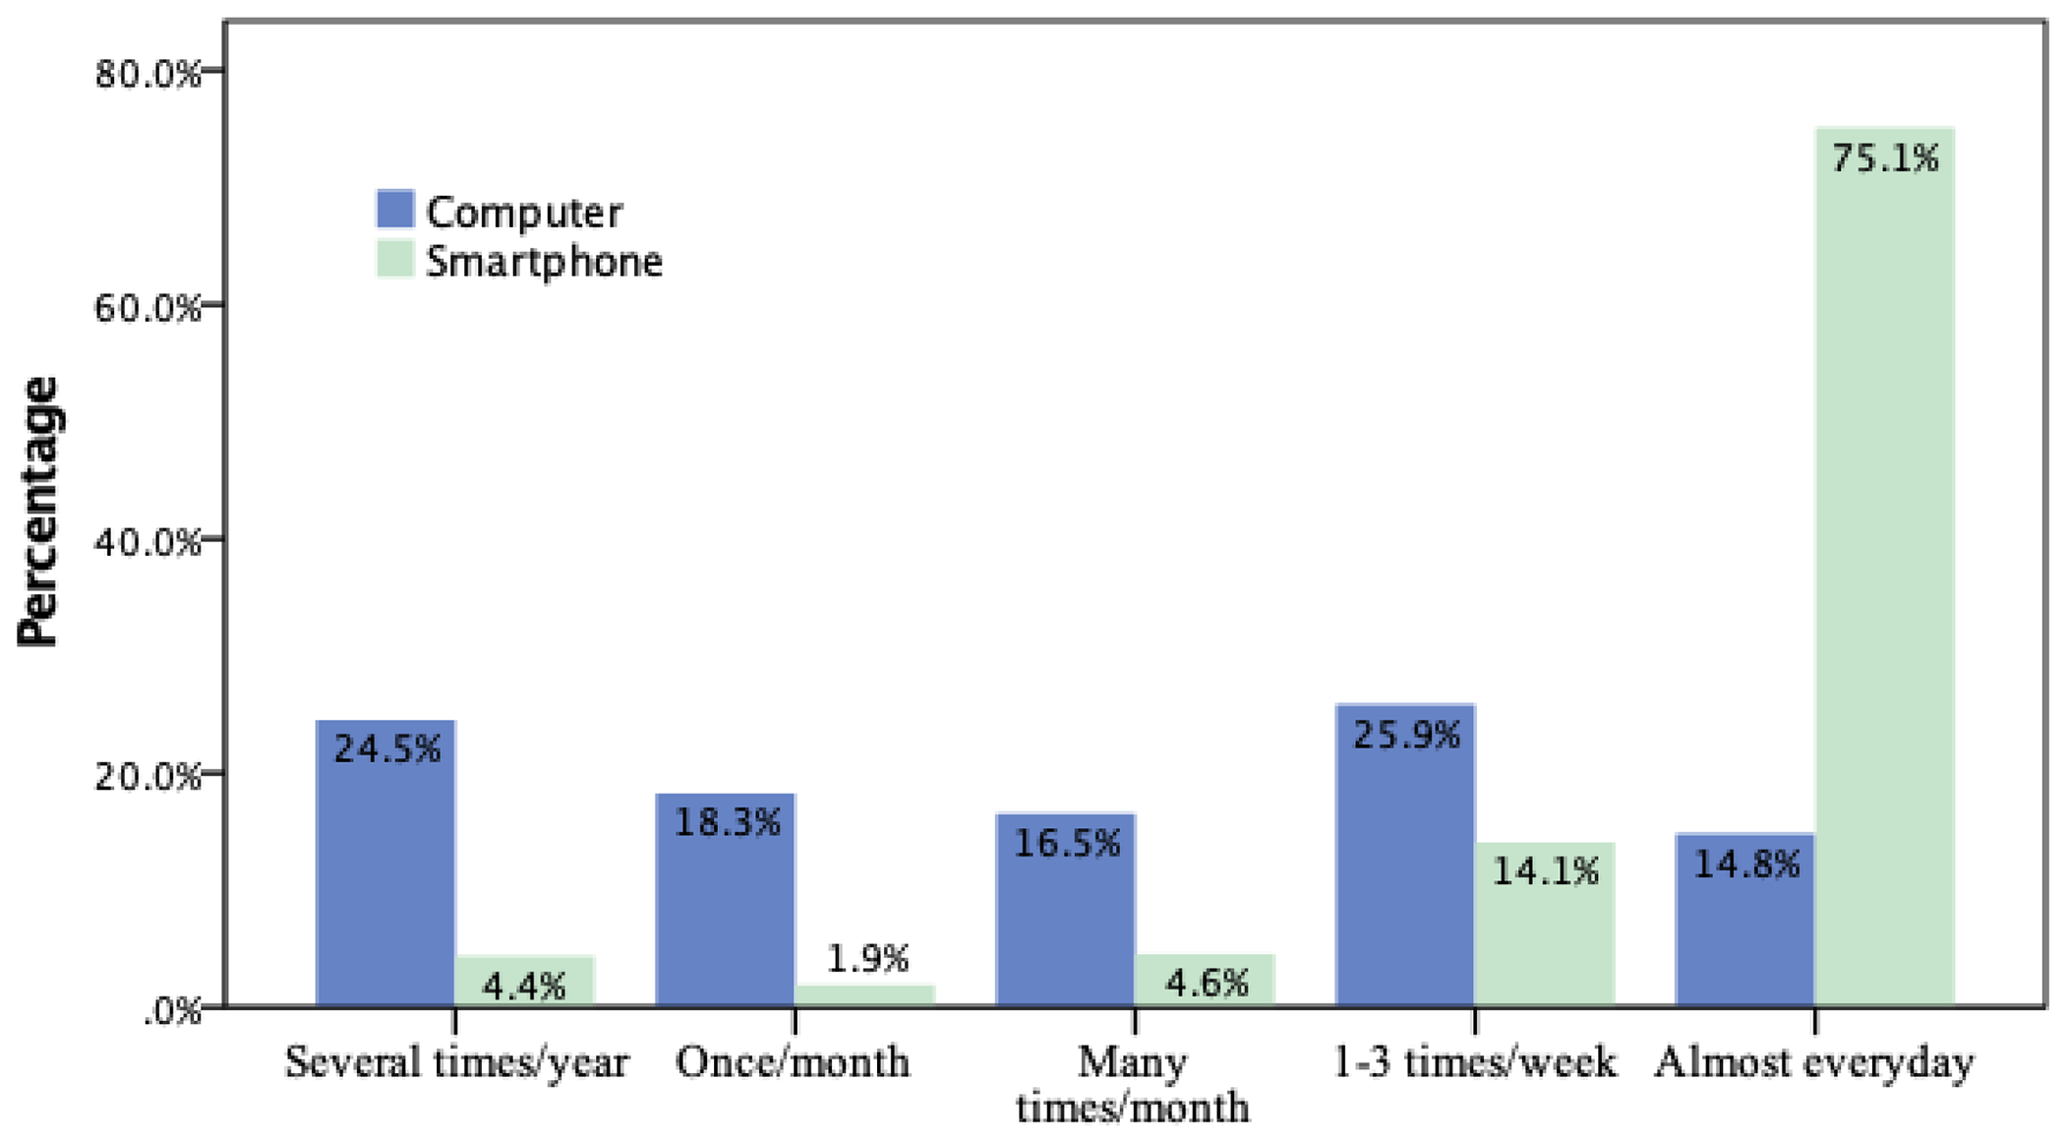
Figure 4 shows the frequency of computer and smartphone usage by the students for the purpose of understanding their daily engagement with these devices and analyzing their difficulty in using electronic maps, particularly in the context of DRR learning. The frequency of computer usage is low: only 14.8 % of students use computers almost every day and 25.9 % about one to three times a week. However, 75.1 % of students use smartphones almost daily, and one to three times a week accounts for 14.1 %.
Previous surveys indicated that students obtain disaster knowledge from different sources, including various types of school education, extracurricular reading of magazines, television or radio programs, computers, and smartphones (Zhu and Zhang, 2017). Therefore, such items were included in a question for students to choose as sources of their disaster knowledge. The results in Fig. 5 show that 86.9 % of the surveyed students acquired DRR knowledge through computers or smartphones. The next primary source of DRR knowledge is TV or radio (72.1 %), followed by schools (66.7 %). About half of the students get information from families and friends (47.7 %). Fewer students learn about DRR through extracurricular academic reading, magazines, museums and communities (8.6 % to 28.1 %). The differences in information across these sources underline the variations in each medium. Digital platforms often provide more timely updates, while educational reading offers in-depth analysis. In summary, major media (internet, TV and radio) and school activities are the primary channels for students to acquire DRR knowledge, each with unique characteristics that influence the type and quality of the information received.
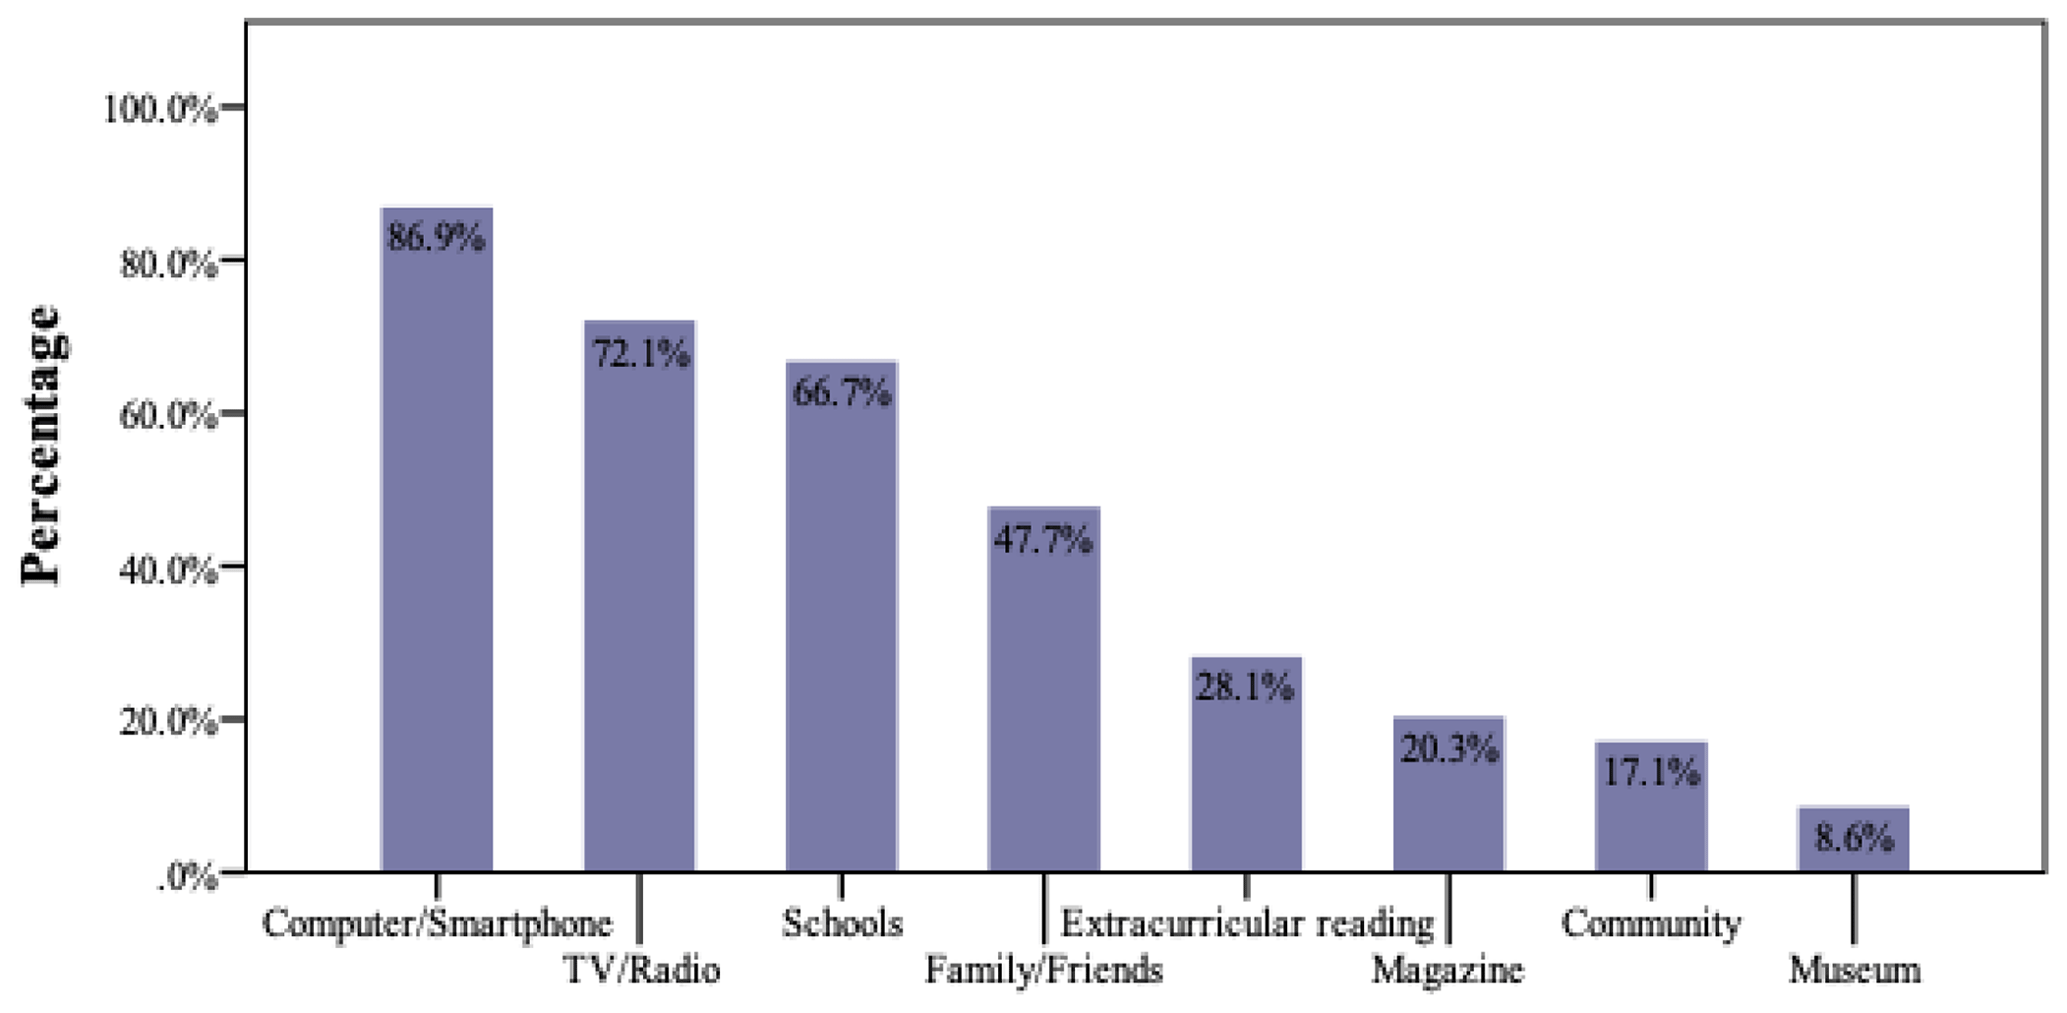
Figure 6 shows the students' responses to the two questions, revealing that 41.6 % (high and very high) pay great attention to DRR-related information in their daily lives, and 73.2 % (high and very high) wish that electronic DRRE materials are included in the school curriculum. Table 2 shows the correlation between the answers to the two questions. Spearman's correlation coefficient, which calculated the correlation between the answers to the two questions, was statistically significant at rs = 0.256 (p < 0.05), indicating that students who pay daily attention to DRR tend to be more positive about using electronic DRRE materials in schools.
Table 2Comparison of pretest and posttest scores through the Wilcoxon signed-rank test.
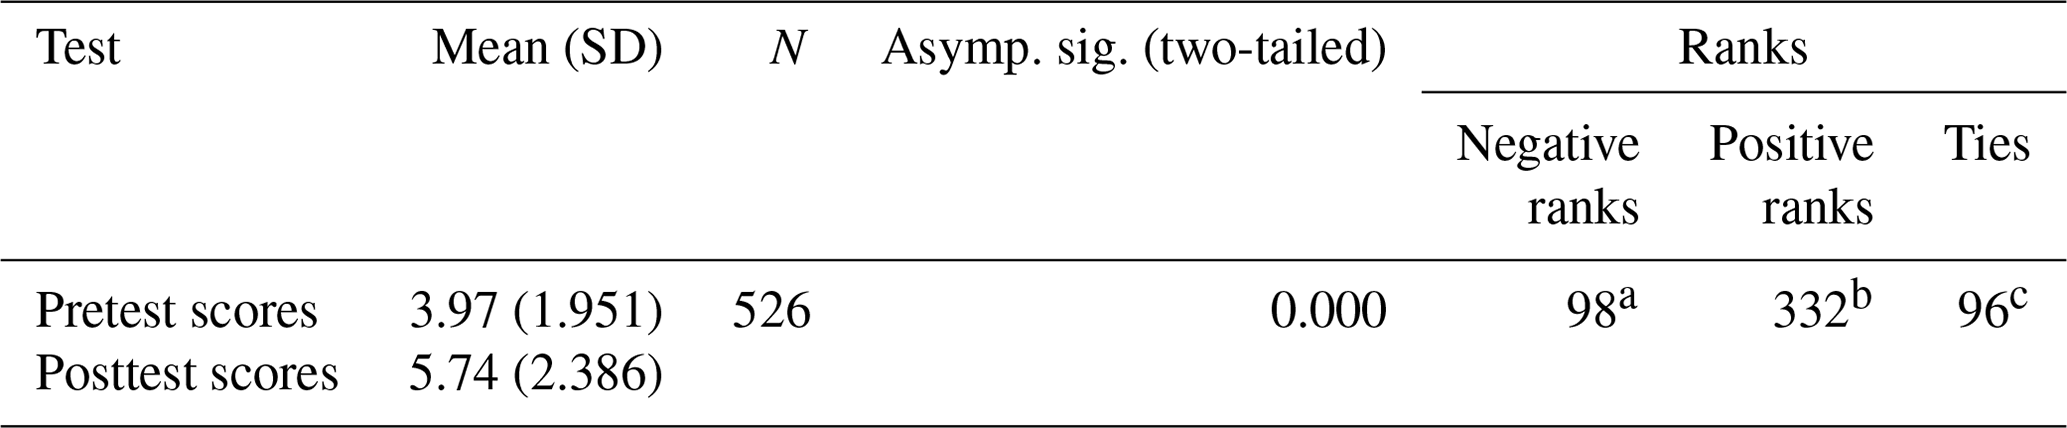
a Posttest scores < pretest scores. b Posttest scores > pretest scores. c Posttest scores = pretest scores.
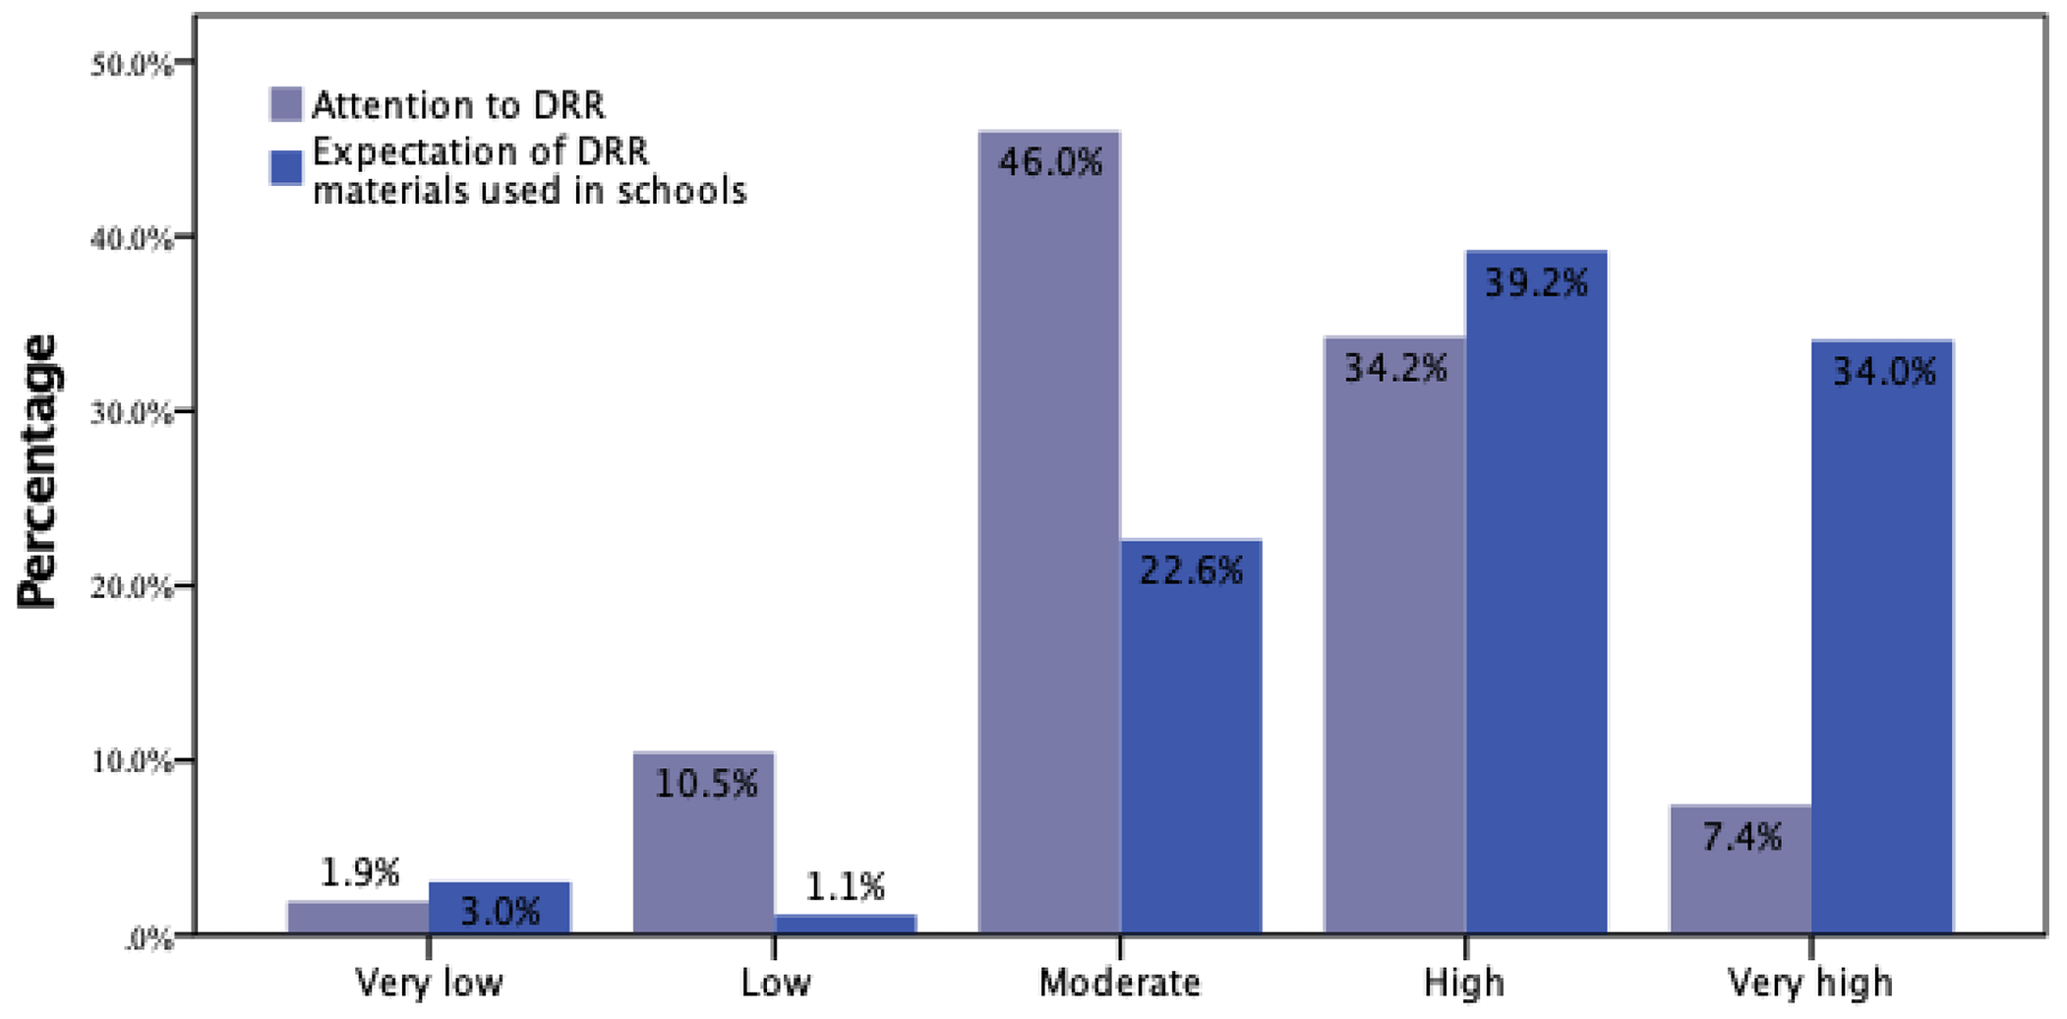
Figure 6Answers about the daily attention to DRR and the expectation of using digital DRRE materials in schools.
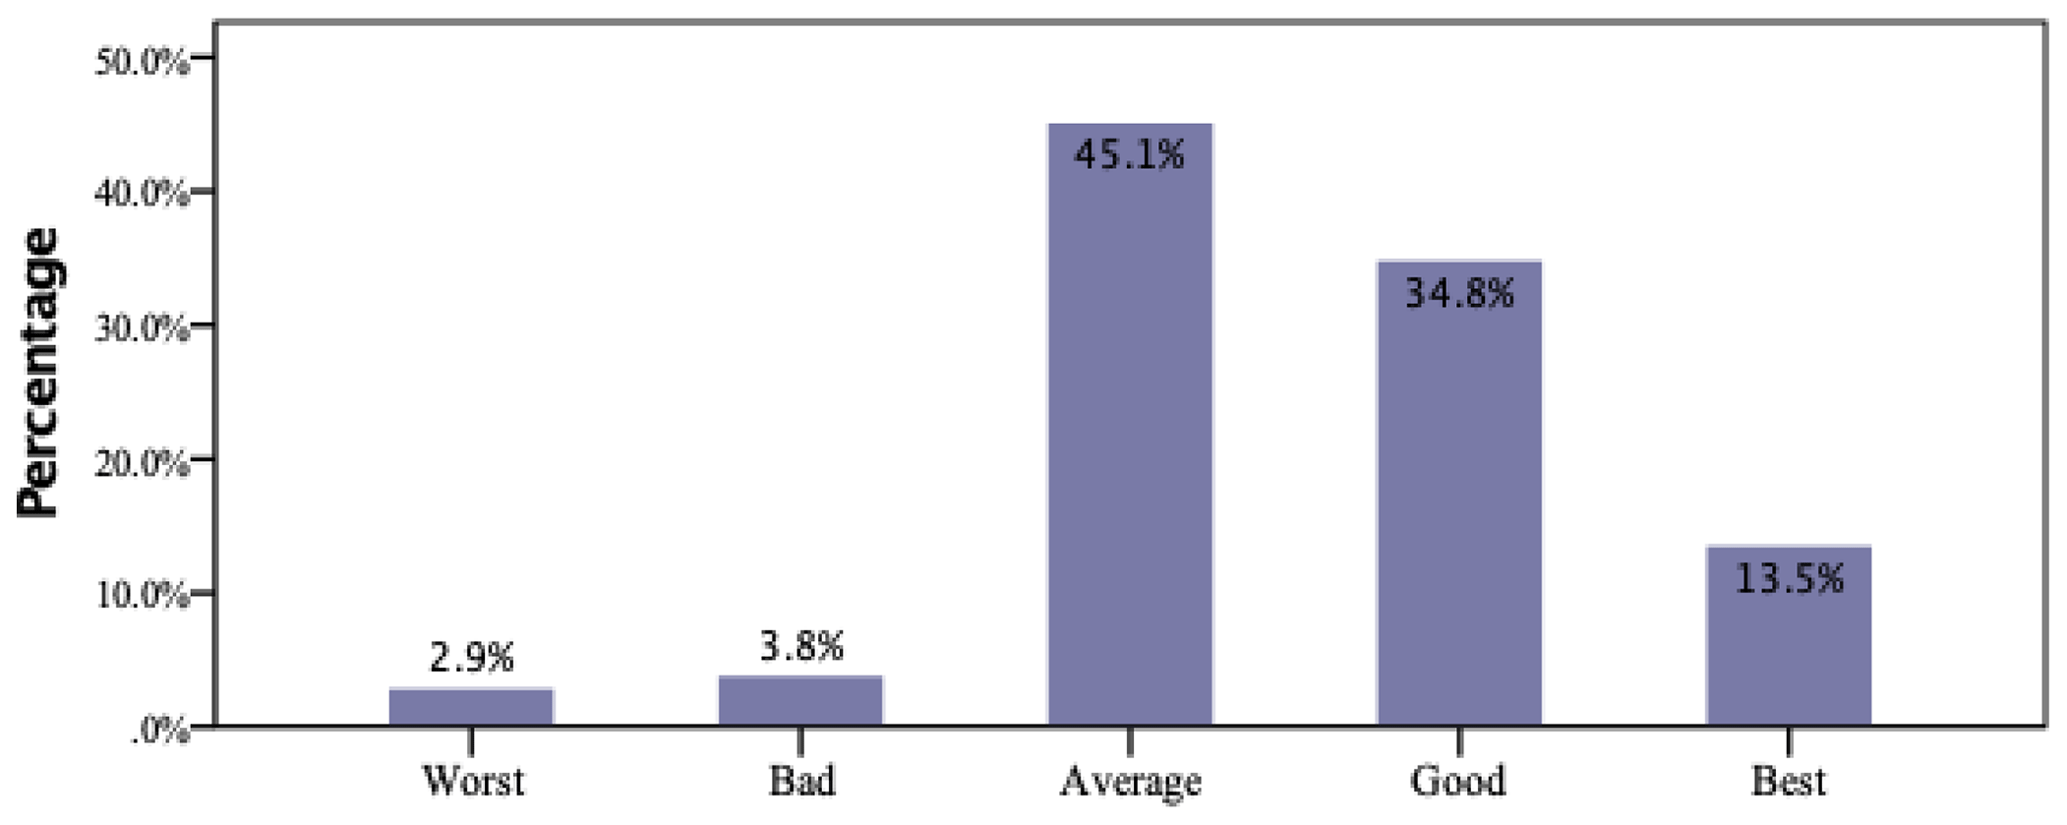
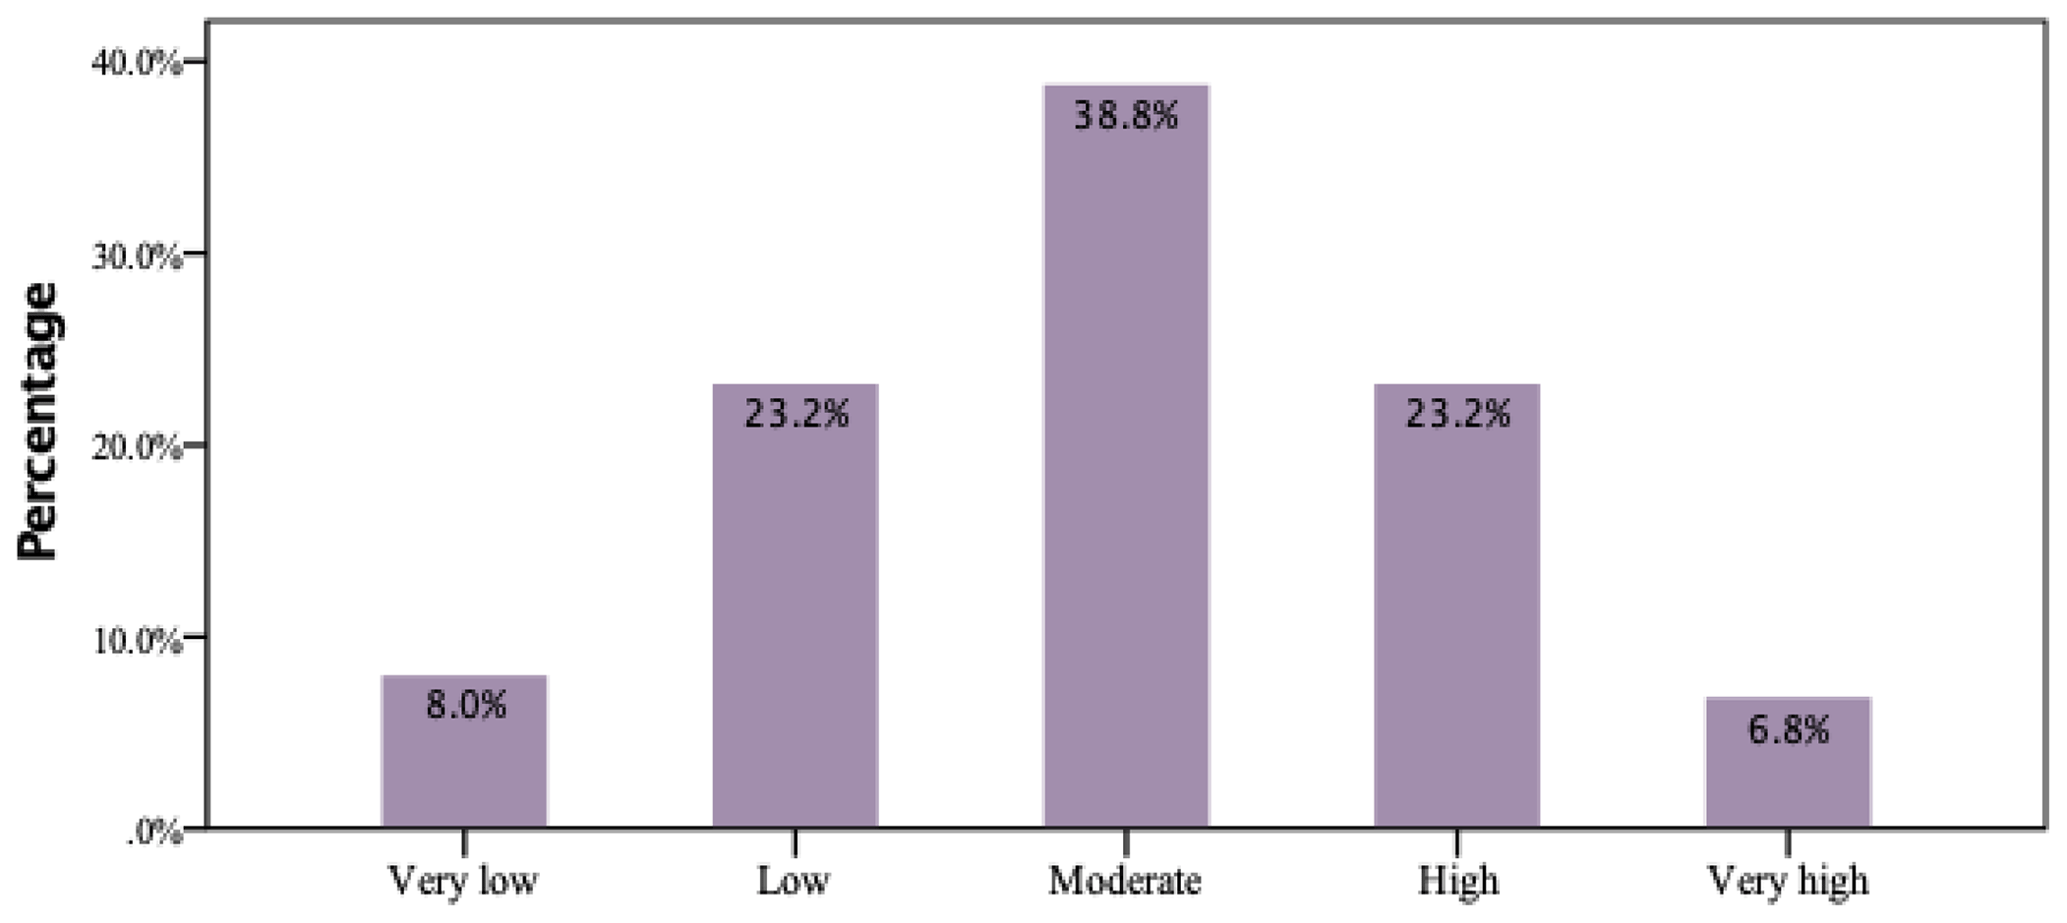
Figures 7 and 8 summarize the answers to the questions of “ability to use electronic products” and “frequency of usage of digital maps”. Nearly all students (93.4 %) considered themselves as having average or higher abilities to use electronic products, and about 30 % use digital maps frequently (high and very high).
4.2 Pretest and posttest results
Figure 9 shows the pretest and posttest scores of all 526 students using a boxplot, and Table 2 provides the result of the nonparametric Wilcoxon signed-rank test for comparing the pretest and posttest scores. The Wilcoxon signed-rank test is the nonparametric test equivalent to the dependent t test. The mean score of the pretest was 3.97, and that of the posttest was 5.74. The test shows that they are different with statistical significance (asymp. sig, i.e., asymptotic significance, is lower than 0.05), although the tall boxplots in Fig. 9 depict large variations. The rank section in the table shows that 332 students had higher posttest scores, 98 had higher pretest scores and 96 had very similar scores.
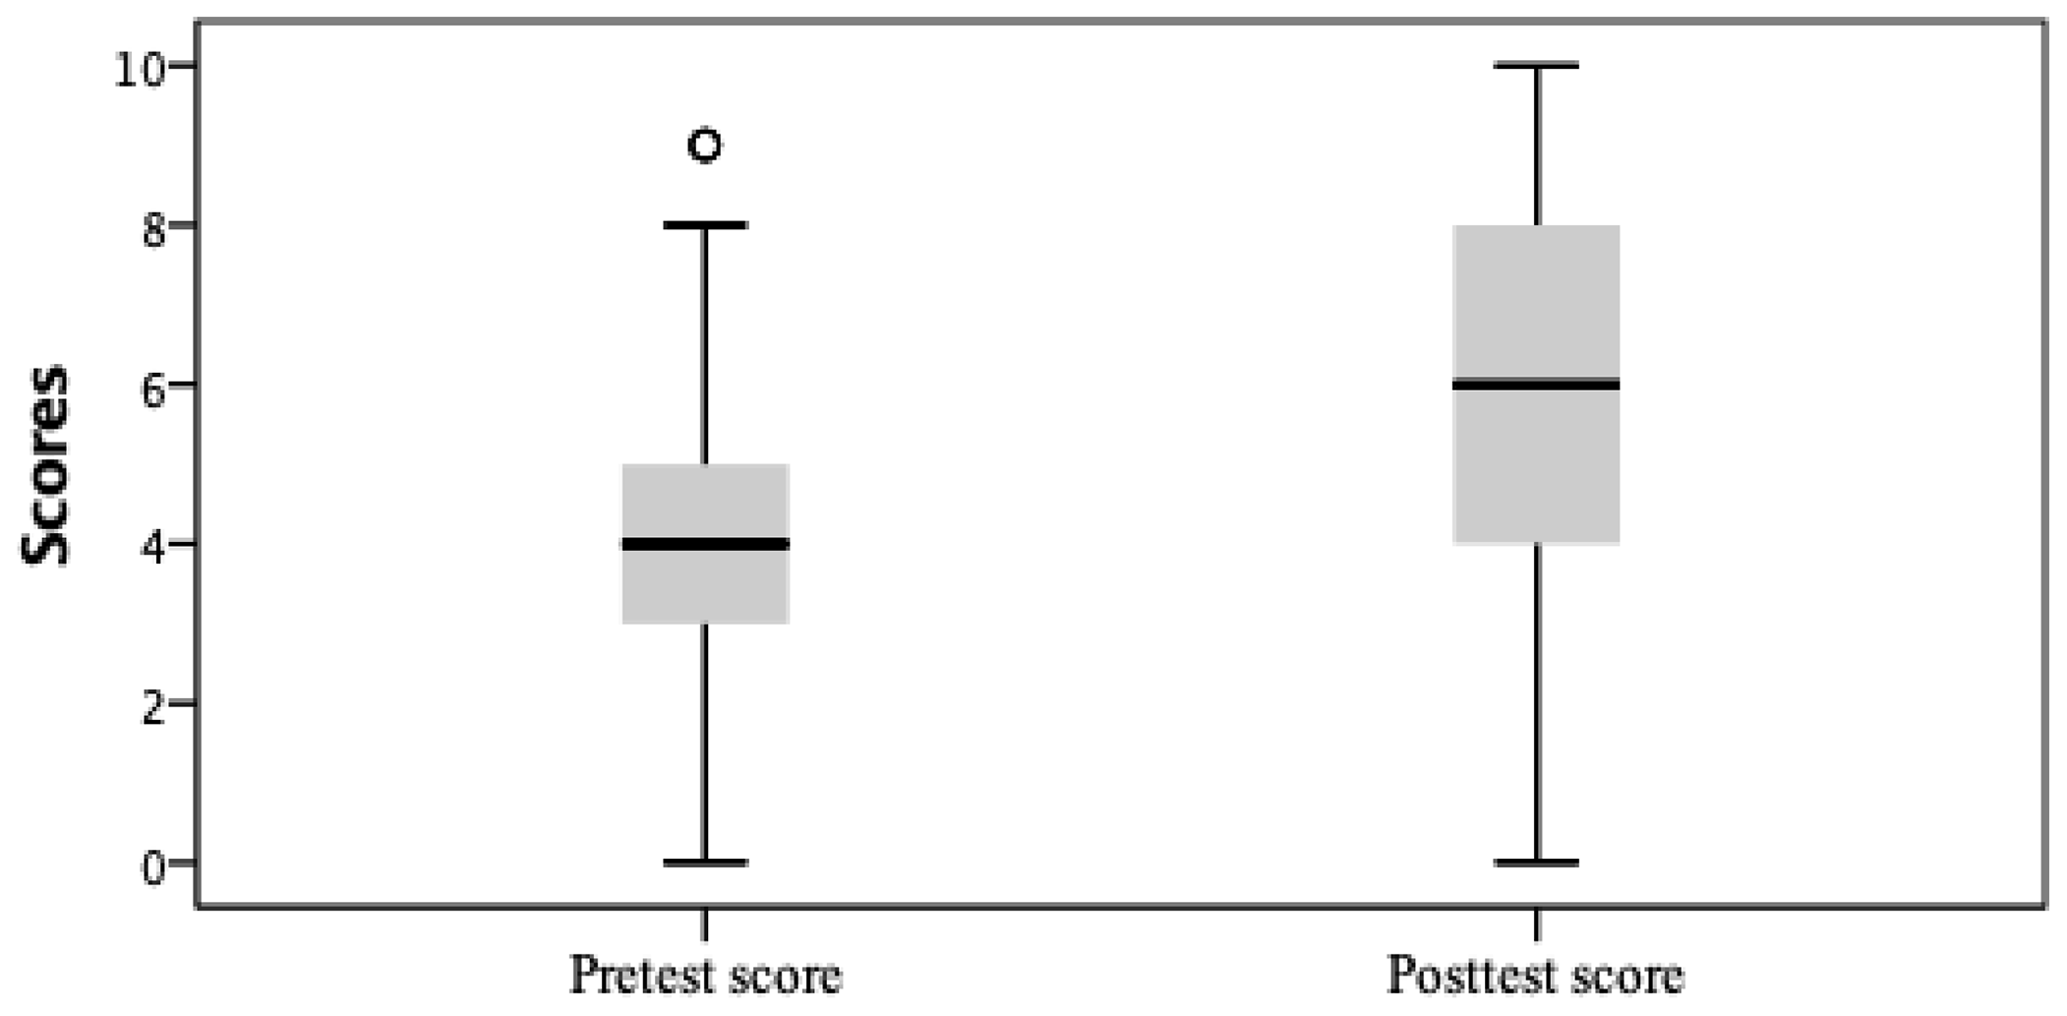
Figure 9Boxplot of pretest and posttest scores. Outliers are data points above the value calculated by Q3 + 1.5 × IQR, representing unusually high scores in the pretest.
Table 3 presents the rank-based nonparametric Kruskal–Wallis test results, the analog of one-way analysis of variance, revealing a statistically significant difference in pretest–posttest score improvement across the three implementation methods (asymp. sig. < 0.05). Figure 10 is the boxplot of the pretest and posttest accuracy rates for the three different implementation methods. The accuracy rates (0 to 1) were used to include data not only for China but also for Japan, where the number of questions was lower. The on-site implementation had the most significant improvement, while the online–on-site mixed implementation had no notable changes. The mixed implementation, conducted in a Japanese high school, had a course length of 50 min, less than half that of the implementations of the other two methods.
Table 3Kruskal–Wallis test results for the difference between pretest and posttest scores according to implementation methods.
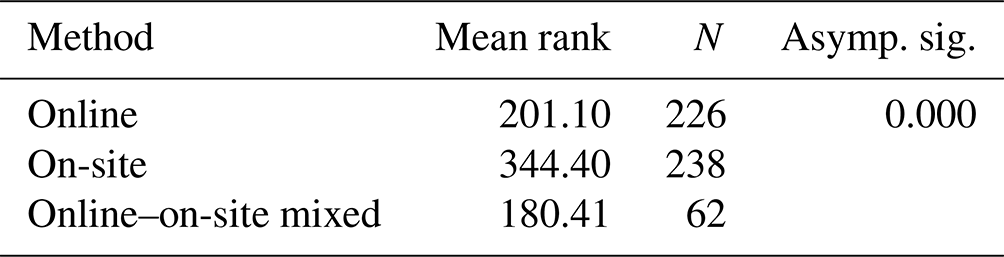
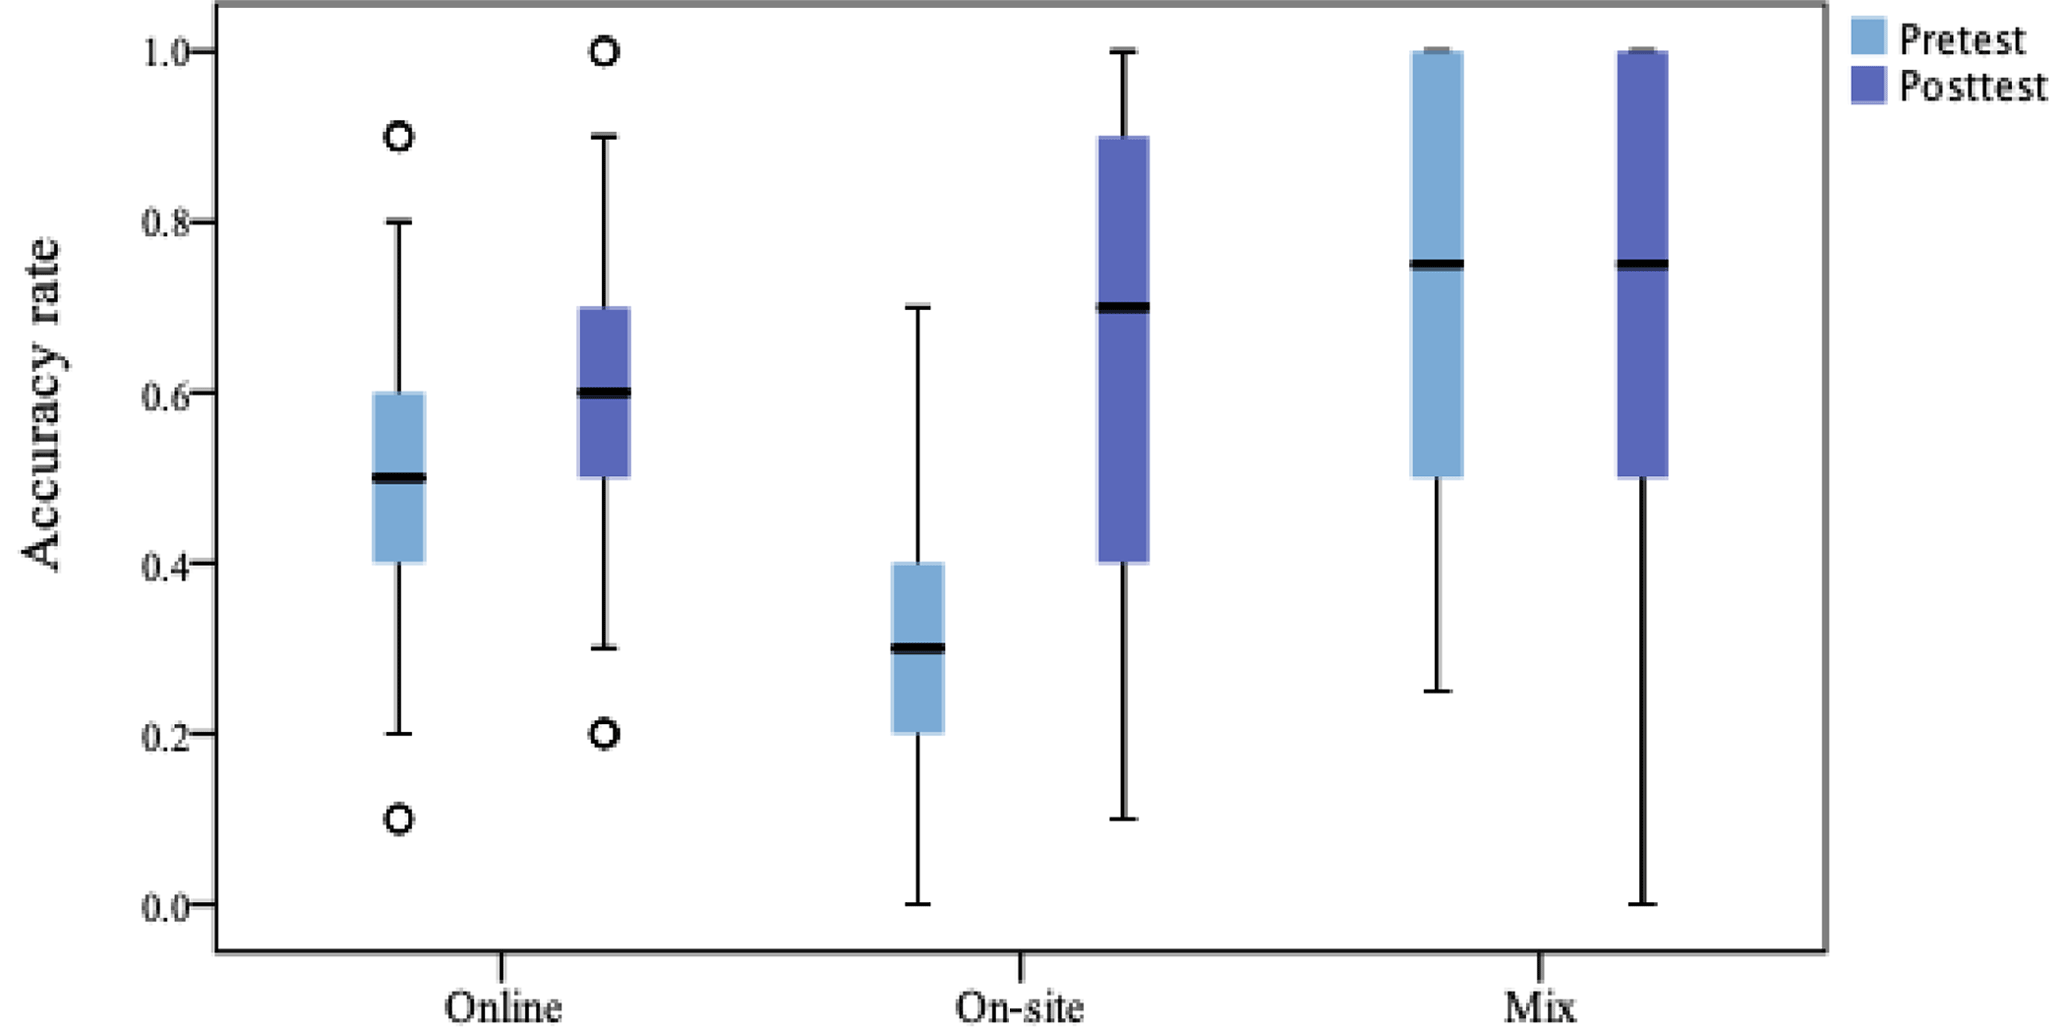
Figure 10Boxplot of pretest and posttest accuracy rates according to three implementation methods. Outliers for the online format's pretest and posttest are identified by values either below IQR or above IQR, indicating unusually low or high scores respectively.
Table 4 presents the result of the Kruskal–Wallis test concerning the differences between pretest and posttest scores in the four regions. The regional disparity is statistically significant (asymp. sig. < 0.05), with Jilin Province having the highest mean rank value and Japan having the lowest. Figure 11 is the boxplot of the pretest and posttest scores for the four regions, confirming the most significant improvement in Jilin Province. All participants in Jilin took on-site implementations, and questions about DRR in the tests were local cases in the same province. The students in Inner Mongolia also showed markedly improved pretest scores. In contrast, the improvement was limited in Liaoning Province and Japan, and their pretest scores were higher than those in the other two regions. All students in Liaoning Province took online implementations, while all students in Japan took online–on-site mixed implementations.
Table 4Kruskal–Wallis test result on the difference in pretest and posttest scores among the four regions.
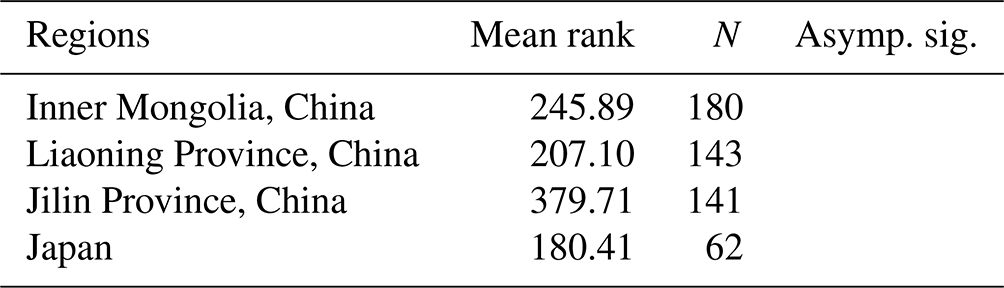
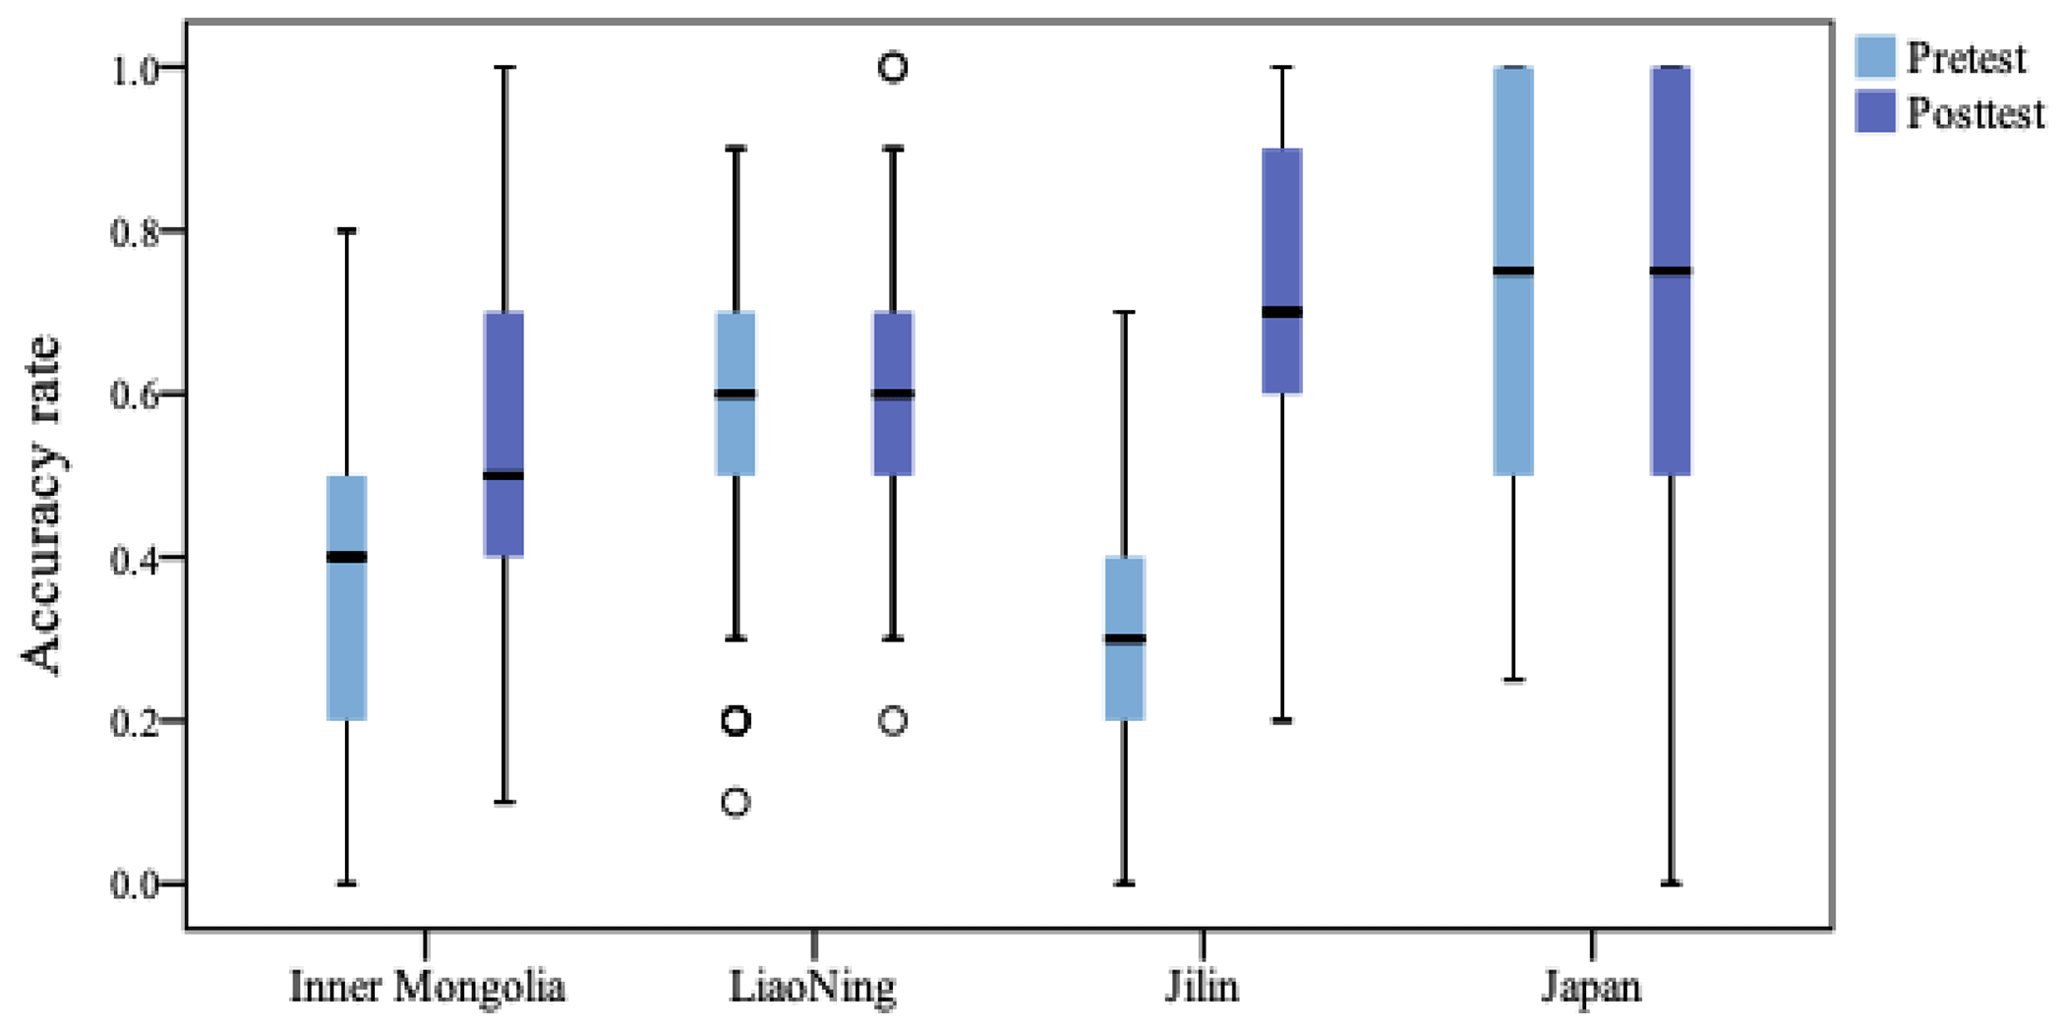
Figure 11Boxplot of pretest and posttest scores for the four regions. Outliers for Liaoning's pretest and posttest are identified by values either below Q1−1.5 × IQR or above IQR, indicating unusually low or high scores respectively.
4.3 Factors influencing students' DRR learning
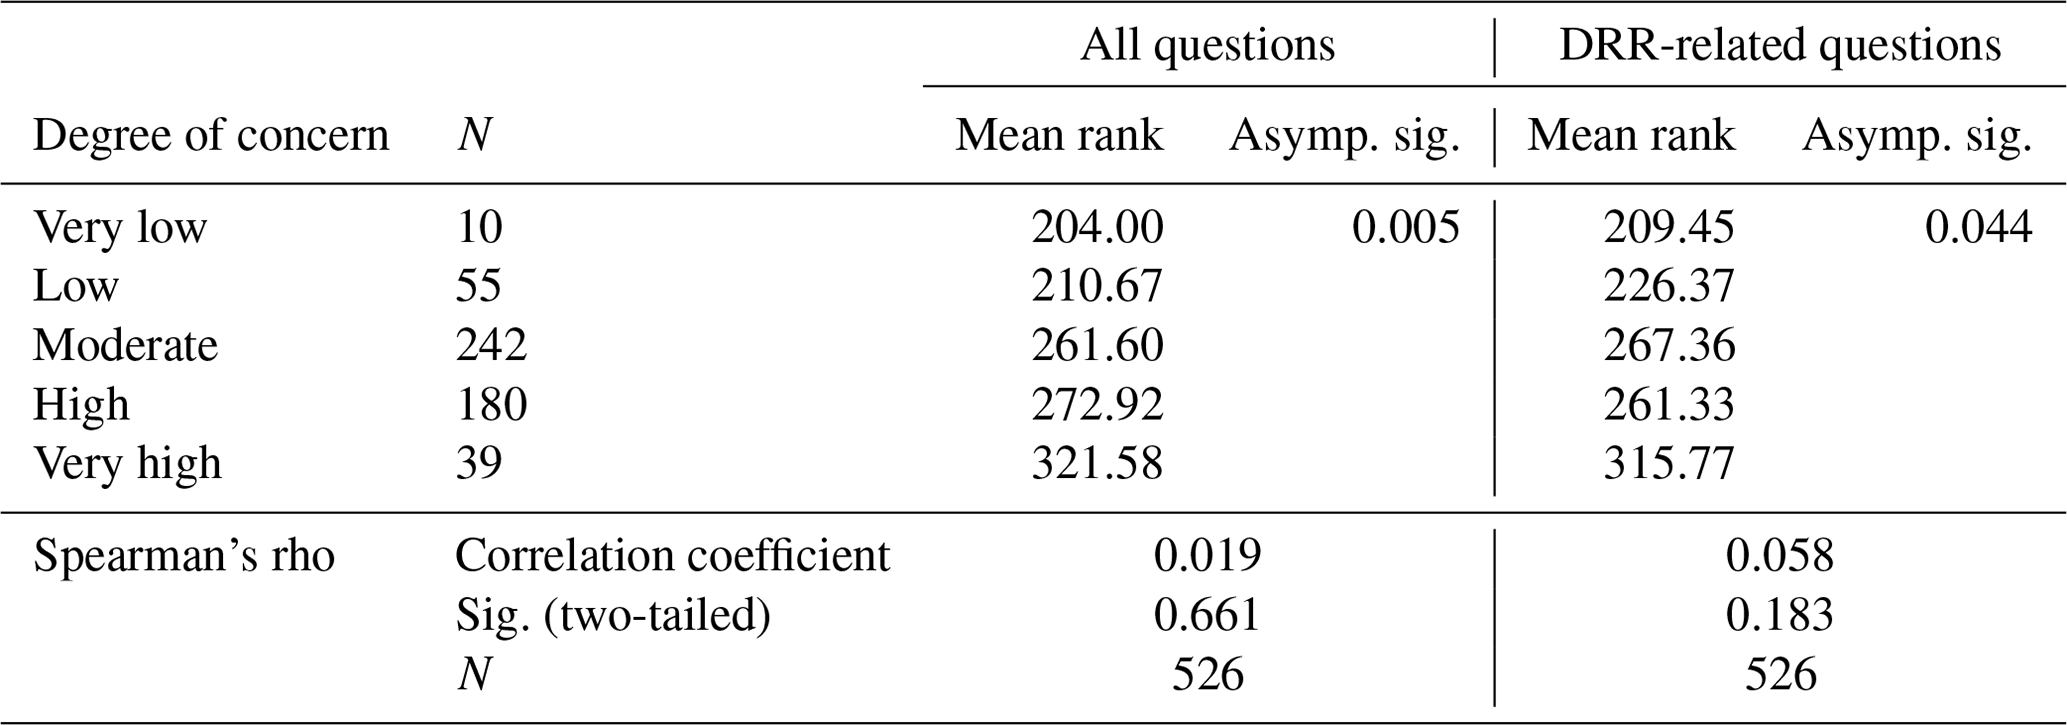
The influence of students' attention to disaster prevention on the pretest results and the score improvement was investigated. For the pretest results, there was no linear correlation (Table 5). However, the influence is significant not only on DRR-related questions but also on all questions (asymp. sig. < 0.05). More daily attention to disaster prevention led to more substantial increases in test scores.
Table 5Correlation and effects of students' daily attentions to disaster prevention and mitigation-related contents on test scores and learning outcomes.
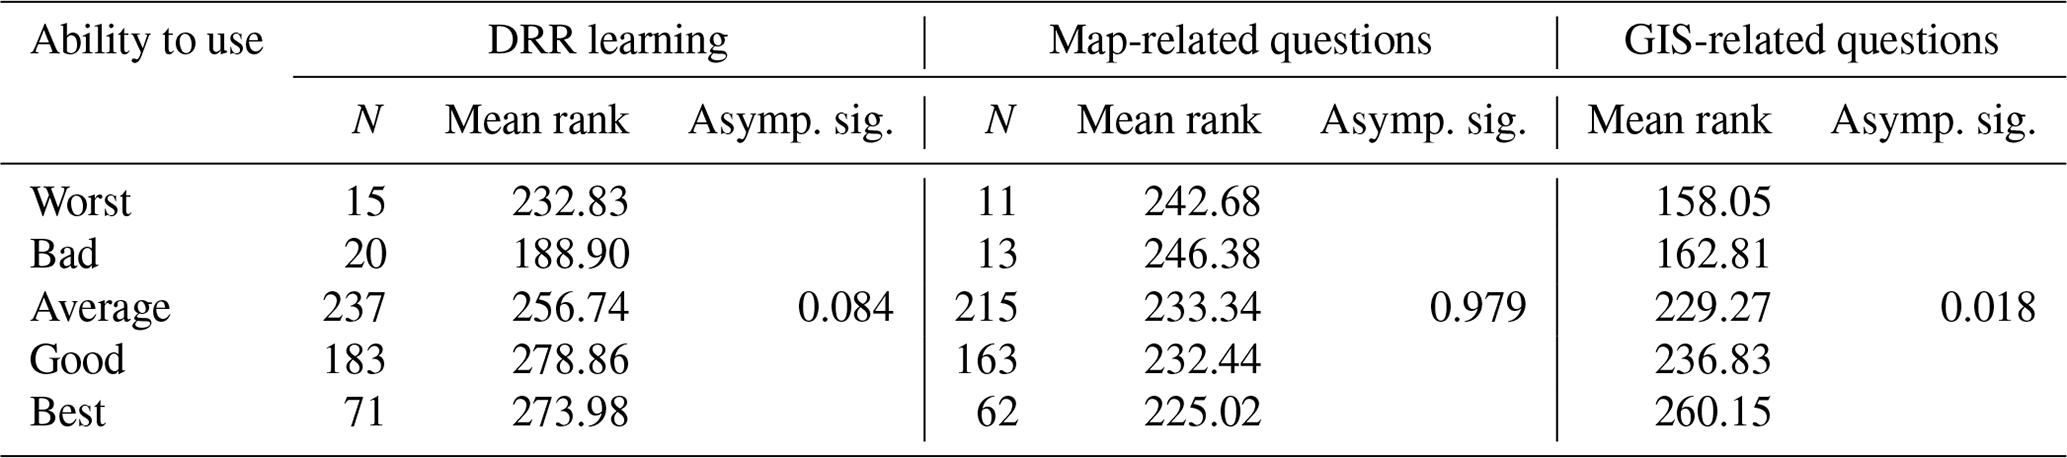
A lack of discernible correlation between the ability to use electronic products and pretest scores was observed through Spearman's rho method. Table 6 shows the result of a similar evaluation regarding the effect of the ability to use electronic products on score improvement for the DRR-related questions. The impact is not statistically significant (asymp. sig. > 0.05), although the mean rank values indicate that higher ability usually led to higher score improvement. Table 6 evaluates the impact of the ability to use electronic products on score improvement for the map-related questions and the GIS-related questions. These questions were not conducted in Japan due to the limited implementation time. Therefore, Table 6 shows the results of 464 students in China. The ability to use electronic products does not significantly affect map-related learning (asymp. sig. > 0.05), which is consistent with the overall result. However, it significantly affects GIS-related learning (asymp. sig. < 0.05) with a positive correlation. A similar analysis was also conducted on the frequency of computer or smartphone usage and score improvement in each section, but no significant correlation was found.
Table 6Effects of the students' abilities to use electronic products on learning maps, GIS and DRR learning.
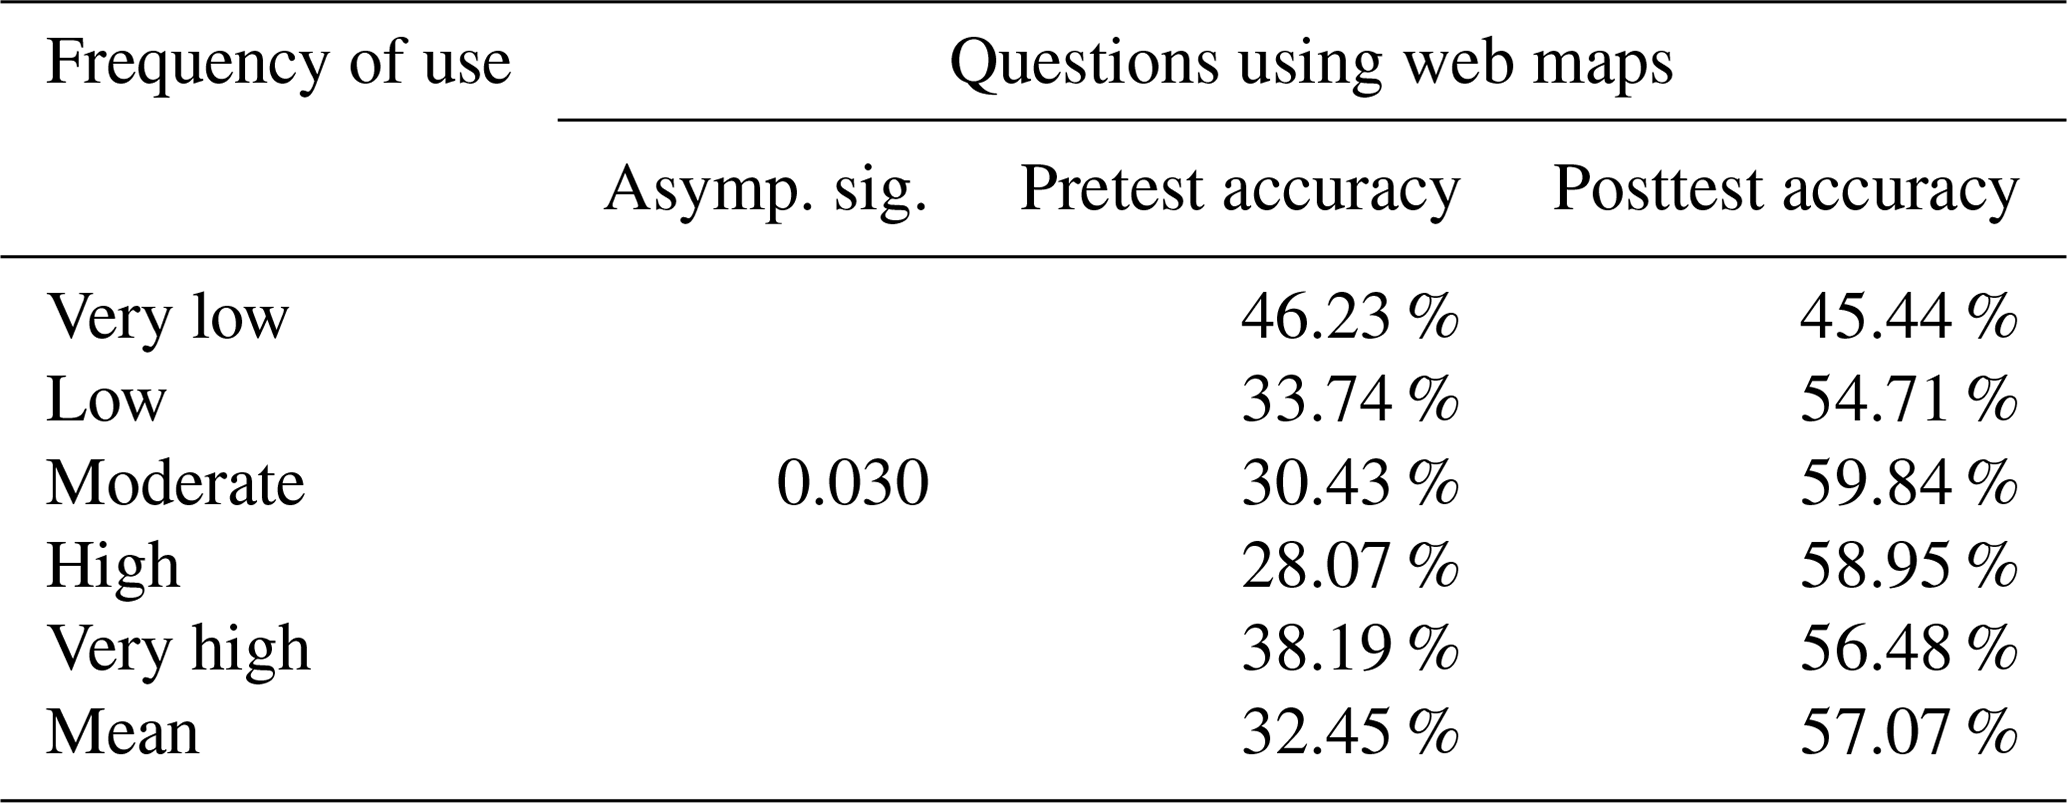
Some of the test questions require the use of web maps to reply. There was no linear correlation between the questions answered without using web maps and the pretest scores. Table 7 evaluates the impact of the pretest and posttest results of questions using web maps for different electronic map usage frequencies. The impact is statistically significant (asymp. sig. < 0.05), and the posttest score improvement tends to increase with the increased frequency of electronic map usage.
Table 7Pretest and posttest results for different electronic map usage frequencies.
This study examines the differences between 526 students in China and Japan before and after using DRR learning materials and the factors influencing the effects of learning, including the previous DRR-related experiences of students. According to this survey, the principal sources for students to acquire disaster knowledge are computers or smartphones, TV or radio, and schools. Zhu and Zhang (2017) surveyed 758 students from 16 primary and secondary schools across Beijing; Guangdong Province; Chengdu of Sichuan Province; and the cities of Changsha and Huaihua of Hunan Province, China, from October to November 2016. The results indicate that the primary three sources of disaster knowledge for students were schools, computers or mobile phones and TV or radio. This suggests that modern communication methods play a crucial role in the widespread dissemination of DRR knowledge, especially for young students, with the importance of school education also being significant. It may be worth noting that the shift towards the reliance on digital platforms could have been further influenced by the COVID-19 pandemic, which necessitated online learning and information sharing, thereby emphasizing the role of computers and mobile phones. These technological adaptations are not just circumstantial but reflect a broader shift in the educational landscape. This blended approach ensures that students have access to a variety of DRR knowledge sources even if school time for DRR education is limited. As noted by Talero (2004), media can offer valuable communication tools that can be used as educational aids to bridge the long and complex distance between scientific knowledge and public awareness. However, the aid of media has limitations, including potential oversimplification or biases that may distort the true essence of the scientific content. Such distortions emphasize the important role that schools play as suppliers of fundamental and systematic knowledge. Schools enable students to discern and evaluate information, thus mitigating the limitations of media. This study also indicates that many students consider disaster prevention and mitigation in ordinary times, suggesting the importance of both off-school learning opportunities and school-based education in achieving optimal DRR education.
The students in the Chinese high schools show significantly improved results after using the DRRE materials with digital hazard maps. This is consistent with Akimoto and Suzuki (2019) in that hazard maps can be DRR educational materials for students. The improvement is undeniable for the on-site implementations. In online education, students only communicate with their classmates digitally; thus, the real-time sharing of ideas, knowledge and information still needs to be completed (Britt, 2006). Adnan (2020) also indicates that traditional classroom learning is more effective than online learning or distance education. The online–on-site mixed implementation conducted in Japan resulted in no significant improvement of test scores. Several reasons can be considered for this exceptional case: (1) students already had high scores at the pretest stage, limiting the further increase in scores; (2) the mixture of online and on-site methods was unusual for students and caused some confusion; and (3) the class hour was only 50 min, which is half of the other implementations.
Gender hardly affects the learning of students. Previous research also indicated that educational curricula utilizing web GIS could promote geospatial thinking skills regardless of gender (Bednarz and Lee, 2011; Bodzin, 2015; Collins, 2018). The levels of previous experiences and attention of students related to electronic maps, electronic products and hazards did not affect the pretest scores in most cases. The student's abilities to use electronic products only affect the learning of GIS-related content, suggesting that the effective operation of GIS needs a skill specific to electronics, but it is technical and irrelevant to the acquisition of DRR-related knowledge. In contrast, previous experience with web hazard maps significantly influences the learning of DRR-related contents, and the frequency of electronic map usage and attention to disaster prevention in daily life also affect the utilization of the DRRE materials. These observations suggest that the questions in the tests were of a relatively high level for the students, so systematic learning using the provided materials was needed to have better scores. At the same time, their previous experiences and attention surely affected learning. Therefore, both opportunities for the systematic learning and daily experiences and attention are needed to maximize the understanding of students about DRR and related issues.
Song et al. (2022) found that students experienced more difficulties recognizing risk regions when the disaster featured their dwelling and the surrounding environment. This study expands on this result with a comprehensive investigation that the pretest scores for the implementations using local disaster cases are low, but the subsequent improvement is significant. Although local examples may be more complicated and disconnected for local students (Hsu et al., 2018), the improvement after learning the DRRE materials using local cases was more significant than that using non-local examples, indicating the necessity of local-level DRRE. Sutanta et al. (2014) suggested that DRR activities should be conducted at the level of local government because it is the authority of local spatial planning. However, local governments may consider DRR from different perspectives, and their activities are only sometimes effective. Therefore, some researchers recommend that municipalities and citizens collaborate to build a culture of DRR in communities (Tuladhar et al., 2014; Lin and Chang, 2020). Introducing web hazard maps into such collaborative work is a key to realizing effective social DRR.
Although Song et al. (2022) shared the DRRE materials among several students as a single web page, the materials used in this study contain multimedia contents and are designed for individual use on a single device. To make them accessible to more users, the DRRE materials were mounted on a server. Nevertheless, there are occasionally delays or lags when many devices tried to access the materials simultaneously. Some students may not have a stable internet connection throughout the implementation process, especially in online implementation. This can impact the ability of students to access the material and may also be a significant factor in delays or other problems. The internet issue is crucial to students' online learning experiences (Agung et al., 2020). Educational authorities and organizations that provide online education may mistakenly believe that most students have a reliable internet connection at home in the era of 4G and 5G networks (Yan et al., 2021). In the scope of this research, while the teaching materials have been designed to be adaptable across various devices and platforms, it is recognized that potential disparities might exist in the quality of students' internet connections that they use. Students with lower-quality internet connections experience difficulties such as sluggish or dropped connections, especially for streaming multimedia contents. This can be frustrating and impact their ability to learn effectively. The development may need to implement measures to improve the size and format of multimedia files, use a content delivery network (CDN) to distribute material more effectively, or implement caching to reduce the number of data that need to be transmitted. In general, it is critical to be aware of the potential challenges students may face when accessing online materials and to take steps to minimize any barriers to learning that may arise.
This study uses the pretest and posttest results to analyze the factors affecting students' learning using web hazard maps. According to this survey, students' primary sources of disaster knowledge are computers, smartphones, televisions, radio and schools. Students believe that online hazard maps can supply more accurate data, and modern communication tools provide a variety of DRR knowledge that cannot be fully conveyed to students during the limited school time. Therefore, DRRE in schools should be combined with the latest technology related to media, and action needs to be taken to overcome potential obstacles that students may encounter when accessing online learning materials.
Students' learning results improved after using the constructed DRRE materials. This observation is common to the two countries, suggesting the broader applicability of the constructed materials and curricula. Students' daily attention to disaster prevention and mitigation-related contents, abilities to use electronic products, and previous usage of web hazard maps did not affect the pretest scores. However, like above, all of them were positively correlated with the learning effects, meaning that both previous experiences and attention and the use of the DRRE materials are needed to maximize the DRR knowledge and skills of students. Among the three implementation methods, on-site implementations led to the most noticeable improvement because face-to-face interactions are effective even when online educational materials are used.
Gender hardly affects students' learning of DRRE materials. Students' abilities to use electronic products only affect the learning of GIS-related contents, not DRR-related knowledge. In addition, the frequency of using electronic maps and students' attention to disaster prevention and mitigation in daily life affect the learning of the DRR-related contents and other relevant sections. Increasing the daily usage of digital maps, including web hazard maps, helps students learn various DRR knowledge. Using local examples in DRRE can help students better understand their communities' specific risks and vulnerabilities. Local governments should pay attention to this approach and consider incorporating it into their DRRE efforts.
Previous research laid the theoretical and empirical groundwork for using electronic maps in DRR education. This study builds on that foundation, proposing more systematic and practical methods. The new approaches not only enable students to better understand and apply electronic maps but also improve their DRR knowledge and disaster response capabilities. Based on the findings of this research, integrating web hazard maps, GIS technology and other relevant electronic tools into a structured curriculum is recommended. This curriculum should emphasize hands-on practice, face-to-face interaction and attention to local examples to enhance students' understandings of DRR-related content and disaster response ability.
A noteworthy observation is that, as students and teachers deepen their knowledge, they inadvertently serve as vehicles for disseminating this information, thereby elevating risk awareness in parents and the wider community. Collaboration with local governments to align with specific community needs is vital. The limitations of this study must be acknowledged, including potential sample biases and limited geographical scope. Furthermore, additional research is necessary to explore the long-term retention of DRR knowledge and validate these approaches across diverse educational contexts. Despite these constraints, the results offer new directions for future research in the field of DRR education, contributing to sustainable development and a safer social environment.
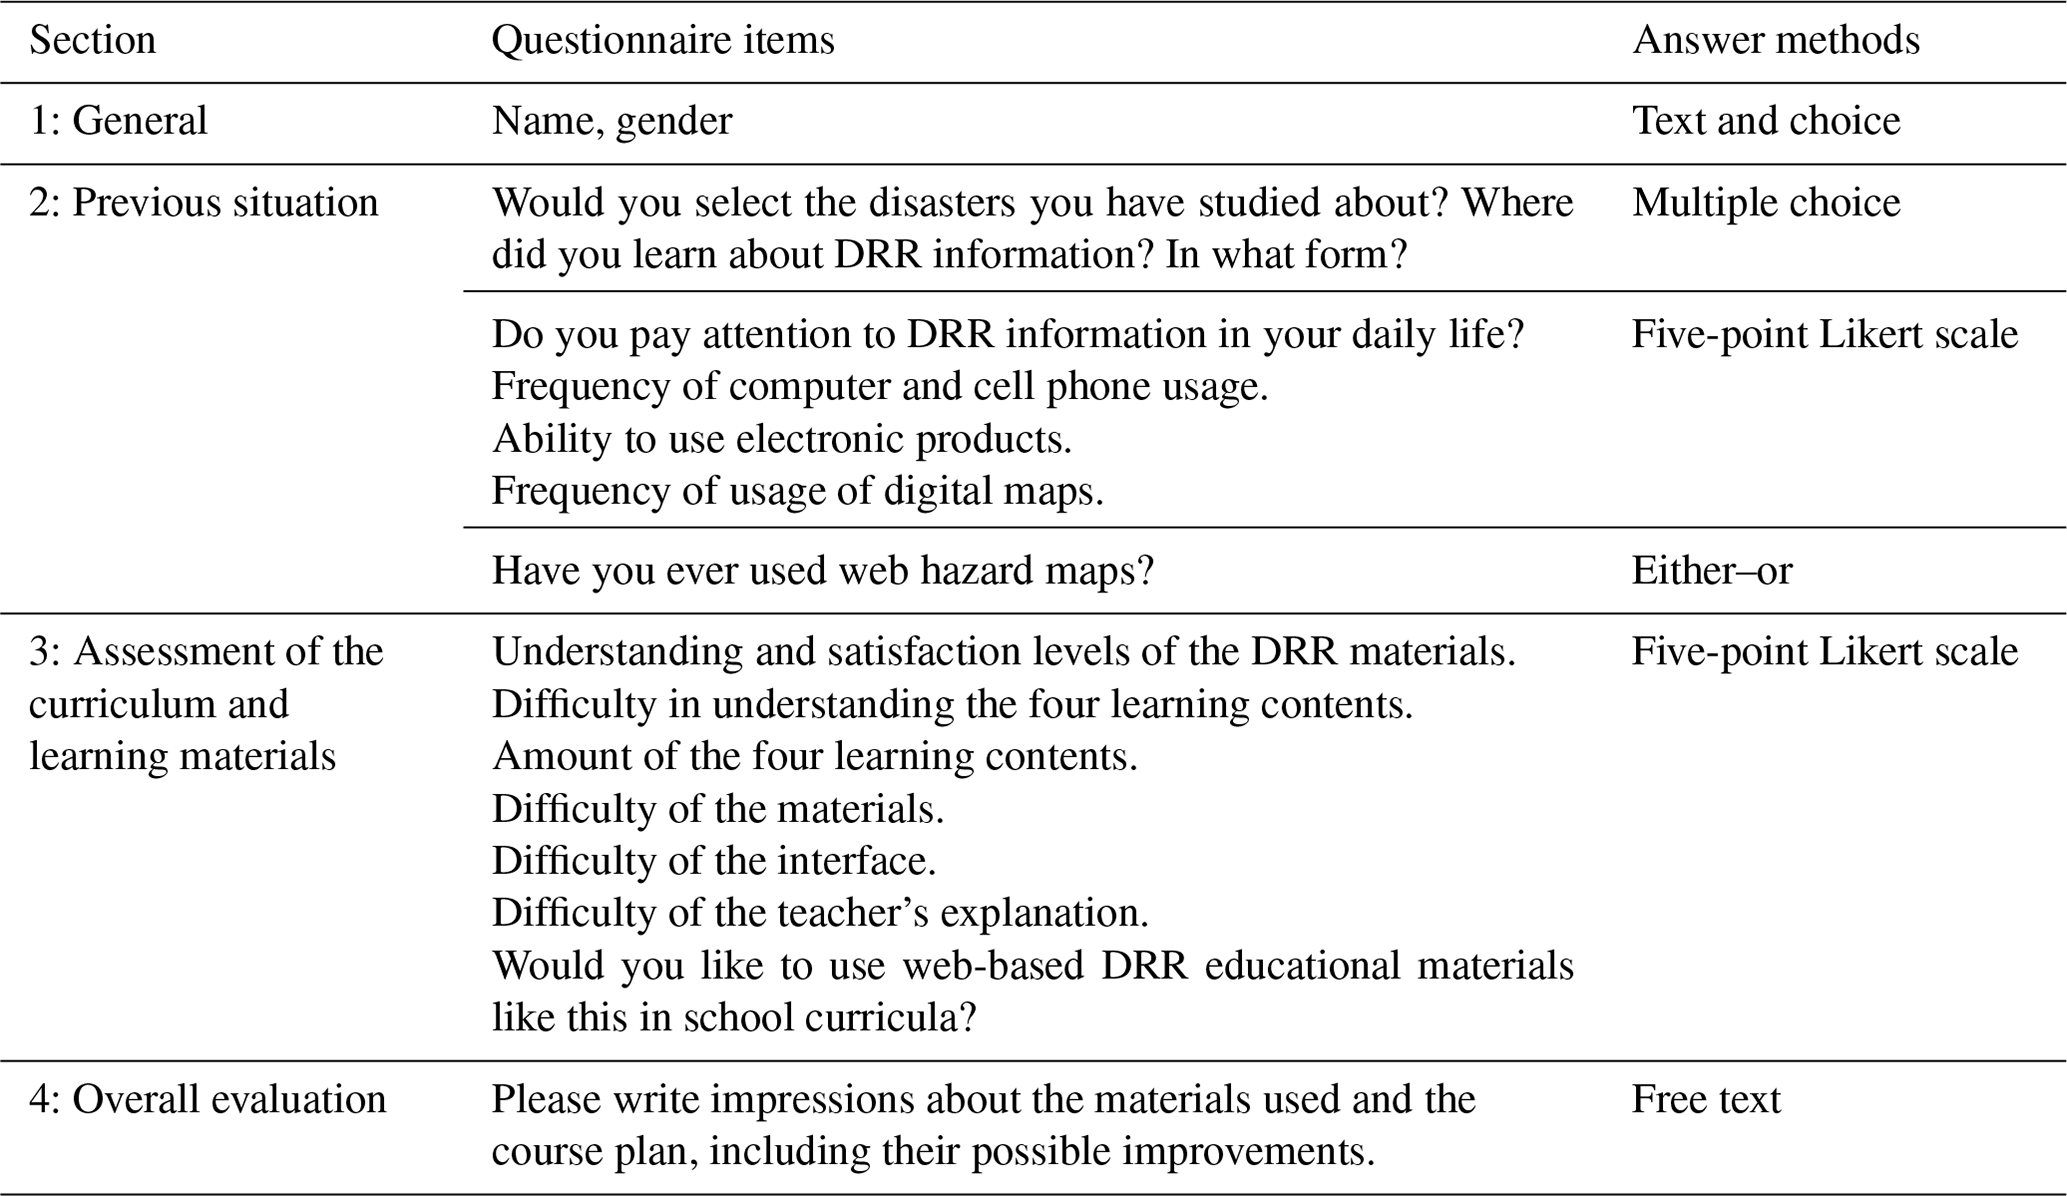
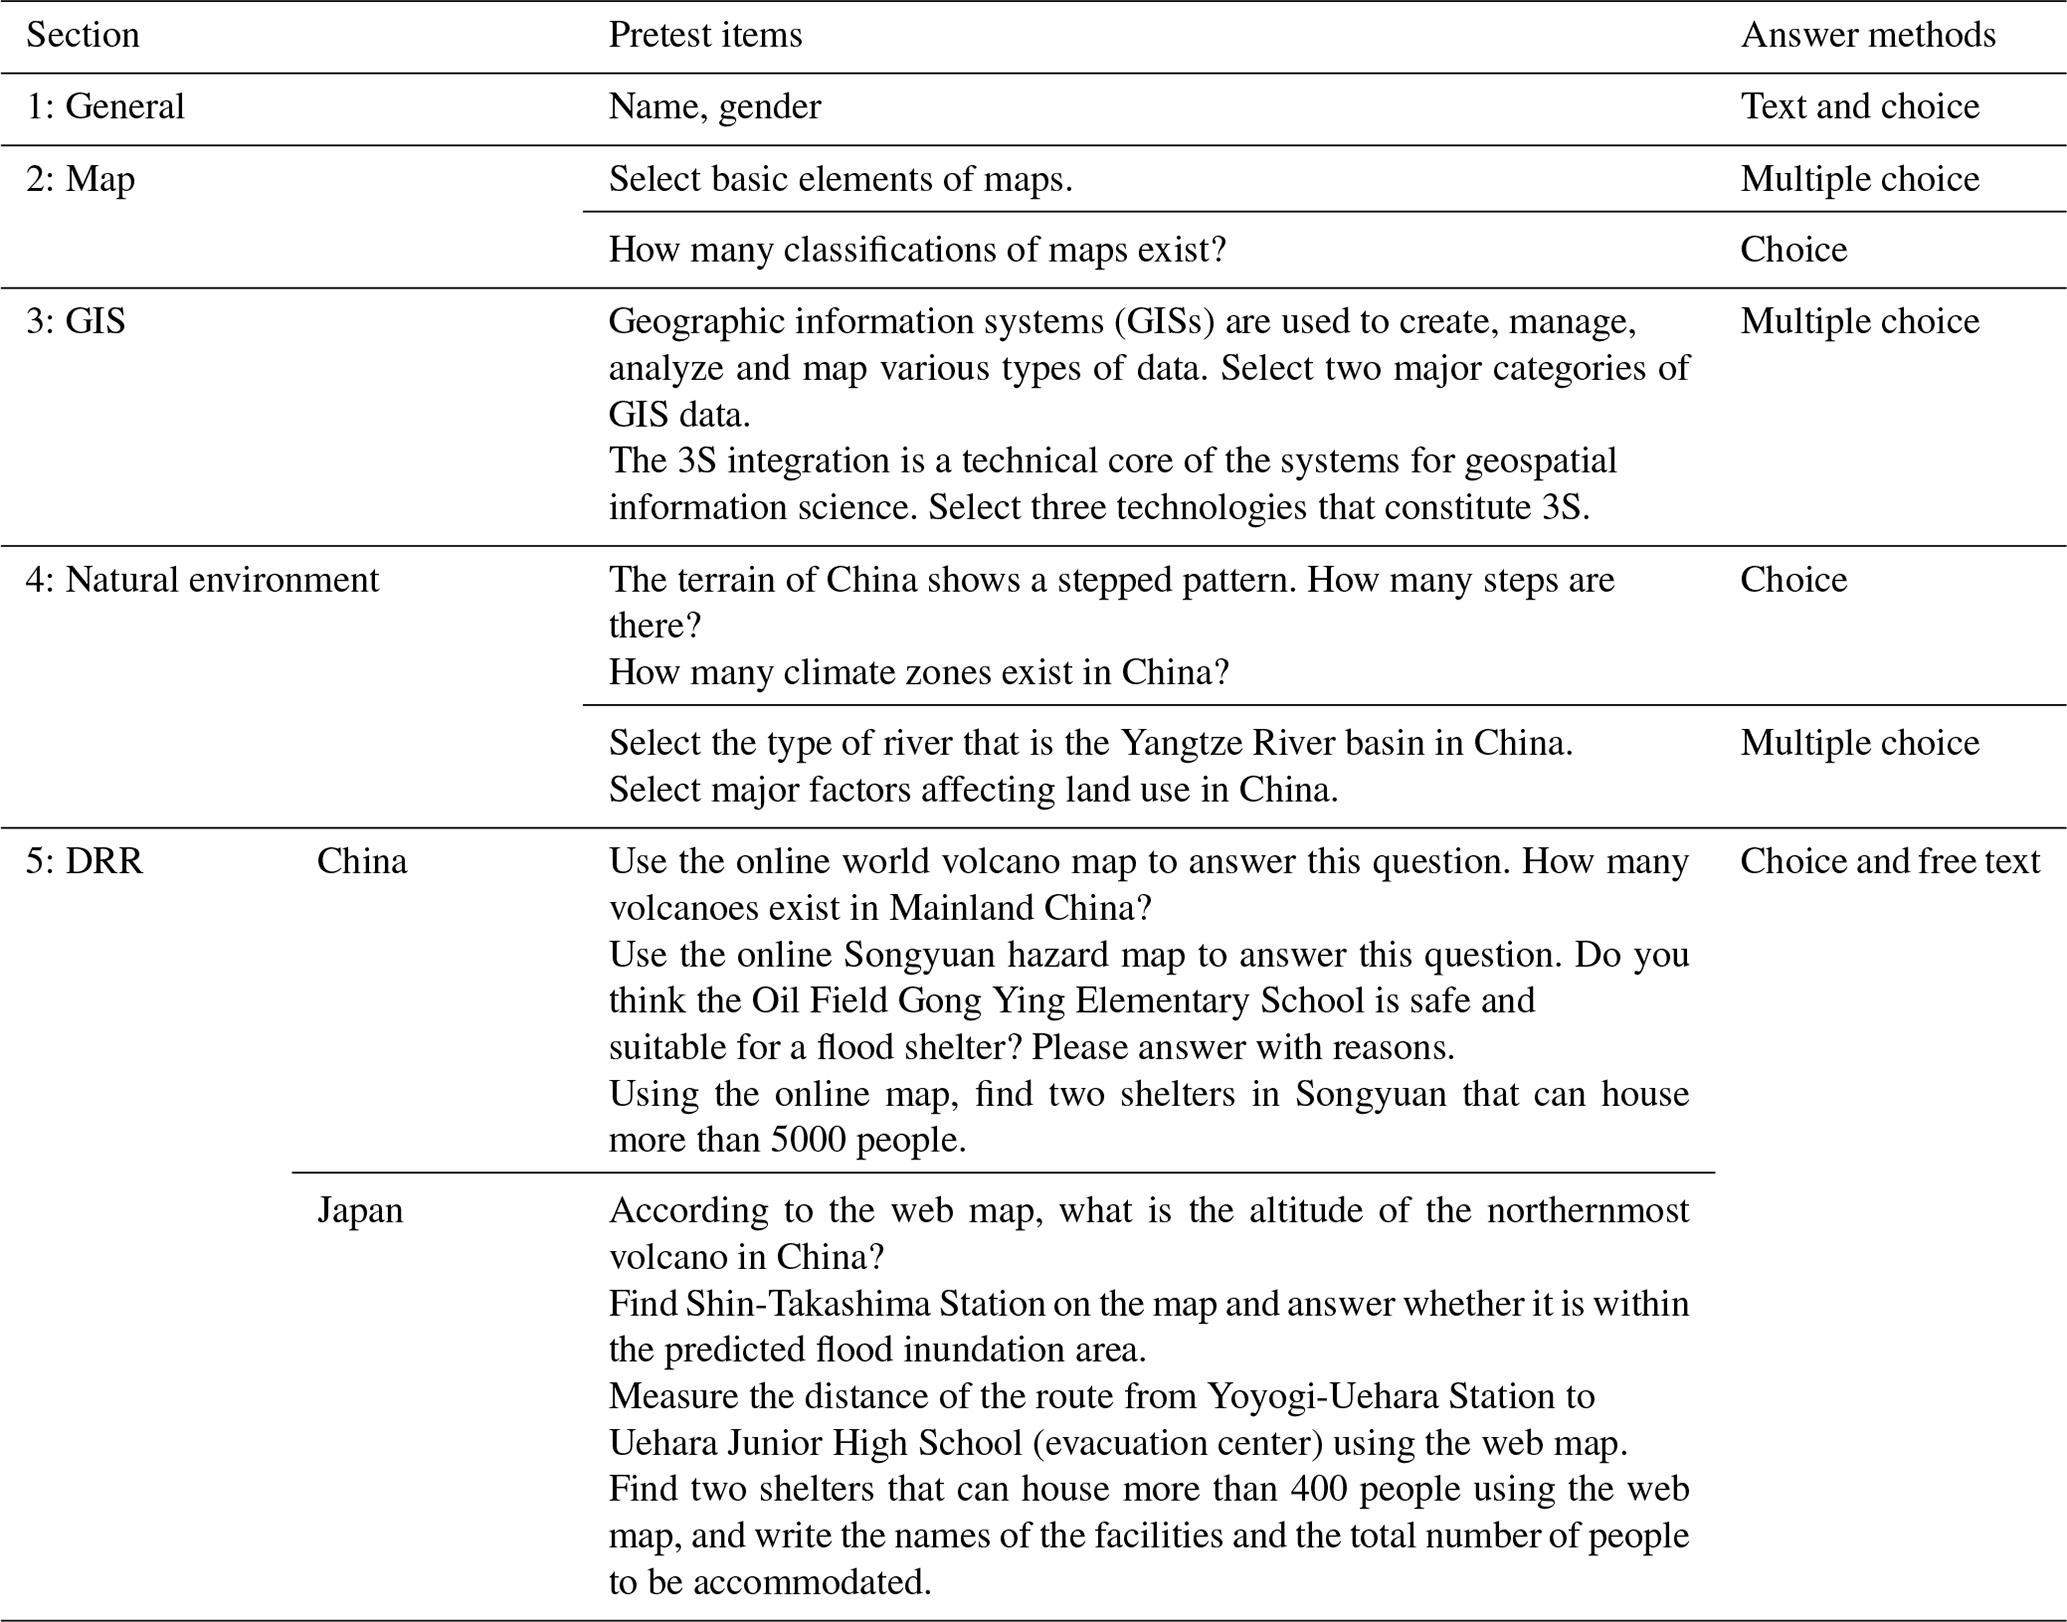
Table A3Items of the posttest.
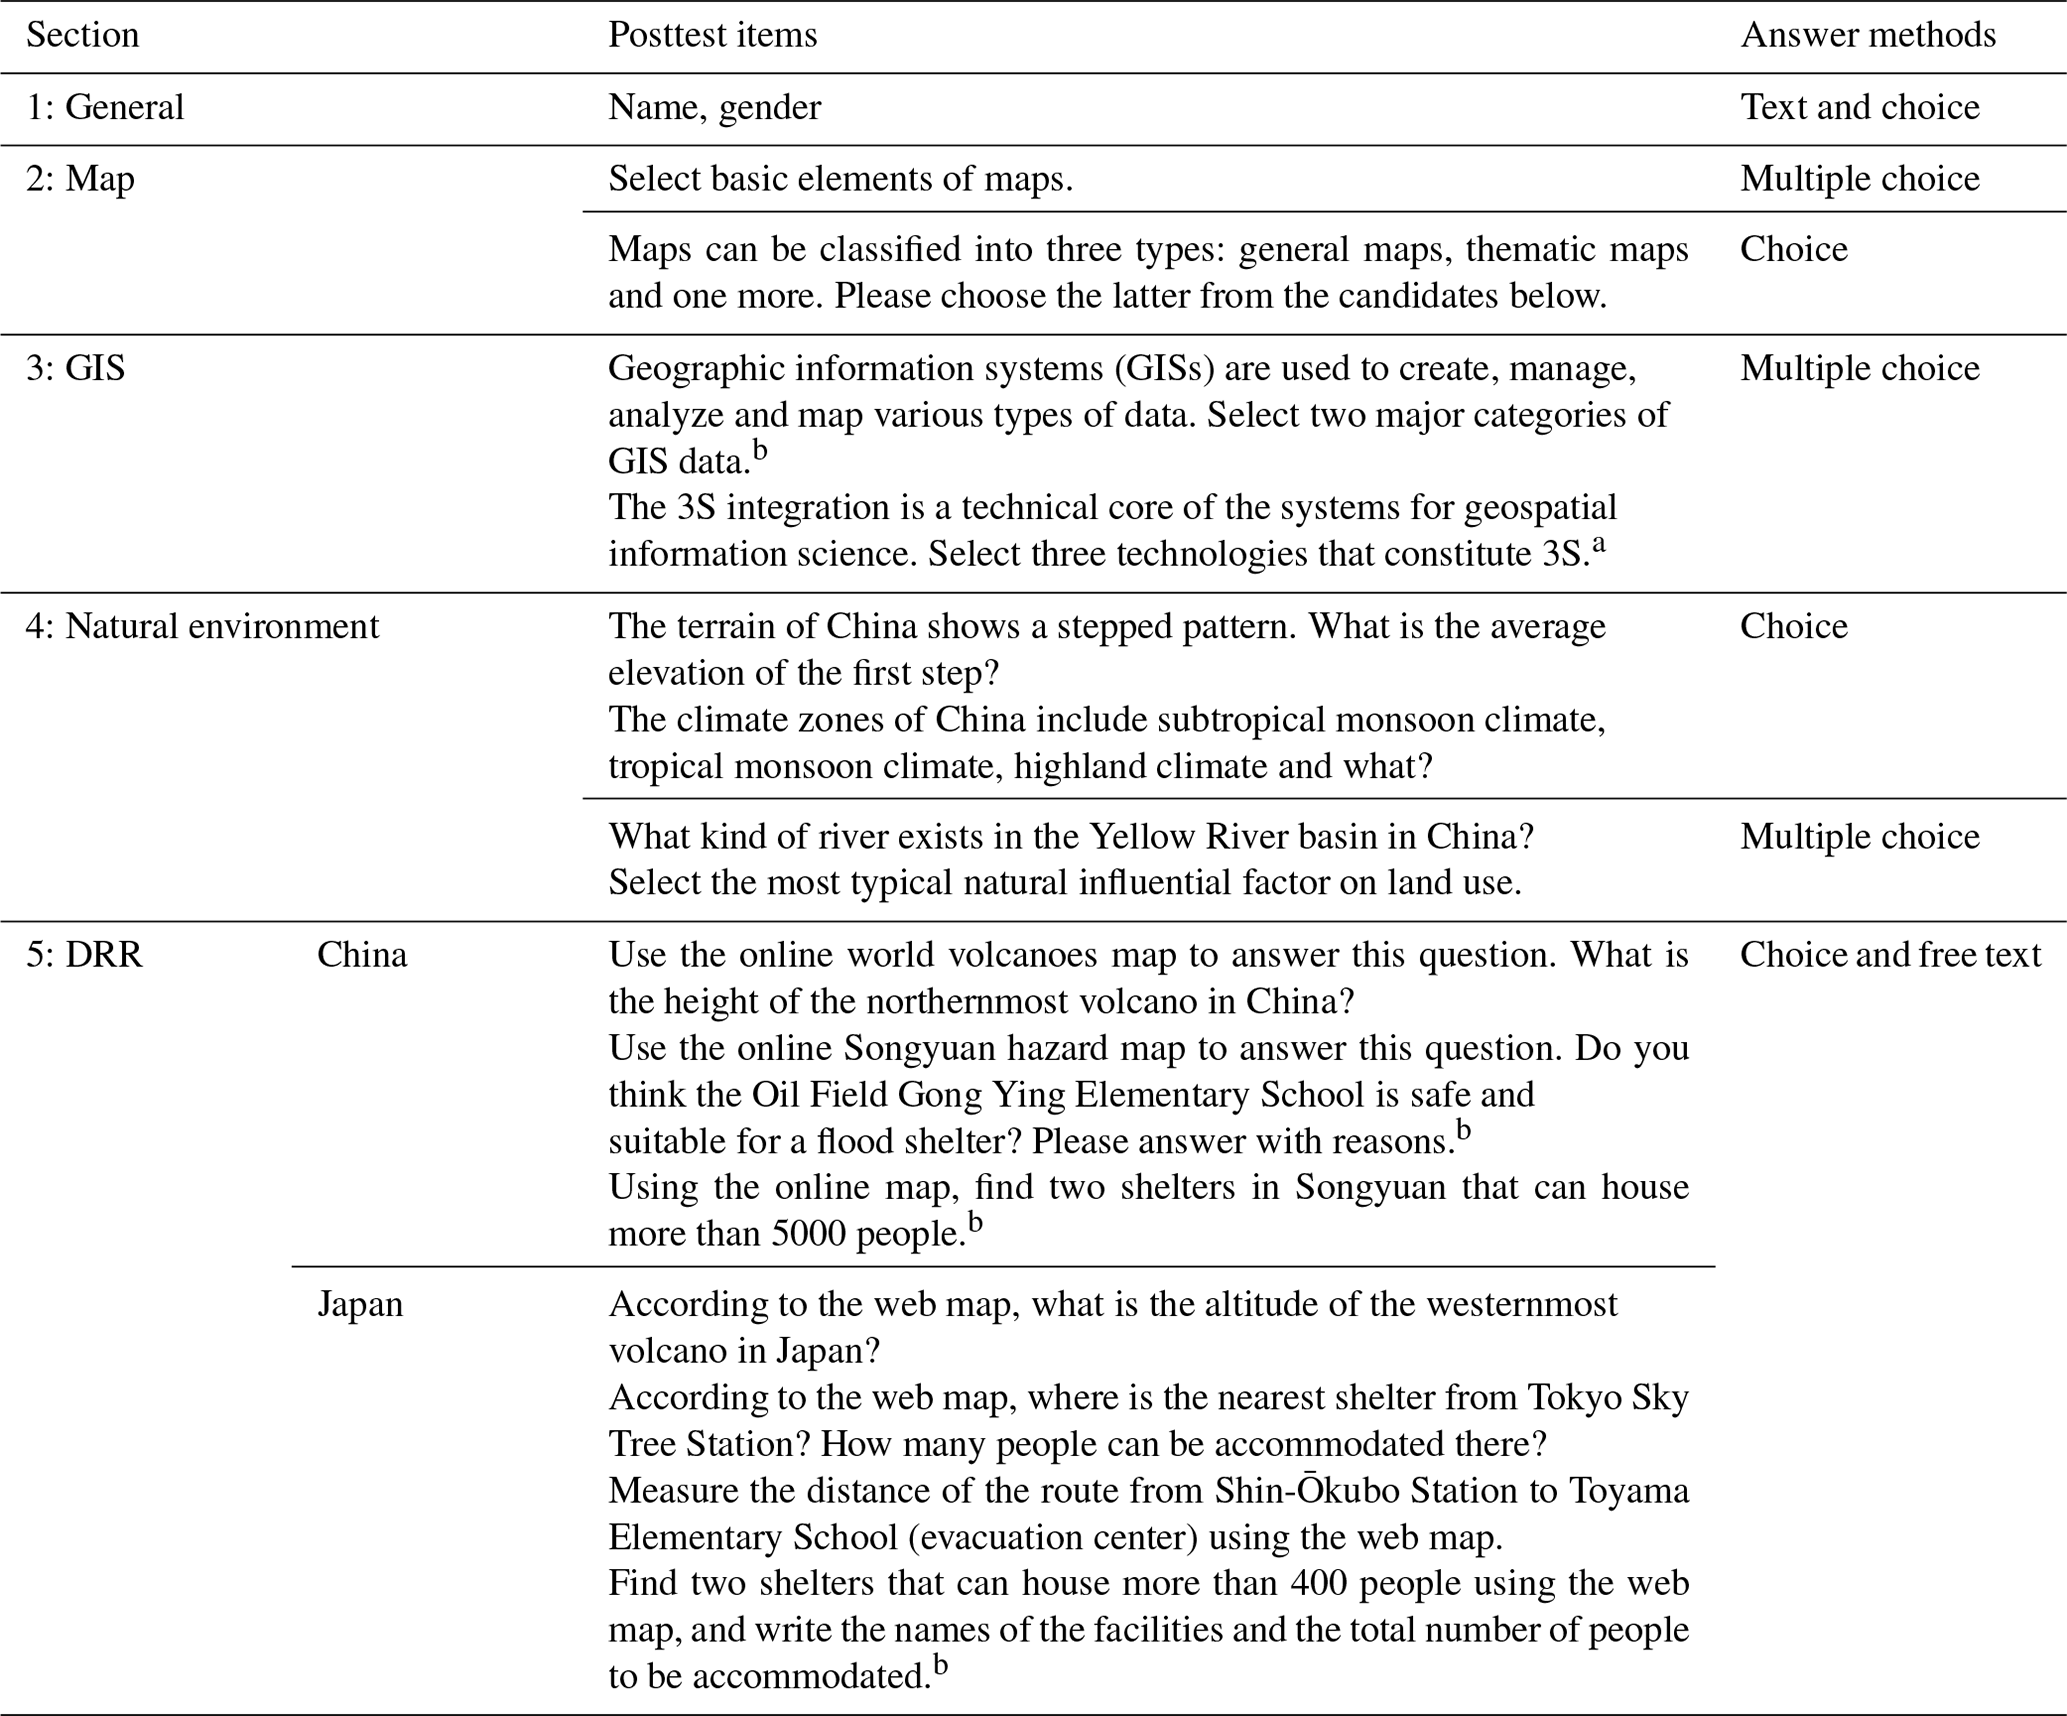
a Only modified the content and order of the options. b Same as the pretest.
All raw data can be provided by the corresponding authors upon request.
SJ developed the online disaster risk reduction materials, conducted the analysis and produced the paper draft; SJ, YH, TO and NY implemented the materials and curriculum at schools; and TO and JW reviewed and edited the paper.
The contact author has declared that none of the authors has any competing interests.
Publisher's note: Copernicus Publications remains neutral with regard to jurisdictional claims made in the text, published maps, institutional affiliations, or any other geographical representation in this paper. While Copernicus Publications makes every effort to include appropriate place names, the final responsibility lies with the authors.
This work was supported by the National Key Research and Development Program of China (grant no. 2021YFE0194300) and JSPS KAKENHI (grant no. JP21H00627). The first author is supported by the China Scholarship Council (CSC) of the Education Ministry of the People’s Republic of China.
This paper was edited by David J. Peres and reviewed by two anonymous referees.
Adnan, M.: Online learning amid the COVID-19 pandemic: Students perspectives, Journal of Pedagogical Sociology and Psychology, 1, 45–51, https://doi.org/10.33902/jpsp.2020261309, 2020.
Agung, A. S. S., Surtikanti, M. W., and Quinones, C. A.: Students' Perception of Online Learning during COVID-19 Pandemic: A Case Study on the English Students of STKIP Pamane Talino, Journal of Social Sciences and Humanities, 10, 225–235, 2020.
Akimoto, H. and Suzuki, E.: Issue and support on Integrated Geography-Focus on Maps/GIS, The Association of Japanese Geographers, https://www.jstage.jst.go.jp/article/ajg/2019s/0/2019s_196/_pdf/-char/ja (last access: 22 November 2023), 2019.
Ariyanti, Y., Yuana, R. A., and Budianto, A.: Web-based geographic information system for school mapping and disaster mitigation, 2018 Int. Conf. Inf. Commun., Yogyakarta, Indonesia, 6–7 March 2018, 136–140, https://doi.org/10.1109/ICOIACT.2018.8350764, 2018.
Bednarz, R. S. and Lee, J.: The components of spatial thinking: Empirical evidence, Procd. Soc. Behv., 21, 103–107, https://doi.org/10.1016/j.sbspro.2011.07.048, 2011.
Bernhardsdottir, A. E., Musacchio, G., Ferreira, M. A., and Falsaperla, S.: Informal education for disaster risk reduction, B. Earthq. Eng., 14, 2105–2116, https://doi.org/10.1007/s10518-015-9771-9, 2016.
Bodzin, A.: Using Educative Curriculum Materials to Support Teacher Enactment of a Geospatial Science Curriculum, SITE 2015 – Society for Information Technology & Teacher Education International Conference, Las Vegas, NV, 6 March 2015, 1116–1124, https://eli.lehigh.edu/sites/eli.lehigh.edu/files/site2015.pdf (last access: 22 November 2023), 2015.
Britt, R.: Online Education: A Survey of Faculty and Students, American Society of Radiologic Technologists, 77, 183–190, 2006.
Collins, L.: The Impact of Paper Versus Digital Map Technology on Students' Spatial Thinking Skill Acquisition, J. Geogr., 117, 137–152, https://doi.org/10.1080/00221341.2017.1374990, 2018.
Fraenkel, J. R., Wallen, N. E., and Hyun, H. H.: How to Design and Evaluate Research in Education, ISBN 978-0-07-809785-0, 1993.
Hsu, H. P., Tsai, B. W., and Chen, C. M.: Teaching Topographic Map Skills and Geomorphology Concepts with Google Earth in a One-Computer Classroom, J. Geogr., 117, 29–39, https://doi.org/10.1080/00221341.2017.1346138, 2018.
Kim, E. S. and Willson, V. L.: Evaluating pretest effects in pre-post studies, Educ. Psychol. Meas., 70, 744–759, https://doi.org/10.1177/0013164410366687, 2010.
Li, J.: What is DingTalk, Alibaba's Slack equivalent that quarantined kids in China hate?, https://finance.yahoo.com/news/dingtalk-alibaba-slack-equivalent-quarantined-112217524.html, last access: 15 September 2020.
Li, J., Xia, H., Qin, Y., Fu, P., Guo, X., Li, R., and Zhao, X.: Web GIS for Sustainable Education: Towards Natural Disaster Education for High School Students, Sustainability, 14, 1–18, https://doi.org/10.3390/su14052694, 2022.
Lin, P. S. S. and Chang, K. M.: Metamorphosis from local knowledge to involuted disaster knowledge for disaster governance in a landslide-prone tribal community in Taiwan, Int. J. Disast. Risk Re., 42, 101339, https://doi.org/10.1016/j.ijdrr.2019.101339, 2020.
La Longa, F., Camassi, R., and Crescimbene, M.: Educational strategies to reduce risk: A choice of social responsibility, Ann. Geophys., 55, 445–451, https://doi.org/10.4401/ag-5525, 2012.
Mishra, L., Gupta, T., and Shree, A.: Online teaching-learning in higher education during lockdown period of COVID-19 pandemic, Int. J. Ed. R., 1, 100012, https://doi.org/10.1016/j.ijedro.2020.100012, 2020.
Mulyasari, F., Takeuchi, Y., and Shaw, R.: Chapter 7 Implementation Tools for Disaster Education, Disaster Educ., 7, 137–151, 2015.
Muñoz, V. A., Carby, B., Abella, E. C., Cardona, O. D., López-Marrero, T., Marchezini, V., Meyreles, L., Olivato, D., Trajber, R., and Wisner, B.: Success, innovation and challenge: School safety and disaster education in South America and the Caribbean, Int. J. Disast. Risk R., 44, https://doi.org/10.1016/j.ijdrr.2019.101395, 2020.
Muttarak, R. and Lutz, W.: Is education a key to reducing vulnerability to natural disasters and hence unavoidable climate change?, Ecol. Soc., 19, 42, https://doi.org/10.5751/ES-06476-190142, 2014.
Pappas, P. A. and Depuy, V.: An Overview of Non-parametric Tests in SAS®: When, Why, and How, 1–5, https://analytics.ncsu.edu/sesug/2004/TU04-Pappas.pdf (last access: 22 November 2023), 2004.
Petal, M.: Disaster Prevention for Schools: Guidance for Education Sector Decision-Makers, 54 pp., https://doi.org/10.1016/S0886-3350(99)80132-1, 2008a.
Petal, M. A.: Concept Note: Formal and Informal Education for Disaster Risk Reduction, TS25, https://eli.lehigh.edu/sites/eli.lehigh.edu/files/site2015.pdf (last access: 22 November 2023), 2008b.
Pielke, R.: Tracking progress on the economic costs of disasters under the indicators of the sustainable development goals, Environ. Hazards, 18, 1–6, https://doi.org/10.1080/17477891.2018.1540343, 2019.
QUARTZ: What is DingTalk, Alibaba’s Slack equivalent that quarantined kids in China hate?, https://finance.yahoo.com/news/dingtalk-alibaba-slack-equivalent-quarantined-112217524.html, last access: 15 September 2020.
QuestionPro: Experimental research – Definition, types of designs and advantages: https://www.questionpro.com/blog/experimental-research/ (last access: 23 November 2023), 2022.
Reyes, M. L., Diopenes, V. E., Co, R., and Berse, P.: Disaster Resilience Starts with the Young: Mainstreaming Disaster Risk Reduction in the School Curriculum, ISBN 9786028411691, 2011.
Sari, K. P., Komalasari, R., and Kanegae, H.: Disaster learning through a map-based mobile application: An evaluation of its readability and user satisfaction, IOP Conf. Ser.-Earth Environ. Sci., 592, 012004, https://doi.org/10.1088/1755-1315/592/1/012004, 2020.
Segrave, S. and Holt, D.: Contemporary learning environments: Designing e-Learning for education in the Professions, Distance Educ., 24, 7–24, https://doi.org/10.1080/01587910303044, 2003.
Serhan, D.: Transitioning from Face-to-Face to Remote Learning: Students' Attitudes and Perceptions of using Zoom during COVID-19 Pandemic, International Journal of Technology in Education and Science, 4, 335–342, https://doi.org/10.46328/ijtes.v4i4.148, 2020.
Shirai, D., Oka, M., Yamamoto, S., and Mori, H.: Proposal of Educational Curriculum of Creating Hazard Map with Tablet-Type Device for Schoolchildren, in: Human Interface and the Management of Information: Supporting Learning, Decision-Making and Collaboration, 74–84, https://doi.org/10.1007/978-3-319-58524-6_7, 2017.
Shiwaku, K. and Fernandez, G.: Chapter 3 Roles of School in Disaster Education, in: Disaster Education, Vol. 7, edited by: Shaw, R., Shiwaku, K., and Takeuchi, Y., Emerald Group Publishing Limited, 45–75, https://doi.org/10.1108/S2040-7262(2011)0000007009, 2011.
Song, J., Yamauchi, H., Oguchi, T., and Ogura, T.: Application of web hazard maps to high school education for disaster risk reduction, Int. J. Disast. Risk Re., 72, 102866, https://doi.org/10.1016/j.ijdrr.2022.102866, 2022.
Soroka, V.: Digital Education in the International Pedagogical Discourse, Comparative Professional Pedagogy, 9, 74–81, https://doi.org/10.2478/rpp-2019-0040, 2020.
Sutanta, H., Rajabifard, A., and Bishop, I. D.: Integrating Spatial Planning and Disaster Risk Reduction at the Local Level in the Context of Spatially Enabled Government, Spatially Enabling Society Research, Emerging Trends and Critical Assessment, 55–68, https://rest.neptune-prod.its.unimelb.edu.au/server/api/core/bitstreams/1e476351-28ac-55c4-8c93-ed2c79768e48/content (last access: 23 November 2023), 2014.
Talero, G.: Environment Education and Public Awareness, 1–12, https://worldfish.org/PPA/PDFs/Semi-Annual%20II%20English/2nd%20s.a.%20eng_F2.pdf (last access: 22 November 2023), 2004.
Tanaka, K.: The impact of disaster education on public preparation and mitigation for earthquakes: A cross-country comparison between Fukui, Japan and the San Francisco Bay Area, California, USA, Appl. Geogr., 25, 201–225, https://doi.org/10.1016/j.apgeog.2005.07.001, 2005.
Tuladhar, G., Yatabe, R., Dahal, R. K., and Bhandary, N. P.: Knowledge of disaster risk reduction among school students in Nepal, Geomat. Nat. Haz. Risk, 5, 190–207, https://doi.org/10.1080/19475705.2013.809556, 2014.
Uchida, O., Tajima, S., Kajita, Y., Utsu, K., Murakami, Y., and Yamada, S.: Development and Implementation of an ICT-based Disaster Prevention and Mitigation Education Program for the Young Generation, Inform. Syst. Front., 23, 1115–1125, https://doi.org/10.1007/s10796-020-10082-9, 2020.
United Nations International Strategy for Disaster Reduction (UNISDR): Making Development Sustainable: The Future of Disaster Risk Management, Global Assessment Report on Disaster Risk Reduction, 311 pp., https://www.undrr.org/publication/global-assessment-report-disaster-risk-reduction-2015 (last access: 22 November 2023), 2015.
VOXCO: Pre-experimental Design: Definition, Types & Examples: https://www.voxco.com/blog/pre-experimental-design-definition-types-examples/, last access: 25 April 2022.
Yan, L., Whitelock-Wainwright, A., Guan, Q., Wen, G., Gašević, D., and Chen, G.: Students' experience of online learning during the COVID-19 pandemic: A province-wide survey study, Brit. J. Educ. Technol, 52, 2038–2057, https://doi.org/10.1111/bjet.13102, 2021.
Zhu, T.-T. and Zhang, Y.-J.: An investigation of disaster education in elementary and secondary schools: evidence from China, Nat. Hazards, 89, 1009–1029, https://doi.org/10.1007/s11069-017-3004-2, 2017.