the Creative Commons Attribution 4.0 License.
the Creative Commons Attribution 4.0 License.
 | 20 Oct 2023
Fixed photogrammetric systems for natural hazard monitoring with high spatio-temporal resolution
Xabier Blanch
Marta Guinau
Anette Eltner
Antonio Abellan
In this publication we address the lack of technical expertise in the geoscience community in the design and construction of photogrammetric systems for monitoring natural hazards at high spatio-temporal resolution. Accordingly, we provide in-depth information on the components, assembly instructions, and programming codes required to build them, making them accessible to researchers from different disciplines who are interested in 3D change detection monitoring. Each system comprises five photographic modules and a wireless transmission system for real-time image transfer. As an alternative to lidar (light detection and ranging), high-end digital cameras offer a simpler and more cost-effective solution for the generation of 3D models, especially in fixed time-lapse monitoring systems. The acquired images, in combination with algorithms that allow the creation of improved 3D models, offer change detection performance comparable to lidar. We showcase the usefulness of our approach by presenting real-world applications in the field of geohazard monitoring. Our findings highlight the potential of our method to detect pre-failure deformation and identify rockfalls with a theoretical change detection threshold of only 3–4 cm, thereby demonstrating the potential to achieve similar accuracies to lidar but at a much lower cost. Furthermore, thanks to the higher data acquisition frequency, the results show how the overlap of events that leads to an erroneous interpretation of the behaviour of the active area is minimized, allowing, for example, more accurate correlations between weather conditions and rockfall activity.
- Article
(10097 KB) - Full-text XML
-
Supplement
(2279 KB) - BibTeX
- EndNote


Close-range remote sensing monitoring is a powerful tool for understanding and capturing natural environments, especially used in the field of natural hazards (Giordan et al., 2022). Its ability to provide detailed and accurate data in real time makes it a key monitoring tool in natural science research. This approach applied in the investigation, modelling, and understanding of geological hazards is of utmost importance for our society, with a wide range of applications including the investigation of landslide phenomena using different 3D surveying techniques, such as traditional photogrammetry (Gili et al., 2021), lidar (Jaboyedoff et al., 2012), and advanced systems that can detect volumetric changes (Kromer et al., 2019) and pre-failure deformation (Royán et al., 2014) on active rockfalls.
Among the different close-range monitoring strategies that can process both 2D and 3D information, digital photogrammetry has played a crucial role in the monitoring of natural hazards. Its popularity is reflected in the large number of publications that use photographic images to make 2D measurements or obtain point clouds for 3D analysis (Anderson et al., 2019). As an example, evidence of this role is the widespread use of really low-cost, easy-to-install cameras capturing time-lapse images, such as (a) wild cameras for glacier front monitoring (Mallalieu et al., 2017) or (b) Raspberry Pi cameras to monitor rockfalls (Blanch et al., 2020; Santise et al., 2017). While these cameras offer a novel, ready-to-use, and quite cost-effective resource for 2D and 3D monitoring, their limitations, such as low-resolution images and significant geometric distortion in the captured images, must be taken into account. In consequence, there is a motivation to explore photogrammetric systems for 3D monitoring using digital cameras whose price, size, and weight are not constraints.
The use of high-definition photogrammetric systems for 3D monitoring can yield superior results in comparison to the low-cost systems. By deploying fixed time-lapse systems equipped with high-quality cameras and lenses, researchers can acquire 3D models that can be compared to those captured by other high-end monitoring devices, albeit at a lower cost. High-end cameras for digital photogrammetry also offer several advantages, including lower infrastructure costs, ease of installation in remote locations, and a low learning curve, contributing to its democratization as a monitoring strategy in geosciences (Eltner and Sofia, 2020; Smith et al., 2015; Westoby et al., 2012). As an example of its widespread use, high-end photogrammetric systems are employed to analyse and monitor objects and surfaces in a wide variety of fields such as building structures (for example, Artese et al., 2016; Bartonek and Buday, 2020; Castellazzi et al., 2015; Meidow et al., 2018) or natural surfaces (for example, Eltner et al., 2016; Nesbit and Hugenholtz, 2019; Westoby et al., 2012).
When high-end cameras are installed as a single system, the camera can capture time-lapse image sequences from a single location, which have been widely utilized in various scientific studies that work with 2D data. Evidence of the effectiveness of such an approach can be found in numerous publications like (a) the use of a camera for semiautomatic flood monitoring of a proglacial outwash plain (Hiller et al., 2022), (b) the installation of a camera to monitor the active areas on Alpine terrain (Hendrickx et al., 2022; Travelletti et al., 2012), (c) the tracking of glaciers with a monoscopic camera (Hadhri et al., 2019; Schwalbe and Maas, 2017), or (d) the monitoring of processes in glacial fronts (How et al., 2019; Lenzano et al., 2014).
Integrating a second photographic module enables the creation of a basic photogrammetric strategy, i.e. stereo-pair time lapse. 3D information can be derived from the 2D images captured utilizing photogrammetric processing algorithms. Thereby, 3D models can be reconstructed providing a more comprehensive understanding of the monitored subject's spatial characteristics. The advantages of this strategy are illustrated in the various studies covering different fields of geosciences: (a) the use of oblique stereo-pair time-lapse imagery to characterize active lava flows (James and Robson, 2014a), (b) the application of two cameras fixed on a monorail to perform interior tunnel monitoring (Attard et al., 2018), (c) the assessment of a two-camera system for fluvial surface monitoring (Bertin et al., 2015), (d) the installation of two cameras for rockfall monitoring (Giacomini et al., 2020; Roncella et al., 2021), or (e) the setup of two cameras to analyse glacial oscillations in the Glaciar Perito Moreno (Lenzano et al., 2018).
As a result of the performance of structure-from-motion and multi-view stereo algorithms (SfM–MVS), which has been extensively detailed in the literature (for example, Eltner and Sofia, 2020; Iglhaut et al., 2019; James and Robson, 2014b; Westoby et al., 2012), it is becoming increasingly common to observe the deployment of more comprehensive photogrammetric systems for the purposes of monitoring natural hazards. Notable examples of such systems, resembling the approach proposed in this publication, are the five cameras installed at a distance of 80 m to a slope for rockfall monitoring (Kromer et al., 2019); this system had data transfer capabilities and could achieve a level of detection between 0.02 and 0.03 m. A similar approach was recently conducted by Núñez-Andrés et al. (2023) with an installation of three cameras in front of the Castellfollit de la Roca cliff (NE Spain) with the aim to identify pre-failure deformations. Finally, Kneib et al. (2022) installed two sets of cameras (12 in total) in debris-covered glaciers in High Mountain Asia (China) to analyse the melt rates on a subseasonal basis.
However, these publications did not provide comprehensive descriptions of the construction of the high-end photogrammetric systems, the products used, or the codes developed for its operation. Moreover, not all of these systems were capable of transmitting data remotely. Sometimes they are controlled by basic intervalometers or they are installed in urban environments with access to the power grid. These monitoring systems can be implemented using a variety of methods and materials, including expensive commercial systems. But this study focuses on the systems that are installed on a fixed or semipermanent basis and require custom-built enclosures, batteries, and control systems, tailored to the particular needs of the research and which can be built DYI (do it yourself).
High-end photogrammetry vs. lidar
In the field of geosciences, lidar has become a popular method for 3D surface monitoring due to its ability to capture 3D models from long distances and at high speeds. This leads to significant advancements, for example, in the characterization of rockfalls (Abellán et al., 2006; Royán et al., 2014) or in the monitoring of large landslides (Jaboyedoff et al., 2012) using high-frequency data acquisition. These advances, coupled with the high quality of the data, especially considering the spatially consistent error behaviour, have resulted in a steady increase in the use of lidar in geosciences (Guzzetti et al., 1999; McKean and Roering, 2004; Buckley et al., 2008; Tarolli, 2014; Tonini and Abellan, 2014).
Despite its many advantages, lidar technology also presents certain limitations such as high infrastructure costs, difficulties in the use in remote locations, and high fixed installation costs (Cook, 2017; Smith et al., 2015). These challenges make lidar implementation incompatible for a massive deployment in the field of natural hazard monitoring (Cook, 2017; Sturzenegger et al., 2007; Wilkinson et al., 2016) where data collection needs to be repeated periodically.
Many studies have attempted to assess the accuracy of digital photogrammetry in geosciences (Brunier et al., 2016; Cook, 2017; Eltner and Schneider, 2015; James and Quinton, 2014; Luhmann et al., 2016; Buckley et al., 2008; Smith et al., 2015). Thanks to advances in digital photogrammetry and computer vision, the image-based 3D reconstruction results can now be compared to those obtained by lidar (Cook and Dietze, 2019; James and Robson, 2012; Rowley et al., 2020; Stumpf et al., 2015). Furthermore, the effectiveness of high-end photogrammetry for fixed time-lapse monitoring can be comparable to that obtained using lidar technology (Kromer et al., 2019), which highlights the potential of ad hoc fixed photogrammetric systems as a viable alternative to real-time natural hazard monitoring.
However, there is a requirement for further progression in the realm of high-resolution photogrammetric systems. In particular, there is a pressing need to make the installation more robust, improve the reliability of these systems in order to guarantee time-lapse acquisition, and increase real-time data capture and transmission to support autonomous data collection in harsh environments. Such advancements, along with the integration of advancements in point cloud and SfM–MVS processing (Blanch et al., 2020; Brodu and Lague, 2012; Feurer and Vinatier, 2018; Gómez-Gutiérrez et al., 2015), can enable these systems to carry out real long-term natural hazard monitoring with accuracy and reliability comparable to lidar but at a significantly lower cost.
Lastly, these lidar vs. digital photogrammetry comparisons cannot be generalized because they are dependent on factors such as the camera used, the number of photographs taken, and the distance and shape of the object (Eltner et al., 2016). Due to these complex uncertainties, one potential way to analyse the performance of the 3D measurement methods consists of making measurements of the same object with the acquisition instrument emplaced at the same distance. Thus, this study compares change detection metrics using lidar instrumentation (Abellán et al., 2010) with the high-resolution photogrammetric system described in this publication. Both data acquisitions have been carried out on the Puigcercós study area (NE, Spain) with the lidar and the cameras placed at the same distance from the escarpment.
The subsequent section delves into the specific requirements for autonomous photogrammetric systems by providing a comprehensive overview of their components and assembly. A practical demonstration of their application in real-world scenarios is then presented along with the resultant data and an evaluation of their reliability for rockfall monitoring. Finally, insightful discussions on potential areas of improvement and the mitigation of common errors are provided, with the goal of advancing fixed time-lapse photogrammetric systems for change detection monitoring.
With the aim of assisting researchers from various disciplines who may not have experience in photography, electronics, or computing, this publication provides open access to assembly instructions, programming codes, and components used to successfully develop advanced high-resolution photogrammetric systems. There is a large opportunity to empower society in acquiring more data and gaining a deeper understanding of its environment by making this information freely accessible. This not only has the potential to enhance the knowledge across disciplines, but also increase the overall safety and security of society by providing a greater awareness of its environment and its hazards, regardless of society's economic resources.
2.1 Photogrammetric system
There is no consensus in the literature on the definition of a photogrammetric system. The works shown earlier use different photographic modules to obtain time-lapse images from which 3D models can be reconstructed. Each of these systems has its own peculiarities and is adapted to the specific research task. Therefore, it is difficult to homogenize the basic characteristics that define a photogrammetric system versus a simple camera array.
We describe a photogrammetric system as a set of synchronized cameras able to simultaneously capture images of an object aiming to generate a 3D reconstruction of the reality. The autonomous system described in this work is characterized by its ability to reliably monitor remote areas for a long period of time without the need for on-site intervention. The photogrammetric system consists of a combination of basic components including a set of imaging devices comprising of a lens and sensor, a control unit for data acquisition, a robust network infrastructure for data transmission, and a self-sufficient power supply to ensure continuous operation in remote locations. The development of these systems is based on three basic principles:
- i.
On demand. Control units must allow full control of the shooting times and modes of the camera, for example capturing a rapid sequence of 15 photographs (burst mode) every 5 h during the day. Note that systems with an external trigger, for example, associated with a rain sensor, humidity sensor, or seismic sensor, should also be considered programmable because they can acquire the data on demand, too (e.g. camera triggered by a change in infrared levels in Hereward et al., 2021).
- ii.
Data transfer. Due to the large amount of data that can be acquired with these systems, the photogrammetric systems should be remotely accessible to facilitate data transfer in both directions, i.e. capable of transmitting data as well as receiving basic programming instructions. In addition, IoT-based (Internet of Things) approaches where processing is done on-site and only a small data amount, e.g. a result or alarm, is transmitted are also considered “data transfer” devices.
- iii.
Stand-alone power system. Fixed monitoring systems can be supplemented with appropriate power systems that allow not only a high degree of autonomy but also the ability to be self-sufficient from a power consumption standpoint. Thanks to the use of batteries, solar panels, or other alternative power sources, it is now possible to install photogrammetric systems on remote locations without access to conventional electrical infrastructure. Additionally, the use of very low-energy-consumption systems that allow several months up to years of operation are also considered.
Although much cheaper photogrammetric systems may be available (based on low-cost sensors), the design presented here is also referred to as low cost or low budget according to the general terminology used in the literature (for example, Anderson et al., 2019; Gabrieli et al., 2016; Giordan et al., 2016; Khan et al., 2021). This is because the final cost of the system is largely controlled by the cost of the camera and lens, which can be easily adapted to the budget and is much lower than other systems such as lidar, radar, or total station (Smith et al., 2015).
2.2 Components of the photogrammetric systems
Several key components are required to create a photogrammetric system such as the photographic modules discussed in this study – the cameras, the control units, and the electronics that enable an advanced acquisition system; the system of data transmission; and the real-time photogrammetric processing workflow (Blanch et al., 2021). Figure S1 in the Supplement shows the materials used for the development of the photogrammetric systems in detail. In this study we share the knowledge and experience gained from the systems installed at the Puigcercós cliff (NE Spain), located in the Origens UNESCO Global Geopark and at the Alhambra de Granada (S Spain), a UNESCO World Heritage place. Both are protected areas of high cultural value that present rockfall activity.
The purpose of giving full details on the different elements that make up the photogrammetric system (i.e. brands and models), including the explanation of their assemblage and functioning, is to provide specific information to non-experts who would like to set up their own autonomous 3D monitoring system. The decision to explain the components in detail is associated with the possibility of sharing the codes (software) and making them fully functional – i.e. plug and play – with the provided hardware. The codes can be found in open-source format in the first author's GitHub repository which can be found at https://github.com/xabierblanch/DSLR-System (last access: 13 October 2023).
2.2.1 Photographic sensor and lens
Three different camera models and lenses have been tested. At the Puigcercós study site three photographic modules use a full-frame (35.9×24 mm) mirrorless Sony Alpha 7R III with a resolution of 42.4 MPx (pixel pitch of 4.51 µm). These cameras are equipped with a 35 mm f/2.8 lens. Two other photographic modules use a Canon 77D digital single lens reflex (DSLR) camera with an APS-C sensor (22.3×14.9 mm) and a resolution of 24.2 MPx (3.72 µm pixel pitch). The Canon cameras are equipped with a 24 mm f/2.8 pancake lens. Using a 24 mm lens on a cropped APS-C sensor produces approximately the same field of view as a 35 mm full-frame lens (Fig. S1a and b).
At the Alhambra de Granada study site all five photographic modules were set up with the Nikon D610 DSLR full-frame camera (35.9×24 mm) with a resolution of 24.3 MPx (5.95 µm pixel pitch). This publication also includes some preliminary evaluations with the Nikon Z5, a full-frame (35.9 × 24 mm) mirrorless camera with 24 MPx resolution (5.97 µm pixel pitch).
2.2.2 Control unit and real-time clock – RTC
A microcomputer is used as the control system of the photographic modules. The unit control is a Raspberry Pi 3 model B+ (Fig. S1c). It operates the system, controls image capture, transmits data, and manages the camera's battery. A commercial Witty Pi 3 board from UUGear is used as a real-time clock and power management system for the Raspberry Pi 3 (Fig. S1d). Specifically, the Witty Pi board allows the interruption of the activation of the system shutdown through the GPIO (general purpose input/output) pinouts of the Raspberry Pi. This function is used in our design to allow remote access, without time limitation, to enable code modifications and upgrades of the system.
2.2.3 Network connection system
The photogrammetric system includes a network infrastructure that allows images to be uploaded to a server. The solution provided in the repository codes is based on the Dropbox data transfer system. However, the same solution can be applied to private servers or other proprietary and open-source cloud systems (Fig. S1e). In addition, a connectivity unit is used in the Puigcercós (NE, Spain) and Alhambra de Granada (S, Spain) study areas with dedicated hardware to provide 4G connectivity to the study area. The main component of this system is the router with 4G capabilities that converts the phone signal into Wi-Fi. The router is powered by a battery and a solar panel (in the same way as the photographic modules). A 12 V timer is in charge of switching the router on and off to prevent wasting energy during periods of inactivity.
The system is modular and easily scalable. In the case of the Puigcercós connectivity module the default omnidirectional antennas of the modem have been replaced by longer-range antennas, both to receive the 4G signal (directional panel antenna) and to send the Wi-Fi signal to the photographic modules (semidirectional antenna). For the 4G antenna it is recommended to use panel antennas that have a highly concentrated radiation pattern at a single point. With a precise installation, this antenna can be oriented in the direction of the nearest telephone antenna and optimize the radiation pattern to obtain the highest possible energy. Figure S2 in the Supplement shows the assembly scheme of the connectivity system, and Fig. S3 shows some images of the connectivity modules installed at the Puigcercós and the Alhambra de Granada study sites.
2.2.4 Power supply and electrical components
The system employs 12 V batteries to power its components (Fig. S1f) because they require a higher voltage and consume more power than very low-cost alternatives which often use small batteries (1.5 V) or power banks (5 V). The sealed lead AGM batteries used in the system have been proven to be reliable and durable with capacities ranging from 7 to 12 Ah. Solar panels of 10 or 20 W have been utilized to power the batteries (Fig. S1g). The panels must be connected to a solar charge controller (Fig. S1h), which manages the battery's charging and discharging processes.
The designed system is characterized by the need for small electronic elements that are responsible for adapting the power supply that reaches all the devices. The DC–DC voltage converter is responsible for modifying the 12 V voltage of the power supply, i.e. the battery, to the required voltages (Fig. S1h). Typically, one converter will be needed to modify the voltage to suit the requirements of the camera and one converter will be needed to supply the power to the control unit. The second electrical component is the relay. The relays can be either mechanical or based on MOSFETs (metal-oxide-semiconductor field-effect transistors) (Fig. S1i). One relay is responsible for disconnecting the camera and saving energy, while the second relay plays an important role in allowing remote access to the Raspberry Pi as its activation prevents the Witty Pi from automatically shutting down the Raspberry Pi. These are the two main systems that are needed for adapting the power supply.
2.2.5 Protective case
All these components have been installed in an enclosure to protect them from environmental conditions (Fig. 1a and b). The boxes were perforated to embed a circular photographic filter which acts as protective glass. For the specific development of the Puigcercós and Alhambra de Granada systems, metal boxes were used, which provided very good robustness but poor reception of the Wi-Fi signal. The anchoring of the boxes in their location varies depending on the characteristics of the study area. In the case of Puigcercós concrete bases built ad hoc were used to anchor the boxes (Fig. 1c), while in Granada they were mainly located in building sites, such as window frames or balconies. In the same way, the solar panels were either supported on the wall or anchored by means of pillars on the concrete bases (Fig. 1d).
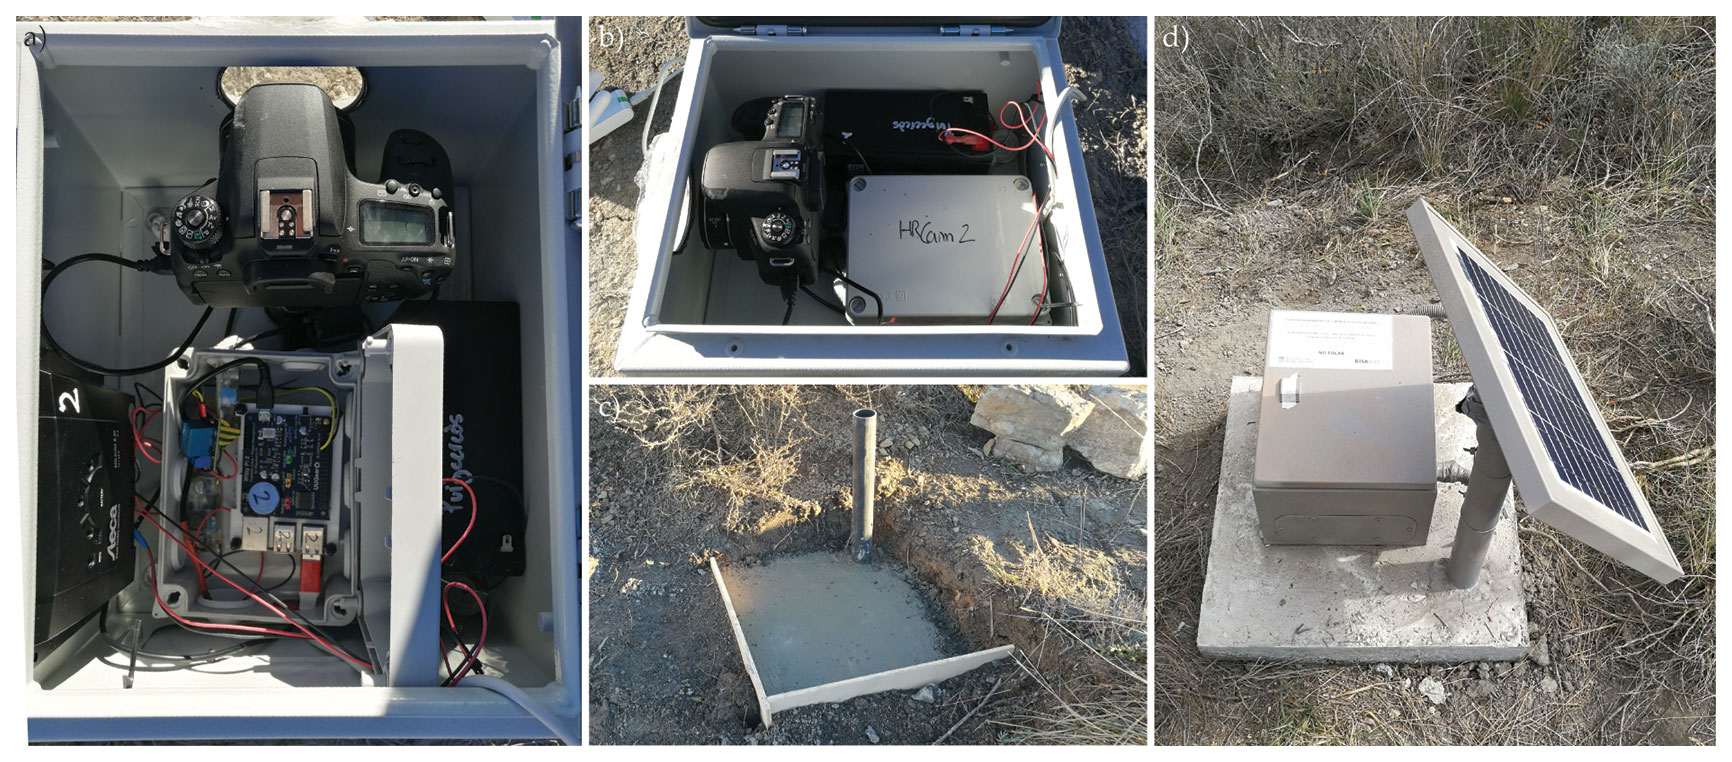
Figure 1Images of the photogrammetric systems installed in the Puigcercós site: (a, b) Fig. 3 shows the inside of the photogrammetric unit with part of the connections; (c) construction of the concrete base and installation of the PVC pipe for the installation of the photographic units; and (d) external view of the installed system.
The total cost of the components of each photo module cannot be standardized because it is controlled by the cost of the camera and lens used. However, the basic components (excluding the camera and lens) usually cost around EUR 120. The basic connectivity module components can be purchased for around EUR 300.
2.3 Module assembly
The assembly of these units requires basic electrical knowledge because they require correct polarity management of the wires and soldering of the devices. In addition, a multimeter is necessary to correctly adjust the output voltages of the DC–DC converters. To activate the solar charge controller the 12 V battery is connected to it. Once the solar charge controller is powered the solar panel can be connected to it (connecting it beforehand may damage the charge controller). There are two power lines from the solar charge controller. One line serves to supply power to the control unit, while the other serves to supply power to the camera. The line powering the control unit incorporates a DC–DC converter which efficiently converts the 12 V input to the 5 V required by the Raspberry Pi (via the USB port). It is important to note that from Witty Pi 3 onwards it is possible to connect the 12 V input directly to the Witty Pi board using the appropriate connector (XH2.54 connector). However, this approach may result in lower conversion efficiency and higher board heating (Fig. 2).
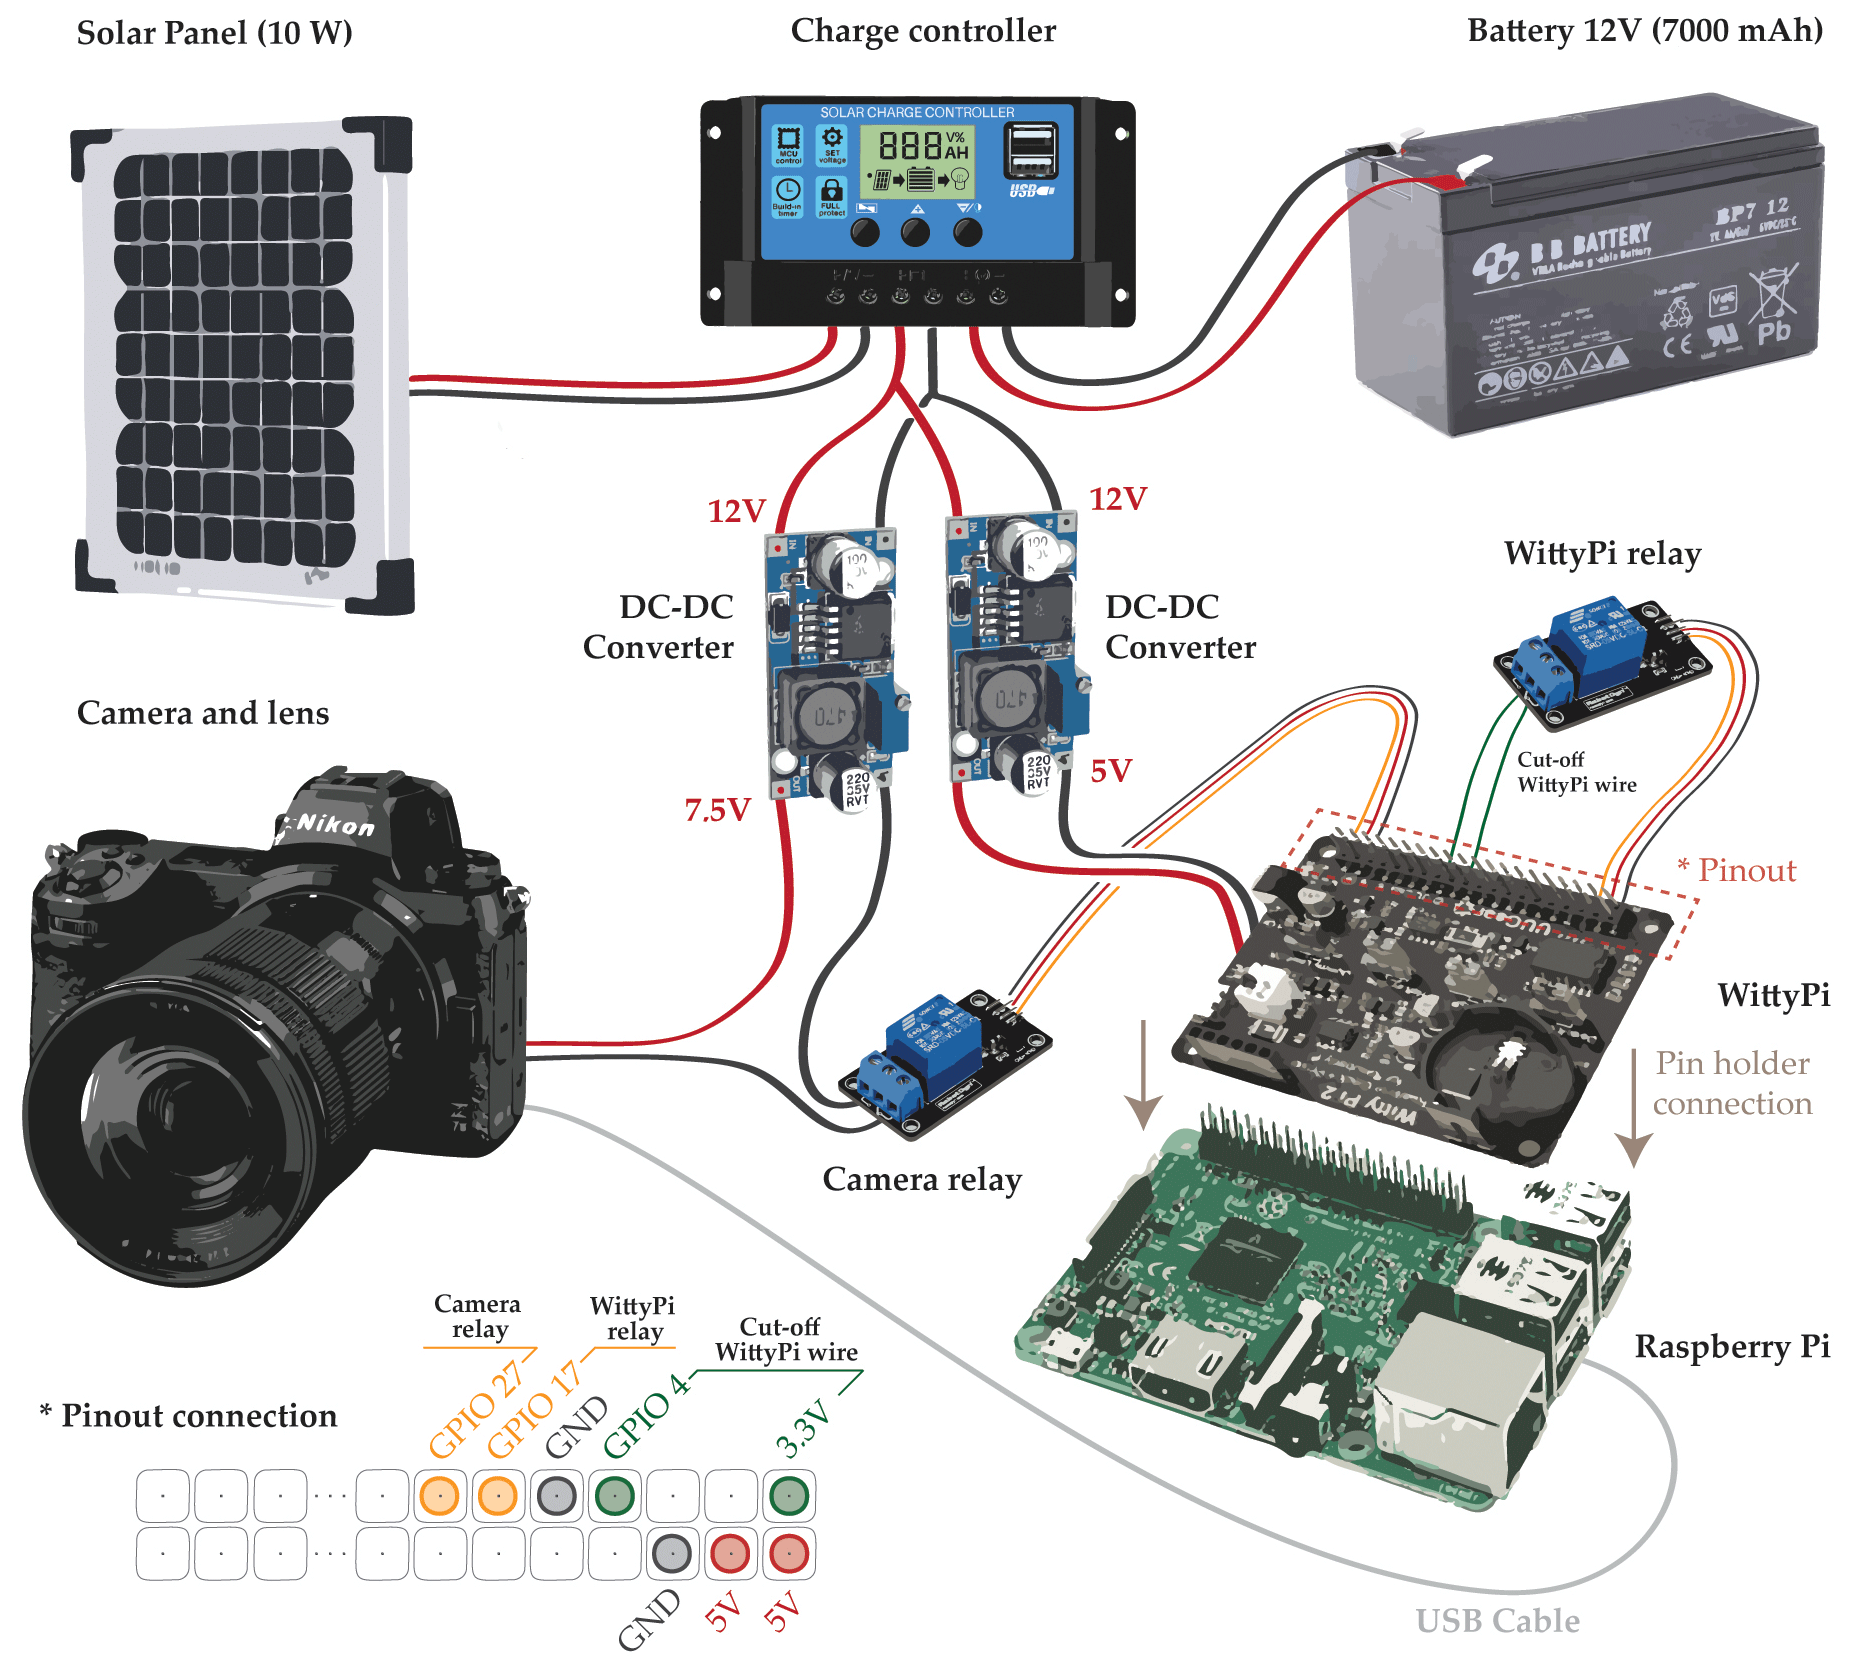
Figure 2Installation sketch of the components. The solar panel and the battery are connected to the solar charge controller. Voltage regulators are installed at the output of the controller to adjust the voltage to the required output for the camera (7.5 V) and the control unit (5 V). The relays are controlled by the control unit, allowing the switching on and off of the camera and activating the system shutdown. The bottom left of the image shows the pinout connection of the control unit in detail.
The line that delivers power to the camera also uses a DC–DC converter because the cameras work with a lower voltage (mostly around 7.5 V). This can be identified on the original batteries or on the product data sheet. The camera is connected to the power supply using a dummy battery. In addition, the camera power line incorporates a relay to prevent the camera from being turned on continuously. The relay is connected to the GPIO pins of the Raspberry Pi (Fig. 2).
The camera is connected to the Raspberry Pi via USB. It is important to note that most modern cameras can also be powered via the USB connection if the output amperage is sufficient for the camera. In this case it is not necessary to create a power line with the DC–DC converter and the relay for the camera. The camera will be activated with the correct voltage when the Raspberry Pi receives power. Finally, the designed system incorporates a relay that cuts the connection between GPIO 4 and the 3.3 V GPIO. When this relay is activated and GPIO4 and 3.3 V are connected, the Witty Pi board deactivates the automatic shutdown of the Raspberry Pi, and it remains switched on. This allows active remote connections to be maintained since the system will not shut down automatically.
2.4 Proposed workflow and software
A code pipeline has been developed that automatically starts with the photographic capture and ends with the telematic transmission of images while providing a backup on the device's internal memory until it is depleted (Fig. 3). The workflow comprises the following steps: (a) image capture, (b) transfer of images from the camera to the control unit, (c) addition of a timestamp to the file name, (d) storage of images in a temporary folder, (e) uploading of images to a server, and (f) transfer of uploaded images to the control unit's backup (Fig. 3). Basic information on installing the OS on the Raspberry Pi and the Witty Pi software can be found in the Supplement S1.
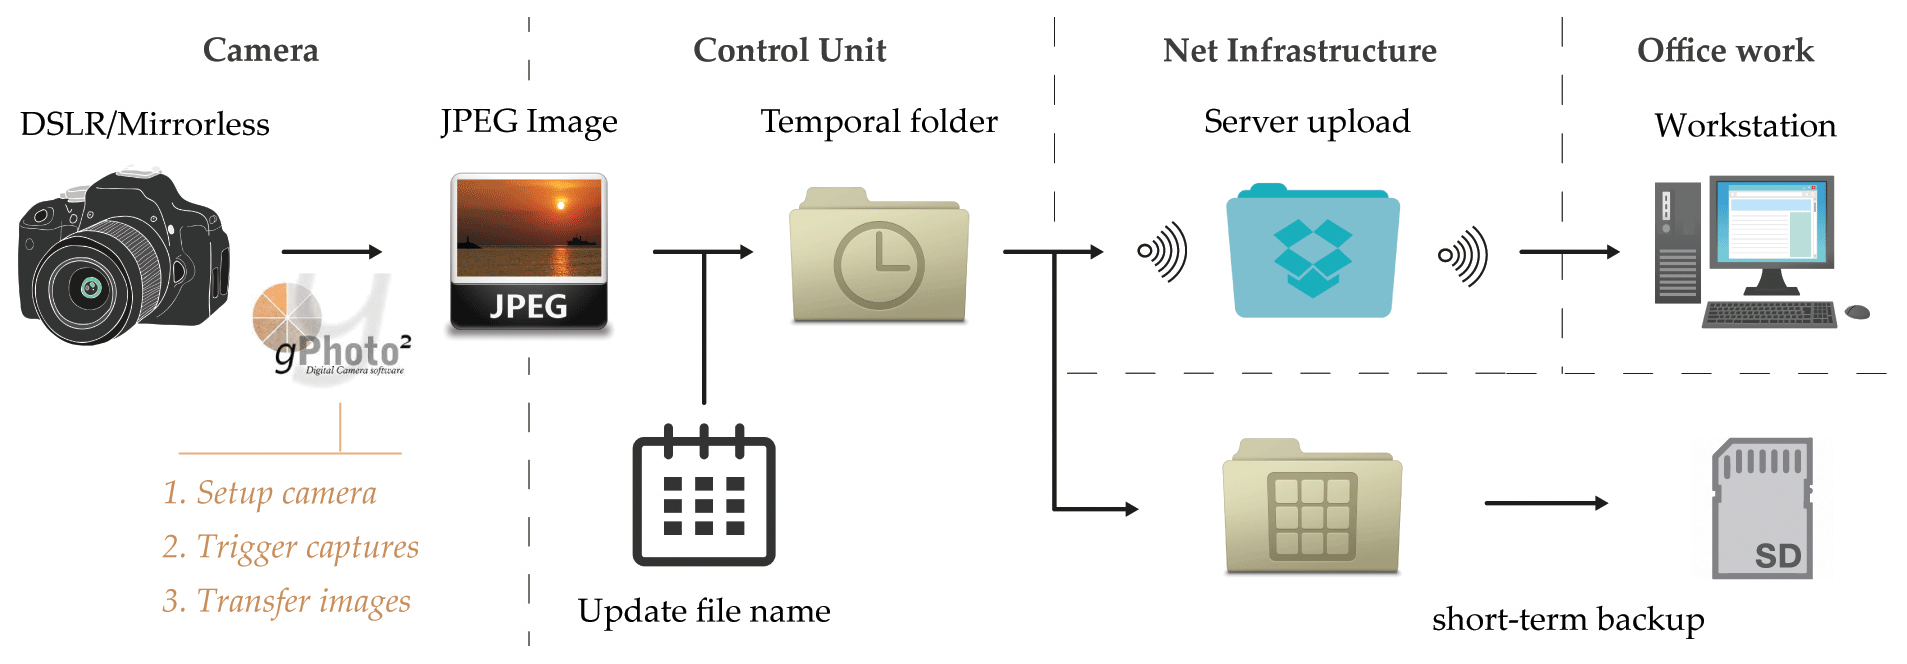
Figure 3Illustrative scheme of the workflow implemented in the control unit to communicate with the camera, trigger the camera, and send the images remotely while avoiding filling the internal memory of the devices.
The integration of different devices (e.g. camera, Raspberry Pi, Witty Pi, and relays) implies developing adapted codes to integrate them effectively. The use of commercial cameras implies the need to use software to externally control the camera (non-native system) both in terms of communication and power supply. Thus, the Raspberry Pi communicates with commercial cameras via the gPhoto2 framework. The gPhoto2 software and its accompanying libgphoto2 library enable the Raspberry Pi to serve as an advanced control unit for commercial cameras. GPhoto2 is a free, redistributable, and ready-to-use suite of digital camera software applications for Unix systems. The workflow described in Fig. 4 can be reproduced using the codes provided in the first author's GitHub repository. The codes are divided into a main code and auxiliary codes written in Python and Bash.
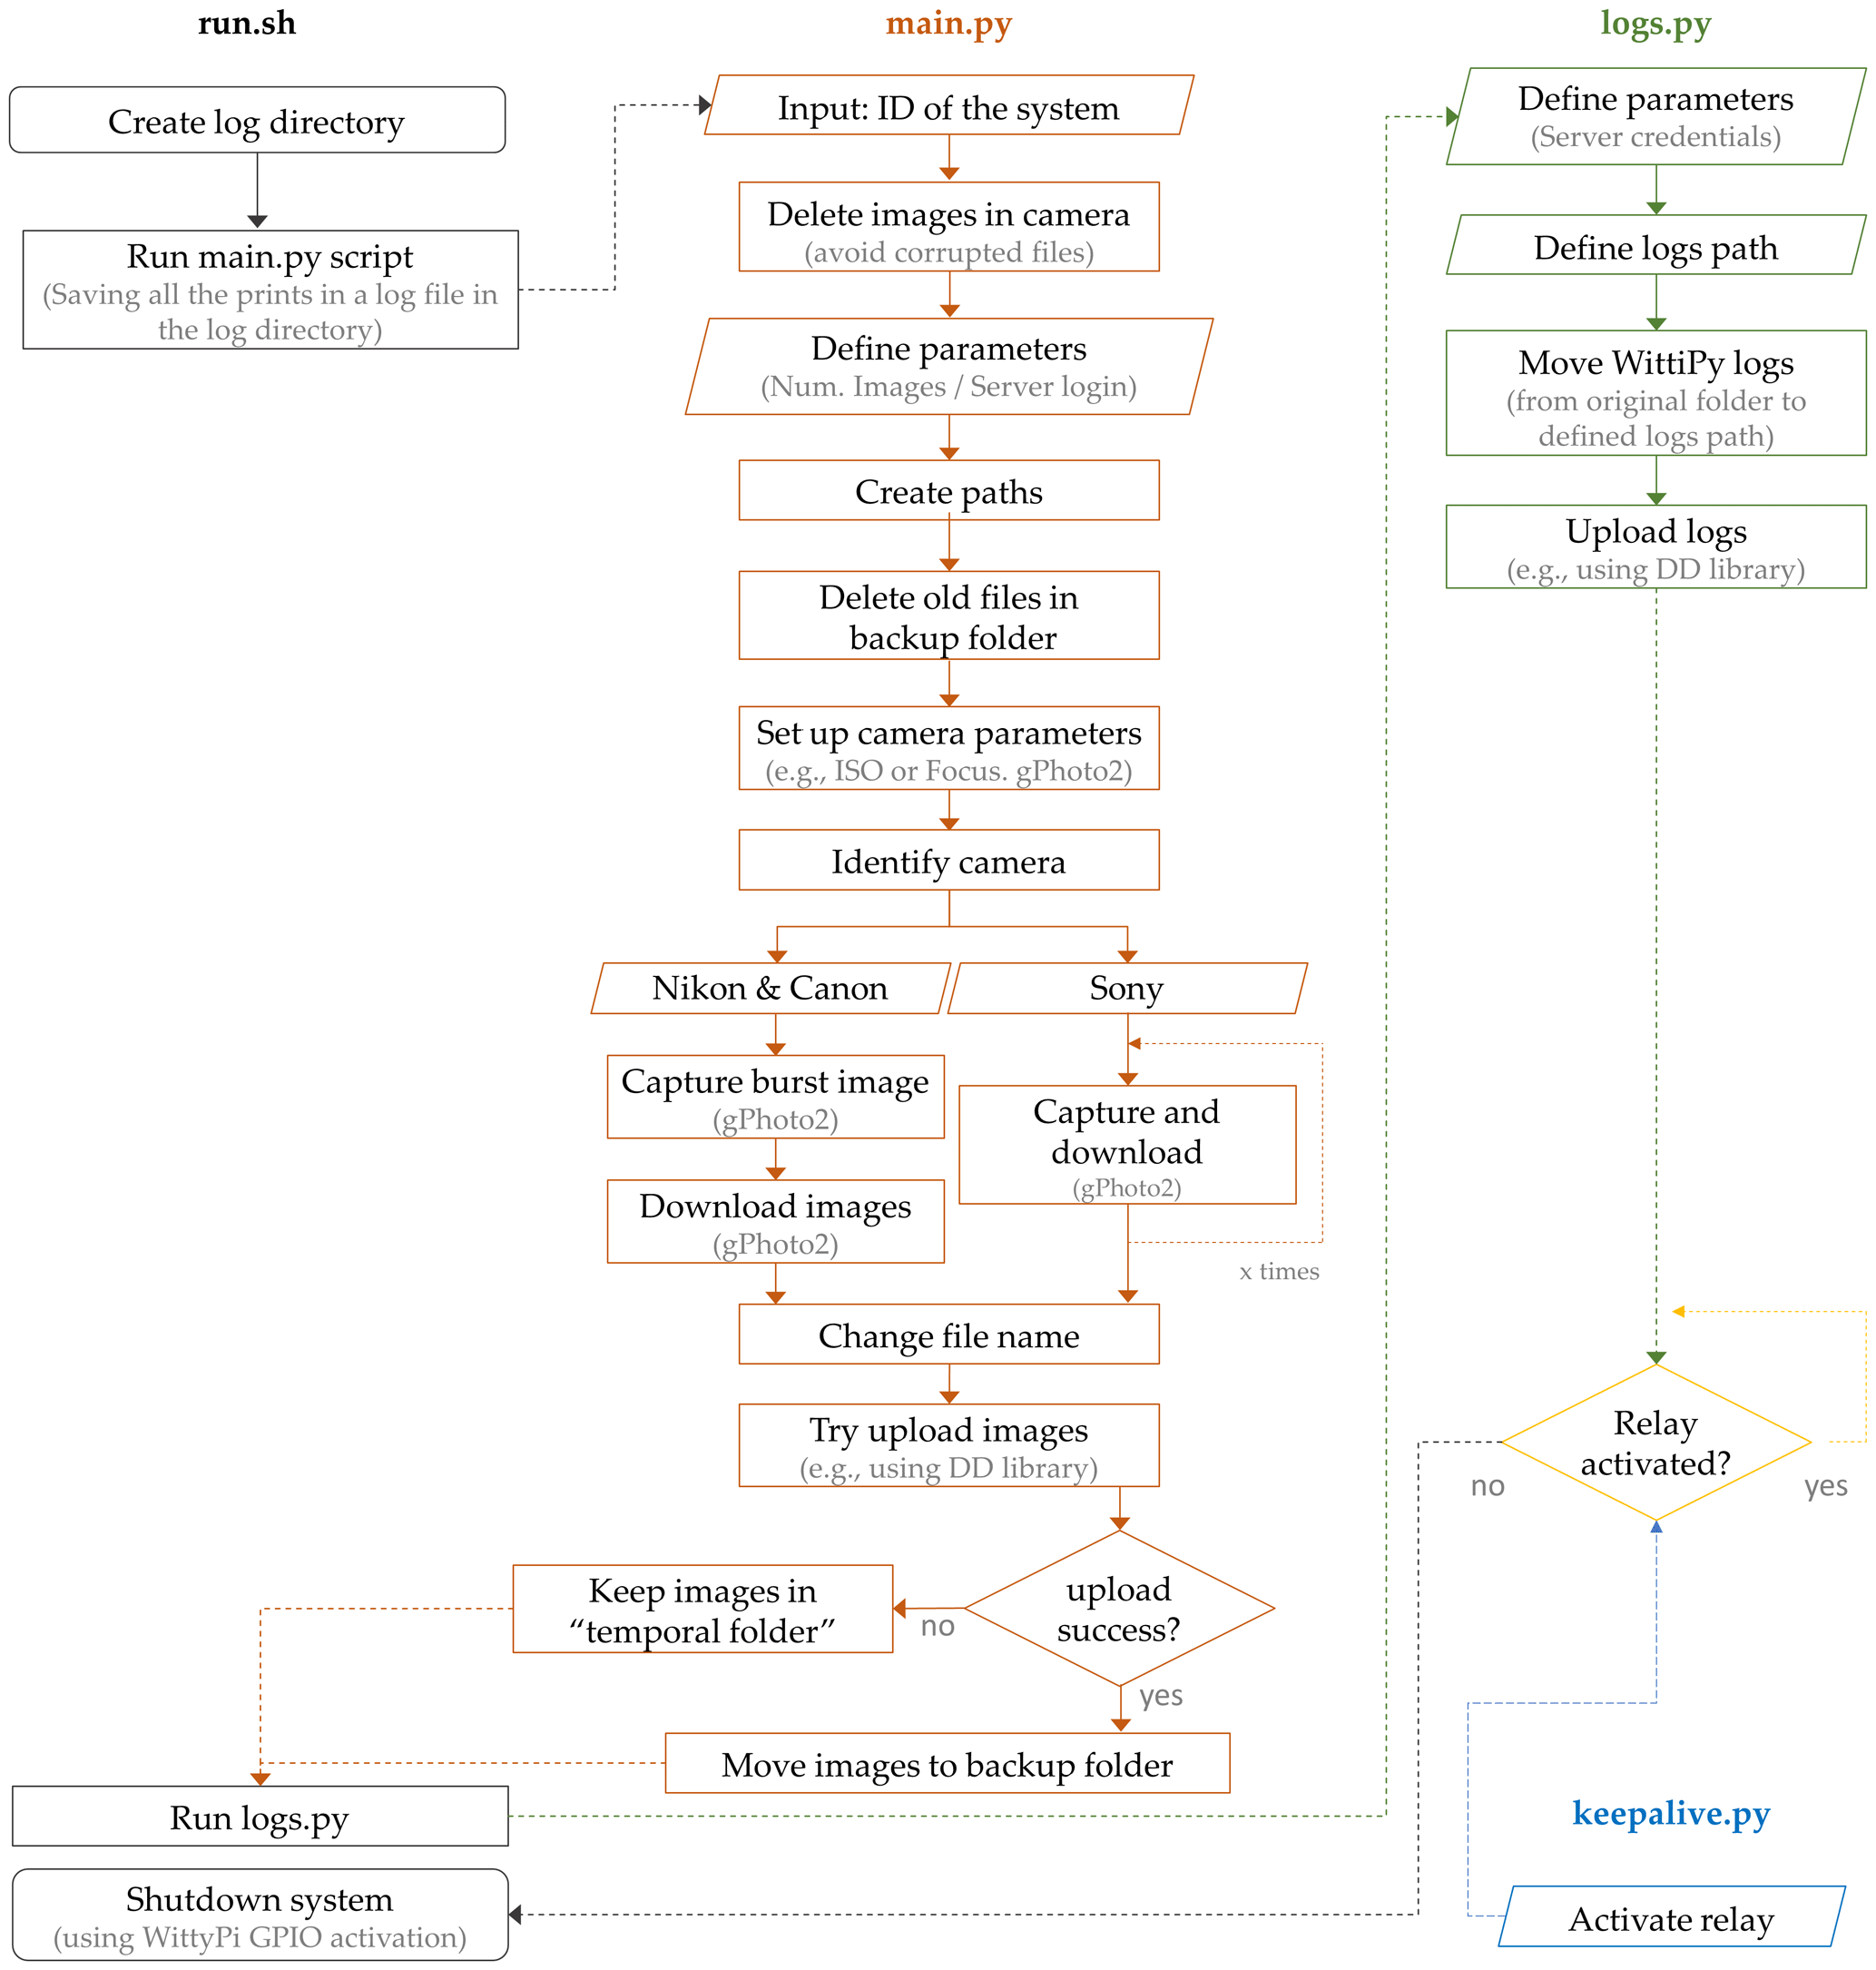
Figure 4Structured flowchart of the open-source codes distributed in the repository of this publication. In grey is the startup code “run.sh”; in orange is the main code “main.py”; in green is the code “logs.py”; and in blue is the code “keepalive.py” that avoids the shutdown process.
The main code (main.py) is in charge of performing the following operations (Fig. 4):
- 1.
Delete files from the camera (avoid corrupted images remaining).
- 2.
Create/check correct paths.
- 3.
Remove old files (more than […] days) from “backup folder”.
- 4.
Identify camera.
- 5.
Set up capture properties and focus camera (if needed).
- 6.
Capture images and download images to the unit control.
- 7.
Change file name by timestamp.
- 8.
Store it in “temporal folder”.
- 9.
Try to upload to Dropbox server (library: https://pypi.org/project/dropbox/, last access: 13 October 2023).
- a.
If successful → move to backup folder.
- b.
If it fails → remain in “temporal folder”.
- a.
The main.py code is executed by an auxiliary code run.sh which is in charge of starting the different auxiliary codes and eventually giving the instruction to shut the system down. The log.py code is used to collect a log of the execution of the software and the log of the Witty Pi board. Both logs are uploaded to the server.
The proposed system includes a mechanism for remote access to the control unit through the use of a relay and the Witty Pi control board. Normally, to initiate the shutdown of the system, the Witty Pi control board sends the shutdown command to the Raspberry Pi (Fig. 4). However, this order is not run if a connection between GPIO4 and 3.3 V is established. In order to control this connection a relay is integrated into the system with an open state. During normal operation the Witty Pi will activate the Raspberry Pi's shutdown command at the end of the run.sh code.
However, the keepalive.sh code activates the relay allowing the connection between GPIO4 and the 3.3 V pinouts (Fig. 2). In this case the automatic shutdown is stopped and remote access to the control unit can be established through a remote desktop connection. To revert the situation the shutdown.sh code is in charge of deactivating the relay that forces the shutdown of the control unit.
3.1 Implementation in real scenarios
The systems presented in this publication have been installed in the study area of Puigcercós (NE Spain) and the study area of Alhambra de Granada (S Spain). Both systems have been installed in front of rockfall-active cliffs and have been in operation for over a year (Blanch, 2022). The Puigcercós system comprises five photographic modules which are situated approximately 100 m from the escarpment and are separated by approximately 30 m from each other (Fig. S3). The connectivity module is installed at the highest point of the escarpment to optimize 4G signal reception (Fig. S4a, b, and c). This system is located in the same area as the low-cost system used in Blanch et al. (2023) and where the lidar that captured the data in Abellán et al. (2009) was placed. The system installed in the Alhambra de Granada is composed of five photographic modules (Fig. S5) and three different connectivity systems (Fig. S4d). Due to its urban grid location, the camera geometries in this system are irregular with the closest camera being 70 m from the escarpment and the farthest being more than 250 m away. Nevertheless, both systems have a common feature which is that each camera captures a full view of the escarpment; this results in 100 % coverage in each image (Figs. S6 and S7). The cameras are configured to take five images in burst mode (rapid sequence of images in quick succession) once daily, which facilitates the application of change detection enhancement algorithms (Blanch et al., 2021; Feurer and Vinatier, 2018).
In the Puigcercós area we obtain a GSD (ground sample distance) of approximately 2 cm pixel−1 for the Canon devices and 1.7 cm pixel−1 for the units with the higher-resolution Sony cameras. The MEMI (Multi-Epoch Multi-Imagery) workflow (Blanch et al., 2021) has been applied to a stack of four images acquired by each of the five cameras of the photogrammetric system. This workflow takes advantage of the use of still cameras because it uses the images from the different epochs to be compared (multi-epoch) to jointly determine the internal and external camera parameters since their position is the same over time. Furthermore, by using image bursts (five images in a few seconds) it uses more than one image per epoch (multi-image) to perform the bundle adjustment. As a result, the use of the MEMI workflow results in denser point clouds with better comparison performance because it does not require co-registration between the compared models since the reconstruction parameters used to generate the point clouds are the same. Using this workflow, an rms reprojection error of 0.23 (0.38 pix) has been obtained. A dense point cloud (after filtering and clipping the scarp) of about 15 million points has been generated with a mean point surface density of 6000 points m−2 using Agisoft Metashape software with the highest-quality setting.
The model has been scaled using virtual ground control points (GCPs) extracted from a terrestrial lidar scan of the same study area. The use of virtual points is necessary due to the inaccessibility of the escarpments. After identifying the most suitable reference points the detection of these points in images from other epochs is performed automatically (e.g. using the Lucas-Kanade algorithm, as described by Blanch et al., 2021). Once the points are identified, a 3D coordinate obtained from the lidar model is assigned to them. Implementing this strategy in stable regions visible to the camera and around the escarpment ensures the accurate scaling of the model. Figure 5a shows the photogrammetric model obtained on the Puigcercós cliff, while Fig. S8 in the Supplement showcases the 3D model generated in the Alhambra study area. Links to an online view of a subsample model are also provided in the “Data availability” section (Puigcercós cliff, Spain, and Alhambra de Granada cliff, Spain).
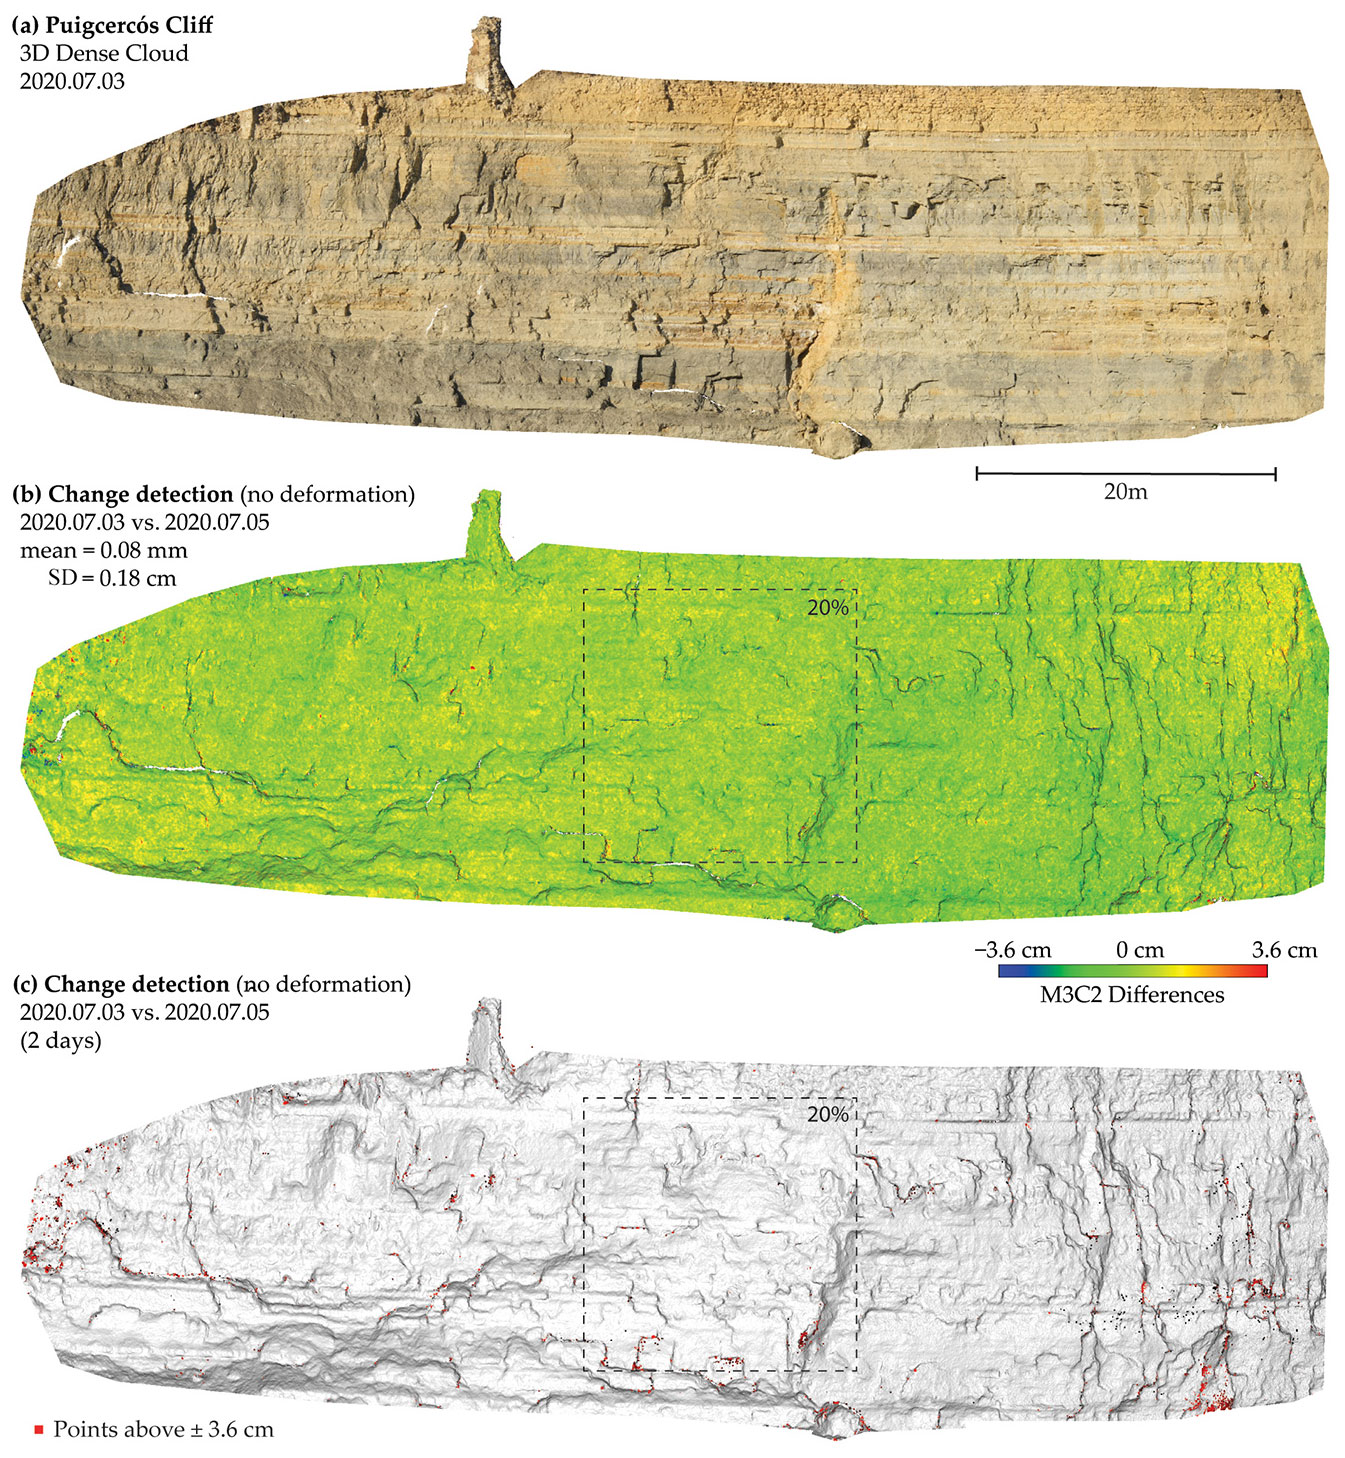
Figure 5(a) Point cloud obtained with the very high-resolution photogrammetric system installed in Puigcercós (obtained with MEMI workflow). (b) M3C2 (Lague et al., 2013) comparison of two consecutive acquisitions (no expected deformation). (c) Same comparison as in (b) highlighting in red the points with a deformation higher than 0.036 m. In (b) and (c) a crop within the central region is delineated which covers around 20 % of the cliff.
In order to estimate the instrumental error of the photogrammetric system and estimate the minimum change detection value, two captures obtained in Puigcercós between 3 and 5 July 2020 were compared (images from 4 July 2020 cannot be used due to bad weather). Since there has been no significant change in the analysis period, the result of the comparison should tend to zero (Fig. 5b). A mean value of the comparison of 0.08 mm and a standard deviation of 0.018 m have been obtained using the M3C2 algorithm for point cloud change detection (Lague et al., 2013). The comparison has been made using the normals calculated in photogrammetric software and a projection diameter of 0.1 m. Although this result is highly dependent on the algorithm, as will be discussed later, this result allows us to define a change detection threshold of only 0.036 m using the methodology described in Abellán et al. (2009) that describes the detection threshold as 2 times the standard deviation of a model comparison without deformation. If we apply the same methodology but on a crop in the central area of the escarpment (Fig. 5bc), the standard deviation obtained decreases to only 0.007 m, which corresponds to a change detection threshold of only 0.014 m.
Figure 5c highlights in red the points that exceed the change detection threshold of 0.036 m in the comparison between the 2 d period without deformation. It is noteworthy that most of the points with higher deformation are located at the margins of the model. Both the points exceeding the threshold found at the edges of the model and those found in more central areas (those more scattered) are associated with fractures, edges, and shadows of the 3D model. The red points represent 0.24 % of the total point cloud, so 99.76 % of the points in the M3C2 comparison fall within the deformation range of −0.036 to +0.036 m for a comparison without deformation (consecutive days without rockfall activity).
3.2 Contribution to process understanding: detecting rockfalls and pre-failure deformation
With the fixed time-lapse photogrammetric systems, results can be obtained that benefit from the high frequency of data acquisition. The comparison of point clouds with 308 d time lapse performed with the MEMI workflow (Blanch et al., 2021) allowed detecting pre-failure deformations in two active zones of the Puigcercós cliff (Fig. 6). The observed deformation increases along the vertical axis of the mobilized blocks, reaching deformation values of 0.16 m in the left block and 0.15 m in the right block; thus the process can be characterized as rock toppling (Hungr et al., 2014). Although in the previous section we calculated the theoretical limit of detection at 0.04 m for the entire escarpment and 0.014 for the central region, a change detection threshold of only 0.015 m was used to be able to identify deformation in the whole region. The use of this threshold is supported by two observations. The first corresponds to the identification of a standard deviation of change detection of only 0.007 m in the central 20 % of the escarpment. The second observation is based on the homogeneity and density of the points that generate the deformation clusters in large volumes. For this reason, Fig. 6a shows useful results obtained with a change detection threshold of only 0.015 m which, although it shows a greater amount of noise, especially at the margins (far from the central 20 % of the escarpment), allows the identification of the pre-failure blocks.
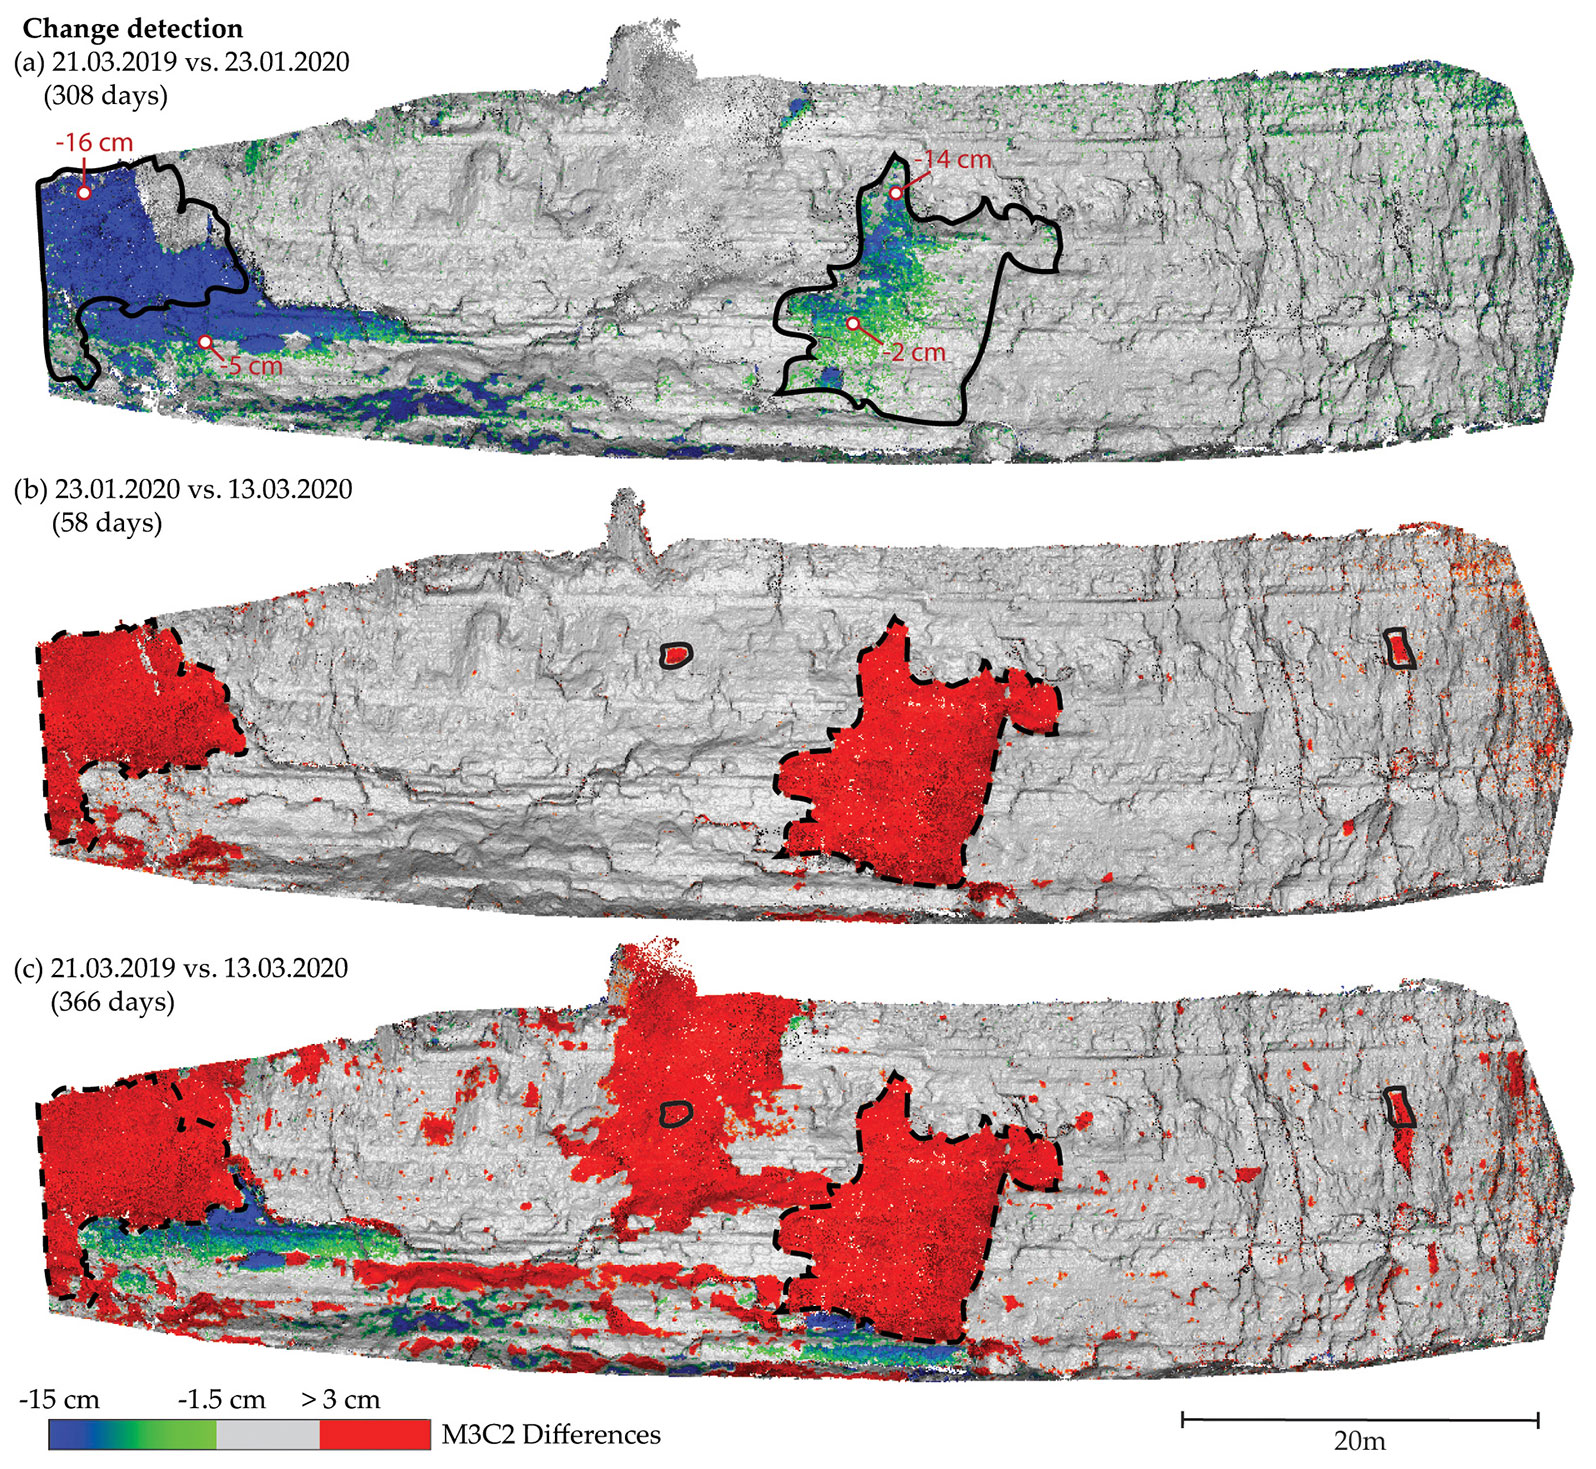
Figure 6Examples of pre-failure deformations and rockfalls detected. (a) Accumulated pre-failure deformation of two active blocks after 308 d. The comparison has been done with the M3C2 algorithm and the MEMI workflow. Panel (b) shows the change detection obtained 58 d after the detection of pre-failure deformation with the two detached blocks identified in red. (c) Change detection after approximately 1 year. The red clusters identify rockfalls, while the green-blue areas indicate pre-failure deformation. For all results 0.015 m has been used as the level of detection.
The comparison covering a period of 58 d after the detection of two active zones with pre-failure deformation revealed the detachment of two rockfalls of great magnitude (more than 100 m3) (Fig. 7b). It is noticeable that in the central rockfall the detached zone overlaps with the deformation detected in Fig. 6a, while at the rockfall on the far right the detached zone does not cover the entire pre-failure deformation area detected in Fig. 8a. For this reason, in later comparisons (Fig. 6c) part of the deformation is still detected at the left end of the figure (part of the mobilized block remains active).
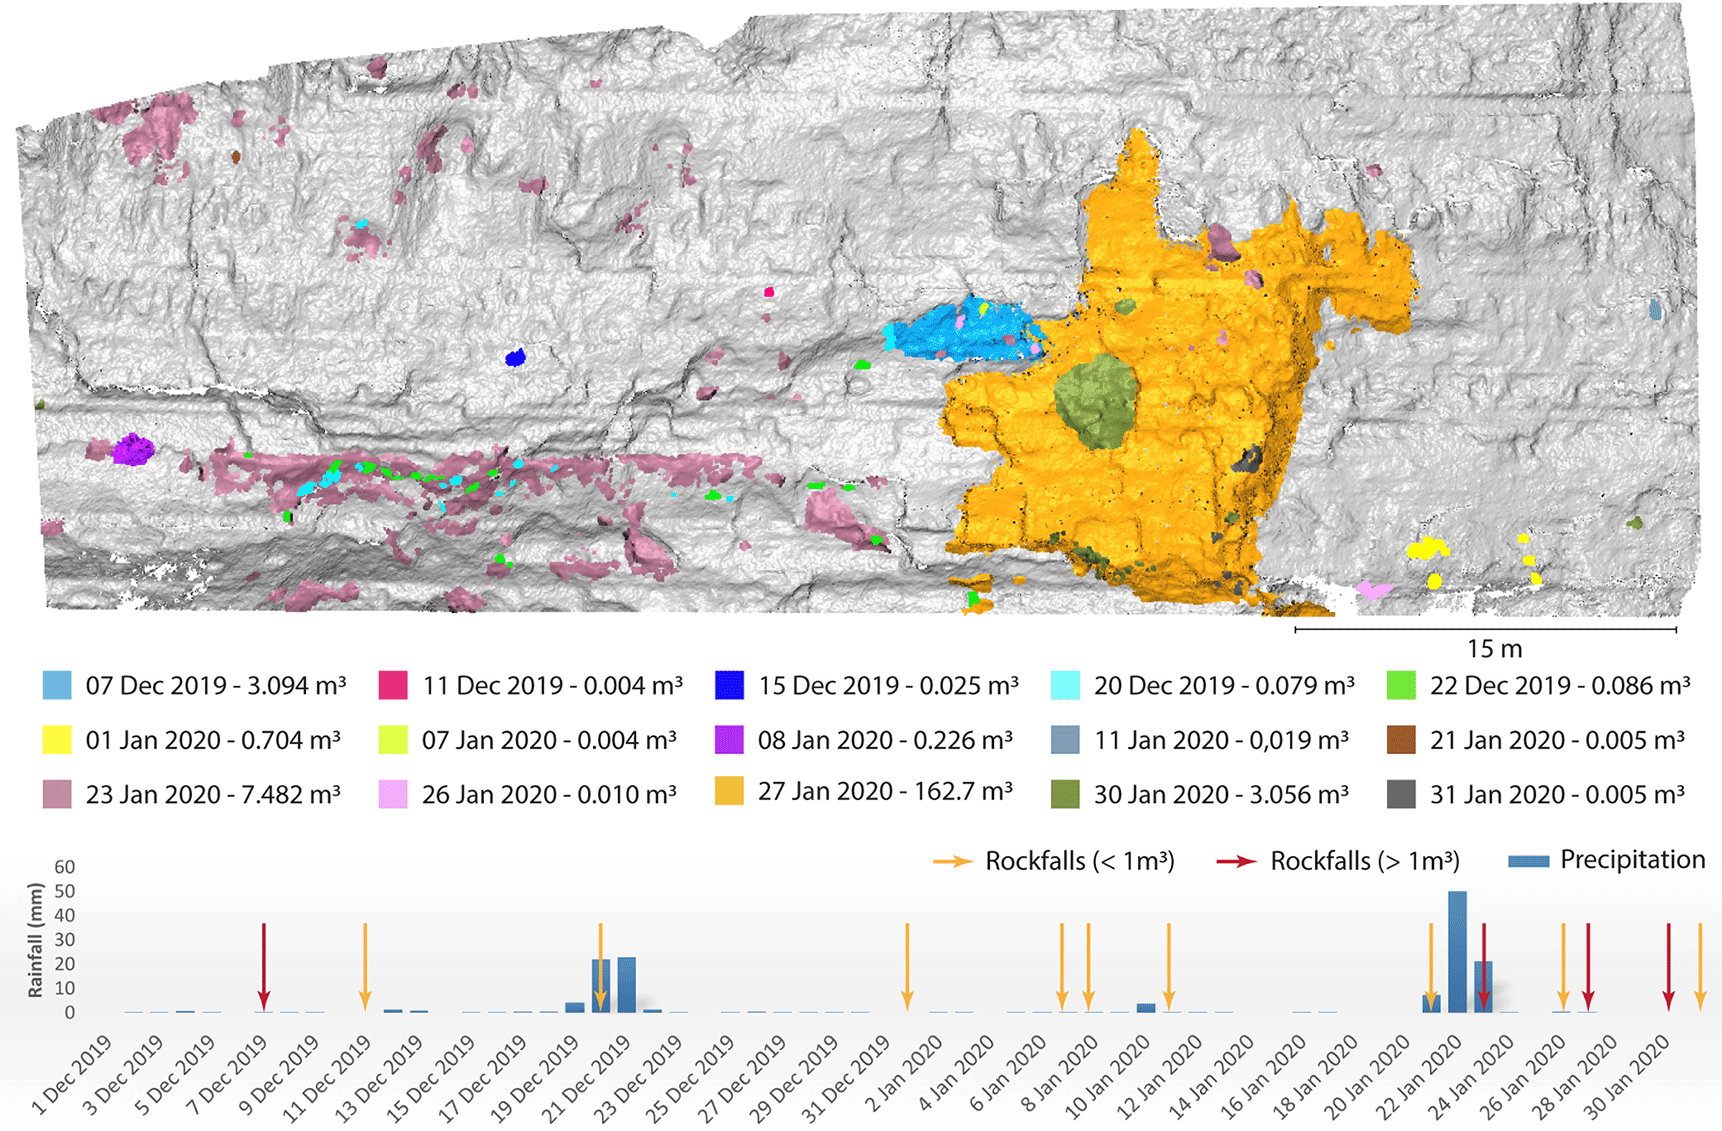
Figure 7Rockfalls that occurred on the Puigcercós cliff (NE, Spain) between 1 December and 31 January. Each colour corresponds to a different detection date, and the total volume of rockfall per day is calculated. The graph displays the precipitation levels in the area and the days with rockfall activity. Red arrows indicate a total volume detached greater than 1 m3, while orange arrows indicate a volume less than 1 m3.
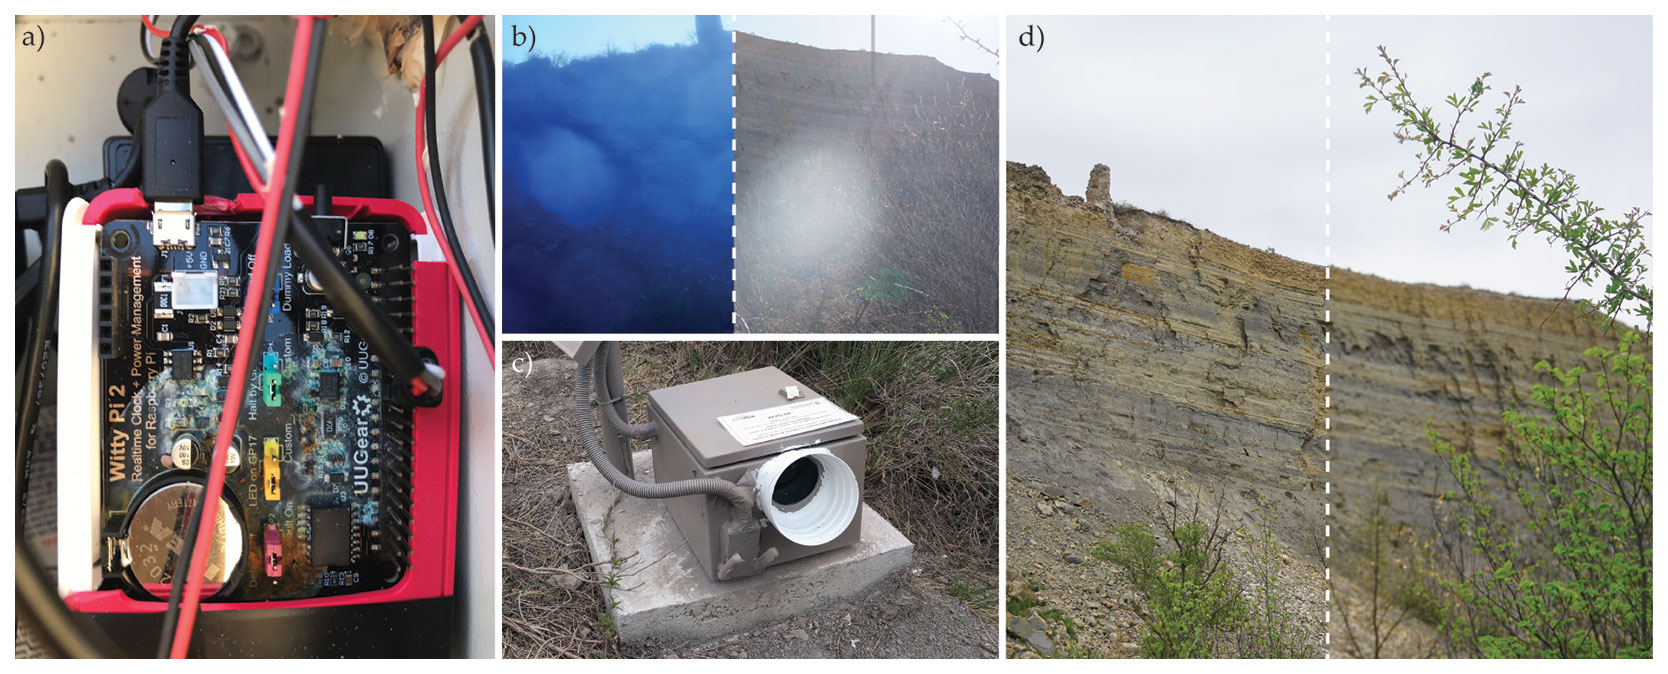
Figure 8Limitations of the high-quality system are as follows: (a) rust on the control unit due to water infiltration; (b) image defects due to not incorporating a lens hood. Left: water drops in the filter glass. Right: lens flare due to the sun's rays; (c) incorporation of the lens hood to avoid the defects that (b) show and the external Wi-Fi antenna; and (d) problem due to automatic focus. Left: image with the focus on the cliff. Right: image with the focus on the vegetation in the foreground.
Figure 6c shows a comparison of the detection of changes in the Puigcercós cliff after 1 year (366 d), covering the two time-lapses that Fig. 6a and b show. Therefore, the figure shows the rockfalls detected in Fig. 6b but as part of a larger rockfall which makes it impossible to individualize them and leads to an overinterpretation of the rockfall volumes of each event. In addition, one of the small rockfalls detected in Fig. 6b is completely masked by a new larger rockfall in Fig. 6c, which results in the ignoring of part of the rockfall activity of the cliff. This problem is solved by fixed photogrammetric systems that allow daily or subdaily frequency monitoring.
Lastly, Fig. 7 shows another example of monitoring the Puigcercós cliff which benefits from high-temporal-resolution data acquisition provided by the fixed time-lapse photogrammetric systems described in this publication. The figure shows a daily analysis carried out over a period of 2 months (December 2019–January 2020) where rockfalls are identified and the volumes of all material detached per day are included. A threshold of 0.05 m has been used to identify positive deformations (rockfalls). As in the previous Fig. 6, overlapping rockfalls are observed in the areas of greatest activity. In addition, it is observed that this overlapping occurs closely in time (27-30-31 January 2020), which allows us to infer a triggering sequence. The largest detected volume corresponds to the 162 m3 rockfall that occurred on 27 January 2020, while the smallest detected volume is 0.004 m3 corresponding to a block approximately 20×20 cm and 10 cm deep. Finally, a graph is included with the precipitation recorded in the village of Tremp (NE Spain) located 4 km from the Puigcercós cliff (XQ–XEMA, Meteorological Service of Catalonia). The graph also displays the days with rockfall activity categorized by magnitudes greater than and less than 1 m3.
4.1 Overall approach
The results obtained in the rockfall monitoring in Puigcercós (NE Spain) (Figs. 6 and 7) demonstrate that the photogrammetric system presented in this publication is useful for 3D change detection using high-end cameras and is particularly appropriate for those processes that require a high temporal frequency of data acquisition while maintaining good accuracy. The systems installed in Puigcercós cliff and Alhambra de Granada have been in operation for more than 1 year and they require some maintenance to keep them operational. In some cases continuity of data acquisition could not be guaranteed. However, thanks to the use of independent systems, even with the failure of two photographic modules, the photogrammetric system captured images from three different locations, guaranteeing 3D results. This allows us to obtain, as a whole, a more robust system than installations based on stereo cameras.
Maintenance has occurred for a variety of reasons but there are two main limitations of these type of systems. The first relates to the specific design of the systems and their ability to withstand a severe climate with precipitation, high humidity, and a very wide temperature range. The construction of the boxes is a weak point because they allow humidity to enter, which can seriously damage the electronic systems (Fig. 8a). Although many efforts to waterproof the electronics were taken, it was not possible to completely isolate the systems. Furthermore, the temperatures reached inside the metal boxes in Puigcercós were high (reaching 60 ∘C). Thus, solutions such as silicone sealant, power tape, or thermal adhesives were not valid as they can soften and lose their firmness and properties over time. Other methods such as encapsulation in epoxy resin or insulation with high-resistance polymer had been tried, but the operation is very difficult because the electronic components have elements that cannot be submerged or covered by resins (e.g. microSD card or USB connectors).
One way to improve the insulation of these enclosures is to replace the circular photographic filter that is embedded in the enclosure. Due to weather conditions, the filter glass was no longer fixed to the metal chassis that held it in place, which allows the glass to rotate freely and consequently allows humidity to enter. Other alternatives such as adding a larger and thicker glass window to the enclosure should allow for greater strength and insulation. In addition, the use of metal boxes hindered the reception of the Wi-Fi signal (Faraday cage effect), which forces the need for an extra hole for the external antenna. In addition, it should be noted that not all pictures are systematically usable for monitoring. Unlike other instrumentation, the robustness of the results is conditioned both by the time of day (image acquisition only during daylight hours) and by weather conditions (Fig. 8b). Thus, it is not possible to obtain images during periods of heavy rain, fog, or direct sunlight/flairs on the lens. To try to mitigate the negative effects caused by drops of water on the glass or light reflections, a hood has been added to the system (Fig. 8c). Although the results have not been noticeably better, given the low cost of the improvement, it is a change to be considered.
4.2 Hardware and software improvements
Another limitation of the system is the integration of all the hardware from different brands that comprise the system. These limitations range from the failure of the electronic components to the need to rewrite the code because some cameras are not fully compatible with the gPhoto2 library used to connect the camera to the control unit.
The main electrical installation can be seen in detail in Fig. 2. However, it was decided to replace the mechanical relays (electromagnets) with static SSRs (solid state relays). The mechanical relays have caused problems in the different installations due to either the quality of the devices or climatic conditions. For this reason, they have been replaced by MOSWITCH–SPDT relays of the UUGear brand. These new relays no longer depend on a mechanical component that is activated by the passage of current (electromagnet) that activates the switch as in mechanical relays. In contrast, the SSRs are activated by the state of activation of the MOSFETs incorporated in the device.
The most distinctive aspect of this high-resolution system lies in its camera selection. The chosen camera significantly impacts the cost of the system, the communication protocol with the control unit, and even the electrical system. Based on the results obtained using the different systems, Table 1 gives a short summary of critical factors in order to optimize the results.
Table 1Cameras installed in the different systems and specification of the most important features.
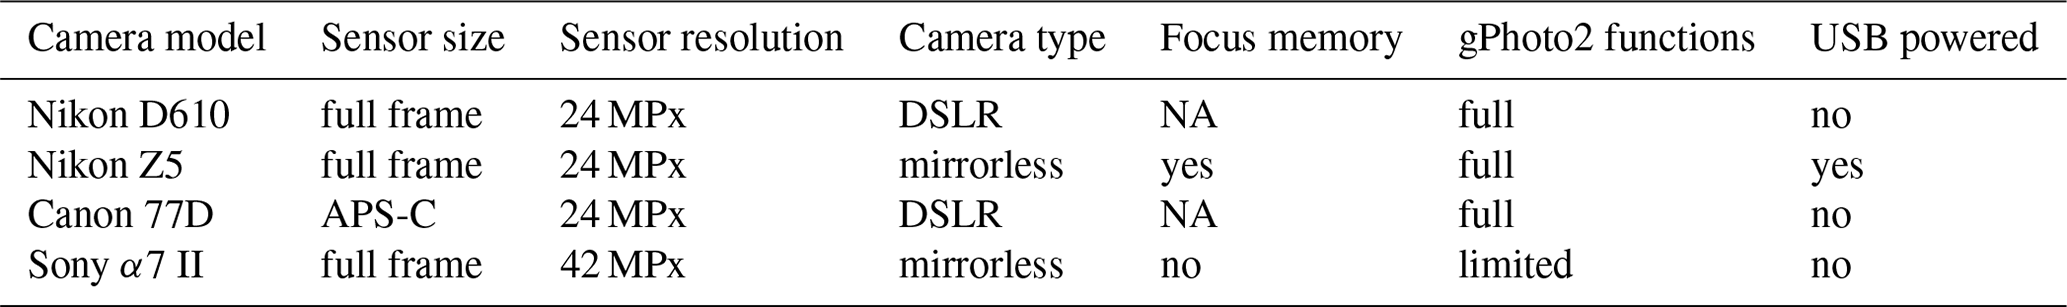
NA: not available.
On DSLR cameras the focus position can be fixed externally on the lens. However, the new mirrorless cameras incorporate many more electronics than their predecessors. Many of them perform automatic focus travel at start-up so that the last focus position is not memorized even when manual focus is selected. For this reason, some of the systems created in this research had to activate the automatic focus of the cameras, which led to higher battery consumption, a longer delay in the acquisition of photos, and, most seriously, an error in obtaining the focus (Fig. 8d).
In the same way, choosing cameras with full compatibility with the gPhoto2 library makes it possible to generalize the image acquisition codes. In this study, the Sony camera was not able to execute the burst shooting command. The camera could only be controlled by the “shoot and download” command, which made it difficult to obtain simultaneous bursts with the other photographic units.
The possibility of powering the new mirrorless cameras via USB cable directly from the control unit makes it possible to eliminate the need for a power supply line, a relay, and a DC–DC converter. However, it must be ensured that the current supplied by the USB port of the Raspberry Pi is sufficient to power the camera. Lastly, the cameras with the most electronics are the ones that have reported the most difficulties, incompatibilities, and malfunctions in the field (camera freezing or corrupted files), so the choice of the robust DSLR can still be a winning point.
4.3 Applications in real scenarios
The high-resolution system allows high-quality change detection models. This result is consistent with other authors such as Kromer et al. (2019) or Kneib et al. (2022) who have already demonstrated the potential of using automatic multicamera photogrammetric systems for natural hazard monitoring. The theoretical detection threshold obtained with the high-resolution cameras (0.04 m) is 50 % lower than those obtained in the same study area with low-cost systems built with 8 Mpx Raspberry Pi Camera V2. Considering that these low-cost systems that Blanch et al. (2023) show were located at a shorter distance from the Puigcercós escarpment (60 m), the real differences in change detection thresholds would have been much greater if they had been located at the same distance, with an increase in the detection threshold of 3 to 4 times. Given that the captured images have 100 % coverage of the area of interest and thus have high overlap, the obtained model was robust and it shows better model edge coherence compared to very low-cost devices. Moreover, the results were achieved by the use of cameras with different characteristics (sensor size and number of different pixels). It can be assumed that if all systems used cameras with the highest quality (e.g. all cameras with 45 MPx and same prime lens) the quality of the model could have been much higher too.
One of the main advantages of using fixed systems is the possibility of acquiring data with high temporal frequency. When comparisons are made using long data intervals, accurate but incomplete information is obtained. In that way, Figs. 6 and 7 highlight the importance of working with high temporal resolutions to obtain accurate rockfall inventories. For example, the four rockfalls detected in Fig. 6b would have been identified as major rockfalls if the change detection analysis were performed on an annual basis (Fig. 6c). Additionally, Figs. 6 and 7 show how the monitored sequence of rockfalls varies based on the frequency of monitoring. While in Fig. 6c a single large rockfall is identified, thanks to the daily analysis in Fig. 7, it is possible to identify the fact that the largest rockfall area was the result of different rockfalls that occurred on 7 December 2019 and on 23, 27, 30, and 31 January 2020. Thus, long time-lapse comparisons generate distorted inventories that do not respond to the natural behaviour of the escarpment (Williams et al., 2018). This sampling effect is observed in both large and small rockfalls, favouring, for example, the rollover effect in the magnitude–frequency curves (Van Veen et al., 2017). While our focus has been on the technical setup, it is worth noting that high-frequency monitoring may unveil connections between weather conditions and rockfall activity (Birien and Gauthier, 2023), as hinted at by Fig. 7. Nevertheless, due to the complexity, further specific analysis is warranted for conclusive insights.
In this study, the standard deviation of the comparison has been employed as a quality metric to evaluate the outcomes of change detection. This metric serves as a basis for comparison with the lidar results published by Abellán et al. (2010) where simultaneous lidar captures were conducted at the Puigcercós site. Notably, these studies employ distinct change detection algorithms which justify slight differences in the metrics obtained. However, Blanch et al. (2021) show results obtained with the same photogrammetric system and the same processing considering error propagation, obtaining individualized accuracies in X, Y, and Z as a function of the location in the 3D model (James et al., 2017). The values published in that work, which also obtains the change detection thresholds, are consistent with those obtained in this work.
Abellán et al. (2010) obtain a standard deviation of 0.0168 m, which highlights the fact that the artefacts occur at the margins of the occluded parts. This standard deviation value allows us to define a change detection threshold of 0.0336 m (Abellán et al., 2009). This value can be directly compared with the result of 0.0360 m obtained in this publication. In addition, the distribution of errors is similar in the two works, which highlights the appearance of errors in shadow zones and fractures of the cliff (Fig. 5). Furthermore, the results obtained are consistent, in terms of the change detection model, with those obtained under different conditions by Kromer et al. (2019).
Finally, it should be noted that due to the number of error points over the threshold (0.24 % of total points), its distribution (edge effects and shadows), and their composition (density and clustering) it is possible to use change detection thresholds below the theoretical value. This is supported by the distribution of the error which, instead of being random throughout the 3D model (as background noise in lidar), is concentrated at the extremes of the model and in the shadow zones (associated with fracture zones). Similar works where pre-failure deformation is identified also use detection thresholds below the theoretical ones; for example, Royán et al. (2014) apply an NN (near neighbours) moving median to the change detection result. This strategy allows them to smooth the background noise, obtaining lower standard deviations and consequently lower thresholds. In the example that Fig. 6 shows, the blocks present a large deformation so that it is easily distinguishable from the background noise; however, the application of NN filters may allow us to identify areas with incipient precursor deformation.
This threshold reduction will become increasingly noticeable as AI (artificial intelligence) elements are used to improve the identification of true clusters that correspond to rockfalls. Thus, just as we have seen an increase in algorithms that allow for improved 3D modelling (e.g. Blanch et al., 2020; Feurer and Vinatier, 2018), it is likely to be possible in the future to see deep learning applications that reduce these detection thresholds without modifying the photogrammetric acquisition systems. This allows the significant improvement of the change detection processes.
Two high-resolution photogrammetric systems have been designed, constructed, and installed in the escarpment of Puigcercós (N Spain) and the Alhambra de Granada (S Spain). They comprise five photographic modules and different wireless transmission systems for image transfer. These modules use high-end DSLR and mirrorless cameras and are controlled by the gPhoto2 library, Raspberry Pi, and a real-time clock board. The systems are equipped with the necessary electronic components to capture images on demand with data transfer capabilities and stand-alone power systems. Open-source codes have been developed for the operation of the systems.
The acquired images, in combination with algorithms that facilitate the creation of improved 3D models (e.g. MEMI, Mult-Epoch Multi-Imagery), offer change detection performance comparable to lidar. The system presented has been used to successfully monitor rockfalls, which allows the comparison of 3D change detection models with the same accuracy as previous works using lidar. The low threshold for change detection allowed the system to detect rockfalls and pre-failure deformation. Thus, the results obtained demonstrate the usefulness of these systems for monitoring natural hazards. In addition, our findings support the idea that a high frequency of monitoring yields a more accurate rockfall inventory and consequently a more reliable characterization of the behaviour of the active cliffs.
All the necessary codes supporting the contents of this publication are available in the first author's digital repository: https://doi.org/10.5281/zenodo.7962813 (Blanch, 2023a). More information can be found at https://github.com/xabierblanch/DSLR-System (last access: 18 October 2023).
The high-resolution 3D photogrammetric models created with the system presented in this work are available for viewing at https://skfb.ly/o7QvV (Blanch, 2021b) (Puigcercós cliff, Spain) and https://skfb.ly/o7QEX (Blanch, 2021a) (Alhambra cliff, Granada, Spain). A set of images (one image for each camera) of Puigcercós cliff, Spain, is available in the “EarthLens: A Repository of Stationary Time-Lapse Images for Geosciences Research” community in the Zenodo repository. You can access these images at the following DOI link: https://doi.org/10.5281/zenodo.10010561 (Blanch, 2023b). These images are provided for the purpose of reproducing the results presented in Figs. 5 and 6. The whole image datasets used and/or analysed during the current study are available from the corresponding author upon reasonable request.
The supplement related to this article is available online at: https://doi.org/10.5194/nhess-23-3285-2023-supplement.
XB: conceptualization, methodology, software, investigation, writing (original draft), figures; MG: conceptualization, writing (review and editing), supervision; AE: conceptualization, methodology, writing (review and editing), supervision; AA: conceptualization, writing (review and editing), supervision.
The contact author has declared that none of the authors has any competing interests.
All data, figures, and codes provided in this publication are published under open-source license. The content of this publication is adapted from the doctoral thesis of the first author (Blanch, 2022) that is available at the following link: http://hdl.handle.net/2445/189157 (last access: 13 October 2023).
Publisher's note: Copernicus Publications remains neutral with regard to jurisdictional claims made in the text, published maps, institutional affiliations, or any other geographical representation in this paper. While Copernicus Publications makes every effort to include appropriate place names, the final responsibility lies with the authors.
The authors would like to thank Origens UNESCO Global Geopark for granting permission to work on Puigcercós rock cliff, the Patronato de la Alhambra y el Generalife for granting permission to work on Tajo de San Pedro cliff, the institutions and private buildings that have accepted and cared for photogrammetric systems on their properties, the colleagues of the University of Granada who have assisted us in the fieldwork, the doctoral thesis examining board for their comments that have improved this publication, and the reviewers and the editor for the valuable comments and suggestions that contributed to the improvement of the present paper.
The presented study was supported by the PROMONTEC Project (grant no. CGL2017-84720-R) funded by the Ministry of Science, Innovation and Universities (MICINN-FEDER). The first author (Xabier Blanch) was supported by an APIF grant funded by the University of Barcelona. Anette Eltner was funded by the DFG (grant no. EL 926/3-1).
This paper was edited by Paolo Tarolli and reviewed by two anonymous referees.
Abellán, A., Vilaplana, J. M., and Martínez, J.: Application of a long-range Terrestrial Laser Scanner to a detailed rockfall study at Vall de Núria (Eastern Pyrenees, Spain), Eng. Geol., 88, 136–148, https://doi.org/10.1016/j.enggeo.2006.09.012, 2006.
Abellán, A., Jaboyedoff, M., Oppikofer, T., and Vilaplana, J. M.: Detection of millimetric deformation using a terrestrial laser scanner: experiment and application to a rockfall event, Nat. Hazards Earth Syst. Sci., 9, 365–372, https://doi.org/10.5194/nhess-9-365-2009, 2009.
Abellán, A., Calvet, J., Vilaplana, J. M., and Blanchard, J.: Detection and spatial prediction of rockfalls by means of terrestrial laser scanner monitoring, Geomorphology, 119, 162–171, https://doi.org/10.1016/j.geomorph.2010.03.016, 2010.
Anderson, K., Westoby, M. J., and James, M. R.: Low-budget topographic surveying comes of age: Structure from motion photogrammetry in geography and the geosciences, Prog. Phys. Geog. Earth and Environment, 43, 163–173, https://doi.org/10.1177/0309133319837454, 2019.
Artese, S., Lerma, J. L., Zagari, G., and Zinno, R.: The survey, the representation and the structural modeling of a dated bridge, in: Proceedings of the ARQUEOLÓGICA 2.0, Computer Graphics, Cultural Heritage and Innovation, Universitat Politècnica València, https://doi.org/10.4995/arqueologica8.2016.3559, 2016.
Attard, L., Debono, C. J., Valentino, G., and Di Castro, M.: Tunnel inspection using photogrammetric techniques and image processing: A review, ISPRS J. Photogramm., 144, 180–188, https://doi.org/10.1016/j.isprsjprs.2018.07.010, 2018.
Bartonek, D. and Buday, M.: Problems of creation and usage of 3D model of structures and theirs possible solution, Symmetry, 12, 1–13, https://doi.org/10.3390/SYM12010181, 2020.
Bertin, S., Friedrich, H., Delmas, P., Chan, E., and Gimel'farb, G.: Digital stereo photogrammetry for grain-scale monitoring of fluvial surfaces: Error evaluation and workflow optimisation, ISPRS J. Photogramm., 101, 193–208, https://doi.org/10.1016/j.isprsjprs.2014.12.019, 2015.
Birien, T. and Gauthier, F.: Assessing the relationship between weather conditions and rockfall using terrestrial laser scanning to improve risk management, Nat. Hazards Earth Syst. Sci., 23, 343–360, https://doi.org/10.5194/nhess-23-343-2023, 2023.
Blanch, X.: DSLR System (Tajo de San Pedro) point cloud viewer, Sketchfab [data set], https://skfb.ly/o7QEX (last access: 13 October 2023), 2021a.
Blanch, X.: HRCam System (Puigcercós) point cloud viewer, Sketchfab [data set], https://skfb.ly/o7QvV (last access: 13 October 2023), 2021b.
Blanch, X.: Developing Advanced Photogrammetric Methods for Automated Rockfall Monitoring. Doctoral dissertation, Universitat de Barcelona, http://hdl.handle.net/2445/189157 (last access: 13 October 2023), 2022.
Blanch, X.: xabierblanch/DSLR-System: v1.0.5 (publication), Zenodo [code], https://doi.org/10.5281/zenodo.7962814, 2023a.
Blanch, X.: High-resolution images from stationary cameras of the Puigcercós cliff in Spain, in Natural Hazards and Earth System Sciences (NHESS), Zenodo [data set], https://doi.org/10.5281/zenodo.10010562, 2023b.
Blanch, X., Abellan, A., and Guinau, M.: Point Cloud Stacking: A Workflow to Enhance 3D Monitoring Capabilities Using Time-Lapse Cameras, Remote Sens., 12, 1240, https://doi.org/10.3390/rs12081240, 2020.
Blanch, X., Eltner, A., Guinau, M., and Abellan, A.: Multi-Epoch and Multi-Imagery (MEMI) Photogrammetric Workflow for Enhanced Change Detection Using Time-Lapse Cameras, Remote Sens., 13, 1460, https://doi.org/10.3390/rs13081460, 2021.
Blanch, X., Guinau, M., Eltner, A., and Abellan, A.: A Cost-Effective Image-Based System for 3d Geomorphic Monitoring: An Application to Rockfalls, SSRN [preprint], https://doi.org/10.2139/ssrn.4489458, 23 June 2023.
Brodu, N. and Lague, D.: 3D terrestrial lidar data classification of complex natural scenes using a multi-scale dimensionality criterion: Applications in geomorphology, ISPRS J. Photogramm., 68, 121–134, https://doi.org/10.1016/j.isprsjprs.2012.01.006, 2012.
Brunier, G., Fleury, J., Anthony, E. J., Gardel, A., and Dussouillez, P.: Close-range airborne Structure-from-Motion Photogrammetry for high-resolution beach morphometric surveys: Examples from an embayed rotating beach, Geomorphology, 261, 76–88, https://doi.org/10.1016/J.GEOMORPH.2016.02.025, 2016.
Buckley, S. J., Howell, J. A. A., Enge, H. D. D., and Kurz, T. H. H.: Terrestrial laser scanning in geology: data acquisition, processing and accuracy considerations, J. Geol. Soc. London, 165, 625–638, https://doi.org/10.1144/0016-76492007-100, 2008.
Castellazzi, G., D'Altri, A. M., Bitelli, G., Selvaggi, I., and Lambertini, A.: From laser scanning to finite element analysis of complex buildings by using a semi-automatic procedure, Sensors, 15, 18360–18380, https://doi.org/10.3390/s150818360, 2015.
Cook, K. L.: An evaluation of the effectiveness of low-cost UAVs and structure from motion for geomorphic change detection, Geomorphology, 278, 195–208, https://doi.org/10.1016/j.geomorph.2016.11.009, 2017.
Cook, K. L. and Dietze, M.: Short Communication: A simple workflow for robust low-cost UAV-derived change detection without ground control points, Earth Surf. Dynam., 7, 1009–1017, https://doi.org/10.5194/esurf-7-1009-2019, 2019.
Eltner, A. and Schneider, D.: Analysis of Different Methods for 3D Reconstruction of Natural Surfaces from Parallel-Axes UAV Images, Photogrammetric Record, 30, 279–299, https://doi.org/10.1111/phor.12115, 2015.
Eltner, A. and Sofia, G.: Structure from motion photogrammetric technique, Dev. Earth Surf. Process., 23, 1–24, https://doi.org/10.1016/B978-0-444-64177-9.00001-1, 2020.
Eltner, A., Kaiser, A., Castillo, C., Rock, G., Neugirg, F., and Abellán, A.: Image-based surface reconstruction in geomorphometry – merits, limits and developments, Earth Surf. Dynam., 4, 359–389, https://doi.org/10.5194/esurf-4-359-2016, 2016.
Feurer, D. and Vinatier, F.: Joining multi-epoch archival aerial images in a single SfM block allows 3-D change detection with almost exclusively image information, ISPRS J. Photogramm., 146, 495–506, https://doi.org/10.1016/j.isprsjprs.2018.10.016, 2018.
Gabrieli, F., Corain, L., and Vettore, L.: A low-cost landslide displacement activity assessment from time-lapse photogrammetry and rainfall data: Application to the Tessina landslide site, Geomorphology, 269, 56–74, https://doi.org/10.1016/j.geomorph.2016.06.030, 2016.
Giacomini, A., Thoeni, K., Santise, M., Diotri, F., Booth, S., Fityus, S., and Roncella, R.: Temporal-Spatial Frequency Rockfall Data from Open-Pit Highwalls Using a Low-Cost Monitoring System, Remote Sens., 12, 2459, https://doi.org/10.3390/rs12152459, 2020.
Gili, J. A., Moya, J., Corominas, J., Crosetto, M., and Monserrat, O.: Past, present and future monitoring at the vallcebre landslide (Eastern pyrenees, spain), Appl. Sci. (Switzerland), 11, 1–22, https://doi.org/10.3390/app11020571, 2021.
Giordan, D., Allasia, P., Dematteis, N., Dell'Anese, F., Vagliasindi, M., and Motta, E.: A Low-Cost Optical Remote Sensing Application for Glacier Deformation Monitoring in an Alpine Environment, Sensors, 16, 1750, https://doi.org/10.3390/s16101750, 2016.
Giordan, D., Luzi, G., Monserrat, O., and Dematteis, N.: Remote Sensing Analysis of Geologic Hazards, Remote Sens. (Basel), 14, 4818, https://doi.org/10.3390/rs14194818, 2022.
Gómez-Gutiérrez, Á., De Sanjosé-Blasco, J. J., Lozano-Parra, J., Berenguer-Sempere, F., and De Matías-Bejarano, J.: Does HDR pre-processing improve the accuracy of 3D models obtained by means of two conventional SfM-MVS software packages? The case of the corral del veleta rock glacier, Remote Sens., 7, 10269–10294, https://doi.org/10.3390/rs70810269, 2015.
Guzzetti, F., Carrara, A., Cardinali, M., and Reichenbach, P.: Landslide hazard evaluation: a review of current techniques and their application in a multi-scale study, Central Italy, Geomorphology, 31, 181–216, https://doi.org/10.1016/S0169-555X(99)00078-1, 1999.
Hadhri, H., Vernier, F., Atto, A. M., and Trouvé, E.: Time-lapse optical flow regularization for geophysical complex phenomena monitoring, ISPRS J. Photogramm., 150, 135–156, https://doi.org/10.1016/j.isprsjprs.2019.02.007, 2019.
Hendrickx, H., Le Roy, G., Helmstetter, A., Pointner, E., Larose, E., Braillard, L., Nyssen, J., Delaloye, R., and Frankl, A.: Timing, volume and precursory indicators of rock- and cliff fall on a permafrost mountain ridge (Mattertal, Switzerland), Earth Surf. Proc. Landf., 47, 1532–1549, https://doi.org/10.1002/esp.5333, 2022.
Hereward, H. F. R., Facey, R. J., Sargent, A. J., Roda, S., Couldwell, M. L., Renshaw, E. L., Shaw, K. H., Devlin, J. J., Long, S. E., Porter, B. J., Henderson, J. M., Emmett, C. L., Astbury, L., Maggs, L., Rands, S. A., and Thomas, R. J.: Raspberry Pi nest cameras: An affordable tool for remote behavioral and conservation monitoring of bird nests, Ecol. Evol., 11, 21, https://doi.org/10.1002/ece3.8127, 2021.
Hiller, C., Walter, L., Helfricht, K., Weisleitner, K., and Achleitner, S.: Flood Flow in a Proglacial Outwash Plain: Quantifying Spatial Extent and Frequency of Inundation from Time-Lapse Imagery, Water, 14, 590, https://doi.org/10.3390/w14040590, 2022.
How, P., Schild, K. M., Benn, D. I., Noormets, R., Kirchner, N., Luckman, A., Vallot, D., Hulton, N. R. J., and Borstad, C.: Calving controlled by melt-under-cutting: Detailed calving styles revealed through time-lapse observations, Ann. Glaciol., 60, 20–31, https://doi.org/10.1017/aog.2018.28, 2019.
Hungr, O., Leroueil, S., and Picarelli, L.: The Varnes classification of landslide types, an update, Landslides, 11, 167–194. https://doi.org/10.1007/s10346-013-0436-y, 2014.
Iglhaut, J., Cabo, C., Puliti, S., Piermattei, L., O'Connor, J., and Rosette, J.: Structure from Motion Photogrammetry in Forestry: a Review, Current Forestry Reports, 5, 155–168, https://doi.org/10.1007/s40725-019-00094-3, 2019.
Jaboyedoff, M., Oppikofer, T., Abellán, A., Derron, M. H., Loye, A., Metzger, R., and Pedrazzini, A.: Use of LIDAR in landslide investigations: A review, Nat. Hazards, 61, 5–28, https://doi.org/10.1007/s11069-010-9634-2, 2012.
James, M. R. and Quinton, J. N.: Ultra-rapid topographic surveying for complex environments: The hand-held mobile laser scanner (HMLS), Earth Surf. Proc. and Landf., 39, 138–142, https://doi.org/10.1002/esp.3489, 2014.
James, M. R. and Robson, S.: Straightforward reconstruction of 3D surfaces and topography with a camera: Accuracy and geoscience application, J. Geophys. Res.-Earth Surf., 117, 1–17, https://doi.org/10.1029/2011JF002289, 2012.
James, M. R. and Robson, S.: Sequential digital elevation models of active lava flows from ground-based stereo time-lapse imagery, ISPRS J. Photogramm., 97, 160–170, https://doi.org/10.1016/j.isprsjprs.2014.08.011, 2014a.
James, M. R. and Robson, S.: Mitigating systematic error in topographic models derived from UAV and ground-based image networks, Earth Surf. Proc. Landf., 39, 1413–1420, https://doi.org/10.1002/esp.3609, 2014b.
James, M. R., Robson, S., and Smith, M. W.: 3-D uncertainty-based topographic change detection with structure-from-motion photogrammetry: precision maps for ground control and directly georeferenced surveys, Earth Surf. Proc. Landf., 42, 1769–1788, https://doi.org/10.1002/esp.4125, 2017.
Khan, M. W., Dunning, S., Bainbridge, R., Martin, J., Diaz-Moreno, A., Torun, H., Jin, N., Woodward, J., and Lim, M.: Low-Cost Automatic Slope Monitoring Using Vector Tracking Analyses on Live-Streamed Time-Lapse Imagery, Remote Sensing, 13, 893, https://doi.org/10.3390/rs13050893, 2021.
Kneib, M., Miles, E. S., Buri, P., Fugger, S., McCarthy, M., Shaw, T. E., Chuanxi, Z., Truffer, M., Westoby, M. J., Yang, W., and Pellicciotti, F.: Sub-seasonal variability of supraglacial ice cliff melt rates and associated processes from time-lapse photogrammetry, The Cryosphere, 16, 4701–4725, https://doi.org/10.5194/tc-16-4701-2022, 2022.
Kromer, R., Walton, G., Gray, B., Lato, M., and Group, R.: Development and Optimization of an Automated Fixed-Location Time Lapse Photogrammetric Rock Slope Monitoring System, Remote Sens., 11, 1890, https://doi.org/10.3390/rs11161890, 2019.
Lague, D., Brodu, N., and Leroux, J.: Accurate 3D comparison of complex topography with terrestrial laser scanner: Application to the Rangitikei canyon (N-Z), ISPRS J. Photogramm., 82, 10–26, https://doi.org/10.1016/j.isprsjprs.2013.04.009, 2013.
Lenzano, M. G., Lannutti, E., Toth, C. K., Lenzano, L. E., and Lovecchio, A.: Assessment of ice-dam collapse by time-lapse photos at the Perito Moreno glacier, Argentina. The International Archives of the Photogrammetry, Remote Sensing and Spatial Information Sciences, XL-1, 211–217, https://doi.org/10.5194/isprsarchives-XL-1-211-2014, 2014.
Lenzano, M. G., Lannutti, E., Toth, C., Lenzano, L., Lo Vecchio, A., Falaschi, D., and Vich, A.: Analyzing the oscillations of the Perito Moreno Glacier, using time-lapse image sequences, Cold Reg. Sci. Technol., 146, 155–166, https://doi.org/10.1016/j.coldregions.2017.11.015, 2018.
Luhmann, T., Fraser, C., and Maas, H. G.: Sensor modelling and camera calibration for close-range photogrammetry, ISPRS J. Photogramm., 115, 37–46, https://doi.org/10.1016/j.isprsjprs.2015.10.006, 2016.
Mallalieu, J., Carrivick, J. L., Quincey, D. J., Smith, M. W., and James, W. H. M.: An integrated Structure-from-Motion and time-lapse technique for quantifying ice-margin dynamics, J. Glaciol., 63, 937–949, https://doi.org/10.1017/jog.2017.48, 2017.
McKean, J. and Roering, J.: Objective landslide detection and surface morphology mapping using high-resolution airborne laser altimetry, Geomorphology, 57, 331–351, https://doi.org/10.1016/S0169-555X(03)00164-8, 2004.
Meidow, J., Usländer, T., and Schulz, K.: Obtaining as-built models of manufacturing plants from point clouds, At-Automatisierungstechnik, 66, 397–405, https://doi.org/10.1515/auto-2017-0133, 2018.
Nesbit, P. R. and Hugenholtz, C. H.: Enhancing UAV-SfM 3D model accuracy in high-relief landscapes by incorporating oblique images, Remote Sens., 11, 239, https://doi.org/10.3390/rs11030239, 2019.
Núñez-Andrés, M. A., Prades-Valls, A., Matas, G., Buill, F., and Lantada, N.: New Approach for Photogrammetric Rock Slope Premonitory Movements Monitoring, Remote Sens., 15, 293, https://doi.org/10.3390/rs15020293, 2023.
Roncella, R., Bruno, N., Diotri, F., Thoeni, K., and Giacomini, A.: Photogrammetric Digital Surface Model Reconstruction in Extreme Low-Light Environments, Remote Sens., 13, 1261, https://doi.org/10.3390/rs13071261, 2021.
Rowley, T., Ursic, M., Konsoer, K., Langendon, E., Mutschler, M., Sampey, J., and Pocwiardowski, P.: Comparison of terrestrial lidar, SfM, and MBES resolution and accuracy for geomorphic analyses in physical systems that experience subaerial and subaqueous conditions, Geomorphology, 355, 107056, https://doi.org/10.1016/j.geomorph.2020.107056, 2020.
Royán, M. J., Abellán, A., Jaboyedoff, M., Vilaplana, J. M., and Calvet, J.: Spatio-temporal analysis of rockfall pre-failure deformation using Terrestrial LiDAR, Landslides, 11, 697–709, https://doi.org/10.1007/s10346-013-0442-0, 2014.
Santise, M., Thoeni, K., Roncella, R., Sloan, S. W., and Giacomini, A.: Preliminary tests of a new low-cost photogrammetric system, The International Archives of the Photogrammetry, Remote Sensing and Spatial Information Sciences, XLII-2/W8, 229–236, https://doi.org/10.5194/isprs-archives-XLII-2-W8-229-2017, 2017.
Schwalbe, E. and Maas, H.-G.: The determination of high-resolution spatio-temporal glacier motion fields from time-lapse sequences, Earth Surf. Dynam., 5, 861–879, https://doi.org/10.5194/esurf-5-861-2017, 2017.
Smith, M. W., Carrivick, J. L., and Quincey, D. J.: Structure from motion photogrammetry in physical geography, Prog. Phys. Geogr., 40, 247–275, https://doi.org/10.1177/0309133315615805, 2015.
Stumpf, A., Malet, J. P., Allemand, P., Pierrot-Deseilligny, M., and Skupinski, G.: Ground-based multi-view photogrammetry for the monitoring of landslide deformation and erosion, Geomorphology, 231, 130–145, https://doi.org/10.1016/j.geomorph.2014.10.039, 2015.
Sturzenegger, M., Yan, M., Stead, D., and Elmo, D.: Application and limitations of ground-based laser scanning in rock slope characterization, Proceedings of the 1st Canada-US Rock Mechanics Symposium – Rock Mechanics Meeting Society's Challenges and Demands, 1, 29–36, https://doi.org/10.1201/noe0415444019-c4, 2007.
Tarolli, P.: High-resolution topography for understanding Earth surface processes: Opportunities and challenges, Geomorphology, 216, 295–312, https://doi.org/10.1016/j.geomorph.2014.03.008, 2014.
Tonini, M. and Abellan, A.: Rockfall detection from terrestrial LiDAR point clouds: A clustering approach using R, Journal of Spatial Information Science, 8, 95–11, https://doi.org/10.5311/josis.2014.8.123, 2014.
Travelletti, J., Delacourt, C., Allemand, P., Malet, J. P., Schmittbuhl, J., Toussaint, R., and Bastard, M.: Correlation of multi-temporal ground-based optical images for landslide monitoring: Application, potential and limitations, ISPRS J. Photogramm., 70, 39–55, https://doi.org/10.1016/j.isprsjprs.2012.03.007, 2012.
Van Veen, M., Hutchinson, I. D. J., Kromer, R., Lato, M., and Edwards, T.: Effects of sampling interval on the frequency - magnitude relationship of rockfalls detected from terrestrial laser scanning using semi-automated methods, Landslides, 14, 1579–1592, https://doi.org/10.1007/s10346-017-0801-3, 2017.
Westoby, M. J., Brasington, J., Glasser, N. F., Hambrey, M. J., and Reynolds, J. M.: `Structure-from-Motion' photogrammetry: A low-cost, effective tool for geoscience applications, Geomorphology, 179, 300–314, https://doi.org/10.1016/j.geomorph.2012.08.021, 2012.
Wilkinson, M. W., Jones, R. R., Woods, C. E., Gilment, S. R., McCaffrey, K. J. W., Kokkalas, S., and Long, J. J.: A comparison of terrestrial laser scanning and structure-frommotion photogrammetry as methods for digital outcrop acquisition, Geosphere, 12, 1865–1880, https://doi.org/10.1130/GES01342.1, 2016.
Williams, J. G., Rosser, N. J., Hardy, R. J., Brain, M. J., and Afana, A. A.: Optimising 4-D surface change detection: an approach for capturing rockfall magnitude–frequency, Earth Surf. Dynam., 6, 101–119, https://doi.org/10.5194/esurf-6-101-2018, 2018.