the Creative Commons Attribution 4.0 License.
the Creative Commons Attribution 4.0 License.
 | 01 Sep 2023
Linking reported drought impacts with drought indices, water scarcity and aridity: the case of Kenya
Alessia Matanó
Anne F. Van Loon
Rhoda A. Odongo
Aklilu D. Teklesadik
Charles N. Wamucii
Marc J. C. van den Homberg
Shamton Waruru
The relation between drought severity and drought impacts is complex and relatively unexplored in the African continent. This study assesses the relation between reported drought impacts, drought indices, water scarcity and aridity across several counties in Kenya. The monthly bulletins of the National Drought Management Authority in Kenya provided drought impact data. A random forest (RF) model was used to explore which set of drought indices (standardized precipitation index, standardized precipitation evapotranspiration index, standardized soil moisture index and standardized streamflow index) best explains drought impacts on pasture, livestock deaths, milk production, crop losses, food insecurity, trekking distance for water and malnutrition. The findings of this study suggest a relation between drought severity and the frequency of drought impacts, whereby the latter also showed a positive relation with aridity. A relation between water scarcity and aridity was not found. The RF model revealed that every region, aggregated by aridity, had their own set of predictors for every impact category. Longer timescales (≥ 12 months) and the standardized streamflow index were strongly represented in the list of predictors, indicating the importance of hydrological drought to predict drought impact occurrences. This study highlights the potential of linking drought indices with text-based impact reports while acknowledging that the findings strongly depend on the availability of drought impact data. Moreover, it emphasizes the importance of considering spatial differences in aridity, water scarcity and socio-economic conditions within a region when exploring the relationships between drought impacts and indices.
- Article
(1808 KB) - Full-text XML
-
Supplement
(382 KB) - BibTeX
- EndNote


Drought events are among the world's most impactful disasters (Stahl et al., 2016) and are receiving increasing attention across different scientific disciplines because of their complex links to both natural and socio-economic processes (Van Dijk et al., 2013; Van Loon et al., 2016a, b). Drought can be characterized as a slow-onset event whose impacts build up over time and extend spatially in relation to a range of contextual factors (Heinrich and Bailey, 2020). For instance, differences in societal and political characteristics can lead to a different range and magnitude of impacts even though the intensity and duration of drought are similar (Savelli et al., 2022). At the same time, catchment characteristics also strongly influence the severity and propagation of drought events (Van Loon, 2015).
The multifaceted nature of drought drivers, drought detection and quantification usually rely primarily on the analysis of climatic and hydrological variables (Kchouk et al., 2022; Mishra and Singh, 2010; Yihdego et al., 2019). By expressing the anomaly with respect to the mean and variability in the local climate, drought characteristics can be compared across regions with different climate conditions. In addition, accumulation periods can be used to account for time lags and memory encountered in hydrological stores (Sutanto and Van Lanen, 2022). The simplest drought indices only use meteorological data, while others include soil moisture or streamflow data (Yihdego et al., 2019). Meteorological and/or soil moisture (agricultural) droughts are often expressed by the standardized precipitation index (SPI), standardized precipitation evapotranspiration index (SPEI) and the Palmer drought severity index (PDSI) (e.g. Baig et al., 2022; Kamruzzaman et al., 2022; Zhou et al., 2022), while the standardized streamflow index (SSI), the standardized runoff index and the standardized groundwater level index (SGI) can be applied for hydrological drought (Van Loon, 2015). However, the analysis of hydro-meteorological variables alone may not be sufficient for the identification of the actual impacts of drought, as the listed drought indices do not take into account the vulnerability of the system under analysis (Bachmair et al., 2015). To better evaluate and communicate drought risk, it is necessary to establish reliable links between drought indices and impacts. Linking drought impacts to drought indices can contribute to drought risk and vulnerability assessments, which are useful for the development of drought monitoring and early warning systems. These systems inform national and international organizations in providing timely and relevant assistance.
Due to the projected increase in drought frequency in some regions around the world (Seneviratne et al., 2021), the probability of successive drought events might rise, resulting in increased destabilization, insecurity and resource-based conflict in contexts with high vulnerabilities (Peng et al., 2020). Monitoring and early warning (M&EW) are important measures to enhance drought resilience. The goal of M&EW is to provide reliable and timely information on drought conditions (using a wide range of drought indices) to enable a local community to better prepare and act accordingly (Wilhite et al., 2007). However, there is a gap between forecasting an extreme hydro-meteorological event and the understanding of its potential impacts, as recognized by the World Meteorological Organization (WMO, 2015). The assessment and monitoring of drought impacts are complex, given (1) the great variety of drought impact categories, (2) their possible propagation throughout the hydrological and social system, and (3) the difficulty of drought impact attribution. For Europe and the USA, drought impact databases have been developed, namely the European Drought Impact Report Inventory (EDII) (EDC, 2013) and the Drought Impact Reporter (NDMC, 2005). Unfortunately, a comprehensive and structured drought impact dataset for the Horn of Africa region is not available yet.
Several studies explored the links between drought impacts and drought indices. For instance, the qualitative dataset of EDII has been used to assess the link between drought impacts and indices at continental (Blauhut et al., 2015), national (Stagge et al., 2015) and regional scales (Bachmair et al., 2015, 2016, 2018). Several methods have been used to investigate the relationships between drought impacts and drought indices, such as logistic or linear regression (Bachmair et al., 2018; Blauhut et al., 2015; Gudmundsson et al., 2014; Parsons et al., 2019; O'Connor et al., 2022; Stagge et al., 2015), correlation analysis (Bachmair et al., 2016; Ma et al., 2020; Wang et al., 2020), and an ensemble regression tree approach (random forest) (Bachmair et al., 2016, 2017; Wang et al., 2020). A multitude of drought indices, mostly SPI and SPEI with accumulation periods ranging between 1 and 24 months, were linked to drought impact categories applicable for the research area, for example wildfire activity (Gudmundsson et al., 2014) and agriculture (Parsons et al., 2019). However, according to our knowledge, there are no similar studies with a focus on the Horn of Africa. Linking drought impacts to drought indices in that region can provide new insights on the relevant drought impact categories (e.g., food insecurity, livestock hunger, migration, diseases, conflicts; Quandt, 2021).
Linking drought impacts with drought indices is regarded as difficult, as there is often no strong intuitive cut-off within impact categories during non-drought and drought conditions (Hall and Leng, 2019). For instance, water scarcity conditions can be the result of anthropogenic actions and can lead to the same impacts experienced as those during drought conditions (Van Loon and Van Lanen, 2013). Water scarcity is a frequent phenomenon within (semi-)arid regions (Maliva and Missimer, 2012), and it occurs when water demand (both societal and ecological water demand) exceeds water supply (Kimwatu et al., 2021). It often leads to long-term unsustainable use of water resources (Van Loon and Van Lanen, 2013). Whereas aridity, based on the ratio of long-term annual precipitation and potential evapotranspiration rates (UNESCO, 1979), is regarded as a relatively constant value, water scarcity is dynamic in time and related to both decreases in water availability and increases in water demand. The simultaneous presence of both water scarcity (partly driven by anthropogenic causes) and meteorological drought in an arid region can lead to a difficult attribution of the impacts experienced. However, the separation of the causes of impacts is needed to generate reliable information to stimulate early actions in the affected sectors during drought events.
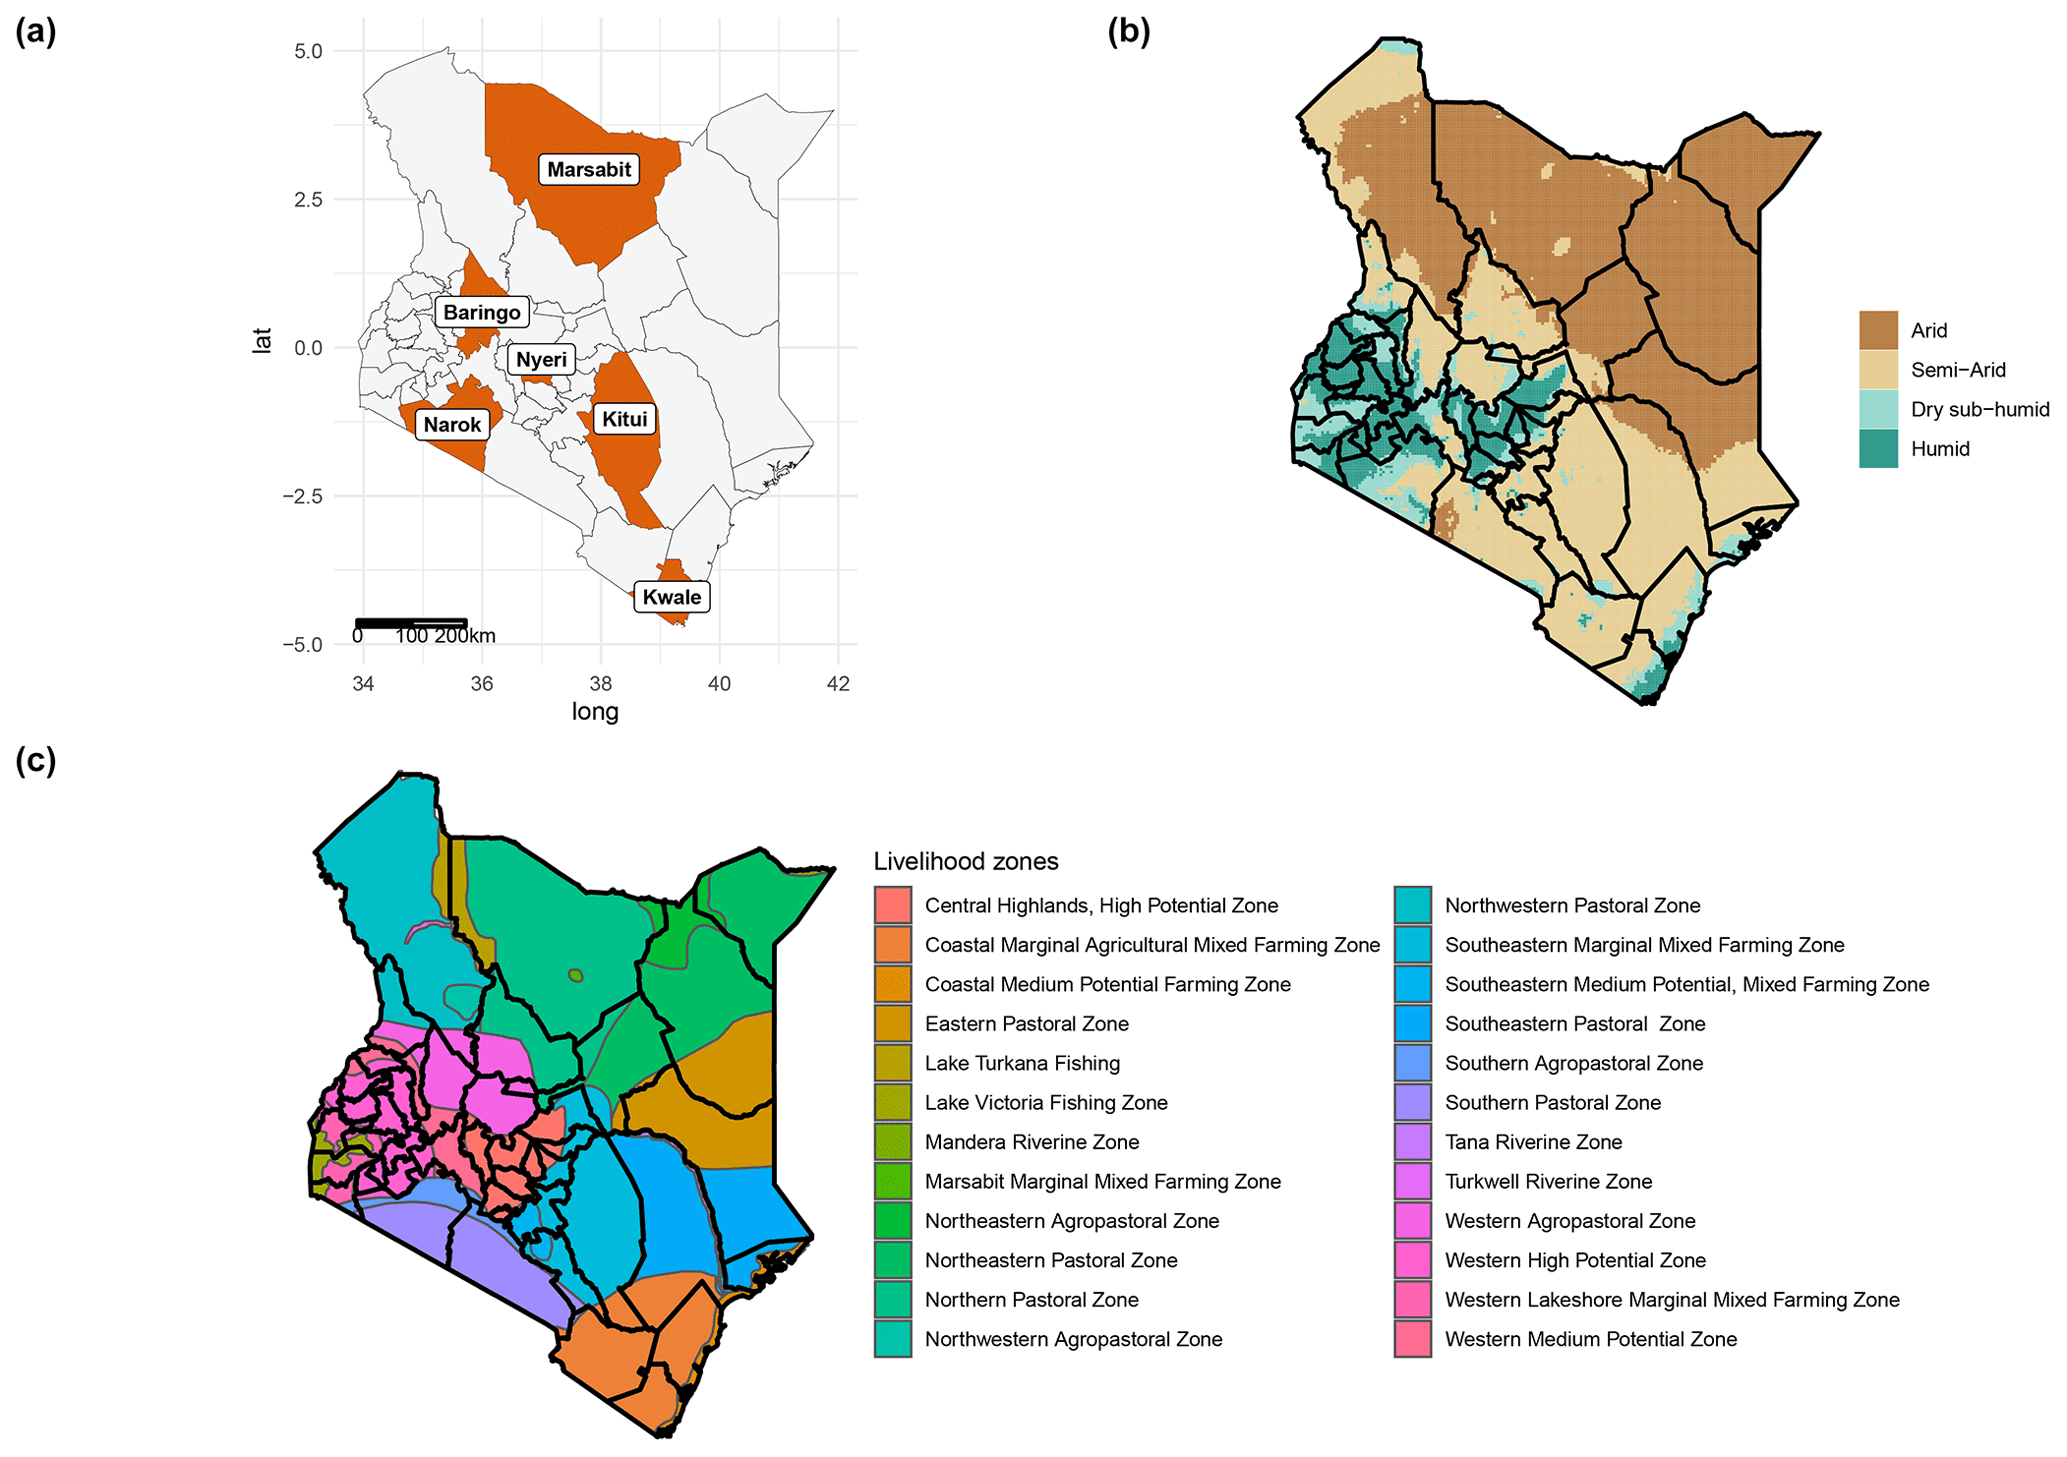
Figure 1Study area and its main characteristics. (a) Counties considered in this study, (b) distribution of aridity and (c) distribution of livelihood zones.
In this study, we focus on Kenya. The country is characterized by strong gradients in precipitation, aridity, water yield (i.e. amount of precipitation minus total actual evapotranspiration) and water scarcity (Mulwa et al., 2021; Wamucii et al., 2021). Furthermore, recent drought impact reports are also freely accessible for specific Kenyan counties. The country has experienced several drought events in the recent past: for instance, 2008–2011 was classified as a prolonged severe drought (Mutsotso et al., 2018), and the drought in 2016–2017 was considered a national disaster (Kew et al., 2021; Ondiko and Karanja, 2021), with more than three million people under food insecurity (Thomas et al., 2020). The country has also experienced a diverse range of drought impacts such as cattle mortality, wildlife deaths, famine, human losses and severe food shortages (Ondiko and Karanja, 2021). The presence of drought hazards, drought impacts, water scarcity and aridity makes this country a suitable study area to analyse their relations. In this context, the following main research question is formulated: what is the relation of drought impacts with drought indices and with water scarcity under different aridity levels?
It is expected that drought events and impact occurrences vary between climate zones. We hypothesize that drought impacts (and therefore the relationship between drought indices and impacts) will differ across regions with different aridity characteristics in Kenya because of the distinct socio-economic settings, possibly making arid areas more vulnerable than more humid areas (Maliva and Missimer, 2012). Furthermore, it is expected that water scarcity will show a relation with aridity due to the presence of unreliable water conditions.
2.1 Study area
Kenya is situated in East Africa. Its highest altitudes can be found in the central highlands (with the highest peak of over 5000 m above sea level observed in Mt. Kenya's forested water tower), and low-lying regions can be found in the east, northwest and northeast. The country mostly has an arid and semi-arid climate which comprises about 80 % of the territory and hosts about one-quarter of the population (FEWS NET, 2013) of approximately 53 million people (The World Bank, 2020). Mean annual rainfall is less than 250 mm in the semi-arid and arid areas and more than 2000 mm in the mountainous areas. Long rains are experienced from March to May (MAM), while short rains occur from October to December (OND) (Ayugi et al., 2020). Medium- to high-potential agricultural areas are in the highland areas in the central and western parts of the country (sub-humid and humid zones) where the population density is 6 times the country’s average. Farming is the primary livelihood (both subsistence and commercial) for more than 75 % of the population. Less than 4 % are pastoralists who mainly live in the semi-arid and arid regions which are characterized by poorly distributed and unreliable rainfall (FEWS NET, 2013).
For this study, six counties have been selected according to different aridity levels, livelihood zones and available drought impact information. Figure 1 presents the counties considered in this study (Fig. 1a), the aridity (Fig. 1b) and the livelihood zones (Fig. 1c). Marsabit is an arid county (arid index 0.03–0.20) in the northern pastoral zone, while Baringo, Kitui and Kwale are considered semi-arid (arid index 0.20–0.50). Baringo is located in the western part of Kenya and encompasses mostly a high-potential agricultural zone, while Kitui and Kwale are both mostly marginal mixed farming zones. Nyeri is situated in the central highlands and encompasses mostly a high-potential agricultural zone. This study specifically focuses on one district in the Nyeri county, namely Kieni, because of the availability of drought impact data provided by the National Drought Management Authority (NDMA). From now on, with Nyeri, we only refer to the Kieni district. The main livelihood in Kieni is connected to agropastoral activities (FEWS NET, 2013). Narok mostly consists of (agro-)pastoral grounds. Both Nyeri and Narok are regarded as sub-humid regions (arid index 0.50–0.75).
2.2 Data
To study the linkage between drought impacts, drought indices, water scarcity and aridity, several datasets were used. In this study, we used reanalysis data to analyse several hydro-meteorological variables (Sect. 2.2.1), national drought bulletins for text-based drought impact data (Sect. 2.2.2) and a gridded water scarcity dataset from McNally et al. (2019) (Sect. 2.2.3).
2.2.1 Hydro-meteorological and soil moisture datasets
Precipitation data
Precipitation data are retrieved from the Multi-Source Weighted-Ensemble Precipitation (MSWEP v2) (Beck et al., 2019). This is a global gridded precipitation (P) dataset that takes full advantage of the complementary nature of the highest-quality gauge-, satellite- and reanalysis-based P estimates, available as a function of timescale and location, by optimally combining them (Beck et al., 2019). MSWEP covers the period 1979–2020 at 3-hourly temporal and 0.1∘ spatial resolutions. This dataset is chosen for this analysis based on its spatial and temporal resolutions and good performance in capturing spatial and temporal variations in drought conditions (Xu et al., 2019).
Soil moisture and potential evapotranspiration data
The Global Land Evaporation Amsterdam Model (GLEAM) version 3.5a consists of a set of algorithms dedicated to the estimation of land surface evaporation (also referred to as evapotranspiration) and root-zone soil moisture from satellite and reanalysis data at the global scale and 0.25∘ spatial resolution (Martens et al., 2017; Miralles et al., 2011). The model uses the MSWEP dataset (Beck et al., 2017a), satellite-observed soil moisture, reanalysis-based air temperature and radiation, and vegetation optical depth (VOD) (Liu et al., 2011) to produce terrestrial evaporation and root-zone soil moisture (Martens et al., 2017). The GLEAM model applies the Priestley–Taylor (PT) equation (Priestley and Taylor, 1972) to calculate the potential evapotranspiration (PET) based on observations of the European Centre for Medium-Range Weather Forecasts (ECMWF), ERA-Interim surface net radiation and near-surface air temperature (Dee et al., 2011). GLEAM datasets have been used in multiple hydro-meteorological applications and recent drought condition studies in the Horn of Africa (e.g. Javadinejad et al., 2019; Nicolai-Shaw et al., 2017; Peng et al., 2020). For this study, the GLEAM PET and root-zone soil moisture data (see http://www.gleam.eu, last access: 23 July 2022) are used for the period 2010–2020.
Streamflow data
Streamflow data are retrieved from the Global Flood Awareness System (GLoFAS) which consists of global gridded reanalysis river discharge data, with a horizontal resolution of 0.1∘ at a daily time step and a time period of 1979–present (Harrigan et al., 2020). It combines the land surface model runoff component of the ECMWF ERA5 global reanalysis (Balsamo et al., 2009; Hersbach et al., 2020) with a hydrological rainfall–runoff channel routing model (Van Der Knijff et al., 2010; Hirpa et al., 2018) (see http://www.globalfloods.eu/, last access: 23 July 2023). The GLoFAS dataset was chosen because of limited river discharge observational data in the study area.
2.2.2 Impact data from the National Drought Management Authority (NDMA)
The monthly county early warning bulletins of the National Drought Management Authority (NDMA) of Kenya were used to retrieve drought impact data. The NDMA has offices in the 23 arid and semi-arid lands (ASALs) of Kenya which are considered vulnerable to drought. The authority performs sentinel surveillance each month based on rainfall estimates from the Tropical Application of Meteorology Using Satellite Data and Ground-based Observations (TAMSAT) (Maidment et al., 2014; Tarnavsky et al., 2014) and vegetation and water status. Food security threats are assessed based on the following: (1) availability aspects: cropping area and yield (maize, beans, sorghum, etc.), animal body condition, milk production, livestock death, and forage conditions; and (2) access factors: market access and performance, as well as food availability in the household and market. These data are fed into web-based software created by the Kenya's Drought Early Warning System and sent directly to the county director. The director analyses the data against the 3-monthly vegetation condition index (VCI-3 month) provided at county level and on a monthly basis. The VCI is obtained from an advanced filtering method for the Moderate Resolution Imaging Spectroradiometer (MODIS) normalized difference vegetation index (NDVI) at pixel level developed and implemented by the University of Natural Resources and Life Sciences (BOKU) (Klisch and Atzberger, 2016). The MODIS NDVI data undergo offline smoothing based on the Whittaker smoother (Atzberger and Eilers, 2011) to daily NDVI values and near-real-time filtering based on available observations within the past 175 d (Atzberger et al., 2014). In addition, the director calculates the percentage of children under 5 years of age with malnutrition using the mid-upper-arm circumference (MUAC) colour codes of the United Nations Children's Fund (UNICEF) against the long-term average. Lastly, the Food Consumption Score (FCS) is computed based on food frequency and diversity based on a 7 d recall of food consumed at the household level, taking into account the relative nutritional importance of different food groups (WFP, 2008). A poor FCS means a lack of vegetable consumption every day and low consumption of protein-rich food such as dairy and meat.
2.2.3 Water scarcity
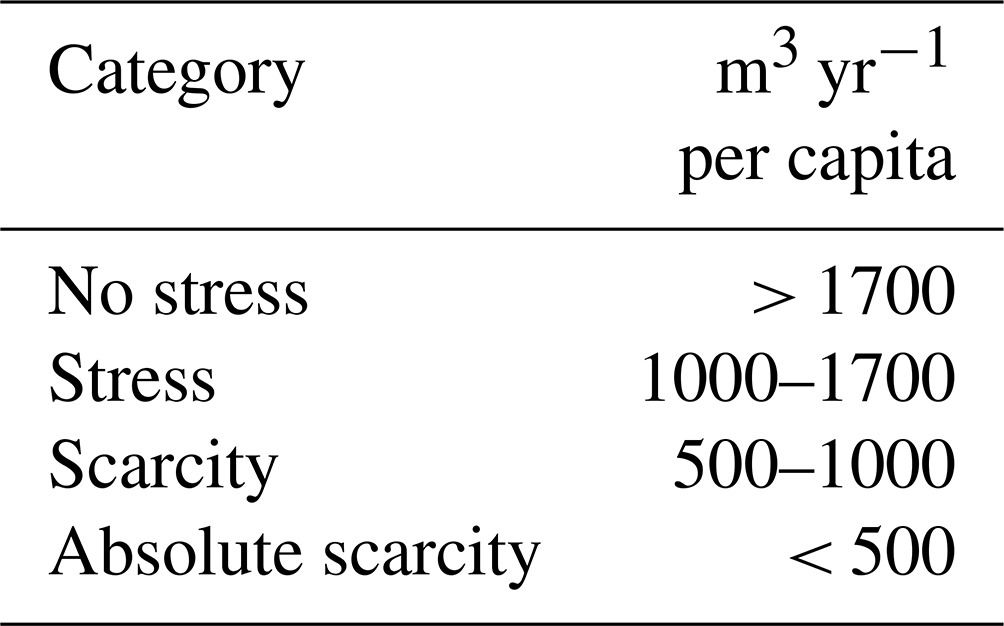
This study has utilized water scarcity (WS) data from McNally et al. (2019). The data are a monthly water scarcity dataset with a spatial resolution of 0.1∘ for Africa from March 2018 to the present. The water scarcity dataset is based on hydrological data from the Famine Early Warning System Network (FEWS NET) Land Data Assimilation System (FLDAS) and gridded population data from WorldPop 2015. The FLDAS’s Noah 3.6 land surface model is derived from the Climate Hazards Group InfraRed Precipitation with Station (CHIRPS) rainfall data and NASA's Modern-Era Retrospective analysis for Research and Applications (MERRA-2) meteorological forcing. The different classes of water scarcity are defined by the Falkenmark index (Falkenmark et al., 1989). This index categorizes the amount of renewable freshwater available for each person per year, as shown in Table 1. The water scarcity dataset of McNally et al. (2019) provides monthly water scarcity data despite the yearly values of the Falkenmark index. For this, McNally et al. (2019) used the yearly values of the Falkenmark index to classify the water scarcity on a monthly basis by using a 12-month running total of the streamflow data. The water scarcity dataset was aggregated for the whole of Kenya, whereafter monthly average values per county have been calculated and classified by the Falkenmark index. More information about the water scarcity dataset can be found in Appendix A.
2.3 Methods
2.3.1 Drought indices
There are several widely used standardized drought indices to characterize meteorological, hydrological and soil moisture drought. The standardized precipitation index (SPI), devised by McKee et al. (1993), allows the quantification of precipitation deficits/surpluses on a range of different accumulation periods. The SPI is calculated by summing daily MSWEP precipitation over n months (termed accumulation periods) obtaining a monthly temporal resolution. Monthly precipitation values are then ranked and their percentiles calculated. The number of zeros is taken into consideration following recommendations from Stagge et al. (2015). Thereafter, the values are standardized to a normal distribution with values between −3 and 3 by ranking, so without fitting a parametric statistical distribution (as tested by Stagge et al., 2015, and others). This is justifiable in our case because the distribution is already approximately normal. Finally, the gridded SPI values are spatially aggregated to county resolution by averaging the SPI values of all grid cells per county to match the spatial resolution of the recorded impacts. Negative values of the drought indices indicate dryer than average conditions, while positive values indicate wetter than average conditions. An area is considered in drought when the drought index is below 0. A similar procedure is used in the calculation of the indices mentioned below.
The standardized precipitation evapotranspiration index (SPEI) is similar to SPI (Vicente-Serrano et al., 2010), but instead of precipitation it uses the difference between precipitation and potential evapotranspiration as input (Beguería et al., 2014). Thus, it provides a water balance and does not have the zero precipitation problems encountered by SPI. SPEI incorporates the effects of potential evapotranspiration, which depends strongly on the temperature. The standardized soil moisture index (SSMI) is based on mean monthly GLEAM root-zone soil moisture content. Finally, the standardized streamflow index (SSI) is based on mean monthly GloFAS discharge values (Nalbantis, 2008). A mask is created with mean monthly discharge values above 1 m3 s−1. This mask is then used for the calculation of the SSI. The SSI and SSMI are often used to take into account drought propagation through the hydrological cycle and are therefore able to better represent catchment memory compared to the SPI and SPEI. For more information on the calculation of the drought indices used, we refer to the paper of Odongo et al. (2023).
All the four drought indices (SPI, SPEI, SSMI and SSI) are calculated on a monthly timescale at the original grid scale with an accumulation period of 1, 3, 6, 12 and 24 months. The drought indices are calculated for the period 1980–2020. However, for investigating drought index–impact relationships, we use drought indices between July 2013 and 2020 in accordance with the availability of drought impact data. In this study, the SPI and SPEI represent meteorological drought, as they are based on precipitation and evapotranspiration anomalies. SSMI represents soil moisture drought, while SSI represents hydrological drought, as they are based on soil moisture and streamflow anomalies respectively (Yihdego et al., 2019). We also used SPI and SPEI with longer accumulation periods as a proxy for soil moisture and hydrological drought (Dai et al., 2020; Seneviratne et al., 2012; Wanders et al., 2017).
2.3.2 Drought impact data
This research gathered drought impact data from the National Drought Management Authority (NDMA) for the above-specified counties in Kenya from July 2013 to December 2020 (https://www.ndma.go.ke/, last access: 23 January 2023). The NDMA was established by the Kenyan government in 2016 with the aim to set up and operate early warning drought systems and to develop drought preparedness strategies and contingency plans (Barrett et al., 2020). Their website provides monthly county early warning bulletins assessing food security in 23 regions using socio-economic and biophysical factors. These text-based impact reports provide the input for the impact categories considered in this study. The impact categories are based on the available information from the NDMA and can therefore be regarded as categories of socio-economic relevance for Kenya.
The heading of the early warning bulletins provides information on the drought phase classification, according to the following levels: “normal”, “alert”, “alarm”, “emergency” and “recovery”. This classification is based on biophysical variables, such as SPI and VCI, and socio-economic indicators of food security (Mwangi et al., 2022). Only the bulletins mentioning the phases “alert”, “alarm” or “emergency” were considered for this analysis. Furthermore, the early warning bulletins provide information about the severity of drought by categorizing the state of the monitored biophysical and socio-economic indicators. This categorization is in general related to the following five levels: very good, normal, moderate, severe and extreme conditions. We converted this information into binary data by assigning a value of 0 to very good and normal conditions and a value of 1 to moderate, severe and extreme conditions. This study defines a drought impact as a negative or adverse effect on the economic, environmental or social level which is experienced under drought conditions (Erian et al., 2021). The following impact categories were considered:
-
pasture (i.e. livestock migration pattern, quality and quantity of pasture, livestock body condition)
-
livestock deaths
-
milk production
-
food insecurity (based on the Food Consumption Score, FCS)
-
crop losses
-
trekking distance to gather water for households
-
malnutrition.
The Jaccard similarity coefficient for binary values, first developed by Paul Jaccard in 1901 (Jaccard, 1912), was used to measure the similarities between the occurrence of drought impact categories (Niwattanakul et al., 2013). It measures the size of intersection of two binary sets divided by the size of the union. The equation for Jaccard similarity, comparing two impact category datasets represented by A and B, is as follows:
The Jaccard coefficient ranges from 0 to 1, whereby 0 indicates no similarity between the impact category datasets and 1 indicates complete similarity. To conduct a significance test, we followed Chung et al. (2019) and utilized their R package named “jaccard”. In this test, we checked if the p value was below 0.05 to determine statistical significance.
2.3.3 Random forest modelling
A machine learning algorithm, known as the classification type of random forest (RF), has been used to assess the drought indices best linked to drought impacts for regions with the same aridity level. RF is a powerful tool for developing a predictive model and is a fairly new technique for linking drought indices with impacts but showed high potential in the studies of Bachmair et al. (2016, 2017). The RF algorithm, proposed by Breiman (2001), constructs multiple random independent decision trees as an ensemble to reduce the risk of overfitting (this study used 1000 trees). Each tree is constructed on boot-strapped fixed-size sub-samples of the data, and predictions are made by averaging. Approximately two-thirds of the training dataset is used for building a tree, while one-third is not used, called the out-of-bag (OOB) data. This generates an additional estimate of performance, namely the OOB error which is a method to measure the prediction error in the random forest. The predictor variables are the drought indices as mentioned in Sect. 2.3.1, and the response variables are the binary time series of reported drought impacts derived from the monthly early warning bulletins of the NDMA.
The drought impact datasets were clustered according to aridity levels: Marsabit (arid); Baringo, Kwale and Kitui (semi-arid); and Narok and Nyeri (sub-humid). For each of these regions, a RF model was constructed for each drought impact category. In order to validate the model, a training dataset and test dataset were constructed with a proportion of 75 % and 25 % of the original dataset. The training datasets were balanced using a synthetic minority oversampling technique (SMOTE) and randomized under-sampling (RUS), as the RF algorithm is sensitive to class imbalances. The caret package in RStudio (version 6.0-93) was used to conduct the RF model analyses (Kuhn, 2008). The “variable importance” function (varImp) of this package was used to determine the importance of a predictor variable for the model to make accurate predictions. Specifically, the prediction accuracy of the OOB data is recorded for each tree, which is also done after permuting each predictor variable. The difference in accuracy between the two models is then averaged over all trees and normalized by the standard error (Kuhn, 2008; Liaw and Wiener, 2002).
The predictive power of the RF models was assessed in two ways. First, the overall model performance on the training set was evaluated based on a 10-fold cross-validation. Therefore, for each model run, the training dataset was split into 90 % for training and 10 % for prediction. This allows the evaluation of the performance of the RF model on unseen data excluded from model fitting. As model performance metrics, we computed the OOB error rate and the accuracy. The OOB error ranges from 0 % to 100 %, with lower values indicating better model performance. Lower values of the OOB error indicate better model performance, as it implies that the model is making more accurate predictions on unseen data. Second, the RF model was fitted to the test dataset to see how the model would perform on unseen and unbalanced data. The following model performance metrics were used to see how the RF model performed on the test set: precision, recall, the F1 score and the “area under the ROC (receiver operating characteristic) curve” (AUC) (Hanley and McNeil, 1982). Precision refers to the ratio of correctly predicted impacts to the total predicted impacts, whereas recall is the ratio of correctly predicted impacts to the total impacts that should have been predicted. The F1 score is a combination of recall and precision, whereby higher F1 scores indicate more accurate prediction on both the positive and negative classes. The AUC describes whether the model was able to predict the occurrence and non-occurrence of impacts correctly. The AUC ranges from 0 to 1 with higher values indicating better model performance. We validated the results of the RF model by conducting a point-biserial correlation. The point-biserial correlation coefficient measures the direction and strength of a relationship between a continuous and categorical variable (Essen and Akpan, 2018). The results of this analysis will not be discussed in detail but are included in Appendix C.
3.1 Drought indices and drought impacts
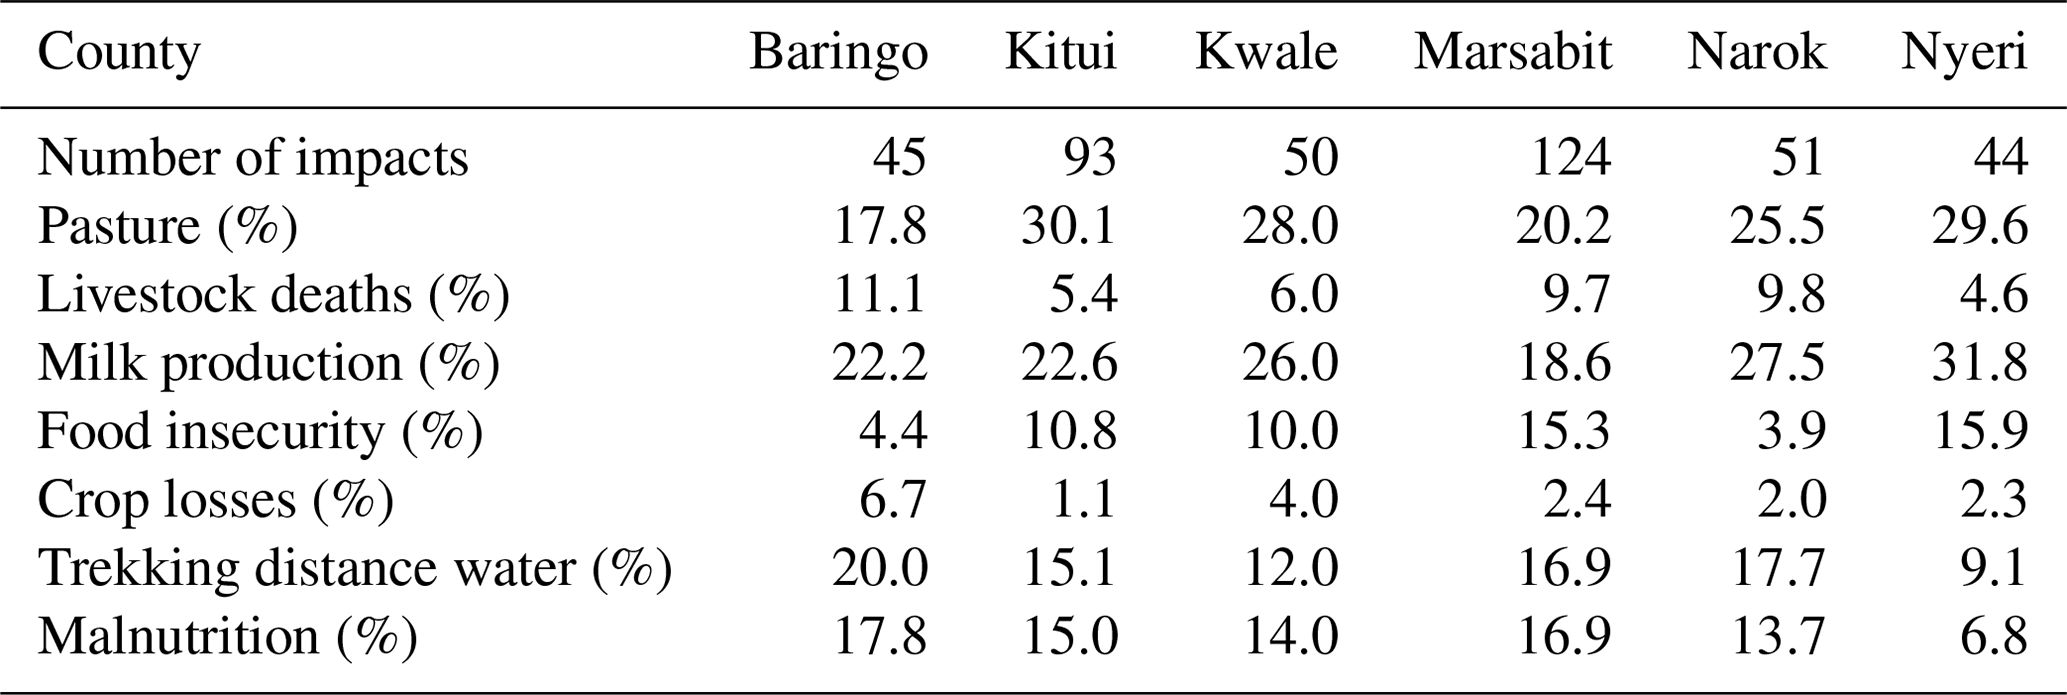
To illustrate the relationship between drought impacts and drought indices, a timeframe from 2016 to 2020 is chosen. Table 2 presents the share of each drought impact category (in %) with respect to the total number of drought impacts per county. Most drought impacts were reported in Marsabit and Kitui, while Baringo and Nyeri reported the lowest number of impacts. Pasture and milk production are the most reported drought impacts across the counties, with values between 17.8 % and 31.8 %. It is noticeable that Nyeri has the highest share in pasture-related impacts: pasture impacts are 29.6 % and milk production impacts are 31.8 % of the total impacts for Nyeri. The least reported drought impacts are on crop losses, livestock deaths and food insecurity with average values of 3.1 %, 7.8 % and 10.1 % respectively. Impacts related to malnutrition are the highest in Baringo (17.8 %) and Marsabit (16.9 %), while Nyeri has by far the lowest number of malnutrition impacts (6.8 %). Baringo has the highest share of impacts concerning trekking distance for water (20.0 %), while Nyeri has the lowest percentage (9.1 %).
Table 2Total number of reported drought impacts between 2016 and 2020 and the share of drought impact categories (%) for each county.
A time series of the drought indicator SPEI for different accumulation periods (1, 3, 6, 12 and 24 months) and a timeline with drought impacts are presented for Marsabit and Nyeri in Fig. 2 for the time period 2016–2020. We choose to visualize the drought impacts and SPEI time series of those counties because of their contrasting aridity levels. Specifically, Marsabit represents an arid region, while Nyeri is classified as sub-humid. Similar figures for the other counties are included in the Supplement (Figs. S1–S4). It is noticeable that Marsabit experienced more extreme drought (in frequency and intensity) than Nyeri: SPEI-03 with a value of −2.22 in November 2018 was the most extreme drought for Marsabit, while SPEI-12 with a value of −1.90 in April 2017 was the most extreme drought for Nyeri. SPEI-24 indicates that Marsabit experienced a multiyear drought from January 2016 to May 2019. The drought of 2016–2017 is very visible for both counties. In addition, there was a drought at the end of 2018 and 2019 which is more pronounced for Marsabit than for Nyeri. Regarding the drought impacts, Marsabit reported drought impacts (N=124) from March 2016 until December 2020 with the exception of the periods between March and December 2018 and between November 2019 and August 2020. Nyeri reported drought impacts (N=44) from February 2017 until September 2019 with only one impact reported between November 2017 and January 2019.
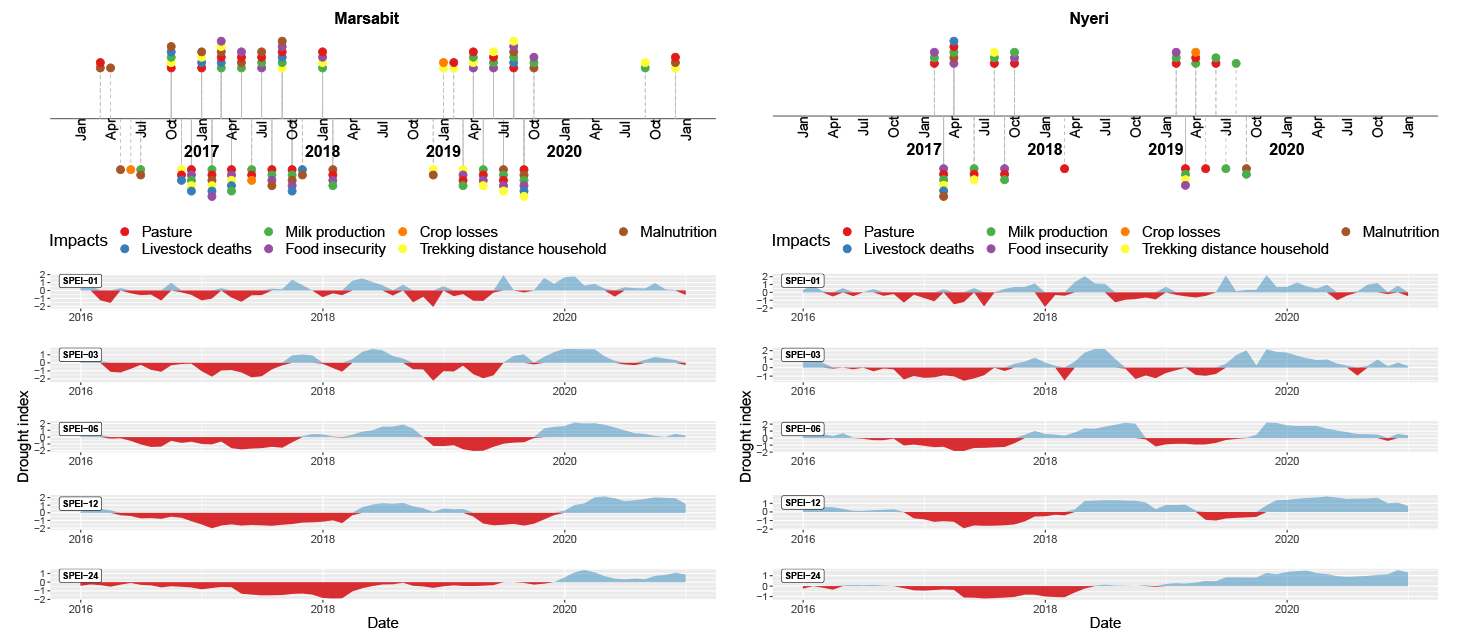
Figure 2A time series of the drought index SPEI for different accumulation periods (1, 3, 6, 12 and 24 months) and a timeline with drought impacts for Marsabit (arid) and Nyeri (sub-humid). The coloured dots indicate the type of impact occurrence. Negative values of SPEI indicate dryer than normal periods (red), while positive values indicate wetter than normal (blue).
Taking the 2016/2017 drought as an example, the drought impacts reported in Marsabit are between March 2016 and February 2018 and highly overlap with negative SPEI-12 between April 2016 and March 2018. Reported drought impacts for Nyeri are between February 2017 and March 2017 and correspond most with negative SPEI-12 values, occurring from October 2016 until April 2018. In general, drought impacts show alignment with SPEI-12 but not with SPEI values based on other accumulation periods. The majority of the analysed impacts occurred after the onset of drought identified with accumulation periods shorter than 12 months.
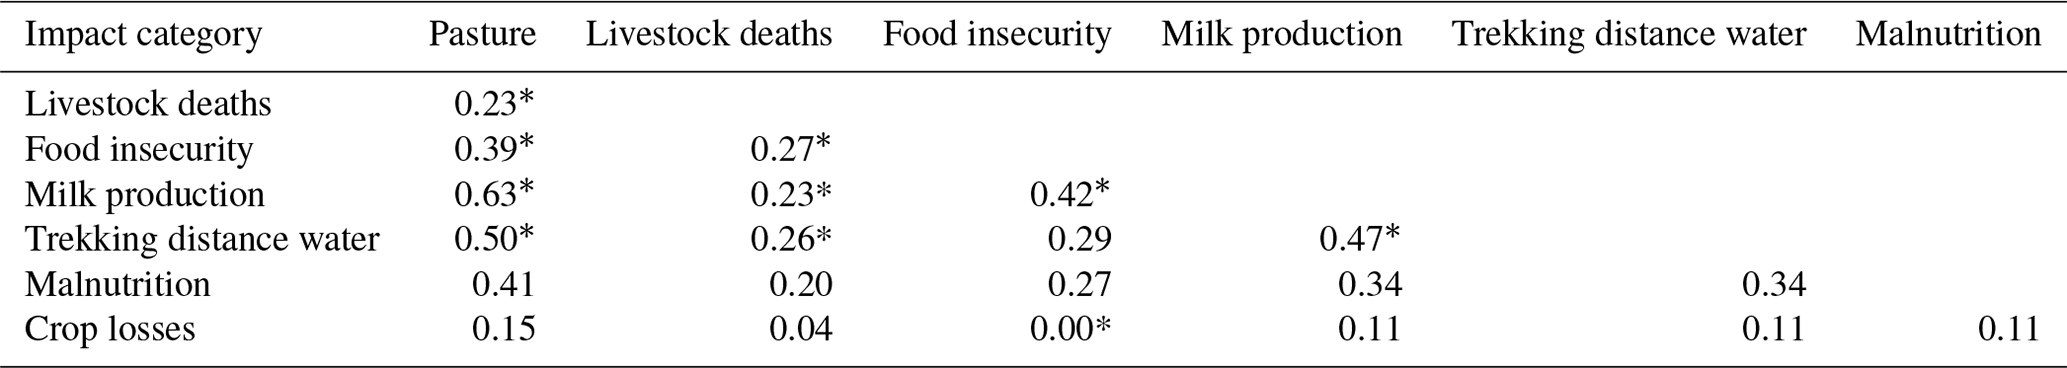
We also explored the relation between reported drought impacts by using the Jaccard similarity for binary values. The results are shown in Table 3, whereby those closer to 1 mean that the datasets are more similar to each other than those closer to 0. Pasture and milk production have the highest significant Jaccard similarity of 0.63, while crop losses are not much related to any other impact category (< 0.20). Trekking distance for water shows a significant Jaccard similarity of 0.50 with pasture and 0.47 with milk production. Other impact categories show a Jaccard similarity below 0.40.
Table 3The correlation between the impact categories, as measured by the Jaccard similarity. The coefficients that are statistically significant (p value < 0.05) are marked with asterisks, following the methods proposed by Chung et al. (2019).
3.2 Drought impacts and water scarcity
The degree of water scarcity per year (in number of months) across the counties is visualized in Fig. 3a. The analysis is performed for the period of March 2018 to December 2020 due to the length of the WS dataset. Kitui and Marsabit have experienced no water stress since March 2018, while Nyeri experienced stress, scarcity and absolute scarcity during 6 out of 10 months in 2018 and all months of 2019. Baringo, Kwale and Narok did also experience stress and scarcity conditions (respectively 2, 4 and 2 months out of 10 for 2018 and 4, 0 and 4 months out of 12 for 2019) but with a lower frequency than Nyeri.
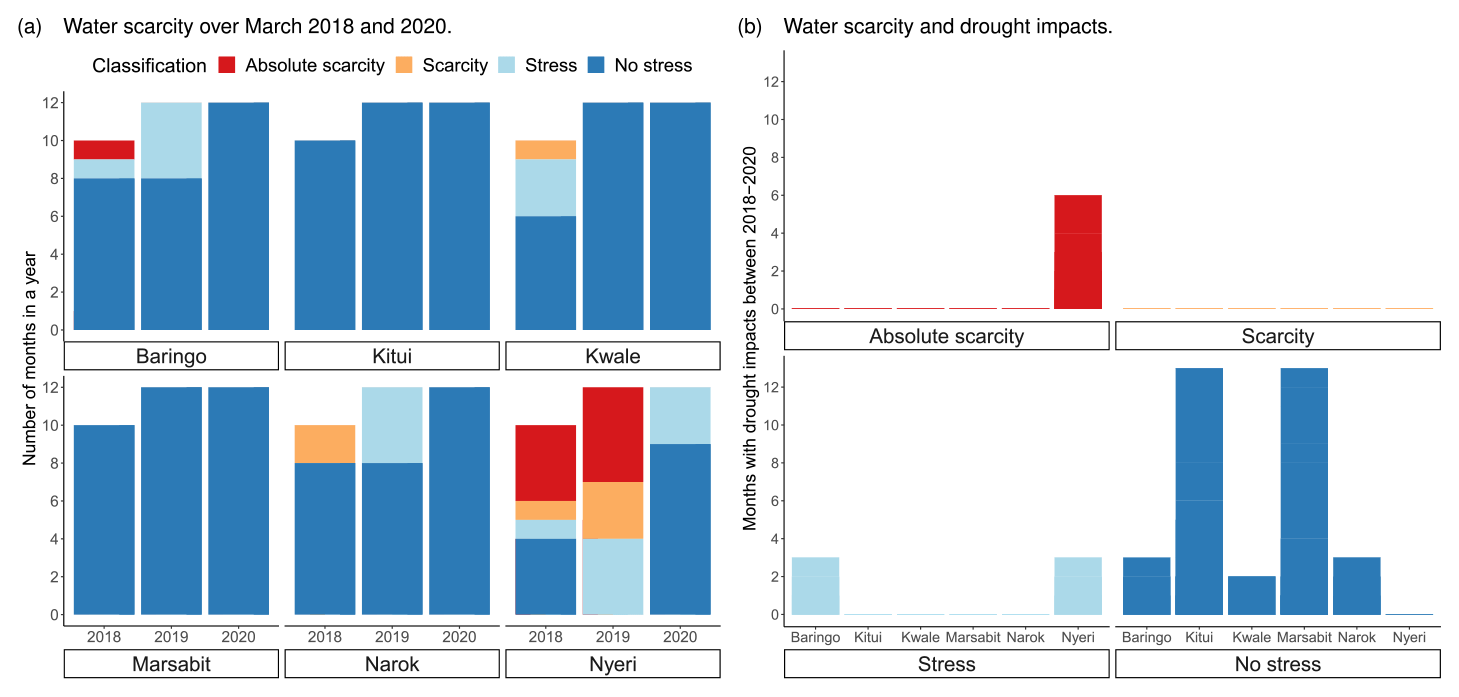
Figure 3The degree of water scarcity per year (March 2018–2020) across the counties (a) and months with drought impacts in relation to water scarcity (b) (McNally et al., 2019).
Figure 3b shows the number of months with drought impacts during 2018 and 2020 in relation to the degree of water scarcity. Nyeri experienced 9 months with drought impacts between March 2018 and 2020, of which 6 months had absolute water scarcity and 3 months a stress situation. Kitui and Marsabit experienced 14 months with drought impacts but did not experience any degree of water scarcity. Baringo had 6 months with drought impacts, of which half of the months showed stress situations.
3.3 Random forest to link drought impacts and drought indices
The performance of the random forest (RF) models per impact category is shown in Table 4. The regions are aggregated by their aridity levels: Marsabit is classified as arid; Baringo, Kitui and Kwale are semi-arid; and Narok and Nyeri are sub-humid regions. The performance of the RF model has been evaluated by looking at the OOB data and accuracy, while precision, recall, the F1 score and the AUC are used as performance metrics for the test dataset.
Table 4RF performance metrics: the performance of the RF model is tested by looking at the OOB data (%) and the accuracy, while precision, recall, the F1 score and the AUC are computed as performance metrics for the performance of the RF model on the test dataset (25 %). The last column indicates the variables that are discussed, determined by two criteria: (1) the performance of the RF model on the test dataset and (2) the similarity with the point-biserial correlation.
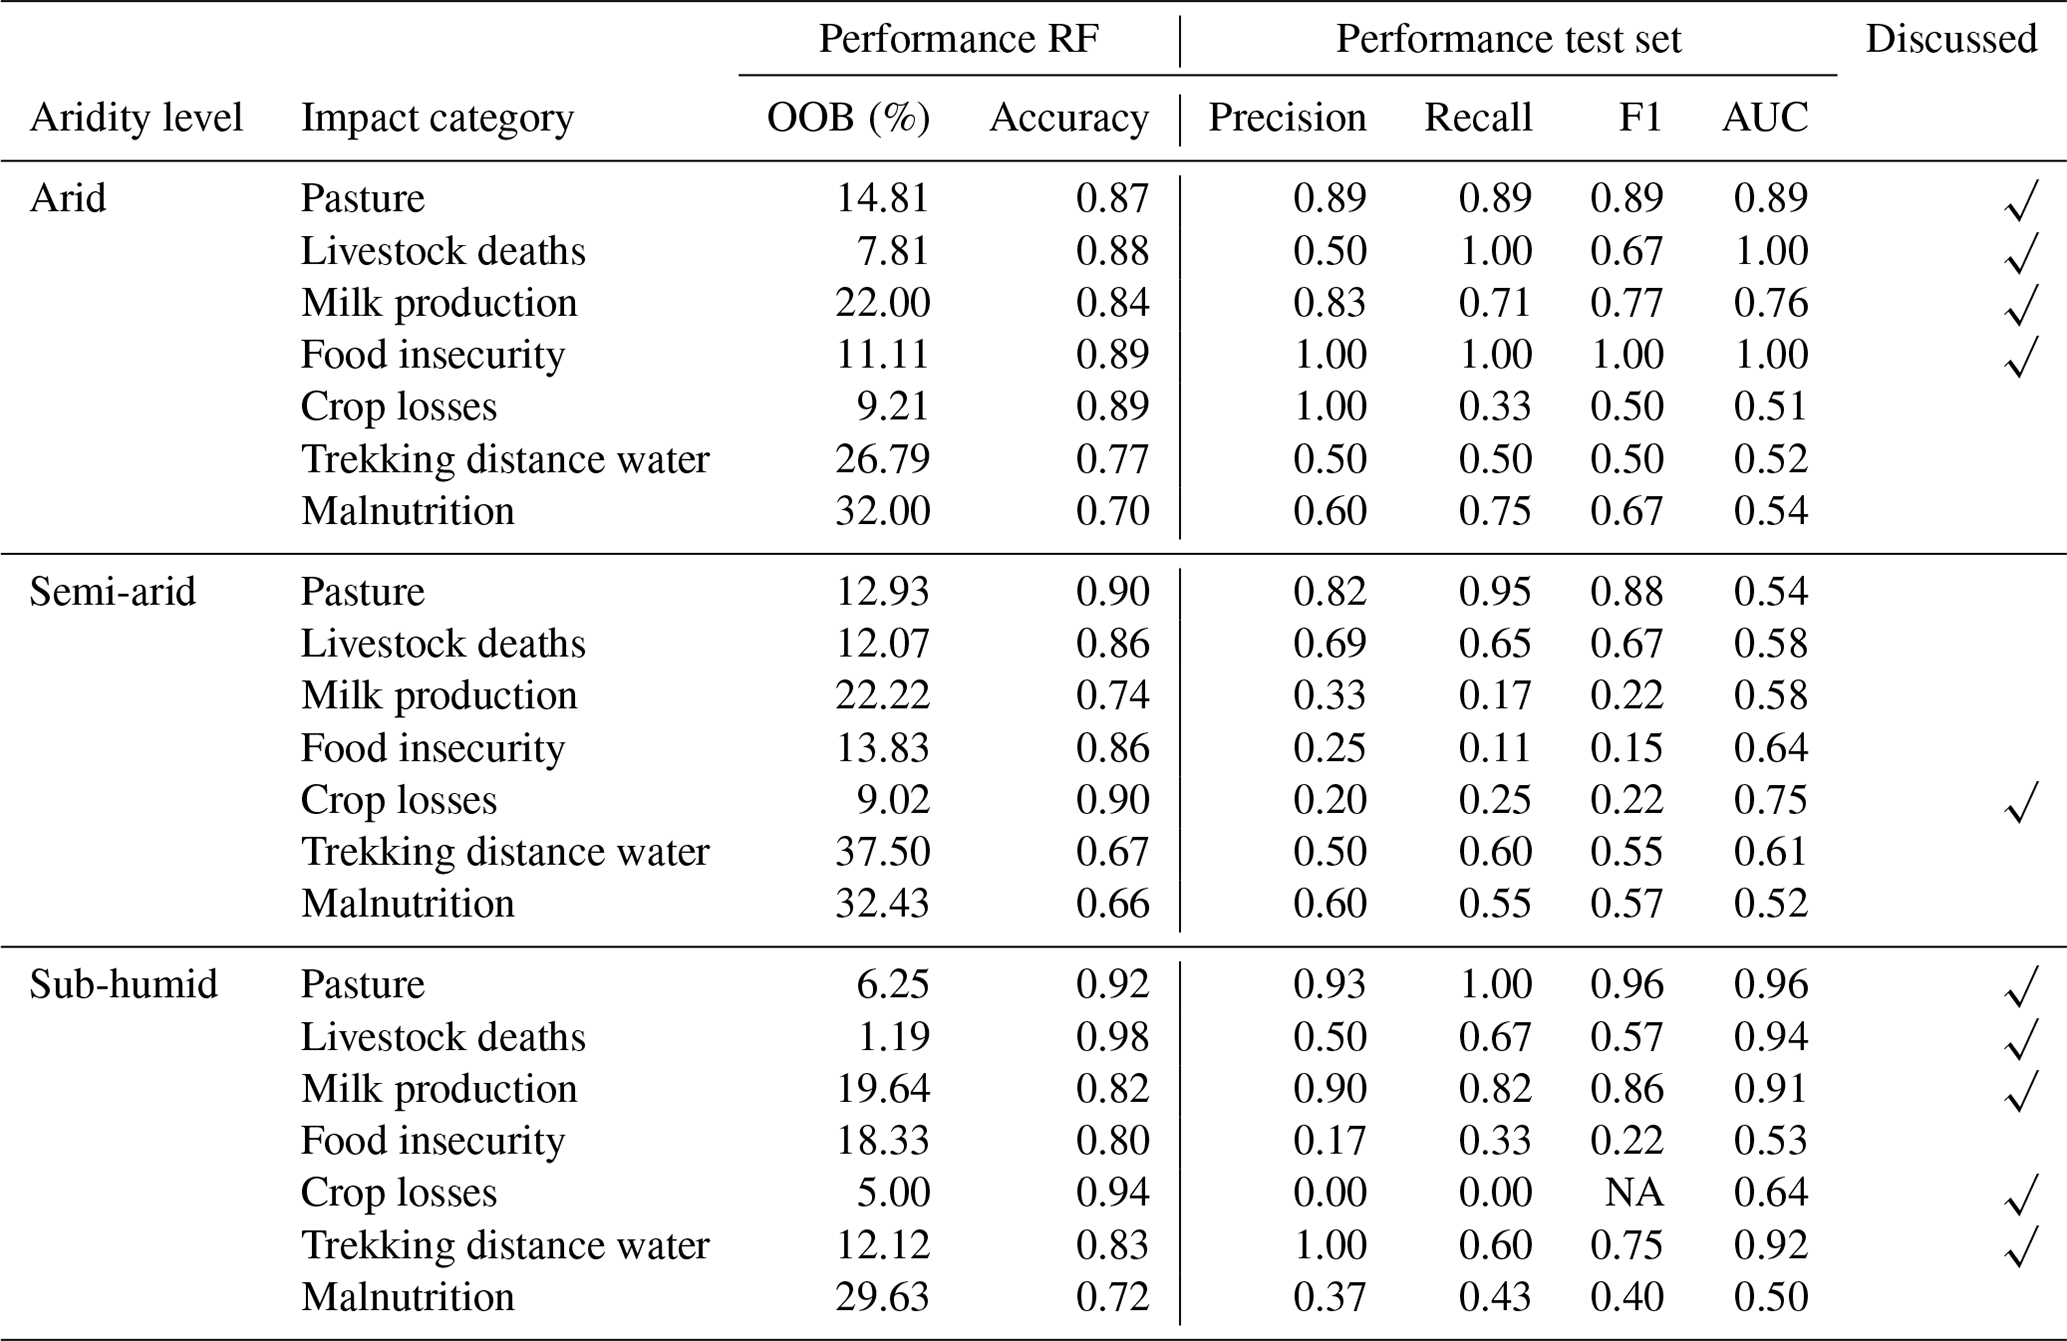
The AUC values as performance metrics for the test dataset range from 0.50 to 1.00. The performance of the models for the drought impacts on pasture, livestock deaths and milk production for the arid and sub-humid regions had the best fit, with AUC values ranging from 0.76 to 1.00. Models developed for the drought impact of malnutrition had the worst fit, with all AUC values below 0.60. In general, the models related to the arid and sub-humid regions performed better than the models of the semi-arid region with an exception of the model developed for crop losses (AUC of 0.75). It is noticeable that the model of the arid region in relation to food insecurity had very high performance values (F1 score of 1.00 and AUC of 1.00), which is also the case for the sub-humid regions in relation to trekking distance for water (F1 score of 0.75 and AUC of 0.92). We will only discuss the variable importance metrics of the RF models (1) that performed relatively well on the test dataset because it is important that the model can predict drought impacts based on unseen data (not used for model training) and (2) for which the results were similar to the results of the point-biserial correlation (Appendix C). The last column of Table 4 indicates if the model is discussed in terms of variable importance.
Figures 4, 5 and 6 show the top five drought indices which are best linked with the drought impact categories. As shown in Fig. 4a, pasture impacts for the arid region tend to be related to shorter drought anomalies (6 months) than the sub-humid regions (24 months). Furthermore, SSI and SPI are the best predictors for pasture impacts in the arid region, while SPEI and SPI are the best predictors for the sub-humid regions. For livestock deaths (Fig. 4b), the situation is reversed: longer accumulation periods (12–24 months) are designated to the arid region, while shorter accumulation periods are related to the sub-humid regions (3–12 months). SPEI and SPI are the best predictors for livestock deaths in the arid region, while SSI and SSMI are the best predictors for the sub-humid regions. Especially SSI-03 seems to be a strong predictor (importance of 19.05) for livestock deaths in the sub-humid region. Milk production in the arid region tends to be most related to accumulation periods of 12 months in relation to a range of drought indices, namely SSMI, SSI, SPEI and SPI. In the sub-humid regions, SSI is the best predictor for milk production with accumulation periods between 3–24 months (Fig. 5a). For the semi-arid regions, long accumulation periods (12–24 months) are associated with crop losses, whereby SSMI is the most prominent predictor. For the sub-humid regions, shorter accumulation periods (1–12 months) are associated with crop losses, whereby SPI and SPEI are the most prominent predictors (Fig. 5b). The results show that food insecurity for the arid region can be predicted well with a range of drought indices (Fig. 6), which are SPEI, SSI, SPI and SSMI, with a more or less stable accumulation period of 12 months. Trekking distance for water for the sub-humid regions can mainly be predicted by SSI with an accumulation period of 6 months (Fig. 6).
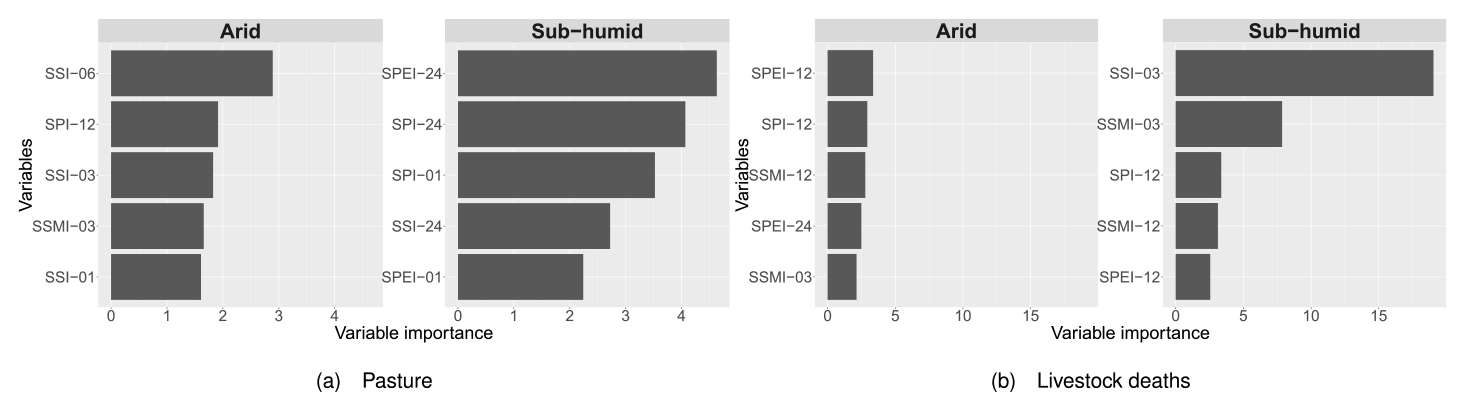
Figure 4Drought indices best linked with pasture and livestock deaths for the arid region (Marsabit) and the sub-humid regions (Narok and Nyeri).
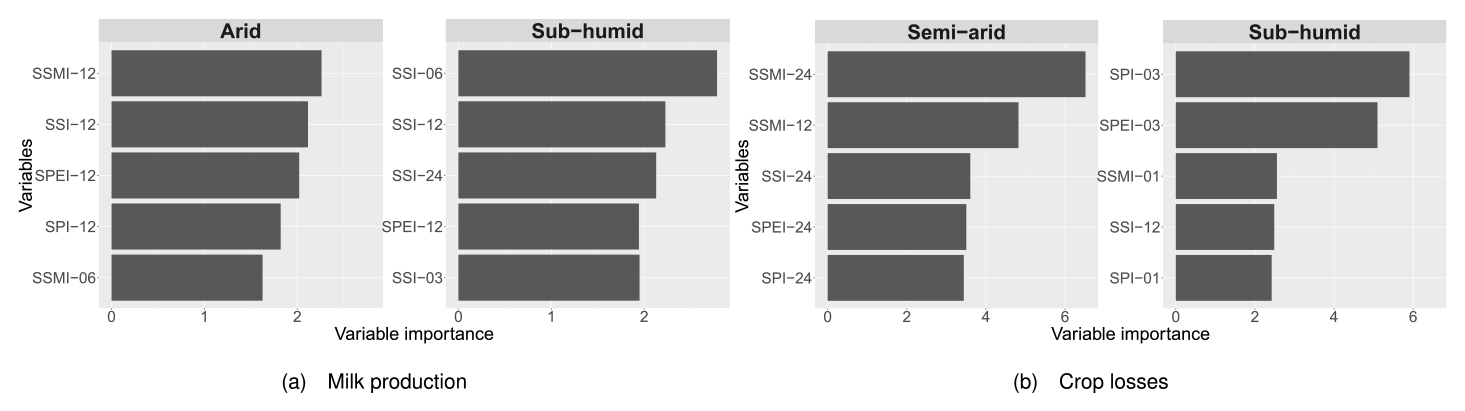
Figure 5Drought indices best linked with milk production for the arid region (Marsabit) and sub-humid regions (Narok and Nyeri) and drought indices best linked with crop losses for the semi-arid regions (Baringo, Kitui and Kwale) and sub-humid regions. The scale of the x axis differs for each category.
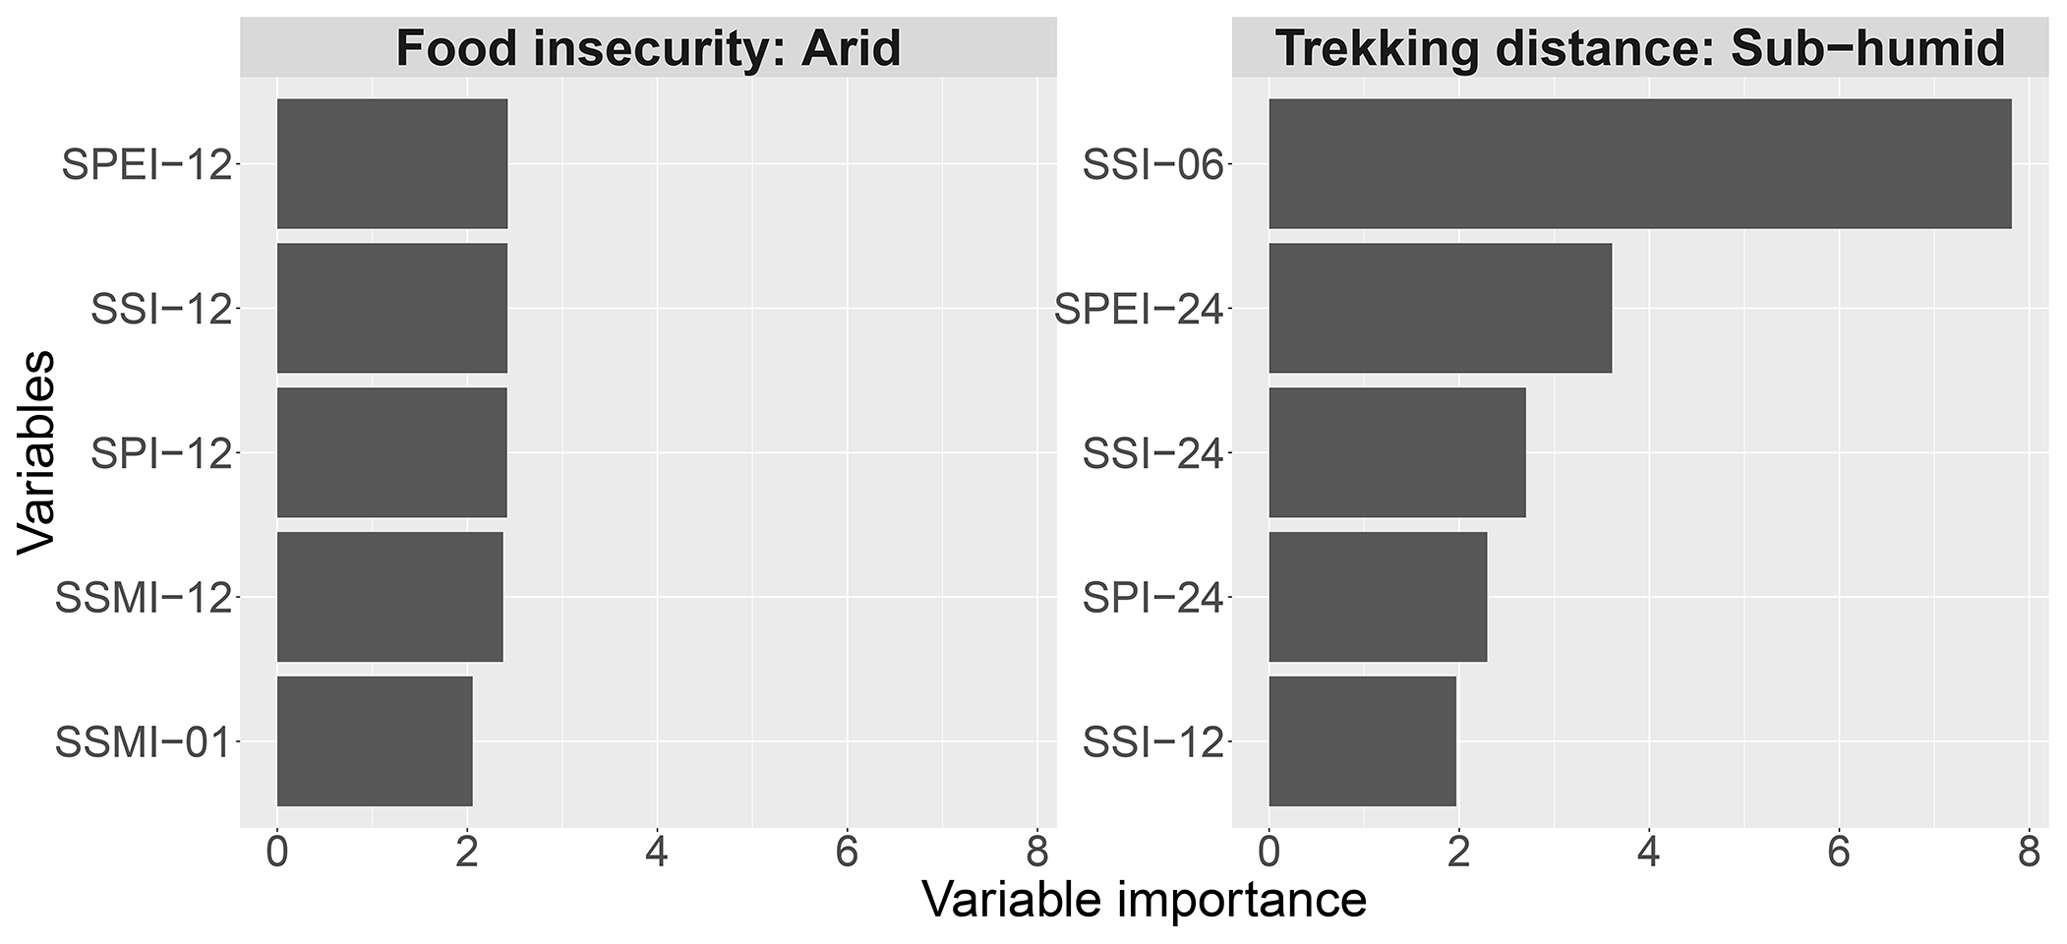
Figure 6Drought indices best linked with food insecurity for the arid region (Marsabit) and the drought indices best linked with trekking distance for water for the sub-humid regions (Narok and Nyeri).
4.1 Data sources and methods
This study used the water scarcity dataset of McNally et al. (2019) which is based on regional streamflow data and population data from WorldPop 2015. This dataset has never been validated in the Horn of Africa, which could be a limitation of this research. In addition, different hydrological datasets were used for the water scarcity dataset and the calculation of the SSI. However, despite some inconsistencies between the datasets, both are following the same pattern, which justifies drawing conclusions based on the water scarcity dataset. The comparison between streamflow data of the water scarcity dataset and SSI-01 is included in Appendix B. Furthermore, the computation of the meteorological drought indices (SPI and SPEI) and the WS dataset is based on different satellite-based precipitation products, MSWEP and CHIRPS respectively. The two datasets showed good performances on a global level (Beck et al., 2017b) and more specifically for East Africa (Cattani et al., 2021). Notwithstanding the slight underestimation of the MSWEP data compared to CHIRPS data over East Africa, both precipitation products showed considerable agreement (Cattani et al., 2021), thereby justifying the simultaneous use of both products.
Drought impact data have been generated by analysing the monthly county-specific reports of the NDMA. This data source had some missing months, between 4 and 8 months, depending on the county, and mainly at the beginning of the period (between July 2013 and December 2014). Despite these missing months, there is still a robust and reliable timeline of drought impact data available for more than 90 % of the considered period. In addition, the bulletins were iteratively checked by several NDMA employees to ensure the reliability of drought impact data. Despite the great effort and very valuable drought impact data information from the NDMA, this study stresses the need for an impact database for Africa such as the already existing databases EDII (EDC, 2013) and DIR (NDMC, 2005) for Europe and the USA respectively. Future research can explore how to build an impact database with enhanced quality in terms of higher spatial and temporal resolutions, more impact categories, and more quantitative information on the impact. To build such a database for historical events, systematically blending and fusing impact data coming from different sources need to be explored (Majani et al., 2022). Sources that can possibly complement the NDMA bulletins range from global repositories such as the Emergency Events Database (EM-DAT) (Guha-Sapir et al., 2017) or the Disaster Inventory System (DesInventar; https://www.desinventar.net/, last access: 23 January 2023), drought appeals from humanitarian organizations such as the Kenya Red Cross Society, index-insurance claims submitted to insurance companies, or digital media reports.
We used a random forest technique in combination with the point-biserial correlation analysis to link drought impacts with drought indices. However, other literature used other techniques such as the Pearson correlation (Wang et al., 2020), Spearman correlation (Ma et al., 2020) and logistic regression (Bachmair et al., 2017; Blauhut et al., 2015; Stagge et al., 2015). Using RF to link drought indices with drought impacts is a fairly new technique but has been done several times before (e.g. Bachmair et al., 2016, 2017; Wang et al., 2020). These studies indicated a potential of using RF for drought M&EW. Our study further validates these findings, as the performance metrics were good for several drought impact categories, and all the discussed models in terms of “variable importance” showed similarities to the results of the point-biserial correlation (Appendix C). However, there were differences in the predictive power of the RF model among the drought impact categories and the regions. This could be related to (1) data availability (e.g. data on impacts related to malnutrition) as the RF model is sensitive to data availability (Bachmair et al., 2016) and (2) potential variations in the link between drought impacts and indices across the counties, which could result in decreased accuracy when counties are aggregated.
4.2 Relations with aridity
The majority of the NDMA drought impact data focuses on livestock and pasture, effectively capturing the primary livelihood activity within the considered counties. Marsabit and Kitui had the highest number of reported drought impacts, while Baringo and Nyeri had the least number of reported drought impacts. This suggests that drought impacts are linked with aridity because Marsabit and Kitui contain larger areas classified as (semi-)arid than Baringo and Nyeri. Also, socio-economic circumstances likely play a role, as acute and chronic food insecurity, poverty, lack of economic development, limited access to basic social services, and low education levels are the highest among households in the ASALs (FEWS NET, 2013).
Maliva and Missimer (2012) stated that arid areas will have more extreme drought due to global warming, which will increase the potential evapotranspiration (Seneviratne et al., 2021; Wang et al., 2022). However, this study cannot link the frequency and intensity of drought events with different aridity levels because of the short timeframe (approx. 7 years) analysed. The analysis of longer time series could indicate not only if there are changes in drought severity, area and frequency but also if there is a long-term shift to a more arid climate (Xu et al., 2021). This could be interesting follow-up research, whereby aridity conditions could be analysed in relation to drought occurrences.
4.3 Water scarcity and drought impacts
According to the water scarcity dataset, most drought impacts occurred at times without water stress (Fig. 3b), with the exception of Nyeri. These findings contrast with the text-based drought impact data on distance from water sources (i.e. trekking distance for water) from the NDMA bulletins, which could be used as a proxy for water stress conditions. Increased distance from water sources was reported in the arid (Marsabit) and sub-humid (Nyeri) regions during most of the months when meteorological and hydrological drought conditions occurred (Fig. 2). It is noticeable that Marsabit has more reported drought impacts on trekking distance for water (16.9 %) than Nyeri (9.1 %) (Table 2), while Nyeri has more months with water scarcity than Marsabit, which has zero months with water scarcity (Fig. 3a).
The discrepancies between the increased distance from water sources and the water scarcity index could be explained by the fact that the streamflow data used for developing the WS dataset were calculated without taking into account the presence of reservoirs, located mainly in the central-western areas of Kenya (Lehner et al., 2011; Mulwa et al., 2021). In addition, the WS dataset uses population data as a proxy for water demand. Since the population density has high values in central-western counties and low values for the ASAL counties, which host only 25 % of the population, although they cover about 80 % of the territory of Kenya (FEWS NET, 2013), it is not surprising that the WS index is higher for central-western counties than for ASAL counties. However, low population density does not imply low water stress: pastoral and agricultural livelihoods are predominant in the ASAL counties and are highly dependent on water availability (FEWS NET, 2013). In addition, the “pulses” (i.e. dry cereals) for the densely populated areas located in central-western counties are mainly supplied by the ASAL counties, resulting in high water consumption by the latter. Finally, water scarcity is also shaped by political choices, public policies and social order (Savelli et al., 2021; Van Loon and Van Lanen, 2013). These factors were not accounted for in the development of the WS dataset.
In summary, the WS dataset is apolitical, does not take reservoirs into account and is highly dependent on population density, which is not a true reflection of water demand. Despite these limitations, interesting conclusions can still be drawn. The WS dataset suggests that water resources were sufficient to meet the water demand in the arid and semi-arid regions of Kenya during drought events. However, water insecurity in the ASAL regions was high during periods of drought (FEWS NET, 2017), possibly due to inefficient water management, for example poor maintenance of water supply systems (related in turn to corruption and poverty) (Bellaubi and Boehm, 2018; Jenkins, 2017; Mulwa et al., 2021). The sub-humid central-western counties, on the other hand, could have experienced water scarcity during periods of drought due to the high population density and hence the high pressure on available water resources. However, in reality, they experienced little water stress thanks to the presence of reservoirs that buffered the drought conditions (FEWS NET, 2017). This shows that water scarcity can be reversed through the wise usage of the available water resources (Phillip, 2013).
4.4 Drought indices and the random forest model
The results show that linking drought indices with drought impacts is region-specific, as confirmed by many other studies (Bachmair et al., 2015, 2016, 2018; Blauhut et al., 2015; Ma et al., 2020; Parsons et al., 2019; Stagge et al., 2015; Wang et al., 2020). For instance, shorter accumulation periods were found for pasture at Marsabit (SSI-06), while longer accumulation periods were found for Narok and Nyeri (SPEI-24). This lag suggests the presence of water buffers in Narok and Nyeri, damming the sub-annual fluctuations in water availability and therefore generating less influence on the impact category pasture (Mulwa et al., 2021). In contrast, livestock deaths are linked with long accumulation periods in Marsabit (SPEI-12) and short accumulation periods in Nyeri (SSI-03). Differences in the relationships between drought impacts and drought indices imply a link with human activities, as they may delay or speed up impact occurrence. As confirmed by Xu et al. (2019), human activities can interfere with natural processes and therefore influence the drought propagation time between meteorological and hydrological drought. This calls for more research on water management practices in relation to drought indices and drought impacts.
Regarding the drought indices, various drought indices are marked as the most optimal indicators: SSI is found in relation to pasture (arid region), livestock deaths (sub-humid regions), milk production (sub-humid regions) and trekking distance for water (sub-humid regions), while SSMI is found in relation to milk production (arid region) and crop losses (semi-arid regions). It is noticeable that SSI gives a possible link with water-dependent activities, while SSMI shows a possible link with agricultural practices. It is expected that SSI and SSMI would show a memory in relation to SPI and SPEI because of the propagation through the hydrological cycle, introducing a lag between meteorological, soil moisture and hydrological drought (Seneviratne et al., 2012; Wanders et al., 2017; Wang et al., 2016). Therefore, the time length and duration of SPI and SPEI can be used to express soil moisture and hydrological drought. In general, a 1-month timescale is considered a meteorological drought, 3–6 months a soil moisture drought and 12 months a hydrological drought (Dai et al., 2020). This link is partly visible by looking at the drought indices in relation to the accumulation periods. For instance, SSI-06 is the best match for trekking distance for water, which indicates hydrological drought. The best links after SSI-06 are SPEI and SPI with a 24-month timescale, also indicating the presence of a hydrological drought.
Studies that linked drought impacts with drought indices are mainly focused on Europe (Bachmair et al., 2015, 2016, 2018; Blauhut et al., 2015; Parsons et al., 2019; Stagge et al., 2015) and recently China (Ma et al., 2020; Wang et al., 2020). Comparisons with these studies are quite difficult due to the different socio-economic and climatic circumstances. As studied by Bachmair et al. (2018), SPI and SPEI with an accumulation period of 3 and 4 months showed the highest correlation for the impacts on crops in Germany. This is consistent with the results found in relation to crop losses for the sub-humid regions, whereby SPI-03 and SPEI-03 are the best match. However, it is not consistent with the results found for the semi-arid regions, whereby the accumulation periods are quite high (24 months). As stated in the study of Bachmair et al. (2018), an accumulation period of 1 month was found to have a notably lower correlation with drought impacts and was often non-significant, which is also confirmed by the results of this study. A reasonable explanation for this is that the occurrence of impacts lags behind the occurrence of drought. Another study of Bachmair et al. (2016) showed that SPI and SPEI with longer accumulation periods (12–24 months) are best linked to impact occurrence in the UK when using the RF model. In general, this matches with the results of this study, whereby SPI-12, SPEI-12, SPI-24 and SPEI-24 are often present in the top five drought indices best linked with the drought impact categories, thereby linking the occurrence of drought impacts with the presence of hydrological drought. Our results indicate that impacts associated with different types of drought have different response times, as confirmed by the distinct differences in drought indices and impact linkage patterns.
This study did not directly account for short- and/or long-term drought adaptation strategies applied in the ASAL regions, although these strategies could influence the drought impact–index relationship. Drought adaptation strategies can be related to (1) structural interventions for increasing the water availability (e.g. construction of reservoirs), (2) sustainable land management practices (e.g. inter-cropping, agroforestry and drought resistant crops), (3) pasture and livestock management (e.g. livestock restocking and improved varieties of grass), and (4) livelihood diversification (Kenya, 2016; Mude et al., 2007; Njarui et al., 2020; Opiyo et al., 2015; Parry, 2016; weADAPT, 2023). Such adaptation measures can increase the resilience of the communities (Nyberg et al., 2020). This could also explain the differences in the optimal drought indices found among the investigated areas, as the level of preparedness can prolong or reduce the occurrence of drought impacts, resulting in a better fit with drought indices with longer accumulation periods. In the past years, Kenya has experienced several drought events. This can influence the extent of adaptation measures taken and therefore the resilience against droughts which affects the impacts. It is therefore recommended to link adaptation measures to drought impacts and indices in order to analyse spatial differences and to map fluctuations over time.
This study contributes to the ongoing debate about the operational needs for drought monitoring by linking multiple drought indices to reported drought impacts. Our results show the best drought index for a given impact. This can be combined with other socio-economic and environmental data to provide enough inputs for the construction of drought impact forecasting, which is useful for stakeholders and decision makers (Heinrich and Bailey, 2020; Stagge et al., 2015). In addition, this research takes the first step in exploring the link between drought and water scarcity and aridity, which is valuable information for the existing literature database on drought and its impacts. However, it is recommended to validate the results in other areas and on finer spatial scales, whereby the influence of human activities on drought propagation and water scarcity can be analysed. Besides this, research would benefit from a refinement of the water scarcity dataset in order to better represent human influences on water scarcity conditions.
There is an urgent need to develop early warning systems to mitigate the adverse consequences of drought, thus reducing its human and financial costs. However, there is still no full understanding of the relation between drought impacts and drought indices in Africa. This continent struggles with water scarcity and the presence of arid regions, which possibly influence the relation between drought hazard and impacts. This paper aimed to fill this knowledge gap by exploring the link between drought impacts, drought indices, water scarcity and aridity with a focus on Kenya.
The arid region of Marsabit had the most severe drought and the highest number of drought impacts over a timeframe from 2016 to 2020. Nyeri, classified as a sub-humid region, had lower frequencies and intensities of drought and reported the least number of drought impacts. This indicates that drought impacts are linked with drought severity and that the occurrence of drought impacts are related to aridity. The skewed spatial distribution of drought impacts could be related to the fragile socio-economic conditions in the ASALs of Kenya which makes this region more vulnerable to drought than the sub-humid region of central-western Kenya. Water scarcity as derived by the WS dataset was not found to be related to aridity, while this was expected because arid regions are often facing limited water resources. In contrast, Marsabit (arid) did not experience any water scarcity during the analysed timeframe (March 2018 and 2020), whilst Nyeri (sub-humid) did. In addition, most drought impacts occurred at times without water stress (except for Nyeri) even when increased distance from water sources was reported as a drought impact, which can be used as a proxy for water stress conditions. Reasonable explanations for this can be found in the water scarcity dataset which is apolitical, does not take reservoirs into account and is highly dependent on population density.
With a random forest model, a link between drought impacts and drought indices was made. The results indicated that every region, aggregated on aridity, had their own set of predictors for every impact category. Region dependency was found by other studies as well. In relation to drought impacts on pasture, anomalies were shorter (6 months) for the arid region of Marsabit than for the sub-humid regions of Narok and Nyeri (24 months). For the impacts on livestock deaths reversed results were found: shorter accumulation periods were found for Narok and Nyeri (3–12 months), while longer accumulation periods were present in Marsabit (12–24 months). Drought indices with longer timescales (≥ 12 months), indicating a hydrological drought, were often found to match best with the drought impact occurrences. The differences in linkages could be related to water management practices, natural characteristics and climatic circumstances.
The predictive ability of indices heavily depends on the spatial and temporal resolution of drought impact data. Therefore, this study stresses the need of systematic drought impact data collection around the world following the example of the NDMA in Kenya. In addition, we recommend looking at finer spatial resolutions to capture the regional differences in human influences on water scarcity and drought impacts. Studying similar research areas and validating the results of this study on smaller scales will expand the knowledge base on drought and impacts and will substantiate the conclusions of this study. This study analysed the link between drought indices and text-based impact reports with a focus on the African continent, which has never been studied before. The integration of regional predictions on drought impacts will contribute to the development of early warning systems for droughts which will help communities to better prepare and act accordingly, therefore reducing vulnerability and increasing resilience to drought and impacts.
The water scarcity index from McNally et al. (2019) is based on outputs from the FEWS NET Land Data Assimilation System (FLDAS), which is a custom instance of the National Aeronautics and Space Administration (NASA) Land Information System (LIS). The FLDAS’s Noah 3.6 land surface model is driven by the Climate Hazards Group InfraRed Precipitation with Station (CHIRPS) rainfall data and NASA’s Modern-Era Retrospective Analysis for Research and Applications (MERRA-2) meteorological forcing. This model partitions rainfall inputs into surface and subsurface runoff (i.e. baseflow), soil moisture storage, and evapotranspiration. Surface runoff is the precipitation in excess of infiltration and saturation capacity of the soil, while subsurface runoff is the drainage from the bottom soil moisture layer caused by gravity. The total runoff is routed though the river network with the Hydrological Modeling and Analysis Platform version 2 (HyMAP-2) river routing scheme. The definitions of catchments are based on boundaries defined by the U.S. Geological Survey (USGS) Hydrological Derivatives for Modelling Applications (HDMA) database. A Pfafstetter code, based on an hierarchical numbering system, is given to the catchments. For the water scarcity index, Pfafstetter level 6 basins are used in order to represent the relatively local nature of water supplies. Two population datasets are used as a proxy for water demand, namely the WorldPop 2015 dataset and the European Commission’s Joint Research Center's (JRC) Global Human Settlement (GHS) data. To classify the amount of water scarcity, the Falkenmark index is used. The Falkenmark index thresholds are specified annually, while monthly data are required for the routinely updated maps of water scarcity. Therefore, a 12-month running total of the streamflow from the current and 11 previous months is used, whereby the Falkenmark index (based on yearly values) can still be used on a monthly resolution. The population estimates are aggregated to Pfafstetter basin level 6, whereafter the 12-month total spatially aggregated streamflow (m3) is divided by the population to produce an estimate of cubic metres per person (McNally et al., 2019).
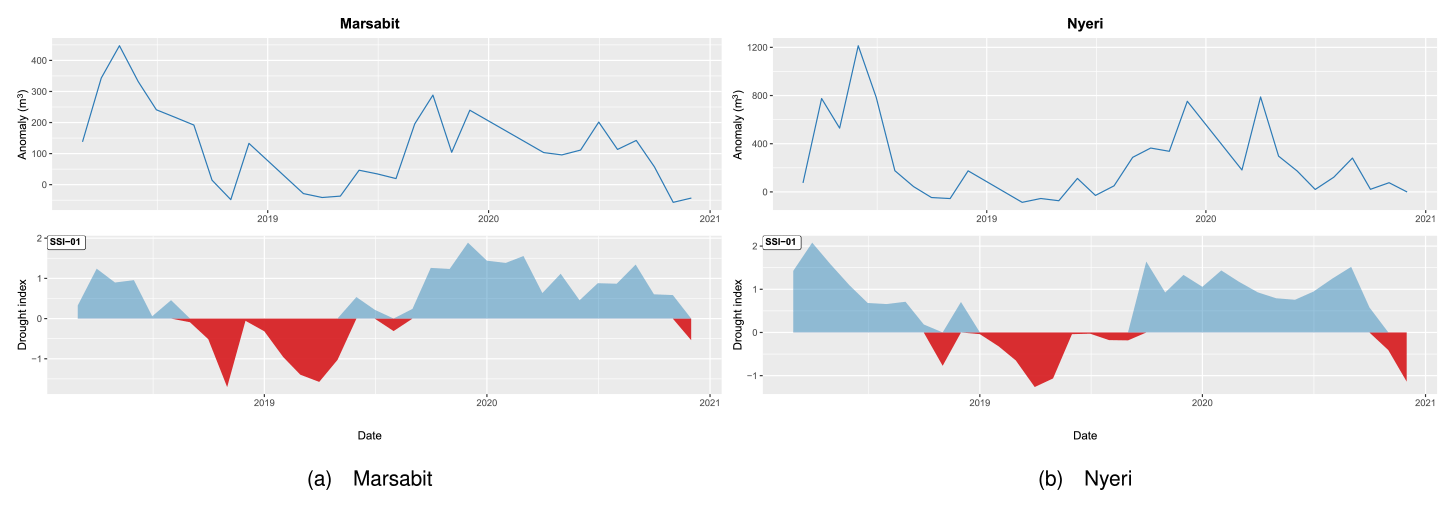
Different hydrological datasets were used for the water scarcity dataset and the calculation of the SSI. The SSI index is based on data from GloFAS, while streamflow data for the water scarcity dataset are based on outputs from the FLDAS. If there are any discrepancies between the datasets, incorrect conclusions could be made. To compare the two different datasets, SSI-01 is plotted with the streamflow anomalies of the water scarcity dataset for Marsabit and Nyeri (Fig. B1). The streamflow anomalies are based on the 1982–2016 FLDAS historical record, while SSI is based on the period between 1980 and 2010. Despite some irregularities between the datasets, both are following quite the same pattern. This suggests that it is reasonable to compare the results from the two different hydrological datasets.
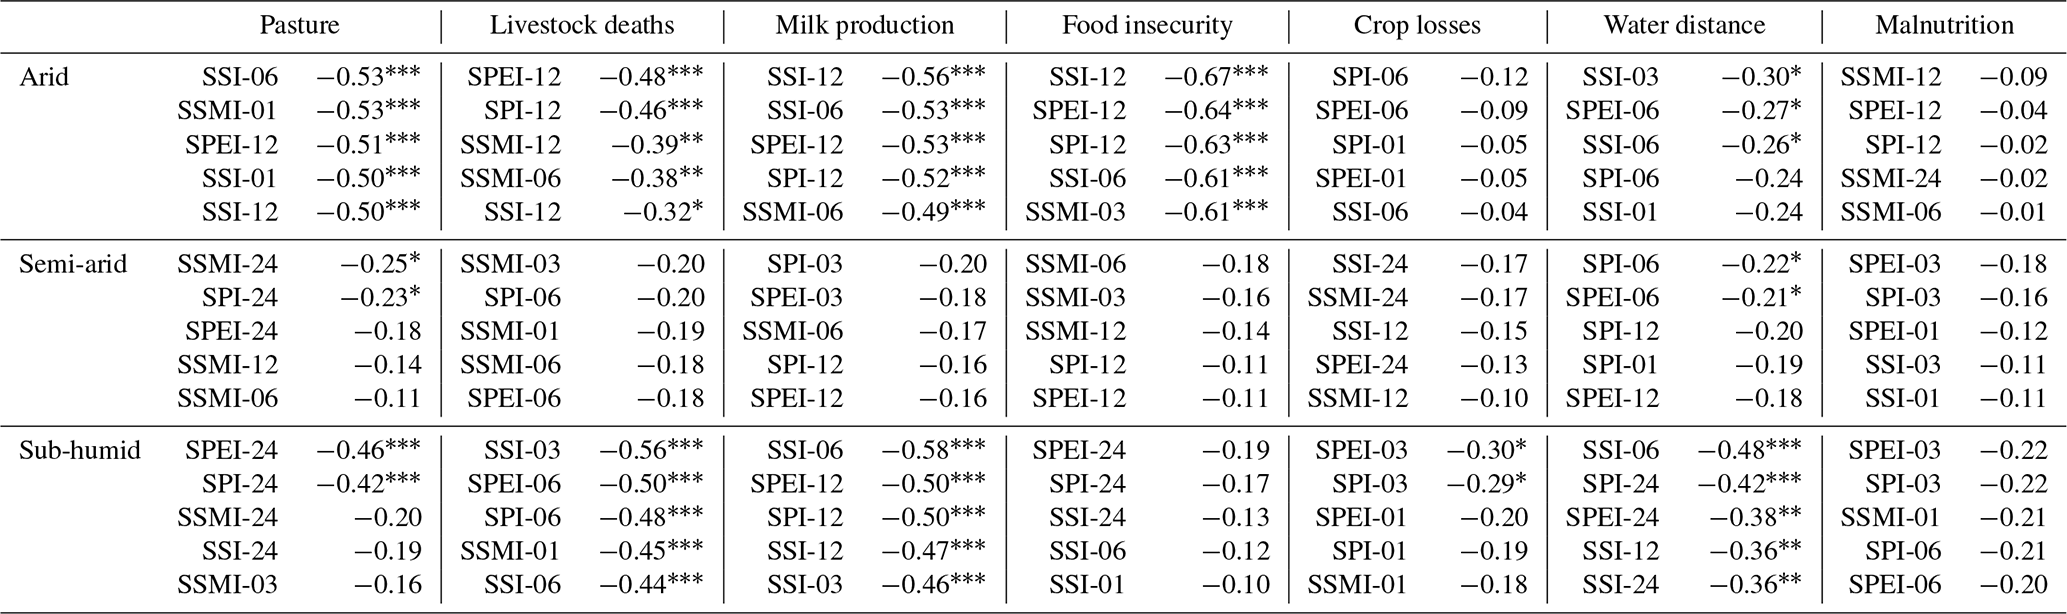
In order to validate the results of the RF model in relation to variable importance, a point-biserial correlation was conducted. It is used to measure the relationship between a binary and a continuous variable. Table C1 shows the results of the point-biserial correlation: only the top five drought indices with the strongest correlation are included. The minus sign indicates a negative correlation between the two variables.
Table C1Point-biserial correlation: linking the drought indices with drought impact category per region with the same level of aridity. The asterisks indicate the statistical significance: , and .
Data are available on the 4tu.ResearchData platform. The DOI is https://doi.org/10.4121/19620357 (Lam and Odongo, 2022).
The supplement related to this article is available online at: https://doi.org/10.5194/nhess-23-2915-2023-supplement.
MRL designed and carried out the research, supervised by AJT, AFVL, AM and ADT. RAO computed the drought indices and wrote the related method section. MRL wrote the manuscript with input from all co-authors. The revisions were handled by MRL with support from AJT, AM, AFVL and RAO. The final version has been approved by all co-authors.
At least one of the (co-)authors is a member of the editorial board of Natural Hazards and Earth System Sciences. The peer-review process was guided by an independent editor, and the authors also have no other competing interests to declare.
Publisher’s note: Copernicus Publications remains neutral with regard to jurisdictional claims in published maps and institutional affiliations.
This article is part of the special issue “Hydro-meteorological extremes and hazards: vulnerability, risk, impacts, and mitigation”. It is a result of the European Geosciences Union General Assembly 2022, Vienna, Austria, 23–27 May 2022.
We would like to thank Amy McNally for providing the water scarcity dataset. In addition, we thank the National Drought Management Authority (NDMA) of the Kenyan government for providing the data for the drought impacts.
This paper was edited by Efthymios Nikolopoulos and reviewed by two anonymous referees.
Atzberger, C. and Eilers, P. H.: Evaluating the effectiveness of smoothing algorithms in the absence of ground reference measurements, Int. J. Remote Sens., 32, 3689–3709, https://doi.org/10.1080/01431161003762405, 2011. a
Atzberger, C., Formaggio, A., Shimabukuro, Y., Udelhoven, T., Mattiuzzi, M., Sanchez, G., and Arai, E.: Obtaining crop-specific time profiles of NDVI: the use of unmixing approaches for serving the continuity between SPOT-VGT and PROBA-V time series, Int. J. Remote Sens., 35, 2615–2638, https://doi.org/10.1080/01431161.2014.883106, 2014. a
Ayugi, B., Tan, G., Niu, R., Dong, Z., Ojara, M., Mumo, L., Babaousmail, H., and Ongoma, V.: Evaluation of meteorological drought and flood scenarios over Kenya, East Africa, Atmosphere, 11, 307, https://doi.org/10.3390/atmos11030307, 2020. a
Bachmair, S., Kohn, I., and Stahl, K.: Exploring the link between drought indicators and impacts, Nat. Hazards Earth Syst. Sci., 15, 1381–1397, https://doi.org/10.5194/nhess-15-1381-2015, 2015. a, b, c, d
Bachmair, S., Svensson, C., Hannaford, J., Barker, L. J., and Stahl, K.: A quantitative analysis to objectively appraise drought indicators and model drought impacts, Hydrol. Earth Syst. Sci., 20, 2589–2609, https://doi.org/10.5194/hess-20-2589-2016, 2016. a, b, c, d, e, f, g, h, i
Bachmair, S., Svensson, C., Prosdocimi, I., Hannaford, J., and Stahl, K.: Developing drought impact functions for drought risk management, Nat. Hazards Earth Syst. Sci., 17, 1947–1960, https://doi.org/10.5194/nhess-17-1947-2017, 2017. a, b, c, d
Bachmair, S., Tanguy, M., Hannaford, J., and Stahl, K.: How well do meteorological indicators represent agricultural and forest drought across Europe?, Environ. Res. Lett., 13, 034042, https://doi.org/10.1088/1748-9326/aaafda, 2018. a, b, c, d, e, f
Baig, M. R. I., Naikoo, M. W., Ansari, A. H., Ahmad, S., and Rahman, A.: Spatio-temporal analysis of precipitation pattern and trend using standardized precipitation index and Mann–Kendall test in coastal Andhra Pradesh, Model. Earth Syst. Environ., 8, 2733–2752, https://doi.org/10.1007/s40808-021-01262-w, 2022. a
Balsamo, G., Beljaars, A., Scipal, K., Viterbo, P., van den Hurk, B., Hirschi, M., and Betts, A. K.: A revised hydrology for the ECMWF model: Verification from field site to terrestrial water storage and impact in the Integrated Forecast System, J. Hydrometeorol., 10, 623–643, https://doi.org/10.1175/2008JHM1068.1, 2009. a
Barrett, A. B., Duivenvoorden, S., Salakpi, E. E., Muthoka, J. M., Mwangi, J., Oliver, S., and Rowhani, P.: Forecasting vegetation condition for drought early warning systems in pastoral communities in Kenya, Remote Sens. Environ., 248, 111886, https://doi.org/10.1016/j.rse.2020.111886, 2020. a
Beck, H. E., van Dijk, A. I. J. M., Levizzani, V., Schellekens, J., Miralles, D. G., Martens, B., and de Roo, A.: MSWEP: 3-hourly 0.25∘ global gridded precipitation (1979–2015) by merging gauge, satellite, and reanalysis data, Hydrol. Earth Syst. Sci., 21, 589–615, https://doi.org/10.5194/hess-21-589-2017, 2017a. a
Beck, H. E., Vergopolan, N., Pan, M., Levizzani, V., van Dijk, A. I. J. M., Weedon, G. P., Brocca, L., Pappenberger, F., Huffman, G. J., and Wood, E. F.: Global-scale evaluation of 22 precipitation datasets using gauge observations and hydrological modeling, Hydrol. Earth Syst. Sci., 21, 6201–6217, https://doi.org/10.5194/hess-21-6201-2017, 2017b. a
Beck, H. E., Wood, E. F., Pan, M., Fisher, C. K., Miralles, D. G., Van Dijk, A. I., McVicar, T. R., and Adler, R. F.: MSWEP V2 global 3-hourly 0.1 precipitation: methodology and quantitative assessment, B. Am. Meteorol. Soc., 100, 473–500, https://doi.org/10.1175/BAMS-D-17-0138.1, 2019. a, b
Beguería, S., Vicente-Serrano, S. M., Reig, F., and Latorre, B.: Standardized precipitation evapotranspiration index (SPEI) revisited: parameter fitting, evapotranspiration models, tools, datasets and drought monitoring, Int. J. Climatol., 34, 3001–3023, https://doi.org/10.1002/joc.3887, 2014. a
Bellaubi, F. and Boehm, F.: Management practices and corruption risks in water service delivery in Kenya and Ghana, Water Policy, 20, 388–409, https://doi.org/10.2166/wp.2018.017, 2018. a
Blauhut, V., Gudmundsson, L., and Stahl, K.: Towards pan-European drought risk maps: quantifying the link between drought indices and reported drought impacts, Environ. Res. Lett., 10, 014008, https://doi.org/10.1088/1748-9326/10/1/014008, 2015. a, b, c, d, e
Breiman, L.: Random forests, Mach. Learn., 45, 5–32, https://doi.org/10.1023/A:1010933404324, 2001. a
Cattani, E., Ferguglia, O., Merino, A., and Levizzani, V.: Precipitation Products’ Inter–Comparison over East and Southern Africa 1983–2017, Remote Sens., 13, 4419, https://doi.org/10.3390/rs13214419, 2021. a, b
Chung, N. C., Miasojedow, B., Startek, M., and Gambin, A.: Jaccard/Tanimoto similarity test and estimation methods for biological presence-absence data, BMC Bioinformatics, 20, 1–11, https://doi.org/10.1186/s12859-019-3118-5, 2019. a, b
Dai, M., Huang, S., Huang, Q., Leng, G., Guo, Y., Wang, L., Fang, W., Li, P., and Zheng, X.: Assessing agricultural drought risk and its dynamic evolution characteristics, Agr. Water Manage., 231, 106003, https://doi.org/10.1016/j.agwat.2020.106003, 2020. a, b
Dee, D. P., Uppala, S. M., Simmons, A. J., Berrisford, P., Poli, P., Kobayashi, S., Andrae, U., Balmaseda, M. A., Balsamo, G., Bauer, P., Bechtold, P., Beljaars, A. C. M., van de Berg, L., Bidlot, J., Bormann, N., Delsol, C., Dragani, R., Fuentes, M., Geer, A. J., Haimberger, L., Healy, S. B., Hersbach, H., Hólm, E. V., Isaksen, L., Kållberg, P., Köhler, M., Matricardi, M., McNally, A. P., Monge-Sanz, B. M., Morcrette, J.-J., Park, B.-K., Peubey, C., de Rosnay, P., Tavolato, C., Thépaut, J.-N., and Vitart, F.: The ERA-Interim reanalysis: Configuration and performance of the data assimilation system, Q. J. Roy. Meteor. Soc., 137, 553–597, https://doi.org/10.1002/qj.828, 2011. a
EDC: Welcome to the EDII and EDR database, https://www.geo.uio.no/edc/droughtdb/ (last access: 29 April 2022), 2013. a, b
Erian, W., Pulwarty, R., Vogt, J., AbuZeid, K., Bert, F., Bruntrup, M., El-Askary, H., de Estrada, M., Gaupp, F., Grundy, M., Hadwen, T., Hagenlocher, M., Kairu, G., Lamhauge, N., Li, W., Mahon, R., Maia, R., Martins, E. S. P. R., Meza, I., de los Milagos Skansi, M., Moderc, A., Naumann, G., Negri, R., Partey, S. T., Podestá, G., Quesada, M., Rakhmatova, N., Riley, J. E., Rudari, R., Shanmugasundaram, J., Silveira Reis Junior, D., Singh, C., Spennemann, P., Srinivasan, G., Stefanski, R., Sušnik, A., Svoboda, M., Trotman, A., Tsegai, D., Ünver, O., Van Meerbeeck, C., Wens, M., Abdullaeva, S., Agarwal, A., Ballantyne, D., Belikov, D., Belorussova, O., Bonnet, G., Brown, G., Browne, T., Cammalleri, C., Conijn, S., Ehlert, K., Fagan, L., Khasankhanova, G., Kibaroğlu, A., Klein, R., Kovalevskaya, Y., Van Loon, A., Massabò, M., Miguel Saraiva, A., de Moel, H., Murray, V., Nemani, R., Nishonov, B., Özgüler, H., Pai, D. S., Pascual, V., Rakhmatova, V., Ramesh, K. J., Richards, V., Rossi, L., Savitskiy, A., Schaan, G., Shardakova, L., Spinoni, J., Stone, R., Stoute, S., Subbiah, A., Tarayannikova, R., Yildiz, D., Young, S., and Zougmore, R. B.: GAR Special Report on Drought 2021, United Nations Office for Disaster Risk Reduction (UNDRR), Geneva, ISBN 9789212320274, 2021. a
Essen, C. and Akpan, G.: Analysis of difficulty and point-biserial correlation indices of 2014 Akwa Ibom State Mock Multiple Choices Mathematics Test, Int. J. Educ. Eval., 4, 1–11, 2018. a
Falkenmark, M., Lundqvist, J., and Widstrand, C.: Macro-scale water scarcity requires micro-scale approaches: Aspects of vulnerability in semi-arid development, in: Natural resources forum, vol. 13,, Wiley Online Library, 258–267, https://doi.org/10.1111/j.1477-8947.1989.tb00348.x, 1989. a
FEWS NET: Kenya food security brief, United States agency for international development (UASID) famine early warning systems network (FEWS NET), https://fews.net/sites/default/files/documents/reports/Kenya_Food%20Security_In_Brief_2013_final_0.pdf (last access: 17 May 2022), 2013. a, b, c, d, e, f
FEWS NET: Kenya Food Security Outlook, https://fews.net/sites/default/files/documents/reports/KE%20FSO%20Feb%20-%20Sep%202017_Final.pdf (last access: 17 May 2022), 2017. a, b
Gudmundsson, L., Rego, F. C., Rocha, M., and Seneviratne, S. I.: Predicting above normal wildfire activity in southern Europe as a function of meteorological drought, Environ. Res. Lett., 9, 084008, https://doi.org/10.1088/1748-9326/9/8/084008, 2014. a, b
Guha-Sapir, D., Below, R., and Hoyois, P.: The CRED/OFDA International Disaster Database, Université Catholique de Louvain, EM-DAT [data set], http://www.emdat.be/ (last access: 23 January 2023), 2017. a
Hall, J. W. and Leng, G.: Can we calculate drought risk... and do we need to?, Wiley Interdisciplinary Reviews: Water, 6, e1349, https://doi.org/10.1002/wat2.1349, 2019. a
Hanley, J. A. and McNeil, B. J.: The meaning and use of the area under a receiver operating characteristic (ROC) curve, Radiology, 143, 29–36, https://doi.org/10.1148/radiology.143.1.7063747, 1982. a
Harrigan, S., Zsoter, E., Alfieri, L., Prudhomme, C., Salamon, P., Wetterhall, F., Barnard, C., Cloke, H., and Pappenberger, F.: GloFAS-ERA5 operational global river discharge reanalysis 1979–present, Earth Syst. Sci. Data, 12, 2043–2060, https://doi.org/10.5194/essd-12-2043-2020, 2020. a
Heinrich, D. and Bailey, M.: Forecast-based Financing and Early Action for Drought – Guidance Notes for the Red Cross Red Crescent, https://www.forecast-based-financing.org/wp-content/uploads/2020/06/1.-Guidance-Notes-A-Report-on-FbA-for-Drought.pdf (last access: 23 January 2023), 2020. a, b
Hersbach, H., Bell, B., Berrisford, P., Hirahara, S., Horányi, A., Muñoz-Sabater, J., Nicolas, J., Peubey, C., Radu, R., Schepers, D., Simmons, A., Soci, C., Abdalla, S., Abellan, X., Balsamo, G., Bechtold, P., Biavati, G., Bidlot, J., Bonavita, M., De Chiara, G., Dahlgren, P., Dee, D., Diamantakis, M., Dragani, R., Flemming, J., Forbes, R., Fuentes, M., Geer, A., Haimberger, L., Healy, S., Hogan, R. J., Hólm, E., Janisková, M., Keeley, S., Laloyaux, P., Lopez, P., Lupu, C., Radnoti, G., de Rosnay, P., Rozum, I., Vamborg, F., Villaume, S., and Thépaut, J.: The ERA5 global reanalysis, Q. J. Roy. Meteor. Soc., 146, 1999–2049, https://doi.org/10.1002/qj.3803, 2020. a
Hirpa, F. A., Salamon, P., Beck, H. E., Lorini, V., Alfieri, L., Zsoter, E., and Dadson, S. J.: Calibration of the Global Flood Awareness System (GloFAS) using daily streamflow data, J. Hydrol., 566, 595–606, https://doi.org/10.1016/j.jhydrol.2018.09.052, 2018. a
Jaccard, P.: The distribution of the flora in the alpine zone. 1, New Phytologist, 11, 37–50, https://doi.org/10.1111/j.1469-8137.1912.tb05611.x, 1912. a
Javadinejad, S., Hannah, D., Ostad-Ali-Askari, K., Krause, S., Zalewski, M., and Boogaard, F.: The impact of future climate change and human activities on hydro-climatological drought, analysis and projections: using CMIP5 climate model simulations, Water Sci. Eng., 4, 71–88, https://doi.org/10.1007/s41101-019-00069-2, 2019. a
Jenkins, M.: The impact of corruption on access to safe water and sanitation for people living in poverty, Anticorruption Resource Center, https://www.u4.no/publications/the-impact-of-corruption-on-access-to-safe-water-and-sanitation-for-people-living-in-poverty (last access: 23 January 2023), 2017. a
Kamruzzaman, M., Almazroui, M., Salam, M., Mondol, M. A. H., Rahman, M., Deb, L., Kundu, P. K., Zaman, M., Uz, A., and Islam, A. R. M. T.: Spatiotemporal drought analysis in Bangladesh using the standardized precipitation index (SPI) and standardized precipitation evapotranspiration index (SPEI), Sci. Rep., 12, 1–17, https://doi.org/10.1038/s41598-022-24146-0, 2022. a
Kchouk, S., Melsen, L. A., Walker, D. W., and van Oel, P. R.: A geography of drought indices: mismatch between indicators of drought and its impacts on water and food securities, Nat. Hazards Earth Syst. Sci., 22, 323–344, https://doi.org/10.5194/nhess-22-323-2022, 2022. a
Kenya: Kenya National Adaptation Plan: 2015–2030, https://www4.unfccc.int/sites/NAPC/Documents%20NAP/Kenya_NAP_Final.pdf (last access: 23 January 2023), 2016. a
Kew, S. F., Philip, S. Y., Hauser, M., Hobbins, M., Wanders, N., van Oldenborgh, G. J., van der Wiel, K., Veldkamp, T. I. E., Kimutai, J., Funk, C., and Otto, F. E. L.: Impact of precipitation and increasing temperatures on drought trends in eastern Africa, Earth Syst. Dynam., 12, 17–35, https://doi.org/10.5194/esd-12-17-2021, 2021. a
Kimwatu, D. M., Mundia, C. N., and Makokha, G. O.: Developing a new socio-economic drought index for monitoring drought proliferation: a case study of Upper Ewaso Ngiro River Basin in Kenya, Environ. Monit. Assess., 193, 1–22, https://doi.org/10.1007/s10661-021-08989-0, 2021. a
Klisch, A. and Atzberger, C.: Operational drought monitoring in Kenya using MODIS NDVI time series, Remote Sens., 8, 267, https://doi.org/10.3390/rs8040267, 2016. a
Kuhn, M.: Building predictive models in R using the caret package, J. Stat. Softw., 28, 1–26, https://doi.org/10.18637/jss.v028.i05, 2008. a, b
Lam, M. and Odongo, R.: Data from the publication: Linking reported drought impacts with drought indices, water scarcity and aridity: the case of Kenya, 4TU.ResearchData [data set], https://doi.org/10.4121/19620357, 2022.
Lehner, B., Liermann, C. R., Revenga, C., Vörösmarty, C., Fekete, B., Crouzet, P., Döll, P., Endejan, M., Frenken, K., Magome, J., Nilsson, C., Robertson, J. C., Rödel, R., Sindorf, N., and Wisser, D. : High-resolution mapping of the world's reservoirs and dams for sustainable river-flow management, Front. Ecol. Environ., 9, 494–502, https://doi.org/10.1890/100125, 2011. a
Liaw, A. and Wiener, M.: Classification and regression by randomForest, R News, 2, 18–22, 2002. a
Liu, Y. Y., De Jeu, R. A., McCabe, M. F., Evans, J. P., and Van Dijk, A. I.: Global long-term passive microwave satellite-based retrievals of vegetation optical depth, Geophys. Res. Lett., 38, L18402, https://doi.org/10.1029/2011GL048684, 2011. a
Ma, M., Lv, J., Su, Z., Hannaford, J., Sun, H., Qu, Y., Xing, Z., Barker, L., and Wang, Y.: Linking drought indices to impacts in the Liaoning Province of China, P. Int. Ass. Hydrol. Sci., 383, 267–272, https://doi.org/10.5194/piahs-383-267-2020, 2020. a, b, c, d
Maidment, R. I., Grimes, D., Allan, R. P., Tarnavsky, E., Stringer, M., Hewison, T., Roebeling, R., and Black, E.: The 30 year TAMSAT African rainfall climatology and time series (TARCAT) data set, J. Geophys. Res.-Atmos., 119, 10–619, https://doi.org/10.1002/2014JD021927, 2014. a
Majani, B. S., Malamud, B. D., and Millington, J.: Use of blended evidence sources to build a history of flooding impact and an impact severity scale: A case study of Nairobi, Kenya, Tech. rep., Copernicus Meetings, https://doi.org/10.5194/egusphere-egu22-12012, 2022. a
Maliva, R. and Missimer, T.: Arid Lands Water Evaluation and Management, Environmental science and engineering, Springer-Verlag, Berlin, Heidelberg, ISBN 978–3642291036, 2012. a, b, c
Martens, B., Miralles, D. G., Lievens, H., van der Schalie, R., de Jeu, R. A. M., Fernández-Prieto, D., Beck, H. E., Dorigo, W. A., and Verhoest, N. E. C.: GLEAM v3: satellite-based land evaporation and root-zone soil moisture, Geosci. Model Dev., 10, 1903–1925, https://doi.org/10.5194/gmd-10-1903-2017, 2017. a, b
McKee, T. B., Doesken, J., and Kleist, J.: Analysis of Standardized Precipitation Index (SPI) data for drought assessment, Water, 26, 1–72, 1993. a
McNally, A., Verdin, K., Harrison, L., Getirana, A., Jacob, J., Shukla, S., Arsenault, K., Peters-Lidard, C., and Verdin, J. P.: Acute water-scarcity monitoring for Africa, Water, 11, 1968, https://doi.org/10.3390/w11101968, 2019. a, b, c, d, e, f, g, h
Miralles, D. G., Holmes, T. R. H., De Jeu, R. A. M., Gash, J. H., Meesters, A. G. C. A., and Dolman, A. J.: Global land-surface evaporation estimated from satellite-based observations, Hydrol. Earth Syst. Sci., 15, 453–469, https://doi.org/10.5194/hess-15-453-2011, 2011. a
Mishra, A. K. and Singh, V. P.: A review of drought concepts, J. Hydrol., 391, 202–216, https://doi.org/10.1016/j.jhydrol.2010.07.012, 2010. a
Mude, A. G., Ouma, R., van de Steeg, J., Kaiuki, J., Opiyo, D., and Tipilda, A.: Kenya adaptation to climate change in the arid lands: Anticipating, adapting to and coping with climate risks in Kenya-Operational recommendations for KACCAL, ILRI Research Report 18, Nairobi, Kenya, International Livestock Research Institute, 135 pp., https://cgspace.cgiar.org/bitstream/handle/10568/2186/KACCAL%20Final%20Report.pdf?sequence=1&isAllowed=y (last access: 23 January 2023), 2007. a
Mulwa, F., Li, Z., and Fangninou, F. F.: Water Scarcity in Kenya: Current Status, Challenges and Future Solutions, Open Access Library Journal, 8, 1–15, https://doi.org/10.4236/oalib.1107096, 2021. a, b, c, d
Mutsotso, R. B., Sichangi, A. W., and Makokha, G. O.: Spatio-temporal drought characterization in Kenya from 1987 to 2016, Adv. Space Res., 7. 125–143, https://doi.org/10.4236/ars.2018.72009, 2018. a
Mwangi, E., Taylor, O., Todd, M. C., Visman, E., Kniveton, D., Kilavi, M., Ndegwa, W., Otieno, G., Waruru, S., Mwangi, J., Ambani, M., Abdillahi, H., MacLeod, D., Rowhani, P., Graham, R., and Colman, A.: Mainstreaming forecast based action into national disaster risk management systems: experience from drought risk management in Kenya, Clim. Dev., 14, 741–756, https://doi.org/10.1080/17565529.2021.1984194, 2022. a
Nalbantis, I.: Evaluation of a hydrological drought index, European Water, 23, 67–77, 2008. a
NDMC: Drought Impact Reporter, https://droughtreporter.unl.edu/map/ (last access: 29 April 2022), 2005. a, b
Nicolai-Shaw, N., Zscheischler, J., Hirschi, M., Gudmundsson, L., and Seneviratne, S. I.: A drought event composite analysis using satellite remote-sensing based soil moisture, Remote Sens. Environ., 203, 216–225, https://doi.org/10.1016/j.rse.2017.06.014, 2017. a
Niwattanakul, S., Singthongchai, J., Naenudorn, E., and Wanapu, S.: Using of Jaccard coefficient for keywords similarity, in: Proceedings of the international multiconference of engineers and computer scientists, Vol. 1, Hong Kong, 13–15 March 2013, 380–384, 2013. a
Njarui, D., Gatheru, M., and Ghimire, S. R.: Brachiaria grass for climate resilient and sustainable livestock production in Kenya, African Handbook of Climate Change Adaptation, 1–22, https://doi.org/10.1007/978-3-030-42091-8_146-1, 2020. a
Nyberg, Y., Jonsson, M., Laszlo Ambjörnsson, E., Wetterlind, J., and Öborn, I.: Smallholders’ awareness of adaptation and coping measures to deal with rainfall variability in Western Kenya, Agroecol. Sust. Food, 44, 1280–1308, https://doi.org/10.1080/21683565.2020.1782305, 2020. a
O'Connor, P., Murphy, C., Matthews, T., and Wilby, R. L.: Relating drought indices to impacts reported in newspaper articles, Int. J. Climatol., 43, 1796–1816, https://doi.org/10.1002/joc.7946, 2022. a
Odongo, R. A., De Moel, H., and Van Loon, A. F.: Propagation from meteorological to hydrological drought in the Horn of Africa using both standardized and threshold-based indices, Nat. Hazards Earth Syst. Sci., 23, 2365–2386, https://doi.org/10.5194/nhess-23-2365-2023, 2023. a
Ondiko, J. H. and Karanja, A. M.: Spatial and Temporal Occurrence and Effects of Droughts on Crop Yields in Kenya, Open Access Library Journal, 8, 1–13, https://doi.org/10.4236/oalib.1107354, 2021. a, b
Opiyo, F., Wasonga, O., Nyangito, M., Schilling, J., and Munang, R.: Drought adaptation and coping strategies among the Turkana pastoralists of northern Kenya, Int. J. Disast. Risk. Sc., 6, 295–309, https://doi.org/10.1007/s13753-015-0063-4, 2015. a
Parry, J.-E.: Review of current and planned adaptation action in Kenya, CARIAA Working Paper no. 16, International Development Research Centre, Ottawa, Canada and UK Aid, London, United Kingdom, https://idl-bnc-idrc.dspacedirect.org/bitstream/handle/10625/55875/IDL-55875.pdf?sequence=1 (last access: 23 January 2023) 2016. a
Parsons, D. J., Rey, D., Tanguy, M., and Holman, I. P.: Regional variations in the link between drought indices and reported agricultural impacts of drought, Agr. Syst., 173, 119–129, https://doi.org/10.1016/j.agsy.2019.02.015, 2019. a, b, c, d
Peng, J., Dadson, S., Hirpa, F., Dyer, E., Lees, T., Miralles, D. G., Vicente-Serrano, S. M., and Funk, C.: A pan-African high-resolution drought index dataset, Earth Syst. Sci. Data, 12, 753–769, https://doi.org/10.5194/essd-12-753-2020, 2020. a, b
Phillip, M. J.: Combating Water Scarcity in Southern Africa: Case Studies from Namibia, Springer, https://doi.org/10.1007/978-94-007-7097-3, 2013. a
Priestley, C. H. B. and Taylor, R. J.: On the assessment of surface heat flux and evaporation using large-scale parameters, Mon. Weater Rev., 100, 81–92, https://doi.org/10.1175/1520-0493(1972)100<0081:OTAOSH>2.3.CO;2, 1972. a
Quandt, A.: Coping with drought: narratives from smallholder farmers in semi-arid Kenya, Int. J. Disast. Risk. Re., 57, 102168, https://doi.org/10.1016/j.ijdrr.2021.102168, 2021. a
Savelli, E., Rusca, M., Cloke, H., and Di Baldassarre, G.: Don’t blame the rain: Social power and the 2015–2017 drought in Cape Town, J. Hydrol., 594, 125953, https://doi.org/10.1016/j.jhydrol.2020.125953, 2021. a
Savelli, E., Rusca, M., Cloke, H., and Di Baldassarre, G.: Drought and society: Scientific progress, blind spots, and future prospects, Wiley Interdisciplinary Reviews: Climate Change, 13, e761, https://doi.org/10.1002/wcc.761, 2022. a
Seneviratne, S., Nicholls, N., Easterling, D., Goodess, C., Kanae, S., Kossin, J., Luo, Y., Marengo, J., McInnes, K., Rahimi, M., Reichstein, M., Sorteberg, A., Vera, C., Zhang, X., Alexander, L. V., Allen, S., Benito, G., Cavazos, T., Clague, J., Conway, D., Della-Marta, P. M., Gerber, M., Gong, S., Goswami, B. N., Hemer, M., Huggel, C., van den Hurk, B., Kharin, V. V., Kitoh, A., Klein Tank, A. M. G., Li, G., Mason, S. J., McGuire, W., van Oldenborgh, G., Orlowsky, B., Smith, S., Thiaw, W., Velegrakis, A., Yiou, P., Zhang, T., Zhou, T., and Zwiers, F. W.: Changes in Climate Extremes and Their Impacts on the Natural Physical Environment, A Special Report of Working Groups I and II of the Intergovernmental Panel on Climate Change (IPCC), Cambridge, UK, and New York, Cambridge University Press, https://doi.org/10.7916/d8-6nbt-s431, 2012. a, b
Seneviratne, S. I., Zhang, X., Adnan, M., Badi, W., Dereczynski, C., Di Luca, A., Ghosh, S., Iskandar, I., Kossin, J., Lewis, S., Otto, F., Pinto, I., Satoh, M., Vicente-Serrano, S. M., Wehner, M., and Zhou, B.: Weather and Climate Extreme Events in a Changing Climate, in: Climate Change 2021: The Physical Science Basis, Contribution of Working Group I to the Sixth Assessment Report of the Intergovernmental Panel on Climate Change, edited by: IPCC, Cambridge University Press, Contribution of working group I to the sixth assessment report of the intergovernmental panel on climate change, Cambridge University Press, 1513–1766, https://doi.org/10.1017/9781009157896.013, 2021. a, b
Stagge, J. H., Kohn, I., Tallaksen, L. M., and Stahl, K.: Modeling drought impact occurrence based on meteorological drought indices in Europe, J. Hydrol., 530, 37–50, https://doi.org/10.1016/j.jhydrol.2015.09.039, 2015. a, b, c, d, e, f, g, h
Stahl, K., Kohn, I., Blauhut, V., Urquijo, J., De Stefano, L., Acácio, V., Dias, S., Stagge, J. H., Tallaksen, L. M., Kampragou, E., Van Loon, A. F., Barker, L. J., Melsen, L. A., Bifulco, C., Musolino, D., de Carli, A., Massarutto, A., Assimacopoulos, D., and Van Lanen, H. A. J.: Impacts of European drought events: insights from an international database of text-based reports, Nat. Hazards Earth Syst. Sci., 16, 801–819, https://doi.org/10.5194/nhess-16-801-2016, 2016. a
Sutanto, S. J. and Van Lanen, H. A.: Catchment memory explains hydrological drought forecast performance, Sci. Rep., 12, 1–11, https://doi.org/10.1038/s41598-022-06553-5, 2022. a
Tarnavsky, E., Grimes, D., Maidment, R., Black, E., Allan, R. P., Stringer, M., Chadwick, R., and Kayitakire, F.: Extension of the TAMSAT satellite-based rainfall monitoring over Africa and from 1983 to present, J. Appl. Meteorol. Clim., 53, 2805–2822, https://doi.org/10.1175/JAMC-D-14-0016.1, 2014. a
The World Bank: Population, data retrieved from World Development Indicators, https://data.worldbank.org/indicator/SP.POP.TOTL (last access: 2 May 2022), 2020. a
Thomas, E., Jordan, E., Linden, K., Mogesse, B., Hailu, T., Jirma, H., Thomson, P., Koehler, J., and Collins, G.: Reducing drought emergencies in the Horn of Africa, Sci. Total Environ., 727, 138772, https://doi.org/10.1016/j.scitotenv.2020.138772, 2020. a
UNESCO: Map of the world distribution of arid regions: Map at scale 1 : 25 000 000 with explanatory note, MAB Technical Notes 7, UNESCO, Paris, ISBN 92-3-101484-6, 1979. a
Van Der Knijff, J., Younis, J., and De Roo, A.: LISFLOOD: a GIS-based distributed model for river basin scale water balance and flood simulation, Int. J. Geogr. Inf. Sci., 24, 189–212, https://doi.org/10.1080/13658810802549154, 2010. a
Van Dijk, A. I., Beck, H. E., Crosbie, R. S., de Jeu, R. A., Liu, Y. Y., Podger, G. M., Timbal, B., and Viney, N. R.: The Millennium Drought in southeast Australia (2001–2009): Natural and human causes and implications for water resources, ecosystems, economy, and society, Water Resour. Res., 49, 1040–1057, https://doi.org/10.1002/wrcr.20123, 2013. a
Van Loon, A. F.: Hydrological drought explained, Wiley Interdisciplinary Reviews: Water, 2, 359–392, https://doi.org/10.1002/wat2.1085, 2015. a, b
Van Loon, A. F. and Van Lanen, H. A.: Making the distinction between water scarcity and drought using an observation-modeling framework, Water Resour. Res., 49, 1483–1502, https://doi.org/10.1002/wrcr.20147, 2013. a, b, c
Van Loon, A. F., Gleeson, T., Clark, J., Van Dijk, A. I., Stahl, K., Hannaford, J., Di Baldassarre, G., Teuling, A. J., Tallaksen, L. M., Uijlenhoet, R., Hannah, D. M., Sheffield, J., Svoboda, M., Verbeiren, B., Wagener, T., Rangecroft, S., Wanders, N., and Van Lanen, H. A. J.: Drought in the Anthropocene, Nat. Geosci., 9, 89–91, https://doi.org/10.1038/ngeo2646, 2016a. a
Van Loon, A. F., Stahl, K., Di Baldassarre, G., Clark, J., Rangecroft, S., Wanders, N., Gleeson, T., Van Dijk, A. I. J. M., Tallaksen, L. M., Hannaford, J., Uijlenhoet, R., Teuling, A. J., Hannah, D. M., Sheffield, J., Svoboda, M., Verbeiren, B., Wagener, T., and Van Lanen, H. A. J.: Drought in a human-modified world: reframing drought definitions, understanding, and analysis approaches, Hydrol. Earth Syst. Sci., 20, 3631–3650, https://doi.org/10.5194/hess-20-3631-2016, 2016b. a
Vicente-Serrano, S. M., Beguería, S., and López-Moreno, J. I.: A multiscalar drought index sensitive to global warming: the standardized precipitation evapotranspiration index, J. Climate, 23, 1696–1718, https://doi.org/10.1175/2009JCLI2909.1, 2010. a
Wamucii, C. N., van Oel, P. R., Ligtenberg, A., Gathenya, J. M., and Teuling, A. J.: Land use and climate change effects on water yield from East African forested water towers, Hydrol. Earth Syst. Sci., 25, 5641–5665, https://doi.org/10.5194/hess-25-5641-2021, 2021. a
Wanders, N., Van Loon, A. F., and Van Lanen, H. A. J.: Frequently used drought indices reflect different drought conditions on global scale, Hydrol. Earth Syst. Sci. Discuss. [preprint], https://doi.org/10.5194/hess-2017-512, in review, 2017. a, b
Wang, R., Li, L., Gentine, P., Zhang, Y., Chen, J., Chen, X., Chen, L., Ning, L., Yuan, L., and Lü, G.: Recent increase in the observation-derived land evapotranspiration due to global warming, Environ. Res. Lett., 17, 024020, https://doi.org/10.1088/1748-9326/ac4291, 2022. a
Wang, W., Ertsen, M. W., Svoboda, M. D., and Hafeez, M.: Propagation of drought: from meteorological drought to agricultural and hydrological drought, Adv. Meteorol., 2016, 6547209, https://doi.org/10.1155/2016/6547209, 2016. a
Wang, Y., Lv, J., Hannaford, J., Wang, Y., Sun, H., Barker, L. J., Ma, M., Su, Z., and Eastman, M.: Linking drought indices to impacts to support drought risk assessment in Liaoning province, China, Nat. Hazards Earth Syst. Sci., 20, 889–906, https://doi.org/10.5194/nhess-20-889-2020, 2020. a, b, c, d, e, f
weADAPT: Enhancing resiliency to drought in Kenya's arid and semi-arid lands, https://www.weadapt.org/ (last access: 23 January 2023), 2023. a
WFP, V.: Food consumption analysis: calculation and use of the food consumption score in food security analysis, World Food Programme, Vulnerability Analysis and Mapping Branch (ODAV), Rome, Italy, 2008. a
Wilhite, D. A., Svoboda, M. D., and Hayes, M. J.: Understanding the complex impacts of drought: A key to enhancing drought mitigation and preparedness, Water Resour. Manag., 21, 763–774, https://doi.org/10.1007/s11269-006-9076-5, 2007. a
WMO: WMO Guidelines on Multi-Hazard Impact-Based Forecast and Warning Services, Geneva, WMO, https://etrp.wmo.int/pluginfile.php/16270/mod_resource/content/0/wmo_1150_en.pdf (last access: 2 May 2022), 2015. a
Xu, H.-J., Wang, X.-P., Zhao, C.-Y., Shan, S.-Y., and Guo, J.: Seasonal and aridity influences on the relationships between drought indices and hydrological variables over China, Weather Clim. Extrem., 34, 100393, https://doi.org/10.1016/j.wace.2021.100393, 2021. a
Xu, Y., Zhang, X., Wang, X., Hao, Z., Singh, V. P., and Hao, F.: Propagation from meteorological drought to hydrological drought under the impact of human activities: A case study in northern China, J. Hydrol., 579, 124147, https://doi.org/10.1016/j.jhydrol.2019.124147, 2019. a, b
Yihdego, Y., Vaheddoost, B., and Al-Weshah, R. A.: Drought indices and indicators revisited, Arab. J. Geosci., 12, 1–12, https://doi.org/10.1007/s12517-019-4237-z, 2019. a, b, c
Zhou, Y., Zhou, P., Jin, J., Wu, C., Cui, Y., Zhang, Y., and Tong, F.: Drought identification based on Palmer drought severity index and return period analysis of drought characteristics in Huaibei Plain China, Environ. Res., 212, 113163, https://doi.org/10.1016/j.envres.2022.113163, 2022. a
- Abstract
- Introduction
- Data and methods
- Results
- Discussion
- Conclusions
- Appendix A: Detailed explanation of the water scarcity dataset
- Appendix B: The hydrological datasets: the streamflow data sources
- Appendix C: Point-biserial correlation
- Data availability
- Author contributions
- Competing interests
- Disclaimer
- Special issue statement
- Acknowledgements
- Review statement
- References
- Supplement