the Creative Commons Attribution 4.0 License.
the Creative Commons Attribution 4.0 License.
 | 03 Aug 2023
A decrease in rockfall probability under climate change conditions in Germany
Katrin M. Nissen
Martina Wilde
Thomas M. Kreuzer
Annika Wohlers
Bodo Damm
Uwe Ulbrich
The effect of climate change on rockfalls in the German low mountain regions is investigated following two different approaches. The first approach uses a logistic regression model that describes the combined effect of precipitation, freeze–thaw cycles, and fissure water on rockfall probability. The climate change signal for the past 6 decades is analysed by applying the model to meteorological observations. The possible effect of climate change until the end of the century is explored by applying the statistical model to the output of a multi-model ensemble of 23 regional climate scenario simulations. It is found that the number of days per year exhibiting an above-average probability for rockfalls has mostly been decreasing during the last few decades. Statistical significance is, however, present at only a few sites. A robust and statistically significant decrease can be seen in the Representative Concentration Pathway (RCP) climate scenario 8.5 (RCP8.5) simulations for Germany and neighbouring regions, locally falling below −10 % when comparing the last 30 years of the 20th century to the last 30 years of the 21st century. The most important factor determining the projected decrease in rockfall probability is a reduction in the number of freeze–thaw cycles expected under future climate conditions.
For the second approach four large-scale meteorological patterns that are associated with enhanced rockfall probability are identified from reanalysis data. The frequency of all four patterns exhibits a seasonal cycle that maximises in the cold half of the year (winter and spring). Trends in the number of days that can be assigned to these patterns are determined both in meteorological reanalysis data and in climate simulations. In the reanalysis no statistically significant trend is found. For the future scenario simulations all climate models show a statistically significant decrease in the number of rockfall-promoting weather situations.
- Article
(6202 KB) - Full-text XML
- BibTeX
- EndNote


The impact of climate change on the occurrence of landslides is an important research topic, as landslides are responsible for numerous fatalities and cause high economic costs each year (Kirschbaum et al., 2015; Klose et al., 2015; Gariano and Guzzetti, 2016; Froude and Petley, 2018; Haque et al., 2019). Therefore, it is essential to investigate how meteorological changes will influence the occurrence of landslides in the future to provide important information for planning and mitigation strategies (Schlögl and Matulla, 2018). The term landslide is generic and encompasses several gravitational mass movement processes such as falls, flows, or slides, and it is necessary to specify the types of mass movement and to analyse them separately (Varnes, 1978; Hungr et al., 2014). In this study, the focus lies on rockfall processes, which are defined as the detachment of rock from steep slopes or cliff descends by falling, rolling, or bouncing. The main triggers are precipitation, snowmelt, and freeze–thaw cycles (Varnes, 1978; Cruden and Varnes, 1996; Wieczorek, 1996; Highland and Bobrowsky, 2008; Hungr et al., 2014).
In several reports, the Intergovernmental Panel on Climate Change (IPCC) states that in some regions it is highly likely that changes in heavy precipitation will have an effect on rockfall occurrence and that the frequency of rockfalls increases mainly due to permafrost degradation (IPCC, 2007, 2012, 2013, 2021). Additionally, numerous studies on the effects of climate change on rockfall have predicted that the frequency of rockfall will increase (Allen and Huggel, 2013; Ravanel and Deline, 2015) with changes varying between seasons (Stoffel et al., 2014). However, most of these studies were conducted for high mountain ranges, where permafrost plays a key role (Gruber and Haeberli, 2007; Ravanel and Deline, 2011, 2015; Stoffel et al., 2014). In contrast, studies focusing on lower mountain ranges came to different conclusions, emphasising that a general assumption on the impact of climate change on rockfalls is not realistic (Dehn and Buma, 1999; Collison et al., 2000; Sass and Oberlechner, 2012). For example, Sass and Oberlechner (2012) analysed over 250 rockfall events located in areas without permafrost in Austria, finding no indication of increased rockfall occurrence due to climate change. Mainieri et al. (2022) investigated the influence of global warming on rockfalls at low-elevation regions in the French Alps. They applied multiple regression models with a rockfall inventory, based on tree ring analysis, and investigated the effect of changes in climatic conditions based on reanalysis data. They concluded that for their sites an increase in rockfall occurrence related to climate change is not to be expected.
There are very few studies on the impact of climate change on rockfall occurrence that use climate change scenarios. Studies on climate change for other mass movement types include, for example, Jemec Auflič et al. (2021). These authors analysed the impact of climate change on shallow and deep-seated landslides between 1961 and 2070 in Slovenia using six different climate models for estimating the effect of the Representative Concentration Pathway (RCP) climate scenario 4.5, counting precipitation threshold exceedances and investigating the size of the affected area. Their results indicate that more frequent extreme rainfall events may lead to an increase in landslide occurrence.
The literature cited here illustrates that the triggers and thresholds are site- and process-specific. The present study is the first that investigates rockfall occurrences under climate change conditions in lower mountain ranges in Germany. The results of two independent approaches are presented. For the first approach, the logistic regression model described by Nissen et al. (2022), which was trained using meteorological observations and a rockfall dataset with events observed in Germany, is applied to meteorological time series data. For the second approach large-scale atmospheric patterns associated with an enhanced probability for rockfall initialisation are identified, and changes in the frequency of these patterns are determined. In contrast to Luque-Espinar et al. (2017), who investigated the link between large-scale atmospheric phenomena (e.g. El Niño–Southern Oscillation, ENSO; North Atlantic Oscillation, NAO; and Quasi-Biennial Oscillation, QBO) and rockfall and landslide events in Spain based on spectral analysis, we identify relevant patterns in the 500 hPa geopotential height field over Europe with an approach based on cluster analysis. This type of approach was also used by Messeri et al. (2015) to develop a risk index for landslides in Italy.
In the present study the climate change signal is investigated for two different time periods: (a) for the last few decades using meteorological observations or reanalysis data and (b) for future periods using a multi-model ensemble of climate scenario simulations.
2.1 Rockfall data
The present study uses historical rockfall data that are extracted from a landslide database of Germany (Rupp and Damm, 2020; Damm and Klose, 2015). The rockfall data are gathered from scientific publications, governmental reports, police reports, civil protection reports, newspapers, field data collections, geographic information systems (GIS), and web analyses. The landslide database of Germany currently contains about 7500 mass movement events of different types. The majority of events listed has occurred in the last 200 years, and the oldest event can be dated back to 1137. The database is not comprehensive, and the number of included events increases with time due to the fact that data on landslide observations have become more readily available in recent years. Within the database, 670 rockfall events have been registered. In this regard, the generic term rockfall includes a variety of geomorphological processes (e.g. rockfall, rock topple, debris fall, debris topple), which are characterised by a rapid gravitational downslope fall of debris or rocks, variable in particle size and volume (Varnes, 1978; Selby, 1993; Cruden and Varnes, 1996; Dorren, 2003). The rockfalls within the landslide database include information on the date and precise location of the event. For 343 events the exact day is known. From these, the 213 events that occurred after 1 January 1979 (start of the weather-type classification) were included in the analysis. The extracted dataset is complemented by data provided and collected by the German railway company Deutsche Bahn (DB). The DB dataset covers the years 2015–2020 and includes 55 rockfall events. The data have been collected by the technical staff of Deutsche Bahn. As we found no evidence for discrepancies, we included these data into our study, being aware of the risk that the level of expertise on which the classification is based might be limited and that this part of the rockfall data might inherit some delay considering the event occurrence, as the railway dataset lists the day of event detection.
2.2 Meteorological data
The two gridded observational datasets that were used to fit the logistic regression model in Nissen et al. (2022) are used again in this study to estimate trends in climate-related rockfall probability during the last 6 decades. Daily minimum and maximum temperatures are taken from the E-OBS dataset (Cornes et al., 2018), while daily precipitation at the rockfall sites is extracted from the REGNIE dataset (Rauthe et al., 2013). Both datasets are constructed from station observations interpolated to a regular grid considering orographical conditions. The horizontal resolution of this grid is for E-OBS and 1 km2 for REGNIE. For consistency, the daily minimum and maximum from the E-OBS dataset are also used to remove potential biases from climate simulations prior to the identification of freeze–thaw cycles in these simulations.
The ERA5 dataset is the basis for a customised classification of large-scale weather patterns. ERA5 is the fifth-generation ECMWF atmospheric reanalysis of the global climate (Hersbach et al., 2020). For the present analysis daily data covering the period 1979–2020 were used. At the time of writing, data for the pre-satellite era 1950–1978 were still categorised as preliminary and therefore excluded from the analysis. The original data were smoothed by interpolating them to a regular grid.
2.3 Climate scenario simulations
Future climate conditions (2071–2100) are analysed from regional climate scenario simulations conducted under the EURO-CORDEX initiative (Jacob et al., 2014) by comparing the scenario period with data produced with the same models under present-day greenhouse gas forcing (1971–2000). We selected the simulations with the highest available horizontal resolution of , corresponding to approximately 12 km × 12 km. The regional simulations are driven by the output of global climate models from the CMIP5 initiative (Taylor et al., 2012). In order to capture the upper range of the potential change, the emission pathway RCP8.5 scenario was chosen. The analysis includes the model simulations accessible from the Freva XCES data server (Kadow et al., 2021) set up for the ClimXtreme project (https://www.climxtreme.net/index.php/en/, last access: 20 June 2023). Table 1 lists these simulations. If more than one ensemble member was available only the first was used for the analysis in order to ensure equal weighting of the models. In total 23 combinations of global and regional models were included in the analysis.
Kupiainen et al. (2015)Kupiainen et al. (2015)Kupiainen et al. (2015)Kupiainen et al. (2015)Kupiainen et al. (2015)Christensen et al. (1998)Christensen et al. (1998)Skamarock et al. (2008)Rockel et al. (2008)Rockel et al. (2008)Rockel et al. (2008)Rockel et al. (2008)Rockel et al. (2008)Rockel et al. (2008)Jacob et al. (2012)Van Meijgaard et al. (2012)Van Meijgaard et al. (2012)Van Meijgaard et al. (2012)Van Meijgaard et al. (2012)Van Meijgaard et al. (2012)Van Meijgaard et al. (2012)Jacob et al. (2012)Jacob et al. (2012)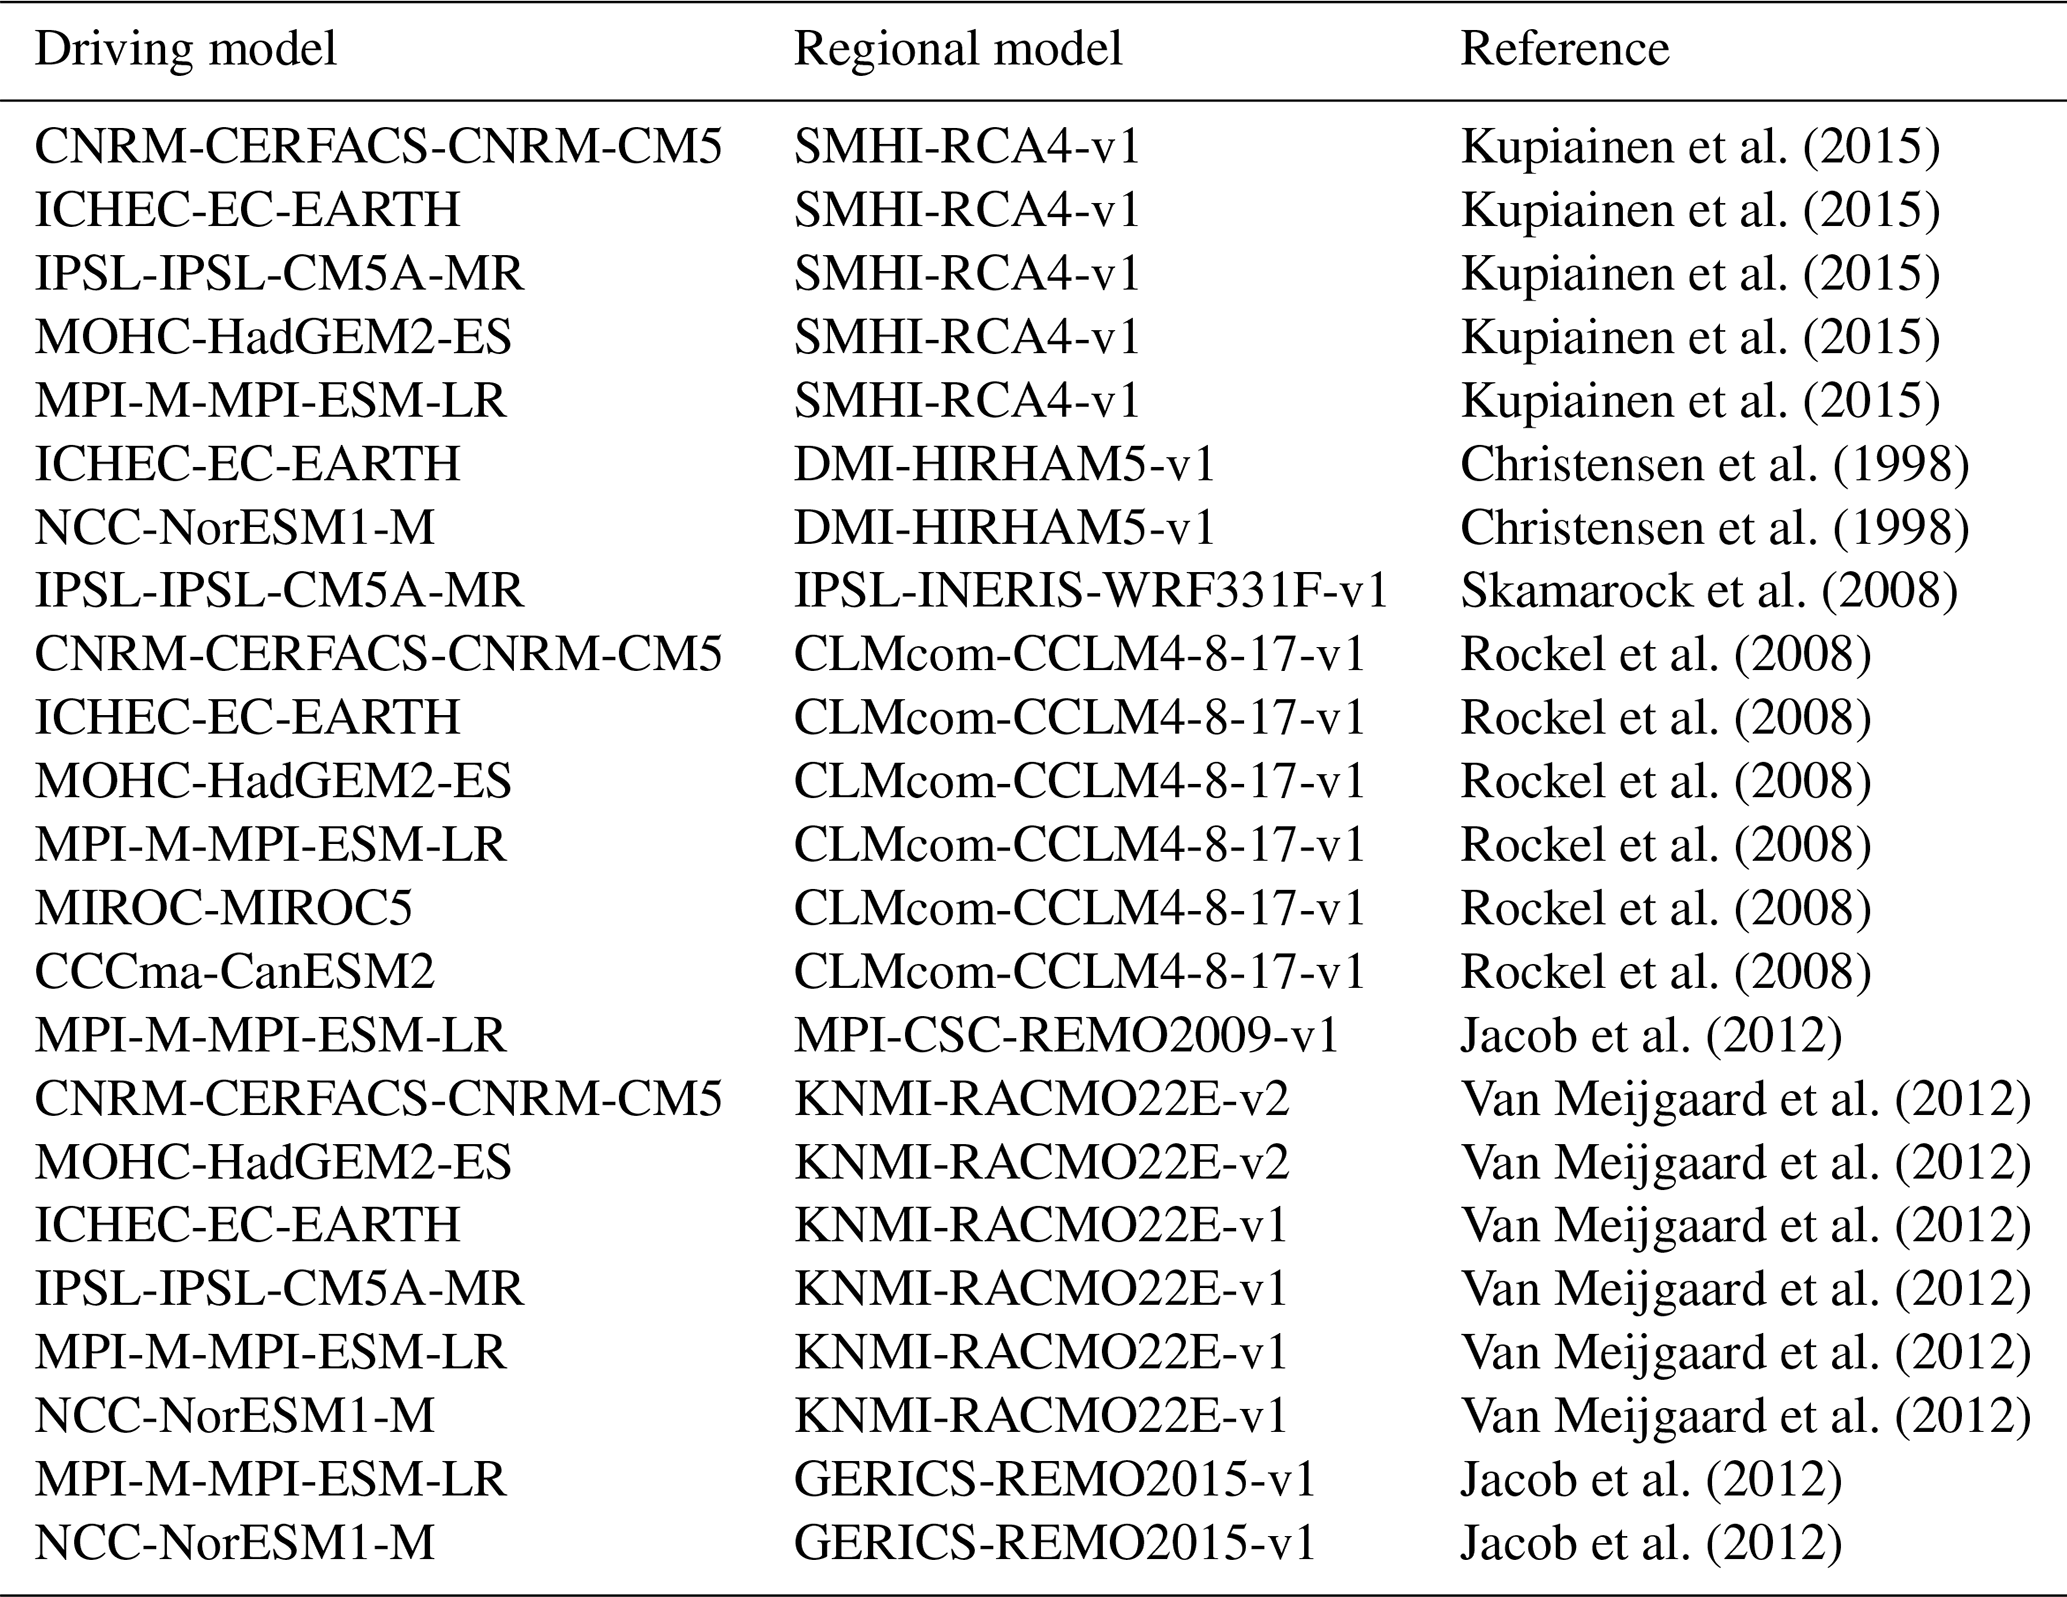
2.4 Definition of subregions
In the following we sometimes refer to specific subregions. The Central European (CE) subregion is located north of the Alps and includes Germany and some neighbouring areas (47–56∘ N, 2–24∘ E). Its extent is depicted in Fig. 2. The greater European subregion (GE) extends from 35 to 70∘ N and from 15∘ W to 30∘ E (see Fig. 5). The smaller European subregion (SE) used for a sensitivity test covers the region 40–60∘ N, 0–20∘ E (not shown).
3.1 Logistic regression
In Nissen et al. (2022), a logistic regression model was developed that describes the probability of rockfalls as a function of meteorological predictors:
where preciplperc is daily precipitation expressed as local percentiles, Dperc is the percentile of a fissure water proxy, and ftc denotes if a freeze–thaw cycle occurred in the previous 9 d. This 9 d period was identified as optimal in Nissen et al. (2022). The fissure water proxy D is defined as the difference between precipitation accumulated over 5 d and the potential evapotranspiration (PET) during this period. PET is determined using the method proposed by Hargreaves (1994) in the version modified by Droogers and Allen (2002). As input parameters the method needs extraterrestrial radiation (which depends on latitude and the day of the year), the time mean of maximum and minimum daily temperatures, and mean precipitation over the accumulation period (as a proxy for cloudiness). A freeze–thaw cycle is defined as the transition from a daily minimum temperature below 0 ∘C to a daily maximum temperature higher than 0 ∘C. Thus, the three variables needed for the model are daily minimum and maximum temperatures (Tmax and Tmin) as well as daily precipitation.
First, the logistic regression model is used to analyse trends in the observational time period (1950–2020) using observational data (E-OBS and REGNIE) at the rockfall sites as input. Trends in the annual number of days per year with p>pclim were investigated. Here, pclim is defined as the total number of observed rockfall events (nevents) divided by the total number of days (ndays) in the meteorological dataset:
The trend is regarded as statistically significant if a Mann–Kendall test (Wilks, 2011) indicates a significance level of less than 5 %.
Next, the statistical model (Eq. 1) is applied to regional climate model data in order to investigate changes in rockfall probability under future climate scenario conditions. As variables in climate simulations can exhibit a bias, a bias correction was applied to the daily maximum and minimum temperatures before determining the freeze–thaw cycles. The correction term was determined by evaluating the percentile that corresponds to 0 ∘C at each grid point in the E-OBS dataset and by finding the temperature corresponding to this percentile in the regional models. Subtracting this temperature results in a quantile correction at 0 ∘C.
For precipitation and the fissure water proxy D no bias correction is necessary, as only percentiles for both parameters are used as input for the statistical model. The references for these percentiles are the model years 1971–2000 of the historical simulation of each model. In order to map D and precipitation to percentiles, a function is fitted that describes the probability density of D and precipitation. For D it was found that a good fit is achieved using a two-parameter beta function, while precipitation is better described by a gamma function. For daily precipitation local percentiles are required. The fit is therefore conducted for each grid point separately. For D the fit is determined for all land grid points over the CE study region together.
In order to analyse the climate change signal, the last 30 years of the 20th century are compared to the last 30 years of the 21st century. The first period stems from the historical simulations forced with observed greenhouse gas concentrations, and the second period is part of the RCP8.5 scenario simulations. The number of days favourable for rockfalls (p>pclim) is counted for both periods, with pclim defined as the local average over all probabilities in the historical period.
Following Jacob et al. (2014), the multi-model result at a grid box is regarded as robust if 66 % of the models agree on the direction of the change. The significance level of the difference between the two periods is calculated for each grid box in each model simulation individually using a Monte Carlo technique. The idea of the test is to determine how likely it is to obtain the same or a greater difference when a random generator distributes the favourable days into the two periods. The implementation can be best explained with an example: assuming the number of favourable days at one grid point in model A in the historical period is 2000, and in the scenario period it is 1500. Together there are 2500 events, and the difference between the two periods is . Each of the 2500 events will now be individually assigned to one of the two periods by the random generator, and the difference Δrandom between the two periods is determined. This process is repeated 100 times, producing 100 values for Δrandom. If Δ is larger or smaller than 95 % of these values, Δ is regarded as statistically significant at the 5 % level. The multi-model result at a grid point is regarded as statistically significant if 66 % of all models exhibit a significance level of no less than 5 % and agree on the direction of the change.
3.2 Large-scale weather patterns
Patterns of meteorological conditions associated with rockfalls are identified by classifying the days with an event in the rockfall database using the objective classification algorithm SANDRA (Philipp et al., 2007). Input variables are taken from the ERA5 reanalysis dataset. As input variables we tested anomalies of the mean sea level pressure (m.s.l.p.) with respect to the long-term mean and anomalies of the 500 hPa geopotential height (GPH500) for two different domain sizes. The first domain covers the greater European (GE) region and the second one the smaller European (SE) domain. For SANDRA the desired number of clusters (i.e. weather patterns) needs to be specified by the user, and we tested numbers between 2 and 12. The classification algorithm groups the meteorological fields on the rockfall days in such a way that the within-cluster variance in the Euclidean distance E between the centroid of the cluster and the cluster elements Xi is minimised. The Euclidean distance is calculated by summing up over all grid points of the field (Eq. 3), with g denoting the grid point and ng being the number of points in the area of interest.
By design each event day is assigned to a cluster. We are, however, only interested in groups of events that have occurred under similar large-scale weather conditions (patterns). Events that do not fit into groups need to be removed. We therefore refined the classification by testing if excluding atypical rockfall days from the classification improves the results. This was done by iteratively removing a certain percentage of cluster elements (days) from each cluster. In each iteration step the element with the largest distance E was removed, and a new centroid was calculated. For each cluster the maximum distance between the remaining cluster elements and the centroid was stored as a threshold distance Ethres. We removed between 10 % and 50 % of the cluster elements for each cluster and compared the results. The selection of the best classification was based on three different criteria:
- a.
a high ability to discriminate between favourable and unfavourable meteorological conditions with respect to rockfalls,
- b.
the number of rockfall days in the relevant clusters should be high, and
- c.
the centroids of the relevant clusters represent distinct meteorological conditions.
To evaluate the ability of a classification to discriminate between favourable and unfavourable meteorological conditions with respect to rockfall probability, the non-rockfall days were assigned to the existing clusters if E<Ethres or to the new group “Other”. For each cluster an X2 test was applied to determine if the probability of rockfall occurrence in the days belonging to the cluster differs significantly from pclim. Only the clusters that are associated with a rockfall probability higher than pclim, that pass the X2 test at the 5 % significance level, and that contain at least 10 rockfall days are regarded as relevant. The mean probability of rockfall in the relevant clusters was determined (pclusters). The probability increase (pclusters−pclim) was taken as a measure of quality criterion (a). The number of rockfall days in the relevant classes was used as quality criterion (b). Criterion (c) was determined by a subjective visual inspection of the centroids. We found that for more than four relevant classes centroids resembled each other, showing only slight shifts in the location of the low-pressure systems. Therefore, classifications with more than four relevant classes were dismissed.
The climate change signal for large-scale weather patterns for the past few decades and for the 21st century was determined by assigning each day of the ERA5 reanalysis and scenario simulations to a weather pattern (cluster) if E<Ethres. The Poisson trend in the annual number of days belonging to one of the relevant weather patterns was determined. Again, a trend was regarded as statistically significant if a significance level of less than 5 % was reached according to a Mann–Kendall test.
4.1 Logistic regression
By entering meteorological observations into the logistic regression model, changes in rockfall probability caused by changes in the meteorological conditions can be studied for the past. For the period between 1950 and 2020 the trends in the annual number of days with p>pclim at the rockfall sites are depicted in Fig. 1. The trend at most event sites is negative (blue circles). The trend is statistically significant only at 9 % of the sites (dark blue circles). The decrease at these sites is small and amounts to −1.5 % to −3.5 % per decade relative to the mean annual frequency. Statistically significant positive trends are absent.
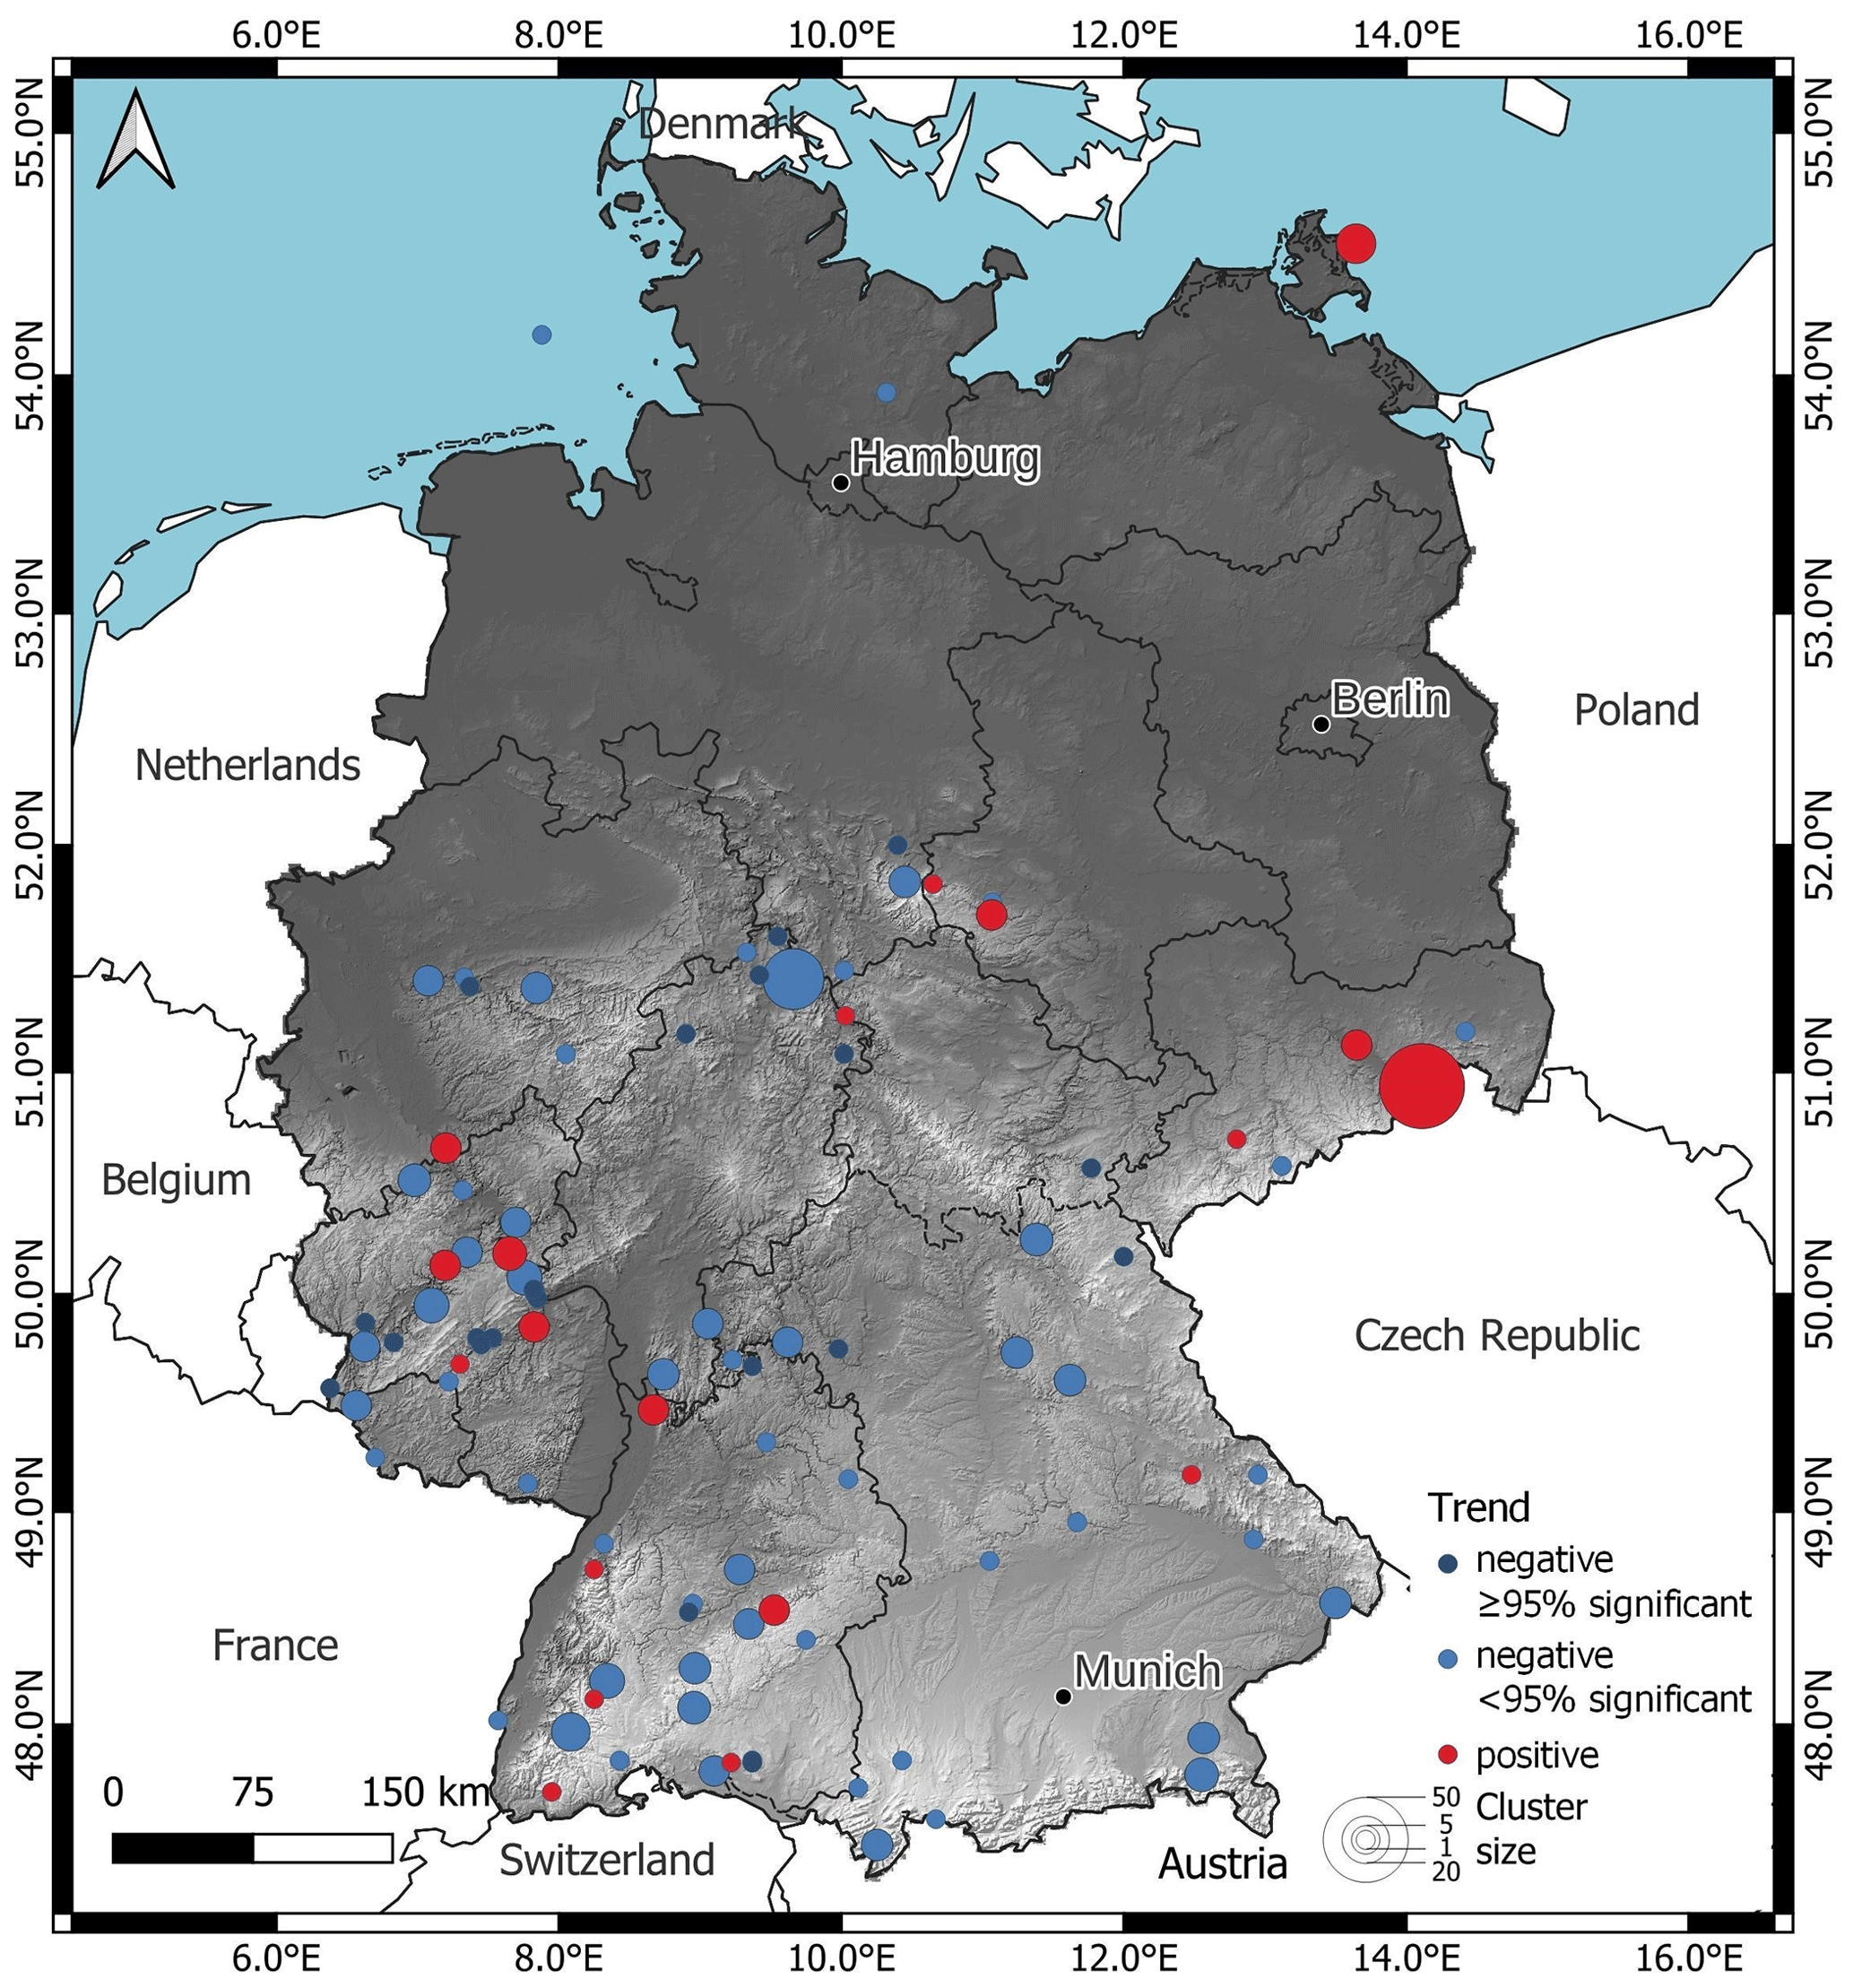
Figure 1Trend in the annual number of days showing a probability of rockfalls that is higher than the climatological probability. Shown is the result at the rockfall sites determined with the logistic regression model using observations. Blue denotes a decrease, and red denotes an increase. A darker colour shade is used if a Mann–Kendall test indicated statistical significance at the 5 % level.
Using variables from climate scenario simulations as input for the logistic regression model, the possible influence of climate change on rockfalls for future periods is estimated (Fig. 2). Comparing the last 30 years of the 20th century with the last 30 years of the 21st century, the multi-model ensemble suggests a decrease in the annual number of days with conditions associated with p exceeding pclim almost everywhere in the CE region. There is an overall gradient of the strength of the signal from the north-east to the south-west of the study region with the strongest decreases reaching −20 %. The average decrease over Germany is between −5 % and −10 %. The criterion for robustness is fulfilled for most of the CE study area. The climate change signal can be regarded as statistically significant in most areas where the climate change signal is stronger than −5 %. Robustness and statistical significance decrease towards the east of the study area, in high mountain areas, and with proximity to the coasts. To increase confidence in the results, the number of models that predict a statistically significant change pointing in the opposite direction to the multi-model mean was counted. In the regions showing robust and statistically significant results, we detected only a few outliers, with counts varying between zero and one (not shown).
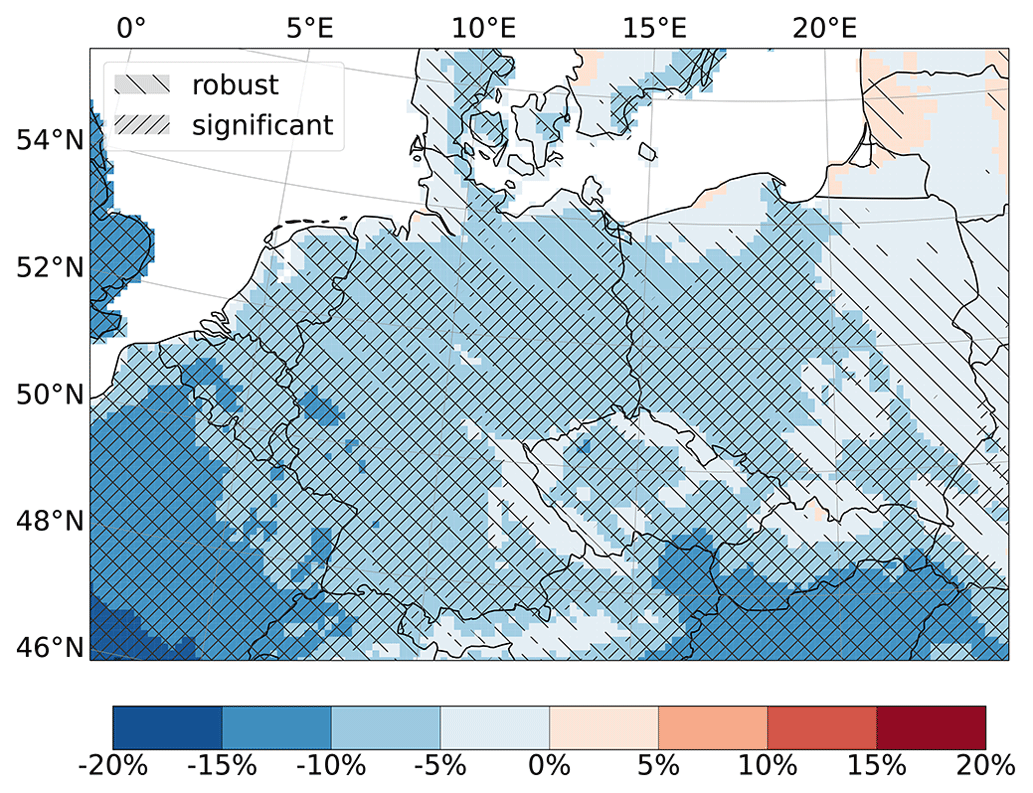
Figure 2Difference in per cent between the simulation periods 1971–2000 and 2071–2100 for the number of days showing a probability of rockfalls that is higher than the climatological probability. Hatching denotes regions for which the signal is statistically significant and/or robust.
Entangling the effects of the different variables on the overall climate signal shows that the strongest contribution is found for the number of freeze–thaw cycles, which is reduced in the climate scenario simulations by more than 50 % (Fig. 3). The precipitation sum is predicted to increase. In the long-term mean this gain is, however, compensated for by the increase in potential evapotranspiration. The number of days with precipitation exceeding the median for the historical period (using only days with precipitation) remains almost unchanged. The strongest precipitation increase is simulated by the model combination IPSL-IPSL-CM5A-MR IPSL-INERIS-WRF331F-v1. This is the only simulation predicting an area-mean increase in rockfall probability in the study region.
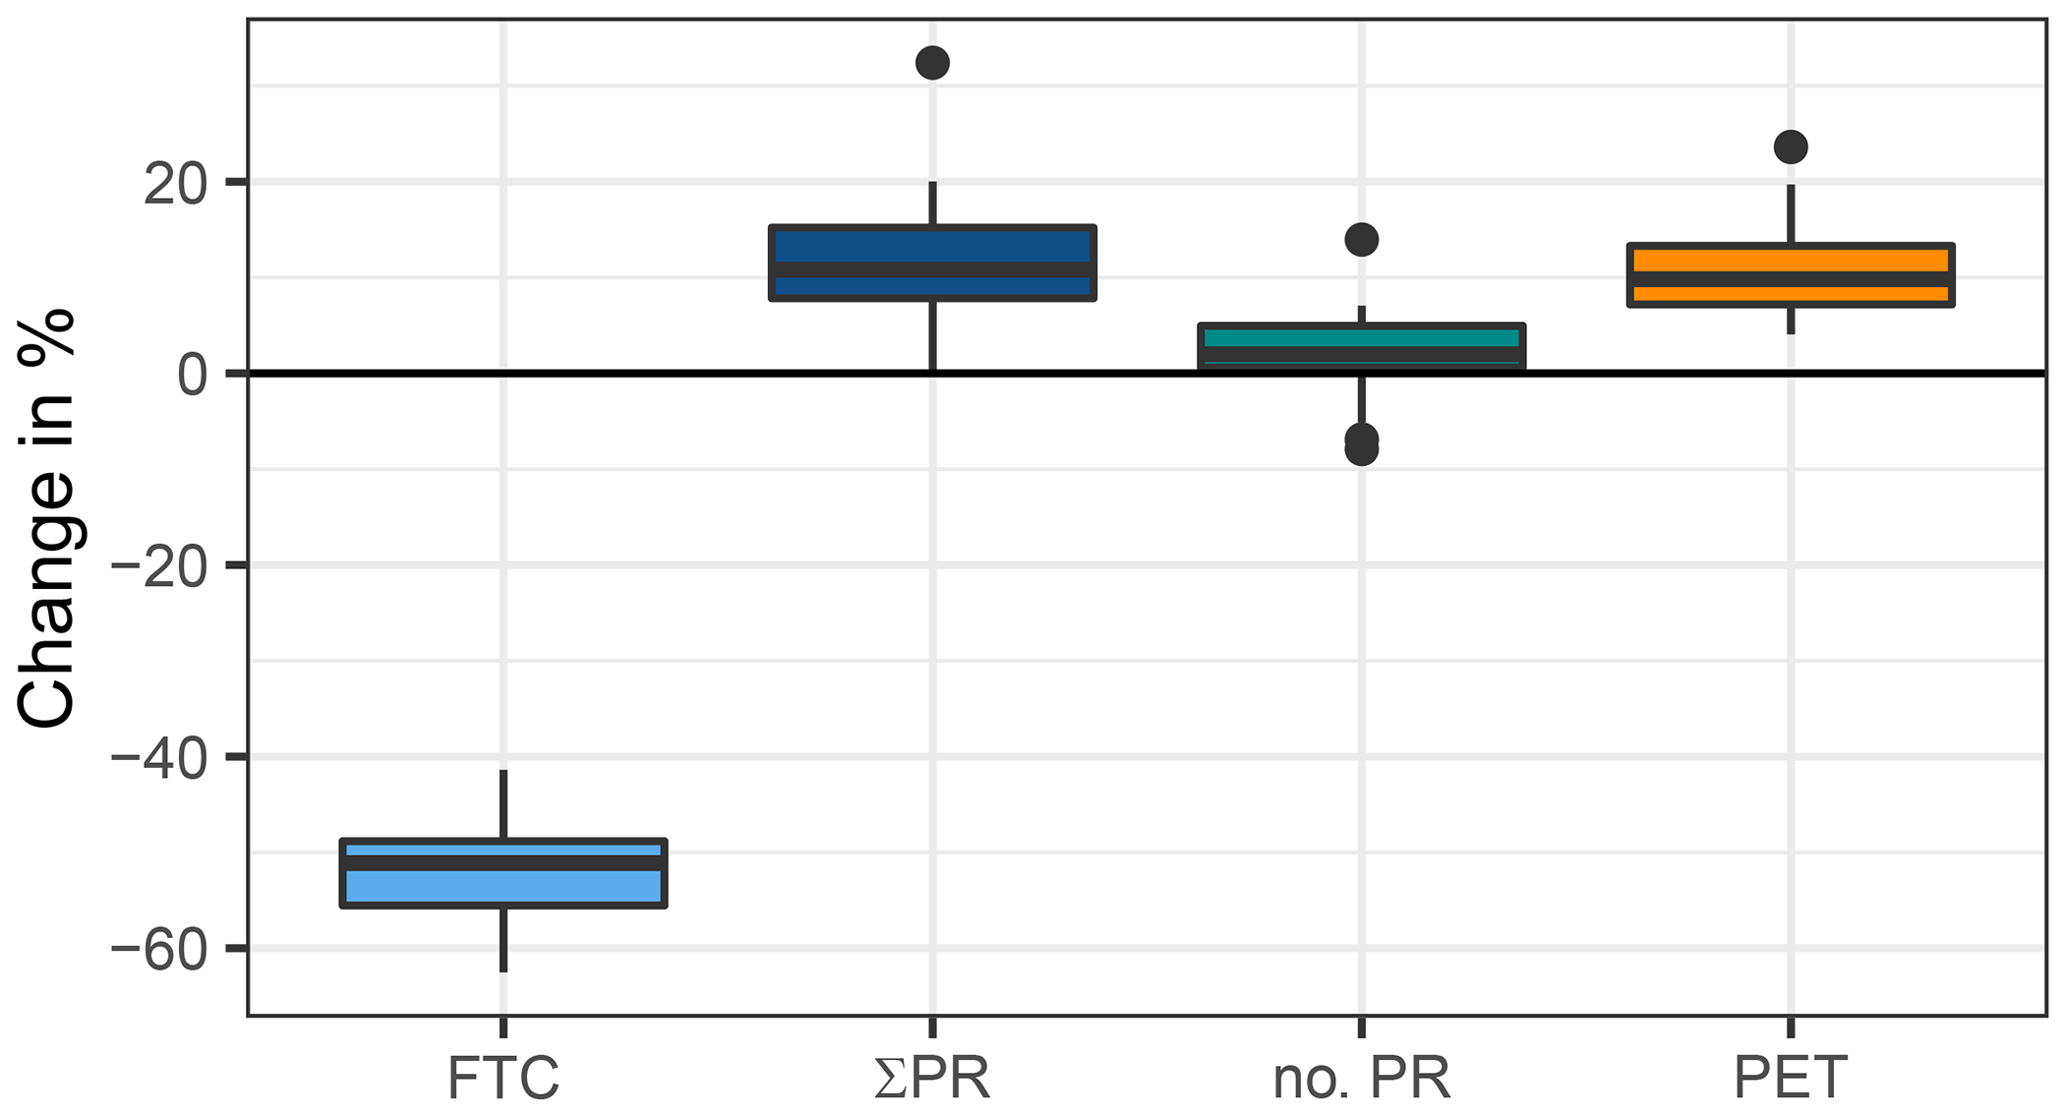
Figure 3Difference in per cent between the simulation periods 1971–2000 and 2071–2100. The boxplot shows the median and quartiles of the individual model simulations. Changes are shown for the number of transitions from freezing to thawing (FTC), the time mean of precipitation (∑PR), the number of days with precipitation higher than the median (no. PR), and the mean potential evapotranspiration (PET). Values are averaged over the region depicted in Fig. 2.
4.2 Large-scale weather patterns
Comparing GPH500 and m.s.l.p. anomalies as input variables for the SANDRA classification showed that GPH500 always performed better in terms of the three quality criteria defined in Sect. 3. Using the larger GE domain generally led to better results than using the smaller SE domain. Removing the rockfall days from the analysis that are the most dissimilar to the cluster centroids reduces the number of events in the relevant clusters but increases the ability of the classes to discriminate between favourable and unfavourable conditions. A good balance was achieved by grouping GPH500 anomalies in the greater European domain in 10 clusters and afterwards removing 20 % of the event days from each cluster. Four of the resulting clusters fulfil the criteria for a relevant weather pattern described in Sect. 3 (Fig. 4). A total of 34 % (88) of the events are contained in these four clusters, but the clusters occur on only 16 % of all days. The probability of the occurrence of a rockfall event is therefore increased by 106 % (between 78 % and 193 % in the individual classes).
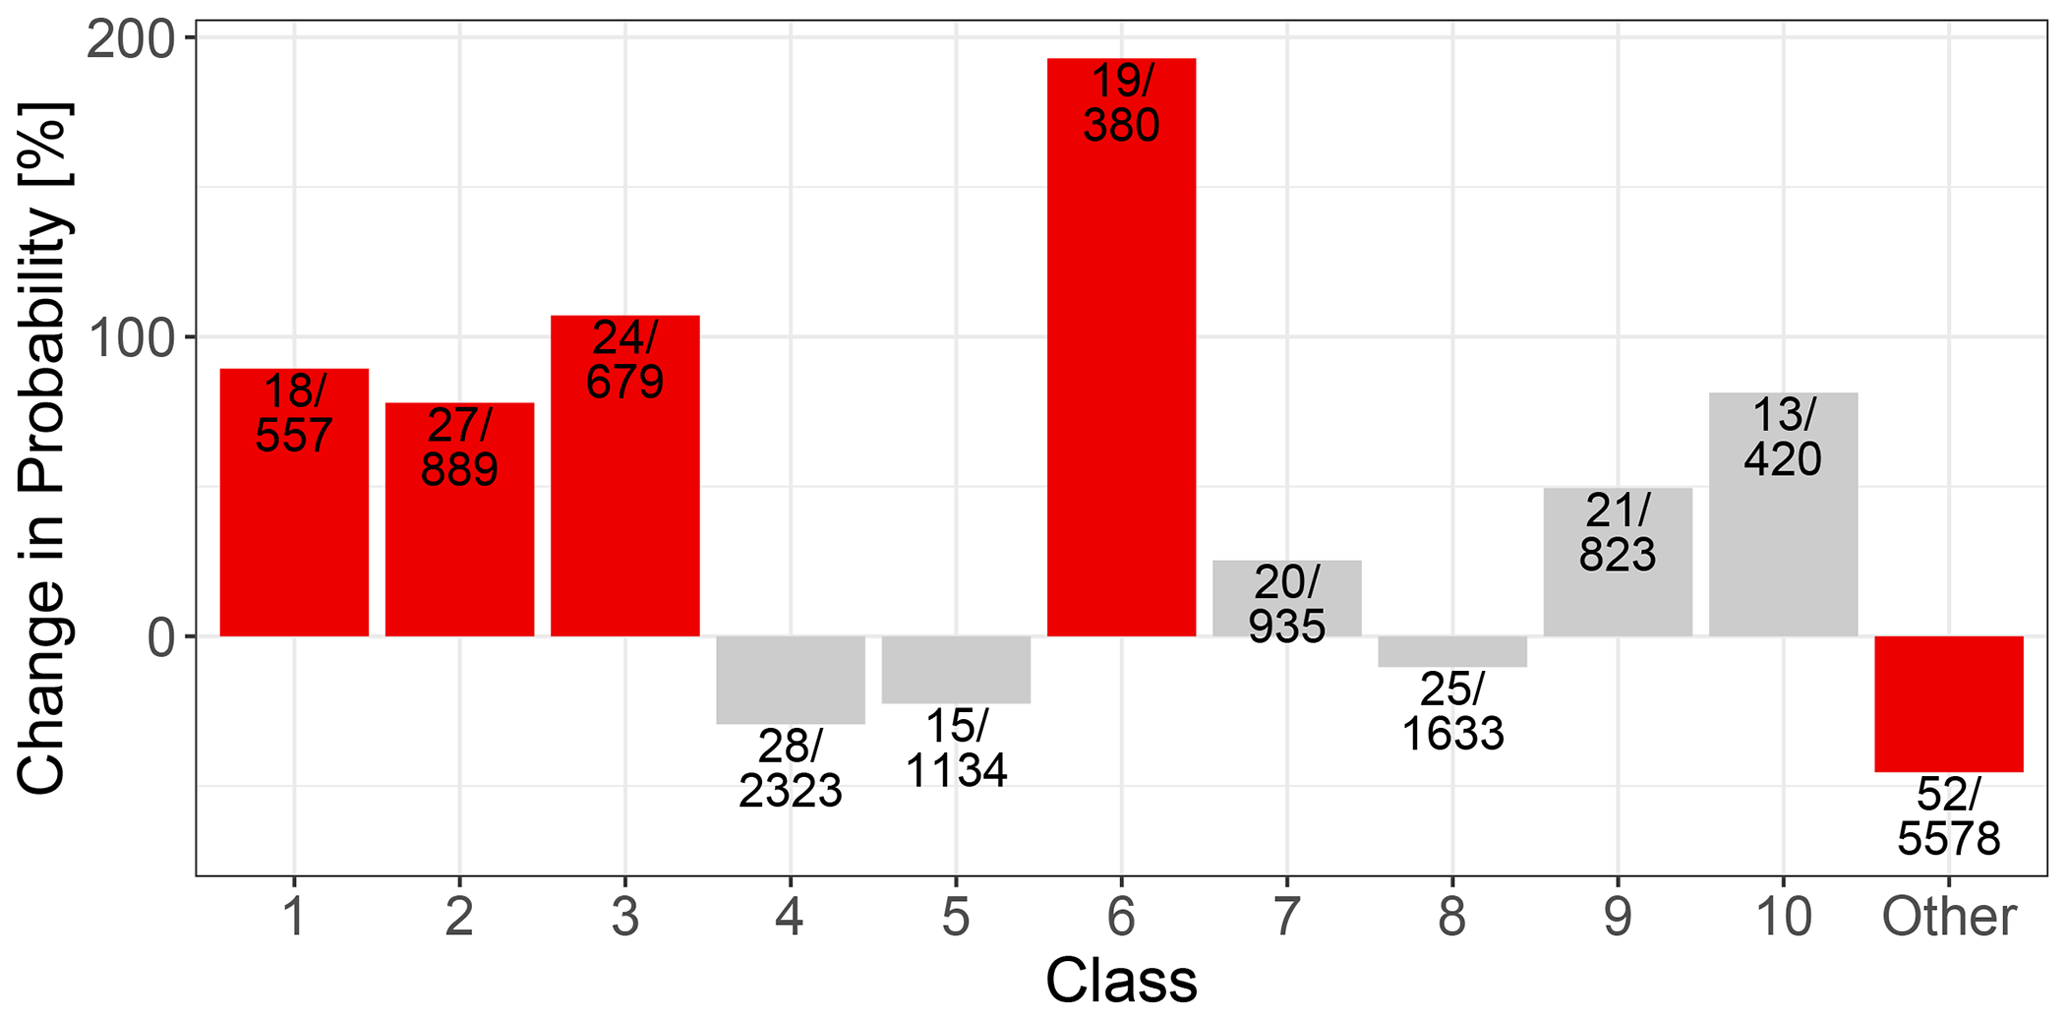
Figure 4Difference in per cent between the climatological rockfall probability and the probability within a class. A statistically significant difference from climatology is denoted by a red bar. The number of rockfall days and the total number of days for each class are given.
Composites over all days belonging to the relevant weather patterns are depicted in Fig. 5. Weather pattern 6, which exhibits the highest increase in rockfall probability, is characterised by an upper-air trough over Germany. Patterns 2 and 3 are associated with a trough over the eastern Atlantic and North Sea, respectively, while pattern 1 shows a wave structure with positive anomalies over Britain and negative anomalies over Eastern Europe. Patterns 2 and 3 are accompanied by high humidity over Germany. The seasonal cycle of the relevant weather patterns (Fig. 6) reveals that the frequency of all four patterns exhibits a minimum in summer. Patterns 1 and 2 occur most frequently in April (spring), while pattern 6 shows the highest frequency in February (winter). Pattern 3 mostly occurs between November and April. Consistent with the concentration of relevant weather patterns in the cold half of the year, the number of freeze–thaw cycles associated with them is higher than climatologically expected when taking the entire year into account (Y). Looking at individual months the number of freeze–thaw cycles does not show homogeneously high values for these patterns compared to other days during the cold half of the year. The relevance of patterns 1, 2, and 6 is therefore mostly explainable with the fact that they are associated with winter and spring conditions. Consistent with the positive moisture anomalies found for patterns 2 and 3 (Fig. 5), these patterns are also associated with positive annual-mean precipitation anomalies (Y). This anomaly is especially strong for pattern 3 that exhibits positive precipitation deviations from November to April.
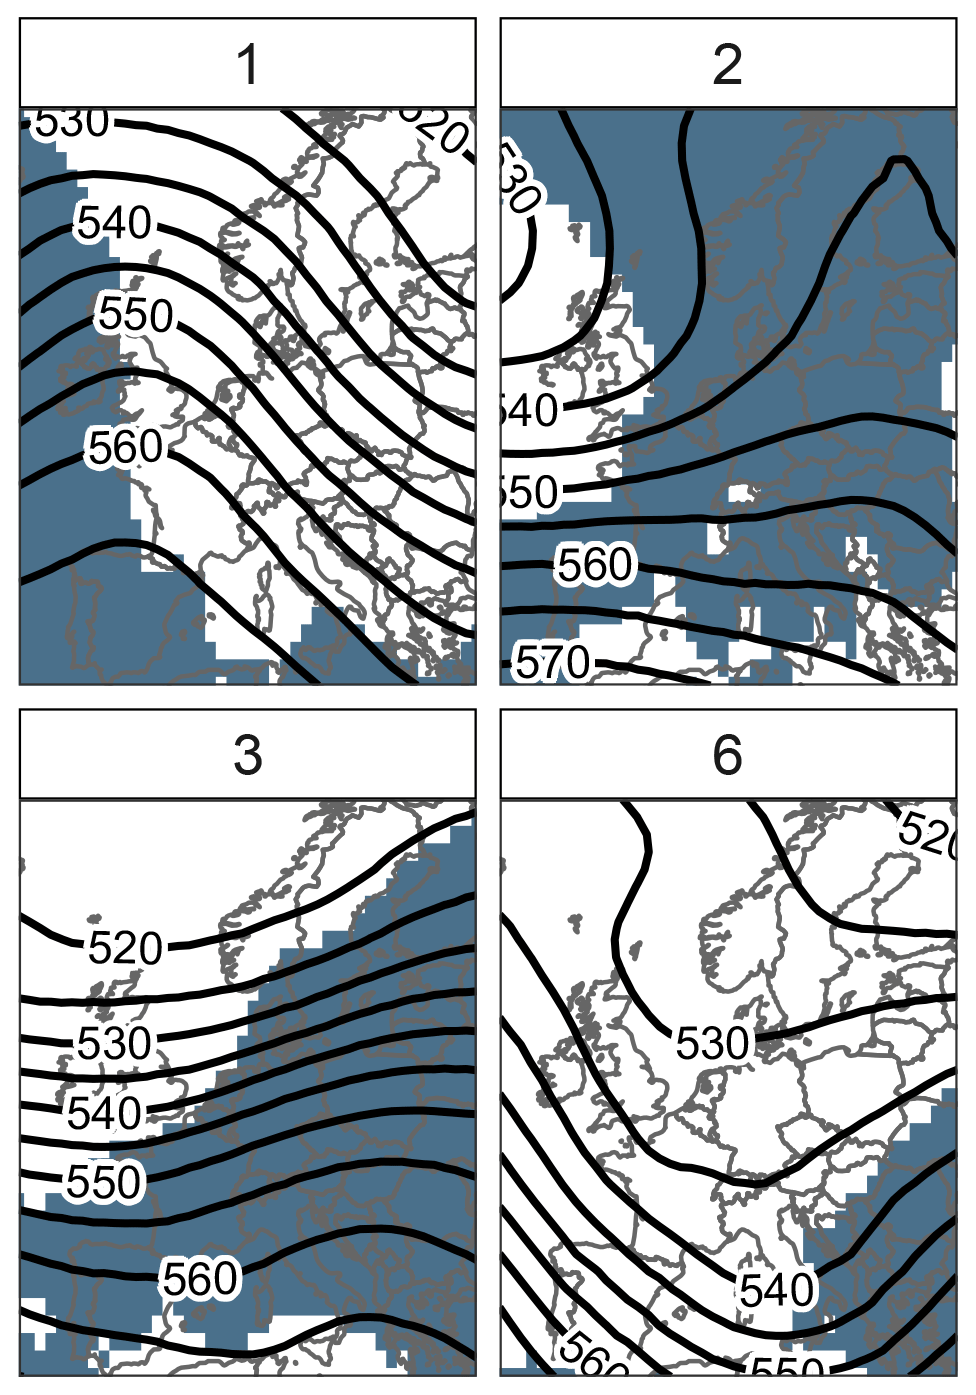
Figure 5Composites of 500 hPa geopotential height in decametre (isolines) and positive monthly moisture anomalies (shading) for the four classes exhibiting a statistically significant potential for rockfall (1, 2, 3, and 6).
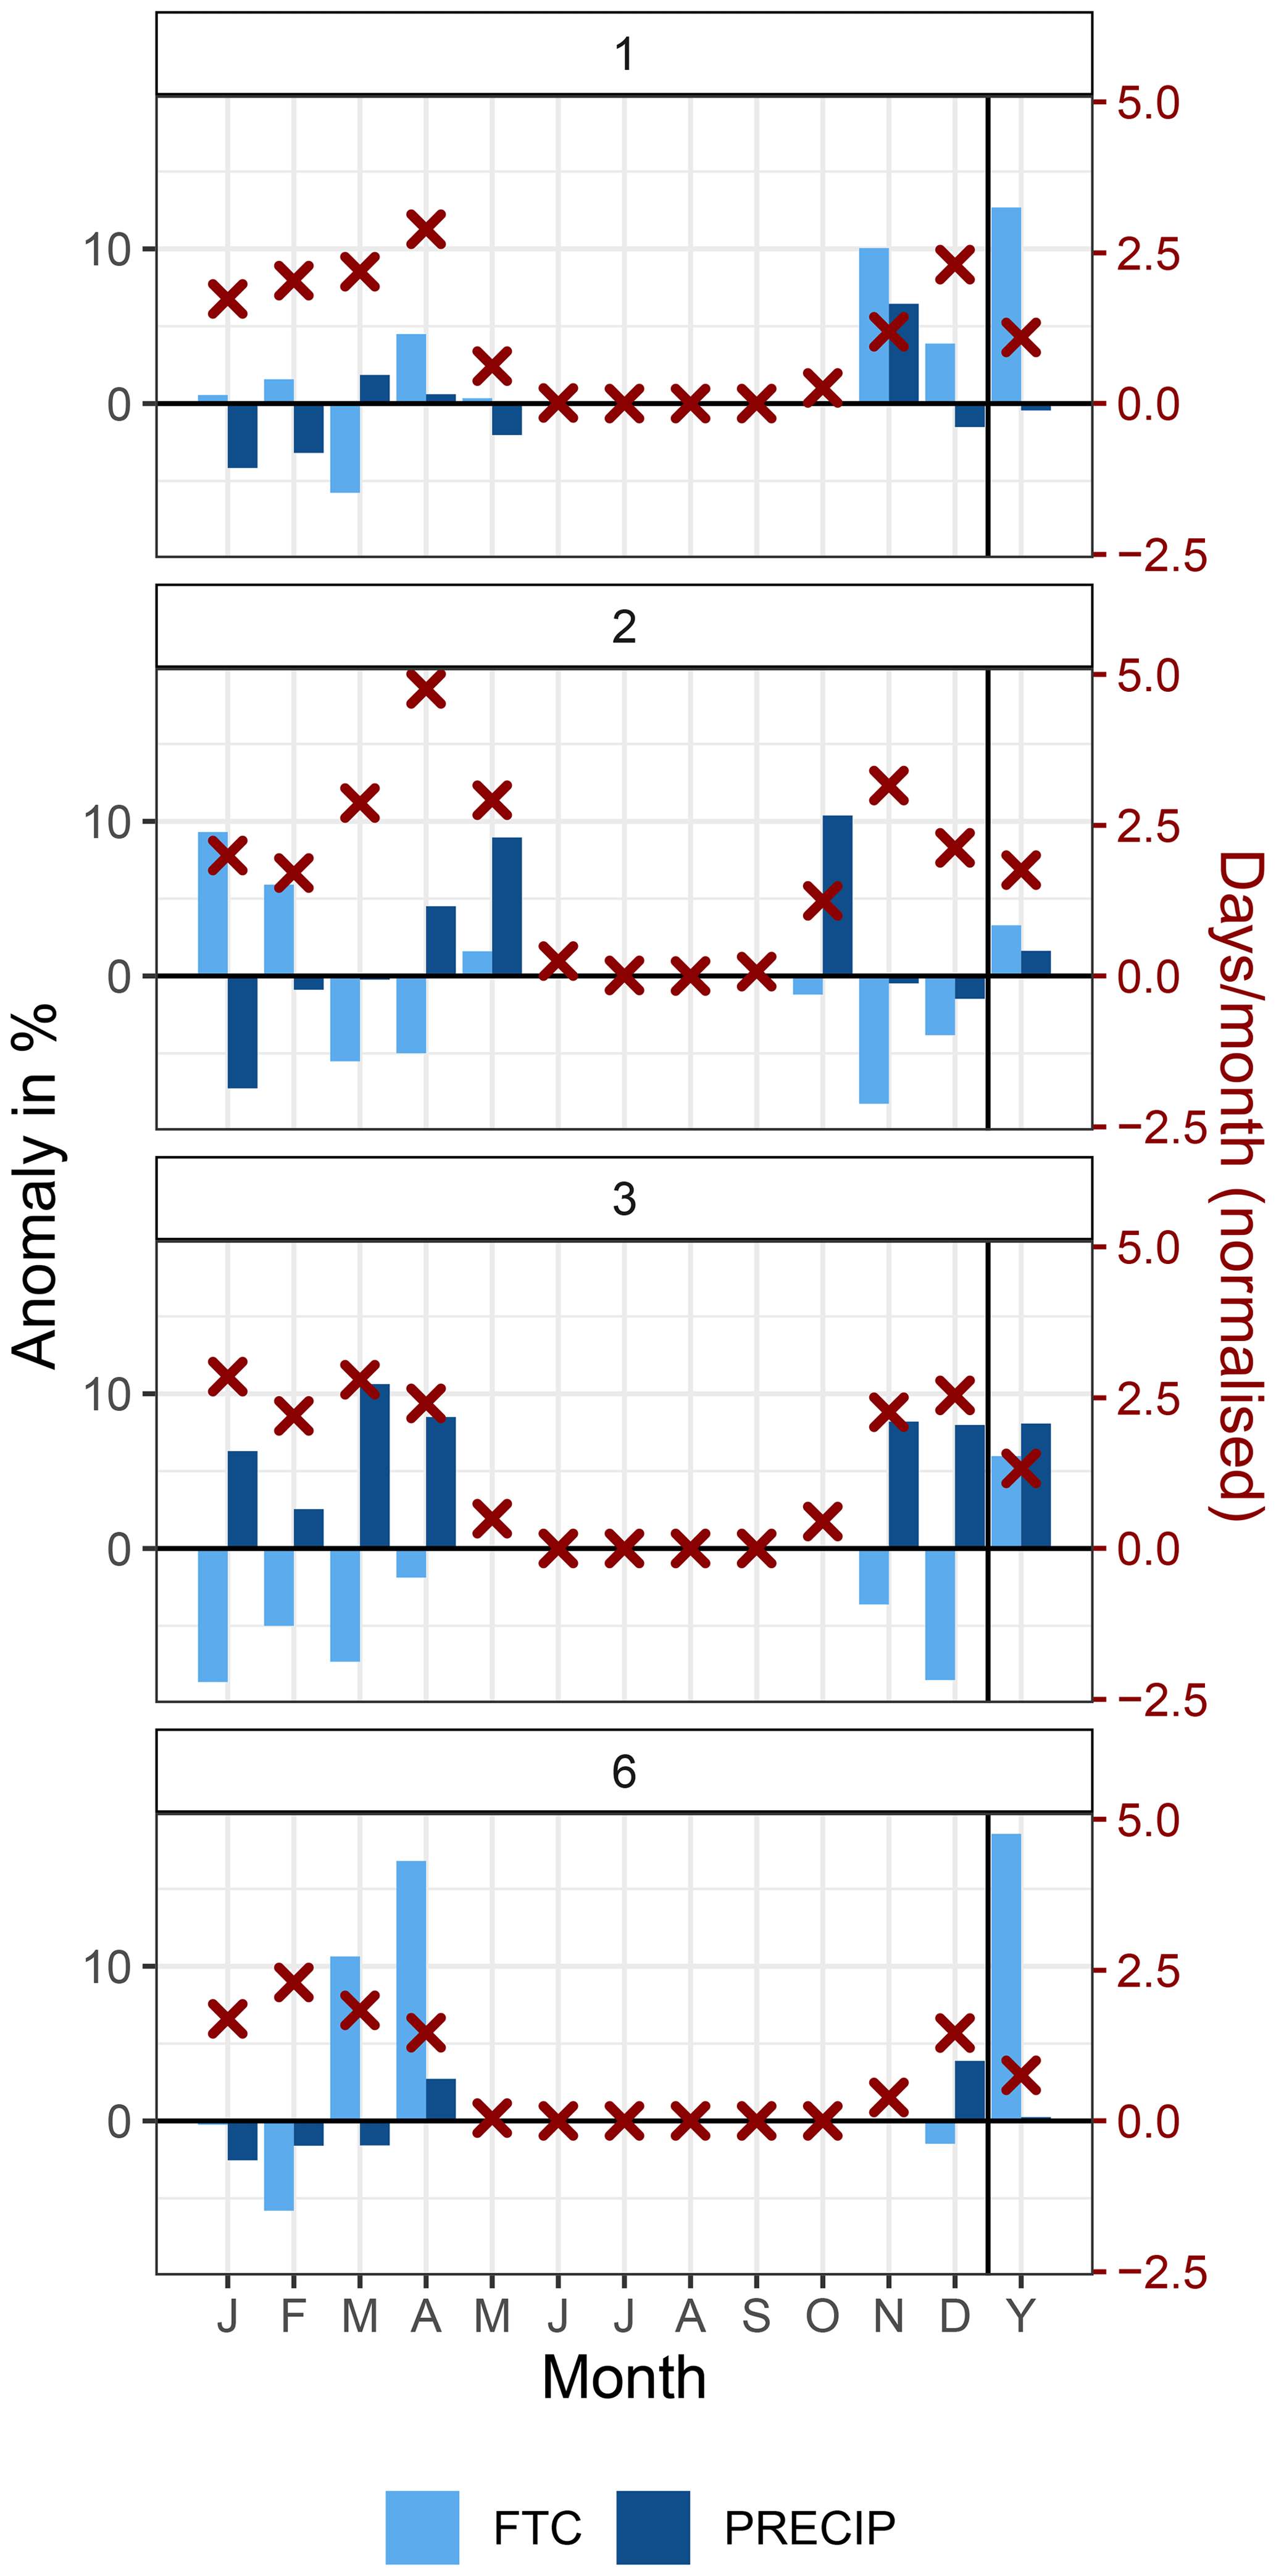
Figure 6Anomalies in the meteorological conditions at the rockfall sites on the days associated with the four large-scale weather patterns exhibiting a statistically significant potential for rockfalls. Shown are the percentage change compared to climatological conditions for the frequency of freeze–thaw cycles (FTC, light blue) and days with precipitation above the median (PRECIP, dark blue). The comparison is shown for the entire year (Y) and individual months. The red crosses denote the mean number of days per month for which the weather pattern was detected, normalised to a 30 d month.
The frequency of days associated with the relevant clusters does not show a statistically significant trend for the ERA5 period, as the variability in the number of days per year is too high for a significant signal (not shown). This is different when analysing the climate scenario simulations. After interpolating the simulated GPH500 anomalies in the GE region to the grid they were assigned to the clusters and counted. It turns out that the number of days per year in the relevant classes decreases over the scenario period in all simulations (Fig. 7). The trends for all simulations considered are statistically significant at the 5 % level.
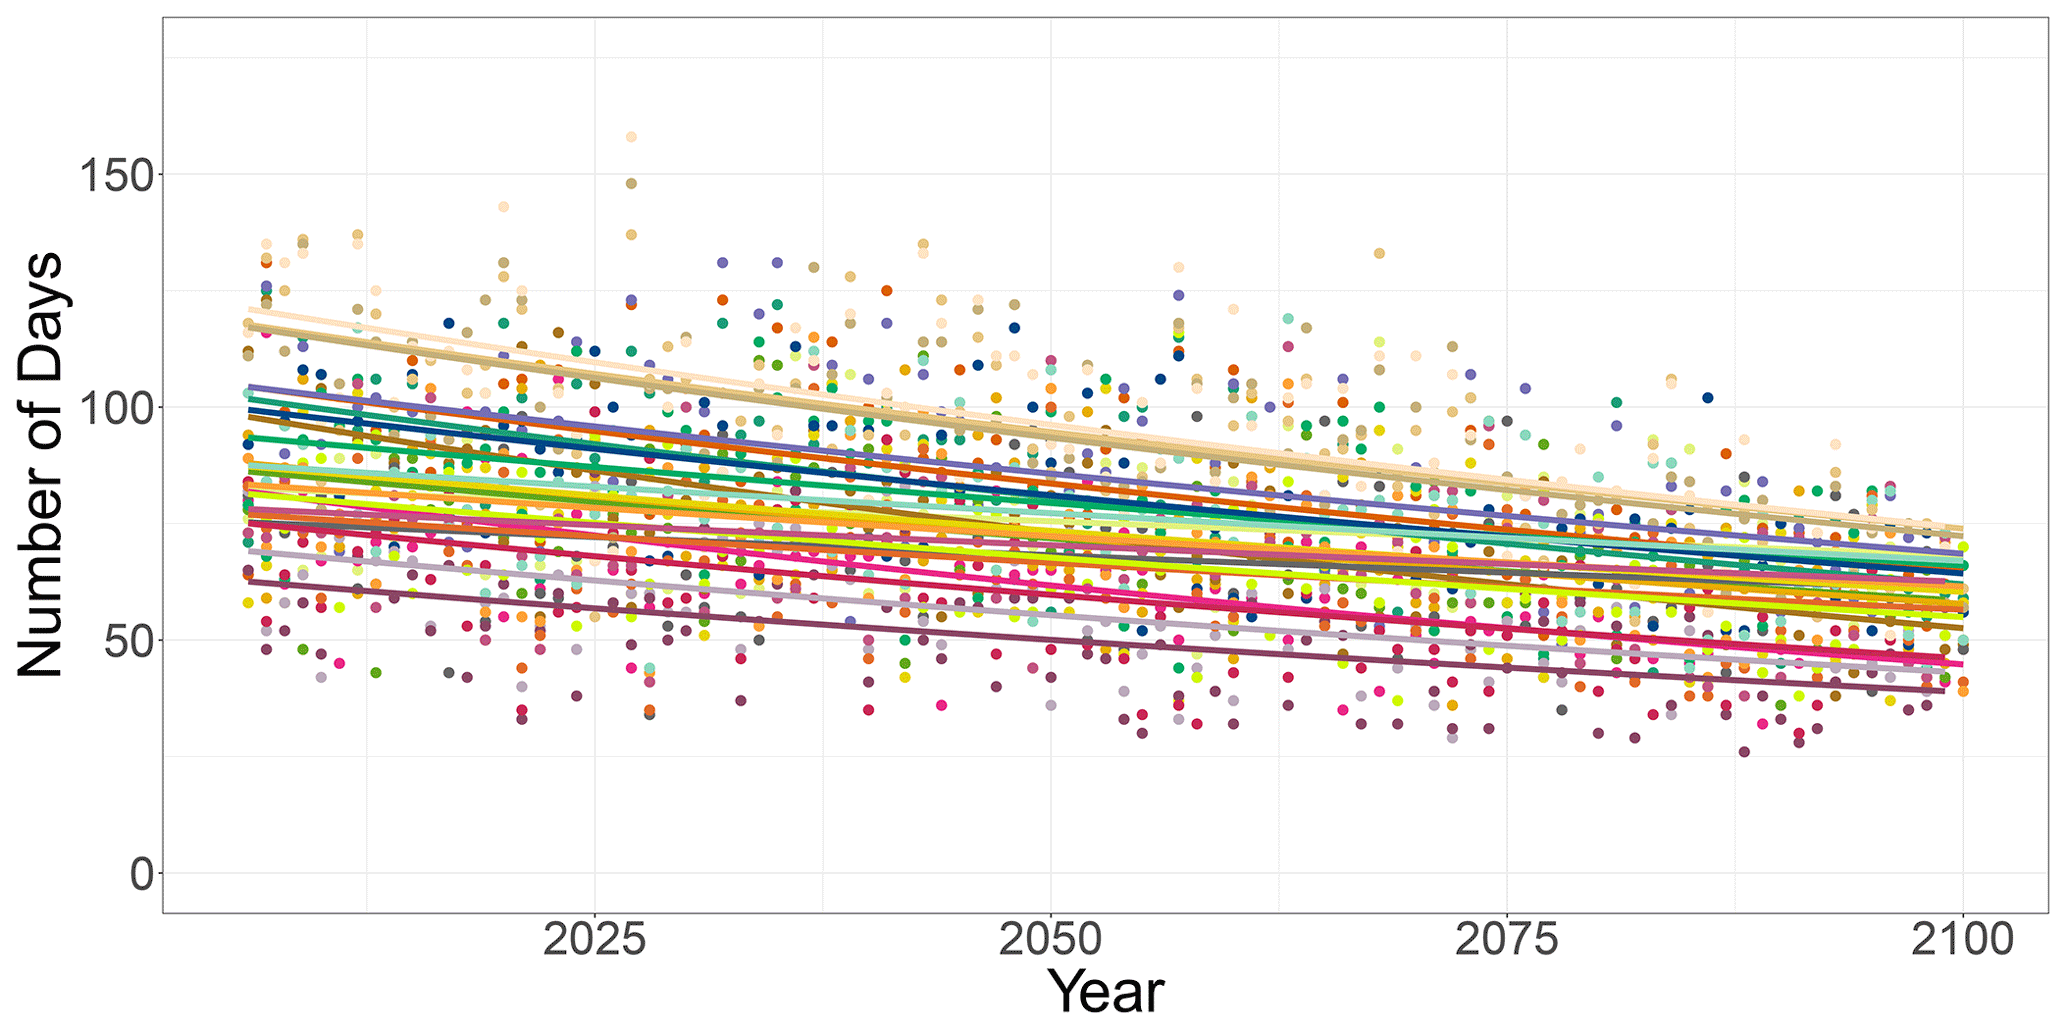
Figure 7Annual number of days associated with weather classes 1, 2, 3, and 6 in the RCP8.5 scenario simulations. The line indicates the trend determined with Poisson regression. A solid line indicates a statistically significant trend. Each colour represents a different model.
The analysis of meteorological influences and the possible impact of climate change on rockfalls and other mass movement types are difficult to assess (Crozier, 2010; Dijkstra and Dixon, 2010; Huggel et al., 2012; Gariano and Guzzetti, 2016). Among other things, this is due to the spatial–temporal inhomogeneity of rockfall datasets compared to the abundance and homogeneity of climate data. There is a general problem with historical rockfall data for which time and location need to be determined retrospectively. Moreover, supra-regional statements such as those made by the IPCC (IPCC, 2012, 2013) with respect to an increase in rockfall probability for the whole of Central Europe must be critically reviewed. In the context of the current climatic development in Central Europe, a general increase in process activity does not follow. Thereby, the distinction between regions with or without permafrost plays a particularly decisive role, as permafrost degradation under a rise in temperature causes rockwall instability that can lead to an increase in rockfall events (Gruber and Haeberli, 2007; Paranunzio et al., 2016; Ravanel and Deline, 2011; Viani et al., 2020). In contrast, a decrease in rockfall probability needs to be considered due to a potentially balancing effect of increased evapotranspiration from increased temperatures as well as temperature-driven changes in soil water regimes (Dehn and Buma, 1999; Collison et al., 2000). The statistical model applied in this study therefore considers the combined effect of precipitation, freeze–thaw cycles, and fissure water (Nissen et al., 2022). The model was developed for rockfall occurrences in the German lower mountain ranges, a study region that does not include areas with permafrost. In fact, the model predicts a decrease in rockfall probability under the investigated climate scenario conditions in the German lower mountain ranges. Determining the exact region for which the statistical model can be regarded as representative was beyond the scope of this study. We analysed an area notably larger than Germany, which illustrates that similar changes in the meteorological conditions affect the entire study area.
In a previous study we have shown that precipitation is the most effective triggering factor for rockfalls in the German lower mountain ranges (Nissen et al., 2022). Even though heavy precipitation is predicted to increase as a consequence of global warming (e.g. Jacob et al., 2014; Nissen and Ulbrich, 2017; Seneviratne et al., 2021), this effect is counterbalanced by an increase in evaporation. The strongest factor contributing to the decrease that was found in this study is the decrease in the number of freeze–thaw cycles associated with the overall warming trend in the atmosphere. The RCP8.5 scenario that was analysed in this study represents the upper end of the potential change and may not be the most realistic scenario (Hausfather and Peters, 2020). However, previous studies have shown that the two variables that drive the changes in rockfall probability in our study region, temperature and precipitation, change in the same direction and also exhibit similar spatial patterns in more moderate emission scenarios (Jacob et al., 2014; Nissen and Ulbrich, 2017). Future changes in rockfall probability may therefore turn out to be weaker than suggested by our study but can be expected to show the same sign and spatial distribution.
Large-scale weather patterns associated with a high probability of rockfall initialisation occur most frequently in winter and spring, which is in line with the seasonal cycle of rockfall itself (Rupp and Damm, 2020). The negative trend found with the logistic regression approach is confirmed by the decrease in the frequency of these patterns. For the identification of large-scale weather patterns, we only took the day of the event into account. Antecedent conditions, which also play a role (e.g. for the fissure water), were neglected in the weather-pattern approach. This simplification does not affect the overall result on the direction of the trend, which is dominated by the decrease in the number of cold-season patterns that are associated with the occurrence of freeze–thawing cycles. In combination, both approaches draw a consistent picture of the future trend in rockfall probability in the German lower mountain region under climate change conditions.
The application of a logistic regression model and the identification of rockfall-promoting large-scale weather patterns with input variables from climate scenario simulations enabled the analysis of rockfall probability under climate change conditions. Both methods suggest that rockfall probability decreases under RCP8.5 scenario conditions. The impact dataset that was used to establish the relationship between the meteorological variables and the events comprises rockfall data from the German lower mountain ranges, and the results should also be applicable for further low mountain regions with similar characteristics in Central Europe.
The chapter Climate Change Information for Regional Impact and for Risk Assessment of the last IPCC report (Ranasinghe et al., 2021) summarises the results of recent publications on the impact of climate change on landslides and rockfalls for various regions of the world. The review imparts the impression that climate change will increase landslide frequency almost everywhere, even though confidence in the results is ranked low. Considering studies on rockfalls in particular, it becomes apparent that most studies serving as a basis for the IPCC statement concentrate on high mountain areas, which are usually related to permafrost (Gruber and Haeberli, 2007; Ravanel and Deline, 2011, 2015). The few studies in lower mountain regions that analyse the influence of meteorological factors on rockfalls based on observations (Sass and Oberlechner, 2012; Mainieri et al., 2022) do not find any significant trends. This study has shown that for the subclass of rockfall events in the German low mountain ranges, climate change will most likely lead to a decrease in the probability of events.
This study is the first that investigates the influence of climate change on rockfalls in Germany. The analysis demonstrates the importance of considering all meteorological variables that influence rockfall probability together, as they are affected differently by climate change. The method used to describe the interplay of the different variables at different time lags is logistic regression. So far, this method has only been used for this purpose in the context of early warning systems (Abaker et al., 2021). Our study is the first to apply it to a multi-model ensemble of regional climate scenario simulations. The second method we apply in a new context is cluster analysis. The analysis is used to identify large-scale weather patterns associated with conditions that promote rockfalls. Projected changes in the frequency of these patterns are determined. Both methods proved useful to study the effect of climate change on rockfalls, and both have the potential to also be applied in other regions and for other types of mass movements such as landslides.
The SANDRA classification scheme is part of the COST733class software package and is available from COST Action 733 (2022) (https://git.rz.uni-augsburg.de/philipan/cost733class-1.4). The EURO-CORDEX simulations are available from https://esgf-data.dkrz.de (DKRZ, 2022). The ERA5 reanalysis dataset is available from Hersbach et al. (2018). The E-OBS dataset can be downloaded from https://www.ecad.eu/download/ensembles/ensembles.php (ECA&D, 2018). REGNIE is available from http://opendata.dwd.de/climate_environment/CDC/grids_germany/daily/regnie/ (DWD CDC, 2013). Information on the rockfall events can be found in the supporting material of Rupp and Damm (2020).
KMN: conceptualisation, methodology, formal analysis, investigation, data curation, writing (original draft as well as review and editing), visualisation. MW: investigation, writing (original draft as well as review and editing). TMK: investigation, writing (original draft as well as review and editing). AW: writing (original draft), visualisation. BD: investigation, resources, writing (review and editing), supervision, project administration, funding acquisition. UU: writing (review and editing), supervision, project administration, funding acquisition.
At least one of the (co-)authors is a member of the editorial board of Natural Hazards and Earth System Sciences. The peer-review process was guided by an independent editor, and the authors also have no other competing interests to declare.
Publisher's note: Copernicus Publications remains neutral with regard to jurisdictional claims in published maps and institutional affiliations.
This article is part of the special issue “Past and future European atmospheric extreme events under climate change”. It is not associated with a conference.
The work used resources of the Deutsches Klimarechenzentrum (DKRZ) granted by its Scientific Steering Committee (WLA) under project IDs b1152 and bm1159. We acknowledge the ERA5, E-OBS, REGNIE, and EURO-CORDEX datasets. We thank the two anonymous reviewers and our editor for their constructive comments.
This research has been supported by the Bundesministerium für Bildung und Forschung (project climXtreme, grant nos. 01LP1903A and 01LP1903K).
We acknowledge support from the Open Access Publication Initiative of Freie Universität Berlin.
This paper was edited by Andreas Hense and reviewed by two anonymous referees.
Abaker, M., Abdelmaboud, A., Osman, M., Alghobiri, M., and Abdelmotlab, A.: A Rock-fall Early Warning System Based on Logistic Regression Model, Intel. Automat. Soft Comput., 28, 843–856, https://doi.org/10.32604/iasc.2021.017714, 2021. a
Allen, S. and Huggel, C.: Extremely warm temperatures as a potential cause of recent high mountain rockfall, Global Planet. Change, 107, 59–69, https://doi.org/10.1016/j.gloplacha.2013.04.007, 2013. a
Christensen, O. B., Christensen, J. H., Machenhauer, B., and Botzet, M.: Very high-resolution regional climate simulations over Scandinavia – Present climate, J. Climate, 11, 3204–3229, 1998. a, b
Collison, A., Wade, S., Griffiths, J., and Dehn, M.: Modelling the impact of predicted climate change on landslide frequency and magnitude in SE England, Eng. Geol., 55, 205–218, https://doi.org/10.1016/S0013-7952(99)00121-0, 2000. a, b
Cornes, R., van der Schrier, G., van den Besselaar, E. J. M., and Jones, P. D.: An ensemble version of the E-OBS temperature and precipitation data sets., J. Geophys. Res.-Atmos, 123, 9391–9409, https://doi.org/10.1029/2017JD028200, 2018. a
COST Action 733: Cost733class software for classification of atmospheric circulation, University of Augsburg [code], https://git.rz.uni-augsburg.de/philipan/cost733class-1.4 (last access: 6 July 2022), 2022. a
Crozier, M.: Deciphering the effect of climate change on landslide activity: A review, Geomorphology, 124, 260–267, https://doi.org/10.1016/j.geomorph.2010.04.009, 2010. a
Cruden, D. M. and Varnes, D. J.: Landslide Types and Processes, Transportation Research Board, Washington, DC, 36–75, https://onlinepubs.trb.org/Onlinepubs/sr/sr29-004.pdf (last access: 28 August 2022), 1996. a, b
Damm, B. and Klose, M.: The landslide database for Germany: Closing the gap at national level, Geomorphology, 249, 82–93, https://doi.org/10.1016/j.geomorph.2015.03.021, 2015. a
Dehn, M. and Buma, J.: Modelling future landslide activity based on general circulation models, Geomorphology, 30, 175–187, https://doi.org/10.1016/S0169-555X(99)00053-7, 1999. a, b
Dijkstra, T. A. and Dixon, N.: Climate change and slope stability in the UK: challenges and approaches, Quart. J. Eng. Geol. Hydrogeol., 43, 371–385, https://doi.org/10.1144/1470-9236/09-036, 2010. a
DKRZ – Deutsches Klimarechenzentrum: Earth System Grid Federation (ESGF) climate data server, https://esgf-data.dkrz.de (last access: 18 July 2022), 2022. a
Dorren, L. K. A.: A review of rockfall mechanics and modelling approaches, Prog. Phys. Geogr., 27, 69–87, https://doi.org/10.1191/0309133303pp359ra, 2003. a
Droogers, P. and Allen, R. G.: Estimating Reference Evapotranspiration Under Inaccurate Data Conditions, Irrig. Drain. Syst., 16, 33–45, 2002. a
DWD CDC – Climate Data Center: REGNIE grids of daily precipitation, DWD CDC [data set], https://opendata.dwd.de/climate_environment/CDC/grids_germany/daily/regnie/ (last access: 13 August 2021), 2013. a
ECA&D – European Climate Assessment and Dataset: E-OBS gridded dataset, https://www.ecad.eu/download/ensembles/ensembles.php (last access: 10 March 2022), 2018. a
Froude, M. J. and Petley, D. N.: Global fatal landslide occurrence from 2004 to 2016, Nat. Hazards Earth Syst. Sci., 18, 2161–2181, https://doi.org/10.5194/nhess-18-2161-2018, 2018. a
Gariano, S. L. and Guzzetti, F.: Landslides in a changing climate, Earth-Sci. Rev., 162, 227–252, https://doi.org/10.1016/j.earscirev.2016.08.011, 2016. a, b
Gruber, S. and Haeberli, W.: Permafrost in steep bedrock slopes and its temperature-related destabilization following climate change, J. Geophys. Res., 112, F02S18, https://doi.org/10.1029/2006jf000547, 2007. a, b, c
Haque, U., da Silva, P. F., Devoli, G., Pilz, J., Zhao, B., Khaloua, A., Wilopo, W., Andersen, P., Lu, P., Lee, J., Yamamoto, T., Keellings, D., Wu, J.-H., and Glass, G. E.: The human cost of global warming: Deadly landslides and their triggers (1995–2014), Sci. Total Environ., 682, 673–684, https://doi.org/10.1016/j.scitotenv.2019.03.415, 2019. a
Hargreaves, G. H.: Defining and using reference evapotranspiration, Irrig. Drain. Eng., 120, 1132–1139, https://doi.org/10.1061/(ASCE)0733-9437(1994)120:6(1132), 1994. a
Hausfather, Z. and Peters, G. P.: Emissions – the `business as usual' story is misleading, Nature, 577, 618–620, https://doi.org/10.1038/d41586-020-00177-3, 2020. a
Hersbach, H., Bell, B., Berrisford, P., Biavati, G., Horányi, A., Muñoz Sabater, J., Nicolas, J., Peubey, C., Radu, R., Rozum, I., Schepers, D., Simmons, A., Soci, C., Dee, D., and Thépaut, J.: ERA5 hourly data on single levels from 1959 to present, CDS [data set], https://doi.org/10.24381/cds.adbb2d47, 2018. a
Hersbach, H., Bell, B., Berrisford, P., Hirahara, S., Horányi, A., Muñoz-Sabater, J., Nicolas, J., Peubey, C., Radu, R., Schepers, D., Simmons, A., Soci, C., Abdalla, S., Abellan, X., Balsamo, G., Bechtold, P., Biavati, G., Bidlot, J., Bonavita, M., De Chiara, G., Dahlgren, P., Dee, D., Diamantakis, M., Dragani, R., Flemming, J., Forbes, R., Fuentes, M., Geer, A., Haimberger, L., Healy, S., Hogan, R. J., Hólm, E., Janisková, M., Keeley, S., Laloyaux, P., Lopez, P., Lupu, C., Radnoti, G., de Rosnay, P., Rozum, I., Vamborg, F., Villaume, S., and Thépaut, J.: The ERA5 global reanalysis, Q. J. Roy. Meteorol. Soc., 146, 1999–2049, https://doi.org/10.1002/qj.3803, 2020. a
Highland, L. and Bobrowsky, P.: The Landslide Handbook – A Guide to Understanding Landslides, vol. US Geological Survey Circular 1325, US Geological Survey, Reston, Virginia, USA, https://doi.org/10.3133/cir1325, 2008. a
Huggel, C., Clague, J. J., and Korup, O.: Is climate change responsible for changing landslide activity in high mountains?, Earth Surf. Proc. Land., 37, 77–91, https://doi.org/10.1002/esp.2223, 2012. a
Hungr, O., Leroueil, S., and Picarelli, L.: The Varnes classification of landslide types, an update, Landslides, 11, 167–194, https://doi.org/10.1007/s10346-013-0436-y, 2014. a, b
IPCC: Climate Change 2007: Impacts, Adaptation and Vulnerability, Cambridge University Press, Cambridge, UK, ISBN 978052188010-7, 2007. a
IPCC: Managing the Risks of Extreme Events and Disasters to Advance Climate Change Adaptation, Cambridge University Press, Cambridge, UK and New York, NY, USA, https://doi.org/10.1017/CBO9781139177245, 2012. a, b
IPCC: Climate Change 2013: The Physical Science Basis, Cambridge University Press, Cambridge, UK and New York, NY, USA, https://doi.org/10.1017/CBO9781107415324, 2013. a, b
IPCC: Climate Change 2021: The Physical Science Basis, in: Contribution of Working Group I to the Sixth Assessment Report of the Intergovernmental Panel on Climate Change, Cambridge University Press, Cambridge, UK and New York, NY, USA, https://doi.org/10.1017/9781009157896, in press, 2021. a
Jacob, D., Elizalde, A., Haensler, A., Hagemann, S., Kumar, P., Podzun, R., Rechid, D., Remedio, A. R., Saeed, F., Sieck, K., Teichmann, C., and Wilhelm, C.: Assessing the Transferability of the Regional Climate Model REMO to Different COordinated Regional Climate Downscaling EXperiment (CORDEX) Regions, Atmosphere, 3, 181–199, https://doi.org/10.3390/atmos3010181, 2012. a, b, c
Jacob, D., Petersen, J., Eggert, B., Alias, A., Christensen, O. B., Bouwer, L., Braun, A., Colette, A., Déqué, M., Georgievski, G., Georgopoulou, E., Gobiet, A., Menut, L., Nikulin, G., Haensler, A., Hempelmann, N., Jones, C., Keuler, K., Kovats, S., Kröner, N., Kotlarski, S., Kriegsmann, A., Martin, E., Meijgaard, E., Moseley, C., Pfeifer, S., Preuschmann, S., Radermacher, C., Radtke, K., Rechid, D., Rounsevell, M., P. Samuelsson, P., Somot, S., Soussana, J., Teichmann, C., Valentini, R., Vautard, R., Weber, B., and Yiou, P.: EURO-CORDEX: new high-resolution climate change projections for European impact research, Reg. Environ. Change, 14, 563–578, https://doi.org/10.1007/s10113-013-0499-2, 2014. a, b, c, d
Jemec Auflič, M., Bokal, G., Kumelj, V., Medved, A., Dolinar, M., and Jež, J.: Impact of climate change on landslides in Slovenia in the mid-21st century, Geologija, 64, 159–171, https://doi.org/10.5474/geologija.2021.009, 2021. a
Kadow, C., Illing, S., Lucio-Eceiza, E. E., Bergemann, M., Ramadoss, M., Sommer, P. S., Kunst, O., Schartner, T., Pankatz, K., Grieger, J., Schuster, M., Richling, A., Thiemann, H., Kirchner, I., Rust, H. W., Ludwig, T., Cubasch, U., and Ulbrich, U.: Introduction to Freva – A Free Evaluation System Framework for Earth System Modeling, J. Open Res. Softw., 9, 13, https://doi.org/10.5334/jors.253, 2021. a
Kirschbaum, D., Stanley, T., and Zhou, Y.: Spatial and temporal analysis of a global landslide catalog, Geomorphology, 249, 4–15, https://doi.org/10.1016/j.geomorph.2015.03.016, 2015. a
Klose, M., Damm, B., and Highland, L. M.: Databases in geohazard science: An introduction, Geomorphology, 249, 1–3, https://doi.org/10.1016/j.geomorph.2015.06.029, 2015. a
Kupiainen, M., Samuelsson, P., Jones, C., Jansson, C., Willén, U., Hansson, U., Ullerstig, A., Wang, S., and Döscher, R.: The surface processes of the Rossby Centre regional atmospheric climate model (RCA4), Report 157, SMHI – Swedish Meteorological and Hydrological Institute, Norrköping, Sweden, https://www.smhi.se/en/publications/the-surface-processes-of-the-rossby-centreregional-atmospheric (last access: 17 June 2022), 2015. a, b, c, d, e
Luque-Espinar, J. A., Mateos, R. M., García-Moreno, I., Pardo-Igúzquiza, E., and Herrera, G.: Spectral analysis of climate cycles to predict rainfall induced landslides in the western Mediterranean (Majorca, Spain), Nat. Hazards, 89, 985–1007, https://doi.org/10.1007/s11069-017-3003-3, 2017. a
Mainieri, R., Eckert, N., Corona, C., Lopez-Saez, J., Stoffel, M., and Bourrier, F.: Limited impacts of global warming on rockfall activity at low elevations: Insights from two calcareous cliffs from the French Prealps, Prog. Phys. Geogr., 47, 50–73, https://doi.org/10.1177/03091333221107624, 2022. a, b
Messeri, A., Morabito, M., Messeri, G., Brandani, G., Petralli, M., Natali, F., Grifoni, D., Crisci, A., Gensini, G., and Orlandinik, S.: Weather-Related Flood and Landslide Damage: A Risk Index for Italian Regions, PLoS One, 10, e0144468, https://doi.org/10.1371/journal.pone.0144468, 2015. a
Nissen, K. M. and Ulbrich, U.: Increasing frequencies and changing characteristics of heavy precipitation events threatening infrastructure in Europe under climate change, Nat. Hazards Earth Syst. Sci., 17,, 1177–1190, https://doi.org/10.5194/nhess-17-1177-2017, 2017. a, b
Nissen, K. M., Rupp, S., Kreuzer, T. M., Guse, B., Damm, B., and Ulbrich, U.: Quantification of meteorological conditions for rockfall triggers in Germany, Nat. Hazards Earth Syst. Sci., 22, 2117–2130, https://doi.org/10.5194/nhess-22-2117-2022, 2022. a, b, c, d, e, f
Paranunzio, R., Laio, F., Chiarle, M., Nigrelli, G., and Guzzetti, F.: Climate anomalies associated with the occurrence of rockfalls at high-elevation in the Italian Alps, Nat. Hazards Earth Syst. Sci., 16, 2085–2106, https://doi.org/10.5194/nhess-16-2085-2016, 2016. a
Philipp, A., Della-Marta, P. M., Jacobeit, J., Fereday, D. R., Jones, P. D., Moberg, A., and Wanner, H.: Long-Term Variability of Daily North Atlantic–European Pressure Patterns since 1850 Classified by Simulated Annealing Clustering, J. Climate, 20, 4065–4095, https://doi.org/10.1175/JCLI4175.1, 2007. a
Ranasinghe, R. A. C. R., Vautard, R., Arnell, N., Coppola, E., Cruz, F. A., Dessai, S., Islam, A. S., Rahimi, M., Ruiz Carrascal, D., Sillmann, J., Sylla, M. B., Tebaldi, C., Wang, W., and Zaaboul, R.: Climate Change Information for Regional Impact and for Risk Assessment, Cambridge University Press, Cambridge, UKand New York, NY, USA, 1767–1926, https://doi.org/10.1017/9781009157896.014, 2021. a
Rauthe, M., Steiner, H., Riediger, U., Mazurkiewicz, A., and Gratzki, A.: A Central European precipitation climatology – Part I: Generation and validation of a high-resolution gridded daily data set (HYRAS), Meteorol. Z., 22, 235–256, https://doi.org/10.1127/0941-2948/2013/0436, 2013. a
Ravanel, L. and Deline, P.: Climate influence on rockfalls in high-Alpine steep rockwalls: The north side of the Aiguilles de Chamonix (Mont Blanc massif) since the end of the `Little Ice Age', Holocene, 21, 357–365, https://doi.org/10.1177/0959683610374887, 2011. a, b, c
Ravanel, L. and Deline, P.: Rockfall Hazard in the Mont Blanc Massif Increased by the Current Atmospheric Warming, in: Volume 1, Engineering Geology for Society and Territory, 425–428, https://doi.org/10.1007/978-3-319-09300-0_81, 2015. a, b, c
Rockel, B., Will, A., and Hense, A.: The Regional Climate Model COSMO-CLM (CCLM), Meteorol. Z., 17, 347–348, https://doi.org/10.1127/0941-2948/2008/0309, 2008. a, b, c, d, e, f
Rupp, S. and Damm, B.: A national rockfall dataset as a tool for analysing the spatial and temporal rockfall occurrence in Germany, Earth Surf. Proc. Land., 45, 1528–1538, https://doi.org/10.1002/esp.4827, 2020. a, b, c
Sass, O. and Oberlechner, M.: Is climate change causing increased rockfall frequency in Austria?, Nat. Hazards Earth Syst. Sci., 12, 3209–3216, https://doi.org/10.5194/nhess-12-3209-2012, 2012. a, b, c
Schlögl, M. and Matulla, C.: Potential future exposure of European land transport infrastructure to rainfall-induced landslides throughout the 21st century, Nat. Hazards Earth Syst. Sci., 18, 1121–1132, https://doi.org/10.5194/nhess-18-1121-2018, 2018. a
Selby, M. J. (Ed.): Hillslope materials and processes, Oxford University Press, New York, ISBN 9780198741831, 1993. a
Seneviratne, S. I., Zhang, X., Adnan, M., Badi, W., Dereczynski, C., Di Luca, A., Ghosh, S., Iskandar, I., Kossin, J., Lewis, S., Otto, F., Pinto, I., Satoh, M., Vicente-Serrano, S. M., Wehner, M., and Zhou, B.: Weather and Climate Extreme Events in a Changing Climate, Cambridge University Press, Cambridge, UK and New York, NY, USA, 1513–1766, https://doi.org/10.1017/9781009157896.013, 2021. a
Skamarock, W. C., Klemp, J. B., Dudhia, J., Gill, D., Barker, D., Duda, M. G., Huang, X., Wang, W., and Powers, J. G.: A Description of the Advanced Research WRF Version 3, Report NCAR/TN-475+STRK, University Corporation for Atmospheric Research, https://doi.org/10.5065/D68S4MVH, 2008. a
Stoffel, M., Tiranti, D., and Huggel, C.: Climate change impacts on mass movements – Case studies from the European Alps, Sci. Total Environ., 493, 1255–1266, https://doi.org/10.1016/j.scitotenv.2014.02.102, 2014. a, b
Taylor, K. E., Stouffer, R. J., and Meehl, G. A.: An Overview of CMIP5 and the Experiment Design, B. Am. Meteorol. Soc., 93, 485–498, https://doi.org/10.1175/BAMS-D-11-00094.1, 2012. a
Van Meijgaard, E., Van Ulft, L. H., Lenderink, G., De Roode, S. R., Wipfler, L., Boers, R., and Timmermans, R.: Refinement and application of a regional atmospheric model for climate scenario calculations of Western Europe Final Report, Report KvR 054/12, Wageningen Environmental Research, ISBN 9789088150463-44, https://library.wur.nl/WebQuery/wurpubs/427097 (last access: 17 June 2022), 2012. a, b, c, d, e, f
Varnes, D. J.: Landslides, analysis and control, in: chap. Slope Movement Types and Processes, Transportation Research Board, National Academy of Sciences, Washington, DC, 11–33, ISBN 978-0309028042, https://onlinepubs.trb.org/Onlinepubs/sr/sr176/176-002.pdf (last access: 27 March 2021), 1978. a, b, c
Viani, C., Chiarle, M., Paranunzio, R., Merlone, A., Musacchio, C., Coppa, G., and Nigrelli, G.: An integrated approach to investigate climate-driven rockfall occurrence in high alpine slopes: the Bessanese glacial basin, Western Italian Alps, J. Mt. Sci., 17, 2591–2610, https://doi.org/10.1007/s11629-020-6216-y, 2020. a
Wieczorek, G. F.: Landslides: investigation and mitigation, in: vol. Special Report 247, Transportation Research Board, Washington, DC, ISBN 030906208X, https://onlinepubs.trb.org/Onlinepubs/sr/sr247/sr247.pdf (last access: 17 June 2022), 1996. a
Wilks, D. S.: Statistical Methods in Atmospheric Science, Acadamic Press, Oxford, UK, ISBN 978-0-12-385022-5, 2011. a