the Creative Commons Attribution 4.0 License.
the Creative Commons Attribution 4.0 License.
 | 14 Jul 2023
A neural network model for automated prediction of avalanche danger level
Vipasana Sharma
Sushil Kumar
Rama Sushil
Snow avalanches cause danger to human lives and property worldwide in high-altitude mountainous regions. Mathematical models based on past data records can predict the danger level. In this paper, we are proposing a neural network model for predicting avalanches. The model is trained with a quality-controlled sub-dataset of the Swiss Alps. Training accuracy of 79.75 % and validation accuracy of 76.54 % have been achieved. Comparative analysis of neural network and random forest models concerning metrics like precision, recall, and F1 has also been carried out.
- Article
(888 KB) - Full-text XML
- BibTeX
- EndNote


Accurate prediction of snow avalanches can help ensure people's safety in snow-covered regions. Many countries still depend on human experts to analyse meteorological data to forecast avalanche warnings.
The major hurdle in developing machine learning models is the lack of sufficient and reliable data. This issue has been resolved to a great extent by the WSL Institute of Snow and Avalanche Research, Switzerland, by collecting 20 years of data in avalanche forecasting. This dataset has further been refined with quality control by experts. The dataset combines different feature sets with meteorological variables.
This unique dataset has enabled experimentation with machine learning models like neural networks and has compared its performance with the random forest machine learning technique.
This paper is organized as follows. Related literature is briefly overviewed in Sect. 2. The dataset used for the training of neural networks is described in Sect. 3. After that, in Sect. 4, we explain the neural network model, tuning of hyperparameters, and evaluation metrics. Random forest machine learning method details applied to the same dataset are described in Sect. 5. Results from both methods are compared and analysed in Sect. 6. The paper is concluded in Sect. 7.
Many countries face snow avalanche hazards with snow-clad mountains. It affects people, facilities, and properties. The impact of snow avalanches on living, work, and recreation in Canada is well documented (Stethem et al., 2003). Every country generally follows its own avalanche classification system. However, in this work, we will follow the European Avalanche Danger Scale (EAWS, 2018).
A comprehensive dataset with the meteorological variables (resampled 24 h averages) and the profile variables extracted from the simulated profiles has been created (Pérez-Guillén et al., 2022a). Weather station data of the IMIS (Intercantonal Measurement and Information System) network in Switzerland for dry-snow conditions are further quality controlled for creating 29 296 records. Each record has 30 variables.
The benefits and challenges of using machine learning and AI for avalanche forecasting in Norway and Canada have been discussed in detail (Horton et al., 2020). Also, machine learning algorithms like the random forest has successfully been used for the prediction of snow avalanches in the region of the Swiss Alps (Pérez-Guillén et al., 2022b). The random forest technique has also been used for forecasting snow avalanches in the Himalayan region (Chawla and Singh, 2021). Numerical modelling techniques (Singh et al., 2005) and artificial neural networks (Singh and Ganju, 2008) have been used for prediction of snow avalanches in the Indian Himalayas. Deep learning methodology has also recently been explored for predicting snow avalanches in Iran (Chen et al., 2022) and Kazakhstan (Blagovechshenskiy et al., 2023).
In this paper, the public dataset provided by Envidat, a Swiss organization, is used. This data are verified and supported by the Swiss Data Science Center (grant C18-05 DEEP snow). More than 20 years of data for avalanche forecasting in the Swiss Alps are provided. Data cover the Swiss winters from 1997–2017. The data are collected from 182 snow stations and are used by the Swiss avalanche warning service.
The dataset includes the meteorological variables (resampled 24 h averages) and the profile variables extracted from the simulated profiles. The dataset contains the danger ratings published in the official Swiss avalanche bulletin using SNOWPACK simulations. The SNOWPACK simulations provide two different output files for each station: (i) time series of meteorological variables and (ii) simulated snow cover profiles.
Table 1Thirty meteorological variables in four categories (measured, extracted, profiled, modelled) (Pérez-Guillén et al., 2022a) used to develop the neural network model.
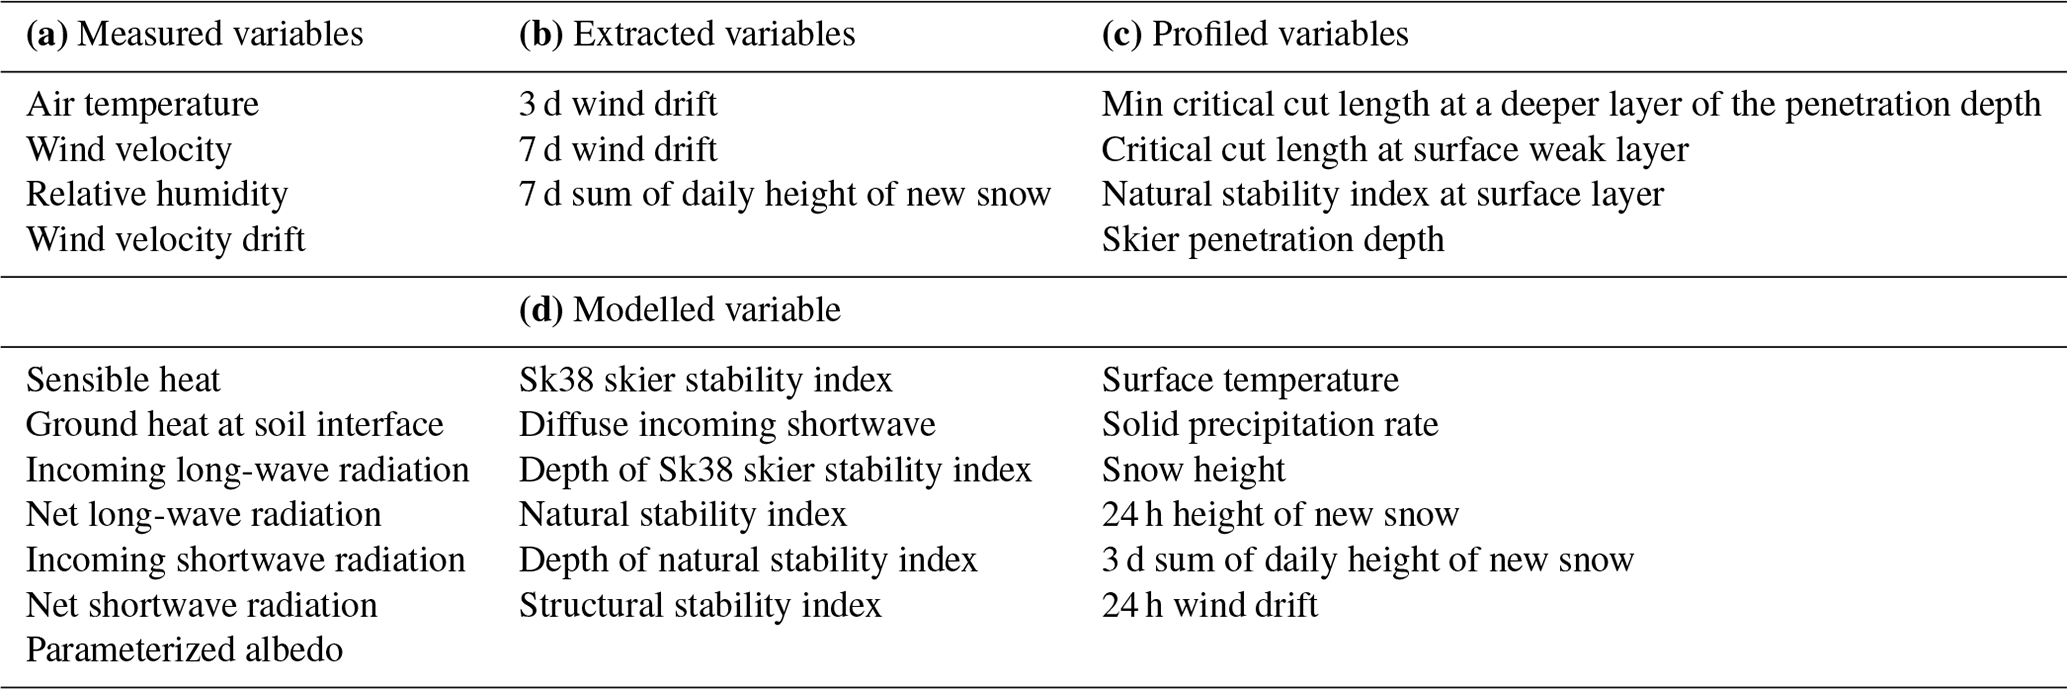
This study uses measured, extracted, profiled, and modelled variables. The entire dataset is pre-processed to remove missing and duplicate values. Further, the dataset is normalized by using a scalar function. Also, categorical variables used for danger levels are replaced with numerical representation for compatibility with neural network training software. In addition, some of the irrelevant columns with information about the date, the sector ID, the name of the sector region, the elevation width, the elevation station, and warning are removed from the dataset. The 30 variables used for the training of the neural network model for predicting snow avalanches are shown in Table 1.
Neural network models allow for the modelling of complex nonlinear relationships between the multiple input and output variables. It is a network of input, output, and intermediate layers (Fig. 1). The outputs are obtained by a linear combination of the weights with inputs. The weights are selected using a “learning algorithm” that minimizes a “cost function” (Bishop, 2005).
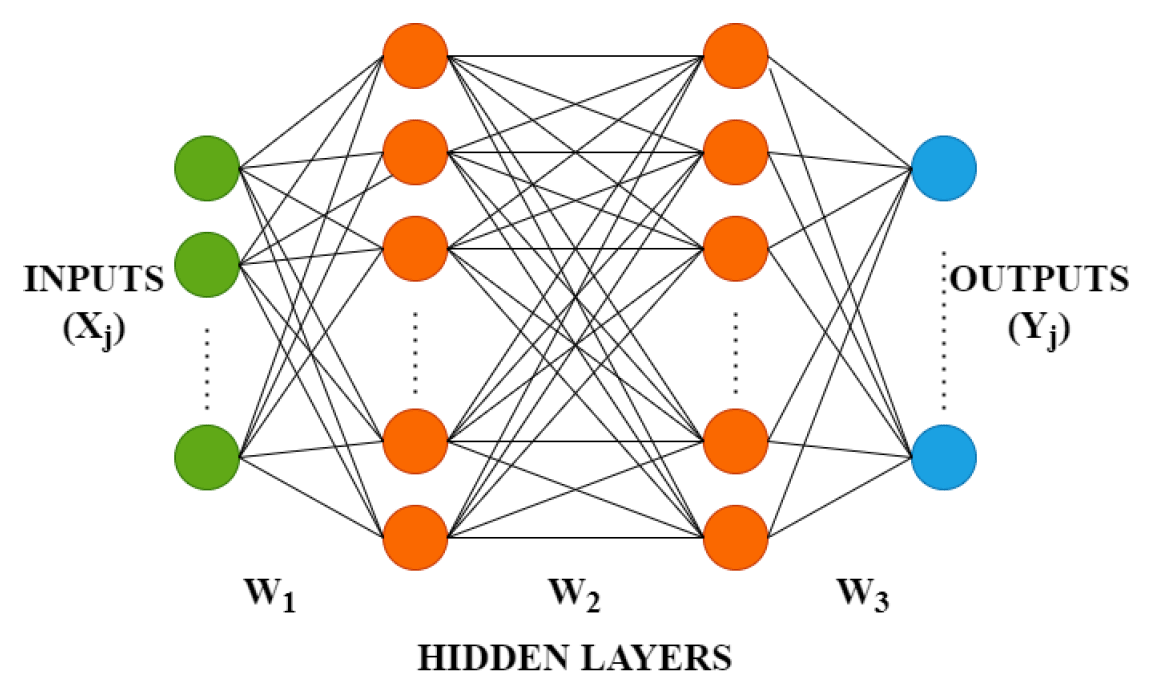
This study uses multilayer feed-forward networks, where each layer of nodes receives inputs from the previous layers. The outputs of the nodes in one layer are inputs to the next layer. For example, the inputs into the hidden neuron in Fig. 1 are combined linearly to give the following output:
where zj denotes the hypothesis of parameters w and b, and xj denotes the features in the training set.
A nonlinear function modifies the above outputs of nodes before being used as inputs by the next layer. The parameters bj and wij are learned from data. The number of hidden layers and nodes in each hidden layer is specified in advance.
Training of artificial neural networks, also known as supervised learning, involves adjusting weights until the model is properly fitted with labels indicating the avalanche danger according to European norms. A total of 30 input variables are used for training the network. The avalanche threat is categorized into five zones as follows:
-
1 – Low
-
2 – Moderate
-
3 – Considerate
-
4 – High
-
5 – Very high
The model's performance across the training dataset is described by a loss function which computes the difference between the trained model's predictions and the actual incident instances. The loss function would be very high if the gap between expected and actual results is too large. The loss function gradually learns to lower the prediction error with the optimization function (Bottou, 1991). A multi-class classification cost function is used for avalanche prediction for each danger level. The average difference between the probability distributions that were anticipated and that occurred is calculated.
Equation (2) computes cross entropy loss using the target and predicted danger levels.
In our scenario, the output layer is set up with five nodes (one for each danger level). The SoftMax activation function is used to compute the probability for each danger class zj:
Equation (3) transforms the raw outputs of the neural network into probabilities (Christopher, 2005).
The gradient descent method has been used to update the weights and bias through backpropagation. The Adam (adaptive moment estimation) optimizer is used for optimization. It performs the search process using an exponentially decreasing moving average of the gradient.
The performance of a neural network mainly depends on the number of hidden layers and the number of neurons in the respective hidden layer. Table 2 shows the range of hyperparameters used for testing different neural networks. The upper limit on the number of neurons has been set according to the number of raw variables in the original dataset.
Table 2Range of hyperparameters used for testing neural networks.
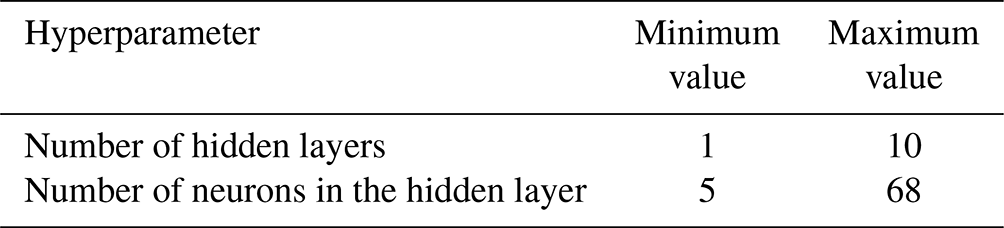
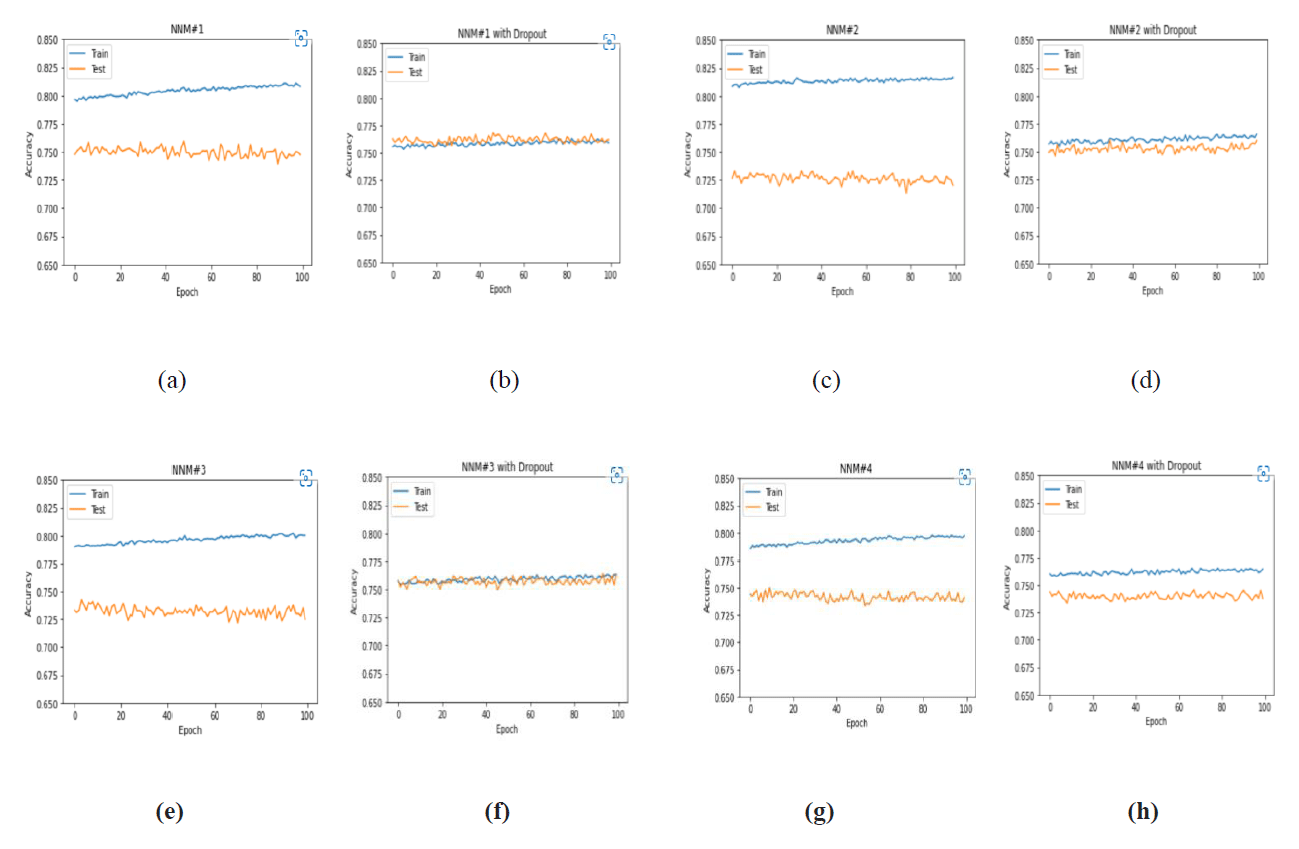
Figure 2Effect of dropout on training and validation accuracy. (a) NNM no. 1 without a dropout; (b) NNM no. 1 with a dropout of 0.2, 0.1, and 0.1 on three hidden layers; (c) NNM no. 2 without a dropout; (d) NNM no. 2 with a dropout of 0.2, 0.1, and 0.1 on three hidden layers; (e) NNM no. 3 without a dropout; (f) NNM no. 3 with a dropout of 0.2 and 0.1 on two hidden layers; (g) NNM no. 4 without a dropout; and (h) NNM no. 4 with a dropout of 0.1, 0.1, and 0.1 on three hidden layers.
After exhaustive testing of neural networks with hyperparameters (Table 2), networks are ranked according to training accuracy (Table 3). However, after plotting of training and validation curves (Fig. 2a, c, e, g), it is observed that validation accuracy was reduced though training accuracy was increased, thus indicating over-fitting of the neural network models. To address this problem, dropout layers are included and tested with different dropouts. Figure 2b, d, f, h shows that dropout regularization successfully resolved over-fitting and significantly improved validation accuracy. Maximum validation accuracy is observed for NNM no. 3 with a dropout of 0.2, 0.1, and 0.1 on three hidden layers (Fig. 3).
Table 3Neural network models ranked according to training accuracy with a learning rate of 0.001 for 100 epochs and a batch size of 64.
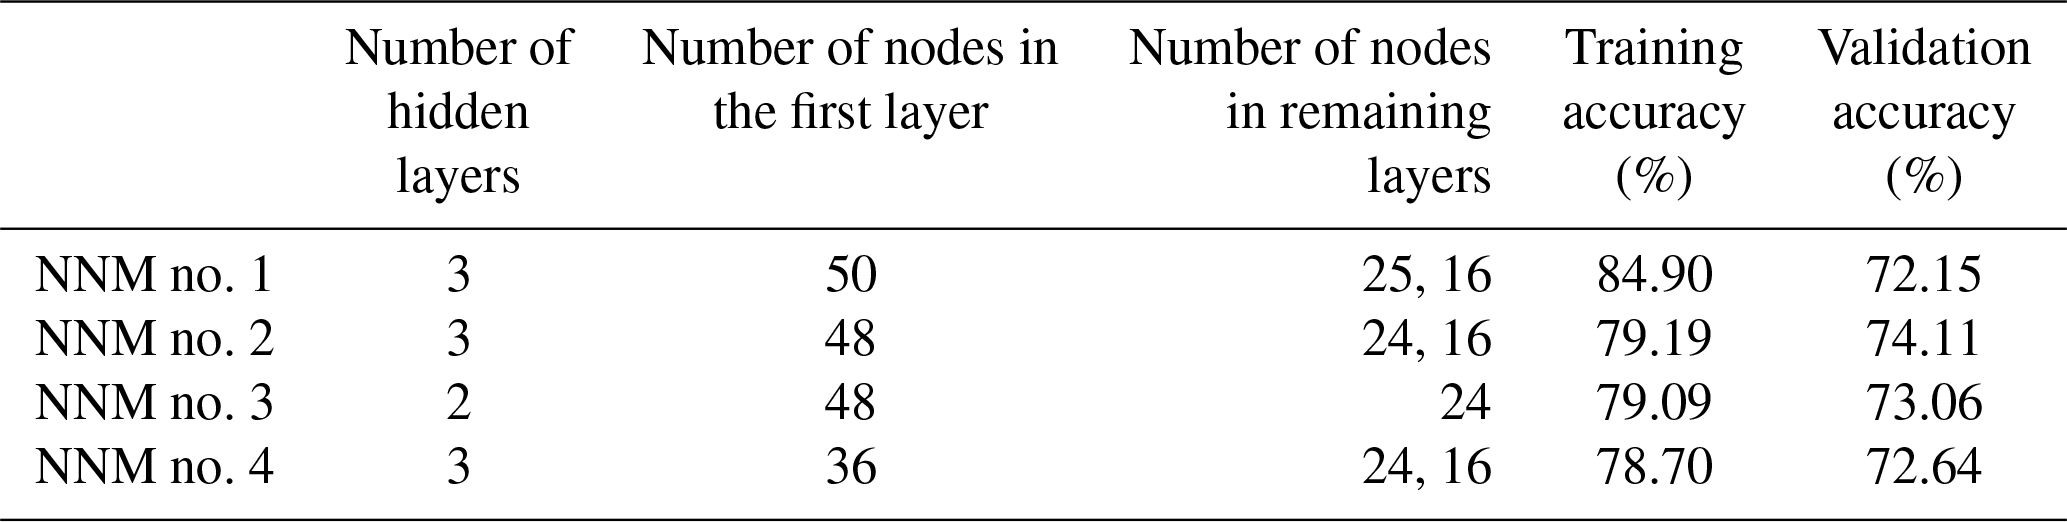
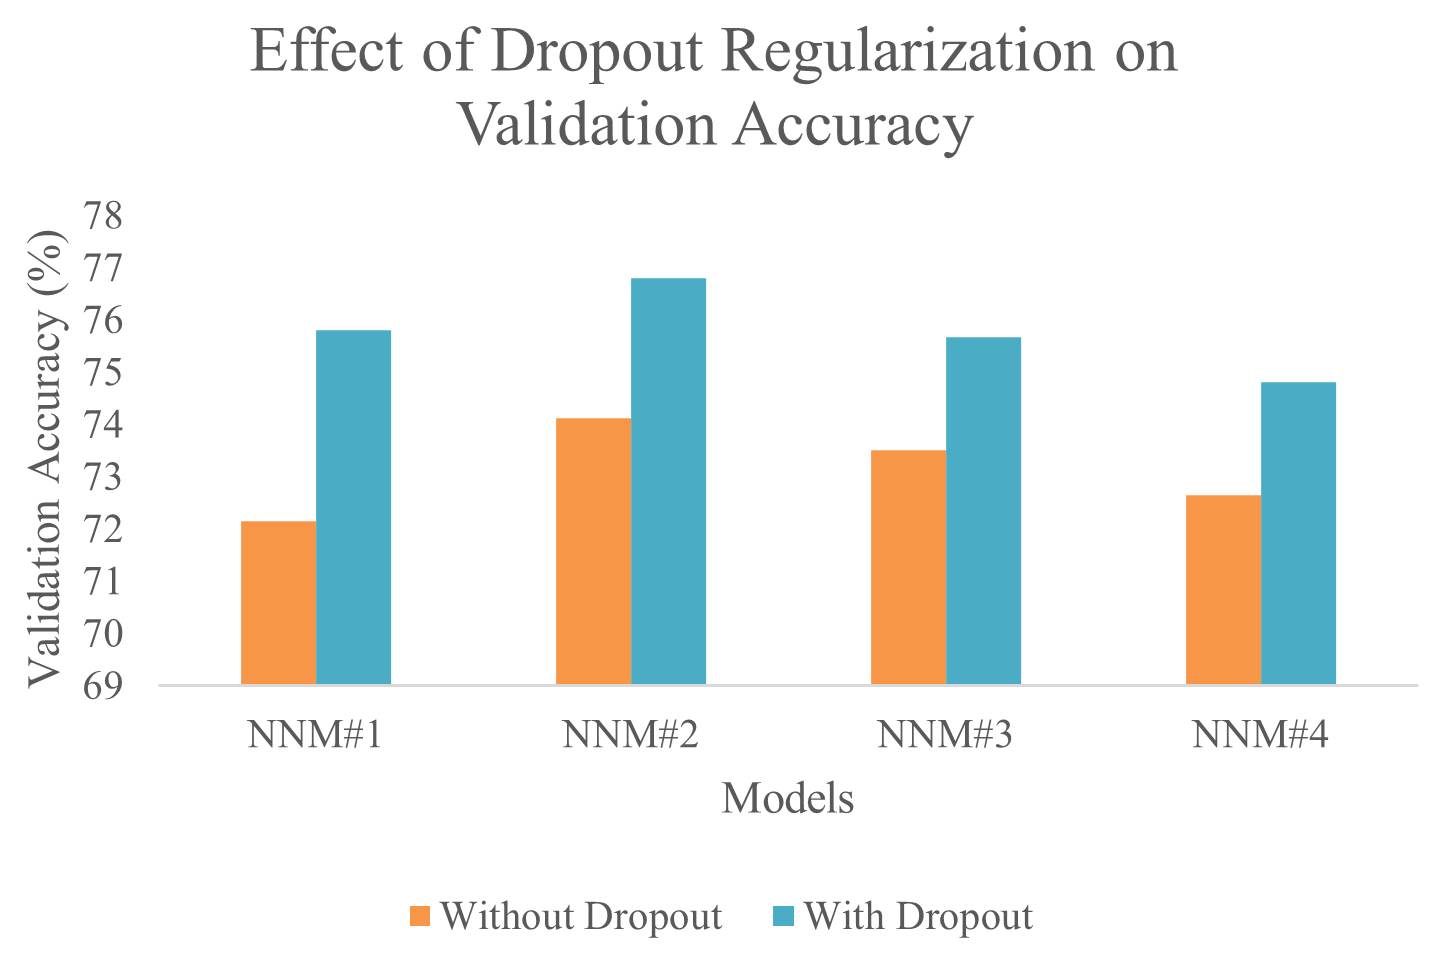
Figure 3Improvement in validation accuracy of neural network models with dropout regularization. Maximum validation accuracy was achieved with NNM no. 2 with a dropout of 0.2, 0.1, and 0.1 on three hidden layers.
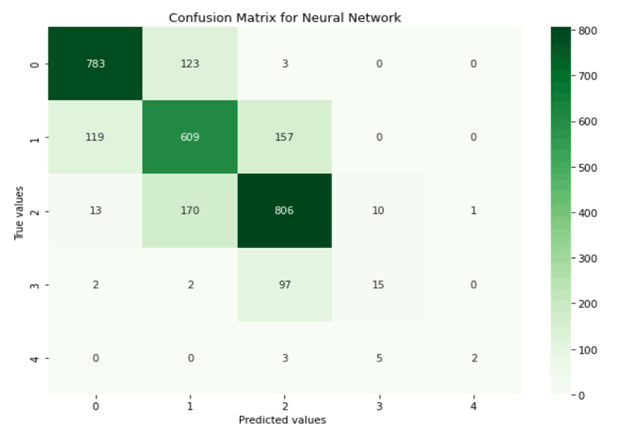
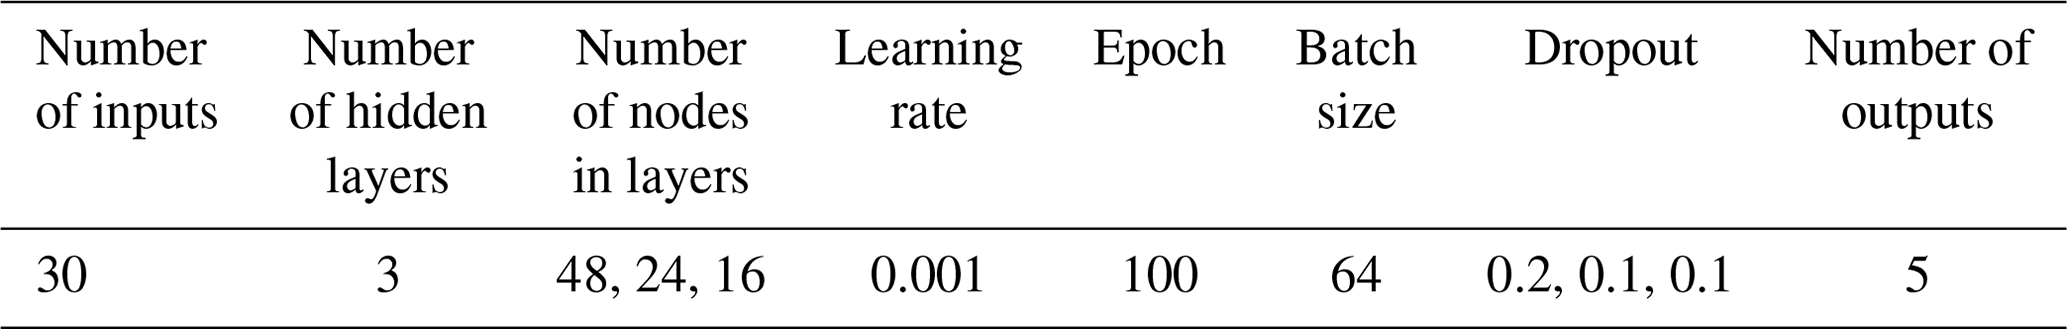
The proposed neural network architecture based on the above study is shown in Table 4. It has three hidden layers and has been trained for 100 epochs. The model achieved a training accuracy of 79.75 % and a validation accuracy of 76.54 %. A confusion matrix for the proposed NNM-1 is shown in Fig. 4 predicting a considerate danger level; out of 1000 cases, 806 cases are true positives, and 194 cases are false positives.
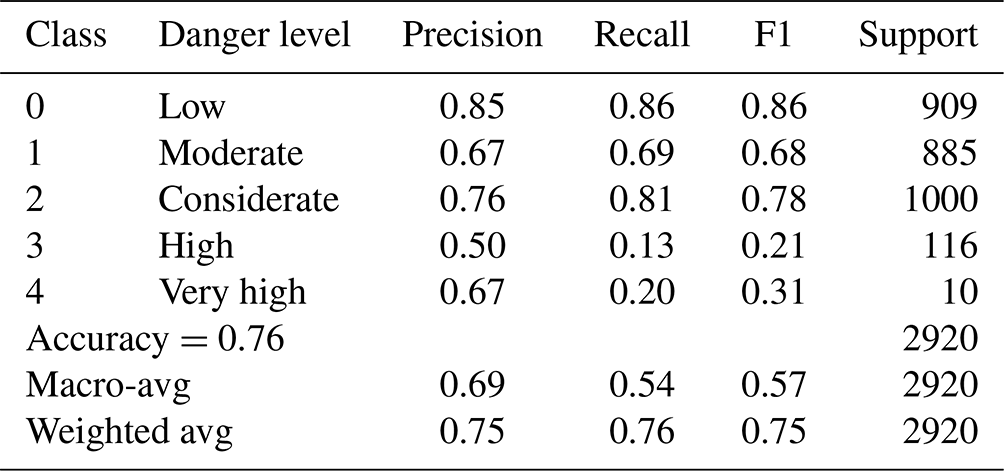
Evaluation matrix for NNM-1
Table 5 shows the various evaluation metrics like accuracy, precision, recall, and F1 score for the neural network model. The proposed neural network correctly predicted 76 classifications for every 100 forecasts made. The macro- and weighted averages of precision, recall, and the F1 score are shown in Table 5. The macro-average is computed without considering the proportion of labels in different classes of danger levels. It may be noted that the weighted average takes into account a low number of labels for high and very high danger level classes. The proposed neural network model achieved a macro- and weighted average F1 score of 0.69 and 0.75, respectively.
Table 5Parametric evaluation metrics for the proposed neural network model.
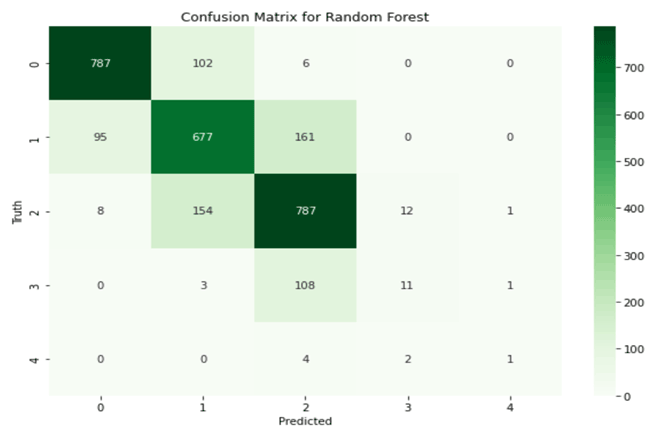
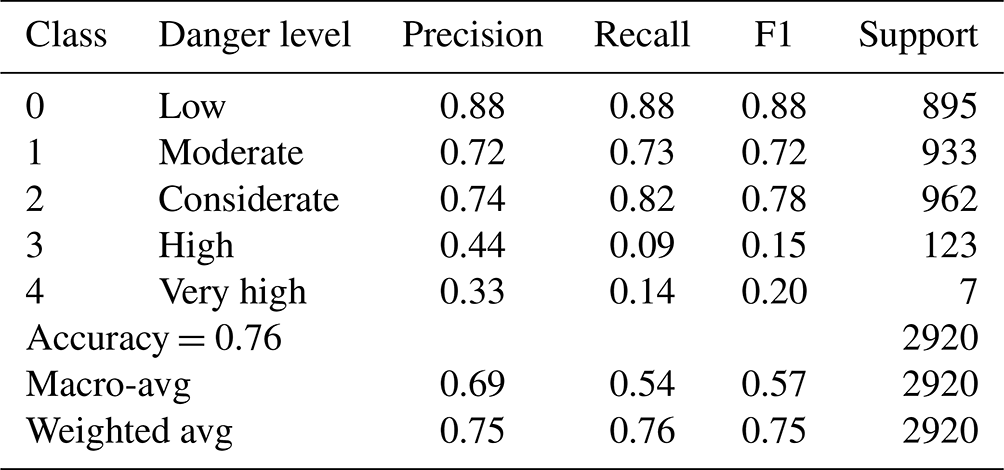
A random forest is a meta-estimator that employs averaging to increase predictive accuracy and reduce over-fitting after fitting numerous decision tree (DT) classifiers to different dataset subsamples (Kroese et al., 2019). A subset of the training data is randomly chosen by the random forest classifier to construct a set of decision trees. It simply consists of a collection of decision trees from a randomly chosen subset of the training set, which is subsequently used to decide the final prediction. The confusion matrix for the random forest classifier is shown in Fig. 5. The dataset (2920 records) used for validating the neural network model is applied to the computing performance matrix. Several decision trees make up the random forest model, which is trained with the Classification and Regression Tree (CART) algorithm. Table 6 shows the various evaluation metrics like precision, recall, and F1 score for the random forest model.
Testing of the proposed model has been carried out with 2920 records for which ground truth labels are available. The data for the high and very high avalanche threats are less compared to low, moderate, and considerate threats. This scenario in a dataset where samples of data in one class are much higher compared to that of the other class is a skewed dataset. In this case, the higher data sample class (low, moderate, and considerate avalanche threat) becomes the major class. The class consisting of relatively fewer data samples (high and very high avalanche threat) is labelled as a minor class. Hence, the overall neural network performance is affected, thereby generating less accurate results for the minor class.
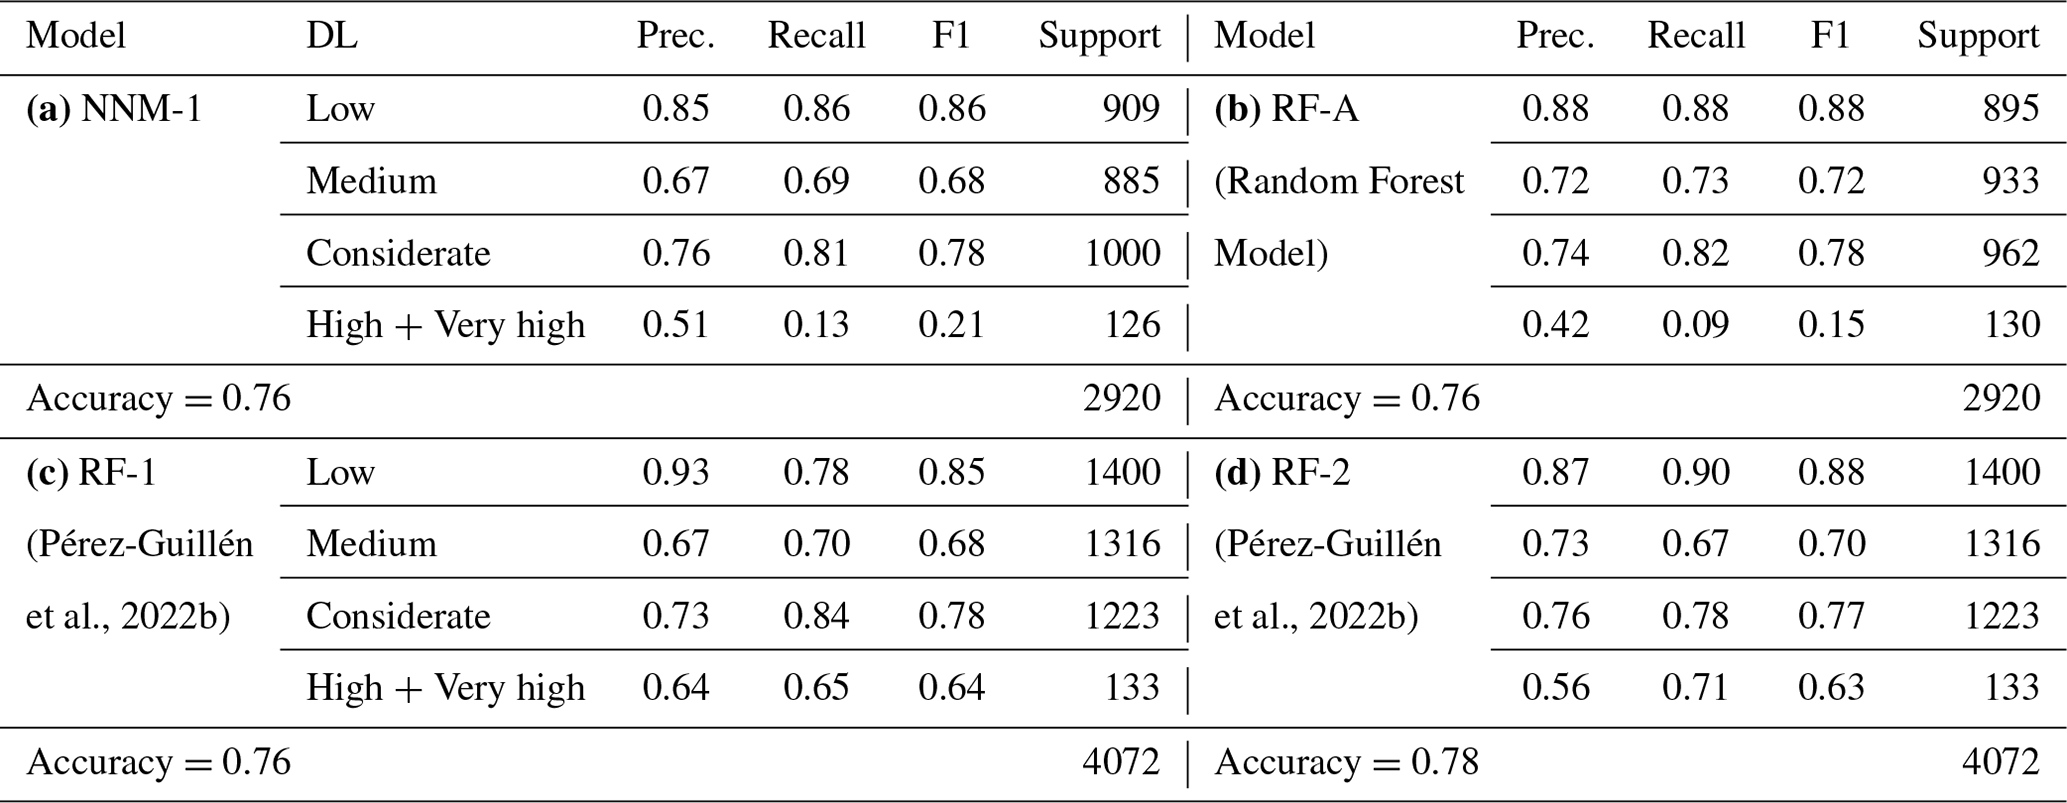
We trained multiple neural network models with a variety of hyperparameters. The model NNM-1 (Table 4) used for the comparative analysis is without over-fitting and has maximum validation accuracy. Another random forest model RF-A (Möhle et al., 2014) is also tested with the same datasets. Both models (NNM-1 and RF-A) achieved the same overall accuracy (0.76) as RF-1, which is slightly less than RF-2's accuracy (0.78). F1 scores for low, medium, and considerate classes are equal for NNM-1 and RF-A models (Table 6). However, the low F1 value for the high and very high class for NNM-1 and RF-A is attributed to skewed data distribution. Weighted average values (Table 5) are more appropriate compared to macro-average values, as these consider a low number of labels for classes 3 and 4.
A neural network model to predict avalanche danger levels has been developed. The model is validated by using 20 years of meteorological measurements and extracted and modelled variables of the Swiss Alps. Extensive testing has been carried out for tuning hyperparameters, like the number of hidden layers and neurons. The data used for testing the neural network model are also applied to the random forest model for the evaluation of performance metrics (Table 7). The developed model has achieved a training accuracy of 79.75 % and a validation accuracy of 76.54 %, which is the same as RF-1 and RF-A but with 2.56 % less accuracy than RF-2.
Table 7Various parametric values of some existing models and proposed NNM-1 for snow avalanche prediction.
Performance indicators like accuracy, precision, recall, and F1 score are used for assessing the effectiveness of the avalanche prediction model. The notations used are
-
TP (true positive), the number of points that are positive and predicted to be positive;
-
FN (false negative), the number of points that are positive but predicted to be negative;
-
FP (false positive), the number of points that are negative but predicted to be positive;
-
TN (true negative), the number of points that are negative and predicted to be negative.
The accuracy of classification is the ratio of correct predictions to the total number of input samples.
Precision is the total number of successfully classified positive classes to the total number of anticipated positive classes.
Recall is the total number of correctly classified positive classes to the total number of positive classes.
The F1 score is the harmonic mean of precision and recall. Mathematically, it can be expressed as
The formulas used for calculating the macro- and weighted average are as follows:
where wi denotes the weights of the five classes, and xi denotes the value, and
where xi denotes the value, and 5 is the number of the target variables.
The script reproducing the main results of this paper is available at https://github.com/vipasanasharma/Automated-Prediction-of-Avalanches/tree/main (last access: 9 July 2023; https://doi.org/10.5281/zenodo.8139913, Sharma, 2023).
The dataset used for this research is publicly accessible. The meteorological and the profile variables extracted from the simulated profiles are provided by the IMIS network, Switzerland, and can be accessed at https://doi.org/10.16904/envidat.330 (Pérez-Guillén et al., 2022a).
VS accessed and pre-processed data, implemented the models in software, reported initial results, and prepared the draft manuscript with the contributions of all co-authors. SK developed the research idea, provided the expertise for model choice and guidance for model implementation, and assisted with the computational framework. RS reviewed the development of the models and the manuscript.
The contact author has declared that none of the authors has any competing interests.
Publisher’s note: Copernicus Publications remains neutral with regard to jurisdictional claims in published maps and institutional affiliations.
This article is part of the special issue “Natural hazards' impact on natural and built heritage and infrastructure in urban and rural zones”. It is not associated with a conference.
We would like to thank the Copernicus team for the comments that have contributed to improving our article.
This paper was edited by Orsolya Kegyes-Brassai and reviewed by three anonymous referees.
Bishop, C. M.: Neural Networks for Pattern Recognition, Oxford University Press, ISBN 9780198538646, 2005.
Blagovechshenskiy, V., Medeu, A., Gulyayeva, T., Zhdanov, V., Ranova, S., Kamalbekova, A., and Aldabergen, U.: Application of Artificial Intelligence in the Assessment and Forecast of Avalanche Danger in the Ile Alatau Ridge, Water, 15, 1438, https://doi.org/10.3390/w15071438, 2023.
Bottou, L.: Stochastic gradient learning in neural networks, in: Proceedings of Neuro-Nîmes'91, Nîmes, France, 4–8 November 1991, EC2, https://leon.bottou.org/papers/bottou-91c (last access: 11 July 2023), 1991.
Chawla, M. and Singh, A.: A data efficient machine learning model for autonomous operational avalanche forecasting, Nat. Hazards Earth Syst. Sci. Discuss. [preprint], https://doi.org/10.5194/nhess-2021-106, 2021.
Chen, Y., Chen, W., Rahmati, O., Falah, F., Kulakowski, D., Lee, S., Rezaie, F., Panahi, M., Bahmani, A., Darabi, H., and Torabi Haghighi, A.: Toward the development of deep learning analyses for snow avalanche releases in mountain regions, Geocarto Int., 37, 7855–7880, 2022.
EAWS: European Avalanche Danger Scale (2018/19), https://www.avalanches.org/standards/avalanche-danger-scale/ (last access: 11 July 2023), 2018.
Horton, S., Müller, K., Haegeli, P., and Engeset, R.: How close are we to automated avalanche forecasting? Lessons from testing machine learning methods in Norway and Canada, in: Virtual Snow Science Workshop, Online, 4–6 October 2020, https://scholar.google.com/citations?view_op=view_citation&hl=en&user=JR91elgAAAAJ&citation_for_view=JR91elgAAAAJ:maZDTaKrznsC.com/citations?view_op=view_citation&hl=en&user=JR91elgAAAAJ&citation_for_view=JR91elgAAAAJ:maZDTaKrznsC (last access: 11 July 2023), 2020.
Kroese, D. P., Botev, Z. I., Taimre, T., and Vaisman, R.: Data Science and Machine Learning: Mathematical and Statistical Methods, Chapman and Hall/CRC, Boca Raton, https://doi.org/10.1093/ije/dyaa072, 2019.
Möhle, S., Bründl, M., and Beierle, C.: Modeling a system for decision support in snow avalanche warning using balanced random forest and weighted random forest, in: International Conference on Artificial Intelligence: Methodology, Systems, and Applications, edited by: Agre, G., Hitzler, P., Krisnadhi, A. A., and Kuznetsov, S. O., Springer, Cham, https://doi.org/10.1007/978-3-319-10554-3_8, 2014.
Pérez-Guillén, C., Techel, F., Hendrick, M., Volpi, M., van Herwijnen, A., Olevski, T., Obozinski, G., Pérez-Cruz, F., and Schweizer, J.: Weather, snowpack and danger ratings data for automated avalanche danger level predictions, EnviDat [data set], https://doi.org/10.16904/envidat.330, 2022a.
Pérez-Guillén, C., Techel, F., Hendrick, M., Volpi, M., van Herwijnen, A., Olevski, T., Obozinski, G., Pérez-Cruz, F., and Schweizer, J.: Data-driven automated predictions of the avalanche danger level for dry-snow conditions in Switzerland, Nat. Hazards Earth Syst. Sci., 22, 2031–2056, https://doi.org/10.5194/nhess-22-2031-2022, 2022b.
Sharma, V.: vipasanasharma/Automated-Prediction-of-Avalanches: First, Zenodo [code], https://doi.org/10.5281/zenodo.8139913, 2023.
Singh, A. and Ganju, A.: Artificial Neural Networks for Snow Avalanche Forecasting inIndian Himalaya, in: The 12th International Conference of International Association for Computer Methods and Advances in Geomechanics (IACMAG), Goa, India, 1–6 October 2008, International Association for Computer Methods and Advances in Geomechanics (IACMAG), ISBN 978-1-62276-176-0, https://www.proceedings.com/content/015/015452webtoc.pdf (last access: 12 July 2023), 2008.
Singh, A., Srinivasan, K., and Ganju, A.: Avalanche Forecast Using Numerical Weather Prediction in Indian Himalaya, Cold Reg. Sci. Technol., 43, 83–92, 2005.
Stethem, C., Jamieson, B., Schaerer, P., Liverman, D., Germain, D., and Walker, S.: Snow avalanche hazard in Canada – a review, Nat. Hazards, 28, 487–515, 2003.
- Abstract
- Introduction
- Related work
- Dataset
- Proposed neural network: NNM-1
- Random forest
- Results and discussion
- Conclusion
- Appendix A: Formulas for the evaluation metrics
- Code availability
- Data availability
- Author contributions
- Competing interests
- Disclaimer
- Special issue statement
- Acknowledgements
- Review statement
- References