the Creative Commons Attribution 4.0 License.
the Creative Commons Attribution 4.0 License.
 | 11 Jul 2023
Brief communication: Towards a universal formula for the probability of tornadoes
Roberto Ingrosso
Piero Lionello
Mario Marcello Miglietta
Gianfausto Salvadori
A methodological approach is proposed to provide an analytical (exponential-like) expression for the probability of occurrence of tornadoes as a function of the convective available potential energy and the wind shear (or, alternatively, the storm relative helicity). The resulting expression allows the probability of tornado occurrence to be calculated using variables that are computed by weather prediction and climate models, thus compensating for the lack of resolution needed to resolve these phenomena in numerical simulations.
- Article
(1529 KB) - Full-text XML
-
Supplement
(8616 KB) - BibTeX
- EndNote


Tornadoes are rapidly rotating columns of air (American Meteorological Society, 2020), extending vertically from the surface to the base of a cumuliform cloud, and represent one of the most severe weather phenomena in terms of victims and damage. Considering only the USA, every year about 500 tornadoes (Kunkel et al., 2013) of intensity EF1 (enhanced Fujita scale; Fujita, 1971; Potter, 2007) or stronger occur, producing an average of 125 victims and huge devastation (Ashley, 2007). Numerical simulations of the very fine spatial and temporal scale of tornadoes (typically with a diameter of less than 2 km and a duration of less than 1000 s) require resolutions that are orders of magnitude smaller than those currently available in operational weather prediction and climate models (Yokota et al., 2018). Further, the chaotic dynamics of these vortices limit their deterministic prediction (Markowski, 2020). Consequently, climatological studies focused on the identification of the environmental conditions favourable to tornado-spawning severe convective storms. Several thermodynamic and kinematic meteorological parameters have been analysed, either individually or considering combined instability indices, to identify the conditions most favourable to the genesis of tornadoes (Brooks et al., 2003; Romero et al., 2007; Taszarek et al., 2018, 2020; Ingrosso et al., 2020; Bagaglini et al., 2021). This approach is consistent with the basic idea that tornadoes result from a multi-stage process, which takes into account that the tilting of the horizontal vorticity near the ground by a violent updraught plays a basic role (Rotunno, 2013; Davies-Jones, 2015). Such a conceptual model is used here as a background framework for introducing an analytical formula for the probability of tornado occurrence. A previous study defined a tornado index limited to the USA based on a Poisson regression between the observed U.S. climatology of tornadoes and monthly averaged environmental parameters from reanalysis (Tippett et al., 2012). Other studies limited their conclusions to the identification of the conditions that are associated with mesoscale convective hazards (Brooks, 2013; Diffenbaugh et al., 2013). The expression that we propose in this study is meant to provide a tool for supporting tornado warning in operational weather predictions and estimating changes in the frequency of tornado occurrence in climate projections.
Our analysis is based on tornadoes that occurred in the USA (dataset provided by the Storm Prediction Center (SPC), https://www.spc.noaa.gov/wcm/#dat, last access: 4 June 2023) and in Europe (dataset provided by the European Severe Weather Database (ESWD), https://www.essl.org, last access: 4 June 2023, managed by the European Severe Storm Laboratory (ESSL); Dotzek et al., 2009). We considered only tornadoes of category 2 or higher (F2+), following the idea that weak events might have an uncertain signature in the environmental conditions and their reporting in official databases is less accurate. A total number of 3073 tornadoes have been considered in this study (2632 for the USA and 441 for Europe; see the Supplement for density plots) during the period 2000–2018. Unfortunately, our dataset does not allow us to differentiate supercellular tornadoes from landspouts in most cases. The hourly fields of ERA5 (ECMWF Reanalysis 5; Hersbach et al., 2020) are used to establish a statistical link between the occurrence of tornadoes and a set of meteorological variables, allowing a straightforward physical interpretation of the results: the updraught maximum parcel vertical velocity (WMAX), which depends on the convective available potential energy (CAPE), the mid-level wind shear (WS700), the low-level storm relative helicity (SRH900), and the lifting condensation level (LCL; Kaltenböck et al., 2009). The Supplement reports the expressions defining the variables used in this study. The values of these variables have been extracted in the period 2000–2018 in all cells where at least one tornado occurred, considering the hourly reanalysis fields at 25 km resolution. The values corresponding to the occurrence of tornadoes have been selected considering the time step closest to the recorded time of the tornado onset in the database.
The univariate analysis of the (conditional) probability P of tornado occurrence is carried out by partitioning the observed range spanned by each variable into 17 equiprobable sub-intervals (bins). Such a number has been chosen as a compromise between the need of a number of bins sufficient for robust regressions and of a number of observations in each bin sufficient for a robust statistical analysis. An empirical estimate of the probability of tornado occurrence, conditional to the fact that the value of the variable lies in a given bin, is computed as the relative frequency of tornadoes in the bin. Its uncertainty is estimated via a suitable bootstrap (Monte Carlo) procedure. An analytical expression of y=log 10P is found by a simple linear regression for WS700, SRH900, and LCL, as well as by a non-linear regression for WMAX (see the Supplement). Notice that first the climatology of the variable of interest is calculated via the partition mentioned above, and then it is compared with the tornadic cases (an approach similar to the one adopted in Romero et al., 2007).
The univariate analysis shows that all the four variables considered in our study (i.e. WMAX, WS700, SRH900, LCL) are significantly linked to the formation of tornadoes. However, the formulas involving WS700 and WMAX, i.e.
describe a range of probabilities (from 10−7 to 10−4) wider than that spanned by SRH900 and LCL. In the case of WS700, the probability increases exponentially over the whole range. Instead, the behaviour of log 10P as a function of WMAX is non-linear and shows a hyper-exponential increase in P for low values (WMAX <10 m s−1), when the probability is small (about 10−7); in the intermediate range the growth gradually slows down, and P becomes quasi-constant for large values (WMAX >30 m s−1), where the probability tends to . For LCL and SRH900, the exponential decrease and increase, respectively, only describe a narrow range of probability (approximately from 10−6 to 10−5). In other words, variations of these two variables do not allow us to discriminate between the low and high probability of occurrence of tornadoes as effectively as in the case of WS700 and WMAX (see Fig. 1).
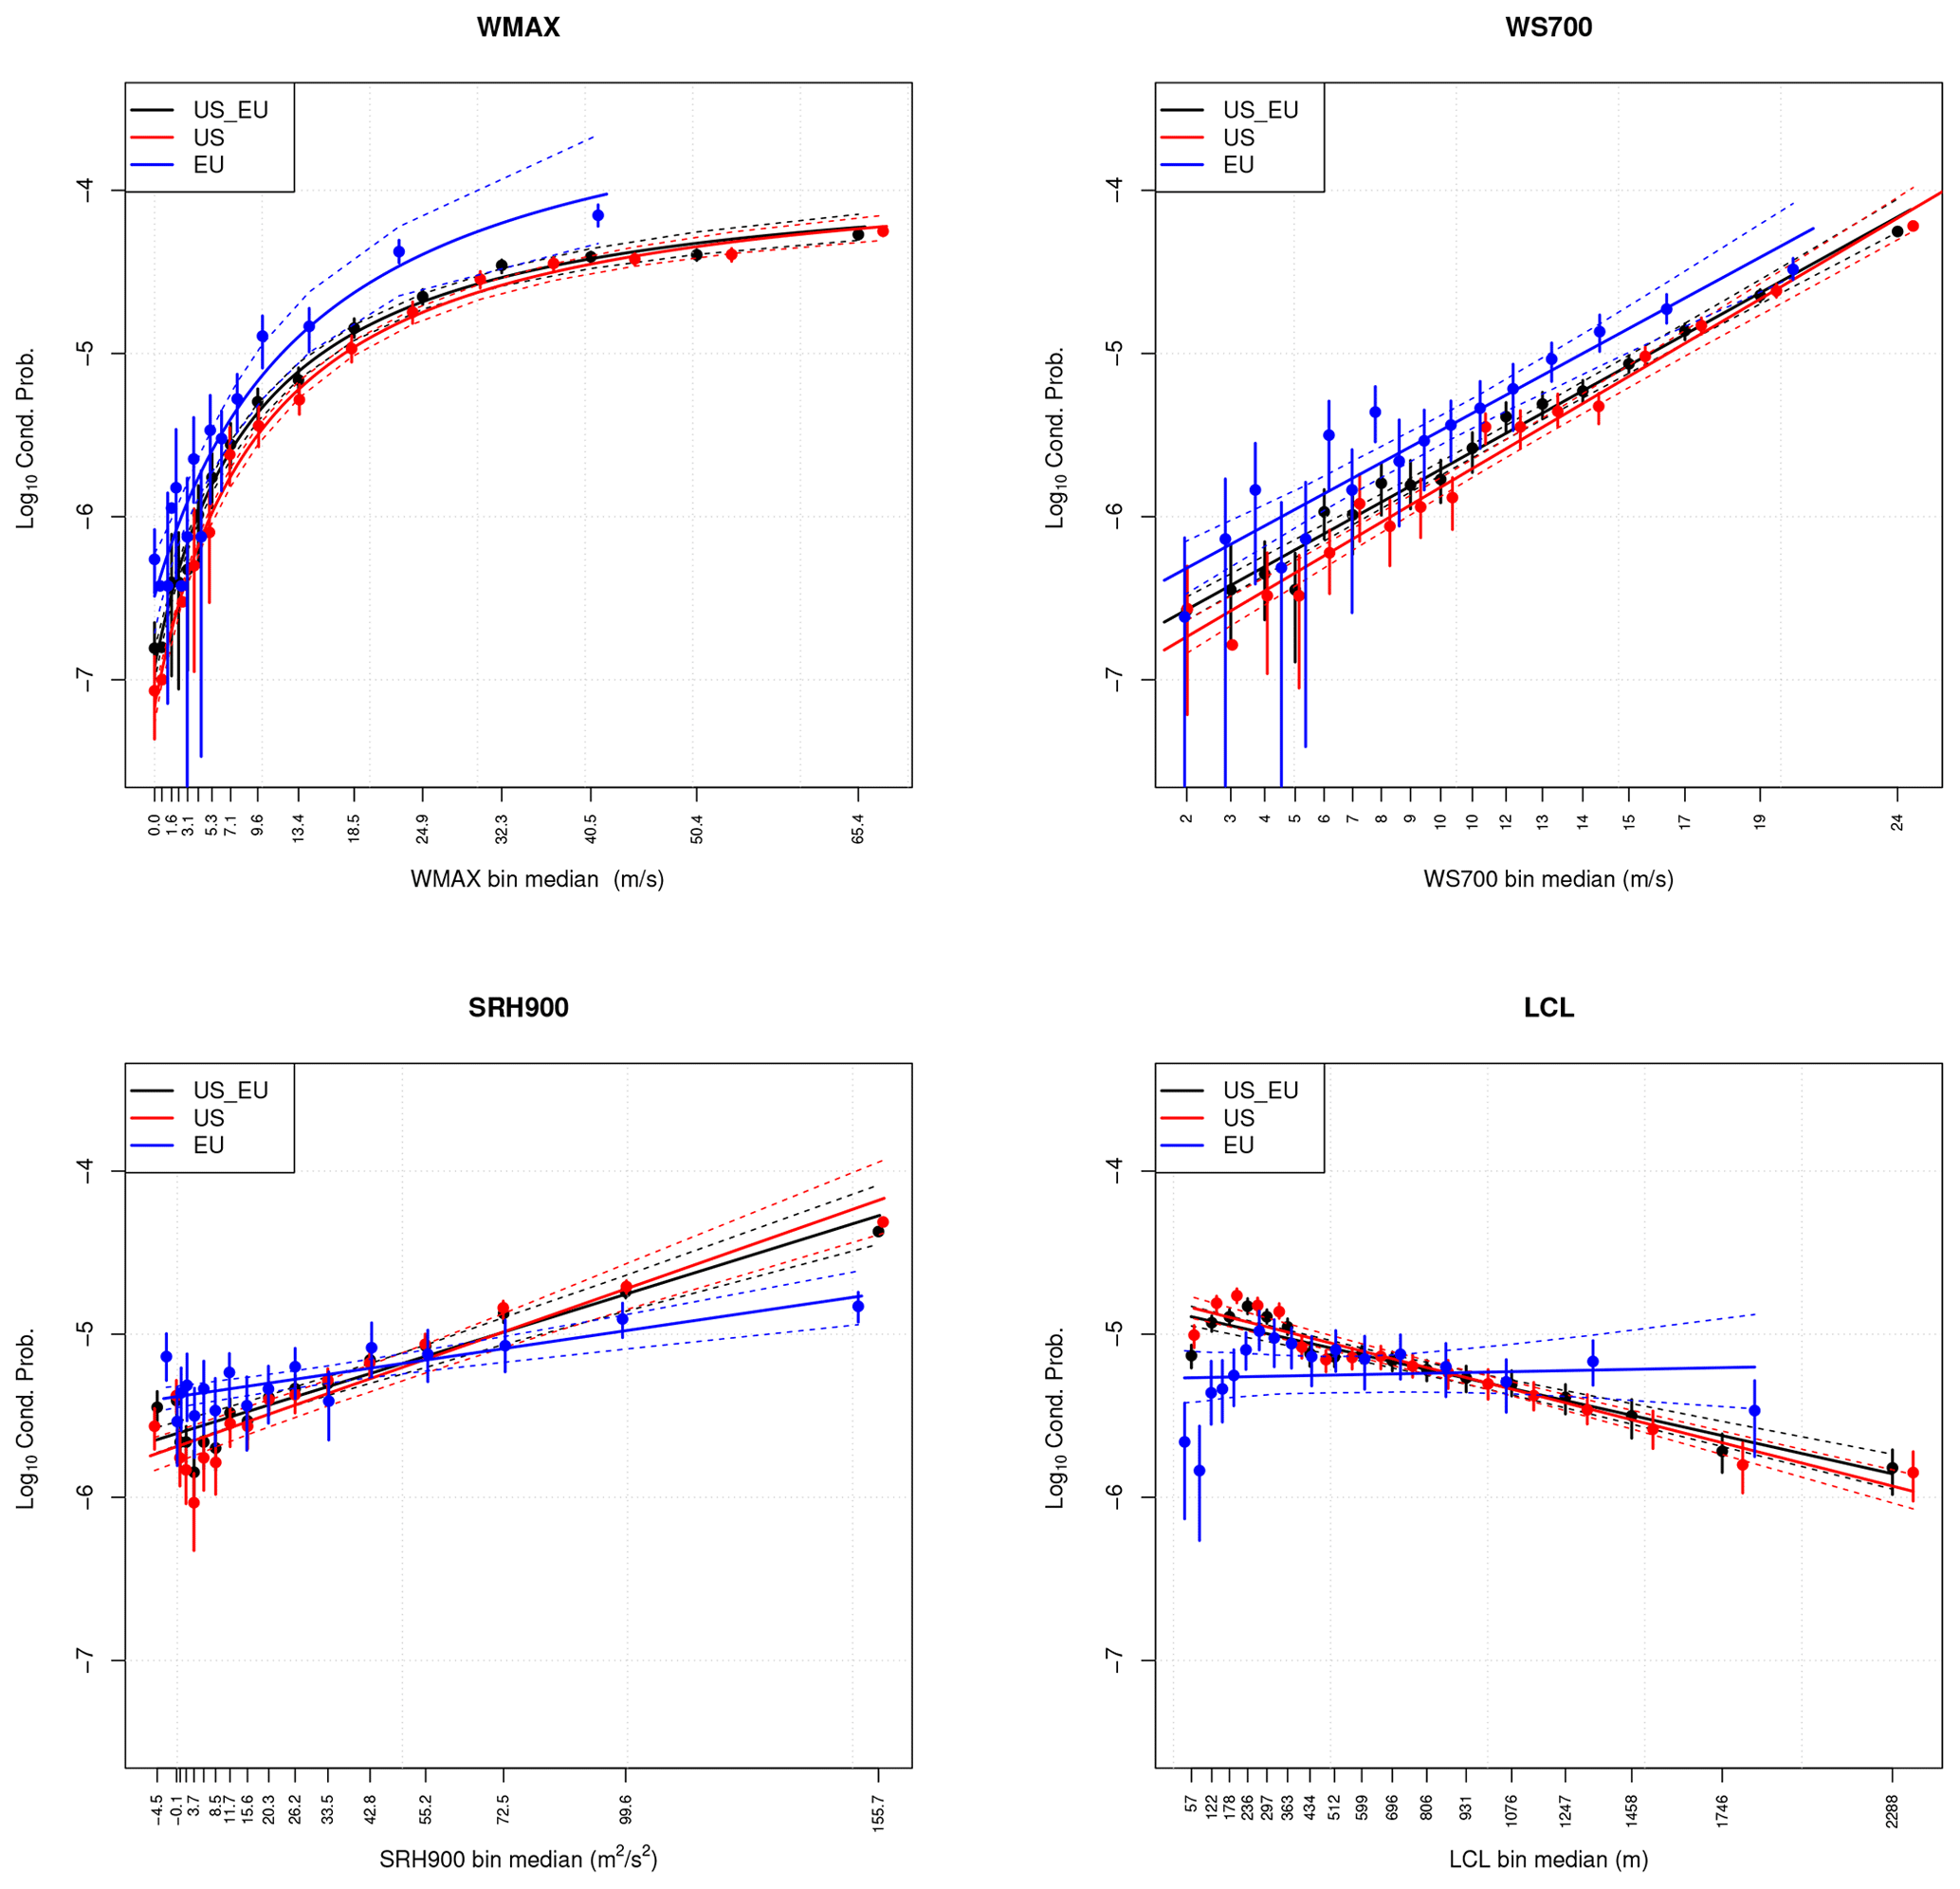
Figure 1Univariate probability distribution for WMAX, WS700, SRH900, and LCL. Markers and whiskers denote the empirical probabilities with uncertainty range. Lines denote the empirical estimates (continuous) with uncertainty ranges (dashed). Different colours represent values based on the full dataset (USA and EU, black), the USA data only (red), and the European data only (EU, blue). Uncertainty ranges correspond to a 95 % confidence level.
Concerning the bivariate analysis (i.e. considering the joint behaviour of pairs of predictors), in analogy with the univariate case, a 17×17 grid matrix is constructed to partition the whole two-dimensional domain in cells. The empirical estimate of the (conditional) probability P of tornado occurrence, provided that the pair of variables lie in a given cell, is empirically computed as above via the estimate of the relative frequency of occurrence. Six different bivariate analyses are carried out considering all possible pair combinations of WMAX, WS700, SRH900, and LCL. For the bivariate probability, non-linear expressions have been adopted for all the pairs of variables involving WMAX and a multiple linear expression for the remaining pairs (see the Supplement). The values of the parameters of the bivariate probability functions have been estimated by a regression of the proposed expressions over the empirical probabilities.
Considering the bivariate expression of P as a function of the pairs (WMAX, LCL) and (WS700, SRH900), the second variable lacks significance, meaning that it provides information analogous to the first one of the pair (in fact, they are fairly correlated), but the first variable provides more (univariate) informative details than the second one in terms of the range of P. Considering the pairs (WMAX, SRH900), (WS700, LCL), and (SRH900, LCL), the probability of tornadoes significantly depends on both variables, but they describe variation in P only over 2–3 orders of magnitude, whereas using the pair (WMAX, WS700) shown in Fig. 2 it is possible to discriminate between conditions where the probability ranges from 10−7 to 10−3 (see the Supplement for the figures regarding all the other pairs). In conclusion, a valuable fit of the probability of occurrence of tornadoes over the range 10−7–10−3 is
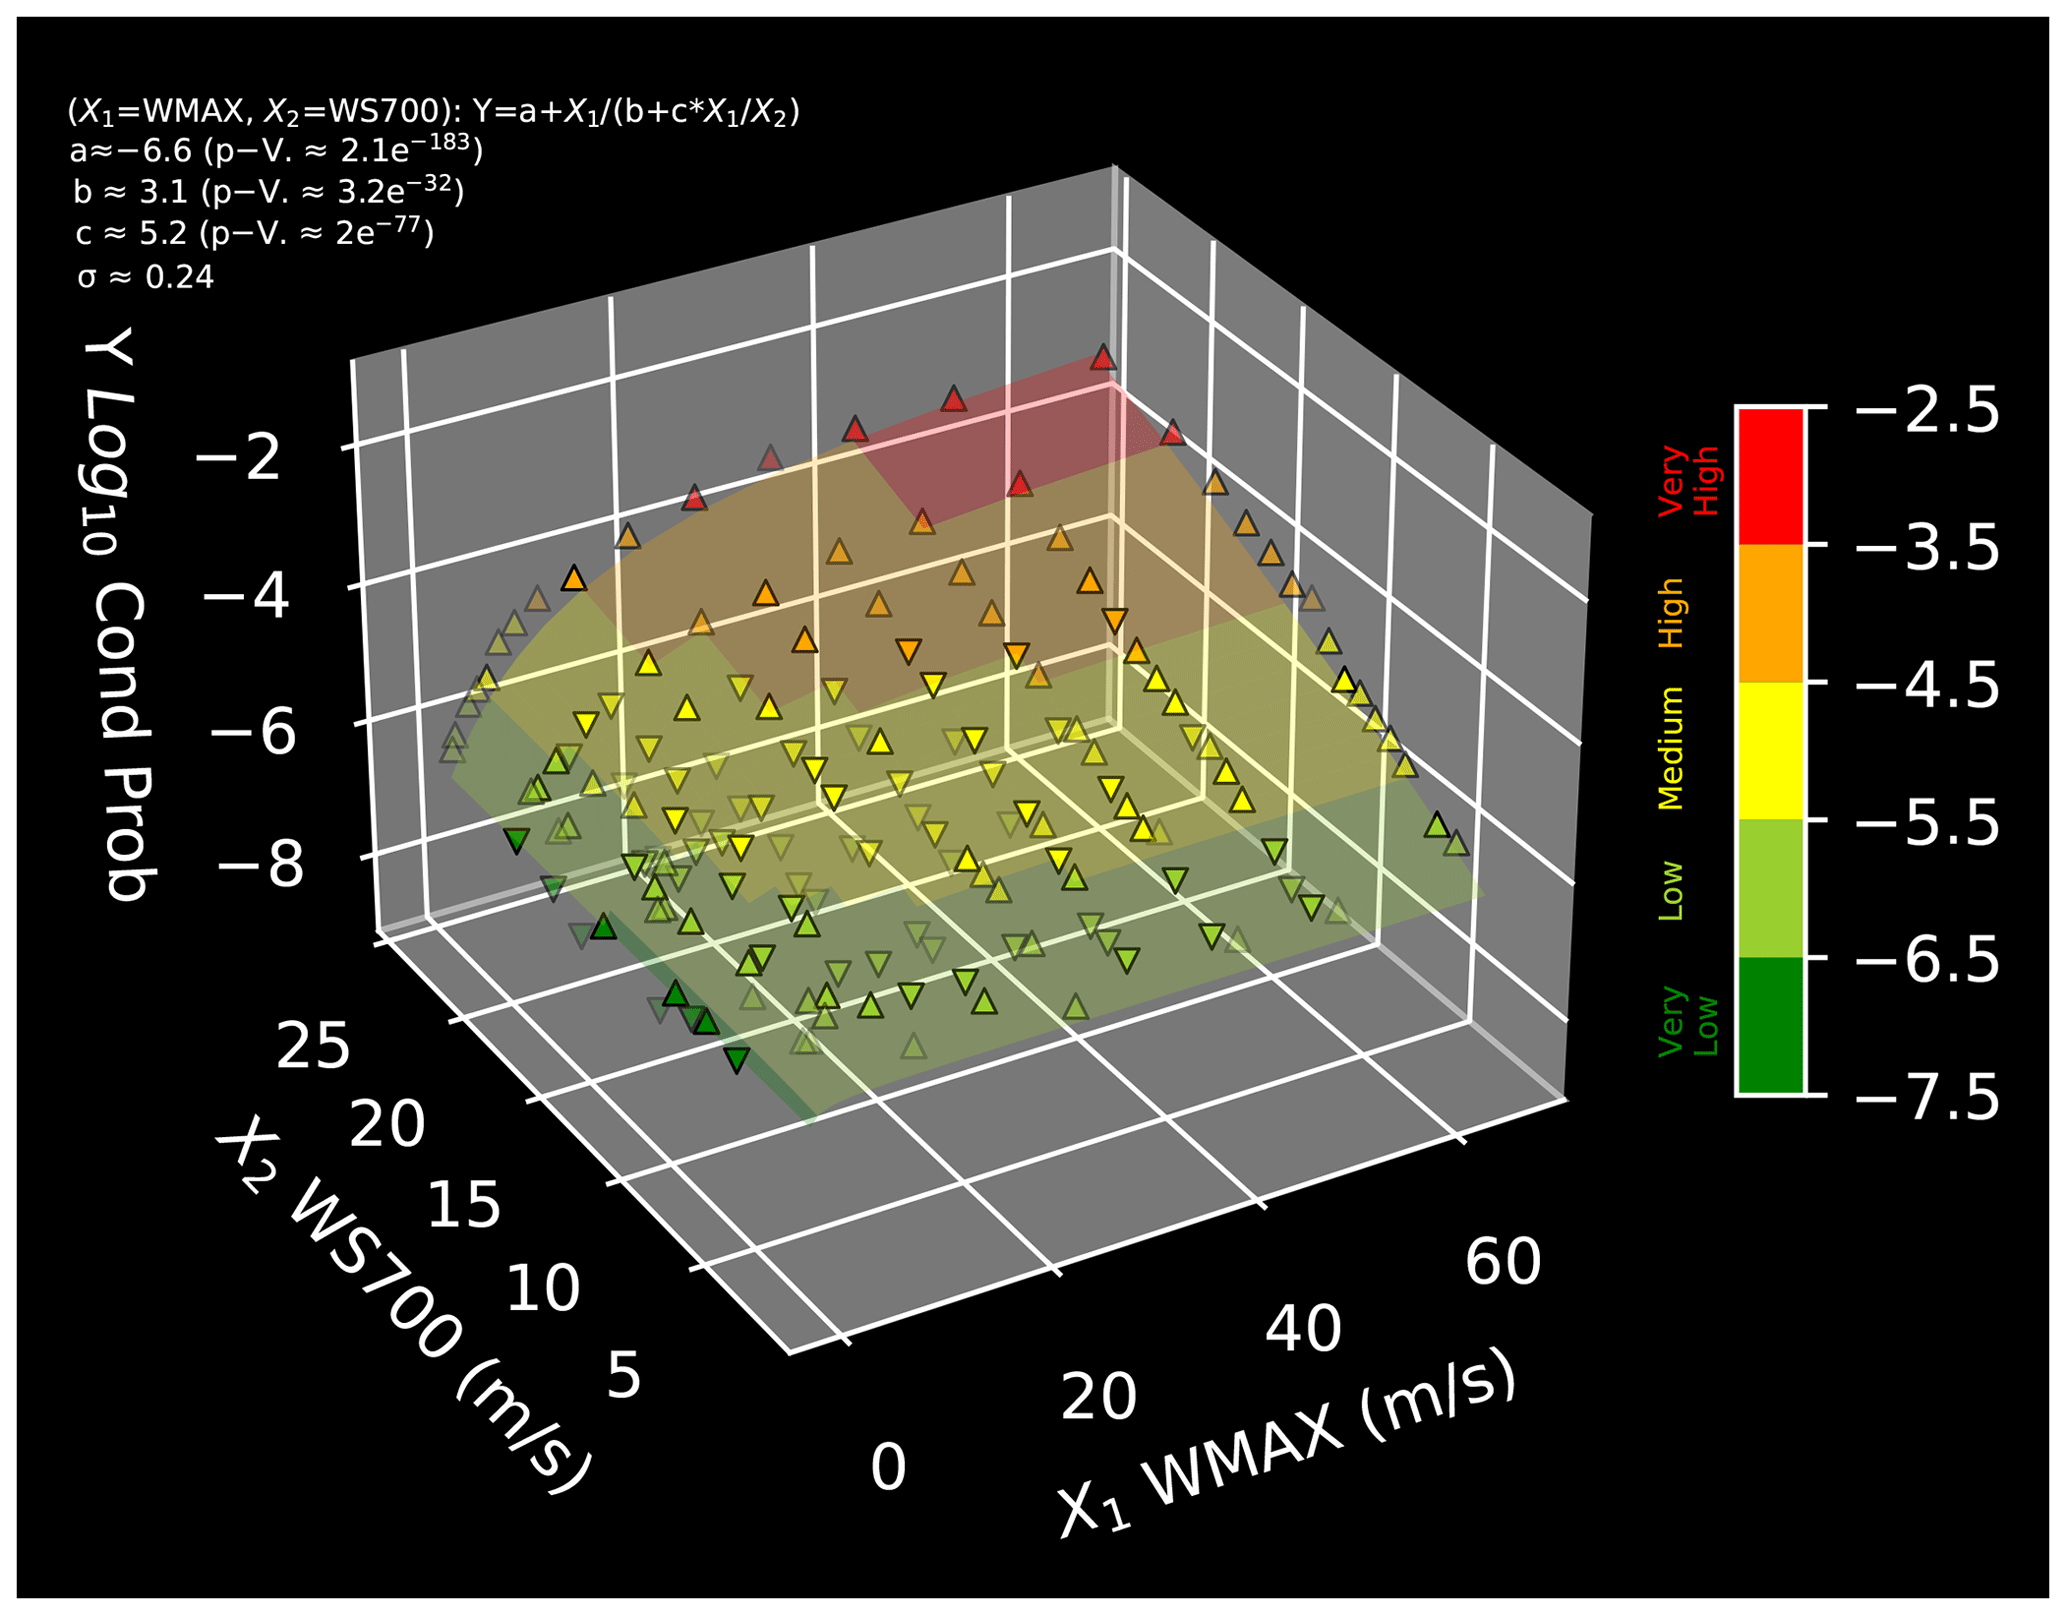
Figure 2Bivariate probability distribution for . The coloured surface shows the empirical fit of y=log 10P. Upward and downward triangles represent empirical estimates located above and below the fitted surface. All values are reported according to the colour bar.
All parameters of the univariate fits in Fig. 1 and bivariate ones in Fig. 2 are statistically significant and significantly different from zero, since the p values of the corresponding tests are (much) smaller than 1 %. For all univariate linear regressions, the adjusted R2 is larger than 90 %, and, in general, the goodness of the fits is visually confirmed by the overwhelming fraction (from 90 % to 100 %) of probability values within the 95 % confidence bands. In the bivariate case, considering the multiple linear regressions of the pairs (WS700, SRH900), (WS700, LCL), and (SRH900, LCL), R2 is, respectively, 70 %, 72 %, and 54 %: in general, these are smaller than in the single-variable case, but this is justified by the fact that the residual variances are about 3 times larger than those estimated in the univariate case. For the three pairs involving WMAX, R2 cannot be used to assess the goodness-of-fit because the regression is non-linear. However, a slice analysis of the fits (see the Supplement for details) shows that the proposed models provide valuable fits over the whole domain of interest.
Further investigations are required to ensure the validity of the expressions in Eqs. (1), (2), and (3) in different environmental and geomorphological conditions. Hypothesis-testing the similarity of the populations of tornado probabilities PEU and PUSA, obtained using only EU and only USA data, respectively, has been carried out by using a Kolmogorov–Smirnov-like (KS) approach (Lopes, 2011) adopting the metric . The significance level of the difference is assessed by computing the fraction of statistics exceeding d0 using a Monte Carlo permutation procedure. Considering the univariate models, the null hypothesis that PEU and PUSA, as a function of WMAX and WS700, are statistically compatible cannot be rejected at 95 % and 99 % levels (suggesting that Eqs. 1 and 2 are acceptable in different geographical domains), whereas it is rejected at a level larger than 99 % for PEU and PUSA as a function of SRH900 and LCL. Considering the bivariate conditional probabilities, the null hypothesis – that PEU and PUSA are statistically compatible – could not be rejected (at a 90 % level) only for the pair (WMAX, SRH900). In this case, the overall conditional probability (combining USA and EU data) is
For all other pairs the null hypothesis could be rejected at the 99 % level.
Possible explanations of the lack of compatibility between conditional probabilities obtained using the EU and USA datasets alone could be different tornado damage-reporting practices (leading to different counting and attributions of tornadoes to the EF/F scale) and different meteorological and/or morphological conditions in the two domains. In spite of these limitations, as well as the need for further investigations, the proposed statistical models suitably fit the conditional probabilities of tornado occurrence. In particular, Eq. (3) has the merit of fitting the bulk of all available data and Eqs. (1), (2), and (4) of being robust with respect to the considered geographical domains.
The formulas of Eqs. (1)–(4), and particularly the bivariate expressions of Eqs. (3) and (4), outline a new statistical tool that can be used for diagnosing the likelihood of tornadoes with potential applications to short–medium range weather predictions and future changes in their frequency in climate projections. Former results considered monthly average probability (Tippett et al., 2012) or provided a modest fit to the data and were based on a smaller dataset (Cohen et al., 2018). The closest analogue to our approach is the formula of tornado probability in Grieser and Haines (2020), who considered two parameters: one describing vertical changes in temperature and a composite parameter merging CAPE and wind shear. Our results differ from Grieser and Haines (2020) in the adopted methodology for estimating the probability of occurrence of tornadoes. Grieser and Haines (2020) propose a linear regression of the logistic function, whereas we propose a non-linear bivariate fit of the logarithm of the probability. In addition, our study shows that the relationship of CAPE to the probability of tornado occurrence departs significantly from a linear dependence and that the interaction between the action of CAPE and wind shear in the lower troposphere cannot be adequately represented by their additive combination, further expanding the outcomes of Grieser and Haines (2020). Finally, Grieser and Haines (2020) used their formula for estimating past occurrence rates of tornado occurrences, while, to our best knowledge, this is the first time that analytical expressions in the form of Eqs. (3) and (4) are proposed in the scientific literature with the general aim of describing probability of tornadoes at high time and space resolution with applications in weather forecasting and climate projections.
The list of tornadoes in the USA can be freely downloaded at https://www.spc.noaa.gov/wcm/#dat (NOAA NWS SPC, 2023). The list of tornadoes in Europe has been obtained from https://www.essl.org/cms/european-severe-weather-database/ (European Severe Storms Laboratory, 2023). ERA-5 data can be freely downloaded from https://cds.climate.copernicus.eu/cdsapp#!/home (Copernicus Climate Change Service, 2023).
The supplement related to this article is available online at: https://doi.org/10.5194/nhess-23-2443-2023-supplement.
RI has been responsible for data collecting, processing, and plotting; PL for the coordination of the study; MMM for the meteorological analysis; and GS for the statistical analysis and the computation of the probability of occurrence of tornadoes. All the authors wrote and contributed to the final manuscript.
At least one of the (co-)authors is a member of the editorial board of Natural Hazards and Earth System Sciences. The peer-review process was guided by an independent editor, and the authors also have no other competing interests to declare.
Publisher’s note: Copernicus Publications remains neutral with regard to jurisdictional claims in published maps and institutional affiliations.
The authors gratefully acknowledge useful discussions and suggestions by Fabrizio Durante (University of Salento, Lecce, Italy. The work of Piero Lionello has been carried out with the partial financial support from ICSC – Centro Nazionale di Ricerca in High Performance Computing, Big Data and Quantum Computing, funded by European Union – NextGenerationEU (CUP F83C22000740001). Moreover, we thank the support of the European COST Action CA17109 “DAMOCLES” (Understanding and Modeling Compound Climate and Weather Events) and the support of the Italian PRIN 2017 (Research Projects of National Interest) “Stochastic Models of Complex Systems” (2017JFFHSH). ESSL is acknowledged for providing European data, ECMWF for ERA5 reanalyses, and the Storm Prediction Center for US reports.
This work has been partially financially supported by ICSC – Centro Nazionale di Ricerca in High Performance Computing, Big Data and Quantum Computing, funded by European Union – NextGenerationEU (CUP F83C22000740001).
This paper was edited by Maria-Carmen Llasat and reviewed by two anonymous referees.
American Meteorological Society (AMS): Glossary of Meteorology, AMS, https://glossary.ametsoc.org/wiki/Tornado (last access: 22 August 2022), 2020. a
Ashley, W. S.: Spatial and Temporal Analysis of Tornado Fatalities in the United States: 1880–2005, Weather Forecast., 22, 1214–1228, https://doi.org/10.1175/2007WAF2007004.1, 2007. a
Bagaglini, L., Ingrosso, R., and Miglietta, M. M.: Synoptic patterns and mesoscale precursors of Italian tornadoes, Atmos. Res., 253, 105503, https://doi.org/10.1016/j.atmosres.2021.105503, 2021. a
Brooks, H. E.: Severe thunderstorms and climate change, Atmos. Res., 123, 129–138, https://doi.org/10.1016/j.atmosres.2012.04.002, 2013. a
Brooks, H. E., Lee, J. W., and Craven, J. P.: The spatial distribution of severe thunderstorm and tornado environments from global reanalysis data, Atmos. Res., 67–68, 73–94, https://doi.org/10.1016/S0169-8095(03)00045-0, 2003. a
Cohen, A. E., Cohen, J. B., Thompson, R. L., and Smith, B. T.: Simulating Tornado Probability and Tornado Wind Speed Based on Statistical Models, Weather Forecast., 33, 1099–1108, https://doi.org/10.1175/WAF-D-17-0170.1, 2018. a
Copernicus Climate Change Service (C3S): Climate Data Store (CDS), https://cds.climate.copernicus.eu/cdsapp#!/home, last access: 5 July 2023. a
Davies-Jones, R.: A review of supercell and tornado dynamics, Atmos. Res., 158–159, 274–291, https://doi.org/10.1016/j.atmosres.2014.04.007, 2015. a
Diffenbaugh, N. S., Scherer, M., and Trapp, R. J.: Robust increases in severe thunderstorm environments in response to greenhouse forcing, P. Natl. Acad. Sci. USA, 110, 16361–16366, https://doi.org/10.1073/pnas.1307758110, 2013. a
Dotzek, N., Groenemeijer, P., Feuerstein, B., and Holzer, A. M.: Overview of ESSL's severe convective storms research using the European Severe Weather Database ESWD, Atmos. Res., 93, 575–586, https://doi.org/10.1016/j.atmosres.2008.10.020, 2009. a
European Severe Storms Laboratory (ESSL): European Severe Weather Database (ESWD), https://www.essl.org/cms/european-severe-weather-database/, last access: 5 July 2023. a
Fujita, T. T.: Proposed characterization of tornadoes and hurricanes by area and intensity, Satellite and Mesometeorology Research Project, 42 pp., https://ntrs.nasa.gov/api/citations/19720008829/downloads/19720008829.pdf (last access: 5 July 2023), 1971. a
Grieser, J. and Haines, P.: Tornado Risk Climatology in Europe, Atmosphere, 11, 768, https://doi.org/10.3390/atmos11070768, 2020. a, b, c, d, e
Hersbach, H., Bell, B., Berrisford, P., Hirahara, S., Horányi, A., Muñoz-Sabater, J., Nicolas, J., Peubey, C., Radu, R., Schepers, D., Simmons, A., Soci, C., Abdalla, S., Abellan, X., Balsamo, G., Bechtold, P., Biavati, G., Bidlot, J., Bonavita, M., De Chiara, G., Dahlgren, P., Dee, D., Diamantakis, M., Dragani, R., Flemming, J., Forbes, R., Fuentes, M., Geer, A., Haimberger, L., Healy, S., Hogan, R. J., Hólm, E., Janisková, M., Keeley, S., Laloyaux, P., Lopez, P., Lupu, C., Radnoti, G., de Rosnay, P., Rozum, I., Vamborg, F., Villaume, S., and Thépaut, J.-N.: The ERA5 global reanalysis, Q. J. Roy. Meteor. Soc., 146, 1999–2049, https://doi.org/10.1002/qj.3803, 2020. a
Ingrosso, R., Lionello, P., Miglietta, M. M., and Salvadori, G.: A Statistical Investigation of Mesoscale Precursors of Significant Tornadoes: The Italian Case Study, Atmosphere, 11, 301, https://doi.org/10.3390/atmos11030301, 2020. a
Kaltenböck, R., Diendorfer, G., and Dotzek, N.: Evaluation of thunderstorm indices from ECMWF analyses, lightning data and severe storm reports, Atmos. Res., 93, 381–396, https://doi.org/10.1016/j.atmosres.2008.11.005, 2009. a
Kunkel, K. E., Karl, T. R., Brooks, H., Kossin, J., Lawrimore, J. H., Arndt, D., Bosart, L., Changnon, D., Cutter, S. L., Doesken, N., Emanuel, K., Groisman, P. Y., Katz, R. W., Knutson, T., O'Brien, J., Paciorek, C. J., Peterson, T. C., Redmond, K., Robinson, D., Trapp, J., Vose, R., Weaver, S., Wehner, M., Wolter, K., and Wuebbles, D.: Monitoring and Understanding Trends in Extreme Storms: State of Knowledge, B. Am. Meteorol. Soc., 94, 499–514, https://doi.org/10.1175/BAMS-D-11-00262.1, 2013. a
Lopes, R.: Kolmogorov-Smirnov Test, in: International Encyclopedia of Statistical Science, Springer Berlin Heidelberg, https://doi.org/10.1007/978-3-642-04898-2, 2011. a
Markowski, P. M.: What is the Intrinsic Predictability of Tornadic Supercell Thunderstorms?, Mon. Weather Rev., 148, 3157–3180, https://doi.org/10.1175/MWR-D-20-0076.1, 2020. a
NOAA NWS SPC: US Tornadoes, NOAA [data set], https://www.spc.noaa.gov/wcm/#dat, last access: 5 July 2023. a
Potter, S.: Fine-Tuning Fujita: After 35 years, a new scale for rating tornadoes takes effect, Weatherwise, 60, 64–71, https://doi.org/10.3200/WEWI.60.2.64-71, 2007. a
Romero, R., Gayà, M., and Doswell, C. A.: European climatology of severe convective storm environmental parameters: A test for significant tornado events, Atmos. Res., 83, 389–404, https://doi.org/10.1016/j.atmosres.2005.06.011, 2007. a, b
Rotunno, R.: The Fluid Dynamics of Tornadoes, Annu. Rev. Fluid Mech., 45, 59–84, https://doi.org/10.1146/annurev-fluid-011212-140639, 2013. a
Taszarek, M., Brooks, H. E., Czernecki, B., Szuster, P., and Fortuniak, K.: Climatological Aspects of Convective Parameters over Europe: A Comparison of ERA-Interim and Sounding Data, J. Climate, 31, 4281–4308, https://doi.org/10.1175/JCLI-D-17-0596.1, 2018. a
Taszarek, M., Allen, J. T., Púčik, T., Hoogewind, K. A., and Brooks, H. E.: Severe Convective Storms across Europe and the United States. Part II: ERA5 Environments Associated with Lightning, Large Hail, Severe Wind, and Tornadoes, J. Climate, 33, 10263–10286, https://doi.org/10.1175/JCLI-D-20-0346.1, 2020. a
Tippett, M. K., Sobel, A. H., and Camargo, S. J.: Association of US tornado occurrence with monthly environmental parameters, Geophys. Res. Lett., 39, L02801, https://doi.org/10.1029/2011GL050368, 2012. a, b
Yokota, S., Niino, H., Seko, H., Kunii, M., and Yamauchi, H.: Important Factors for Tornadogenesis as Revealed by High-Resolution Ensemble Forecasts of the Tsukuba Supercell Tornado of 6 May 2012 in Japan, Mon. Weather Rev., 146, 1109–1132, https://doi.org/10.1175/MWR-D-17-0254.1, 2018. a