the Creative Commons Attribution 4.0 License.
the Creative Commons Attribution 4.0 License.
 | 28 Jun 2023
Accounting for the effect of forest and fragmentation in probabilistic rockfall hazard
Camilla Lanfranconi
Paolo Frattini
Gianluca Sala
Giuseppe Dattola
Davide Bertolo
Juanjuan Sun
Giovanni Battista Crosta
The presence of trees along the slope and block fragmentation at impact strongly affect rockfall dynamics and hazard as a consequence. However, these phenomena are rarely simulated explicitly in rockfall studies. We performed rockfall simulations by using the 3D rockfall simulator Hy-Stone, modeling both the presence of trees and fragmentation through specific algorithms implemented in the code. By comparing these simulations with a more classical approach that attempts to account implicitly for such phenomena in the model parameters and by using a new probabilistic rockfall hazard analysis (PRHA) method, we were able to quantify the impact of these phenomena on the design of countermeasures and on hazard.
We demonstrated that hazard changes significantly when accounting explicitly for these phenomena and that a classical implicit approach usually overestimates both the hazard level and the 95th percentile of kinetic energy, leading to an oversizing of mitigation measures.
- Article
(3165 KB) - Full-text XML
-
Supplement
(2866 KB) - BibTeX
- EndNote


Rockfalls are widespread in mountain ranges, coastal cliffs, volcanos, riverbanks, and slope cuts, and they are a threat to people, structures and infrastructure, and lifelines (Crosta et al., 2015). Although rockfalls generally have a limited size, they are extremely rapid processes that exhibit high kinetic energies, long runout, and damaging capability (Corominas et al., 2017). Rockfall hazard and risk assessment (Corominas et al., 2005; Agliardi et al., 2009; Lari et al., 2014; Wang et al., 2014; Farvacque et al., 2019, 2021; Hantz et al., 2021) and the design of defensive works (Volkwein et al., 2009) require numerical modeling of rockfalls to assess the dynamics of the blocks (i.e., velocity, kinetic energy, and bouncing height) and the lateral and longitudinal spreading (Crosta and Agliardi, 2003). In Italy, for example, the design of rockfall barriers is based on the use of the 95th percentiles of the blocks' height in flight and their kinetic energy, obtained from numerical models (UNI 11211; Volkwein et al., 2011). Since rockfall dynamics depend on block geometry, slope topography, surficial geology, vegetation, and some peculiar rockfall behaviors (e.g., dynamic fragmentation), the reliability of analyses and the efficiency of rockfall protections depend on the correct account for all these variables (Crosta et al., 2015). Both the characteristics of the slope (e.g., topography, material properties, and presence of forests) and the type of rockfall (e.g., whether it is fragmental) must be taken into account during modeling because they contribute to the overall extent of rockfall potential and hazard zonation in mountain areas (Frattini et al., 2012). Both these characteristics can modify the trajectories, the extent and the dynamics of the rockfall events, the frequency, and the probability of impact.
Forests provide important protection against rockfall in steep mountain terrain, defending structures and infrastructure (Berger et al., 2002; Dorren et al., 2004a; Perret et al., 2004). Thanks to this nature-based solution, maintenance and installation costs of technical protection measures, such as embankments or nets, are financially bearable or can even be avoided at many places due to the reduction in rockfall rebound heights and impact energies by previous impacts on trees (Grêt-Regamey et al., 2008; Häyhä et al., 2015; Getzner et al., 2017; Moos and Dorren, 2022). Although this protective effect is evident in hazard assessment processes because it supports decisions on risk prevention measures, it is often accounted for only in implicit terms by adopting a set of modified restitution coefficients (Pfeiffer and Bowen, 1989; Azzoni et al., 1995). Less frequently, the presence of trees is simulated explicitly by using numerical modeling approaches (Dorren et al., 2006; Stoffel et al., 2006; Berger and Dorren, 2007; Bigot et al., 2009; Jancke et al., 2009; Rammer et al., 2010; Leine et al., 2014; Radtke et al., 2014; Kajdiž et al., 2015; Dupire et al., 2016; Moos et al., 2018; Toe et al., 2018).
When stiff and strong rock blocks hit a hard impact substratum or other blocks of comparable size like a talus deposit, they may fragment and explode (Crosta et al., 2015). The rockfall fragmentation process is defined as the separation of the initial rock mass into smaller pieces generally upon the first impact on the ground (Evans and Hungr, 1993), and the resultant fragments propagate downslope following trajectories and new dynamics (especially in terms of kinetic energy and height) compared to the source block. This definition covers both the disaggregation of the block fragments delimited by pre-existing discontinuities in the initial mass and the generation of new fragments due to the breakage of intact rock (Corominas et al., 2012; Ruiz-Carulla, 2018). Block fragmentation is generally at the origin of extreme behaviors, major damage, and accidents and can interact strongly with protection structures (Nocilla et al., 2009; Corominas et al., 2019). Even if fragmentation during rockfall is recognized as fundamental in risk analysis (Corominas et al., 2012), a complete understanding of the process during rockfall has not been achieved so far, remaining a phenomenon largely neglected during numerical modeling. Only a few numerical codes allow modeling propagation that explicitly takes into account fragmentation (Crosta et al., 2003; Frattini et al., 2012; Matas et al., 2017; Ruiz-Carulla, 2018). When missing an explicit algorithm, the modeling of rockfalls with fragmentation can be done with two alternative approaches: either the model is calibrated to replicate the spreading of the event, including the most distal fragments, or the model is calibrated to replicate only the main deposit, neglecting the most distal blocks. The first approach leads to hazard overestimation and the second to hazard underestimation.
The aim of this paper is to quantify rockfall hazard when accounting for the presence of trees and fragmentation with an explicit simulation approach (i.e., using a specific model) and to evaluate the differences with a classical approach that does not simulate explicitly such phenomena. The simulator Hy-Stone (Crosta and Agliardi, 2003, 2004, 2018b), which allows us to model both the presence of forest and fragmentation, and a new revised probabilistic rockfall hazard analysis (PRHA) are adopted to quantify the impact of these phenomena on the design of countermeasures and on hazard.
2.1 Rockfall analysis
2.1.1 Hy-Stone (HS)
The analysis of rockfall propagation was performed by means of Hy-Stone, a 3D rockfall simulator that reproduces the block motion from the dynamics equations (Crosta and Agliard, 2004; Frattini et al., 2012; Dattola et al., 2021) using a triangulated vector topography derived from digital terrain models (DTMs). The model allows us to simulate blocks with the shape of spheres, cylinders, ellipsoids, and discs. The stochastic nature of rockfall processes is accommodated by slope morphology and roughness and by the random sampling of most parameters from different probability density distributions (e.g., uniform, normal, exponential). The block trajectories are computed by splitting them in a succession of elementary motions: free fly, rolling, sliding, and impacts/bouncing. When the impact process is concerned, Hy-Stone has many different models comprising the constant and not-constant restitution coefficients (Pfeiffer and Bowen, 1989) and the elasto-visco-plastic model initially formulated by di Prisco and Vecchiotti (2006) and subsequently extended by introducing rotation and prismatic blocks (Dattola et al., 2021). Specific submodels explicitly account for the interactions between blocks and countermeasures or structures, between blocks and trees, and fragmentation (Frattini et al., 2012).
2.1.2 Tree-impact submodel
The block–forest interaction is modeled through a stochastic tree-impact submodel. Tree height, trunk diameter, absorbable energy, and density (as number of trees per 10 m2) are used as input to calculate at each cell a probability of impact that depends on the tree density, tree size, block size, and, in the case of impact, a loss of block kinetic energy and a lateral deviation of the trajectories (Frattini et al., 2012). The block kinetic energy lost by impact on tree stems is greatest for central impacts and decreases according to a Gaussian distribution away from the stem axis, while the angular deflection of the block on impact is assumed to vary according to the type of impact (central, lateral, scour) (Dorren et al., 2004b).
2.1.3 Fragmentation submodel
Hy-Stone can simulate the splitting up of a block in fragments moving independently from each other. The fragmentation occurs at impact when the kinetic energy of a block exceeds a limit energy defined by Yashima et al. (1987) based on the Weibull distribution. The Yashima expression is
where Ek,lim is the limit energy, ν is the Poisson coefficient, E is the Young modulus, Rbl is the radius of the parent block, V0 is a reference volume, σ0 is the strength at the reference volume, and mw is the Weibull distribution parameter. Coefficients Bf and Cf are computed according to the following expressions:
and
Coefficient Af is the result of the following expression:
Therefore, the threshold fragmentation energy depends on the geomechanical properties of the block and its volume (the larger the block, the lower the fragmentation energy). Once the fragmentation criterion is satisfied, a distribution of fragments is generated according to a power-law distribution:
where R(D) is the fragment size distribution, D is the fragment diameter, Dm is the maximum fragment diameter, and n is a model parameter. The maximum fragment size is a fixed fraction of the parent block size. The number of fragments is computed according to the mass conservation (the total fragment mass must be about the mass of the parent block) and the above distribution, and the energy of each fragment is calculated by means of the following expression:
in which mf,i is fragment mass, is the translational kinetic energy of the fragment, and αf is a model parameter. β is computed by imposing the translational energy conservation. Once the kinetic energy of a fragment is known, the inverse formula gives the fragment ejection velocity modulus. Fragment ejection velocity direction is computed stochastically within a cone whose aperture is a model parameter. Frattini et al. (2012) showed that block fragmentation has an effect on the runout extent and on the spatial distribution of velocities and heights of the flying rocks. The largest fragments, however, display a behavior that is more similar to that of the parent blocks.
2.2 Rockfall hazard assessment
To assess rockfall hazard, we propose a new revised PRHA (probabilistic rockfall hazard analysis), based on Lari et al. (2014), to build rockfall hazard curves starting from a set of block-volume scenario simulations. This methodology owes its idea on Cornell's (1968) probabilistic seismic hazard analysis (PSHA), which considers all possible earthquake scenarios to provide the exceedance probability of a certain level of ground motion at a site within a defined time frame. For each block-volume scenario, s, the probability of exceeding a certain value of intensity (i.e., the reach of a specific value of kinetic energy), for each position along the slope (z) is
where ps(Ek) is the probability density function of kinetic energy at the position z for the scenario s. Multiplying the exceedance probability by the annual frequency of occurrence (fs), we obtain the annual rate at which i is exceeded, Fs :
The annual frequency of occurrence (fs) of each scenario combines the onset frequency (fo) and the transit frequency (ft,s) at a certain position and for the specific scenario:
The onset frequency (fo,s) of blocks with a certain volume, Vs, can be expressed in terms of magnitude–frequency relationships (Hungr et al., 1999; Dussauge-Peisser et al., 2002; Rosser et al., 2007).
where N(Vs) is the cumulative number of individual blocks with volume larger than Vs for the scenarios s, and parameter a depends on both the area extent and the overall susceptibility of the cliff, whereas the power law exponent, b, mainly depends on lithology and geological structure (Hungr et al., 1999). To properly account for the frequency of individual blocks that propagate on the slope, it is necessary to combine the volume–frequency relationship of rockfall events with the volume–frequency relationship of blocks (Hantz et al., 2018; Hantz et al., 2020). The first relationship can be developed from surveyed historical events (e.g., Dussauge-Peisser et al., 2002; Chau et al., 2003; Guzzetti et al., 2003; Guthrie and Evans, 2004; Malamud et al., 2004) and provides annual frequencies of released rockfall volumes. However, these volumes should not be used for hazard analysis because single rockfall events disaggregate or fragment (Ruiz-Carulla et al., 2017) soon after the detachment and during propagation into a distribution of smaller individual blocks. On the other hand, the volume–frequency relationship of blocks can be derived from the rock mass fracture network or directly from already stopped blocks, both in the talus (Ruiz-Carulla et al., 2017), along roads (Hungr et al., 1999) and caught by rockfall nets within a certain range of time (Matasci et al., 2015; Moos and Dorren, 2022). However, these distributions usually lack the temporal frame that allows us to correctly estimate the annual frequency. The combination of the two distributions can be achieved by calculating the total volume of the event (integrating the first distribution) and by calculating the a parameter of the second distribution by assuming the total volume to be equal to the first one (Hantz et al., 2018).
The transit relative frequency (ft) can be calculated for the rockfall simulation and corresponds to the ratio between the number of potential paths passing through a position (ts) and the total number of simulated paths from the rockfall trajectories (ttot):
For rockfall scenarios with different magnitude that occur in a certain position along the slope, the total annual rate at which i is exceeded, Ftot , is derived from the sum of these scenarios, s:
By assuming a homogeneous, stationary Poisson process for the occurrence of the events (Crovelli, 2000), the probability of exceeding each intensity i in the next T years from this annual rate, Ppoiss, is
This represents the hazard curve at each position along the slope.
With respect to Lari et al. (2014), the revised PRHA method adopts a more flexible non-parametric approach for the kinetic energy probability distribution. Moreover, the new PRHA implements the approach proposed by Hantz et al. (2018, 2020) for the calculation of the onset frequency (fo), using the frequency-size distribution of the blocks observed along the talus to downscale the magnitude–frequency distribution of larger study areas.
2.3 Demonstration case studies
The application of potential rockfall scenarios was performed at the two representative sites that were recently affected by rockfall events in the Aosta Valley region (Western Italian Alps) showing a significant role of forest and fragmentation at Saint Oyen and Roisan (Fig. 1). During both the events, the rockfalls impacted roads and buildings, thus requiring a practical implementation of hazard assessment (for zonation) and the design of protection barriers (for mitigation).
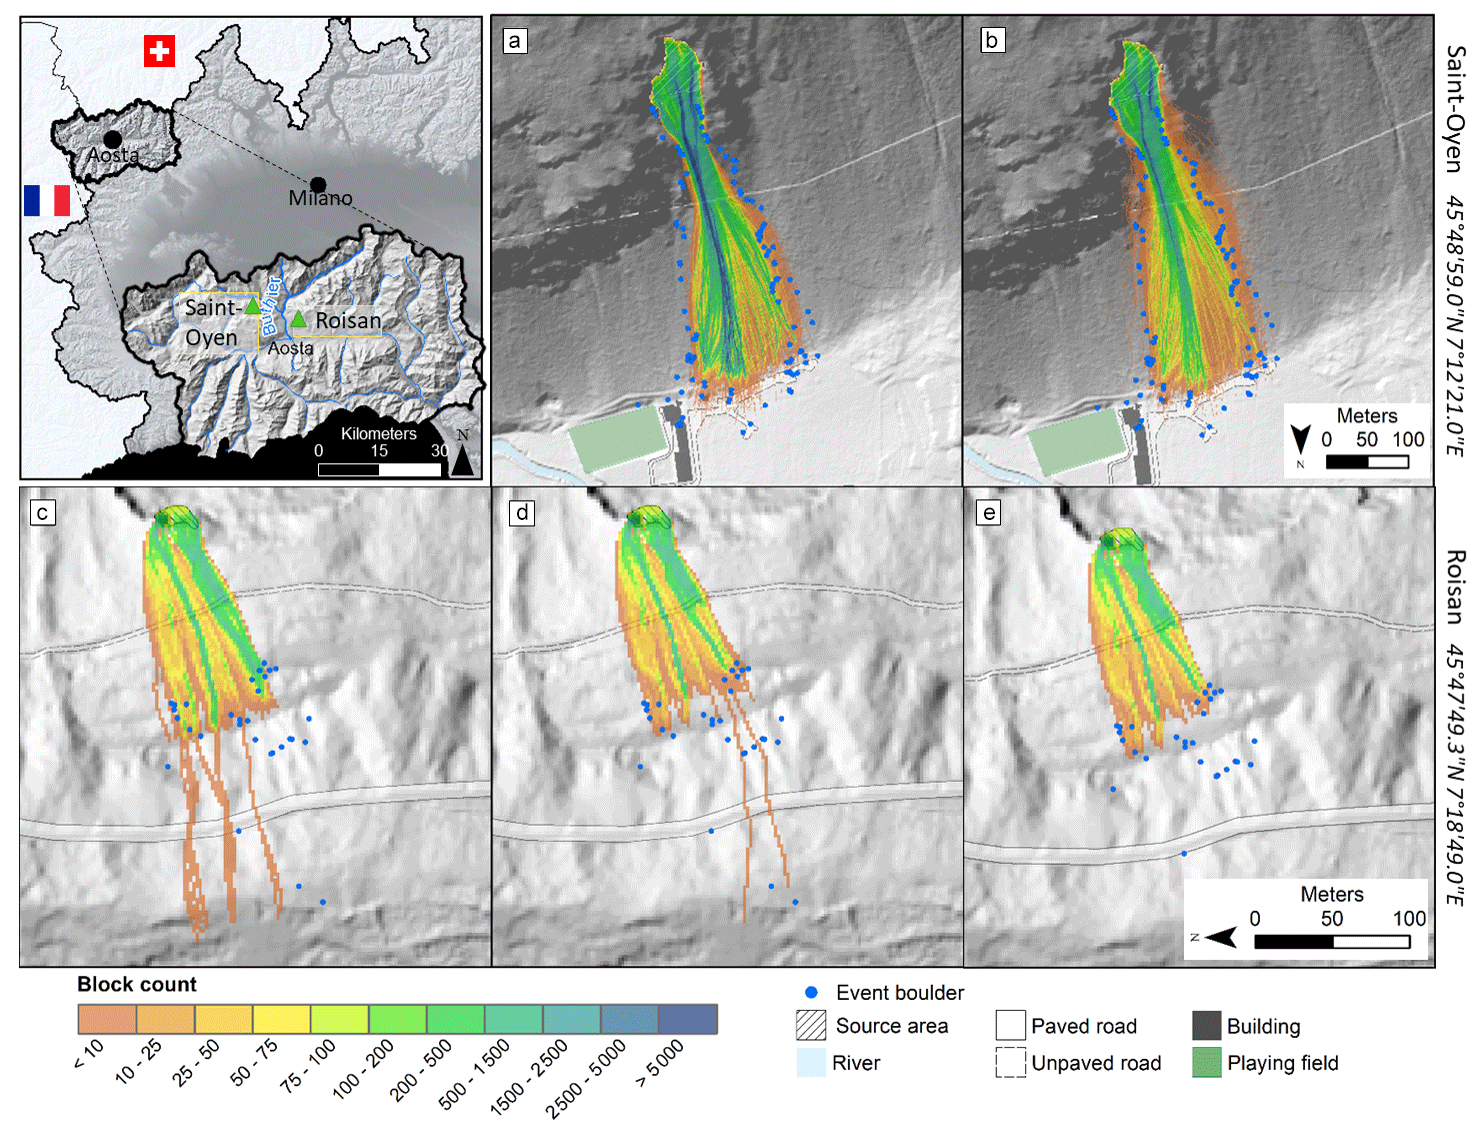
Figure 1(a) Location of the two case studies in the Aosta Valley region. The other panels show the back calibration of the rockfall events: (a) and (b) simulation of Saint-Oyen rockfall (a) with parameters modified to account for the forest (SO_HS) and (b) by adopting the Hy-Stone tree-impact algorithm (SO_HStree); (c) and (d) simulation of Roisan rockfall (c) with parameters modified to implicitly account for the possibility of fragmentation (R_HS) and (d) by adopting the Hy-Stone fragmentation algorithm (R_HSfrag). Panel (e) shows the calibration R_HSshort obtained by neglecting the most distal blocks: this approach simulates only the blocks that stopped in the main deposit without crossing the paved road.
Saint Oyen and Roisan are located in the Western Alps, within the Austroalpine–Pennidic collisional prism, consisting of overburden layers formed by continental crust and fragments of oceanic lithosphere, strongly reworked by the Alpine tectono-metamorphic processes (Dal Piaz et al., 2016).
In the Saint Oyen case study (45∘48′59.0′′ N, 7∘12′21.0′′ E), about 17 500 m3 of Ruitor micascists detached in March 2020 and reached a service road and the playing field in the lower part of the slope, passing through a mature fir forest. The presence of the forest significantly influenced the block distribution along the slope, increasing the lateral dispersion of trajectories and reducing their mobility. The case study is well documented by UAV flights conducted by the regional authority soon after the events, allowing for a detailed mapping of arrested blocks on the slope. We adopted this case study to investigate the role of forest, which has been fundamental for the rockfall dynamic, as observed in the field. Although minor fragmentation may have occurred during the event, we neglected it during the simulation to focus on tree impact only.
Less than 10 km away, at Roisan (45∘47′49.3′′ N, 7∘18′49.0′′ E), about 1050 m3 of Arolla gneiss toppled in October 2019 and impacted after 20 m of free fall (Polino et al., 2015) against a bench. While the main body of the rockfall stopped in a relatively flat area close to the source area, two blocks reached the foot of the slope causing the interruption of a municipal road. The event is documented by a post-event UAV flight and by a detailed field survey of the blocks. For this case study, the presence of forest was minor due to the size and age of the trees, and it has been neglected in order to reveal better the role of fragmentation.
For both case studies, we firstly back-calibrated the model parameters on the rockfall events in order to simulate several volume scenarios from local-scale rockfall source areas (with and without the use of specific algorithms for tree impact and fragmentation) to quantify the differences in terms of dynamics, spreading and rockfall hazard. We simulated all the scenarios by using spherical blocks and a 3D topography derived from the available 1×1 m lidar DTM of the Aosta Valley region. The characteristics of each simulation, the number of simulated blocks, and the parameters adopted when using the two algorithms are reported Tables S1, S2, and S3 in the Supplement.
3.1 Calibration by back-analysis
The calibration of model parameters was obtained by fitting the longitudinal and lateral extent of rockfall trajectories and deposits by using the Hy-Stone model with and without tree impact and fragmentation. In particular, we simulated the following scenarios (Fig. 1).
-
SO_HS (Saint-Oyen tree impact implicit). The values of parameters are set to account for the forest, e.g., increasing rolling friction and reducing the tangential restitution coefficient. This is the most classical approach adopted in the practice to “simulate” the effect of forest with an implicit approach.
-
SO_HStree (Saint-Oyen tree impact explicit). The values of parameters are calibrated by adopting the Hy-Stone tree-impact algorithm that explicitly simulates the effect of forest; in this case, the motion parameters used in the simulation do not account for the forest.
-
R_HS (Roisan fragmentation implicit). The values of parameters are set to allow the model to replicate the spreading of the event, including the most distal blocks, implicitly accounting for the possibility of fragmentation.
-
R_HSfrag (Roisan fragmentation explicit). The values of parameters are calibrated by adopting the Hy-Stone fragmentation algorithm that explicitly simulates the distal blocks as fragments.
For Roisan, we experimented a different calibration strategy that replicates the spreading of the main deposit only (R_HSshort), neglecting most distal blocks (Fig. 1e). Although this strategy is physically correct to simulate non-fragmenting blocks, it provides an overall spreading that strongly underestimates the possible reach distance of fragments and the hazard level, accordingly.
For Saint-Oyen, both the simulations (SO_HS, SO_HStree) provide a good match with the main deposit of the 2020 event (Fig. 1a and b), with a slightly larger spreading when using the tree-impact algorithm, consistently with the fact that the impact with trees adds a component of lateral dispersion to the trajectories.
For Roisan, we can observe a good match between the longitudinal and lateral extent of the main deposit from the 2019 event and the simulations (R_HS, R_HSfrag) but we observe an overestimation of the blocks reaching the paved road (18 blocks modeled, while just 2 blocks during the event) when the fragmentation algorithm is not used (Fig. 1c). The comparison with simulated stopping points shows that the model without fragmentation is able to reach the maximum distance but not in the right location, since trajectories are strongly controlled by topography. This does not happen with the fragmentation algorithm, which is able to replicate the right position of the distal blocks in the meadow (Fig. 1d).
In addition, the volume distribution is also considered. To this purpose the in situ block size distribution (IBSD) at the cliff considered in the previous numerical simulations was obtained previously by the geological survey of the Aosta Valley by means of a terrestrial laser scanner survey. In Fig. S1 a comparison of the rock block size distribution (RBSD) obtained with the orthophotos at the toe of the slope and the distributions obtained with the scenario R_HS, R_HSfrag is shown. The comparison reveals a good agreement, since the curves are parallel to each other, although the Hy-Stone distributions overestimate the in situ one.
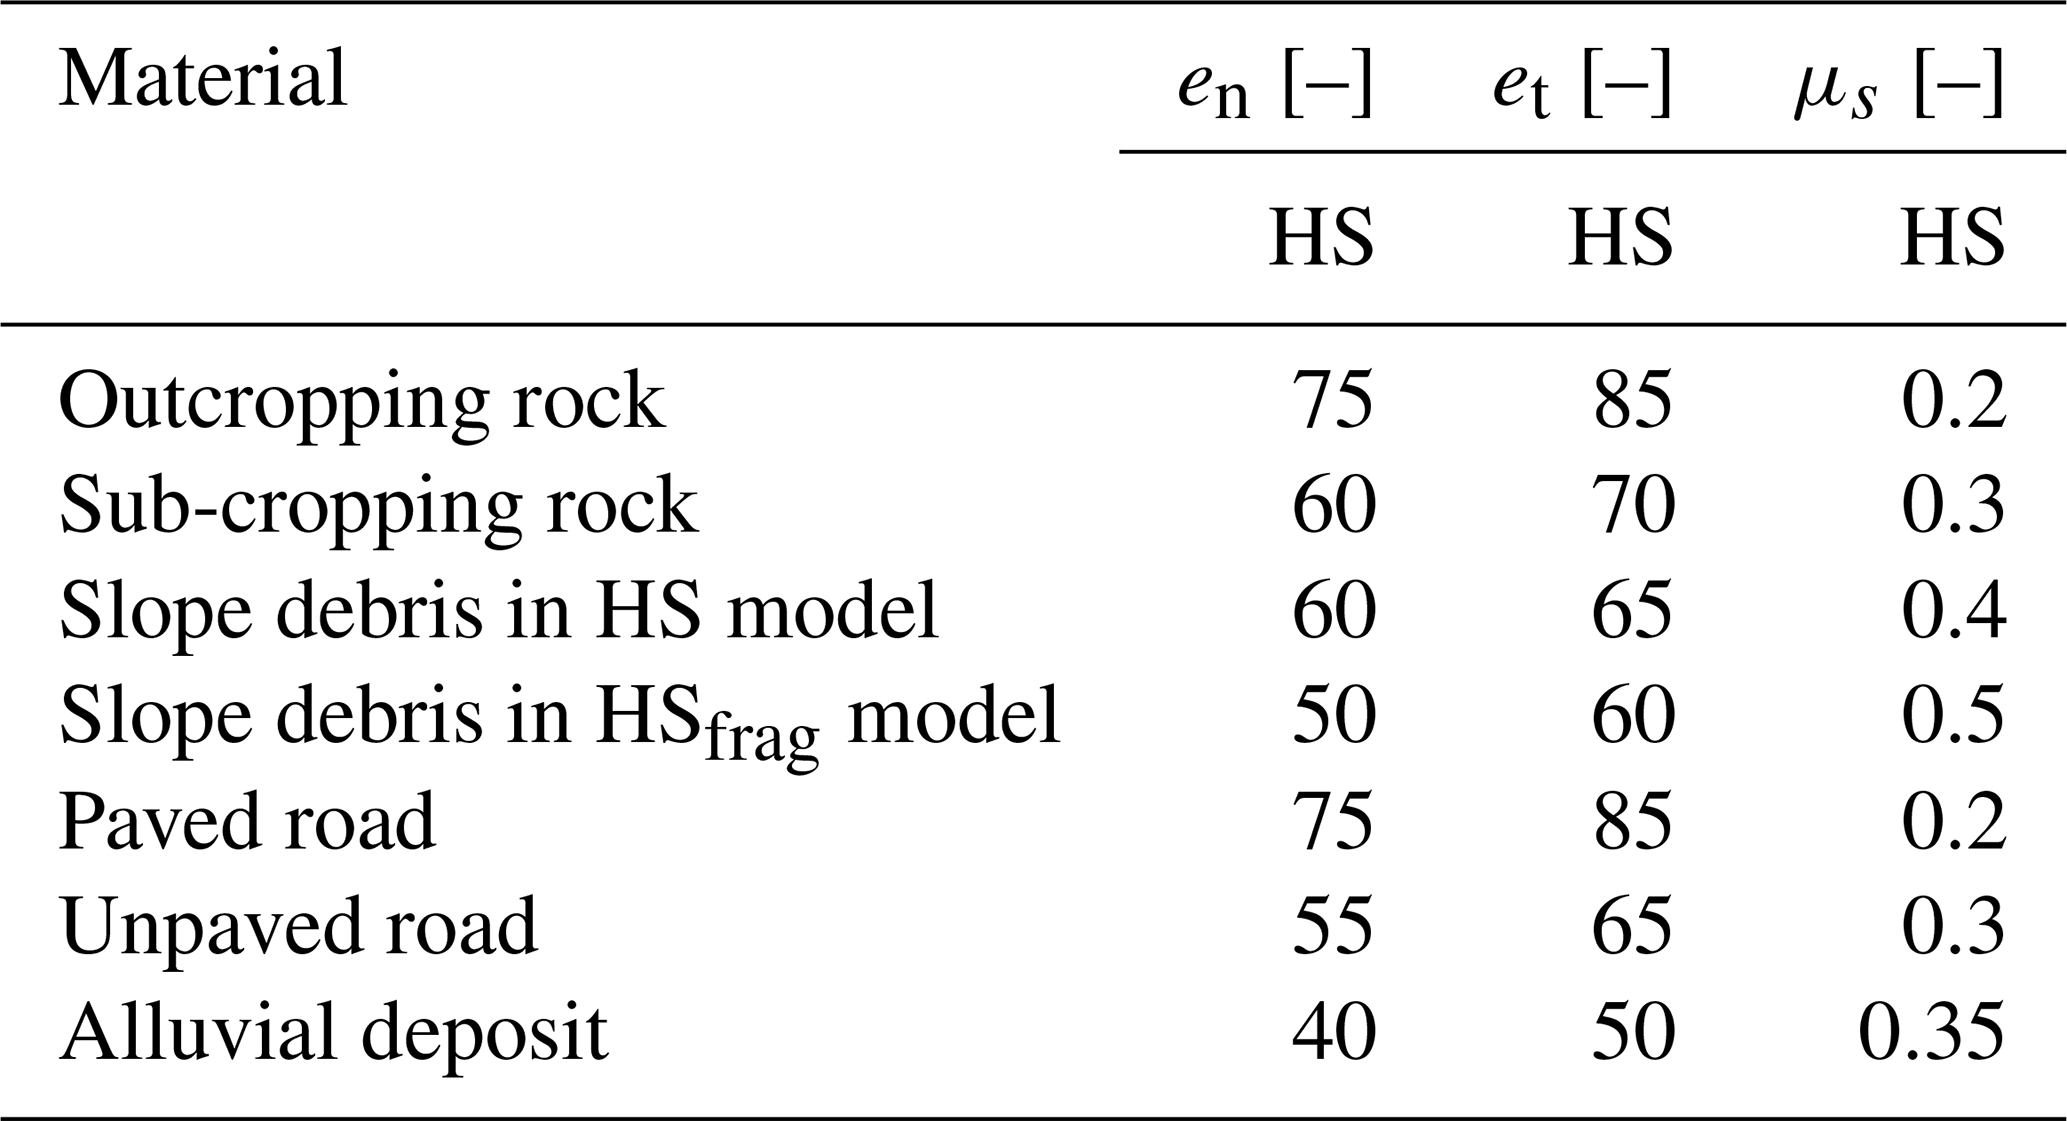
Tables 1 and 2 report the values of normal and tangential restitution coefficients and of the friction coefficient for the different slope materials used in the rockfall numerical simulations in the cases of SO_HS and R_HS. Tables S1 and S2 in the Supplement report the parameters of tree-impact and fragmentation algorithms used in the cases of SO_HStree and R_HSfrag.
Table 1Values of normal (en) and tangential restitution (et) coefficients and of the friction coefficient (μs) for the different slope materials used in the rockfall numerical simulations for the Saint-Oyen case study.
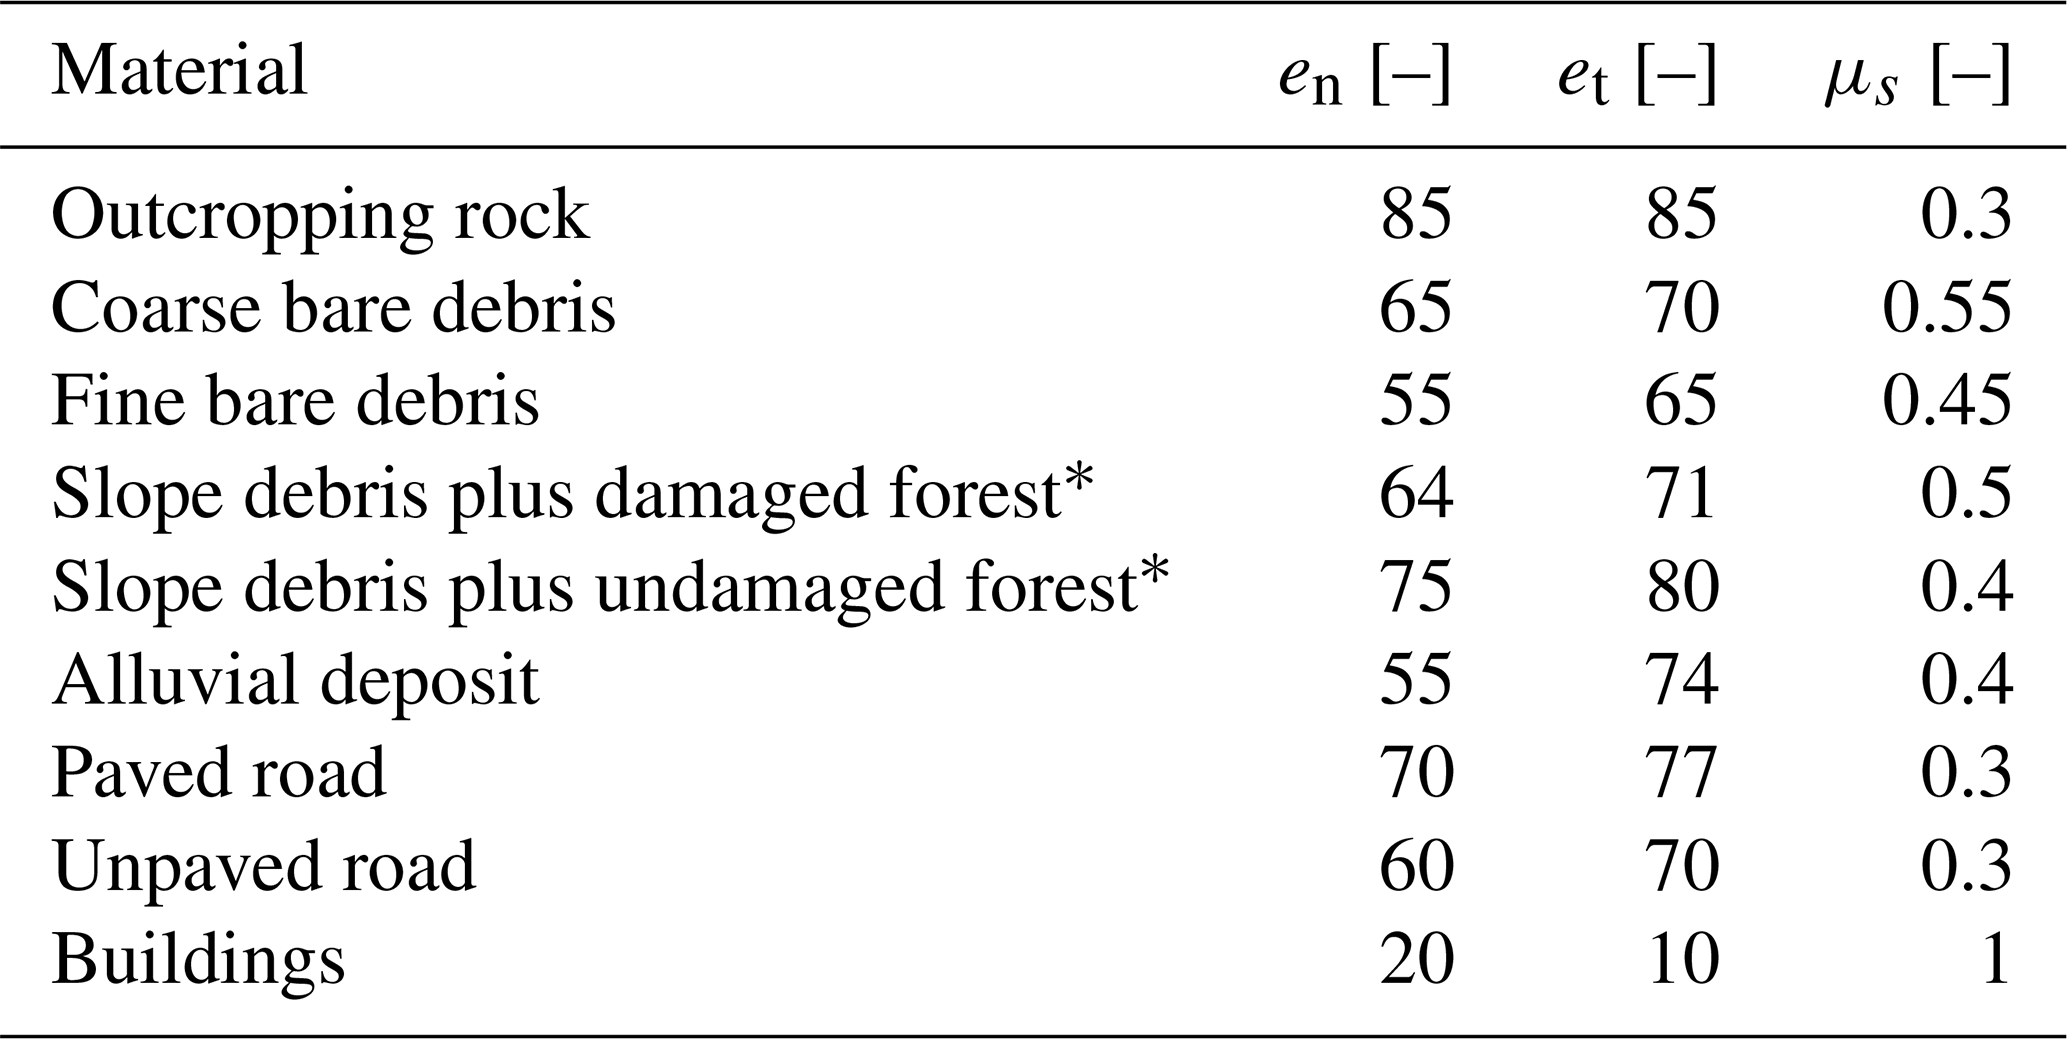
∗ Only for the explicit approach (HStree).
Table 2Values of normal (en) and tangential restitution (et) coefficients and of the friction coefficient (μs) for the different slope materials used in the rockfall numerical simulations for the Roisan case study.
3.2 Effect of tree-impact and fragmentation submodels on kinetic energy
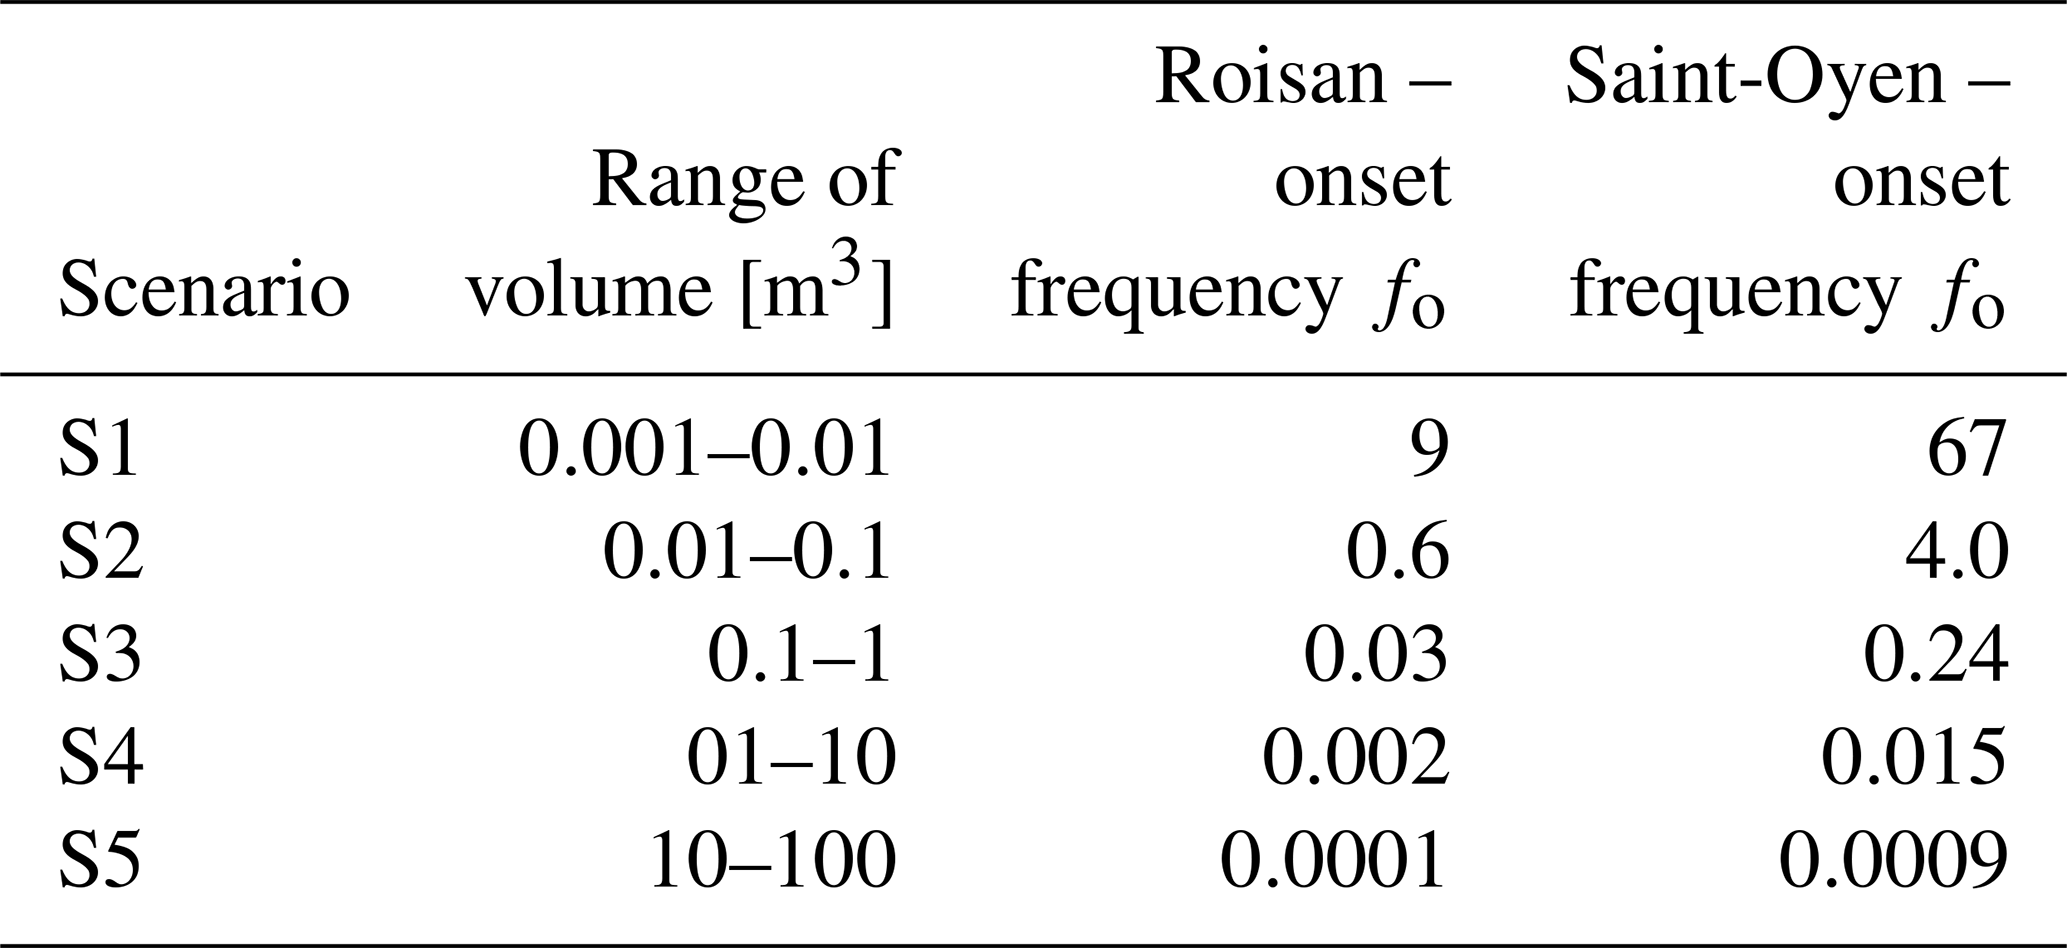
To quantify the effect of explicitly simulating tree impact and fragmentation in rockfall modeling, we performed simulations for five scenarios in which the released volumes are changed (Table 3), using the modeling parameters that were back-calibrated from the events as previously described. The volume scenarios range from 0.001 to 100 m3 to encompass the block sizes surveyed on the field at the two sites.
For the spatial analysis, we divided the slope into a 10×10 m square lattice, and we calculated statistics of kinetic energy within each square.
3.2.1 Effect of tree-impact submodel
Figure 2 shows the 95th percentile of the blocks' kinetic energy in each 10 m square considering the first and fifth scenario with and without the forest submodel. This statistic variable has been chosen since it is frequently used for designing defensive works (UNI 11211; Macciotta et al., 2015; Lambert et al., 2021). In the case of low-volume blocks, the simulation without the tree-impact submodel (Fig. 2a) shows a central sector characterized by the highest kinetic energies (from 2500 kJ up to over 10 000 kJ for the 95th percentile) and a distal zone characterized by lower values. Trajectories are able to reach the base of the slope, the unpaved road, buildings, and playing field and pass over the location of the outermost blocks of the 2020 event. When using the tree-impact submodel (Fig. 2b), the number of trajectories passing through the central sector of the slope decreases dramatically. The trajectories that reach the base of the slope are concentrated in the area affected by the 2020 event where the forest is damaged. These trajectories reach only the unpaved road, with associated 95th percentile kinetic energy values of less than 2500 J. For large blocks (fifth scenario), the kinetic energy is high enough to nullify the effect of forest, and the two analyses without and with tree-impact submodels become similar (Fig. 2c and d).
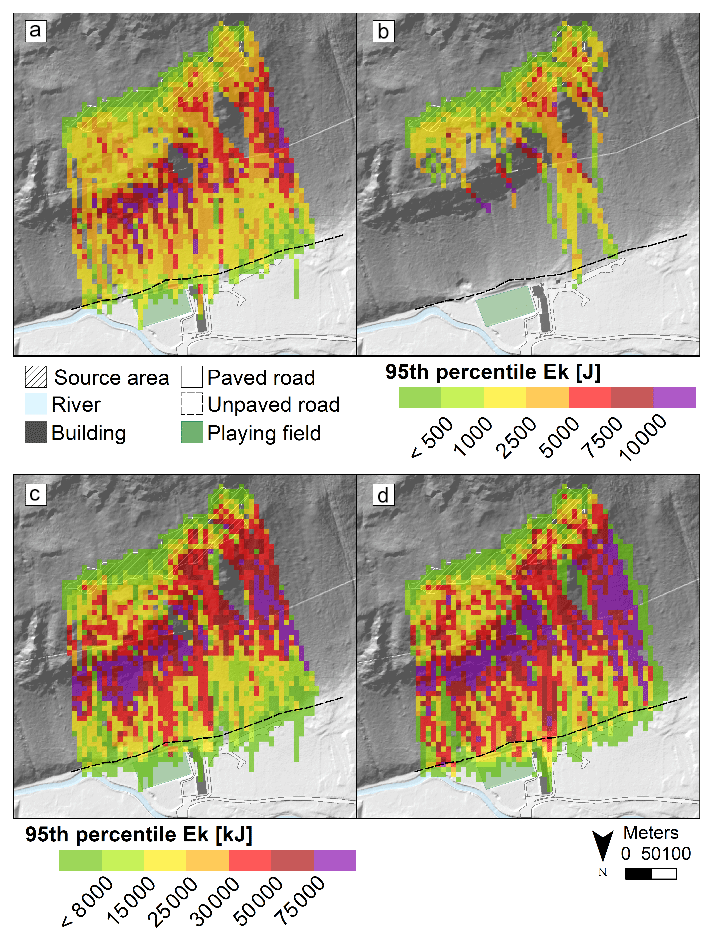
Figure 2Distribution of kinetic energies of blocks along the slope in the Saint-Oyen case study. The value of each cell corresponds to the 95th percentile of the kinetic energy of the blocks passing through that cell. Panel (a) scenario S1 (small blocks) HS, (b) scenario S1 (small blocks) HStree, (c) scenario S5 (large blocks) HS, and (d) scenario S5 HStree (large blocks).
From these results, it is evident that the use of the tree impact submodel is relevant in the case of low-volume blocks, for which the simulated trees are able to interrupt most of the computed trajectories and in any case to decrease the kinetic energies. On the contrary, tree-impact analysis is almost irrelevant for high-volume blocks.
Analyzing the distribution of kinetic energies along the road and the number of blocks at the foot of the slope without (HS) and with (HStree) the tree impact submodel, we systematically observe lower values of energy for the HS analyses (Fig. 3). Indeed, in these models, the effect of the forest is simulated by reducing the restitution coefficients and increasing friction coefficient, calibrated on the range of kinetic energies of the event. However, this coefficient modification is independent of the block mass of the simulated blocks, and, therefore, it is not possible to observe the scale effect revealed in the HStree analyses.
When the kinetic energies are lower than both the calibrated kinetic energies and the kinetic absorption energies of the trees (scenarios S1 and S2), the classical HS approach overestimates the runout (see the large number of blocks intersecting the road after crossing the forest in Fig. 2a). Instead, the HStree algorithm intercepts, slows, and stops the least energetic blocks, allowing only the most energetic to reach the lower part of the slope. As a result, few transits are obtained but with much higher kinetic energies due to the filtering effect of the forest (Fig. 3).
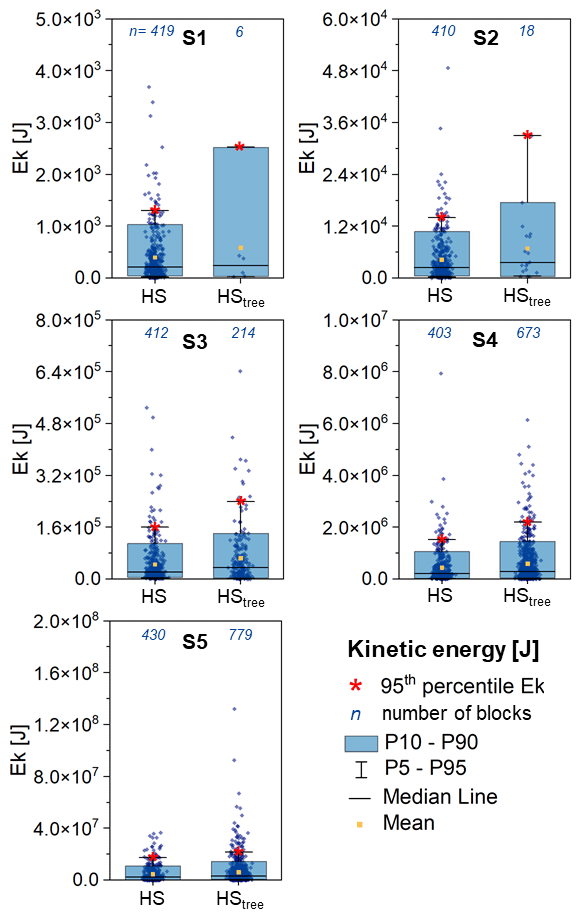
Figure 3Boxplots of kinetic energy values recorded for each scenario (S1 to S5) at the foot of the slope in the Saint-Oyen case study. The associated 95th percentile value is highlighted by the red star. The total number of simulated blocks for each scenario is 995.
In contrast, when the kinetic energies grow beyond the calibration range (scenarios S4 and S5), the classical HS approach continues to apply the forest effect (through the modified parameters) even though the kinetic energies are well above the tree absorption energies, underestimating the runout (the number of blocks intercepting the road remains about the same as in the low-energy scenarios) and the kinetic energies (Fig. 3). For the HStree,s analyses in these scenarios, S4 through S5, show higher kinetic energies and a high number of transits (compared to the lower-volume scenarios) because the effect of the trees becomes negligible, as it should be (Fig. 3).
In the intermediate S3 scenario, greater congruence between the two approaches HS and HStree is observed (Fig. 3) because the simulated volumes are similar to the calibration range (between 0.001 and 34 m3).
3.2.2 Effect of fragmentation submodel
Figure 4 shows the 95th percentile of the blocks' kinetic energy in each 10 m square grid with and without the adoption of the fragmentation submodel considering the first and fifth scenarios. The behavior of the analyses with small or large block volumes is extremely different. In the case of low-volume blocks, the adoption of the fragmentation algorithm is almost negligible because blocks are too small to undergo fragmentation. In Fig. 4a the highest 95th percentile values of kinetic energy for the first scenario and without fragmentation are concentrated in the area located just below the modeled source and at the highest escarpment, and only four trajectories characterized by values up to 3 kJ reach and cross the paved road. In Fig. 4b we observe that the highest 95th percentile values considering the fragmentation are concentrated in the area close to the cliff, but only one trajectory passes the road, characterized by the 95th percentile of kinetic energy being much lower (up to 1.5 kJ).
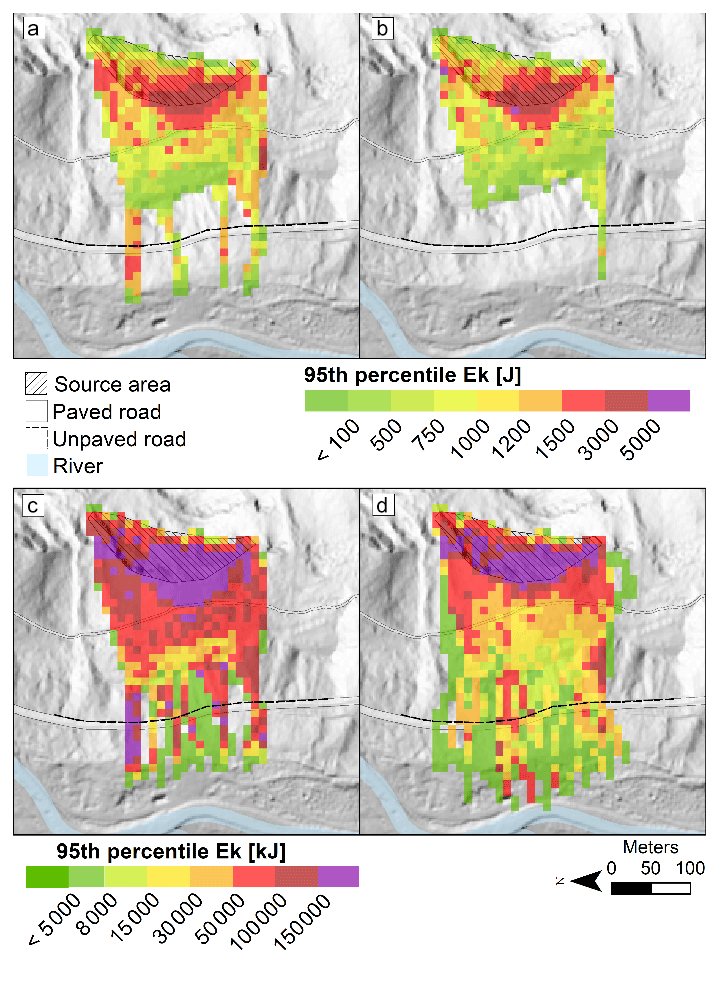
Figure 4Distribution of kinetic energy of blocks along the slope in the Roisan case study. The value of each cell corresponds to the 95th percentile of the kinetic energy of the blocks passing through that cell. Panel (a) scenario S1 (small blocks) HS, (b) scenario S1 (small blocks) HSfrag, (c) scenario S5 (large blocks) HS, and (d) scenario S5 (large blocks) HSfrag.
For larger blocks (S5 scenario), the difference with and without fragmentation is much more significant because more blocks are fragmented (612 out of 2646, 23 %). In Fig. 4c without fragmentation the runout achieved by blocks does not exceed that of Fig. 4a but with much larger values associated with the 95th percentile of kinetic energy reached all over the slope. The area located just below the modeled source and in the highest escarpment is characterized by kinetic energy values greater than 50 000 kJ at the intersection with the unpaved road. Values remain high also at the intersection with the paved road. In Fig. 4d in which the fragmentation is considered there is an increase in the number of blocks crossing the roads, a consequent spread of trajectories with longer runouts (more than those actually achieved during the event) and a decrease in kinetic energy due to block fragmentation. On the unpaved road, the values associated with the 95th percentile drop to 50 000 kJ, and where the event boulder stopped it decreases to 8000 kJ. At the intersection with the paved road, percentile values are more frequently lower than 15 000 kJ except in an isolated section where they reach 50 000 kJ and over.
Analyzing the distribution of kinetic energies along the paved road at the foot of the slope without (HS) and with (HSfrag) the fragmentation submodel, we systematically observe higher values of energy for the HS analyses (Fig. 5). Although during the event very few blocks crossed the paved road and only two of them reached the meadow at the foot of the slope, the calibration of the model without fragmentation was accomplished by adjusting the parameters in order to reach the maximum runout. This causes a strong overestimation of the number of blocks crossing the paved road, a general overestimation of the landslide runout, and therefore also an overestimation of the kinetic energies at the element at risk. As already said for the Saint-Oyen case study, the runout in the HS models is almost independent from the block mass. Therefore, the number of transits is roughly constant in all five scenarios.
Instead, in the HSfrag approach, the kinetic energy at the element at risk is systematically lower because the model is calibrated to allow only ejected fragments (characterized by much lower volumes with respect to original blocks) to reach and cross the paved road as occurred during the event. The number of fragments reaching the road increases significantly through different volume scenarios (from S1 to S5). This depends on the relationship between block size and fracture energy (Yashima et al., 1987); according to this relationship, the fracture energy scales with the radius of the block by an exponent that depends on the Weibull's coefficient of uniformity and is always lower than 3, which is the scaling of the kinetic energy with radius. Hence, the larger the block is, the higher the probability of fracturing is for a certain velocity.
The two approaches HS and HSfrag provide similar results in the S4 scenario (characterized by simulated volumes that are similar to the calibration range, between 0.5 and 23 m3) both in terms of number of blocks intersecting the road and in terms of kinetic energies: compared to all other scenarios, less than an order of magnitude separates the two 95th percentile values of kinetic energy.
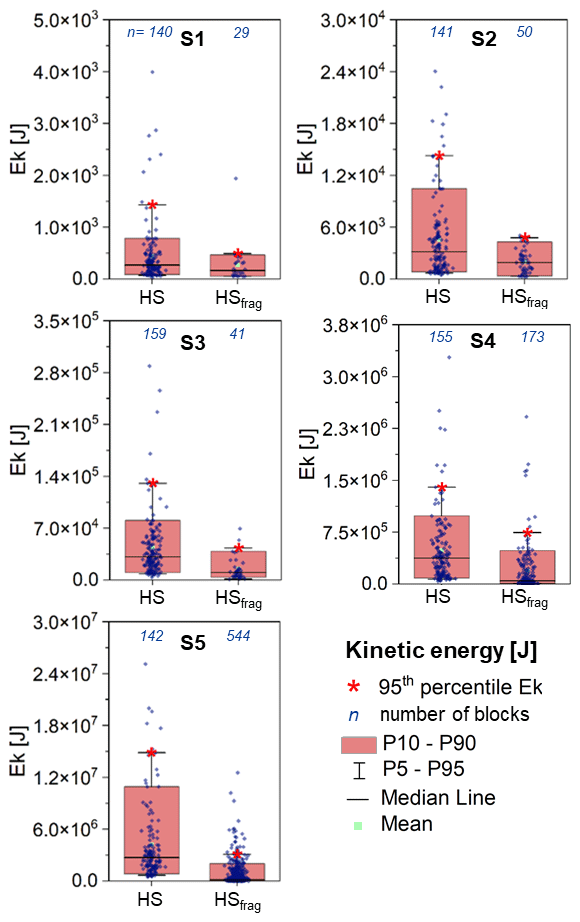
Figure 5Boxplots of kinetic energy values recorded along the road at the foot of the slope in the Roisan case study. The associated 95th percentile value is highlighted by the red star. The total number of simulated blocks is 2646.
3.3 Rockfall hazard
As explained in the Methods section, the assessment of rockfall hazard requires the onset frequencies f0,s for each magnitude scenario, the transit frequency ft,s, and the distribution of kinetic energy in each position along the slope. For the calibration of onset frequency parameters (Eq. 10), we adopted the methodology of Hantz et al. (2018), who related the magnitude–frequency relationship of all rockfall events within a fixed site with the size-frequency relationship of blocks along the talus for a specific event at the same site.
We obtained the magnitude–frequency relationship by analyzing the available rockfall database of the Aosta Valley region, which includes 306 events with volume information (Fig. 6). Among them, only 25 belong to the same catchment of the case studies (Buthier catchment; Fig. 6). Since this subsample appears to be insufficient to characterize the magnitude–frequency curve, especially for smaller volumes that are not recorded, we therefore adopted the entire inventory that we fitted with a maximum likelihood approach, obtaining a good power-law fitting (R2=0.99) for rockfalls larger than 10 m3, with a scaling exponent of 0.56. We believe that this parameter value is reliable also for the Buthier catchment, since the fitting curve has the same slope as larger rockfall volumes (with a volume greater than 500 m3) within the subsample. Therefore, this parameter b is adopted for the two case studies.
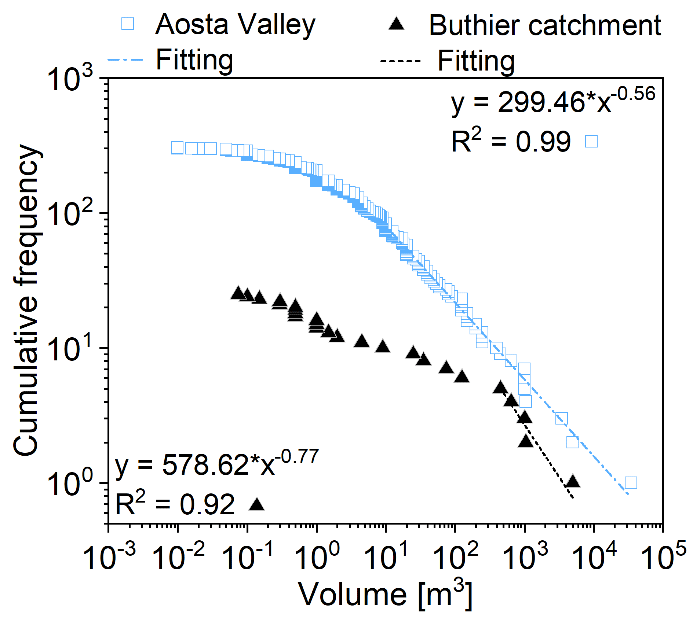
Figure 6The two magnitude–frequency relationships of 306 rockfall events collected in the Aosta Valley region (blue empty squares) and the 25 events from the Buthier catchment (black triangles).
For the parameter a, we used the size-frequency relationship of blocks along the talus obtained by image analysis. Figure 7 shows an excellent power-law fitting (R2=0.99) for blocks larger than 0.2 m3, with a scaling exponent b equal to 1.22. Eventually, by relating the magnitude–frequency size frequency and accounting for the potential unstable area of both case studies, we obtained an a value of 0.0072 and of 0.0021 for Saint-Oyen and Roisan, respectively. The resulting onset frequencies for the different volume scenarios are reported in Table 3 for both case studies.
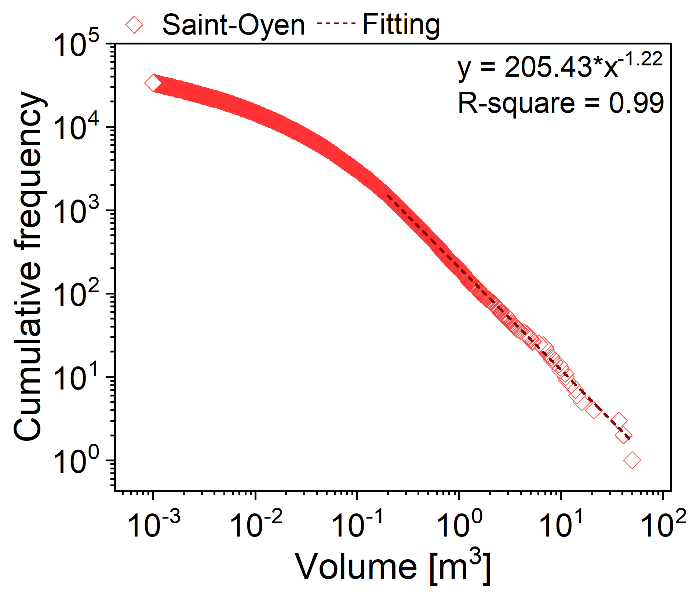
Figure 7The size-frequency relationship of blocks along the talus obtained by image analysis for the Saint-Oyen event.
Both transit frequency (ft,s) and the distribution of the kinetic energy come from the rockfall simulation trajectories sampled within 10×10 m cells. In order to characterize the kinetic energy distribution, we tested the hypothesis adopted by Lari et al. (2014), who assumed the logarithm of the kinetic energy to be normally distributed, and obtained the kinetic energy probability density ps(Ek) by using the mean and standard deviation statistics. The Kolmogorov–Smirnov's test (Fig. 8) shows that the normality is not rejected for more than 50 % of the 10×10 m cells when using Hy-Stone without additional algorithms. However, this percentage is lower when using the tree-impact and fragmentation algorithms, suggesting that a non-parametric approach should be adopted when the level of complexity increases.
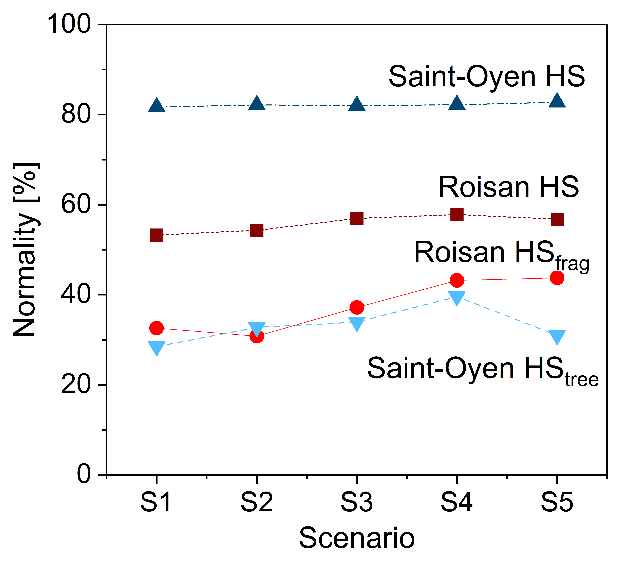
Figure 8Test of the normality of log-kinetic energy distribution within 10×10 m cells for all the volume scenarios. The y axis shows the percentage of cells where the normality is not rejected by the Kolmogorov–Smirnov test.
By combining the various scenarios and taking into account their associated probabilities (Eq. 12), we constructed the hazard curves (by Eq. 13), which show the probability of exceeding a certain level of intensity in 50 years. Figure 9 shows hazard curves only for some representative cells. We can assert that they do not always have a logarithmic distribution and that some curves (not here reported) do not reach the exceedance probability of 0.1 due to a very low transit frequency. Subsequently, for each location along the slope and for each model analysis (SO_HS, SO_HStree, R_HS, and R_HSfrag), we computed from each hazard curve, fixing the exceedance probability in 50 years at 10 % as done by Lari et al. (2014), the corresponding kinetic energy which is used to represent the hazard through a hazard map (Fig. 10).
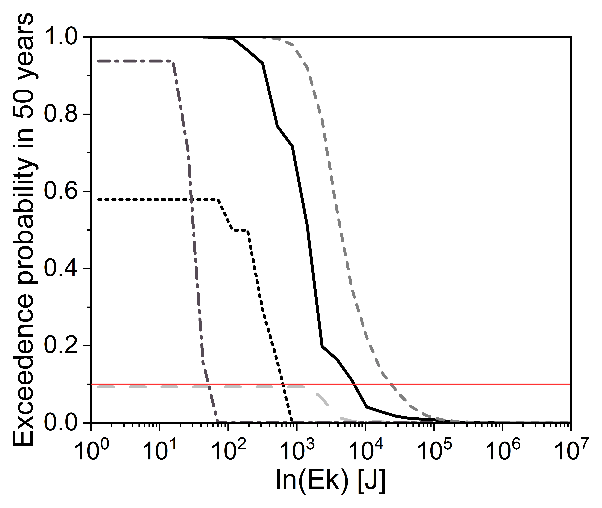
Figure 9Example of hazard curves characterized by a non-logarithmic trend, calculated in five cells of the R_HS model.
Compared to the SO_HS model (Fig. 10a), in SO_HStree (Fig. 10b) the hazard decreases because kinetic energy is significantly lowered, except with respect to the two sectors most affected by the event (see calibration in Fig. 1) where it remains similar (Fig. 10a and b). The total area involved remains about the same, although with slightly lower runout. However, if only the areas with Ek>1 kJ are considered, hazard decreases significantly along the road at the foot of the slope.
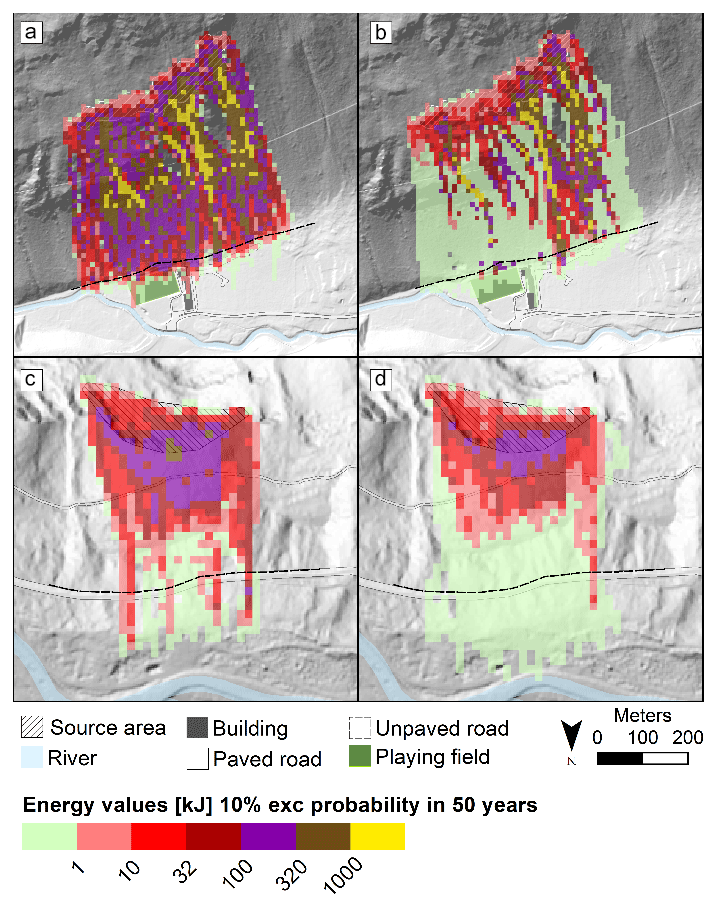
Figure 10Hazard map for (a) Saint-Oyen SO_HS model, (b) Saint-Oyen SO_HStree model, (c) Roisan R_HS model, and (d) Roisan R_HSfrag model. The hazard is quantified as the kinetic energy associated with a 10 % probability in 50 years.
For the Roisan case study, compared to the R_HS model, in R_HSfrag the hazard decreases because the kinetic energy is significantly lowered, but note that the area involved increases (Fig. 10c and d). Analyzing the distribution of the hazard values (Fig. 11) at the foot of the slope obtained by the different approaches without and with the tree impact and fragmentation algorithms, we observe an overestimation of the potential hazard in both case studies. In the Roisan case study, the overestimation is particularly high because the chance to fragment the blocks into smaller fragments greatly reduces the kinetic energy of those. Moreover, the distribution is less sparse because the only blocks with an energy value higher than the minimum energy value (1 kJ) that are able to reach the foot of the slope are few and localized in a 10 m corridor.
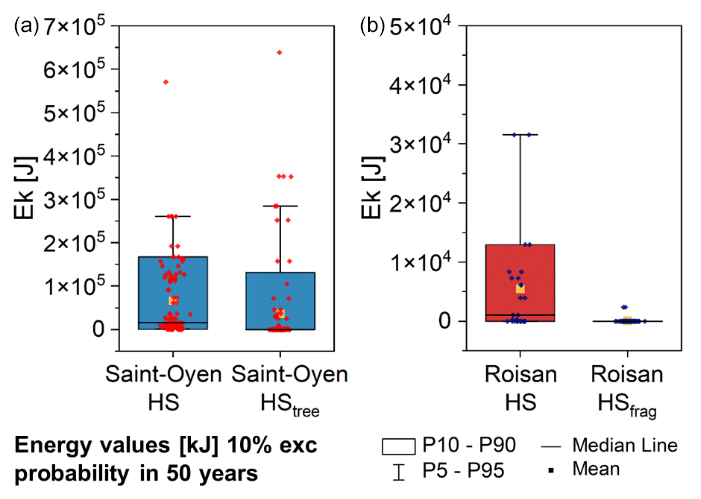
Figure 11Boxplot of the kinetic energy associated with a 10 % probability in 50 years for Saint-Oyen (blue boxplots on the left) and Roisan (red boxplots on the right) case studies, recorded along the road at the foot of the slope (dashed line in Fig. 10).
When hazard and risk need to be assessed, having a repeatable procedure and possibly a unique result is required. This study demonstrates that different modeling approaches can influence both the hazard analysis and the design of countermeasures but also points out the problems involved in advanced modeling, leading to necessary discussions on the topic.
4.1 Tree impact
The classical approach for modeling rockfall propagating along forested slopes is based on the modification of restitution and friction coefficients, calibrated on the extent of block propagation. This study shows that the adoption of this set of modified restitution coefficients provides a correct replication of the maximum lateral spreading and longitudinal runout but inaccurate energy of blocks. In fact, the modification of the restitution coefficients is independent of the size of the blocks and can slow down even those blocks that are large enough to be actually unaffected by the presence of the forest. This leads to an overestimation of rockfall runout and of the number of blocks reaching the elements at risk. When the protective role played by the forest is explicitly simulated (HStree), the hazard decreases due to the forest protection, but the high percentiles of kinetic energy become higher. This occurs because the trees stop the blocks with lower kinetic energy, generating a filtering effect of the larger blocks, leading to the risk of considering, paradoxically, the presence of the forest as more dangerous. These considerations open an important discussion on the opportunity to design the defensive works only based on percentiles of the kinetic energy.
4.2 Fragmentation
In the case of rockfalls characterized by fragmentation, the classical approach for calibrating the model with this events is based on a conservative adjustment of the parameters in order to reach the maximum runout of single fragments. We demonstrate that this approach leads to a strong overestimation of the number of transits (Fig. 4), the overall landslide runout, the kinetic energy of blocks impacting the elements at risk (Fig. 5), and the hazard (Fig. 10). On the other side, the alternative approach to replicate only the main deposit, neglecting the most distal blocks, would result in an underestimation of all these quantities (Fig. S5 in the Supplement). Therefore, regardless of whether deciding to simulate only the blocks that have stopped in the main deposit (Fig. 1e) or to extend the trajectories to the maximum fragment extent (Fig. 1c), this study demonstrates that the result is fundamentally incorrect, especially for the design of defensive works. On the other side, the explicit modeling of fragmentation is still challenging from both a theoretical point of view (Ruiz-Carulla et al., 2017; Shen et al., 2017; Guccione et al., 2022) and a practical point of view due to the difficulty in calibrating the geotechnical parameters that control fragmentation. This adds further uncertainty in the analysis of rockfall dynamics and hazard.
The results of hazard computation when using the fragmentation show a decrease in the hazard. However, as in the case of forest, this results from the fact that more importance is given to the kinetic energy of the blocks and not the frequency. Is it correct to infer that the hazard decreases, mostly due to the decrease in kinetic energy, even if the frequency increases and the trajectories are much more dispersed? Our belief is that this inference is not entirely accurate since the area affected by rockfalls is larger, even if blocks are smaller. This discussion leaves room for future new studies.
4.3 Probabilistic rockfall hazard
The PRHA approach allows us to quantify rockfall hazard in terms of hazard curves, thus describing the probability of exceeding a certain level of hazard. For each magnitude scenario, the approach overcomes the need of selecting a statistic of the kinetic energy at a certain position along the slope (Agliardi et al., 2009; Farvacque et al., 2021) and allows us to consider the full energy distribution within a certain grid cell. With respect to Lari et al. (2014), the revised PRHA method presents two improvements: (i) the adoption a more flexible non-parametric approach for the kinetic energy probability distribution, instead of assuming a log-normal distribution, that we demonstrate in this paper to be frequently violated if tree impacts and fragmentation subsist (Fig. 8); and (ii) the implementation of the approach proposed by Hantz et al. (2016, 2019) for the calculation of the onset frequency (fo,s). This approach allows us to relate the onset frequency estimated from historical catalogues with the frequency-size distribution of blocks along the slope. In fact, the large volumes recorded in the catalogues typically disaggregate into a population of blocks as soon as they impact on the slope. This disaggregation occurs due to the presence of pre-existing joints and fractures of a jointed rock mass (Ruiz-Carulla et al., 2017) and does not correspond to a fragmentation. The adoption of the Hantz et al. (2016, 2019) approach places emphasis on the block size distribution along the slope, both to define the design volumes (Melzner et al., 2020) and to support the correct definition of the onset frequency.
The insight drawn from this study leads us to the following conclusions:
-
If we do not explicitly simulate forest, we underestimate the protective role of trees and consequently overestimate the hazard. On the other hand, the 95th percentile of the simulated kinetic energy of the blocks is higher when adopting the tree-impact algorithm because of the filtering effect performed by trees.
-
If we do not explicitly simulate the fragmentation phenomenon, we overestimate the hazard in terms of energy values but underestimate the spreading of blocks during the events. The 95th percentile of kinetic energy along the element at risk is significantly lower when adopting the fragmentation algorithm.
-
We obtained non-log-normal distributions of the kinetic energy values, so we adopted a non-parametric approach that we demonstrate to be suitable for the hazard analysis. We highlight how PRHA fits different methodological models, and we quantify how much explicitly simulating both the interaction with forest and the fragmentation process leads to more accurate hazard mapping.
-
As already mentioned in the Discussion, we pointed out the need to simulate a distribution of blocks that is representative of what already occurred as being so far the most likely because the dimensioning of the mitigation works is centered on the expected and simulated kinetic energies of the blocks. We also used the frequency-size distribution of the blocks along the talus to downscale the magnitude–frequency distribution of the study area, as proposed by Hantz et al. (2018), to simulate different volume class scenarios.
-
This study highlights the strong dependency of the 95th percentile of kinetic energy on the adopted modeling approach, showing the fluctuations in this value and thus the uncertainty related to the use of this parameter for hazard analysis.
The digital elevation models are publicly accessible at https://geoportale.regione.vda.it/download/dtm/ (Geoportale Regione Valle d'Aosta, 2023). The numerical simulation results are available from the corresponding author upon request.
The supplement related to this article is available online at: https://doi.org/10.5194/nhess-23-2349-2023-supplement.
CL, PF, and GBC contributed to the conceptualization of the project, formal analysis, investigation, methodology, visualization, writing of the original draft, and reviewing and editing of the text. DB contributed by data collection with the geological survey of the Aosta Valley region. GS, GD, and JS contributed to the analysis, reviewing, and editing of the text.
The contact author has declared that none of the authors has any competing interests.
Publisher’s note: Copernicus Publications remains neutral with regard to jurisdictional claims in published maps and institutional affiliations.
The authors would like to acknowledge the support of the geological survey of the Aosta Valley region and also Serena Lari for useful discussions.
This paper was edited by Andreas Günthers and reviewed by two anonymous referees.
Agliardi, F., Crosta, G. B., and Frattini, P.: Integrating rockfall risk assessment and countermeasure design by 3D modelling techniques, Nat. Hazards Earth Syst. Sci., 9, 1059–1073, https://doi.org/10.5194/nhess-9-1059-2009, 2009.
Azzoni, A., La Barbera, G., and Zaninetti, A.: Analysis and prediction of rockfalls using a mathematical model, Int. J. Rock Mech, 32, 709–724, 1995.
Berger, F. and Dorren, L. K.: Principles of the tool Rockfor.net for quantifying the rockfall hazard below a protection forest, Schweiz. Z. fur Forstwes., 158, 157–165, https://doi.org/10.3188/szf.2007.0157, 2007.
Berger, F., Quetel, C., and Dorren, L. K.: Forest: a natural protection mean against rockfalls, but with which efficiency, International congress INTERPRAEVENT, 2, 815–826, 2002.
Bigot, C., Dorren, L. K., and Berger, F.: Quantifying the protective function of a forest against rockfall for past, present and future scenarios using two modelling approaches, Nat. hazards, 49, 99–111, 2009.
Chau, K. T., Wong, R. H. C., Liu, J., and Lee, C. F.: Rockfall hazard analysis for Hong Kong based on rockfall inventory, Mech. Rock Eng., 36, 383–408, 2003.
Corominas, J., Copons, R., Moya, J., Vilaplana, J. M., Altimir, J., and Amigó, J.: Quantitative assessment of the residual risk in a rockfall protected area, Landslides, 2, 343–357, 2005.
Corominas, J., Mavrouli, O., Santana, D., and Moya, J.: Simplified approach for obtaining the block volume distribution of fragmental rockfalls, edited by: Eberhardt, E., Froese, C., Turner, A. K., and Leroueil, S., Landslides Eng. Slopes, 2, 1159–1164, 2012.
Corominas, J., Mavrouli, O., and Ruiz-Carulla, R.: Rockfall occurrence and fragmentation, Advancing Culture of Living with Landslides, Volume 1 ISDR-ICL Sendai Partnerships 2015–2025, 75–97 pp., Springer, https://doi.org/10.1007/978-3-319-59469-9_4, 2017.
Corominas, J., Matas, G., and Ruiz-Carulla, R.: Quantitative analysis of risk from fragmental rockfalls, Landslides, 16, 5–21, 2019.
Crosta, G. B. and Agliardi, F.: A methodology for physically based rockfall hazard assessment, Nat. Hazards Earth Syst. Sci., 3, 407–422, https://doi.org/10.5194/nhess-3-407-2003, 2003.
Crosta, G. B. and Agliardi, F.: Parametric evaluation of 3D dispersion of rockfall trajectories, Nat. Hazards Earth Syst. Sci., 4, 583–598, https://doi.org/10.5194/nhess-4-583-2004, 2004.
Crosta, G. B., Agliardi, F., Frattini, P., and Lari, S.: Key Issues in Rock Fall Modeling, Hazard and Risk Assessment for Rockfall Protection, Eng. Geol. Soc., 2, 43–58, https://doi.org/10.1007/978-3-319-09057-3_4, 2015/
Crovelli, R. A.: Probability Models for Estimation of Number and Costs of Landslides. U.S., Geological Survey Open File Report 00–249, 1–24, https://doi.org/10.3133/ofr00249, 2000.
Dal Piaz, G. V., Bistacchi, A., Gianotti, F., Monopoli, B., Passeri, L., and Schiavo, A.: Note illustrative del F. 070 Monte Cervino della Carta Geologica d'Italia alla scala 1: 50.000, https://www.isprambiente.gov.it/Media/carg/note_illustrative/70_Monte_Cervino.pdf (last access: 20 June 2023), 2016.
Dattola, G., Crosta, G. B., and di Prisco, C.: Investigating the influence of block rotation and shape on the impact process, Int. J. Rock Mech, 147, 104867, https://doi.org/10.1016/j.ijrmms.2021.104867, 2021.
Di Prisco, C. and Vecchiotti, M.: A rheological model for the description of boulder impacts on granular strata, Geotechnique, 56, 469–482, https://doi.org/10.1680/geot.56.7.469, 2006.
Dorren, L. K. A., Berger, F., Imeson, A. C., Maier, B., and Rey, F.: Integrity, stability and management of protection forests in the European Alps, For. Ecol., 195, 165–176, 2004a.
Dorren, L. K. A., Maier, B., Putters, U. S., and Seijmonsbergen, A. C.: Combining field and modelling techniques to assess rockfall dynamics on a protection forest hillslope in the European Alps, Geomorphology, 57, 151–167, 2004b.
Dorren, L. K. A., Berger, F., and Putters, U. S.: Real-size experiments and 3-D simulation of rockfall on forested and non-forested slopes, Nat. Hazards Earth Syst. Sci., 6, 145–153, https://doi.org/10.5194/nhess-6-145-2006, 2006.
Dupire, S., Bourrier, F., Monnet, J. M., Bigot, S., Borgniet, L., Berger, F., and Curt, T.: Novel quantitative indicators to characterize the protective effect of mountain forests against rockfall, Eco. Indic., 67, 98–107, 2016.
Dussauge-Peisser, C., Helmstetter, A., Grasso, J.-R., Hantz, D., Desvarreux, P., Jeannin, M., and Giraud, A.: Probabilistic approach to rock fall hazard assessment: potential of historical data analysis, Nat. Hazards Earth Syst. Sci., 2, 15–26, https://doi.org/10.5194/nhess-2-15-2002, 2002.
Evans, S. G. and Hungr, O.: The assessment of rockfall hazard at the base of talus slopes, Can. Geotech. J., 30, 620–636, 1993.
Farvacque, M., Lopez-Saez, J., Corona, C., Toe, D., Bourrier, F., and Eckert, N.: Quantitative risk assessment in a rockfall-prone area: the case study of the Crolles municipality (Massif de la Chartreuse, French Alps), Geomorphol. Relief, Process. Environ., 25, 7–19, 2019.
Farvacque, M., Eckert, N., Bourrier, F., Corona, C., Lopez-Saez, J., and Toe, D.: Quantile-based individual risk measures for rockfall-prone areas, Int. J. Disaster Risk Reduct., 53, 101932, https://doi.org/10.1016/j.ijdrr.2020.101932, 2021.
Frattini, P., Crosta, G. B., Agliardi, F., Clague, J. J., and Stead, D.: 22 Rockfall characterization and modelling, Landslides: types, mechanisms and modeling, 267, Landslides: Types, mechanisms and modeling, 267–281, https://doi.org/10.1017/CBO9780511740367.023, 2012.
Getzner, M., Gutheil-KnoppKirchwald, G., Kreimer, E., Kirchmeir, H., and Huber, M.: Gravitational natural hazards: Valuing the protective function of alpine forests, For. Policy Econ., 80, 150–159, 2017.
Geoportale Regione Valle d'Aosta: Modello Digitale del Terreno, SCT [data set], https://geoportale.regione.vda.it/download/dtm/ (last access: 20 June 2023), 2023.
Grêt-Regamey A., Bebi P., Bishop, I. D., and Smid W. A.: Linking GIS-based models to value ecosystem services in an alpine region, J. Environ. Manage., 89, 197–208, 2008
Guccione, D. E., Giacomini, A., Thoeni, K., Fityus, S., and Buzzi, O.: On the Dynamic Fragmentation of Rock-Like Spheres: Insights into Fragment Distribution and Energy Partition, Mech. Rock. Eng., 56, 847–873, https://doi.org/10.1007/s00603-022-03114-0, 2022
Guthrie, R. H. and Evans, S. G.: Magnitude and frequency of landslides triggered by a storm event, Loughborough Inlet, British Columbia, Nat. Hazards Earth Syst. Sci., 4, 475–483, https://doi.org/10.5194/nhess-4-475-2004, 2004.
Guzzetti, F., Reichenbach, P., and Wieczorek, G. F.: Rockfall hazard and risk assessment in the Yosemite Valley, California, USA, Nat. Hazards Earth Syst. Sci., 3, 491–503, https://doi.org/10.5194/nhess-3-491-2003, 2003.
Hantz, D., Ventroux, Q., Rossetti, J. P., and Berger, F.: A new approach of diffuse rockfall hazard, Landslides and Engineered Slopes, Experience, Theory and Practice, CRC Press, 1063–1067, 2018.
Hantz, D., Colas, B., Dewez, T., Lévy, C., Rossetti, J. P., Guerin, A., and Jaboyedoff, M.: Caractérisation quantitative des aléas rocheux de départ diffuse, Revue Française de Géotechnique, (163), 2, 8–16, https://doi.org/10.1051/geotech/2020011, 2020.
Hantz, D., Corominas, J., Crosta, G. B., and Jaboyedoff, M.: Definitions and concepts for quantitative rockfall hazard and risk analysis, Geosciences, 11, 158, https://doi.org/10.3390/geosciences11040158, 2021.
Häyhä, T., Franzese, P. P., Paletto, A., and Fath, B. D.: Assessing, valuing, and mapping ecosystem services in alpine forests, Ecosyst. Serv., 14, 12–24, 2015.
Hungr, O., Evans, S. G., and Hazzard, J.: Magnitude and frequency of rock falls and rock slides along the main transportation corridors of southwestern British Columbia, Can. Geotech. J., 36, 224–238, 1999.
Jancke, O., Dorren, L. K., Berger, F., Fuhr, M., and Köhl, M.: Implications of coppice stand characteristics on the rockfall protection function, For. Ecol., 259, 124–131, 2009.
Kajdiž, P., Diaci, J., and Rebernik, J.: Modelling facilitates silvicultural decision-making for improving the mitigating effect of beech (Fagus sylvatica L.) dominated alpine forest against rockfall, Forests, 6, 2178–2198, 2015.
Lambert, S., Toe, D., Mentani, A., and Bourrier, F.: A meta-model-based procedure for quantifying the on-site efficiency of rockfall barriers, Mech. Rock. Eng., 54, 487–500, 2021.
Lari, S., Frattini, P., and Crosta, G. B.: A probabilistic approach for landslide hazard analysis, Eng. Geol., 182, 3–14, 2014.
Leine, R. I., Schweizer, A., Christen, M., Glover, J., Bartelt, P., and Gerber, W.: Simulation of rockfall trajectories with consideration of rock shape, Multibody Syst. Dyn., 32, 241–271, 2014.
Macciotta, R., Martin, C. D., and Cruden, D. M.: Probabilistic estimation of rockfall height and kinetic energy based on a three-dimensional trajectory model and Monte Carlo simulation, Landslides, 12, 757–772, 2015.
Malamud, B. D., Turcotte, D. L., Guzzetti, F., and Reichenbach, P.: Landslide inventories and their statistical properties, Earth Surf. Process. Landf., 29, 687–711, 2004.
Matas, G., Lantada, N., Corominas, J., Gili, J. A., Ruiz-Carulla, R., and Prades, A.: RockGIS: a GIS-based model for the analysis of fragmentation in rockfalls, Landslides, 14, 1565–1578, 2017.
Matasci, B., Jaboyedoff, M., Loye, A., Pedrazzini, A., Derron, M. H., and Pedrozzi, G.: Impacts of fracturing patterns on the rockfall susceptibility and erosion rate of stratified limestone, Geomorphology, 241, 83–97, 2015.
Melzner, S., Rossi, M., and Guzzetti, F.: Impact of mapping strategies on rockfall frequency-size distributions, Eng. Geol., 272, 105639, https://doi.org/10.1016/j.enggeo.2020.105639, 2020.
Moos, C. and Dorren, L.: Cost-Benefit Analysis as a Basis for Risk-Based Rockfall Protection Forest Management, IntechOpen, https://doi.org/10.5772/intechopen.99513, 2022.
Moos, C., Fehlmann, M., Trappmann, D., Stoffel, M., and Dorren, L.: Integrating the mitigating effect of forests into quantitative rockfall risk analysis–Two case studies in Switzerland, Int. J. Disaster Risk Reduct., 32, 55–74, 2018.
Nocilla, N., Evangelista, A., and Di Santolo, A. S.: Fragmentation during rock falls: two Italian case studies of hard and soft rocks, Mech. Rock. Eng., 42, 815, https://doi.org/10.1007/s00603-008-0006-0, 2009.
Perret, S., Dolf, F., and Kienholz, H.: Rockfalls into forests: analysis and simulation of rockfall trajectories – considerations with respect to mountainous forests in Switzerland, Landslides, 1, 123–130, 2004.
Pfeiffer, T. J. and Bowen, T. D.: Computer simulation of rockfalls, Bull. Eng. Geol. Environ., 26, 135–146, 1989
Polino, R., Bonetto, F., Carraro, F., Gianotti, F., Gouffon, Y., Malusà, M. G., Martin, S., Perello, P., and Schiavo, A.: Foglio 090 Aosta della Carta Geologica d'Italia, https://www.isprambiente.gov.it/Media/carg/note_illustrative/90_Aosta.pdf (last access: 2 June 2023), 2015.
Radtke, A., Toe, D., Berger, F., Zerbe, S., and Bourrier, F.: Managing coppice forests for rockfall protection: lessons from modelling, Ann. For. Sci., 71, 485–494, 2014.
Rammer, W., Brauner, M., Dorren, L. K. A., Berger, F., and Lexer, M. J.: Evaluation of a 3-D rockfall module within a forest patch model, Nat. Hazards Earth Syst. Sci., 10, 699–711, https://doi.org/10.5194/nhess-10-699-2010, 2010.
Rosser, N., Lim, M., Petley, D., Dunning, S., and Allison, R.: Patterns of precursory rockfall prior to slope failure, J. Geophys. Res.-Earth Surf., 112, https://doi.org/10.1029/2006JF000642, 2007.
Ruiz-Carulla, R.: Rockfall analysis: failure, fragmentation and propagation characterization. A fractal fragmentation of rockfalls, Ph.D Thesis, Technical University of Catalonia. Department of Civil and Environmental Engineering, PhD thesis, 1–354, 2018
Ruiz-Carulla, R., Corominas, J., and Mavrouli, O.: A fractal fragmentation model for rockfalls, Landslides, 14, 875–889, 2017.
Shen, W. G., Zhao, T., Crosta, G. B., and Dai, F.: Analysis of impact-induced rock fragmentation using a discrete element approach, Int. J. Rock. Mech., 98, 33–38, 2017.
Stoffel, M., Wehrli, A., Kühne, R., Dorren, L. K., Perret, S., and Kienholz, H.: Assessing the protective effect of mountain forests against rockfall using a 3D simulation model, For. Ecol., 225, 113–122, 2006.
Toe, D., Bourrier, F., Dorren, L., and Berger, F.: A novel DEM approach to simulate block propagation on forested slopes, Mech. Rock. Eng., 51, 811–825, 2018.
UNI: UNI 112111-4: 2012 rockfall protective measures – Part 4: definitive and executive design, Ente Nazionale Italiano di Unificazione, Milano Italia (in Italian), http://www.uni.com (last access: 20 June 2023), 2012.
Volkwein, A., Roth, A., Gerber, W., and Vogel, A.: Flexible rockfall barriers subjected to extreme loads, Struct. Eng. Int., 19, 327–332, 2009.
Volkwein, A., Schellenberg, K., Labiouse, V., Agliardi, F., Berger, F., Bourrier, F., Dorren, L. K. A., Gerber, W., and Jaboyedoff, M.: Rockfall characterisation and structural protection – a review, Nat. Hazards Earth Syst. Sci., 11, 2617–2651, https://doi.org/10.5194/nhess-11-2617-2011, 2011.
Yashima, S., Kanda, Y., and Sano, S.: Relationships between particle size and fracture energy or impact velocity required to fracture as estimated from single particle crushing, Powder Technol., 51, 277–282, 1987.
Wang, X., Frattini, P., Crosta, G. B., Zhang, L., Agliardi, F., Lari, S., and Yang, Z., Uncertainty assessment in quantitative rockfall risk assessment, Landslides, 11, 711–722, 2014.