the Creative Commons Attribution 4.0 License.
the Creative Commons Attribution 4.0 License.
 | 20 Jun 2023
Scenario-based multi-risk assessment from existing single-hazard vulnerability models. An application to consecutive earthquakes and tsunamis in Lima, Peru
Juan Camilo Gómez Zapata
Massimiliano Pittore
Nils Brinckmann
Juan Lizarazo-Marriaga
Sergio Medina
Nicola Tarque
Fabrice Cotton
Multi-hazard risk assessments for building portfolios exposed to earthquake shaking followed by a tsunami are usually based on empirical vulnerability models calibrated on post-event surveys of damaged buildings. The applicability of these models cannot easily be extrapolated to other regions of larger/smaller events. Moreover, the quantitative evaluation of the damages related to each of the hazard types (disaggregation) is impossible. To investigate cumulative damage on extended building portfolios, this study proposes an alternative and modular method to probabilistically integrate sets of single-hazard vulnerability models that are constantly being developed and calibrated by experts from various research fields to be used within a multi-risk context. This method is based on the proposal of state-dependent fragility functions for the triggered hazard to account for the pre-existing damage and the harmonisation of building classes and damage states through their taxonomic characterisation, which is transversal to any hazard-dependent vulnerability. This modular assemblage also allows us to separate the economic losses expected for each scenario on building portfolios subjected to cascading hazards. We demonstrate its application by assessing the economic losses expected for the residential building stock of Lima, Peru, a megacity commonly exposed to consecutive earthquake and tsunami scenarios. We show the importance of accounting for damage accumulation on extended building portfolios while observing a dependency between the earthquake magnitude and the direct economic losses derived for each hazard scenario. For the commonly exposed residential building stock of Lima exposed to both perils, we find that classical tsunami empirical fragility functions lead to underestimations of predicted losses for lower magnitudes (Mw) and large overestimations for larger Mw events in comparison to our state-dependent models and cumulative-damage method.
- Article
(5448 KB) - Full-text XML
- BibTeX
- EndNote


Cascading natural events, commonly defined as a primary hazard triggering a secondary one, have jointly induced large disasters (Gill and Malamud, 2016). In the case of earthquakes, between 25 % and 40 % of economic losses and deaths have been reported to result as a consequence of secondary effects, i.e. tsunamis, landslides, liquefaction, fire, and others (Daniell et al., 2017). Well-known examples are the submarine earthquakes and the subsequent tsunamis that occurred in 2004 in the Indian Ocean, in 2011 in Japan, and in 2018 in Palu Bay in Indonesia (Goda et al., 2019). These events not only induced cumulative physical damage on the exposed infrastructure but also brought drastic socioeconomic cascading effects that are still perceptible today (de Ruiter et al., 2020; Suppasri et al., 2021). Despite the magnitude of such events, multi-hazard risk assessment remains a relatively new research field with still not unified terminologies and approaches (Pescaroli and Alexander, 2018; Tilloy et al., 2019). Nonetheless, a number of studies (e.g. Kappes et al., 2012; Komendantova et al., 2014; Gallina et al., 2016; Julià and Ferreira, 2021; De Angeli et al., 2022; Cremen et al., 2022) have unanimously agreed that more realistic multi-risk evaluations can only be conducted if both (1) multi-hazard (e.g. Marzocchi et al., 2012; Liu et al., 2016) and (2) multi-vulnerability interactions (e.g. Zuccaro et al., 2008; Gehl et al., 2013) are considered altogether. While the former comprises the study of the conditional probabilities of the occurrences of these hazards and their combination, the study of the latter involves reviewing the many classes of vulnerabilities that are associated with an exposed territory.
Therefore, this study narrows down the scope of scenario-based multi-hazard risk by assuming that a second hazardous event is always triggered after the occurrence of the first one, thus eliminating the need to quantify the probability of this occurring. Thus, we will only focus on the dynamic physical vulnerability and related cumulative damage that a building stock exposed to a close succession of hazardous events might suffer. As a premise, this study contributes to the field by proposing a modular method to probabilistically integrate sets of single-hazard vulnerability models that are being constantly developed and calibrated by experts from various research fields to be used within a multi-risk context. The rest of this Introduction discusses the state-of-the-art exposure modelling for large-scale building portfolios for multi-hazard risk assessment: focus is made on the underlying assumptions to propose generalised building typologies with associated fragility functions used to assess their physical vulnerabilities to earthquake and tsunamis. Having done that, the last part of the Introduction summarises the general scope and capabilities of the original method that will be described in detail afterward.
In exposure modelling for multi-hazard risk purposes, we can distinguish between two main approaches:
-
The first approach is using a single set of building classes, each employing as many fragility/vulnerability models as the natural hazards considered, for example, the HAZUS-MH (FEMA, 2003, 2017; Dabbeek and Silva, 2020; Dabbeek et al., 2020). They typically have associated sets of fragility functions with equivalent damage states regardless of the hazard. Aligned with this philosophy, the vulnerability classes of the European Macroseismic Scale (EMS-98) originally proposed by Grünthal (1998) were used by some authors not only to describe the likely damage due to seismic action, but also to classify likely ranges of vulnerabilities to other hazards based on the building's material types (Schwarz et al., 2019; Maiwald and Schwarz, 2019).
-
The second approach is jointly applying a number of different building classifications per individual hazard to the same exposed buildings (e.g. Gomez-Zapata et al., 2021e; Arrighi et al., 2022). Their associated fragility functions may have different sets of damage states (differing in number and description). Notably, these models are constantly developed and individually validated by experts of each research field.
Although the first type might be useful in the assessment of risk arising from independent hazards, their related sets of fragility models lack multi-hazard calibration and validation and, therefore, do not offer sufficient inputs for assessing the increasing damage from cascading events (Ward et al., 2020).
Moreover, the definition of the damage scale depends on the building type (Hill and Rossetto, 2008) and the likely failure mechanisms that it can experience under the action of specific hazard intensity measures (IMs) (Vamvatsikos et al., 2010; Selva, 2013). Therefore, the observable damage features on individual structural or non-structural components that jointly describe a certain damage state can have contrasting descriptions across various hazard-dependent vulnerability types (Gehl and D'Ayala, 2018; Figueiredo et al., 2021), and there is often not a 1:1 relation between them, i.e. for the case of earthquakes and tsunamis (Bonacho and Oliveira, 2018; Lahcene et al., 2021). The reasons behind such a mismatching between the definitions of damage states may arise from the absence of standard formats for damage data collection across regions and across the several vulnerability types of interest (Mas et al., 2020; Frucht et al., 2021). Notably, the study of Negulescu et al. (2020) found this aspect to be particularly significant for the multi-hazard risk context, stating that the damage states of earthquake and tsunami fragility models can have variable levels of compatibility. This assumption led to contrasting loss estimates with respect the US HAZUS approach, which is based on the complete equivalence between damage grades. This background portrays the need to standardise the description of the physical damage through harmonising scales across several hazard-dependent vulnerabilities, which are inputs for unified methods in multi-hazard risk (Ward et al., 2022).
The earthquake engineering community has investigated the cumulative damage expected during seismic sequences (e.g. Papadopoulos and Bazzurro, 2021; Karapetrou et al., 2016; Trevlopoulos et al., 2020), but this concept is rarely considered in other research disciplines. For instance, the physical vulnerability of building portfolios to tsunamis has been typically evaluated through empirical fragility functions derived from post-near-field tsunami surveys. A drawback of these functions is that they have been presented solely as tsunami fragility functions in terms of the inundation depth, when in reality these surveys encompassed assets that experienced cumulative damage due to the joint effect of the tsunami-generating earthquake and the tsunami itself (Charvet et al., 2017). Due to this limitation, analytical fragility functions were recently proposed for individual structures (e.g. Attary et al., 2017; Petrone et al., 2017) and for large-scale building stocks with generalised typologies (Belliazzi et al., 2021). However, as remarked by Attary et al. (2021), using these functions for loss estimation should only be valid for far-field tsunamis, and for near-field events the damage induced by shaking before the tsunami strikes must still be addressed.
To the best of the authors' knowledge, only a few studies have investigated the performance of heterogeneous and large-scale building portfolios for risk estimates subjected to consecutive ground shaking and tsunamis. Hereby, we summarise some of them. In Goda and De Risi (2018), a rationale was proposed for adopting the larger value of the damage ratios from independent earthquake and tsunami risk computations. In Park et al. (2019), a probabilistic multi-risk approach was presented for a building stock in the US subjected to spatially uncorrelated seismic ground motions and subsequent tsunamis. This study showed the disaggregation of losses per hazard and per material-based building type across several return periods while assuming statistical independence between their respective damage states. As a common denominator of the aforementioned studies, the cumulative damage and losses from a building portfolio were not assessed. Since these metrics cannot be obtained as the sum of the effects from each individual hazardous event (Bernal et al., 2017; Terzi et al., 2019), it is rather necessary to address the non-linear damage accumulation on the same exposed assets during the multi-hazard sequences (Merz et al., 2020).
This study proposes a modular method to probabilistically integrate existing sets of single-hazard vulnerability models (or “reference schemes”). For this aim, this method comprises four main modules. The first two refer to sets of compatibilities between the vulnerability models selected for each single-hazard vulnerability (e.g. between existing seismic and tsunami building classification schemes). The first probabilistic compatibility set is obtained between (1) building classes (as presented in Sect. 2.1), while the second is obtained between (2) damage states (Sect. 2.2). These two conversions are done through the use of taxonomic attributes that are independent of the definition of the reference schemes. This is done with the purpose of representing the damage distribution resulting after the first hazard (i.e. earthquake) through a damage-updated exposure model whose damage scale is dependent on the classification scheme required for assessing the vulnerability to a triggered event (i.e. tsunami). The third module results from the need to perform risk assessment for the triggered hazard using the damage-updated exposure model that is now represented in terms of the second vulnerability scheme (e.g. building classes and damage states for tsunami fragility). Hence, this module comprises the proposal of (3) sets of state-dependent fragility functions for the second hazard (e.g. tsunami), as presented in Sect. 2.3. These three modules are valuable inputs for ultimately assessing the expected cumulative damage. They are later complemented by a last fourth module: (4) a consequence model to assess the incremental direct economic losses (Sect. 2.4) that are expected from consecutive hazard scenarios.
In the application section of this paper (Sect. 3), we demonstrate the application of this method by investigating the likely cumulative damage on the residential buildings of Lima (Peru) by considering this city's exposure to six mega-thrust earthquake scenarios (main shock) and subsequent tsunamis. This is done using existing vulnerability models per hazard and addressing the probabilistic compatibilities between building classes and damage states. Complementarily, a set of tsunami state-dependent fragility functions that are obtained through the use of simple ad hoc scaling factors are proposed. Nonetheless, as it will be discussed, these functions can and should be replaced by other sets of state-dependent tsunami fragility functions derived from more sophisticated methods when they become available. Every damage distribution is translated into direct economic losses to gain a comparative risk metric and disaggregate the contribution of each hazard scenario.
To assess the cumulative damage that is expected to be experienced by a building portfolio during hazardous event sequences, we rely on the principle that its related exposure model is represented by jointly applying existing building classification schemes, one per each individual hazardous scenario of the cascading sequence. For example, one building that is expected to be affected by a first hazard intensity measure IMA (here A refers to an IM used to model ground shaking, for example, peak ground acceleration (PGA) in g) and a second one IMB (B refers to an IM used to model inland tsunami inundation, for example, inundation depth in m) is actually classified under two exposure classification schemes ( and ), respectively, which have attached their related vulnerability models. Each scheme contains a set of mutually exclusive, collectively exhaustive building classes, and , correspondingly.
To assess the expected damage state after the first hazardous event (e.g. ground shaking), we apply their fragility function , which gives us the probability that a building k, typically assumed to be in an undamaged state (), changes to a progressive state z due to a hazard intensity IMA (green part in Fig. 1b). For risk assessment, this is completed by the consequence model, , which assigns a loss ratio L of the total replacement cost of building class k given the occurrence of a damage state. Thus, the expected loss given a hazard intensity IMA is calculated considering the contributions from all possible damage states and their probabilities, as per Eq. (1).
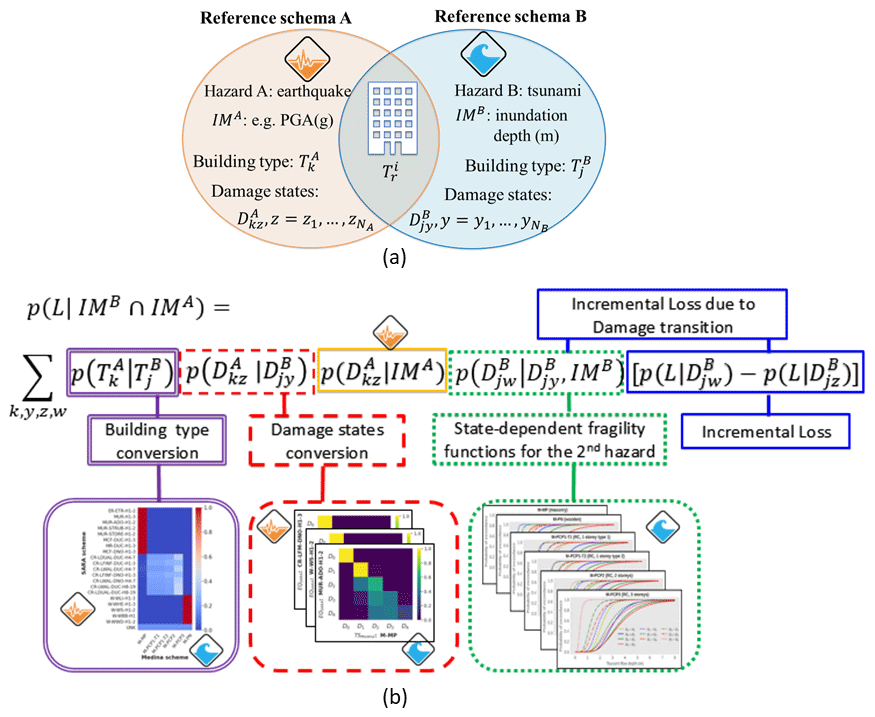
Figure 1(a) Example of the principle proposed for classifying the same building class into two hazard-dependent reference schemes with associated fragility models. (b) Schematic representation of the proposed method to calculate cumulative damage and losses from scenario-based risk for the case of an earthquake followed by a tsunami, which is developed afterward.
If this damaged building portfolio is subjected to the action of a second scenario with a hazard intensity IMB, it would experience cumulative damage moving from a damage state to a damage state w (but in the domain of the second vulnerability scheme: ). Due to this differential scheme classification, their respective set of damage states may not have trivial equivalences because they can also have different observable damage features. Therefore, we propose integrating a set of modular components:
-
The first module is inter-scheme compatibilities between each hazard-dependent exposure classification scheme (i.e. purple part/double-lined box in Fig. 1b). Its derivation follows the method originally proposed in Gómez Zapata et al. (2022b), and it is summarised herein in Sect. 2.1. By reusing this approach, a building stock that was initially classified for a first hazard vulnerability (i.e. earthquake-oriented (EQ) typologies) can now be probabilistically represented by other predefined classes (e.g. tsunami-oriented (TS) typologies).
-
The second module is the related compatibility levels between inter-scheme damage states (i.e. red part/dashed box in Fig. 1b, explained in Sect. 2.2) that is needed when the fragility models attached to such schemes have different numbers of damage states and descriptions.
The two aforementioned conversions are represented through two sets of “compatibility matrices” that are probabilistically generated. The advantage of using these matrices is that through these conversions, the damage-updated exposure model resulting from the action of IMA can be represented in the domain of the reference scheme attached to the second vulnerability to be analysed. Once this change of reference scheme is obtained, the damage-updated exposure model can be directly used for a second risk computation (e.g. for tsunami risk, addressing cumulative damage when the buildings experienced previous damage due to seismic ground shaking):
- 3.
This second risk calculation is performed by using a third module that refers to generic state-dependent tsunami fragility functions (i.e. with non-zero initial damage states made of new curves that represent the permissible damage progression). Since the resultant earthquake-induced damages are formerly expressed in the tsunami vulnerability domain (step 2), the non-zero damage limit states of this set of state-dependent tsunami fragility functions will implicitly account for such pre-existing damage. The joint ensemble of these three components can be ultimately used to calculate the cumulative expected damages after the triggered event with IMB, while accounting for the preceding induced by IMA (i.e. green part/dotted box in Fig. 1b, developed in Sect. 2.3).
- 4.
For multi-risk assessment a fourth module that represents the incremental loss obtained from the economic consequence model attached to the classification scheme (i.e. replacement costs and related loss ratios per damage state of the second scheme, ) is integrated. This is represented by the last box made of continuous (blue) lines in Fig. 1b, explained in Sect. 2.4.
These four modules are described hereafter.
2.1 Exposure modelling: taxonomic description, inter-scheme conversion, and spatial aggregation of building classes
The classified building stock under the first hazard-dependent classification scheme is spatially aggregated into a set of geocells that capture the local spatial variations of the hazards' IM of interest across the study area. For such a purpose, we recommend using variable-resolution exposure models in the form of central Voronoi tessellations (CVTs). Besides spatially representing the building portfolio, they also provide a representative IM per geocell for reliable and computationally efficient vulnerability estimations (Pittore et al., 2020; Gomez-Zapata et al., 2021e). They also implicitly serve as common minimum reference unit (MRU) aggregation entities between exposure and hazard (Zuccaro et al., 2018). This is because for their derivation, one can consider the combination of local variations of the hazard intensity measures (IMs) and certain exposure proxies (e.g. population density) across the same area. CVT-based models may be useful in a multi-hazard risk context where the spatial correlation of various IMs can differ (e.g. ground shaking and tsunami inundation).
As shown in Pittore et al. (2018), every building class k that belongs to one scheme A (in this case, earthquake) and every building class j that belongs to one scheme B (in this case, tsunami) can be described in terms of basic observable features Fm within a faceted taxonomy, that is, a building classification schema in which building classes result from the characterisation of individual attributes or facets (Brzev et al., 2013; Silva et al., 2018, 2022). This disaggregation is the common underlying vocabulary to obtain the probability that a building class within the source scheme ( corresponds to another class within the target scheme . As proposed in Gómez Zapata et al. (2022b), the degree of compatibility between the building classes belonging to both schemes can be represented by a compatibility matrix to account for the uncertainties when there is not a trivial (one-to-one) mapping. Knowing in advance certain exposure metrics of the source scheme (i.e. building counts), the respective values of the target scheme can be obtained by applying the dot product (Eq. 2).
2.2 The probabilistic description and compatibility of inter-scheme damage states
We consider how the fragility functions associated with (earthquake) and (tsunami) may have diverse numbers and descriptions of damage states per considered hazard-dependent vulnerability scheme ( and ). To harmonise their equivalence, we propose obtaining their probabilistic inter-scheme compatibility as a set of matrices . This is achieved after having evaluated how the likely observable characteristics linked to each damage state within and can be expressed in terms of another one. For this aim, we first propose the use of the Agibilità E Danno in Emergenza Sismica form (AeDES; usability and damage in seismic emergency) of the Italian Civil Protection (Baggio et al., 2007) as a standard scoring system to create a synthetic dataset based on the likely observable damage on individual building components. Although the AeDES form was originally proposed for post-earthquake damage data collection, we propose to transversally use it to describe every damage state z and y of (due to seismic ground shaking) and (due to tsunami inundation), respectively.
Expert elicitation is used on the AeDES form to create heuristics evaluating the expected damage extension per building type and each of the damage limit states defined within their respective fragility functions. For this aim, we make use of its implicit scale within a range of 0= L to 9= A over the building components n (low-level taxonomic attributes) as shown in Fig. 2. We decided to only include four out of these six components that can be found in any building type as listed in Eq. (3), as stairs and pre-existing damage are not always present in all buildings. The importance of such building components for assessing their physical vulnerability has been documented in previous studies on ground shaking (e.g. Lagomarsino et al., 2021) and tsunamis (e.g. Del Zoppo et al., 2021).
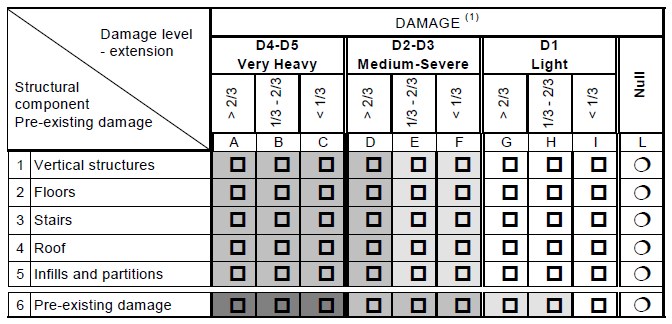
Figure 2Scale to assess the damage level on buildings as proposed by the AeDES form. Reprinted from Baggio et al. (2007).
A heuristic is generated by scoring the four components in Eq. (3) per damage state, per fragility function, and per building class of both exposure classification schemes. This is done through expert elicitation and establishes a training dataset of the possible observable damage extent {OD}n in a harmonised manner. For instance, one set of {OD}n (for a given damage state and building type) is made up of a set of four numbers from 0 to 9, e.g. , meaning level I for VS and RF, level H for FL, and level G for IP (Eq. 3). Thereafter, using the total probability theorem, the probability that the damage state z of building class j in scheme A corresponds to the damage state y of building class j in scheme B can be calculated by Eq. (4).
We assume that the representations of damage states within the two considered schemes are conditionally independent (). Thereby, given the information of the scored observable damage on the individual components {OD}n, we can describe the source damage scheme to be modelled in terms of {OD}n that jointly compose the target scheme . Thus, Eq. (4) can be expressed as a product, given by Eq. (5).
We obtain a probabilistic compatibility degree between damage states ( and ) for every pair of combination of building classes and through a Bayesian formulation as presented in Eq. (6).
The terms and in Eq. (6) can be solved through supervised machine learning techniques for classification (e.g. logistic regression, naive Bayes, decision trees) to predict the probabilities between the training sets and a synthetic testing dataset. The selection of the machine learning technique, naturally, carries epistemic uncertainties (Mangalathu et al., 2020) whose investigation is beyond the scope of this study. The testing dataset is obtained after generating random numbers of all the possible combinations of the AeDES-based scores. With this dataset we express the conditional probabilities of having damage states and (for each building class within schemes A and B) given {OD}n. The term p({OD}n) is a marginal probability that can be assumed to represent the proportion of one observation out of exhaustive combinations of {OD}n. Lastly, describes the proportion of each damage state y within each building class k in the training dataset for scheme B. Once Eq. (6) is solved, the expression is obtained, which stems from the probabilistic inter-scheme damage compatibility matrix for each possible pair of buildings within schemes A and B. After having established the compatibility between building classes and damage states, a special set of fragility functions is needed to follow the damage progression inflicted by the second hazard. They are explained hereafter.
2.3 State-dependent fragility functions
The next steps of the method are carried out within the reference vulnerability scheme of the second hazard (i.e. tsunami). Let us suppose that the fragility functions (for a set of building types Tr and composed by a set of damage limit states) are assumed to be modelled by cumulative lognormal distributions. They are defined by their respective logarithmic means and their logarithmic standard deviations, for which we assume that their initial damage states are all represented by a zero q0 (for a pristine, intact structure). For a set of damage states in pristine structures, there is a corresponding set of values . With this, let us assume that the damage state w belongs to . Equation (7) represents the conditional probability that the building j (of scheme B) can move to a progressive state w given the action of IMB when it already presented a damage state y due to the action of IMA. For such a process, note that it was already classified in terms of scheme B, thanks to the compatibilities between damage states.
The former expression defines a probabilistic state-dependent fragility function composed of transition probabilities between increasing damage states (for instance, for scheme B, this description follows: . For a fragility model designed for a set of building types Tr, and composed of damage states (for any hazard of interest i), the required set of transition probabilities for a given range of hazard intensities are completely defined by a triangular number Gf as expressed in Eq. (8).
A visual example of such transition probabilities within fragility functions for several hazard-dependent models (also including and as well as their respective sets of damage states and ) is presented in Fig. 3.
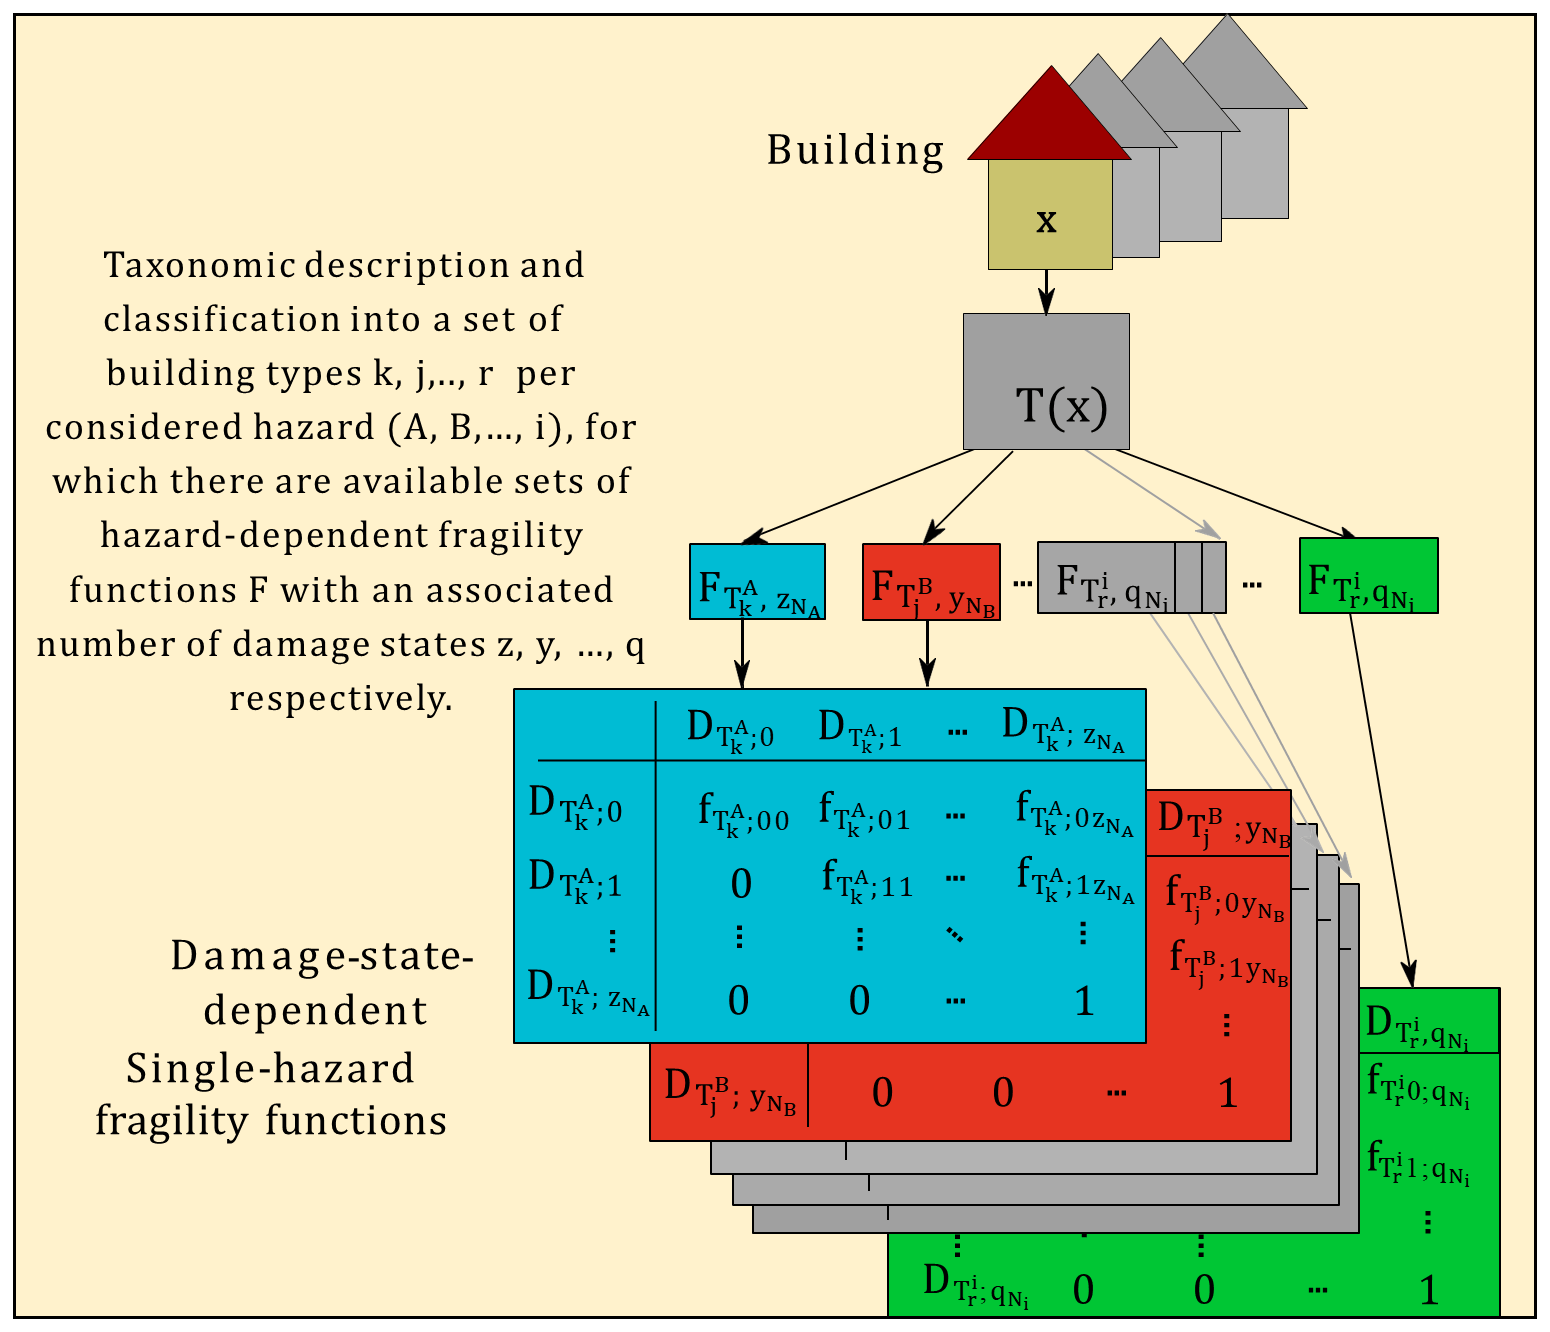
Figure 3Example of a set of damage-state-dependent fragility functions for several single-hazard fragility functions comprising progressive transition probabilities. Figure modified from Gómez Zapata et al. (2020).
Only for the overall scope of this paper do we propose that state-dependent fragility functions can be simplified by using ad hoc calibration parameters to modify these logarithmic mean values. For such a modification, we propose applying to them the exponential operator to obtain the physically accountable mean IM (hazard intensity measures). That is, defines each damage state as . Subsequently we propose to obtain their respective differences . For example, if a fragility function is composed of damage states (excluding damage state 0, equivalent to no damage), there will be a set of damage states for which we should obtain the differences between all the possible top and bottom damage states and for which we must obtain six values: .
In this example, these six state-dependent transition values are included within the Gf=10 triangular number (i.e. 4 from 0, 3 from 1, 2 from 2, 1 from 3) given by Eq. (8). Thereby, for each , it is still necessary to determine the probabilistic representation (log mean and log standard deviation) of every damage state transition . To do so, the values are proposed to be multiplied by the factors, and, by assuming that this product is a log-normally distributed random variable (ln operator), the values δw|y will have a normal distribution. This is expressed as given by Eq. (9):
The reader should note that in this approach, the values are a set of ad hoc calibration parameters or scaling factors that are applied directly to the for which each damage limit state was originally derived. The δw|y values form the lognormal mean of the state-dependent fragility functions. A similar approach was followed by Rao et al. (2017). The fragility functions used to constrain the state-dependent fragility functions should have been derived only for the actual second acting hazard (i.e. far-field tsunamis). Thus, the use of those derived analytically is advised over empirical ones (which implicitly had the damage induced by ground shaking in their derivation). Further details about this approach and model assumptions to find the ad hoc calibration parameters are provided for the example case in the data repository in Gómez Zapata et al. (2022a).
2.4 Loss assessment for sequences of cascading hazard scenarios
We propose a simple economical consequence model that assigns the replacement cost ratios to every damage state of the building classes . The incremental economic loss, defined as the difference in the expected loss resultant from the initial damage state and final damage state, is calculated in terms of the reference scheme B as
Combining the two inter-scheme compatibility matrices, ( and , along with Eqs. (7) and (10), we obtain the formulation in Eq. (11), which is identical to the one in Fig. 1b. This allows us to calculate the probability of observing an incremental loss due to the cumulative damage during the sequence of hazard scenarios.
Equation (11) represents the disaggregated loss caused by the triggered event upon the buildings with a pre-existing damage (induced by IMA). Finally, the likely loss for the entire sequence can be obtained by summing up Eqs. (1) and (11).
3.1 Context of the study area: metropolitan Lima, Peru
In 2022, Peru had a population of around 33 million people, with nearly 58 % of the population living in coastal communities (INEI, 2022). In Løvholt et al. (2014) it was stated that this country has the largest population exposed to tsunamis on the American continent. Lima, its capital, with nearly 10 million inhabitants (around one-third of the country's population), is home to the most important political, industrial, and economic activities of the country. Lima is ranked as the capital city exposed to the largest seismic hazard in South America (Petersen et al., 2018) and as the second city in the world in terms of the value of working days lost relative to the national economy due to earthquakes (Schelske et al., 2014). This city has suffered devastating disasters in the past. For instance, in 1586 and 1724 earthquakes triggered tsunami run-ups of over 24 m (Kulikov et al., 2005). The 1746 earthquake, with an estimated magnitude of Mw 8.8 (Jimenez et al., 2013), produced a tsunami with a local height of 15 to 20 m (Dorbath et al., 1990) and destroyed the city. In 1974, a Mw 8.1 event produced widespread damage and caused losses of ∼ USD 7.5 billion. Since then, the city has been experiencing continuous urbanisation with generally poor structural design (Tarque et al., 2019).
A tsunami event with similar characteristics as the one triggered by the 1746 earthquake was used for context in Adriano et al. (2014) to estimate the damage probabilities of the residential building stock of Callao (part of the metropolitan area of Lima), using the empirical tsunami fragility functions of Suppasri et al. (2013) for four building types. More recently, Ordaz et al. (2019) developed probabilistic earthquake and tsunami risk forecasts for Callao. However, that study neither described the vulnerability models used nor discussed the method employed to address the non-linear damage accumulation. To the best of the authors' knowledge, neither cumulative damages due to earthquake and tsunami scenarios nor the use of analytical tsunami fragility functions for Lima have been reported in the scientific literature.
3.2 Scenarios of earthquakes and tsunamis for Lima
We use the dataset compiled by Gomez-Zapata et al. (2021e), which is composed of six earthquakes with moment magnitudes ranging from 8.5 to 9.0 Mw, which were made available in Gomez-Zapata et al. (2021c). In that dataset, each event is represented by an associated 1000 realisations of cross-correlated ground motion fields (GMFs) for peak ground acceleration (PGA) and spectral accelerations (S.A.) at 0.3 and 1.0 s. The selection of these spectral periods depends on the fragility function's IM associated with the building classes of the exposure model (Sect. 3.3). The simulated GMFs were obtained making use of the ground motion prediction equation (GMPE) proposed in Montalva et al. (2017) and the spatially cross-correlation model of Markhvida et al. (2018) employing the OpenQuake Engine (Pagani et al., 2014). For the site term of the GMPE, the dataset reported in Ceferino et al. (2018), which combined the slope-based values of Allen and Wald (2007) and a seismic microzonation (Aguilar et al., 2013), was used.
On the tsunami modelling side, we reuse the data repository of Harig and Rakowsky (2021) that compiles tsunami inundations for each of the mentioned six earthquakes using the finite element model TsunAWI. Similarly as performed by Harig et al. (2020), the inundation values were interpolated to a raster file with grid cell dimensions of 10×10 m. Figure 4 shows three of the tsunami inundation scenarios for the study area.
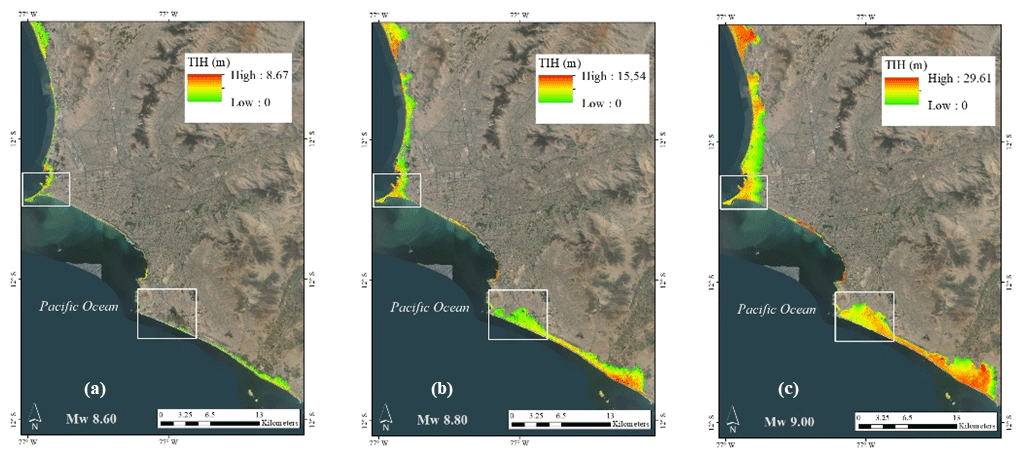
Figure 4Expected tsunami inundation heights (TIHs) in metres (m) for three out of the six considered scenarios per moment magnitude (Mw), namely (a) Mw 8.6, (b) Mw 8.8, and (c) Mw 9.0. These raster products are available from Harig and Rakowsky (2021). Two densely populated areas are depicted by white rectangles: in the north the La Punta (Callao) and Chorrillos in the south. Updated figure is from Gomez-Zapata et al. (2021e). Map data: © Google Earth 2021.
3.3 Exposure modelling: taxonomic description, inter-scheme conversion, and spatial aggregation of building classes for Lima
We make use of the existing building exposure models that represent the residential building stock of metropolitan Lima for ground-shaking vulnerability that were developed by Gomez-Zapata et al. (2021e) and are available from Gomez-Zapata et al. (2021b). Such a building classification was defined by relating some covariates included within the last official Peruvian census from 2017 (INEI, 2017) at the block level with respect to 21 classes proposed by the South American Risk Assessment (SARA) project (Yepes-Estrada et al., 2017) through a mapping scheme proposed from expert elicitation (GEM, 2014). Since that information has been provided for dwellings, the so-called “dwelling ratios” proposed by SARA has also been implemented to obtain the building counts per class. A description of these building classes is presented in Table 1.
Table 1SARA building classes proposed for the residential building stock of metropolitan Lima and Callao, with their respective replacement costs per building unit (repl. cost USD per bdg.) as reported in Yepes-Estrada et al. (2017) in the frame of the SARA model released by the Global Earthquake Model (GEM) in 2015, which was based on official census data reported by INEI (2007). The intensity measures (IMs) of the associated seismic fragility functions to each building class, as reported in Villar-Vega et al. (2017), are also provided.
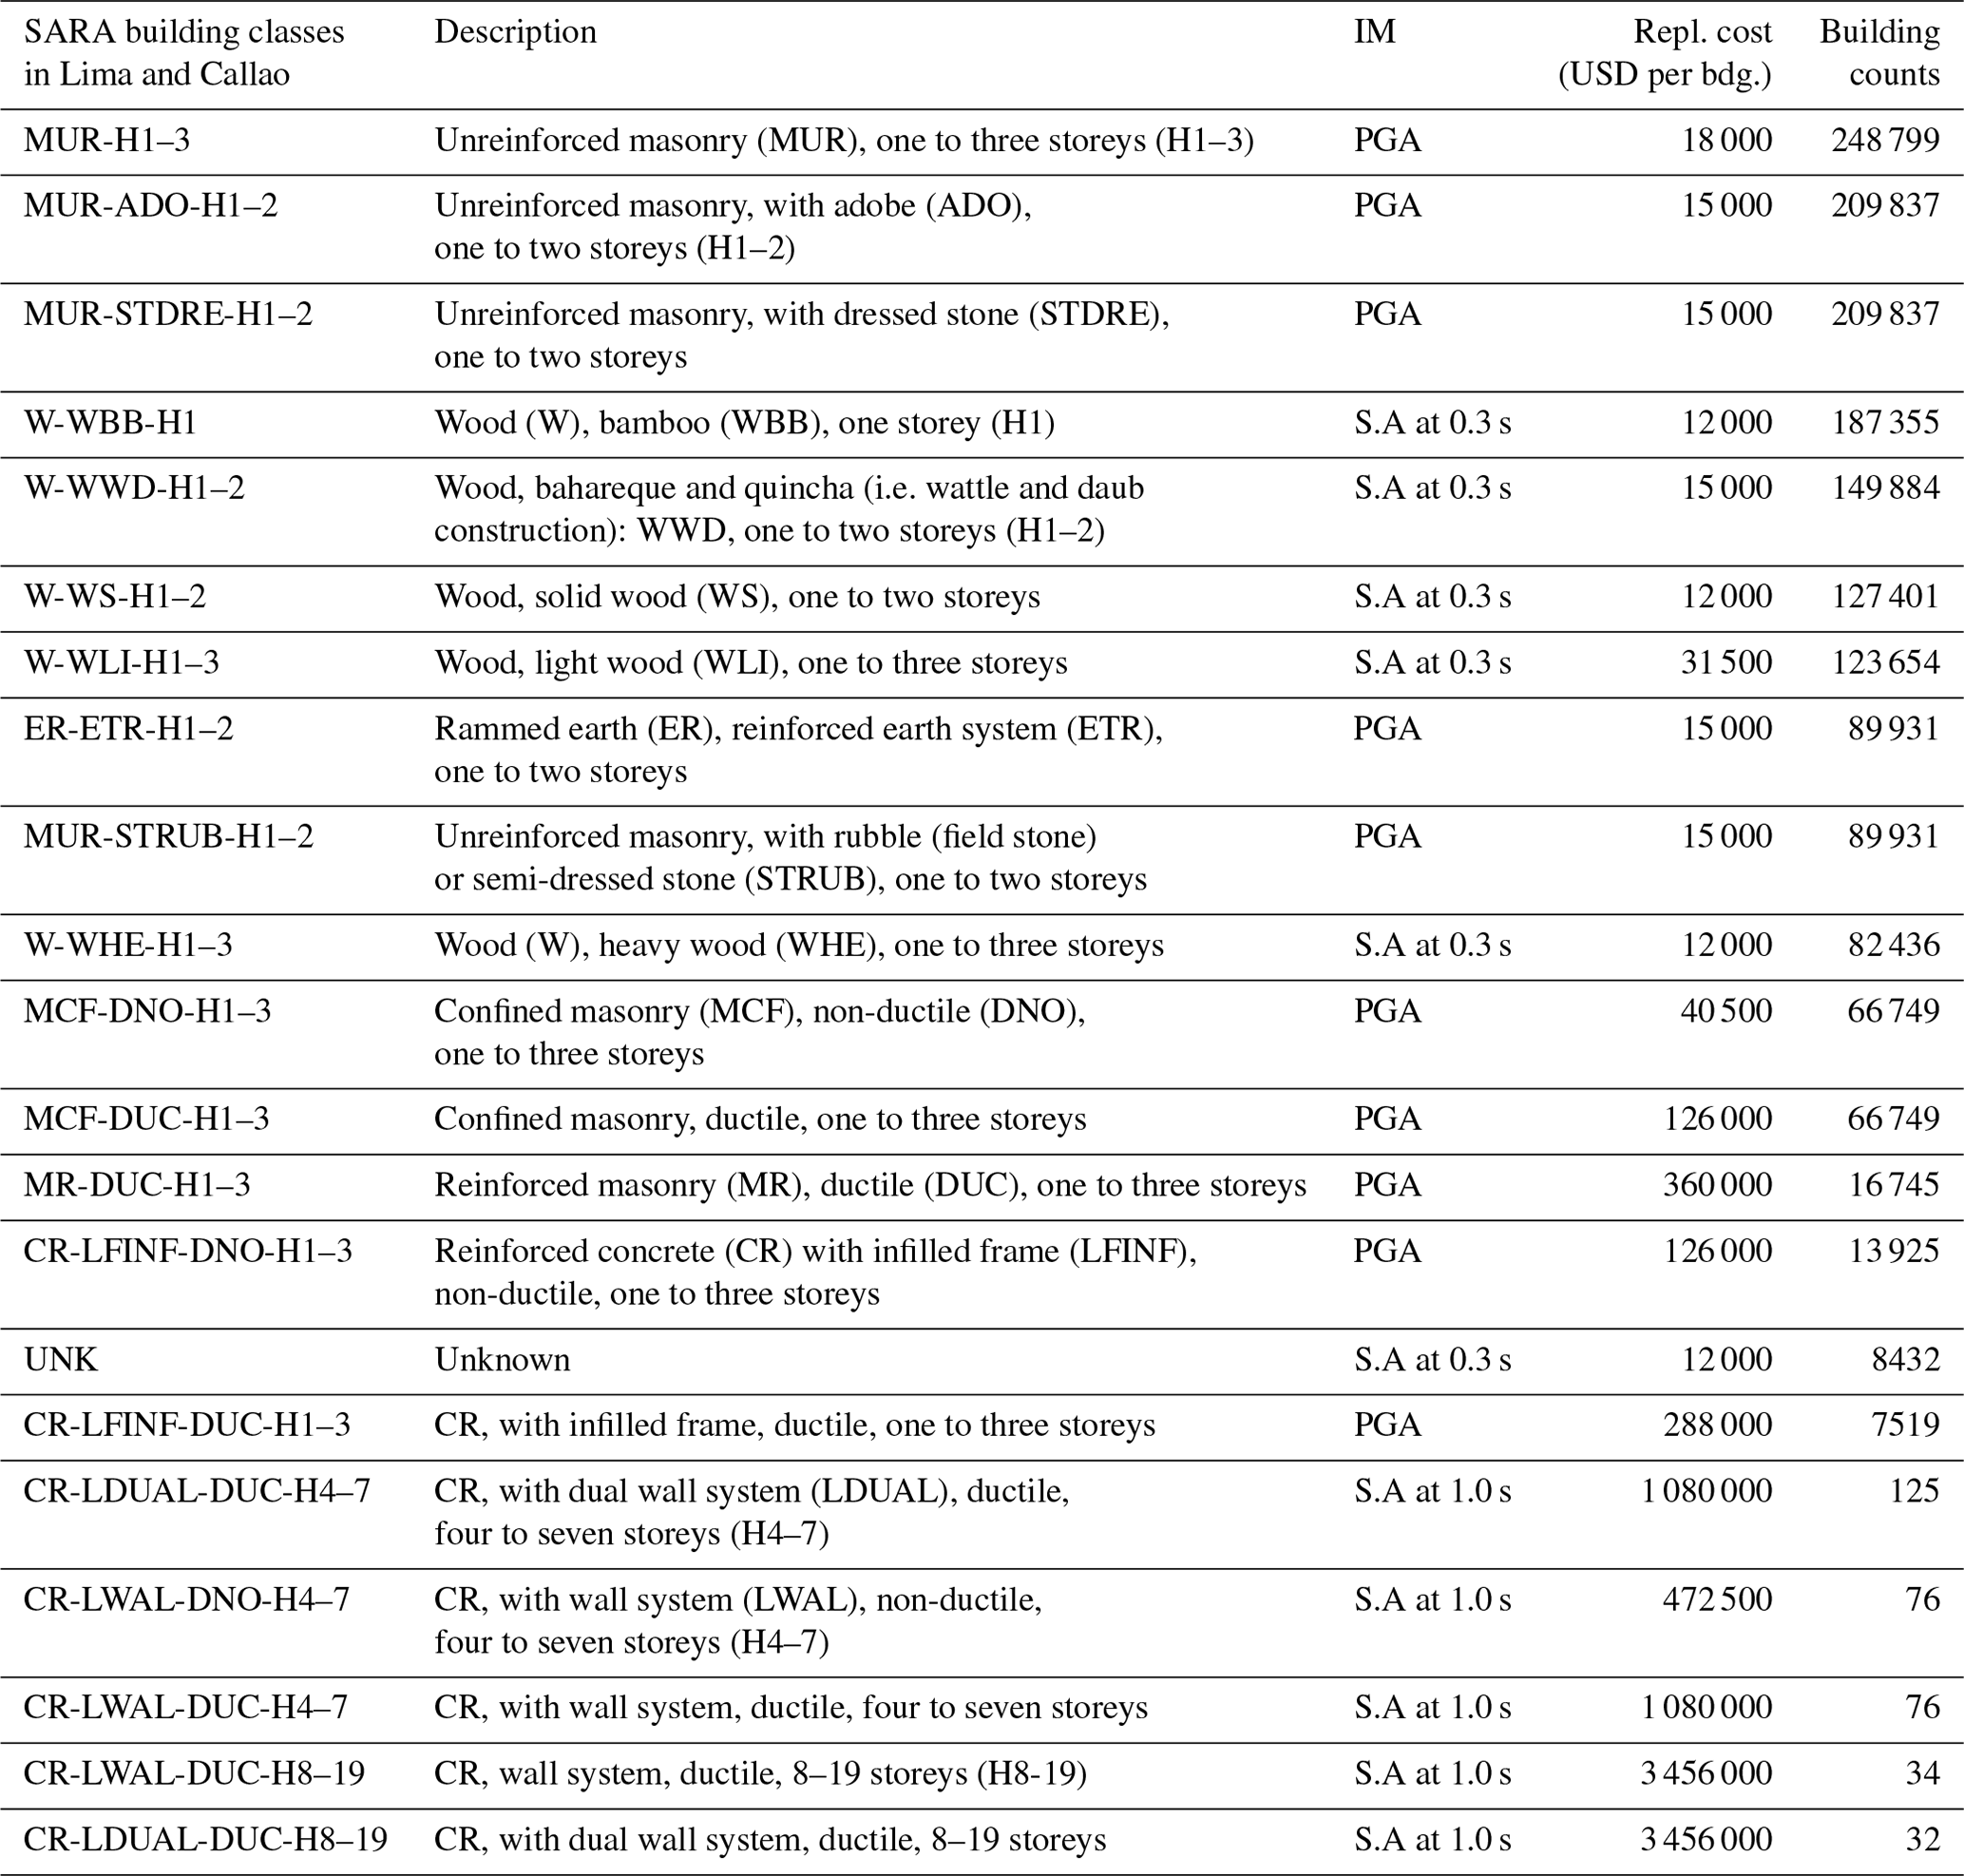
It is worth noting that although these typologies are similar to those of the SARA exposure model, there are differences between the building counts reported by that project and the adopted model. This might be due to the vintage of the input census datasets (2007 vs. 2017, respectively), the thematic detail induced by the spatial aggregation entities (districts/blocks/CVTs), having merged some building classes in terms of similar heights, and having reduced the number of unknown (UNK) types (∼91 % with respect the SARA model). The resultant exposure model is made up of ∼1 657 635 residential buildings, a 25 % increase with respect to the SAA model. However, as observed in Gómez Zapata et al. (2022b), this scheme does not properly capture the presence of high-rise buildings, underestimating their presence, while overestimating the wooden types.
These SARA buildings are spatially aggregated onto central Voronoi tessellations (CVTs) to form seismic-oriented exposure models. It is worth noting that the construction of such heterogeneous aggregation units was based on the selection of an underlying distribution that spatially combined and normalised two weighted map layers, namely (1) a tsunami inundation depth from a Mw 9.0 scenario (70 % weight) and (2) the population density at the block level (30 %). The resulting model provides higher-resolution cells where both conditions are maximised, while coarser geocells occur when one can expect their absence. Further details about these models are available in Gomez-Zapata et al. (2021a, b). Figure 5 shows the percentage of building typologies grouped by their main structural materials expected within each geocell.
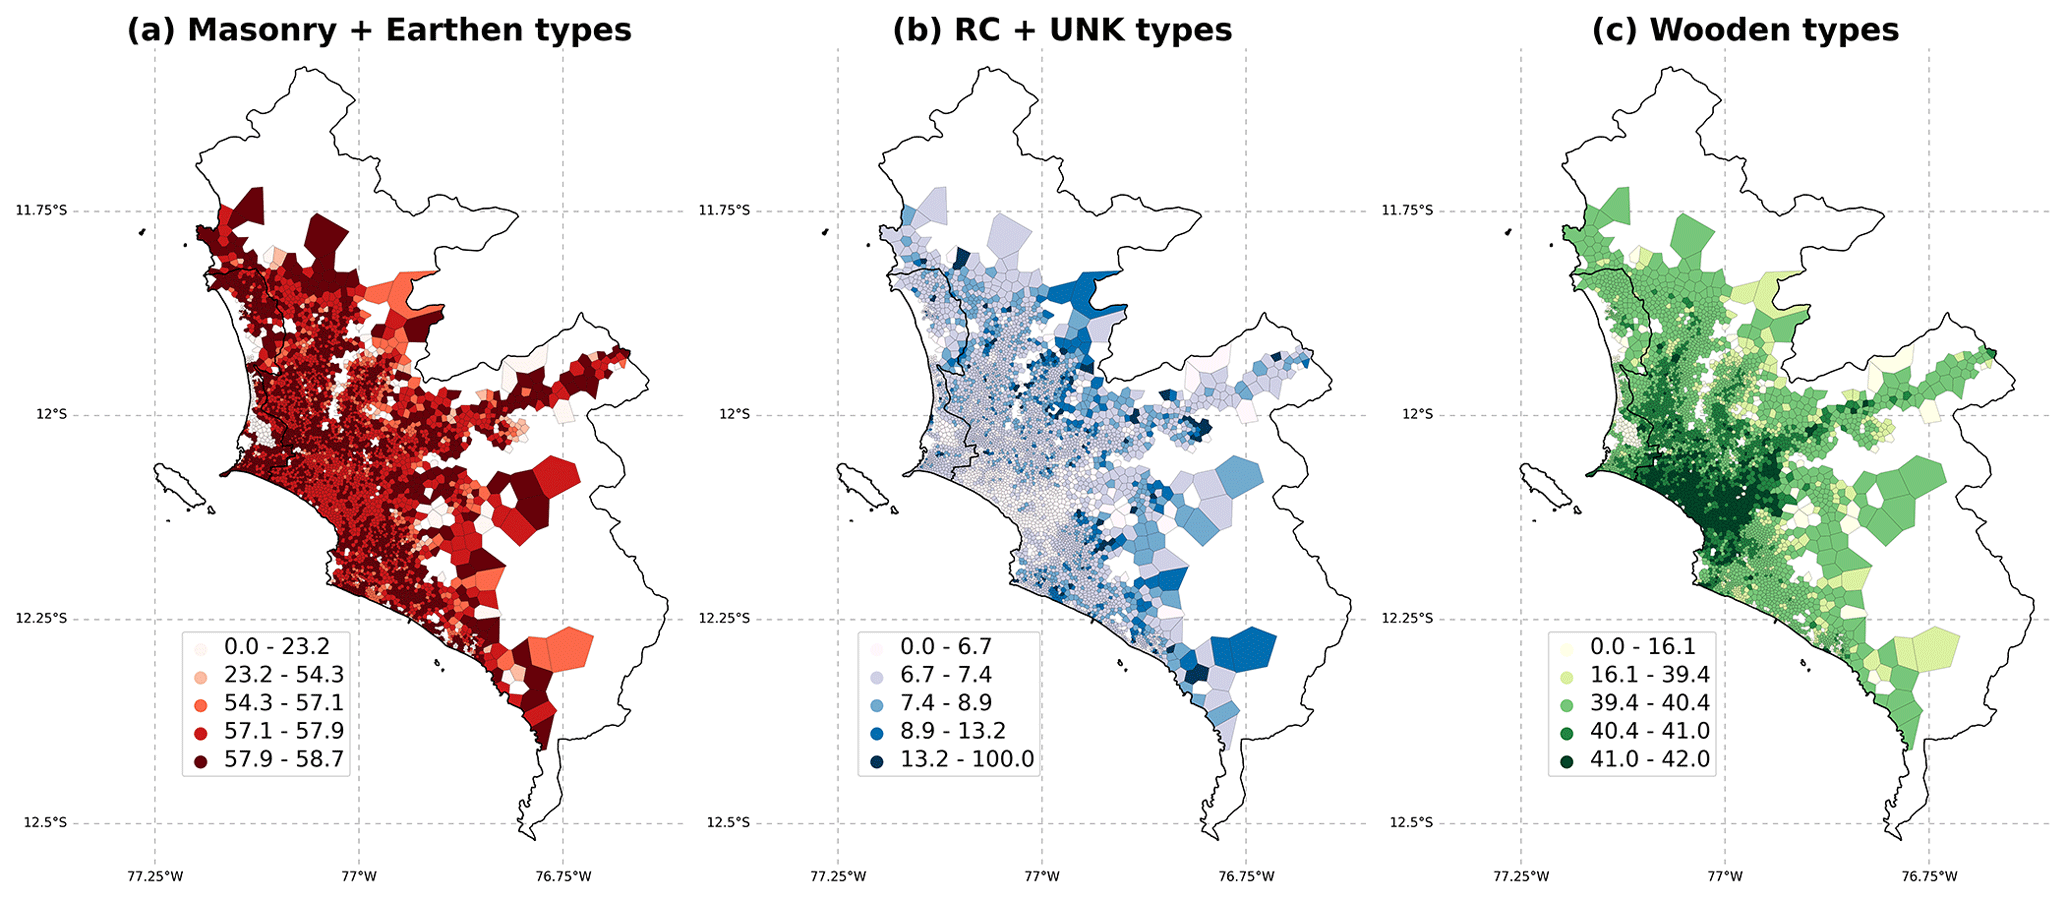
Figure 5Spatial distribution of the percentage of the main structural material of the residential buildings in metropolitan Lima in each central Voronoi tessellation (CVT) geocell using the dataset of Gomez-Zapata et al. (2021b). The colour scale represents the material type: (a) masonry and earthen (red); (b) reinforced concrete, RC, and unknown, UNK (blue); and (c) wooden types (green). Only CVTs that intersected the census-based blocks (INEI, 2017) are shown.
The analytically derived set of seismic fragility functions by Villar-Vega et al. (2017) are assigned to every SARA class. They will be used to obtain the damage distribution for the cross-correlated ground motions per earthquake scenario (Sect. 3.2). For this vulnerability assessment, we use the replacement cost as given by Yepes-Estrada et al. (2017) presented in Table 1. For their damage states, we assumed loss ratios of 2 %, 10 %, 50 %, and 100 %.
On the tsunami vulnerability side, we represent the commonly exposed residential building stock to earthquakes and tsunamis in terms of two classification schemes, namely the Suppasri et al. (2013) and Medina (2019) schemes, which provide sets of empirical and analytical fragility curves, respectively. The former one was made available for Lima in Gomez-Zapata et al. (2021b) and is comprised of six typologies. Notably, its corresponding set of empirical tsunami fragility functions (with six damage states) was derived by implicitly addressing the damage induced by the ground shaking after the Mw 9.1 2011 Japan earthquake and tsunami. Due to this reason, the steps outlined in Sect. 2.2 and 2.3 are not developed for the Suppasri et al. (2013) scheme. Their related direct scenario-based loss estimates were reported in Gomez-Zapata et al. (2021e) from the variations obtained from seven geographical entities used to spatially aggregate the residential building portfolio of Lima and were presented in Sect. 4 for comparative purposes in contrast with the offered method applied to the Medina (2019) scheme. This second type of classification is to the authors' knowledge the only available model that provides analytical far-field tsunami fragility functions for the South American Pacific Coast. It includes six typical buildings located in Tumaco (Colombia) initially defined in Medina (2019), which are generalised in this study. They are M-PN (wooden), M-MP (masonry), M-PCP1-T1 (framed reinforced concrete (RC), one storey with a similar length width ratio), M-PCP1-T2 (framed RC, one storey with a higher length width ratio), M-PCP2 (framed RC, two storeys), and M-PCP3 (framed RC, three or more storeys). Their associated set of fragility functions was developed following the method proposed in Medina et al. (2019) to define the structural fragility due to tsunami forces. A summary that regards the structural characteristics of these building types and the method adopted in deriving these models are provided in the data repository (Gómez Zapata et al., 2022c).
As explained in Sect. 2.1, every building class within the three schemes of interest is disaggregated into attributes within the GEM v.2.0 faceted taxonomy. As done in Gómez Zapata et al. (2022b), fuzzy compatibility levels between the attribute values and building classes are assigned through expert elicitation. Thereby, synthetic surveys based on the possible combinations of attributes that every building class may describe are employed to solve the compatibility scores and obtain the probabilistic inter-scheme compatibility matrices expressed by that is shown in Fig. 6b. By applying a dot product (Eq. 2) between this matrix and the building counts of the source scheme SARA, , (Fig. 6a), we can obtain the building counts under the tsunami classification scheme of Medina (2019) as shown in Fig. 6c.
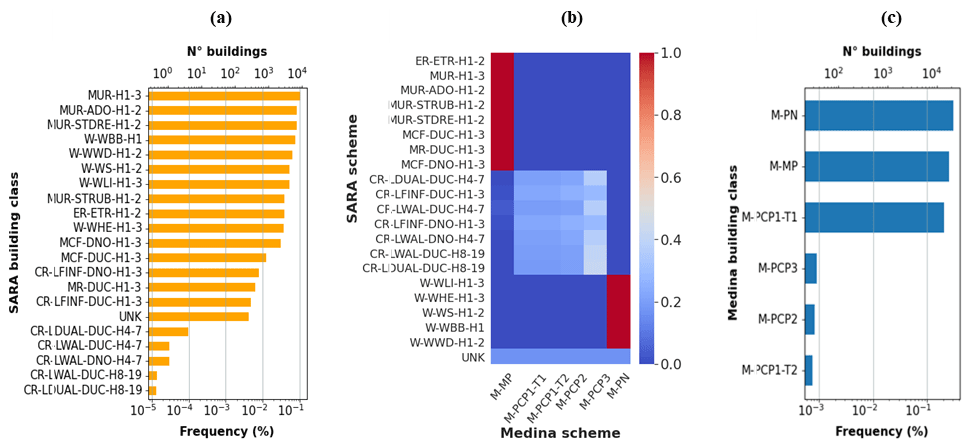
Figure 6Classification of the buildings in the maximum-exposed area to both perils (Mw 9.0 scenario) in terms of the (a) seismic-vulnerability-oriented SARA classes (used as a source scheme) and (b) the inter-scheme conversion matrix. The former two models are used as inputs to obtain the (c) proportions of the tsunami-oriented building classes of Medina (2019). Acronyms for SARA building classes are given in Table 1, while the six Medina (2019) classes are M-PN (wooden), M-MP (masonry), M-PCP1-T1 (framed reinforced concrete (RC), one storey with a similar length width ratio), M-PCP1-T2 (framed RC, one storey with a higher length width ratio), M-PCP2 (framed RC, two storeys), and M-PCP3 (framed RC, three or more storeys).
The inter-scheme conversion between SARA and the Suppasri et al. (2013) classes for Lima was reported in Gomez-Zapata et al. (2021e). The replacement cost values of the building classes within the Medina (2019) scheme are assumed to be the same as the SARA class for which the largest compatibility value was obtained from the inter-scheme compatibility matrix (Fig. 6b). We have adopted identical loss ratios per damage limit state as the ones assumed for earthquake vulnerability. This decision is aligned with previous related studies; i.e. similar loss ratios were also adopted in Antoncecchi et al. (2020) to assess the vulnerability of buildings to tsunamis using empirical fragility functions. It is worth noting that only the commonly exposed buildings to each pair of hazard scenarios (i.e. intersection between the IM of Figs. 4 and 5) are considered for the assessment of cumulative damage after the cascading sequence.
3.4 The probabilistic description and compatibility of inter-scheme damage states for Lima
We obtain the inter-scheme damage compatibility matrices, , following the method presented in Sect. 2.2 to probabilistically harmonise the damage states that define the fragility functions of A (SARA) and B (Medina). It is worth noting that although A and B comprise four damage states, they do not have a trivial equivalence. A defines a single damage criterion for the entire set of building classes closely following the proposal by Lagomarsino and Giovinazzi (2006) as a function of the yielding and ultimate spectral displacements. Conversely, B uses a building-class-dependent parameterisation based on the HAZUS inter-storey drift ratios to define the structural damage levels on pre-code structures.
First, we use the AeDES scale to score the admissible observable damage extension on individual building components (n in Eq. 3) through expert elicitation, which can jointly describe each building-specific damage state of every scheme's fragility functions (, ). Some examples of this procedure are displayed in Fig. 7. These heuristics configure the training datasets. Subsequently, we have configured the testing datasets. They are composed of a synthetic dataset of 10 000 exhaustive possible combinations of the observable AeDES score-based damage extension {OD}n. Thereby, the likelihood terms and in Eq. (6) represent the probability of classifying each damage state and given the set of scored building components {OD}n.
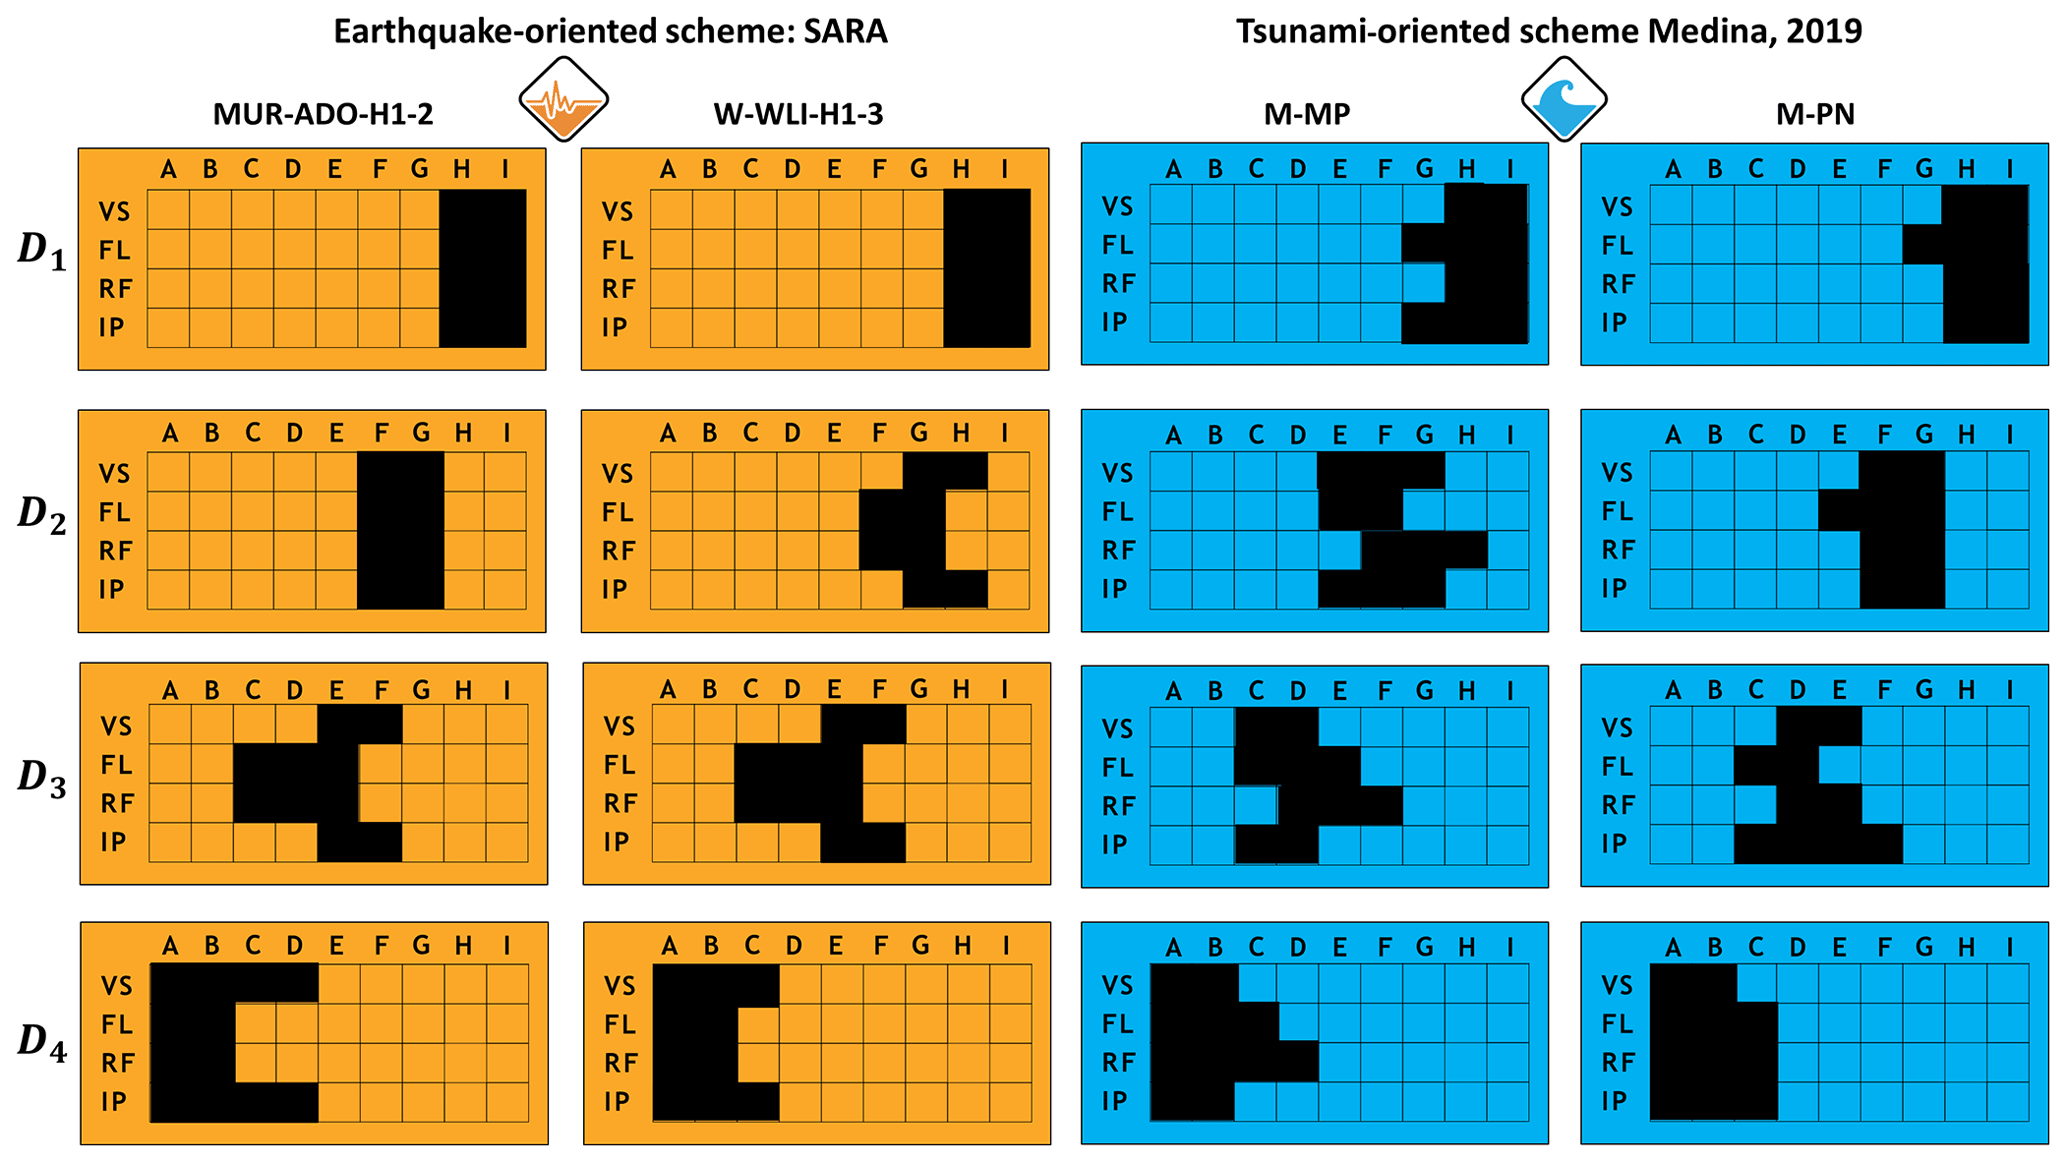
Figure 7Examples of the AeDES-based heuristics (see original AeDES form of Baggio et al., 2007, on Fig. 2) that describe the expected observable damage on the four selected building components listed in Eq. (3) (vertical structure, VS; floor, FL; roof, RF; infills and partitions, IPs) using the scale from I–A (i.e. I =0 (null)) to A =9 ( extension within the “very heavy” damage level). This is done per damage state per building class within two hazard-dependent vulnerability schemes.
To obtain the likelihood terms of in Eq. (6), we have decided to use the Gaussian naïve Bayes supervised machine learning classification algorithm. It is available in the free software library scikit-learn for the Python programming language (Buitinck et al., 2013). This selection is suitable for our classification problem because the observable damage heuristics can be assumed as normally distributed continuous data. This can be intuitively observed from the heuristic shown in Fig. 7 where the central damage states (i.e. moderate and extensive) show wider ranges of combinations of observable damage with respect to the lowest (slight) and largest (collapse) states. For illustrative purposes, in Fig. 8 we show one of the possible sets for the likelihood probabilities predicted for each damage state described in terms of observable damage extension with respect to the AeDES scale upon two building components (VS, IP) for two material-based typologies in the commonly exposed area to both perils, i.e. masonry and wooden structures (see Fig. 6a, c).
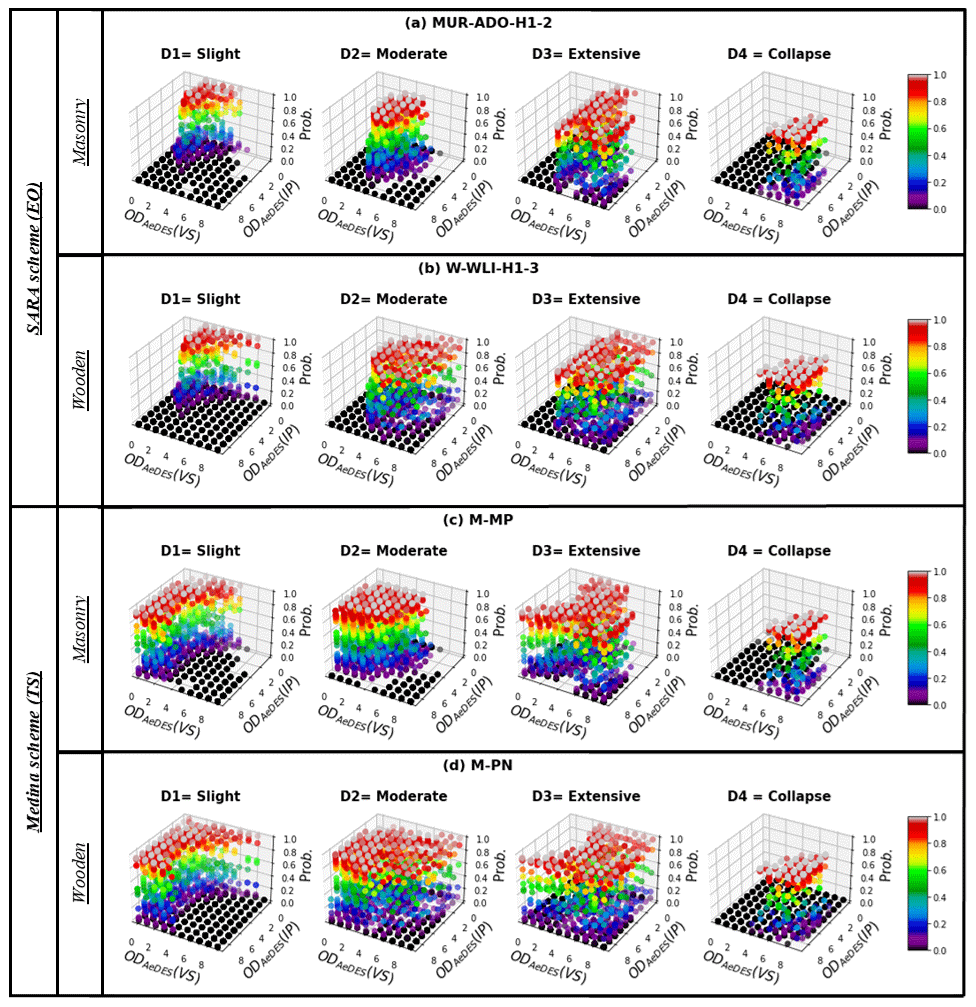
Figure 8Predicted likelihood probabilities of classifying each damage state of two building types that belong to the earthquake-oriented (EQ) vulnerability scheme SARA (, with building types k and sets of damage states z) and two building types that belong to the tsunami-oriented (TS) scheme Medina (, with building types j and sets of damage states y). These features come from having scored the likely observable damage {OD}n on the building components listed in Eq. (93) in terms of the AeDES scale, i.e. 0 = L–9 = A (e.g. as shown in Fig. 7). The predicted likelihood probabilities on the figure are only shown for the building component vertical structure (VS) and infills and partitions (IP) for masonry buildings (subplots a, c) and wooden buildings (subplots b, d).
The marginal probability in Eq. (6), p({OD}n), is assumed to be the proportion between one observation and the exhaustive combinations (). Thereafter, we have obtained the probabilistic inter-scheme damage matrix for each combination of building types from the two schemas (i.e. 21 SARA classes to 6 Medina classes =126 conversion matrices). Examples of the inter-scheme damage matrices are shown in Fig. 9 for three pairs of building types that had the highest inter-scheme compatibility values in Fig. 6b. Each of the 126 matrices that relates the damage states for each possible combination of building classes from the two schemas is subsequently weighted by the corresponding value of , that is, by the probability of the building classes of the two schemas actually being descriptive of the same actual building (i.e. Fig. 6b). When considered in Eq. (11), the damage-related matrices are maximised by the most compatible pairs of inter-schema building matrices (Fig. 6b). The scripts, heuristics, the final set of likelihoods, and the compatibility matrices are provided in Gómez Zapata et al. (2022c).
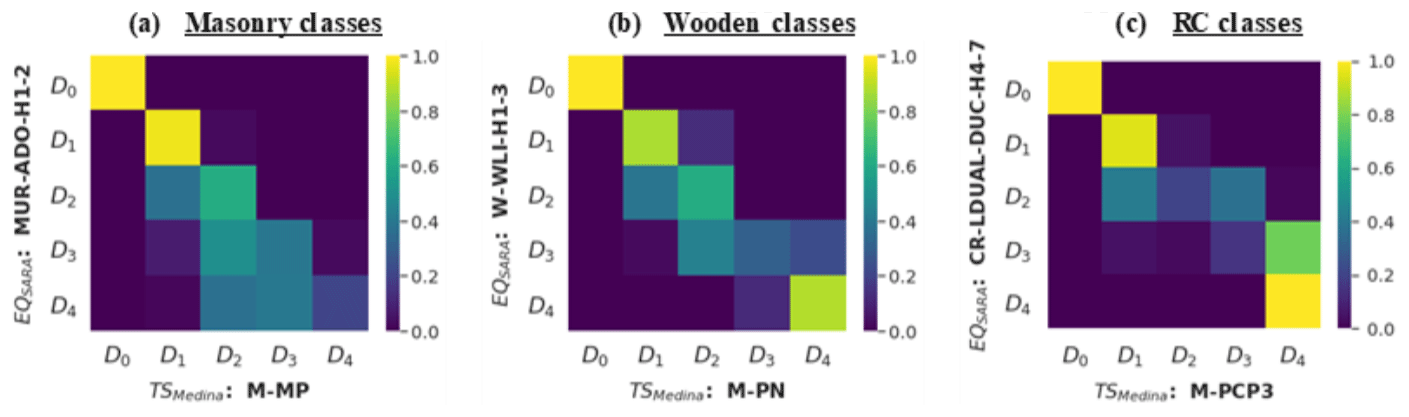
Figure 9Probabilistic inter-scheme damage compatibility matrices for three pairs of building classes: (a) masonry, (b) wooden, and (c) reinforced concrete (RC). The pairs of building typologies shown had the greatest compatibility in Fig. 6b. Their respective fragility functions are comprised within the source earthquake-oriented (EQ) vulnerability scheme SARA (, with building types k and sets of damage states z) and the target tsunami-oriented (TS) scheme Medina (, with building types j and sets of damage states y).
3.5 Tsunami state-dependent fragility functions for Lima
We have followed the method presented in Sect. 2.3 to configure the state-dependent fragility functions based on Scheme B (Medina) with associated analytical far-field tsunami fragility functions. The parameters that define the lognormal cumulative distributions for the four original damage states (assuming an initial undamaged state) as well as for the set of Gf=10 transition probabilities (from Eq. 8) are provided in the data repository (Gómez Zapata et al., 2022a). Figure 10 shows the analytical tsunami fragility functions (continuous lines) and state-dependent fragility curves with their respective damage transitions (non-continuous lines) for the six building classes.
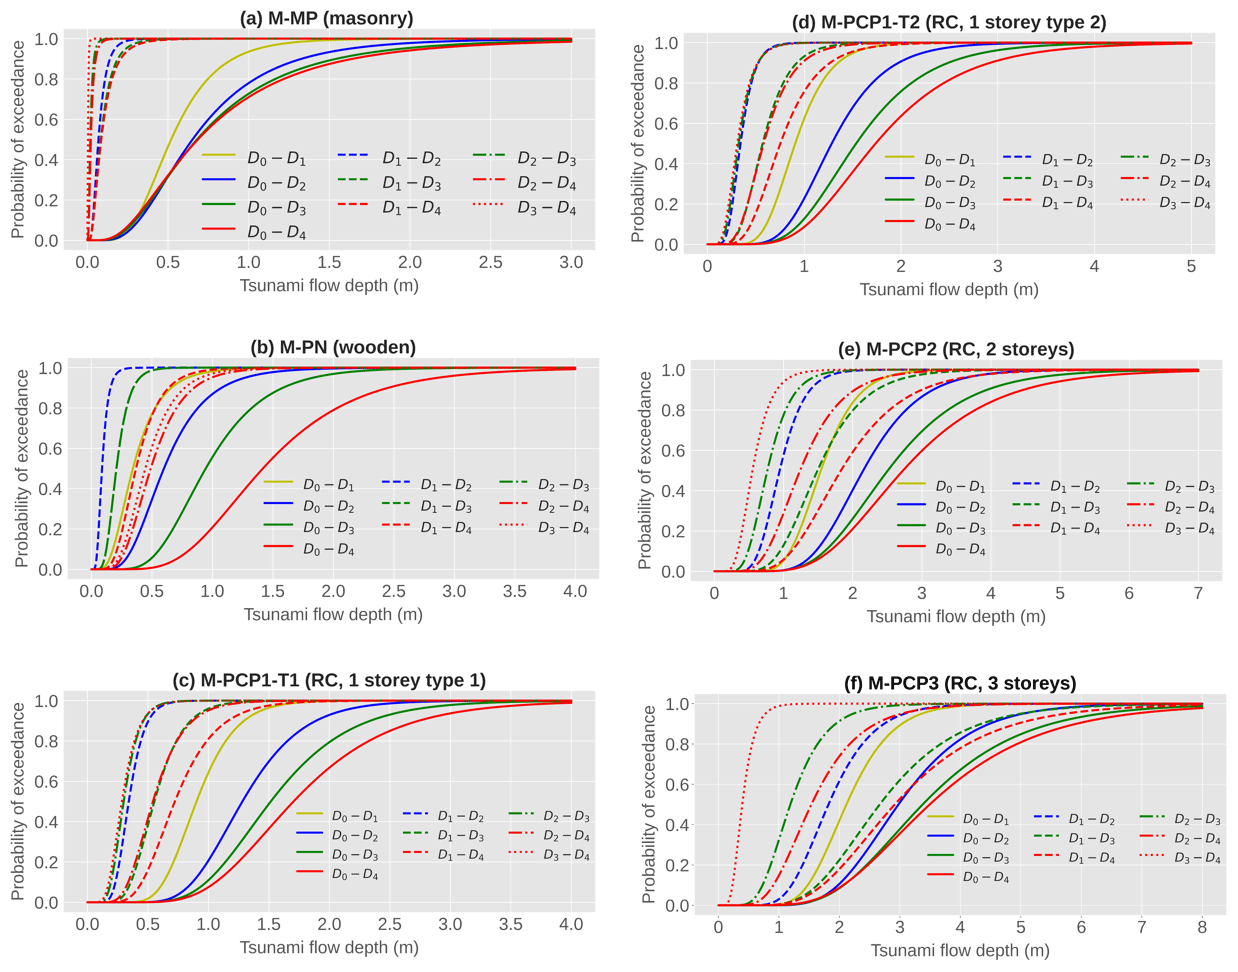
Figure 10Analytical tsunami fragility functions with initial undamaged states as proposed by Medina (2019) (continuous lines) and derived state-dependent fragility curves (non-continuous lines) in terms of flow depth (m) as IM for six building classes: (a) M-MP (masonry), (b) M-PN (wooden), (c) M-PCP1-T1 (framed reinforced concrete (RC), one storey with a similar length width ratio), (d) M-PCP1-T2 (framed RC, one storey with a higher length width ratio), (e) M-PCP2 (framed RC, two storeys), and (f) M-PCP3 (framed RC, three or more storeys).
From Fig. 10 it is possible to observe some features of the tsunami damaged-state fragility functions based on ad hoc calibration parameters (Sect. 2.3). For example, the masonry building class is the one most fragile to tsunami forces when in an undamaged state. Consequently, their associated state-dependent fragilities are shifted towards the left side of the plot in quite an extreme fashion (Fig. 10a). This means that for that building type there is a higher probability for it to follow a longer damage progression after having been strongly affected by the seismic ground shaking (dotted and dashed lines). Conversely, for the wooden buildings (Fig. 10b), these are more likely to follow a damage progression than other classes if they were slightly affected by the shaking (see dashed lines). For the two one-storey RC building types assessed (M-PCP1-T1 and M-PCP1-T2), there are negligible differences between the transition probabilities D2−D3 and D3−D4, as well as between D1−D3 and D2−D4. Notably, the inter-distances between these pairs of sets (of damage states) are of a similar order as the ones comprised by one and two damage state(s), respectively. This feature is neither present for the other RC buildings with increasing heights nor present for the wooden types. It is worth noting that these observations are fully dependent on the specific fragility models that we have implemented and the assumptions adopted to derive them (Eq. 10), and no further generalisations should be done until they can be further compared with other approaches and validated through other means.
3.6 Cumulative damage from consecutive ground shaking and tsunami scenarios in Lima
The spatially cross-correlated ground motion fields (Sect. 3.2, Fig. 11a, b), along with the exposure model for seismic vulnerability and its corresponding sets of fragility functions (Sect. 3.3, Fig. 11d, e), are the first sets of inputs required by the engine DEUS (Brinckmann et al., 2021) to estimate the damage distribution and direct economic losses for the residential building stock of Lima after each of the six earthquake scenarios considered. DEUS is a software designed to compute scenario-based risk from any type of natural hazard over spatially aggregated building portfolios. This version of DEUS is an open-source Python programme whose number of executions is proportional to the consecutive risk scenarios.
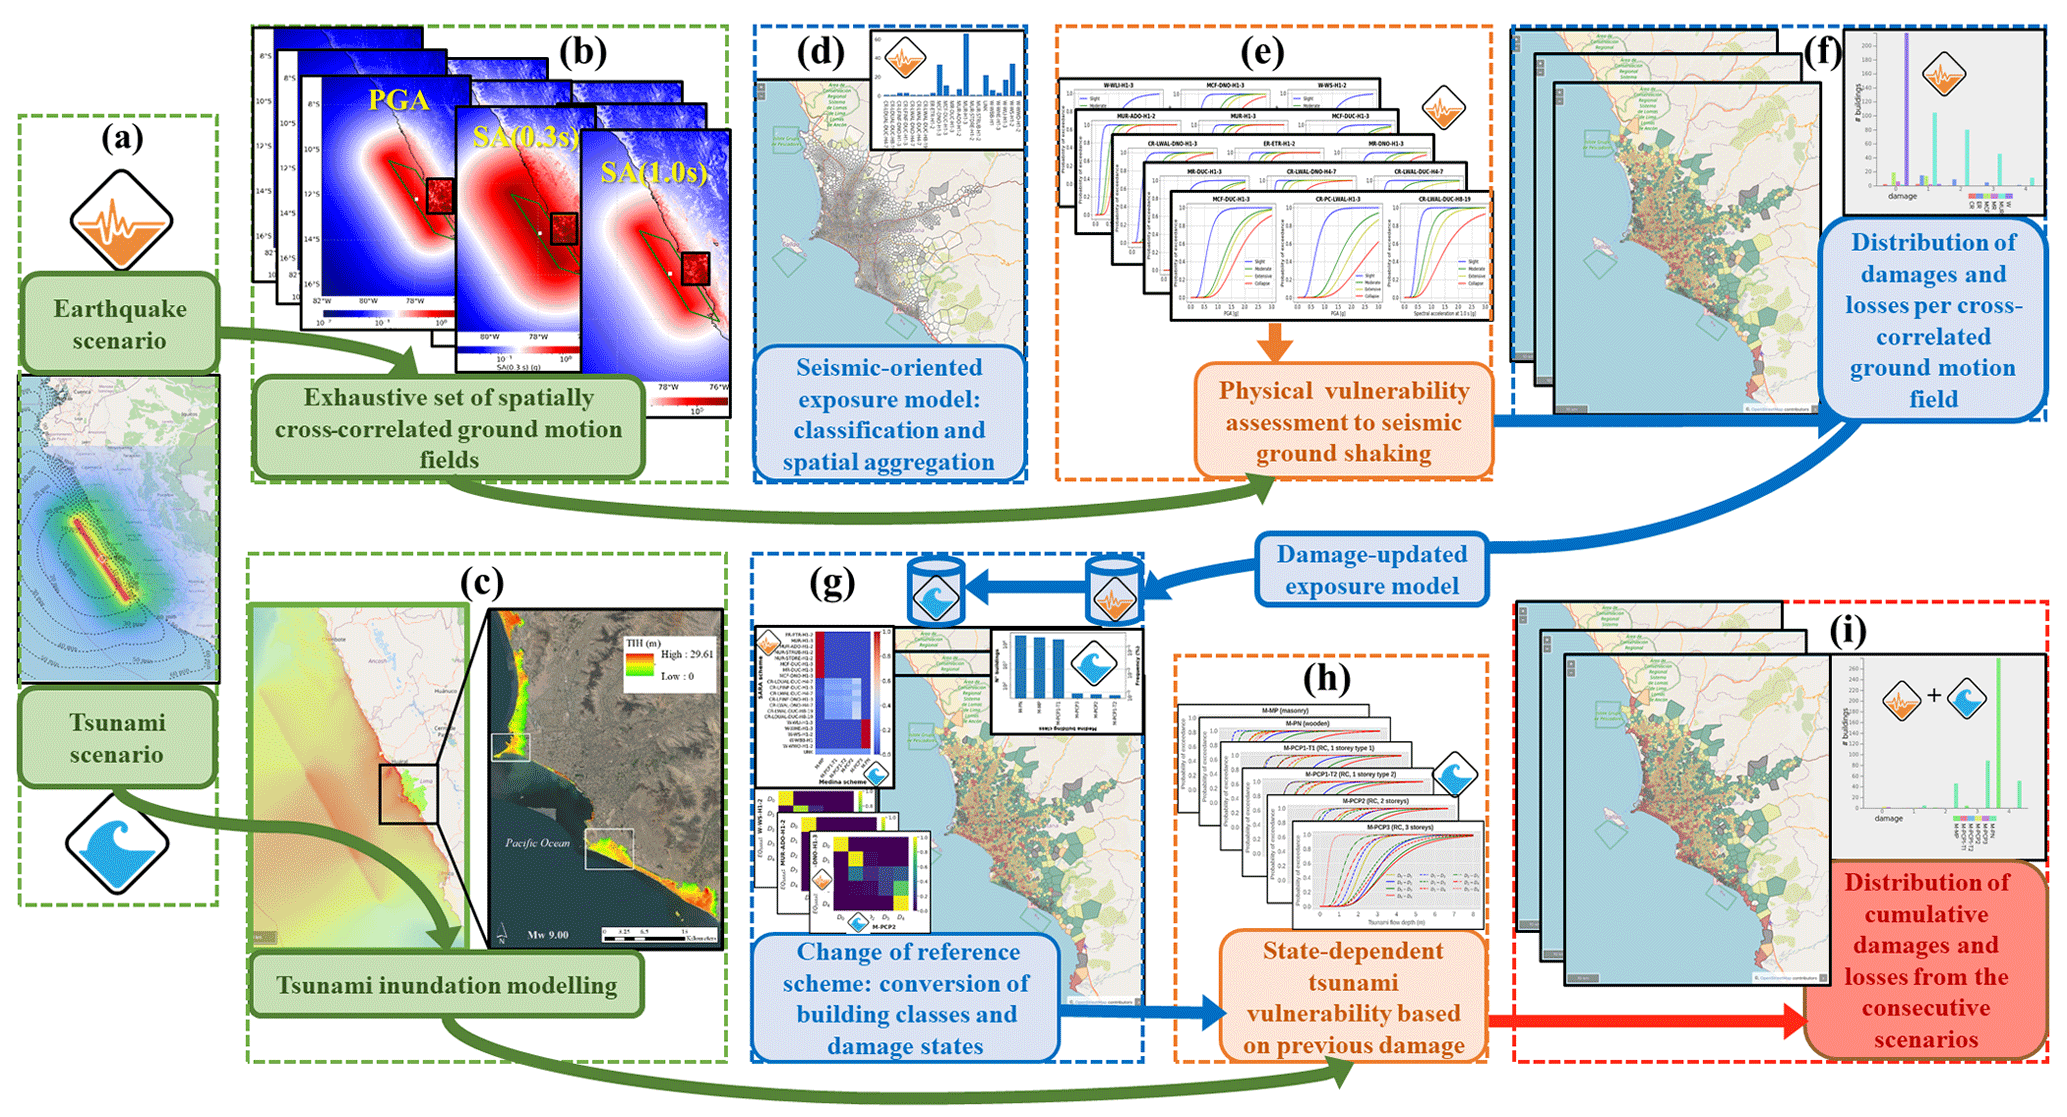
Figure 11Proposed workflow for multi-risk assessment in Lima from each pair of consecutive earthquake and tsunami scenarios. A Mw 8.8 event is displayed as an example (subplot a). The processes regarding the natural hazardous events are highlighted in green. Blue and orange indicate the exposure and vulnerability processes, respectively. The spatially cross-correlated ground motion fields (subplot b) and an initial exposure model (with earthquake-oriented classes, in subplot d) are inputs for the seismic vulnerability process using analytical fragility functions for ground shaking (subplot c), which provides the damage-updated exposure models (subplot f). The reference scheme conversion processes (building classes and damage states shown in subplot g) that generate the sets of damaged exposure models are, together with the tsunami inundation models (subplot e), the inputs used by the state-dependent tsunami fragility functions (subplot h) to finally obtain the distribution of cumulative damages and losses (red box in subplot i). Map data of subplot (c): © Google Earth 2021. Map data of subplots (a), (d), (f), (g), and (i): © OpenStreetMap contributors 2021), distributed under the Open Data Commons Open Database License (ODbL) v1.0.
As shown in Fig. 11f, g, the resulting damaged exposure model (after ground shaking) is used as input for a second execution to account for the cumulative damage induced by the corresponding tsunami scenarios. DEUS makes use of the two sets of inter-scheme compatibility matrices for buildings (Sect. 3.3) and damage states (Sect. 3.4) to change from the source earthquake reference scheme to the target tsunami reference scheme (see Fig. 11g). These are inputs together with the tsunami inundation heights (Sect. 3.2, Fig. 11c) and state-dependent tsunami fragility functions (Sect. 3.5, Fig. 11h) for the second run of DEUS. This time, the damage states are updated in the building exposure model, delivering only the disaggregated damage and losses expected from the tsunami. Finally, the cumulative distribution of losses is obtained by adding the latter disaggregated tsunami losses with the initial results derived from the earthquake ground shaking (Fig. 11i).
The generated results are presented in the form of loss exceedance curves in Fig. 12. This figure reports the probability of exceeding the selected loss metric (replacement cost in USD) for the six earthquake and tsunami scenarios that might impact the portion of the residential building stock of Lima that is commonly exposed to each pair of hazard scenarios. This figure shows five sets of curves, hereby described:
-
Earthquake ground-shaking-induced loss (blue curves). They represent the direct losses due only to seismic ground shaking using the SARA scheme (Villar-Vega et al., 2017). They are obtained through 1000 realisations of cross-correlated seismic ground motion fields using the models described in Sect. 3.2.
-
Losses obtained from the sole use of empirical fragility functions as simulating a near-field tsunami (red curves). These curves represent the losses from the cumulative effects of the shaking and the tsunami (without any possibility to separate both effects). Such loss prediction may be biased, since the empirical fragility functions of Suppasri et al. (2013) assuming an initial undamaged state () have not been validated for smaller or larger events. Similarly to what was concluded in Gomez-Zapata et al. (2021e), we have also observed that as the earthquake magnitude increases, the differences between the two largest loss values in the curve (from the two finest-resolution entities) are reduced.
-
Losses obtained from the sole use of analytical fragility functions as simulating a far-field tsunami (purple curves). They represent the direct losses obtained solely through the implementation of the analytical tsunami fragility tsunami Medina (2019), while assuming an initial undamaged state (), thus neglecting seismic ground shaking. Similarly, as done for the former case (empirical functions), the reduced variability of these results was accounted for through computations using seven exposure models with variable spatial resolutions obtained from a recent study (Gomez-Zapata et al., 2021e). This is a result of the lack of variability in the seismogenic parameters to vary only Mw and not having assumed distributions for slip rates but single values.
-
The losses related to the tsunami event obtained after using our method (state-dependent fragility functions, orange curves). They represent the direct losses, which were only derived from the updated exposure model (i.e. with non-zero damage states). This means that these curves only represent tsunami-induced losses for buildings that have already experienced earthquake-related damage. These loss exceedance curves are constructed using Eq. (11). Thus, this procedure implied the inter-scheme building conversion derived in Sect. 3.3 and the inter-scheme damage state conversion obtained in Sect. 3.4, as well as the state-dependent tsunami fragility functions constrained in Sect. 3.5.
-
Cumulative losses (our method) induced by the ground shaking and tsunami sequence (green curves). They represent the losses obtained by adding the shaking-induced losses (blue curves) with the aforementioned disaggregated tsunami-induced losses (orange curves), that is, the outcome of the method proposed in this paper. These green curves represent, according to our approach, the likely losses that would be expected from each magnitude-dependent scenario-based cascading sequence over the considered building stock.
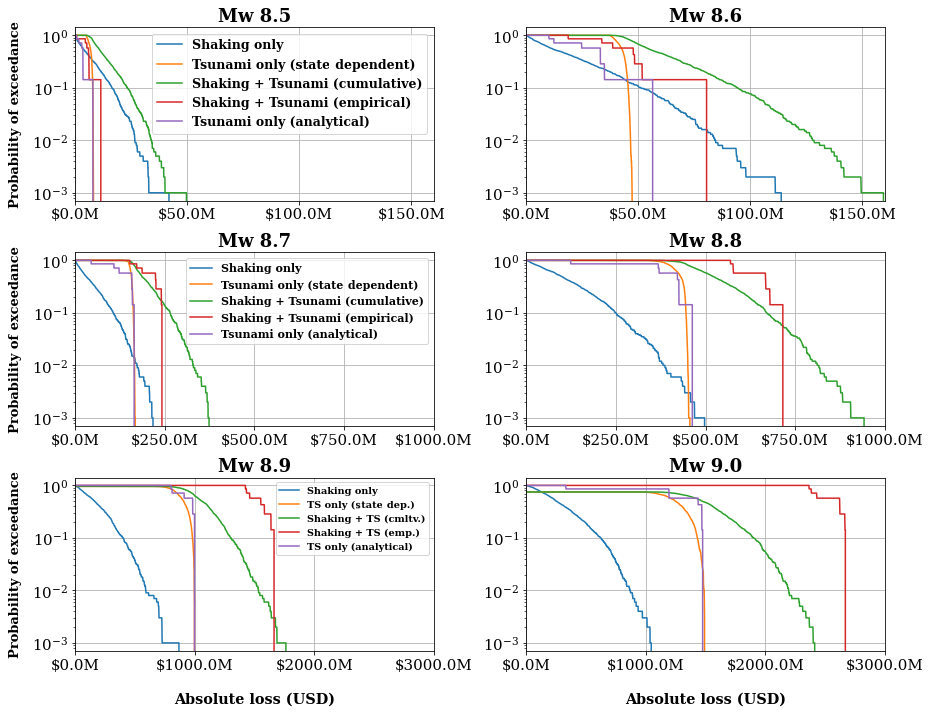
Figure 12Five loss exceedance curves for the residential building portfolio of Lima are presented in six subplots per earthquake magnitude scenario (Mw (8.5–9.0)). Three out of the five curves represent the disaggregated losses per hazard event: shaking-induced losses only (blue), far-field tsunami-induced losses (initial undamaged state, purple), and state-dependent tsunami-induced losses (with pre-existing shaking-induced damage, orange). The green curves represent the losses expected from the cascading sequence. The red ones show the losses derived solely using empirical tsunami fragility functions (implying that they have an implicit contribution to the earthquake phase).
Hereafter we describe some observations that arise from Fig. 12:
-
The resultant losses obtained after having used the two sets (empirical or analytical) of tsunami fragility functions (while assuming initial undamaged states) are profoundly different. As expected, the use of the empirical tsunami fragility model (red curves), for all the magnitudes, leads to larger values in comparison with the values obtained from the analytically derived fragility functions (purple). These differences increase with magnitude. This feature might arise from the fact that empirical fragility functions consider both earthquake and tsunami actions, while the purple curves consider only the effects of the tsunami, as well as because empirical fragility functions only account for flow depth as the IM. Conversely, the analytical fragility functions implemented were derived using the theoretical forces associated with the flow velocity tsunami waves as input in the generating numerical model. Similar observations regarding the reduction in the loss estimations when flow velocity is included have been drawn by other studies (e.g. Attary et al., 2021; Park et al., 2017).
-
We observe that the ground shaking dominates the losses at lower magnitudes (Mw 8.5, 8.6), while the tsunami, either from analytical (emulating far-field tsunamis) or empirical fragility functions (near-field tsunamis), controls the losses for the rest of the scenarios with larger magnitudes. The former is aligned with the observations of Goda and De Risi (2018) and Gomez-Zapata et al. (2021e) for the case of empirical tsunami models. Moreover, a similar trend is observed for the disaggregated tsunami-induced losses (assuming initial non-zero damage) whose respective loss values (orange curves) are larger than the shaking-induced losses for Mw 8.8, 8.9, and 9.0. Hence, these features highlight that as the magnitude increases, there is an increasing comparative importance of the tsunami risk within the considered sequence of hazards.
-
Expected loss values from cumulative damages based on single-hazard vulnerability models (our method, green curves) are clearly different from the one produced by classical empirical tsunami models. Classical empirical tsunami fragility functions lead to considerably lower loss estimations for the low-magnitude earthquakes and substantial larger estimations for the larger ones.
-
The differences between the loss exceedance curves derived from both sets of analytical fragility models (either from undamaged or with pre-existing damage) are larger for the lower magnitudes (Mw 8.5, 8.6) and decrease with increasing magnitude. As the magnitude increases, there is an increasing tendency of convergence between these two loss curves (Mw 8.9, 9.0).
-
Consequently, since tsunami-induced losses either from analytical fragilities (initial undamaged states) or from state-dependent and inter-scheme models converge for the larger magnitudes (Mw 8.9, 9.0), their respective summations with the shaking-induced losses would be approximately similar at the largest probabilities of exceedance. Nevertheless, this observation needs to be better investigated through more exhaustive simulations of tsunami inundation per considered scenario.
-
Conversely, considering observation three, (i.e. as the magnitude decreases, the differences between purple curves and orange curves increase), their respective summations with the shaking-induced losses will lead to very different results. Hence, this observation suggests that, although earthquake and tsunami structural responses can be separately approximated for very large magnitudes, it is still required to address cumulative damages from the vulnerability interactions that are expected on the lower-magnitude earthquakes we have considered (i.e. Mw 8.5, 8.6).
When we consider analytical fragility functions with that only emulate the damaging actions of far-field tsunamis (without any ground shaking), we observe that as the magnitude increases, their respective loss exceedance curves converge with the ones that assumed state dependency (. This is because, for the larger-magnitude events, the damaging actions due to seismic ground shaking will correspondingly increase. Hence, the available probabilistic damage transitions from the damage states within the earthquake (source) to tsunami (target) schemes will consequently be reduced. Therefore, we observe that if far-field analytical tsunami fragility functions are used, their corresponding results will be very much alike, regardless of whether they are considered undamaged () or having pre-existing damage . Therefore, for these larger-magnitude events, regardless of which curve is summed up with the shaking-induced losses, the resulting loss distributions for the hazard sequence would lead to quite similar results. Thus, the implementation of state dependency on tsunami fragility may not be fully necessary to be addressed for very large earthquake magnitudes (Mw 8.9, 9.0). This observation is aligned with studies (i.e. Petrone et al., 2020; Rossetto et al., 2018) that suggest that earthquake and tsunami structural responses can be separately approximated. However, the former statement would not apply to the low-magnitude earthquakes investigated in Lima for which the pre-existing damage due to earthquakes must be addressed. No generalisations should therefore be made in this regard, with sensitivity analyses needing to be carried out in the future.
This study has proposed a modular method to disaggregate the direct losses expected for building portfolios exposed to consecutive hazardous scenarios of different natures in which their individual components could be individually improved. Therefore, future sensitivity analyses on some of the modules related to damage states would benefit from the understanding of how their embedded uncertainties would impact their corresponding results. We can mention the following:
-
The disaggregation of building classes into taxonomic attributes as presented in Sect. 2.1 is an important input to obtain the probabilistic inter-scheme compatibility matrices based on Gómez Zapata et al. (2022b). However, it is worth noting the shortcoming described by Charvet et al. (2017), referring to the generally poor taxonomic building characterisations of the currently available tsunami fragility models. They are, most of the time, only based on their main construction material, although sometimes they include the number of storeys, and rarely do they include other attributes such as the date of construction (e.g. Suppasri et al., 2015). When more enriched descriptions for tsunami vulnerability become available in the future, this approach will remain useful for similar purposes.
-
When/if local high-quality empirical data collection and analytical models become available, they could be used to constrain the relationships between the failure mechanisms and attribute relevance to hazard-related susceptibilities. This might contribute to enhancing the construction of heuristics that characterise the likely observable damage extent (per damage limit state, building type, and hazard-dependent fragility model) that could be obtained through more refined approaches such as unsupervised machine learning. Its use applied on real datasets that document observations on building components (even different from the ones presented in Eq. 3) could contribute to refining state-dependent tsunami fragility functions and restricting the heuristics on the likely observable damage (Sect. 2.2) and thus minimising subjective expert judgment. In this sense, it is worth noting that the set of predicted likelihood probabilities in the probabilistic compatibility degree between damage states from different hazard fragility functions that we derived from the synthetic datasets created through the heuristics and the AeDES scoring system is not unique, as they depend on the choice of machine learning technique and on the heuristics derived through expert elicitation. In this sense, we have documented a preliminary sensitivity analysis on such parameterisation in Gómez Zapata et al. (2022c). However, further investigation of the impact of such parameterisation is still advised.
-
As described by Hill and Rossetto (2008), we have observed that, when characterising damage states due to the impacts of natural hazards on buildings, there is still the need for standardisation in describing observable physical damage after any kind of hazardous event through the harmonisation of damage scales for data collection, not only regarding entire building units but also regarding the particular damage (and extent) experienced by certain individual components. In this regard, although we have used the AeDES scale, other damage scales could be more suitable to describe the observable damage to some building classes than for others (Hill and Rossetto, 2008; Turchi et al., 2022). Nonetheless, the choice of a standard scale to transversally describe any observable set of damage on buildings will benefit the research in multi-hazard vulnerabilities.
-
The integration of economic consequence models for physical vulnerability based on the replacement costs as a function of the buildings' area, as for instance presented in Triantafyllou et al. (2019), for tsunami vulnerability is worth testing. This also depends on the available data, and it is out of the scope of this paper, but it would be worth exploring their contribution once more refined estimations about replacement cost are available for Lima. Nevertheless, one should be aware of the uncertainties involved in large-scale building exposure models.
-
The derivation of the hazard intensities could also benefit from future enhancements. For instance, the GMPE-based seismic accelerations derived from a simplified site grid of ∼1 km might be too coarse to capture local site effects in the expected ground motions. However, the performance of site-response analyses that account for the local geotechnical soil properties of site-specific soil profiles, as for instance reported by Aguilar et al. (2019), is a computationally demanding task that is out of the scope of this study, but when integrated it could benefit the overall quality of seismic risk calculations for the study area. Complementarily, we strongly advise to generate exhaustive sets of cross-correlated ground motion fields (at the required spectral periods by the buildings classes) to address their aleatory uncertainty. The selection of this model, among the available ones, carries epistemic uncertainties.
It is worth noting that the variability of the loss exceedance curves obtained for the cumulative damage (due to tsunamis) was derived from the damaged exposure models subjected to each realisation of cross-correlated ground motion fields (i.e. orange curves in Fig. 12). Therefore, investigating the impact of other tsunami vulnerability and hazard data products (Behrens et al., 2021), which was beyond the scope of this paper, is nonetheless worth exploring. When such parameterisation in the tsunami data products becomes available for Lima, future studies could provide dimensionality of the contribution of the tsunami hazard upon the outlined method for scenario multi-risk estimates.
For the commonly exposed residential building stock of Lima exposed to both perils, we have observed that assuming initial undamaged states in the selected tsunami empirical fragility functions leads to large underestimations for lower magnitudes (Mw) and large overestimations for larger Mw events in comparison to when state-dependent models were used. Hence, the initial undamaged state assumption used to assess the tsunami vulnerability in former studies (e.g. Adriano et al., 2014; Gomez-Zapata et al., 2021e) may not be completely accurate to represent the losses expected after this type of cascading sequence. This is because such an assumption misses the calculation of earthquake-related damage, which is an important input needed to assess cumulative damage and losses through state-dependent analytical fragility models. On the other hand, adopting the larger value between independent earthquake and tsunami risk computations proposed by Goda and De Risi (2018) may lead to better correspondence with our model (mostly for the lower Mw events) than the sole use of the selected non-state-dependent analytical fragility functions.
To give a perspective on the importance of addressing cumulative damage and losses for building stocks, let us recall some of the findings of the available studies of Gomez-Zapata et al. (2021e) and Markhvida et al. (2017). They investigated the likely economic losses of the entire residential building portfolio of Lima and Callao solely after seismic ground motion from a Mw 8.8 scenario, addressing the variability induced by the same cross-correlation model we have implemented herein. In the first study, ∼1 657 635 residential buildings were considered, and both studies considered the SARA building classes and fragility functions, similar to what we have done. Both studies reported mean loss values of around USD 7 billion and a maximum of around USD 35 billion (among a stochastic sample of events). It is then interesting to compare such a range of values with the mean loss values reported for a similar Mw (Fig. 11d). Notably, the forecasted losses per event (shaking and tsunami) and inferred from cumulative damage were derived from the much smaller commonly exposed building stock to each pair of hazard scenarios (see Fig. 8c), which constitute ∼21 209 buildings. This means that the building count for the entire residential stock of Lima (Fig. 6a) is around 78 times larger than that commonly exposed to both perils (Fig. 6b). Hence, we can note the important role of tsunami-induced losses in the study area. The mean losses expected from the cascading sequence of that Mw 8.8 (i.e. value for the 50th percentile on the green curve in Fig. 11b) is ∼ USD 0.75 billion and a maximum of around USD 0.94 billion. Therefore, given the difference between the size of both building portfolios, finding out that the losses for the entire city are expected to be only 9 times larger than the ones forecasted after the action of both earthquakes and tsunamis tells us the crucial importance of carefully addressing the cumulative damage due to tsunamis in the study area. Moreover, this tell us that, besides all of the secondary effects of the tsunami, these types of future scenarios in Lima will constitute not only a huge source of direct economic losses for building portfolios but also uncertainties due to the lack of data to calibrate or validate these types of risk assessment after the action of cascading hazards.
We have proposed a modular method that allows us to consistently re-use existing single-hazard fragility models that are being developed by experts in various research fields and integrate them for multi-hazard risk assessment for extended building portfolios. This integration aims for the probabilistic harmonisation of diverse hazard-dependent building classes and damage states, which are included in their associated fragility functions. Through this integration, we aim to provide an alternative approach to conventional ones (e.g. HAZUS-MH; FEMA, 2003, 2017) that considers a single building class with sets of fragility functions for a variety of hazards. In this sense, the method we have developed can be particularly useful to assess the cumulative damage in hazard sequences of different natures and forces that might induce various failure mechanisms upon the exposed buildings. Thereby, the presented integrative method contributes to reducing the existing gaps due to the typical lack of collective calibration and validation of multi-hazard risk methods. This is due to, for instance, when triggered events act on damaged assets right after the first hazard or even simultaneously, thus experiencing compound hazards with no time for damage reconnaissance or disaggregation of the damage features induced by the individual hazards.
We have proposed a modular method composed of the following components:
-
Existing hazard-dependent vulnerability schemes are selected to model the building portfolio under each hazard-dependent vulnerability scheme of interest. They contain sets of building classes and associated fragility functions. To model the physical vulnerability of the building portfolio towards the triggering event (in this case, earthquake), there is no preference on whether empirical or analytical fragility functions should be used.
-
On the other hand, to model the physical vulnerability of the building stock towards the triggered event, sets of state-dependent fragility functions must be derived for each building type within the selected scheme. For this purpose, it is important to use models that do not involve the damaging effects of the triggered event as the starting point (i.e. avoiding empirical models and using analytical ones). This proposal overcomes the assumption of initial undamaged states for the structures exposed to the triggered event and allows us to account for the differential cumulative damage between hazards.
-
The building classes are characterised through their disaggregation into building taxonomic attributes. This description allows for the harmonisation between the building classes belonging to different hazard-dependent vulnerability schemes through the probabilistic inter-scheme compatibility matrix proposed in Gómez Zapata et al. (2022b).
-
The exposure models are spatially aggregated into optimal geographic entities (i.e. CVT-based models) that account for the spatial variability of low-correlated hazard IM in their derivation (Gomez-Zapata et al., 2021e). This selection was taken due to performance purposes only, but a more refined block-based model could also have been used.
-
A generalised description of the damage states is given based on a set of observable damage types on individual building components. This is done through a scoring system based on an underlying common scale (employing, for example, the AeDES form) that ultimately allows us to get the damage state inter-scheme conversion. We use the total probability theorem, a Bayesian formulation, and machine learning techniques.
-
A vulnerability assessment is conducted for sequences of cascading hazard scenarios through the proposal of consistent economical consequence models across hazard-dependent vulnerability schemes. They must define replacement cost ratios per damage state and per fragility function associated with each vulnerability scheme.
The joint combination of these components creates a method to update the damage states throughout the multi-hazard sequence while allowing us to exploit existing hazard-specific risk-oriented taxonomies (i.e. building classifications with corresponding fragility functions and defined damage states) available in the literature for a wide range of natural hazards. This is a modular method in which each one of their individual components can be separately customised when seeking future improvements.
When applying this method on the residential building stock of Lima (Peru), we have observed, on the one hand, that considering the risk metrics from tsunami vulnerability only from the selected set of empirical fragility functions (derived from near-field tsunamis) as representative of the shaking and tsunami sequences leads to underestimations for the lower magnitudes. On the other hand, we have observed overestimations for the larger-magnitude scenarios in comparison with the state-dependent method that accounts for the accumulated damage due to the former earthquake solicitations. We have observed that the use of the proposed method to assess the cumulative damage is more relevant for the lower-magnitude scenarios than we have considered (Mw 8.5 and 8.6). This might be due to the greater damage extension on the exposed buildings that is expected from the seismic demands in comparison with those imposed by their corresponding tsunamis, and thus there is a greater chance to obtain cumulative damage. On the contrary, for larger magnitudes, the use of state-dependent fragilities and analytical functions assuming no pre-existing damage is converging, and thus the importance of assessing state-dependency is reduced.
Considering the limitations and simplifications assumed in this study, we are not claiming that the resulting economic losses we have calculated for the residential building stock of Lima from multi-hazard scenario-based risk computations are totally exhaustive. Thus, caution should be taken with the interpretation and extrapolation of these conclusions to other study areas and combinations of models. Nevertheless, awareness of these uncertainties for the reliable quantification of risk towards these cascading hazards is increasingly important to enhance mitigation strategies for disaster risk reduction (Imamura et al., 2019). Furthermore, it is worth recalling that the method herein proposed has been exclusively designed for spatially extended residential buildings as proof of a concept for integrating existing fragility models. We do not provide a complete validation of multi-vulnerability approaches, but rather we offer a holistic and novel harmonising method to track such dynamics in a consistent manner. Hence, our method is not meant to replace more detailed analytical analyses required to determine the structural response of individual buildings subjected to seismic and tsunami loading (e.g. Petrone et al., 2017; Rossetto et al., 2019).
The data used in the elaboration of this study are available in open repositories. The scenario-based ground motions and tsunami inundation maps are available in Gomez-Zapata et al. (2021c, https://doi.org/10.5880/riesgos.2021.008) and Harig and Rakowsky (2021, https://doi.org/10.5880/riesgos.2021.010), respectively. The first set was calculated making use of the Shakyground script (Weatherill et al., 2021, https://doi.org/10.5880/riesgos.2021.004), which relies on the OpenQuake Engine (Pagani et al., 2014, https://doi.org/10.1785/0220130087), while the second set was calculated using the TsunAWI software. The exposure and fragility models for both hazard-vulnerability schemes (earthquake and tsunami) are available in Gomez-Zapata et al. (2021a, https://doi.org/10.5880/riesgos.2021.006; b, https://doi.org/10.5880/riesgos.2021.007) and were adapted to fulfil the data formats required by the scripts provided by AssetMaster and ModelProp (Pittore et al., 2021, https://doi.org/10.5880/riesgos.2021.005). They were used as inputs for the scenario-based seismic risk assessment (Sect. 3.6) using the DEUS software (Brinckmann et al., 2021, https://doi.org/10.5880/riesgos.2021.011). The scenario-based risk estimates for earthquakes and tsunamis using analytical and empirical fragility functions, respectively, are provided in Gomez-Zapata et al. (2021d, https://doi.org/10.5880/riesgos.2021.009).
JCGZ and MP conceived the study. JCGZ wrote the manuscript. JCGZ conducted the data processing and formal analysis. NB contributed to software development. JLM and SM developed analytical tsunami fragility functions. NT contributed to the synthetic scorings of observable damage per building typology. MP and FC supervised the study and reviewed the manuscript. All authors agreed to the published version of the manuscript.
The contact author has declared that none of the authors has any competing interests.
Publisher’s note: Copernicus Publications remains neutral with regard to jurisdictional claims in published maps and institutional affiliations.
This article is part of the special issue “Multi-risk assessment in the Andes region”. It is not associated with a conference.
We want to express our gratitude to Andrey Babeyko, Michael Haas, Michael Langbein, Jörn Lauterjung, Giuseppe Nicodemo, Juan Páez-Ramírez, Juan Palomino, Matthias Rüster, and Sandra Santa-Cruz for their support during the elaboration of this study. Thanks to Sven Harig and Natalja Rakowsky for having provided us with the tsunami inundation models for Lima. We also thank Henning Lilienkamp and Graeme Weatherill for their support with the simulation of spatially correlated ground motion fields and machine learning techniques. We thank Kevin Fleming for the careful proofreading in a previous draft of the manuscript.
This research has been supported by the German Federal Ministry of Education and Research (BMBF, Bundesministerium für Bildung und Forschung) through the RIESGOS and RIESGOS 2.0 projects (grant nos. 03G0905A-H and 03G0876A-J). These projects are part of the funding programme CLIENT II – International
Partnerships for Sustainable Innovations.
The article processing charges for this open-access publication were covered by the Helmholtz Centre Potsdam – GFZ German Research Centre for Geosciences.
This paper was edited by Elisabeth Schoepfer and reviewed by two anonymous referees.
Adriano, B., Mas, E., Koshimura, S., Estrada, M., and Jimenez, C.: Scenarios of Earthquake and Tsunami Damage Probability in Callao Region, Peru Using Tsunami Fragility Functions, Journal of Disaster Research, 9, 968–975, https://doi.org/10.20965/jdr.2014.p0968, 2014.
Aguilar, Z., Lazares, F., Alarcon, S., Quispe, S., Uriarte, R., and Calderon, D.: Actualización de la Microzonificación Sísmica de la ciudad de Lima, International Symposium for CISMID 25th Anniversary 17–18 August, 2012, Lima, Peru, 2013.
Aguilar, Z., Tarazona, J., Vergaray, L., Barrantes, J., Uriarte, R., and Calderon, D.: Site response analysis and its comparison with the peruvian seismic design spectrum, TECNIA, 29, 91–97, https://doi.org/10.21754/tecnia.v29i2.700, 2019.
Allen, T. I. and Wald, D. J.: Topographic Slope as a Proxy for Seismic Site-Conditions (VS30) and Amplification Around the Globe, Open-File Report 2007-1357, https://doi.org/10.3133/ofr20071357, 2007.
Antoncecchi, I., Ciccone, F., Dialuce, G., Grandi, S., Terlizzeze, F., Di Bucci, D., Dolce, M., Argnani, A., Mercorella, A., Pellegrini, C., Rovere, M., Armigliato, A., Pagnoni, G., Paparo, M. A., Tinti, S., Zaniboni, F., Basili, R., Cavallaro, D., Coltelli, M., Firetto Carlino, M., Lipparini, L., Lorito, S., Maesano, F. E., Romano, F., Scarfì, L., Tiberti, M. M., Volpe, M., Fedorik, J., Toscani, G., Borzi, B., Faravelli, M., Bozzoni, F., Pascale, V., Quaroni, D., Germagnoli, F., Belliazzi, S., Del Zoppo, M., Di Ludovico, M., Lignola, G. P., and Prota, A.: Progetto SPOT - Sismicità Potenzialmente Innescabile Offshore e Tsunami: Report integrato di fine progetto, Version 1, Ministero dello Sviluppo Economico, Zenodo, https://doi.org/10.5281/zenodo.3732887, 2020.
Arrighi, C., Tanganelli, M., Cristofaro, M. T., Cardinali, V., Marra, A., Castelli, F., and De Stefano, M.: Multi-risk assessment in a historical city, Nat. Hazards, online first, https://doi.org/10.1007/s11069-021-05125-6, 2022.
Attary, N., van de Lindt, J. W., Unnikrishnan, V. U., Barbosa, A. R., and Cox, D. T.: Methodology for Development of Physics-Based Tsunami Fragilities, J. Struct. Eng., 143, 04016223, https://doi.org/10.1061/(ASCE)ST.1943-541X.0001715, 2017.
Attary, N., Van De Lindt, J. W., Barbosa, A. R., Cox, D. T., and Unnikrishnan, V. U.: Performance-Based Tsunami Engineering for Risk Assessment of Structures Subjected to Multi-Hazards: Tsunami following Earthquake, J. Earthq. Eng., 25, 2065–2084, https://doi.org/10.1080/13632469.2019.1616335, 2021.
Baggio, C., Bernardini, A., Colozza, R., Corazza, L., Della Orsini, M., Di Pascuale, G., Dolce, M., Goretti, A., Martinelli, A., Orsini, G., Papa, F., and Zuccaro, G.: Field Manual for post-earthquake damage and safety assessment and short term countermeasures (AeDES), EUR 22868 EN – Joint Research Centre – Institute for the Protection and Security of the Citizen, Office for Official Publications of the European Communities, Luxembourg, 100 pp., https://publications.jrc.ec.europa.eu/repository/handle/JRC37914 (last access: 2 June 2023), 2007.
Behrens, J., Løvholt, F., Jalayer, F., Lorito, S., Salgado-Gálvez, M. A., Sørensen, M., Abadie, S., Aguirre-Ayerbe, I., Aniel-Quiroga, I., Babeyko, A., Baiguera, M., Basili, R., Belliazzi, S., Grezio, A., Johnson, K., Murphy, S., Paris, R., Rafliana, I., De Risi, R., Rossetto, T., Selva, J., Taroni, M., Del Zoppo, M., Armigliato, A., Bureš, V., Cech, P., Cecioni, C., Christodoulides, P., Davies, G., Dias, F., Bayraktar, H. B., González, M., Gritsevich, M., Guillas, S., Harbitz, C. B., Kânoğlu, U., Macías, J., Papadopoulos, G. A., Polet, J., Romano, F., Salamon, A., Scala, A., Stepinac, M., Tappin, D. R., Thio, H. K., Tonini, R., Triantafyllou, I., Ulrich, T., Varini, E., Volpe, M., and Vyhmeister, E.: Probabilistic Tsunami Hazard and Risk Analysis: A Review of Research Gaps, Frontiers in Earth Science, 9, 628772, https://doi.org/10.3389/feart.2021.628772, 2021.
Belliazzi, S., Lignola, G. P., Di Ludovico, M., and Prota, A.: Preliminary tsunami analytical fragility functions proposal for Italian coastal residential masonry buildings, Structures, 31, 68–79, https://doi.org/10.1016/j.istruc.2021.01.059, 2021.
Bernal, G. A., Salgado-Gálvez, M. A., Zuloaga, D., Tristancho, J., González, D., and Cardona, O.-D.: Integration of Probabilistic and Multi-Hazard Risk Assessment Within Urban Development Planning and Emergency Preparedness and Response: Application to Manizales, Colombia, Int. J. Disast. Risk Sc., 8, 270–283, https://doi.org/10.1007/s13753-017-0135-8, 2017.
Bonacho, J. and Oliveira, C. S.: Multi-hazard analysis of earthquake shaking and tsunami impact, Int. J. Disast. Risk Re., 31, 275–280, https://doi.org/10.1016/j.ijdrr.2018.05.023, 2018.
Brinckmann, N., Gomez-Zapata, J. C., Pittore, M., and Rüster, M.: DEUS: Damage-Exposure-Update-Service, Version 1.0, GFZ Data Services [code], https://doi.org/10.5880/riesgos.2021.011, 2021.
Brzev, S., Scawthor, C., Charleson, A. W., Allen, L., Greene, M., Jaiswal, K., and Silva, V.: GEM building taxonomy version 2.0, GEM Foundation, Pavia, https://doi.org/10.13117/GEM.EXP-MOD.TR2013.02, 2013.
Buitinck, L., Louppe, G., Blondel, M., Pedregosa, F., Mueller, A., Grisel, O., Niculae, V., Prettenhofer, P., Gramfort, A., Grobler, J., Layton, R., VanderPlas, J., Joly, A., Holt, B., and Varoquaux, G.: API design for machine learning software: experiences from the scikit-learn project, in: European Conference on Machine Learning and Principles and Practices of Knowledge Discovery in Databases, Prague, Czech Republic, September 2013, 108–122, https://inria.hal.science/hal-00856511 (last access: 2 June 2023), 2013.
Ceferino, L., Kiremidjian, A., and Deierlein, G.: Regional Multiseverity Casualty Estimation Due to Building Damage following a Mw 8.8 Earthquake Scenario in Lima, Peru, Earthq. Spectra, 34, 1739–1761, https://doi.org/10.1193/080617EQS154M, 2018.
Charvet, I., Macabuag, J., and Rossetto, T.: Estimating Tsunami-Induced Building Damage through Fragility Functions: Critical Review and Research Needs, Frontiers in Built Environment, 3, 36, https://doi.org/10.3389/fbuil.2017.00036, 2017.
Cremen, G., Galasso, C., and McCloskey, J.: Modelling and quantifying tomorrow's risks from natural hazards, Sci. Total Environ., 817, 152552, https://doi.org/10.1016/j.scitotenv.2021.152552, 2022.
Dabbeek, J. and Silva, V.: Modeling the residential building stock in the Middle East for multi-hazard risk assessment, Nat. Hazards, 100, 781–810, https://doi.org/10.1007/s11069-019-03842-7, 2020.
Dabbeek, J., Silva, V., Galasso, C., and Smith, A.: Probabilistic earthquake and flood loss assessment in the Middle East, Int. J. Disast. Risk Re., 49, 101662, https://doi.org/10.1016/j.ijdrr.2020.101662, 2020.
Daniell, J. E., Schaefer, A. M., and Wenzel, F.: Losses Associated with Secondary Effects in Earthquakes, Frontiers in Built Environment, 3, 30, https://doi.org/10.3389/fbuil.2017.00030, 2017.
De Angeli, S., Malamud, B. D., Rossi, L., Taylor, F. E., Trasforini, E., and Rudari, R.: A multi-hazard framework for spatial-temporal impact analysis, Int. J. Disast. Risk Re., 102829, https://doi.org/10.1016/j.ijdrr.2022.102829, 2022.
Del Zoppo, M., Wijesundara, K., Rossetto, T., Dias, P., Baiguera, M., Ludovico, M. D., Thamboo, J., and Prota, A.: Influence of exterior infill walls on the performance of RC frames under tsunami loads: Case study of school buildings in Sri Lanka, Eng. Struct., 234, 111920, https://doi.org/10.1016/j.engstruct.2021.111920, 2021.
de Ruiter, M. C., Couasnon, A., van den Homberg, M. J. C., Daniell, J. E., Gill, J. C., and Ward, P. J.: Why We Can No Longer Ignore Consecutive Disasters, Earth's Future, 8, e2019EF001425, https://doi.org/10.1029/2019EF001425, 2020.
Dorbath, L., Cisternas, A., and Dorbath, C.: Assessment of the size of large and great historical earthquakes in Peru, B. Seismol. Soc. Am., 80, 551–576, 1990.
FEMA: Multi-hazard loss estimation methodology, Federal Emergency Management Agency, Washington, https://www.fema.gov/sites/default/files/2020-09/fema_hazus_flood-model_user-manual_2.1.pdf (last access: 2 June 2023), 2003.
FEMA: HAZUS Tsunami Model Technical Guidance, Federal Emergency Management Agency, Washington, D.C., https://www.fema.gov/sites/default/files/2020-09/fema_hazus_tsunami_technical-manual_4.0.pdf (last access: 2 June 2023), 2017.
Figueiredo, R., Romão, X., and Paupério, E.: Component-based flood vulnerability modelling for cultural heritage buildings, Int. J. Disast. Risk Re., 61, 102323, https://doi.org/10.1016/j.ijdrr.2021.102323, 2021.
Frucht, E., Salamon, A., Rozelle, J., Levi, T., Calvo, R., Avirav, V., Burns, J. N., Zuzak, C., Gal, E., Trapper, P., Galanti, B., and Bausch, D.: Tsunami loss assessment based on Hazus approach – The Bat Galim, Israel, case study, Eng. Geol., 289, 106175, https://doi.org/10.1016/j.enggeo.2021.106175, 2021.
Gallina, V., Torresan, S., Critto, A., Sperotto, A., Glade, T., and Marcomini, A.: A review of multi-risk methodologies for natural hazards: Consequences and challenges for a climate change impact assessment, J. Environ. Manage., 168, 123–132, https://doi.org/10.1016/j.jenvman.2015.11.011, 2016.
Gehl, P. and D'Ayala, D.: System loss assessment of bridge networks accounting for multi-hazard interactions, Struct. Infrastruct. E., 14, 1355–1371, https://doi.org/10.1080/15732479.2018.1434671, 2018.
Gehl, P., Quinet, C., Le Cozannet, G., Kouokam, E., and Thierry, P.: Potential and limitations of risk scenario tools in volcanic areas through an example at Mount Cameroon, Nat. Hazards Earth Syst. Sci., 13, 2409–2424, https://doi.org/10.5194/nhess-13-2409-2013, 2013.
GEM: Report on the SARA Exposure and Vulnerability Workshop in Medellin, Colombia, Version 1.0, 47 pp., https://sara.openquake.org/_media/risk:03_2014_-_workshop_medellin_-_exposure.pdf (last access: 2 June 2023), 2014.
Gill, J. C. and Malamud, B. D.: Hazard interactions and interaction networks (cascades) within multi-hazard methodologies, Earth Syst. Dynam., 7, 659–679, https://doi.org/10.5194/esd-7-659-2016, 2016.
Goda, K. and De Risi, R.: Multi-hazard loss estimation for shaking and tsunami using stochastic rupture sources, Int. J. Disast. Risk Re., 28, 539–554, https://doi.org/10.1016/j.ijdrr.2018.01.002, 2018.
Goda, K., Mori, N., Yasuda, T., Prasetyo, A., Muhammad, A., and Tsujio, D.: Cascading Geological Hazards and Risks of the 2018 Sulawesi Indonesia Earthquake and Sensitivity Analysis of Tsunami Inundation Simulations, Frontiers in Earth Science, 7, 261, https://doi.org/10.3389/feart.2019.00261, 2019.
Gómez Zapata, J. C., Pittore, M., Brinckmann, N., and Shinde, S.: Dynamic physical vulnerability: a Multi-risk Scenario approach from building- single- hazard fragility- models, EGU General Assembly 2020, Online, 4–8 May 2020, EGU2020-18379, https://doi.org/10.5194/egusphere-egu2020-18379, 2020.
Gomez-Zapata, J. C., Zafrir, R., Harig, S., and Pittore, M.: Customised focus maps and resultant CVT-based aggregation entities for Lima and Callao (Peru), Version 1.0, GFZ Data Services [data set], https://doi.org/10.5880/riesgos.2021.006, 2021a.
Gomez-Zapata, J. C., Zafrir, R., Brinckmann, N., and Pittore, M.: Residential building exposure and physical vulnerability models for ground-shaking and tsunami risk in Lima and Callao (Peru), Version 1.0., GFZ Data Services [data set], https://doi.org/10.5880/riesgos.2021.007, 2021b.
Gomez-Zapata, J. C., Brinckmann, N., Pittore, M., and Cotton, F.: Seismic ground motion fields for six deterministic earthquake scenarios (Mw 8.5-9.0) for Lima (Peru), GFZ Data Services [data set], https://doi.org/10.5880/riesgos.2021.008, 2021c.
Gomez-Zapata, J. C., Brinckmann, N., Pittore, M., and Cotton, F.: Spatial representation of direct loss estimates on the residential building stock of Lima (Peru) from decoupled earthquake and tsunami scenarios on variable resolutions exposure models, GFZ Data Services [data set], https://doi.org/10.5880/riesgos.2021.009, 2021d.
Gomez-Zapata, J. C., Brinckmann, N., Harig, S., Zafrir, R., Pittore, M., Cotton, F., and Babeyko, A.: Variable-resolution building exposure modelling for earthquake and tsunami scenario-based risk assessment: an application case in Lima, Peru, Nat. Hazards Earth Syst. Sci., 21, 3599–3628, https://doi.org/10.5194/nhess-21-3599-2021, 2021e.
Gómez Zapata, J. C., Medina, S., and Lizarazo-Marriaga, J.: Creation of simplified state-dependent fragility functions through ad-hoc scaling factors to account for previous damage in a multi-hazard risk context. An application to flow-depth-based analytical tsunami fragility functions for the Pacific coast of South America, GFZ Data Services [data set], https://doi.org/10.5880/riesgos.2022.002, 2022a.
Gómez Zapata, J. C., Pittore, M., Cotton, F., Lilienkamp, H., Simantini, S., Aguirre, P., and Hernan, S. M.: Epistemic uncertainty of probabilistic building exposure compositions in scenario-based earthquake loss models, B. Earthq. Eng., 20, pages 2401–2438, https://doi.org/10.1007/s10518-021-01312-9, 2022b.
Gómez Zapata, J. C., Pittore, M., and Lizarazo, J. M.: Probabilistic inter-scheme compatibility matrices for multi-hazard exposure modeling. An application using existing vulnerability models for earthquakes and tsunami from synthetic datasets constructed using the AeDEs form through expert-based heuristics, GFZ Data Services [data set], https://doi.org/10.5880/riesgos.2022.003, 2022c.
Grünthal, G.: European Macroseismic Scale 1998, Centre Européen de Géodynamique et de Séismologie, Luxembourg, 99 pp., https://doi.org/10.2312/EMS-98.full.en, 1998.
Harig, S. and Rakowsky, N.: Tsunami flow depth in Lima/Callao (Peru) caused by six hypothetical simplified tsunami scenarios offshore Lima, GFZ Data Services [data set], https://doi.org/10.5880/riesgos.2021.010, 2021.
Harig, S., Immerz, A., Weniza, Griffin, J., Weber, B., Babeyko, A., Rakowsky, N., Hartanto, D., Nurokhim, A., Handayani, T., and Weber, R.: The Tsunami Scenario Database of the Indonesia Tsunami Early Warning System (InaTEWS): Evolution of the Coverage and the Involved Modeling Approaches, Pure Appl. Geophys., 177, 1379–1401, https://doi.org/10.1007/s00024-019-02305-1, 2020.
Hill, M. and Rossetto, T.: Comparison of building damage scales and damage descriptions for use in earthquake loss modelling in Europe, B. Earthq. Eng., 6, 335–365, https://doi.org/10.1007/s10518-007-9057-y, 2008.
Imamura, F., Boret, S. P., Suppasri, A., and Muhari, A.: Recent occurrences of serious tsunami damage and the future challenges of tsunami disaster risk reduction, Progress in Disaster Science, 1, 100009, https://doi.org/10.1016/j.pdisas.2019.100009, 2019.
INEI: Censos Nacionales 2007, Instituto Nacional de Estadistica e Informatica (INEI; Institute of Statistic and Informatics), Lima, Peru, https://www.inei.gob.pe/media/MenuRecursivo/publicaciones_digitales/Est/Lib1136/libro.pdf (last access: 2 June 2023), 2007.
INEI: Censos Nacionales 2017, Instituto Nacional de Estadistica e Informatica (INEI; Institute of Statistic and Informatics), Lima, Peru, https://www.inei.gob.pe/media/MenuRecursivo/publicaciones_digitales/Est/Lib1544/ (last access: 2 June 2023), 2017.
INEI: Perú: 50 años de cambios, desafíos y oportunidades poblacionales, Instituto Nacional de Estadistica e Informatica (INEI; Institute of Statistic and Informatics), https://www.gob.pe/institucion/inei/informes-publicaciones/ 3254297-peru-50-anos-de-cambios-desafios-y-oportunidades-poblacionales (last access: 2 June 2023), 2022.
Jimenez, C., Moggiano, N., Mas, E., Adriano, B., Koshimura, S., Fujii, Y., and Yanagisawa, H.: Seismic Source of 1746 Callao Earthquake from Tsunami Numerical Modeling, Journal of Disaster Research, 8, 266–273, https://doi.org/10.20965/jdr.2013.p0266, 2013.
Julià, P. B. and Ferreira, T. M.: From single- to multi-hazard vulnerability and risk in Historic Urban Areas: a literature review, Nat. Hazards, 108, 93–128, https://doi.org/10.1007/s11069-021-04734-5, 2021.
Kappes, M. S., Keiler, M., von Elverfeldt, K., and Glade, T.: Challenges of analyzing multi-hazard risk: a review, Nat., Hazards, 64, 1925–1958, https://doi.org/10.1007/s11069-012-0294-2, 2012.
Karapetrou, S., Manakou, M., Bindi, D., Petrovic, B., and Pitilakis, K.: “Time-building specific” seismic vulnerability assessment of a hospital RC building using field monitoring data, Eng. Struct., 112, 114–132, https://doi.org/10.1016/j.engstruct.2016.01.009, 2016.
Komendantova, N., Mrzyglocki, R., Mignan, A., Khazai, B., Wenzel, F., Patt, A., and Fleming, K.: Multi-hazard and multi-risk decision-support tools as a part of participatory risk governance: Feedback from civil protection stakeholders, Int. J. Disast. Risk Re., 8, 50–67, https://doi.org/10.1016/j.ijdrr.2013.12.006, 2014.
Kulikov, E. A., Rabinovich, A. B., and Thomson, R. E.: Estimation of Tsunami Risk for the Coasts of Peru and Northern Chile, Nat. Hazards, 35, 185–209, https://doi.org/10.1007/s11069-004-4809-3, 2005.
Lagomarsino, S. and Giovinazzi, S.: Macroseismic and mechanical models for the vulnerability and damage assessment of current buildings, B. Earthq. Eng., 4, 415–443, https://doi.org/10.1007/s10518-006-9024-z, 2006.
Lagomarsino, S., Cattari, S., and Ottonelli, D.: The heuristic vulnerability model: fragility curves for masonry buildings, B. Earthq. Eng., 19, 3129–3163, https://doi.org/10.1007/s10518-021-01063-7, 2021.
Lahcene, E., Ioannou, I., Suppasri, A., Pakoksung, K., Paulik, R., Syamsidik, S., Bouchette, F., and Imamura, F.: Characteristics of building fragility curves for seismic and non-seismic tsunamis: case studies of the 2018 Sunda Strait, 2018 Sulawesi–Palu, and 2004 Indian Ocean tsunamis, Nat. Hazards Earth Syst. Sci., 21, 2313–2344, https://doi.org/10.5194/nhess-21-2313-2021, 2021.
Liu, B., Siu, Y. L., and Mitchell, G.: Hazard interaction analysis for multi-hazard risk assessment: a systematic classification based on hazard-forming environment, Nat. Hazards Earth Syst. Sci., 16, 629–642, https://doi.org/10.5194/nhess-16-629-2016, 2016.
Løvholt, F., Glimsdal, S., Harbitz, C. B., Horspool, N., Smebye, H., de Bono, A., and Nadim, F.: Global tsunami hazard and exposure due to large co-seismic slip, Int. J. Disast. Risk Re., 10, 406–418, https://doi.org/10.1016/j.ijdrr.2014.04.003, 2014.
Maiwald, H. and Schwarz, J.: Unified damage description and risk assessment of buildings under extreme natural hazards, Mauerwerk, 23, 95–111, https://doi.org/10.1002/dama.201910014, 2019.
Mangalathu, S., Sun, H., Nweke, C. C., Yi, Z., and Burton, H. V.: Classifying earthquake damage to buildings using machine learning, Earthq. Spectra, 36, 183–208, https://doi.org/10.1177/8755293019878137, 2020.
Markhvida, M., Ceferino, L., and Baker, J. W.: Effect of ground motion correlation on regional seismic lossestimation: application to Lima, Peru using across-correlated principal component analysis model, Safety, Reliability, Risk, Resilience and Sustainability of Structures and Infrastructure. 12th Int. Conf. on Structural Safety and Reliability, Vienna, Austria, 2017.
Markhvida, M., Ceferino, L., and Baker, J. W.: Modeling spatially correlated spectral accelerations at multiple periods using principal component analysis and geostatistics, Earthq. Eng. Struct. D., 47, 1107–1123, https://doi.org/10.1002/eqe.3007, 2018.
Marzocchi, W., Garcia-Aristizabal, A., Gasparini, P., Mastellone, M. L., and Di Ruocco, A.: Basic principles of multi-risk assessment: a case study in Italy, Nat. Hazards, 62, 551–573, https://doi.org/10.1007/s11069-012-0092-x, 2012.
Mas, E., Paulik, R., Pakoksung, K., Adriano, B., Moya, L., Suppasri, A., Muhari, A., Khomarudin, R., Yokoya, N., Matsuoka, M., and Koshimura, S.: Characteristics of Tsunami Fragility Functions Developed Using Different Sources of Damage Data from the 2018 Sulawesi Earthquake and Tsunami, Pure Appl. Geophys., 177, 2437–2455, https://doi.org/10.1007/s00024-020-02501-4, 2020.
Medina, S.: Zonificación de la vulnerabilidad física para edificaciones típicas en San Andrés de Tumaco, Costa Pacífica Colombiana, Master thesis in Civil Engineering, Master thesis, Universidad Nacional de Colombia Facultad de Ingeniería, Departamento Ingeniería Civil y Ambiental, Bogotá, Colombia, 245 pp., 2019.
Medina, S., Lizarazo-Marriaga, J., Estrada, M., Koshimura, S., Mas, E., and Adriano, B.: Tsunami analytical fragility curves for the Colombian Pacific coast: A reinforced concrete building example, Eng. Struct., 196, 109309, https://doi.org/10.1016/j.engstruct.2019.109309, 2019.
Merz, B., Kuhlicke, C., Kunz, M., Pittore, M., Babeyko, A., Bresch, D. N., Domeisen, D. I. V., Feser, F., Koszalka, I., Kreibich, H., Pantillon, F., Parolai, S., Pinto, J. G., Punge, H. J., Rivalta, E., Schröter, K., Strehlow, K., Weisse, R., and Wurpts, A.: Impact Forecasting to Support Emergency Management of Natural Hazards, Rev. Geophys., 58, e2020RG000704, https://doi.org/10.1029/2020RG000704, 2020.
Montalva, G. A., Bastías, N., and Rodriguez-Marek, A.: Ground-Motion Prediction Equation for the Chilean Subduction Zone, B. Seismol. Soc. Am., 107, 901–911, https://doi.org/10.1785/0120160221, 2017.
Negulescu, C., Benaïchouche, A., Lemoine, A., Le Roy, S., and Pedreros, R.: Adjustability of exposed elements by updating their capacity for resistance after a damaging event: application to an earthquake–tsunami cascade scenario, Nat. Hazards, 104, 753–793, https://doi.org/10.1007/s11069-020-04189-0, 2020.
Ordaz, M., Salgado-Gálvez, M. A., Huerta, B., Rodríguez, J. C., and Avelar, C.: Considering the impacts of simultaneous perils: The challenges of integrating earthquake and tsunamigenic risk, Disaster Prev. Manag., 28, 823–837, https://doi.org/10.1108/DPM-09-2019-0295, 2019.
Pagani, M., Monelli, D., Weatherill, G., Danciu, L., Crowley, H., Silva, V., Henshaw, P., Butler, L., Nastasi, M., Panzeri, L., Simionato, M., and Vigano, D.: OpenQuake Engine: An Open Hazard (and Risk) Software for the Global Earthquake Model, Seismol. Res. Lett., 85, 692–702, https://doi.org/10.1785/0220130087, 2014.
Papadopoulos, A. N. and Bazzurro, P.: Exploring probabilistic seismic risk assessment accounting for seismicity clustering and damage accumulation: Part II. Risk analysis, Earthq. Spectra, 37, 386–408, https://doi.org/10.1177/8755293020938816, 2021.
Park, H., Cox, D. T., and Barbosa, A. R.: Comparison of inundation depth and momentum flux based fragilities for probabilistic tsunami damage assessment and uncertainty analysis, Coast. Eng., 122, 10–26, https://doi.org/10.1016/j.coastaleng.2017.01.008, 2017.
Park, H., Alam, M. S., Cox, D. T., Barbosa, A. R., and van de Lindt, J. W.: Probabilistic seismic and tsunami damage analysis (PSTDA) of the Cascadia Subduction Zone applied to Seaside, Oregon, Int. J. Disast. Risk Re., 35, 101076, https://doi.org/10.1016/j.ijdrr.2019.101076, 2019.
Pescaroli, G. and Alexander, D.: Understanding Compound, Interconnected, Interacting, and Cascading Risks: A Holistic Framework, Risk Anal., 38, 2245–2257, https://doi.org/10.1111/risa.13128, 2018.
Petersen, M. D., Harmsen, S. C., Jaiswal, K. S., Rukstales, K. S., Luco, N., Haller, K. M., Mueller, C. S., and Shumway, A. M.: Seismic Hazard, Risk, and Design for South America, B. Seismol. Soc. Am., 108, 781–800, https://doi.org/10.1785/0120170002, 2018.
Petrone, C., Rossetto, T., and Goda, K.: Fragility assessment of a RC structure under tsunami actions via nonlinear static and dynamic analyses, Eng. Struct., 136, 36–53, https://doi.org/10.1016/j.engstruct.2017.01.013, 2017.
Petrone, C., Rossetto, T., Baiguera, M., la Barra Bustamante, C. D., and Ioannou, I.: Fragility functions for a reinforced concrete structure subjected to earthquake and tsunami in sequence, Eng. Struct., 205, 110120, https://doi.org/10.1016/j.engstruct.2019.110120, 2020.
Pittore, M., Haas, M., and Megalooikonomou, K. G.: Risk-Oriented, Bottom-Up Modeling of Building Portfolios With Faceted Taxonomies, Frontiers in Built Environment, 4, 41, https://doi.org/10.3389/fbuil.2018.00041, 2018.
Pittore, M., Haas, M., and Silva, V.: Variable resolution probabilistic modeling of residential exposure and vulnerability for risk applications, Earthq. Spectra, 36, 321–344, https://doi.org/10.1177/8755293020951582, 2020.
Pittore, M., Gomez-Zapata, J. C., Brinckmann, N., and Rüster, M.: Assetmaster and Modelprop: web services to serve building exposure models and fragility functions for physical vulnerability to natural-hazards, Version 1.0, GFZ Data Services [data set], https://doi.org/10.5880/riesgos.2021.005, 2021.
Rao, A. S., Lepech, M. D., and Kiremidjian, A.: Development of time-dependent fragility functions for deteriorating reinforced concrete bridge piers, Struct. Infrastruct. E., 13, 67–83, https://doi.org/10.1080/15732479.2016.1198401, 2017.
Rossetto, T., Petrone, C., Eames, I., De La Barra, C., Foster, A., and Macabuag, J.: Advances in the Assessment of Buildings Subjected to Earthquakes and Tsunami, in: Recent Advances in Earthquake Engineering in Europe: 16th European Conference on Earthquake Engineering-Thessaloniki 2018, edited by: Pitilakis, K., Springer International Publishing, Cham, 545–562, https://doi.org/10.1007/978-3-319-75741-4_23, 2018.
Rossetto, T., De la Barra, C., Petrone, C., De la Llera, J. C., Vásquez, J., and Baiguera, M.: Comparative assessment of nonlinear static and dynamic methods for analysing building response under sequential earthquake and tsunami, Earthq. Eng. Struct. D., 48, 867–887, https://doi.org/10.1002/eqe.3167, 2019.
Schelske, O., Sundermann, L., and Hausmann, P.: Mind the risk - A global ranking of cities under threat from natural disasters, Swiss Re, 2013.
Schwarz, J., Maiwald, H., Kaufmann, C., Langhammer, T., and Beinersdorf, S.: Conceptual basics and tools to assess the multi hazard vulnerability of existing buildings, Mauerwerk, 23, 246–264, https://doi.org/10.1002/dama.201910025, 2019.
Selva, J.: Long-term multi-risk assessment: statistical treatment of interaction among risks, Nat. Hazards, 67, 701–722, https://doi.org/10.1007/s11069-013-0599-9, 2013.
Silva, V., Yepes-Estrada, C., Dabbeek, J., Martins, L., and Brzev, S.: GED4ALL: Global exposure database for multi-hazard risk analysis. Multi-hazard exposure taxonomy, D5 - Final Report, GEM Technical Report 2018-05, GGEM Foundation, Pavia, https://riskdatalibrary.org/assets/docs/technicalReports/challengefund_phase1_exposureSchemaDevelopment_D5%20-%20Final%20report.pdf (last access: 2 June 2023), 2018.
Silva, V., Brzev, S., Scawthorn, C., Yepes, C., Dabbeek, J., and Crowley, H.: A Building Classification System for Multi-hazard Risk Assessment, Int. J. Disast. Risk Sc., 161–177, https://doi.org/10.1007/s13753-022-00400-x, 2022.
Suppasri, A., Mas, E., Charvet, I., Gunasekera, R., Imai, K., Fukutani, Y., Abe, Y., and Imamura, F.: Building damage characteristics based on surveyed data and fragility curves of the 2011 Great East Japan tsunami, Nat. Hazards, 66, 319–341, https://doi.org/10.1007/s11069-012-0487-8, 2013.
Suppasri, A., Charvet, I., Imai, K., and Imamura, F.: Fragility Curves Based on Data from the 2011 Tohoku-Oki Tsunami in Ishinomaki City, with Discussion of Parameters Influencing Building Damage, Earthq. Spectra, 31, 841–868, https://doi.org/10.1193/053013EQS138M, 2015.
Suppasri, A., Maly, E., Kitamura, M., Syamsidik, Pescaroli, G., Alexander, D., and Imamura, F.: Cascading disasters triggered by tsunami hazards: A perspective for critical infrastructure resilience and disaster risk reduction, Int. J. Disast. Risk Re., 66, 102597, https://doi.org/10.1016/j.ijdrr.2021.102597, 2021.
Tarque, N., Salsavilca, J., Yacila, J., and Camata, G.: Multi-criteria analysis of five reinforcement options for Peruvian confined masonry walls, Earthq. Struct., 17, 205–219, 2019.
Terzi, S., Torresan, S., Schneiderbauer, S., Critto, A., Zebisch, M., and Marcomini, A.: Multi-risk assessment in mountain regions: A review of modelling approaches for climate change adaptation, J. Environ. Manage., 232, 759–771, https://doi.org/10.1016/j.jenvman.2018.11.100, 2019.
Tilloy, A., Malamud, B. D., Winter, H., and Joly-Laugel, A.: A review of quantification methodologies for multi-hazard interrelationships, Earth-Sci. Rev., 196, 102881, https://doi.org/10.1016/j.earscirev.2019.102881, 2019.
Trevlopoulos, K., Guéguen, P., Helmstetter, A., and Cotton, F.: Earthquake risk in reinforced concrete buildings during aftershock sequences based on period elongation and operational earthquake forecasting, Struct. Saf., 84, 101922, https://doi.org/10.1016/j.strusafe.2020.101922, 2020.
Triantafyllou, I., Novikova, T., Charalampakis, M., Fokaefs, A., and Papadopoulos, G. A.: Quantitative Tsunami Risk Assessment in Terms of Building Replacement Cost Based on Tsunami Modelling and GIS Methods: The Case of Crete Isl., Hellenic Arc, Pure Appl. Geophys., 176, 3207–3225, https://doi.org/10.1007/s00024-018-1984-9, 2019.
Turchi, A., Traglia, F. D., Gentile, R., Fornaciai, A., Zetti, I., and Fanti, R.: Relative seismic and tsunami risk assessment for Stromboli Island (Italy), Int. J. Disast. Risk Re., 76, 103002, https://doi.org/10.1016/j.ijdrr.2022.103002, 2022.
Vamvatsikos, D., Panagopoulos, G., Kappos, A. J., Nigro, E., Rossetto, T., Lloyd, T. O., and Stathopoulos, T.: Structural Vulnerability Assessment under Natural Hazards: A review, in: COST ACTION C26: Urban Habitat Constructions under Catastrophic Events, Naples, Italy, 16–18 September 2010, edited by: Mazzolani, F. M., CRC Press, http://ikee.lib.auth.gr/record/228630/?ln=en (last access: 2 June 2023), 2010.
Villar-Vega, M., Silva, V., Crowley, H., Yepes, C., Tarque, N., Acevedo, A. B., Hube, M. A., Gustavo, C. D., and María, H. S.: Development of a Fragility Model for the Residential Building Stock in South America, Earthq. Spectra, 33, 581–604, https://doi.org/10.1193/010716EQS005M, 2017.
Ward, P. J., Blauhut, V., Bloemendaal, N., Daniell, J. E., de Ruiter, M. C., Duncan, M. J., Emberson, R., Jenkins, S. F., Kirschbaum, D., Kunz, M., Mohr, S., Muis, S., Riddell, G. A., Schäfer, A., Stanley, T., Veldkamp, T. I. E., and Winsemius, H. C.: Review article: Natural hazard risk assessments at the global scale, Nat. Hazards Earth Syst. Sci., 20, 1069–1096, https://doi.org/10.5194/nhess-20-1069-2020, 2020.
Ward, P. J., Daniell, J., Duncan, M., Dunne, A., Hananel, C., Hochrainer-Stigler, S., Tijssen, A., Torresan, S., Ciurean, R., Gill, J. C., Sillmann, J., Couasnon, A., Koks, E., Padrón-Fumero, N., Tatman, S., Tronstad Lund, M., Adesiyun, A., Aerts, J. C. J. H., Alabaster, A., Bulder, B., Campillo Torres, C., Critto, A., Hernández-Martín, R., Machado, M., Mysiak, J., Orth, R., Palomino Antolín, I., Petrescu, E.-C., Reichstein, M., Tiggeloven, T., Van Loon, A. F., Vuong Pham, H., and de Ruiter, M. C.: Invited perspectives: A research agenda towards disaster risk management pathways in multi-(hazard-)risk assessment, Nat. Hazards Earth Syst. Sci., 22, 1487–1497, https://doi.org/10.5194/nhess-22-1487-2022, 2022.
Weatherill, G., Pittore, M., Haas, M., Brinckmann, N., Rüster, M., and Gomez-Zapata, J. C.: Shakyground: a web service to serve GMPE-based ground motion fields, Version 1.0, GFZ Data Services [data set], https://doi.org/10.5880/riesgos.2021.004, 2021.
Yepes-Estrada, C., Silva, V., Valcárcel, J., Acevedo, A. B., Tarque, N., Hube, M. A., Coronel, G., and María, H. S.: Modeling the Residential Building Inventory in South America for Seismic Risk Assessment, Earthq. Spectra, 33, 299–322, https://doi.org/10.1193/101915EQS155DP, 2017.
Zuccaro, G., Cacace, F., Spence, R. J. S., and Baxter, P. J.: Impact of explosive eruption scenarios at Vesuvius, J. Volcanol. Geoth. Res., 178, 416–453, https://doi.org/10.1016/j.jvolgeores.2008.01.005, 2008.
Zuccaro, G., De Gregorio, D., and Leone, M. F.: Theoretical model for cascading effects analyses, Int. J. Disast. Risk Re., 30, 199–215, https://doi.org/10.1016/j.ijdrr.2018.04.019, 2018.