the Creative Commons Attribution 4.0 License.
the Creative Commons Attribution 4.0 License.
 | 18 Jan 2023
Assessing uncertainties in landslide susceptibility predictions in a changing environment (Styrian Basin, Austria)
Raphael Knevels
Helene Petschko
Herwig Proske
Philip Leopold
Aditya N. Mishra
Douglas Maraun
Alexander Brenning
The assessment of uncertainties in landslide susceptibility modelling in a changing environment is an important, yet often neglected, task. In an Austrian case study, we investigated the uncertainty cascade in storylines of landslide susceptibility emerging from climate change and parametric landslide model uncertainty. In June 2009, extreme events of heavy thunderstorms occurred in the Styrian Basin, triggering thousands of landslides. Using a storyline approach, we discovered a generally lower landslide susceptibility for the pre-industrial climate, while for the future climate (2071–2100) a potential increase of 35 % in highly susceptible areas (storyline of much heavier rain) may be compensated for by much drier soils (−45 % areas highly susceptible to landsliding). However, the estimated uncertainties in predictions were generally high. While uncertainties related to within-event internal climate model variability were substantially lower than parametric uncertainties in the landslide susceptibility model (ratio of around 0.25), parametric uncertainties were of the same order as the climate scenario uncertainty for the higher warming levels (+3 and +4 K). We suggest that in future uncertainty assessments, an improved availability of event-based landslide inventories and high-resolution soil and precipitation data will help to reduce parametric uncertainties in landslide susceptibility models used to assess the impacts of climate change on landslide hazard and risk.
- Article
(5881 KB) - Full-text XML
-
Supplement
(19525 KB) - BibTeX
- EndNote


Climate and land use/land cover (LULC) are changing worldwide, altering the risk of landslide occurrences. During the period from 1998 to 2017, landslides affected 4.8 million people, causing more than 55 997 deaths and over USD 5.28 billion total damage (Froude and Petley, 2018; Wallemacq et al., 2018). In the future, these landslide-associated casualties are likely to increase globally (Haque et al., 2019; Gariano and Guzzetti, 2022), and such an increase can already be observed in some regions (Schlögel et al., 2020). Across the Austrian Alps and their forelands, a generally high proneness to landslides is observed, which are among the main natural hazards frequently causing damage to houses and infrastructure as well as casualties (Jaedicke et al., 2014; Lima et al., 2021). Here they are conditioned by local geomorphology, geology, and LULC, with long-lasting heavy rainfall and rapid snowmelt as the main natural triggers (Schweigl and Hervás, 2009). In southeastern Austria extreme precipitation is projected to increase by up to 14 % for each kelvin of warming (% K−1) as a consequence of climate change, which was found to affect the risk of landslide occurrences (Olefs et al., 2021; Maraun et al., 2022).
In June 2009 and September 2014, weather conditions developed through a cut-off low bringing heavy rainfall into the Styrian Basin, Austria's southeastern Alpine forelands (e.g. over 100 mm in 24 h in 2009). In both events in total more than 3000 landslides were triggered, causing significant damage to human infrastructure (e.g. about EUR 13.4 million in 2009; Hornich and Adelwöhrer, 2010; ZAMG, 2014). The combined effect of premoisturing over the preceding winter and spring and the occurrence of the actual triggering rainfall made this landslide event a compound event (Zscheischler et al., 2020; Maraun et al., 2022). In addition to the high amount of rain, local experts identified human activities as a conditioning factor (steep or unsecured embankments, artificial slope surcharge, impervious paved surfaces; Hornich and Adelwöhrer, 2010). Statistical investigations of these landslide events confirmed the important role of meteorological (rainfall intensity and 5 d rainfall) and LULC (forest types) predictors (Knevels et al., 2020). Focusing on the rainfall event in 2009, Maraun et al. (2022) analysed the effect of the projected future climate (2070–2100) and LULC change (LULCC) on landslide occurrences for the most affected Feldbach region. In Maraun et al. (2022) the concept of storylines – simulations of physically self-consistent, plausible pathways of a specific event (Shepherd et al., 2018) – was first applied in a landslide context, thus asking “how would this event occur in a warmer/colder climate, and what would be the associated landslide susceptibility?” While cut-off lows are expected to become slightly less frequent, the area threatened by landslides, given such an event, would increase by 45 % in a 4 K global warming scenario (Maraun et al., 2022). However, a comprehensive assessment of uncertainties inherent in the projected landslide susceptibility has yet to be conducted, which is the objective of our study.
Uncertainty assessments are essential for the development of business strategies and policy interventions; they increase transparency of and confidence in scientific analyses, and they are considered a “good modelling practice” (Kirchner et al., 2021, and references therein). Generally, depending on the scientific community, different definitions of uncertainties exist (Walker et al., 2003; Kirchner et al., 2021). In risk assessment, uncertainty is commonly categorised into aleatory and epistemic uncertainty (Roy and Oberkampf, 2011; Rougier et al., 2013). Aleatory uncertainty refers to the natural variation or randomness inherent in the natural hazard process and is thus irreducible and unavoidable (Roy and Oberkampf, 2011; Rougier, 2013). Epistemic uncertainty arises from missing knowledge and is reducible by enhancing knowledge on the subject (Roy and Oberkampf, 2011; Rougier and Beven, 2013). Additionally, three sources of epistemic uncertainty can be distinguished (Rougier and Beven, 2013): input uncertainty (e.g. initial or boundary condition uncertainty in climate modelling), parametric uncertainty (e.g. uncertainty in model parameter settings), and structural uncertainty (e.g. uncertainty in the model form to represent the system). However, according to Roy and Oberkampf (2011) the boundary between aleatory and epistemic uncertainty is fluid and depends on the question. Furthermore, when different sources of uncertainties propagate through a sequence of calculations, the full range of uncertainties is referred to as the uncertainty cascade (Refsgaard et al., 2016).
In landslide risk management, many authors have emphasised the importance of the quantification of uncertainties, especially considering environmental change (Reichenbach et al., 2018; Gariano and Guzzetti, 2022). However, only a tiny fraction of around 3 % of recent statistical landslide susceptibility analyses actually address this issue (Reichenbach et al., 2018, based on 565 articles published between 1983 and 2016). Focusing on statistical landslide susceptibility analysis, input and parameter uncertainties have previously been investigated with a focus on landslide inventory biases or incompleteness (e.g. Steger et al., 2016, 2017); the quality, resolution, and spatial scale of input data (e.g. Guzzetti et al., 2006; Brock et al., 2020; Torizin et al., 2021); and the size and strategy effects of landslide sampling (e.g. Petschko et al., 2014; Ozturk et al., 2021). For the assessment of structural uncertainty, model validation procedures such as (spatial) cross-validation are well-established assessment techniques (e.g. Petschko et al., 2014; Torizin et al., 2021). However, only a few studies account explicitly for often invisible effects of spatial (and temporal) autocorrelation in landslide model fitting and prediction (Reichenbach et al., 2018; Lombardo et al., 2020). Spatially varying uncertainties in landslide susceptibility predictions, emerging from parametric uncertainty (or sampling variability) and model error, have been assessed in terms of the standard error (or confidence interval) of the predicted probabilities (Guzzetti et al., 2006; Petschko et al., 2014) or by model ensembles (Kim et al., 2018; Felsberg et al., 2022). Regarding climate change, landslide studies often suffer from common modelling limitations: namely, the presence of large-scale circulation errors in global climate models (GCMs), using GCMs without downscaling and subsequent bias adjustment (Roberts et al., 2019), not resolving convection in standard regional climate models (RCMs), and ignoring factors that might be potentially relevant in a changing climate such as soil moisture (Maraun et al., 2017, 2022).
Our objective was the assessment of uncertainties in landslide susceptibility predictions considering both parametric landslide model uncertainty and climate change uncertainty (within-event internal model variability and scenario uncertainty) while accounting for different storylines of LULC and climate change in the Styrian Basin, Austria. The focus was not on creating landslide susceptibility maps but on the quantification of uncertainties. Such a joint consideration of uncertainties in integrated modelling (or interdisciplinary systems of linked models) is still an important research gap (Kirchner et al., 2021), and existing studies mostly come from a non-landslide context (e.g. hydrological or crop modelling; Bastola et al., 2011; Holzkämper et al., 2015; Refsgaard et al., 2016). In our analysis, we built upon an existing landslide susceptibility model (Maraun et al., 2022) that linked different predisposing and triggering factors to the 2009 and 2014 landslide occurrences. Our workflow combines within-event internal climate model variability with probabilistic simulations of parametric uncertainties in the landslide model into an uncertainty cascade in order to obtain a storyline uncertainty assessment. With this approach, we differentiate the uncertainty components in the analysed landslide susceptibility predictions.
2.1 Study area and rainfall events
Landslides in the Styrian Basin, Austria, have received much attention, especially recently after the 2009 and 2014 compound events (Hornich and Adelwöhrer, 2010; Knevels et al., 2020; Maraun et al., 2022). Our study area (3831 km2) is characterised by flat lowlands in the east and a hilly topography in the west, ranging from 196 to 1167 m above the Adriatic Sea (m AA) with a relative relief of 3–550 m km−2. The Styrian Prealps border the study area from the southwest (Possruck Mountains, Koralpe) to northwest (Stubalpe Mountains, Graz Mountains). According to Gasser et al. (2009) and Hornich and Adelwöhrer (2010), the Styrian Basin has a high predisposition to landslides due to the underlying geology of Neogene sediments (thick Miocene and minor Pliocene sediments) mainly consisting of a heterogeneous mixture and interbedded strata of sands, silts, clays, marl, and gravels (more geological details are given in Gasser et al., 2009).
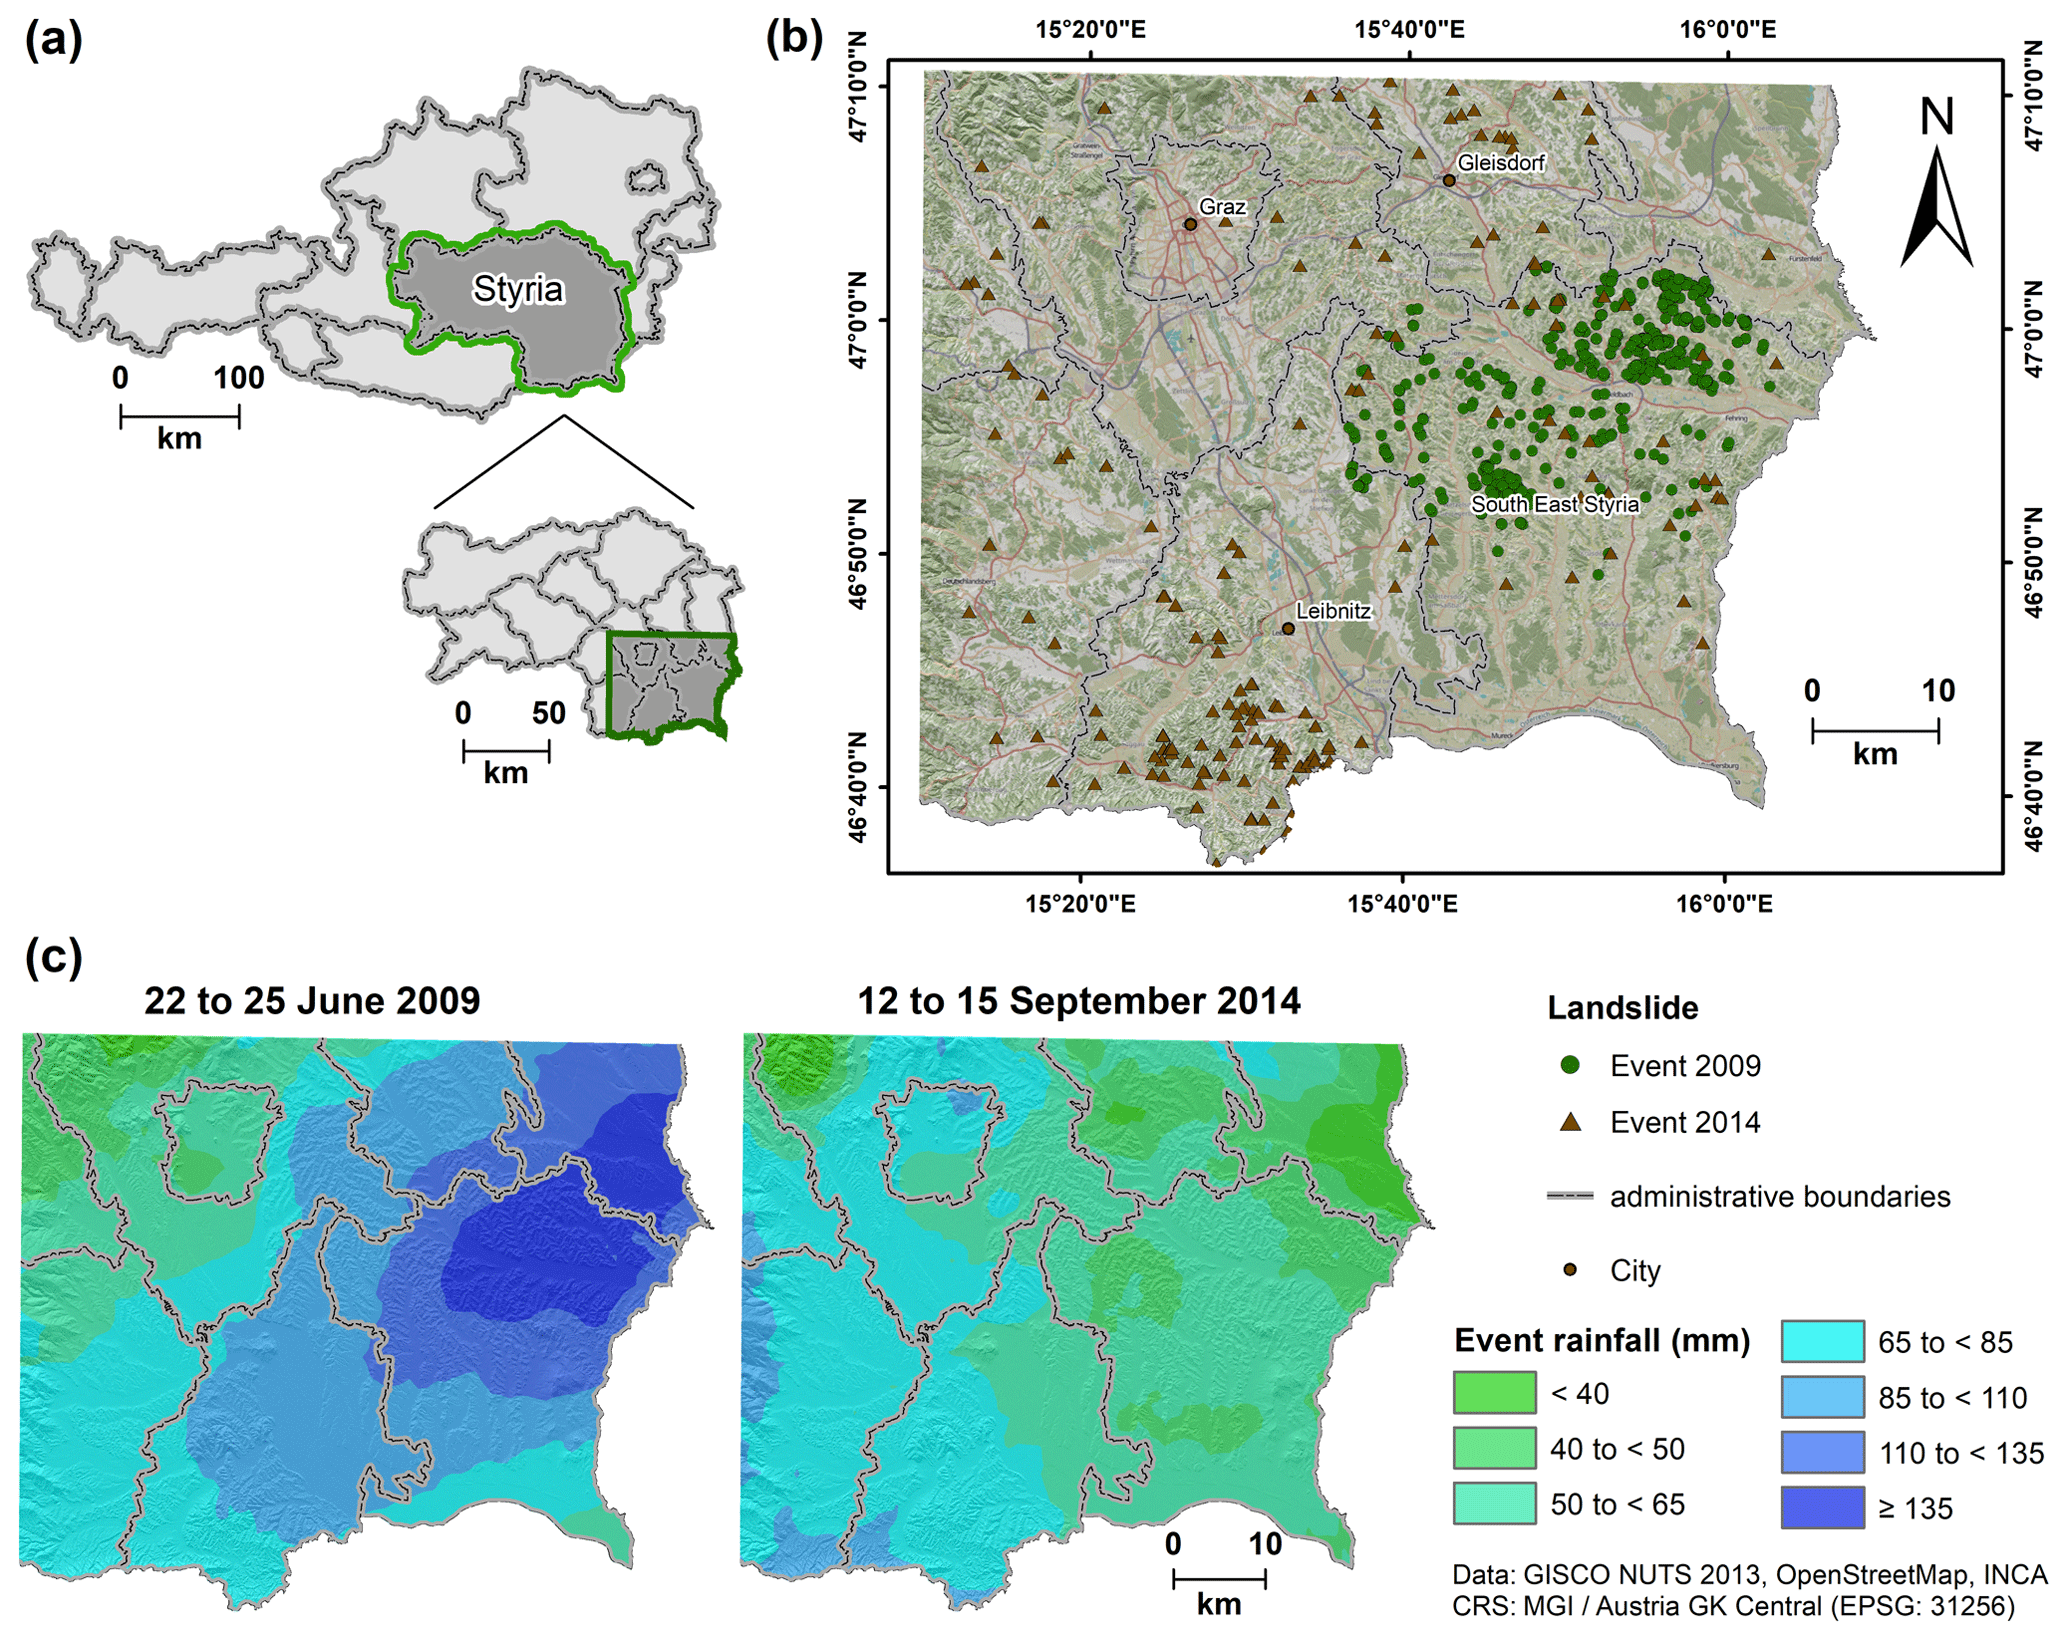
Figure 1Overview of the study area. (a) Location in Austria (upper part) and federal state of Syria (lower part). (b) Landslide distribution for both rainfall events. (c) Accumulated rainfall (mm) of the event in 2009 (left) and 2014 (right). Adopted from Knevels et al. (2020).
In June 2009 and September 2014, heavy-rainfall events occurred in southeastern Styria. From 22 to 25 June 2009, a series of heavy thunder- and rainstorms brought over 100 mm of precipitation within 24 h in some places, which corresponds to a 50-year return period (Fig. 1c left; meteorological details in Haiden, 2009; Hornich and Adelwöhrer, 2010). In the region, around 1700 landslide-related private damage claims were submitted to the state government, surpassing EUR 13.4 million in cost for reconstruction and emergency response (Hornich and Adelwöhrer, 2010). The northern part of the district of South East Styria was particularly severely affected (Fig. 1b), so for several municipalities a state of emergency had to be declared (Hornich and Adelwöhrer, 2010). The rainfall event in 2014 was similar, although less severe. In September 2014, several heavy thunderstorms occurred within a 3-week period (ZAMG, 2014). From 12 to 15 September, between 30 and 100 mm of rain (Fig. 1c right) was brought to the region by an upper-level low (Landeswarnzentrale Steiermark, 2014). Again, landslides occurred across the entire Styrian Basin but were clustered with more than 500 landslides south of Leibnitz and north of Gleisdorf (Fig. 1b).
2.2 Data
The database of the analysis is consistent with the data described in Knevels et al. (2020) and Maraun et al. (2022). While detailed information on the landslide inventory, the sampling design, and the landslide susceptibility model can be found in Knevels et al. (2020), model extensions and applications that account for soil moisture and environmental changes, respectively, were presented in Maraun et al. (2022). Similarly to the above-mentioned studies, we used a target resolution of 10 m × 10 m for our analysis. Here we will present the database, only briefly giving the details relevant for our model construction, and we refer the reader to the cited publications for further detail.
2.2.1 Base data
For the analysis, different climate, land surface, and landslide data were provided by various sources. As climate data, precipitation and soil moisture data were used. INCA (Integrated Nowcasting through Comprehensive Analysis, 1 km × 1 km) precipitation was provided by the Austrian Central Institute for Meteorology and Geodynamics. Furthermore, precipitation was aggregated to obtain accumulated 5 d rainfall (in mm) and maximum 3 h rainfall intensity (in mm h−1) on the landslide failure day (for a justification of the precipitation aggregation scheme, please refer to Knevels et al., 2020). The soil moisture data were derived using HRLDAS v4.1 (High-Resolution Land Data Assimilation System; Chen et al., 2007) with a 1 km × 1 km spatial and an hourly temporal resolution for the 2004–2014 period and were provided by Maraun et al. (2022) (technical details in Schaffer, 2021). As land surface data, an airborne lidar-derived high-resolution digital terrain model (HRDTM, 1 m × 1 m), a geological basemap, and LULC data (distinguishing forest types: no, broadleaf, mixed, and conifer forest) were provided by the GIS department of Styria and JOANNEUM RESEARCH, respectively. Based on the HRDTM, suitable land surface variables were derived (Sect. 3.1).
As landslide data, we used landslides that occurred during the heavy-rainfall events, which were initially mapped by the Institute of Military Geoinformation and the Geological Survey of Austria in 2009 and in 2014 by the Department of Hydrology, Resources and Sustainability of the Styrian Government. Knevels et al. (2020) analysed and filtered these datasets and compiled a quality-controlled landslide inventory comprising 626 landslides (487 for 2009 and 139 for 2014) in total, which we classified as earth and debris slides with possible transitions to complex slide flows after Cruden and Varnes (1996) (refer to Table A2 in Knevels et al., 2020, for more information).
2.2.2 Environmental change simulations
In order to project landslide susceptibility patterns based on past and future environmental conditions, we obtained event storylines in pre-industrial and future climates (Maraun et al., 2022) as well as a future LULC scenario compiled from various sources. In an event storyline approach, the emphasis is placed on a qualitative understanding and plausibility of driving factors involved in an event, and thus the physically self-consistent unfolding of past or plausible future events or pathways is examined (Shepherd et al., 2018). This implies that we are not investigating all future expected extreme rainfall events but rather a similar event manifesting itself differently in varied climate scenarios. Recently, the Intergovernmental Panel On Climate Change (IPCC) emphasised the utility of the storyline approach for constructing and communicating regional climate information (Doblas-Reyes et al., 2021).
For climate change, the focus was on simulations of the 2009 rainfall event in the present climate, as well as of its characteristics in pre-industrial and future climates. The pre-industrial (“past”) climate is understood here as a counterfactual (present) climate, i.e. without climate change (from here on referred to as NO-CC for “climate with no climate change”). The simulations were based on the regional climate model (RCM) Consortium for Small-scale Modeling (Rockel et al., 2008) with a spatial resolution of 3 km × 3 km and covered the eastern Alpine region (Fig. S1 in Supplement). The RCM boundary conditions were obtained from the integrated forecast system of the European Centre for Medium-Range Weather Forecasts (Bechtold et al., 2008). A spin-up was run (1 October 2008 to 20 June 2009) to ensure a balanced soil moisture field. Based on the spin-up, a 10-member ensemble simulation of the actual event ending on 28 June at 00:00 UTC was computed (“present day”). Storylines for NO-CC and future conditions were simulated based on boundary conditions modified by changes from four GCMs of the Coupled Model Intercomparison Project (Taylor et al., 2009) accounting for the representative concentration pathways (RCPs) with a radiative forcing of 8.5 W m−2 (RCP8.5, i.e. high-emission scenarios; with 10 ensemble members each): IPSL-CM5A-MR (IPSL), HadGEM2-CC (HadGEM), GFDL-ESM2M (GFDL), and MIROC-ESM (MIROC). For the future simulations, the RCM boundaries were modified by imposing changes derived from GCMs, representing the difference between typical conditions during weather events comparable to the 2009 event in warmer future climates and the present climate. The changes were derived from events occurring in the periods 2071–2100 and 1975–2004 under the RCP8.5 scenario and rescaled to selected global warming levels (Maraun et al., 2022). Specifically, we considered 0.5 K (Paris agreement; PARIS), 3 K (business as usual), and 4 K warming (worst case). For the NO-CC simulations, boundary conditions were obtained by scaling the future climate change signal down to −1 K cooling. Please refer to Maraun et al. (2022) for more details on the climate simulations.
Since all conducted simulations showed a positional bias, a delta change approach was applied for each hydrometeorological variable (i.e. precipitation and soil moisture). Following Maraun et al. (2022) the delta change factors were estimated for the simulated hydrometeorological values as ratios of differences in areal averages within domains where the climate change signal was assumed to be constant (NO-CC to present, present to future, 10×10 ensemble-members, i.e. 100 pairs per storyline). In contrast to Maraun et al. (2022), in this study, for soil moisture, the region was expanded to fit the actual target domain (i.e. southeastern Styria vs. Feldbach region, Fig. S1).
A LULC scenario for the future was developed jointly with the Forestry Directorate and District Forestry Authority as regional and local stakeholders. The present-day Syrian forest has a characteristic structure of small-scale changes in different forest types but with a high percentage of spruce (around 58 %; BFW, 2019). Rising temperatures and summer dryness may lead to a higher vulnerability to disturbances such as pathogens and forest pests, including bark beetles (Kolström et al., 2011; Jandl, 2020). Adopting active forest management in the developed future LULC scenario, coniferous forest was replaced by climate-resilient mixed forest. Additionally, present-day agricultural land in unfavourable topography (e.g. slopes steeper than 20∘) was simulated as being transformed to mixed forest in the future. The idealised LULC scenarios developed by Maraun et al. (2022) were not in the scope of this analysis (i.e. extreme de- and afforestation). For NO-CC, the present-day LULC was used as we were only interested in the climate signal.
2.2.3 Data for landslide susceptibility predictions
For the spatial prediction of landslide susceptibility, the creation of a prediction dataset with one layer for each variable (i.e. stack of raster layers) was required. Since precipitation and soil moisture varied during the landslide-triggering period (22–25 June 2009) and landslide failure dates for the simulated NO-CC and future are unknown, we extracted process-related aggregated features for the considered period. Specifically, for each grid cell we determined the maximum 3 h rainfall intensity, and we took the maximum 5 d rainfall. For soil moisture, we used the maximum value on the day prior to the beginning of the corresponding 5 d rainfall aggregation. We downscaled the climate data to our target resolution using the inverse distance weighting method (power = 3; maximum number of neighbours = 16).
The proposed approach to assessing landslide susceptibility uncertainty addresses model fitting accounting for spatial dependency (Sect. 3.1), predictions considering environmental change (Sect. 3.2), and their amount of uncertainty (Sect. 3.3). Please refer to Fig. A1 in the Appendix A for an overview.
3.1 Landslide susceptibility model
Our analysis built on the landslide susceptibility model of Maraun et al. (2022), which was a generalised additive model (GAM). A GAM is a semi-parametric extension of a generalised linear model (GLM), since it has the ability to model non-linear relationships by automatically fitting transformations, or so-called component smooth functions (Wood, 2017). The additive structure of a GAM allows common model diagnostics (e.g. predictor–response relationship, variable importance, odds ratios), and thus GAMs have become popular in landslide susceptibility studies in recent years (Petschko et al., 2014; Knevels et al., 2020).
For the landslide susceptibility analysis, we linked predisposing and time-varying preparatory and triggering factors to landslide occurrences by following recent recommendations for non-stationary landslide susceptibility models (Gariano and Guzzetti, 2016; Reichenbach et al., 2018; Jones et al., 2021; Ozturk et al., 2021). Therefore, we are analysing conditional landslide susceptibility in the sense of a susceptibility that applies under given (time-varying) environmental conditions. Predictor variables were land surface variables (convergence index of 100 and 500 m, plan and profile curvature, logarithmic D-Infinity flow accumulation, normalised height, slope angle, slope angle of catchment area, north and west exposedness, topographic position index (TPI), and topographic wetness index (SWI)), hydrometeorological variables (soil moisture, 5 d rainfall, and maximum 3 h rainfall intensity), geology, and forest type (representing LULC). For more information on the delineation of the predictor variables and their maps, refer to Knevels et al. (2020) and Fig. S6, respectively.
We developed landslide susceptibility models with different model settings, some of which have been published before (Table A1 in Appendix A). As a new model, we decided to explicitly account for residual spatial autocorrelation using a low-rank Gaussian process (GP) smoother (Wood, 2017) as an additional predictor (GAM-Spatial). This feature is often missing in landslide susceptibility modelling, which may result in residual patterns that are unaccounted for by the model and may introduce errors into predictions (Reichenbach et al., 2018). Furthermore, we kept the influence of the 5 d rainfall variable constant beyond 80 mm (“top-coded”) to counteract a physically implausible predictor–response relationship beyond this threshold (GAM-SM+TC in Maraun et al., 2022). In other model settings, the 5 d rainfall variable was not modified (i.e. GAM-SM; Maraun et al., 2022; cf. Fig. A2, Appendix A), and soil moisture was not included as model predictor (i.e. GAM-Co; Knevels et al., 2020).
We used a GAM-Spatial implementation that incorporates residual spatial autocorrelation through the GP representation (Fahrmeir et al., 2013; Wood, 2017). The hyperparameters necessary for the GP implementation are a range (Φ) and correlation function and were estimated based on the residuals of GAM-SM+TC. We followed Simpson (2018) in iteratively searching for a suitable range (from 10 to 1000 m) and correlation function (spherical, exponential, Gaussian, and Matérn, the latter with κ values of 1.5, 2.5, and 3.5). The models' restricted maximum likelihood (REML) score was assessed to identify optimal hyperparameters (i.e. lowest REML score), which were then applied to fit the GAM-Spatial model with a GP smoother. Additionally, the effective range, at which the residual autocorrelation drops below 0.05, was calculated using StempCens in R (EffectiveRange with cor =0.05; Valeriano et al., 2020).
For model assessment, we used well-established diagnostic tools. The model performance was assessed using a 5-fold spatial cross-validation (SpCV) with five repetitions and measured using the area under the receiver operating characteristic curve (AUROC) (Knevels et al., 2020). We ensured that the training and validation data were identical to those in Knevels et al. (2020) to achieve a fair comparison of the landslide susceptibility models. The AUROC values were interpreted following the interpretation guide of Hosmer et al. (2013). To assess variable importance, we calculated the model's mean decrease in deviance explained (mDD, %) after removing the respective variable from the model (Knevels et al., 2020). Larger mDD values indicate greater explanatory power. Predictor–response relationships were analysed visually using transformation functions and quantitatively using odds ratios (ORs). An OR represents the chance that an outcome happened given a specific exposure, compared to odds of the outcome under a reference exposure (Szumilas, 2010). An OR greater than 1 means an exposure with higher odds of landslide occurrence, while an OR lower than 1 is associated with lower odds of landslide occurrence while accounting for the other variables in the model (OR =1 means no association with the exposure). In contrast to Knevels et al. (2020), the variable importance and predictor–response relationships were assessed based on GAMs using the complete dataset (GAM-Spatial, GAM-SM+TC, GAM-SM), i.e. not on subsets of the SpCV models (GAM-Co).
We focused on highly susceptible areas for analysing the uncertainty cascade in storylines of the landslide susceptibility. The area of high landslide susceptibility was defined using the thresholding approach of Petschko et al. (2014), according to which 70 % of the observed landslides fall into that class; low and medium susceptibility account for 5 % and 25 % of observed landslides.
We used the free and open-source computing environment R (R version 4.1.0; R Core Team, 2021) with the GAM implementation in the mgcv package (Wood, 2017).
3.2 Modelling landslide susceptibility in a changing environment
Landslide susceptibility is commonly considered stationary (or invariant in time; Fell et al., 2008). However, this assumption is often violated in space (e.g. anthropogenic land use changes; Reichenbach et al., 2014) and time (e.g. “follow-up” landslides; Samia et al., 2017). In this study, we assessed NO-CC and future landslide susceptibility by considering the LULC and hydrometeorological variables as time-varying predictors, and therefore we modified their values according to the storylines. While the hydrometeorological predictors were multiplied with the corresponding delta change factor, the LULC data were replaced with the developed scenario only for the future. The other predictors (land surface variables and geology) were considered invariant in time.
To estimate changes in landslide susceptibility between a storyline and the present day, we applied two approaches: first, we calculated the relative change in the areal extent of a susceptibility class (in % and percentage points, pp) to quantitatively derive the potential change in the area at risk. And second, we expressed the effect size of change using the average change in the odds of landslide occurrence of a susceptibility class as OR class for those locations which fall into identical susceptibility classes in both predictions:
where logitstory(i) and logitref(i) denote the logits of landslide occurrence probabilities at a specific location i and susceptibility class (low, medium, or high) of the storyline and reference scenario (present day), respectively, and n is all locations of the same landslide susceptibility class in both scenarios.
3.3 Uncertainty cascade in landslide predictions
In integrated modelling, there are various sources of uncertainty affecting the predicted outcomes. We quantified the uncertainty cascade in storylines of landslide susceptibility by accounting for climate model uncertainty and landslide model parametric uncertainty (or sampling variability).
For the climate model uncertainty we assessed within-event internal model variability and scenario uncertainty for each hydrometeorological variable. The applied single event storyline approach includes a particular realisation of internal climate variability; thus the established storylines are conditioned on it (Doblas-Reyes et al., 2021). By using estimates from a climate model ensemble with different realisations of internal variability, the uncertainty related to conditional internal climate model variability can essentially be removed (Maraun et al., 2022). In this study, we explicitly analyse within-event internal climate model variability and therefore address the question of how the event could locally unfold in the present climate as well as cooler and warmer climates. Regarding the climate signal or forced change, the influence of within-event internal climate model variability can be accounted for by averaging across the ensemble members of a climate models' storyline (Maraun et al., 2022).
For the within-event internal climate model variability, we estimated the 2.5th and 97.5th percentiles from the delta change factor distribution (i.e. 100 pairs per storyline) describing the lower and upper bound of local climate model variability; the mean delta change factor represents a models’ climate signal (or forced change). The estimated delta change factors were subsequently offset against the corresponding values of the hydrometeorological predictor. For the climate scenario uncertainty, the width of the predicted outcomes using the climate signals of all climate models within a scenario (NO-CC, PARIS, 3 and 4 K warming) was calculated.
The landslide models’ parametric uncertainty is associated with measurement errors, sampling errors and variability, misclassification of data, and surrogate data weaknesses (EPA, 2019) and, from a frequentist perspective, is commonly expressed using confidence intervals. A common approach to quantify parametric uncertainty is bootstrapping (e.g. Brenning et al., 2015). However, in the framework of the mgcv::gam, this approach has limitations when penalties are present and some observations are sampled twice. This may cause undersmoothing and is therefore not recommended (Wood, 2017). However, the manner in which the mgcv GAM is implemented can be viewed as “empirical Bayes” (Wood, 2017). This allows the calculation of pointwise Bayesian credible intervals for the estimated model parameters using the standard error derived from the Bayesian posterior covariance matrix (Wood, 2017; Simpson, 2018). The pointwise Bayesian credible intervals have good frequentist coverage probabilities when averaged across the function domain but with over- and under-coverage in some parts (Marra and Wood, 2012). In contrast, a simultaneous Bayesian credible interval that contains the entire true function for a given credible level (1−α) can be achieved by posterior simulation from the posterior distribution of the model coefficients (Simpson, 2018); this is the approach we adopt in this study.
To simulate GAM coefficients, a Gaussian approximation to the posterior for the coefficients is a computationally very efficient approach but not recommended for spatial models with a logit link in the mgcv framework (Wood, 2015). Therefore, we used a simple Metropolis–Hastings (MH) sampler with random-walk proposals as implemented in the mgcv::gam.mh function, but we also calculated a Gaussian approximation for comparison purposes (mgcv::rmvn function). The MH function reports two types of acceptance rate: a fixed acceptance rate and a random-walk acceptance rate (refer to Wood, 2015, for more details). The simulations of the MH sampler are controlled by hyperparameters that need to be tuned to achieve an optimal proposal distribution. A proposal distribution is optimal for a random-walk acceptance rate of 23.4 %, while high values are to be achieved for the fixed acceptance rate (Roberts et al., 1997; Wood, 2015). Thus, the optimum of the hyperparameter tuning was selected by minimising the sum of the absolute difference of both acceptance rates to their optimal rates. For the tuning, we set the initial burn-in period to 5000 simulations, the number of (actual) “simulated GAMs” to 10 000, and optimised rw.scale (random-walk scale factor for a posterior covariance matrix) and t.df (degrees of freedom of the t distribution) using a grid search. We defined a regular grid ranging from 0.005 to 0.02 for rw.scale (step size of 0.0005, i.e. 31 total steps) and from 25 to 10 000 (step size of 25, i.e. 400 total steps) for t.df (in total 12 400 executions).
Furthermore, the simulation from the posterior distribution allows us to derive the so-called critical value for each non-parametric transformation function (Ruppert et al., 2003; Simpson, 2018). The critical value is a factor which modifies the pointwise Bayesian credible interval to achieve the simultaneous Bayesian credible interval for a given credible level. A critical value greater than the coverage factor for a given credible level means an underestimation of the true function for the pointwise interval compared to the simultaneous interval (e.g. critical value of 2.5 vs. coverage factor of 1.96 for 95 % credible level, 28 % underestimation; Simpson, 2018), and large critical values may indicate particularly uncertain predictors.
For the uncertainty cascade, landslide susceptibility prediction uncertainty intervals were estimated as described in the following. First, we classified the predictions of each of the simulated GAM-Spatial models into (low, medium, and) high landslide susceptibilities. And second, we derived the 2.5th and 97.5th percentiles as lower and upper uncertainty intervals of the corresponding storyline from the resulting distribution of the high-landslide-susceptibility area (i.e. 3×10 000 values of high landslide susceptibility for mean and percentiles of delta change factor distribution). Finally, to compare the different sources of uncertainty in the uncertainty cascade, we calculated the following ratios:
where RIV;Lsl and RCS;Lsl denote the ratio of the uncertainty width of within-event internal climate model variability (CIIV) and scenario uncertainty (i.e. width of climate signals, CICS), respectively, to the parametric uncertainty width of the landslide model (CILsl). The joint uncertainty distribution of the landslide models' parametric uncertainty and within-event internal climate model variability is here referred to as the storyline uncertainty (CIStory).
4.1 Climate change uncertainty
We identified different patterns of delta change factor distributions depending on the considered hydrometeorological variable and the storyline (Fig. 2).
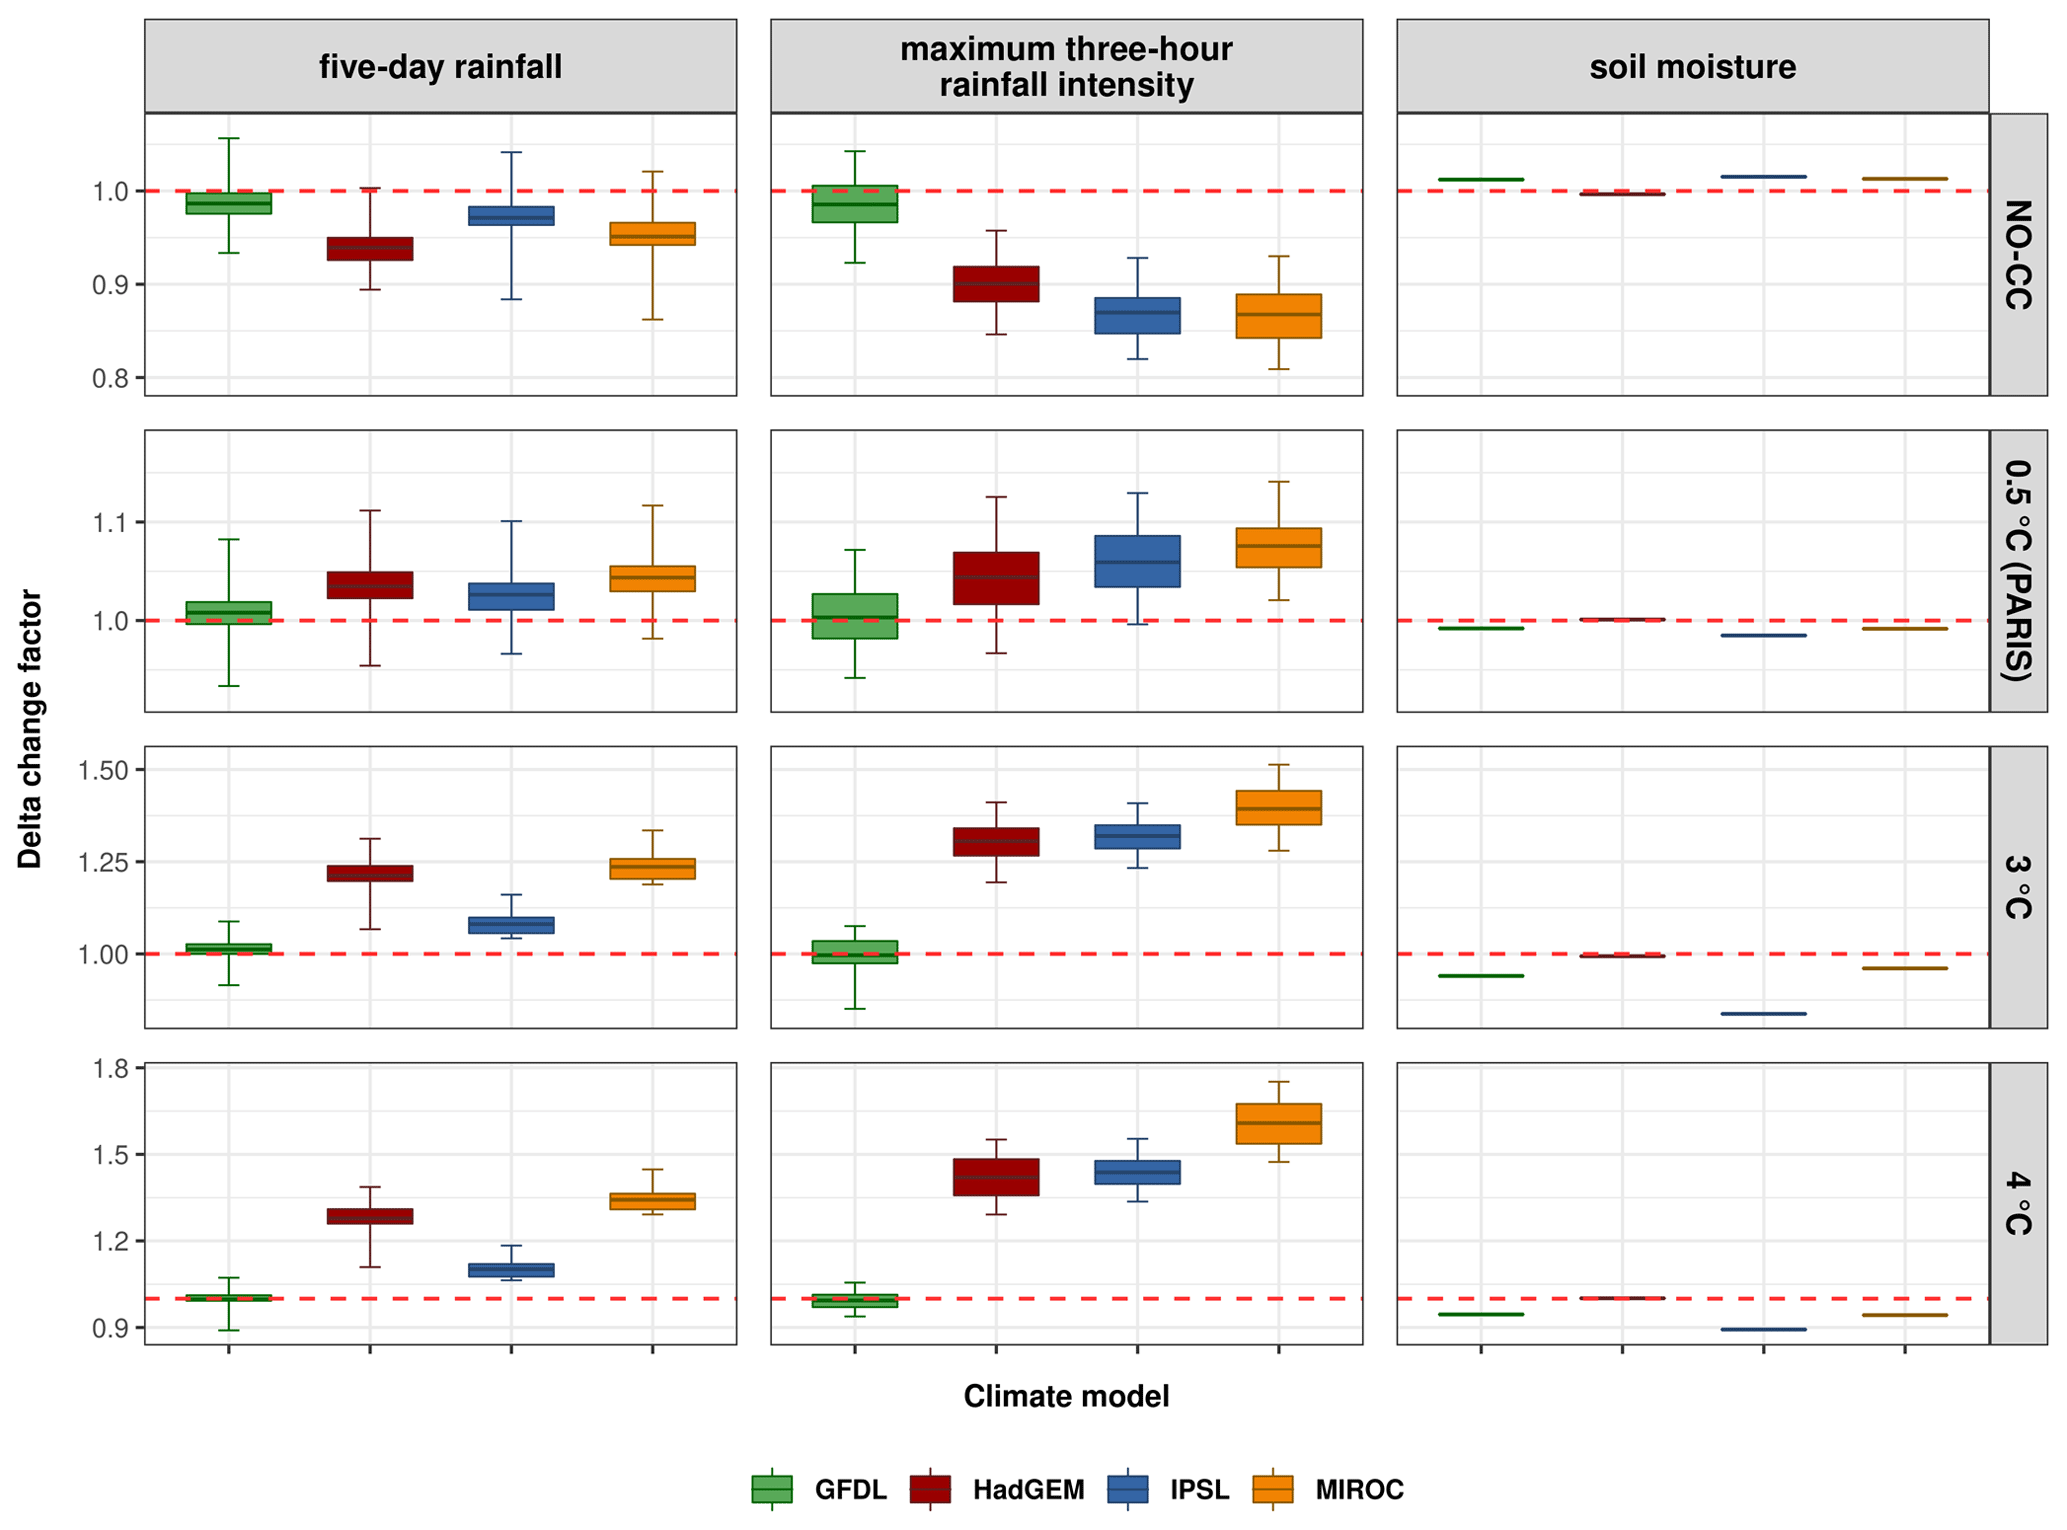
Figure 2Delta change factor distribution for each storyline; variability corresponds to individual model simulations. Note that scales of y axes differ between scenarios. Boxplot modifications: the middle hinge shows the mean. The lower and upper whiskers represent the 2.5th and 97.5th percentiles, respectively. Potential outliers are not plotted.
The mean delta change factors (i.e. climate signals) for 5 d rainfall and maximum 3 h rainfall intensity were generally lower in NO-CC and higher in the future relative to the present-day climate (Table A3 in Appendix A). In the future climate, with the exception of the GFDL model, the mean increase ranged from 3 % (IPSL, PARIS) to 34 % (MIROC, 4 K warming) for 5 d rainfall and from 4 % (HadGEM, PARIS) to 61 % (MIROC, 4 K warming) for maximum 3 h rainfall intensity. In NO-CC, with the exception of the GFDL model, the changes were negative on average (i.e. factors <1). Specifically, mean decreases were between 3 % (IPSL) and 6 % (HadGEM) for 5 d rainfall and ranged from 10 % (HadGEM) to 13 % (MIROC) for maximum 3 h rainfall intensity. The averaged delta change factor of GFDL indicated projected changes of ±1 % in both meteorological variables in NO-CC as well as future climates. For soil moisture, the models projected on average drier soils in the future and wetter soil in NO-CC relative to the present-day climate, with the exception of HadGEM. IPSL in 3 K warming projected the driest soils (−16 %, on average), and it also projected the wettest soil conditions overall (+2 %) in NO-CC, on average. Following Maraun et al. (2022), the hydrometeorological storylines for the future can thus be summarised as (much) heavier rain (HadGEM, MIROC, IPSL) and (much) drier soil (IPSL, GFDL, MIROC), although there were also some neutral projections (rain: GFDL; soil: HadGEM; Table A2 in Appendix A).
Regarding the 2.5th and 97.5th percentiles of the storylines' delta change factor distributions (i.e. within-event internal climate model variability), we discovered opposed delta change factors in the GFDL storylines (Table A3 in Appendix A). Similarly, in the NO-CC and PARIS scenarios for 5 d rainfall, all other climate models had contrasting delta change factors, while for the maximum 3 h rainfall intensity this was only the case for HadGEM and IPSL in PARIS. Regarding the percentiles of the soil moisture storylines, only coherent delta change factors were found, yet some climate signals were weak (e.g. nearly 1 for HadGEM).
4.2 Landslide susceptibility model
We established a spatial GAM using an optimised GP smoother. The spatial structure of GAM-SM+TC residuals was best described by a Gaussian correlation function with an effective range of 524 m (Φ of 303 m). Nevertheless, the other correlation models achieved nearly identical REML scores with varying effective ranges (582 to 710 m, Table A4 in Appendix A and Fig. S2). The following subsections describe the model assessment (Sect. 4.2.1) and the posterior simulation of the coefficients (Sect. 4.2.2) for GAM-Spatial. Detailed results for the other model settings (GAM-Co and GAM-SM+TC) are included in the Supplement (Fig. S3).
4.2.1 Assessment of the landslide susceptibility model
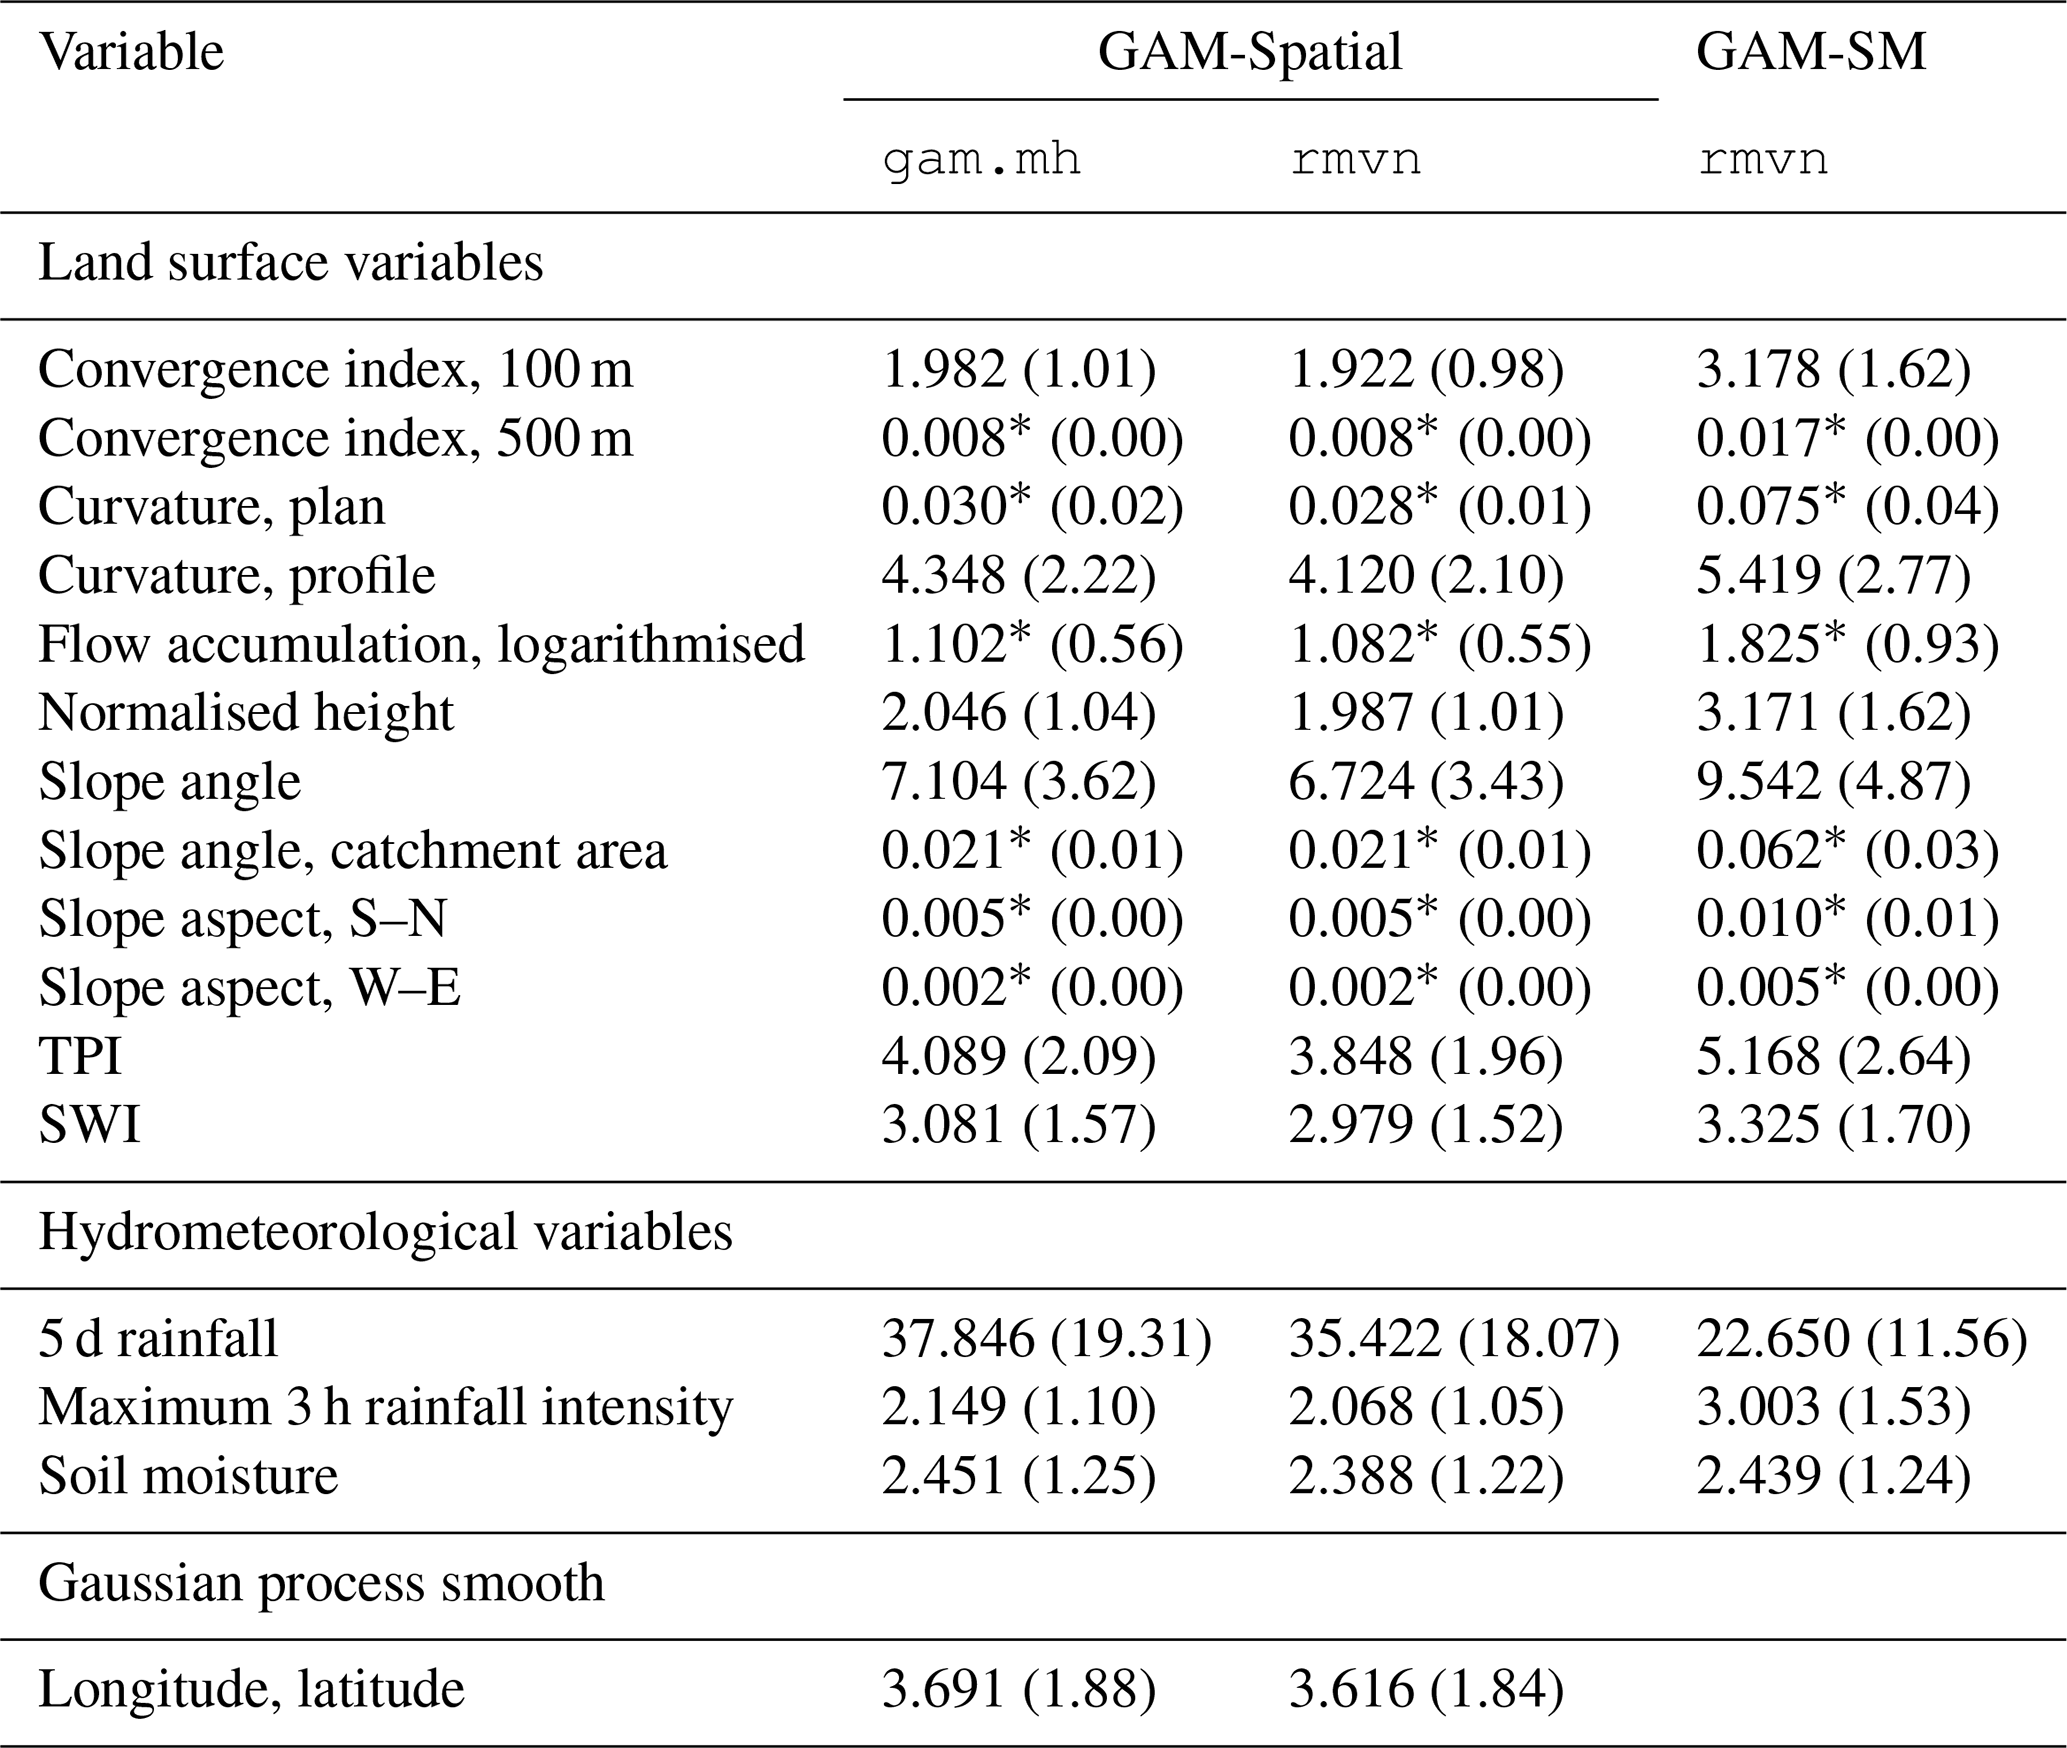
GAM-Spatial achieved an outstanding discrimination capability with median AUROC (mAUROC) of 0.94 (Fig. 3a, Table A5 in Appendix A). The model's five most important variables in decreasing order were 5 d rainfall (10.8 % mDD), forest type (8.8 % mDD), the spatial GP smoother (6 % mDD, longitude and latitude), slope angle (5.5 % mDD), and profile curvature (1.1 % mDD) (Fig. 3b). The hydrometeorological variables maximum 3 h rainfall intensity (0.9 % mDD) and soil moisture ranked sixth and ninth (0.6 % mDD), respectively (Table A6 in Appendix A).
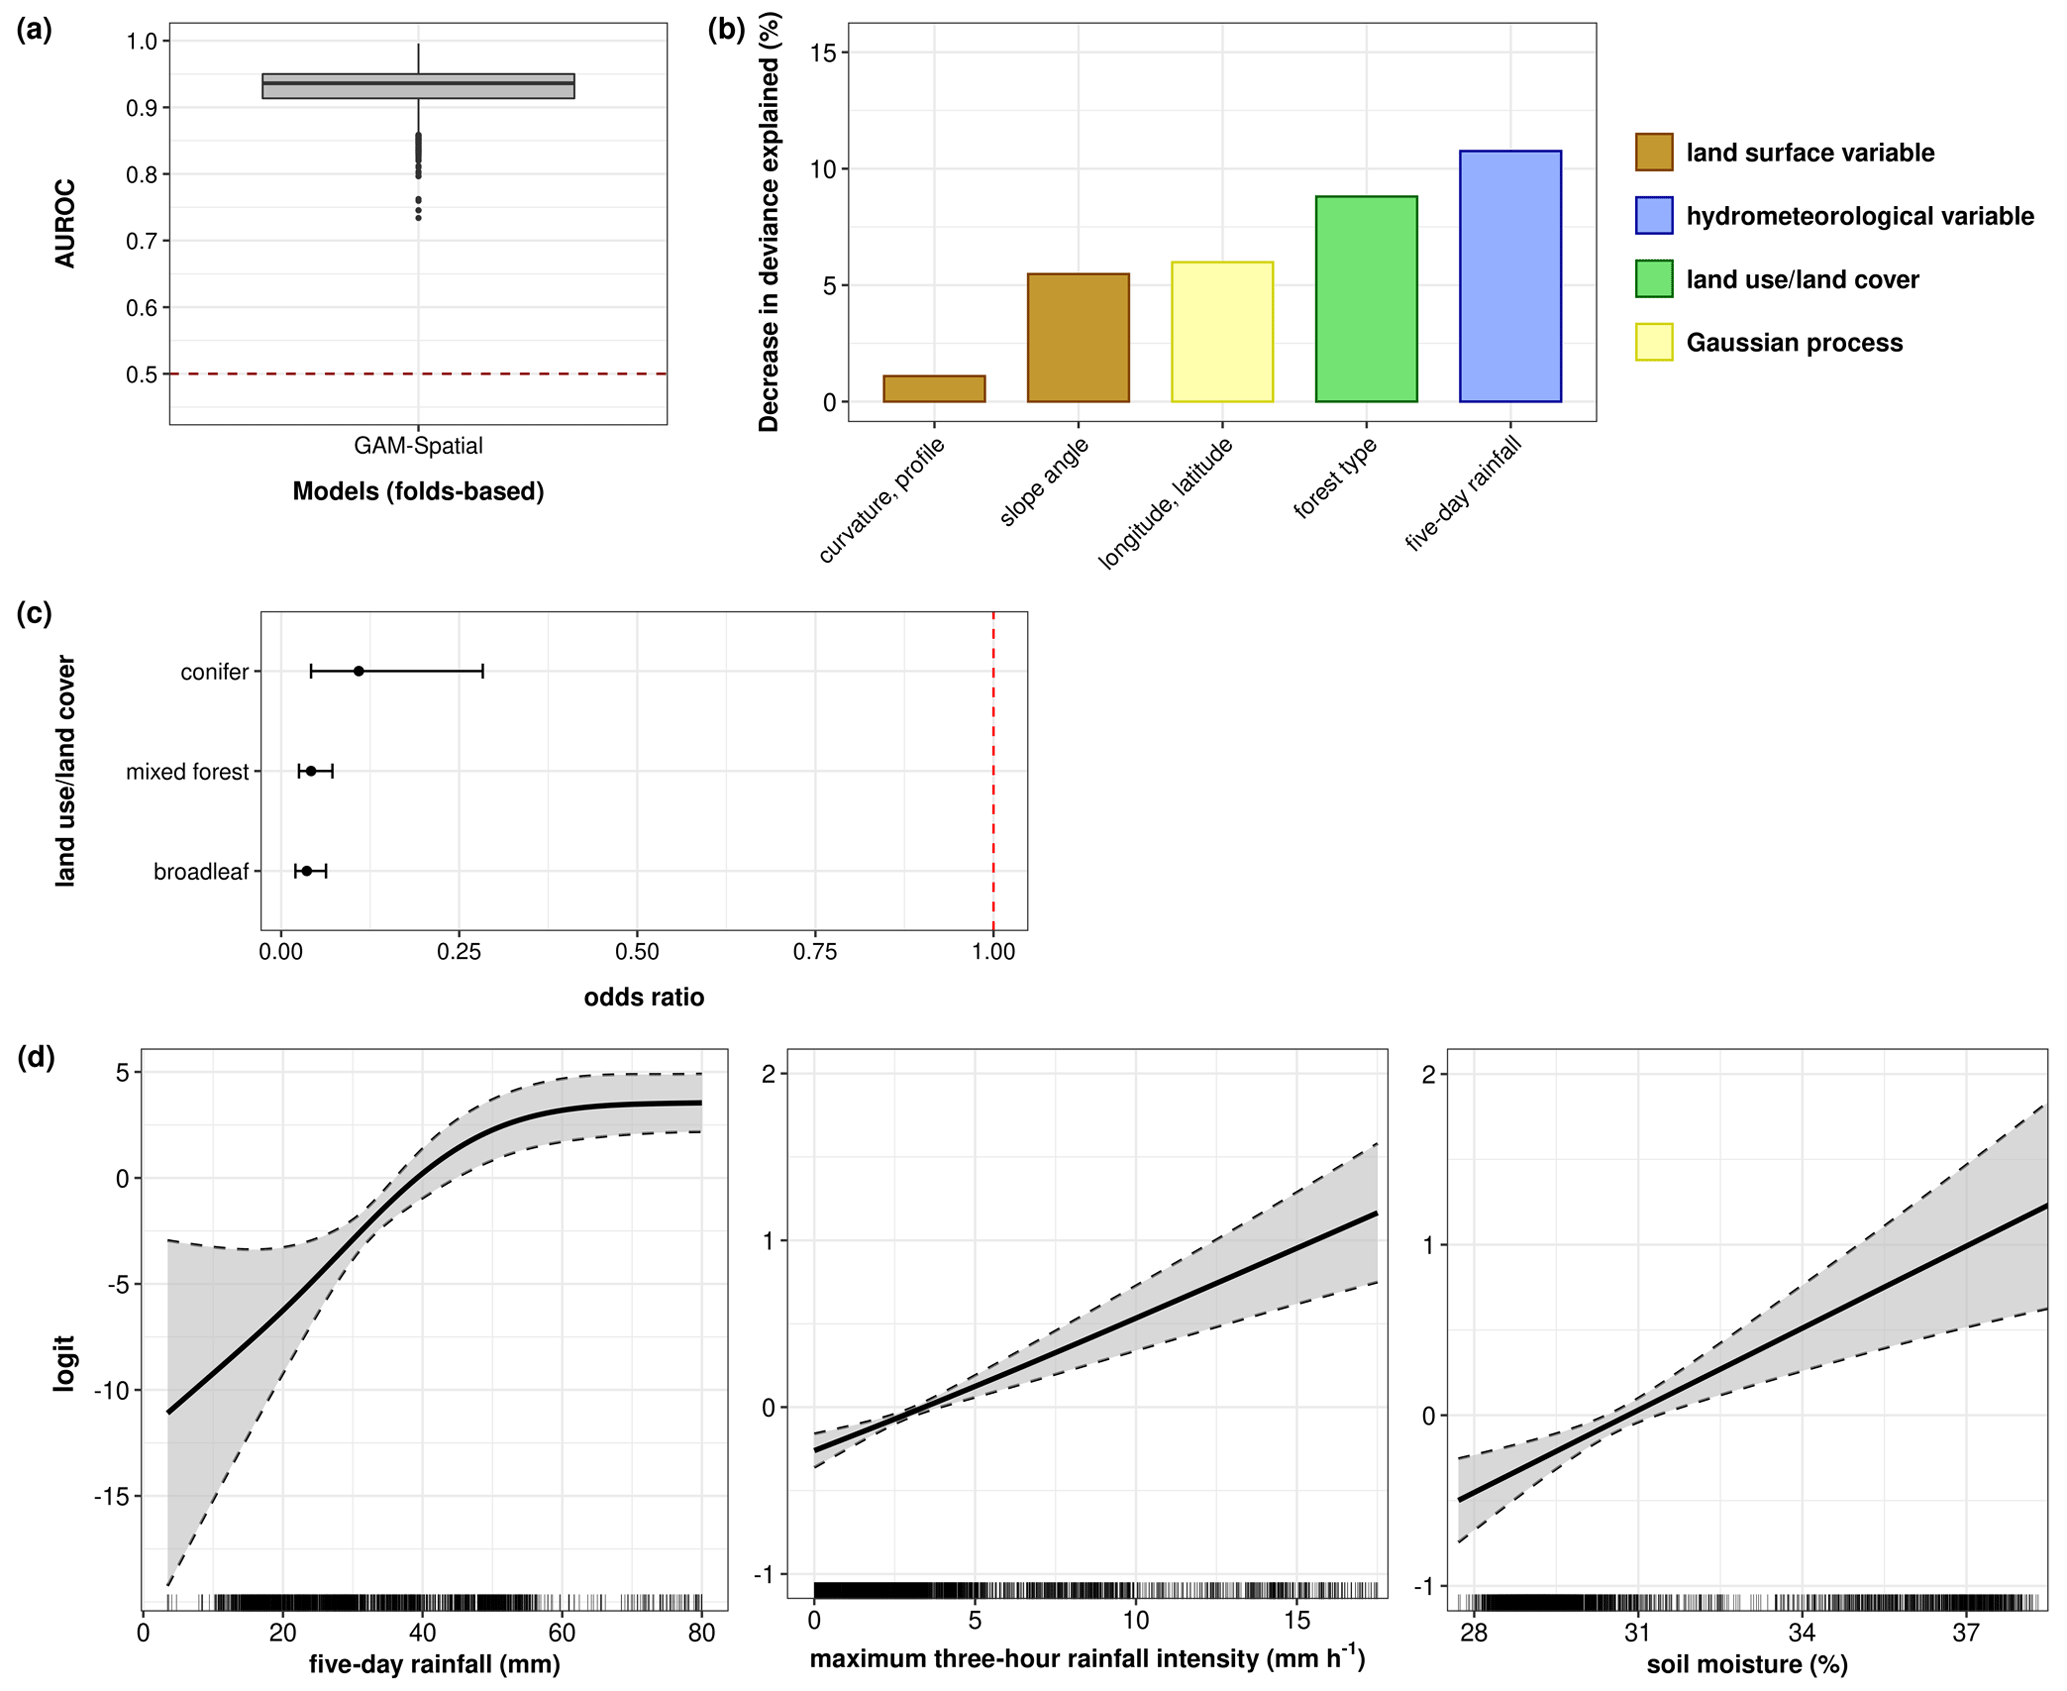
Figure 3Model diagnostics for GAM-Spatial. (a) Comparison of model performances (folds-based). (b) Top five most important variables sorted by mean decrease in deviance explained (%). For an overview of all input variables, refer to Table A6. (c) Comparison of predictor–response relationships of LULC variables using odds ratios. (d) Comparison of predictor–response relationships of hydrometeorological variables. Note that the y axes in panel (d) are plot-dependent. Estimates and predictor–response relationships for GAM-Co are based on SpCV models in Knevels et al. (2020). In grey: 95 % pointwise Bayesian credible intervals.
Regarding the predictor–response relationships, for the LULC variable, the chances (i.e. odds) of landslide occurrence were up to 0.04 times as low in forested areas as in non-forest areas (Fig. 3c). For 5 d rainfall, the modelled chances rise as rainfall increases up to 80 mm, where a plateau was reached due to the top-coding of this variable. For maximum 3 h rainfall intensity and soil moisture, we identified a linear relationship with higher odds of landslide occurrence for higher rainfall and soil moisture values, respectively, while accounting for the other variables in the model (Fig. 3d).
Overall, the inclusion of the spatial GP smoother had little impact on the model discrimination capability, relative importance of variables, or the modelled relationships compared to other model settings (Fig. S3).
4.2.2 Hyperparameter tuning for posterior simulation
The hyperparameter tuning for the posterior simulation allowed us to identify an optimal region at rw.scale =0.0095 and t.df between 6050 and 6100 (Fig. 4c). For the random-walk acceptance rate, we discovered a non-linear relationship of rw.scale to the random-walk acceptance rate describing higher acceptance rates at lower rw.scale values, while changing t.df values had no effect (Figs. 4a, A3 in Appendix A). The fixed acceptance rate, in contrast, increased with higher t.df values and reached a plateau at t.df values around 2500 (Figs. 4b, A3 in Appendix A). Considering the optimal rates, we identified three optima with identical rw.scale values of 0.0095, a random-walk acceptance rate of 23.24 %, and a fixed acceptance rate of 22.95 %, as well as nearly identical t.df values (6050, 6075, 6100; overall difference of 1.47 pp, Fig. 4c). Therefore, we simulated coefficients based on the optimal hyperparameter values corresponding to the lowest t.df value (i.e. 6050).
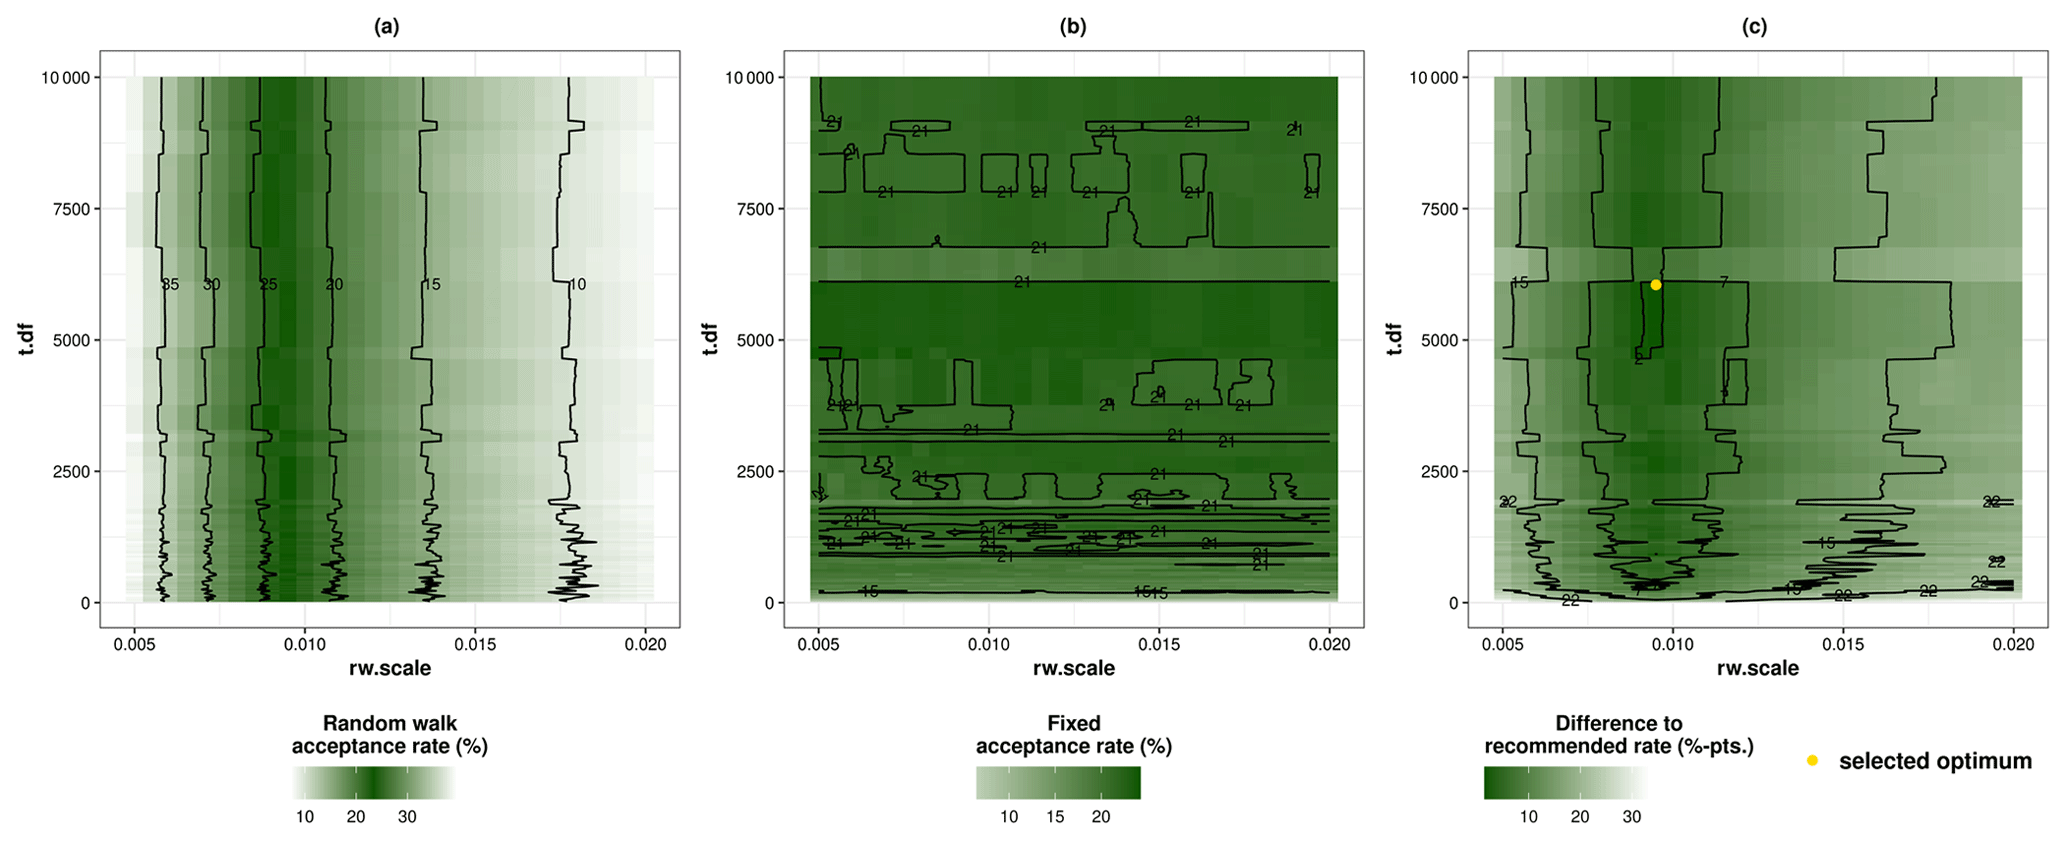
Figure 4Optimisation results for acceptance rates of mgcv::gam.mh using different hyperparameter values for rw.scale (random-walk scale factor for posterior covariance matrix) and t.df (degrees of freedom for t proposal). (a) Random-walk acceptance rate. (b) Fixed acceptance rate. (c) Sum of absolute differences between acceptance rates and optimal rate. The optimal rate for random-walk acceptance is 23.4 % according to Roberts et al. (1997), and high values for the fixed acceptance rate, respectively.
The estimation of the critical values for the non-parametric transformation functions according to Simpson (2018) revealed a general agreement of the Gaussian approximation (mgcv::rmvn) and the simple Metropolis–Hastings sampler (mgcv::gam.mh) (Table A7). For GAM-Spatial's five most important variables, the critical values ranged between 3.7 (longitude, latitude) and 37.85 (5 d rainfall), which corresponds to intervals that are approximately ±88 % to ±1831 % wider than the equivalent across-the-function intervals for the 95 % credible level.
4.3 Uncertainty cascade in landslide predictions
The landslide susceptibility predictions of the simulated GAM-Spatial models were classified into low, medium, and high susceptibility (Petschko et al., 2014). The thresholds to discriminate low from medium and medium from high landslide susceptibility were 0.16 and 0.57 on the probability scale, respectively. In the following, we focus on the storylines of highly susceptible areas and their uncertainties (Fig. 5).
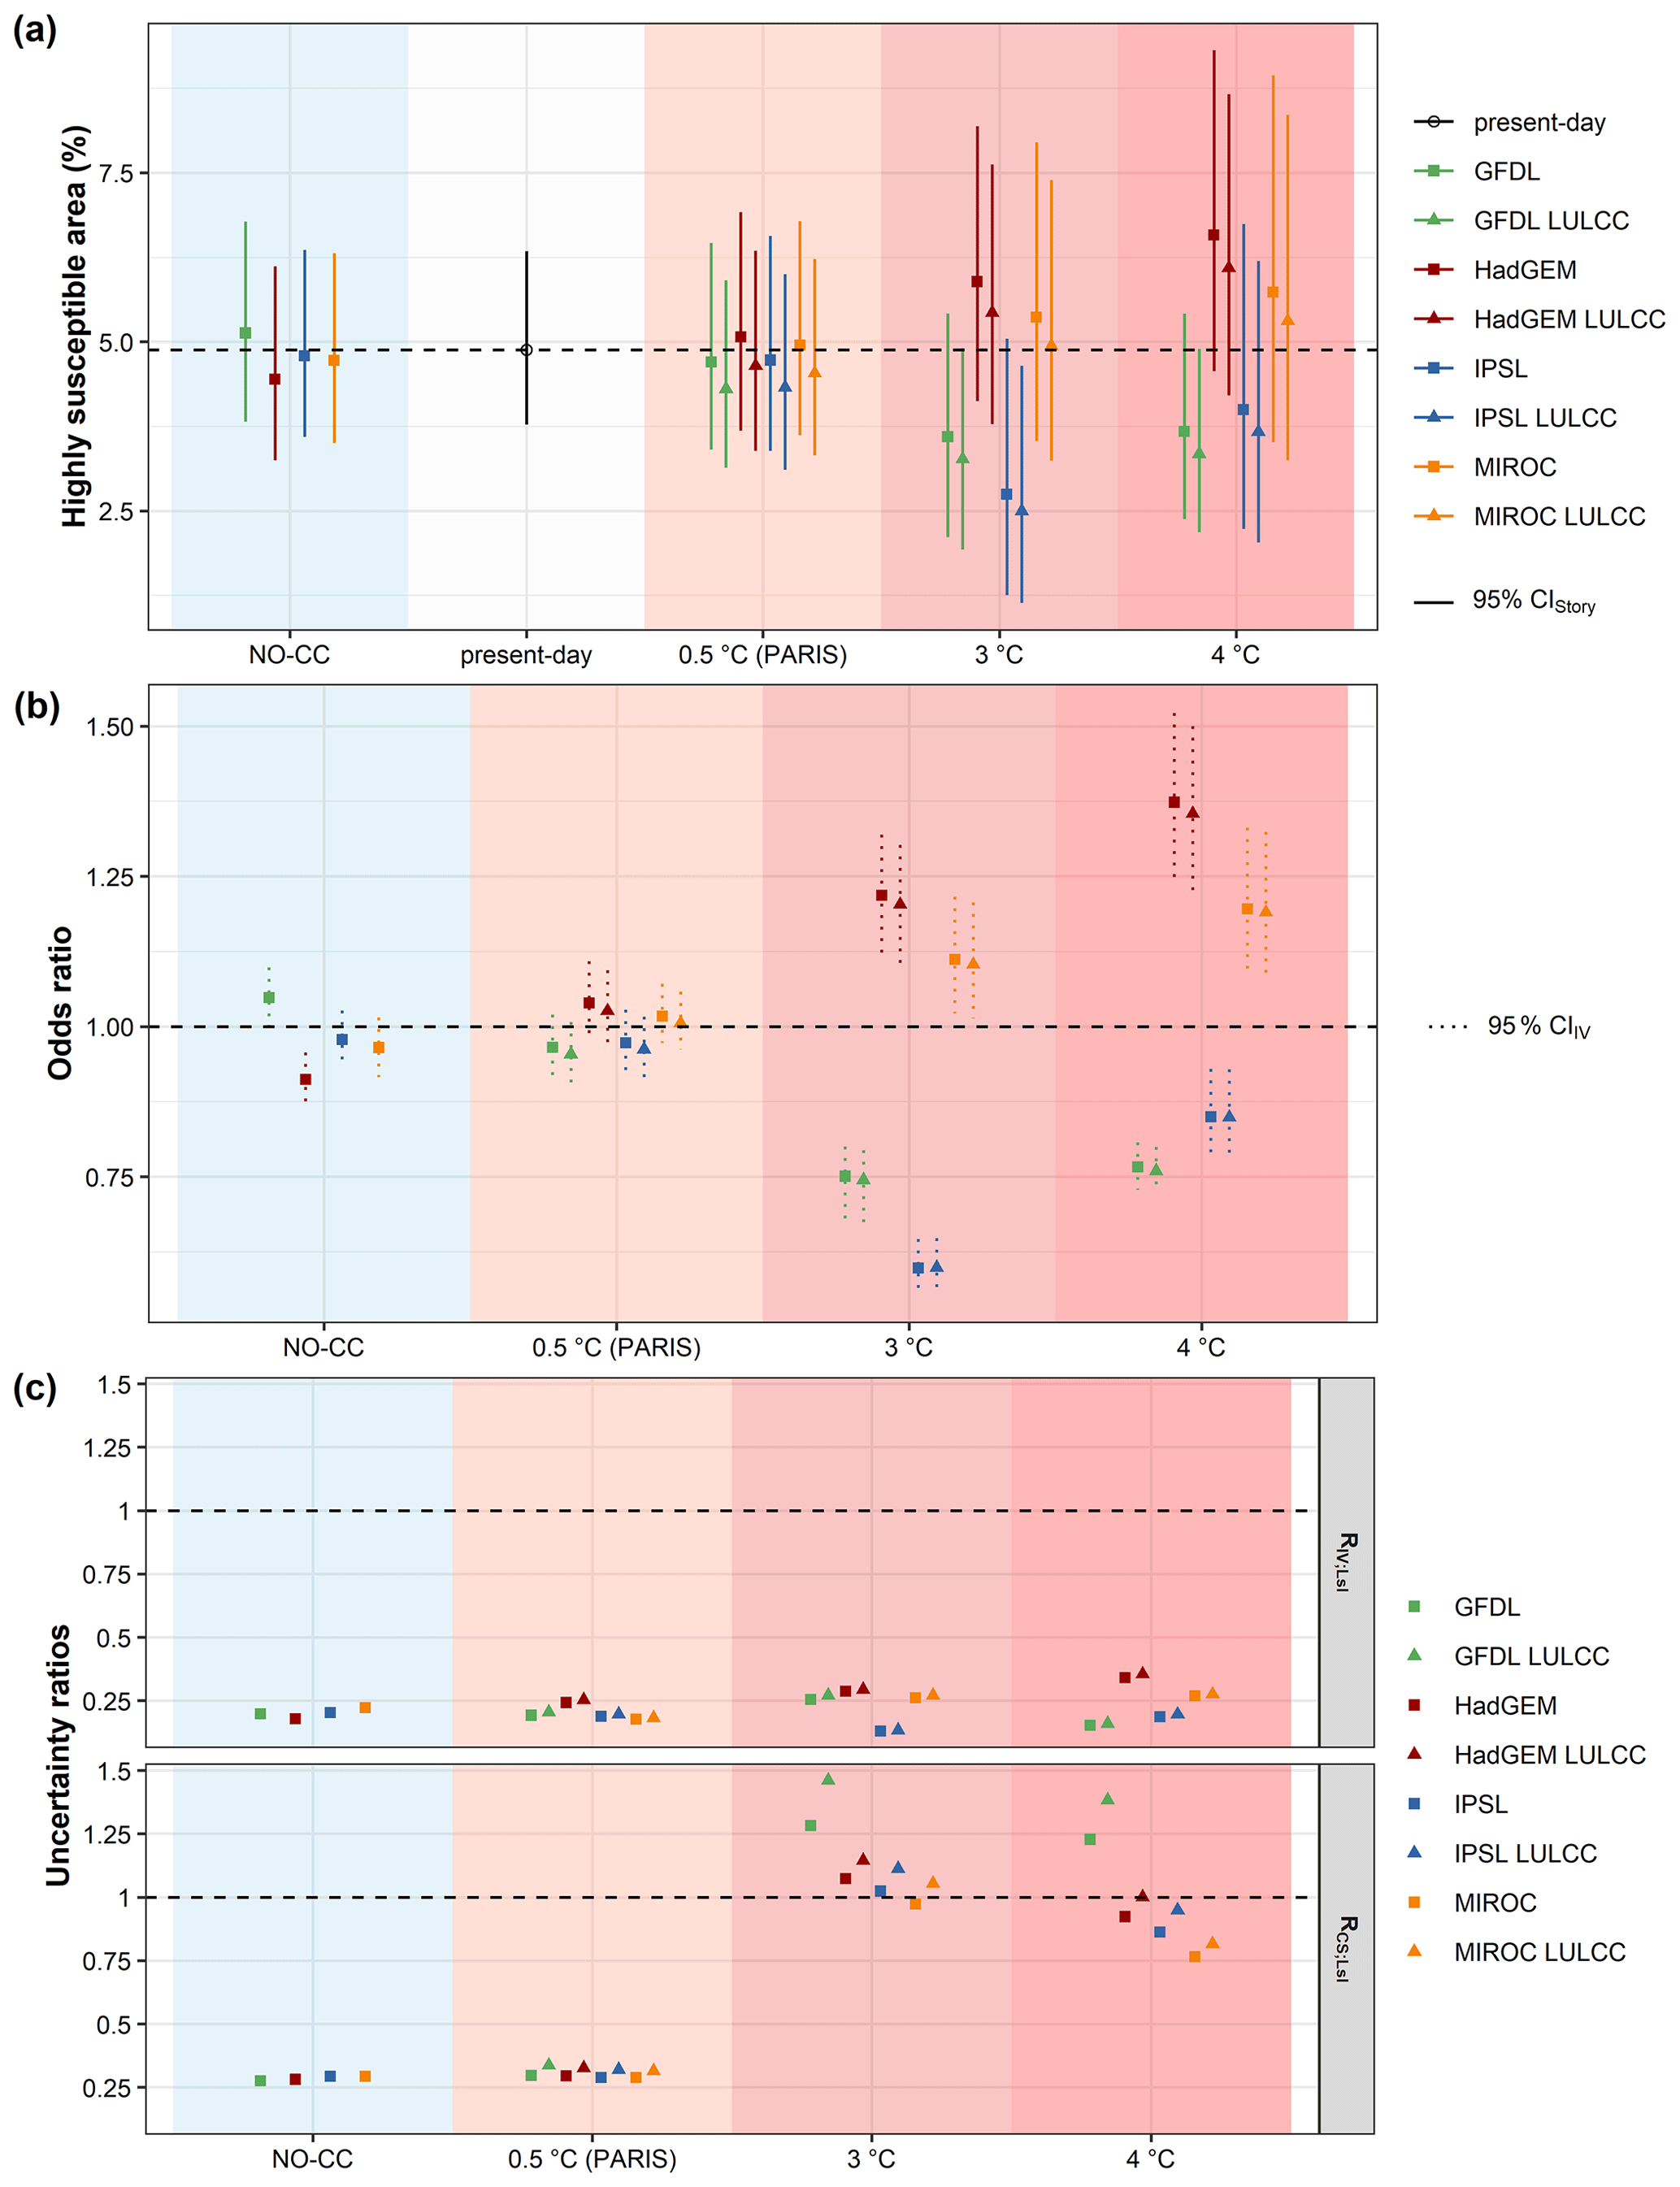
Figure 5Uncertainty assessment results for high landslide susceptibility. (a) Area of high landslide susceptibility with 95 % confidence intervals (CIs) is based on within-event internal climate model variability (CIIV) and landslide model uncertainty (CILsl). (b) OR of landslide occurrence in highly susceptible areas relative to present-day landslide susceptibility. (c) Ratio of within-event internal climate model variability (RIV;Lsl, top; see Eq. 2) and climate scenario uncertainty (RCS;Lsl, bottom; see Eq. 3) to landslide model uncertainty.
Regarding the present-day landslide susceptibility, around 4.9 % of the study area was highly susceptible to landslides (Fig. 5a, Table A8 in Appendix A). In the NO-CC scenario, high susceptibility was generally less common (4.4 %–4.8 %), with the exception of GFDL, which showed a slightly higher share (5.1 %).
The projected future signal, in contrast, was less coherent. In PARIS, the mean signal was similar to present-day susceptibility (−0.2 pp (percentage points difference in area) for GFDL and +0.2 pp for HadGEM), while the mean changes in 3 and 4 K warming were substantial. In 3 and 4 K warming, GFDL and IPSL projected a decrease in the highly susceptible area by up to −1.3 and −2.2 pp (−27 % and −45 %), respectively, while HadGEM and MIROC showed the opposite signal with increases of up to +1.7 and +0.8 pp (+35 % and +16 %), respectively. The mean signals of climate models in a 3 K warmer world were lower than in 4 K. Additionally, the considered LULC scenario resulted in a generally smaller extent of highly susceptible areas (up to 0.5 pp).
Regarding the OR of the storylines relative to present-day landslide susceptibility within the high-susceptibility class (see Eq. 1), the pattern is similar to the change in susceptible area but more coherent (Fig. 5b, Table A9 in Appendix A). The chances of landslide occurrence in the NO-CC scenario were 0.91 (HadGEM) to 0.98 times (IPSL) as high as in the present-day settings (with the exception of GFDL with an OR of 1.05), based on the modelled climate signals. For the future, while in PARIS the ORs showed small effect sizes (ORs between 0.97 for GFDL and 1.04 for HadGEM), in 3 and 4 K warming the effect sizes were medium to large. In the worst-case storyline, the chances of landslide occurrence in highly susceptible areas was 1.37 times as high as in the present day (i.e. for HadGEM in 4 K warming), while it was 0.60 times as high in the best-case storyline (i.e. for IPSL in 3 K warming).
Regarding the storyline uncertainty (CIStory, Fig. 5a, Table A7 in Appendix A), for present-day landslide susceptibility, the uncertainty width was from +1.4 pp (+29 % area change) to −1.1 pp (−22 %). While present-day predictions were not affected by within-event internal climate model variability and thus reflected only landslide model uncertainty, the other storyline uncertainties accounted for both. The largest uncertainty interval for NO-CC covered 3.0 pp (GFDL). For the future, we identified larger uncertainty intervals with increased warming levels (largest intervals: PARIS, 3.2 pp for HadGEM; 3 K warming, 4.4 pp for MIROC; 4 K warming, 5.4 pp for MIROC).
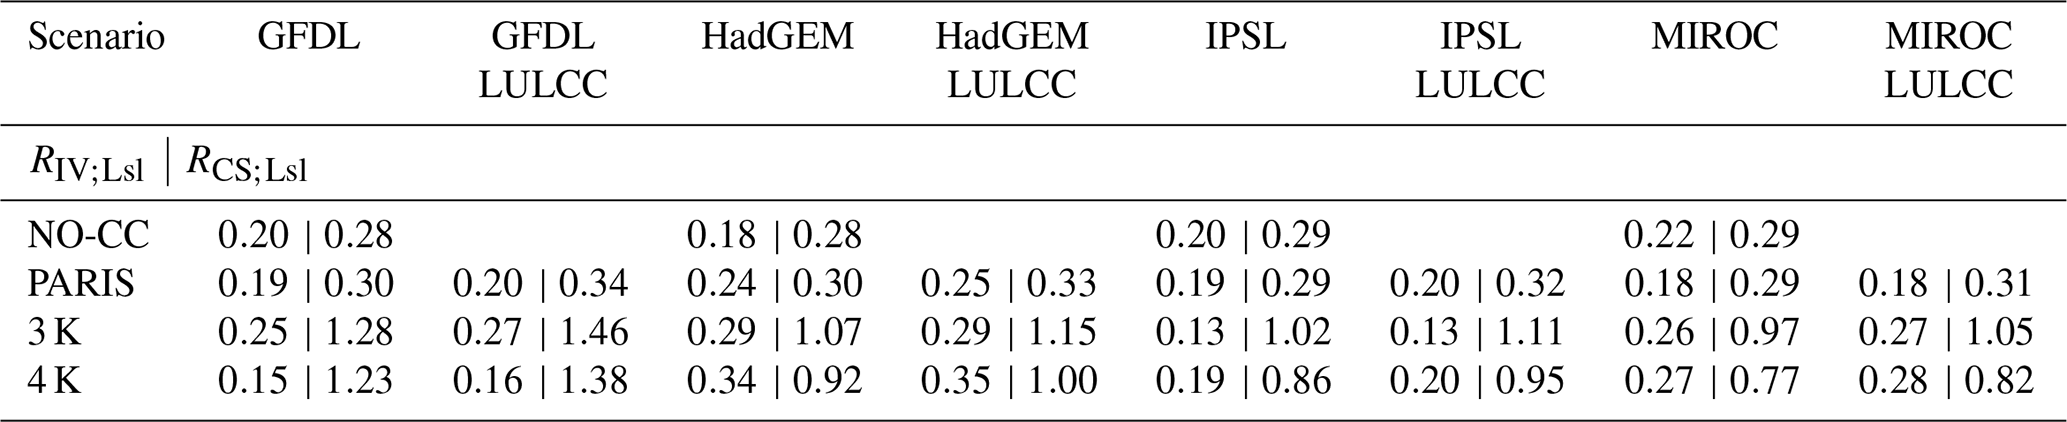
Regarding the contributions of the uncertainty cascade in the storylines, the uncertainty introduced by within-event internal climate model variability is around 0.13 (IPSL in 3 K warming) to 0.35 (HadGEM LULCC in 4 K warming) times as large as parametric landslide model uncertainty (RIV;Lsl, Fig. 5c, Table A10 in Appendix A; see Eq. 2). Instead, the ratio of climate scenario uncertainty to parametric landslide model uncertainty (RCS;Lsl; see Eq. 3) showed a distinct pattern depending on the scenario: for NO-CC and PARIS, the uncertainty introduced by the climate models was lower relative to parametric landslide model uncertainties (ratios between 0.28 and 0.34). Instead, for 3 K warming, the climate scenario uncertainty was generally larger than the parametric landslide model uncertainty with ratios between 1.05 (IPSL) and 1.46 (GFDL LULCC) (excluding MIROC with a ratio of 0.97). For 4 K warming, while the climate scenario uncertainty was larger than the landslide model uncertainties for GFDL and GFDL LULCC (ratios of 1.23 and 1.38, respectively), for the other models the ratios were equal to (i.e. HadGEM LULCC) or lower than 1 (e.g. ratio of 0.77 for MIROC).
5.1 Landslide susceptibility in a changing environment
We identified different trends of projected landslide susceptibility for future storylines relative to the present day, while for the NO-CC storylines (i.e. pre-industrial, counterfactual climate), landslide susceptibility was generally estimated to be lower (exception: GFDL). For projected future changes in hydrometeorological conditions (i.e. climate signals), the storyline of much heavier rain showed the strongest increase in affected highly susceptible area (+35 %) with additionally higher chances of landslide occurrence relative to present-day susceptibility (OR of 1.37, HadGEM in 4 K). However, the effect of much drier soil may compensate for heavier rain and thus reduce the affected area (−45 %) and the chance of landslide occurrence (OR of 0.6, IPSL in 3 K). The projected changes in highly susceptible areas and their magnitudes were in general agreement with the findings of Maraun et al. (2022), who used a small part of our study area (Feldbach region, 95th percentile for high-susceptibility thresholding). For the worst- and best-case storylines, Maraun et al. (2022) found changes of +45 % (4 K warming) and −37 % (3 K warming) in highly susceptible area and ORs of 1.66 (4 K warming) and 0.8 (3 K warming) in landslide susceptibility in those areas.
For other regions, some authors have projected an increased landslide occurrence or affected area that is attributable to climate change (Jaedicke et al., 2008; Lee, 2017), while other authors have found more complex patterns that depend on the seasonal period and location under consideration (Ciabatta et al., 2016; Gariano et al., 2017; Rianna et al., 2017). Projected increases in slope failure probability amounted to approximately 25 % for mountainous areas in Norway (for 2050; Jaedicke et al., 2008) or 40 % for the Umbria region in central Italy (for 1990–2013 to 2070–2099 under RCP8.5; Ciabatta et al., 2016), and an increase in susceptible area by around 32 % was projected for southwestern Taiwan (for 2090; Lee, 2017). With a focus on seasonal differences, Ciabatta et al. (2016) projected increases in landslide occurrence mainly in winter, while in the warm and wet season, very low soil moisture (Ciabatta et al., 2016) and increased evaporation (Rianna et al., 2017; for 2071–2100 under RCP8.5) might even improve slope stability. Analysing spatial patterns in Calabria, southern Italy, Gariano et al. (2017) identified for around 27 % of the municipalities a significant increase in rainfall-events with landslides (western part of the region and along the main mountain chains), while for 38 % of the municipalities a reduction was estimated (for 1981–2010 to 2036–2065 under RCP8.5). Therefore, we agree with Schlögel et al. (2020) that projecting the interplay between a natural hazard and climatic changes is still a challenging task, especially if multiple triggers and locally driven ground responses are present.
Regarding changes in LULC, our findings suggest that active LULC management and afforestation may have a beneficial effect on landslide occurrences (−0.5 pp in highly susceptible areas). Such effects have also been reported by other authors (Picarelli et al., 2017; Pisano et al., 2017; Gariano et al., 2018).
5.2 Uncertainties of a changing environment
The analysis of uncertainties in landslide risk management under environmental change is an important, yet often neglected, task (Reichenbach et al., 2018). In particular, the analysis of uncertainty cascades in integrated modelling is still an open research gap with great potential to understand and subsequently reduce uncertainty sources (Refsgaard et al., 2016; Kirchner et al., 2021).
In our analysis, we could successfully quantify uncertainty in landslide susceptibility predictions by accounting for parametric uncertainty in the landslide model and climate change uncertainty (within-event internal model variability and scenario uncertainty). However, we found the estimated uncertainties in predictions to be generally high, which is not unusual for an uncertainty cascade (Refsgaard et al., 2016). Furthermore, we discovered a tendency towards higher uncertainty with increased warming level for both parametric uncertainty and within-event internal climate model variability. Uncertainty from within-event internal climate model variability was much lower than parametric uncertainty (RIV;Lsl of around 0.25). Additionally, parametric uncertainty even exceeded scenario uncertainty for specific climate models (e.g. RCS;Lsl of 0.77 for MIROC in 4 K warming). Other authors have reported similar uncertainty components in the context of hydrological modelling under climate change (Bastola et al., 2011; Refsgaard et al., 2016).
In the following subsection the uncertainties in climate change modelling (Sect. 5.2.1) and landslide susceptibility modelling (Sect. 5.2.2) are further discussed.
5.2.1 Climate change uncertainty
In climate change modelling, there were different sources of uncertainty. We addressed uncertainties in climate sensitivity or global climate response uncertainty by conditioning the climate results on global warming levels, and thus we were capable of approximately removing this uncertainty (Chen et al., 2021; Maraun et al., 2022). Local climate response uncertainties were represented by the simulation of storylines. Furthermore, climate change projections are generally influenced by scenario uncertainty and internal variability (Stainforth et al., 2007). Scenario uncertainty was accounted for by considering landslide susceptibility conditional on different levels of global warming. Internal variability mainly arises from large-scale circulation (Shepherd, 2014), which was kept fixed and thus removed. Uncertainties related to the influence of within-event internal variability on local changes can effectively be removed (i.e. by averaging across the ensemble members; Maraun et al., 2022) but were explicitly addressed in this study by accounting for the delta change factor distribution estimated for all possible pairs of a climate model's simulation.
We discovered that in our case study, the climate signal of the hydrometeorological variables showed generally more and intensified precipitation and a drier soil in future storylines (in contrast to the NO-CC storylines), which was also reported for extreme rainfall events in other regions (Ciabatta et al., 2016; Rianna et al., 2017; Olefs et al., 2021). However, regarding the within-event internal climate model variability, contrasting delta change factors were identified mainly for NO-CC and PARIS storylines and especially for the variable 5 d rainfall. While for NO-CC the contrasting delta change factors showed that there is a low but non-zero probability that a similar event without climate change could be locally stronger than the actual event in the present climate, it means for the targeted 0.5 K warming limitation (Paris Agreement) that an event may unfold locally more weakly than under the present climate. Furthermore, the contrasting delta change factors of the GFDL climate model (in all storylines and for both meteorological variables) clearly indicate the importance of a careful selection of multiple, reliable climate models. The availability of multiple storylines ultimately avoids an under- or overestimation of the projected landslide activity (Gariano et al., 2017).
5.2.2 Landslide susceptibility model uncertainty
In a climate change context, uncertainties from a landslide model arise from model structure and parametric uncertainty under extrapolation (Maraun and Widmann, 2018). While parametric uncertainty results from the finite sample and the fact that the observed landslide distribution was a realisation of a stochastic process, structural uncertainty comprises the presence of physically plausible climatic predictor–response relationships for environmental change conditions (Maraun et al., 2022). Additionally, by calibrating the landslide model on two rainfall events (2009 and 2014, with different hydrometeorological conditions), we adjusted the model as far as possible for extrapolation purposes.
For the assessment of the parametric uncertainty, we simulated from the posterior distribution of coefficients using a Metropolis–Hastings sampler. For the most important predictor–response relationships, we identified simultaneous Bayesian credible intervals that were by far larger than the corresponding pointwise intervals at a 95 % credible level (±88 % to ±1831 %), which explained the generally high parametric uncertainty. Especially, the predictor–response relationship of 5 d rainfall appeared very uncertain (critical value of 37.8, Table A7 in Appendix A), while the simultaneous Bayesian credible intervals of the other hydrometeorological variables were only marginally wider than their pointwise counterparts. Furthermore, the top-coding of the variable at 80 mm additionally increased the parametric uncertainty (cf. critical value of 22.7 for GAM-SM, i.e. no top-coding of 5 d rainfall). Moreover, with the application of both higher and lower delta change factors in the higher warming levels, predictor values shifted towards the bounds of the training distribution, where data tend to be sparse and, therefore, uncertainty increases.
For the reduction in structural uncertainty, we applied a physically plausible statistical landslide model that allowed us to assess the landslide response in a changing climate by varying hydrometeorological predictors. Especially, the use of moisture-related predisposing factors is an important yet an often missed requirement in event-based landslide modelling (Bogaard and Greco, 2018). For the variable 5 d rainfall, we top-coded the value range at 80 mm to remove implausible fluctuations beyond that threshold (Maraun et al., 2022). A similar relationship of unchanged slope conditions with higher rainfall was also identified in Lee (2017) (described as a Weibull cumulative distribution function). For the soil moisture variable, we identified a linear predictor–response relationship showing higher landslide occurrence probability with higher soil moisture values. However, other authors reported a more complex soil moisture relationship due to the interplay with temperature (e.g. desiccation cracking; Tang et al., 2018; Debele et al., 2019) or soil texture (coarse-grained vs. fine-grained soil; Rianna et al., 2016), which affects geomechanical characteristics and thus slope stability. Besides, the soil moisture variable had only a moderate explanatory power (0.6 % mDD), although antecedent soil moisture conditions had likely contributed to the landslide event's severity (Hornich and Adelwöhrer, 2010). We suggest that the thematic and spatial resolution of the soil moisture estimated by HRLDAS (Schaffer, 2021; Maraun et al., 2022) was too coarse to capture the “true” soil moisture in the field and that additional, high-resolution soil physical parameters may have the potential to improve the modelled relationship (e.g, soil type, infiltration capacity, permeability, hydraulic conductivity).
Another source of structural uncertainty is the simplified representation of LULC as only four forest types (no, broadleaved, conifer, or mixed forest). According to Crozier (2010), the impact of human activity on slope stability is believed to be equal to or even higher than effects of climate change. Additionally, human disturbances did certainly contribute to causing some of the observed landslides (Hornich and Adelwöhrer, 2010). The Styrian state government projects an overall increase in the region's population until the year 2060 (by +2.5 %), while peripheral regions are expected to show a decrease (Amt der Steiermärkischen Landesregierung, 2020). Demographic and economic changes may alter the regional demand for land for urban development, affecting the landscape composition. However, since detailed information on landscape impacts due to human disturbance and socio-economic pathways was not available, we had to assume changes due to such anthropogenic factors to be constant throughout our analysis.
5.3 Model assessment
In this study, we successfully modified a GAM for landslide susceptibility analysis to explicitly account for spatial autocorrelation effects using a GP component (GAM-Spatial) – an often missed feature in landslide susceptibility modelling (Reichenbach et al., 2018). The spatial GP component explained a meaningful fraction of the deviance (6 % mDD), indicating that a spatial pattern remained unaccounted for by the other predictors in the model. Furthermore, the modified GAM showed similar predictor–response relationships and variable importance as well as an outstanding discrimination skill (mAUROC of 0.94) comparable to GAMs used in previous studies (Knevels et al., 2020; Maraun et al., 2022), confirming the general reliability of the landslide susceptibility model. Additionally, the time-varying modelling perspective on (conditional) landslide susceptibility as recommended by various authors (Gariano and Guzzetti, 2016; Reichenbach et al., 2018; Jones et al., 2021; Ozturk et al., 2021) allowed us to analyse the effects of LULC and climate change dynamics.
For the assessment of the uncertainties related to GAM-Spatial, we identified and applied optimal hyperparameters for a simple Metropolis–Hastings sampler (mgcv::gam.mh function in R) to stochastically simulate GAMs by approximating the posterior distribution of the coefficients, as this approach is recommended for logit link functions (Wood, 2015). However, the identified very large optimal hyperparameter value for t.df (i.e. 6050 degrees of freedom of the t distribution) indicated a nearly Gaussian approximation for the posterior distribution. Furthermore, regarding the similarity in the critical values for simultaneous intervals between the Metropolis–Hastings sampler and a simple Gaussian approximation (mgcv::rmvn function in R, Table A7 in Appendix A), the effort put into tuning and applying the Metropolis–Hastings sampler is worth reconsidering in future studies with similar settings.
5.4 Applicability
The presented methodological approaches are generally applicable to other regions. However, the established landslide susceptibility model was based on only two landslide-event inventories at the regional scale for a single study area. Thus, the projected uncertainties and effects of climate and LULC change on rainfall-induced landslide occurrences may be specific to the local geological and geomorphological setting. With a greater awareness of the need for a reliable landslide-event inventory and with additional landslides surveyed in the future, a more generalisable and less uncertain landslide model may be established.
As a practical application, the prediction of landslide susceptibility, its projections of change in area and magnitude with climate change, and its uncertainties may provide important tools for planners and decision-makers. With the chosen approach it is possible not only to consider susceptibility maps statically and retrospectively but also to project them into the future, which is an essential prerequisite for climate change adaptation in the context of slope stability. In the spatial context, recommendations for the construction of new settlement infrastructure may be derived based on a map, and zones of high landslide susceptibility along with uncertainty graphs (Fig. S7) can be communicated to local planners and environmental managers (cf. Petschko et al., 2014). In the engineering context, grey (e.g. engineering structure) or green (e.g. forest management) approaches may be considered a scenario, and their effectiveness for potential slope stabilisation on a regional scale may be assessed (cf. Debele et al., 2019). Such development scenarios also enable the analysis of the exposure of elements at risk, potential mitigation measurements, and sustainable adaptations plans.
In this study, we analysed uncertainties in storylines of high landslide susceptibility in a changing environment. We established a landslide model based on two large rainfall-triggered landslide events in the Styrian Basin (2009 and 2014), showing the direct link of hydrometeorological and LULC patterns to landslide occurrences while also accounting for residual spatial autocorrelation. We identified distinct signals of projected changes in highly susceptible areas depending on the storyline. In the worst case of 4 K warming, much heavier rain may cause an increase of 35 % in highly susceptible area with additionally 37 % higher chances of landslide occurrence (HadGEM), while much drier soils might even over-compensate for this effect, leading to more stable slopes (IPSL in 3 K warming, OR of 0.6 and −45 % in high-landslide-susceptibility area). Proactive land-use management (i.e. afforestation and climate-resilient forest conversion) has the potential to reduce the extent of highly susceptible areas. In the NO-CC scenario (i.e. pre-industrial, counterfactual climate), the high susceptibility was generally estimated to be lower (exception: GFDL).
The assessed landslide susceptibility uncertainty accounted for climate change and parametric landslide model uncertainty, and its uncertainty cascade was generally high. Even though for some climate models and hydrometeorological variables, within-event internal climate model variability showed opposed delta change factors (e.g. GFDL for 5 d rainfall in PARIS), their associated uncertainties in the landslide predictions were by far lower than uncertainties arising from the landslide model (ratio of around 0.25). Furthermore, parametric landslide model uncertainty was found to be of the same order as the climate scenario uncertainty in the higher warming level (+3 and +4 K). In particular, the most important predictor–response relationship, the 5 d rainfall, was identified to be the most uncertain not only for the landslide susceptibility model but also in the within-event internal climate model variability assessment. For studies focusing on the climate signal or forced change, within-event internal climate model variability can be accounted for by averaging across the ensemble members (Maraun et al., 2022).
The compound characteristic of the extreme weather event in the Styrian Basin in 2009 made an integrated modelling framework necessary. The assessment of future landslide occurrences and their associated uncertainties considering environmental change is a challenging task due to its complexity, its feedbacks, and the requirement to involve multiple disciplines and their associated methodological uncertainties. However, the analysis of compound events and their uncertainties is crucial to understanding and improving the underlying key processes and thus needed to support local decision-makers and spatial planners in risk assessment (Zscheischler et al., 2020; Kirchner et al., 2021). With a higher awareness of the local institutes for the creation of reliable landslide inventories and the support of high-resolution ground data, model uncertainties may be reduced.
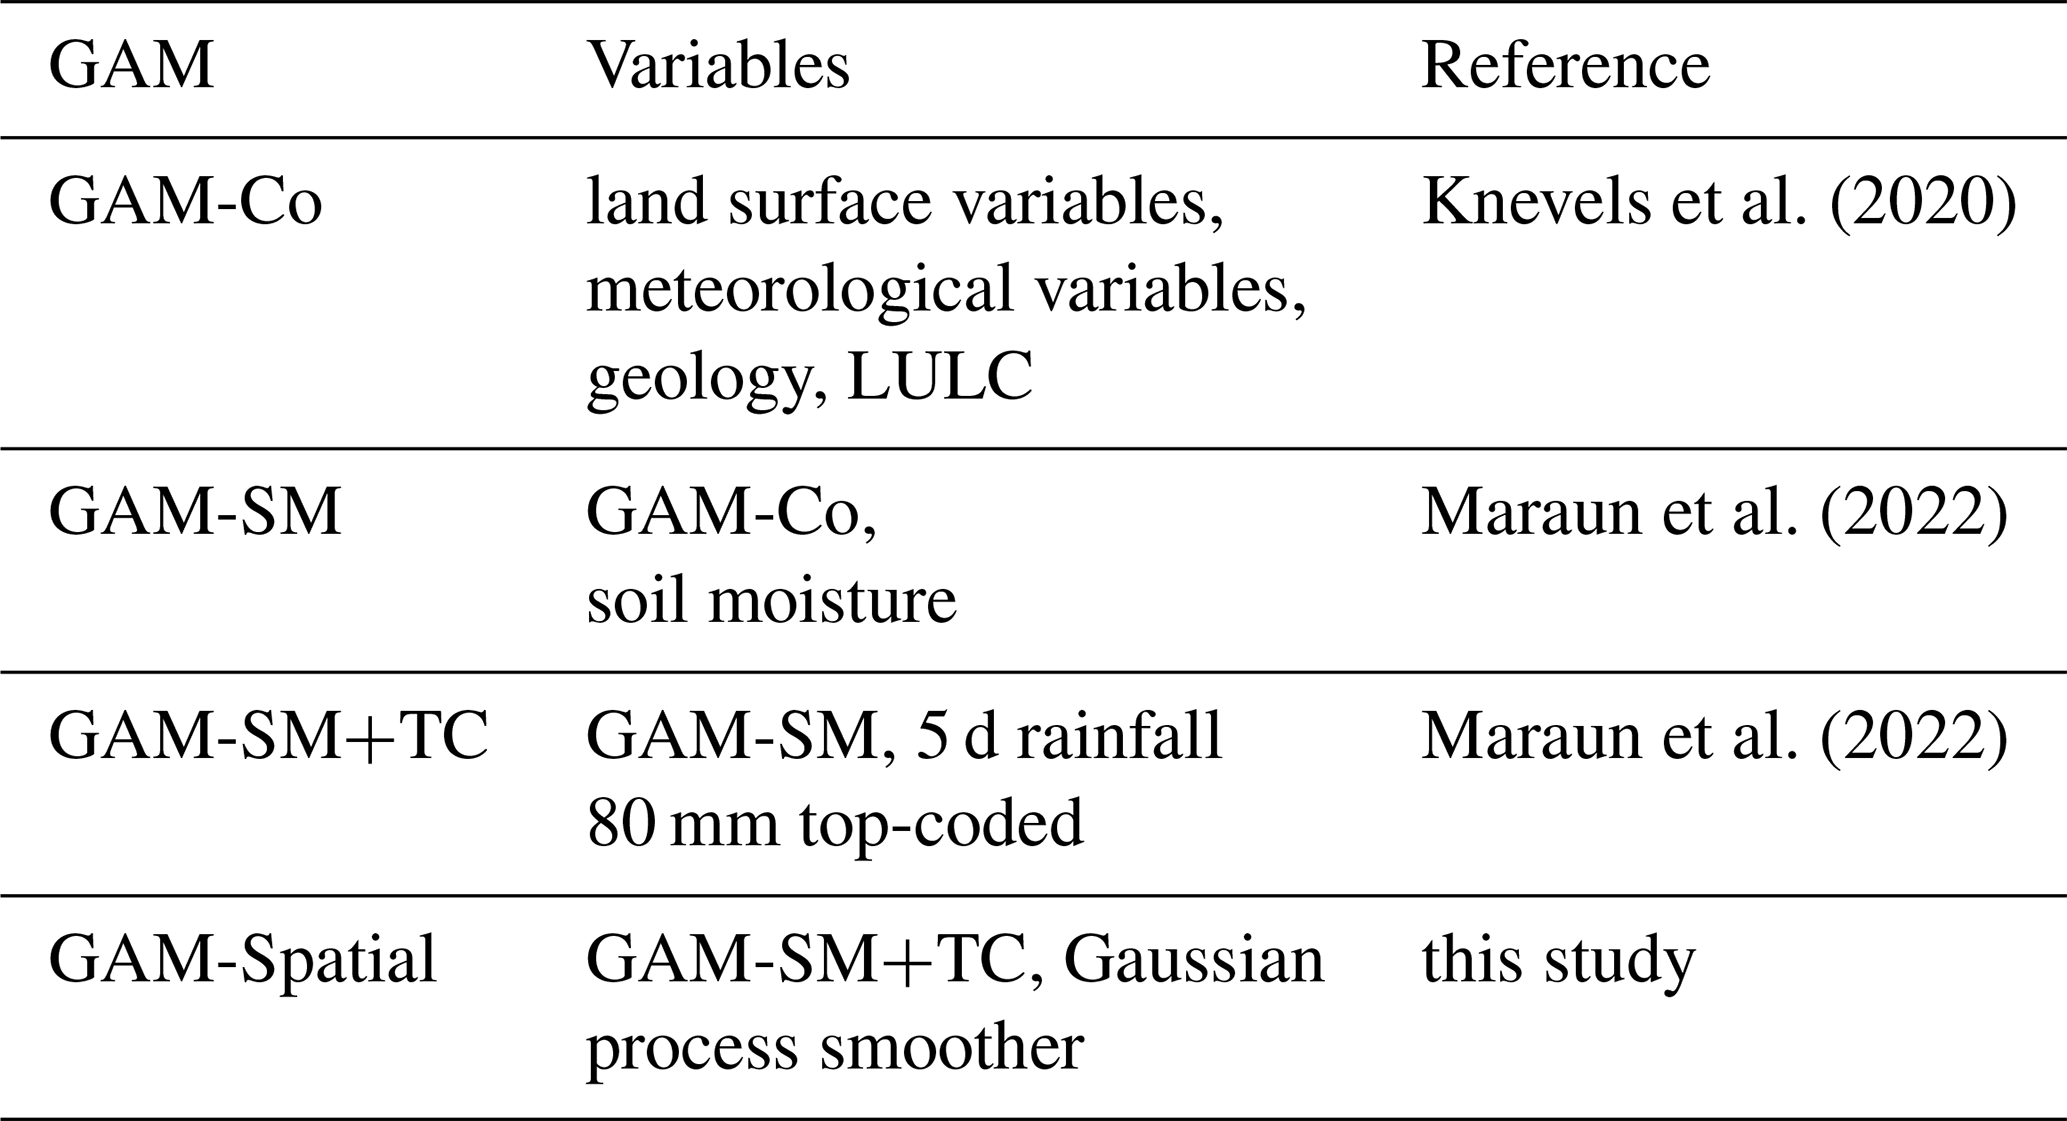
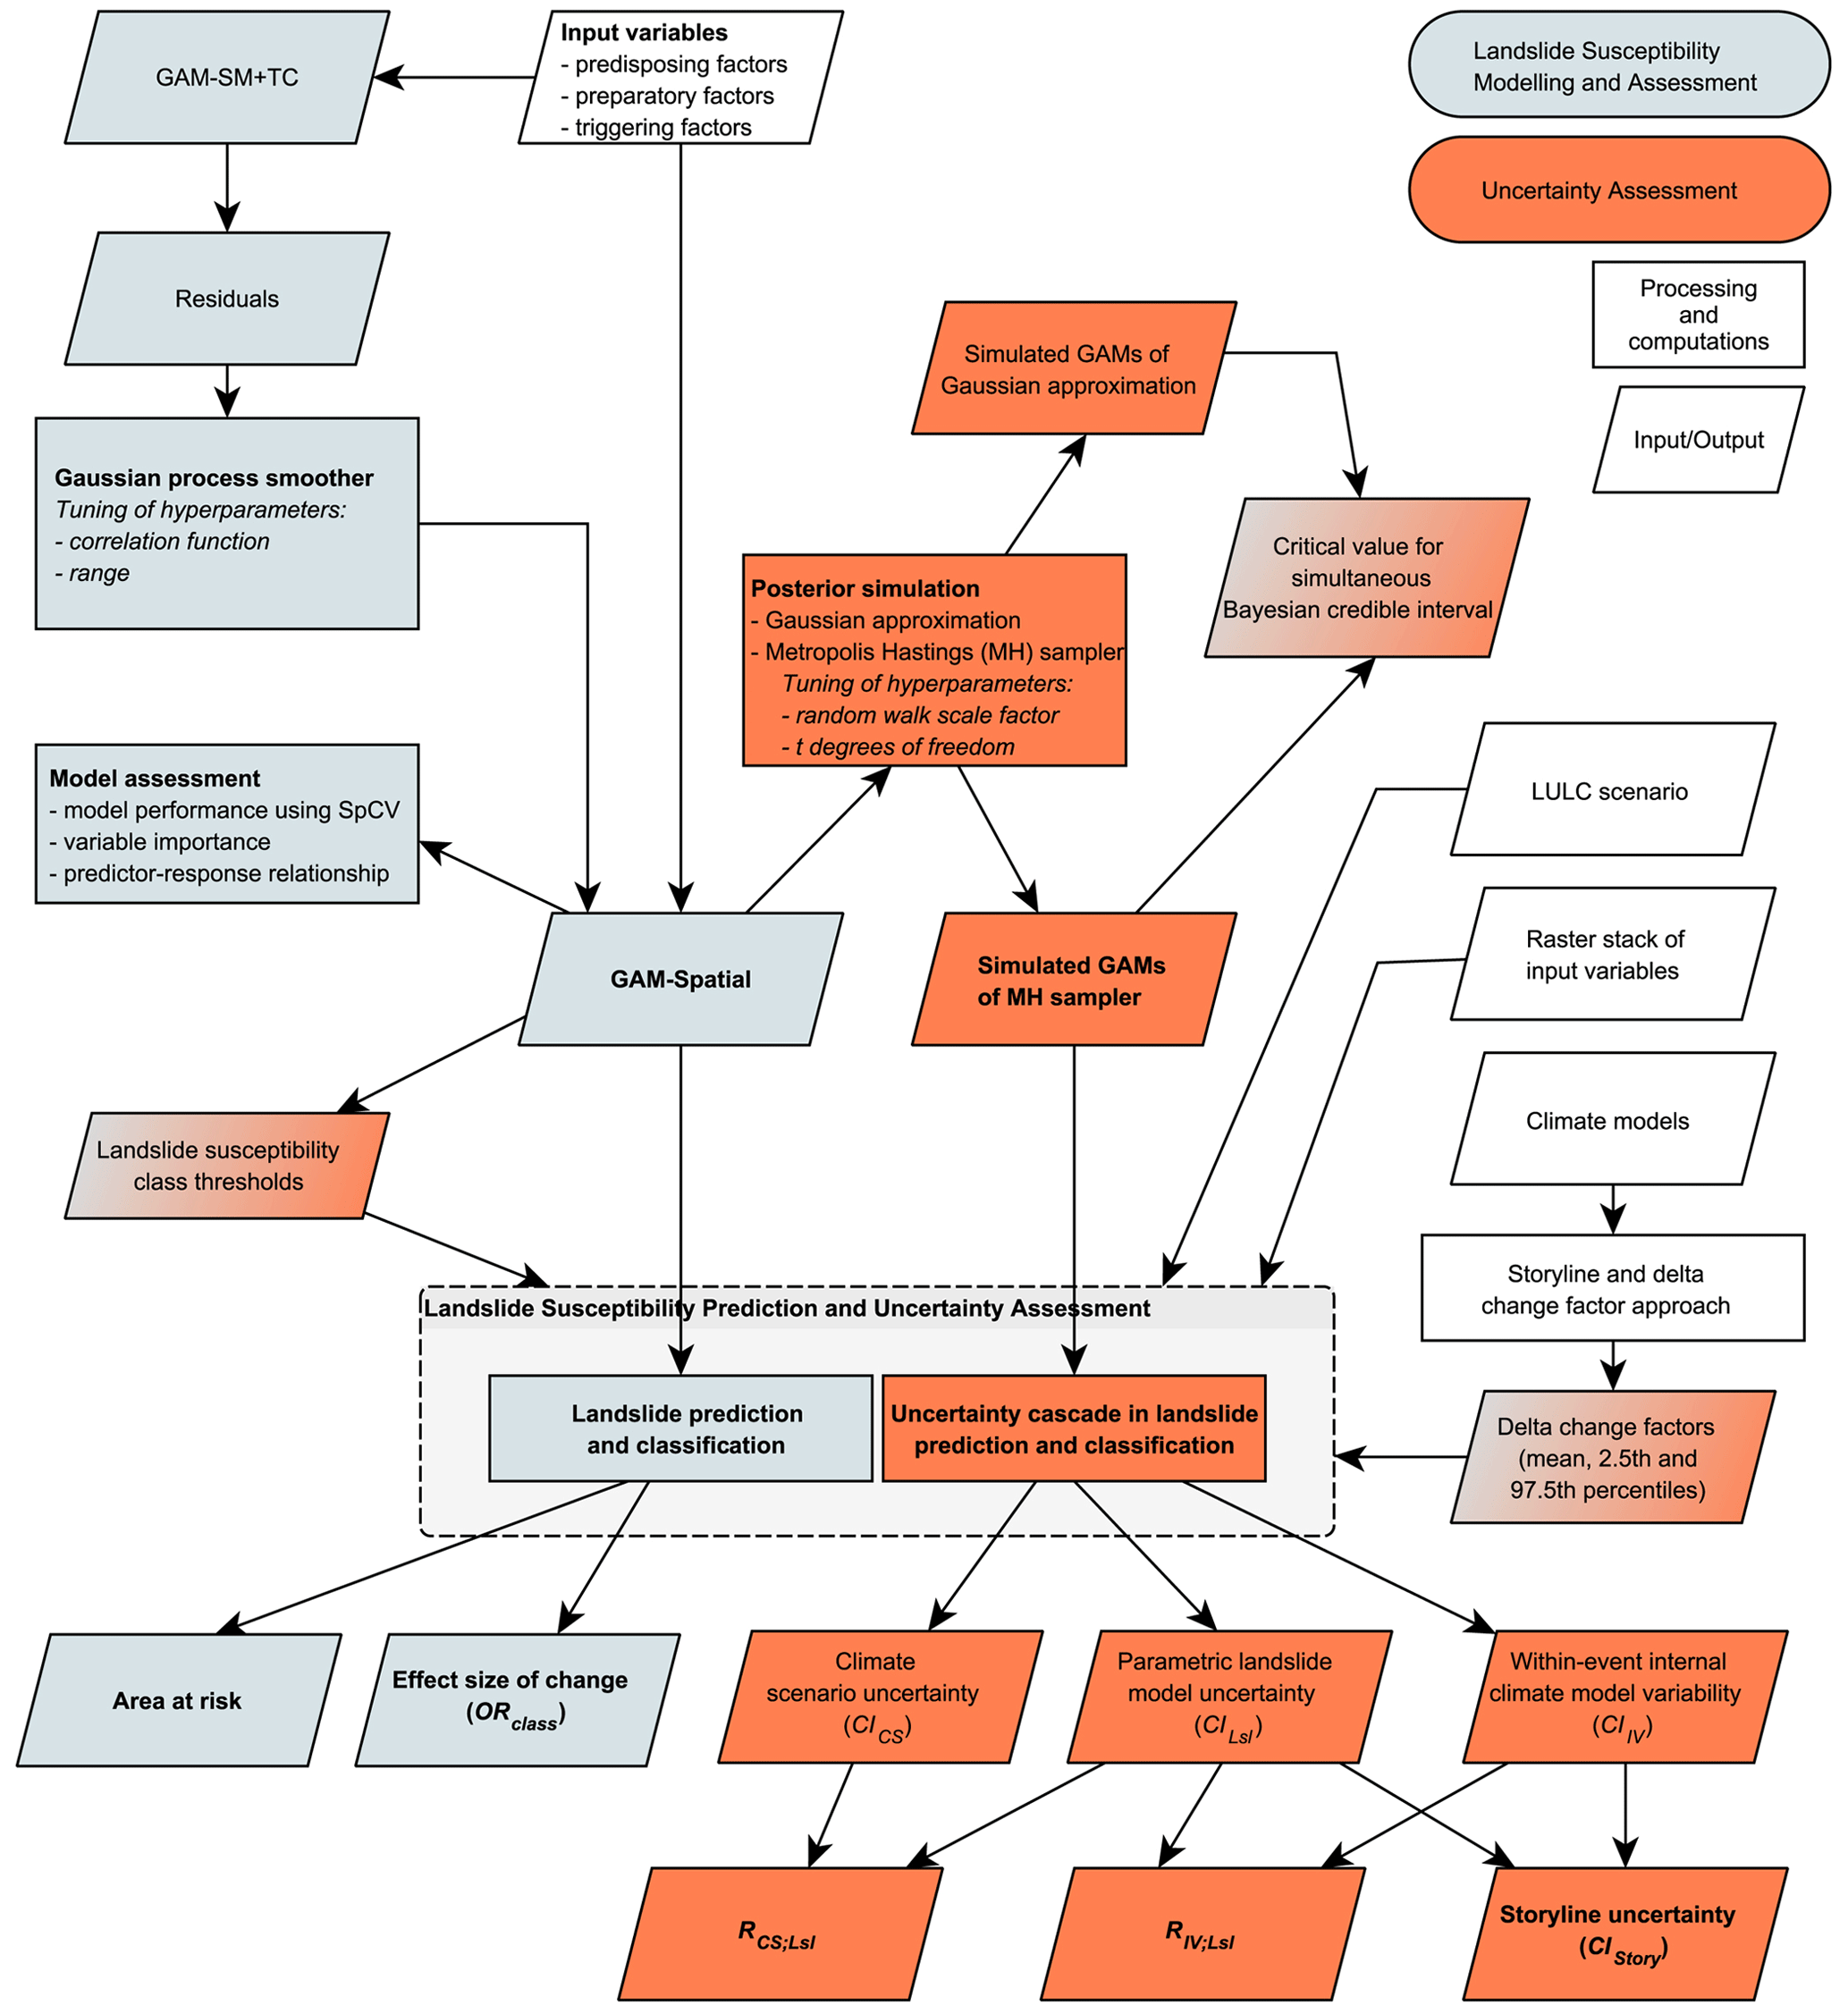
Figure A1Overview of the proposed landslide susceptibility prediction and uncertainty assessment.
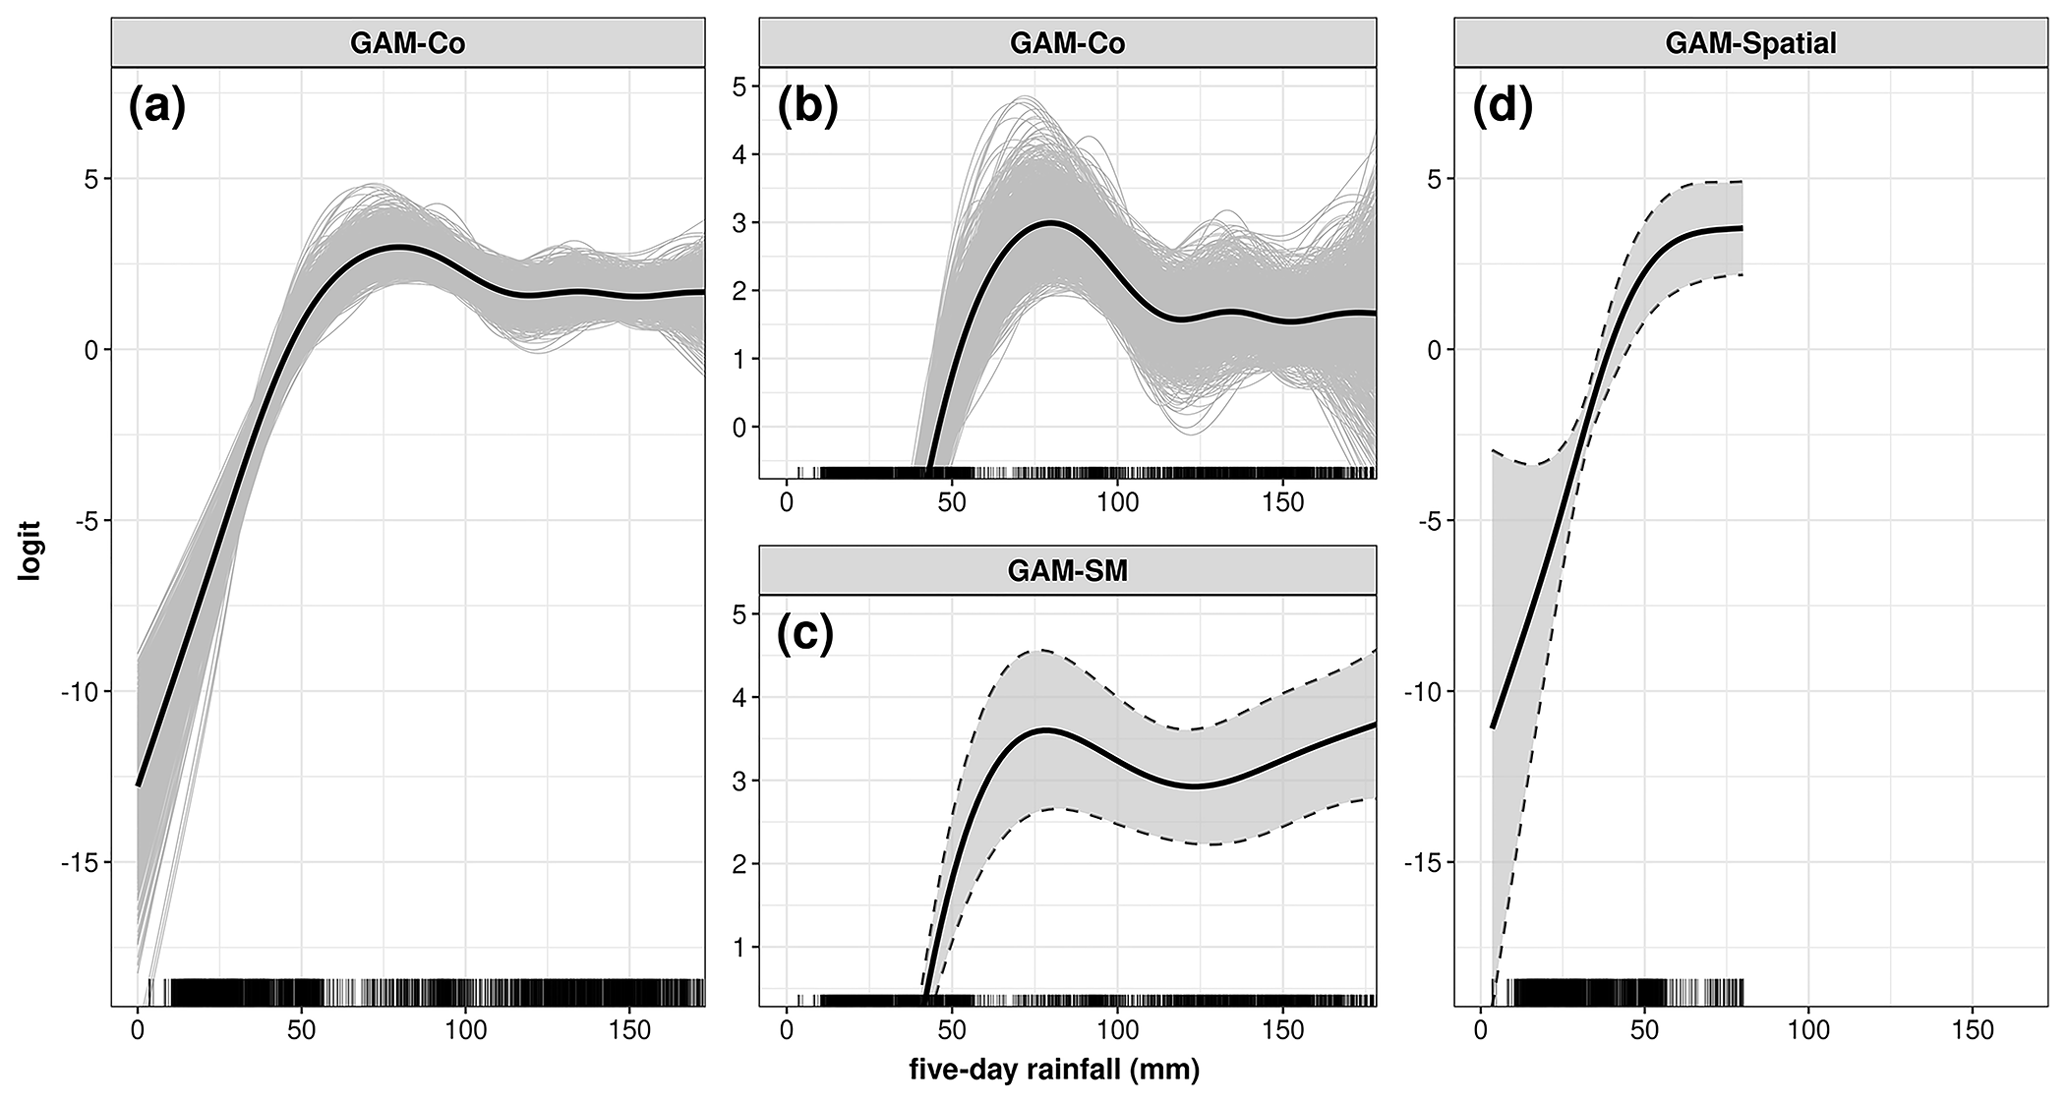
Figure A2Response–predictor relationships of 5 d rainfall. (a) GAM-Co from Knevels et al. (2020) and (b) enlarged. (c) GAM-SM from Maraun et al. (2022) (enlarged). (d) GAM-Spatial from this study. Note that 95 % pointwise Bayesian credible intervals are plotted for panels (c) and (d).
Table A2Hydrometeorological storylines for the projected future climate.
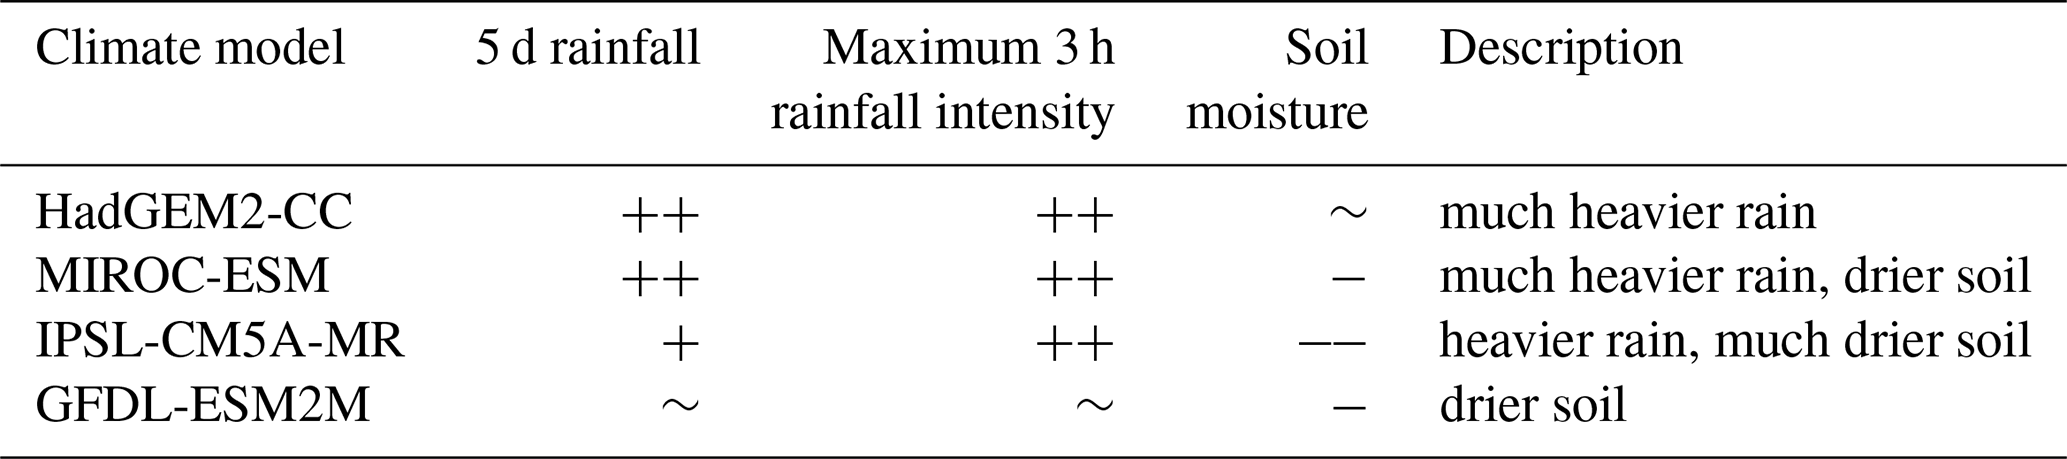
Strong increase. + Increase. ∼ No change. − Decrease. Strong decrease. Adopted from Maraun et al. (2022).
Table A3Delta change factors of hydrometeorological variables.
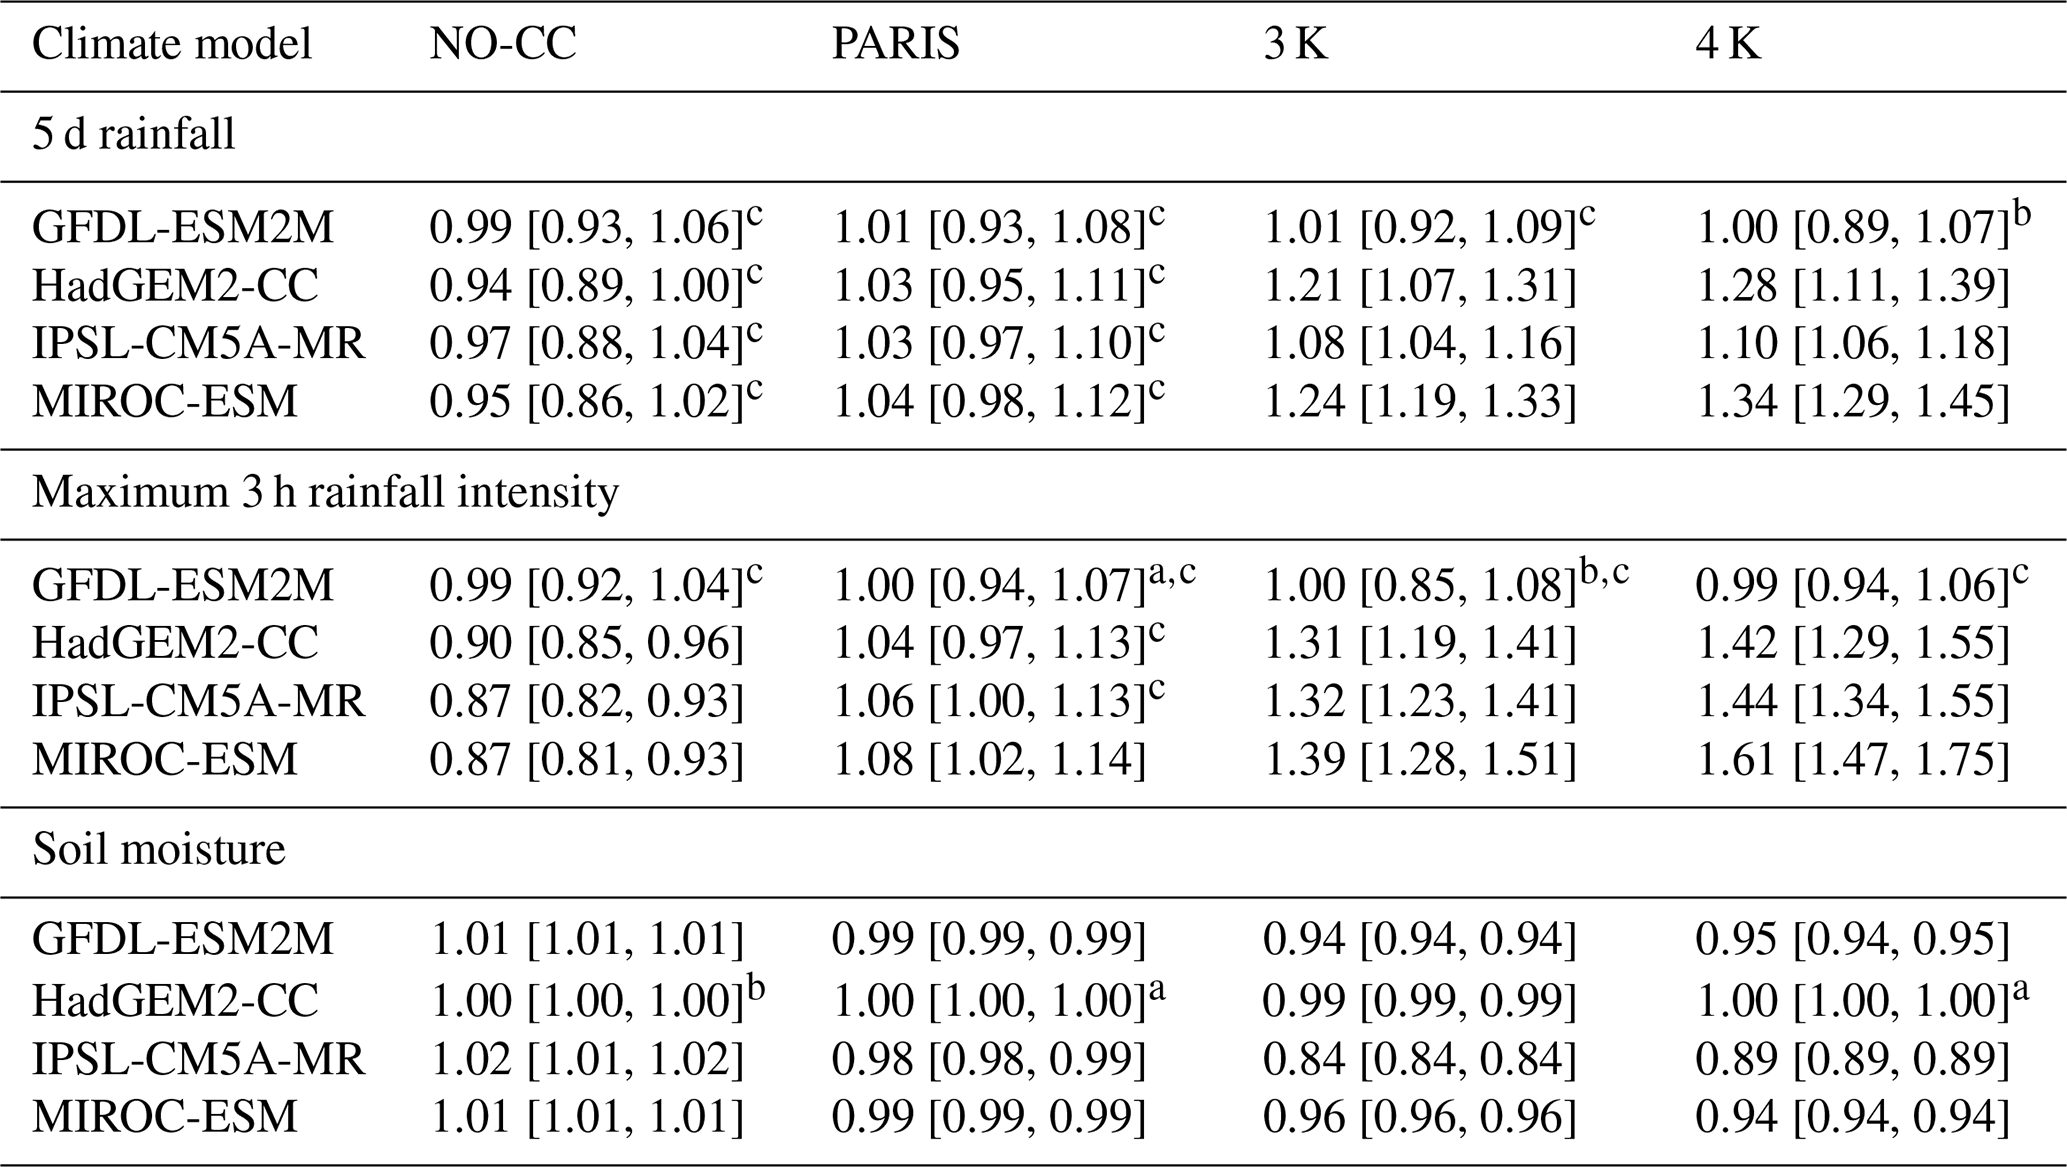
a Mean greater than 1. b Mean lower than 1. c The 2.5th or 97.5th percentile showed contrasting delta change factors.
Table A4Effective ranges of correlation functions.
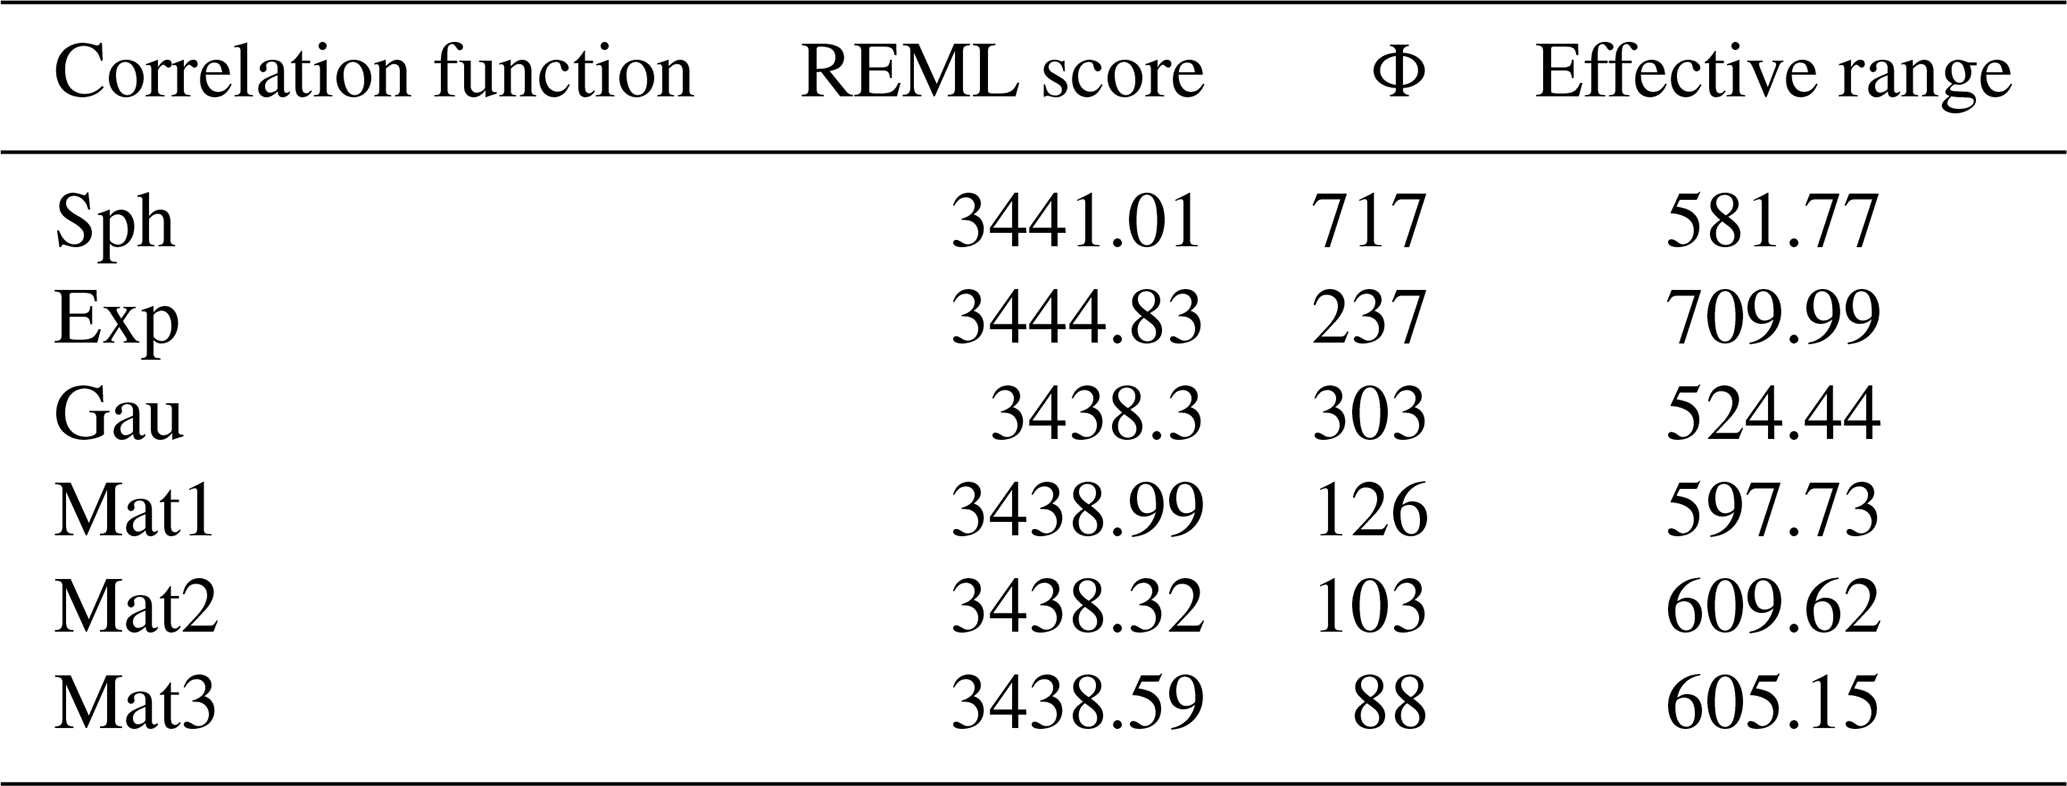
Effective range was estimated using the
R function StempCens::EffectiveRange for a correlation ≤0.05.
Table A5Performance assessment (folds-based).

Statistics: median (), mean (), range (Range), minimum (Min), maximum (Max), interquartile range (IQR).
Table A6Variable importance.
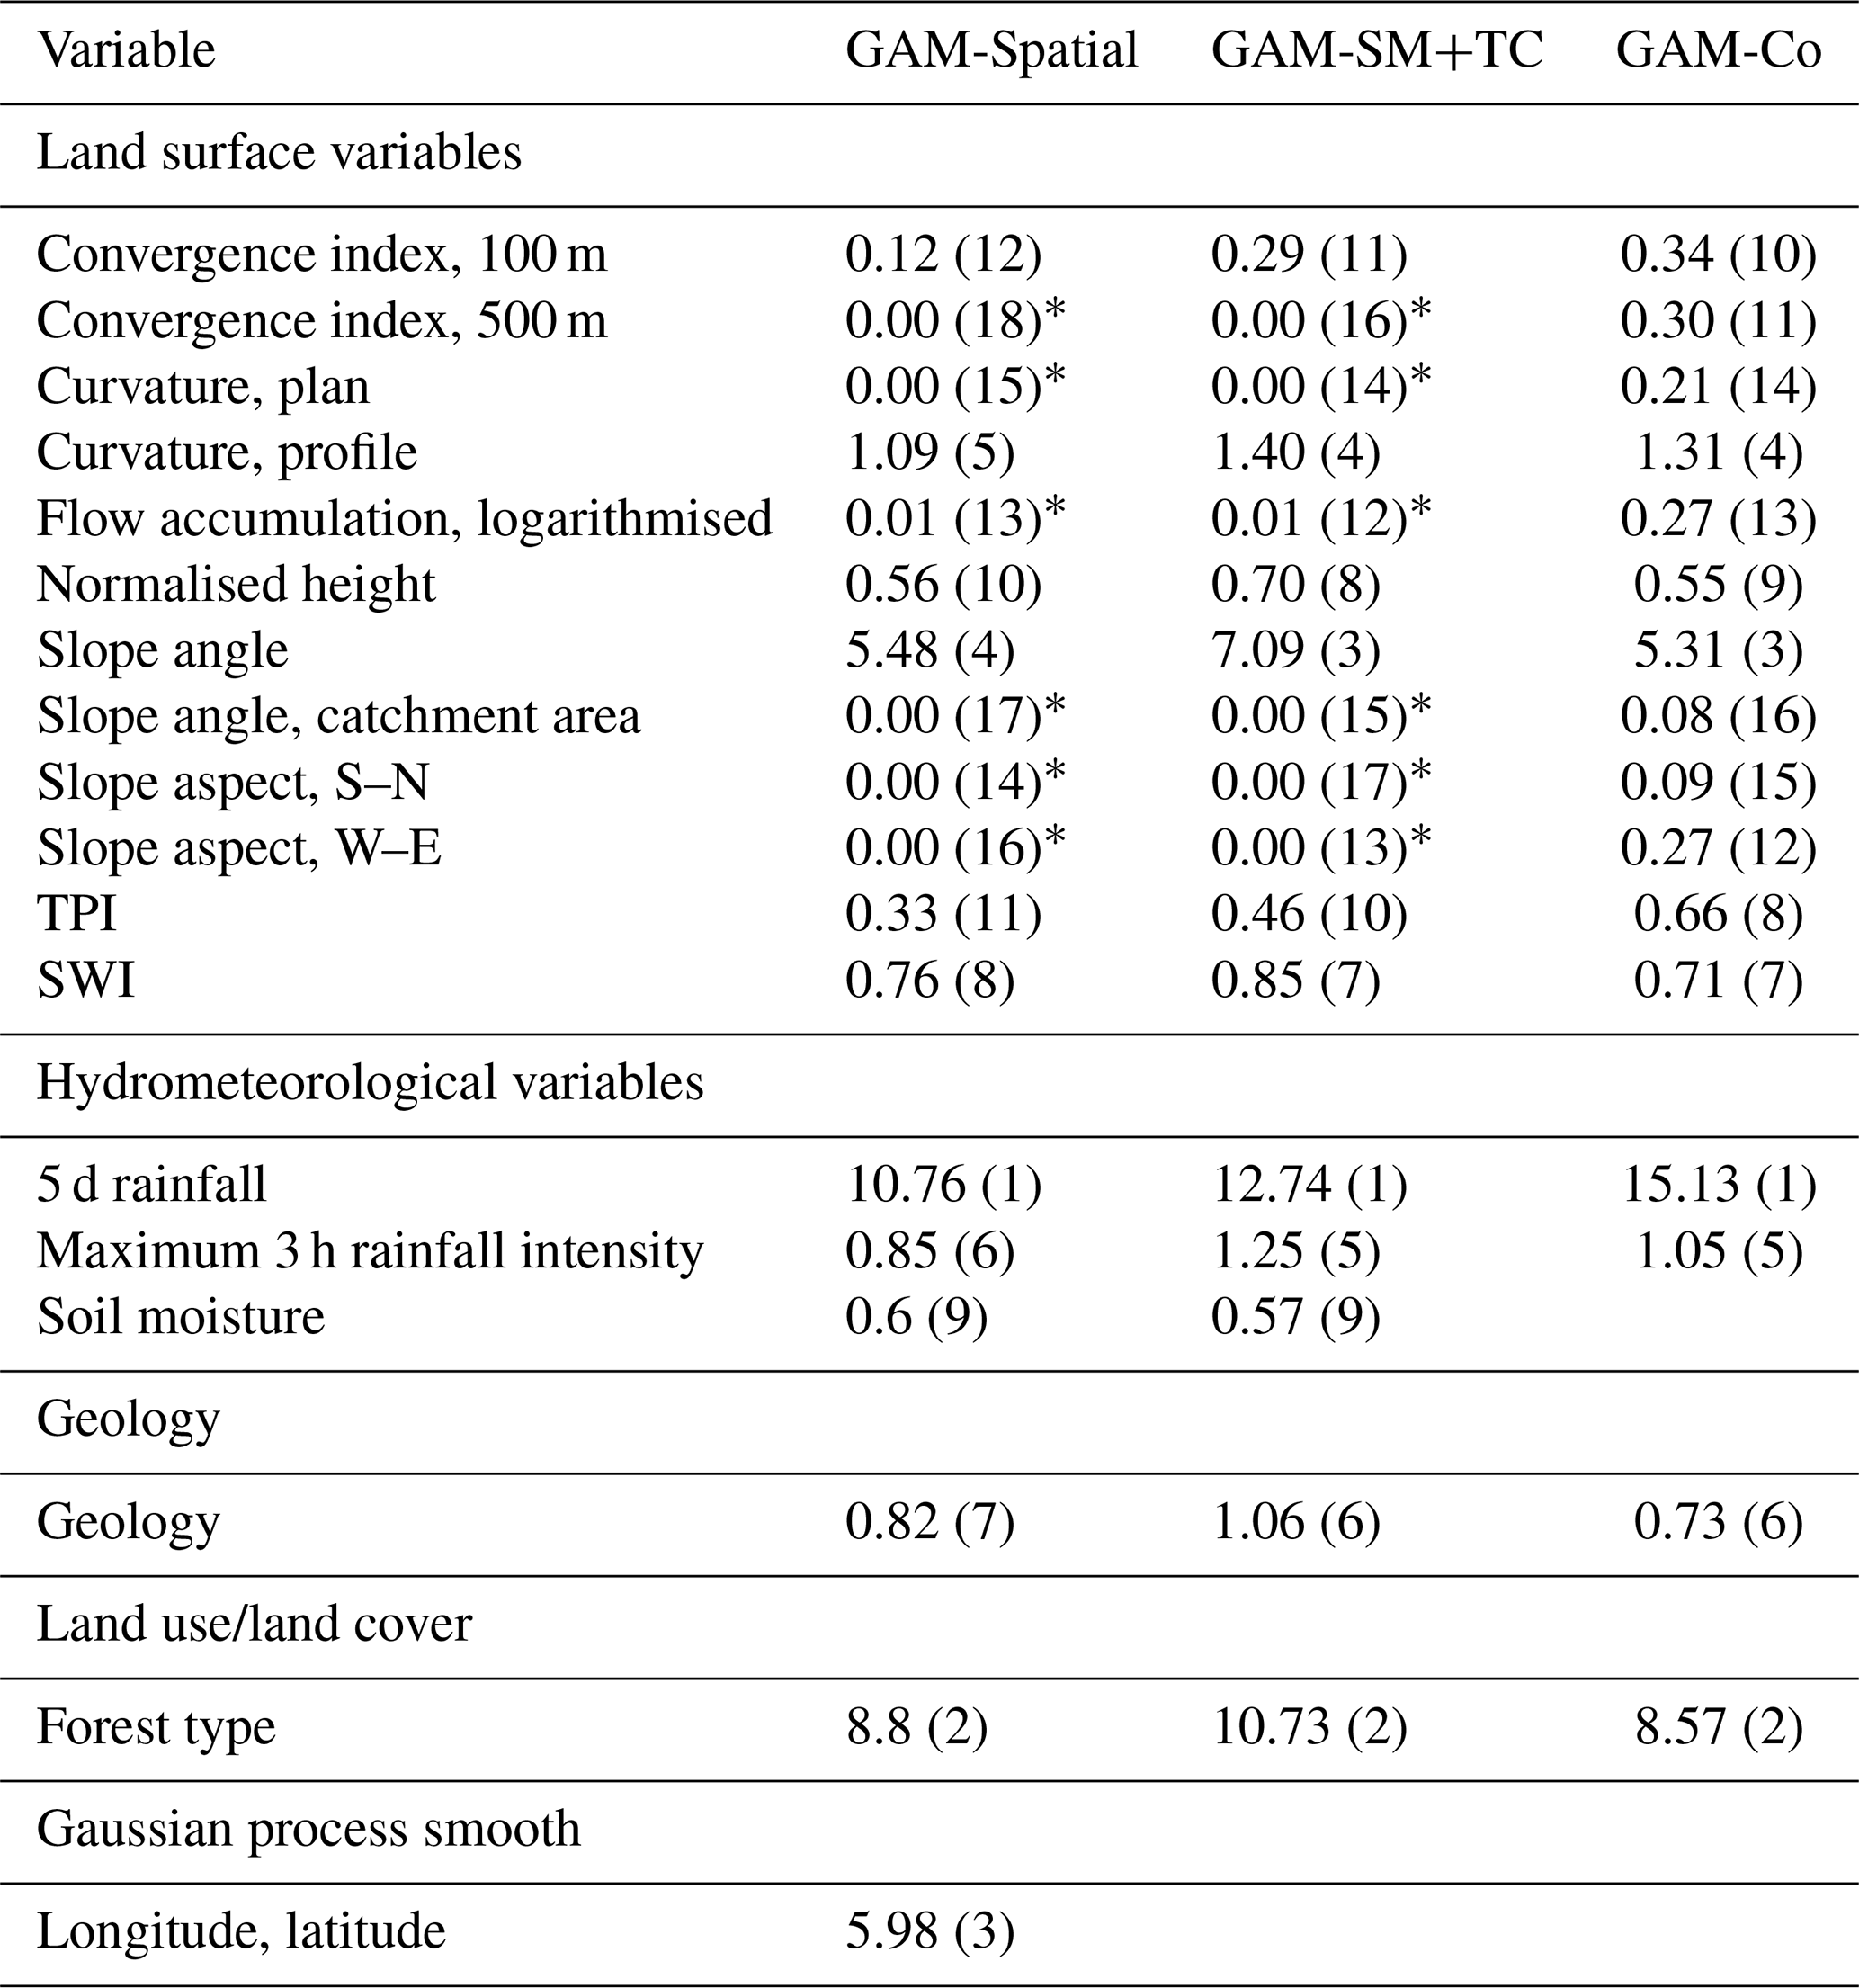
Variable importance measured in mean decrease in deviance explained (%), rank of variable in parentheses. Note that estimates for GAM-Co were based on SpCV models in Knevels et al. (2020). * Model term was shrunk to zero.
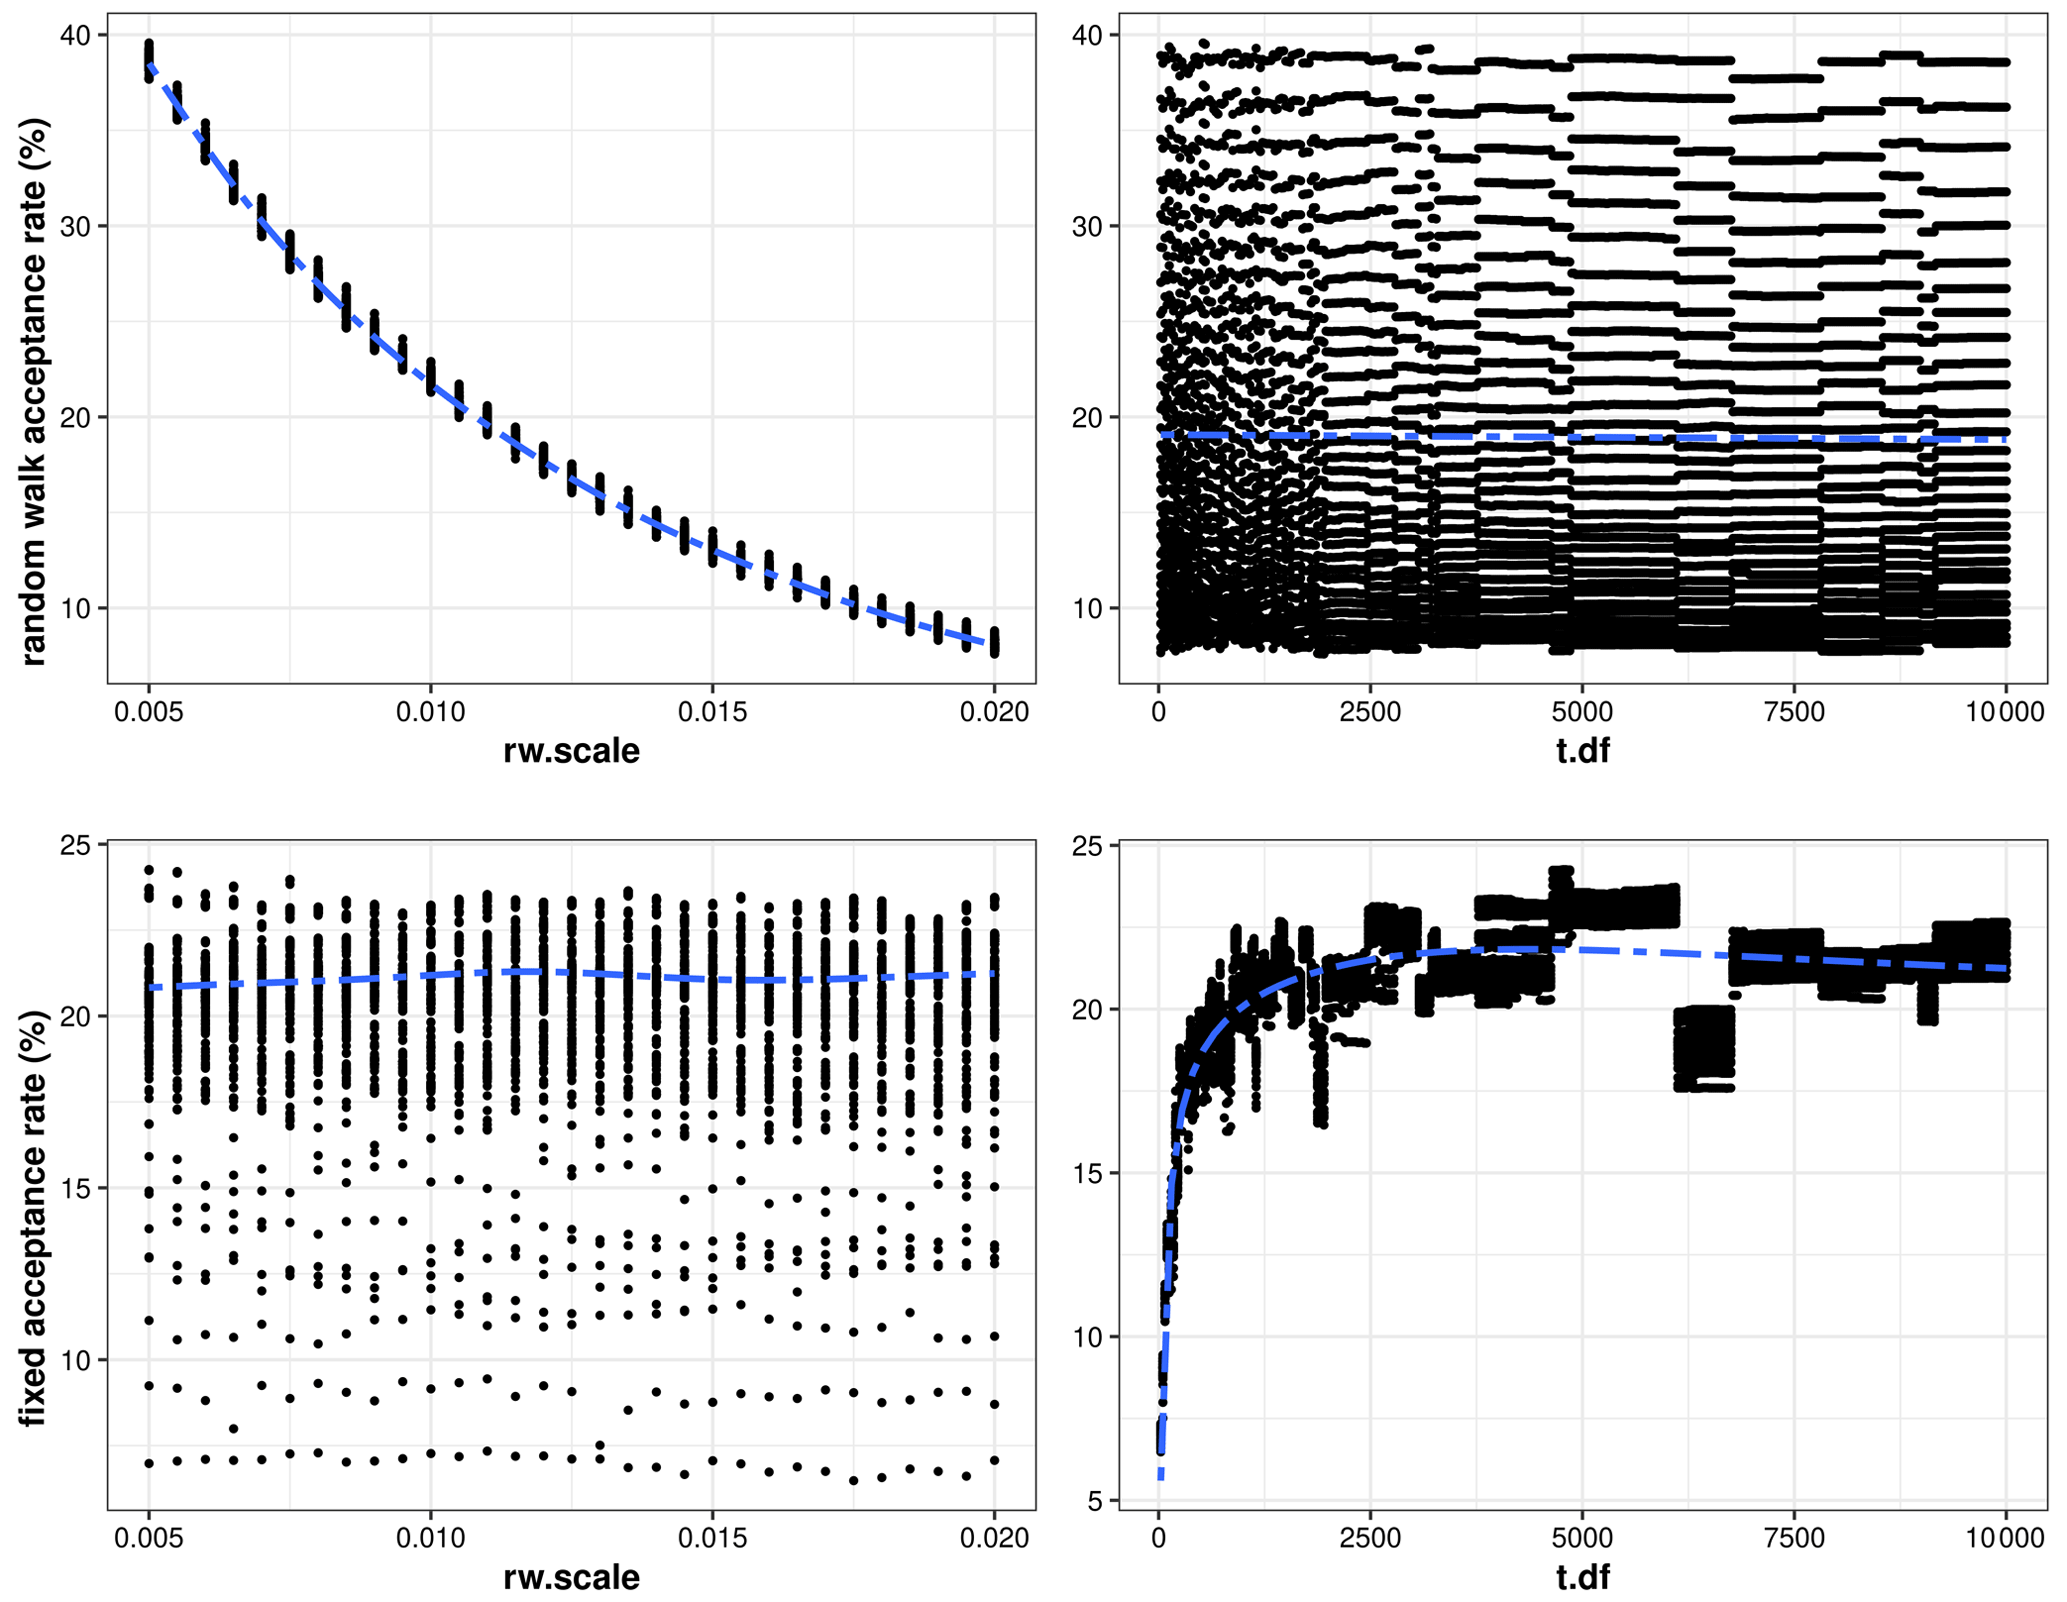
Figure A3Relationship of mgcv::gam.mh's hyperparameter values to acceptance rates. Dashed blue line: smooth function.
Table A7Critical values for simultaneous credible intervals of non-parametric transformation functions at the 95 % credible level.
Critical values are estimated at the 95 % credible level;
mgcv::gam.mh: simple posterior simulation with gam fits; mgcv::rmvn: generate from or evaluate multivariate normal or t densities. Note that the default coverage factor is 1.96 for the 95 % credible level.
Parentheses show the ratio to the default.
* Model term was shrunk to zero. GAM-SM: GAM-Co including soil moisture
but no top-coded 5 d rainfall.
Table A8Uncertainty in predicted highly landslide susceptible area.
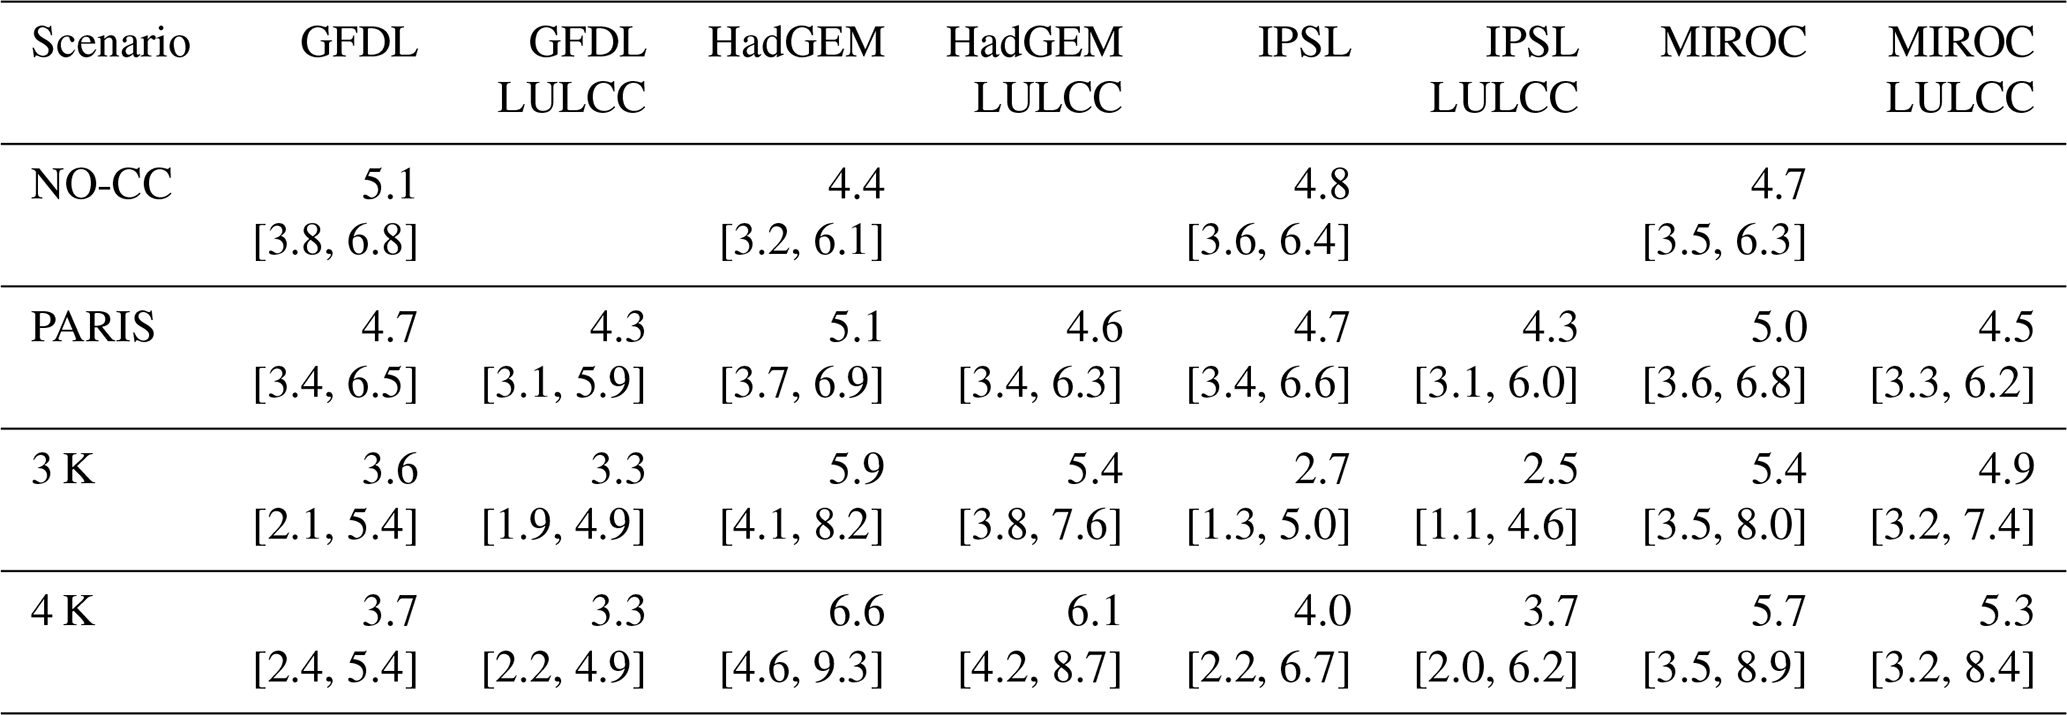
Note that the area is relative to the total study area. The 95 % CIs are based on within-event internal climate model variability and parametric landslide model uncertainty (i.e. CIStory). For results for low, medium, and high landslide susceptibility, please refer to Table S1.
Table A9Odds ratios of landslide occurrences of the high-susceptibility class relative to present-day high landslide susceptibility.
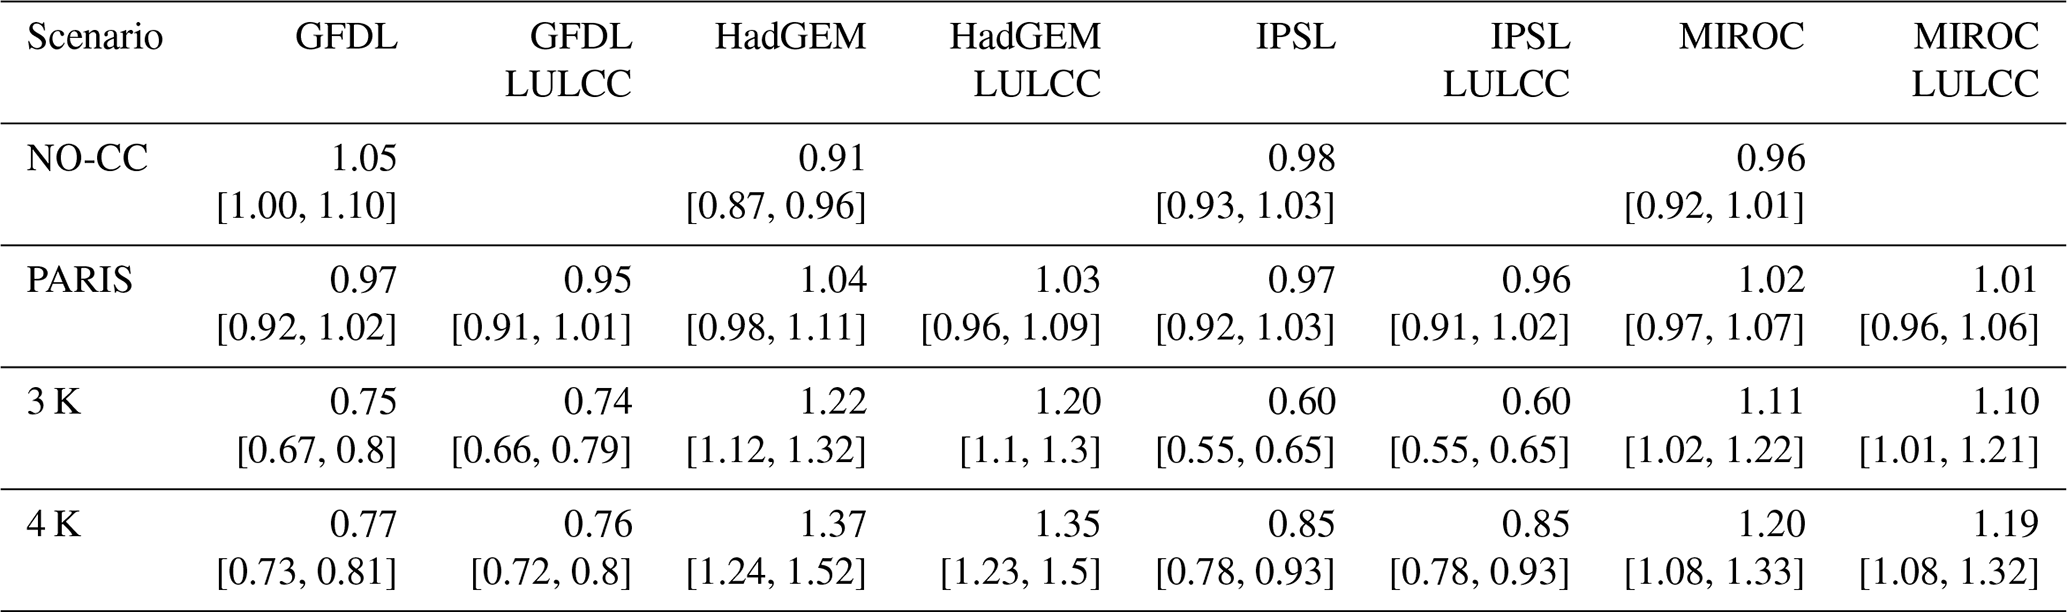
Note that 95 % CIs are based on within-event internal climate model variability (i.e. CIIV). For results for low, medium, and high landslide susceptibility, please refer to Table S2.
Table A10Ratio of uncertainty sources in predicted high landslide susceptibility.
The calibrated landslide susceptibility models can be accessed from https://doi.org/10.5281/zenodo.6365228 (Knevels et al., 2022). Landslide data can be requested from the state of Styria (raimund.adelwoehrer@stmk.gv.at), the Geological Survey (GBA, arben.kociu@geolba.ac.at), and the Institute of Military Geoinformation (IMG, helene.kautz@bmlv.gv.at). Rainfall data from the Integrated Nowcasting through Comprehensive Analysis (INCA) system are available from the Central Institute for Meteorology and Geodynamics (https://data.hub.zamg.ac.at, last access: 20 May 2022; Haiden et al., 2010). Climate model data for the IFS (Integrated Forecasting System) boundary conditions for the CCLM RCM can be obtained from ECMWF (https://www.ecmwf.int/en/forecasts/datasets (cycle35r2), last access: 20 May 2022; Bechtold et al., 2008); ERA5 and ERA-Interim reanalysis data from ECMWF are available from https://www.ecmwf.int/en/forecasts/datasets/browse-reanalysis-datasets (last access: 20 May 2022; Hersbach et al., 2020; Dee et al., 2011), and data from the chosen CMIP5 GCM simulations can be downloaded from the Climate and Environmental Retrieval and Archive (CERA) Database (https://cera-www.dkrz.de/WDCC/ui/cerasearch, last access: 20 May 2022; Taylor et al., 2009).
The supplement related to this article is available online at: https://doi.org/10.5194/nhess-23-205-2023-supplement.
Conceptualisation was by RK and AB; data curation was by RK, HPr, DM, and AM; formal analysis was by RK; methodology was by RK and AB; supervision was by HPe and AB; writing – original draft was by RK; writing – review and editing was by RK, AB, PL, DM, AM, HPr, and HPe. All authors have read and agreed to the published version of the paper.
The contact author has declared that none of the authors has any competing interests.
Publisher’s note: Copernicus Publications remains neutral with regard to jurisdictional claims in published maps and institutional affiliations.
This research was conducted within the Eastern Alpine Slope Instabilities under Climate Change (EASICLIM) project. We are grateful to Filippo Catani and the anonymous reviewers for their valuable comments.
This research has been supported by the Klima- und Energiefonds (grant no. KR16AC0K13160). The contribution of Aditya N. Mishra was also financially supported by the Austrian Science Fund DK Climate Change (FWF, grant no. W1256).
This paper was edited by Filippo Catani and reviewed by two anonymous referees.
Amt der Steiermärkischen Landesregierung: Regionale Bevölkerungsprognose, Steiermark – Bundesland, Bezirke und Gemeindegruppen, Steirische Statistiken, Heft 3, Abteilung 17 Landes- und Regionalentwicklung, Referat Statistik und Geoinformation, Graz, Austria, https://www.landesentwicklung.steiermark.at/cms/dokumente/12658765_141979497/b6924e0e/Heft%203-2020%20Bev%C3%B6lkerungsprognose%20aktuell.pdf, (last access: 20 May 2022), 2020. a
Bastola, S., Murphy, C., and Sweeney, J.: The role of hydrological modelling uncertainties in climate change impact assessments of Irish river catchments, Adv. Water Resour., 34, 562–576, https://doi.org/10.1016/j.advwatres.2011.01.008, 2011. a, b
Bechtold, P., Köhler, M., Jung, T., Doblas-Reyes, F., Leutbecher, M., Rodwell, M. J., Vitart, F., and Balsamo, G.: Advances in simulating atmospheric variability with the ECMWF model: From synoptic to decadal time-scales, Q. J. Roy. Meteorol. Soc., 134, 1337–1351, https://doi.org/10.1002/qj.289, 2008 (data available at: https://www.ecmwf.int/en/forecasts/datasets, last access: 20 May 2022). a, b
BFW: Interim evaluation of the Austrian Forest Inventory 2016/18 – Styria [Zwischenauswertung der ÖWI 2016/18 – Steiermark], Tech. rep., Austrian Reseach Centre for Forests, Vienna, Austria, https://www.bfw.gv.at/wp-content/uploads/Steiermark_OEWI_16_18.pdf (last access: 20 May 2022), 2019. a
Bogaard, T. and Greco, R.: Invited perspectives: Hydrological perspectives on precipitation intensity-duration thresholds for landslide initiation: proposing hydro-meteorological thresholds, Nat. Hazards Earth Syst. Sci., 18, 31–39, https://doi.org/10.5194/nhess-18-31-2018, 2018. a
Brenning, A., Schwinn, M., Ruiz-Páez, A. P., and Muenchow, J.: Landslide susceptibility near highways is increased by 1 order of magnitude in the Andes of southern Ecuador, Loja province, Nat. Hazards Earth Syst. Sci., 15, 45–57, https://doi.org/10.5194/nhess-15-45-2015, 2015. a
Brock, J., Schratz, P., Petschko, H., Muenchow, J., Micu, M., and Brenning, A.: The Performance of Landslide Susceptibility Models Critically Depends on the Quality of Digital Elevations Models, Geomat. Nat. Haz. Risk, 11, 1075–1092, https://doi.org/10.1080/19475705.2020.1776403, 2020. a
Chen, D., Rojas, M., Samset, B. H., Cobb, K., Diongue-Niang, A., Edwards, P., Emori, S., Faria, S. H., Hawkins, E., Hope, P., Huybrechts, P., Meinshausen, M., Mustafa, S. K., Plattner, G.-K., and Tréguier, A. M.: Framing, context, and methods, in: Climate Change 2021: The Physical Science Basis, Contribution of Working Group I to the Sixth Assessment Report of the Intergovernmental Panel on Climate Change, edited by: Masson-Delmotte, V., Zhai, P., Pirani, A., Connors, S. L., Péan, C., Berger, S., Caud, N., Chen, Y., Goldfarb, L., Gomis, M. I., Huang, M., Leitzell, K., Lonnoy, E., Matthews, J. B. R., Maycock, T. K., Waterfield, T., Yelekçi, Ö., Yu, R., and Zhou, B., Cambridge University Press, https://www.ipcc.ch/report/ar6/wg1/downloads/report/IPCC_AR6_WGI_Chapter01.pdf (last access: 20 May 2022), 2021. a
Chen, F., Manning, K. W., LeMone, M. A., Trier, S. B., Alfieri, J. G., Roberts, R., Tewari, M., Niyogi, D., Horst, T. W., Oncley, S. P., Basara, J. B., and Blanken, P. D.: Description and Evaluation of the Characteristics of the NCAR High-Resolution Land Data Assimilation System, J. Appl. Meteorol. Clim., 46, 694–713, https://doi.org/10.1175/JAM2463.1, 2007. a
Ciabatta, L., Camici, S., Brocca, L., Ponziani, F., Stelluti, M., Berni, N., and Moramarco, T.: Assessing the impact of climate-change scenarios on landslide occurrence in Umbria Region, Italy, J. Hydrol., 541, 285–295, https://doi.org/10.1016/j.jhydrol.2016.02.007, 2016. a, b, c, d, e
Crozier, M. J.: Deciphering the effect of climate change on landslide activity: A review, Geomorphology, 124, 260–267, https://doi.org/10.1016/j.geomorph.2010.04.009, 2010. a
Cruden, D. M. and Varnes, D. J.: Landslide Types and Processes, in: Landslides investigation and mitigation, edited by: Turner, A. and Schuster, R., Transportation research board, Special Report 247, 36–75, 1996. a
Debele, S. E., Kumar, P., Sahani, J., Marti-Cardona, B., Mickovski, S. B., Leo, L. S., Porcù, F., Bertini, F., Montesi, D., Vojinovic, Z., and Di Sabatino, S.: Nature-based solutions for hydro-meteorological hazards: Revised concepts, classification schemes and databases, Environ. Res., 179, 108799, https://doi.org/10.1016/j.envres.2019.108799, 2019. a, b
Dee, D. P., Uppala, S. M., Simmons, A. J., Berrisford, P., Poli, P., Kobayashi, S., Andrae, U., Balmaseda, M. A., Balsamo, G., Bauer, P., Bechtold, P., Beljaars, A. C. M., van de Berg, L., Bidlot, J., Bormann, N., Delsol, C., Dragani, R., Fuentes, M., Geer, A. J., Haimberger, L., Healy, S. B., Hersbach, H., Hólm, E. V., Isaksen, L., Kållberg, P., Köhler, M., Matricardi, M., McNally, A. P., Monge-Sanz, B. M., Morcrette, J.-J., Park, B.-K., Peubey, C., de Rosnay, P., Tavolato, C., Thépaut, J.-N., and Vitart, F.: The ERA-Interim Reanalysis: Configuration and Performance of the Data Assimilation System, Q. J. Roy. Meteor. Soc., 137, 553–597, https://doi.org/10.1002/qj.828, 2011. a
Doblas-Reyes, F. J., Sörensson, A. A., Almazroui, M., Dosio, A., Gutowski, W. J., Haarsma, R., Hamdi, R., Hewitson, B., Kwon, W.-T., Lamptey, B. L., Maraun, D., Stephenson, T. S., Takayabu, I., Terray, L., Turner, A., and Zuo, Z.: Linking global to regional climate change, in: Climate Change 2021: The Physical Science Basis. Contribution of Working Group I to the Sixth Assessment Report of the Intergovernmental Panel on Climate Change, edited by Masson-Delmotte, V., Zhai, P., Pirani, A., Connors, S. L., Péan, C., Berger, S., Caud, N., Chen, Y., Goldfarb, L., Gomis, M. I., Huang, M., Leitzell, K., Lonnoy, E., Matthews, J. B. R., Maycock, T. K., Waterfield, T., Yelekçi, Ö., Yu, R., and Zhou, B., Cambridge University Press, 2021. a, b
EPA, U.: Guidelines for Human Exposure Assessment, EPA/100/B-19/001, Risk Assessment Forum, U.S. Environmental Protection Agency, Washington, DC, USA, https://ofmpub.epa.gov/eims/eimscomm.getfile?p_download_id=429103 (last access: 20 May 2022), 2019. a
Fahrmeir, L., Kneib, T., Lang, S., and Marx, B.: Regression: Models, Methods and Applications, Springer-Verlag, Berlin Heidelberg, https://doi.org/10.1007/978-3-642-34333-9, 2013. a
Fell, R., Corominas, J., Bonnard, C., Cascini, L., Leroi, E., and Savage, W. Z.: Guidelines for landslide susceptibility, hazard and risk zoning for land use planning, Eng. Geol., 102, 85–98, https://doi.org/10.1016/j.enggeo.2008.03.022, 2008. a
Felsberg, A., Poesen, J., Bechtold, M., Vanmaercke, M., and De Lannoy, G. J. M.: Estimating global landslide susceptibility and its uncertainty through ensemble modeling, Nat. Hazards Earth Syst. Sci., 22, 3063–3082, https://doi.org/10.5194/nhess-22-3063-2022, 2022. a
Froude, M. J. and Petley, D. N.: Global fatal landslide occurrence from 2004 to 2016, Nat. Hazards Earth Syst. Sci., 18, 2161–2181, https://doi.org/10.5194/nhess-18-2161-2018, 2018. a
Gariano, S. L. and Guzzetti, F.: Landslides in a changing climate, Earth-Sci. Rev., 162, 227–252, https://doi.org/10.1016/j.earscirev.2016.08.011, 2016. a, b
Gariano, S. L. and Guzzetti, F.: 5.32 – Mass-Movements and Climate Change, in: Treatise on Geomorphology, 2nd edn., edited by: Shroder, J. F., Academic Press, Oxford, 546–558, https://doi.org/10.1016/B978-0-12-818234-5.00043-2, 2022. a, b
Gariano, S. L., Rianna, G., Petrucci, O., and Guzzetti, F.: Assessing future changes in the occurrence of rainfall-induced landslides at a regional scale, Sci. Total Environ., 596–597, 417–426, https://doi.org/10.1016/j.scitotenv.2017.03.103, 2017. a, b, c
Gariano, S. L., Petrucci, O., Rianna, G., Santini, M., and Guzzetti, F.: Impacts of past and future land changes on landslides in southern Italy, Reg. Environ. Change, 18, 437–449, https://doi.org/10.1007/s10113-017-1210-9, 2018. a
Gasser, D., Gusterhuber, J., Krische, O., Puhr, B., Scheucher, L., Wagner, T., and Stüwe, K.: Geology of Styria: An overview, Mitteilungen des Naturwissenschaftlichen Vereins für Steiermark, 139, 5–36, 2009. a, b
Guzzetti, F., Reichenbach, P., Ardizzone, F., Cardinali, M., and Galli, M.: Estimating the quality of landslide susceptibility models, Geomorphology, 81, 166–184, 2006. a, b
Haiden, T.: Meteorologische Analyse des Niederschlags von 22.-25. Juni 2009 [Meteorological analysis of the precipitation from 22 to 25 June 2009], Tech. rep., ZAMG, Vienna, Austria, http://www.zamg.ac.at/docs/aktuell/2009-06-30_Meteorologische%20Analyse%20HOWA2009.pdf (last access: 20 May 2022), 2009. a
Haiden, T., Kann, A., Wittmann, C., Pistotnik, G., Bica, B., and Gruber, C.: The Integrated Nowcasting through Comprehensive Analysis (INCA) System and Its Validation over the Eastern Alpine Region, Weather Forecast., 26, 166–183, https://doi.org/10.1175/2010WAF2222451.1, 2010 (data available at: https://data.hub.zamg.ac.at, last access: 20 May 2022). a
Haque, U., da Silva, P. F., Devoli, G., Pilz, J., Zhao, B., Khaloua, A., Wilopo, W., Andersen, P., Lu, P., Lee, J., Yamamoto, T., Keellings, D., Wu, J.-H., and Glass, G. E.: The human cost of global warming: Deadly landslides and their triggers (1995–2014), Sci. Total Environ., 682, 673–684, https://doi.org/10.1016/j.scitotenv.2019.03.415, 2019. a
Hersbach, H., Bell, B., Berrisford, P., Hirahara, S., Horányi, A., Muñoz-Sabater, J., Nicolas, J., Peubey, C., Radu, R., Schepers, D., Simmons, A., Soci, C., Abdalla, S., Abellan, X., Balsamo, G., Bechtold, P., Biavati, G., Bidlot, J., Bonavita, M., Chiara, G. D., Dahlgren, P., Dee, D., Diamantakis, M., Dragani, R., Flemming, J., Forbes, R., Fuentes, M., Geer, A., Haimberger, L., Healy, S., Hogan, R. J., Hólm, E., Janisková, M., Keeley, S., Laloyaux, P., Lopez, P., Lupu, C., Radnoti, G., de Rosnay, P., Rozum, I., Vamborg, F., Villaume, S., and Thépaut, J.-N.: The ERA5 Global Reanalysis, Q. J. Roy. Meteorol. Soc., 146, 1999–2049, https://doi.org/10.1002/qj.3803, 2020 (data available at: https://www.ecmwf.int/en/forecasts/datasets/browse-reanalysis-datasets, last access: 20 May 2022). a
Holzkämper, A., Klein, T., Seppelt, R., and Fuhrer, J.: Assessing the propagation of uncertainties in multi-objective optimization for agro-ecosystem adaptation to climate change, Environ. Modell. Softw., 66, 27–35, https://doi.org/10.1016/j.envsoft.2014.12.012, 2015. a
Hornich, R. and Adelwöhrer, R.: Landslides in Styria in 2009, Geomechanics and Tunnelling, 3, 455–461, https://doi.org/10.1002/geot.201000042, 2010. a, b, c, d, e, f, g, h, i
Hosmer, D. W., Lemeshow, S., and Sturdivant, R. X.: Applied Logistic Regression, Wiley Series in Probability and Statistics, John Wiley & Sons, Hoboken, NJ, USA, https://doi.org/10.1002/9781118548387, 2013. a
Jaedicke, C., Solheim, A., Blikra, L. H., Stalsberg, K., Sorteberg, A., Aaheim, A., Kronholm, K., Vikhamar-Schuler, D., Isaksen, K., Sletten, K., Kristensen, K., Barstad, I., Melchiorre, C., Høydal, Ø. A., and Mestl, H.: Spatial and temporal variations of Norwegian geohazards in a changing climate, the GeoExtreme Project, Nat. Hazards Earth Syst. Sci., 8, 893–904, https://doi.org/10.5194/nhess-8-893-2008, 2008. a, b
Jaedicke, C., Van Den Eeckhaut, M., Nadim, F., Hervás, J., Kalsnes, B., Vangelsten, B. V., Smith, J. T., Tofani, V., Ciurean, R., Winter, M. G., Sverdrup-Thygeson, K., Syre, E., and Smebye, H.: Identification of Landslide Hazard and Risk 'Hotspots' in Europe, B. Eng. Geol. Environ., 73, 325–339, https://doi.org/10.1007/s10064-013-0541-0, 2014. a
Jandl, R.: Climate-induced challenges of Norway spruce in Northern Austria, Trees, Forests and People, 1, 100008, https://doi.org/10.1016/j.tfp.2020.100008, 2020. a
Jones, J. N., Boulton, S. J., Bennett, G. L., Stokes, M., and Whitworth, M. R. Z.: Temporal Variations in Landslide Distributions Following Extreme Events: Implications for Landslide Susceptibility Modeling, J. Geophys. Res.-Earth, 126, e2021JF006067, https://doi.org/10.1029/2021JF006067, 2021. a, b
Kim, H. G., Lee, D. K., Park, C., Ahn, Y., Kil, S.-H., Sung, S., and Biging, G. S.: Estimating landslide susceptibility areas considering the uncertainty inherent in modeling methods, Stoch. Env. Res. Risk A., 32, 2987–3019, https://doi.org/10.1007/s00477-018-1609-y, 2018. a
Kirchner, M., Mitter, H., Schneider, U. A., Sommer, M., Falkner, K., and Schmid, E.: Uncertainty concepts for integrated modeling – Review and application for identifying uncertainties and uncertainty propagation pathways, Environ. Modell. Softw., 135, 104905, https://doi.org/10.1016/j.envsoft.2020.104905, 2021. a, b, c, d, e
Knevels, R., Petschko, H., Proske, H., Leopold, P., Maraun, D., and Brenning, A.: Event-Based Landslide Modeling in the Styrian Basin, Austria: Accounting for Time-Varying Rainfall and Land Cover, Geosciences, 10, 217, https://doi.org/10.3390/geosciences10060217, 2020. a, b, c, d, e, f, g, h, i, j, k, l, m, n, o, p, q, r, s, t
Knevels, R., Petschko, H., Proske, H., Leopold, P., Maraun, D., and Brenning, A.: Event-based landslide susceptibility models (Styrian Basin, Austria), Version 1.0.0, Zenodo [data set], https://doi.org/10.5281/zenodo.6365228, 2022. a
Kolström, M., Lindner, M., Vilén, T., Maroschek, M., Seidl, R., Lexer, M. J., Netherer, S., Kremer, A., Delzon, S., Barbati, A., Marchetti, M., and Corona, P.: Reviewing the Science and Implementation of Climate Change Adaptation Measures in European Forestry , Forests, 2, 961–982, https://doi.org/10.3390/f2040961, 2011. a
Landeswarnzentrale Steiermark: Niederschlagswarnung für die Steiermark. Für den Zeitraum: Donnerstag, 11.09.2014 12:00 Uhr MESZ bis Sonntag, 14.09.2014 12:00 Uhr MESZ [Precipitation warning for Styria. For the period: Thursday, 11 September 2014 12:00 CEST to Sunday, 14 September 2014 12:00 CEST], Tech. rep., Fachabteilung Katastrophenschutz und Landesverteidigung, Referat Landeswarnzentrale und Kommunikationstechnik, Graz, Austria, http://www.katastrophenschutz.steiermark.at/cms/beitrag/12083692/5461/ (last access: 20 May 2022), 2014. a
Lee, C.-T.: Landslide trends under extreme climate events, Terr. Atmos. Ocean. Sci., 28, 33–42, https://doi.org/10.3319/TAO.2016.05.28.01(CCA), 2017. a, b, c
Lima, P., Steger, S., and Glade, T.: Counteracting Flawed Landslide Data in Statistically Based Landslide Susceptibility Modelling for Very Large Areas: A National-Scale Assessment for Austria, Landslides, 18, 3531–3546, https://doi.org/10.1007/s10346-021-01693-7, 2021. a
Lombardo, L., Opitz, T., Ardizzone, F., Guzzetti, F., and Huser, R.: Space-time landslide predictive modelling, Earth-Sci. Rev., 209, 103318, https://doi.org/10.1016/j.earscirev.2020.103318, 2020. a
Maraun, D. and Widmann, M.: Statistical Downscaling and Bias Correction for Climate Research, Cambridge University Press, Cambridge, https://doi.org/10.1017/9781107588783, 2018. a
Maraun, D., Shepherd, T. G., Widmann, M., Zappa, G., Walton, D., Gutiérrez, J. M., Hagemann, S., Richter, I., Soares, P. M. M., Hall, A., and Mearns, L. O.: Towards process-informed bias correction of climate change simulations, Nat. Clim. Change, 7, 764–773, https://doi.org/10.1038/nclimate3418, 2017. a
Maraun, D., Knevels, R., Mishra, A. N., Truhetz, H., Bevacqua, E., Proske, H., Zappa, G., Brenning, A., Petschko, H., Schaffer, A., Leopold, P., and Puxley, B. L.: A severe landslide event in the Alpine foreland under possible future climate and land-use changes, Communications Earth & Environment, 3, 1–11, https://doi.org/10.1038/s43247-022-00408-7, 2022. a, b, c, d, e, f, g, h, i, j, k, l, m, n, o, p, q, r, s, t, u, v, w, x, y, z, aa, ab, ac, ad, ae, af, ag, ah, ai, aj
Marra, G. and Wood, S. N.: Coverage Properties of Confidence Intervals for Generalized Additive Model Components, Scand. J. Stat., 39, 53–74, https://doi.org/10.1111/j.1467-9469.2011.00760.x, 2012. a
Olefs, M., Formayer, H., Gobiet, A., Marke, T., Schöner, W., and Revesz, M.: Past and future changes of the Austrian climate – Importance for tourism, Journal of Outdoor Recreation and Tourism, 34, 100395, https://doi.org/10.1016/j.jort.2021.100395, 2021. a, b
Ozturk, U., Pittore, M., Behling, R., Roessner, S., Andreani, L., and Korup, O.: How Robust Are Landslide Susceptibility Estimates?, Landslides, 18, 681–695, https://doi.org/10.1007/s10346-020-01485-5, 2021. a, b, c
Petschko, H., Brenning, A., Bell, R., Goetz, J., and Glade, T.: Assessing the quality of landslide susceptibility maps – case study Lower Austria, Nat. Hazards Earth Syst. Sci., 14, 95–118, https://doi.org/10.5194/nhess-14-95-2014, 2014. a, b, c, d, e, f, g
Picarelli, L., Comegna, L., Gariano, S. L., Guzzetti, F., Mercogliano, P., Rianna, G., Santini, M., and Tommasi, P.: Potential climate changes in Italy and consequences for land stability, in: Slope Safety Preparedness for Impact of Climate Change, CRC Press, 47 pp., https://doi.org/10.1201/9781315387789, 2017. a
Pisano, L., Zumpano, V., Malek, Ž., Rosskopf, C. M., and Parise, M.: Variations in the susceptibility to landslides, as a consequence of land cover changes: A look to the past, and another towards the future, Sci. Total Environ., 601–602, 1147–1159, https://doi.org/10.1016/j.scitotenv.2017.05.231, 2017. a
R Core Team: R: A Language and Environment for Statistical Computing, R Foundation for Statistical Computing, Vienna, Austria, https://www.R-project.org/ (last access: 20 May 2022), 2021. a
Refsgaard, J., Sonnenborg, T., Butts, M., Christensen, J., Christensen, S., Drews, M., Jensen, K., Jørgensen, F., Jørgensen, L., Larsen, M., Rasmussen, S., Seaby, L., Seifert, D., and Vilhelmsen, T.: Climate change impacts on groundwater hydrology – where are the main uncertainties and can they be reduced?, Hydrolog. Sci. J., 61, 2312–2324, https://doi.org/10.1080/02626667.2015.1131899, 2016. a, b, c, d, e
Reichenbach, P., Busca, C., Mondini, A. C., and Rossi, M.: The Influence of Land Use Change on Landslide Susceptibility Zonation: The Briga Catchment Test Site (Messina, Italy), Environ. Manage., 54, 1372–1384, https://doi.org/10.1007/s00267-014-0357-0, 2014. a
Reichenbach, P., Rossi, M., Malamud, B. D., Mihir, M., and Guzzetti, F.: A review of statistically-based landslide susceptibility models, Earth-Sci. Rev., 180, 60–91, https://doi.org/10.1016/j.earscirev.2018.03.001, 2018. a, b, c, d, e, f, g, h
Rianna, G., Comegna, L., Mercogliano, P., and Picarelli, L.: Potential effects of climate changes on soil–atmosphere interaction and landslide hazard, Nat. Hazards, 84, 1487–1499, https://doi.org/10.1007/s11069-016-2481-z, 2016. a
Rianna, G., Comegna, L., Gariano, S. L., Guzzetti, F., Mercogliano, P., Picarelli, L., and Tommasi, P.: Potential Effects of Climate Changes on Landslide Activity in Different Geomorphological Contexts, in: Advancing Culture of Living with Landslides, edited by: Mikoš, M., Casagli, N., Yin, Y., and Sassa, K., Springer International Publishing, Cham, 243–249, https://doi.org/10.1007/978-3-319-53485-5_28, 2017. a, b, c
Roberts, D. R., Wood, W. H., and Marshall, S. J.: Assessments of Downscaled Climate Data with a High-Resolution Weather Station Network Reveal Consistent but Predictable Bias, Int. J. Climatol., 39, 3091–3103, https://doi.org/10.1002/joc.6005, 2019. a
Roberts, G. O., Gelman, A., and Gilks, W. R.: Weak convergence and optimal scaling of random walk Metropolis algorithms, Ann. Appl. Probab., 7, 110–120, https://doi.org/10.1214/aoap/1034625254, 1997. a, b
Rockel, B., Will, A., and Hense, A.: The Regional Climate Model COSMO-CLM (CCLM), Meteorol. Z., 17, 347–348, https://doi.org/10.1127/0941-2948/2008/0309, 2008. a
Rougier, J.: Quantifying hazard losses, in: Risk and Uncertainty Assessment for Natural Hazards, edited by: Rougier, J., Hill, L. J., and Sparks, S., Cambridge University Press, Cambridge, 19–39, https://doi.org/10.1017/CBO9781139047562.003, 2013. a
Rougier, J. and Beven, K.: Model and data limitations: the sources and implications of epistemic uncertainty, in: Risk and Uncertainty Assessment for Natural Hazards, edited by: Rougier, J., Hill, L. J., and Sparks, S., Cambridge University Press, Cambridge, 40–63, https://doi.org/10.1017/CBO9781139047562.004, 2013. a, b
Rougier, J., Sparks, S., and Hill, L. J. (Eds.): Risk and Uncertainty Assessment for Natural Hazards, Cambridge University Press, Cambridge, https://doi.org/10.1017/CBO9781139047562, 2013. a
Roy, C. J. and Oberkampf, W. L.: A comprehensive framework for verification, validation, and uncertainty quantification in scientific computing, Comput. Method. Appl. M., 200, 2131–2144, https://doi.org/10.1016/j.cma.2011.03.016, 2011. a, b, c, d
Ruppert, D., Wand, M. P., and Carroll, R. J.: Semiparametric Regression, Cambridge Series in Statistical and Probabilistic Mathematics, Cambridge University Press, Cambridge, https://doi.org/10.1017/CBO9780511755453, 2003. a
Samia, J., Temme, A., Bregt, A., Wallinga, J., Guzzetti, F., Ardizzone, F., and Rossi, M.: Do landslides follow landslides? Insights in path dependency from a multi-temporal landslide inventory, Landslides, 14, 547–558, https://doi.org/10.1007/s10346-016-0739-x, 2017. a
Schaffer, A.: Evaluation of the Soil Moisture-Precipitation Feedback in Austria [Beurteilung des Bodenfeuchte-Niederschlag-Feedbacks in Österreich], Master's thesis, Graz University of Technology, Graz, Austria, https://online.tugraz.at/tug_online/wbabs.showThesis?pThesisNr=73261&pOrgNr=37 (last access: 20 May 2022), 2021. a, b
Schlögel, R., Kofler, C., Gariano, S. L., Van Campenhout, J., and Plummer, S.: Changes in climate patterns and their association to natural hazard distribution in South Tyrol (Eastern Italian Alps), Scientific Reports, 10, 5022, https://doi.org/10.1038/s41598-020-61615-w, 2020. a, b
Schweigl, J. and Hervás, J.: Landslide mapping in Austria, JRC Scientific and Technical Reports EUR 23785 EN, European Commission, Joint Research Centre, Luxembourg, https://doi.org/10.2788/85150, 2009. a
Shepherd, T. G.: Atmospheric circulation as a source of uncertainty in climate change projections, Nat. Geosci., 7, 703–708, https://doi.org/10.1038/ngeo2253, 2014. a
Shepherd, T. G., Boyd, E., Calel, R. A., Chapman, S. C., Dessai, S., Dima-West, I. M., Fowler, H. J., James, R., Maraun, D., Martius, O., Senior, C. A., Sobel, A. H., Stainforth, D. A., Tett, S. F. B., Trenberth, K. E., van den Hurk, B. J. J. M., Watkins, N. W., Wilby, R. L., and Zenghelis, D. A.: Storylines: an alternative approach to representing uncertainty in physical aspects of climate change, Clim. Change, 151, 555–571, https://doi.org/10.1007/s10584-018-2317-9, 2018. a, b
Simpson, G. L.: Modelling Palaeoecological Time Series Using Generalised Additive Models, Frontiers in Ecology and Evolution, 6, 149, https://doi.org/10.3389/fevo.2018.00149, 2018. a, b, c, d, e, f
Stainforth, D., Allen, M., Tredger, E., and Smith, L.: Confidence, uncertainty and decision-support relevance in climate predictions, Philos. T. Roy. Soc. A, 365, 2145–2161, https://doi.org/10.1098/rsta.2007.2074, 2007. a
Steger, S., Brenning, A., Bell, R., and Glade, T.: The propagation of inventory-based positional errors into statistical landslide susceptibility models, Nat. Hazards Earth Syst. Sci., 16, 2729–2745, https://doi.org/10.5194/nhess-16-2729-2016, 2016. a
Steger, S., Brenning, A., Bell, R., and Glade, T.: The influence of systematically incomplete shallow landslide inventories on statistical susceptibility models and suggestions for improvements, Landslides, 14, 1767–1781, https://doi.org/10.1007/s10346-017-0820-0, 2017. a
Szumilas, M.: Explaining Odds Ratios, Journal of the Canadian Academy of Child and Adolescent Psychiatry, 19, 227–229, https://www.ncbi.nlm.nih.gov/pmc/articles/PMC2938757/ (last access: 20 May 2022), 2010. a
Tang, A. M., Hughes, P. N., Dijkstra, T. A., Askarinejad, A., Brenčič, M., Cui, Y. J., Diez, J. J., Firgi, T., Gajewska, B., Gentile, F., Grossi, G., Jommi, C., Kehagia, F., Koda, E., ter Maat, H. W., Lenart, S., Lourenco, S., Oliveira, M., Osinski, P., Springman, S. M., Stirling, R., Toll, D. G., and Van Beek, V.: Atmosphere–vegetation–soil interactions in a climate change context; impact of changing conditions on engineered transport infrastructure slopes in Europe, Q. J. Eng. Geol. Hydroge., 51, 156–168, https://doi.org/10.1144/qjegh2017-103, 2018. a
Taylor, K. E., Ronald, S., and Meehl, G.: A Summary of the CMIP5 experiment design, PCDMI Rep., 4, 1–33, https://pcmdi.llnl.gov/mips/cmip5/docs/Taylor_CMIP5_design.pdf (last access: 20 May 2022), 2009 (data available at: https://cera-www.dkrz.de/WDCC/ui/cerasearch, last access: 20 May 2022). a, b
Torizin, J., Fuchs, M., Kuhn, D., Balzer, D., and Wang, L.: Practical Accounting for Uncertainties in Data-Driven Landslide Susceptibility Models. Examples from the Lanzhou Case Study, in: Understanding and Reducing Landslide Disaster Risk: Volume 2 From Mapping to Hazard and Risk Zonation, edited by: Guzzetti, F., Mihalić Arbanas, S., Reichenbach, P., Sassa, K., Bobrowsky, P. T., and Takara, K., ICL Contribution to Landslide Disaster Risk Reduction, Springer International Publishing, Cham, 249–255, https://doi.org/10.1007/978-3-030-60227-7_27, 2021. a, b
Valeriano, K. L., Lachos, V. H., and Matos, L. A.: StempCens: Spatio-temporal estimation and prediction for censored/missing responses, R Foundation for Statistical Computing, https://CRAN.R-project.org/package=StempCens (last access: 20 May 2022), 2020. a
Walker, W., Harremoës, P., Rotmans, J., van der Sluijs, J., van Asselt, M., Janssen, P., and Krayer von Krauss, M.: Defining Uncertainty: A Conceptual Basis for Uncertainty Management in Model-Based Decision Support, Integrated Assessment, 4, 5–17, https://doi.org/10.1076/iaij.4.1.5.16466, 2003. a
Wallemacq, P., House, R., and McLean, D.: Economic Losses, Poverty & Disasters: 1998–2017, Tech. rep., Centre for Research on the Epidemiology of Disaster, UN Office for Disaster Risk Reductions, https://www.cred.be/sites/default/files/CRED_Economic_Losses_10oct.pdf (last access: 20 May 2022), 2018. a
Wood, S. N.: Core Statistics, Institute of Mathematical Statistics Textbooks, Cambridge University Press, Cambridge, https://doi.org/10.1017/CBO9781107741973, 2015. a, b, c, d
Wood, S. N.: Generalized Additive Models: An Introduction with R, Chapman and Hall/CRC, Boca Raton, FL, USA, 2nd edn., https://doi.org/10.1201/9781315370279, 2017. a, b, c, d, e, f, g
ZAMG: Meldungen zu Unwetter und Witterungsbedingten Schäden in der Wirtschaft / September 2014 [Reports on severe weather and weather-related losses in the economy / September 2014], ZAMG, Tech. rep., https://www.zamg.ac.at/zamgWeb/klima/klimarueckblick/archive/2014/09/unwetter09-14.pdf (last access: 20 May 2022), 2014. a, b
Zscheischler, J., Martius, O., Westra, S., Bevacqua, E., Raymond, C., Horton, R. M., van den Hurk, B., AghaKouchak, A., Jézéquel, A., Mahecha, M. D., Maraun, D., Ramos, A. M., Ridder, N. N., Thiery, W., and Vignotto, E.: A typology of compound weather and climate events, Nature Reviews Earth & Environment, 1, 333–347, https://doi.org/10.1038/s43017-020-0060-z, 2020. a, b