the Creative Commons Attribution 4.0 License.
the Creative Commons Attribution 4.0 License.
 | 20 Apr 2023
Hydrological drought forecasting under a changing environment in the Luanhe River basin
Min Li
Mingfeng Zhang
Runxiang Cao
Yidi Sun
Xiyuan Deng
Forecasting the occurrence of hydrological drought according to a forecasting system is an important disaster reduction strategy. In this paper, a new drought prediction model adapted to changing environments was constructed. Taking the Luanhe River basin in China as an example, first, nonstationarity analysis of hydrological sequences in the basin was carried out. Then, conditional distribution models with the human activity factor as an exogenous variable were constructed to forecast hydrological drought based on meteorological drought, and the results were compared with the traditional normal distribution model and conditional distribution model. Finally, a scoring mechanism was applied to evaluate the performance of the three drought forecasting models. The results showed that the runoff series of the Luanhe River basin from 1961 to 2010 were nonstationary; moreover, when human activities were not considered, the hydrological drought class tended to be the same as the meteorological drought class. The calculation results of the models involving HI as an exogenous variable were significantly different from the models that did not consider human activities. When the current drought class tended towards less severe or normal, the meteorological drought tended to turn into more severe hydrological drought with the increase in human index values. According to the scores of the three drought forecasting models, the conditional distribution models involving the human index can further improve the forecasting accuracy of drought in the Luanhe River basin.
- Article
(4037 KB) - Full-text XML
- BibTeX
- EndNote


Typically, meteorological drought is regarded as the beginning of a drought event; after the occurrence of meteorological drought, other drought phenomena occur, such as hydrological drought (Fendeková et al., 2018; Fuentes et al., 2022; Wang et al., 2021). However, there is a delay period from meteorological drought to hydrological drought (Ding et al., 2021; Xu et al., 2019; Onyutha, 2017; Cammalleri and Vogt, 2018). Therefore, the occurrence of hydrological drought can be forecasted according to meteorological drought monitoring. Accurate hydrological forecast information is beneficial to reduce the losses caused by hydrological drought (Behzad and Hamid, 2019; Oertel et al., 2018 Dixit et al., 2022; Jehanzaib et al., 2020).
To identify the drought characteristics of the region, scholars have developed drought indices. For example, the standardized precipitation index (SPI) is typically used to identify and capture the characteristics of meteorological drought (McKee et al., 1993). Considering the influence of precipitation and temperature, Vicente-Serrano et al. (2010) proposed the standardized precipitation evapotranspiration index (SPEI) to characterize meteorological drought. The standardized runoff index (SRI), which focuses on the surface runoff of catchments, is typically used to indicate hydrological drought (Shukla and Wood, 2008). Aghelpour and Varshavian (2021) proposed the multivariate standardized precipitation index (MSPI) to forecast hydrological drought in Iran.
Statistical technology is an effective prediction method that has been widely used in drought forecasting in recent years (Alquraish et al., 2021; Abbasi et al., 2021; Dehghani et al., 2019; Mallya et al., 2013). For instance, neural network models have been proposed to combine multiple data for drought prediction (Rezaeianzadeh et al., 2016; Mokhtarzad et al., 2017; Ahnadi et al., 2011), and time series models can be used to analyse the variation in time series such as rainfall and runoff to achieve drought prediction (Moghimi et al., 2020; Natsagdorj et al., 2021; Stojković et al., 2020). The conditional probability model was proposed by Cancelliere et al. (2007) and developed for drought forecasting by Bonaccorso et al. (2015). Bonaccorso et al. (2015) showed that the conditional probability model can calculate the transition probabilities from the current drought index values to the future drought classes, and this is a more robust method that can be used to forecast drought than the traditional probability prediction models (such as the multivariate normal distribution model and Markov method).
A change in the environment may lead to the nonstationarity of the relationship between hydrological series (for example, precipitation and runoff series), which also occurs in the Luanhe River basin (Wang et al., 2016, 2018, 2020; Li et al., 2015). Traditional drought prediction methods need to be further improved to adapt to nonstationary conditions (Wang et al., 2022; Zhao et al., 2018; Chen et al., 2021). Ren et al. (2017) found that the conditional distribution model using large-scale climatic indices as covariates can improve the accuracy of meteorological drought forecasting in the Luanhe River basin. Although some progress has been made in the study of drought forecasting, there are relatively few studies considering the impact of the changing environment.
In this paper, to analyse the impact of human activities on hydrological drought, we constructed the human activity index (HI) based on the restoration method. Subsequently, conditional distribution models with the HI as the exogenous variable were developed to forecast hydrological drought based on meteorological drought, and then the results were compared with the traditional normal distribution model and conditional distribution model; as a result, the impact of human activities on transition probabilities was illustrated. A scoring mechanism was applied to the evaluation of the three probability models.
In addition to the introduction, this paper contains the following sections. Section 2 introduces the study area and data. Section 3 briefly describes the methods used in the research. Section 4 introduces the model construction and calculation results and analyses the results. Section 5 presents the prospects.
The Luanhe River basin, located in the subtropical monsoon region, covers an area of approximately 33 700 km2. Its geographical location is shown in Fig. 1. Due to the influence of geographical location and topography, the annual average north–south temperature difference in the basin is 11.5 ∘C, and the annual rainfall distribution is uneven. Less rain in spring and winter makes the area prone to meteorological drought and hydrological drought, while there is relatively more rainfall in summer. The average rainfall in summer is approximately 200–560 mm, resulting in highly variable annual runoff in the basin. The concentrated rainfall in summer has also become one of the remarkable features of the climate in this area. In recent years, the precipitation and inflow of the Luanhe River basin have gradually decreased, the water level of the Panjiakou Reservoir in the lower reaches of the basin has decreased, the runoff has decreased, and the frequency of meteorological drought and hydrological drought has significantly increased. Especially after entering the 21st century, the river basin has exhibited continuous drought and even extreme drought. With the change in the global climate and the impact of human activities on the basin environment, drought disasters in the Luanhe River basin occur frequently, causing significant social and economic losses.
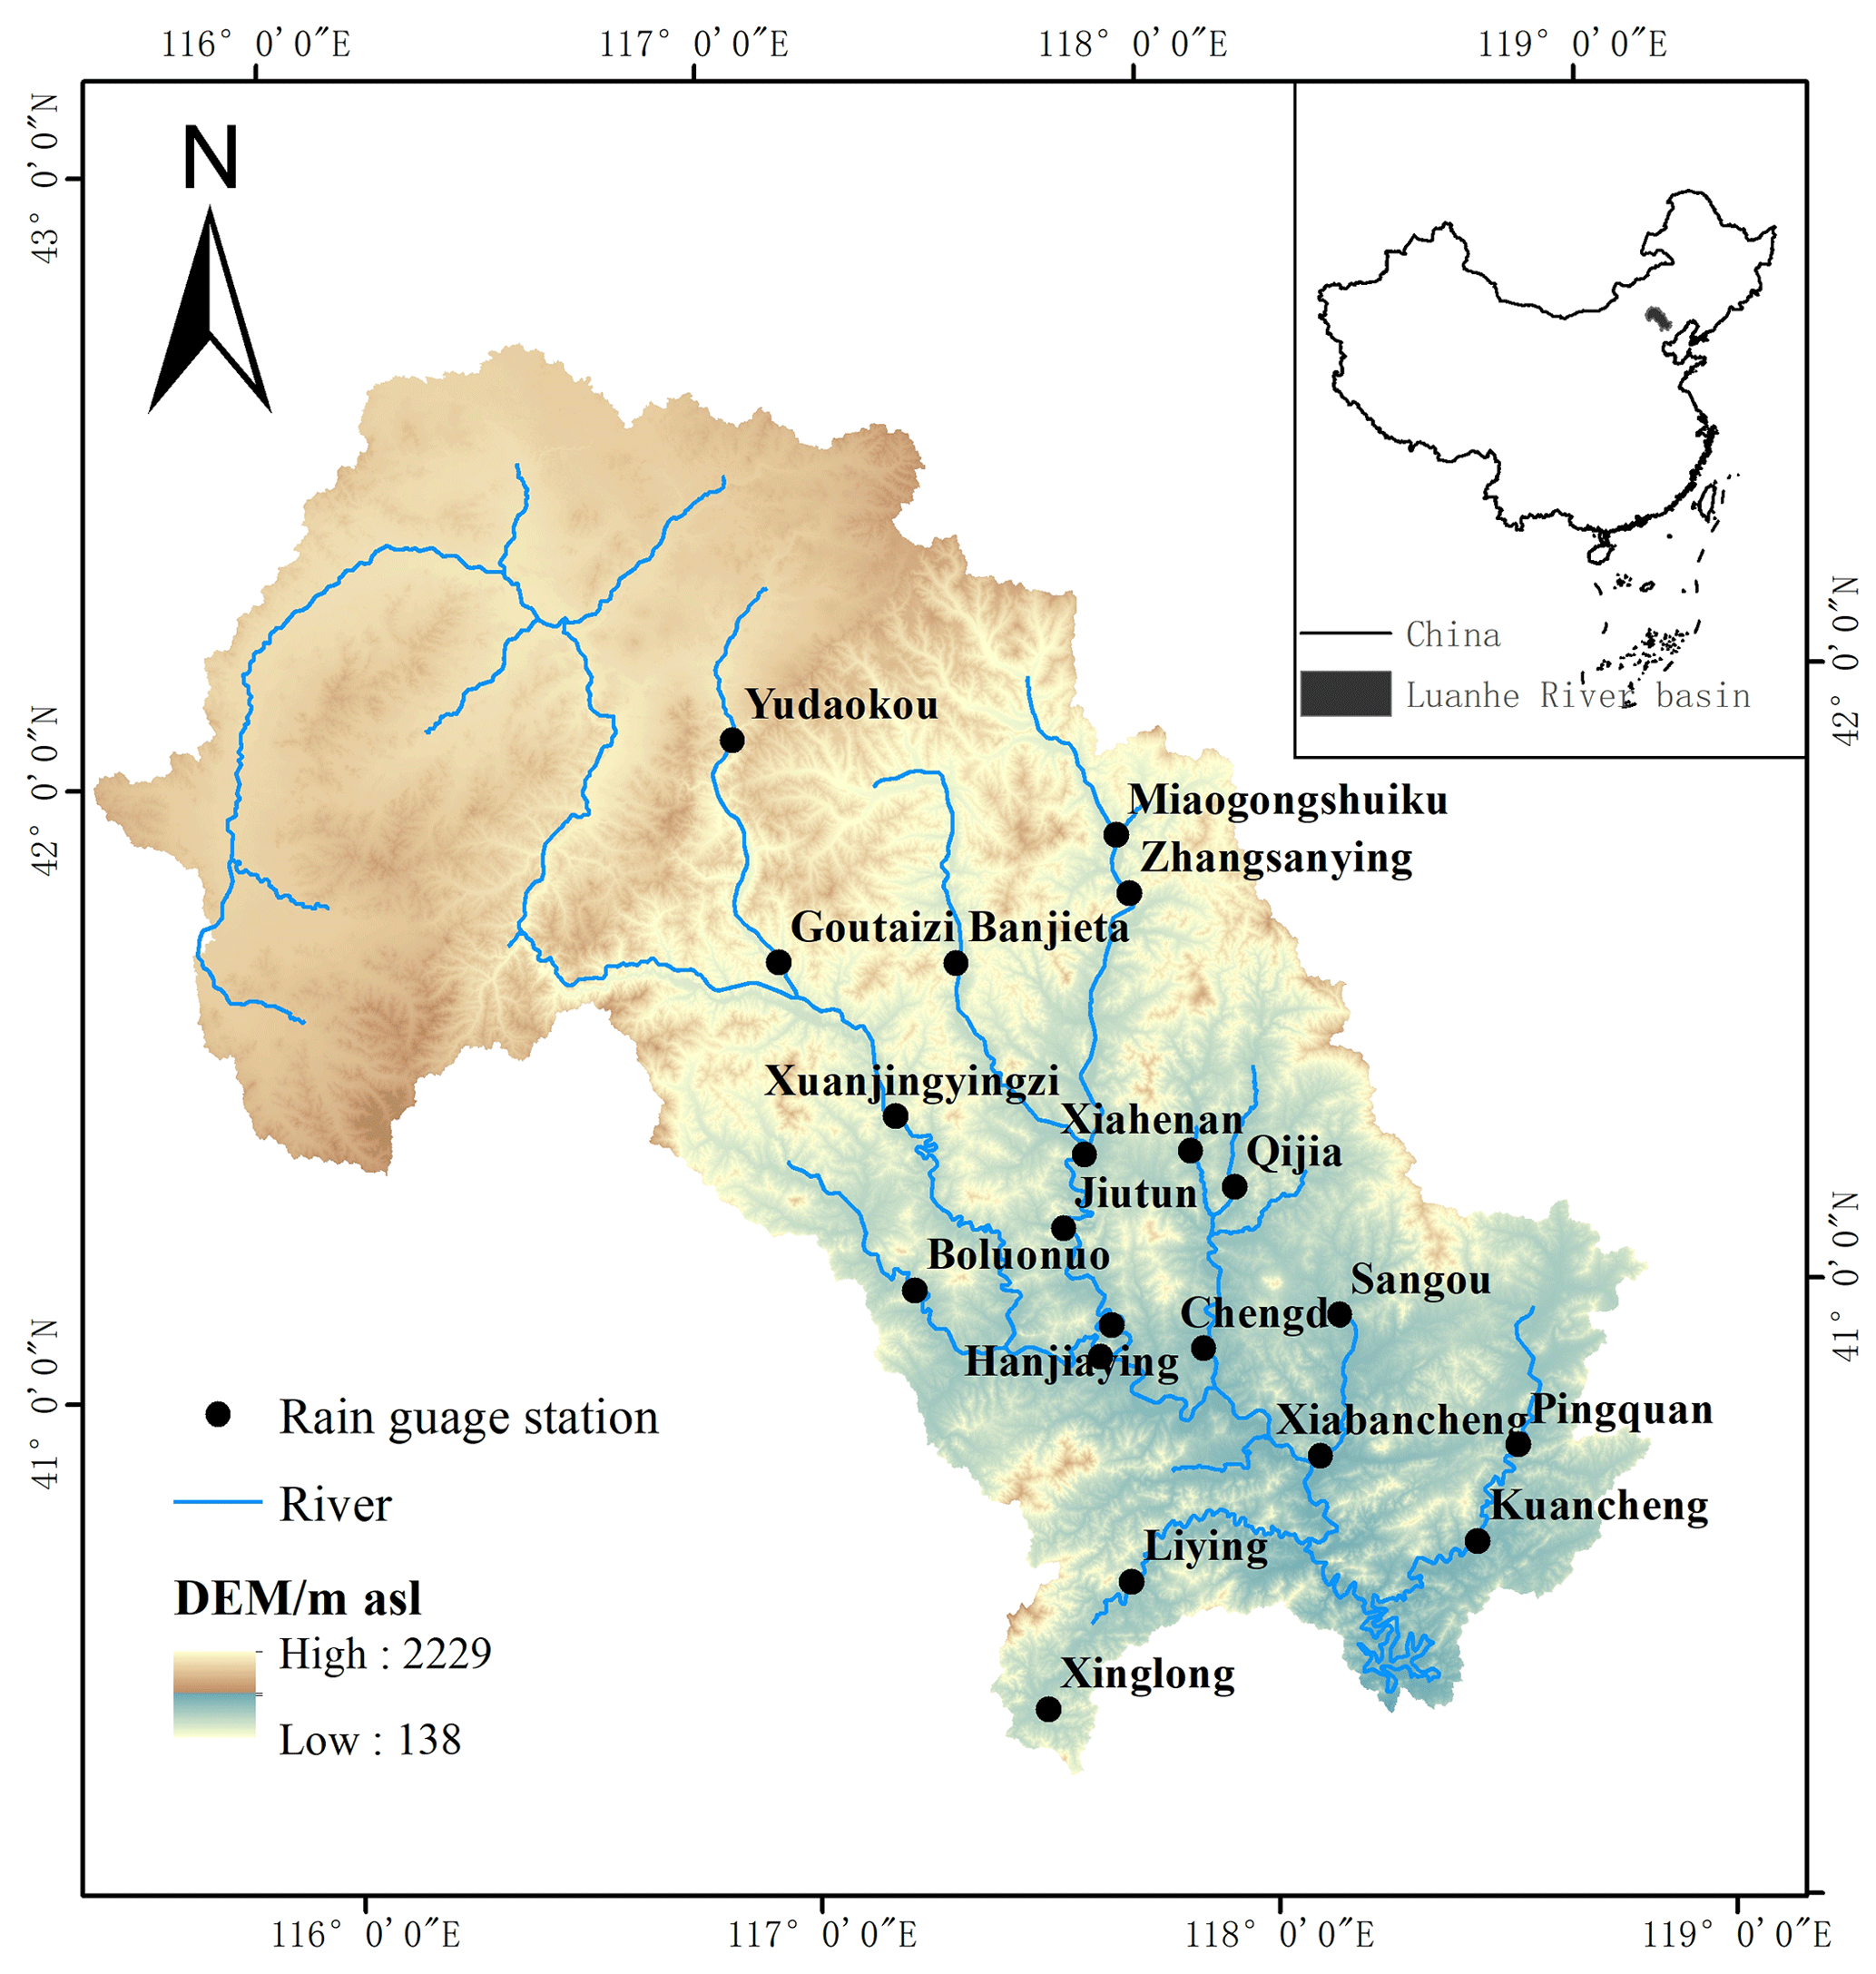
Figure 1The geographical location of the Luanhe River basin.
Influenced by topography, meteorology, hydrology and hydrogeological conditions, the spatial distribution of groundwater resources in the Luanhe River basin is quite different. The recharge and storage conditions of shallow groundwater in plain areas and intermountain basins are relatively superior, and the content of groundwater in mountainous areas is relatively small (the area of mountainous areas in the Luanhe River basin accounts for 98.2 %). Therefore, the total amount of water resources in the Luanhe River basin is mainly considered to be affected by the amount of surface water resources.
In this paper, the monthly rainfall data from 26 stations in the Luanhe River basin from 1961 to 2010 were provided by the Hebei Provincial Hydrology and Water Resources Investigation Bureau. The average monthly rainfall data of the area were obtained by the inverse distance weighting interpolation method. The runoff data from 1961 to 2010 came from the inflow runoff series of the Panjiakou Reservoir. The SPI and SRI can be calculated for 1-month, 3-month, 6-month, and 12-month timescales to characterize meteorological drought and hydrological drought based on these data.
3.1 Nonstationarity test method
In the case of environmental changes, nonstationarity may occur in hydrological series. The Pettitt test, as one of the important methods to test whether there is nonstationarity in time series, can identify whether there are change points in the sample series (Malede et al., 2022). Assuming that the sample sequence is , the formula is as follows:
where Ut,n is the test statistic, which indicates the cumulative number of the values at time t greater than or less than the values at time i. In addition, if satisfies the following,
then t0 is considered to be the change point, and the cumulative probability of possible change is determined by :
Given the significance level α=0.05, if , it means that the point is a significant change point (Li et al., 2022; Koudahe et al., 2018). Furthermore, combined with the Mann–Kendall test, the trend characteristics of the sample series can be obtained (Li et al., 2018).
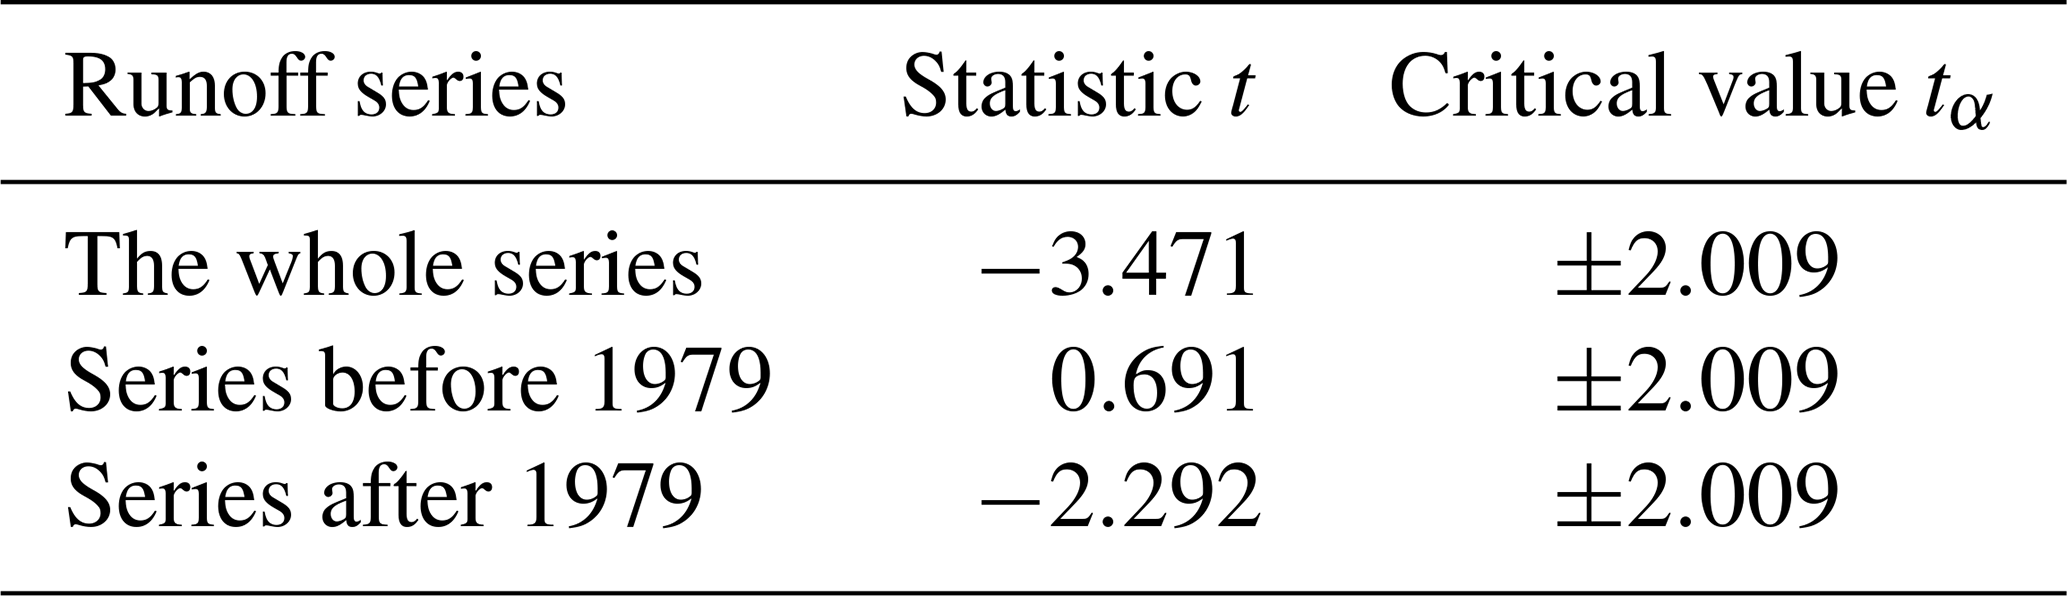
The sliding T test is a basic method commonly used in statistics. According to the mean and variance of the two sample sequences before and after the change points in the runoff time series, the two sample sequences are tested (Li et al., 2020):
where the change point is xt, n1 and n2 represent the sample size before and after the change point, and and represent the variance of the samples before and after the change point, respectively. If the t statistic satisfies t>tα at the significance level of α=0.05, the point can be considered a change point.
The Spearman correlation test can be applied to test the trend of time series, and the specific description refers to the article of Bishara and Hittner (2012).
3.2 Human activity index
The rainfall and runoff series of the watershed are usually strongly correlated. However, under the interference of human activities, the relationship between rainfall and runoff changes.
The double cumulative curve method can test the nonstationarity of the bivariate correlation between rainfall series and runoff series, and the point where the underlying surface is significantly altered by human activities can be determined according to the position of the slope change of the curve. Due to the short data series before and after the change point (20 years before the change point and 30 years after the change point), a linear equation was used to fit the relationship between precipitation and runoff.
The linear regression relationship of the cumulative rainfall and runoff series can be calculated according to the following formula:
where x is the runoff series; y is the rainfall series; k is the correlation coefficient of the regression equation; and b is the intercept of the regression equation.
Human activities are the main reason for the nonstationarity of the runoff series in the watershed, so the HI can be constructed to quantify the impact of human activities on runoff. Based on the linear regression relationship established between the accumulated precipitation and the accumulated runoff before the change point, the theoretical runoff sequence during the human activity period can be calculated from the measured precipitation sequence. SRI′ represents the standardized runoff index value without human activity interference, and SRI represents the normalized runoff index value calculated based on the measured runoff sequence under the disturbance of human activities. The HI is obtained by subtracting the theoretical SRI′ and the actual SRI, and the calculation formula is as follows:
When HI>0, it can be assumed that human activities exacerbate hydrological drought; HI<0 means that the actual SRI is greater than the theoretical SRI without human activities, and when HI=0, the watershed is considered undisturbed by human activities.
3.3 Multivariate normal distribution model
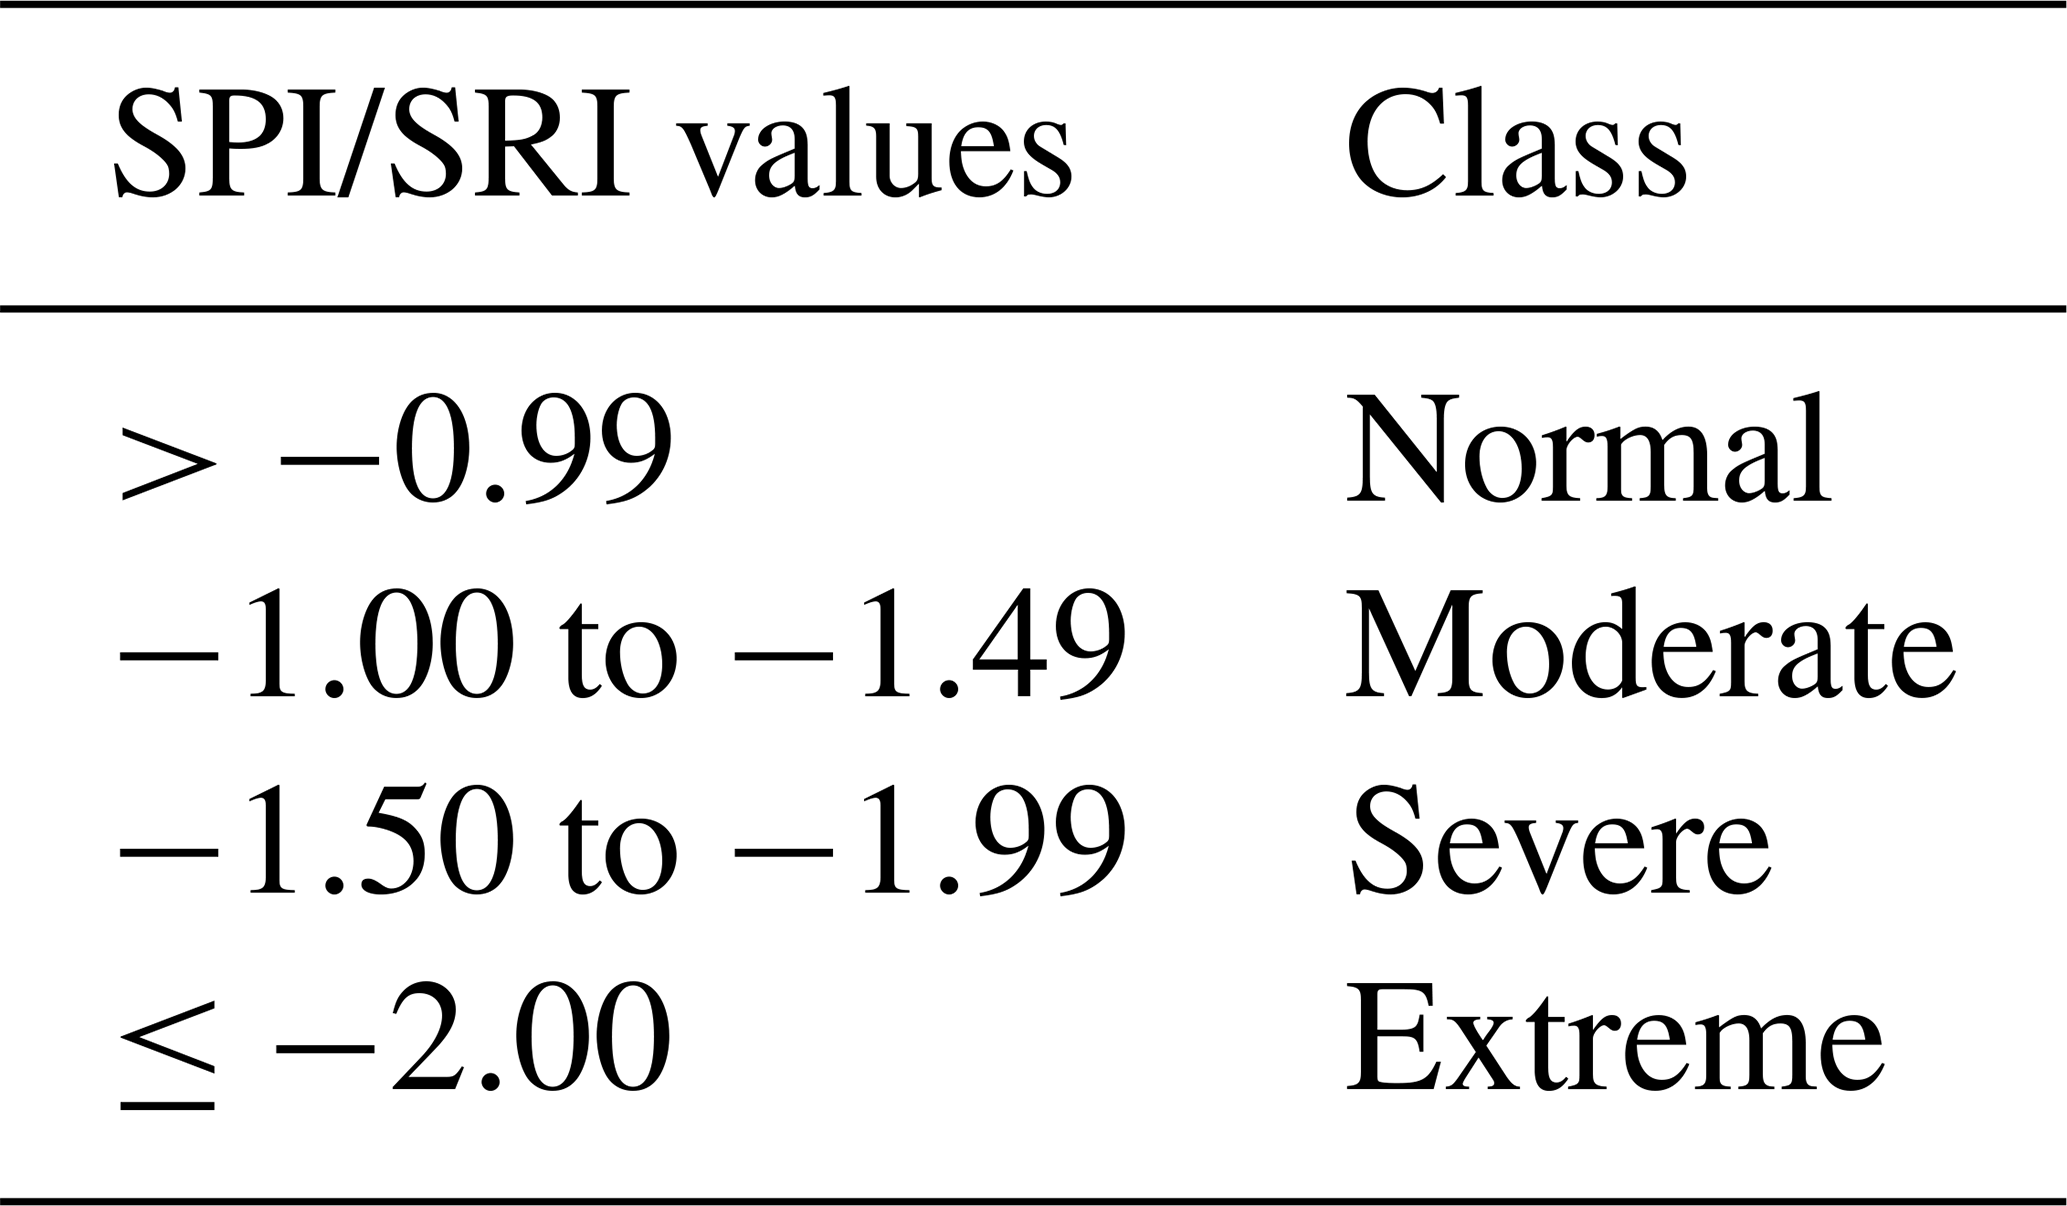
The SPI is one of the important indicators for evaluating meteorological drought in the basin, and the SRI is an important indicator for evaluating hydrological drought in the basin. According to the rainfall data and runoff data in the basin, the SPI and SRI can be calculated at different timescales. Table 1 provides the drought class classification and corresponding SPI values and SRI values (Kolachian and Saghafian, 2021).
Table 1Drought class classification and corresponding SPI values and SRI values.
As a traditional drought class forecasting model, the multivariate normal distribution model (Model 1) can forecast the future SRI class according to the current SPI class. Assuming that the current SPI and SRI series both satisfy a multivariable normal distribution, the joint probability density can be expressed as follows (Chang et al., 2022):
where Σ is the covariance matrix, and . The form of the covariance matrix is as follows:
Furthermore, according to the joint probability density function of the SPI value at year v and month λ and the future M month's SRI value , the analytical formula of the transition probability of the future SRI drought class can be obtained (Zhang et al., 2017):
where CM represents the drought class, and represents the marginal density function of in the current λ month.
3.4 Conditional distribution model
The conditional distribution model (Model 2) proposed by Bonaccorso et al. (2015) is described as follows: when one group of sample data X obeys a normal distribution and satisfies , and another group of sample data Y also obeys a normal distribution, namely, , then the total sequence can be written as follows:
When sequence Y obeys a normal distribution, the distribution of sequence X under the Y condition still satisfies a normal distribution; namely, the distribution of (X|Y) is as follows (Gong et al., 2021):
where μ3 represents the expected value under the conditional distribution, and Σ3 is the conditional covariance matrix:
Then, the probability of the current SPI value transitioning to the future SRI drought class can be deduced as follows (Ren et al., 2017):
where Zv,λ represents the SPI value of the current month λ, represents the SRI value of the λ+M month, and are the upper and lower limits of drought class CM, and the correlation coefficient between the current SPI value and the future SRI value is ρ. Furthermore, the current SPI and future SRI can be expressed as the standard normal cumulative distribution function Φ:
The calculation of the correlation coefficient ρ is as follows:
where K represents the timescale of the drought index. Assuming that the cumulative rainfall Y and runoff X satisfy a normal distribution, after the standardization process, the SPI value corresponding to cumulative rainfall Y and SRI value corresponding to runoff X obey the standard normal distribution:
represents the covariance between the current SPI and the Sri value with a forecast period of M months. The calculation is as follows:
3.5 Conditional distribution model involving the HI as an exogenous variable
According to the above conditional probability model, when considering the HI as an exogenous variable, the model (Model 3) can be extended as follows:
where
3.6 Scoring mechanism
A scoring mechanism was applied to evaluate the performance of the drought forecasting models. In this method, the monthly drought transition probability is summed to evaluate the model (Chen et al., 2013), where ps,t characterizes the transition probability in month t of year s, and n is the length of the validation period.
4.1 Nonstationarity analysis
In this paper, the area average monthly rainfall data of the Luanhe River basin from 1961 to 2010 were obtained by spatial interpolation. The runoff data came from the inflow runoff series of the Panjiakou Reservoir. Given the significance level α=0.05, the nonstationarity test results are shown in Fig. 2.

Figure 2a shows that the years of possible runoff change were 1979, 1996, 1997, 1998 and 1999. The P values in 1979 and 1998 were infinitely close to 1, which were considered to be extremely significant runoff change points. Among all the possible points satisfying t>tα, there were two maximum points (Fig. 2b), namely, 1979 and 1998, which were considered to be possible runoff change points. The final change point needs to be judged based on the actual situation of the watershed.
The results of the Spearman correlation test (Table 2) indicate that the runoff series showed an upwards trend before 1979, but the trend was not significant. However, there was a significant downwards trend in the series after 1979. In general, the runoff series showed a significant downwards trend.
Table 2Spearman correlation test results of runoff series trend.
In addition, according to historical records, local human activities (such as land use change and reservoir construction) are regarded as the main factors influencing runoff (Yan et al., 2018; Chen et al., 2021). Synthesizing the above analysis, 1979 was determined as the change point for the runoff sequence in the basin, and this conclusion was consistent with Li et al. (2015) and Wang et al. (2015).
4.2 Transition probabilities from current SPI values to future SRI classes
According to the normality test results of rainfall and runoff series, it was reasonable to apply the conditional distribution model. To analyse the influence of different timescales of the SPI on the transition probabilities, using the forecast period as 1 month and the SPI timescales at 1, 3, 6 and 12 months as examples, the probabilities of converting SPI values to SRI classes were calculated (Fig. 3).
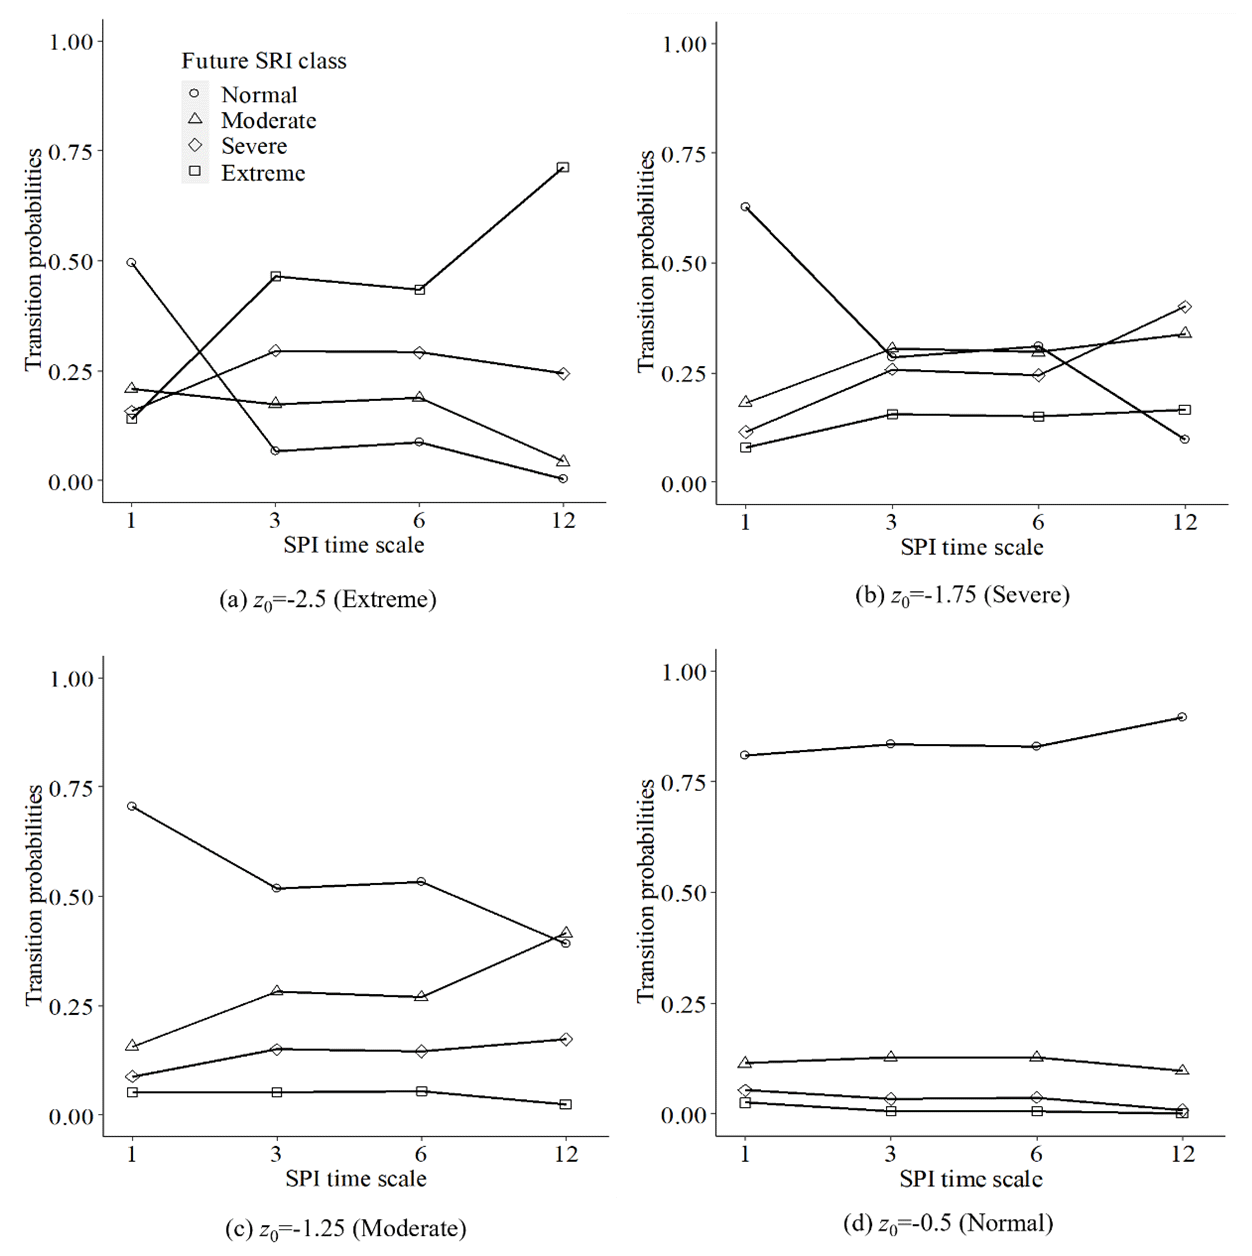
Figure 3Influence of the SPI timescale on transition probabilities (z0: initial value of SPI).
As shown in Fig. 3, when meteorological drought is categorized as extreme drought, the probabilities of maintaining the SRI class in extreme drought increased with the increasing SPI timescale. While the SPI had a short timescale, the response of the future SRI class to rainfall was fast, so the hydrological drought was more likely to tend to a normal status. This situation also occurred when the current meteorological drought was in another status.
In addition, the transition probabilities of drought were distinct for different forecast periods. As seen in Fig. 4, when the forecast periods were short (M=1 or 2), the hydrological drought classes obtained from the transition of meteorological drought tended to be the same as those of meteorological drought. With the extension of the forecast period (M=2 or 3), the hydrological drought classes obtained from the transition tended to be lower than the meteorological drought or the normal status.
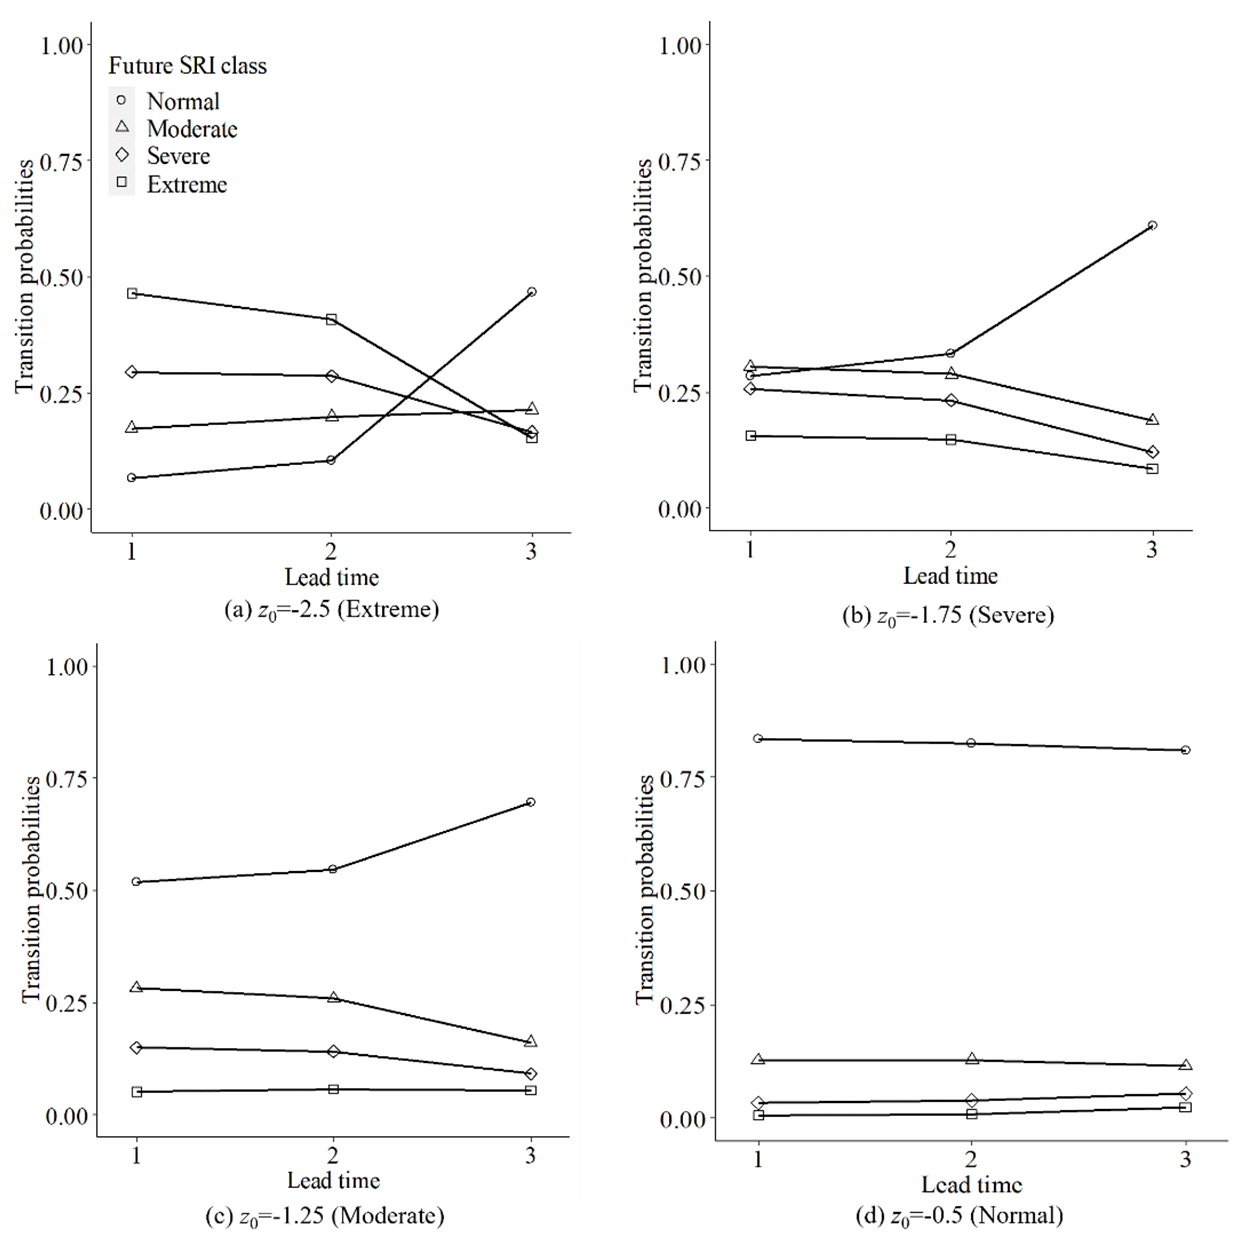
Figure 4Influence of forecast period on transition probabilities (z0: initial value of SPI).
4.3 Transition probabilities involving the HI as the covariate
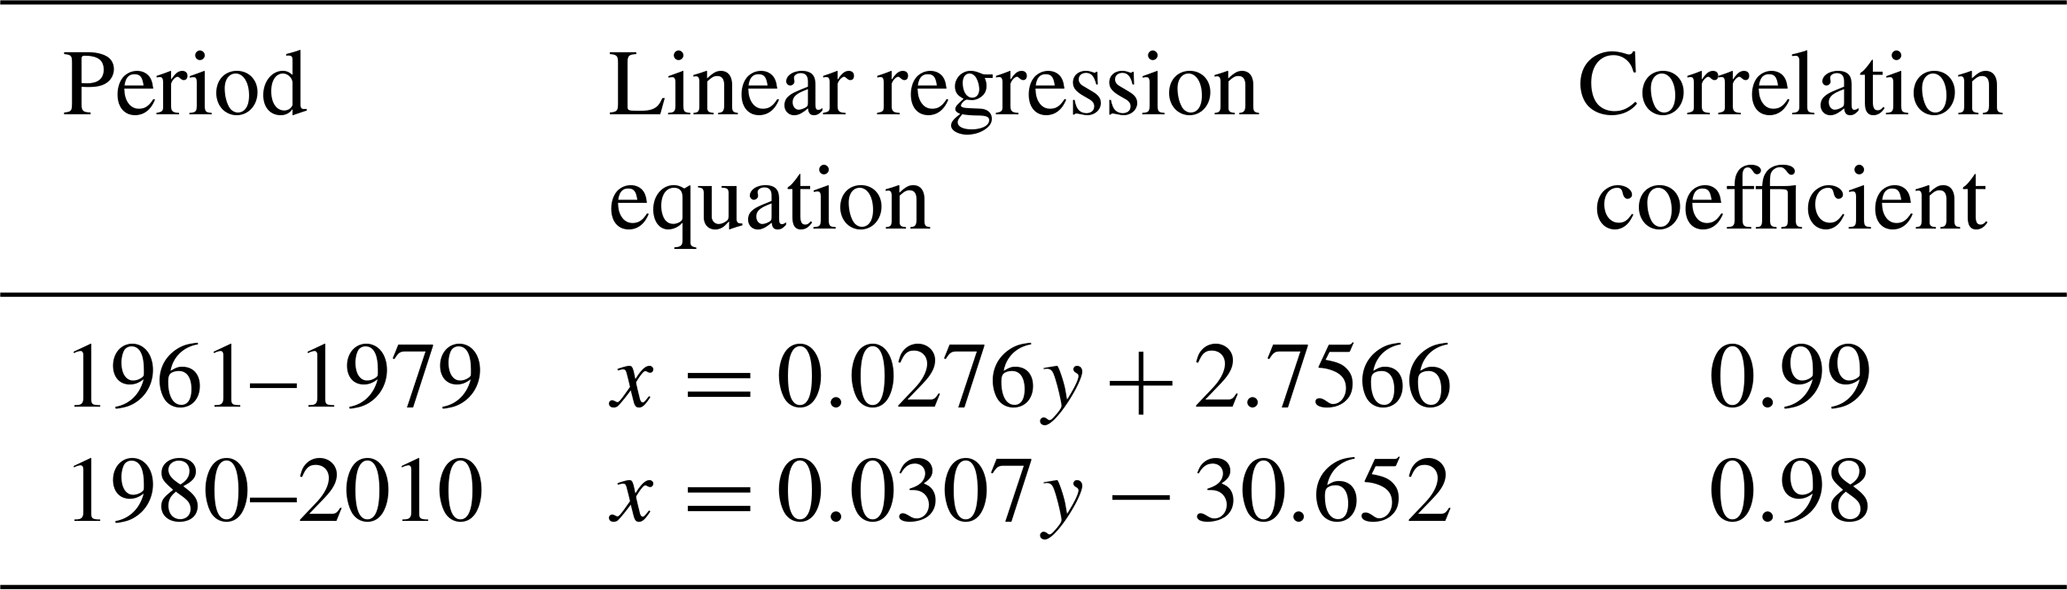
The effects of human activities are complex. To quantify the impact of human activities, the change point was identified, and then it was believed that the difference in the relationship between precipitation and runoff before and after the change point was caused by human activities. Moreover, the HI is easy to calculate and can approximately replace the influence of human activities. According to historical records, local human activities (such as land use change and reservoir construction) were regarded as the main factors influencing runoff (Yan et al., 2018; Chen et al., 2021). According to the above nonstationarity test results, 1979 was the change point, and the linear regression relationship of the cumulative rainfall and runoff series before and after the change point was established. The calculation results are shown in Table 3.
Table 3Linear regression relationship between cumulative precipitation (x per mm) and cumulative runoff (y per 106 m3).
The HI results for different timescales are shown in Fig. 5.
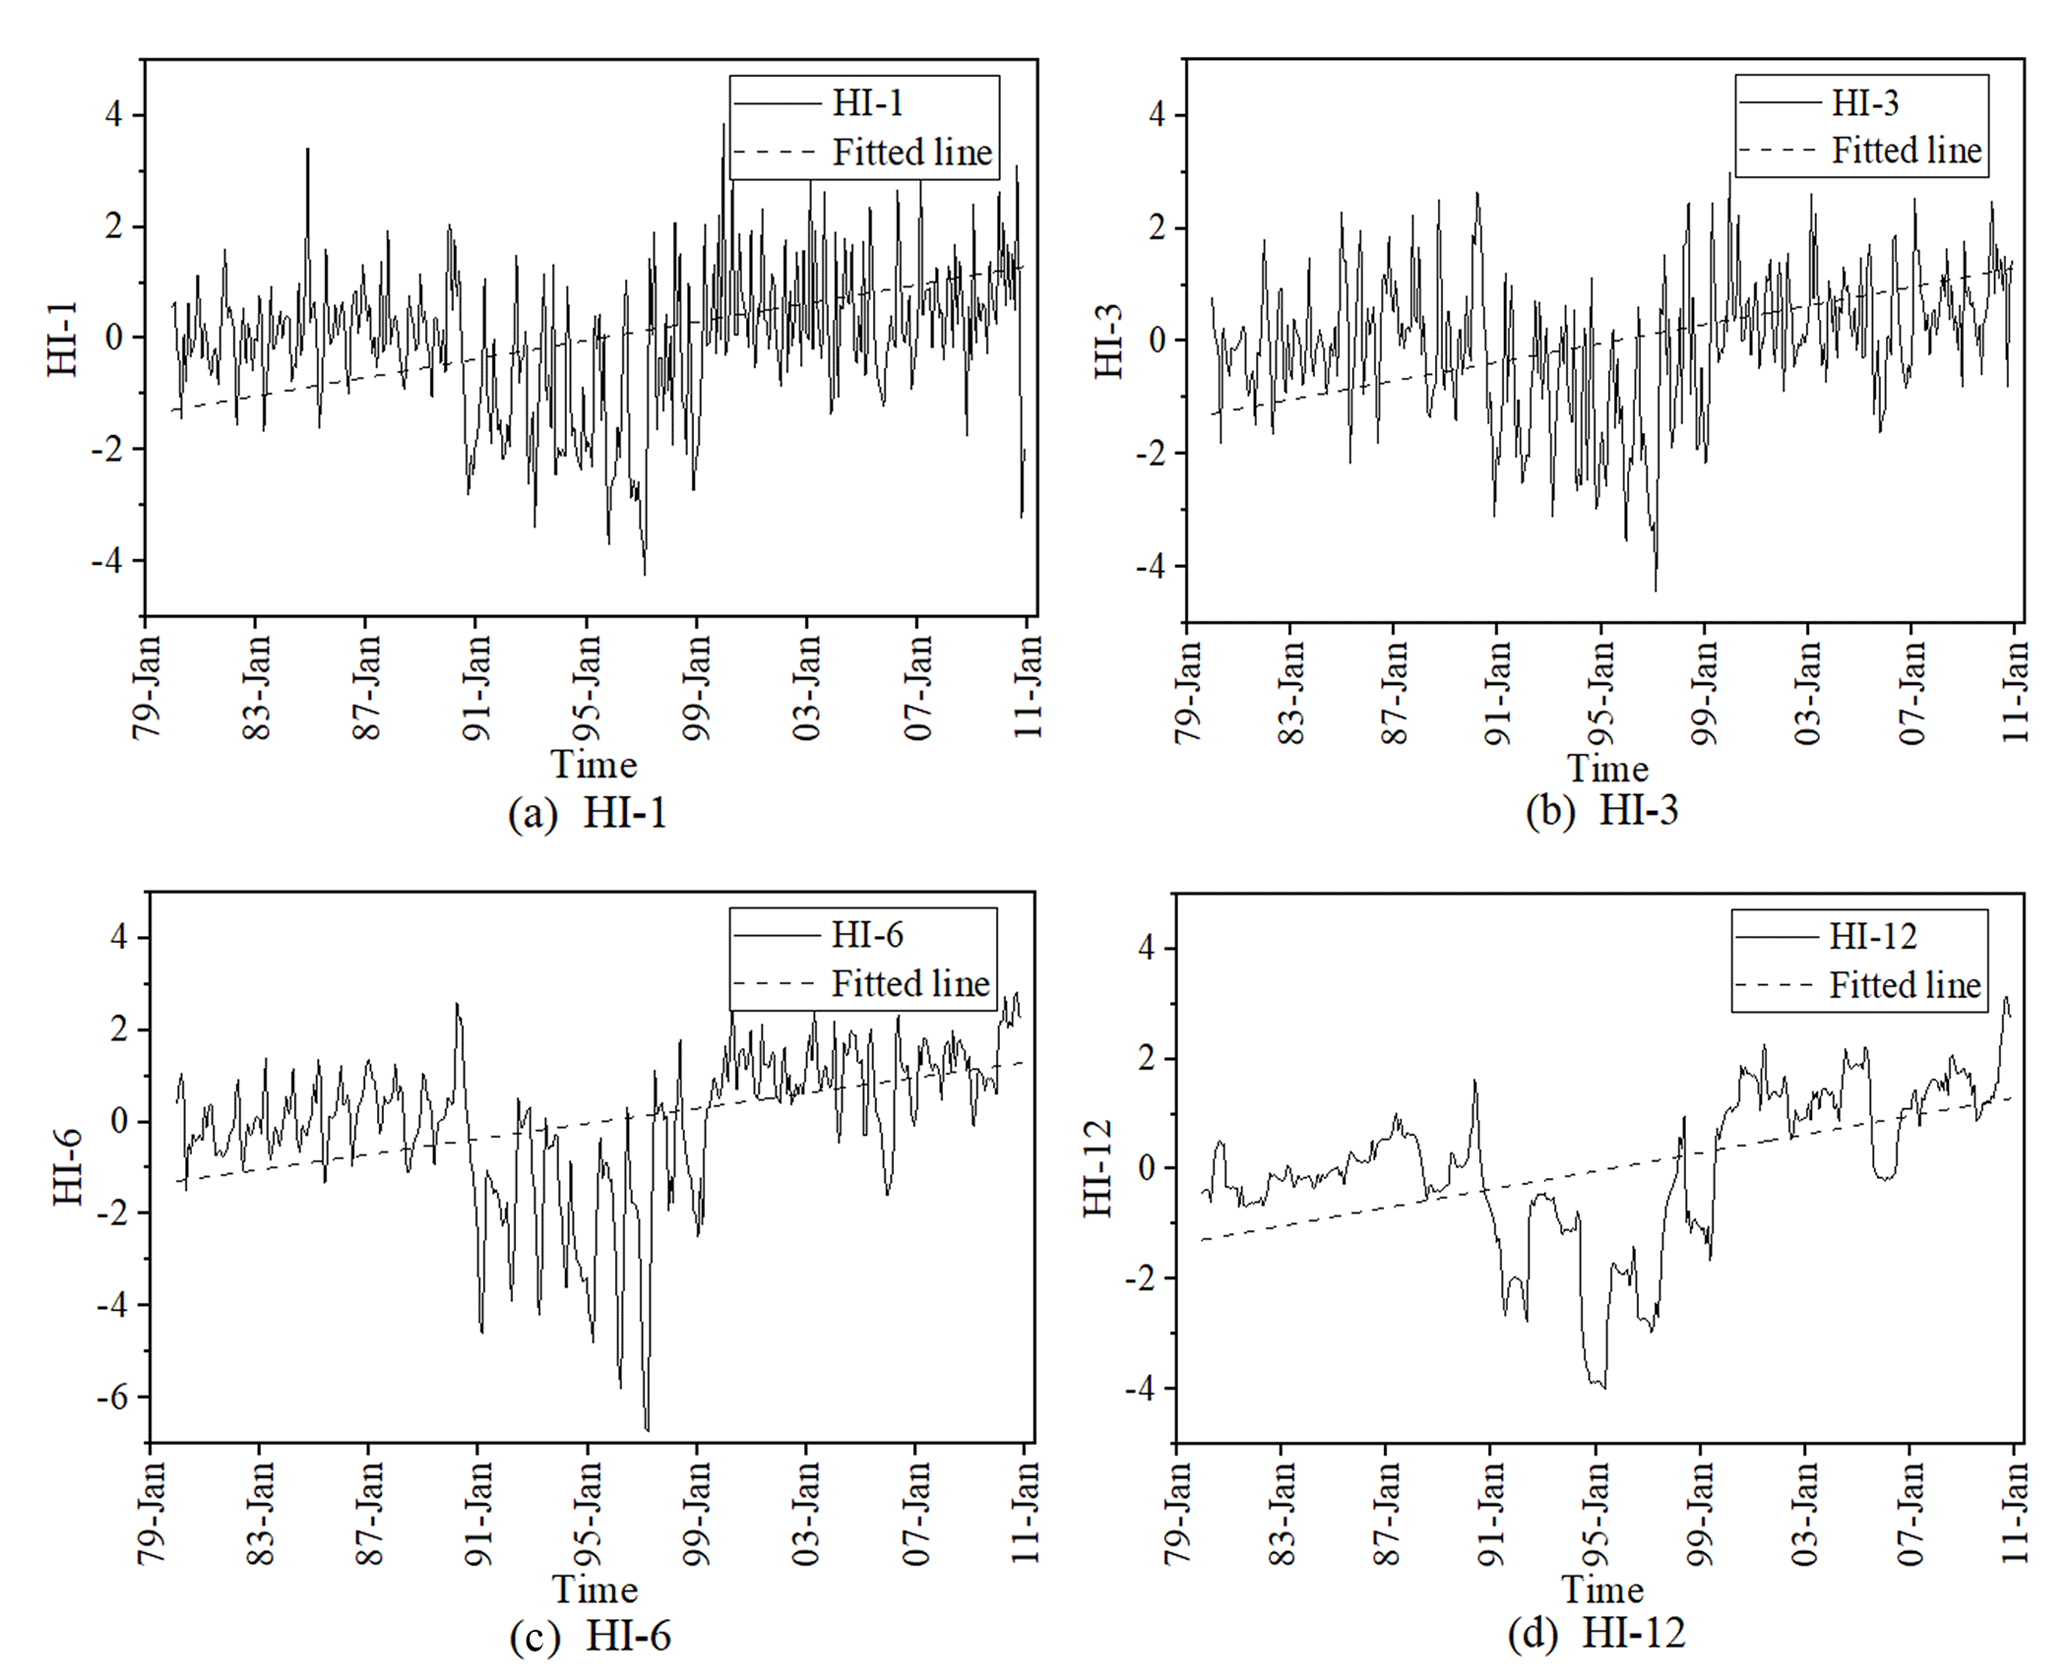
Figure 5Different average periods of the HI (HI-1: HI with a 1-month timescale; HI-3: HI with a 3-month timescale; HI-6: HI with a 6-month timescale; HI-12: HI with a 12-month timescale).
As shown in Fig. 5, the HI at all monthly scales generally ranged upwards, which means that human activities have intensified the occurrence of hydrological drought. According to historical statistics, many water conservancy projects were built in the basin from 1980 to 2000, and the construction and operation of large reservoirs in the mid-1990s may be the main reason for the serious negative values of the HI.
The HIs of different monthly scales were standardized, taking the 12-month timescale as an example, and the results were calculated as shown in Table 4.

Furthermore, the drought transition probabilities involving the HI can be calculated from Eq. (23). Using the forecast period of 1 month from December and the SPI timescale of 12 months as an example, the drought transition probabilities from the current SPI values to the future SRI classes were calculated (Fig. 6). To analyse the effect of human activities on the drought transition probability more clearly, the calculation results of the three models are compared here separately. The horizontal coordinate indicates the drought classes corresponding to the SRI for the coming month, and the vertical coordinate is the drought transition probability.

Figure 6Drought transition probability under the influence of human activities (C0 denotes the initial drought class of the SPI in the multivariate normal model; z0 represents the initial value of the SPI in the conditional distribution model; Model 1: the normal distribution model; Model 2: the conditional distribution model; Model 3: the conditional distribution model involving the HI).
In Fig. 6a, when the initial z0=0.75 and C0=N, the results shown in Model 1 and Model 2 were similar, and the probabilities of the SPI values transitioning to the SRI classes in the future month in the normal class were close to 1. However, the results of Model 3 indicated that the probabilities of maintaining the SRI in the normal class in the future decreased as the HI increased. When HI =2, the future hydrological drought classes were more likely to transition to severe drought or extreme drought.
From the initial and C0= Mo (Fig. 6b), the results of Model 3 showed that the transition probabilities of the SPI values to a normal SRI class in the coming month were higher when the HI was less than 1. As the HI increased, the transition probabilities of the SPI values to a moderate drought or even a more severe drought in the future increased. In addition, the probabilities of maintaining moderate drought were the highest when human activities were not considered, and Model 2 showed a higher probability than Model 1.
While the initial meteorological drought class was severe drought (Fig. 6c), the probabilities of the future SRI drought class being in the normal class became larger as the HI decreased. When the effect of human activities was not considered, the probability that the current SPI value transitioned to the SRI class under severe drought in the future month was the highest, and the probability of being in the normal class was the lowest. For Model 2, the probability of the SRI classes transitioning to severe drought was higher than the result of Model 1.
It was noteworthy that when the initial and C0= Es (Fig. 6d), the probabilities of transition of the SPI values to the future SRI classes at the normal class were close to 1 as HI<0. However, hydrological drought was more likely to be moderate drought or severe drought, as the HIs were greater than 0, and the transition probabilities exceeded 0.25. For Model 1 and Model 2, the probabilities of transition of the current SPI values or classes to the future month SRI classes in extreme drought were both higher than 0.75, and Model 2 showed a higher probability than Model 1.
In general, for the evaluation of drought transition probabilities in the future month, hydrological drought classes tended to be the same as meteorological drought when human activities were not considered, and this situation was more significant in Model 2 than in Model 1. The calculation results of the model involving the HI as an exogenous variable were significantly different from those of the models that did not consider human activities. The calculation results of Model 1 and Model 2 showed that the future hydrological drought classes were more likely to be the same as the meteorological drought classes in the current period, and they were more significant in Model 2. In addition, it was obvious that the drought transition probabilities of Model 3 were significantly different from those of Model 1 and Model 2. Taking Fig. 6b as an example, when and C0= Mo, the result of Model 1 showed that the probability of the SPI values transitioning to the SRI classes in the future month in the normal class was close to 0.15, the result of Model 2 was close to 0, and the result of Model 3 (HI =0) was close to 0.95. The results of Model 3 (HI =0) indicated that hydrological drought was likely to remain at the normal class in the future month. Moreover, the value of the HI had a great impact on the results of Model 3; for example, when HI or −1, the probabilities of the SPI values transitioning to the SRI classes in the future month in the normal class were both close to 1, but the probability was close to 0.65 and 0.17 when HI =1 and 2, respectively.The results further indicated that meteorological drought tended to turn into more severe hydrological drought with increasing HI values.
4.4 Model evaluation and analysis
To quantitatively evaluate the prediction accuracy of Model 1, Model 2 and Model 3, the study period was divided into a correction period (1961–2003) and a verification period (2004–2010), and then the drought transition probability from the SPI value or class to the SRI class in the future M-month was calculated. The calculation results are shown in Table 5.
Table 5Model evaluation (Model 1: multivariate normal distribution model; Model 2: conditional distribution model; Model 3: conditional distribution model with the HI).
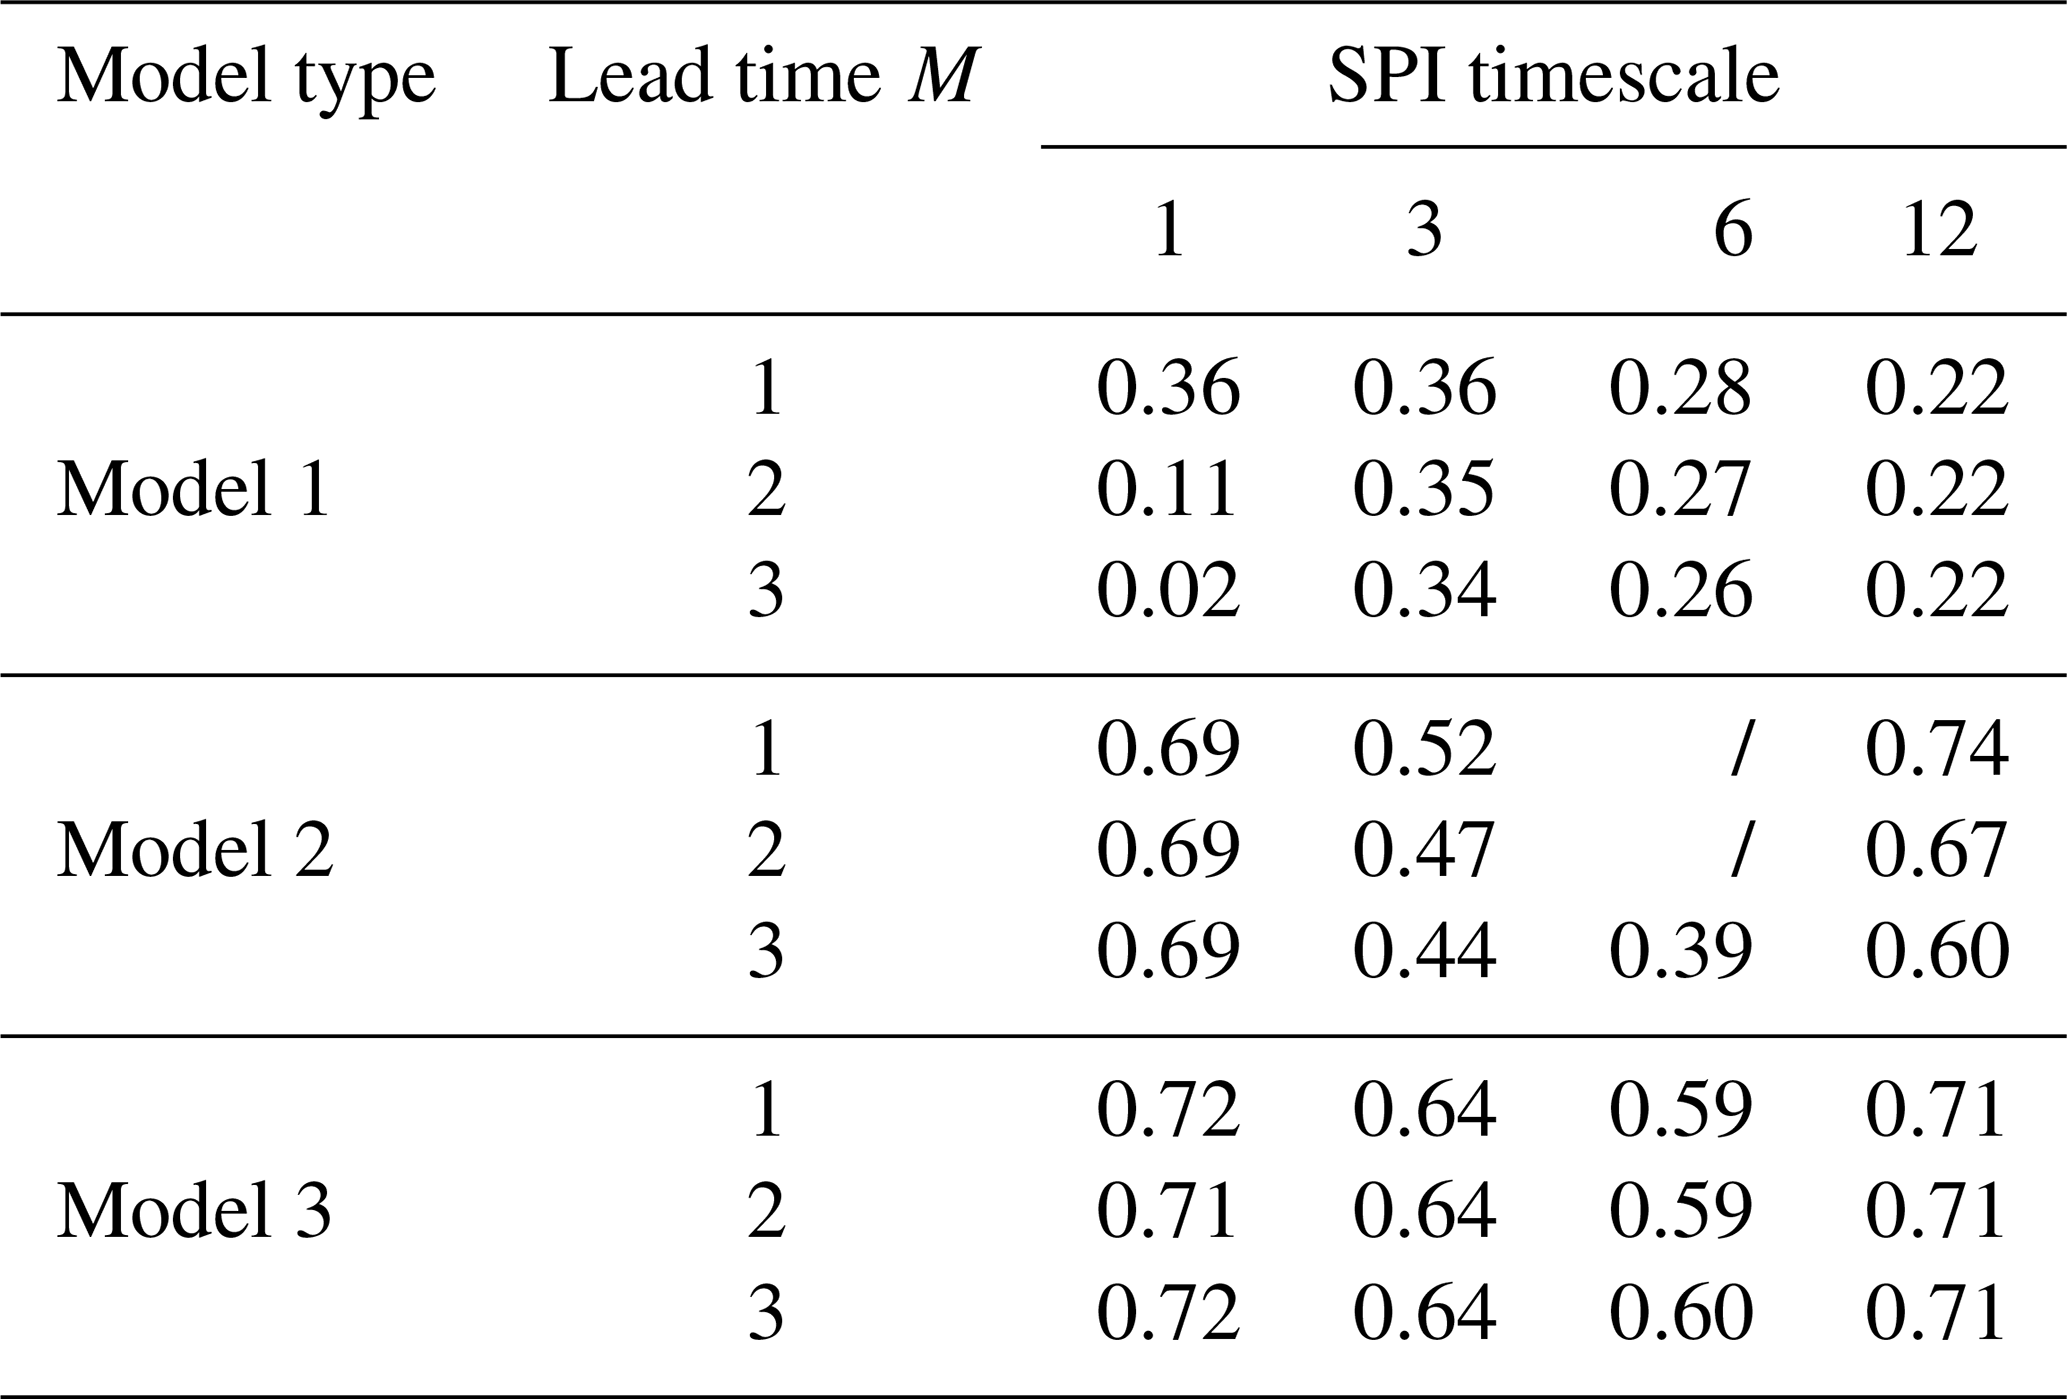
With the same timescale of the SPI, the model scores of Model 1 and Model 2 decreased as the forecast period M lengthened, while the model scores of Model 3 were not significantly affected by the forecast period M. Model 1 had the highest rating of 0.36 at an SPI of a 1-month timescale and a forecast period of 1 month; Model 2 reached the highest model rating of 0.74 at a 12-month timescale and a forecast period of 1 month; and Model 3 performed well at an SPI of 1-month timescale and a 12-month timescale. Overall, Model 3 had the highest rating, and Model 1 had the lowest rating for the same SPI timescale and the same forecast period, which also indicated that the forecast accuracy of the conditional distribution model considering the HI was higher for short-term forecasts with a forecast period of 3 months or less, and including the HI could further improve the forecast accuracy of the model.
Many studies have noted that human activities have a significant impact on watershed runoff in the Luanhe River basin. In this paper, three probability models were constructed to calculate the transition probabilities from the current SPI classes or values to the future SRI classes; then, a scoring mechanism was applied to evaluate the performance of the models.
The calculation results of Model 1 and Model 2 showed that the future hydrological drought classes were more likely to be the same as the meteorological drought classes in the current period, and they were more significant in Model 2. In addition, it was obvious that the drought transition probabilities of Model 3 were significantly different from those of Model 1 and Model 2. Under the condition of considering the HI, the results of the drought transition probability showed that when HI <0, the future hydrological drought classes tended to normal status, and this situation was more obvious with the decrease in the HI values, which indicates that human activities mitigate the degree of hydrological drought when HI <0. However, when HI >0, the future hydrological drought classes generally transitioned to more severe drought with increasing HI values. Thus, it was indicated that human activities exacerbate the degree of hydrological drought as HI >0.
Finally, a scoring mechanism was applied to the evaluation of the models, and the forecast results of the three models were evaluated. The results demonstrate that when the SPI timescale was the same, the scores of Model 1 and Model 2 decreased as the forecast period lengthened. In most cases, Model 2 performed better than Model 1, and the performance of Model 3 was the most stable of the three models and had the highest score. The conditional probability model considering the HI was more suitable for the Luanhe River basin, where human activities have a high influence.
Although this study has made some progress in the forecasting of hydrological drought in a changing environment, only the HI was considered as the exogenous variable in this paper, and human activities were generalized. In future studies, the HI can be analysed specifically. For example, the impact of land use and socioeconomics on drought prediction can be specifically analysed. In addition, climate factors can be further considered in future research.
The data and materials of the research are available from the Hydrology and Water Resource Survey Bureau of Hebei Province.
ML (first author and corresponding author): conceptualization, methodology, software, investigation, formal analysis, writing – original draft; MZ: data curation, writing – original draft; RC: visualization, investigation; YS: resources, supervision; XD: visualization, writing – review and editing. ML, MZ, RC, YS and XD all agreed to participate in the research for the article. ML, MZ, RC, YS and XD all agreed to publish this article.
The contact author has declared that none of the authors has any competing interests.
Publisher’s note: Copernicus Publications remains neutral with regard to jurisdictional claims in published maps and institutional affiliations.
We are grateful to the Hydrology and Water Resource Survey Bureau of Hebei Province for providing runoff data. This work was supported by the State Key Laboratory of Hydraulic Engineering Simulation and Safety (Tianjin University) program.
This research has been supported by the State Key Laboratory of Hydraulic Engineering Simulation and Safety (Tianjin University) (grant nos. HESS-2206 and HESS-2222).
This paper was edited by Brunella Bonaccorso and reviewed by Fawen Li and two anonymous referees.
Abbasi, A., Khalili K., Behmanesh, J., and Shirzad, A.: Estimation of ARIMA model parameters for drought prediction using the genetic algorithm, Arab. J. Geosci., 14, 841–841, https://doi.org/10.1007/s12517-021-07140-0, 2021.
Aghelpour, P. and Varshavian, V.: Forecasting Different Types of Droughts Simultaneously Using Multivariate Standardized Precipitation Index (MSPI), MLP Neural Network, and Imperialistic Competitive Algorithm (ICA), Complexity, 2021, 6610228, https://doi.org/10.1155/2021/6610228, 2021.
Ahnadi, M.: Climatic drought forecasting using artificial neural network in Hamedan region, New York Science Journal, 4, 15–19, https://doi.org/10.7537/marsnys040811.03, 2011.
Alquraish, M. A., Abuhasel, K. S., and Alqahtani, A. K.: SPI-Based Hybrid Hidden Markov–GA, ARIMA–GA, and ARIMA–GA–ANN Models for Meteorological Drought Forecasting, Sustainability, 13, 12576–12576, https://doi.org/10.3390/su132212576, 2021.
Behzad, A. and Hamid, M.: Revisiting hydrological drought propagation and recovery considering water quantity and quality, Hydrol. Process., 33, 1492–1505, https://doi.org/10.1002/hyp.13417, 2019.
Bishara, A. J. and Hittner, J. B.: Testing the significance of a correlation with nonnormal data: comparison of Pearson, Spearman, transformation, and resampling approaches, Psychol. Methods, 17, 399–417, https://doi.org/10.1037/a0028087, 2012.
Bonaccorso, B., Cancelliere, A., and Rossi, G.: Probabilistic forecasting of drought class transitions in Sicily (Italy) using Standardized Precipitation Index and North Atlantic Oscillation Index, J. Hydrol., 526, 136–150, https://doi.org/10.1016/j.jhydrol.2015.01.070, 2015.
Cammalleri, C. and Vogt, J. V.: Non-stationarity in MODIS fAPAR time-series and its impact on operational drought detection, Int. J. Remote Sens., 40, 1428–1444, https://doi.org/10.1080/01431161.2018.1524603, 2018.
Cancelliere, A., Di Mauro, G., and Bonaccorso, B.: Drought forecasting using the standardized precipitation index, Water Resour. Manage., 21, 801–819, https://doi.org/10.1007/s11269-006-9062-y, 2007.
Chang, G. B., Zhang, S. B., and Liu, Z. P.: Understanding the adjusment from an information theoretic perspective, Geomatics and Information Science of Wuhan University, 2022, 1–17, https://kns.cnki.net/kcms/detail/42.1676.TN.20211125.1422.006.html (last access: 25 November 2021), 2022 (in Chinese).
Chen, J., Brissette, F. P., Chaumont, D., and Braun, M.: Performance and uncertainty evaluation of empirical downscaling methods in quantifying the climate change impacts on hydrology over two North American river basins, J. Hydrol., 479, 200–214, https://doi.org/10.1016/j.jhydrol.2012.11.062, 2013.
Chen, X., Han, R. G., Feng, P., and Wang, Y. J.: Combined effects of predicted climate and land use changes on future hydrological droughts in the Luanhe River basin, China, Nat. Hazards, 2021, 1–33, https://doi.org/10.1007/s11069-021-04992-3, 2021.
Dehghani, M., Saghafian, B., and Zargar, M.: Probabilistic hydrological drought index forecasting based on meteorological drought index using Archimedean copulas, Hydrol. Res., 50, 1230–1250, https://doi.org/10.2166/nh.2019.051, 2019.
Ding, Y. B., Xu, J. T., Wang, X. W., Cai, H. J., Zhou, Z. Q., Sun, Y. N., and Shi, H. Y.: Propagation of meteorological to hydrological drought for different climate regions in China, J. Environ. Manag., 283, 111980, https://doi.org/10.1016/j.jenvman.2021.111980, 2021.
Dixit, S. and Jayakumar, K. V.: A Non-stationary and Probabilistic Approach for Drought Characterization Using Trivariate and Pairwise Copula Construction (PCC) Model, Water Resour. Manag., 36, 1217–1236, https://doi.org/10.1007/s11269-022-03069-5, 2022.
Fendeková, M., Gauster, T., Labudová, L., Vrablíková, D., Danáčová, Z., Fendek, M., and Pekárová, P.: Analysing 21st century meteorological and hydrological drought events in Slovakia, J. Hydrol. Hydromech., 66, 393–403, https://doi.org/10.2478/johh-2018-0026, 2018.
Fuentes, I., Padarian, J., and Vervoort, R. W.: Spatial and Temporal Global Patterns of Drought Propagation, Frontiers in Environmental Science, 10, 788248, https://doi.org/10.3389/fenvs.2022.788248, 2022.
Gong, H. N., Xie, B. T., and Wang J. R.: Long-term prediction of extreme response of deepwater floating platform based on environmental contour method, Ocean Eng., 39, 28–38, https://doi.org/10.16483/j.issn.1005-9865.2021.05.003, 2021 (in Chinese).
Jehanzaib, M., Shah, S. A., Yoo, J., and Kim, T.-W.: Investigating the impacts of climate change and human activities on hydrological drought using non-stationary approaches, J. Hydrol., 588, 125052, https://doi.org/10.1016/j.jhydrol.2020.125052, 2020.
Kolachian, R. and Saghafian, B.: Hydrological drought class early warning using support vector machines and rough sets, Environ. Earth Sci., 80, 390–390, https://doi.org/10.1007/s12665-021-09536-3, 2021.
Koudahe, K., Koffi, D., Kayode, J. A., Awokola, S. O., and Adebola, A. A.: Impact of Climate Variability on Crop Yields in Southern Togo, Environment Pollution and Climate Change, 2, 1–9, https://doi.org/10.4172/2573-458X.1000148, 2018.
Li, J. Z., Wang, Y. X., Li, S. F., and Hu, R.: A Nonstationary Standardized Precipitation Index incorporating climate indices as covariates, J. Geophys. Res.-Atmos., 120, 12082–12095, https://doi.org/10.1002/2015JD023920, 2015.
Li, L. C., Yao, N., Li, Y., Liu, D. L., Wang, B., and Ayantobo, O. O.: Future projections of extreme temperature events in different sub-regions of China, Atmos. Res., 217, 150–164, https://doi.org/10.1016/j.atmosres.2018.10.019, 2018.
Li, X., Fang, G. H., Wen, X., Xu, M., and Zhang, Y.: Characteristics analysis of drought at multiple spatiotemporal scale and assessment of CMIP6 performance over the Huaihe River Basin, Journal of Hydrology: Regional Studies, 41, 101–103, https://doi.org/10.1016/j.ejrh.2022.101103, 2022.
Li, X. X., Ma, X. X., Li, X. D., and Zhang, W. J.: Method Consideration of Variation Diagnosis and Design Value Calculation of Flood Sequence in Yiluo River Basin, China, Water, 12, 2722–2722, https://doi.org/10.3390/w12102722, 2020.
Malede, D. A., Agumassie, T. A., Kosgei, J. R., Linh, N. T. T., and Andualem, T. G.: Analysis of rainfall and streamflow trend and variability over Birr River watershed, Abbay basin, Ethiopia, Environmental Challenges, 7, 100528, https://doi.org/10.1016/j.envc.2022.100528, 2022.
Mallya, G., Tripathi, S., Kirshner, S., and Govindaraju, R. S.: Probabilistic Assessment of Drought Characteristics Using Hidden Markov Model, J. Hydrol. Eng., 18, 834–845, https://doi.org/10.1061/(ASCE)HE.1943-5584.0000699, 2013.
McKee, T. B., Doesken, N. J., and Kleist, J.: The relationship of drought frequency and duration to time scale, in: Proceedings of the Eighth Conference on Applied Climatology, American Meteorological Society, 179–184, 1993.
Moghimi, M. M., Zarei, A. R., and Mahmoudi, M. R.: Seasonal drought forecasting in arid regions, using different time series models and RDI index, J. Water Clim. Change, 11, 633–654, https://doi.org/10.2166/wcc.2019.009, 2020.
Mokhtarzad, M., Eskandari, F., Jamshidi Vanjani, N., and Arabasadi, A.: Drought forecasting by ANN, ANFIS, and SVM and comparison of the models, Environ. Earth Sci., 76, 729–729, https://doi.org/10.1007/s12665-017-7064-0, 2017.
Natsagdorj, E., Renchin, T., Maeyer, P. D., and Darkhijav, B.: Spatial Distribution of Soil Moisture in Mongolia Using SMAP and MODIS Satellite Data: A Time Series Model (2010–2025), Remote Sensing., 13, 347–347, https://doi.org/10.3390/RS13030347, 2021.
Oertel, M., Meza, F. J., Gironás, J., Scott, C. A., Rojas, F., and Pineda-Pablos, N.: Drought Propagation in Semi-Arid River Basins in Latin America: Lessons from Mexico to the Southern Cone, Water, 10, 1564–1564, https://doi.org/10.3390/w10111564, 2018.
Onyutha, C.: On Rigorous Drought Assessment Using Daily Time Scale: Non-Stationary Frequency Analyses, Revisited Concepts, and a New Method to Yield Non-Parametric Indices, Hydrology, 4, 48–48, https://doi.org/10.3390/hydrology4040048, 2017.
Ren, W., Wang, Y., Li, J., Feng, P., and Smith, R. J.: Drought forecasting in Luanhe River basin involving climatic indices, Theor. Appl. Climatol., 130, 1133–1148, https://doi.org/10.1007/s00704-016-1952-1, 2017.
Rezaeianzadeh, M., Stein, A., and Cox, J. P.: Drought Forecasting using Markov Chain Model and Artificial Neural Networks, Water Resour. Manag., 30, 2245–2259, https://doi.org/10.1007/s11269-016-1283-0, 2016.
Shukla, S. and Wood, A. W.: Use of a standardized runoff index for characterizing hydrologic drought, Geophys. Res. Lett., 35, L02405, https://doi.org/10.1029/2007GL032487, 2008.
Stojković, M., Plavšić, J., Prohaska, S., Pavlović, D., and Despotović, J.: A two-stage time series model for monthly hydrological projections under climate change in the Lim River basin (southeast Europe), Hydrolog. Sci. J., 65, 387–400, https://doi.org/10.1080/02626667.2019.1699241, 2020.
Vicente-Serrano, S., Beguería, S., and López-Moreno, J.: A Multiscalar Drought Index Sensitive to Global Warming: The Standardized Precipitation Evapotranspiration Index, J. Climate, 23, 1696–1718, https://doi.org/10.1175/2009JCLI2909.1, 2010.
Wang, M., Jiang, S., Ren, L., Xu, C.-Y., Menzel, L., Yuan, F., Xu, Q., Liu, Y., and Yang, X.: Separating the effects of climate change and human activities on drought propagation via a natural and human-impacted catchment comparison method, J. Hydrol., 603, 126913, https://doi.org/10.1016/j.jhydrol.2021.126913, 2021.
Wang, Y., Li, J., Feng, P., and Chen, F.: Effects of large-scale climate patterns and human activities on hydrological drought: a case study in the Luanhe River basin, China, Nat. Hazards, 76, 1687–1710, https://doi.org/10.1007/s11069-014-1564-y, 2015.
Wang, Y., Li, J., Feng, P., and Hu, R.: Analysis of drought characteristics over Luanhe River basin using the joint deficit index, J. Water Clim. Change, 7, 340–352, https://doi.org/10.2166/wcc.2015.108, 2016.
Wang, Y., Zhang, T., Chen, X., Li, J., and Feng, P.: Spatial and temporal characteristics of droughts in Luanhe River basin, China, Theor. Appl. Climatol., 131, 1369–1385, https://doi.org/10.1007/s00704-017-2059-z, 2018.
Wang, Y., Duan, L., Liu, T., Li, J., and Feng, P.: A Non-stationary Standardized Streamflow Index for hydrological drought using climate and human-induced indices as covariates, Sci. Total Environ., 699, 134278, https://doi.org/10.1016/j.scitotenv.2019.134278, 2020.
Wang, Y., Peng, T., Lin, Q., Singh, V., Dong, X., Chen, C., Liu, J., Chang, W., and Wang, G.: A New Non-stationary Hydrological Drought Index Encompassing Climate Indices and Modified Reservoir Index as Covariates, Water Resour. Manag., 36, 2433–2454, https://doi.org/10.1007/S11269-022-03151-Y, 2022.
Xu, Y., Zhang, X., Wang, Xiao., Hao, Z., Singh, V., and Hao, F.: Propagation from meteorological drought to hydrological drought under the impact of human activities: A case study in northern China, J. Hydrol., 579, 124147, https://doi.org/10.1016/j.jhydrol.2019.124147, 2019.
Yan, X., Bao, Z., Zhang, J., Wang, G., He, R., and Liu, C.: Quantifying contributions of climate change and local human activities to runoff decline in the upper reaches of the Luanhe River basin, J. Hydro-Environ. Res., 28, 67–74, https://doi.org/10.1016/j.jher.2018.11.002, 2018.
Zhang, T., Li, J., Hu, R., Wang, Y., and Feng, P.: Drought class transition analysis through different models: a case study in North China, Water Supply, 17, 138–150, https://doi.org/10.2166/ws.2016.123, 2017.
Zhao, G., Gao, H. L., Kao, S. C., Nathalie, V., and Bibi, S. N.: A modeling framework for evaluating the drought resilience of a surface water supply system under non-stationarity, J. Hydrol., 563, 22–32, https://doi.org/10.1016/j.jhydrol.2018.05.037, 2018.