the Creative Commons Attribution 4.0 License.
the Creative Commons Attribution 4.0 License.
 | 06 Apr 2023
Review article: Design and evaluation of weather index insurance for multi-hazard resilience and food insecurity
Marcos Roberto Benso
Gabriela Chiquito Gesualdo
Roberto Fray Silva
Greicelene Jesus Silva
Luis Miguel Castillo Rápalo
Fabricio Alonso Richmond Navarro
Patricia Angélica Alves Marques
José Antônio Marengo
Eduardo Mario Mendiondo
Ensuring food security against climate risks has been a growing challenge recently. Weather index insurance has been pointed out as a tool for increasing the financial resilience of food production. However, the multi-hazard insurance design needs to be better understood. This paper aims to review weather index insurance design for food security resilience, including the methodology for calculating natural hazards' indices, vulnerability assessment, and risk pricing. We searched for relevant research papers in the Scopus database using the Preferred Reporting Items for Systematic reviews and Meta-Analyses (PRISMA) protocol. Initially, 364 peer-reviewed papers from 1 January 2010 to 19 February 2022 were screened for bibliometric analysis. Then, the 26 most relevant papers from the last 5 years were systematically analyzed. Our results demonstrate that despite a significant research effort on index insurance, most papers focused on food production. However, research considering other aspects of food security, such as transportation, storage, and distribution, is lacking. Most research focuses on droughts. Other hazards, such as extreme temperature variation, excessive rainfall, and wildfires, were poorly covered. Most studies considered only single-hazard risk, and the multi-hazard risk studies assumed independence between hazards, neglecting the synergy hypothesis between hazards. Lastly, we proposed a conceptual framework that illustrates design paths for a generalized weather index insurance design and evaluation. Solutions for addressing multi-hazard problems are considered. An illustrative example demonstrates the importance of testing the multi-hazard risk hypothesis for weather-based index insurance design for soybean production in Brazil.
- Article
(1547 KB) - Full-text XML
-
Supplement
(383 KB) - BibTeX
- EndNote


The increased frequency and magnitude of extreme weather and climate events have been evidenced in many regions of the globe, being widely attributed to climate change (IPCC, 2022). In recent years, extreme weather events have caused significant losses and damages in many climate-sensitive sectors, affecting urban and rural areas. Insurance is essential to provide economic sustainability to vulnerable sectors and to improve recovery from catastrophic climate events.
Insurance has been pointed out as a tool for safeguarding populations and properties from climate change (UNEP FI, 2012). Nevertheless, Kraehnert et al. (2021) argue that insurance itself is not an adaptation measure and depends on several characteristics and factors. Some relevant factors are living standards, economic well-being, the availability of safety nets for poor people, characteristics of the sector, and the types of risks that sectors are exposed to (FAO, 2014).
Swiss Re (2021) predicts non-life insurance premiums to rise 10 % above the pre-pandemic state and acknowledges that climate change might have an even more significant impact on the insurance industry. They propose that increasing underwriting policies against climate-related disasters is vital to tackle this problem.
However, the challenge might be more significant in developing countries with lower insurance coverage. On the one hand, the premiums per capita in the United States and Canada were USD 7270 in 2020, which is much higher than the world average of USD 809 per capita and the eurozone average of USD 2723. Conversely, Latin America, the Caribbean, emerging Europe, and Asia presented premiums of USD 203, 159, and 215 per capita, respectively. Africa and the emerging Middle East presented much lower numbers of USD 45 and 93 per capita, respectively (Swiss Re, 2021).
Index-based insurance policy is a solution to improve insurance coverage, especially in low-income areas (Raucci et al., 2019). The term index insurance started being used for crop yield insurance policies based on area-yield indices as first described by Halcrow (1949) and then further revisited by Miranda (1991). The area-yield insurance model was adopted in the United States in the early 1990s, dividing agricultural areas in the crop domain into group risk plans (GRPs). Indemnities were triggered when forecasted crop yields would fall under a certain threshold within each GRP (Skees, 2008).
Area-yield contracts depend on data availability and technical capacity to evaluate and monitor the group risk units, which can be costly and impractical in many poor and developing countries. To overcome this challenge, researchers proposed contracts based on weather indices (Müller and Grandi, 2000).
In the financial and actuarial literature, weather derivatives have been used to associate the financial frustration of a business with a weather index (Müller and Grandi, 2000). Contracts based on weather indices have helped policyholders to hedge against adverse conditions in the clothing business (Štulec et al., 2019), hydropower plants (Foster et al., 2015), and solar energy systems (Boyle et al., 2021). Crop yield contracts based on rainfall have been used due to their simplicity and data availability (Yoshida et al., 2019). The method uses rainfall from weather stations nearby farms to predict losses, and the threshold is usually defined according to an index in the growing season.
This type of contract almost eliminates the need for on-site verification of losses, reducing administrative costs and improving the transparency of insurance products (Shirsath et al., 2019). Insurance companies also benefit from reducing moral hazards, since crop losses are estimated from indices provided by third-party agencies (Ghosh et al., 2021). Moreover, due to reduced costs, contracts based on weather indices have been used for microinsurance contracts in poor rural areas to improve protection against adverse climate conditions and to prevent smallholder farmers from falling into poverty traps (Skees, 2008). Despite its advantages, index insurance has a particular side effect called basis risk, which is a mismatch between actual losses and predicted losses (Ghosh et al., 2021).
As expected from the relevance of agriculture in the insurance industry, most literature reviews focus on understanding index insurance and microinsurance for agriculture (Leblois et al., 2014; Sarris, 2013). Zara (2010) proposed a systematic review of the role of weather derivatives in the wine industry. Akter (2012) focused on reviewing problems of microinsurance in Bangladesh, looking for evidence for insurance demand, how to approach the market, and design challenges to improve the safety of vulnerable populations, especially for smallholder farmers.
Several studies have reported on single-hazard risk insurance design. Considering only one hazard does not include the expression of risk due to interactions among different hazards (Gill and Malamud, 2014; Hillier et al., 2020). Insurance risk assessment and climate change impacts have recently been reviewed by Lyubchich et al. (2019). The authors review several adverse events such as floods, hail, and excessive wind, but the interaction effect between hazards could be explored further.
Sekhri et al. (2020) proposed a framework for multi-hazard risk management. However, it was too specific for mountainous regions and a broader risk management strategy. Komendantova et al. (2014) introduced a framework for participatory risk governance, allowing for feedback from stakeholders. Abdi et al. (2022) conducted an extensive review of the possible index insurance applications for agriculture. The authors summarized indices and methods for designing index insurance with possible applications for multi-hazard risks. However, multi-hazard implementation has not been nearly as thoroughly investigated as single-hazard problems.
Considering this initial analysis, this paper thoroughly analyzes the literature, further describes the identified gaps, and proposes a framework for addressing multi-hazard index-based insurance design for agricultural purposes. The systematic review was designed to answer the following questions, considering the context of index insurance: (1) what indices are used to assess and monitor extreme weather events? (2) What functions and methods are used to assess the vulnerability of food production to extreme weather events, and (3) how are risk premiums determined?
The paper is organized into the following sections: Sect. 2 presents the methodology used to conduct the systematic literature review; Sect. 3 reports the main findings of the literature review, discusses the most relevant papers, presents the proposed framework for insurance design, and illustrates its use with an example for soybean production in Brazil; and Sect. 4 concludes the paper, pointing out limitations and recommended future works.
A systematic review was conducted to better identify state-of-the-art designing and implementing of multi-hazard index-based insurance in agricultural environments and to identify the main gaps in current techniques and models. The Preferred Reporting Items for Systematic reviews and Meta-Analyses (PRISMA) protocol (Liberati et al., 2009) was applied, and the Scopus database was used for data collection.
This database was chosen due to its comprehensive coverage of relevant events and scientific journals related to climate change, agriculture, insurance design, and multi-hazard frameworks and techniques among other relevant topics. It encompasses a wide range of subjects in technology, science, social sciences, medicine, humanities, and arts (Scopus, 2022).
We performed the literature review following the PRISMA protocol (Liberati et al., 2009). First, a bibliometric analysis was performed on the selected papers from 1 January 2010 to 19 February 2022 using the Bibliometrix R package (Aria and Cuccurullo, 2017). Then, a critical analysis of the most cited papers of the last 5 years (2018 to 2022) was performed to identify fundamental research topics, themes, keywords, and guidelines for index insurance design and evaluation and to identify the main gaps in the literature.
The systematic review process was divided into four steps (Fig. 1). The first consisted of defining the search strings based on the three research questions described in Sect. 1. Our search string was composed of keywords in the English language extracted from an in-depth analysis of relevant literature reviews and papers on the topic. It was then used to search terms in the documents' title, abstract, and keywords in the Scopus database. The following criteria were considered:
-
English keywords: multi-risk weather index insurance.
-
English synonyms: multi-risk, risk, weather, climate, index, parametric, insurance, microinsurance, derivative.
-
Search string: TITLE-ABS-KEY ((risk (multi AND risk) OR portfolio) OR (index OR parametric) AND (insurance OR microinsurance OR derivative) AND (weather OR climate)).
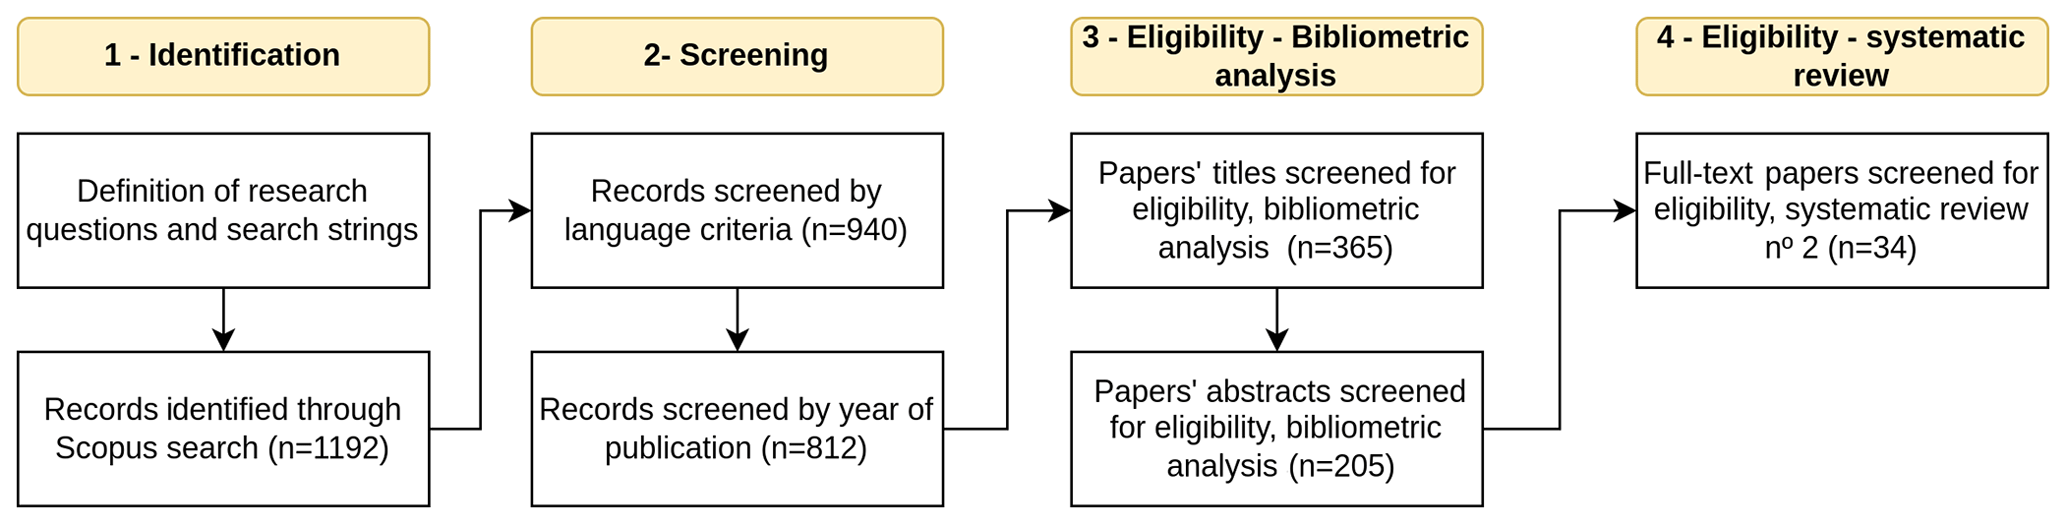
The second step was the screening process. First, we selected only scientific papers published in peer-reviewed journals in English, Portuguese, or Spanish. Review papers, books, book chapters, and conference proceedings were excluded from the analysis, following the methodology used in other systematic reviews in the literature. This step resulted in 1192 documents.
In the third step, an analysis of the documents' titles and abstracts was conducted to filter only works that designed or implemented a complete application of an index insurance or weather derivative. Many studies on the evaluation of demand for index insurance, and traditional insurance models were excluded. This step resulted in 365 documents. Then, several tools used for bibliometric analysis were applied to this dataset.
The fourth step was performing a critical review of the 26 most cited papers published in the last 5 years of the dataset (2018 to 2022). This evaluation excluded papers that did not provide information on index insurance design. This review was divided into (i) hazard identification, (ii) vulnerability analysis, and (iii) financial method and risk pricing analyses. These three modules were adapted from the frameworks developed by Guzmán et al. (2020), Mohor and Mendiondo (2017), and Righetto et al. (2007), which encompass the main aspects of weather-based insurance design.
Before analyzing the full papers, it is critical to specify the main concepts and definitions. Although there are many definitions for concepts such as hazard, multi-hazard, resilience, and food security, we chose to adopt the most broadly accepted ones. These were the following:
-
Hazard. “A dangerous phenomenon, substance, human activity or condition that may cause loss of life, injury or other health impacts, property damage, loss of livelihoods and services, social and economic disruption, or environmental damage” (UNDRR, 2014). This paper refers explicitly to hazards derived from extreme weather and climate events.
-
Multi-hazard. “All possible and relevant hazards and the valid comparison of their contributions to hazard potential, including the contribution to hazard potential from hazard interactions and spatial/temporal coincidence of hazards, while also taking into account the dynamic nature of vulnerability to multiple stresses” (Gill and Malamud, 2014).
-
Vulnerability. “The conditions determined by physical, social, economic and environmental factors or processes, which increase the susceptibility of a community to the impact of hazards” as defined by the Hyogo Framework for Action (UNDRR, 2014). For this paper, the concept of vulnerability was focused on the physical damages and losses derived from the realization of an extreme weather event. We are utilizing, therefore, a classical approach to quantify the vulnerability of risk-averse individuals, which considers that the greater the losses, the more the vulnerability. Even though this traditional definition has been questioned as a reducer of solely the economic sphere of an issue that permeates social, political, and environmental dimensions, this is ultimately a practical approach of widespread use (Machado et al., 2005).
-
Resilience. “The ability of a system, community or society exposed to hazards to resist, absorb, accommodate to and recover from the effects of a hazard in a timely and efficient manner, including through the preservation and restoration of its essential basic structures and functions” UNDRR (2009). In the context of this paper, and as described primarily by Mohor and Mendiondo (2017) and Guzmán et al. (2020), in the resilience module of an index insurance schema, the risk premium is an indicator of the resilience of a sector for coping with weather and extreme climate events.
-
Food security. “exists when all people, at all times, have physical, social and economic access to sufficient, safe and nutritious food which meets their dietary needs and food preferences for an active and healthy life. Household food security is the application of this concept to the family level, with individuals within households as the focus of concern” (FAO, 2003). In summary, food security is rooted in the pillars of availability, access, and utilization (Barrett, 2010). This broadens the concept of food security to encompass different supply chain links, such as food production, transportation, storage, and distribution.
This section describes the main results of this work. It also discusses important aspects related to applying these results in different scenarios and contexts. It is divided into the following sections. Section 3.1 contains the main results of the bibliometric analysis; Sect. 3.2 presents an in-depth literature review of the most relevant papers identified, exploring the hazard assessment, vulnerability analysis, and financial methods and risk pricing modules; and Sect. 3.3 presents the proposed conceptual framework, encompassing both its description and an example to illustrate its main aspects and contributions to the field of multi-hazard weather-based insurance design.
3.1 Bibliometric analysis
First, it is vital to observe that around 50 % of the works analyzed have been published since 2018, denoting an increased interest in the topic. The average number of citations per year per paper demonstrates the increasing impact of weather index insurance in the literature (Fig. 2a). However, the global distribution is concentrated in Europe, the United States, Canada, and Asia. The role of Latin America, the Caribbean, Australia, New Zealand, Oceania, and Africa is much smaller, representing less than 10 % of the published papers each.

Figure 2Weather index insurance studies. (a) Temporal distribution of papers collected from 1 January 2010 to 19 February 2022. (b) Thematic map representing the global collaboration network, where the countries in blue represent the number of studies produced by scientists. The darker the color, the more affiliations the country has. The world vector map data were provided by https://www.naturalearthdata.com/ (last access: 8 March 2023) under public domain.
Additionally, international collaboration is a critical factor for high-impact scientific studies. Two important countries to analyze in this aspect are Russia and China. In Russia, more than 90 % of highly cited papers were written in an international setting (Pislyakov and Shukshina, 2014). Similarly, in China, 47 % of highly cited papers were written in an international, collaborative form.
These countries' international cooperative background, in general, paves the way to more innovative research in the field. These publications illustrate how collaborations with international scientists from centers of excellence enhance the study's dissemination.
The scientific collaboration map (Fig. 2b) shows strong collaboration networks between the United States, European countries, China, and India. European countries such as Germany, Switzerland, and the Netherlands have played a dominant role in integration and have promoted collaboration with Kenya, Ethiopia, Nigeria, and South Africa. Canada has collaborated with China, Indonesia, the United States, and European countries. From this analysis, we conclude that the United States, China, and Germany have dominant roles in scientific collaboration and are the most influential countries.
A keyword analysis revealed that agricultural and crop insurance are well-developed subjects with a substantial impact on index insurance. In addition, drought is the most studied hazard, explained by the impacts of droughts on agriculture. It is important to note that since index insurance was designed to be used in agriculture (Miranda, 1991; Skees, 2008) and as the concept has gained attention, a broader range of applications might be proven feasible.
On the one hand, Latin American countries such as Brazil, Argentina, and Mexico are vital to global food production (Baldos et al., 2020). On the other hand, by conducting a bibliometric analysis of relevant studies from 2010 to 2022, we discovered a low academic engagement between them and the rest of the world. This is contradictory, as these countries suffer the most from extreme event losses due to their solid economic link with climate-dependent primary activities. These findings emphasize the importance of developing index insurance in tropical countries, notably Latin America, to adapt better to climate change. Furthermore, climate change and basis risk are critical in building index insurance. However, these themes need to be developed more in the literature analyzed.
Table 1 presents a strategic diagram to analyze clusters of keywords (referred to as themes) according to their centrality and density values. According to Cobo et al. (2011), density is a measure of the development of the theme, and centrality is the importance of the theme in the development of the whole field of research analyzed. According to their densities and centralities, the themes are divided into four classes: basic, motor, niche, and emerging and declining themes. These will be analyzed in the following paragraphs.
Table 1Thematic mapping of the documents based on the conceptual structure of the authors' keywords divided into seven clusters with word frequency higher than 40 words according to centrality (the relevance of the theme in the development of the field) and density (the development of the field).

Basic themes represent relevant keyword clusters for all the documents analyzed. These include the following clusters: index-based insurance, climate change, index insurance, and basis risk. Climate change has been a significant concern for decision-makers, especially in risk management. Climate change might lead some regions toward higher risk profiles, increasing their vulnerability and the expected losses. Therefore, this theme represents an opportunity to develop index insurance for agriculture. Basis risk is a primary topic that requires more development. Even though it is a well-known bottleneck in the field, our analysis suggests room for improvement. More attention must be paid to this topic in future studies.
Motor themes encompass keywords that are relevant to the entire insurance theme and that are well developed. Since they present strong centrality and high density, the clusters' insurance, agriculture, risk management, and crop insurance are conceptually related to almost all papers gathered in the bibliometric analysis. This result confirms that agricultural and crop insurance are the most explored themes in the index insurance field.
Emerging and declining themes are related to themes that represent a combination of low levels of development and are marginal to the entire field of research. This quadrant includes weather index insurance, which is a critical issue in terms of impact, since extreme weather events trigger significant disasters worldwide. Given the need to manage weather extremes and their importance to a broader geophysical community, weather index insurance is an emerging topic that will gain more attention in the coming years.
Finally, niche themes encompassed the term weather derivatives. It is considered a niche theme because it is well developed but has a marginal impact on the field. The themes have fundamental distinctions and similarities. Derivatives are traded over the counter (OTC) or on the Chicago Mercantile Exchange (CME). Index insurance is a product offered by insurance and reinsurance companies. They theoretically have a similar principle: a risk-averse individual pays a premium for a risk-bearing individual.
3.2 Systematic literature review
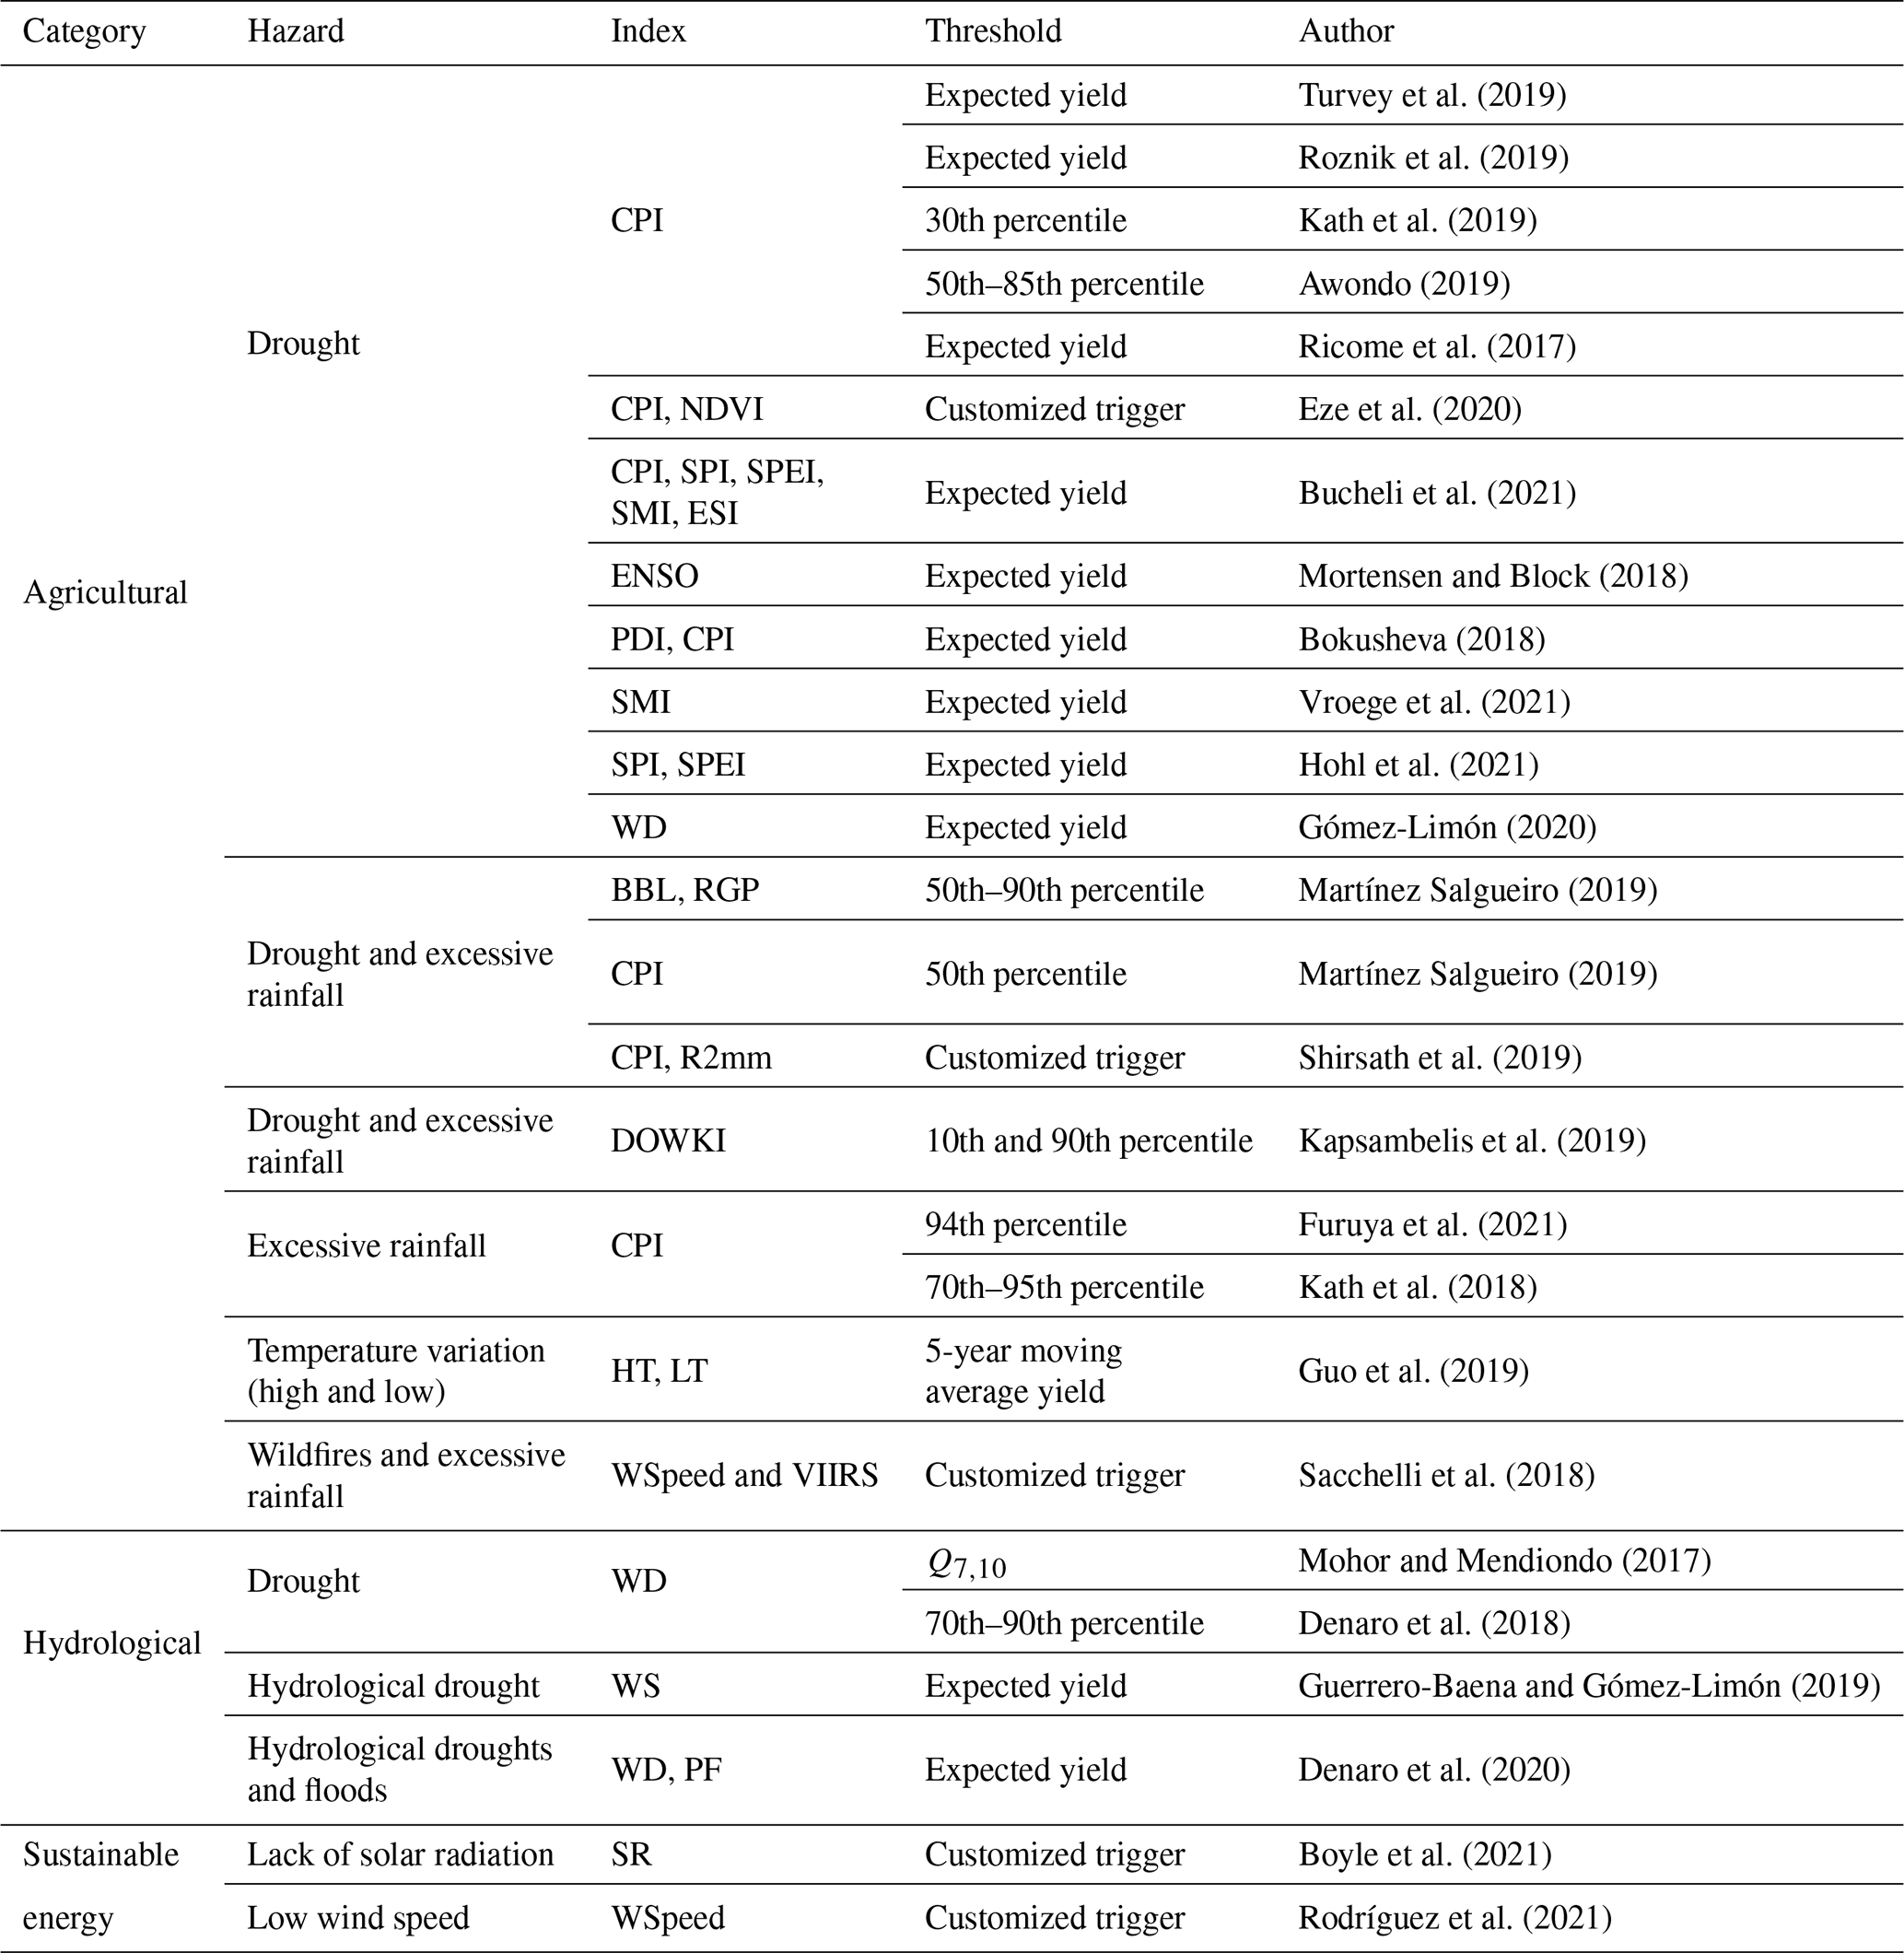
The concept of food security is rooted in the pillars of availability, access, and utilization (Barrett, 2010). Food production can affect availability, while access to renewable or sustainable energy can facilitate proper food transportation and storage. Not all research in the systematic review could be thoroughly examined due to a lack of information on their applications. Thus, for the 26 papers with complete information, we conducted an overview of the application and most relevant characteristics of index insurance for food security in three main categories: (i) agricultural, (ii) hydrological, and (iii) sustainable energy insurance. Table 2 presents the results of this analysis.
Turvey et al. (2019)Roznik et al. (2019)Kath et al. (2019)Awondo (2019)Ricome et al. (2017)Eze et al. (2020)Bucheli et al. (2021)Mortensen and Block (2018)Bokusheva (2018)Vroege et al. (2021)Hohl et al. (2021)Gómez-Limón (2020)Martínez Salgueiro (2019)Martínez Salgueiro (2019)Shirsath et al. (2019)Kapsambelis et al. (2019)Furuya et al. (2021)Kath et al. (2018)Guo et al. (2019)Sacchelli et al. (2018)Mohor and Mendiondo (2017)Denaro et al. (2018)Guerrero-Baena and Gómez-Limón (2019)Denaro et al. (2020)Boyle et al. (2021)Rodríguez et al. (2021)Table 2Main categories for index-based insurance and their specific application. Indices: cumulative precipitation index (CPI), water storage (WS), water deficit (WD), normalized difference vegetation index (NDVI), soil moisture index (SMI), standardized precipitation evapotranspiration index (SPEI), standardized precipitation index (SPI), El Niño–Southern Oscillation (ENSO), evaporative stress index (ESI), Ped's drought index (PDI), Ribéreau–Gayon and Peynaud hydrothermal scale (RGP), sum of 2 consecutive days' rainfall exceeding a given threshold value (R2mm), Drought and Overwhelmed Water Key Indicator (DOWKI), Berman and Levadoux (BBL), high temperature (HT), low temperature (LT), peak flow (PF), Visible Infrared Imaging Radiometer Suite (VIIRS), solar radiation (SR), and wind speed (WSpeed).
We observed that most studies evaluated insurance at different spatiotemporal aggregations, such as crop insurance, which was analyzed at the farm level by governmental agencies, insurance companies, or surveys. In many countries, for example, agricultural data are aggregated at a regional scale, i.e., municipality, department, state, and country, without standardization. The size of the properties varied greatly from 5 to 400 ha, and the total coverage was up to 1.6 million ha.
Forestry insurance covers larger areas and uses remote sensing data to assess risk. Therefore, spatial discretization is performed at a pixel level. The catchment level was the spatial unit for hydrological insurance, and the coverage included all hydrological processes that occurred upstream of the reservoir. For the sustainable energy insurance – wind and solar power insurance – a unique point, representing the location of the windmills and solar panels, was evaluated.
The temporal scale at which the insurance was purchased varied from seasonal to annual. Crop insurance is typically contracted before the sowing period and reaches maturity at the end of the crop cycle. Sectors that are continuously exposed to natural hazards are operated on an annual basis.
The insurance premiums were represented using different units. However, most of the works focused on premiums per unit of area and unit of cost. The crop insurance premium varied from USD 6.18 to 55.26 per hectare. This value was affected mainly by the cost of production and farmers' degree of risk aversion. A value of USD 187.29 per tonne of crop and 3 % to 7 % of production costs was also found.
In contrast, the hydrological insurance for water supply represents values of USD 10.48, and the irrigation insurance ranges from USD 212.83 to 333.07 per hectare. The prices for irrigation were inconsistent with crop insurance. This might be related to irrigation costs. Sustainable insurance presented premium rates ranging from 0.35 % to 0.50 % of production costs or a fixed fee of USD 0.033144 per kW h. A detailed analysis of hazard identification, vulnerability analysis, and financial methods of the reviewed paper is presented in sequence.
3.2.1 Hazard assessment
The index insurance literature contains a broader range of analyzed hazards and indices (Table 2). Drought and hydrological drought are the most frequent hazard (77 %), followed by excessive rainfall and flood (27 %), temperature variation: heat and cold waves (4 %), wildfire (4 %), low wind speed (4 %), and lack of solar radiation (4 %). Furthermore, 27 % of the studies have a multi-hazard interaction, with drought and excessive rainfall being the most common, followed by wildfire and excessive rainfall and hydrological drought and floods.
Most studies focused on drought, which is consistent with the findings of Abdi et al. (2022), who identified drought as the leading risk when studying index insurance for crop productions. This is due to the fact that drought is the most damaging threat in the agricultural sector, and the sector was the driving subject of the studies evaluated. Our finding is consistent with the fact that drought-induced yield losses occurred in three-fourths of the global harvested regions between 1983 and 2009 (Kim et al., 2019).
Index insurance is a promising methodology for designing insurance models because it avoids the high administration costs, adverse selection, and moral hazard issues associated with traditional indemnity-based insurance. The behavior of an index can characterize the variability of a hazard. However, its performance in covering losses is highly dependent on the index chosen.
The index choice is a critical phase in index insurance modeling, since a mismatch between the index and the actual loss might increase basis risk. Another significant element influencing performance is geographic basis risk, which occurs when the insurance index is based on a location other than the insured location. This difficulty emerges, for example, in agricultural insurance when the index is derived from a meteorological station placed in a location that does not adequately represent the insured region.
Because it is challenging to give specific index insurance contracts to small regions, geographical basis risk is generally unavoidable (Odening and Shen, 2014). Another option for mitigating this risk is to utilize decorrelation functions and an insurance portfolio composed of contracts for various regions (Norton et al., 2013). Figueiredo et al. (2018) proposes a probabilistic framework for tackling uncertainties in trigger selection and damage modeling, therefore improving basis risk quantification, evaluation, and communication.
Approximately 50 % of the studies analyzed used a rainfall-based drought indicator (i.e., CPI, SPI, CDD, and R2mm) to indicate drought and excessive rainfall. This straightforward strategy indicates drought conditions and only needs precipitation data. Besides, these indices have the advantage of representing both water deficit and water excess.
Rainfall indices in the agricultural sector might considerably represent low-yield occurrences, in both deficit and excess forms, which would correlate well with low yields (Abdi et al., 2022). Indices such as the standardized precipitation index (SPI) have the advantage of being determinable even when there are gaps in the data. However, the SPI's application is limited when issues related to the water balance must be considered in the problem analysis.
As an alternative, the standardized precipitation evapotranspiration index (SPEI), while capable of reflecting the combined effect of rainfall and temperature variations on drought, requires data for radiation, temperature, and relative humidity. These can be challenging to obtain in developing countries with a low density of weather stations.
In addition to data availability, the index's simplicity of computation is a significant factor to consider while choosing it. As a result of their ease of calculation and data input, indices such as CPI, consecutive dry days (CDD), water storage (WS), and water deficit (WD) are popular among the studies examined. While data for CPI, CDD, WS, and WD calculations are easily acquired, the spatial distribution of risk has yet to be fully known, even in places with long-established weather stations. This poses difficulty in the index insurance market: strategically exploiting information from existing stations at geographic locations where the precise weather observations are unknown (Norton et al., 2013).
The standardized precipitation index (SPI) and standardized precipitation evapotranspiration index (SPEI) are more complicated indices that add weather statistics to the analysis. Aside from the complexity of its calculation, these indices require a database of at least 30 years. Indices derived from modeling techniques and remote sensing are much more challenging to acquire and determine.
Besides that, complex indices, such as the soil moisture index (SMI) and the normalized difference vegetation index (NDVI), as well as the usage of the El Niño–Southern Oscillation (ENSO), have grown more frequent as modeling techniques and remote sensing have advanced. This popularization is already seen in the current review, as they were used in 11 % of the studies investigated.
A disadvantage of using indices derived from remote sensing is that these datasets have shorter time series. At least 20 years of data are required to understand historical patterns and to provide more confidence for historical burn rate analysis pricing (Norton et al., 2013).
While some indices are more popular than others, it is crucial to realize that no index can be used for all contexts and situations. The available data, degree of drought monitoring, and time resources available for its determination all influence the index representation of the hazard, as long as the uncertainties (basis risks) are under control.
Other hazards encompass temperature variation, wildfire, low wind speed, and lack of solar radiation, accounting for 16 % of the studies analyzed. Thermal hazard is a growing concern for human health, agriculture production, forestry, and the environment. Similarly to rainfall, temperature extremes can also explain satisfactory yield losses (Abdi et al., 2022).
Given the topic's relevance, we expected more work focusing on this subject. However, we have found only one study on temperature variation insurance. High-temperature index (HTI) and low-temperature index (LTI), proposed by Guo et al. (2019), focused on computing the number of days the temperature was higher or lower than a certain threshold, representing the rice yield reduction. Regardless of the hazard, we had one study per index. This reflects the diversity of these issues and a need for in-depth research on the specific hazards – temperature variation, fire, wind, and solar radiation.
The hazards are treated as independent occurrences in the multi-hazard interaction. However, not every study examined one index per hazard. More than half of the multi-hazard studies considered drought and excessive rainfall, and they used the same index to reflect both hazards (i.e., CPI, DOWKI, and R2mm). According to Kapsambelis et al. (2019), simple climatic water balance based on precipitation and evapotranspiration data can simulate both drought and excess rainfall globally.
The authors state that the DOWKI index was able to fit extreme yield anomalies. One example of employing different indices to reflect different hazards was found on wildfires and excessive rainfall on forestry in Italy (Sacchelli et al., 2018). The authors described forest fires using the Visible Infrared Imaging Radiometer Suite (VIIRS) and explored the effects of strong winds through wind speed (WSpeed).
The advantage of using only one index to represent two hazards is the ease of calculating and implementing the insurance policy. However, not all hazards can be represented by a single index, such as wildfires and excessive rainfall. It is known that multi-hazard and compound events are increasingly intense and significant. The finding of only a few studies connected to the theme reflects a substantial gap in the literature.
3.2.2 Vulnerability analysis
In finance and management, insurance is a product that intends to totally or partially reduce or eliminate the loss caused due to different risks (Ejiyi et al., 2022). In order to lower the basis risk and boost the acceptance of insurance products, the prediction models of the link between the index and the damages must be chosen effectively. The vulnerability analysis is focused on modeling the physical damages and losses from an extreme weather event. Thus, we presented a summary of the expected loss amount (ELA) and expected annual damage (EAD) models applied in the reviewed papers, available in Table 3. The deterministic models were applied for income reduction impacts, especially crop insurance.
Eze et al. (2020)Bokusheva (2018)Bucheli et al. (2021)Furuya et al. (2021)Gómez-Limón (2020)Guerrero-Baena and Gómez-Limón (2019)Guo et al. (2019)Hohl et al. (2021)Kath et al. (2019)Mortensen and Block (2018)Denaro et al. (2020)Awondo (2019)Kath et al. (2018)Shirsath et al. (2019)Bokusheva (2018)Kapsambelis et al. (2019)Martínez Salgueiro (2019)Mohor and Mendiondo (2017)Sacchelli et al. (2018)Table 3Summary of expected loss amount (ELA) and expected annual damage (EAD) models.
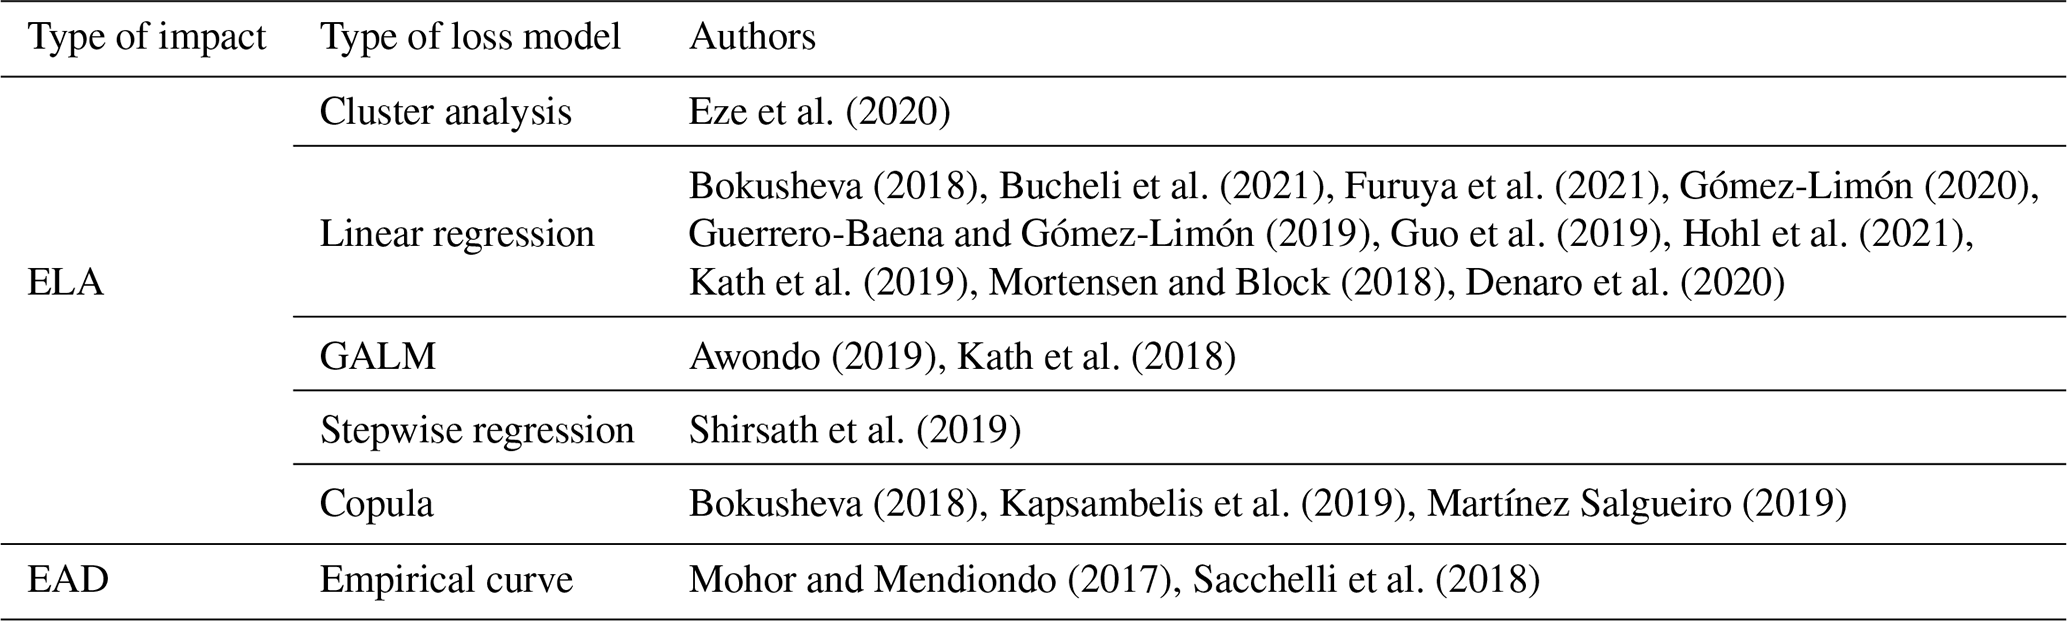
Most applied models were related to a unique explanatory variable or index. Due to their simple application and understanding, these models are expected to be the most common, primarily linear regression models. However, these models present the disadvantage of contemplating only one hazard at a time. In contrast, the generalized additive linear models (GALMs) and stepwise regression added the possibility of evaluating more than one index. These can then be used in a multi-hazard approach.
A multi-hazard approach requires understanding the frequency and magnitude of multiple hazards and the possibility of them occurring simultaneously. The multi-hazard risk index insurance papers analyzed presented combinations of drought and excessive rainfall for crop insurance (Kapsambelis et al., 2019; Shirsath et al., 2019), fire and storms for forestry insurance (Sacchelli et al., 2018), temperature variation and excessive rainfall for crop insurance (Martínez Salgueiro, 2019), and high and low temperatures for crop insurance (Guo et al., 2019). The assumption of independence was considered prior knowledge by Martínez Salgueiro (2019) and Guo et al. (2019). However, the authors did not provide mathematical proof of this choice. Instead, they prioritized hazards according to their frequency and magnitude using pre-existent risk maps.
Another possible way to incorporate hazard interactions is through copulas. This has been incorporated in loss modeling by Kapsambelis et al. (2019) and Martínez Salgueiro (2019). The copula theory (Nelsen, 2006) is widely used for multi-hazard analysis, since it derives joint probability distributions from marginal distributions. Briefly, the marginal distributions are not required to follow the same probability distribution model, giving flexibility and robustness to analyze the interaction of more than two marginal distributions.
Additionally, loss and damage databases are not necessarily normally distributed in copulas models, which is common in crop production. This way, a significant amount of skewed information can be well embodied, depicting better hydrological and meteorological extremes than linear regression models.
In addition, to embody loss and damages originating from multi-hazard events, another important aspect of vulnerability assessment is the representation of complex patterns in the loss and damage series modeling. In this regard, linear regressions are commonly applied in loss forecasting due to their simplicity.
Generalized additive linear models (GALMs) add a link function to express a linear relationship between more than one variable (Blier-Wong et al., 2020), making it possible to express both multi-hazard risk phenomena and simple nonlinear effects. While simple and easily explainable, such models may be ineffective at learning complex patterns in the data, which are common in food production. Machine learning (ML) can enable the optimal formulation of insurance policies when applied to the insurance field. These models help to capture high-dimensional, nonlinear, and complex interactions between indices and losses (Blier-Wong et al., 2020).
ML techniques are still emerging in loss models, and here we have reviewed only a very recent paper (from 2020) that used cluster analysis. The paper provides evidence that ML techniques can improve loss modeling from different sources and that it can present different time and spatial scales (Eze et al., 2020). Blier-Wong et al. (2020) emphasized that ML applications in actuarial science are expanding rapidly and show great promise.
Frees et al. (2014) affirm that with greater data availability and robustness in ML algorithms, more heterogeneity represented by insured individuals can be captured, representing their vulnerability accurately. With these models becoming more common in future studies, the multi-hazard assessment could be better incorporated. While promising, applying ML techniques to model loss and damages in the insurance sector may be bottlenecked, especially in developing countries, by the need for qualified personal and powerful GPUs.
When vulnerability studies or datasets for loss and damage quantification in specific sites are unavailable, the insurer can lay their hands on empirical functions or crop modeling techniques. Monteleone et al. (2022) reviewed methods used to model the functional relationship between a given extreme event and crop losses. They also highlighted the need for studying crop vulnerability to other less-studied climate-related hazards, such as extreme temperatures. Regarding index insurance design, we found a paper that presented empirical functions based on the assumption of linearity between water deficit and losses. Mohor and Mendiondo (2017) used the water deficit volume to the Q7,10 reference flow for predicting the impact of water shortage on water supply, irrigation, livestock, and ecological sectors. In crop insurance, if the historical yield losses database is non-existent or only available at a high level of aggregation, crop modeling shows promise in estimating yield while utilizing different explainable variables.
3.2.3 Financial methods and risk pricing
The impact provided in the vulnerability analysis module can be translated as expected values of damage, income reduction, or business interruption by financial methods. The reviewed papers presented burning rate, probabilistic fit, and index modeling as the most prevalent risk pricing models. They commonly use the mean historical losses to estimate expected future losses for similar sectors (Sant, 1980).
The expected losses are called pure risk premiums and are the primary concern in index insurance papers. The historical losses are converted into payouts considering two critical variables: (i) strike value K and (ii) degree of coverage dc. K is the index value that triggers payouts proportional to risk aversion and the degree of coverage. The risk aversion is reflected in the degree of coverage, e.g., dc ranging from 0 to 1, 0 being with no protection and 1 with complete protection. These variables represent the behavior and aversion of policyholders towards a particular risk and will be key in defining the premium and indemnity values.
The loss expectation can be determined using the historical burn rate method (HBR), which is based on the observation of historical losses (Guerrero-Baena and Gómez-Limón, 2019; Hohl et al., 2021; Mortensen and Block, 2018; Shirsath et al., 2019). This method is widely applied in the insurance industry. However, it requires sufficient data in order to be accurate. For smaller datasets considering uncertainty, expected values can be evaluated by fitting loss data to a probability density function (Bokusheva, 2018; Bucheli et al., 2021; Kath et al., 2019; Eze et al., 2020; Kath et al., 2019; Martínez Salgueiro, 2019; Sacchelli et al., 2018; Vroege et al., 2021). This procedure helps to improve pure risk premium rates by accounting for the probability of extreme events that have not been recorded. The probability distribution of loss data presents distortions in the tails, leading to underestimating pure risk premiums.
Moreover, insurance companies present nontraded assets that add costs to final premium rates. The transformation method proposed by Wang (2002), also referred to as Wang transform, takes into consideration the impact of nontraded assets in premium rates, and the method was applied by Boyle et al. (2021) and Denaro et al. (2018).
Other approaches for defining contract payouts are based on a probabilistic fit. Bokusheva (2018) applied the marginal expected shortfall (MES) method, which is a conditional probability modeling where payouts are given when the target variable exceeds the strike value. In contrast, Eze et al. (2020) used cluster analysis, associating NDVI and weather variables with higher yield observations.
It is well known that climate variables present a certain degree of uncertainty when they are predicted. Therefore, this aspect needs to be considered when estimating losses caused by climate-related losses (Smith and Matthews, 2015). A stochastic approach based on Monte Carlo simulations is used in the literature to address the problem. A Monte Carlo simulation is the basis of the index modeling method applied by Gómez-Limón (2020), Guo et al. (2019), Kapsambelis et al. (2019), Gómez-Limón (2020), Mohor and Mendiondo (2017), and Rodríguez et al. (2021). The generation of synthetic weather time series enhances understanding of the climate uncertainty in terms of confidence intervals. A summary of the risk pricing methods is described in Table S1 in the Supplement.
Econometric models provide values that guide decision-makers in understanding the price of the risk. However, it is fundamental to evaluate the risk reduction performance of index insurance. The simulation of cash flows allows for an understanding of the hedging effectiveness of the insurance policy. Nonetheless, this efficiency depends on the point of reference adopted by the modeler.
The effectiveness problem arises when policyholders and insurance companies have different and often competing objectives. On the one hand, policyholders want to protect their assets at risk to prevent going out of business. On the other hand, insurance companies want to maximize profit to comply with the interests of their investors and shareholders. Since information asymmetry and moral hazards are allegedly minimized in the case of index insurance (Barnett et al., 2008; Mußhoff et al., 2018), the costs associated with moral hazards can be neglected from premium rate pricing.
The cash flow equation is a standard tool for evaluating the capital of companies and people. The simulation of cash flows, using expected revenue and payouts as assets and premiums as liability for policyholders, is used for evaluating the effectiveness of the index insurance policy (Bokusheva, 2018; Boyle et al., 2021; Kath et al., 2019; Martínez Salgueiro, 2019). For insurance companies, the cash flow changes the direction; i.e., premiums are considered assets, and payouts are a liability. This was used for calculating the loss ratio by (Mohor and Mendiondo, 2017).
Other authors have applied the utility theory to evaluate insurance policies. The utility theory accounts for the behavior and individual preferences in economic analysis and is based on several assumptions that apply to a group of individuals (Kahneman and Tversky, 1979). Some authors (Bucheli et al., 2021; Eze et al., 2020; Furuya et al., 2021; Vroege et al., 2021) used the concept of risk-averse utility functions for policyholders, where the asset's utility at risk is concave or diminishing. Detailed information about the insurance policy evaluation methods is in Table S2.
When estimating fair premium values and addressing the potential increase in future risks caused by climate change scenarios, it is important to note that the insurance market should take certain steps to minimize their vulnerabilities and sources of uncertainty. These steps may include the following.
First, as mentioned before, to calculate the premium value, it converges into a multi-objective problem. The insured could contract a long-term insurance policy with an established premium. However, due to the CC uncertainty, some extreme events did not happen, and the insured paid too much for unnecessary coverage, resulting in more profit for the insurer. Nevertheless, the opposite could happen. In this scenario, the insured pays less, but extreme events do happen, and the insurer does not have the liquidity to pay for losses.
Second, the insurance market could consider a layered insurance scheme including private and public sectors (PP) (Keskitalo et al., 2014; Paudel et al., 2015) to cope with extreme losses. This means that when a certain threshold of loss is reached, a second partner will pay the difference in the indemnities. However, the definition of that threshold is another gap in the literature, similar to the strike value K.
Third, according to the spatial scale, a scheme of pool risk is preferable to reduce premium values, which requires cooperation among the stakeholders. However, the main issue is to reach complete diversification of the portfolio (Porth et al., 2016). Fourth, this induces risk reduction proposals to increase resilience and to promote adaptation within the sector. The latter could be reached through financial incentives such as premium discounts offered to stakeholders when they adopt some mitigation measure, as shown in (Hudson et al., 2016).
Finally, for a multi-hazard scheme, the schemes mentioned earlier should be calculated for each hazard. Nonetheless, premium values will be different, and a weighted procedure will be required, such as what was done with the hazard frequency by Martínez Salgueiro (2019) and Guo et al. (2019) as mentioned in Sect. 3.2.2.
3.3 Conceptual framework
Based on the results discussed, we present a conceptual framework for multi-hazard risk index-based insurance design, delineating various paths through which insurance policies can be developed. As shown in Fig. 3, the index-based insurance design can be divided into three modules: (i) hazard identification, (ii) vulnerability assessment, and (iii) financial methods and risk pricing.

Figure 3The multi-hazard risk weather insurance design framework. The framework illustrates the process of selecting and prioritizing hazards, defining index thresholds, modeling losses, and optimizing insurance risk premiums. The vulnerability assessment presents two types of systems: (a) stationary-state system, where both thresholds and hazards are stationary and represent an analysis based on observed historical information, and (b) non-stationary-state system, where both indices and hazards are non-stationary and reflect a combination of observed historical and projected data. The non-stationary system anticipates a potential increase in risk and optimizes risk premiums.
Hazard identification is the process of analyzing and selecting the most critical threats and their respective indices. The vulnerability analysis refers to the process of selecting loss models and thresholds. Finally, the financial methods and risk pricing refer to methods for estimating long-term loss expectations and risk premium rates.
This framework (Fig. 3) elicits paths for designing an insurance policy, and each step indicates a design option supported by the literature. Turvey et al. (2019), for example, followed a path A1–C1–D2–E1–F1, i.e., drought insurance (A1) with a static threshold (C1) and a loss model based on losses projected by an index (D2) for single policyholders (E1) and for many farmers in a region (F1). Sacchelli et al. (2018) provides another example, presenting a design path A2–B1–C1–D1–E1–F1, i.e., multi-hazard risk insurance for wildfires and excessive rainfall (A2), considering the hypothesis of independent events (B1) with a static threshold (C1), using the index value to model losses (D1), and premium rates for a single policyholder (E1) without considering risk pooling (F1).
3.3.1 Hazard identification
The previous discussion demonstrated that the significant decisions in this step are whether to use single- (A1) or multi-hazard (A2) risk insurance. Single-hazard risk is straightforward and should be reserved for situations when one hazard is dominant in a region. However, research has shown that the single-hazard hypothesis and multi-hazard risks might include independent, synergistic, and cascade events.
According to (Gill and Malamud, 2014), independent hazards (B1) are events that can happen simultaneously in a region without any causal dependence. Synergistic hazards (B2) refer to a situation when the occurrence of a particular hazard increases the probability of the occurrence of another. Cascade hazards (B3) represent a situation when an event triggers the occurrence of another event (i.e., excessive rainfall triggering landslides in a particular region).
Alternative multi-hazard interaction hypotheses must be tested to depict weather- and climate-related losses (Tilloy et al., 2019) and can influence the correct interpretation of loss modeling. The papers that addressed multi-hazard risks assumed independence between the events investigated; however, the combination of drivers and impacts of hazards contributes to risk analysis and is responsible for the occurrence of the most severe weather- and climate-related impacts (Zscheischler et al., 2020). To overcome this challenge, Tilloy et al. (2019) presented methods for testing multi-hazard risk hypotheses, including copulas, classification algorithms, linear regression, and physical models. The importance of these models will be explored in the illustrative example.
3.3.2 Vulnerability analysis
The vulnerability analysis for insurance design is translated into threshold definition and loss model selection. Thresholds, strikes, and triggers are all terms for the pre-agreed-upon index value that triggers claim payments when reached or exceeded. In the literature, we identified loss models represented in terms of index value (D1) or losses estimated with index values (D2).
The rising frequency of extreme climate events has forced insurers to increase premium rates and threatens coverage availability. Losses and damages associated with extreme events have multiple drivers (Zscheischler et al., 2020), implying that losses have multiple thresholds and are associated with multiple variables. These thresholds vary with time and space (Hoek van Dijke et al., 2022).
As discussed in the vulnerability section, the selection of thresholds and consequential loss modeling consists of evaluating historical events. This creates a system we call stationary-state system (C1), characterized by fixed thresholds even when multiple hazards are considered. The second case is the non-stationary-state system (C2). The frequency and severity of hazards change over time, and the thresholds are dynamic, indicating either improvement or deterioration of resilience.
We proposed a conceptual framework for considering multi-hazard risk analysis that allowed us to analyze the interaction between hazards and two types of vulnerability: static and dynamic resilience (Fig. 4). Static resilience refers to a stationary-state system. Most papers represent this case. Dynamic resilience refers to a non-stationary-state system and considers changing hazard patterns and vulnerability thresholds. Considering a non-stationary-state system helps one to anticipate increasing patterns of losses, therefore optimizing risk premiums to accelerate the adaptation to and resilience of farmers against climate change.
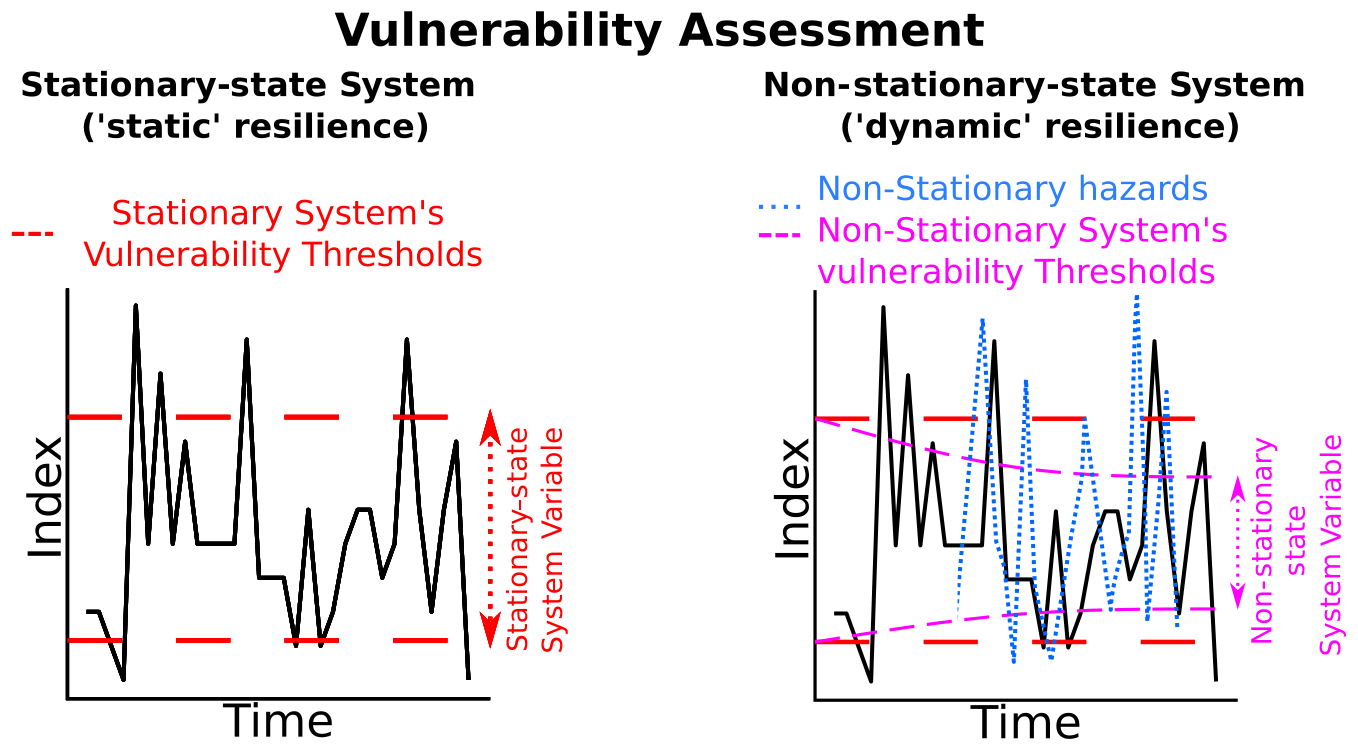
The dynamic threshold considers future scenarios that might assist in avoiding risk reassessment by anticipating and diluting potential severe climate shocks. Shifts in frequency and severity of extreme events are evaluated using the Representative Concentration Pathways (RCPs) (Van Vuuren et al., 2011), indicating possible changes in risk exposure. The Shared Socioeconomic Pathways (SSPs) (Riahi et al., 2017) will help us to understand risk in different vulnerability trajectories, i.e., increasing, stationary, and decreasing resilience.
3.3.3 Financial methods and risk pricing
Financial methods require defining parameters relevant to policy implementation, which depend on regional socioeconomic factors. Single contracts (E1) are focused on the individual policy and were the general option described in the literature review (Table 2). Community contracts (E2) are widely used for microinsurance contracts when smallholder farmers are associated with governmental institutions, associations, or companies to access affordable insurance policies and long-term financial support against weather- and climate-related threats (Platteau et al., 2017).
Both individual and community contracts can be tailored to a single region (F1), or different locations can be pooled (F2). In the derivative market, several locations can be insured in the same contract using the same weather index. This type of contract has been applied by retailers (Štulec et al., 2019) and is suited for farmers and companies with operations in more than one location.
3.4 Framework application: illustrative example
An illustrative example was developed to demonstrate the multi-hazard risk path of the framework proposed. This encompasses all steps from problem definition and data collection to index calculation and loss evaluation for several cities and a specific crop. It is important to note that the methods utilized and the code created can be reused for different years, areas, countries, hazards, and crops.
This choice was motivated to prove the impact of selecting multi-hazard indices for designing weather index-based insurance for crop yields. Further studies must be done to link crop yield to other aspects of food security, such as transportation, storage, and retail.
In this example, we chose the 42 largest soybean-producing municipalities in the Brazilian state of Paraná for evaluation. According to Pereira et al. (2013), the study area is located in a region with low to very low geodiversity and low soil diversity. Fine-grained soil such as Ultisols and Latosols with a high iron content are predominant in the region, followed by the presence of medium-grained soils such as Cambisols (Bhering et al., 2009). These soils are generally classified as clayey and loamy, and their soil volumetric water content (VWC) tends to be high. According to Saxton and Rawls (2006), the permanent wilting point (PWP) is on average 22 %, the field capacity (FC) is 37 %, and the porosity/saturation is at 47 %.
The production of soybeans represents an interesting object of study, since it is an essential crop for oil and protein. Soybean has a significant economic impact on Brazil, a wide geographical distribution, and a vulnerability to various hazards. Soybean crop yields in Paraná are mainly threatened by temperature variation, droughts, and excessive rainfall (da Silva et al., 2021).
We used 22 years of yield data of first-cycle soybean production from the 1996/1997 to the 2019/2020 growing seasons. Crop data were retrieved from the official statistical yearbooks (Parana, 2023). The multi-hazard risk hypothesis was tested using the widely employed machine learning algorithm random forest (Breiman, 2001).
The conceptual framework illustrated in Fig. 4 was applied to a case study for soybean production in southern Brazil, following the methodology described in Sect. 2.2. The main objective of this case study was to illustrate the main steps of the framework, focusing on multi-hazard risks (A2), testing the hypothesis of synergic interaction between hazards (B2), a stationary-state system (C1), a loss estimated with index value (D2), single contracts (E1), and no risk pooling (F1). The following five key steps were used in the illustrative example:
-
Hazard identification. We selected thermal stress, drought, and excessive rainfall as the main threats to soybean production. The index selection was based on the indices found in the literature (Table 2) and the indices indicated by the CCl/CLIVAR/JCOMM Expert Team (ET) on Climate Change Detection and Indices (ETCCDI) (Peterson et al., 2001). The index selection focused on finding simple indicators based solely on precipitation and temperature. After an extensive examination, the following indices were considered: the maximum daily rainfall event over the growing season (pmax), a 3-month standardized precipitation index (SPI), and the number of days where daily precipitation is higher than the 90th percentile over the growing season (TX90p).
-
Definition of loss thresholds. Crop losses were chosen as the target variable because they can be used as a proxy for the impact of extreme weather occurrences. The crop yields were detrended following the linear procedure used in Bucheli et al. (2021): , where is the detrended crop yield series, yi is the raw crop yield data in the year i, and β is the linear regression coefficient of the equation . The losses were then determined following the equation . The K variable is the crop yield threshold value. It can be understood as the threshold that divides unfavorable crop yields for farmers (values below K) and favorable crop yields (values above K).
-
Data clustering for evaluating the interaction between hazards. The k-means clustering method (MacQueen, 1967), a widely used clustering method, was implemented to understand the data better. The clustering was applied for four relevant variables: pmax, SPI, TX90p, and crop yield. The elbow method was used to define the optimal value of clusters (also referred to as hyperparameter κ). This is the method most used in the literature for defining κ. The method was implemented in R Environment using the package stats (R Core Team, 2022).
-
Crop loss prediction modeling. Several models were tested. However, two crop loss prediction models were chosen to demonstrate the importance of multi-hazard risk modeling, following a regression model and using the random forest algorithm: (i) the multi-hazard model M1, a drought- and thermal-stressed model using SPI and TX90p as inputs (M1(SPI,TX90p)), and (ii) the multi-hazard model M2, an excessive precipitation- and thermal-stressed model using SPI, TX90p, and pmax as inputs (M2(SPI,TX90p,pmax)). The multi-hazard model M1 was trained and validated using data from clusters 2 and 4, and the multi-hazard model M2 was trained and validated using data from cluster 6. The standard cross-validation method was applied, following best practices for machine learning workflows presented in the literature. The models were built using the R package randomForest (Liaw and Wiener, 2002).
-
Risk pricing. The risk analysis is performed to determine pure risk premiums using stochastic methods. Historical burn analysis was performed on detrended crop yields to determine reference pure risk premium values. Then, a stochastic analysis of premiums for multi-hazard models M1(SPI,TX90p) and M2(SPI,TX90p) was determined considering P=E[Loss]. The expectation of loss E[Loss] was determined using the generation of 50 synthetic scenarios of weather data. The synthetic weather data were simulated using a multi-site multi-variable (daily precipitation and temperature) weather-generator method. The stochastic simulation was performed using a wavelet-based algorithm that allows multi-site simulation. The simulation was implemented in R Environment with the package PRSim (Brunner et al., 2021).
The cluster analysis using climate indices and crop yield losses allowed us to interpret the multi-hazard nature of the historical loss events. We identified six clusters that are described in Table 4. Three clusters reasonably explained ca. 70 % of soybean crop losses for the region and period studied. Cluster 2 represents years where losses were predominantly driven by precipitation deficit (single-hazard years).
Table 4Description for each identified cluster, with the SPI, pmax, and TX90p values used in the cluster analysis shown in italics. We specifically highlight clusters 1, 2, and 6 in bold, as these clusters were chosen for loss modeling.
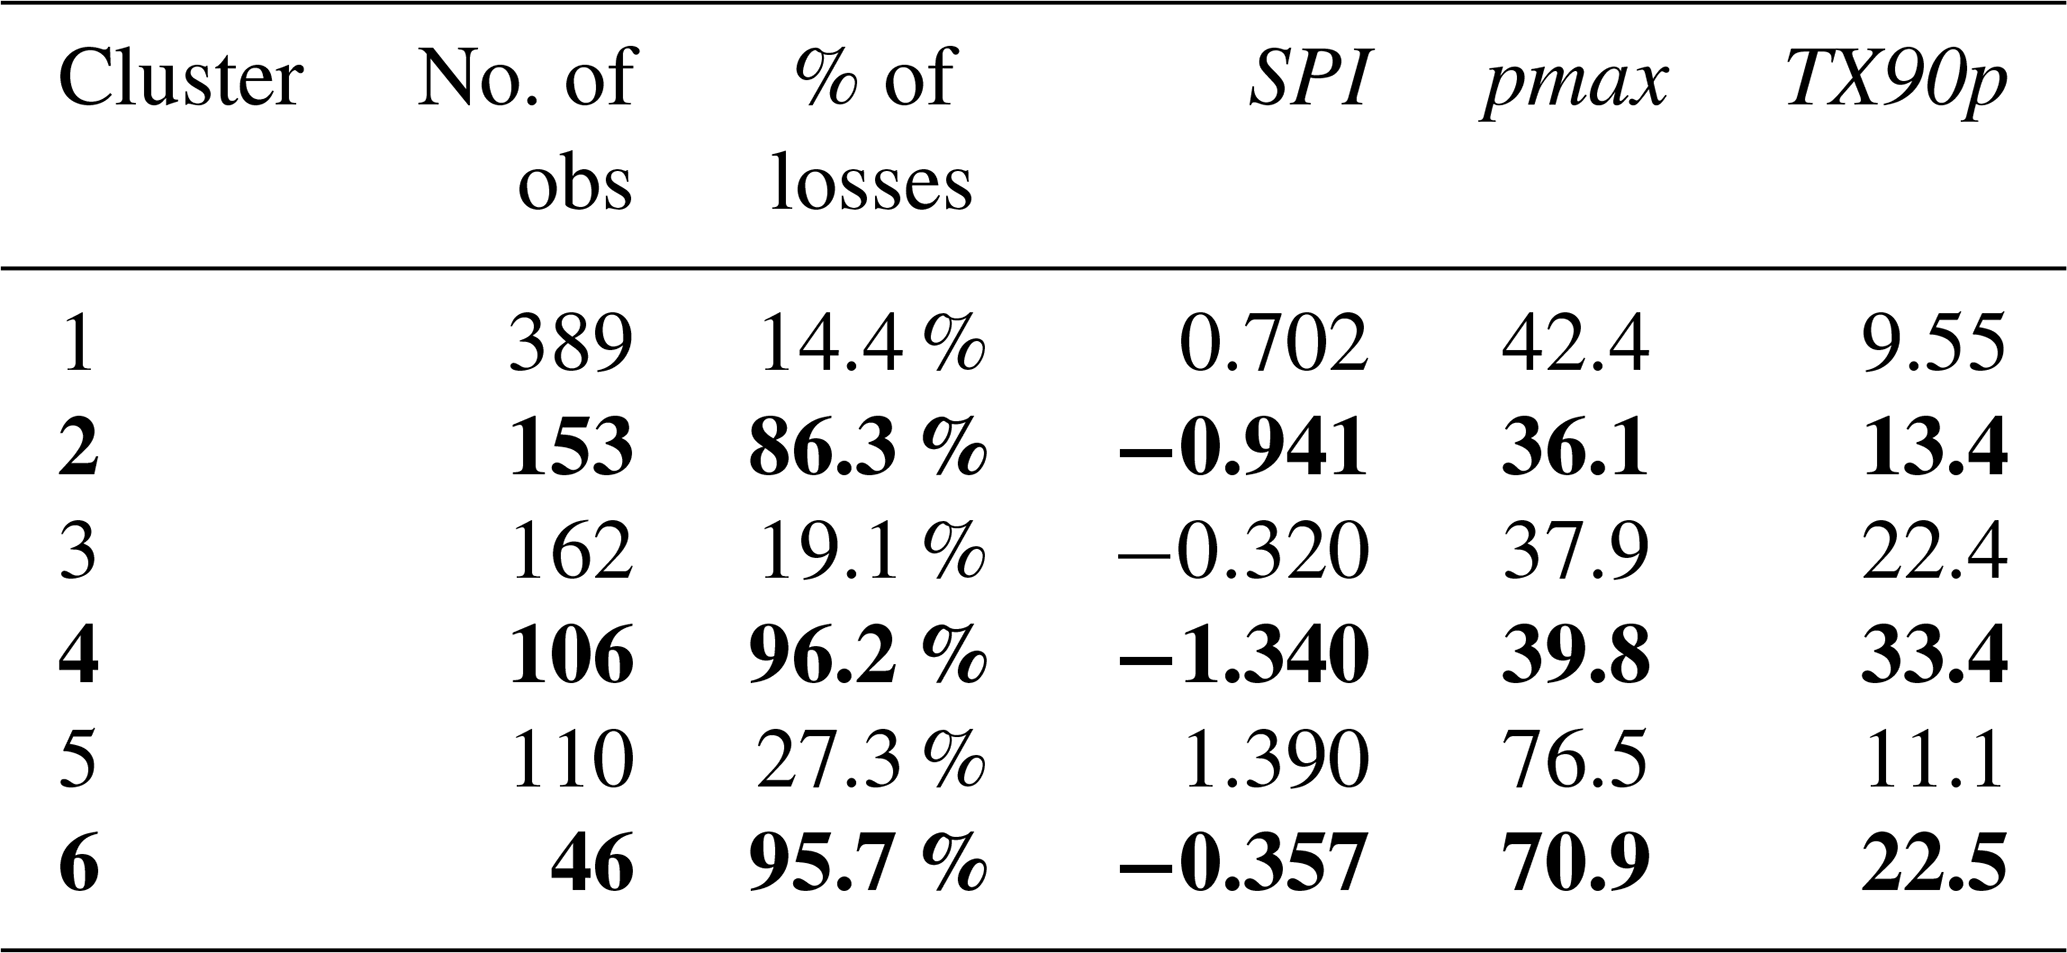
Cluster 4 represents years where losses were driven by precipitation deficit and thermal stress (multi-hazard year 1). Cluster 6 is associated with relatively normal years in SPI but heavy rainfall events and higher temperatures (multi-hazard year 2). The underlying structure of the other clusters (1, 3, and 5) can be related to other drivers of losses that were not considered in the present analysis.
The coupling of high temperatures and droughts has been a major cause of crop losses globally, and global warming is pointed to increase coupled thermal–moisture threats to food production (Lesk et al., 2021). On the other hand, excessive precipitation can increase soil moisture, creating conditions for plant hypoxia, which means that plants have less access to oxygen and have a reduction in their energetic status (Brandão and Sodek, 2009). Then, plants become more vulnerable to other threats.
The illustrative example highlights the multi-hazard effects of extreme weather events on crop yield losses. We used cluster analysis to identify what hazards were dominant each year that a crop loss event occurred. This results in using a single-hazard approach or assuming independence among hazards, which can be an oversimplification. The cluster method used for assessing multi-hazard events represents an option that can be used to visualize how to apply the proposed framework (Fig. 3), which may improve decision-making in terms of index selection and vulnerability assessment. Improving hazard identification by categorizing historic data allows insurance designers to have new insights in comparison to traditional methods, which conduct a statistical analysis of past crop losses associated with a single-hazard index.
Table 5Summary of pure risk premiums in terms of percentage of expected crop yields.
We summarize the multi-hazard risk analysis for a specific city (Toledo), which is essential for soybean production and is severely impacted by extreme weather occurrences, in Fig. 5. It is possible to observe that (i) Toledo had considerable losses in the multi-hazard periods (especially 2012); (ii) both models presented satisfying results for predicting crop losses in the different periods; (iii) the models identified different aspects of the data, implying that a model ensemble might produce the best results; and (iv) although multi-hazard model M1(SPI,TX90p) suited the data better (presenting a lower mean absolute error), multi-hazard model M1(SPI,pmax,TX90p) better predicted the worst year (2012), providing additional evidence that an ensemble approach could present better results. (v) The sum of the losses estimated with models M1 and M2 (Fig. 5b) presented the lowest overall error in comparison to the observed crop loss, providing further evidence of the importance of using ensembles for predicting crop loss probability.

Figure 5Risk analysis module applied to the city of Toledo, Paraná, Brazil (1197.016 km2), demonstrating the multi-hazard model M1(SPI,TX90p), multi-hazard model M2(SPI,pmax,TX90p), sum of the two models, and observed crop losses in the studied period. (a) Simulation of crop losses and (b) crop loss probability in the studied period, including the sum of the losses estimated with two loss models.
The study case conducted in this subsection illustrates one possible application of the framework, considering several analyses and visualizations that a stakeholder could use to better understand the impacts of extreme weather events over time on agricultural productivity, taking both the historical values and the crop loss probability into consideration. This information could improve insurance policy design and give a better understanding of different regions' situations. Generating charts such as the ones illustrated in Fig. 5 for multiple regions on a dashboard would allow for a better overview of the impacts of weather events on different crops and regions and could be used to improve decision-making.
This study reviewed the development and design of index insurance, focusing on multi-hazard risk analysis and food security. We summarized the primary hazard analysis and index calculation methods, loss modeling, and risk pricing. We observed that the lack of studies on multi-hazard risks is the central gap in the literature. Therefore, we proposed a conceptual framework with an illustrative example to give suggestions for future work in the field.
Drought was the most studied hazard, and cumulative precipitation index (CPI) was the most frequently used index in drought index insurance design. The literature review also presents other hazards, such as excessive precipitation, temperature variation, wind, and radiation. Since food security is a multifaceted concept, agricultural, hydrological, and sustainable energy insurance were also evaluated.
The vulnerability analysis for insurance design is composed of a loss model selection and the definition of threshold values. Multi-hazard loss models were composed of generalized or separate additive models to calculate losses caused by different hazards when considering that the hazard occurrence was independent. Composite indices such as DOWKI or ambivalent indices such as CPI and SPI could capture excessive rainfall and droughts and are suitable for analyzing extreme conditions. Nonetheless, the reviewed papers did not fully explore other hypotheses of multi-hazard interaction, such as synergistic and cascade events.
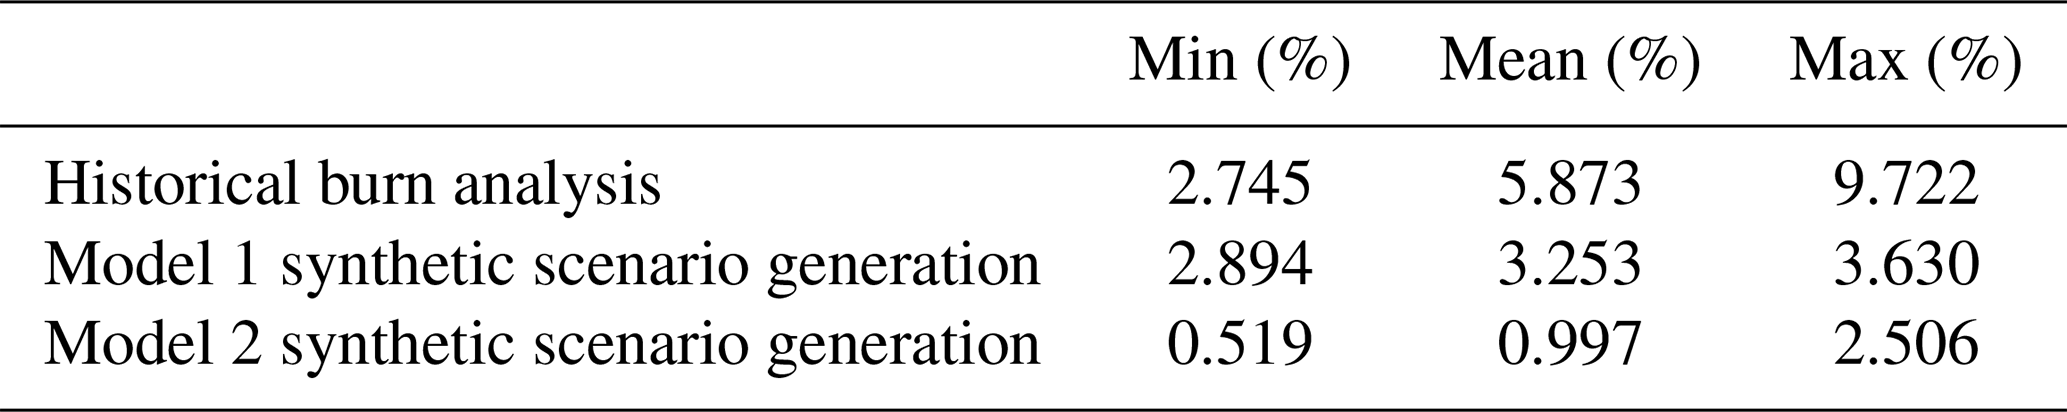
As shown in Table 5, the historical burn analysis provides a baseline risk range of 2.7 % to 9.7 % of the expected crop production in the study area. Model 1 generates a risk range of 2.8 % to 3.6 %, suggesting that this model could cover most of the baseline risk in some regions. Model 2 generates a lower risk range of 0.5 % to 2.5 %. Further analysis combining the two models would improve the explanation of the baseline risk.
Trigger values, which are the index values that trigger payouts, were attributed to both index values or losses estimated by the index. In the first case, thresholds were defined by a quantile or a range of quantiles, e.g., 70th to 80th quantiles. We postulate that the threshold value is dependent on how risk-averse the policyholder is. The case of losses estimated by the index was typical in crop insurance, where the threshold is a percentage of the expected crop yield for a given year.
The determination of risk premiums followed methods based on historical data evaluation. These methods are based on the assumption that historical data provide enough information to characterize regional risk. However, recent findings (Cremades et al., 2018) demonstrate that this approach might lead to an underestimation of future risk. In the in-depth analysis of the most relevant papers, we found burning rate, probabilistic fit, and index modeling to be the most prevalent risk pricing models.
We proposed a conceptual framework with an illustrative example of multi-hazard index insurance design for soybean production in 42 municipalities in the state of Paraná, Brazil. This application focused on categorizing multi-hazard events using a clustering technique based on the k-means algorithm. Droughts and coupled thermal–moisture events were found in the study area. Two examples of multi-hazard events were detected by the clustering analysis; one is the combination of excessive rainfall and high temperature, and the other is the combination of droughts and high temperatures.
The cluster model demonstrated that historic crop losses were divided into three groups: the first was precipitation deficit dominated, the second was precipitation deficit and high temperatures, and the third was excessive rainfall and high temperatures. Two different loss prediction models were trained with historic data separated according to the cluster analysis. This example illustrates that the problem of the mismatch between actual losses and losses predicted from the index insurance contract, also called basis risk, does not only depend on having enough historical records of loss events but also on having an adequate understanding of what the major drivers of loss events in the historical records were. Future work must explore this effect and compare it with actual yield.
Our paper demonstrates that despite the fact that index insurance for food security has gained attention in the past few years, there are still important areas that require further attention and investigation in future studies, for example, (i) providing a clear definition and analysis of multiple hazards instead of assuming single-hazard risk; (ii) testing different hypotheses of the interaction between hazards, especially for coupled moisture–thermal events; (iii) evaluating how the multi-hazard risk selection affects basis risk; and (iv) analyzing the trade-offs between the loss in model accuracy and the policyholders' willingness to pay.
The code used in this study will be made available upon request to the corresponding author.
The data used in this study can be accessed at https://doi.org/10.17632/3xjshm9n5w.1 (Benso et al., 2023).
The supplement related to this article is available online at: https://doi.org/10.5194/nhess-23-1335-2023-supplement.
Conception and design of the work, data collection, manuscript drafting: MRB. Systematic literature review: MRB, GCG, GJS, LMCR, FARN, and RFS. Discussion and analysis: MRB, GCG, GJS, LMCR, FARN, RFS, and EMM. Critical review of the manuscript: MRB, GCG, GJS, LMCR, FARN, RFS, EMM, JAM, and PAAM. Advisor: EMM.
The contact author has declared that none of the authors has any competing interests.
Publisher’s note: Copernicus Publications remains neutral with regard to jurisdictional claims in published maps and institutional affiliations.
We also wish to express our appreciation to the reviewers and editors for their valuable feedback and contributions to this project. We would like to thank the University of São Paulo for providing a stimulating research environment and resources that made this work possible.
This study was supported by the Coordenação de Aperfeiçoamento de Pessoal de Nível Superior do Brasil (CAPES) (finance code 001, grant no. 88888.057913/2013-00) and regular funding to the post-graduate program in Hydraulics and Sanitation of the São Carlos School of Engineering of the University of Sao Paulo by the Brazilian National Council for Scientific and Technological Development (CNPq). This study was additionally supported by the National Institute of Science and Technology for Climate Change Phase 2 (INCT-II) under CNPq grant no. 465501/2014-1, the São Paulo Research Foundation (FAPESP) under grant no. 2014/50848-9, the Center for Artificial Intelligence (C4AI-USP) under FAPESP grant no. 2019/07665-4, the IBM Corporation, CAPES under grant no. 16/2014, and the National Institute of Science and Technology (INCT) for the Fight Against Hunger under CNPq grant no. 406774/2022-6.
This paper was edited by Vassiliki Kotroni and reviewed by three anonymous referees.
Abdi, M. J., Raffar, N., Zulkafli, Z., Nurulhuda, K., Rehan, B. M., Muharam, F. M., Khosim, N. A., and Tangang, F.: Index-based insurance and hydroclimatic risk management in agriculture: A systematic review of index selection and yield-index modelling methods, Int. J. Disast. Risk Re., 67, 102653, https://doi.org/10.1016/j.ijdrr.2021.102653, 2022. a, b, c, d
Akter, S.: The Role of Microinsurance as a Safety Net Against Environmental Risks in Bangladesh, J. Environ. Dev., 21, 263–280, https://doi.org/10.1177/1070496512442505, 2012. a
Aria, M. and Cuccurullo, C.: bibliometrix: An R-tool for comprehensive science mapping analysis, J. Informetr., 11, 959–975, 2017. a
Awondo, S. N.: Efficiency of region-wide catastrophic weather risk pools: Implications for African Risk Capacity insurance program, J. Dev. Econ., 136, 111–118, https://doi.org/10.1016/j.jdeveco.2018.10.004, 2019. a, b
Baldos, U., Haqiqi, I., Hertel, T., Horridge, M., and Liu, J.: SIMPLE-G: A multiscale framework for integration of economic and biophysical determinants of sustainability, Environ. Modell. Softw., 133, 104805, https://doi.org/10.1016/j.envsoft.2020.104805, 2020. a
Barnett, B. J., Barrett, C. B., and Skees, J. R.: Poverty Traps and Index-Based Risk Transfer Products, World Dev., 36, 1766–1785, https://doi.org/10.1016/j.worlddev.2007.10.016, 2008. a
Barrett, C. B.: Measuring food insecurity, Science, 327, 825–828, 2010. a, b
Benso, M. R., Fray da Silva, R., Gesualdo, G., Jesus da Silva, G., Castillo, L., Richmond Navarro, F. A., Marques, P. A. A., Marengo, J., Mendiondo, and Eduardo, M.: Multi-hazard risk index insurance for soybean in Parana, Brazil, V1, Mendeley Data [data set], https://doi.org/10.17632/3xjshm9n5w.1, 2023. a
Bhering, S. B., Dos Santos, H. G., Bognola, I., Cúrcio, G., Carvalho Junior, W. D., Chagas, C. D. S., Manzatto, C., Áglio, M., and Silva, J. D. S.: Mapa de solos do Estado do Paraná, legenda atualizada, in: 32th CONGRESSO BRASILEIRO DE CIÊNCIA DO SOLO, O solo e a produção de bioenergia: perspectivas e desafios: anais, SBCS, Viçosa, MG; UFC, Fortaleza, 2009. a
Blier-Wong, C., Cossette, H., Lamontagne, L., and Marceau, E.: Machine learning in P&C insurance: A review for pricing and reserving, Risks, 9, 4, https://doi.org/10.3390/risks9010004, 2020. a, b, c
Bokusheva, R.: Using copulas for rating weather index insurance contracts, J. Appl. Stat., 45, 2328–2356, https://doi.org/10.1080/02664763.2017.1420146, 2018. a, b, c, d, e, f
Boyle, C. F., Haas, J., and Kern, J. D.: Development of an irradiance-based weather derivative to hedge cloud risk for solar energy systems, Renew. Energ., 164, 1230–1243, https://doi.org/10.1016/j.renene.2020.10.091, 2021. a, b, c, d
Brandão, A. D. and Sodek, L.: Nitrate uptake and metabolism by roots of soybean plants under oxygen deficiency, Brazilian Journal of Plant Physiology, 21, 13–23, 2009. a
Breiman, L.: Random forests, Mach. Learn., 45, 5–32, 2001. a
Brunner, M. I., Slater, L., Tallaksen, L. M., and Clark, M.: Challenges in modeling and predicting floods and droughts: A review, WIREs Water, 8, e1520, https://doi.org/10.1002/WAT2.1520, 2021. a
Bucheli, J., Dalhaus, T., and Finger, R.: The optimal drought index for designing weather index insurance, Eur. Rev. Agric. Econ., 48, 573–597, https://doi.org/10.1093/erae/jbaa014, 2021. a, b, c, d, e
Cobo, M., López-Herrera, A., Herrera-Viedma, E., and Herrera, F.: An approach for detecting, quantifying, and visualizing the evolution of a research field: A practical application to the Fuzzy Sets Theory field, J. Informetr., 5, 146–166, https://doi.org/10.1016/j.joi.2010.10.002, 2011. a
Cremades, R., Surminski, S., Máñez Costa, M., Hudson, P., Shrivastava, P., and Gascoigne, J.: Using the adaptive cycle in climate-risk insurance to design resilient futures, Nat. Clim. Change, 8, 4–7, 2018. a
da Silva, E. H. F. M., Antolin, L. A. S., Zanon, A. J., Junior, A. S. A., de Souza, H. A., dos Santos Carvalho, K., Junior, N. A. V., and Marin, F. R.: Impact assessment of soybean yield and water productivity in Brazil due to climate change, Eur. J. Agron., 129, 126329, https://doi.org/10.1016/j.eja.2021.126329, 2021. a
Denaro, S., Castelletti, A., Giuliani, M., and Characklis, G.: Fostering cooperation in power asymmetrical water systems by the use of direct release rules and index-based insurance schemes, Adv. Water Resour., 115, 301–314, https://doi.org/10.1016/j.advwatres.2017.09.021, 2018. a, b
Denaro, S., Castelletti, A., Giuliani, M., and Characklis, G.: Insurance Portfolio Diversification Through Bundling for Competing Agents Exposed to Uncorrelated Drought and Flood Risks, Water Resour. Res., 56, e2019WR026443, https://doi.org/10.1029/2019WR026443, 2020. a, b
Ejiyi, C. J., Qin, Z., Salako, A. A., Happy, M. N., Nneji, G. U., Ukwuoma, C. C., Chikwendu, I. A., and Gen, J.: Comparative Analysis of Building Insurance Prediction Using Some Machine Learning Algorithms, International Journal of Interactive Multimedia and Artificial Intelligence, 7, 75–85, https://doi.org/10.9781/ijimai.2022.02.005, 2022. a
Eze, E., Girma, A., Zenebe, A., and Zenebe, G.: Feasible crop insurance indexes for drought risk management in Northern Ethiopia, Int. J. Disast. Risk Re., 47, 101544, https://doi.org/10.1016/j.ijdrr.2020.101544, 2020. a, b, c, d, e, f
FAO: Chapter 2. Food security: concepts and measurement, Trade Reforms and Food Security, Conceptualizing the Linkages, Food and Agriculture Organization, United Nations, Rome, https://www.fao.org/3/y4671e/y4671e06.htm (last access: 8 March 2023), 2003. a
FAO: The Water-Energy-Food Nexus A new approach in support of food security and sustainable agriculture, Food and Agriculture Organization, United Nations, Rome, https://www.fao.org/3/bl496e/bl496e.pdf (last access: 8 March 2023), 2014. a
Figueiredo, R., Martina, M. L., Stephenson, D. B., and Youngman, B. D.: A probabilistic paradigm for the parametric insurance of natural hazards, Risk Anal., 38, 2400–2414, 2018. a
Foster, B., Kern, J., and Characklis, G.: Mitigating hydrologic financial risk in hydropower generation using index-based financial instruments, Water Resources and Economics, 10, 45–67, https://doi.org/10.1016/j.wre.2015.04.001, 2015. a
Frees, E. W., Derrig, R. A., and Meyers, G.: Predictive modeling applications in actuarial science, vol. 1, Cambridge University Press, https://doi.org/10.1017/CBO9781139342674, 2014. a
Furuya, J., Mar, S. S., Hirano, A., and Sakurai, T.: Optimum insurance contract of flood damage index insurance for rice farmers in Myanmar, Paddy Water Environ., 19, 319–330, https://doi.org/10.1007/s10333-021-00859-2, 2021. a, b, c
Ghosh, R. K., Gupta, S., Singh, V., and Ward, P. S.: Demand for Crop Insurance in Developing Countries: New Evidence from India, J. Agr. Econ., 72, 293–320, https://doi.org/10.1111/1477-9552.12403, 2021. a, b
Gill, J. C. and Malamud, B. D.: Reviewing and visualizing the interactions of natural hazards, Rev. Geophys., 52, 680–722, https://doi.org/10.1002/2013RG000445, 2014. a, b, c
Gómez-Limón, J. A.: Hydrological drought insurance for irrigated agriculture in southern Spain, Agr. Water Manage., 240, 106271, https://doi.org/10.1016/j.agwat.2020.106271, 2020. a, b, c, d
Guerrero-Baena, M. and Gómez-Limón, J.: Insuring Water Supply in Irrigated Agriculture: A Proposal for Hydrological Drought Index-Based Insurance in Spain, Water, 11, 686, https://doi.org/10.3390/w11040686, 2019. a, b, c
Guo, J., Mao, K., Zhao, Y., Lu, Z., and Xiaoping, L.: Impact of Climate on Food Security in Mainland China: A New Perspective Based on Characteristics of Major Agricultural Natural Disasters and Grain Loss, Sustainability, 11, 869, https://doi.org/10.3390/su11030869, 2019. a, b, c, d, e, f, g
Guzmán, D. A., Mohor, G. S., and Mendiondo, E. M.: Multi-Year Index-Based Insurance for Adapting Water Utility Companies to Hydrological Drought: Case Study of a Water Supply System of the Sao Paulo Metropolitan Region, Brazil, Water, 12, 2954, https://doi.org/10.3390/w12112954, 2020. a, b
Halcrow, H. G.: Actuarial Structures for Crop Insurance, Am. J. Agr. Econ., 31, 418, https://doi.org/10.2307/1232330, 1949. a
Hillier, J. K., Matthews, T., Wilby, R. L., and Murphy, C.: Multi-hazard dependencies can increase or decrease risk, Nat. Clim. Change, 10, 595–598, https://doi.org/10.1038/s41558-020-0832-y, 2020. a
Hoek van Dijke, A. J., Herold, M., Mallick, K., Benedict, I., Machwitz, M., Schlerf, M., Pranindita, A., Theeuwen, J. J., Bastin, J.-F., and Teuling, A. J.: Shifts in regional water availability due to global tree restoration, Nat. Geosci., 15, 363–368, 2022. a
Hohl, R., Jiang, Z., Vu, M. T., Vijayaraghavan, S., and Liong, S.-Y.: Using a regional climate model to develop index-based drought insurance for sovereign disaster risk transfer, Agricultural Finance Review, 81, 151–168, https://doi.org/10.1108/AFR-02-2020-0020, 2021. a, b, c
Hudson, P., Botzen, W. W., Feyen, L., and Aerts, J. C.: Incentivising flood risk adaptation through risk based insurance premiums: Trade-offs between affordability and risk reduction, Ecol. Econ., 125, 1–13, 2016. a
IPCC: Climate Change 2022: Mitigation of Climate Change. Contribution of Working Group III to the Sixth Assessment Report of the Intergovernmental Panel on Climate Change, Cambridge Press University, ISBN 978-92-9169-160-9, 2022. a
Kahneman, D. and Tversky, A.: Prospect Theory: An Analysis of Decision under Risk, Econometrica, 47, 263–292, https://doi.org/10.2307/1914185, 1979. a
Kapsambelis, D., Moncoulon, D., and Cordier, J.: An Innovative Damage Model for Crop Insurance, Combining Two Hazards into a Single Climatic Index, Climate, 7, 125, https://doi.org/10.3390/cli7110125, 2019. a, b, c, d, e, f
Kath, J., Mushtaq, S., Henry, R., Adeyinka, A., and Stone, R.: Index insurance benefits agricultural producers exposed to excessive rainfall risk, Weather and Climate Extremes, 22, 1–9, https://doi.org/10.1016/J.WACE.2018.10.003, 2018. a, b
Kath, J., Mushtaq, S., Henry, R., Adeyinka, A. A., Stone, R., Marcussen, T., and Kouadio, L.: Spatial variability in regional scale drought index insurance viability across Australia's wheat growing regions, Climate Risk Management, 24, 13–29, https://doi.org/10.1016/j.crm.2019.04.002, 2019. a, b, c, d
Keskitalo, E. C. H., Vulturius, G., and Scholten, P.: Adaptation to climate change in the insurance sector: examples from the UK, Germany and the Netherlands, Nat. Hazards, 71, 315–334, 2014. a
Kim, W., Iizumi, T., and Nishimori, M.: Global patterns of crop production losses associated with droughts from 1983 to 2009, J. Appl. Meteorol. Clim., 58, 1233–1244, https://doi.org/10.1175/JAMC-D-18-0174.1, 2019. a
Komendantova, N., Mrzyglocki, R., Mignan, A., Khazai, B., Wenzel, F., Patt, A., and Fleming, K.: Multi-hazard and multi-risk decision-support tools as a part of participatory risk governance: Feedback from civil protection stakeholders, Int. J. Disast. Risk Re., 8, 50–67, https://doi.org/10.1016/j.ijdrr.2013.12.006, 2014. a
Kraehnert, K., Osberghaus, D., Hott, C., Habtemariam, L. T., Wätzold, F., Hecker, L. P., and Fluhrer, S.: Insurance Against Extreme Weather Events: An Overview, Review of Economics, 72, 71–95, https://doi.org/10.1515/roe-2021-0024, 2021. a
Leblois, A., Quirion, P., and Sultan, B.: Price vs. weather shock hedging for cash crops: Ex ante evaluation for cotton producers in Cameroon, Ecol. Econ., 101, 67–80, https://doi.org/10.1016/j.ecolecon.2014.02.021, 2014. a
Lesk, C., Coffel, E., Winter, J., Ray, D., Zscheischler, J., Seneviratne, S. I., and Horton, R.: Stronger temperature–moisture couplings exacerbate the impact of climate warming on global crop yields, Nature Food, 2, 683–691, 2021. a
Liaw, A. and Wiener, M.: Classification and Regression by randomForest, R News, 2, 18–22, https://CRAN.R-project.org/doc/Rnews/ (last access: 8 March 2023), 2002. a
Liberati, A., Altman, D. G., Tetzlaff, J., Mulrow, C., Gøtzsche, P. C., Ioannidis, J. P., Clarke, M., Devereaux, P. J., Kleijnen, J., and Moher, D.: The PRISMA statement for reporting systematic reviews and meta-analyses of studies that evaluate health care interventions: explanation and elaboration, J. Clin. Epidemiol., 62, e1–e34, 2009. a, b
Lyubchich, V., Newlands, N. K., Ghahari, A., Mahdi, T., and Gel, Y. R.: Insurance risk assessment in the face of climate change: Integrating data science and statistics, WIREs Comput. Stat., 11, e1462, https://doi.org/10.1002/wics.1462, 2019. a
Machado, M. L., Nascimento, N., Baptista, M., Gonçalves, M., Silva, A., Lima, J. d., Dias, R., Silva, A., Machado, E., and Fernandes, W.: Curvas de danos de inundação versus profundidade de submersão: desenvolvimento de metodologia, Revista de Gestão de Água da América Latina, 2, 35–52, 2005. a
MacQueen, J.: Classification and analysis of multivariate observations, in: 5th Berkeley Symp. Math. Statist. Probability, 1966, Barkley, University of California Press, 281–297, 1967. a
Martínez Salgueiro, A.: Weather index-based insurance as a meteorological risk management alternative in viticulture, Wine Economics and Policy, 8, 114–126, https://doi.org/10.1016/j.wep.2019.07.002, 2019. a, b, c, d, e, f, g, h, i
Miranda, M. J.: Area‐Yield Crop Insurance Reconsidered, Am. J. Agr. Econ., 73, 233–242, https://doi.org/10.2307/1242708, 1991. a, b
Mohor, G. S. and Mendiondo, E. M.: Economic indicators of hydrologic drought insurance under water demand and climate change scenarios in a Brazilian context, Ecol. Econ., 140, 66–78, https://doi.org/10.1016/j.ecolecon.2017.04.014, 2017. a, b, c, d, e, f, g
Monteleone, B., Borzí, I., Bonaccorso, B., and Martina, M.: Quantifying crop vulnerability to weather-related extreme events and climate change through vulnerability curves, Nat. Hazards, 1–36, online first, https://doi.org/10.1007/s11069-022-05791-0, 2022. a
Mortensen, E. and Block, P.: ENSO Index-Based Insurance for Agricultural Protection in Southern Peru, Geosciences, 8, 64, https://doi.org/10.3390/geosciences8020064, 2018. a, b, c
Müller, A. and Grandi, M.: Weather Derivatives: A Risk Management Tool for Weather-sensitive Industries, Geneva Pap. R. I.-Iss. P., 25, 273–287, https://doi.org/10.1111/1468-0440.00065, 2000. a, b
Mußhoff, O., Hirschauer, N., Grüner, S., and Pielsticker, S.: Bounded rationality and the adoption of weather index insurance, Agricultural Finance Review, 78, 116–134, https://doi.org/10.1108/AFR-02-2017-0008, 2018. a
Nelsen, R. B.: An Introduction to Copulas, in: Springer Series in Statistics, Springer New York, New York, NY, https://doi.org/10.1007/0-387-28678-0, 2006. a
Norton, M. T., Turvey, C., and Osgood, D.: Quantifying spatial basis risk for weather index insurance, The Journal of Risk Finance, 14, 20–34, https://doi.org/10.1108/15265941311288086, 2013. a, b, c
Odening, M. and Shen, Z.: Challenges of insuring weather risk in agriculture, Agricultural Finance Review, 74, 188–199, https://doi.org/10.1108/AFR-11-2013-0039, 2014. a
Parana: Levantamento da Produção Agropecuária, https://www.agricultura.pr.gov.br/deral/ProducaoAnual, last access: 8 March 2023. a
Paudel, Y., Botzen, W. J., and Aerts, J. C.: Influence of climate change and socio-economic development on catastrophe insurance: a case study of flood risk scenarios in the Netherlands, Reg. Environ. Change, 15, 1717–1729, 2015. a
Pereira, D. I., Pereira, P., Brilha, J., and Santos, L.: Geodiversity assessment of Paraná State (Brazil): an innovative approach, Environ. Manage., 52, 541–552, 2013. a
Peterson, T., Folland, C., Gruza, G., Hogg, W., Mokssit, A., and Plummer, N.: Report on the activities of the working group on climate change detection and related rapporteurs, World Meteorological Organization Geneva, http://etccdi.pacificclimate.org/docs/wgccd.2001.pdf (last access: 8 March 2023), 2001. a
Pislyakov, V. and Shukshina, E.: Measuring excellence in Russia: Highly cited papers, leading institutions, patterns of national and international collaboration, J. Assoc. Inf. Sci. Tech., 65, 2321–2330, https://doi.org/10.1002/asi.23093, 2014. a
Platteau, J.-P., De Bock, O., and Gelade, W.: The demand for microinsurance: A literature review, World Dev., 94, 139–156, 2017. a
Porth, L., Boyd, M., and Pai, J.: Reducing risk through pooling and selective reinsurance using simulated annealing: An example from crop insurance, Geneva Risk Ins. Rev., 41, 163–191, 2016. a
R Core Team: R: A Language and Environment for Statistical Computing, R Foundation for Statistical Computing, Vienna, Austria, https://www.r-project.org/ (last access: 8 March 2023), 2022. a
Raucci, G. L., Lanna, R., da Silveira, F., and Capitani, D. H. D.: Development of weather derivatives: evidence from the Brazilian soybean market, Italian Review of Agricultural Economics, 74, 17–28, https://doi.org/10.13128/REA-10850, 2019. a
Riahi, K., Van Vuuren, D. P., Kriegler, E., Edmonds, J., O'Neill, B. C., Fujimori, S., Bauer, N., Calvin, K., Dellink, R., Fricko, O., Lutz, W., Popp, A., Cuaresma, J. C., KC, S., Leimbach, M., Jiang, L., Kram, T., Rao, S., Emmerling, J., Ebi, K., Hasegawa, T., Havlik, P., Humpenöder, F., Da Silva, L. A., Smith, S., Stehfest, E., Bosetti, V., Eom, J., Gernaat, D., Masui, T., Rogelj, J., Strefler, J., Drouet, L., Krey, V., Luderer, G., Harmsen, M., Takahashi, K., Baumstark, L., Doelman, J. C., Kainuma, M., Klimont, Z., Marangoni, G., Lotze-Campen, H., Obersteiner, M., Tabeau, A., and Tavoni, M.: The shared socioeconomic pathways and their energy, land use, and greenhouse gas emissions implications: an overview, Global Environ. Change, 42, 153–168, 2017. a
Ricome, A., Affholder, F., Gérard, F., Muller, B., Poeydebat, C., Quirion, P., and Sall, M.: Are subsidies to weather-index insurance the best use of public funds? A bio-economic farm model applied to the Senegalese groundnut basin, Agr. Syst., 156, 149–176, https://doi.org/10.1016/j.agsy.2017.05.015, 2017. a
Righetto, J., Mendiondo, E., and Righetto, A.: Modelo de Seguro para Riscos Hidrológicos, Revista Brasileira de Recursos, 12, 107–113, https://doi.org/10.21168/rbrh.v12n2.p107-113, 2007. a
Rodríguez, Y. E., Pérez-Uribe, M. A., and Contreras, J.: Wind put barrier options pricing based on the Nordix index, Energies, 14, 1177, https://doi.org/10.3390/en14041177, 2021. a, b
Roznik, M., Brock Porth, C., Porth, L., Boyd, M., and Roznik, K.: Improving agricultural microinsurance by applying universal kriging and generalised additive models for interpolation of mean daily temperature, Geneva Pap. R. I.-Iss. P., 44, 446–480, https://doi.org/10.1057/s41288-019-00127-9, 2019. a
Sacchelli, S., Cipollaro, M., and Fabbrizzi, S.: A GIS-based model for multiscale forest insurance analysis: The Italian case study, Forest Policy Econ., 92, 106–118, https://doi.org/10.1016/j.forpol.2018.04.011, 2018. a, b, c, d, e, f
Sant, D. T.: Estimating Expected Losses in Auto Insurance, J. Risk Insur., 47, 133–151, https://doi.org/10.2307/252686, 1980. a
Sarris, A.: Weather index insurance for agricultural development: Introduction and overview, Agr. Econ., 44, 381–384, https://doi.org/10.1111/agec.12022, 2013. a
Saxton, K. E. and Rawls, W. J.: Soil water characteristic estimates by texture and organic matter for hydrologic solutions, Soil Sci. Soc. Am. J., 70, 1569–1578, 2006. a
Scopus: What is Scopus about?, https://service.elsevier.com/app/answers/detail/a_id/15100/supporthub/scopus/ (last access: 8 March 2023), 2022. a
Sekhri, S., Kumar, P., Fürst, C., and Pandey, R.: Mountain specific multi-hazard risk management framework (MSMRMF): Assessment and mitigation of multi-hazard and climate change risk in the Indian Himalayan Region, Ecol. Indic., 118, 106700, https://doi.org/10.1016/j.ecolind.2020.106700, 2020. a
Shirsath, P., Vyas, S., Aggarwal, P., and Rao, K. N.: Designing weather index insurance of crops for the increased satisfaction of farmers, industry and the government, Climate Risk Management, 25, 100189, https://doi.org/10.1016/j.crm.2019.100189, 2019. a, b, c, d, e
Skees, J. R.: Challenges for use of index‐based weather insurance in lower income countries, Agricultural Finance Review, 68, 197–217, https://doi.org/10.1108/00214660880001226, 2008. a, b, c
Smith, A. B. and Matthews, J. L.: Quantifying uncertainty and variable sensitivity within the US billion-dollar weather and climate disaster cost estimates, Nat. Hazards, 77, 1829–1851, https://doi.org/10.1007/s11069-015-1678-x, 2015. a
Štulec, I., Petljak, K., and Naletina, D.: Weather impact on retail sales: How can weather derivatives help with adverse weather deviations?, Journal of Retailing and Consumer Services, 49, 1–10, 2019. a, b
Swiss Re: World insurance: the recovery gains pace, Sigma, 3, Swiss Re, https://www.swissre.com/dam/jcr:ca792993-80ce-49d7-9e4f-7e298e399815/swiss-re-institute-sigma-3-2021-en.pdf (last access: 8 March 2023), 2021. a, b
Tilloy, A., Malamud, B. D., Winter, H., and Joly-Laugel, A.: A review of quantification methodologies for multi-hazard interrelationships, Earth-Sci. Rev., 196, 102881, https://doi.org/10.1016/J.EARSCIREV.2019.102881, 2019. a, b
Turvey, C., Shee, A., and Marr, A.: Addressing fractional dimensionality in the application of weather index insurance and climate risk financing in agricultural development: A dynamic triggering approach, Weather Clim. Soci., 11, 901–915, https://doi.org/10.1175/WCAS-D-19-0014.1, 2019. a, b
UNDRR: 2009 unisdr terminology on disaster risk reduction, https://www.unisdr.org/files/7817_UNISDRTerminologyEnglish.pdf (last access: 8 March 2023), 2009. a
UNDRR: Sendai Framework for Disaster Risk Reduction 2015-2030, https://www.undrr.org/publication/sendai-framework-disaster-risk-reduction-2015-2030 (last access: 8 March 2023), 2014. a, b
UNEP FI: Principles for sustainable insurance, UN Environment Programme Finance Initiative, Geneva, Switzerland, https://www.unepfi.org/insurance/insurance/ (last access: 8 March 2023), 2012. a
Van Vuuren, D. P., Edmonds, J., Kainuma, M., Riahi, K., Thomson, A., Hibbard, K., Hurtt, G. C., Kram, T., Krey, V., Lamarque, J.-F., Masui, T., Meinshausen, M., Nakicenovic, N., Smith, S. J., and Rose, S. K.: The representative concentration pathways: an overview, Climatic Change, 109, 5–31, 2011. a
Vroege, W., Bucheli, J., Dalhaus, T., Hirschi, M., and Finger, R.: Insuring crops from space: the potential of satellite-retrieved soil moisture to reduce farmers' drought risk exposure, Eur. Rev. Agric. Econ., 48, 266–314, https://doi.org/10.1093/erae/jbab010, 2021. a, b, c
Wang, S. S.: A Universal Framework for Pricing Financial and Insurance Risks, ASTIN Bull., 32, 213–234, https://doi.org/10.2143/AST.32.2.1027, 2002. a
Yoshida, K., Srisutham, M., Sritumboon, S., Suanburi, D., Janjirauttikul, N., and Suanpaga, W.: Evaluation of economic damages on rice production under extreme climate and agricultural insurance for adaptation measures in Northeast Thailand, Engineering Journal, 23, 451–460, https://doi.org/10.4186/ej.2019.23.6.451, 2019. a
Zara, C.: Weather derivatives in the wine industry, International Journal of Wine Business Research, 22, 222–237, https://doi.org/10.1108/17511061011075365, 2010. a
Zscheischler, J., Martius, O., Westra, S., Bevacqua, E., Raymond, C., Horton, R. M., van den Hurk, B., AghaKouchak, A., Jézéquel, A., Mahecha, M. D., Maraun, D., Ramos, A. M., Ridder, N. N., Thiery, W., and Vignotto, E.: A typology of compound weather and climate events, Nature Reviews Earth & Environment, 1, 333–347, 2020. a, b