the Creative Commons Attribution 4.0 License.
the Creative Commons Attribution 4.0 License.
 | 24 Mar 2022
Spatiotemporal evolution and meteorological triggering conditions of hydrological drought in the Hun River basin, NE China
Shupeng Yue
Xiaodan Sheng
Fengtian Yang
The change of climate and environmental conditions has obviously affected the evolution and propagation of drought in river basins. The Hun River basin (HRB) is a region seriously troubled by drought in China, so it is particularly urgent to evaluate the evolution of hydrological drought and investigate the threshold of triggering hydrological drought in the HRB. In this study, the standardized runoff index (SRI) was applied to reveal the evolution characteristics of hydrological drought. Meanwhile, based on drought duration and severity identified by the run theory, the copula function with the highest goodness of fit was selected to calculate the return period of hydrological drought. Furthermore, the propagation time from meteorological to hydrological drought was determined by calculating the Pearson correlation coefficients between 1-month SRI and multi-timescale standardized precipitation index (SPI). Finally, based on the improvement of the drought propagation model, the drought propagation thresholds for triggering different scenarios of hydrological drought and its potential influence factors were investigated. The results show that (1) the hydrological drought showed a gradually strengthened trend from downstream to upstream of the HRB from 1967 to 2019; (2) downstream of the HRB were districts vulnerable to hydrological drought with longer drought duration and higher severity; (3) the most severe drought with drought duration of 23 months and severity of 28.7 had corresponding return periods that exceed the thresholds of both duration and severity of 371 and 89 years, respectively; (4) the propagation time from meteorological to hydrological drought downstream of reservoir has been significantly prolonged; and (5) the drought propagation threshold downstream of the HRB was remarkably higher than that upstream in all drought scenarios. Additionally, midstream showed the highest drought propagation threshold at moderate and severe drought scenarios, while downstream showed the highest drought propagation threshold in the extreme drought scenario.
Please read the corrigendum first before continuing.
-
Notice on corrigendum
The requested paper has a corresponding corrigendum published. Please read the corrigendum first before downloading the article.
-
Article
(7870 KB)
-
The requested paper has a corresponding corrigendum published. Please read the corrigendum first before downloading the article.
- Article
(7870 KB) - Full-text XML
- Corrigendum
- BibTeX
- EndNote


Drought is a complex natural disaster caused by the abnormal decrease in precipitation, which can have serious effects on agriculture, ecology, and social economy (Oladipo, 1985; Huang and Chou, 2008; Huang et al., 2015; Fang et al., 2019; Guo et al., 2019). Compared with other natural disasters, droughts cause much more severe damage than other natural disasters because of their extensive spatial impact and generally longer duration (Mishra and Singh, 2010). In the last few decades, remarkable changes in global climate and environment have aggravated the occurrence of hydrological extreme events characterized by drought (Wilhite and Glantz, 2009; Palmer and Räisänen, 2002; Kunkel, 2003; Beniston and Stephenson, 2004; Christensen and Christensen, 2004; Leng et al., 2015).
Hydrological drought, usually lagging the occurrence of meteorological drought, manifests in the case of long-term lack of precipitation, resulting in the overall water supply shortage in terms of river flow, groundwater, and reservoir storage (Vicente-Serrano and López-Moreno, 2005; Van Lanen et al., 2013; Joetzjer et al., 2013). Developing reliable drought indices can reliably reveal the hydrological drought status of the basin (Mishra and Singh, 2011; Wang et al., 2020). The standardized runoff index (SRI), established based on runoff variation, is commonly applied in hydrological drought evaluation and has been widely used in drought frequency analysis and drought risk management (Vicente-Serrano et al., 2012; Rivera et al., 2017; Chen et al., 2018; Xu et al., 2019; Yang et al., 2020). Therefore, based on the SRI, the spatiotemporal evolution of drought events can be analyzed quantitatively. Run theory (Yevjevich, 1967), a time series analysis method, is widely applied to identify drought events and extract drought characteristic values, such as drought duration and severity (Kim et al., 2011; Z. P. Liu et al., 2016; Z. Y. Liu et al., 2016; Wu et al., 2017; Sun et al., 2019). The copula function can be suitable to combine multiple drought characteristic variables and provides an effective method for multivariate frequency analysis (Lee et al., 2013; Vyver and Bergh, 2018; Dash et al., 2019; Lindenschmidt and Rokaya, 2019). Thus, once a suitable copula function is selected to model the joint distribution of drought duration and drought severity, the return period of hydrological drought can be estimated, which has significant practical significance for regional hydrological drought prediction (Kao and Govindaraju, 2009; Mirabbasi et al., 2012).
In general, hydrological drought results from the accumulation of meteorological drought conditions. Many scholars have made lots of attempts to study the relationship between hydrological drought and meteorological drought (Pandey and Ramasastri, 2001; Van Loon et al., 2012; Leng et al., 2015; Barker et al., 2016; Sattar et al., 2019). Amongst these previous studies, more efforts have been focused on the calculation of drought propagation time (Lorenzo-Lacruz et al., 2013; Huang et al., 2017; Gevaert et al., 2018). The Pearson correlation coefficients between 1-month SRI and multi-timescale standardized precipitation index (SPI) were calculated to determine the drought propagation time from meteorological drought to hydrological drought. Furthermore, the timescale of SPI with the highest correlation with the single-timescale SRI is regarded as drought propagation time (i.e., PTMH) (Barker et al., 2016; Huang et al., 2017; Fang et al., 2019). However, there are few studies on the severity of the meteorological drought that triggers hydrological drought with different levels. Guo et al. (2020b) explored the drought propagation thresholds of meteorological drought for triggering hydrological drought at various levels based on the copula-based conditional probability model. The duration and severity of meteorological drought were used to characterize the drought propagation threshold. However, it is not ideal to use duration or severity of meteorological drought to represent the drought propagation threshold for triggering hydrological drought because of its relative absolute and inconvenient monitoring. Guo et al. (2020a) proposed a drought propagation threshold model based on Bayesian networks, which took cumulative precipitation deficit as the condition and single-timescale SRI as the target to clarify the impact of large reservoirs on watershed drought tolerance by calculating cumulative deficit rainfall, triggering different levels of hydrological drought. However, although single-timescale SRI can capture hydrological regime changes sensitively and accurately, a severe drought event usually lasts for several months. Therefore, it is not accurate to take the cumulative precipitation deficit calculated with a single-timescale SRI as the threshold for triggering hydrological drought in the drought propagation threshold model. Also, it is highly necessary to select appropriate hydrological and meteorological drought factors as targets and conditions to improve the drought propagation threshold model so as to obtain a more accurate propagation threshold for triggering different scenarios of hydrological drought.
In view of this, this paper adopted the SRI to study the hydrological drought in the HRB. The primary objectives of this paper are
-
to reveal the spatiotemporal evolution characteristics of hydrological drought,
-
to select the best-fit copula and calculate the hydrological drought return period,
-
to determine the PTMH, and
-
to establish a drought propagation threshold model based on a Bayesian network to determine the propagation thresholds for triggering different scenarios of hydrological drought.
The HRB, as presented in Fig. 1, is located in Liaoning Province, NE China, and covers an area of 11 481 km2, among which the hilly area occupies 67 %, and plain area 33 %. The basin belongs to the temperate semi-humid and semi-arid monsoon climate, with four distinct seasons and the same season of rain and heat and weak climate differences within the basin. The warm and wet air flow from the low-latitude tropical monsoon circulation prevails in the summer and brings more rainy days, while the Siberia–Mongolia high-pressure dry, cold continental air flow occurs during the winter, with prevailing north wind and northwest wind, resulting in low temperature and less precipitation. The multi-year average precipitation is approximately 780 mm, with obvious seasonal characteristics, and the precipitation in the main flood season (July to August) accounts for about 48.5 % of the annual precipitation.
The Dahuofang (DHF) reservoir, located in the middle and upper reaches of the HRB, is a large-scale water control project, with a total storage capacity of 2.268 billion cubic meters. The DHF reservoir plays a vital function in flood control and water supply, as well as power generation and fish farming. Since the opening of the DHF reservoir in 1958, the irrigation, the river ecosystem of the region, and the hydrological condition of the river channel have been greatly affected. Four hydrological stations in the HRB were selected from upstream to downstream, Beikouqian (BKQ), Dahuofang (DHF), Shenyang (SY), and Xingjiawopeng (XJWP), to explore the spatial distribution of hydrological drought in this study. The locations of the four hydrological stations are shown in Fig. 1. The BKQ is located upstream of the DHF reservoir, while SY and XJWP are successively arranged downstream of the DHF reservoir. The four hydrological stations selected are located downstream of each basin, so the hydrological information of each basin can be reflected by the status of the corresponding hydrological stations (Fu et al., 2004). They represent the hydrological conditions above BKQ, from BKQ to DHF, from DHF to SY, and from SY to XJWP. The monthly runoff data of these four hydrological stations and monthly precipitation data of the 20 meteorological stations during 1967–2019 were adopted in this study, which were collected from the hydrological data of Liao River basin from the Year Book of Hydrology PR China. Among them, the runoff data of the DHF station is the inflow runoff of the DHF reservoir. Additionally, the Thiessen polygon method was applied to calculate the precipitation of meteorological stations to get the corresponding area precipitation of each hydrological station.
In this study, SRI and SPI were employed to characterize meteorological drought and hydrological drought, respectively (McKee et al., 1993; Shukla and Wood, 2008). Run theory was applied to the SRI-1 series to identify hydrological drought events and capture their corresponding drought characteristic values, drought duration, and severity. SRI and drought characteristic values were implied to quantitatively reveal the evolution characteristics of hydrological drought. Meanwhile, the copula functions with the highest goodness of fit were selected to establish the joint distribution of drought duration and drought severity and calculate the return period of hydrological drought. The Pearson correlation coefficients between SRI-1 and multi-timescale SPI were calculated to determine the PTMH. Based on the PTMH and drought duration, the cumulative precipitation deficit of each hydrological drought event was determined, which was applied to characterize meteorological drought. Drought duration and severity were used to describe a single hydrological drought event. Then, based on the copula function and Bayesian model, a improvement drought propagation threshold model was established, including the cumulative precipitation deficit, drought duration, and drought severity. Finally, the drought propagation threshold interval would be determined according to the magnitude of the conditional probability of occurrence of hydrological drought events under different cumulative precipitation deficit conditions.
3.1 Standardized precipitation index (SPI) and standardized runoff index (SRI)
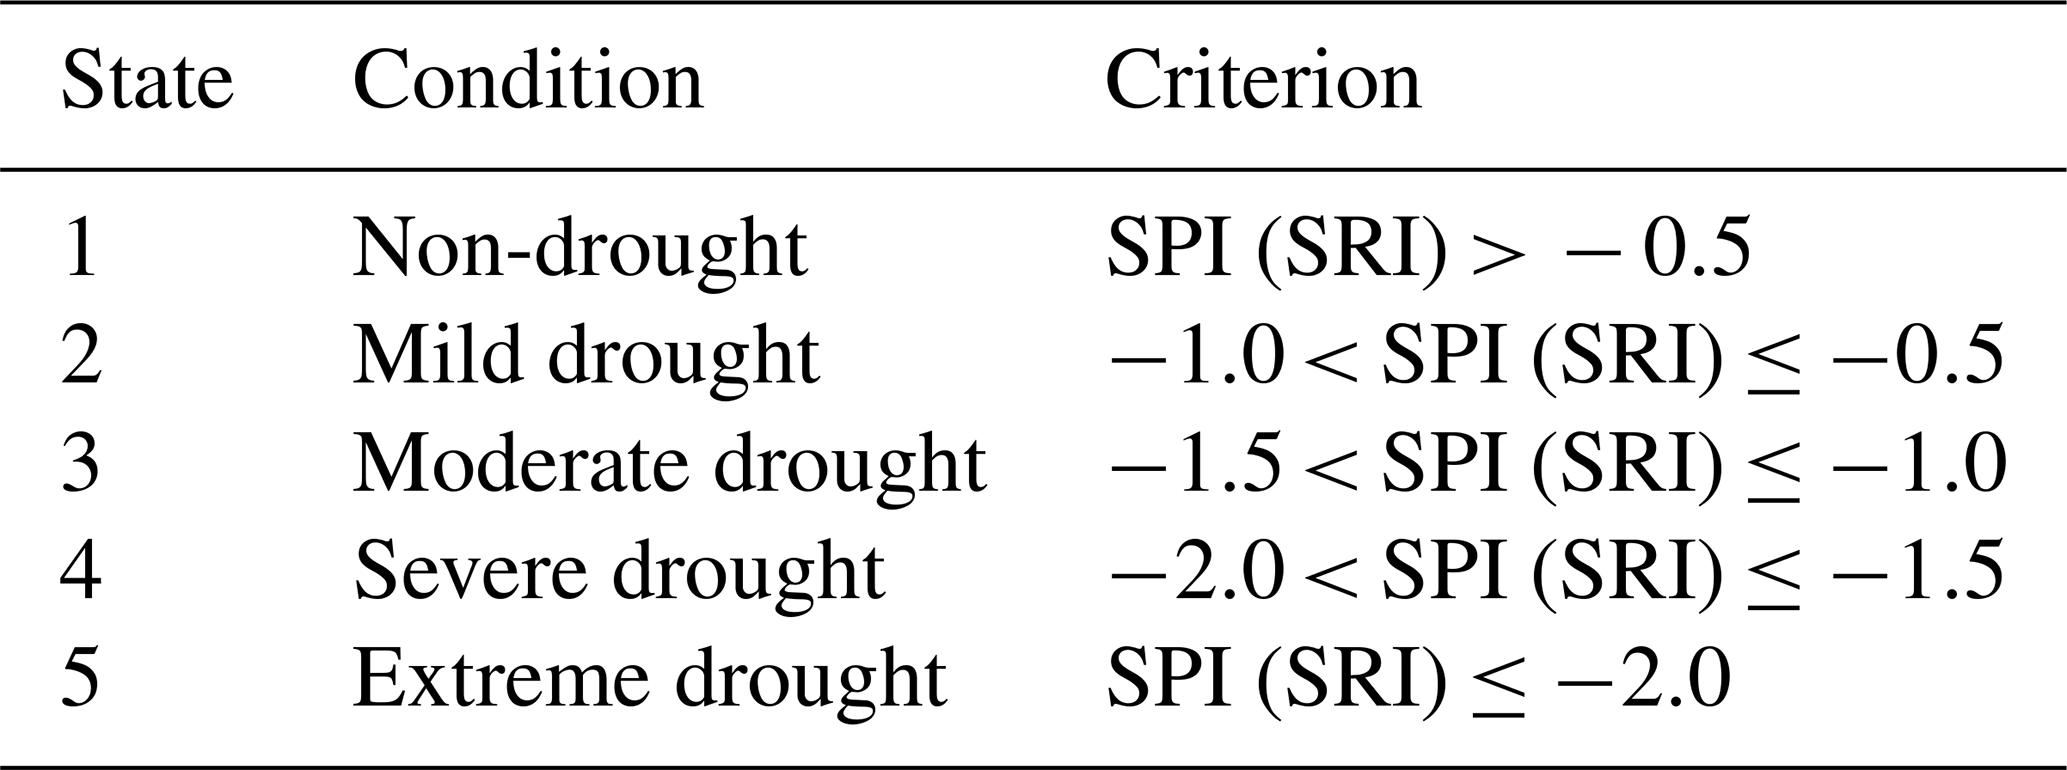
SPI was proposed by McKee et al. (1993) to characterize the drought conditions in Colorado, USA, and it has been recommended by the World Meteorological Organization as the primary meteorological drought index to be used. SRI was proposed by Shukla and Wood (2008) to reflect drought from the perspective of hydrology. Both SPI and SRI, established based on historical precipitation and runoff data respectively, can monitor droughts over a range of timescales. SPI and SRI were calculated in similar calculation procedures, in which gamma distributions were used to describe the variation in precipitation and runoff, respectively. The cumulative probability of precipitation/runoff can be obtained based on gamma distribution, and then cumulative probability was converted to the standard normal distribution to obtain SPI and SRI values. More details on the calculation can be found in Huang et al. (2017). According to the SPI and SRI values, droughts are classified into five classes. The criteria are shown in Table 1.
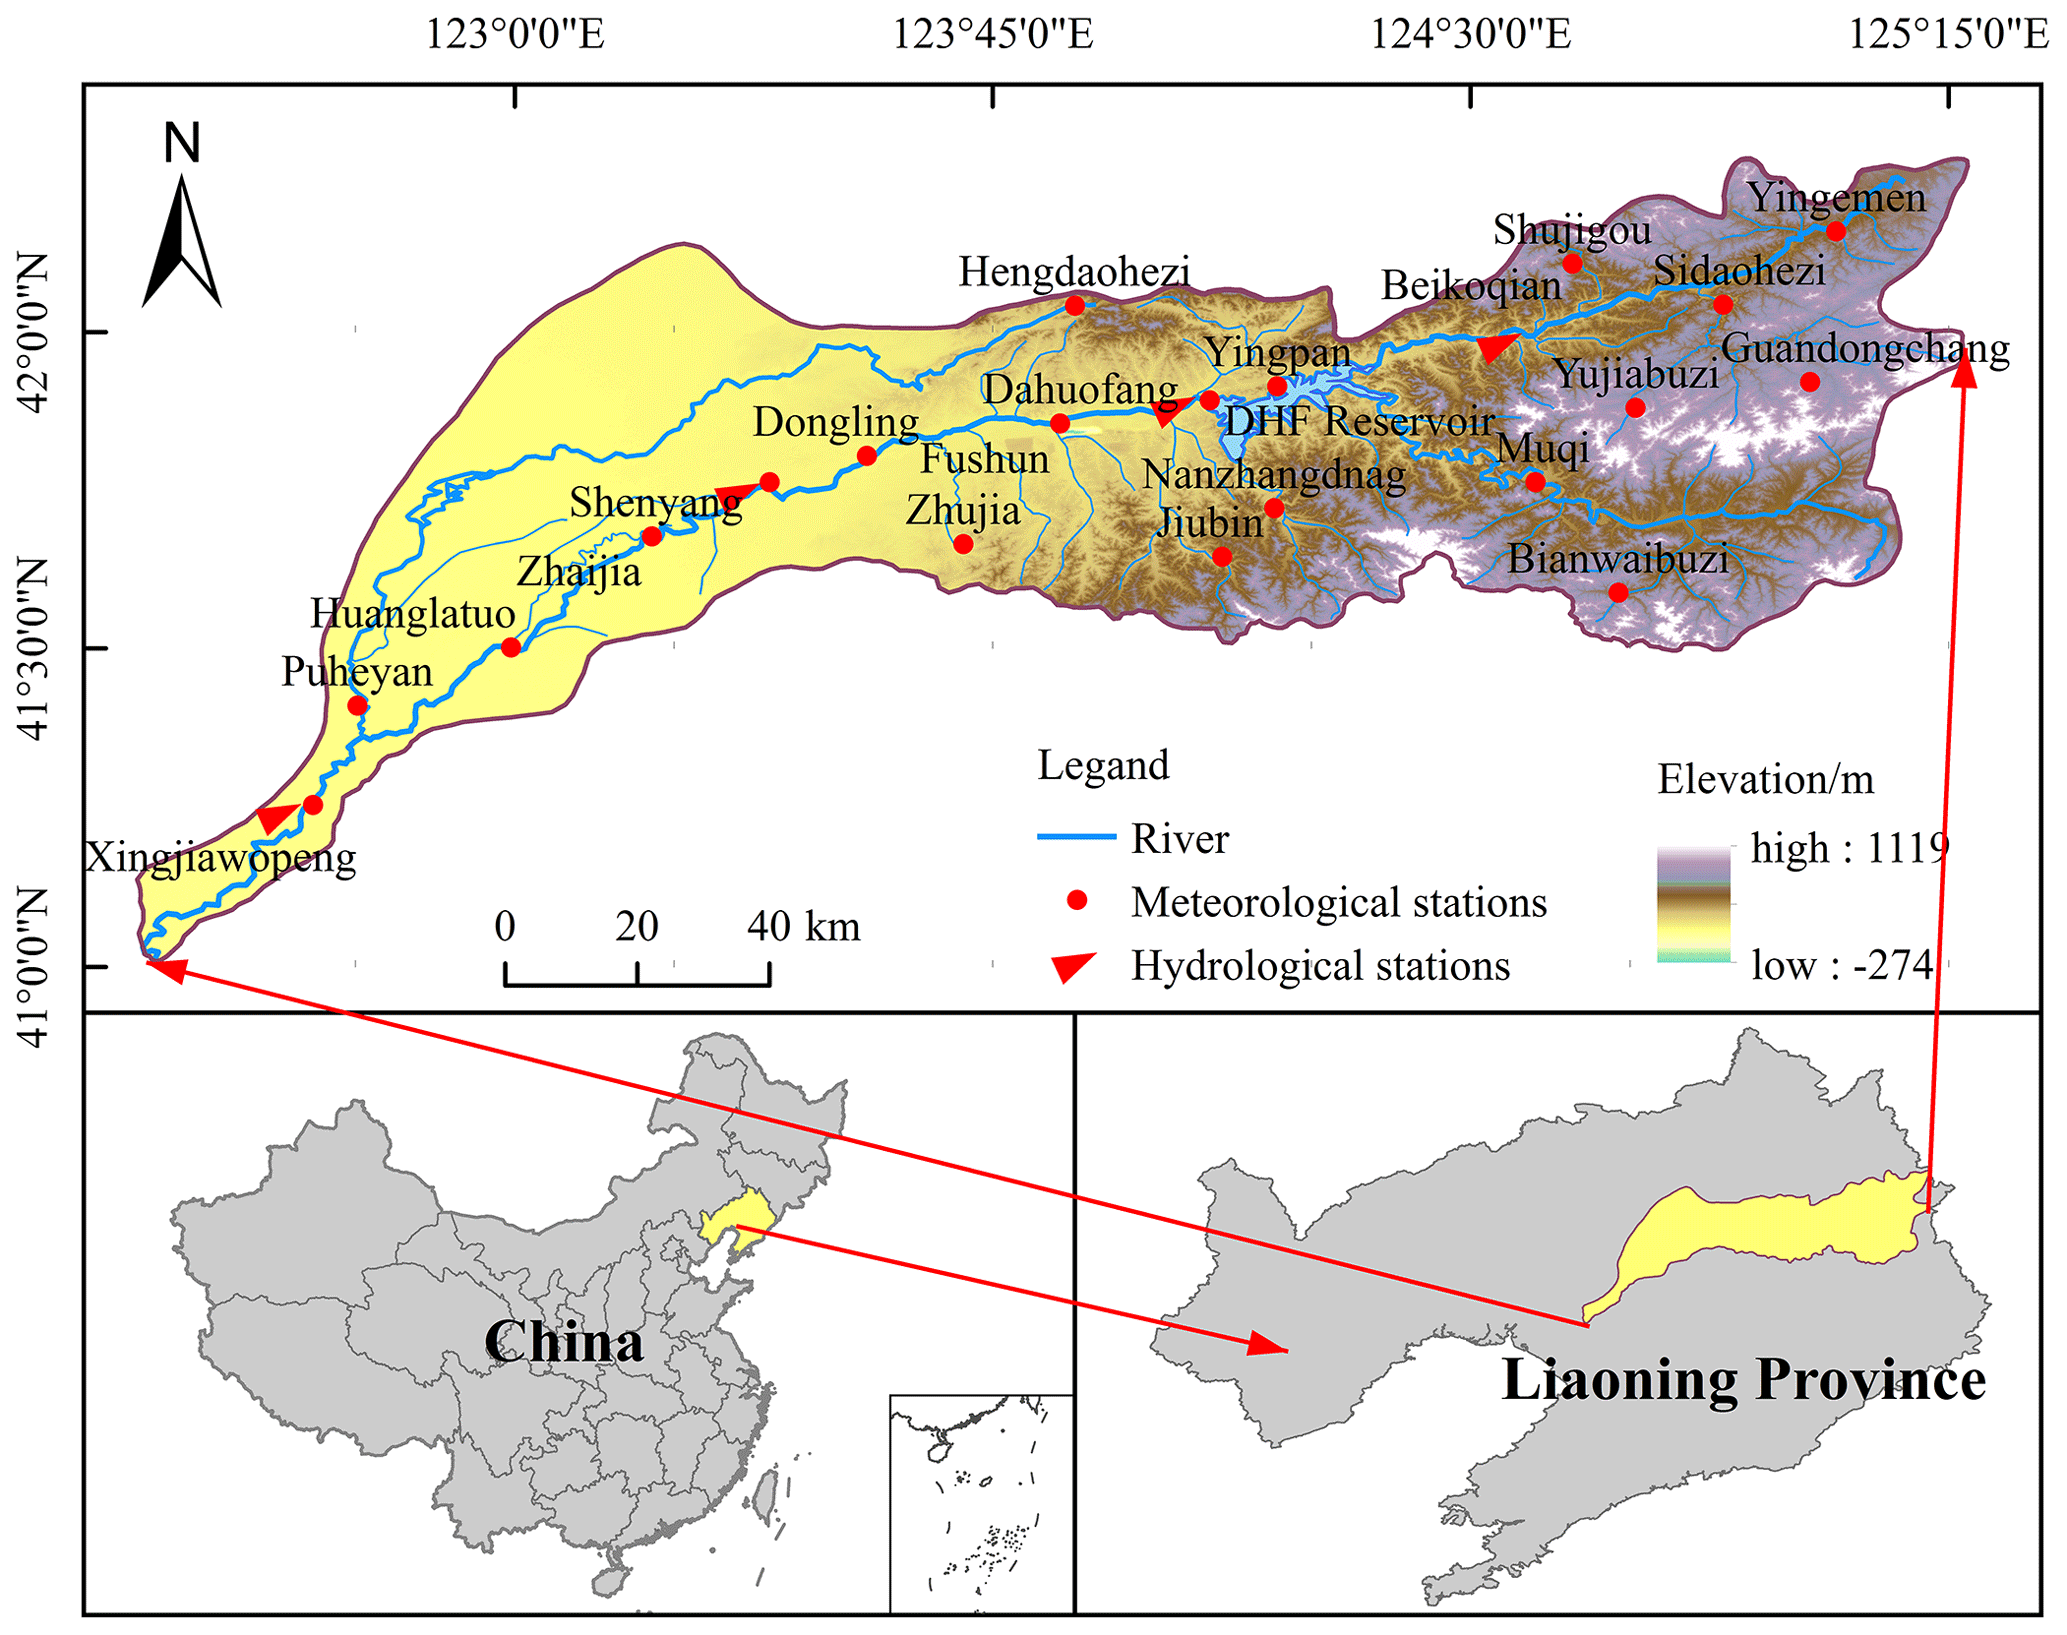
Figure 1Locations of the HRB, DHF reservoir, and meteorological and hydrological stations.
Table 1Definition of drought conditions based on the SPI (SRI).
3.2 The modified Mann–Kendall trend test method
The Mann–Kendall (M–K) trend test (Mann, 1945; Kendall, 1990), a non-parametric statistical testing method, is widely used to access the trends of hydrological variables. The M–K method assumes that the data are independent and randomly ordered. However, the SRI series are autocorrelated, which influences the significance of the test results. The modified Mann–Kendall (MMK) trend test method can eliminate the autocorrelation components in the sequence and improves the testing ability of the M–K method (Hamed and Rao, 1998; Longobardi et al., 2021). Therefore, this paper adopted the MMK method to investigate the trend characteristics of hydrological drought in the HRB during 1967–2019 with the significance level of 0.05 and the corresponding . The calculation procedure of the MMK method was described in Longobardi et al. (2021).
3.3 Drought identification and copula estimation
Run theory is a time series analysis method which is widely applied to identify drought events and extract drought characteristic values (Yevjevich, 1967; Zhao et al., 2017; Sun et al., 2019). It is worth mentioning that in the process of drought recognition, some severe drought events may be interrupted by some non-drought events with short drought duration, causing severe drought events to be divided into several less severe drought events, thus weakening the impact of drought. Therefore, optimizing the threshold level of drought recognition is crucial to improve the accuracy of run theory in drought analysis (Wang et al., 2020). In this paper, based on the three thresholds SRI0 (−0.5), SRI1 (−1.0), and SRI2 (0.0), the run theory was used to identify three drought characteristics, namely drought event, duration, and severity, from the 1-month scale SRI sequence. Figure 2 shows the process of drought recognition based on the threshold method, and the specific identification process is as follows.
-
Drought characteristics are considered to appear when the SRI value is less than SRI0. Hence, it is preliminarily determined that drought occurs during the period from t1 when the SRI value is equal to or less than SRI0 to t2 when the SRI value is equal to SRI0 or even larger. The run duration (i.e., t2−t1) and the absolute value of the accumulated SRI during the drought are identified as drought duration (D) and drought severity (S), respectively. For example, five drought processes (i.e., a, b, c, d, and e) can be recognized in Fig. 2.
-
On the basis of (1), if a drought has a duration of just 1 month, it is considered a drought event only when its corresponding SRI value is less than SRI1, otherwise it is not (c).
-
If a drought event (e) occurs 1 month later than the preceding one (d), and the SRI value in between is less than SRI2, these two drought events (d and e) are regarded as one combined drought event, otherwise they are considered two independent drought events. The severity and duration of the combined drought event are and , respectively.

The sequences of drought duration and severity determined by the run theory were then fitted by five common functions, including gamma (GAM), generalized extreme value (GEV), exponential (EXP), lognormal (Logn), and Weibull (WBL) distributions (Rad et al., 2017; Wang et al., 2020). Furthermore, Kolmogorov–Smirnov (K–S) (Hand, 2005), root mean square error (RMSE), and Akaike information criteria (AIC) (Akaike, 1974) tests were employed to identify the best-fit marginal distribution functions. The copula function is a multidimensional joint distribution function defined in [0, 1] and can integrate marginal distributions of several dependent random variables to structure a joint probability distribution with multiple features. Previous studies have proven that the copula function is a high-efficiency tool for multivariate probability analysis of drought (Hao and Singh, 2015; Salvadori and De Michele, 2015; Ren et al., 2020). Its equation is expressed as follows:
where C(u,v) represents the copula function combining two random variables u and v, and φ is convex function.
In this study, according to the univariate empirical frequency of drought duration and severity, three typical drought scenarios were selected to analyze the return periods. The scenarios corresponding to the univariate cumulative empirical frequency intervals of [0.5, 0.75), [0.75, 0.95) and [0.95, 1] were defined as moderate, severe, and extreme drought, respectively. The dependency structures of drought duration and severity were modeled with the commonly used binary copula functions, including Gumbel–Hougaard, Clayton, Frank, t, and normal (Lee et al., 2013; Wang et al., 2020). K–S, RMSE, AIC, and Cramér–von Mises (C–M) (Genest et al., 2011; Rad et al., 2017) tests were applied to select the best copula function with the highest goodness of fit (GOF). In addition, several joint probability expressions corresponding to bivariate return periods were used to further explore the occurrence frequency of hydrological drought. The expressions of joint probability are defined as (Shiau, 2006; Kwon and Lall, 2016)
where E(L) denotes the expected value of drought interval, and FD(d) and FS(s) are marginal cumulative density functions of drought duration and severity, respectively. F(d,s) is the joint distribution function of drought duration and severity. Tand is the return period of drought events that both exceed the thresholds of duration (D≥d) and severity (S≥s), and Tor is the return period of drought events that exceed the threshold of duration (D≥d) or severity (S≥s).
3.4 The drought propagation time
In general, hydrological drought is a response to the accumulation of meteorological drought conditions. Generally, the change of hydrological regime can be characterized sensitively by the single-timescale SRI, and the accumulation of meteorological drought in the preceding n months can be reflected by the n-timescale SPI. The timescale of SPI with the highest correlation with the single-timescale SRI is regarded as drought propagation time (Barker et al., 2016; Fang et al., 2019). Therefore, Pearson correlation between monthly scale SRI and multi-timescale SPI (1–24 months) was adopted in this study to determine the PTMH, which is denoted as TP.
3.5 The calculation of drought propagation threshold
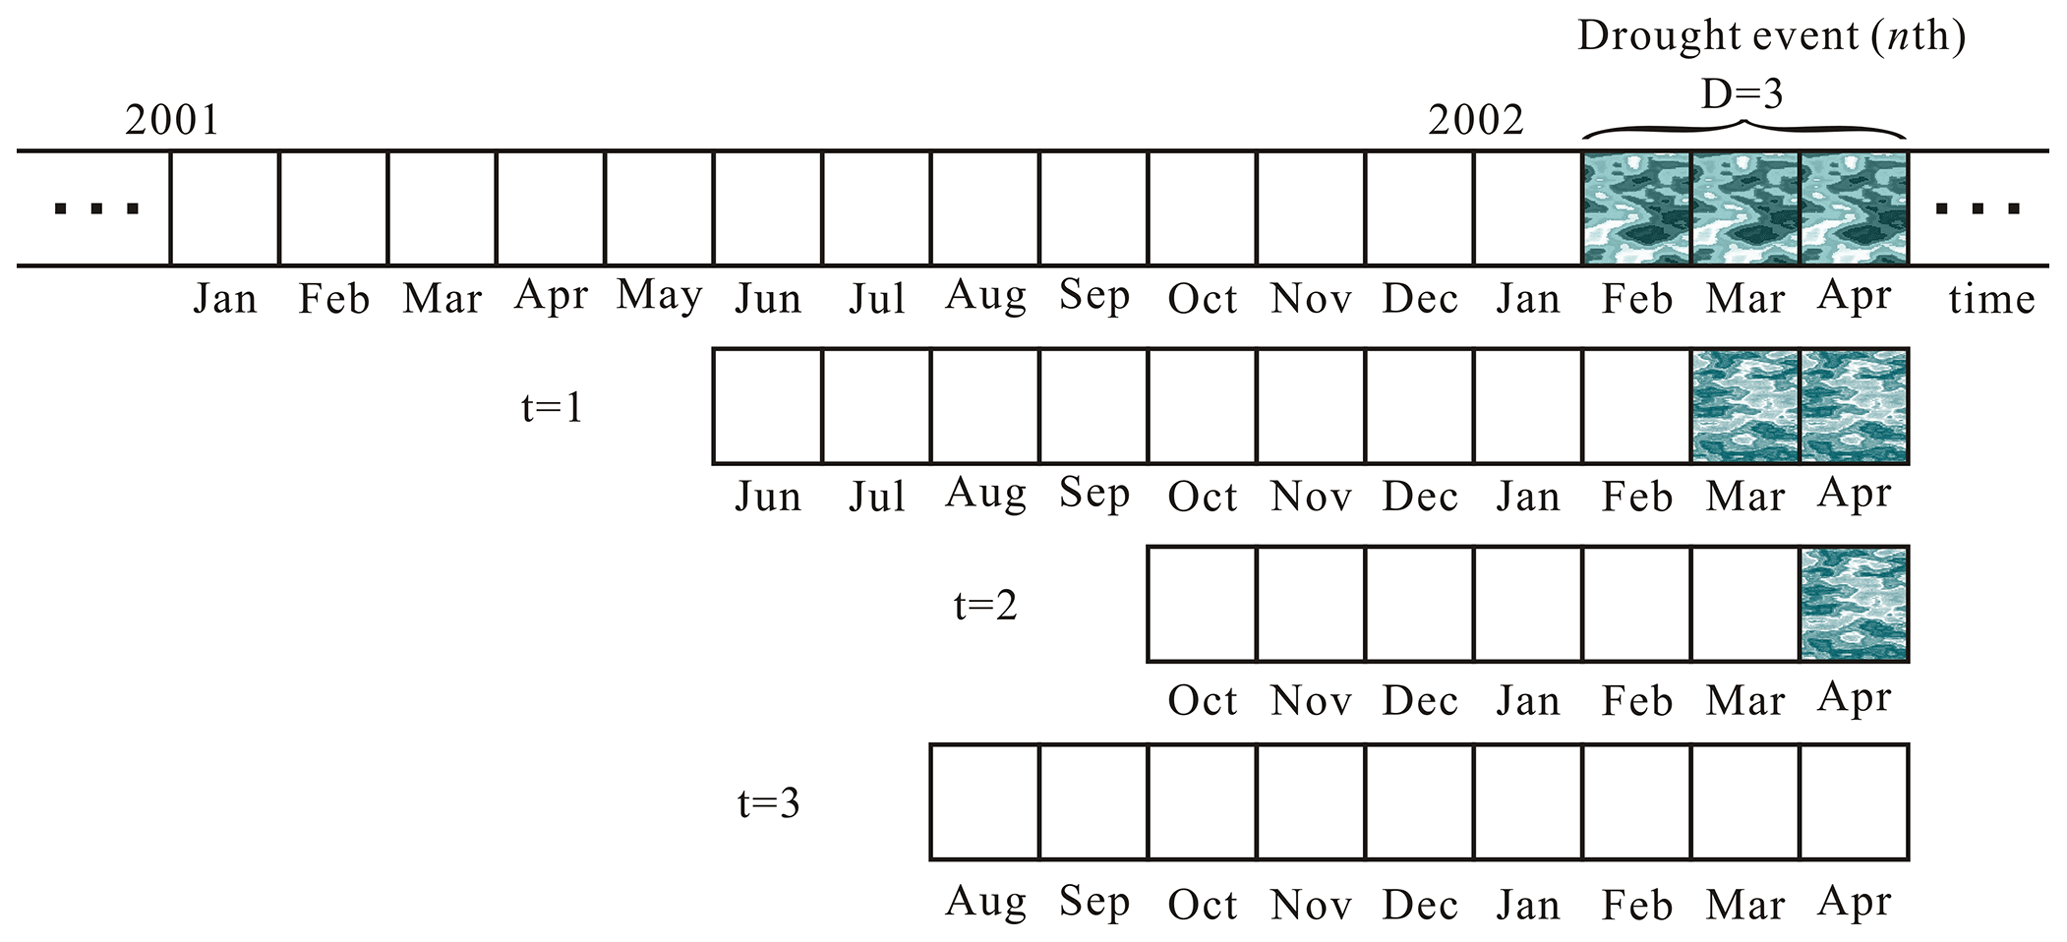
In order to obtain more accurate propagation threshold triggering hydrological drought in different scenarios, we improved the drought propagation threshold model based on a Bayesian network model by selecting appropriate hydrological and meteorological drought factors in this study. Before analyzing joint probability and Bayesian networks, the marginal distribution must be determined. In this study, the drought duration (D) and severity (S) and cumulative precipitation deficit (CPD, mm) of each drought event were selected to describe the hydrological and meteorological drought, respectively. The D and S of each drought event were identified from the SRI-1 sequence based on the run theory. The CPD is the cumulative precipitation deficit of each hydrological drought event during the PTMH, which is defined as
where CPDn is the corresponding CPD for the nth drought, Pi denotes the precipitation during the period of i, Pm represents the multi-annual average monthly precipitation of the actual mth month corresponding to i, refers to the drought propagation time of the month represented by t (i.e., when t equals 3 but the actual month is February, refers to the drought propagation time of February), and D is the drought duration of the nth drought event. To make the calculation process of CPD clearer, Fig. 3 was drawn to further explain Eq. (4). As shown in Fig. 3, it is assumed that the nth drought event occurred in February 2002 with the drought duration of 3 months (February to April). At the same time, it is assumed that drought propagation time of February, March, and April is 9, 6, and 9 months, respectively. According to Eq. (4), when t is equal to 1 (corresponding to February 2001), combined with the drought propagation duration of February being 9 months, it is believed that precipitation conditions affecting this drought can be traced back to June 2001, as shown in Fig. 3. Similarly, when t equals 2 and 3 (corresponding to March and April 2002), the precipitation affected the drought dates back to October and August 2001, respectively. Taking the above into consideration, when t is equal to 1, the precipitation that affects this drought can be traced furthest, so the CPD of this drought event is the absolute value of the sum of monthly precipitation minus their monthly average precipitation from June 2001 to March 2002.
A Bayesian network, a probabilistic graph model, is widely used in drought impact assessment (Sattar et al., 2019; Guo et al., 2020a). Therefore, a threshold model of drought propagation based on a Bayesian network is established in this study. Suppose X (x1, x2 …, xn) and Y (y1, y2 …, yn) are two random variables, with X and Y as conditions and targets, respectively. Then, in the case of X≥u, the probability of Y≥v can be expressed as
where C(x(u), y(v)) represents the joint cumulative probability of X≤u and Y≤v, x(u) and y(v) denote the cumulative probability of X≤u and Y≤ v, and x and y are the marginal cumulative distribution of two random variables X and Y. In addition, when , the probability of Y≥v is expressed as
where u1 and u2 are the upper and lower limits of the given interval.
Figure 4 shows the schematic diagram for determining drought propagation thresholds based on bivariate copula functions and Bayesian networks. Figure 4a shows the graphical model of the Bayesian network. It describes the causal relationships among the CPD, D, S, and hydrological drought levels (HDLs). HDL includes three drought scenarios defined in Sect. 3.3 in terms of univariate empirical frequencies of drought duration and severity, which are moderate, severe, and extreme drought. The response variable here is hydrological drought with two components D and S, and the feature variable that characterizes the response variable is CPD. Figure 4b shows the selection of the probability distributions of D (S) and CPD and the determination of their joint distributions. As Fig. 4b showed, according to the method of determining the marginal distribution described in Sect. 3.3, the best-fit marginal distribution functions of D, S, and CPD under three drought scenarios were identified. The commonly used bivariate theoretical copula functions, including Clayton, Frank, and Gumbel copulas, were considered for modeling the dependence structure between CPD and D (S). Furthermore, K–S, C–M, RMSE, and AIC tests were applied to select the GOF copula function. Then, the joint distributions of CPD and D (S) under three drought scenarios were established based on the GOF copula functions. Figure 4c expresses the process of determining CPD thresholds for triggering multiple hydrological drought scenarios. As shown in Fig. 4c, in this model, the D and S of each drought event are taken as the target, respectively, and the corresponding CPD is identified as the condition. According to Eqs. (5) and (6), the conditional probability of hydrological drought under different CPD conditions would be calculated for different scenarios. Generally, as the accumulation of meteorological drought, the probability of occurrence hydrological drought will be infinitely close to 1. The confidence level in this study is 0.95, which means while the conditional probability is equal to or greater than 0.95, the corresponding CPD will be taken as the meteorological triggering conditions of hydrological drought in this scenario.

Figure 4The schematic of determining the drought propagation threshold based on bivariate copula functions and the Bayesian network. (a) The graphical model of the Bayesian network about CPD, D, S, and HDL. (b) Selecting the probability distributions of D (S) and CPD and determinating their joint distributions. (c) Quantifying the CPD threshold under multiple drought scenarios.
4.1 Spatiotemporal evolution of hydrological drought
Figure 5 depicts the temporal variation trend of hydrological drought based on the SRI-1 in the HRB from 1967 to 2019, which presented different temporal evolution characteristics in upstream and downstream of the reservoir. It is clear from Fig. 5a, b that the temporal evolution characteristics of the SRI-1 sequence in BKQ and DHF were similar, showing a non-significant downward trend, indicating that drought in DHF and BKQ has a slight increasing trend. The significant strengthening trend of drought occurred from March 1991 to October 2004, with an average SRI value of −0.29 and −0.48 and minimum of −1.81 and −3.33, respectively. Figure 5c, d show that the temporal evolution characteristics of hydrological drought were similar without obvious trend characteristics in SY and XJWP. Droughts occurred mainly from May 1977 to April 1984, November 1988 to July 1993, and March 2000 to March 2005 in SY, with an average SRI value of −0.56, −0.50, and −0.83, respectively. Similarly, droughts occurred mainly from May 1977 to April 1984, November 1988 to July 1993, and March 2000 to September 2003 in XJWP, with an average SRI value of −0.84, −0.57, and −0.70, respectively.

Figure 5Temporal variation in hydrological drought based on monthly scales in the HRB during 1967–2019. Panels (a)–(d) show BKQ, DHF, SY, and XJWP, respectively.
The multi-timescale SRI applies to describe the mean hydrological regime during the preceding few months. Therefore, the SRI-3 and SRI-12 were calculated to analyze the seasonal and annual variation trend of hydrological drought. The SRI-3 values in February, May, August, and November were applied to describe the variations in hydrological drought in winter, spring, summer, and autumn, respectively. It is worth mentioning that the irrigation and river ecological water that occurs from May to August is supplied by the reservoir through the river channel, which affects the river runoff. Therefore, this paper considers the water supply period (WS–P) to be from May to August and the storage period (S–P) from September to April of the following year. Meanwhile, the SRI-4 values in August and SRI-8 values in April were applied to describe the variations in hydrological drought in WS–P and S–P, respectively. Figure 6 presents the temporal variation in hydrological drought on seasonal scales, WS–P and S–P in the HRB from 1967 to 2019. From the seasonal perspective, the drought trend was different in sub-regions, with the linear slope of SRI changing from to years. SRI showed a decreasing trend in summer, autumn, and winter in BKQ, with the linear slope of SRI being , , and years, which indicated that drought was aggravating in summer, autumn, and winter. SRI showed a decreasing trend in spring, summer, and autumn in DHF, with the linear slope of SRI being , , and years, which indicated that drought was aggravating in spring, summer, and autumn. The linear slope of SRI was 0.16710 and 0.20810 years in spring and winter and and years in summer and autumn in SY, indicating that drought was strengthening in summer and autumn and decreasing in spring and winter. Similar to the temporal characteristics of SY, drought showed a strengthening trend in summer and autumn and a decreasing trend in spring and winter in XJWP, with the linear slope of SRI being , , 0.31910, and 0.46910 years. From the WS–P and S–P perspective, the drought trends were different in sub-regions at different periods. It can be observed from Fig. 6 that SRI showed a decreasing trend in both WS–P and S–P, while the decrease was greater in WS–P than S–P in BKQ and DHF. Furthermore, SRI showed a decreasing trend in S–P and an increasing trend in WS–P at both SY and XJWP. Considering the above information, the drought was aggravating in BKQ and DHF, while the drought was weakening in SY and XJWP at WS–P.
In order to further explore the temporal evolution characteristics of hydrological drought, the trend characteristic U values of the MMK trend test of multi-timescale SRI were calculated. Table 2 shows the calculation results of trend characteristic value U at the seasonal scale, WS–P, S–P, and annual scale. It is clear from Table 2 that the characteristics of drought trends in different periods and stations are obviously different. On the annual scale, the U values of BKQ, DHF, SY, and XJWP stations were −2.26, −1.58, −0.34, and −0.10, indicating a significant strengthening trend of drought in the HRB. In addition, the drought trend gradually increased from the lower reaches to the upper reaches and strengthened significantly in BKQ. On the seasonal scale, the U values of each sub-basin in summer and autumn were less than zero, which indicated that drought was strengthening in summer and autumn in the HRB. Furthermore, the U values of BKQ and XJWP in summer were less than −1.96, which indicated that drought was significantly strengthening in summer at BKQ and XJWP. The U values of BKQ in spring and winter were 2.14 and −2.24, respectively, indicating that drought showed a weakening trend in spring and a strengthening trend in winter, both of which reached a significant level. The U values of DHF were less than zero in spring and winter, which indicated that drought showed a strengthening trend in spring and winter at DHF. However, the U values of SY and XJWP stations were 3.04, 2.76, 3.30, and 9.90 in spring and winter, respectively. These trend characteristic U values passed the significance test, indicating that the drought showed a significant strengthening trend in spring and winter at the SY and XJWP of the HRB. From the WS–P and S–P perspective, the U values of each sub-basin in S–P were less than zero, which indicated that drought was strengthening in S–P at the HRB. The U values of WS–P were less than zero in BKQ and DHF, while they were greater than zero in SY and XJWP. In addition, the trend characteristic U values of BKQ and XJWP passed the significance test. Thus, the drought showed a strengthening trend at BKQ and DHF, while it showed a weakening trend at SY and XJWP in WS–P, which can be confirmed with the conclusions of the previous section.
Table 2U values of SRI at different scales in the HRB during 1967–2019.
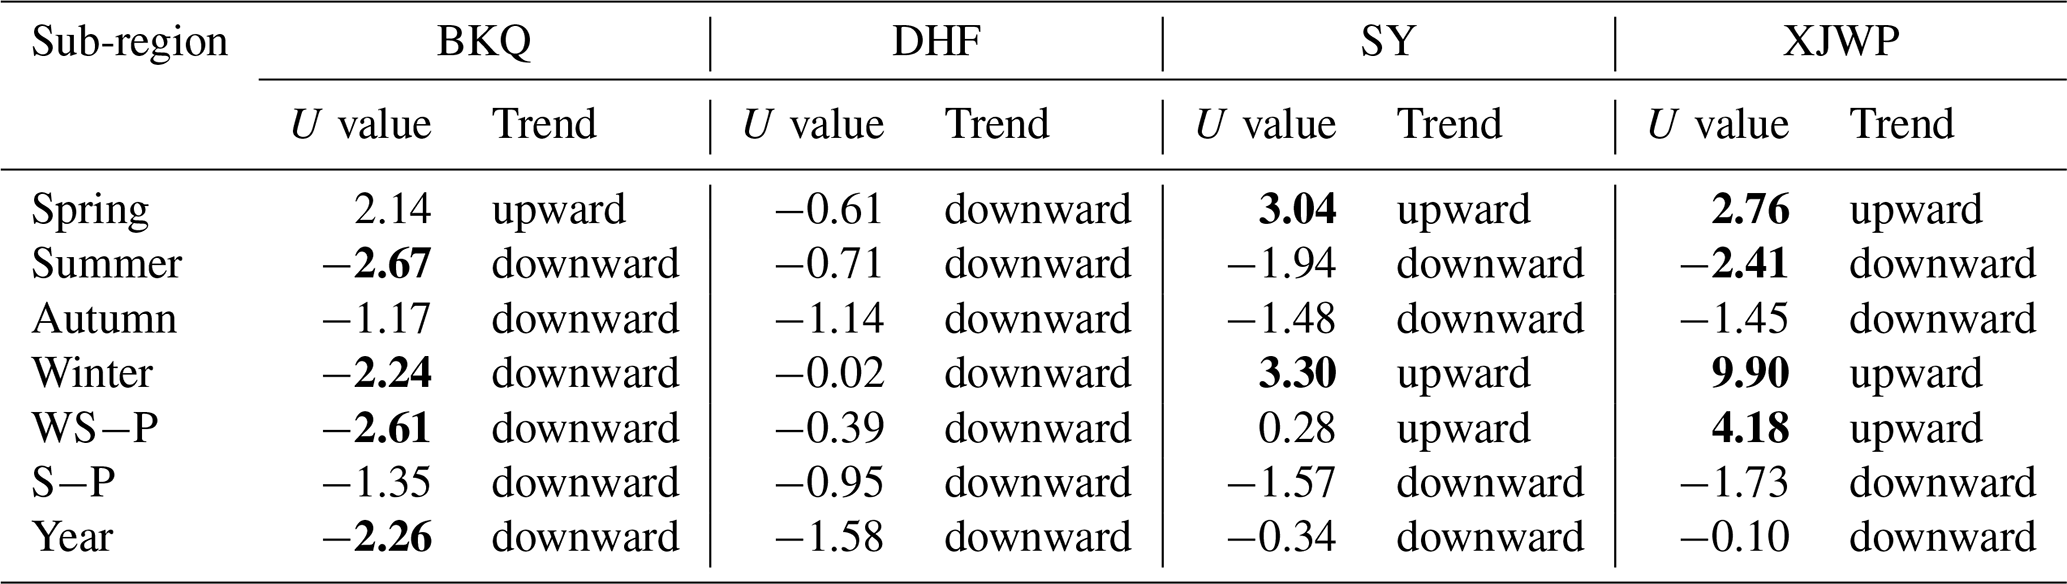
The bold letters denote that the Uvalues passed the MMK trend test of α= 0.05.
Based on the run theory, three drought factors, namely drought events, duration, and severity, were identified from the 1-month scale SRI sequence. Drought events which were detected sum up to 186 in four districts of the HRB during 1967–2019. DHF was most frequently affected by drought, with a total of 57 drought events, followed by BKQ, XJWP, and SY with 53, 39, and 37 drought events, respectively. The box chart of drought duration and severity was drawn, and the spatial distribution of drought was discussed (Fig. 7). Figure 7 shows that the districts with a mean of drought duration of more than 5 months included SY and XJWP, where the mean of drought duration differs greatly from the median. Furthermore, the mean of drought duration in BKQ and DHF was smaller than that of SY and XJWP, and the difference between their mean and median was small. Besides, SY and XJWP experienced extremely long and persistent drought events lasting more than 20 and 23 months, respectively. Taking the above two points into consideration, the drought duration downstream (BKQ and DHF) of the reservoir is longer than that upstream (SY and XJWP), and downstream is more likely to experience long-duration extreme drought events. Drought severity and drought duration maintained a highly consistency. The mean drought severity of drought events downstream of the reservoir was higher than that upstream, and the drought events with the maximum severity occurred in XJWP (Fig. 7). In summary, the downstream district of the reservoir was vulnerable to hydrological drought, whereas the drought duration and severity were more serious than upstream. Nevertheless, the upstream district of the reservoir was more sensitive to short-duration drought, which was dominated by 2-month and 3-month drought events.
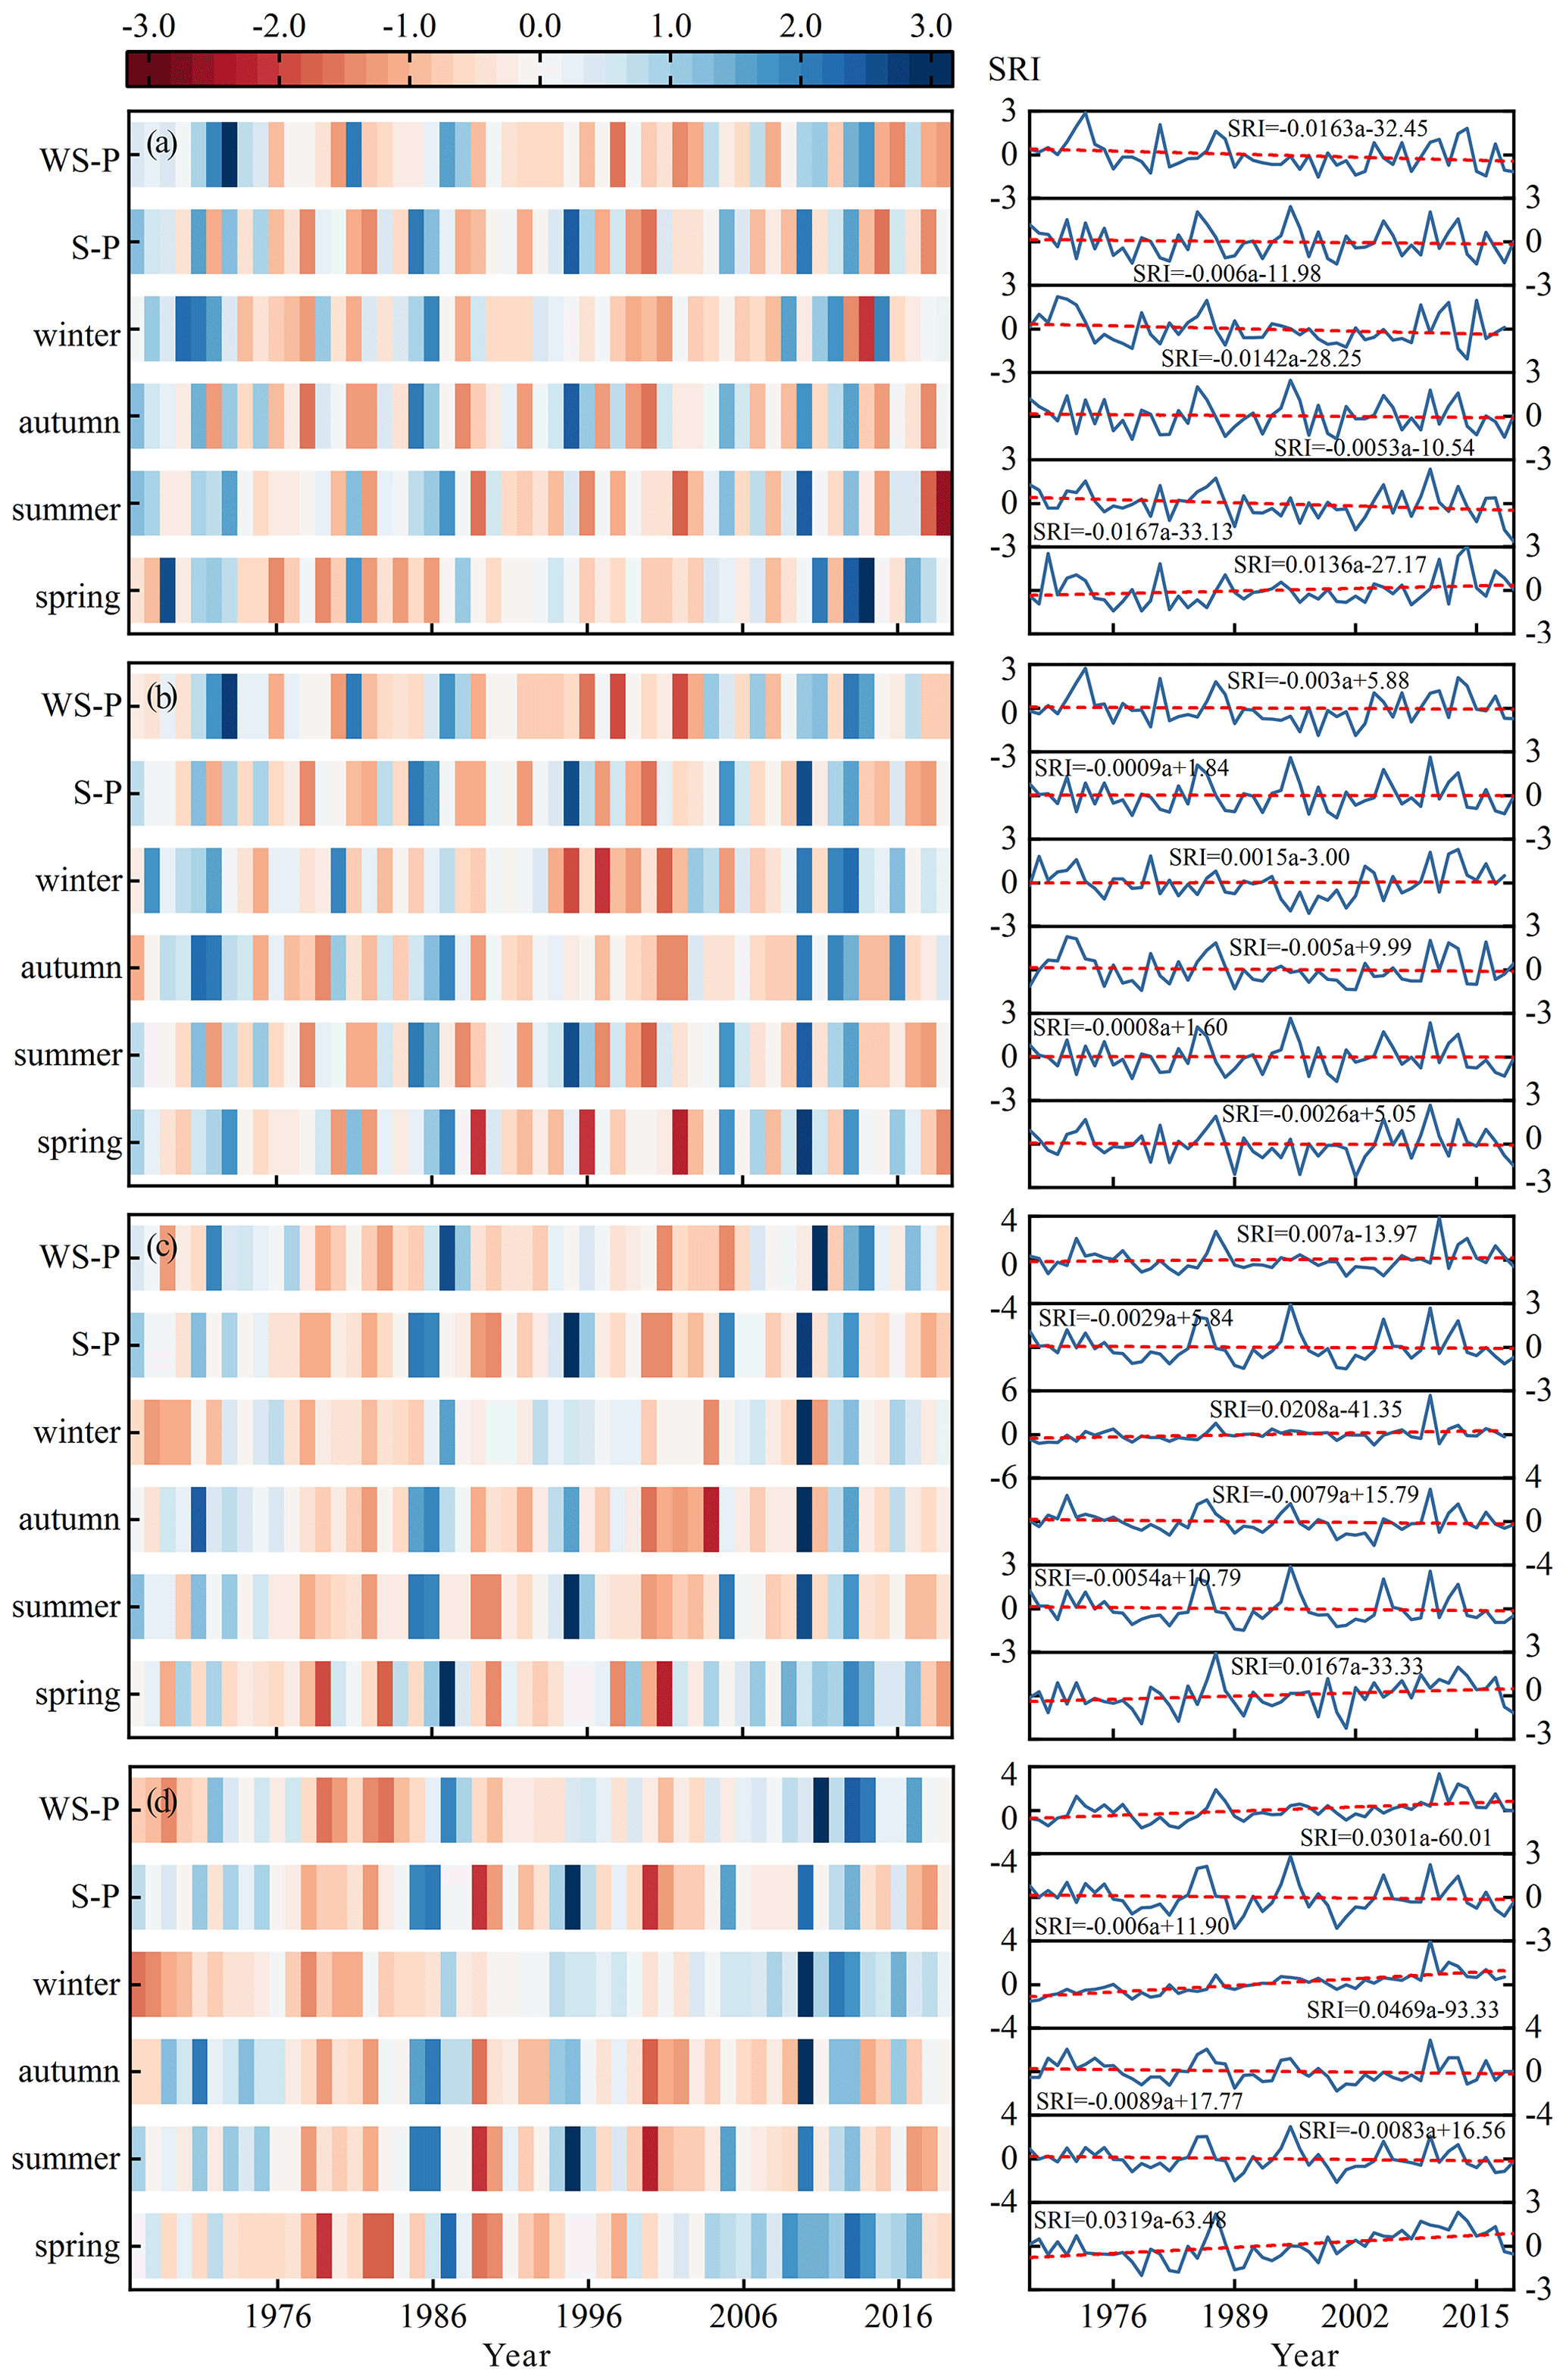
Figure 6Temporal variation in hydrological drought at seasonal scales in the HRB from 1967 to 2019. Panels (a)–(d) show BKQ, DHF, SY, and XJWP, respectively.

4.2 Return period analysis
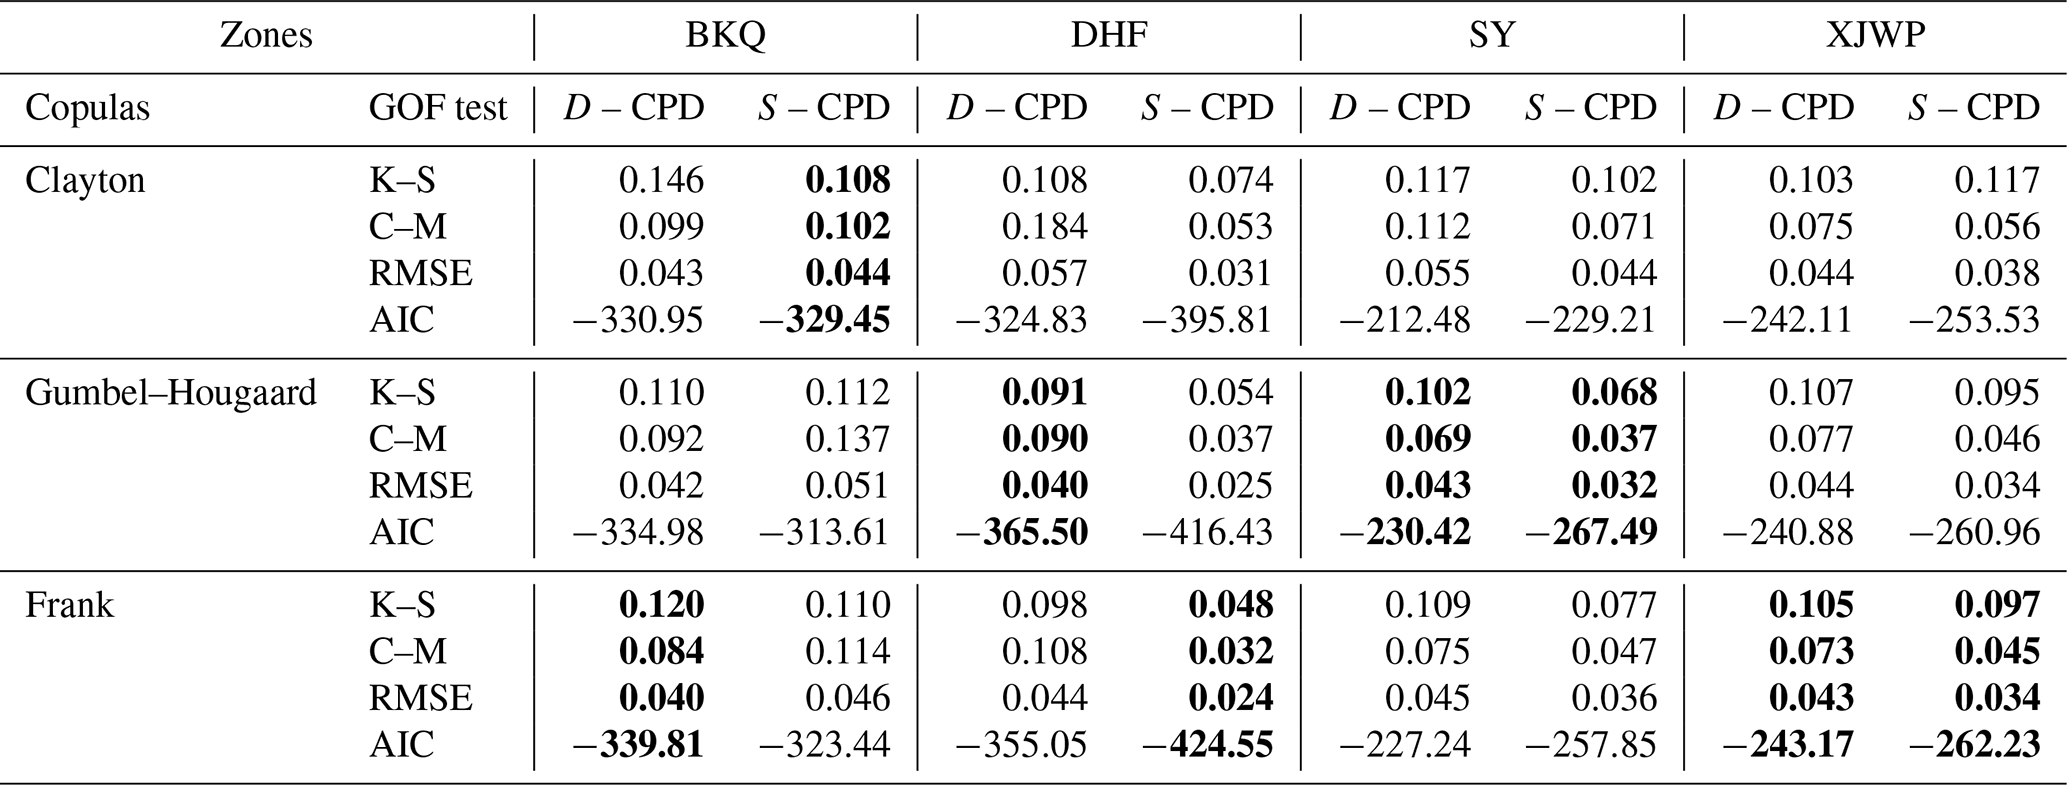
In order to grasp the occurrence frequency of hydrological drought in the HRB, the recurrence was analyzed by calculating the return period. In this study, five common functions including gamma, EXP, GEV, Logn, and WBL were used to fit the sequence of duration and severity of hydrological drought events in the three sub-basins of the HRB. AIC, RMSE, and K–S tests were applied to select the best-fit marginal distribution, and the results are shown in Table 3. Table 3 illustrates that the optimal distribution for different drought characteristics passed the K–S test (α= 0.05) in all four sub-regions. The joint distribution of drought duration and severity in the HRB was determined with the application of copula functions. According to the values of K–S, C–M, RMSE, and AIC, the GOF copula functions were selected as the best joint distribution of drought duration and severity in the HRB (Table 4).
Table 3Optimum marginal distribution function of drought characteristics (D, S, and CPD).
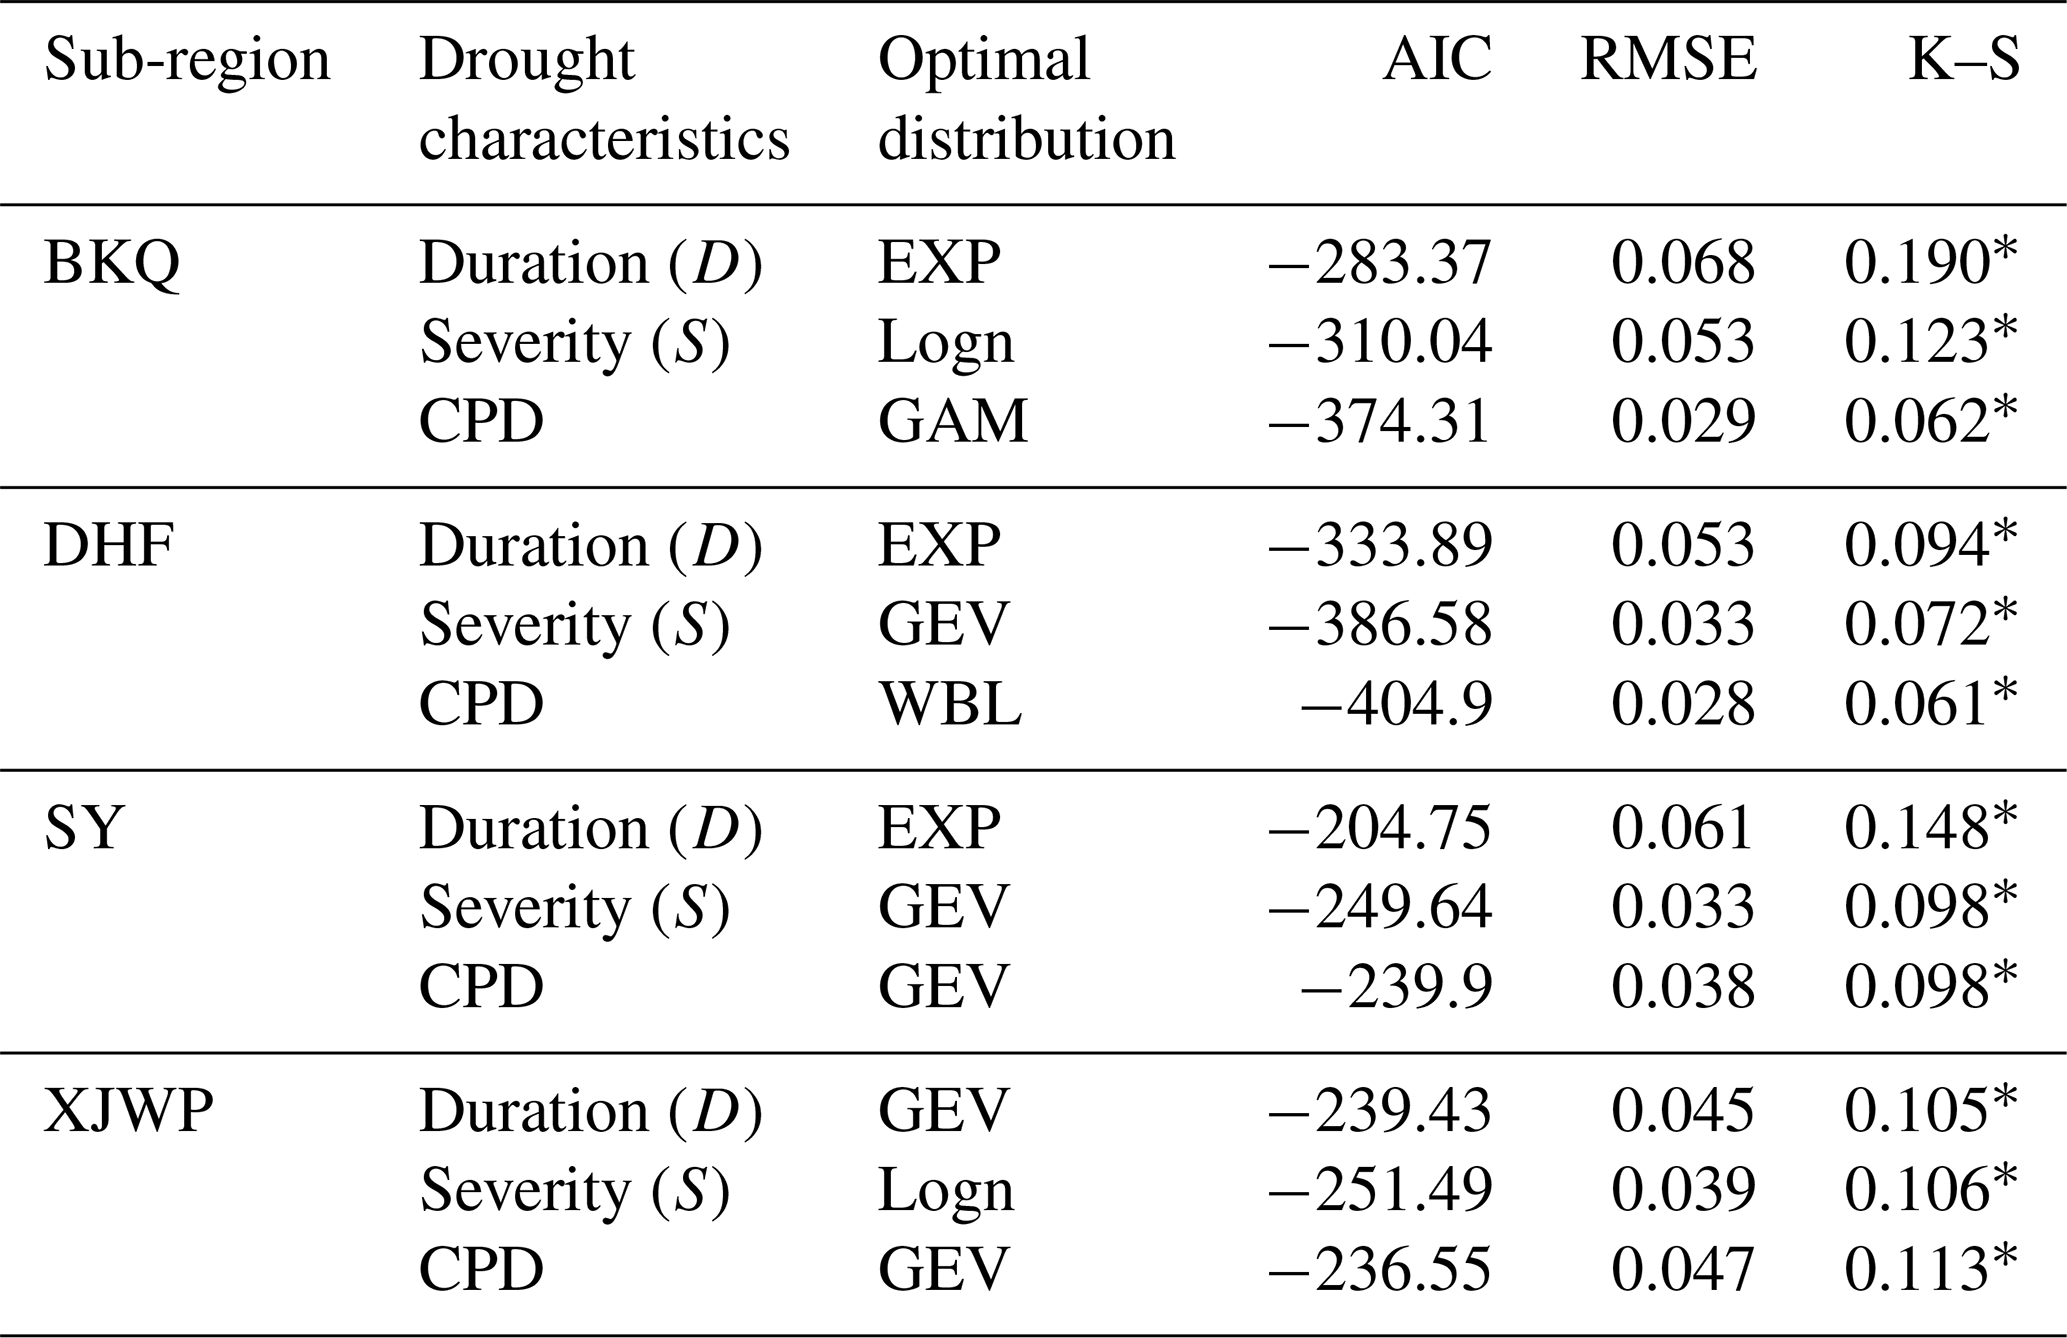
Asterisks denote that the optimal distribution passed the K–S test of α = 0.05.
Table 4GOF evaluation of different copula functions about drought duration and severity in the HRB.

Bold letters represent the optimal copula functions.
Figure 8 shows the contour plots of return period levels of drought events based on the optimal copula, and the return period Tand and Tor of drought events in each sub-region can be observed. The drought return period increased with the increase in drought duration and severity in the HRB. For the same drought event, return period Tand would be higher than Tor. Meanwhile, regarding the same return period, drought duration and severity from large to small were SY, BKQ, DHF, and XJWP. In BKQ, the drought occurring from December 1981 to October 1982 was the most severe, lasting 11 months, with severity of 11.5, and the return periods Tand and Tor were 46 and 11 years, respectively. In DHF, the drought occurring from September 2001 to July 2002 was the most severe, lasting 11 months, with severity of 16.2, and return periods Tand and Tor were 33 and 17 years, respectively. In SY, the most severe drought happened from May 2000 to November 2001, lasting 19 months, with severity of 24.1, and return periods Tand and Tor were 152 and 24 years, respectively. Similarly, the drought occurring from August 1981 to June 1983 was the most severe in XJWP, lasting 23 months, with severity of 28.7, and return periods Tand and Tor were 371 and 89 years, respectively.
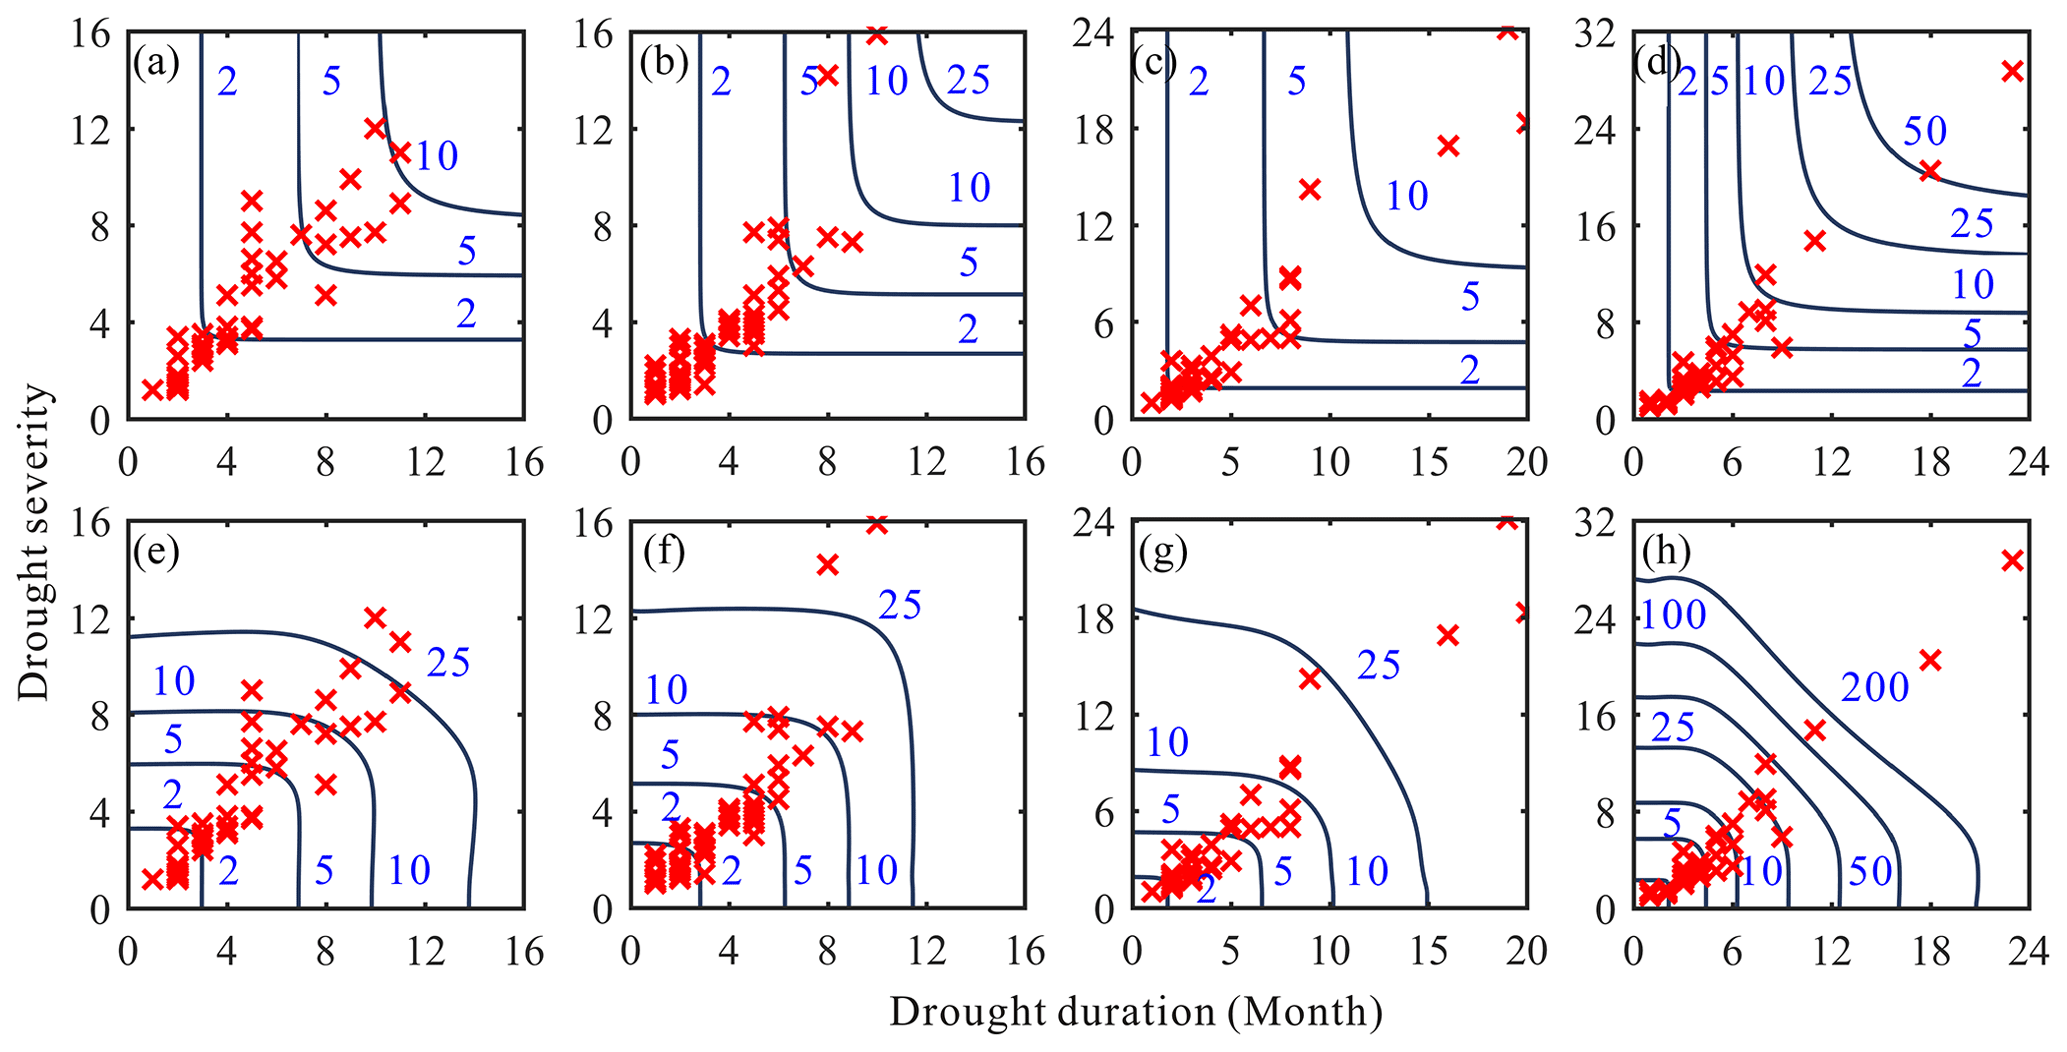
Figure 8The return periods Torand Tand of 1-month-scale drought events in BKQ (a, e), DHF (b, f), SY (c, g), and XJWP (d, h).
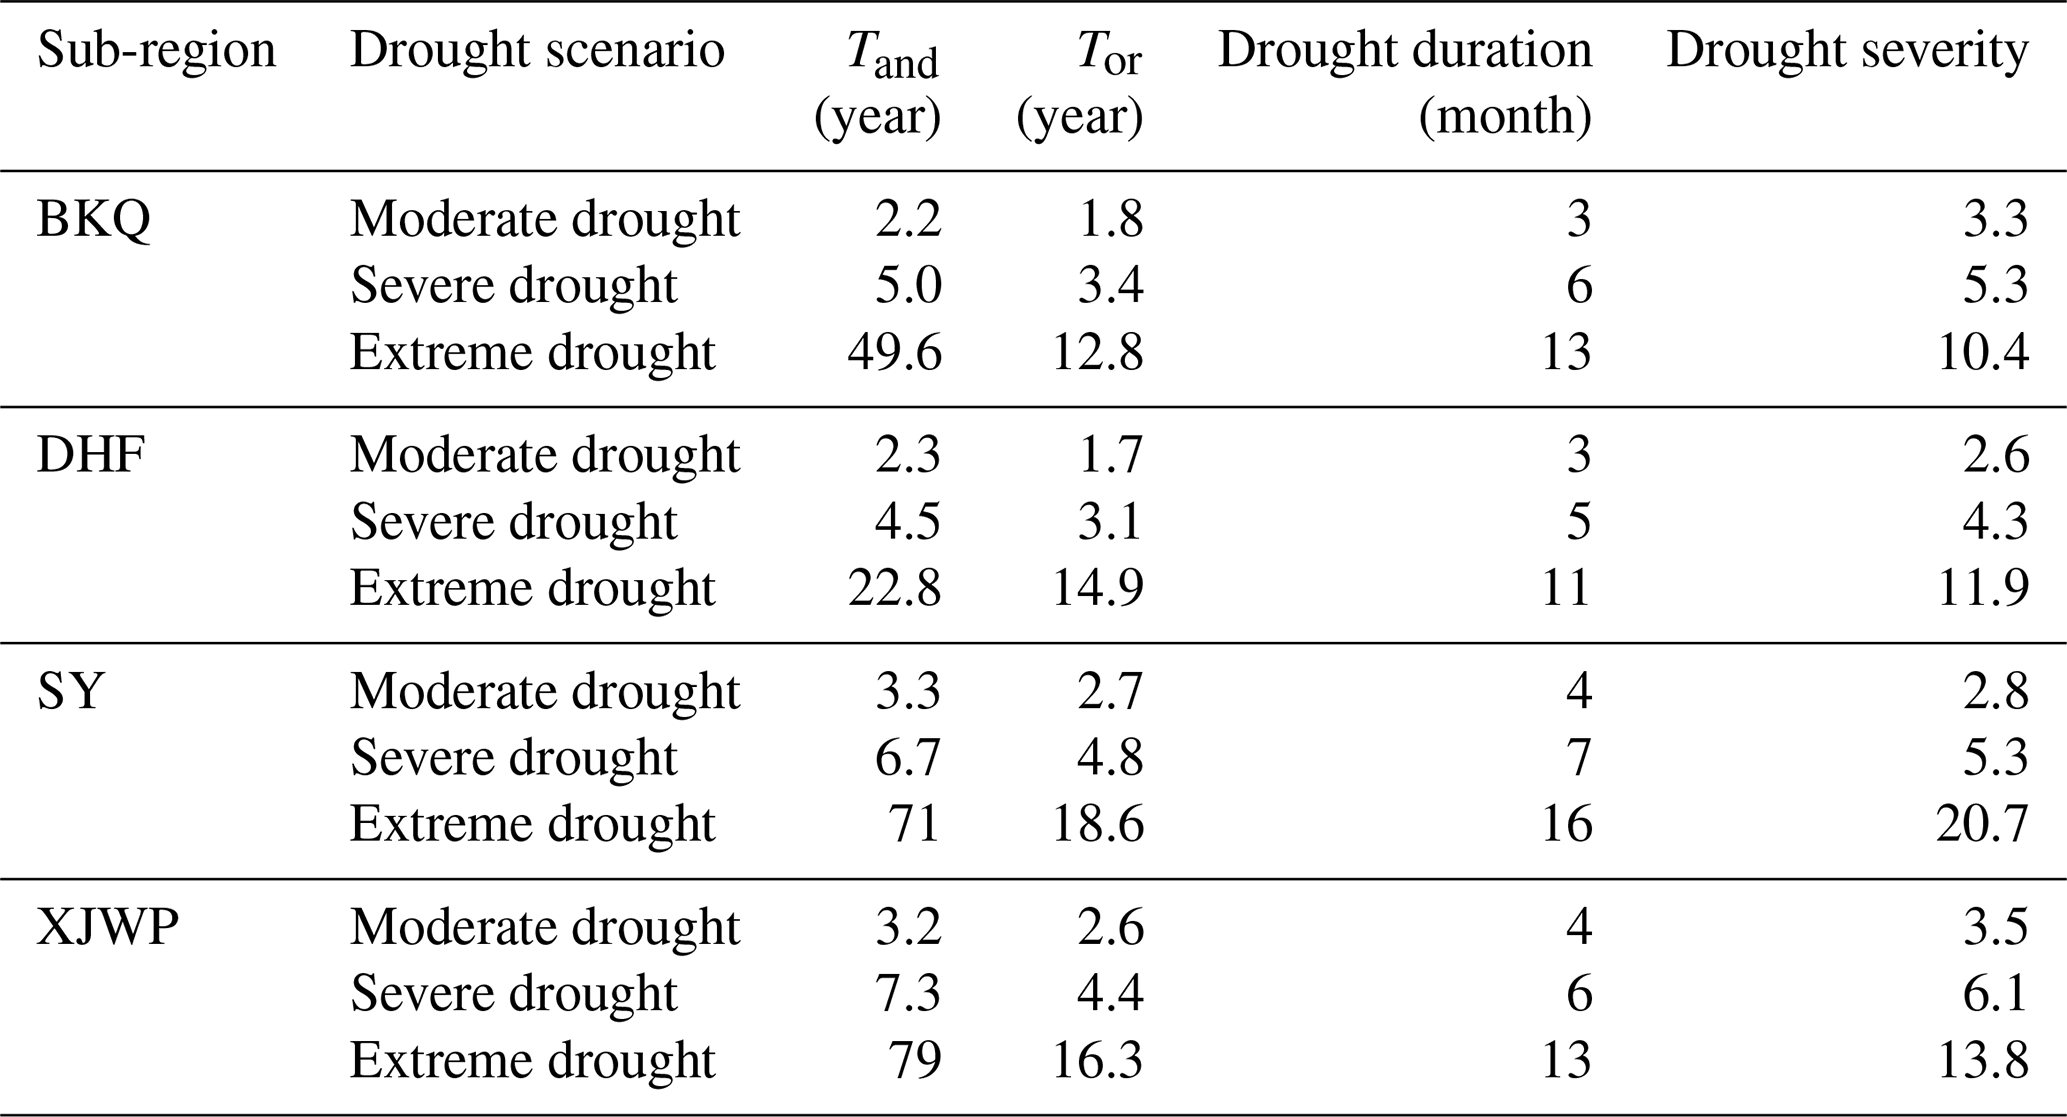
Table 5 exhibits the drought return periods Tand and Tor under different drought scenarios and their corresponding drought duration and drought severity in BKQ, DHF, SY, and XJWP. For moderate drought, the return periods Tand and Tor had similar regularity in BKQ, DHF, SY, and XJWP, with the largest value in SY, followed by XJWP, DHF, and BKQ. The distribution of Tand and Tor about severe and extreme drought was consistent in BKQ, DHF, SY, and XJWP, which showed that SY has the highest return period Tor, followed by XJWP, DHF, and BKQ, while the return period Tand in XJWP was greater than in SY, BKQ, and DHF. It should be noted that the drought presented the characteristics of a smaller return period with low drought duration and small severity downstream of the reservoir. It is foreseeable that downstream of the reservoir will be more likely to suffer from serious drought events with long duration.
Table 5The drought return periods Tand and Tor under different drought scenarios and their corresponding drought factors in the HRB.
4.3 The propagation from meteorological to hydrological drought
Based on the superiority of SPI that it can be calculated at multi-timescales, the Tp values were determined by calculating the Pearson correlation coefficient between the monthly SRI and the multi-timescale SPI. The Tp was indicated by the month with the strongest correlation. However, the correlation is high for a large variety of SPI timescales in some months, which makes the identification of Tp values highly uncertain. Therefore, in order to overcome this issue, the uncertainty of the correlation coefficients was calculated, and the Tp was expressed on the SPI timescale with strong correlation and low uncertainty. The Pearson correlation coefficient and the Tp of BKQ, DHF, SY, and XJWP are shown in Fig. 9. It can be seen from Fig. 9 that the Tp of SY and XJWP was significantly higher than that of BKQ and DHF in all months. As shown in Fig. 1, the BKQ and DHF are located in the eastern part of the HRB with mountainous terrain, while SY and XJWP are in the western plain. The slope of BKQ and DHF is greater than that of other sub-basins, indicating that the underlying surface has less water retention and buffer capacity than other regions. Meanwhile, the runoff process in the downstream of the reservoir can be redistributed on the spatial and temporal scale through the operation of the reservoir (Shiklomanov et al., 2000; Chang et al., 2019). Therefore, under the combined action of stronger water retention and buffer capacity and the redistribution of runoff processes by DHF reservoir operation, the Tp of SY and XJWP was higher than that of other regions.
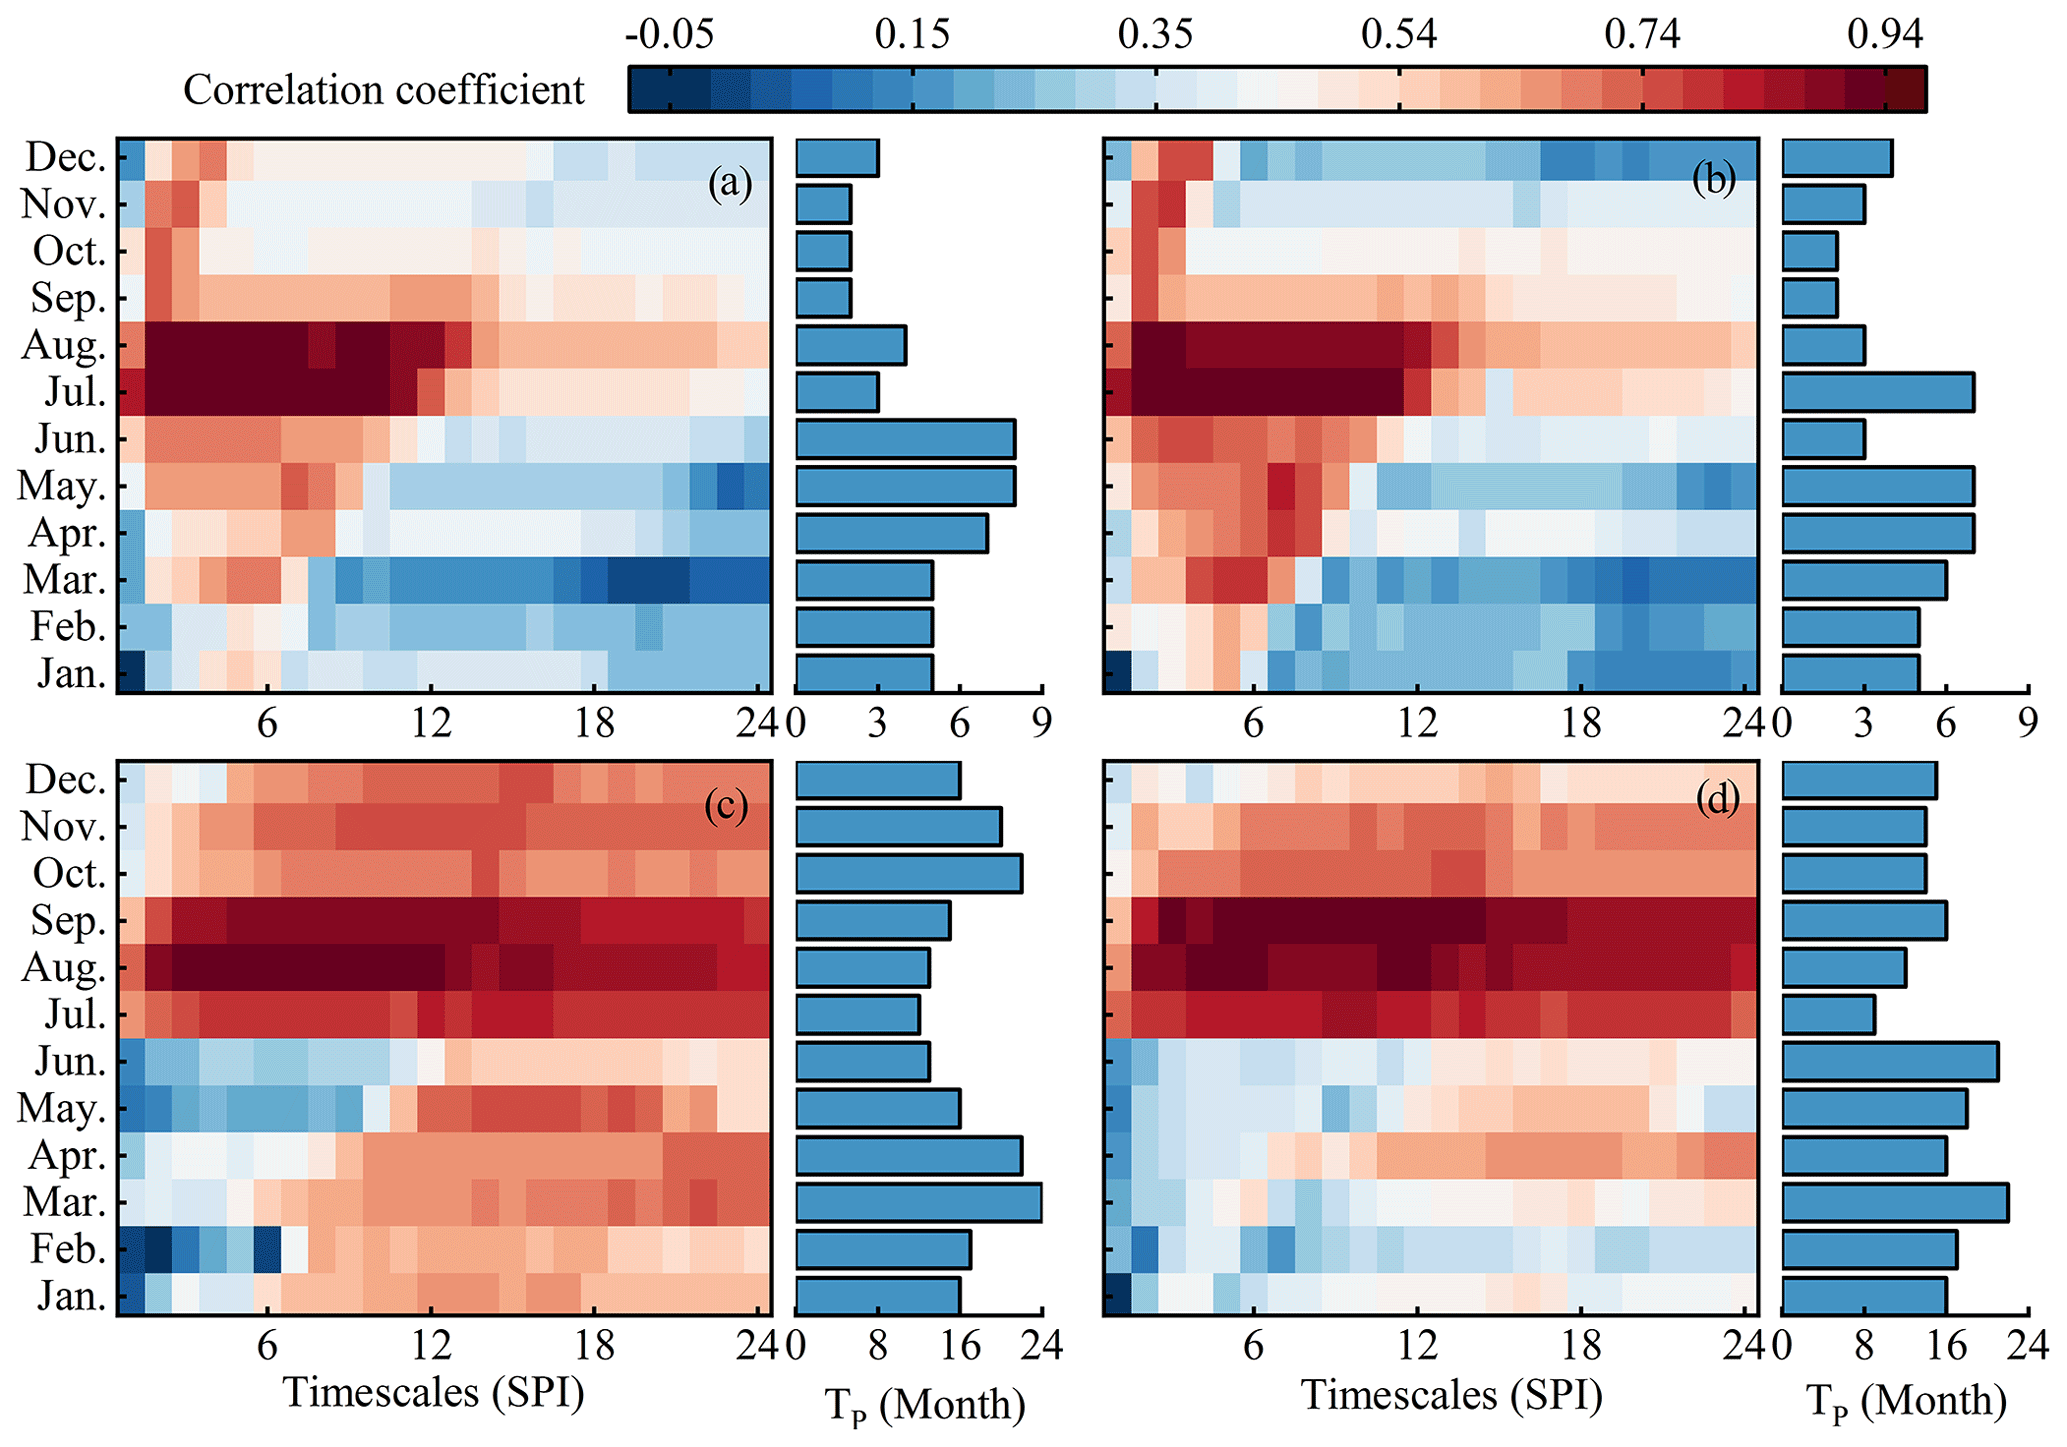
Figure 9The correlation between monthly SRI and multi-timescale SPI and the Tp in BKQ (a), DHF (b), SY (c), and XJWP (d).
In order to further reveal the changes of Tp, the Tp in different periods is calculated. Figure 10 expresses the results of the Tp including the four seasons, WS–P, S–P, and full series (F series) in the four regions in the HRB. It is clear from Fig. 10 that, from the point of view of the F series, the Tp of SY (17.2 months) and XJWP (15.8 months) was obviously higher than the DHF's (4.5 months), which indicates that the Tp in the area downstream of the DHF reservoir was significantly postponed. In order to explore the reasons for the postponement of Tp, the evolution of the meteorological factor was explored. The annual precipitation and its variation trend in the control areas of four hydrological stations during 1967–2019 are shown in Fig. 11. It was clear from Fig. 11 that there was no significant trend in annual precipitation in four sub-regions during 1967–2019, implying that the prolonged drought propagation is not due to the change of meteorological factors. Meanwhile, as Fig. 10 showed, the Tp of BKQ (4.5 months) was equal to DHF's, whilst obviously lower than that of SY and XJWP. Therefore, the construction and operation of the DHF reservoir are the main reasons for the significant extension of Tp downstream of the reservoir. Many studies have also confirmed the impact of reservoir operation on hydrological drought (Wu et al., 2016, 2018; Wang et al., 2019). Moreover, the Tp of SY was higher than XJWP's, implying that the improvement effect is weaker with the rising of the interval from hydrological stations to the DHF reservoir.
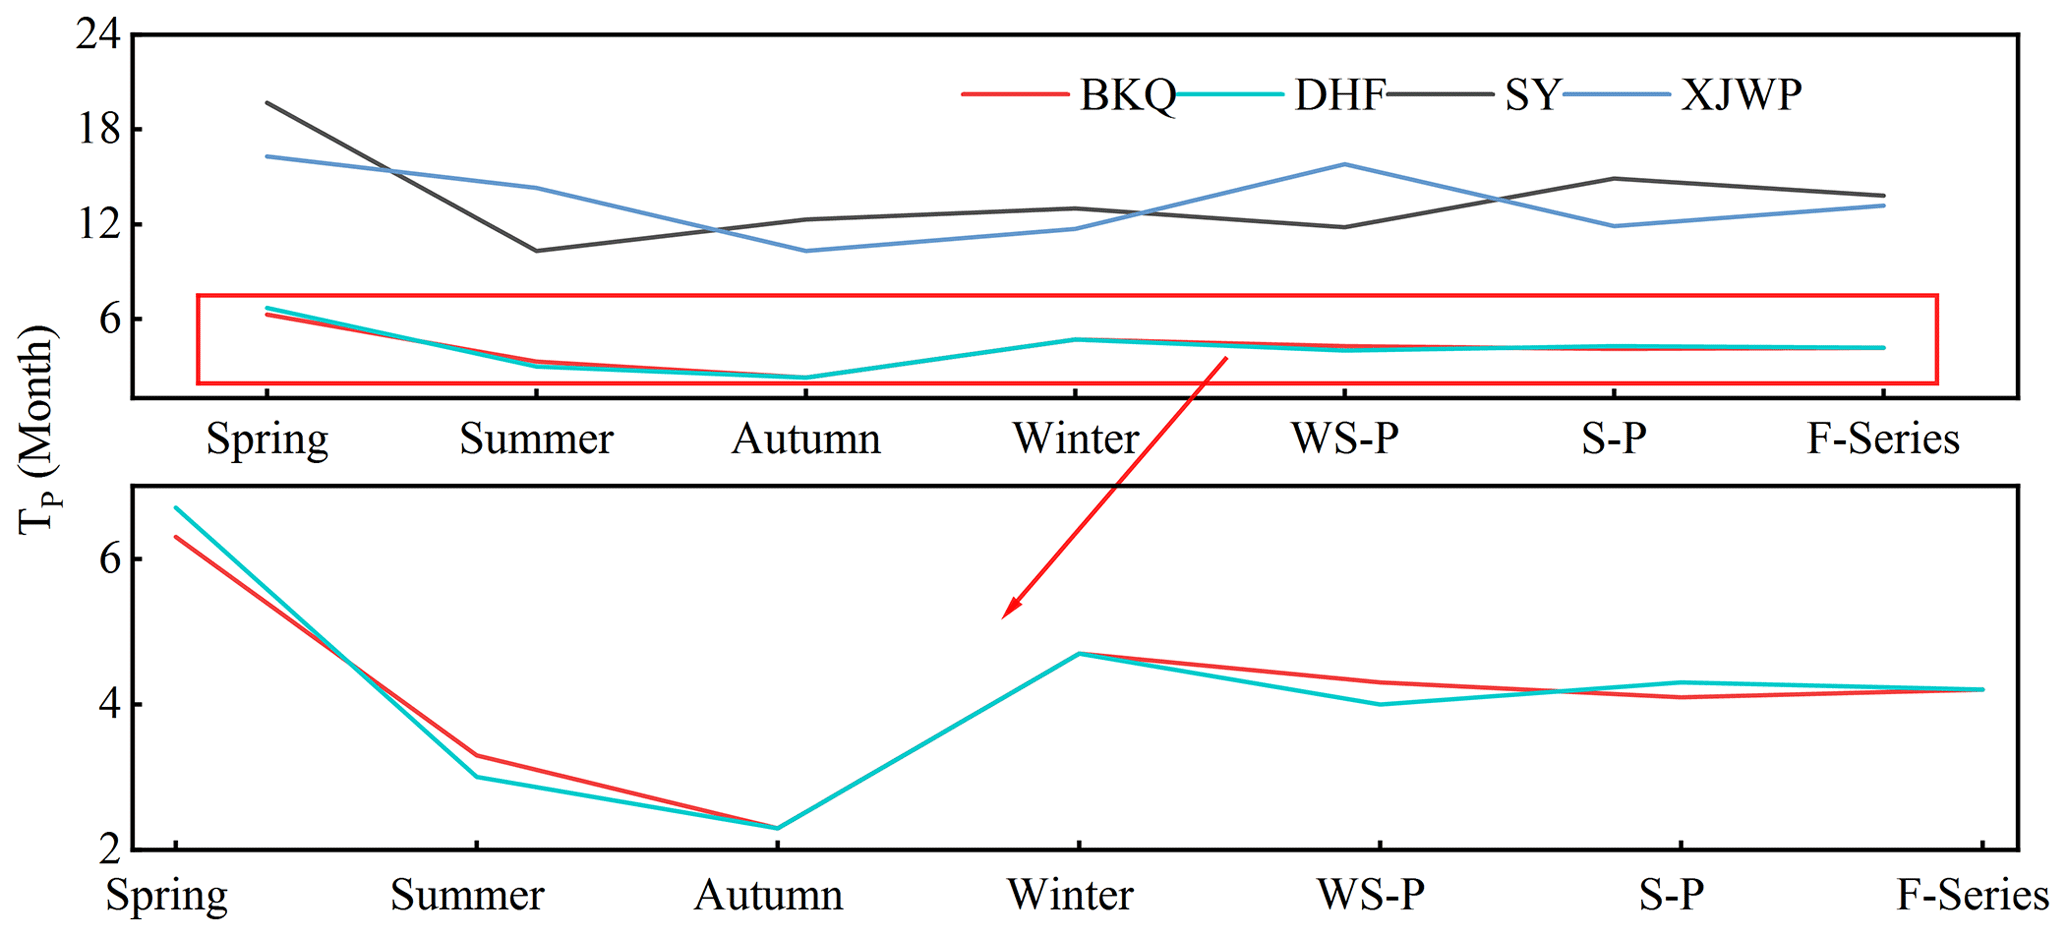
Figure 10The Tp of BKQ, DHF, SY, and XJWP from meteorological to hydrological drought in different periods.
Similar to the F series, the Tp of SY and XJWP was obviously higher than BKQ's in the four seasons, while the Tp of DHF was not significantly different from that of BKQ. Meanwhile, on the whole, the seasonal variations in Tp in DHF, SY, and XJWP were brought into line with that of BKQ, showing long Tp in spring and winter and short Tp in summer and autumn. Vegetation can consume more water through evapotranspiration during the season with higher temperatures. Higher temperatures in summer and autumn may be the reason for the relatively long Tp of spring and winter. In addition, there is a large amount of snow in winter, and most of the snow melts in the next spring in the HRB. Therefore, the longer Tp in winter and spring may be caused by the lower temperature in spring and winter and the melting of snow in spring. In addition, it is worth mentioning that the Tp of XJWP was longer than that of SY in summer compared to other seasons. This change indicated that the duration of drought propagation at XJWP in summer was prolonged, which may be due to the partial agricultural water supply from the DHF reservoir directly reaching downstream (XJWP) through channels without passing through SY in summer.
For S–P, the Tp of SY and XJWP was longer than BKQ, and with the rising of the interval between the hydrological station and the DHF reservoir, the Tp showed a decreasing trend, which showed similar characteristics with the F series. It is worth mentioning that the Tp of XJWP is longer than SY during WS–P, which was inconsistent with the conclusion that the Tp decreases with the increase in the interval between hydrological station and reservoir during S–P. The reason for this is most likely that part of the agricultural water supply from the DHF reservoir directly reaches downstream (XJWP) through channels without passing through SY, which increased runoff at XJWP while SY runoff was little affected. Moreover, agricultural water supplies mostly occur in the summer, which can be mutually verified with the results of seasonal perspective.
In conclusion, the Tp of SY and XJWP was higher than that of BKQ and DHF in different periods. The Tp downstream of the DHF reservoir has been remarkably strengthened in each period. Moreover, with the rise of the interval between the hydrological station and the DHF reservoir, the improvement effect was weakened. Meanwhile, the Tp was longer in spring and winter, while it was shorter in summer and autumn. The Tp of XJWP was longer than that of SY in WS–P because of the effect of agricultural water supply on the DHF reservoir.
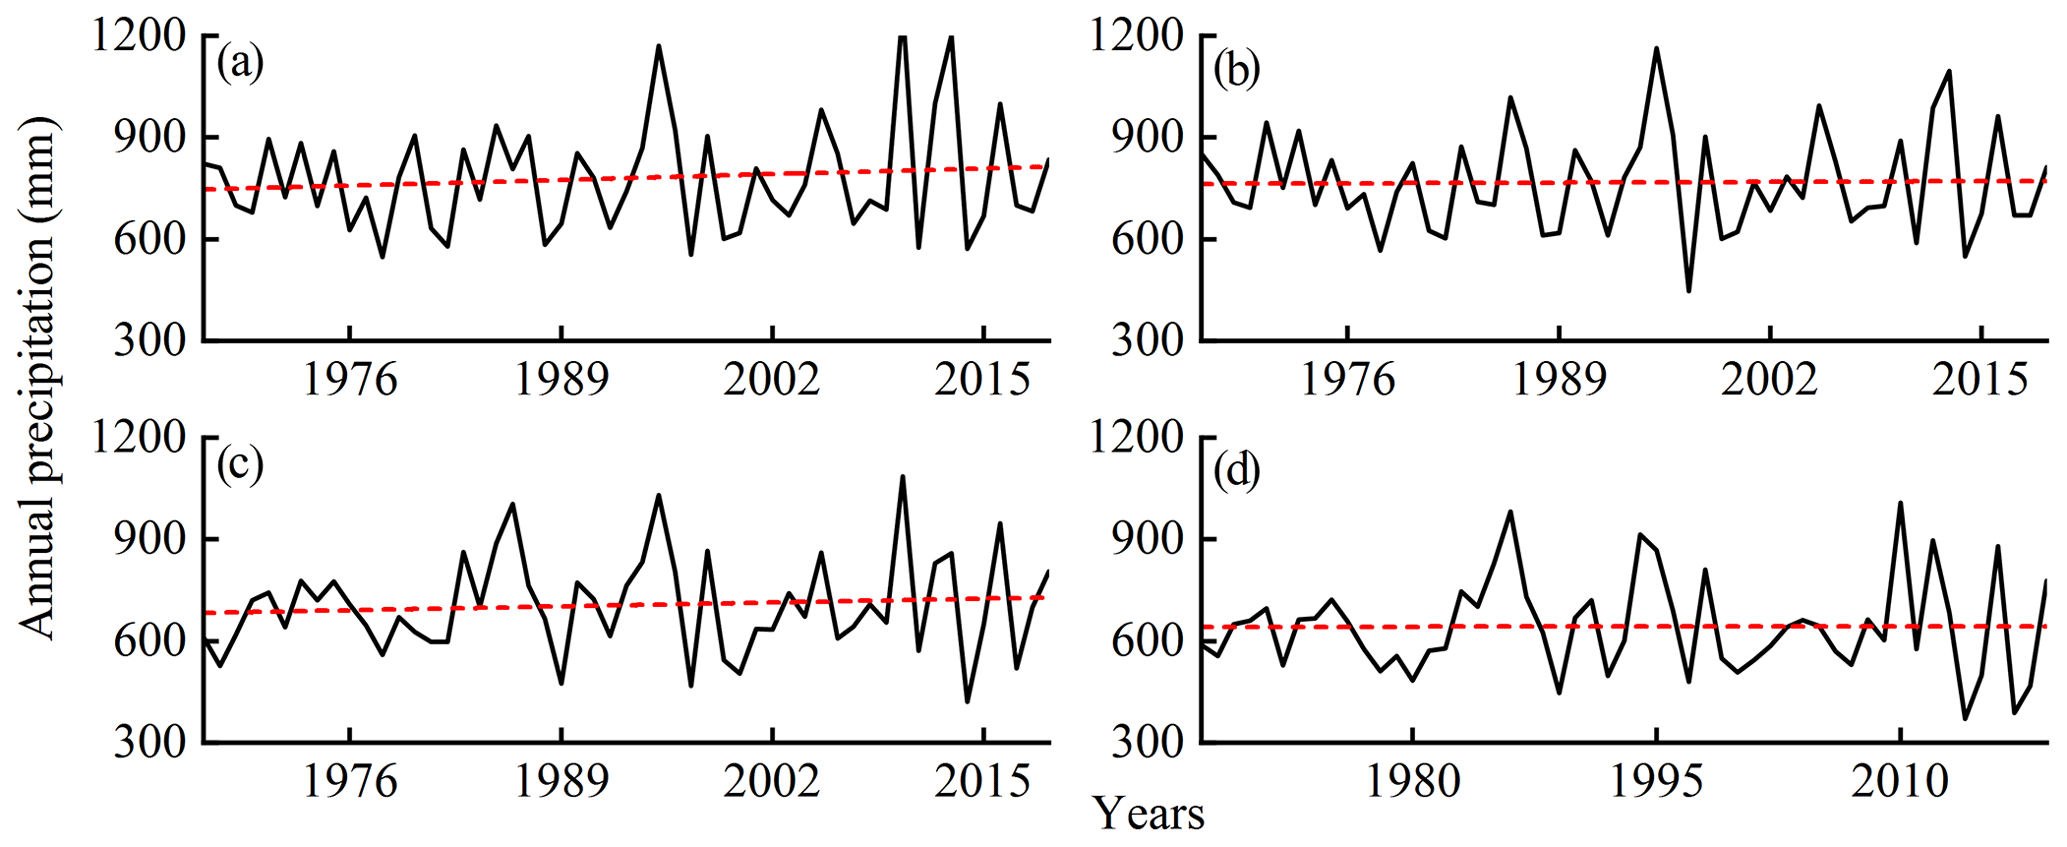
Figure 11The variation trend of annual precipitation in the four sub-regions during 1967–2019. Panels (a)–(d) show BKQ, DHF, SY, and XJWP, respectively.
4.4 The drought propagation thresholds for triggering hydrological drought
In this study, drought propagation threshold model was established to explore the CPD thresholds for triggering hydrological drought. In the model, moderate, severe, and extreme hydrological droughts defined in Sect. 4.2 were selected as specific hydrological drought scenarios. The drought duration and severity of each hydrological drought event were taken as the target, and the corresponding CPD was regarded as the condition. Five common functions including gamma, EXP, GEV, Logn, and WBL were used to fit the sequence of CPD in the four sub-basins in the HRB. The AIC, RMSE, and K–S tests were applied to select the best-fit marginal distribution, and the consequences are shown in Table 3. The commonly used bivariate theoretical copula functions, including Clayton, Frank, and Gumbel copulas, were considered for modeling the dependence structure between CPD and drought duration (D-CPD) and severity (S-CPD). Based on the K–S, C–M, RMSE, and AIC tests, the GOF copula functions were selected and shown in Table 6. Figure 12 shows the conditional probabilities of occurrence for different scenarios of hydrological droughts characterized by drought duration and severity under the condition of various CPDs in four sub-regions. It can be seen from Fig. 12 that the CPD corresponding to the same probability in the four regions increased with the enhancement of drought level. Under the same probability, the CPD of upstream regions (BKQ and DHF) of the HRB reservoir is smaller than that of midstream (SY) and downstream regions (XJWP) with the same level of drought.
Table 6GOF evaluation of different copula functions between CPD and drought duration and severity in four sub-regions.
The bold letters represent the selected optimal copula functions.
In order to quantitatively reveal the threshold triggering different scenarios of hydrological drought, the CPD threshold interval was obtained based on the drought propagation threshold model introduced in Sect. 3.5 (Table 7). It was clear from Table 7 that the CPD threshold of hydrological drought at all scenarios in the upstream region of the HRB reservoir is significantly lower than that in the downstream basins. The upstream region is located in the eastern part of the HRB with mountainous terrain, while the downstream region is in the western plain. The slope of the upstream region is greater than that downstream, indicating that the underlying surface of upstream region has less water retention and buffer capacity. Meanwhile, due to the operation of the DHF reservoir, which provides agricultural and ecological water supply to downstream in May–August, it can provide a strong supply downstream and alleviate the hydrological drought (Guo et al., 2020a). Therefore, under the combined action of the stronger stagnant water and buffer capacity of the underlying surface, and the water supply by the operation of the DHF reservoir, the CPD threshold in the downstream region of the DHF reservoir is significantly higher than that in the upstream basins.
For the DHF and BKQ, both of them are located in mountainous areas with higher slope, but the vegetation coverage rate of BKQ is relatively larger than that of DHF, which is indicated by the normalized difference vegetation index (NDVI) of the HRB (Fig. 13). Therefore, BKQ has strong water retention and buffering capacity, which leads to the CPD of BKQ relatively greater than DHF. As for the SY and XJWP, both of them are located in the plain area with little difference in slope. However, the XJWP showed lower CPD in all scenarios of hydrological drought than SY. On the one hand, large reservoirs can postpone the propagation from meteorological drought to hydrological drought, and the effect decreases with the increase in the distance from the reservoir (Guo et al., 2020a). The distance between SY and the DHF reservoir is greater than that from XJWP to the DHF reservoir. On the other hand, as the urbanization process of SY is much faster than that of XJWP, the vegetation coverage rate of SY is lower than that of XJWP, which was confirmed in Fig. 13. During extreme meteorological droughts, vegetation is in a state of water shortage and consumes more water through evapotranspiration, which would aggravate drought in the basin (Teuling et al., 2013; Niu et al., 2019). Therefore, the higher vegetation coverage in XJWP is another reason why the CPD of the XJWP for extreme drought is lower than the SY.
Figure 12Conditional probabilities of occurrence of extreme (a), severe (b), and moderate (c) hydrological drought under various CPDs in the HRB.
The mean value of CPD thresholds under different drought scenarios and the increase rate (IR) of CPD thresholds as the drought scenario intensified were calculated to investigate the difference of CPD increase rate in each sub-basin with the aggravation of hydrological drought. Table 8 shows the mean of CPD thresholds and the IR of CPD under extreme and severe drought relative to moderate drought in each sub-basin. It can be seen from Table 8 that the IR of CPD threshold in BKQ and XJWP was less than that of DHF and SY with the intensifying of drought scenario. Moreover, the IR of the CPD threshold from severe drought to extreme drought was much lower than that from moderate drought to severe drought in BKQ and XJWP. These suggest that BKQ and XJWP are more sensitive to CPD in the event of drought, and a slight increase in CPD may trigger a more severe drought. Especially in the severe drought scenario, a small increase in CPD is likely to trigger extreme drought. As shown in Fig. 1, DHF and SY are located around the DHF reservoir, while BKQ and XJWP are far away from the DHF reservoir. Therefore, the cause of this result is most likely the operation of the DHF reservoir, which needs further research to confirm.
Meanwhile, for a specific hydrological drought, the higher the CPD that triggered this hydrological drought, the stronger the drought resistance of this basin (Guo et al., 2020a). Therefore, the CPD thresholds for triggering hydrological drought can be employed to characterize the drought resistance of the basin in this study. According to the above CPD threshold analysis results of sub-basins, the drought resistance of the downstream region of the DHF reservoir is stronger than that of the upstream region under all hydrological drought scenarios. SY showed the strongest resistance for all scenarios of hydrological drought. The difference of drought resistance of each sub-basin mainly depends on the topography of the basin, the influence of reservoir operation on the watercourse hydraulic conditions, and the change of underlying surface conditions caused by urbanization.
Figure 13Normalized difference vegetation index (NDVI) of the HRB.
Table 7CPD threshold intervals for triggering different scenarios of hydrological drought in the HRB.
Table 8The mean and the IR of CPD thresholds in each sub-basin.
In this paper, SPI and SRI were adopted to characterize meteorological and hydrological drought, respectively, and the spatiotemporal variation characteristics of hydrological drought were investigated in the HRB from 1967 to 2019. Meanwhile, the joint distribution of drought duration and severity was established by using copula functions to calculate the return period of hydrological drought. Furthermore, the Tp values were determined by calculating the Pearson correlation coefficients between 1-month SRI and multi-timescale SPI. Finally, the CPD threshold intervals for triggering hydrological drought are obtained by the drought propagation threshold model. From the results, primary conclusions are given as follows.
The hydrological drought showed a gradually strengthening trend from downstream to upstream of the HRB from 1967 to 2019, and strengthened significantly in BKQ. From a seasonal perspective, drought presented a strengthening at each sub-basin in summer and autumn. Nevertheless, drought showed a significant strengthening trend in spring and winter at the SY and XJWP. From the WS–P and S–P perspective, drought presented a strengthening in S–P at each sub-basin. Furthermore, the drought showed a strengthening trend at BKQ and DHF, while it showed a weakening trend at SY and XJWP in WS–P.
-
Downstream of the HRB were vulnerable districts to hydrological drought with longer drought duration and higher severity. Furthermore, the upstream region of the HRB was more sensitive to short-duration drought, which was dominated by 2-month and 3-month drought events.
-
The return periods Tand of moderate, severe, and extreme hydrological drought in BKQ, DHF, SY, and XJWP were 2.2, 5.0, 49.6, 2.3, 4.5, 22.8, 3.3, 6.7, 71.0, 3.2, 7.3, and 79.0 years, respectively. Furthermore, the return periods Tor of moderate, severe, and extreme hydrological drought in DHF, SY, and XJWP were 1.8, 3.4, 12.8, 1.7, 3.1, 14.9, 2.7, 4.8, 18.6, 2.6, 4.4, and 16.3 years, respectively.
-
The average Tp values in BKQ, DHF, SY, and XJWP were 4.1, 4.3, 14.9, and 1.9 months, respectively, which indicated that the Tp downstream of the DHF reservoir has been significantly improved owing to the operation of DHF. Moreover, with the increase in interval between hydrological station and the DHF reservoir, the improvement effect was weakened.
-
The mean CPD thresholds of moderate hydrological drought at BKQ, DHF, SY, and XJWP were 213.4, 159.6, 289.9, and 221.6 mm; for severe they were 239.0, 201.2, 343.0, and 254.6 mm; and for extreme they were 249.8, 244.1, 409.7, and 268.5 mm, respectively. The midstream of the HRB showed the highest drought propagation threshold in moderate and severe drought scenarios, while downstream showed the highest drought propagation in extreme drought scenario. Furthermore, the difference of CPD thresholds of each sub-basin mainly depends on the topography of the basin, the evolution of river hydraulic condition by reservoir operation, and the change of underlying surface conditions caused by urbanization.
Generally, the findings of this study help to reveal the spatiotemporal evolution, return period characteristics, and meteorological triggering conditions of hydrological drought. In particular, the improved drought propagation threshold model helps to further enhance the understanding of the drought propagation process, thus contributing to the development of efficient hydrological drought early warning system, which is of great significance for local drought assessment and management. Note that the framework and methodology of drought research in this paper are universal and generalized, so it can be extended to other regions without restriction.
Some or all data, models, or code that support the findings of this study are available from the corresponding author upon reasonable request.
SY and FY conceptualized the project, developed the methodology, and wrote and prepared the original draft of the paper. XS and SY curated the data, conducted the formal analysis and investigation, and performed graphic visualization. FY and SY reviewed and edited the paper. All authors discussed the results and contributed to the final version of the paper.
The contact author has declared that neither they nor their co-authors have any competing interests.
Publisher’s note: Copernicus Publications remains neutral with regard to jurisdictional claims in published maps and institutional affiliations.
This article is part of the special issue “Recent advances in drought and water scarcity monitoring, modelling, and forecasting (EGU2019, session HS4.1.1/NH1.31)”. It is a result of the European Geosciences Union General Assembly 2019, Vienna, Austria, 7–12 April 2019.
This paper was edited by Athanasios Loukas and reviewed by seven anonymous referees.
Akaike, H.: A new look at statistical model identification, IEEE T. Automat. Contr., 19, 716–723, https://doi.org/10.1109/TAC.1974.1100705, 1974.
Barker, L. J., Hannaford, J., Chiverton, A., and Svensson, C.: From meteorological to hydrological drought using standardised indicators, Hydrol. Earth Syst. Sci., 20, 2483–2505, https://doi.org/10.5194/hess-20-2483-2016, 2016.
Beniston, M., and Stephenson, D. B.: Extreme climatic events and their evolution under changing climatic conditions, Global Planet. Change, 44, 1–9, https://doi.org/10.1016/j.gloplacha.2004.06.001, 2004.
Chang, J., Guo, A., Wang, Y., Ha, Y., Zhang, R., Xue, L., and Tu, Z.: Reservoir operations to mitigate drought effects with a hedging policy triggered by the drought prevention limiting water level, Water Resour. Res., 55, 904–922, https://doi.org/10.1029/2017WR022090, 2019.
Chen, X., Li, F. W., and Feng, P.: Spatiotemporal variation of hydrological drought based on the Optimal Standardized Streamflow Index in Luanhe River basin, China, Nat. Hazards., 91, 155–178, https://doi.org/10.1007/s11069-017-3118-6, 2018.
Christensen, O. B. and Christensen, J. H.: Intensification of extreme European summer precipitation in a warmer climate, Global Planet. Change, 44, 107–117, https://doi.org/10.1016/j.gloplacha.2004.06.013, 2004.
Dash, S. S., Sahoo, B., and Raghuwanshi, N. S.: A SWAT-Copula based approach for monitoring and assessment of drought propagation in an irrigation command, Ecol. Eng., 127, 417–430, https://doi.org/10.1016/j.ecoleng.2018.11.021, 2019.
Fang, W., Huang, S., Huang, Q., Huang, G., Wang, H., Leng, G., Wang, L., and Guo, Y.: Probabilistic assessment of remote sensing-based terrestrial vegetation vulnerability to drought stress of the Loess Plateau in China, Remote Sens. Environ., 232, 111292, https://doi.org/10.1016/j.rse.2019.111290, 2019.
Fu, G. B., Chen, S. L., Liu, C. M., and Shepard, D.: Hydro-climatic trends of the Yellow River Basin for the last 50 years, Climatic Change, 65, 149–178, https://doi.org/10.1023/B:CLIM.0000037491.95395.bb, 2004.
Genest, C., Kojadinovic, I., Nešlehová, J., and Yan, j.: A goodness-of-fit test for bivariate extreme-value copulas, Bernoulli, 17, 253–275, https://doi.org/10.3150/10-BEJ279, 2011.
Gevaert, A. I., Veldkamp, T. I. E., and Ward, P. J.: The effect of climate type on timescales of drought propagation in an ensemble of global hydrological models, Hydrol. Earth Syst. Sci., 22, 4649–4665, https://doi.org/10.5194/hess-22-4649-2018, 2018.
Guo, Y., Huang, S. Z., Huang, Q., Wang, H., Fang, W., Yang, Y. Y., and Wang, L.: Assessing socioeconomic drought based on an improved multivariate standardized reliability and resilience index, J. Hydrol., 568, 904–918, https://doi.org/10.1016/j.jhydrol.2018.11.055, 2019.
Guo, Y., Huang, Q., Huang, S. Z., Leng, G. Y., Zheng, X. D., Fang, W., Deng, M. J., and Song, S. B.: Elucidating the effects of mega reservoir on watershed drought tolerance based on a drought propagation analytical method, J. Hydrol., 598, 125738, https://doi.org/10.1016/j.jhydrol.2020.125738, 2020a.
Guo, Y., Huang, S. Z., Huang, Q., Leng, G. Y., Fang, W., Wang, L., and Wang, H.: Propagation thresholds of meteorological drought for triggering hydrological drought at various levels, Sci. Total Environ., 712, 136502, https://doi.org/10.1016/j.scitotenv.2020.136502, 2020b.
Hamed, K. H. and Rao, A. R.: A modified Mann-Kendall trend test for autocorrelated data, J. Hydrol., 204, 182–196, https://doi.org/10.1016/S0022-1694(97)00125-X, 1998.
Hand, D.: Good practice in retail credit scorecard assessment, J. Oper. Res. Soc., 56, 1109–1117, https://doi.org/10.1057/palgrave.jors.2601932, 2005.
Hao, Z. and Singh, V.P.: Drought characterization from a multivariate perspective: A review, J. Hydrol., 527, 668–678, https://doi.org/10.1016/j.jhydrol.2015.05.031, 2015.
Huang, S., Li, P., Huang, Q., Leng, G., Hou, B., and Ma, L.: The propagation from meteorological to hydrological drought and its potential influence factors, J. Hydrol., 547, 184–195, https://doi.org/10.1016/j.jhydrol.2017.01.041, 2017.
Huang, S. Z., Chang, J. X., Leng, G. Y., and Huang, Q.: Integrated index for drought assessment based on variable fuzzy set theory: a case study in the Yellow River basin, China, J. Hydrol., 527, 608–618, https://doi.org/10.1016/j.jhydrol.2015.05.032, 2015.
Huang, W. C. and Chou, C. C.: Risk-based drought early warning system in reservoir operation, Adv. Water Resour., 31, 649–660, https://doi.org/10.1016/j.advwatres.2007.12.004, 2008.
Joetzjer, E., Douville, H., Delire, C., Ciais, P., Decharme, B., and Tyteca, S.: Hydrologic benchmarking of meteorological drought indices at interannual to climate change timescales: a case study over the Amazon and Mississippi river basins, Hydrol. Earth Syst. Sci., 17, 4885–4895, https://doi.org/10.5194/hess-17-4885-2013, 2013.
Kao, S. C. and Govindaraju, R. S.: A copula-based joint deficit index for droughts, J. Hydrol., 380, 121–134, https://doi.org/10.1016/j.jhydrol.2009.10.029, 2009.
Kendall, M. G.: Rank Correlation Methods (Charles Griffin Book Series) 5th ed., Oxford University Press, 1990.
Kim, S., Kim, B., Ahn, T. J., and Kim, H. S.: Spatio-temporal characterization of Korean drought using severity-area-duration curve analysis, Water Environ. J., 25, 22–30, https://doi.org/10.1111/j.1747-6593.2009.00184.x, 2011.
Kunkel, K. E.: North American trends in extreme precipitation, Nat. Hazards., 29, 291–305, https://doi.org/10.1023/A:1023694115864, 2003.
Kwon, H. H. and Lall, U.: A copula-based nonstationary frequency analysis for the 2012–2015 drought in California, Water Resour. Res., 52, 5662–5675, https://doi.org/10.1002/2016WR018959, 2016.
Lee, T., Modarres, R., and Ouarda, T. B. M. J.: Data-based analysis of bivariate copula tail dependence for drought duration and severity, Hydrol. Process., 27, 1454–1463, https://doi.org/10.1002/hyp.9233, 2013.
Leng, G. Y., Tang, Q. H., and Rayburg, S.: Climate change impacts on meteorological, agricultural and hydrological droughts in China, Global Planet. Change, 126, 23–34, https://doi.org/10.1016/j.gloplacha.2015.01.003, 2015.
Lindenschmidt, K. E. and Rokaya, P.: A stochastic hydraulic modelling approach to determining the probable maximum staging of Ice-Jam floods, J. Environ. Inform., 34, 45–54, https://doi.org/10.3808/jei.201900416, 2019.
Liu, Z. P., Wang, Y. Q., Shao, M. G., Jia, X. X., and Li, X. L.: Spatiotemporal analysis of multiscalar drought characteristics across the Loess Plateau of China, J. Hydrol., 534, 281–299, https://doi.org/10.1016/j.jhydrol.2016.01.003, 2016.
Liu, Z. Y., Menzel, L., Dong, C. Y., and Fang, R. H.: Temporal dynamics and spatial patterns of drought and the relation to ENSO: A case study in Northwest China, Int. J. Climatol., 36, 2886–2898, https://doi.org/10.1002/joc.4526, 2016.
Longobardi, A., Boulariah, O., and Villani, P.: Assessment of centennial (1918–2019) drought features in the Campania region by historical in situ measurements (southern Italy), Nat. Hazards Earth Syst. Sci., 21, 2181–2196, https://doi.org/10.5194/nhess-21-2181-2021, 2021.
Lorenzo-Lacruz, J., Vicente-Serrano, S. M., González-Hidalgo, J. C., López-Moreno, J. I., and Cortesi, N.: Hydrological drought response to meteorological drought in the Iberian Peninsula, Clim. Res., 58, 117–131, https://doi.org/10.3354/cr01177, 2013.
Mann, H. B.: Nonparametric tests against trend, Econometrica, 13, 245–259, https://doi.org/10.2307/1907187, 1945.
McKee, T. B., Doesken, N. J., and Kleist, J.: The relationship of drought frequency and duration to time scales, in: Eight Conf. On Applied Climatology, Anaheim, CA, Amer. Meteor. Soc., 179–184, 1993.
Mirabbasi, R., Fakheri-Fard, A., and Dinpashoh, Y.: Bivariate drought frequency analysis using the copula method, Theor. Appl. Climatol., 108, 191–206, https://doi.org/10.1007/s00704-011-0524-7, 2012.
Mishra, A. K. and Singh, V. P.: A review of drought concepts, J. Hydrol., 391, 202–216, https://doi.org/10.1016/j.jhydrol.2010.07.012, 2010.
Mishra, A. K. and Singh, V. P.: Drought modelling-a review, J. Hydrol., 403, 157–175, https://doi.org/10.1016/j.jhydrol.2011.03.049, 2011.
Niu, Z., He, H., Zhu, G., Ren, X., Zhang, L., Zhang, K., Yu, G., Ge, R., Li, P., Zeng, N., and Zhu, X.: An increasing trend in the ratio of transpiration to total terrestrial evapotranspiration in China from 1982 to 2015 caused by greening and warming, Agr. Forest Meteorol., 279, 107701, https://doi.org/10.1016/j.agrformet.2019.107701, 2019.
Oladipo, E. O.: A comparative performance analysis of three meteorological drought indices, J. Climate, 5, 655–664, https://doi.org/10.1002/joc.3370050607, 1985.
Palmer, T. N. and Räisänen, J.: Quantifying the risk of extreme seasonal precipitation events in a changing climate, Nature, 415, 512–514, https://doi.org/10.1038/415512a, 2002.
Pandey, R. P. and Ramasastri, K. S.: Relationship between the common climatic parameters and average drought frequency, Hydrol. Process., 15, 1019–1032, https://doi.org/10.1002/hyp.187, 2001.
Rad, A. M., Ghahraman, B., Khalili, D., Ghahremani, Z., and Ardakani, S. A.: Integrated meteorological and hydrological drought model: A management tool for proactive water resources planning of semi-arid regions, Adv. Water Resour., 107, 336–353, https://doi.org/10.1016/j.advwatres.2017.07.007, 2017.
Ren, K., Huang, S. Z., Huang, Q., Wang, H., Leng, G. Y., Fang, W., and Lia, P.: Assessing the reliability, resilience, and vulnerability of water supply system under multiple uncertain sources, J. Clean. Prod., 252, 119806, https://doi.org/10.1016/j.jclepro.2019.119806, 2020.
Rivera, J. A., Penalba, O. C., Villalba, R., and Araneo, D. C.: Spatio-temporal patterns of the 2010–2015 extreme hydrological drought across the Central Andes, Argentina, Water, 9, 652, https://doi.org/10.3390/w9090652, 2017.
Salvadori, G. and De Michele, C.: Multivariate real-time assessment of droughts via copula-based multi-site hazard trajectories and fans, J. Hydrol., 526, 101–115, https://doi.org/10.1016/j.jhydrol.2014.11.056, 2015.
Sattar, M. N., Lee, J. Y., Shin, J. Y., and Kim, T. W.: Probabilistic characteristics of drought propagation from meteorological to hydrological drought in South Korea, Water Resour. Manag., 33, 2439–2452, https://doi.org/10.1007/s11269-019-02278-9, 2019.
Shiau, J. T.: Fitting drought duration and severity with two-dimensional copulas, Water Resour. Manag., 20, 795–815, https://doi.org/10.1007/s11269-005-9008-9, 2006.
Shiklomanov, I. A., Shiklomanov, A. I., Lammers, R. B., Peterson, B. J., and Vorosmarty, C. J.: The Dynamics of River Water Inflow to the Arctic Ocean, in: Lewis, E. L., Jones, E. P., Lemke, P., Prowse, T. D., and Wadhams, P., The Freshwater Budget of the Arctic Ocean, NATO Science Series (Series 2. Environment Security), 70, Springer, Dordrecht, https://doi.org/10.1007/978-94-011-4132-1_13, 2000.
Shukla, S. and Wood, A. W.: Use of a standardized runoff index for characterizing hydrologic drought, Geophys. Res. Lett., 35, 41–46, https://doi.org/10.1029/2007GL032487, 2008.
Sun, S. L., Li, Q., Li, J., and Wang, G.: Revisiting the evolution of the 2009-2011 meteorological drought over Southwest China, J. Hydrol., 568, 385–402, https://doi.org/10.1016/j.jhydrol.2018.10.071, 2019.
Teuling, A. J., Van Loon, A. F., Seneviratne, S. I., Lehner, I., Aubinet, M., Heinesch, B., Bernhofer, C., Grünwald, T., Prasse, H., and Spank, U.: Evapotranspiration amplifies European summer drought, Geophys. Res. Lett., 40, 2071–2075, https://doi.org/10.1002/grl.50495, 2013.
Van Lanen, H. A. J., Wanders, N., Tallaksen, L. M., and Van Loon, A. F.: Hydrological drought across the world: impact of climate and physical catchment structure, Hydrol. Earth Syst. Sci., 17, 1715–1732, https://doi.org/10.5194/hess-17-1715-2013, 2013.
Van Loon, A. F., Van Huijgevoort, M. H. J., and Van Lanen, H. A. J.: Evaluation of drought propagation in an ensemble mean of large-scale hydrological models, Hydrol. Earth Syst. Sci., 16, 4057–4078, https://doi.org/10.5194/hess-16-4057-2012, 2012.
Vicente-Serrano, S. M. and López-Moreno, J. I.: Hydrological response to different time scales of climatological drought: an evaluation of the Standardized Precipitation Index in a mountainous Mediterranean basin, Hydrol. Earth Syst. Sci., 9, 523–533, https://doi.org/10.5194/hess-9-523-2005, 2005.
Vicente-Serrano, S. M., López-Moreno, J. I., Beguería, S., Lorenzo-Lacruz, J., AzorinMolina, C., and Morán-Tejeda, E.: Accurate computation of a streamflow drought index, J. Hydrol. Eng., 17, 318–332, https://doi.org/10.1061/(ASCE)HE.1943-5584.0000433, 2012.
Vyver, H. V. D. and Bergh, J. V. D.: The Gaussian copula model for the joint deficit index for droughts, J. Hydrol., 561, 987–999, https://doi.org/10.1016/j.jhydrol.2018.03.064, 2018.
Wang, F., Wang, Z. M., Yang, H. B., Di, D. Y., Zhao, Y., Liang, Q. H., and Hussain, Z.: Comprehensive evaluation of hydrological drought and its relationships with meteorological drought in the Yellow River basin, China, J. Hydrol., 584, 124751, https://doi.org/10.1016/j.jhydrol.2020.124751, 2020.
Wang, Y. M., Yang, J., Chang, J. X., and Zhang, R.: Assessing the drought mitigation ability of the reservoir in the downstream of the Yellow River, Sci. Total Environ., 646, 1327–1335, https://doi.org/10.1016/j.scitotenv.2018.07.316, 2019.
Wilhite, D. A. and Glantz, M. H.: Understanding: the drought phenomenon: the role of definitions, Water Int., 10, 111–120, https://doi.org/10.1080/02508068508686328, 2009.
Wu, J. F., Chen, X. W., Gao, L., Yao, H. X., Chen, Y., Liu, M. B., and Shukla, S.: Response of hydrological drought to meteorological drought under the influence of large reservoir, Adv. Meteorol., 2016, 1–11, https://doi.org/10.1155/2016/2197142, 2016.
Wu, J. F., Chen, X. W., Yao, H. X., Gao, L., Chen, Y., and Liu, M. B.: Non-linear relationship of hydrological drought responding to meteorological drought and impact of a large reservoir, J. Hydrol., 551, 495–507, https://doi.org/10.1016/j.jhydrol.2017.06.029, 2017.
Wu, J. F., Liu, Z. Y., Yao, H. X., Chen, X. H, Chen, X. W, Zheng, Y. H., and He, Y. H.: Impacts of reservoir operations on multi-scale correlations between hydrological drought and meteorological drought, J. Hydrol., 563, 726–736, https://doi.org/10.1016/j.jhydrol.2018.06.053, 2018.
Xu, Y., Zhang, X., Wang, X., Hao, Z. C., Singh, V. P., and Hao, F. H.: Propagation from meteorological drought to hydrological drought under the impact of human activities: a case study in northern China, J. Hydrol., 579, 124147, https://doi.org/10.1016/j.jhydrol.2019.124147, 2019.
Yang, X., Li, Y. P., Liu, Y. R., and Gao, P. P.: A MCMC-based maximum entropy copula method for bivariate drought risk analysis of the Amu Darya River Basin, J. Hydrol., 590, 125502, https://doi.org/10.1016/j.jhydrol.2020.125502, 2020.
Yevjevich, V.: An objective approach to definitions and investigations of continental hydrologic droughts: Vujica Yevjevich: Fort Collins, Colorado State University, 1967, Hydrology paper no. 23, 19 pp., https://doi.org/10.1016/0022-1694(69)90110-3, 1967.
Zhao, P. P., Lu, H. S., Fu, G. B., Zhu, Y. H., Su, J. B., and Wang, J. Q.: Uncertainty of hydrological drought characteristics with copula functions and probability distributions: a case study of Weihe River, China, Water, 9, 334, https://doi.org/10.3390/w9050334, 2017.
The requested paper has a corresponding corrigendum published. Please read the corrigendum first before downloading the article.
- Article
(7870 KB) - Full-text XML