the Creative Commons Attribution 4.0 License.
the Creative Commons Attribution 4.0 License.
 | 16 Feb 2022
Flash flood warnings in context: combining local knowledge and large-scale hydro-meteorological patterns
Agathe Bucherie
Micha Werner
Marc van den Homberg
Simon Tembo
The small spatial and temporal scales at which flash floods occur make predicting events challenging, particularly in data-poor environments where high-resolution weather models may not be available. Additionally, the uptake of warnings may be hampered by difficulties in translating the scientific information to the local context and experiences. Here we use social science methods to characterise local knowledge of flash flooding among vulnerable communities along the flat Lake Malawi shoreline in the district of Karonga, northern Malawi. This is then used to guide a scientific analysis of the factors that contribute to flash floods in the area using contemporary global datasets, including geomorphology, soil and land-use characteristics, and hydro-meteorological conditions. Our results show that communities interviewed have detailed knowledge of the impacts and drivers of flash floods (deforestation and sedimentation), early warning signs (changes in clouds, wind direction, and rainfall patterns), and distinct hydro-meteorological processes that lead to flash flood events at the beginning and end of the wet season. Our analysis shows that the scientific data corroborate this knowledge and that combining local and scientific knowledge provides improved understanding of flash flood processes within the local context. We highlight the potential of linking large-scale global datasets with local knowledge to improve the usability of flash flood warnings.
- Article
(13185 KB) - Full-text XML
-
Supplement
(6424 KB) - BibTeX
- EndNote


Weather-related hazards are responsible for 78 % of the economic losses and 38 % of the fatalities related to disasters worldwide, with a drastic increase in the number of events in the last 35 years attributed to global climate change. Hydrological events show the highest increase globally with a rise of a factor of 4, while meteorological catastrophes have increased by a factor of 3 (Hoeppe, 2015). Although these events affect the entire globe, exposure to hydrological events and vulnerability of those affected are not uniformly distributed, and climate risk disproportionately affects the world's poorest (Byers et al., 2018). For example, the impact floods have is greater in developing countries. Indeed, 95 % of people are affected by floods, and 73 % of the total direct damages every year occur in Asia and Africa (Alfieri et al., 2017). Aiming at reducing the global impacts of natural hazards, the Sendai Framework for Disaster Risk Reduction (UNISDR, 2015) calls for the increased adoption of multi-hazard early warning systems.
A recent survey of the development of operational forecasting systems for floods (Perera et al., 2020) shows that in many countries and river basins good progress has been made, though such progress is often limited in least developed countries, hampered by a lack of monitoring networks as well as human and technical capacities. These also often focus on large spatial- and temporal-scale riverine floods, which have attracted the most attention of the flood forecasting, warning, and response research community (Alfieri et al., 2018; Kauffeldt et al., 2015; Sai et al., 2018). Flash floods, in contrast, occur at smaller spatial and temporal scales, resulting in severe damage to infrastructure and the environment, and are more deadly than riverine floods (Jonkman, 2005). Flash flood events are characterised by very rapid runoff generation and the sudden rise of water levels out of the riverbanks. They can be caused by a combination of high local precipitation rates (Doswell and Brooks, 1996), adverse antecedent hydrological conditions (The University Corporation for Atmospheric Research and SENAMI-Cusco, 2010), and the geomorphological disposition of the catchment to flash flooding (Georgakakos, 1986).
Flash flood warning is challenging due to the response times of the catchments that flash floods occur in. These are often shorter than the time needed for decision making, thus preventing efficient flash flood warning responses (Drobot and Parker, 2007). Additionally, the development of effective warnings for flash floods is hampered by the spatial and temporal incoherence between the understanding of the atmospheric and geomorphological processes that leads to flash floods and observation data availability, even in countries with well-developed hydro-meteorological networks (Creutin and Borga, 2003). Recent decades have, however, seen significant progress in developing warning systems in flash-flood-prone catchments (Hapuarachchi et al., 2011; Braud et al., 2018), though these rely extensively on the availability of high-resolution quantitative precipitation estimates and forecasts, in particular helped by the availability of radar-based precipitation estimates and nowcasts (Creutin and Borga, 2003; Werner and Cranston, 2009; Javelle et al., 2010). Such weather radars are practically non-existent in developing countries. Medium- to high-resolution numerical weather prediction (NWP) models may, however, be available and are applied in selected cases, such as in the Southern Africa Region Flash Flood Guidance system (Poolman et al., 2014). Flash flood guidance relies on geomorphological indicators (Azmeri et al., 2016; Smith, 2003) of the susceptibility of a catchment to flash floods and triggers. Several approaches to establish triggers have been developed across the globe, based on forecasting river discharge (Drobot and Parker, 2007) or rainfall thresholds (Alfieri et al., 2015; Georgakakos, 2005). These also rely on the availability of hydrological observation data for calibration and validation of triggers and have reached a high level of complexity. Availability of these data is not equally distributed around the world, compounding the difficulty of making flash flood predictions in data-poor countries, which are often also developing countries. Global- and continental-scale flood forecasting systems are increasingly being developed with the availability of global meteorological forecast and reanalysis datasets as well as satellite-based precipitation data (Emerton et al., 2016), and these provide an opportunity to fill the gap where national and regional forecasting systems are not available. However, although these offer the advantage of providing consistent datasets to areas otherwise poorly served, the limited resolution of global- and continental-scale NWP datasets means they are inadequate to support flash flood forecasts (Emerton et al., 2016) and may be limited only to the forecasting of larger-scale weather patterns.
Despite these technical challenges, increasing the ability to anticipate the occurrence and impacts of flash floods stands to benefit communities at risk and organisations involved in disaster relief, potentially leading to faster response and better allocation for the emergency flood relief effort. However, to be effective, the early warning needs to have not only a technical basis but also a human-centred approach, commensurate with the knowledge of the people at risk (Basher, 2006). Local communities have shown to have a complex knowledge cutting across the full disaster risk management cycle (Šakić Trogrlić et al., 2019) and the climatic conditions that lead to extreme (flood) events (Lefale, 2010; Orlove et al., 2010). Integration of both local and scientific knowledge is recommended in all steps of early warning system design (Martin and Rice, 2012) and can contribute to closing the “usability” gap (Vincent et al., 2020). Plotz et al. (2017) suggest two approaches to the integration of local knowledge and the knowledge derived from contemporary forecasts systems, either through validating local knowledge based on scientific datasets or through combining the local and scientific data into a consensus forecast that considers both knowledge. The evolving people-centred paradigm to early warning also recognises that community engagement, the integration of local perceptions and information tailored to those at risk, is important to the fostering of trust in warning information, thus increasing the potential of its uptake (WMO, 2015, 2018). Impact-based forecasting follows this paradigm, recognising that early action by those at risk is more likely to be taken where warning messages recognise people's local understanding of the hazard, environmental and social cues (Calvel et al., 2020), and potential impact (Luther et al., 2017; Meléndez-Landaverde et al., 2020).
In this paper we explore local knowledge and science-based information on the occurrence of flash floods in rural communities in Karonga District in northern Malawi. We hypothesise that local knowledge can complement the information contained in larger-scale global datasets and that the combination of local and scientific knowledge can contribute to the development of meaningful and trustworthy early warning, within the context of the people-centred early warning framework (WMO, 2015, 2018). This framework recognises that effective early warning builds on four key interrelated elements: (i) risk knowledge, (ii) monitoring and warning, (iii) dissemination and communication, and (iv) response capacity. Northern Malawi is an example of an area with high flash flood risk where the population is extremely vulnerable due to low coping capacities. Through interviews with impacted communities, we develop a shared knowledge of risk through a joint understanding of the root causes of flash floods in the area, the impacts these have, and where these are more likely to occur. In the interviews we also consider the local knowledge of meteorological and hydrological signs communities recognise as precursors to flash flood events. We then interrogate available information on catchment geomorphology and hydro-meteorological conditions derived from large-scale global models and satellite datasets to examine if these provide useful information congruent to that local knowledge. Our aim is to reconcile these scientific data with local knowledge of flash floods to inform the implementation of people-centred flash flood warnings and foster the taking of early action by communities.
Malawi is a sub-Saharan landlocked country in south-eastern Africa, sharing its borders with Zambia, Mozambique, and Tanzania. It has an elongated orientation, following Lake Malawi, with its physiography dominated by the rift valley geology. The subtropical climate and highly seasonal precipitation variability result in Malawi being prone to weather-related disasters (McSweeney et al., 2010). Two main seasons exist: a wet austral summer season (November–April) and a dry season (May–October). Perhaps more importantly than its disposition to weather-related hazards, the most severe impacts from disasters result from the high vulnerability of the population, estimated at around 16.5 million, with a poverty index of 57.9 %. Karonga is the northernmost district of Malawi, sharing a border with Tanzania. It is located along the Lake Malawi shore and has a surface of 3355 km2 and an estimated population of 380 000 in 2020. The district is characterised by a steep rift escarpment separating the hills and plateau area from the lake-shore plain (see Fig. 1). Characterised by strong erosion of the crystalline base rock, filling the rift valley with quaternary sediments, Karonga soil types are primarily sandy. Land use along the flat lake shore is almost entirely cropland (mainly rice, maize, and cassava), while the hills and plateau are covered by bushes and open forest. The population of Karonga is rural and is distributed mainly on the flat lake shore in small communities. The economy depends upon subsistence agriculture and fishing. With a poverty incidence of 57.1 % (IFPRI, 2019), Karonga District is poorer than average for Malawi. Being one of the most vulnerable areas to floods, Karonga is the focus of several projects of the Malawi Red Cross Society that aim to improve preparedness, early action, and disaster response in Malawi. Flood events recur annually and are particularly damaging in Karonga due to poor infrastructure, a growing population, an increase of farming in flood risk areas, and difficulties for the population to receive warnings due to a lack of access to communication. Large-scale damaging events can occur in the district of Karonga, like the floods of 12–16 April 2018, affecting 4069 people, destroying 433 houses, and killing 4, as reported by the Department of Disaster Management Affairs of Malawi (DoDMA). Smaller-scale and isolated flash floods have also impacted the district, like the event of the 1 February 2018, affecting 1175 persons and damaging 42 houses and 397 ha of crops in the small village of Mwenelupembe according to DoDMA.
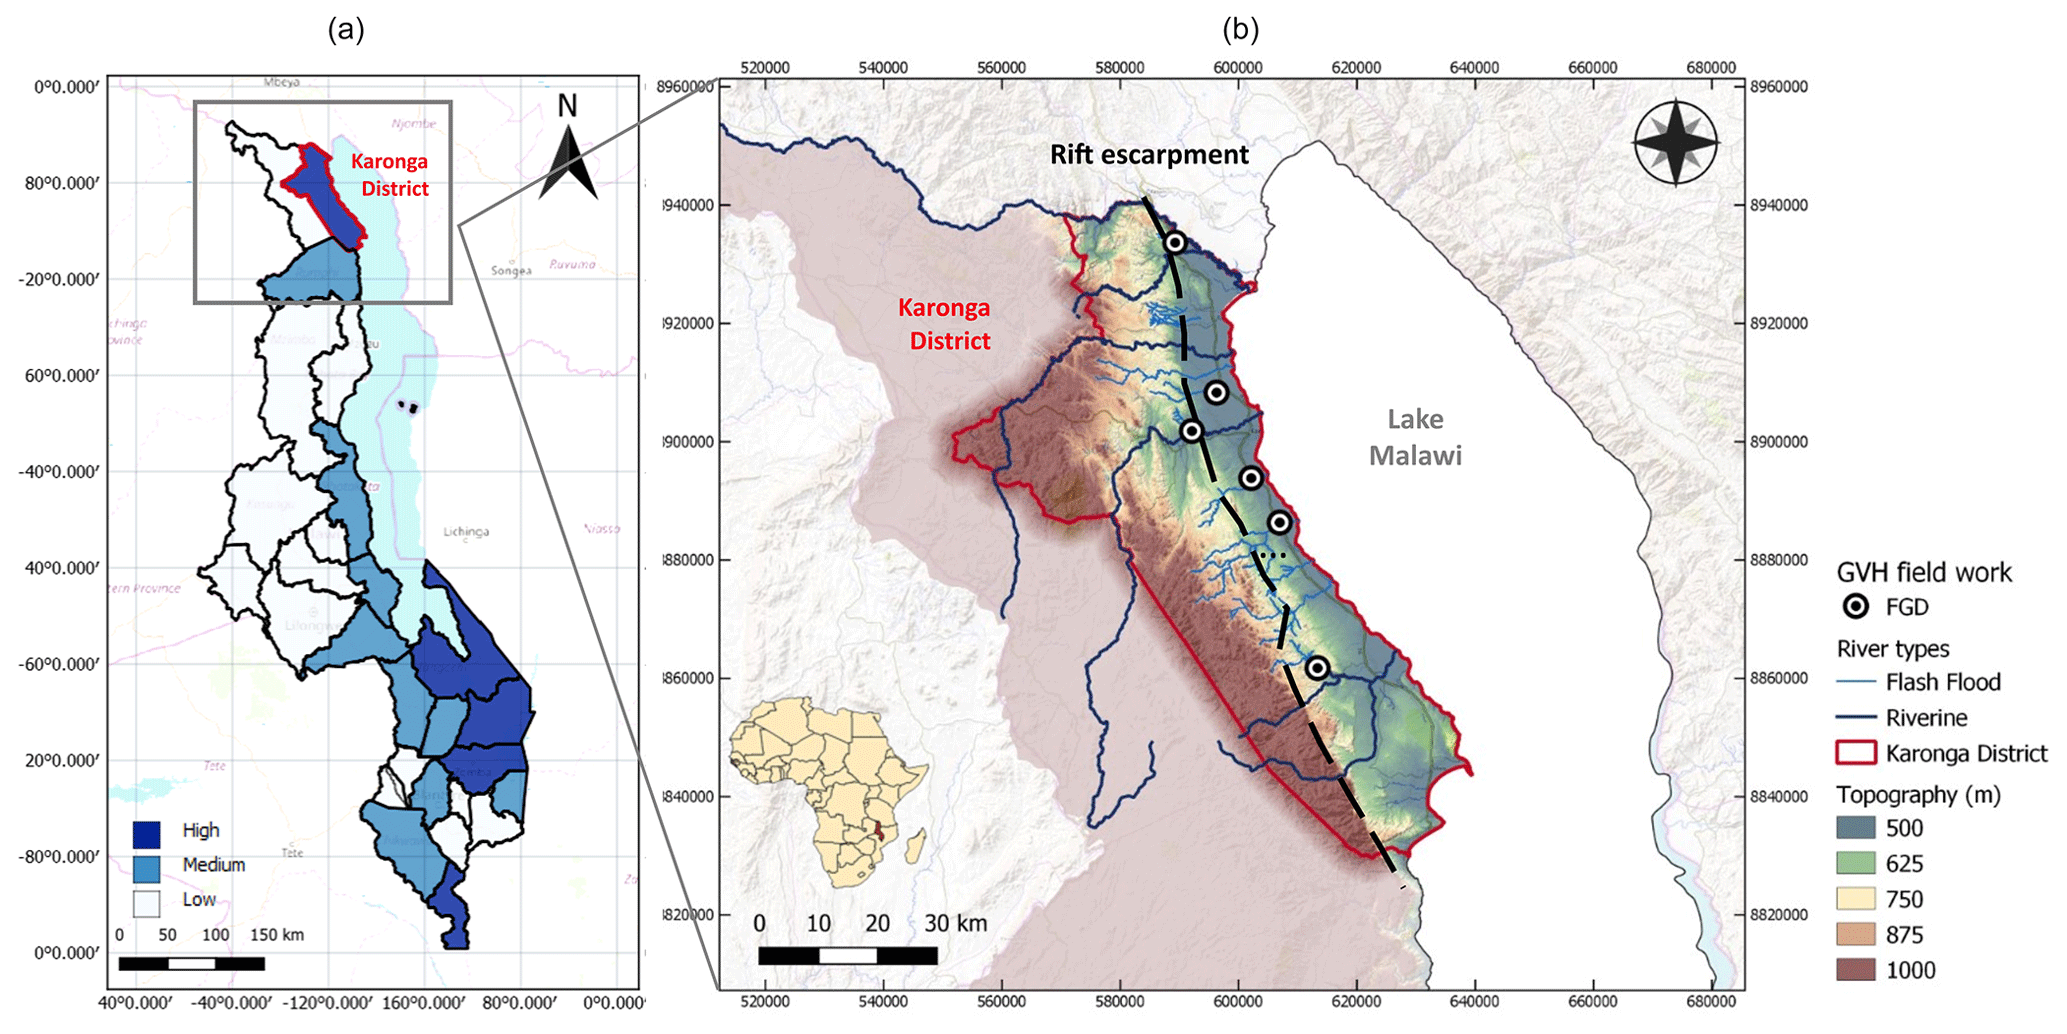
Figure 1Karonga District location on (a) Malawi flood recurrence map based on observed flood frequency in the period 2000–2013 generated by DoDMA (ICA, 2014). (b) Topography map showing the rift escarpment, the main rivers, and the six visited villages where focus group discussions were conducted for the research.
3.1 Building common knowledge of flash flooding
To develop a common understanding of what constitutes a flash flood in the perception of local communities in Karonga District, a primary data collection campaign was conducted at national, district, and community levels through a series of semi-structured key informant interviews (KIIs) and focus group discussions (FGDs), following a systematic protocol (see Sect. 3.1 of the Supplement). The KIIs at the national and district level and FGDs held at the community level followed a similar questioning pattern allowing for an alignment and comparison of the results obtained. We ensure that all KIIs and FGDs were prepared to comply with the COREQ (consolidated criteria for reporting qualitative research) qualitative research criteria (Tong et al., 2007).
KII refers to qualitative in-depth interviews with people from a range of sectors selected for their knowledge on the specific topic (USAID, 1996). For the KIIs at the national and district levels, we approached actors from a wide range of institutions, including representatives of disaster, meteorological, and hydrological governmental institutions; universities; and disaster practitioners from locally active NGOs (non-governmental organisations). As a results, we were able to carry out six KIIs in English at the national level, including with identified experts from the Malawi Red Cross Society; the Department of Disaster Risk Management Affairs; the Ministry of Finance and Economic Affairs; the Department of Climate Change and Meteorological Services; the Ministry of Agriculture, Irrigation, and Water Development; and Mzuzu University. At the Karonga District level, local actors such as members of the district civil-protection committee, a reporter from the Nyasa Times news agency, and NGOs active in the district (Salvation Army, Focus, and Self Help Africa) were interviewed. Based on these interviews, we identified 12 communities that are recognised to have a higher flash flood risk in Karonga District, located on different river basins across the district. Focus group discussions (FGDs) were carried out with six of these communities (communities are identified as a group village head, GVH) represented as circles in Fig. 1. FGD interviews bring together a group of persons from a similar background guided by a facilitator. We made sure that at least four persons in the FGD were above 50 years old, with at least one participant having spent more than 50 years in the community in each group. These were conducted and recorded in the local languages, Nkhonde and Chichewa, and subsequently transcribed and translated into English. A community drawing exercise was held in each village, resulting in a map gathering information about historical flash flood frequency, impacts, and perceptions of flash flood risk in different areas of the community. This was followed by a transect walk through the most affected part of the community. In addition, information about historical flash flood occurrence and their impacts was collected from each community. From all KII and FGD interview transcripts, local knowledge was extracted through quotes and coded into thematic analysis following five themes: (i) flash flood definition, (ii) occurrence of flash flood events, (iii) impacts of flash floods, (iv) risk perception, and (v) the signs leading to flash floods. These themes were identified partly based on deductive coding (literature study) inspired by the dimensions of local knowledge of the flood risk management cycle identified by Šakić Trogrlić et al. (2019) and partly based on inductive coding of the transcripts.
We complement these primary data with secondary data on historical flash flood events with their location, date, and recorded impacts. These were extracted manually from five different sources of information: disaster reports from humanitarian actors (IFRC-GO, 2018; UNICEF, 2019), existing global disaster data (EM-DAT, 2018; Munich RE, 2004), government data, online news briefs (FloodList, 2018; ReliefWeb, 2019), and national online media (Nyasa Times, 2019; The Nation, 2019). All datasets were filtered and consolidated into an event database at three levels of spatial granularity: Karonga District, traditional authority (TA), and community levels (GVH). A total of 142 records of flash flood events affecting the district from 2000 to 2018 were gathered (Bucherie, 2021). This included 48 events reported at the district level and 38 events at the TA level. Only 18 events are reported to affect the six communities of interest, covering the period 2004–2018.
3.2 Mapping flash flood susceptibility based on scientific data
The susceptibility of an area to be affected by flash floods depends on the geomorphometric and surface characteristics (Horton, 1945; Patton and Baker, 1976), which have a strong influence on catchment hydrologic response to heavy rains and therefore on runoff generation. Here we map the relative susceptibility to flash flooding of the 12 communities identified to have the highest flash flood risk in Karonga District. For each of the 12 communities, hydrological catchments are delineated, using the global SRTM (Shuttle Radar Topography Mission) v4.1 90 m digital elevation model (DEM) (Jarvis et al., 2008). Geomorphological indicators related to surface and morphometric characteristics known to characterise flash flood risk are identified (Bajabaa et al., 2013; Farhan et al., 2016; Rogelis and Werner, 2014), with some linked to the local knowledge (such as indicators related to slope, soil type, and land or vegetation cover). The identified indicators and references are described in Table 1.
Gray (1961)Schumm (1956)Miller (1953)Kirpich (1940)(Zevenbergen and Thorne, 1987)Linsey et al. (1982)Melton (1957)Oruonye (2016)Schumm (1956)Patton and Baker (1976)Strahler (1957)Schumm (1956)Smith (2003)Tincu et al. (2018)Smith (2003)Tincu et al. (2018)Smith (2003)Tincu et al. (2018)Table 1Identified geomorphological and surface indicators related to flash flood susceptibility.

For each catchment, geomorphological indicators are calculated and classified according to four categories characterising the geometry, the hypsometry, the drainage network, and the surface of the catchments (Table A1). While the first three categories of catchment indicators are extracted from the DEM analysis only, the surface characteristic indicators are derived from the Malawian government soil type and land-use–land-cover (LULC) data and the normalised difference vegetation index (NDVI) Copernicus Global Land Service 300 m product (Roujean et al., 2018). All geomorphological indicators are normalised from 0 to 1 according to their contribution to the susceptibility of flash flooding.
Different methods of weighting the influence of each geomorphological parameter can be used depending on the context and the scale of each case study (Azmeri et al., 2016). Some studies use equal weighting (Zogg and Deitsch, 2013) or weighting based on the indicator ranking (Karmokar and De, 2020). Here we apply a weighted method based on principal component analysis (PCA) to reduce the dimensions in each class (Chao and Wu, 2017; Rogelis and Werner, 2014). Based on the four principal component results, a ranking of flash flood susceptibility of the 12 catchments is calculated, following Eq. (1), representing the inherent potential of each catchment to generate a flash flood in the case of heavy rain. PC[name] refers to principal components related to the geometry, hypsometry, surface, and drainage network. The linear coefficients a, b, c, and d are the weights applied to each of these classes.
Validating a map of flash flood susceptibility is a challenge where there is little historical data (Alam et al., 2020). For data-rich catchments, machine learning techniques use historical flash flood data to calibrate the flash flood susceptibility map (integrating morphometric and precipitation indicators) and have been tested on the catchment-specific study scale (Arabameri et al., 2020; Pham et al., 2020). Here we estimate the weight (a, b, c, and d) of each class by calibrating them against the estimated relative flash flood frequency for each catchment as indicated by the communities interviewed. The best fit is defined by minimising the root mean square error (RMSE) between the modelled flash flood susceptibility (FFSuscept) and the normalised observations of flash flood frequency.
3.3 Identifying hydro-meteorological conditions associated with flash flooding
Precipitation and large-scale hydro-meteorological indicator datasets are selected, guided by the knowledge gained from communities on the signs and triggers they consider precursors to flash floods. The spatial and seasonal distribution of indicators derived from the datasets are analysed to understand if these corroborate with the reported signs and particularly if these reflect conditions associated with flash floods during and prior to the catalogued historical flash flood events.
Precipitation is derived from the GSMaP (Global Satellite Mapping of Precipitation) satellite-based precipitation products (Aonashi et al., 2009; Okamoto et al., 2005; Kubota et al., 2007) and extracted for the wet seasons of the 2002–2018 period. We limit the extraction of these data to the wet season for computational reasons, as well as due to flash flood events occurring in the wet season. GSMaP was selected given the high spatial (0.05∘) and temporal (hourly) resolution, as well as relatively low latency. Historical extreme rainfall patterns are explored spatially and temporally over the district. In addition, maximum daily 1 and 3 h rainfall totals are extracted to characterise precipitation intensity associated with the 18 catalogued flash flood events affecting the six communities for the 2004–2018 period. Moving windows of 6 h, 1,̣ and 3 d cumulative rainfall are extracted as indicators of antecedent cumulative precipitation. These precipitation indicators and associate statistics are extracted from the GSMaP data at locations corresponding to the centroids of the catchments of interest. Time series are analysed visually for each flash flood event.
Large-scale hydro-meteorological conditions are derived from the ECMWF ERA5 climate reanalysis dataset (Hersbach et al., 2020) provided through the Copernicus Climate Change Service (C3S, 2019). This dataset is selected given its availability and as it provides the same parameters and at similar temporal and spatial scales as the forcing data used in global hydro-meteorological forecast models such as GLOFAS (Global Flood Awareness System; Alfieri et al., 2013). Daily data are extracted for the 2000–2018 period from ERA5 over a geographical box that encompasses the study area (8–12∘ S, 32–36∘ E). Variables considered include the 2 m surface air temperature, the 2 m dew point temperature, the volumetric soil water content of the first 7 cm of the land surface, the relative humidity of the deep troposphere, the CAPE indicator (surface-based convective available potential energy), and the surface u and v wind vectors.
These variables are extracted from the ERA5 data at three locations (see Fig. 2), one in the northern part of the district (N), one in the southern part (S), and one in Lake Malawi (L). Daily averages of the selected ERA5 variables are extracted for the period 2000–2018 to analyse seasonal variations. To study the larger-scale hydro-meteorological patterns and conditions associated with historical flash flood events, the same ERA5 hydro-meteorological variables are extracted and averaged over four regions (see Fig. 2), for up to 3 d before each of the catalogued flash flood events. These regions are selected based on the precursor signs reported by communities interviewed and include Karonga (region W), Lake Malawi (region S), and the areas to the north-west and north-east of Karonga (region NW and region NE, respectively).
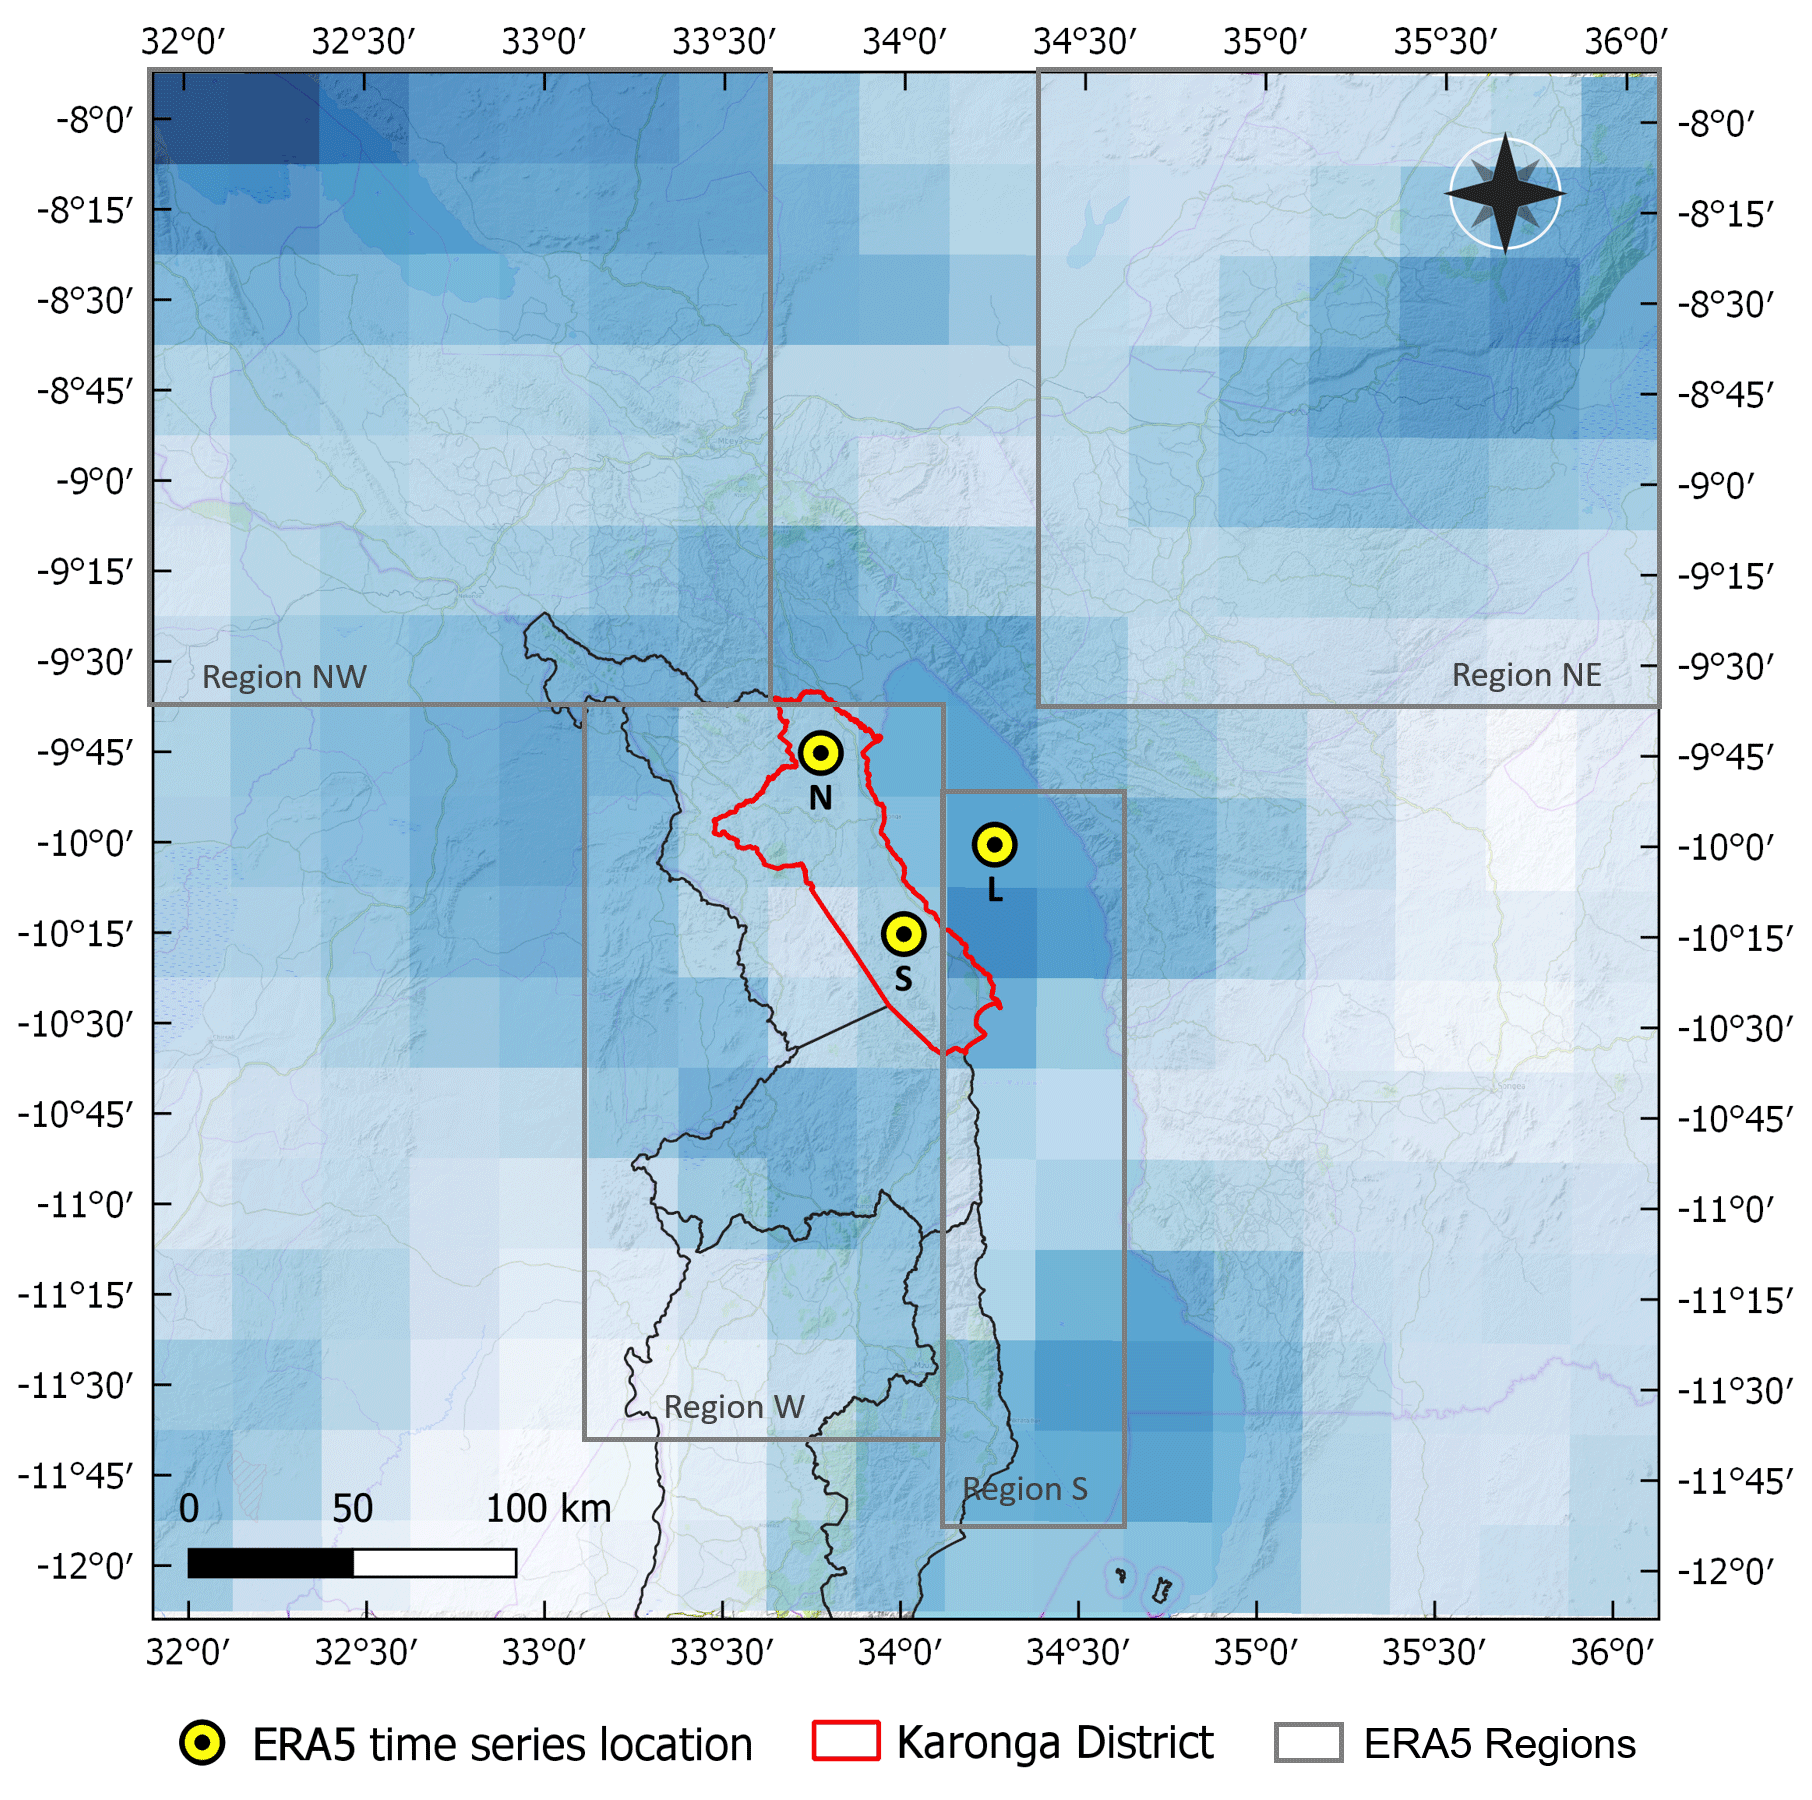
Figure 2ERA5 grid resolution; x, y point locations (yellow dots); and four regions (NW: north-west, NE: north-east, W: west, and S: south) used for large-scale hydro-meteorological pattern analysis.
Table 2Monthly flood event frequency based on 2000–2018 secondary data collection (43 recorded events) and associated proportion of short-duration (≤3 d) and local (affecting only 1 TA) recorded flood events.
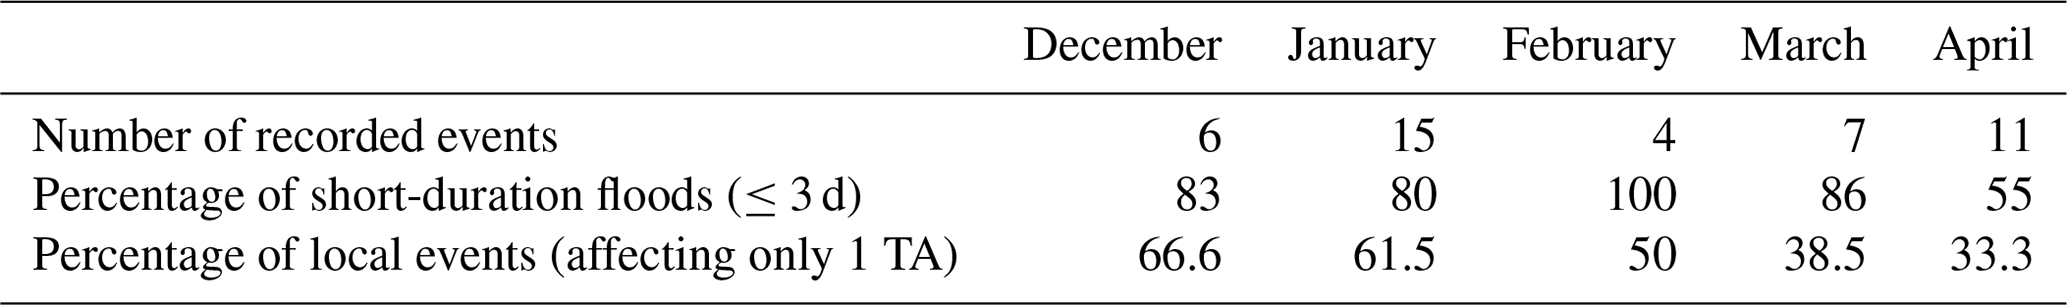
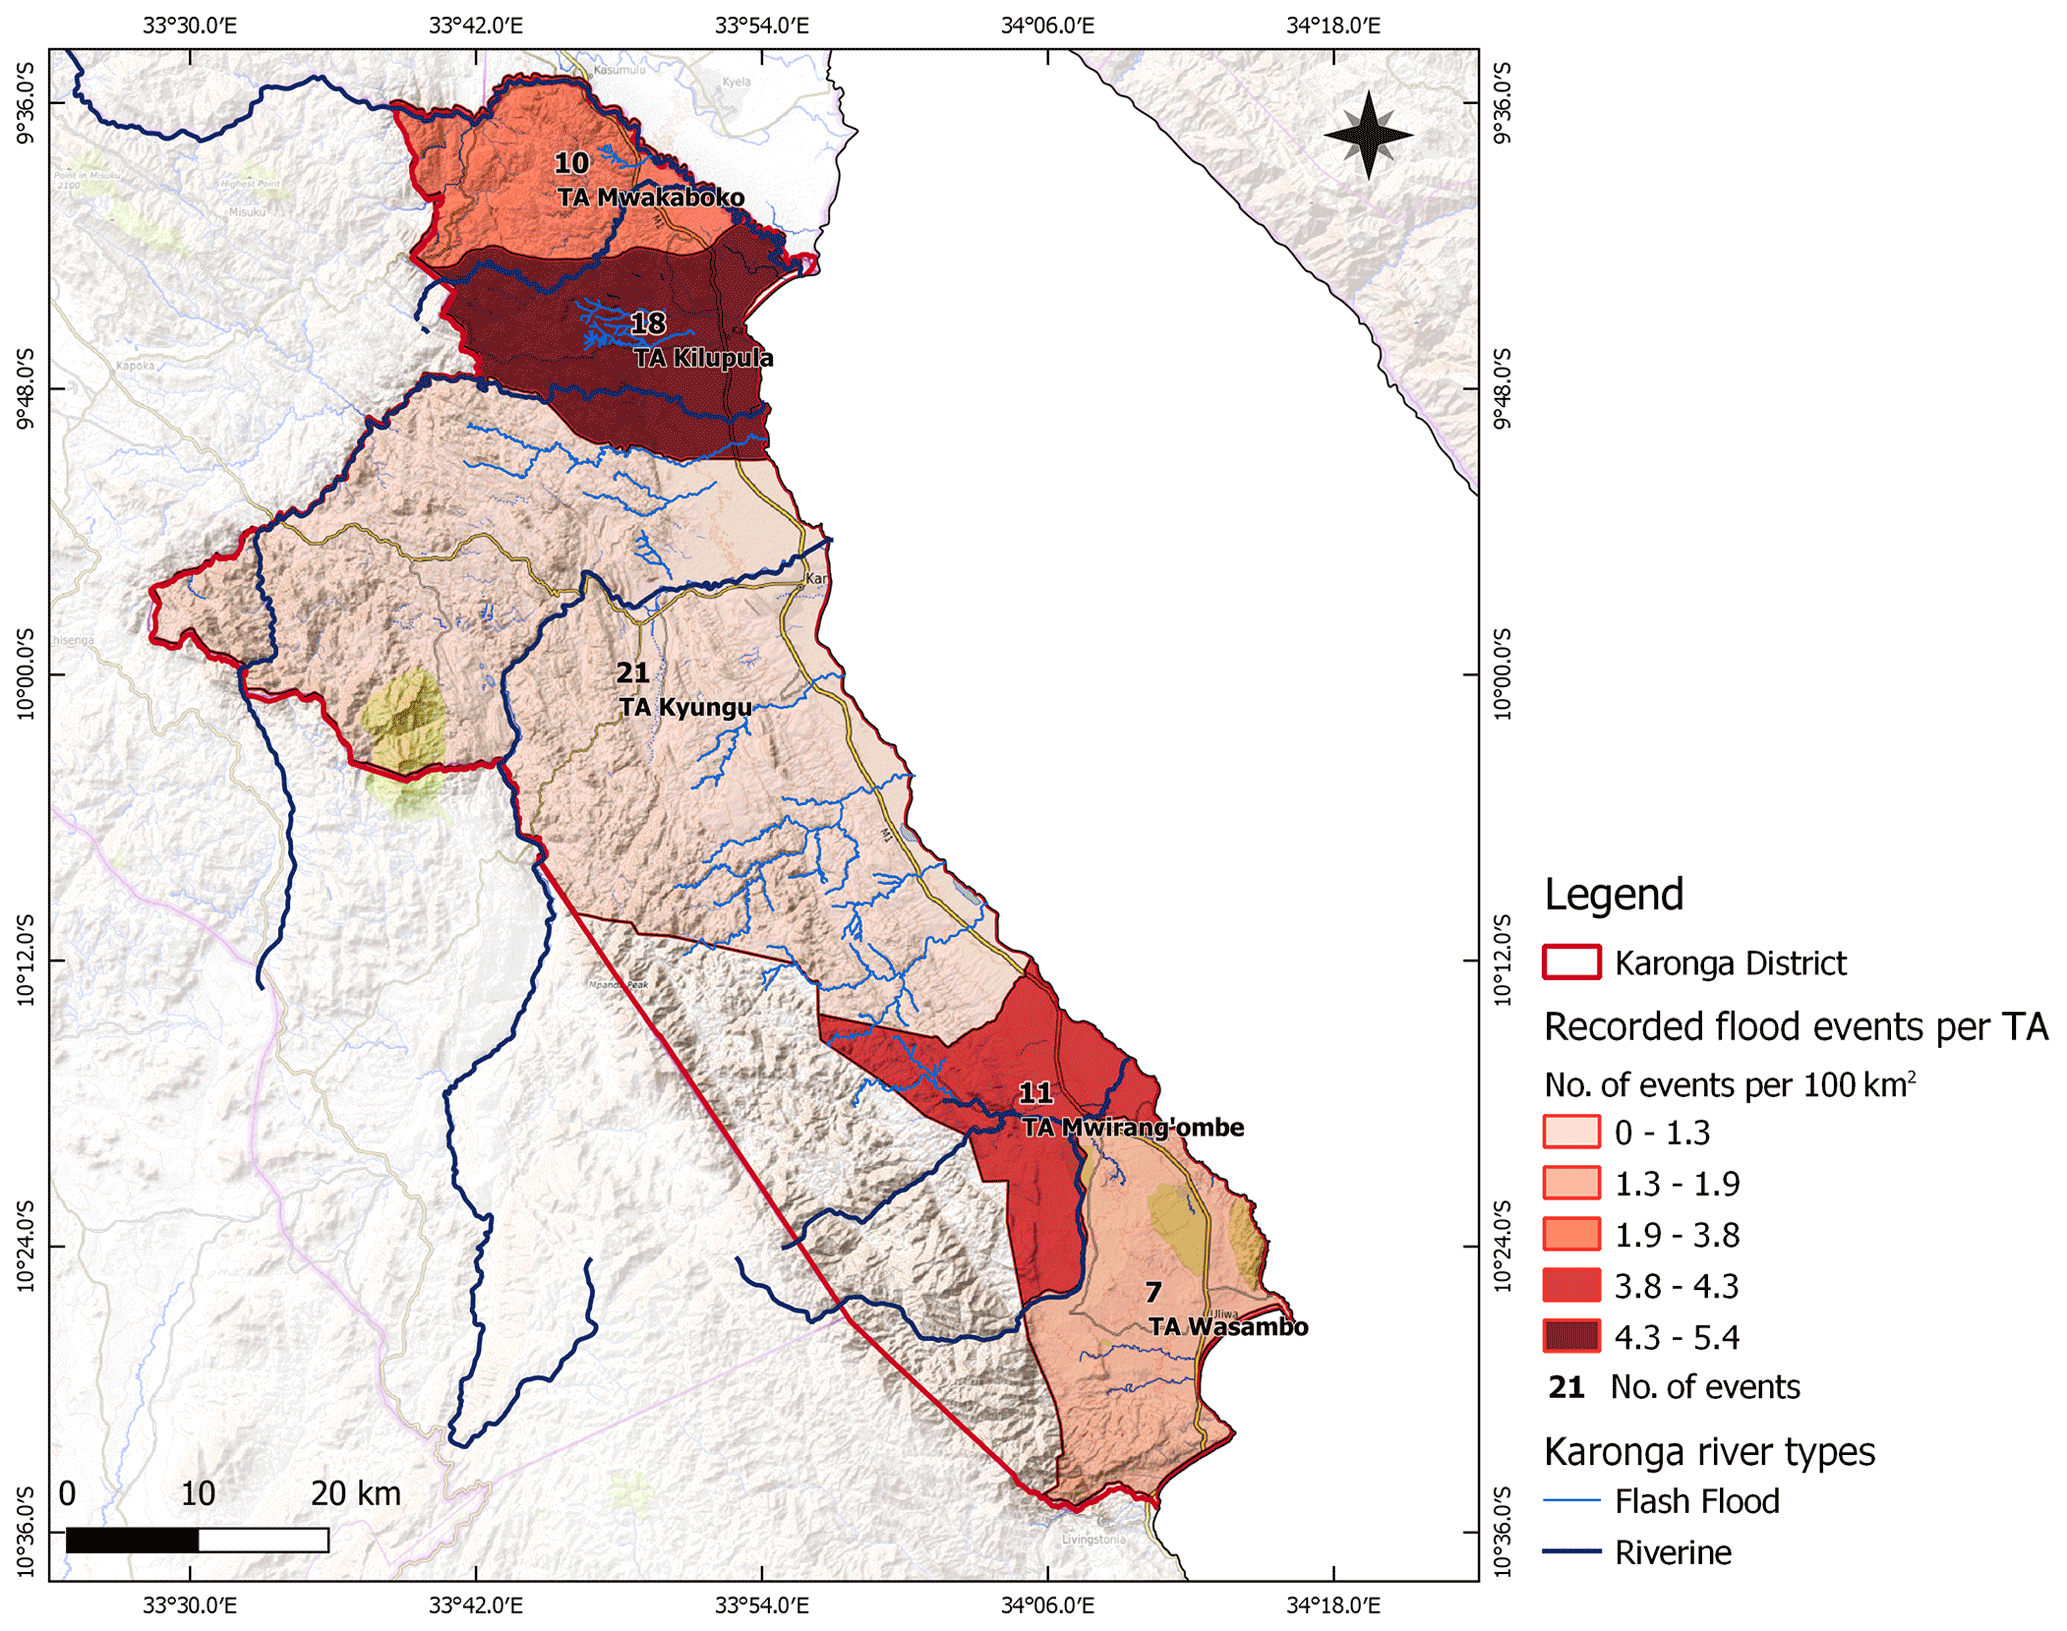
Figure 3Number of recorded flood events per 100 km2 for every TA (collected for the period 2000–2018), with the total number of events recorded for each TA indicated as labels.
4.1 Building knowledge about flash flooding
Local knowledge about flash flooding in Karonga District has been compiled from all KIIs, FGDs, transect walks, and community drawings, through the extraction of quotes from interview transcripts. We reported the knowledge extracted here, structured along the five themes identified in the collection and analysis of the data. Additionally, the risk knowledge established in the themes about the (ii) occurrence of flash flood events and (iii) impact of flash floods is based on the integration and corroboration of the FGDs and KIIs (primary data) with the flash flood occurrence and impact analysis derived from the secondary data.
- i.
Flash flood description. Communities report that they experience sudden floods, induced by intense and short rainfall events, and that these form the main type of weather-induced disasters in northern Malawi. All communities describe these flood events as unexpected and occurring “without notice”, associated with intense power of river flows, erosion of river banks, and rivers bursting their banks. Participants identified that the topography is known to govern the occurrence of flash floods in Karonga and that the most affected areas are on the flat rift valley floor close to the escarpment. In addition, fast-onset floods are known sometimes to coincide with slow-onset riverine floods in communities in the north of Karonga, a scenario described as resulting in larger-scale, longer-duration, and more severe disasters.
- ii.
Occurrence of flash flood events. The analysis of the data from the KIIs and FGDs, supported by the analysis of the secondary data on the spatial and temporal occurrence of flash floods, reveals that flash floods happen between one and eight times per year in Karonga District, mostly in January and in March–April, and generally overnight. In addition, shorter-duration and more localised flash flood events are reported to occur in January, while longer-duration floods affecting larger areas are observed in April (Table 2). The frequency of flash floods is found to be higher in the northern part of the district, in Kyungu and Kilipula TA (see Fig. 3). In addition, April events affect mainly catchments in the northern TAs, while January events may affect any of the catchments in the entire district.
- iii.
Impacts of flash floods. Information about the impact of flash floods in Karonga is extracted from the interviews and the analysis of historical impact datasets. The main impact of flash floods experienced by Karonga's communities is on agriculture, as flash flood events are reported to systematically sweep away several hectares (ha) of crops (either recently planted or fully grown) and sometimes livestock. In addition, communities mentioned that flash floods can destroy parts of villages, irrespective of the type of buildings. Communities report an increase in flood impact since 2007. Based on our historical data, we estimate that when a flood occurs in the district it has a 50 % chance of affecting at least 300 households and 200 ha of crops and killing at least one person. The communities also indicated that the impact of floods is higher in April and also higher in the north of Karonga. This is attributed to the combination of flash floods with riverine floods in the Songwe, Kyungu, Lufira, and North Rukuru rivers, as well as the higher population density in the north. These prolonged and larger-scale flood events are reported to trigger cholera outbreaks in the region. Flash flood events occurring in January can, however, affect the entire district. Their impacts on communities are more spatially contained but may be more severe at that small scale.
- iv.
Perceived drivers of flash flood risk. Extracted from the KII and FGD interview transcripts, a summary of six factors perceived to increase flash flood risks in Karonga District is presented below. Quotes made by different community members are provided, where relevant.
-
River sediments. Karonga has mostly ephemeral rivers with heavily silted river beds, which are dry from the months of August to December. Increasing sedimentation of the river beds and changes in river behaviour are reported by elderly people. High sedimentation in rivers is recognised to have increased flood occurrence and the exposure of people living along these rivers. “Before, water would swell within its course and go back to normal without any damage. Today, rivers are full of sand, blocking culverts and preventing water from flowing in its original course.” River profiles where these cross the lake-shore plain are very flat, and their channels were observed during our transect walks to not be deep enough to accommodate peak discharges.
-
Land use. The sedimentation in the river courses is identified by all communities to be the result of deforestation in the upstream catchments, which started in the 1970s, after the independence of Malawi. Charcoal production, and the use of wood to build stronger burnt brick structures have risen: “Bushfires and overgrazing animals are leaving the soil bare and prone to flood.” In addition, the intensification of agriculture along the river banks is reported to reduce the natural control of the water velocity, increasing the spread of water on farmland.
-
Climate change. A shift toward shorter and more intense rainy seasons (December to March instead of November to April) is observed by communities, leading to more frequent and devastating events. An intensification of rain events and a change in meteorological patterns is described by elderly people, making the indigenous prediction more difficult than before.
-
Geomorphology. Fast-running water is experienced to come from the steep slopes of the mountains of the escarpment and affects villages in the low land areas, making the proximity to the hills a factor of increasing risk.
-
Soil type. The relation between flash floods and soil type is expressed in terms of erodibility of the soil: “The soil, easily swept away during flood, is dispersed in agricultural fields and lowers soil fertility.” In the northern communities, a relation between the flood duration and the clay content in the soil, lowering the infiltration capacity in the lake margin plains, is observed.
-
Socio-economic vulnerability. The rapid increase of population and poverty, associated with poor settlement and farming practices, is perceived to have exacerbated the vulnerability of communities in the district.
-
- v.
The signs leading to flash floods. The local knowledge of the signs experienced prior to flash floods are categorised into two types of observations.
-
Meteorological signs. Community knowledge revealed that flash floods are associated with strong south-easterly winds at the end of the wet season. In addition, communities in the south of Karonga District described flash floods to be associated with highly localised storm events and thunder, black and slow-moving convective clouds, and changeable wind direction. In addition, a rise in temperature before flash floods was reported by all communities.
-
Hydrological signs. When water velocity and volume increase in the rivers, the amount of debris carried as well as the colour of the water changes (turning brown, black, milky, or red), announcing that a major flood is coming. In addition, at the lake margin, the soil moisture and water table are known to be high at the end of the wet season, increasing the duration of floods and consequent impacts. When the soil is dry, water from the flash floods will infiltrate faster in the farmlands.
-
4.2 Geomorphological analysis of flash flood susceptibility in Karonga District
All catchments that drain the escarpment are reported to be susceptible to flash flooding in Karonga District, although the level of susceptibility may vary between catchments. The results from the flash flood frequency estimation from each community was fundamental to understanding the spatial difference in flash flood susceptibility from the geomorphology and surface characteristics of the upstream catchments upstream. The normalised indicator values and PCA composite results calculated for each catchment are presented in Sect. 4.2 in the Supplement; the PCA component loadings are found in Table A1.
The relative catchment susceptibility results for the four geomorphological classes – geometry, hypsometry, drainage system, and surface characteristics – reveal differences from north to south, as shown in Fig. 4. The dashed coloured lines show the results from the PCA for each of the four categories of catchment characteristics. Black triangles show the normalised frequency of flash floods as reported by the communities visited, which were used to estimate the weights (a, b, c, and d) for the final flash flood susceptibility ranking of the selected catchments. The thick solid line shows the normalised flash flood susceptibility indicators, found from the weighted contributing factors: geometry (0.5), hypsometry (0.1), drainage (0.2), and surface (0.2), where the values in brackets are the weights in Eq. (1) with the best fit (RMSE of 0.31). The resulting indices are mapped in Fig. 5.
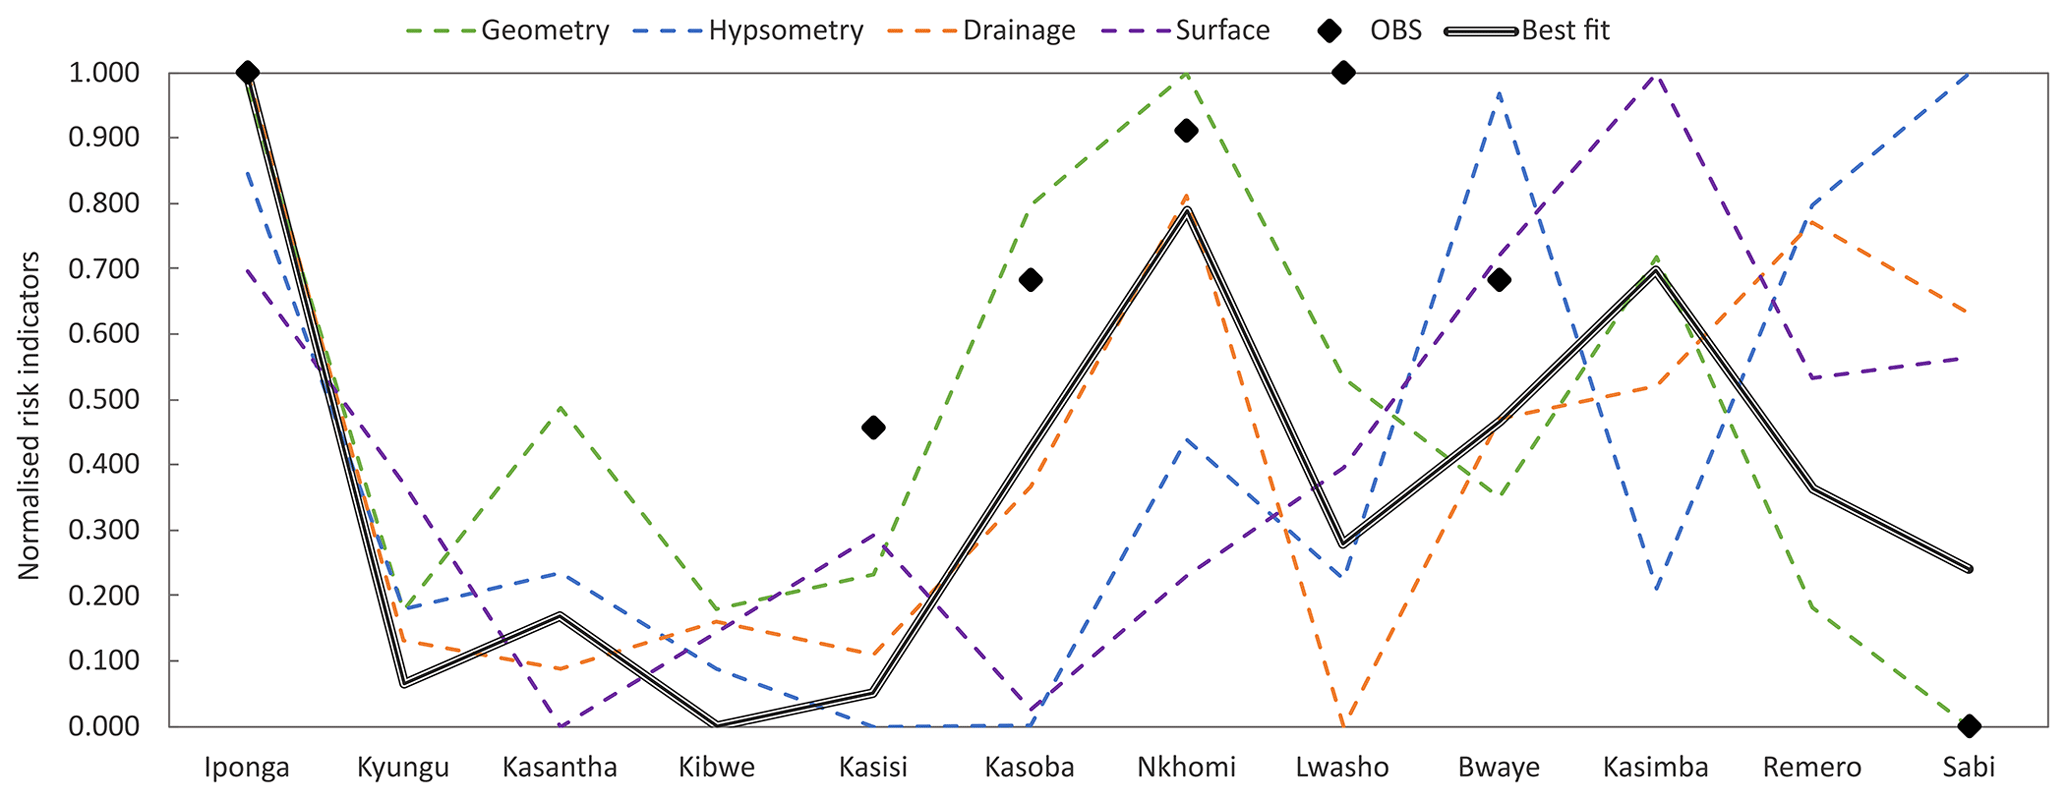
Figure 4Results from the PCA of the four catchment characteristic categories and weighted flash flood catchment susceptibility. The black dots correspond to the normalised estimation of the flash flood frequency of the communities visited (OBS: observed). Catchments are ordered from north to south (left to right).
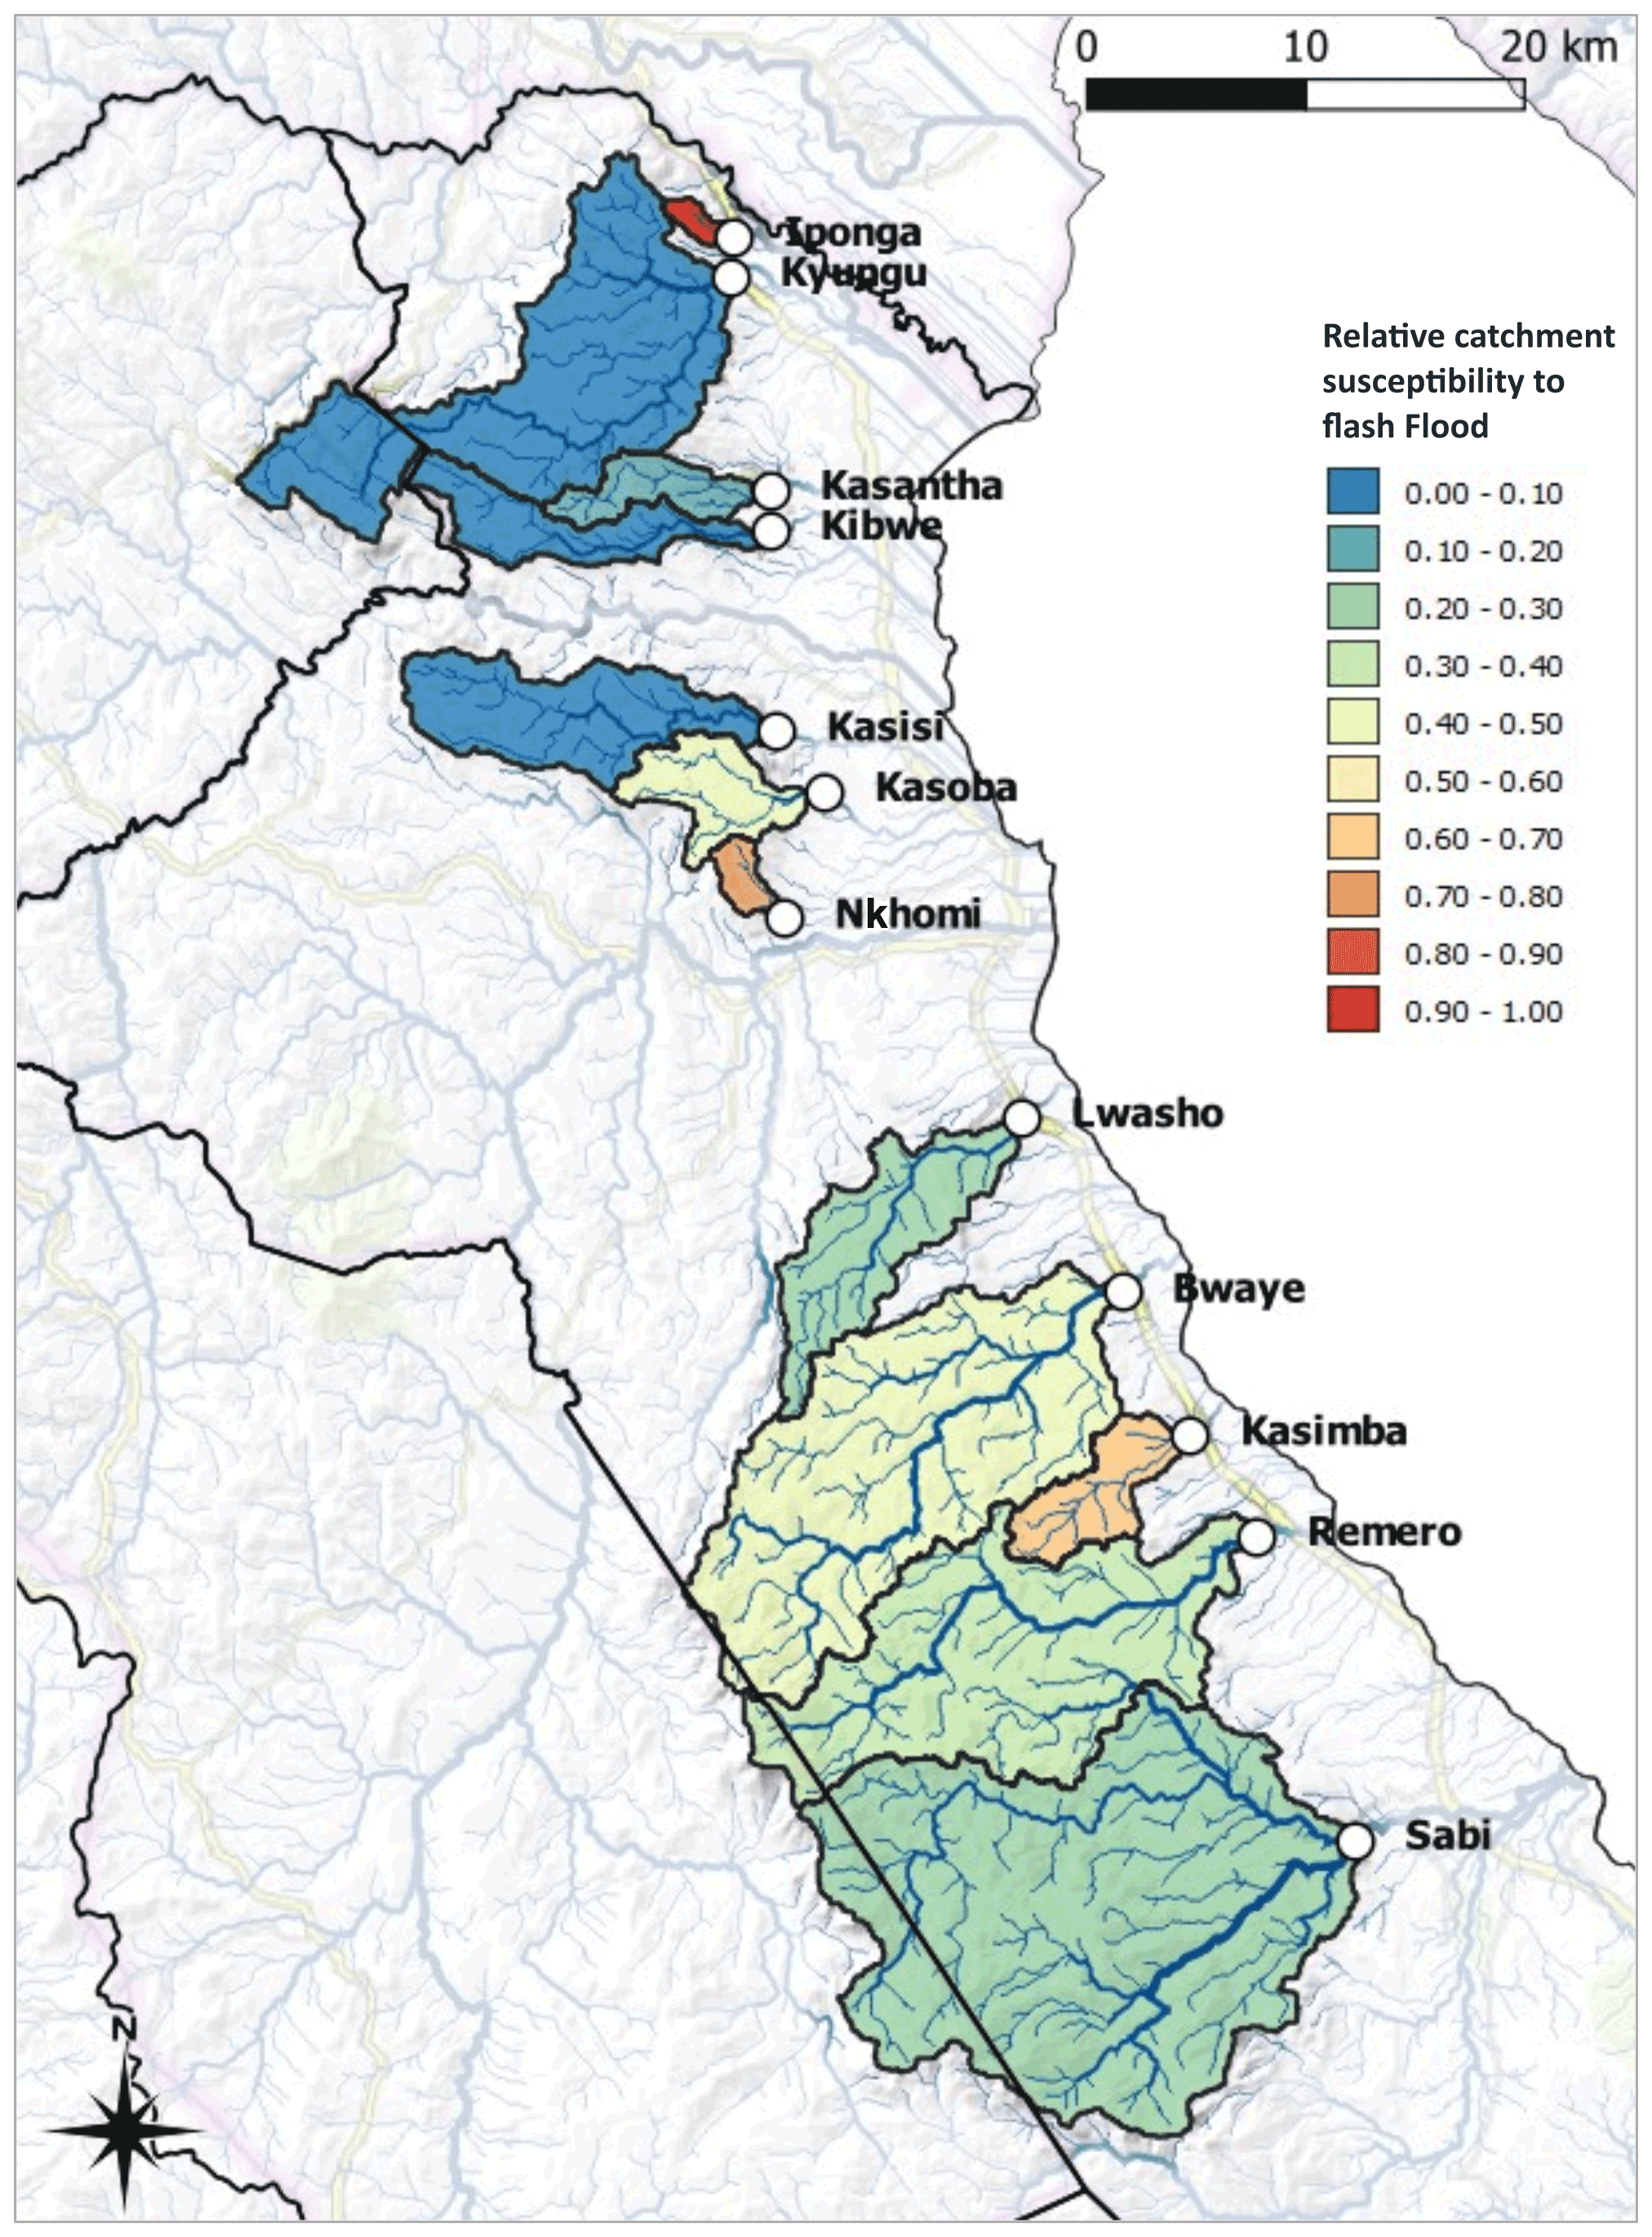
Figure 5Relative flash flood susceptibility of the catchments in Karonga District.
The increased flash flood susceptibility of catchments appears to be mostly driven by catchment geometry and is inversely proportional to the area and the time of concentration (Tc) of the catchment, together explaining 63 % of the variance of the geometric class. While the high frequency of flash floods experienced by the communities of Iponga and Nkhomi are explained mainly by their small upstream catchments size (lower than 10 km2) and Tc of about 40 min, the lowest flash flood frequency observed in the Sabi community can be explained by the largest contributing area (335 km2) and associated Tc (∼4 h).
The derived weights attribute an equally important influence to both the drainage characteristics (controlled essentially by the drainage relief ratio) and the surface characteristics. While the higher flash flood susceptibility of the Iponga and Nkhomi catchments is also explained by the high drainage relief ratio, spatial variation of the susceptibility related to surface characteristics is mainly driven by the soil types and the vegetation cover. A strong variability in the NDVI is observed between the north and the south, particularly at the beginning of the wet season, exposing the south (with more bare soils) to a higher susceptibility to flash floods. The high susceptibility of the Iponga catchment is additionally explained by the presence of clayey soils in the north, decreasing the infiltration capacity. Finally, catchment hypsometry results do not correlate well with field observations. The resulting low relative flash flood susceptibility of the Kyungu, Kibwe, and Kasantha catchments in the north of Karonga, which were not visited, confirms these being ranked as less dangerous by Karonga experts through the KIIs.
4.3 Hydro-meteorological conditions associated with flash flooding
Guided by local knowledge about the hydro-meteorological signs associated with flash flood events and the temporal distribution of flash flood events through the wet season, we analysed the characteristics of extreme rainfall and large-scale spatial and intra-seasonal hydro-meteorological patterns that could lead to flash floods in Karonga.
The analysis of historical precipitation indicates that heavy rainfall events are not homogeneously distributed spatially and are distinctly different at the beginning and at the end of the wet season.
Figure 6 shows the maximum daily precipitation found with the GSMaP data, averaged over the time period 2002–2018 for the months of January and April, the months in which flash floods are reported by communities to occur. This reveals that extreme rainfall rates are constrained to the northern part of Karonga at the end of the wet season in April, while these are distributed more homogeneously in January. A more detailed analysis of the hourly rainfall rate reveals that extreme rainfall events are more frequent in January than in April, though the maximum hourly precipitation rates are comparable in both months (see Sect. 4.3.1 in the Supplement). All rainfall events associated with the 18 historical flash flood events were detected by GSMaP. It confirms that extreme rainfall peaks of at least 30 mm h−1 are associated with events localised in the north of Karonga, either at the beginning or at the end of the wet season. In addition, flash flood events that correspond to low GSMaP rainfall signals (peak rain below 10 mm h−1) are observed mainly in the south of Karonga, in January and February (see Sect. 4.3.2 in the Supplement).
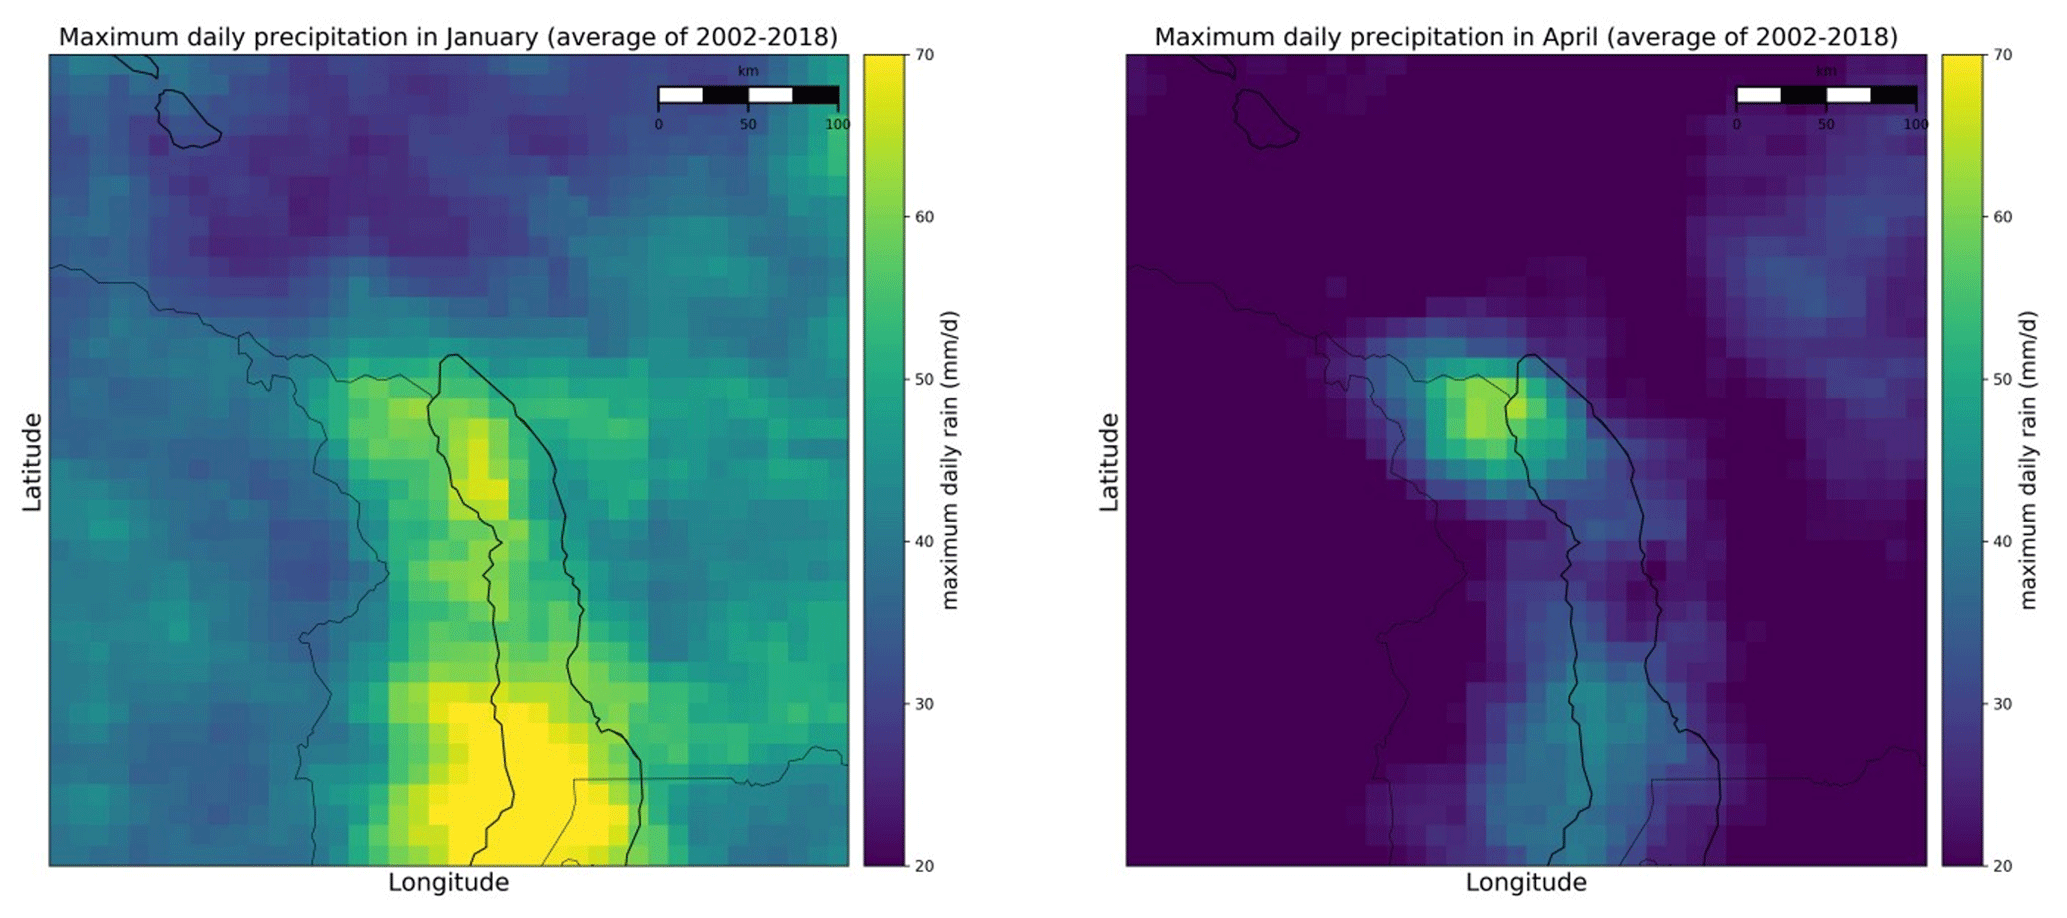
Figure 6Maximum daily rainfall over 2 different months of the wet season (January and April), averaged for 15 wet seasons (2002/03 to 2017/18). Yellow colours indicate areas with higher maximum daily rainfall (mm d−1) recorded on average for the month. The maps are centred on northern Malawi; black lines represent the boundaries between countries and Lake Malawi.
4.3.1 The large-scale hydro-meteorological analysis
The large-scale hydro-meteorological analysis on seasonal patterns and conditions associated with flash floods in northern Malawi helps to explain the extreme rainfall patterns in northern Karonga. Figure 7 presents the standard daily averages for the selected variables spanning the 2000–2018 period, derived from ERA5 hourly reanalysis and sampled at three locations (Fig. 2).
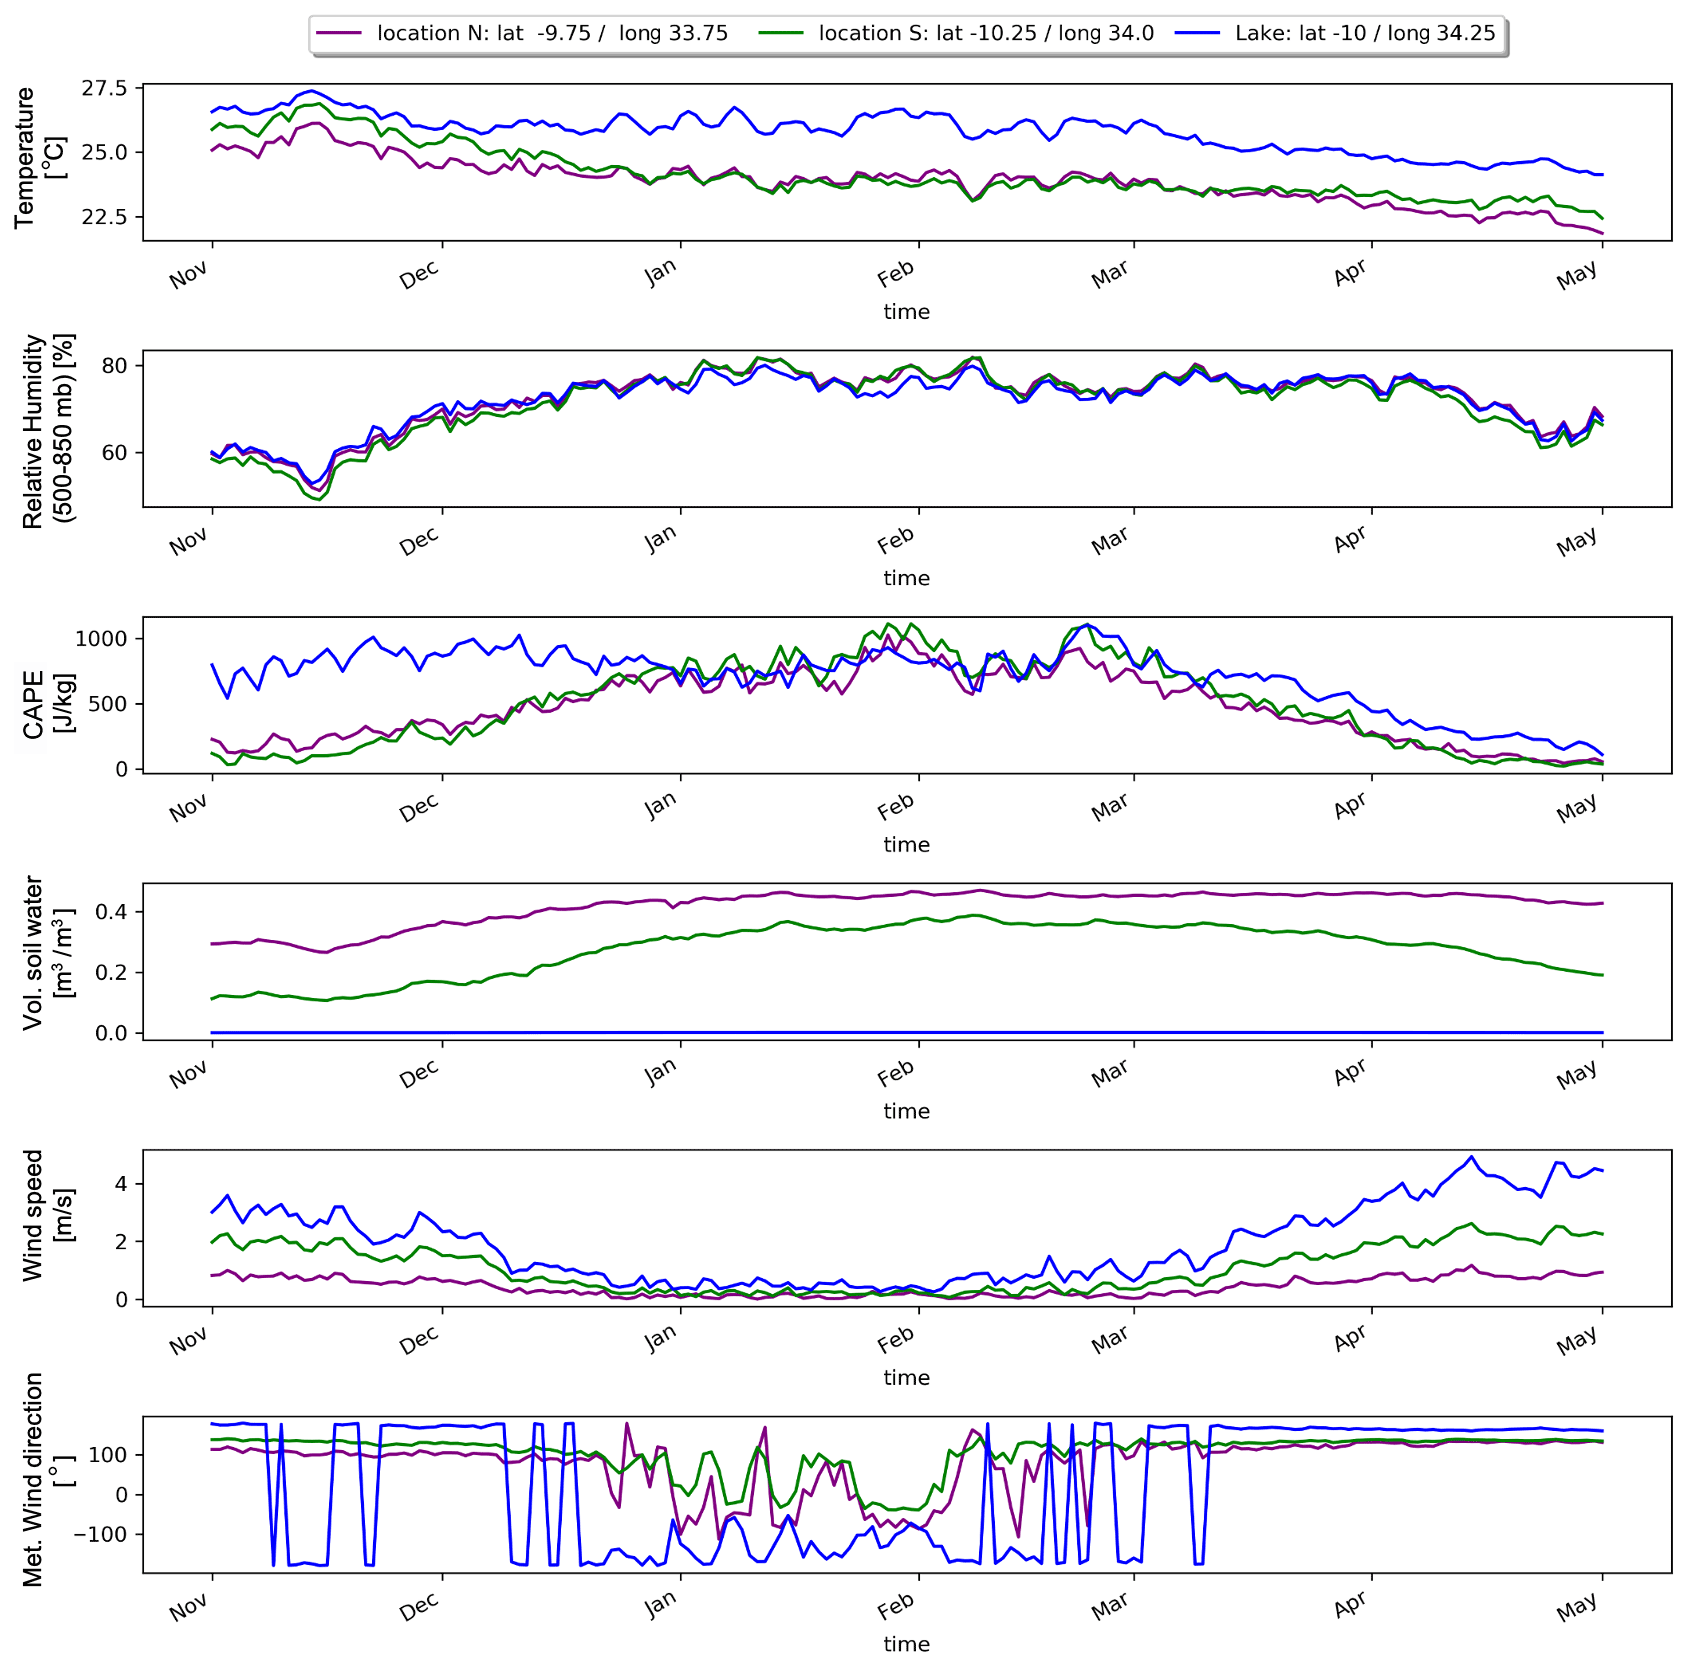
Figure 7ERA5 standard daily averaged variables over the period 2000–2018 for the three locations as introduced in Fig. 3 representing the north and the south of Karonga and Lake Malawi. Six hydro-meteorological variables are shown: the surface temperature, the relative humidity of the troposphere, the CAPE factor, the volumetric soil water, the wind speed, and the meteorological wind direction.
The relative humidity, which provides an indication of the water saturation of the deep troposphere, strongly increases during the first part of the wet season, from mid-November to end of December. The average relative humidity is at its maximum from January to mid-February, approaching 80 %, and is slightly lower from mid-February to the end of March. The relative humidity of the troposphere then drops significantly in April.
The soil moisture is generally lower in the south than in the north of Karonga. It gradually rises from November to February, then drops at the end of the wet season in the south while remaining high in the north. These results confirm the precipitation observations, showing a prolonged rainy season in April in the north of Karonga, but could also be attributed to differences in soil characteristics and vegetation.
The convective available potential energy (CAPE) is highly variable within the wet season. It shows a rising trend at the beginning of the wet season and a falling trend at the end of the wet season, with averaged maximum standard values of 1000 J km−1 at the end of January revealing a maximum atmospheric instability. In addition, the daily variability of CAPE is higher in January.
The wind is generally stronger before December, becoming weaker at the beginning of the wet season. It reaches its minimum intensity in January and February and increases again towards the end of the wet season. We observe that winds are stronger over the lake and in the south than in the north of Karonga at the end of the wet season. During November–December and March–April, the wind is uniformly south-easterly over land and southerly over the lake. During the months of January and February, wind direction is more erratic, characterised by an alternation between north-westerly and north-easterly winds over Karonga and, respectively, north-westerlies and southerlies over Lake Malawi.
Our analysis of these variables confirms our hypothesis of two large-scale hydro-meteorological patterns in northern Malawi, characteristic of the early and late wet season, respectively.
4.3.2 The early wet season
The early wet season is characterised by a maximum atmospheric instability in January, with high temperatures and relative humidity. This is when the Intertropical Convergence Zone (ITCZ) is positioned over Malawi. This suggests that the convective storm risk associated with the tropical climate regime is higher at the beginning of the wet season. During this period, extreme rainfall events are more frequent, more localised, and of shorter duration. Such convective events occur evenly distributed over the district. The wind, alternating between two different regimes, can lead to either orographically enhanced rainfall in the north or more scattered convective conditions in the south.
4.3.3 The late wet season
The late wet season is driven by an extra-tropical climate regime associated with the Mozambique Current coming from the Indian Ocean. This is consistent with the strong winds from the south observed along Lake Malawi. When this pattern forms, clouds converge toward the northern part of Karonga, where rainfall is orographically enhanced. The north of Karonga experiences a longer rainy season as a consequence, with frequent, intense, and continuous rainfall until the end of April, while flash flood risk is considerably reduced in April in the south of Karonga.
While orographic effects in Karonga have been documented (Nicholson et al., 2014), the differences between the orographic events of the late wet season and the predominantly convective events of the early wet season as a trigger for flash floods have not been previously studied. These distinct patterns do, however, corroborate the differences observed by local communities as reported in the FGDs held.
4.4 Linking local and scientific knowledge about flash flooding in Karonga District
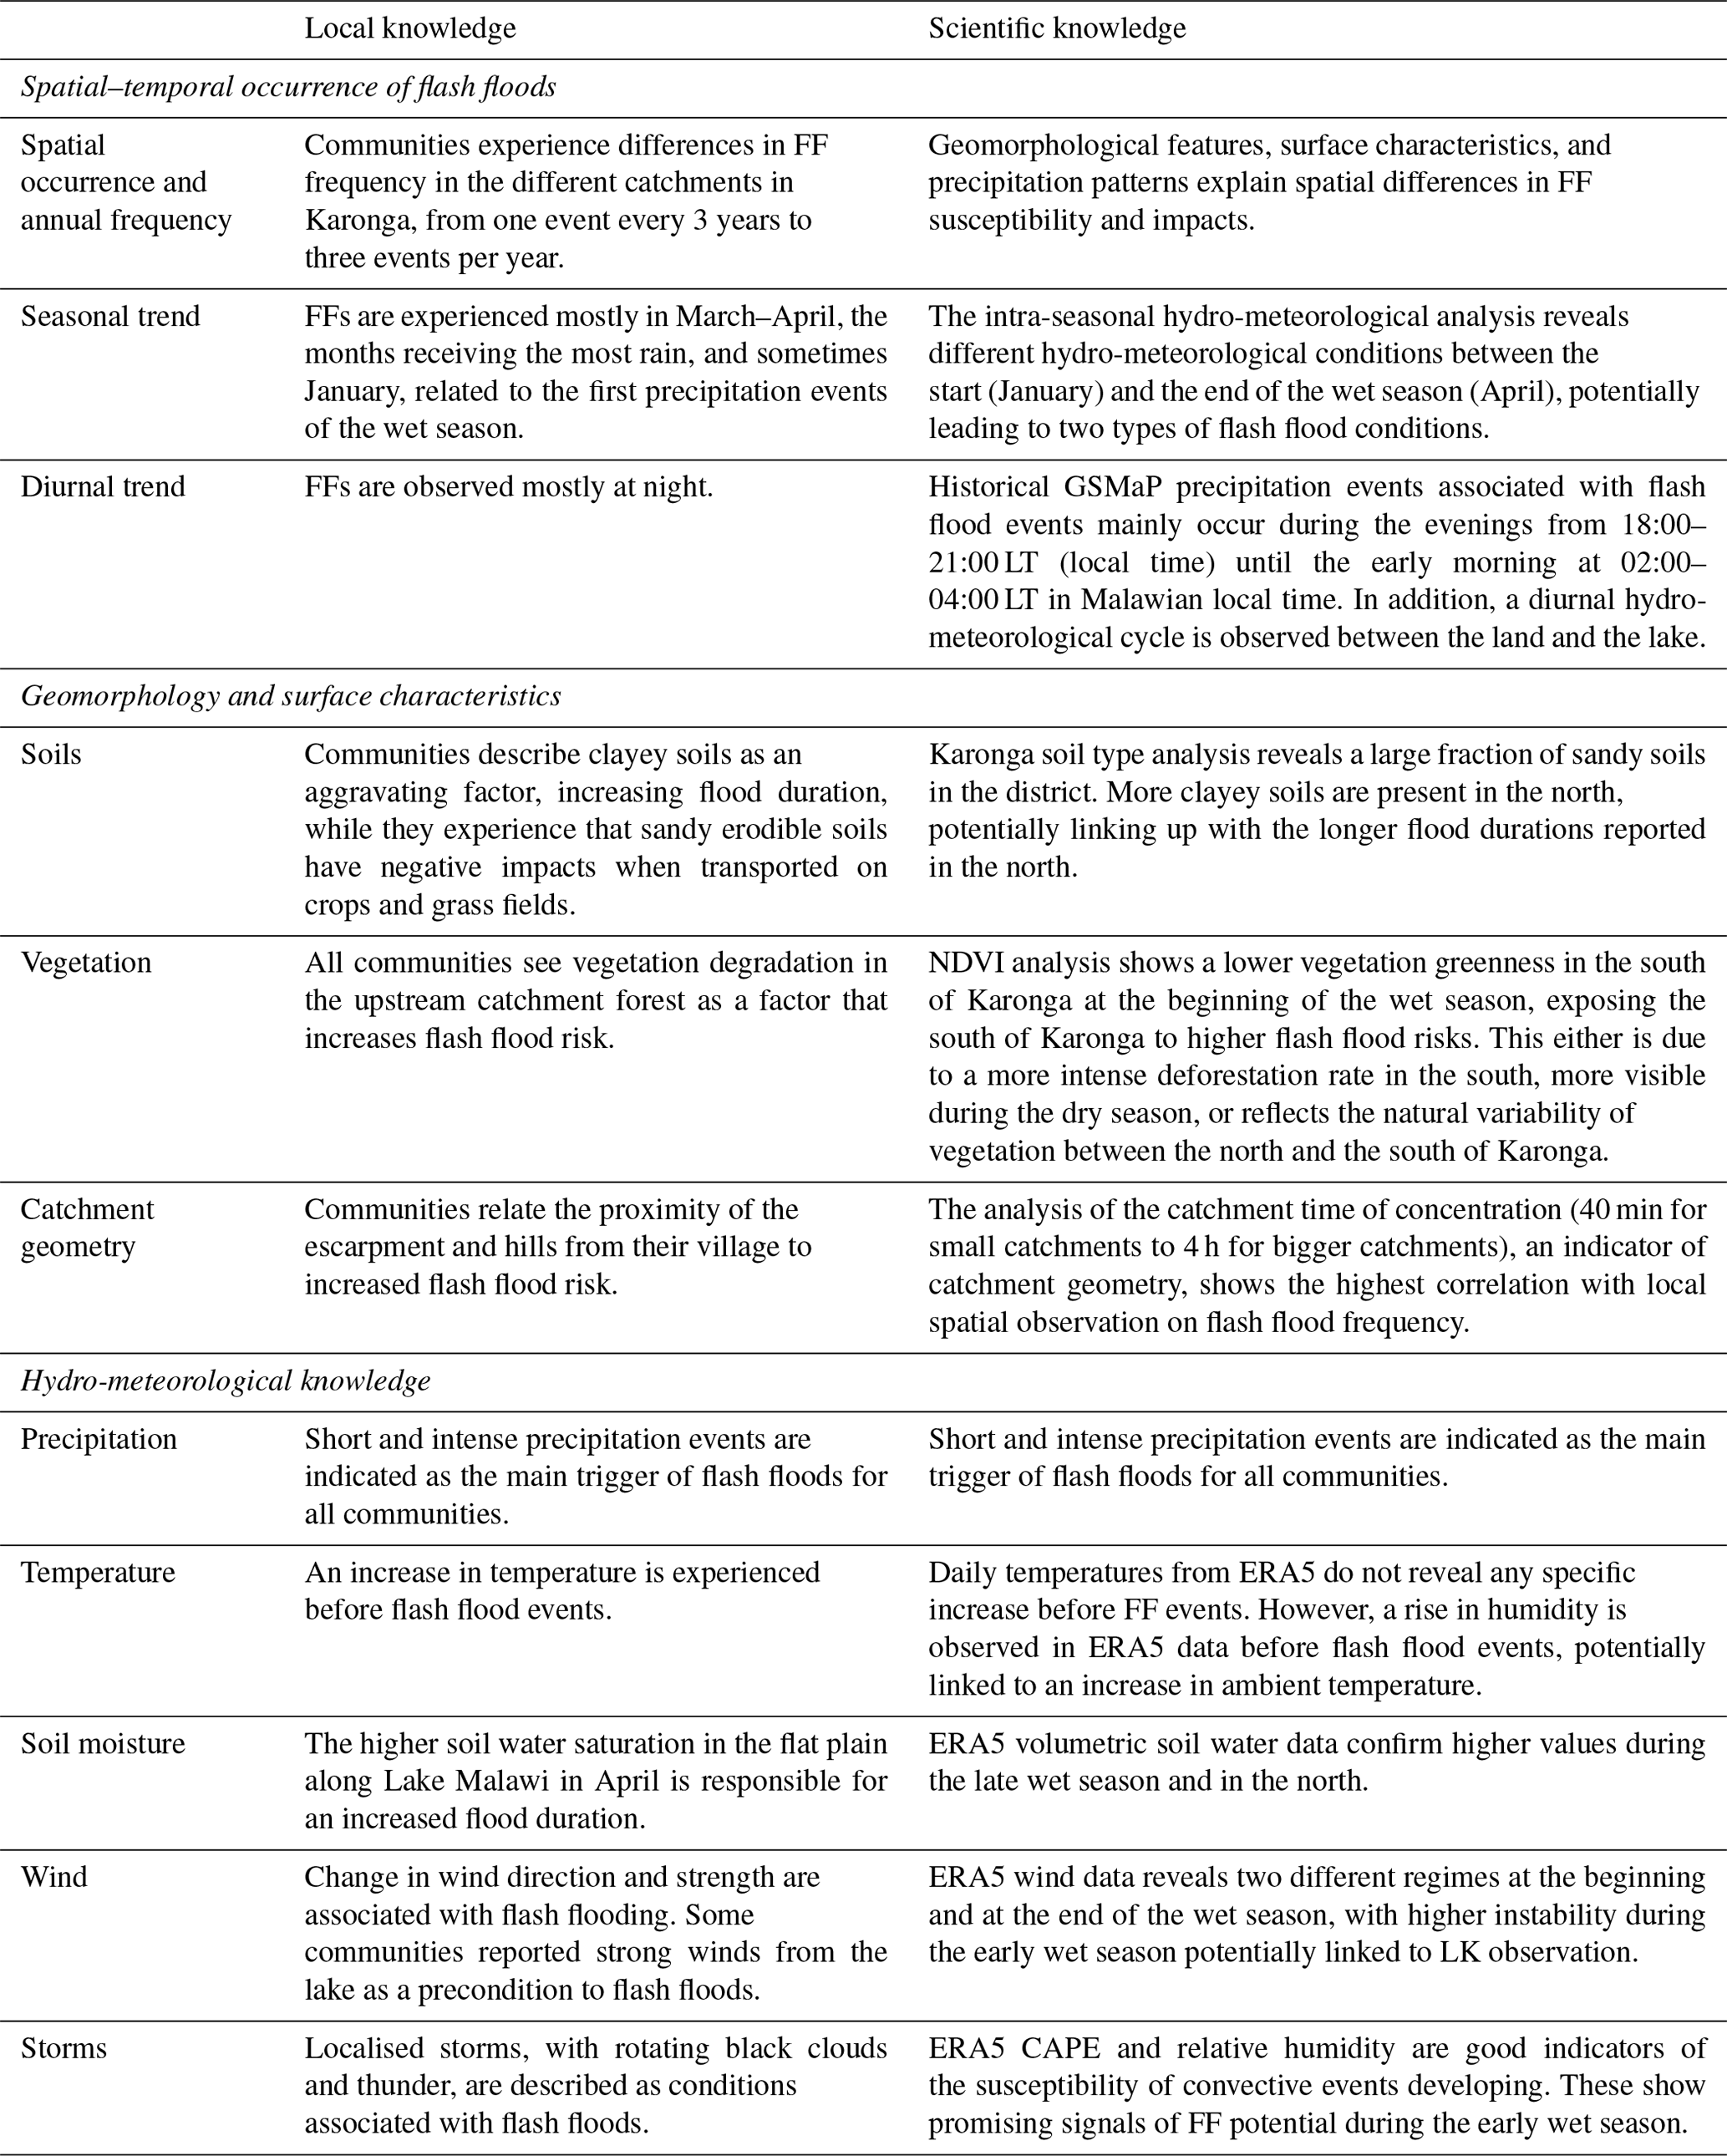
The local knowledge of the communities in Karonga District about the conditions that lead to flash floods, which we obtained through the FGDs and supported by the KIIs, was used to guide the diagnosis of scientific data in the exploration of the factors contributing to flash flood risk in northern Malawi. In this section we synthesise this local knowledge and explain how the scientific diagnosis corroborates local knowledge. Table 3 shows the results for the three main themes of analysis (left column), linking the local to scientific knowledge (middle and right columns, respectively).
Table 3Synthesis of the local and scientific knowledge on flash flooding in northern Malawi. FF: flash flood. LK: local knowledge.
5.1 Validating local knowledge in predictions of flash floods
Karonga District, as well as more generally most countries in southern Africa, lacks the availability of high-resolution quantitative precipitation forecasts and high-resolution hydrological models that provide plausible prediction of flash floods (Hapuarachchi et al., 2011; Braud et al., 2018). Global- and continental-scale flood forecasting systems (Emerton et al., 2016; Alfieri et al., 2018) potentially fill this gap, but the current meteorological and hydrological models these use are too coarse to provide reliable hydrological predictions of flash floods at the scale of catchments susceptible to flash flooding (Emerton et al., 2016; Gründemann et al., 2018), or there are insufficient in situ data to correct bias in forecasts derived from such global systems (Bischiniotis et al., 2018; Lavers et al., 2019). Despite this, our results show that larger-scale patterns that are identified to be linked to the occurrence of flash floods in Karonga District based on local knowledge can be discerned in the coarser global-scale models and remote sensing datasets. This highlights the opportunity of local knowledge in helping bridge the temporal- and spatial-scale gap (Plotz et al., 2017) and in deriving flash flood warnings by interpreting forecasts of larger-scale patterns associated with flash floods in the district using indicators that reflect local knowledge. Plotz et al. (2017) propose two approaches to combining local and scientific knowledge in forecasts: a consensus forecast approach and a science integration approach that validates the accuracy of forecasts based on local knowledge using scientific data. Following the second approach, we extract the identified indicators of the critical hydro-meteorological conditions associated with the 18 flash flood events recorded in Karonga and use a simple model to test the predictability of the binary occurrence of flash floods in the Karonga District. The two indicators derived from ERA5 found to be the best predictors of conditions that may lead to a flash flood are the maximum hourly peak in the CAPE in the 3 d before an event and the maximum hourly relative humidity of the troposphere 1 d before the flash flood. The latter indicator was found to be a good predictor in the early wet season only, confirming that in this period flash floods are primarily induced by convective storms. Conversely, antecedent rainfall conditions are found to have more predictive potential during the late wet season, particularly for the catchments in the north. We explore the predictability of the binary occurrence of the observed flash flood events with these simple indicators at three spatial scales: (i) at the scale of predicting the flash flood events in each catchment, (ii) at the scale of predicting a flash occurring in the north and or in the south of Karonga District, and (iii) at the scale of predicting the occurrence of flash flood events in the district as a whole. Clearly the sample size is small, particularly for predictions of flash floods occurring in individual catchments. Our results show there is little skill in the prediction of flash floods at the scale of the individual catchments, as the reasonably high probability of detection (POD) is complemented by a high probability of false detection (POFD). However, skill improved markedly in predicting the binary occurrence of flash floods when pooling warnings for either the northern or southern catchments and further still at the scale of the district as a whole (see Sect. 5.1 in the Supplement). These results underscore the complexity of predicting the occurrence of flash floods in triggering warnings at the local scale, particularly using coarser global datasets in the absence of available high-resolution observational data and numerical weather predictions. Despite this difficulty of providing predictions at the very local scale, the results do highlight the potential these datasets have in providing guidance on the occurrence of flash floods in the district. Predictions of the likely occurrence of a flash flood event, either differentiated to the north or south of the district or in the district as a whole, could be translated to flash flood guidance in the individual catchments based on the knowledge of the communities of the relative susceptibility of each of the catchments in the district and predicted large-scale meteorological conditions. This approach is in principle similar to differentiated rainfall thresholds derived to support flash flood guidance statements such as those used in the Southern Africa Region Flash Flood Guidance (SARFFG) system developed in collaboration with the Malawian Department of Climate Change and Meteorological Services (DCCMS) (Jubach and Sezin Tokar, 2016) but differs as it differentiates catchments based on local knowledge, corroborated by the scientific assessment of catchment flash flood susceptibility. We argue that this contributes to more effective dissemination of guidance on the potential occurrence of flash floods, as it considers the knowledge and perceptions of the recipients.
Although our sample size of 14 KIIs and 6 guided FGDs with 7 to 11 persons allowed us to capture the diversity of local knowledge in the area, we cannot say data saturation was fully reached. Most likely a larger sample size of FGDs would have allowed for a further in-depth spatial characterisation of local knowledge and shed light on minor discrepancies such as why communities considered the Kasisi catchment to be more susceptible than the Sabi catchment, despite the contrary being suggested by the geomorphological characteristics. Nevertheless, the validation of the local knowledge obtained through the FGDs and KIIs evidences the complementarity of local and scientific knowledge, even with the coarse-scale global datasets explored here, implying the potential of blending these to provide effective early warning of flash floods.
5.2 Combining local and scientific knowledge toward people-centred early warning systems
None of the communities we interviewed in Karonga District had access to a formal warning before recent events, based on their knowledge of neither the hydro-meteorological conditions they recognise as possible precursors to flash floods nor guidance from SARFFG issued through the DCCMS. Given the knowledge of the communities of the catchments most susceptible to flash floods and the hydro-meteorological conditions that may lead to flash flood events and that these conditions can be identified in large-scale hydro meteorological datasets such as ERA5, there is clear potential in combining this information into a form of a consensus warning (Plotz et al., 2017) of elevated flash flood risk in the district. Developing warning messages that visualise the indicators that are understood by the recipients of the warnings can contribute to the credibility of these warnings, helping close the “usability” gap (Vincent et al., 2020) and foster two-way communication between observations of the communities and warning provision (O'Sullivan et al., 2012; Basher, 2006). The taking of protective action by recipients of warning messages, if indeed these are received, depends on several factors, including understanding, trust in the provider of warnings, ownership, and personal and contextual relevance (Parker et al., 2009; Molinari and Handmer, 2011; Salit et al., 2013). Shah et al. (2012) found that confirmation of the warning content through the observation of visual cues in their environment that confirmed the warning content contributes to the taking of protective actions by recipients. Additional research is needed on how to combine local knowledge and community observations with the scientific forecast information in the provision of warnings to communities such as those in Karonga, as carefully designed warning content and the dissemination and communication of methods is required. This design should also acknowledge other signs communities recognise as precursors to flash flood events which were reported in the FGDs, such as in animal and plant behaviour. In Karonga, groups of big black phanga birds flying fast towards the mountains, ant movements, and the presence of butterflies are indigenous signs associated with imminent heavy rains, while frog noises are often heard the night before a flood. The community of the village of Mwenelupembe also said they perceived a change in vegetation colour, turning deep green before the flood. Such careful design is also relevant to avoid diminishing response and trust due to a high false-alarm rate as a result of forecast overconfidence (Morss et al., 2016). Though not extensively explored in the FGD we held with communities, elderly people described an intensification of rain events and a change in meteorological patterns, making the forecasts based on local knowledge more difficult. This reflects observations made by participants in the research of Šakić Trogrlić et al. (2019) in the lower Shire River basin in Malawi, who saw the manifestation of climate change through a change in rainfall patterns, which negatively influenced the reliability of local indicators. Rising temperatures in southern Africa as a consequence of climate change are consistently projected, as are changes to precipitation patterns, though the projections of how precipitation will change are less certain (Engelbrecht et al., 2015). Further research will be needed to understand if and how local knowledge will adapt under climate change. Improved forecast information provided by global forecasting systems, including through integration of local hydro-meteorological observations (Lavers et al., 2019), as well as improved interpretation of these forecasts at regional level (Jubach and Sezin Tokar, 2016), could contribute to reducing false-alarm rates.
Using social-science-based methods and secondary data sources, we document the knowledge that communities have on the occurrence and impacts of flash floods in Karonga District in northern Malawi. Thematic analysis of the transcriptions from focus group discussions with communities and key informant interviews with local and national experts revealed which catchments communities identify as susceptible to flash flooding, as well as the hydro-meteorological signs they recognise as precursors to flash flood events. This local knowledge was used to guide scientific analysis of the susceptibility of flash floods in catchments identified as flash flood prone by the communities, as well as the hydro-meteorological conditions prior to and during documented flash flood events extracted from coarse-scale globally available models and datasets.
The local knowledge of the communities, documented through the focus group discussion and key informant interviews, shows that there is well-developed knowledge of the occurrence of flash floods in the district, including which catchments are more susceptible to flash flooding and the factors that may aggravate susceptibility. There is also well-developed knowledge of the hydro-meteorological conditions they consider precursors to flash flood events. Interestingly, the communities identified differences in flash flood events and the impacts these have across the district, including the different characteristics of flash flood events occurring in the early wet season and in the late wet season. Integrating this local knowledge with secondary data of flash floods and their impacts in the district contributed to developing a common baseline of the knowledge and perspectives of the spatial and temporal occurrence of flash floods and their triggers in northern Malawi.
Our geomorphological analysis of the catchments, based on the geometric attributes and indicators extracted from SRTM DEM data, the normalised difference vegetation index (NDVI) from the Copernicus Global Land Service, and national soil and land-cover datasets, corroborates the variability of flash flood susceptibility of the catchments in the district described by the communities. Similarly, indicators of the hydro-meteorological conditions and patterns extracted from GSMaP satellite precipitation estimates and ERA5 global reanalysis datasets validate the precursor signs communities report, including the different characteristics of events across the district and across the wet season. This demonstrates that flash floods happen the way people say, as well as how local knowledge can be used to guide and validate scientific analysis.
Through combining the local knowledge and the scientific analysis of hydro-meteorological conditions and geomorphological patterns, we developed a common understanding of flash floods in northern Malawi. We identified that the occurrence of flash floods and their impacts differ both spatially and temporally. The analysis suggests that flash floods in the south of Karonga District are mostly triggered by localised convective storms, aggravated by lower vegetation cover, while flash floods in the north of the district are triggered by longer duration orographic rainfall, also extending later into the wet season, with events lasting longer due to the lower infiltration rate. This common understanding of flash flooding is developed through a bottom-up approach that starts from the risk knowledge and interpretation of communities affected by flash floods and guides the analysis of geomorphological and hydro-meteorological conditions. This holds significant potential in developing a more people-centred early warning of flash floods in those areas of the world where high-resolution forecast data may not be available. Though warnings triggered by indicators extracted from the global datasets used here result in overconfident forecasts, our results highlight the potential these datasets have, even at the local scale. Combining the local and scientific knowledge and understanding, as well as using commonly understood cues, will lead to better efficiency in triggering action prior to flash flood events, which is crucial to reduce flash flood impacts in vulnerable communities.
Table A1List of indicators included in the principal component analysis per categories, resulted indicator loading factors, and category weights (a, b, c, and d).

The historical flood impact database of Karonga built for the current research is available on demand. The dataset is restricted to analysis only and cannot yet be published openly, as it contains data entries that are property of the Department of Disaster Management Affair (DoDMA) (https://doi.org/10.5281/zenodo.4661438, Bucherie, 2021).
Codes (as Python scripts) are available on demand.
The supplement related to this article is available online at: https://doi.org/10.5194/nhess-22-461-2022-supplement.
AB conceptualised the project and methodology, curated the data, performed the formal analysis and investigation (field data collection), wrote and prepared the original draft of the paper, and reviewed and edited the paper. MW conceptualised the project and methodology, provided the data extraction code, supervised the project, wrote and prepared the original draft of the paper, and reviewed and edited the paper. MvdH conceptualised the project and methodology, supervised the project, and reviewed and edited the paper. ST administered the project (field campaign organisation), performed the investigation (primary data collection – FGD facilitation), and reviewed the paper.
The contact author has declared that neither they nor their co-authors have any competing interests.
Publisher's note: Copernicus Publications remains neutral with regard to jurisdictional claims in published maps and institutional affiliations.
The field research work was funded by the European Civil Protection and Humanitarian Aid Operations (ECHO) II Enhancing resilience in Malawi programme in Malawi. First of all, we are extremely grateful to the meteorologists Charles Vanya and Victor M. Phiri (from the Malawian Department of Climate Change and Meteorological Services, DCCMS) and Richard Nyoni (from Self Help Africa) for their involvement in the research and confidence in sharing valuable data, information, and experiences of flash flooding in northern Malawi with us. This paper and research would not have been possible without the support of the Malawi Red Cross Society in organising and conducting the field research in Karonga District. We sincerely thank all participants of the focus group discussions and the key informant interviews for their time and enthusiasm to share their valuable knowledge. We also would like to address a special acknowledgement to our Nyasa Times reporter Andrew Mwenelupembe for his dedicated journalistic support in the setting up, facilitation, translation, and transcription of the focus group discussions. Finally, we would like to thank the 510 Global team and particularly Marijke Panis and Aklilu Teklesadik for the valuable technical support and brainstorming discussions, as well as Hans van der Kwast, senior lecturer at IHE Delft, for his QGIS inspiration regarding the hydrology and geomorphology analysis. This research was largely undertaken by the lead author as a part of her MSc studies at IHE Delft.
This paper was edited by Maria-Carmen Llasat and reviewed by two anonymous referees.
Alam, A., Ahmed, B., and Sammonds, P.: Flash flood susceptibility assessment using the parameters of drainage basin morphometry in SE Bangladesh, Quatern. Int., 575–576, 295–307, https://doi.org/10.1016/j.quaint.2020.04.047, 2020. a
Alfieri, L., Burek, P., Dutra, E., Krzeminski, B., Muraro, D., Thielen, J., and Pappenberger, F.: GloFAS – global ensemble streamflow forecasting and flood early warning, Hydrol. Earth Syst. Sci., 17, 1161–1175, https://doi.org/10.5194/hess-17-1161-2013, 2013. a
Alfieri, L., Berenguer, M., Knechtl, V., Liechti, K., Sempere-Torres, D., and Zappa, M.: Flash Flood Forecasting Based on Rainfall Thresholds, in: Handbook of Hydrometeorological Ensemble Forecasting, Springer, 1–38, https://doi.org/10.1007/978-3-642-40457-3_49-1, 2015. a
Alfieri, L., Bisselink, B., Dottori, F., Naumann, G., Roo, A., Salamon, P., Wyser, K., and Feyen, L.: Global projections of river flood risk in a warmer world, Earth's Future, 5, 171–182, https://doi.org/10.1002/2016EF000485, 2017. a
Alfieri, L., Cohen, S., Galantowicz, J., Schumann, G. J. P., Trigg, M. A., Zsoter, E., Prudhomme, C., Kruczkiewicz, A., Coughlan de Perez, E., Flamig, Z., Rudari, R., Wu, H., Adler, R. F., Brakenridge, R. G., Kettner, A., Weerts, A., Matgen, P., Islam, S. A. K. M., de Groeve, T., and Salamon, P.: A global network for operational flood risk reduction, Environ. Sci. Policy, 84, 149–158, https://doi.org/10.1016/j.envsci.2018.03.014, 2018. a, b
Aonashi, K., Awaka, J., Hirose, M., Hozu, T., and Kubota, T.: GSMaP passive, microwave precipitation retrieval algorithm: Algorithm description and validation, J. Meteorol. Soc. Jpn., 87A, 119–136, 2009. a
Arabameri, A., Saha, S., Chen, W., Roy, J., Pradhan, B., and Bui, D. T.: Flash flood susceptibility modelling using functional tree and hybrid ensemble techniques, J. Hydrol., 587, 125007, https://doi.org/10.1016/j.jhydrol.2020.125007, 2020. a
Azmeri, Hadihardaja, I. K., and Vadiya, R.: Identification of flash flood hazard zones in mountainous small watershed of Aceh Besar Regency, Aceh Province, Indonesia, Egypt. J. Remote Sens. Space Sci., 19, 143–160, https://doi.org/10.1016/j.ejrs.2015.11.001, 2016. a, b
Bajabaa, S., Masoud, D. M., and Alamri, N.: Flash flood hazard mapping based on quantitative hydrology, geomorphology and GIS techniques: case study of Wadi Al Lith, Saudi Arabia, Arab. J. Geosci., 7, 2469–2481, https://doi.org/10.1007/s12517-013-0941-2, 2013. a
Basher, R.: Global early warning systems for natural hazards: systematic and people-centred, Philos. T. Roy. Soc. A, 364, 2167–2182, https://doi.org/10.1098/rsta.2006.1819, 2006. a, b
Bischiniotis, K., Van Den Hurk, B., Jongman, B., Coughlan De Perez, E., Veldkamp, T., De Moel, H., and Aerts, J.: The influence of antecedent conditions on flood risk in sub-Saharan Africa, Nat. Hazards Earth Syst. Sci., 18, 271–285, https://doi.org/10.5194/nhess-18-271-2018, 2018. a
Braud, I., Vincendon, B., Anquetin, S., Ducrocq, V., and Creutin, J. D.: The challenges of flash flood forecasting, Mobility in the Face of Extreme Hydrometeorological Events 1: Defining the Relevant Scales of Analysis, Elsevier, 63–88, https://doi.org/10.1016/B978-1-78548-289-2.50003-3, 2018. a, b
Bucherie, A.: Karonga historical flood occurrences and impacts dataset (2000–2018), Zenodo [data set], https://doi.org/10.5281/zenodo.4661438, 2021. a, b
Byers, E., Gidden, M., Leclere, D., Balkovic, J., Burek, P., Ebi, K., Greve, P., Grey, D., Havlik, P., Hillers, A., Johnson, N., Kahil, T., Krey, V., Langan, S., Nakicenovic, N., Novak, R., Obersteiner, M., Pachauri, S., Palazzo, A., Parkinson, S., Rao, N. D., Rogelj, J., Satoh, Y., Wada, Y., Willaarts, B., and Riahi, K.: Global exposure and vulnerability to multi-sector development and climate change hotspots, Environ. Res. Lett., 13, e055012, https://doi.org/10.1088/1748-9326/aabf45, 2018. a
Calvel, A., Werner, M., van den Homberg, M., Cabrera Flamini, A., Streefkerk, I., Mittal, N., Whitfield, S., Langton Vanya, C., and Boyce, C.: Communication Structures and Decision Making Cues and Criteria to Support Effective Drought Warning in Central Malawi, Front. Climate, 2, 578327, https://doi.org/10.3389/fclim.2020.578327, 2020. a
Chao, Y. S. and Wu, C. J.: Principal component-based weighted indices and a framework to evaluate indices: Results from the Medical Expenditure Panel Survey 1996 to 2011, PLoS ONE, 12, e0183997, https://doi.org/10.1371/journal.pone.0183997, 2017. a
Creutin, J. D. and Borga, M.: Radar hydrology modifies the monitoring of flash-flood hazard, Hydrol. Process., 17, 1453–1456, https://doi.org/10.1002/hyp.5122, 2003. a, b
C3S: ERA5: Fifth generation of ECMWF atmospheric reanalyses of the global climate, Copernicus Climate Change Service Climate Data Store, https://cds.climate.copernicus.eu, last access: January 2019. a
Doswell, C. A. and Brooks, H. E.: Flash flood forecasting : An ingredients-based methodology, Weather Forecast., 11, 560–581, https://doi.org/10.1175/1520-0434(1996)011<0560:FFFAIB>2.0.CO;2, 1996. a
Drobot, S. and Parker, D. J.: Advances and challenges in flash flood warnings, Environ. Hazards, 7, 173–178, https://doi.org/10.1016/j.envhaz.2007.09.001, 2007. a, b
EM-DAT: The CRED OFDA International Disaster Database, https://www.emdat.be/, last access: December 2018. a
Emerton, R. E., Stephens, E. M., Pappenberger, F., Pagano, T. C., Weerts, A. H., Wood, A. W., Salamon, P., Brown, J. D., Hjerdt, N., Donnelly, C., Baugh, C. A., and Cloke, H. L.: Continental and global scale flood forecasting systems, WIREs Water, 3, 391–418, https://doi.org/10.1002/wat2.1137, 2016. a, b, c, d
Engelbrecht, F., Adegoke, J., Bopape, M. J., Naidoo, M., Garland, R., Thatcher, M., McGregor, J., Katzfey, J., Werner, M., Ichoku, C., and Gatebe, C.: Projections of rapidly rising surface temperatures over Africa under low mitigation, Environ. Res. Lett., 10, 085004, https://doi.org/10.1088/1748-9326/10/8/085004, 2015. a
Farhan, Y., Anaba, O., and Salim, A.: Morphometric Analysis and Flash Floods Assessment for Drainage Basins of the Ras En Naqb Area, South Jordan Using GIS, J. Geosci. Environ. Protect., 04, 9–33, https://doi.org/10.4236/gep.2016.46002, 2016. a
FloodList: Reporting floods and flooding news since 2008, Funded by Copernicus, the European System for Earth Monitoring, https://floodlist.com/, last access: December 2018. a
Georgakakos, K. P.: A generalized stochastic hydrometeorological model for flood and flash-flood forecasting: 1. Formulation, Water Resour. Res., 22, 2083–2095, https://doi.org/10.1029/WR022i013p02083, 1986. a
Georgakakos, K. P.: Analytical results for operational flash flood guidance, J. Hydrol., 317, 81–103, https://doi.org/10.1016/j.jhydrol.2005.05.009, 2005. a
Gray, D. M.: Interrelationships of watershed characteristics, J. Geophys. Res., 66, 1215–1223, https://doi.org/10.1029/JZ066i004p01215, 1961. a
Gründemann, G. J., Werner, M., and Veldkamp, T. I.: The potential of global reanalysis datasets in identifying flood events in Southern Africa, Hydrol. Earth Syst. Sci., 22, 4667–4683, https://doi.org/10.5194/hess-22-4667-2018, 2018. a
Hapuarachchi, H. A., Wang, Q. J., and Pagano, T. C.: A review of advances in flash flood forecasting, Hydrol. Process., 25, 2771–2784, https://doi.org/10.1002/hyp.8040, 2011. a, b
Hersbach, H., Bell, B., Berrisford, P., Hirahara, S., Horányi, A., Muñoz-Sabater, J., Nicolas, J., Peubey, C., Radu, R., Schepers, D., Simmons, A., Soci, C., Abdalla, S., Abellan, X., Balsamo, G., Bechtold, P., Biavati, G., Bidlot, J., Bonavita, M., De Chiara, G., Dahlgren, P., Dee, D., Diamantakis, M., Dragani, R., Flemming, J., Forbes, R., Fuentes, M., Geer, A., Haimberger, L., Healy, S., Hogan, R. J., Hólm, E., Janisková, M., Keeley, S., Laloyaux, P., Lopez, P., Lupu, C., Radnoti, G., de Rosnay, P., Rozum, I., Vamborg, F., Villaume, S., and Thépaut, J.-N.: The ERA5 global reanalysis, Q. J. Roy. Meteorol. Soc., 146, 1999–2049, https://doi.org/10.1002/qj.3803, 2020. a
Hoeppe, P.: Trends in weather related disasters – Consequences for insurers and society, Weather Clim. Extrem., 11, 70–79, https://doi.org/10.1016/j.wace.2015.10.002, 2015. a
Horton, B. Y. R. E.: Erosional development of streams and their drainage basins; Hydrophysical approach to quantitative morphology, B. Geol. Soci. Am., 56, 275–370, 1945. a
ICA: Malawi Integrated Context Analysis, Tech. rep., WFP, https://documents.wfp.org/stellent/groups/public/documents/communications/wfp264472.pdf (last access: April 2019), 2014. a
IFPRI: IFPRI Key Facts Series: Poverty May 2019 Background to the Integrated Household Surveys (IHS), Tech. Rep., https://www.ifpri.org/publication/ifpri-key-facts-series-poverty last access: June 2019. a
IFRC-GO: Disaster Response and Preparedness Operation Database. International Federation of the Red Cross, https://go.ifrc.org/, last access: December 2018. a
Jarvis, A., Reuter, H., Nelson, A., and Guevara, E.: Hole-filled SRTM for the globe version 3 from the CGIAR-CSI SRTM 90 m database, http://srtm.csi.cgiar.org (last access: December 2018), 2008. a
Javelle, P., Fouchier, C., Arnaud, P., and Lavabre, J.: Flash flood warning at ungauged locations using radar rainfall and antecedent soil moisture estimations, J. Hydrol., 394, 267–274, https://doi.org/10.1016/j.jhydrol.2010.03.032, 2010. a
Jonkman, S. N.: Global Perspectives on Loss of Human Life Caused by Floods, Nat. Hazards, 34, 151–175, https://doi.org/10.1007/s11069-004-8891-3, 2005. a
Jubach, R. and Sezin Tokar, A.: International severe weather and flash flood hazard early warning systems-leveraging coordination, cooperation, and partnerships through a hydrometeorological project in Southern Africa, Water, 8, 1–11, https://doi.org/10.3390/w8060258, 2016. a, b
Karmokar, S. and De, M.: Flash flood risk assessment for drainage basins in the Himalayan foreland of Jalpaiguri and Darjeeling Districts, West Bengal, Model. Earth Syst. Environ., 6, 2263–2289, https://doi.org/10.1007/s40808-020-00807-9, 2020. a
Kauffeldt, A., Wetterhall, F., Pappenberger, F., Salamon, P., and Thielen, J.: Technical review of large-scale hydrological models for implementation in operational flood forecasting schemes on continental level, Environ. Model. Softw., 75, 68–76, https://doi.org/10.1016/j.envsoft.2015.09.009, 2015. a
Kirpich, Z. P.: Time of concentration of small agricultural watersheds, Civ. Eng., 10, 362, 1940. a
Kubota, T., Shige, S., Hashizume, H., Aonashi, K., Takahashi, N., Ushio, T., and Kachi, M.: Global Precipitation Map using Satelliteborne Microwave Radiometers by the GSMaP Project: Production and Validation, in: International Geoscience and Remote Sensing Symposium (IGARSS), Vol. 45, 2259–2275, https://doi.org/10.1109/IGARSS.2006.668, 2007. a
Lavers, D. A., Harrigan, S., Andersson, E., Richardson, D. S., Prudhomme, C., and Pappenberger, F.: A vision for improving global flood forecasting, Environ. Res. Lett., 14, 121002, https://doi.org/10.1088/1748-9326/ab52b2, 2019. a, b
Lefale, P. F.: Ua 'afa le Aso Stormy weather today: Traditional ecological knowledge of weather and climate. The Samoa experience, Climatic Change, 100, 317–335, https://doi.org/10.1007/s10584-009-9722-z, 2010. a
Linsey, R. K., Kohler, M. A., and Pauhlus, J. L. H.: Hydrology for engineers, 3rd Edn., McGraw-Hill, New York, https://www.mendeley.com/catalogue/b109a1db-5807-34e5-a767-03b2b5852b9c/?utm_source=desktop&utm_medium=1.19.8&utm_campaign=open_catalog&userDocumentId={c4e049fe-b229-4203-a6be-2f3690382903}, (last access: February 2022), 1982. a
Luther, J., Hainsworth, A., Tang, X., Harding, J., Torres, J., and Fanchiotti, M.: Advancing Culture of Living with Landslides, volume 1 ISDR-ICL Sendai Partnerships 2015–2025, Adv. Cult. Liv. Landslide., https://doi.org/10.1007/978-3-319-59469-9, 2017. a
Martin, N. and Rice, J.: Emergency communications and warning systems, Disast. Prevent. Manage., 21, 529–540, https://doi.org/10.1108/09653561211278671, 2012. a
McSweeney, C., New, M., and Lizcano, G.: The UNDP Climate Change Country Profiles, B. Am. Meteorol. Soc., 91, 157–166, https://doi.org/10.1175/2009BAMS2826.1, 2010. a
Meléndez-Landaverde, E. R., Werner, M., and Verkade, J.: Exploring protective decision-making in the context of impact-based flood warnings, J. Flood Risk Manage., 13, 1–11, https://doi.org/10.1111/jfr3.12587, 2020. a
Melton, M. A.: An analysis of the relations among elements of climate, surface properties, and geomorphology, Office of Naval Research Technical Report No. 11, https://doi.org/10.7916/d8-0rmg-j112, 1957. a
Miller, V. C.: A quantitative geomorphic study of drainage basin characteristics in the Clinch Mountain area, Virginia and Tennessee, Dept. of Geology, Columbia University, New York, 389–402, https://www.worldcat.org/title/quantitative-geomorphic-study-of-drainage-basin-characteristics (last access: February 2022), 1953. a
Molinari, D. and Handmer, J.: A behavioural model for quantifying flood warning effectiveness, J. Flood Risk Manage., 4, 23–32, https://doi.org/10.1111/j.1753-318X.2010.01086.x, 2011. a
Morss, R. E., Demuth, J. L., Lazo, J. K., Dickinson, K., Lazrus, H., and Morrow, B. H.: Understanding public hurricane evacuation decisions and responses to forecast and warning messages, Weather Forecast., 31, 395–417, https://doi.org/10.1175/WAF-D-15-0066.1, 2016. a
Munich RE: NatCatSERVICE disaster database, https://www.munichre.com/en/solutions/for-industry-clients/natcatservice.html (last access: December 2018), 2004. a
Nicholson, S. E., Klotter, D., and Chavula, G.: A detailed rainfall climatology for Malawi, Southern Africa, Int. J. Climatol., 34, 315–325, 2014. a
Nyasa Times: Malawi breaking online news, https://www.nyasatimes.com/, last access: March 2019. a
Okamoto, K., Ushio, T., and Iguchi, T.: The Global Satellite Mapping of Precipitation (GSMaP) project, in: 25th IGARSS Proceedings, 5, 3414–3416, https://doi.org/10.1109/IGARSS.2005.1526575, 2005. a
Orlove, B., Roncoli, C., Kabugo, M., and Majugu, A.: Indigenous climate knowledge in southern Uganda: The multiple components of a dynamic regional system, Climatic Change, 100, 243–265, https://doi.org/10.1007/s10584-009-9586-2, 2010. a
Oruonye, E.: Morphometry and Flood in Small Drainage Basin: Case Study of Mayogwoi River Basin in Jalingo, Taraba State Nigeria, J. Geogr. Environ. Earth Sci. Int., 5, 1–12, https://doi.org/10.9734/jgeesi/2016/23379, 2016. a
O'Sullivan, J. J., Bradford, R. A., Bonaiuto, M., De Dominicis, S., Rotko, P., Aaltonen, J., Waylen, K., and Langan, S. J.: Enhancing flood resilience through improved risk communications, Nat. Hazards Earth Syst. Sci., 12, 2271–2282, https://doi.org/10.5194/nhess-12-2271-2012, 2012. a
Parker, D. J., Priest, S. J., and Tapsell, S. M.: Understanding and enhancing the public's behavioural response to flood warning information, Meteorol. Appl., 16, 103–114, https://doi.org/10.1002/met.119, 2009. a
Patton, P. C. and Baker, V. R.: Morphometry and floods in small drainage basins subject to diverse hydrogeomorphic controls, Water Resour. Res., 12, 941–952, https://doi.org/10.1029/WR012i005p00941, 1976. a, b
Perera, D., Seidou, O., Agnihotri, J., Mehmood, H., and Mohamed Rasmy, A. W.: Challenges and Technical Advances in Flood Early Warning Systems (FEWSs), in: Flood Impact Mitigation and Resilience Enhancement, Intechopen, 1–18, https://doi.org/10.5772/intechopen.93069, 2020. a
Pham, B. T., Avand, M., Janizadeh, S., Phong, T. V., Al-Ansari, N., Ho, L. S., Das, S., Le, H. V., Amini, A., Bozchaloei, S. K., Jafari, F., and Prakash, I.: GIS based hybrid computational approaches for flash flood susceptibility assessment, Water, 12, 683, https://doi.org/10.3390/w12030683, 2020. a
Plotz, R. D., Chambers, L. E., and Finn, C. K.: The best of both worlds: A decision-making framework for combining traditional and contemporary forecast systems, J. Appl. Meteorol. Clim., 56, 2377–2392, https://doi.org/10.1175/JAMC-D-17-0012.1, 2017. a, b, c, d
Poolman, E., Rautenbach, H., and Vogel, C.: Application of probabilistic precipitation forecasts from a deterministic model towards increasing the lead-time of flash flood forecasts in South Africa, Water SA, 40, 729, https://doi.org/10.4314/wsa.v40i4.18, 2014. a
ReliefWeb: Humanitarian information service, Provided by the United Nations Office for the Coordination of Humanitarian Affairs (OCHA), https://reliefweb.int/disasters, last access: March 2019. a
Rogelis, M. C. and Werner, M.: Regional debris flow susceptibility analysis in mountainous peri-urban areas through morphometric and land cover indicators, Nat. Hazards Earth Syst. Sci., 14, 3043–3064, https://doi.org/10.5194/nhess-14-3043-2014, 2014. a, b
Roujean, J. L., Leon-Tavares, J., Smets, B., Claes, P., Camacho De Coca, F., and Sanchez-Zapero, J.: Surface albedo and toc-r 300 m products from PROBA-V instrument in the framework of Copernicus Global Land Service, Remote Sens. Environ., 215, 57–73, https://doi.org/10.1016/j.rse.2018.05.015, 2018. a
Sai, F., Cumiskey, L., Weerts, A., Bhattacharya, B., and Haque Khan, R.: Towards impact-based flood forecasting and warning in Bangladesh: a case study at the local level in Sirajganj district, Nat. Hazards Earth Syst. Sci. Discuss. [preprint], https://doi.org/10.5194/nhess-2018-26, 2018. a
Šakić Trogrlić, R., Wright, G., Duncan, M., van den Homberg, M., Adeloye, A., Mwale, F., and Mwafulirwa, J.: Characterising Local Knowledge across the Flood Risk Management Cycle: A Case Study of Southern Malawi, Sustainability, 11, 6, https://doi.org/10.3390/su11061681, 2019. a, b, c
Salit, F., Zaharia, L., and Beltrando, G.: Assessment of the warning system against floods on a rural area: the case of the lower Siret River (Romania), Nat. Hazards Earth Syst. Sci., 13, 409–416, https://doi.org/10.5194/nhess-13-409-2013, 2013. a
Schumm, S. A.: Evolution of drainage systems and slopes in badlands at Perth Amboy, New Jersey, GSA Bull., 67, 597–646, https://doi.org/10.1130/0016-7606(1956)67[597:EODSAS]2.0.CO;2, 1956. a, b, c
Shah, M. A. R., Douven, W., Werner, M., and Leentvaar, J.: Flood warning responses of farmer households: a case study in Uria Union in the Brahmaputra flood plain, Bangladesh, J. Flood Risk Manage., 5, 258–269, https://doi.org/10.1111/j.1753-318X.2012.01147.x, 2012. a
Smith, G.: Flash Flood potential: determining the hydrologic response of FFMP basins to heavy rain by analysing their physiographic characteristics, A white paper available from the NWS Colorado Basin River Forecast Center web site at http://www.cbrfc.noaa.gov/papers/ffp_wpap.pdf (last access: July 2021), 2003. a, b, c, d
Strahler, A. N.: Quantitative analysis of watershed geomorphology, Eos Trans. Am. Geophys. Union, 38, 913–920, https://doi.org/10.1029/TR038i006p00913, 1957. a
The Nation: Nation Publications Limited (NPL) Newspaper, https://www.mwnation.com/, last access: March 2019. a
The University Corporation for Atmospheric Research and SENAMI-Cusco: Flash Flood Early Warning System Reference Guide, Flash Flood Early Warning System Reference Guide, COMET – NOAA Report, http://www.meted.ucar.edu/communities/hazwarnsys/ffewsrg/FF_EWS.pdf (last access: March 2019), 2010. a
Tincu, R., Lazar, G., and Lazar, I.: Modified flash flood potential index in order to estimate areas with predisposition to water accumulation, Open Geosci., 10, 593–606, https://doi.org/10.1515/geo-2018-0047, 2018. a, b, c
Tong, A., Sainsbury, P., and Craig, J.: Consolidated criteria for reporting qualitative research (COREQ): a 32-item checklist for interviews and focus groups, Int. J. Qual. Health Care, 19, 349–357, https://doi.org/10.1093/intqhc/mzm042, 2007. a
UNICEF: UNICEF Malawi blog, https://unicefmalawi.blog/, last access: March 2019. a
UNISDR: Sendai framework for disaster risk reduction 2015–2030, Tech. rep., United Nations International Strategy for Disaster Reduction, http://www.wcdrr.org/uploads/Sendai_Framework_for_Disaster_Risk_Reduction_2015-2030.pdf (last access: July 2021), 2015. a
USAID: Conducting Key Informant Interviews, in: Performance Monitoring & Evaluation TIPS, Tech. rep., Center for Development Information and Evaluation, Washington, DC, https://pdf.usaid.gov/pdf_docs/PNABS541.pdf (last access: July 2021), 1996. a
Vincent, K., Conway, D., Dougill, A. J., Pardoe, J., Archer, E., Bhave, A. G., Henriksson, R., Mittal, N., Mkwambisi, D., Rouhaud, E., and Tembo-Nhlema, D.: Re-balancing climate services to inform climate-resilient planning – A conceptual framework and illustrations from sub-Saharan Africa, Clim. Risk Manage., 29, 100242, https://doi.org/10.1016/j.crm.2020.100242, 2020. a, b
Werner, M. and Cranston, M.: Understanding the Value of Radar Rainfall Nowcasts in Flood Forecasting and Warning in Flashy Catchments, Meteorol. Appl., 16, 41–55, https://doi.org/10.1002/met.125, 2009. a
WMO: WMO Guidelines on Multi-hazard Impact-based Forecast and Warning Services, Tech. rep., https://library.wmo.int/doc_num.php?explnum_id=7901 (last access: July 2021), 2015. a, b
WMO: Multi-hazard Early Warning Systems: A Checklist, Outcome of the first Multi-hazard Early Warning Conference 22 to 23 May, p. 20, https://library.wmo.int/doc_num.php?explnum_id=4463 (last access: July 2021), 2018. a, b
Zevenbergen, L. W. and Thorne, C. R.: Quantitative analysis of land surface topography, Earth Surf. Proc. Land., 12, 47–56, https://doi.org/10.1002/esp.3290120107, 1987. a
Zogg, J. and Deitsch, K.: The Flash Flood Potential Index at WFO Des Moines, Iowa – NOAA – NWS, Tech. rep., http://www.crh.noaa.gov/Image/dmx/hydro/FFPI/FFPI_WriteUp.pdf (last access: June 2019), 2013. a