the Creative Commons Attribution 4.0 License.
the Creative Commons Attribution 4.0 License.
 | 22 Dec 2022
Equivalent hazard magnitude scale
Antonia Sebastian
Hazard magnitude scales are widely adopted to facilitate communication regarding hazard events and the corresponding decision making for emergency management. A hazard magnitude scale measures the strength of a hazard event considering the natural forcing phenomena and the severity of the event with respect to average entities at risk. However, existing hazard magnitude scales cannot be easily adapted for comparative analysis across different hazard types. Here, we propose an equivalent hazard magnitude scale to measure the hazard strength of an event across multiple types of hazards. We name the scale the Gardoni Scale after Professor Paolo Gardoni. We design the equivalent hazard magnitude on the Gardoni Scale as a linear transformation of the expectation of a measure of adverse impact of a hazard event given average exposed value and vulnerability. With records of 12 hazard types from 1900 to 2020, we demonstrate that the equivalent magnitude can be empirically derived with historical data on hazard magnitude indicators and records of event impacts. In this study, we model the impact metric as a function of fatalities, total affected population, and total economic damage. We show that hazard magnitudes of events can be evaluated and compared across hazard types. We find that tsunami and drought events tend to have large hazard magnitudes, while tornadoes are relatively small in terms of hazard magnitude. In addition, we demonstrate that the scale can be used to determine hazard equivalency of individual historical events. For example, we compute that the hazard magnitude of the February 2021 North American cold wave event affecting the southern states of the United States of America was equivalent to the hazard magnitude of Hurricane Harvey in 2017 or a magnitude 7.5 earthquake. Future work will expand the current study in hazard equivalency to modelling of local intensities of hazard events and hazard conditions within a multi-hazard context.
- Article
(9039 KB) - Full-text XML
-
Supplement
(21990 KB) - BibTeX
- EndNote


Natural hazards pose significant challenges to human societies around the world. Between 2000 and 2020, natural hazard events caused over USD 130 billion in losses and 64 695 fatalities, and they affected more than 196 million people on average each year (Guha-Sapir et al., 2021). Hazardous events, such as earthquakes, floods, and forest fires, can inflict heavy losses on communities when people and property are exposed to the natural forces of these events. The impacts of events, whatever their type, can be quantified directly (e.g. by financial loss; Hillier et al., 2015) or estimated on a scale. To estimate the impacts of an event with the consideration of its hazard strength, various impact scales have been proposed, including the Bradford disaster scale (Keller et al., 1992, 1997), unified localizable crisis scale (Rohn and Blackmore, 2009, 2015), disaster impact index (Gardoni and Murphy, 2010), and cascading disaster magnitude (Alexander, 2018). However, a hazard strength scale is not the same as a hazard impact scale, as impacts are also driven by the exposure and vulnerability of entities, such as individuals, communities, and infrastructures, to an event. This makes it difficult to use impact scales to compare hazard strengths across natural hazard types. For example, the 2011 Christchurch earthquake was one of the most destructive earthquakes in New Zealand, albeit with a medium hazard strength of 6.2 in terms of its moment magnitude (Kaiser et al., 2012). Meanwhile, the 1964 Alaskan earthquake, with a larger moment magnitude of 9.2, resulted in fewer casualties and less economic damage than the Christchurch earthquake (USGS, 2021).
Hazard scientists have long called for separation of natural forcing phenomena (Bensi et al., 2020) from the study of disasters to better understand the causes of impacts rooted in the social and economic fabric of entities exposed to natural hazards (e.g. O'Keefe et al., 1976; Wisner et al., 2004). In this regard, quantifying hazard strength helps separate the natural force from other social, environmental, and engineering or built environmental factors that may drive impacts. Yet, despite the large volume of research that focuses on hazard strength for singular natural hazard types such as earthquake (e.g. Wood and Neumann, 1931; Richter, 1935; Kanamori, 1977; Katsumata, 1996; Grünthal, 1998; Wald et al., 2006; Rautian et al., 2007; Serva et al., 2016), tropical cyclone (e.g. Simpson and Saffir, 1974; Bell et al., 2000; Emanuel, 2005; Powell and Reinhold, 2007; Hebert et al., 2008), tornado (e.g. Fujita, 1971, 1981; Meaden et al., 2007; Potter, 2007; Dotzek, 2009), and drought (e.g. Palmer, 1965, 1968; Shafer and Dezman, 1982; McKee et al., 1993; Byun and Wilhite, 1999; Shukla and Wood, 2008; Hunt et al., 2009), few have quantified or modelled hazard strengths across multiple hazard types.
To quantify hazard strengths for cross-hazard comparison, impacts can be used to explore similarities between multiple hazards (e.g. Hillier et al., 2015; Hillier and Dixon, 2020). As an example, insurance professionals often leverage loss metrics to understand the relative significance of various hazards (see, e.g. Mitchell-Wallace et al., 2017). Such cross-hazard practices of risk aggregation and accumulation are intentionally focused on the exposed values and observed impacts, rather than hazard strengths. In contrast, risk quantification for nuclear facilities requires consideration of hazard strengths across multiple hazard types to facilitate probabilistic safety assessment within a multi-hazard context (see, e.g. Choi et al., 2021). Indices regarding hazard strengths have also been created and adopted for extreme meteorological events across multiple hazard types (see, e.g. Malherbe et al., 2020). When quantifying hazard strengths within a multi-hazard context, a calibration of hazard strength to the expectation of impact may be used to create impact-based proxies for hazard strengths, linking two extremes and allowing them to be studied in a way that is relevant to risk assessment and yet decoupled from the detail of exposed values and vulnerability (Hillier et al., 2020). Nevertheless, there is not yet a general metric that facilitates the comparison of events of different hazard types in terms of potential to cause damage in a way that is as decoupled as possible from exposed values and vulnerability.
To enable evaluation of event-wise hazard strengths across different hazard types, in this article, we propose a multi-hazard equivalent hazard magnitude scale – the Gardoni Scale – for natural hazards. The proposed scale is named in honour of the Alfredo H. Ang Family Professor Paolo Gardoni at the University of Illinois at Urbana–Champaign. Because hazard strength is correlated with hazard impacts given average exposed value and vulnerability of considered entities, the expectation of a metric of observed impacts of hazard events can be used to calibrate models for deriving equivalent hazard magnitudes (Hillier et al., 2015; Hillier and Dixon, 2020; Wang and Sebastian, 2022). In this article, a quantitative modelling methodology based on a principal component analysis (PCA) and a set of linear regressions is developed to construct the impact metric and derive equivalent hazard magnitudes on the Gardoni Scale. The impact metric is a function of three impact variables, i.e. fatality, total affected population, and total damage in 2019 USD. We use historical event data from the EM-DAT international disaster database (Guha-Sapir et al., 2021) from 1900 to 2020 to calibrate the quantitative models. To demonstrate the value of the proposed scale, we apply it to discuss the equivalent magnitudes of historical and recent hazard events.
The subsequent sections are organized as follows. First, we provide a brief theoretical background for this study. We then introduce our methodology, including data processing, to derive the equivalent hazard magnitude on the Gardoni Scale. Next, we describe the results of applying our methodology and compare natural hazard types regarding the derived equivalent hazard magnitudes. Finally, we discuss the potential contributions and limitations of the proposed scale before concluding the article.
In natural hazards research, theoretical frameworks are often based on basic concepts, such as hazard, impact, exposure, vulnerability, recovery, and resilience, that have overlapping or discipline-specific definitions (see, e.g. Klijn et al., 2015). These inconsistencies across disciplines often result in confusion in quantitative modelling. Herein, the impacts of an event are the result of strength of the hazard agent, value of entities exposed to the event, and vulnerability of the exposed entities to hazard impacts (Nigg and Mileti, 1997; Coburn and Spence, 2002; Wisner et al., 2004; Dilley et al., 2005; McEntire, 2005; Adger, 2006; Peduzzi et al., 2009; Burton, 2010; Lindell, 2013; Birkmann et al., 2014; Highfield et al., 2014; van de Lindt et al., 2020; Wang et al., 2020; Wang and Sebastian, 2021). As shown in Fig. 1, hazard strength of an event is one of the main drivers, albeit not the sole driver, of impacts.
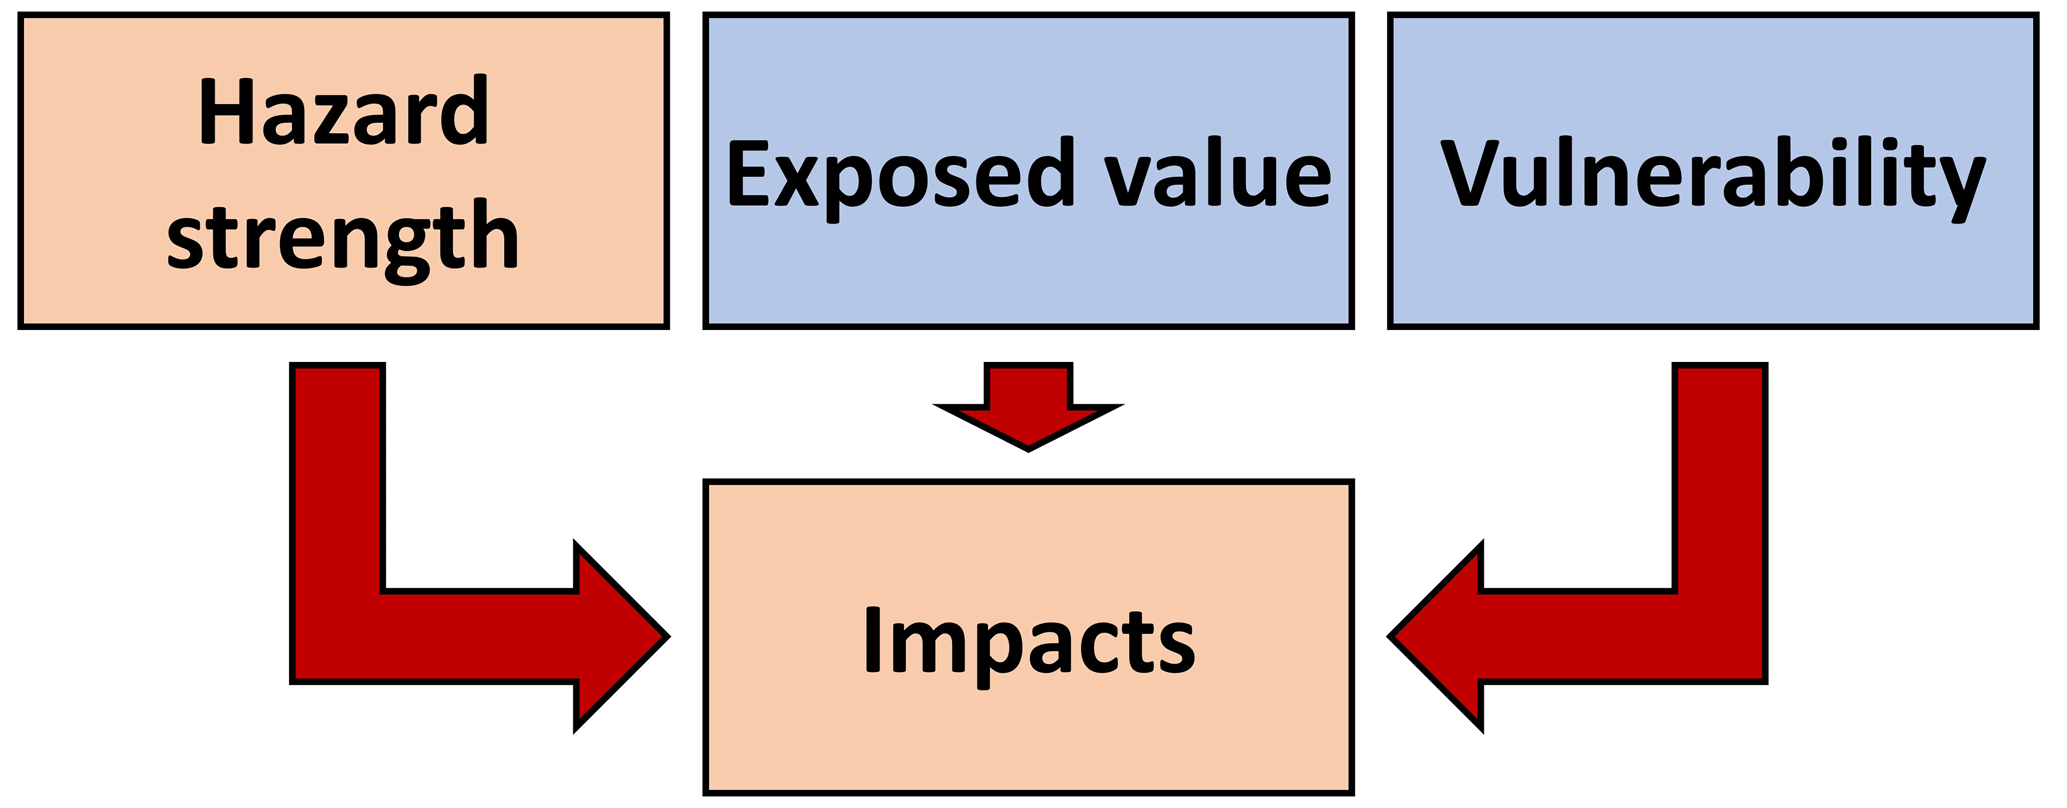
Figure 1Hazard event impacts as a result of hazard strength, exposed value, and vulnerability of exposed entities.
Hazard strength is often referred to as the hazard magnitude or hazard intensity (Blong, 2003; Alexander, 2018). However, these two concepts are not equivalent. Hazard magnitude is a measure of the size of, or the total energy involved in, the entirety of a hazard event (Blong, 2003; Alexander, 2018), whereas hazard intensity is often a measure of the strength of an event with respect to a given location or area and/or a moment or period. Recently, Wang and Sebastian (2022) identified two defining dimensions, i.e. the spatial and temporal dimensions, to categorize existing hazard strength scales. These scales can be classified as agential or locational along the spatial dimension and durational or momental along the temporal dimension. A hazard strength scale is categorized as agential if it indicates the size of an event within its entire spatial range and locational if it is given for a set of locations within the spatial range of an event. Likewise, a hazard strength scale is categorized as durational when it corresponds to the entire duration of an event and momental when it corresponds to a set of moments within the duration of an event. Considering both the spatial and temporal dimensions, hazard strength scales can therefore be categorized into four types, i.e. the agential–durational scale, the locational–durational scale, the agential–momental scale, and the locational–momental scale. In this study, we use term “hazard magnitude” to refer to an agential–durational hazard strength of an event.
To quantify hazard strength in terms of equivalent hazard magnitude, we considered 12 hazard types: cold wave, convective storm, drought, earthquake, extra-tropical storm, flash flood, forest fire, heat wave, riverine flood, tornado, tropical cyclone, and tsunami. A general standardized metric of impact was created by combining three loss measures from the EM-DAT database (Guha-Sapir et al., 2021): fatality, total affected population, and total damage. The impact metric was then related to an indicator of hazard strength, such as the Richter magnitude, for each hazard type via linear regression. The expectation of impact metric for each hazard type was linearly scaled and adopted as the equivalent hazard magnitude. Here, two assumptions were made. First, we assumed that the EM-DAT records were not significantly biased across similar hazard events. Second, we assumed that the derivation of expectation of impact metric cancelled out all local factors of exposed value and vulnerability. The following sections outline the method in detail.
3.1 Data collection
To reduce the biases in model calibration due to different protocols for data collection across different types of natural hazards, we only used data gathered from the EM-DAT database (Guha-Sapir et al., 2021). To be included in the EM-DAT database, a hazard event must meet at least one of three criteria, i.e. 10 or more human fatalities, 100 or more people affected by the event, or a declaration of a state of emergency or an appeal for international assistance by a country (Guha-Sapir et al., 2021). For this study, we downloaded the entire EM-DAT datasets on all types of natural hazards. However, since some records of hazard magnitude indicators of events for some hazard types (e.g. the volcanic activities and landslides) were missing, we only included 12 hazard types. The final dataset for deriving the equivalent hazard magnitudes contained a total of 3844 data points, each representing one unique hazard event.
The 12 considered hazard types include convective storm, extra-tropical storm, tornado, tropical cyclone (wind speed is used as hazard magnitude indicator), cold wave, heat wave (temperature), drought, flash flood, forest fire, riverine flood (affected area), earthquake, and tsunami (Richter magnitude). For data quality control, we removed data points with questionable values of hazard magnitude indicators. For cold wave events, we only included data points with a minimum temperature of ≤ 0 ∘C. For convective storms, we only considered data points with a peak gust wind speed of ≥ 60 km h−1. For forest fires, we only included data points with a burnt area of ≤ 200 000 km2. For heat wave events, we only considered data points with a maximum temperature of ≥ 35 and ≤ 57 ∘C. For tornadoes, we only included data points with a peak gust wind speed of ≥ 100 km h−1. For tsunamis, we only considered data points with an earthquake Richter magnitude ≥ 100 km h−1.
To facilitate regression modelling, we logarithmically transformed values of hazard magnitude indicators to be close to a Gaussian distribution within the theoretical range for eight of the hazard types. Such logarithmic transformations were conducted to keep the shape of distribution of data points consistent with their corresponding linear regression models. The indicators that were not logarithmically transformed included minimum temperature of cold waves, maximum temperature of heat waves, Richter magnitude of earthquakes, and earthquake Richter magnitude of tsunamis. Cold wave and heat wave events were excluded from logarithmic transformations because the distributions of data points of these events did not present non-linear patterns and the Celsius temperature has a range [273.15, ∞) similar to . Meanwhile, the earthquake Richter magnitude is already a logarithmic metric with the desired theoretical range of .
3.2 Impact metric
We designed the impact metric as the principal component (Jolliffe, 2002; Jolliffe and Cadima, 2016) of three logarithmically transformed and standardized impact variables. The selected impact variables represented three major impact dimensions as defined by the EM-DAT database (Guha-Sapir et al., 2021). The first variable, fatality, indicated the number of people who perished as the result of a hazard event. The second variable, total affected population, referred to the total number of individuals injured, made homeless, or affected by the event. The third variable, total damage, indicated the total amount of damage to property, crops, and livestock in 2019 USD caused by the event. The values of the impact variables were logarithmically transformed to be within the range and standardized with the formula
where IV denoted the logarithmically transformed and standardized impact variable, IVO was the original impact variable, and μln IV and σln IV were respectively the mean and standard deviation of the logarithmically transformed impact variable (see Table 1). The principal component of the three logarithmically transformed and standardized impact variables corresponded to the dimension along which the variation of data points was preserved to the largest extent in the three-dimensional vector space. The principal component also showed the direction of the eigenvector associated with the largest eigenvalue with respect to the covariance matrix of the three transformed impact variables. Each data point represented the impact of one hazard event experienced by one country (see Video S1 in the Supplement).
Table 1Means and standard deviations of original and logarithmically transformed impact variablesa.
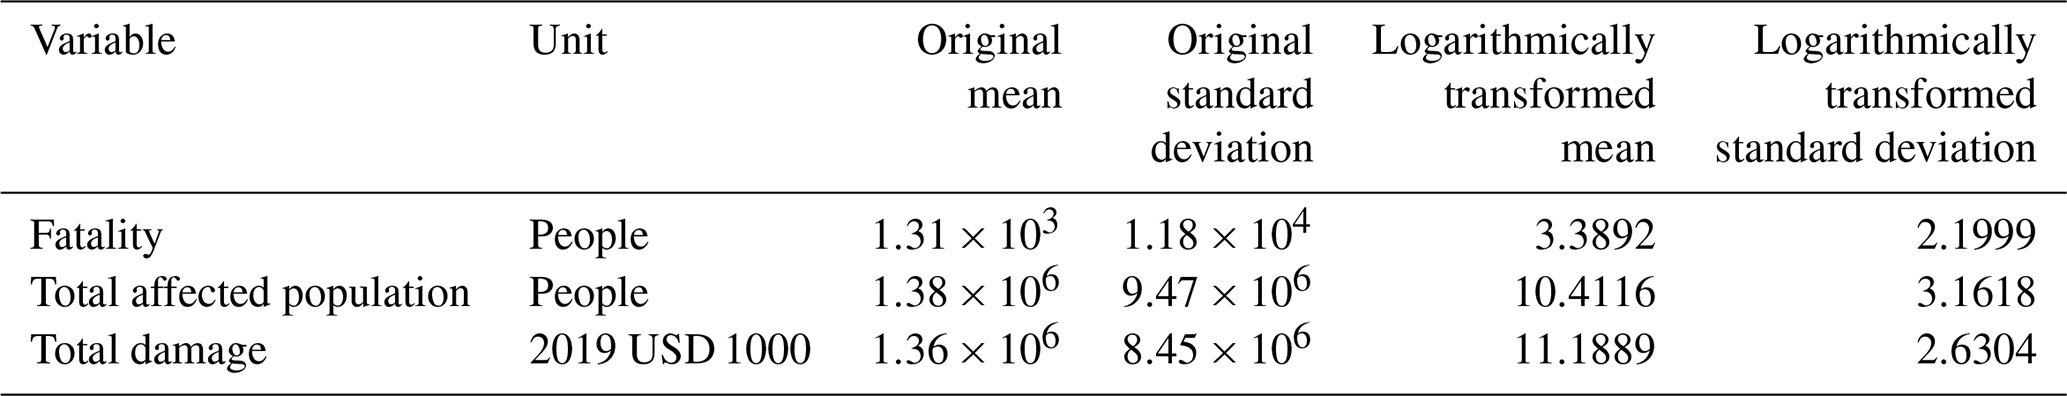
a This table corresponds to Data S1 in the Supplement.
To reduce the bias associated with factors of exposed value and vulnerability (Fig. 1), we included all available data points at the country–year level for countries around the world and hazard events from 1900 to 2020. To compute the impact metric, we only kept data points (n=1470) without any missing values. A PCA was then conducted to determine the weights of transformed and standardized impact variables within the impact metric. The resulting formula for the impact metric was
where IM denoted the impact metric and IVF, IVTA, and IVTD referred to the transformed and standardized impact variables of fatality, total affected population, and total damage respectively.
3.3 Equivalent magnitude
For each considered hazard type, we established the relationship between its hazard magnitude indicator and hazard impact metric via linear regression
where a3 and b3 were two model coefficients, MI denoted hazard magnitude indicator, σ3 was the dispersion parameter, and ε was a standard normal random variable. The statistics of parameters of these regression models are listed in Table 2. Parameters of all linear regression models involved in this study were determined with a maximum likelihood approach based on Raphson's algorithm (Raphson, 1697; Wang et al., 2019; Wang, 2020). For each regression model, the standard errors of parameter estimates were derived from the main diagonal of the covariance matrix of model parameters computed as the negative inverse of the observed Fisher information matrix. To present equivalent hazard magnitude roughly within the range of [0, 10], we applied a linear transformation to the point estimate of impact metric
where EM referred to the equivalent hazard magnitude and denoted the point estimate of expectation. The derived equivalent hazard magnitudes for all data points are recorded in Data S6 in the Supplement.
Table 2Statistics of parameters of 12 simple linear regression models for deriving equivalent hazard magnitudesa.

a This table corresponds to Data S4 in the Supplement; R2 measures are included in Fig. 3; standard errors are in the parentheses. ∗ ; ; .
4.1 Model calibration
Visualization of the distribution of data points with respect to the impact variables and impact metric (Fig. 2a, d, h, and m) shows that the empirical marginal distributions of the logarithmically transformed and standardized impact variables and the impact metric appear to be approximately Gaussian. The standardized natural logarithms of impact variables are positively correlated with each other (Fig. 2c, f, and g; also see Appendix A). Results of the linear regression modelling with two independent variables (see Appendix A) indicate that each of the standardized natural logarithms of impact variables is positively associated with the other two logarithmically transformed and standardized impact variables with a positive R2 (Fig. 2b, e, and i). These results provide justifications for leveraging data on some impact variables to interpolate missing values of other impact variables (see Appendix A). Meanwhile, Fig. 2j–l shows that there are positive correlations between the impact metric and each of the standardized natural logarithms of impact variables with a large R2. This result suggests the appropriateness of using as the impact metric the principal component of the three logarithmically transformed and standardized impact variables.
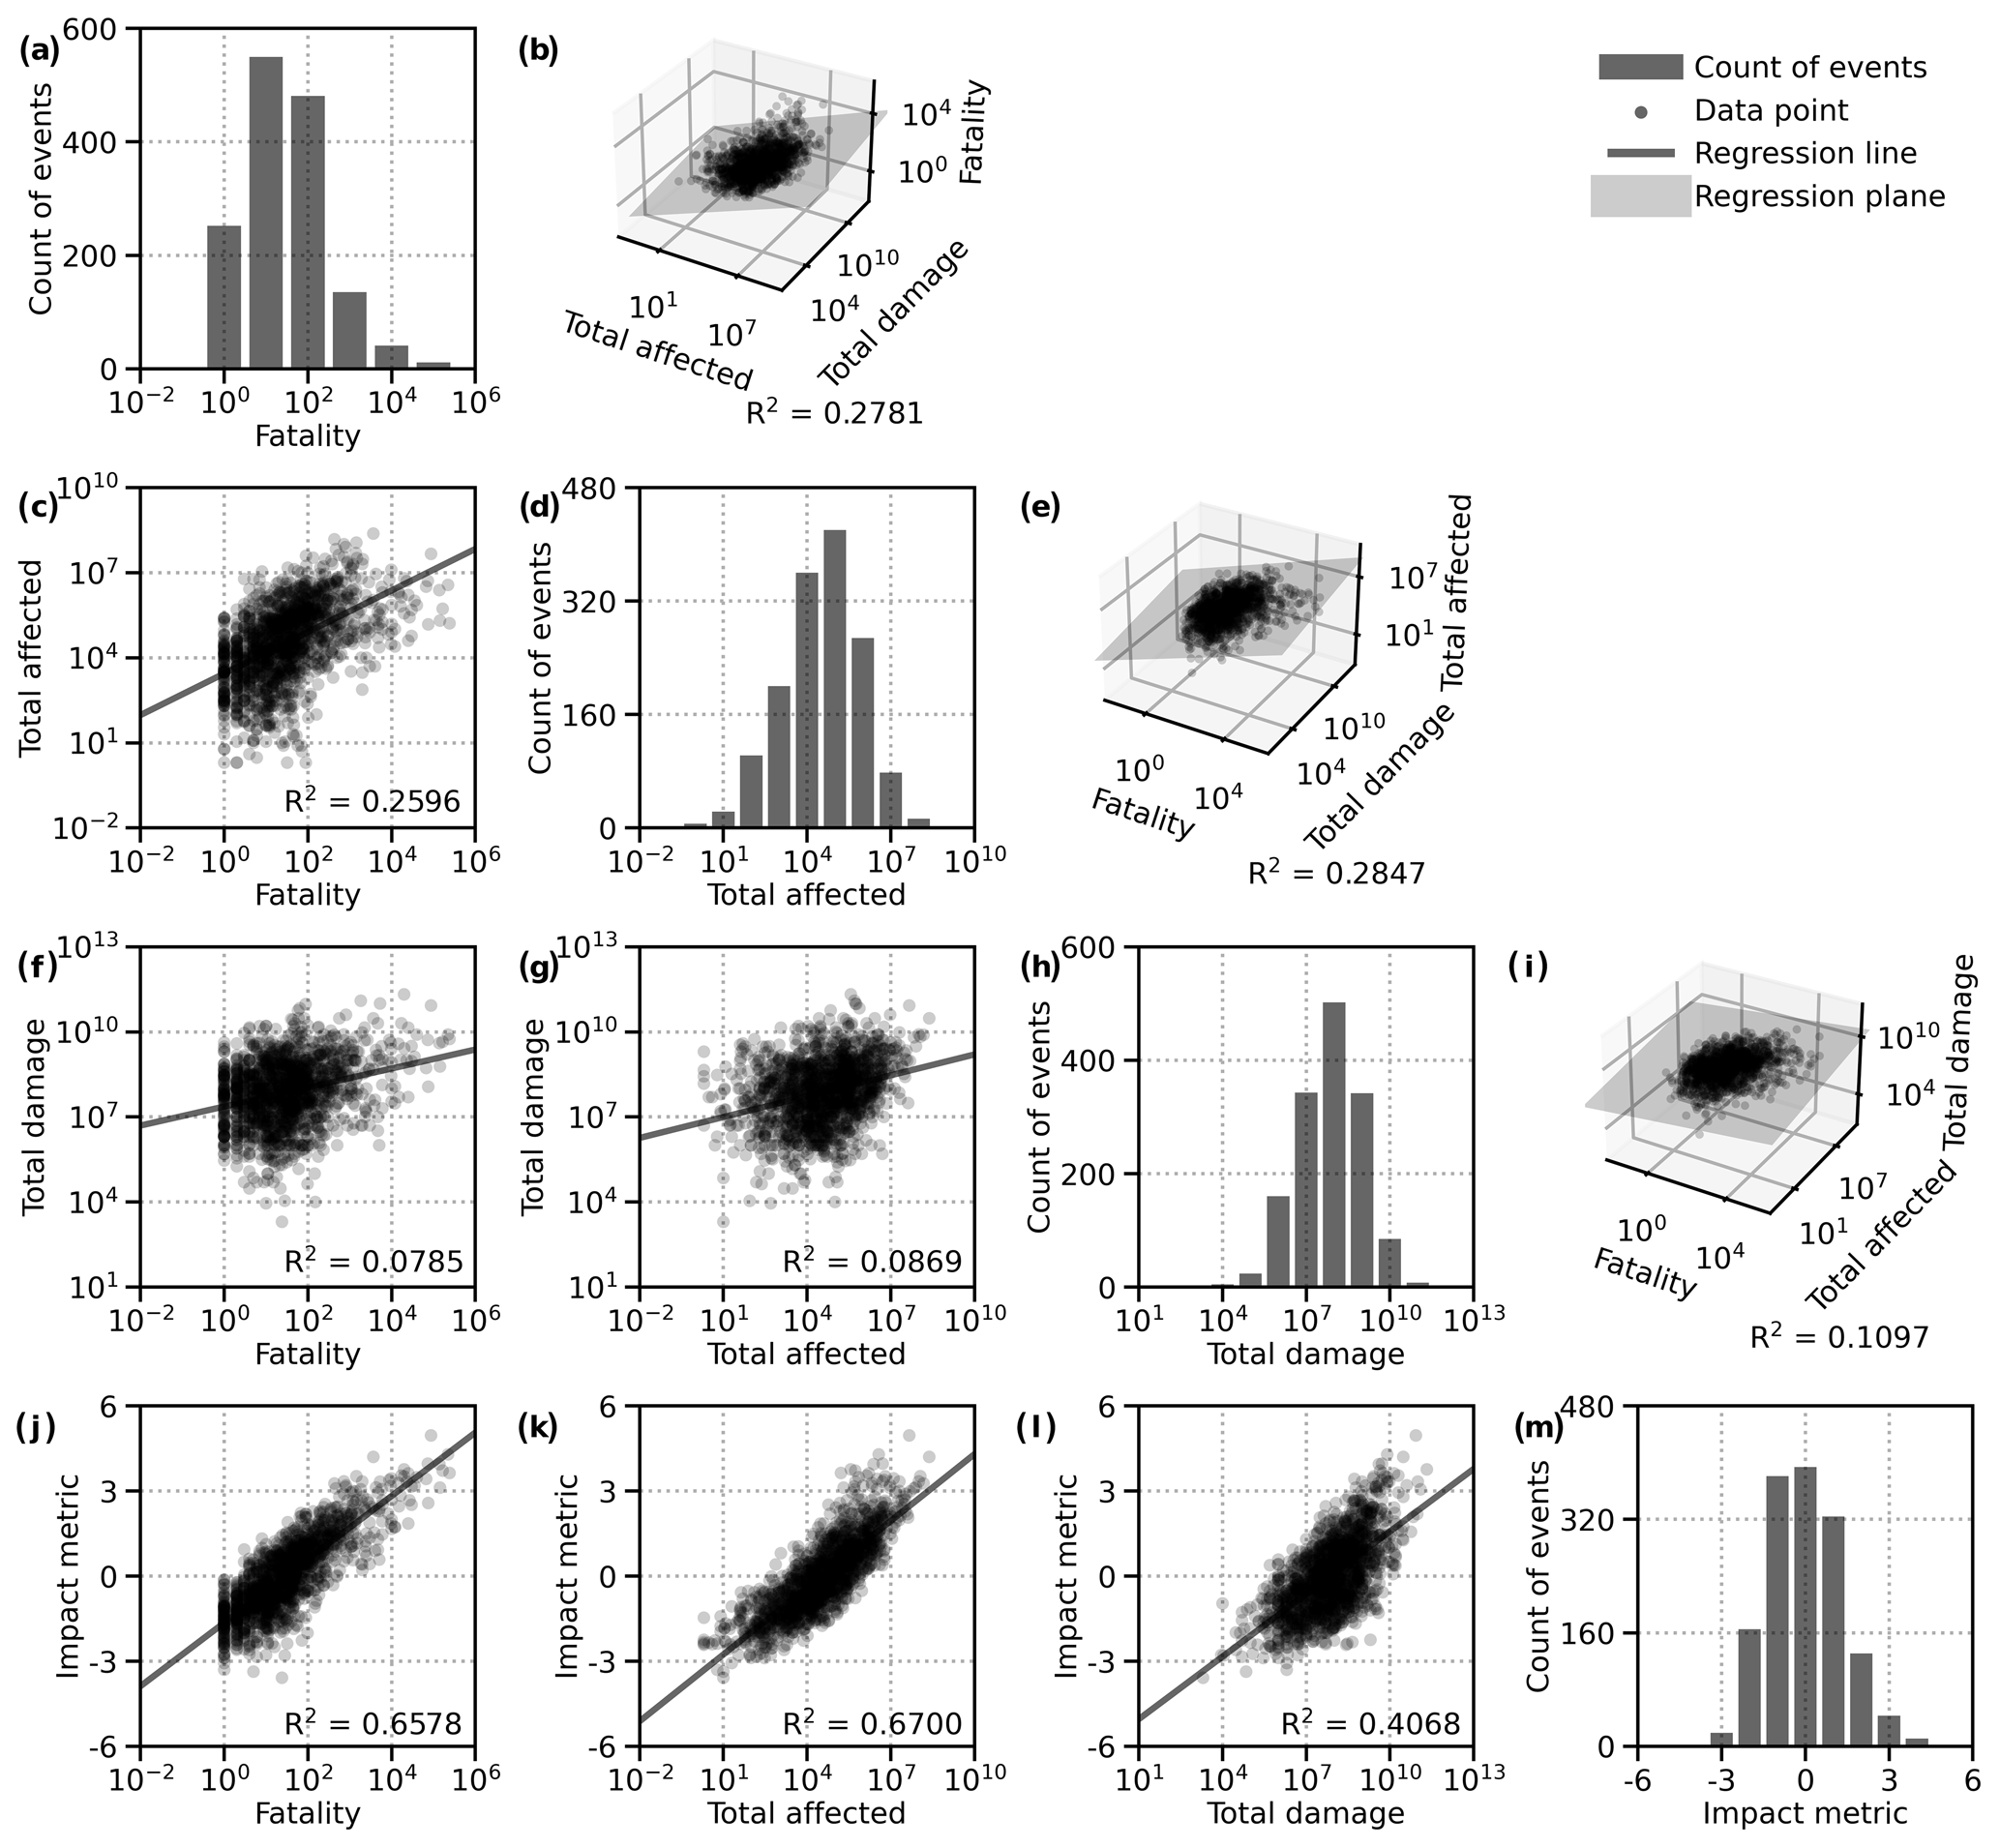
Figure 2Impact variables and impact metric. (a) Histogram of impact variable fatality. (b) Fatality regressed on total affected population and total damage in 2019 USD with a multiple linear regression. (c) Total affected population regressed on fatality with a simple linear regression. (d) Histogram of impact variable total affected population. (e) Total affected population regressed on fatality and total damage in 2019 USD with a multiple linear regression. (f) Total damage in 2019 USD regressed on fatality with a simple linear regression. (g) Total damage in 2019 USD regressed on total affected population with a simple linear regression. (h) Histogram of impact variable total damage in 2019 USD. (i) Total damage in 2019 USD regressed on fatality and total affected population with a multiple linear regression. (j) Impact metric regressed on fatality with a simple linear regression. (k) Impact metric regressed on total affected population with a simple linear regression. (l) Impact metric regressed on total damage in 2019 USD with a simple linear regression. (m) Histogram of impact metric.
Figure 3 demonstrates that the proposed methodology for deriving an equivalent hazard magnitude of an event is effective in decoupling the natural force, manifested in hazard strength, from other factors of impacts of natural hazard events to support studies on exposed value and vulnerability. The results of the calibration of linear regression models for 12 individual hazards (Fig. 3 and Table 2) show that the direction of the coefficient of hazard magnitude indicator in each model is consistent with expectation. In particular, the estimates of coefficients of hazard magnitude indicators for convective storm (Fig. 3b), drought (Fig. 3c), earthquake (Fig. 3d), flash flood (Fig. 3f), forest fire (Fig. 3g), riverine flood (Fig. 3i), tropical cyclone (Fig. 3k), and tsunami (Fig. 3l) are all statistically significant at (Table 2). Because the objective of this study is not to model or predict hazard impacts of an event, but rather to quantify the agential–durational hazard strength of the event, it is also expected that the results of the regression models for individual hazards will show a wide spread of data points with respect to hazard magnitude indicator with a small R2. In fact, the variation or spread of the data points with respect to hazard magnitude indicators in Fig. 3 serves to underscore the importance of studying exposed value and vulnerability for disaster risk reduction since these factors also drive hazard impacts (as discussed in Fig. 1).

Figure 3Simple linear regressions on impact metric against magnitude indicators. Impact metric is regressed on (a) minimum temperature of cold wave, (b) peak gust wind speed of convective storm, (c) total affected area of drought, (d) Richter magnitude of earthquake, (e) peak gust wind speed of extra-tropical storm, (f) total flooded area of flash flood, (g) total burnt area of forest fire, (h) maximum temperature of heat wave, (i) total flooded area of riverine flood, (j) peak gust wind speed of tornado, (k) maximum sustained wind speed of tropical cyclone, and (l) earthquake Richter magnitude of tsunami. Solid lines are regression lines. Shaded areas are the 95 % confidence intervals of the corresponding regression lines.
4.2 Comparisons of hazard magnitudes
Using the proposed methodology, we can plot all the data points onto one figure (Fig. 4), allowing us to compare equivalent hazard magnitudes of events across different hazard types on the Gardoni Scale. Each data point on Fig. 4 corresponds to a record of hazard event and all plotted data points are associated with impacts above the threshold defined by the EM-DAT database (Guha-Sapir et al., 2021).
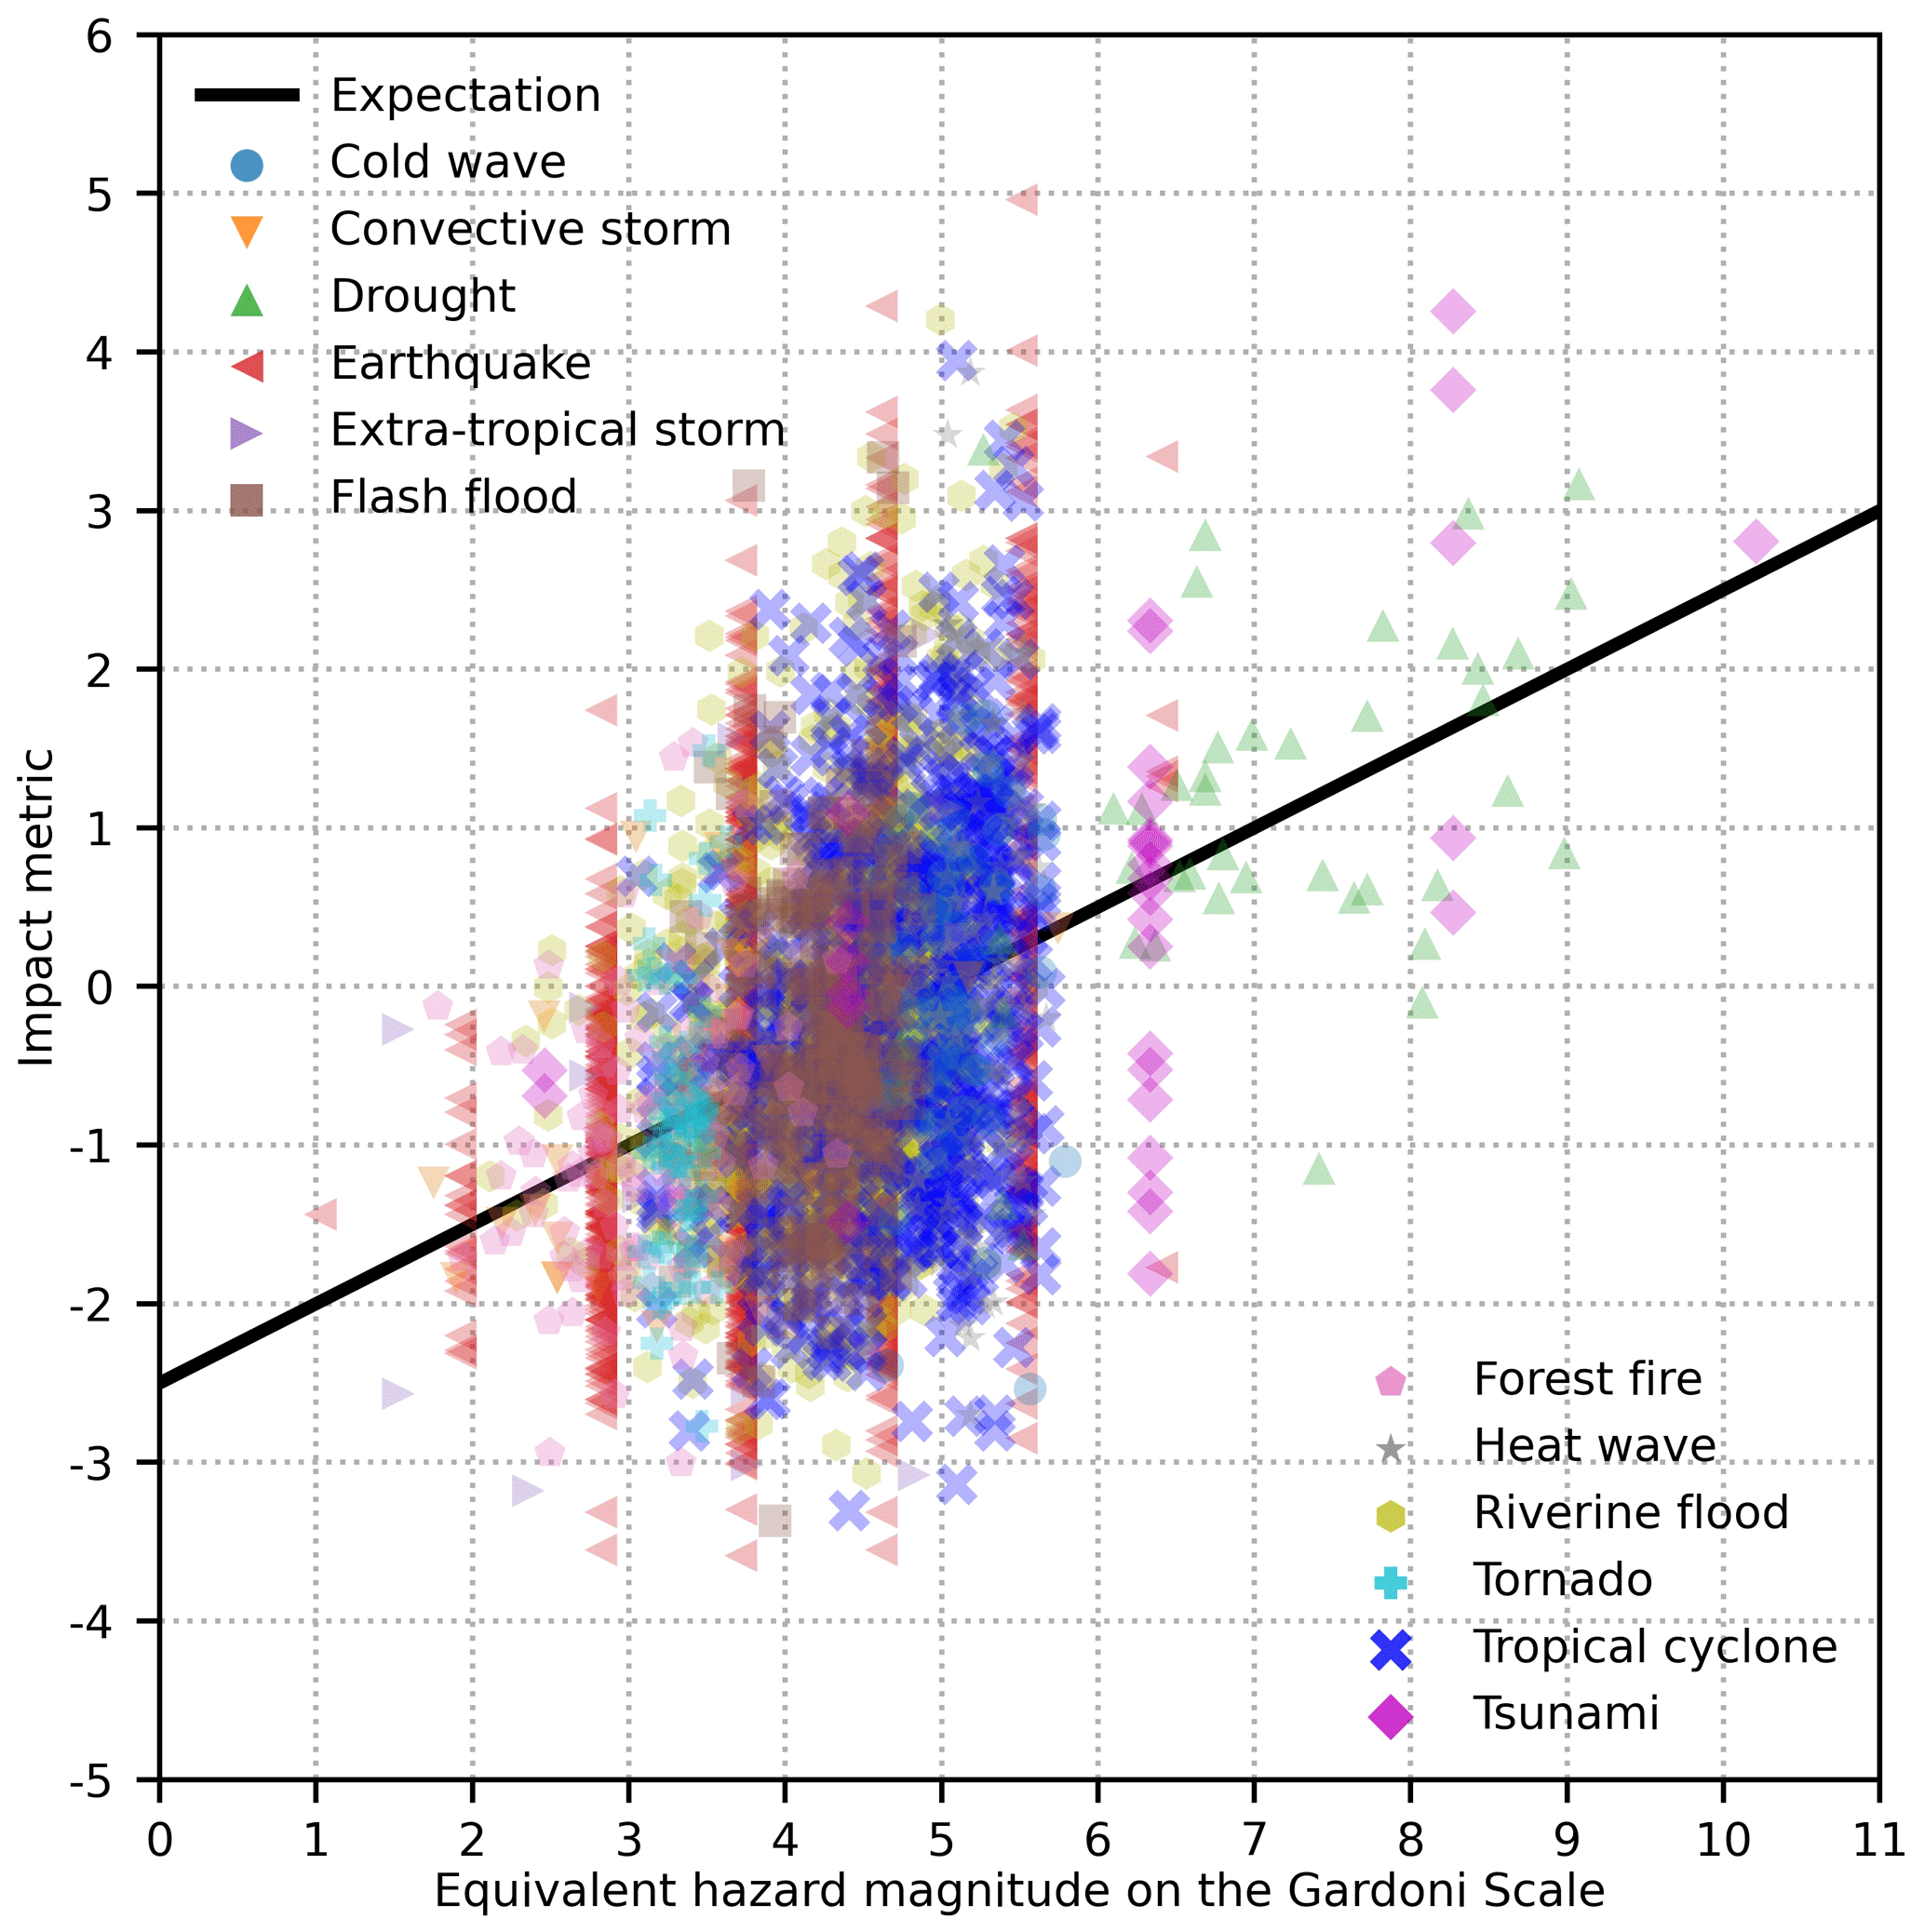
Figure 4Impact metric versus equivalent hazard magnitude on the Gardoni Scale. The expectation line shows values of the expected impact metric with respect to equivalent hazard magnitude.
Within the datasets for this study, all 37 events with the largest equivalent hazard magnitudes are either a tsunami or a drought. Their equivalent hazard magnitudes range [6.50, 10.21]. The event with the largest equivalent magnitude is the 1960 Chilean tsunami that killed 6000 and affected over 2 million people in Chile as well as resulted in 61 fatalities in Hawaii, USA. The notorious 2004 Indian Ocean tsunami that affected more than 2 million people ranks 10th among all events, with its equivalent magnitude at 8.27. The drought event with the largest equivalent hazard magnitude (9.07) is the 2002 Indian monsoon drought that affected a total of about 300 million people. The largest earthquake events are recorded with an equivalent hazard magnitude at 6.41. One of these events is the 1920 Haiyuan earthquake in mainland China that resulted in at least 180 000 fatalities. Among the considered 12 hazard types, the natural hazard with the lowest maximum equivalent magnitude is the tornado. The tornado event with the largest equivalent hazard magnitude (3.62) is the 2013 El Reno tornado in Oklahoma, USA. This tornado event led to a total damage of over 2019 USD 2 billion (Guha-Sapir et al., 2021).
4.2.1 Earthquake, tornado, forest fire, and tropical cyclone
Figure 5 compares hazard magnitudes of events of four hazard types, i.e. earthquake, tornado, forest fire, and tropical cyclone, with ranges of hazard magnitudes adjusted according to the earthquake Richter magnitude scale. The figure shows that tornadoes tend to have a smaller hazard magnitude than large earthquakes and tropical cyclones. Most of the recorded tornadoes have a hazard magnitude equivalent to an earthquake Richter magnitude between 5 and 6. Compared with tropical cyclones in terms of peak sustained wind speed on the Saffir–Simpson hurricane wind scale, these tornadoes are similar in hazard magnitude to a tropical storm but not a hurricane. This indicates that hazard strength of an entire tornado event may be much smaller than the one for a large earthquake or tropical cyclone, even though tornadoes can still cause significant damage locally as in the case of the 2013 El Reno tornado. Meanwhile, the wide spread of data points of tornadoes with respect to hazard magnitude on Fig. 5a suggests that exposed value and vulnerability of exposed entities may be much stronger predictors of hazard impacts than hazard magnitude for tornado events.
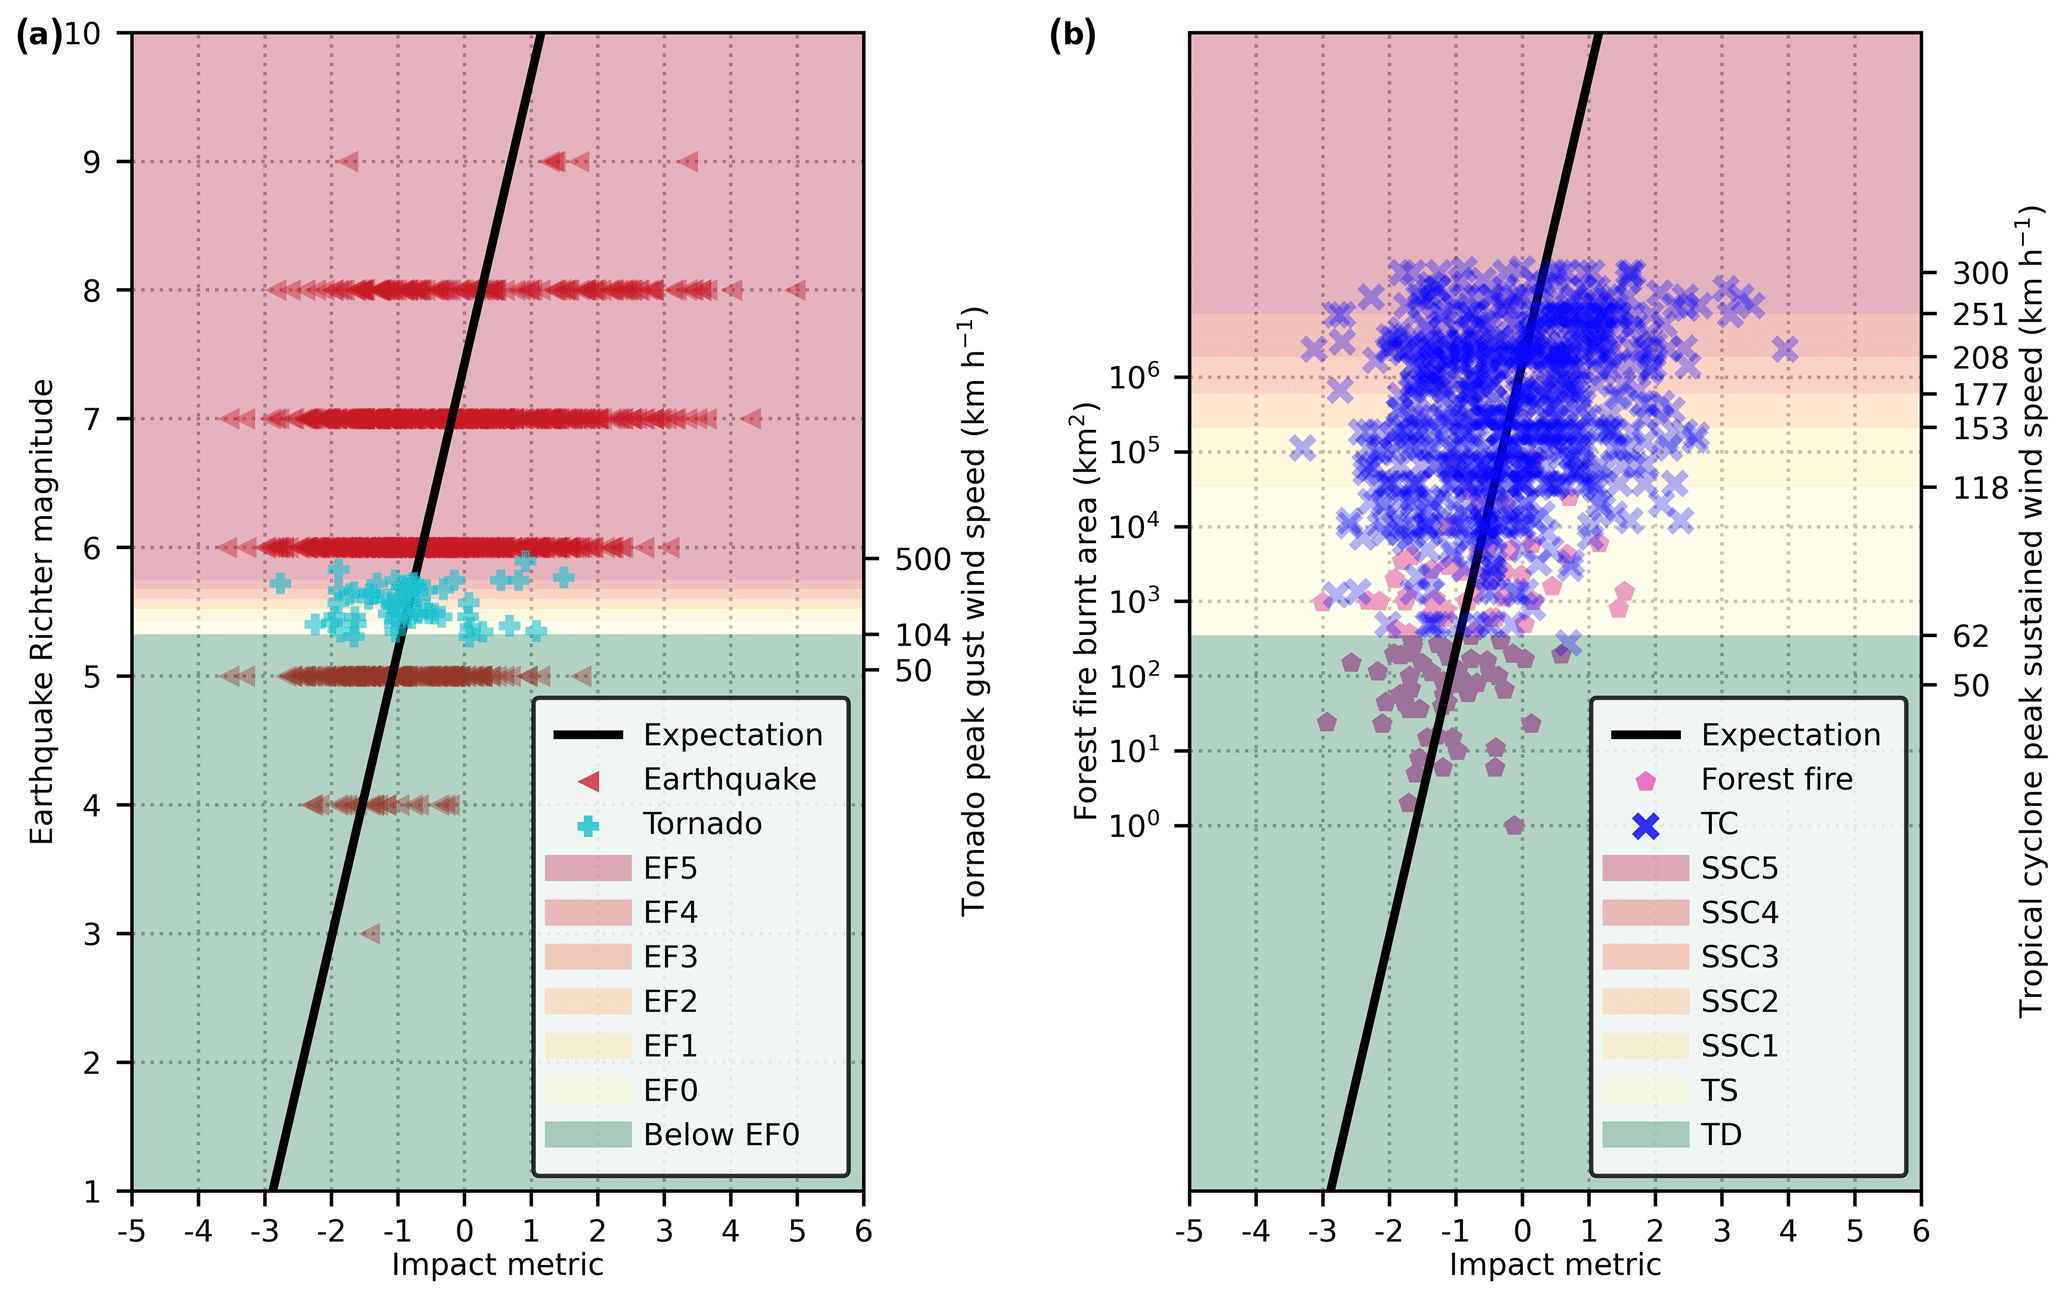
Figure 5Comparisons of hazard magnitudes of four hazard types. (a) Earthquake Richter magnitude versus tornado enhanced Fujita scale. EF0, EF1, EF2, EF3, EF4, and EF5 are enhanced Fujita scale 0, 1, 2, 3, 4, and 5 with gust wind speed at 104–137, 138–177, 178–217, 218–266, 267–322, and over 322 km h−1, respectively. (b) Forest fire burnt area versus tropical cyclone Saffir–Simpson wind scale. TD and TS are tropical depression and tropical storm with sustained wind speed below 63 km h−1 and at 63–118 km h−1, respectively; SSC1, SSC2, SSC3, SSC4, and SSC5 are Saffir–Simpson category 1, 2, 3, 4, and 5 with sustained wind speed at 119–153, 154–177, 178–208, 209–251, and over 251 km h−1, respectively; TC is tropical cyclone. Panels (a) and (b) are plotted with the same range and scale with respect to the earthquake Richter magnitude.
Compared to earthquakes, tropical cyclones that reach a hurricane level on the Saffir–Simpson scale are equivalent in hazard magnitude to an earthquake with a Richter magnitude greater than 6.5. A magnitude 8 earthquake on the Richter scale has a similar size in hazard magnitude as a tropical cyclone labelled with a peak category 5 on the Saffir–Simpson scale. Within the datasets for this study, Typhoon Meranti is the tropical cyclone with the largest equivalent hazard magnitude at 5.66. Although the typhoon was strong and affected the Philippines, Taiwan, mainland China, and South Korea in September 2016, it only resulted in a total economic loss of around 2019 USD 70 million, according to the EM-DAT database (Guha-Sapir et al., 2021).
In addition to earthquake and tropical cyclone, forest fire is another hazard type with a statistically significant estimate of coefficient of hazard magnitude indicator (Table 2). However, forest fires tend to have smaller equivalent magnitudes than large earthquakes and tropical cyclones (Fig. 4b). The two largest forest fires within the datasets had an equivalent hazard magnitude of 4.33. They occurred in Russia and Mongolia in 1996, resulting in 19 and 25 fatalities, respectively (Guha-Sapir et al., 2021). Both forest fires were equivalent to a tropical cyclone with its peak sustained wind speed reaching category 1 on the Saffir–Simpson scale. They were also equivalent in hazard magnitude to an earthquake with a Richter magnitude between 6.5 and 7.
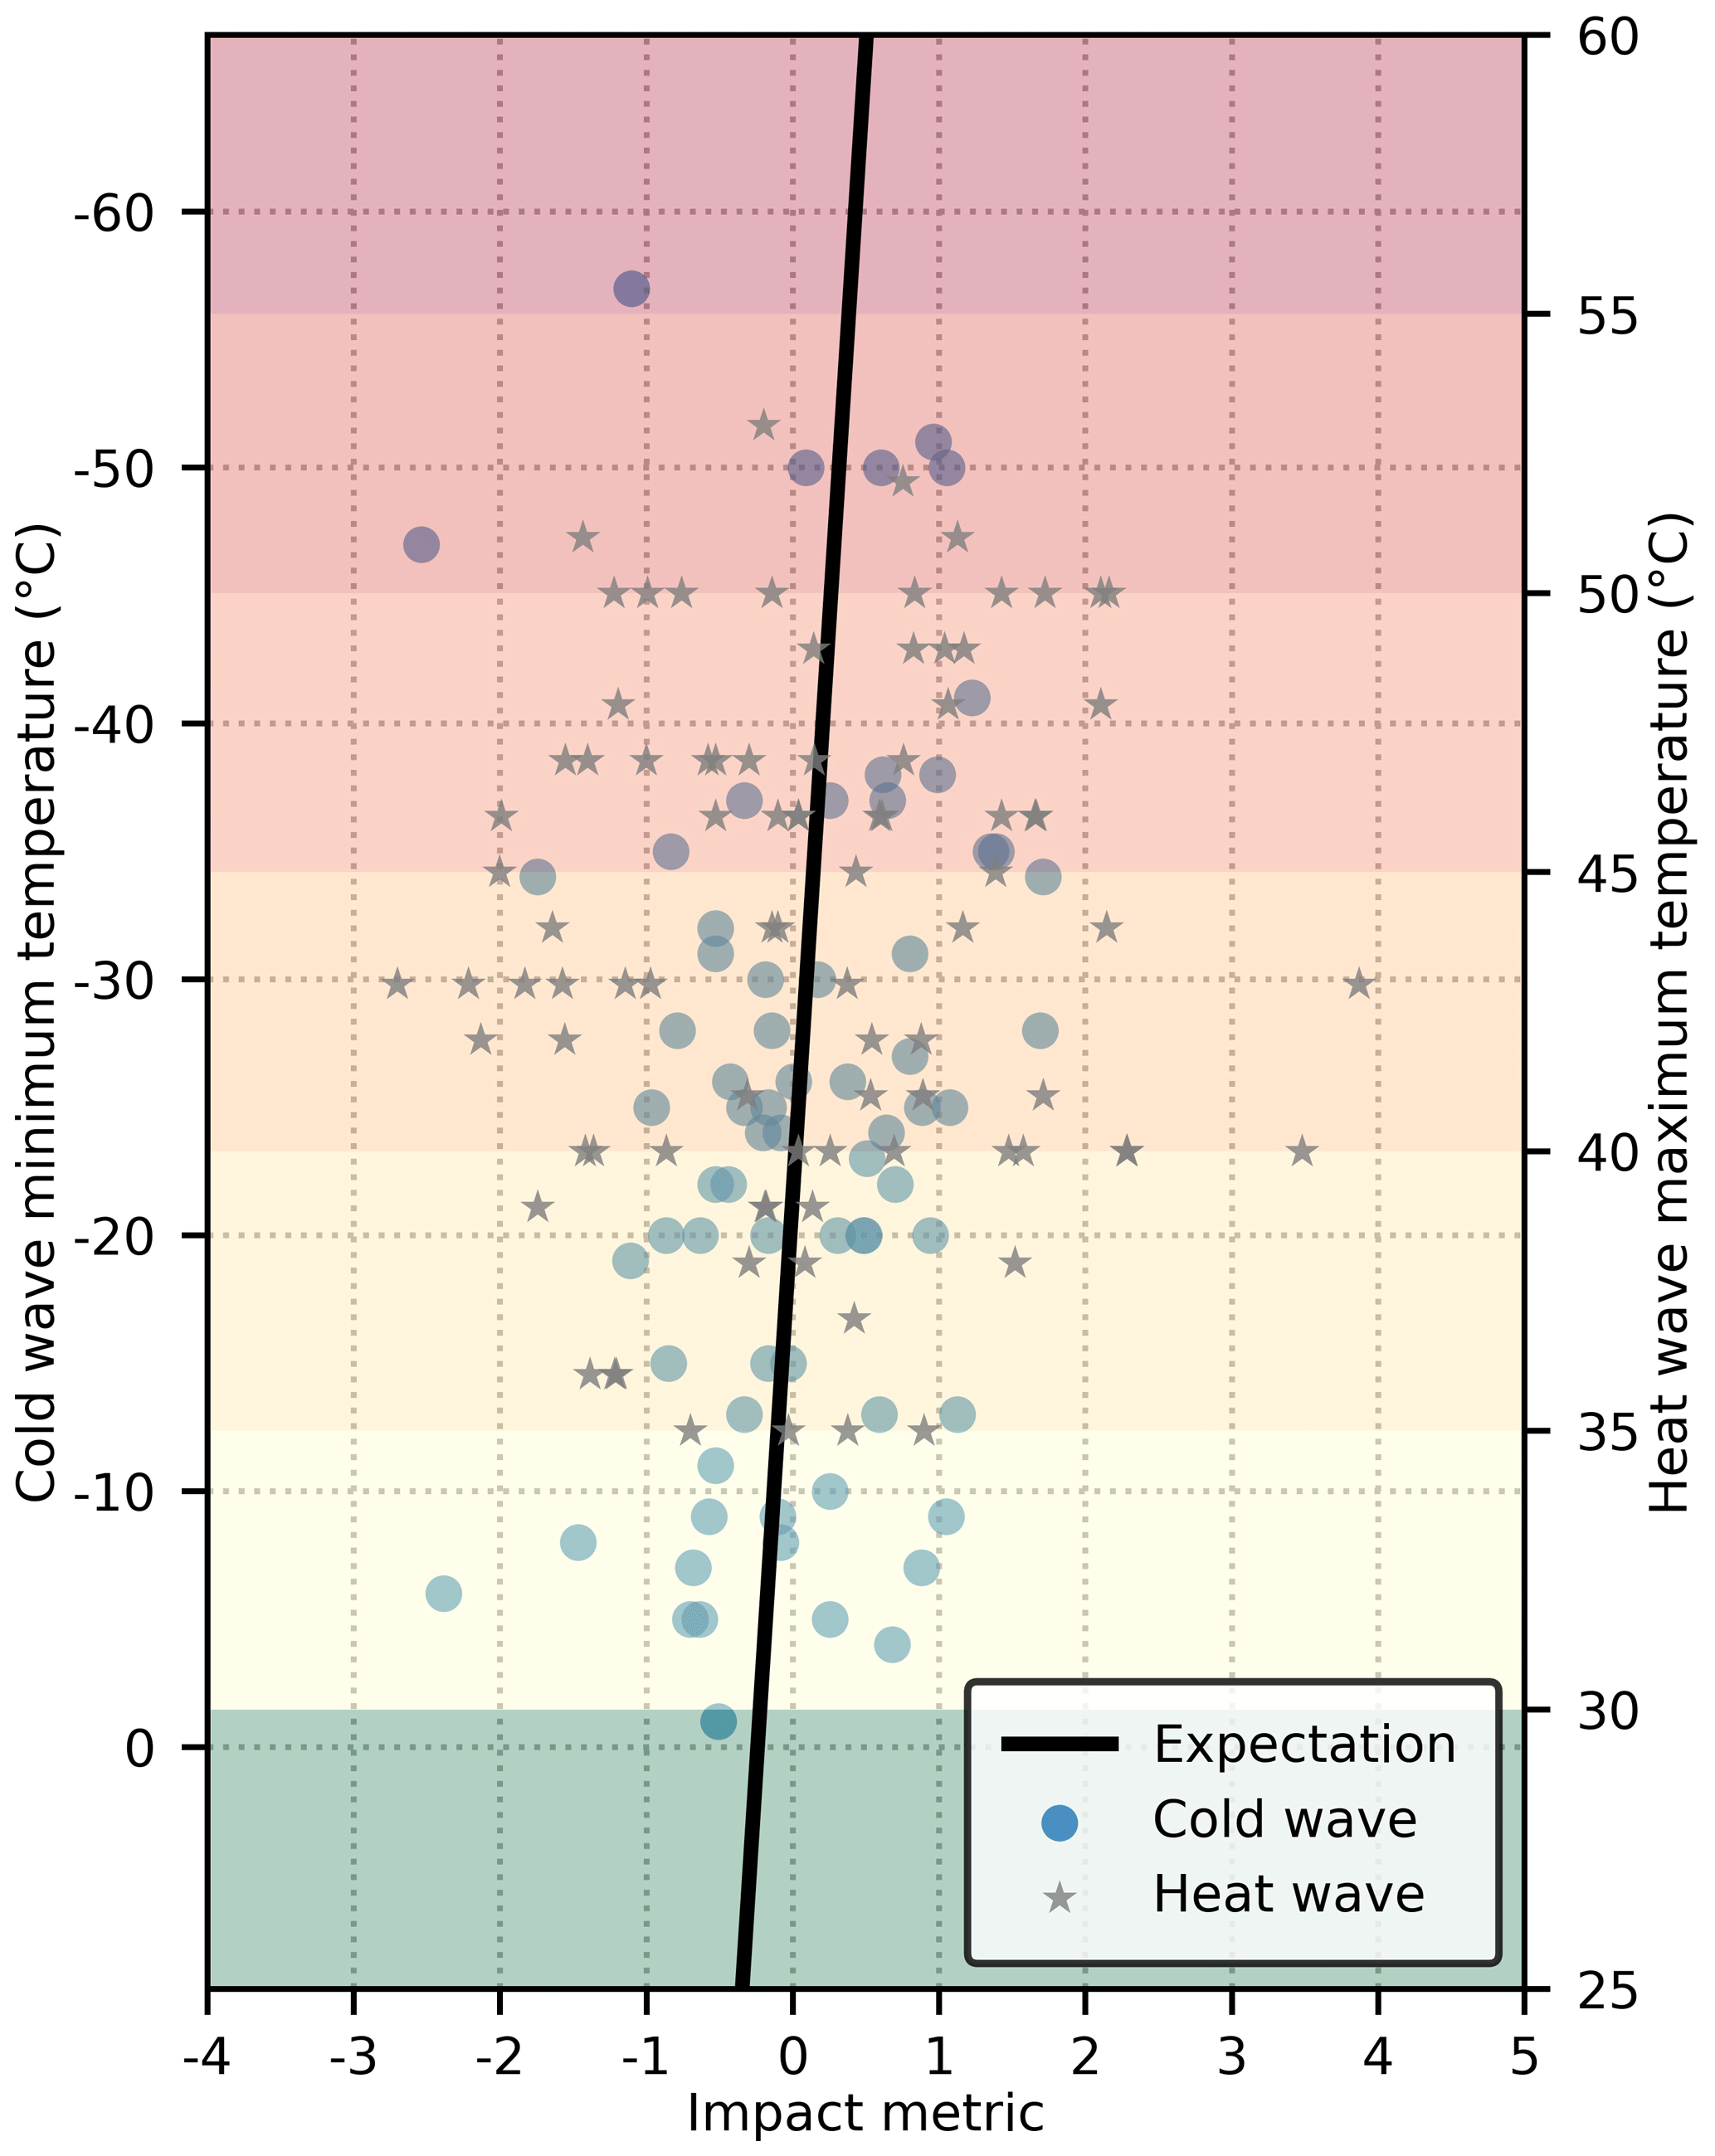
4.2.2 Cold wave and heat wave
With Fig. 6, we can compare the hazard magnitudes of cold wave and heat wave events. Both hazard types have a narrow range of equivalent hazard magnitude of events, with [4.54, 5.79] for cold wave and [4.79, 5.67] for heat wave (also see Data S5 in the Supplement). This is also consistent with the statistically insignificant estimates of their corresponding coefficients of hazard magnitude indicators (Table 2). Despite the narrow ranges of equivalent hazard magnitude, the range of minimum temperature of cold wave events from 0 to −55 ∘C is approximately equivalent to the range of maximum temperature of heat wave events from 30 to 55 ∘C (Fig. 6). The strongest cold wave event recorded in the EM-DAT database occurred in Russia in 2001, with its minimum temperature at −57 ∘C. This cold wave event killed 145 people, affected 6120 more, and led to an economic loss of 2019 USD 100 000. On the other hand, the heat wave event with the largest hazard magnitude had a maximum temperature at 53 ∘C. It struck Pakistan in June 1991, resulting in 523 human fatalities (Guha-Sapir et al., 2021).
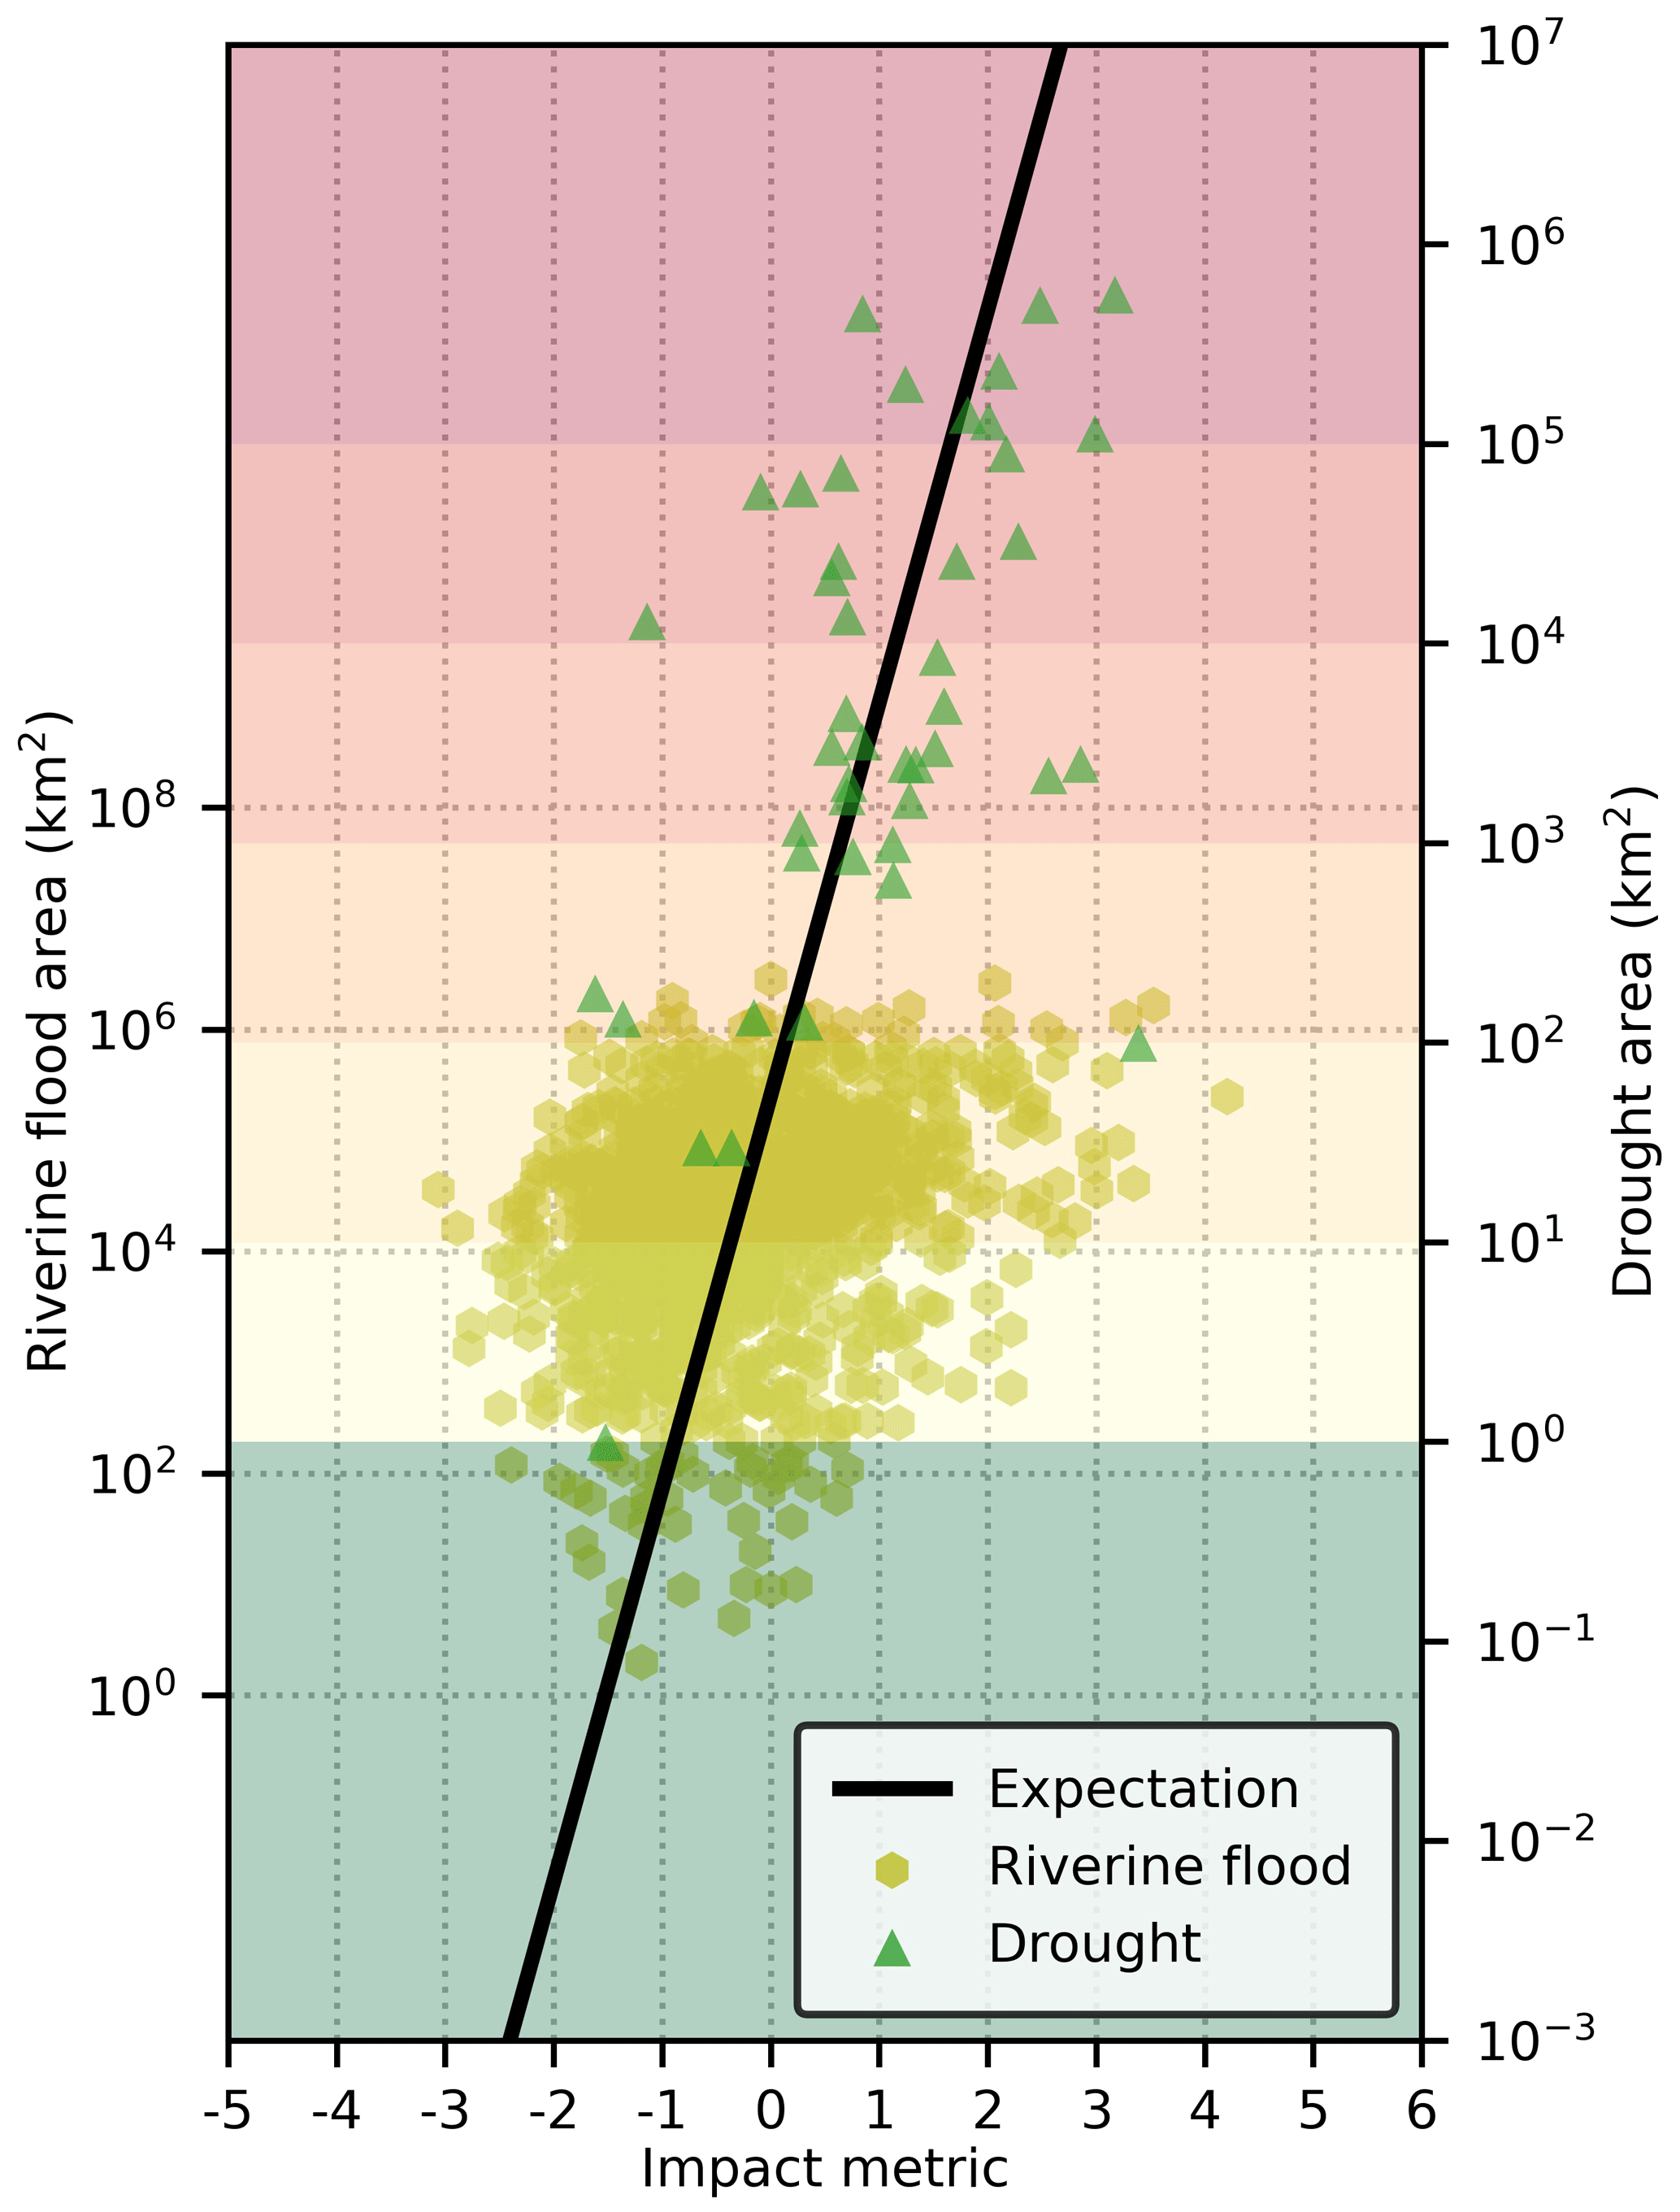
4.2.3 Riverine flood and drought
Comparison of hazard magnitudes can also be conducted between riverine flood and drought events (Fig. 7). Among hazard events included in the datasets for this study, drought has a large range of equivalent hazard magnitude of [3.23, 9.07], while riverine flood has a relatively small range of [2.11, 5.59]. A riverine flood event with a flooded area of 100 km2 is equivalent in hazard magnitude to a drought event with an affected area of about 1 km2. Meanwhile, a drought event with an affected area of 100 km2 has the similar hazard magnitude as a riverine flood with a flooded area of 1 million km2. Here, because the magnitude indicators of riverine flood and drought are defined by the EM-DAT database without strong justifications (Guha-Sapir et al., 2021), the meanings and modelling of the presented magnitude indicators of these two hazard types may deserve further investigation. Nevertheless, large drought events seem to be much larger in hazard magnitude than large riverine floods, even though some riverine floods may lead to more severe impacts. For example, the riverine flood event in mainland China in 1998 had an equivalent hazard magnitude of 4.99. But the event resulted in over 3600 fatalities, more than 238 million affected population, and an economic loss of 2019 USD 30 billion (Guha-Sapir et al., 2021).
4.3 Sensitivity analysis
In this study, the impact metric was constructed as the principal component of three transformed impact variables. The sum of squares of weights of transformed impact variables within the impact metric equalled one. We conducted a visual sensitivity analysis to examine if altering the weights of transformed impact variables within the impact metric had any significant effect on the relative comparison of hazard magnitudes across hazard types. For this sensitivity analysis, we first kept the sum of squares of all weights of transformed impact variables equal to one. Second, we maintained an equal ratio of squares of weights between two transformed impact variables. Third, we changed the weight of the third transformed impact variable and adjusted the weights of the other two transformed impact variables according to the first two rules.
Figure 8 shows the result of a sensitivity analysis with data points of tsunami and flash flood as a demonstrative example. Data points are plotted based on their equivalent hazard magnitudes with a fixed scale of the hazard magnitude indicator of tsunami. When the weight of each of the transformed impact variables of fatality (Fig. 8a–d), total affected population (Fig. 8e–h), and total economic damage (Fig. 8i–l) is shifted from zero to one, there are identifiable increasing or decreasing trends of alterations of the distributions of data points as well as the deviations between clusters of data points of the two different hazard types. However, when weights of transformed impact variables are far away from the extreme value of zero or one, there is no significant change regarding the distribution of data points with respect to equivalent hazard magnitude (see Fig. 6b, c, f, g, j, and k). This result indicates desirable performance of the proposed methodology for deriving equivalent hazard magnitude of an event on the Gardoni Scale.
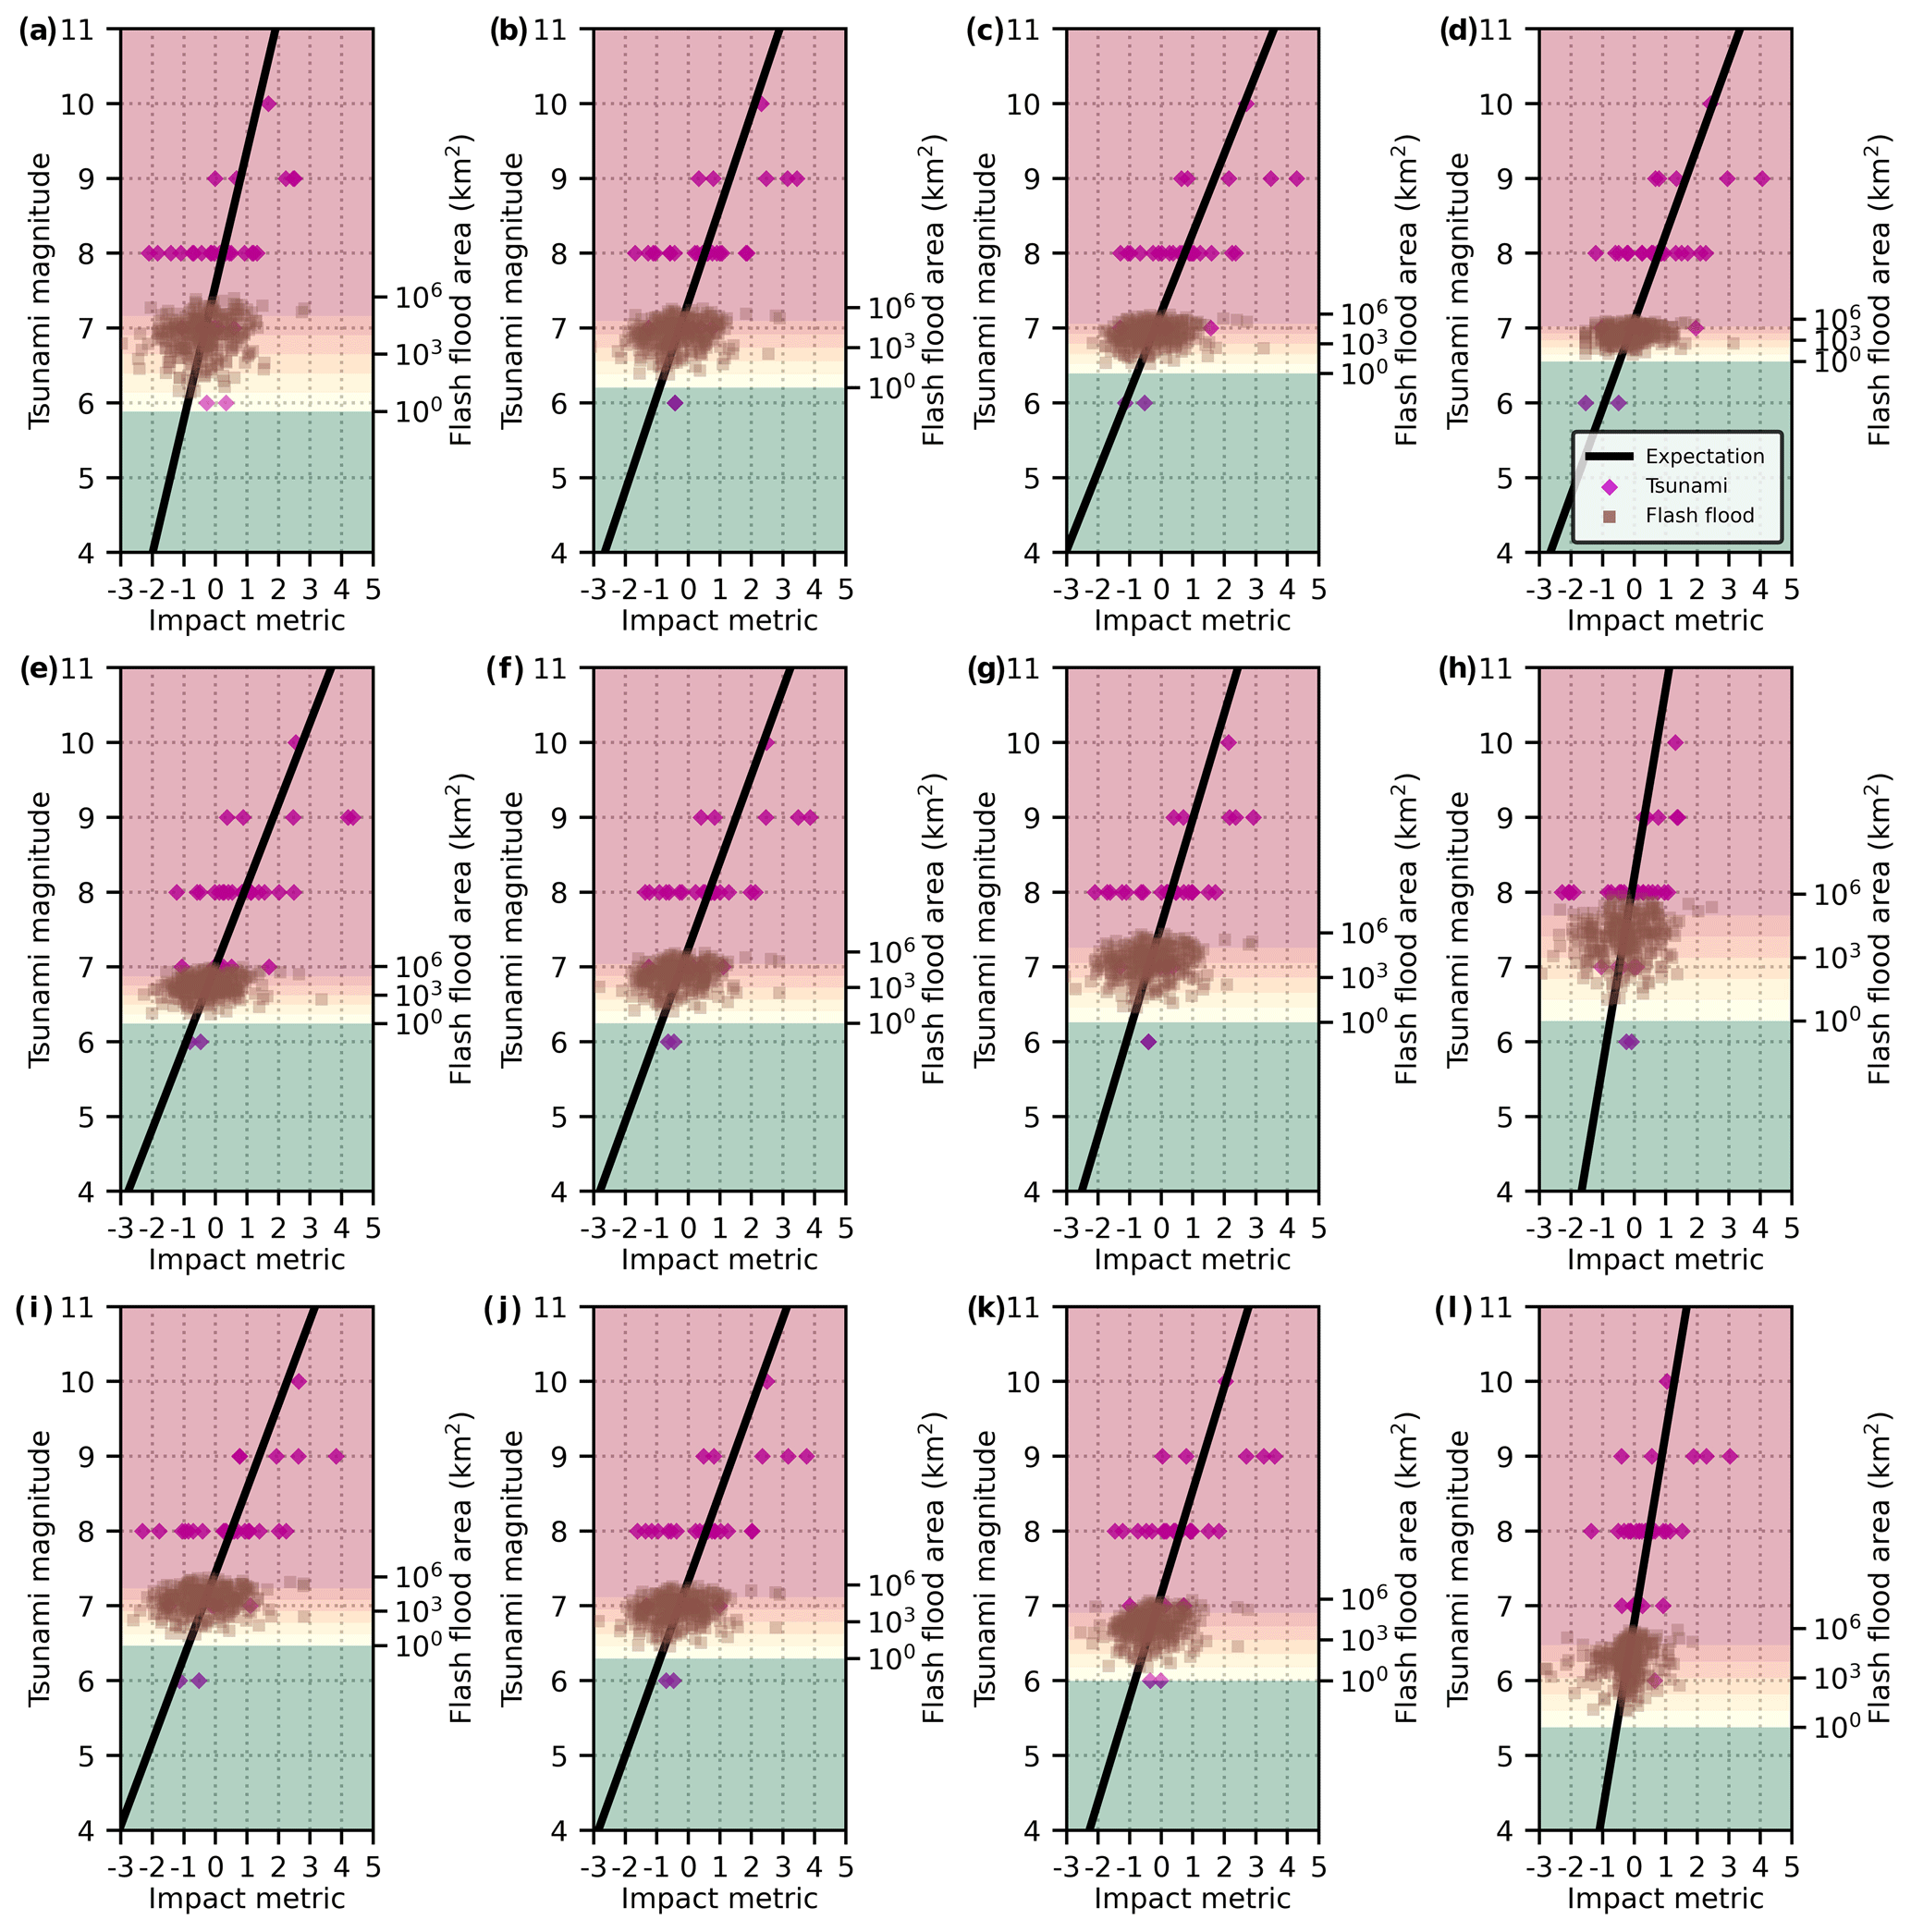
Figure 8Results of visual sensitivity analysis regarding effects of altering weight of one transformed impact variable within impact metric on equivalent magnitudes of tsunami and flash flood events. Weight of fatality equals zero, , , and one in (a), (b), (c), and (d), respectively, where wF is the calibrated weight of fatality. Weight of total affected population equals zero, , , and one in (e), (f), (g), and (h), respectively, where wTA is the calibrated weight of total affected population. Weight of total damage equals zero, , , and one in (i), (j), (k), and (l), respectively, where wTD is the calibrated weight of total damage. In panels (a)–(l), sum of squared weights of three transformed impact variables equals one and the ratio of squares of the other two variable weights is kept constant.
5.1 Contributions
To our knowledge, this study represents the first attempt to produce an equivalent hazard magnitude scale, i.e. the Gardoni Scale, to quantify agential–durational hazard strengths for hazard events across multiple hazard types. The proposed scale has several merits. First, professionals in natural hazard and emergency management could use equivalent hazard magnitudes on the Gardoni Scale to facilitate hazard communication among various stakeholders. Similarly, journalists and news media could adopt the Gardoni Scale for news reporting on natural disasters to the public. When events of different hazard types are described as equivalent to each other in terms of their natural forces, we can use the proposed methodology to compute the equivalent hazard magnitudes of these events on the Gardoni Scale to confirm such equivalency. For example, if we adopt the minimum temperature of −26 ∘C at Oklahoma City as the hazard magnitude indicator of the February 2021 cold wave event that severely affected the southern states of the USA (Doss-Gollin et al., 2021), we find that the event had an equivalent hazard magnitude of 5.10 on the Gardoni Scale. This was equivalent to the hazard magnitude of Hurricane Harvey (2017), which had a peak sustained wind speed of 215 km h−1 and a Richter magnitude slightly larger than 7.5. Given such information on equivalency of hazard magnitudes across historical events, individuals or decision makers that may have previously experienced one event may be provided with a better understanding of the human, financial, and material resources that are needed to prepare for a predicted hazard event of similar magnitude.
Beside its utility for emergency management, computation of equivalent hazard strengths of events can enhance hazard profiling and risk analysis within a multi-hazard context. When hazard strengths can be evaluated comparatively across hazard types, we can model hazard frequency and exposure regarding multiple types of hazards simultaneously and create multi-hazard hazard maps. With quantified hazard equivalency, it will also be possible to derive loss ratio curves with respect to a uniform equivalent hazard strength measure to indicate the differences in vulnerability and resilience of individuals, communities, and infrastructures facing hazards across different hazard types. Such multi-hazard quantification of hazard, exposure, vulnerability, and resilience can be integrated to facilitate risk analysis to predict future losses and loss ratios without additional efforts to develop sophisticated models for each individual hazard type. Thus, management of perceived and engineered risks due to natural hazard events would be facilitated by the proposed hazard equivalency methodology. To achieve such multi-hazard quantifications of risks of natural hazard events, more research is needed not only to improve the proposed Gardoni Scale for equivalent agential–durational hazard strengths, but also to explore the modelling of equivalency of other types of hazard strengths, particularly the locational hazard strengths, for hazard management at the local level.
5.2 Implication, limitations, and future work
As shown in the previous section, data points in this study can be visualized as centred along the expectation line, albeit with a large variation (Fig. 4). This implies that the derived equivalent hazard magnitudes may correspond well to the expectation of hazard impacts but without precision. Such a lack of precision is not a limitation. On the contrary, it suggests that impacts of hazard events are not only the result of hazard strength but also correlated with environmental, societal, and infrastructural factors that affect the exposed value and vulnerability of exposed entities within a natural hazard context (Fig. 1). Because of the effect of these factors other than hazard strength, however, the mere inclusion of, or the complete exclusion of, data points with a unique bias toward one direction of these factors will result in biased derivation of equivalent hazard strength metric. To reduce such a bias, in this study we included all available data points of hazard events worldwide and from a long period of 1900–2020. However, there may still be bias due to spatial or temporal concentrations of data points regarding certain hazard types, for example, events that have large hazard magnitudes but small impacts (due to, e.g. no exposed entities or low vulnerability, or under reporting, see, e.g. Paprotny et al., 2018). Future work should examine how to further reduce this potential bias caused by factors of exposed value and vulnerability of exposed entities.
To demonstrate the implementation of the proposed methodology for deriving equivalent hazard magnitudes of events, we only considered one hazard magnitude indicator for each hazard type. For many hazard types, one indicator cannot represent the true hazard magnitude of an event which may arise due to multiple forcings. For example, both wind and precipitation contribute significantly to damages associated with tropical cyclone events (Mudd et al., 2017). Selection of hazard magnitude indicators in this study was also limited by the adopted datasets. As an example, the earthquake Richter magnitude (Richter, 1935) was the only recorded hazard magnitude indicator in the datasets of this study. However, the EM-DAT database reported generically as “Richter magnitude” estimates for earthquake events, even though such estimates may include moment magnitude as well. In addition, regarding tsunami, the mere inclusion of earthquake magnitude of a tsunami-triggering earthquake as the magnitude indicator ignores the fact that tsunamis can also be caused by non-seismic events, such as volcanic island collapses and large coastal landslides. For flood hazards, as another example, there is a lack of established methods to quantify the agential–durational hazard strength metrics. In this study, we used the flooded area as the hazard magnitude indicator for the flood hazards in accordance with the procedure used to create the EM-DAT database (Guha-Sapir et al., 2021). However, the definition of such flooded area is still vague and deserves more research. An ideal agential–durational hazard strength metric for a flood event should integrate multiple flood intensity measures, such as water depth, flood volume, and flow velocity, over the entire flooded area and duration of the event to correspond to the total energy released by the natural force of the event. More effort, therefore, is needed to study, select, and quantify the appropriate hazard magnitude indicators for deriving equivalent hazard magnitudes of events on the Gardoni Scale.
In addition to hazard magnitude indicators, the construction of the impact metric is important for the calibration of regression models and for the derivation of equivalent hazard magnitudes as it is end-user specific. For example, insurance professionals may be interested in an equivalent hazard magnitude that is derived from data on financial and property loss, whereas environmental scientists may be more interested in an impact metric based on ecological damage. Herein, we derived a general metric of impact for equivalent hazard magnitude based on key indicators of societal impact: fatalities, damages, and number of affected individuals. However, hazard events can affect a variety of sectors resulting in impacts to physical, social, economic, and environmental well-being (Lindell and Prater, 2003; Gardoni and Murphy, 2010; Alexander, 2013; Wang et al., 2016, 2021). To advance methodological development for the proposed Gardoni Scale and quantification of other equivalent hazard strength metrics for various stakeholders, future work should scrutinize different indicators as impact variables of events and seek the optimal models to combine impact variables to inform the level of impacts of events for different hazard types.
To support modelling with consideration of hazard magnitude indicators and the impact metric, more statistical, machine learning, and other quantitative models should be pursued to establish the mapping between an equivalent hazard magnitude and the expectation of impacts of hazard events. When data on hazard events with little or zero impacts become available for modelling, we may also apply zero-inflated techniques or other methods to consider the effect of data points with zero impacts to improve the derivation of equivalent hazard magnitudes of events within a multi-hazard context.
Beside these above-mentioned issues, the inclusion and exclusion of certain data points based on values of variables may also affect the results of derivation of equivalency of hazard magnitude. First, in this study, a set of thresholds were adopted to filter out records of events with extremely small and large measures of magnitude indicators. However, some events with magnitude indicator measures barely inside the thresholds, such as the magnitude 3 earthquake in southern Russia in 1999, were still included in the data for modelling. On the other hand, because the EM-DAT database only included events with loss records beyond a set of criteria, numerous events with lesser impacts were not recorded for model calibration in the study. Such exclusion of events with lesser impacts caused the empirical marginal distributions of the logarithmically transformed and standardized impact variables and the impact metric to appear to be approximately Gaussian. Future work should explore to what extent the computation of equivalent hazard magnitude is sensitive to the inclusion and exclusion of data points of events of an either small or large size in terms of both the magnitude indicators and adverse impacts.
In this article, we proposed an equivalent hazard magnitude scale, called the Gardoni Scale, to measure the strength of natural force involved in the entirety of a natural hazard event for comparative analysis across different hazard types. A computational methodology based on PCA and regression modelling was introduced and implemented to demonstrate the methodological utility in derivation of the equivalent hazard magnitudes of events for 12 natural hazard types. The proposed equivalent hazard magnitudes of events on the Gardoni Scale are recommended to be adopted for hazard communication by various stakeholders including news media, decision makers, industry professionals, academic personnel, and the public. By applying the proposed Gardoni Scale, we can also help quantitatively decouple the natural forces of hazard events from the environmental, societal, and infrastructural factors of hazard impacts to support social scientific and engineering research in natural hazard phenomena with a multi-hazard approach. We anticipate that this study on equivalent hazard magnitude will be extended to comparative modelling of other types of hazard strengths of events in a multi-hazard manner to consolidate the foundations for quantifying and studying exposure, vulnerability, recovery, resilience, and other conditions for disaster risk reduction due to natural hazards at both local and global levels.
Six simple linear regression models and three multiple linear regression models with two independent variables were calibrated with the same data points for derivation of the impact metric. These regression models were created to fill in missing values of impact variables for data points with at most two empty entries among the three impact variables. Within each of these nine linear regression models, the dependent variable was one of the three impact variables. For each of the six simple linear regression models, the independent variable was one of the two impact variables that were not used as the dependent variable. The simple linear regression models had the form
where a1=0 and b1 were two model coefficients, IV1 and IV2 were two considered transformed and standardized impact variables, and σ1 was the dispersion parameter. The statistics of parameters of these simple linear regression models are shown in Table A1. Per the three multiple linear regression models with two independent variables, the independent variables were the two impact variables other than the one used as the dependent variable. The formula for the multiple linear regression models was
where a2=0, b2, and c2 were three model coefficients; IV3 was the third transformed and standardized impact variable; and σ2 was the dispersion parameter. Table A2 lists the statistics of parameters of the multiple linear regression models with two independent variables. The missing values of data points were filled with the expectations regressed on the independent variables with available data. The data were then aggregated event-wise to form data points of the dataset for deriving the equivalent hazard magnitudes.
Table A1Statistics of parameters of six simple linear regression models for filling in missing values of impact variablesa.
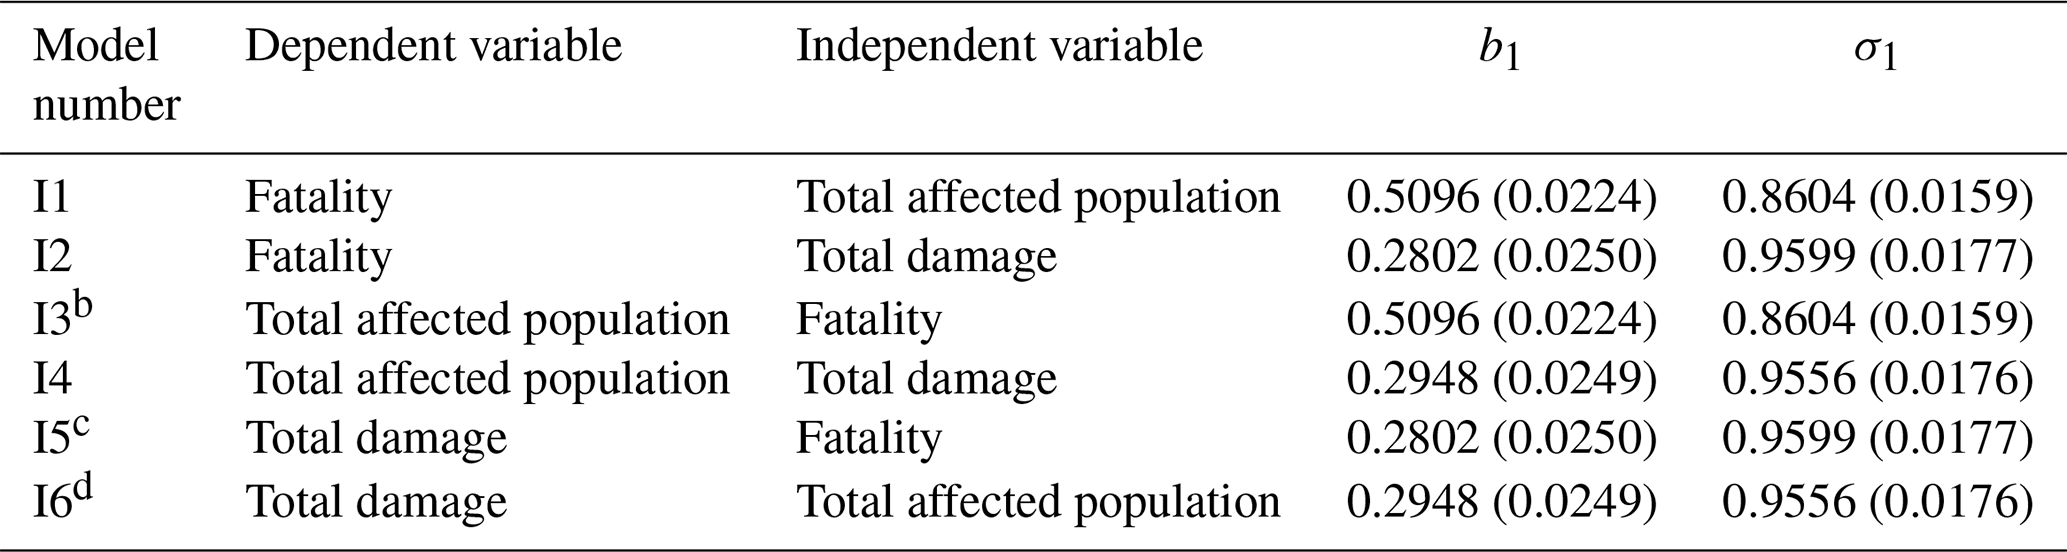
a This table corresponds to Data S2 in the Supplement; R2 measures are included in Fig. 2; standard errors are in the parentheses; estimations of b1 and σ1 are all significant at . b Models I1 and I3 share the same model parameters and R2 measures. c Models I2 and I5 share the same model parameters and R2 measures. d Models I4 and I6 share the same model parameters and R2 measures.
Table A2Statistics of parameters of three multiple linear regression models with two independent variables for filling in missing values of impact variablesa.
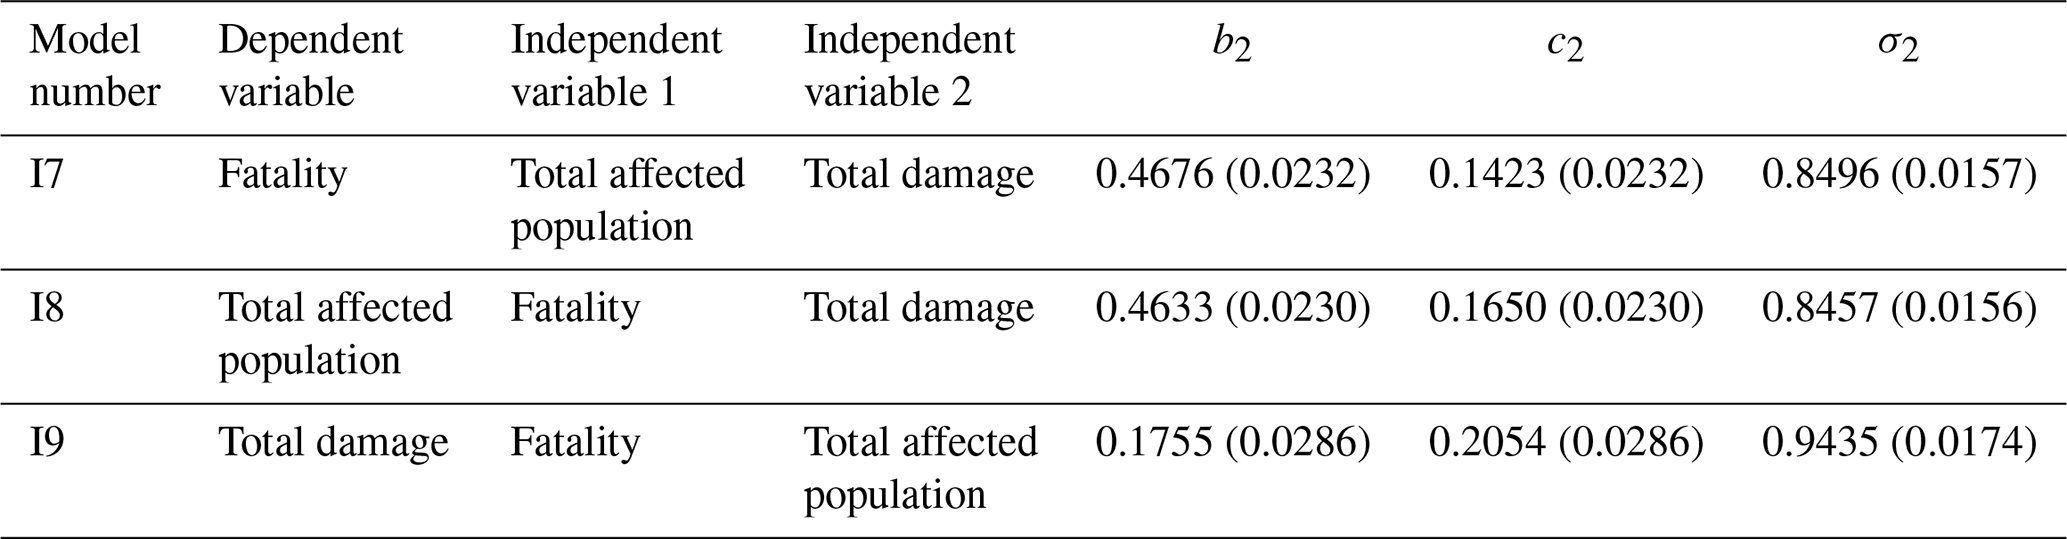
a This table corresponds to Data S3 in the Supplement; R2 measures are included in Fig. 2; standard errors are in the parentheses; estimations of b2, c2, and σ2 are all significant at .
Python codes and data that support this study are available at https://doi.org/10.15139/S3/DJV7CR (Wang and Sebastian, 2020).
Video S1 shows the distribution of data points with respect to impact variables and the impact metric. The supplement related to this article is available online at: https://doi.org/10.5194/nhess-22-4103-2022-supplement.
YVW was responsible for design of the study, data collection, data processing, and coding. Data analysis, drafting, and critical review of the paper were undertaken by both authors.
The contact author has declared that neither of the authors has any competing interests.
Publisher’s note: Copernicus Publications remains neutral with regard to jurisdictional claims in published maps and institutional affiliations.
Yi Victor Wang would like to thank Paolo Gardoni and Colleen Murphy for inspiring discussions and suggestions.
The article processing charges are covered by the Institute for Earth, Computing, Human and Observing (ECHO) at Chapman University.
This paper was edited by Mario Parise and reviewed by John K. Hillier and three anonymous referees.
Adger, W. N.: Vulnerability, Global Environ. Chang., 16, 268–281, https://doi.org/10.1016/j.gloenvcha.2006.02.006, 2006.
Alexander, D. E.: Impact, definition of, in: Encyclopedia of Crisis Management, edited by: Penuel, K. B., Statler, M., and Hagen, R., SAGE Publication, Thousands Oaks, CA, 488–490, https://doi.org/10.4135/9781452275956.n167, 2013.
Alexander, D. E.: A magnitude scale for cascading disasters, Int. J. Disast. Risk Re., 30, 180–185, https://doi.org/10.1016/j.ijdrr.2018.03.006, 2018.
Bell, G. D. Halpert, M. S., Schnell, R. C., Higgins, R. W., Lawrimore, J., Kousky, V. E., Tinker, R., Thiaw, W., Chelliah, M., and Artusa, A.: Climate assessment for 1999, B. Am. Meteorol. Soc., 81, S1–S50, https://doi.org/10.1175/1520-0477(2000)81[s1:CAF]2.0.CO;2, 2000.
Bensi, M., Mohammadi, S., Kao, S.-C., and DeNeale, S. T.: Multi-Mechanism Flood Hazard Assessment: Critical Review of Current Practice and Approaches, Oak Ridge National Laboratory, Oak Ridge, TN, https://doi.org/10.2172/1649363, 2020.
Birkmann, J., Kienberger, S., and Alexander, D. E. (Eds.): Assessment of Vulnerability to Natural Hazards: A European Perspective, Elsevier, Amsterdam, the Netherlands, https://doi.org/10.1016/C2012-0-03330-3, 2014.
Blong, R.: A review of damage intensity scales, Nat. Hazards, 29, 57–76, https://doi.org/10.1023/A:1022960414329, 2003.
Burton, C. G.: Social vulnerability and hurricane impact modelling, Nat. Hazards Rev., 11, 58–68, https://doi.org/10.1061/(ASCE)1527-6988(2010)11:2(58), 2010.
Byun, H.-R. and Wilhite, D. A.: Objective quantification of drought severity and duration, J. Climate, 12, 2747–2756, https://doi.org/10.1175/1520-0442(1999)012<2747:OQODSA>2.0.CO;2, 1999.
Choi, E., Ha, J.-G., Hahm, D., and Kim, M. K.: A review of multihazard risk assessment: Progress, potential, and challenges in the application to nuclear power plants, Int. J. Disast. Risk Re., 53, 101933, https://doi.org/10.1016/j.ijdrr.2020.101933, 2021.
Coburn, A. and Spence, R.: Earthquake Protection, 2nd edn., John Wiley & Sons, Ltd, Chichester, UK, ISBN 978-0470855171, 2002.
Dilley, M., Chen, R. S., Deichmann, U., Lerner-Lam, A. L., Arnold, M., Agwe, J., Buys, P., Kjekstad, O., Lyon, B., and Yetman, G.: Natural Disaster Hotspots: A Global Risk Analysis, The World Bank, Washington, DC, ISBN 978-0821359303, http://hdl.handle.net/10986/7376 (last access: 20 December 2022), 2005.
Doss-Gollin, J., Farnham, D. J., Lall, U., and Modi, V.: How unprecedented was the February 2021 Texas cold snap?, EarthArXiv, https://doi.org/10.31223/X5003J, 2021.
Dotzek, N.: Derivation of physically motivated wind speed scales, Atmos. Res., 93, 564–574, https://doi.org/10.1016/j.atmosres.2008.10.015, 2009.
Emanuel, K.: Increasing destructiveness of tropical cyclones over the past 30 years, Nature, 436, 686–688, https://doi.org/10.1038/nature03906, 2005.
Fujita, T. T.: Proposed Characterization of Tornadoes and Hurricanes by Area and Intensity, the University of Chicago, Chicago, IL, https://ntrs.nasa.gov/citations/19720008829 (last access: 20 December 2022), 1971.
Fujita, T. T.: Tornadoes and downbursts in the context of generalized planetary scales, J. Atmos. Sci., 38, 1511–1534, https://doi.org/10.1175/1520-0469(1981)038<1511:TADITC>2.0.CO;2, 1981.
Gardoni, P. and Murphy, C.: Gauging the societal impacts of natural disasters using a capability approach, Disasters, 34, 619–636, https://doi.org/10.1111/j.1467-7717.2010.01160.x, 2010.
Grünthal, G. (Ed.): European Macroseismic Scale 1998, European Seismological Commission, Luxembourg, http://www.bcsf.prd.fr/EMS98_Original_english.pdf (last access: 20 December 2022), 1998.
Guha-Sapir, D., Hoyois, P., and Below, R.: EM-DAT Public, https://public.emdat.be/, last access: 10 March 2021.
Hebert, C. G., Weinzapfel, R. A., and Chambers, M. A.: Hurricane Severity Index: A new way of estimating a tropical cyclone's destructive potential, 19th Conference on Probability and Statistics, 20–24 January 2008, New Orleans, LA, USA, 2008.
Highfield, W. E., Peacock, W. G., and Van Zandt, S.: Mitigation planning: Why hazard exposure, structural vulnerability, and social vulnerability matter, J. Plan. Educ. Res., 34, 287–300, https://doi.org/10.1177/0739456X14531828, 2014.
Hillier, J. K. and Dixon, R. S.: Seasonal impact-based mapping of compound hazards, Environ. Res. Lett., 15, 114013, https://doi.org/10.1088/1748-9326/abbc3d, 2020.
Hillier, J. K., Macdonald, N., Leckebusch, G. C., and Stavrinides, A.: Interactions between apparently “primary” weather-driven hazards and their cost, Environ. Res. Lett., 10, 104003, https://doi.org/10.1088/1748-9326/10/10/104003, 2015.
Hillier, J. K., Matthews, T., Wilby, R., and Murphy, C.: Multi-hazard dependencies can increase or decrease risk, Nat. Clim. Change, 10, 595–598, https://doi.org/10.1038/s41558-020-0832-y, 2020.
Hunt, E. D., Hubbard, K. G., Wilhite, D. A., Arkebauer, T. J., and Dutcher, A. L.: The development and evaluation of a soil moisture index, Int. J. Climatol., 29, 747–759, https://doi.org/10.1002/joc.1749, 2009.
Jolliffe, I. T.: Principal Component Analysis, 2nd edn., Springer, New York, NY, https://doi.org/10.1007/b98835, 2002.
Jolliffe, I. T. and Cadima, J.: Principal component analysis: A review and recent developments, Phil. Trans. R. Soc. A, 374, 20150202, https://doi.org/10.1098/rsta.2015.0202, 2016.
Kaiser, A., Holden, C., Beavan, J., Beetham, D., Benites, R., Celentano, A., Collett, D., Cousins, J., Cubrinovski, M., Dellow, G., Denys, P., Fielding, E., Fry, B., Gerstenberger, M., Langridge, R., Massey, C., Motagh, M., Pondard, N., McVerry, G., Ristau, J., Stirling, M., Thomas, J., Uma, S. R., and Zhao, J.: The Mw 6.2 Christchurch earthquake of February 2011: Preliminary report, New Zeal. J. Geol. Geop., 55, 67–90, https://doi.org/10.1080/00288306.2011.641182, 2012.
Kanamori, H.: The energy release in great earthquakes, J. Geophys. Res., 82, 2981–2987, https://doi.org/10.1029/JB082i020p02981, 1977.
Katsumata, A.: Comparison of magnitudes estimated by the Japan Meteorological Agency with moment magnitudes for intermediate and deep earthquakes, B. Seismol. Soc. Am., 86, 832–842, https://doi.org/10.1785/BSSA0860030832, 1996.
Keller, A. Z., Wilson, H. C., and Al-Madhari, A.: Proposed disaster scale and associated model for calculating return periods for disasters of given magnitude, Disast. Prev. Manag., 1, https://doi.org/10.1108/09653569210011093, 1992.
Keller, A. Z., Meniconi, M., Al-Shammari, I., and Cassidy, K.: Analysis of fatality, injury, evacuation and cost data using the Bradford Disaster Scale, Disast. Prev. Manag., 6, 33–42, https://doi.org/10.1108/09653569710162433, 1997.
Klijn, F., Kreibich, H., de Moel, H., and Penning-Rowsell, E.: Adaptive flood risk management planning based on a comprehensive flood risk conceptualisation, Mitig. Adapt. Strateg. Glob. Change, 20, 845–864, https://doi.org/10.1007/s11027-015-9638-z, 2015.
Lindell, M. K.: Disaster studies, Curr. Sociol. Rev., 61, 797–825, https://doi.org/10.1177/0011392113484456, 2013.
Lindell, M. K. and Prater, C. S.: Assessing community impacts of natural disasters, Nat. Hazards Rev., 4, 176–185, https://doi.org/10.1061/(ASCE)1527-6988(2003)4:4(176), 2003.
Malherbe, J., Smit, I. P. J., Wessels, K. J., and Beukes, P. J.: Recent droughts in the Kruger National Park as reflected in the extreme climate index, Afr. J. Range For. Sci., 37, 1–17, https://doi.org/10.2989/10220119.2020.1718755, 2020.
McEntire, D. A.: Why vulnerability matters: Exploring the merit of an inclusive disaster reduction concept, Disast. Prev. Manag., 14, 206–222, https://doi.org/10.1108/09653560510595209, 2005.
McKee, T. B., Doesken, N. J., and Kleist, J.: The relationship of drought frequency and duration to time scales, in: Proceedings of the Eighth Conference on Applied Climatology, 17–22 January 1993, Anaheim, CA, USA, 179–183, https://climate.colostate.edu/pdfs/relationshipofdroughtfrequency.pdf (last access: 20 December 2022), 1993.
Meaden, G. T., Kochev, S., Kolendowicz, L., Kosa-Kiss, A., Marcinoniene, I., Sioutas, M., Tooming, H., and Tyrrell, J.: Comparing the theoretical versions of the Beaufort scale, the T-scale and the Fujita scale, Atmos. Res., 83, 446–449, https://doi.org/10.1016/j.atmosres.2005.11.014, 2007.
Mitchell-Wallace, K., Jones, M., Hillier, J., and Foote, M. (Eds.): Natural Catastrophe Risk Management and Modelling: A Practitioner's Guide, John Wiley & Sons, Ltd, Chichester, UK, ISBN 978-1118906040, 2017.
Mudd, L., Rosowsky, D., Letchford, C., and Lombardo, F.: Joint probabilistic wind–rainfall model for tropical cyclone hazard characterization, J. Struct. Eng., 143, 04016195, https://doi.org/10.1061/(ASCE)ST.1943-541X.0001685, 2017.
Nigg, J. M. and Mileti, D.: Natural hazards and disasters, Disaster Research Center, DE, Preliminary Paper, 261, https://udspace.udel.edu/bitstream/handle/19716/280/PP+261.pdf?sequence=1 (last access: 20 December 2022), 1997.
O'Keefe, P., Westgate, K., and Wisner, B.: Taking the naturalness out of natural disasters, Nature, 260, 566–567, https://doi.org/10.1038/260566a0, 1976.
Palmer, W. C.: Meteorological Drought, US Department of Commerce, Washington, DC, https://www.droughtmanagement.info/literature/USWB_Meteorological_Drought_1965.pdf (last access: 20 December 2022), 1965.
Palmer, W. C.: Keeping track of crop moisture conditions, nationwide: The new Crop Moisture Index, Weatherwise, 21, 156–161, https://doi.org/10.1080/00431672.1968.9932814, 1968.
Paprotny, D., Sebastian, A., Morales-Nápoles, O., and Jonkman, S. N.: Trends in flood losses in Europe over the past 150 years, Nat. Commun., 9, 1985, https://doi.org/10.1038/s41467-018-04253-1, 2018
Peduzzi, P., Dao, H., Herold, C., and Mouton, F.: Assessing global exposure and vulnerability towards natural hazards: the Disaster Risk Index, Nat. Hazards Earth Syst. Sci., 9, 1149–1159, https://doi.org/10.5194/nhess-9-1149-2009, 2009.
Potter, S.: Fine-tuning Fujita: After 35 years, a new scale for rating tornadoes takes effect, Weatherwise, 62, 64–71, https://doi.org/10.3200/WEWI.60.2.64-71, 2007.
Powell, M. D. and Reinhold, T. A.: Tropical cyclone destructive potential by integrated kinetic energy, B. Am. Meteorol. Soc., 88, 513–526, https://doi.org/10.1175/BAMS-88-4-513, 2007.
Raphson, J.: Analysis Aequationum Universalis Seu Ad Aequationes Algebraicas Resolvendas Methodus Generalis, & Expedita, Ex Nova Infinitarum Serierum Methodo, Deducta Ac Demonstrata: Cui Annexum Est de Spatio Reali, Seu Ente Infinito Conamen Mathematico-Metaphysicum, Braddyll, London, Kingdom of England, https://doi.org/10.3931/e-rara-13516, 1697.
Rautian, T. G., Khalturin, V. I., Fujita, K., Mackey, K. G., and Kendall, A. D.: Origins and methodology of the Russian Energy K-Class System and its relationship to magnitude scales, Seismol. Res. Lett., 78, 579–590, https://doi.org/10.1785/gssrl.78.6.579, 2007.
Richter, C. F.: An instrumental earthquake magnitude scale, B. Seismol. Soc. Am., 25, 1–32, https://doi.org/10.1785/BSSA0250010001, 1935.
Rohn, E. and Blackmore, D.: A unified localizable emergency events scale, Int. J. Inf. Syst. Crisis Res. Manag., 1, 1–14, https://doi.org/10.4018/jiscrm.2009071001, 2009.
Rohn, E. and Blackmore, D.: The augmented unified localizable crisis scale, Technol. Forecast. Soc. Chang., 100, 186–197, https://doi.org/10.1016/j.techfore.2015.06.017, 2015.
Serva, L., Vittori, E., Comerci, V., Esposito, E., Guerrieri, L., Michetti, A. M., Mohammadioun, B., Mohammadioun, G. C., Porfido, S., and Tatevossian, R. E.: Earthquake hazard and the Environmental Seismic Intensity (ESI) scale, Pure Appl. Geophys., 173, 1479–1515, https://doi.org/10.1007/s00024-015-1177-8, 2016.
Shafer, B. A. and Dezman, L. E.: Development of a surface water supply index (SWSI) to assess the severity of drought conditions in snowpack runoff areas, in: Proceedings of the 50th Annual Western Snow Conference, 19–21 April 1982, Reno, NV, USA, https://westernsnowconference.org/sites/westernsnowconference.org/PDFs/1982Shafer.pdf (last access: 20 December 2022), 1982.
Shukla, S. and Wood, A. W.: Ise of a standardized runoff index for characterizing hydrologic drought, Geophys. Res. Lett., 35, L02405, https://doi.org/10.1029/2007GL032487, 2008.
Simpson, R. H. and Saffir, H.: The hurricane Disaster–Potential Scale, Weatherwise, 27, 169–186, https://doi.org/10.1080/00431672.1974.9931702, 1974.
United States Geological Survey (USGS): M9.2 Alaska earthquake and tsunami of March 27, 1964, USGS, Reston, VA, USA, https://earthquake.usgs.gov/earthquakes/events/alaska1964/ (last access: 20 December 2022), 2021.
van de Lindt, J. W., Peacock, W. G., Mitrani-Reiser, J., Rosenheim, N., Deniz, D., Dillard, M., Tomiczek, T., Koliou, M., Graettinger, A., Crawford, P. S., Harrison, K., Barbosa, A., Tobin, J., Helgeson, J., Peek, L., Memari, M., Sutley, E. J., Hamideh, S., Gu, D., Cauffman, S., and Fung, J.: Community resilience-focused technical investigation of the 2016 Lumberton, North Carolina, flood: An interdisciplinary approach, Nat. Hazards Rev., 21, 04020029, https://doi.org/10.1061/(ASCE)NH.1527-6996.0000387, 2020.
Wald, D. J., Worden, B. C., Quitoriano, V., and Pankow, K. L.: ShakeMap Manual: Technical Manual, User's Guide, and Software Guide, US Geological Survey, Reston, VA, USA, https://doi.org/10.3133/tm12A1, 2006.
Wang, Y. V.: Empirical local hazard models for bolide explosions, Nat. Hazards Rev., 21, 04020037, https://doi.org/10.1061/(ASCE)NH.1527-6996.0000405, 2020.
Wang, Y. V. and Sebastian, A.: Data for deriving equivalent hazard magnitude scale (Version V2), University of North Carolina Dataverse [data set, code], https://doi.org/10.15139/S3/DJV7CR, 2020.
Wang, Y. V. and Sebastian, A.: Community flood vulnerability and risk assessment: An empirical predictive modelling approach, J. Flood Risk Manag., 14, e12739, https://doi.org/10.1111/jfr3.12739, 2021.
Wang, Y. V. and Sebastian, A.: Murphy Scale: A locational equivalent intensity scale for hazard events, Risk Anal., https://doi.org/10.1111/risa.13933, online first, 2022.
Wang, Y. V., Tabandeh, A., Gardoni, P., Hurt, T. M., Hartman, E. R., and Myers, N. R.: Assessing socioeconomic impacts of cascading infrastructure disruptions using the Capability Approach, US Army Engineer Research and Development Center Construction Engineering Research Lab, Champaign, IL, USA, 130 pp., https://apps.dtic.mil/sti/citations/AD1016582 (last access: 20 December 2022), 2016.
Wang, Y. V., Gardoni, P., Murphy, C., and Guerrier, S.: Predicting fatality rates due to earthquakes accounting for community vulnerability, Earthq. Spectra, 35, 513–536, https://doi.org/10.1193/022618EQS046M, 2019.
Wang, Y. V., Gardoni, P., Murphy, C., and Guerrier, S.: Worldwide predictions of earthquake casualty rates with seismic intensity measure and socioeconomic data: A fragility-based formulation, Nat. Hazards Rev., 21, 04020001, https://doi.org/10.1061/(ASCE)NH.1527-6996.0000356, 2020.
Wang, Y. V., Gardoni, P., Murphy, C., and Guerrier, S.: Empirical predictive modelling approach to quantifying social vulnerability to natural hazards, Ann. Am. Assoc. Geogr., 111, 1559–1583, https://doi.org/10.1080/24694452.2020.1823807, 2021.
Wisner, B., Blaikie, P., Cannon, T., and Davis, I.: At Risk: Natural Hazards, People's Vulnerability and Disasters, 2nd edn., Routledge, London, UK, https://doi.org/10.4324/9780203714775, 2004.
Wood, H. O. and Neumann, F.: Modified Mercalli intensity scale of 1931, B. Seismol. Soc. Am., 21, 277–283, https://doi.org/10.1785/BSSA0210040277, 1931.