the Creative Commons Attribution 4.0 License.
the Creative Commons Attribution 4.0 License.
 | 28 Nov 2022
Multi-scenario urban flood risk assessment by integrating future land use change models and hydrodynamic models
Qinke Sun
Xuewei Dang
Kepeng Xu
Yongqiang Fang
Min Liu
Urbanization and climate change are critical challenges in the 21st century. Flooding by extreme weather events and human activities can lead to catastrophic impacts in fast-urbanizing areas. However, high uncertainty in climate change and future urban growth limit the ability of cities to adapt to flood risk. This study presents a multi-scenario risk assessment method that couples a future land use simulation (FLUS) model and floodplain inundation model (LISFLOOD-FP) to simulate and evaluate the impacts of future urban growth scenarios with flooding under climate change (two representative concentration pathways (RCP2.6 and RCP8.5)). By taking the coastal city of Shanghai as an example, we then quantify the role of urban planning policies in future urban development to compare urban development under multiple policy scenarios (business as usual, growth as planned, growth as eco-constraints). Geospatial databases related to anthropogenic flood protection facilities, land subsidence and storm surge are developed and used as inputs to the LISFLOOD-FP model to estimate flood risk under various urbanization and climate change scenarios. The results show that urban growth under the three scenario models manifests significant differences in expansion trajectories, influenced by key factors such as infrastructure development and policy constraints. Comparing the urban inundation results for the RCP2.6 and RCP8.5 scenarios, the urban inundation area under the growth-as-eco-constraints scenario is less than that under the business-as-usual scenario but more than that under the growth-as-planned scenario. We also find that urbanization tends to expand more towards flood-prone areas under the restriction of ecological environment protection. The increasing flood risk information determined by model simulations helps us to understand the spatial distribution of future flood-prone urban areas and promote the re-formulation of urban planning in high-risk locations.
- Article
(8365 KB) - Full-text XML
-
Supplement
(815 KB) - BibTeX
- EndNote


Climate change and urbanization are global challenges for the 21st century (Ramaswami et al., 2016; Pecl et al., 2017). Floods have been key threats for many cities around the world and are driven by global climate change (Hallegatte et al., 2013; IPCC, 2014; Fang et al., 2020). Currently, more than 600 million people worldwide live in coastal cities that are less than 10 m above sea level (m a.s.l.; United Nations, 2017). The United Nations reports that the global population living in cities is projected to reach 6.7 billion by 2050 (United Nations, 2018); especially in low-elevation coastal areas, the population density is expected to be twice the current population density (Van Coppenolle and Temmerman, 2019), which means that the populations of coastal cities will become increasingly concentrated in the future and impervious surfaces will become more numerous (Chen et al., 2020; He et al., 2021). On the other hand, a National Oceanic and Atmospheric Administration (NOAA) report suggests that the global mean sea level will rise around 0.2 to 2.0 m by 2100 under a continuing global warming trend (Parris et al., 2012). Additionally, properties and populations in many coastal areas will suffer more severely in the future if the effects of land subsidence are taken into account (Vousdoukas et al., 2018).
However, high uncertainty in flood risk and urban growth leads to a lack of capacity of cities to respond to the flooding arising from future climate change (Du et al., 2015; Tessler et al., 2015; Fang et al., 2021). Therefore, there is an urgent need for specialist knowledge and techniques to address the conflict between urbanization and flood risk (Wang et al., 2015; Lai et al., 2016; Bouwer, 2018; Haynes et al., 2018). Studies on urban flood risk assessment are more likely to simulate flood risk using different climate change scenarios or integrating different flood sources (Huong and Pathirana, 2013; Muis et al., 2015; Dullo et al., 2021). For example, Zhou et al. (2019) examine the impact of urban flood volumes and associated risks under RCP2.6 and RCP8.5 scenarios. Parodi et al. (2020) integrate the compound flood scenarios such as wave height, storm surge and extreme sea level due to sea level rise to assess coastal flood risk. However, ignoring the uncertainty of urban growth in urban flood risk assessment reduces the validity of the assessment (Gori et al., 2019), and hence an increased understanding of possible urban growth scenarios is needed; otherwise there is a lack of understanding of the consequences of future flooding (Zhao et al., 2017; Kim and Newman, 2020). Although there are some studies that have quantified urban growth and assessed flood risk, such as in Chennai (Nithila Devi et al., 2019), Guangzhou (Lin et al., 2020) and Shanghai (Shan et al., 2022), these studies have not considered the development of urban areas under different growth scenarios and the assessment of flood impacts after the implementation of these scenarios. In addition, the failure to integrate with broader climate-change-related scenarios and possible extreme-case flood risks has led to underinvestment in climate adaptation actions by governments that do not adequately address the spatial consequences of future floods (Reckien et al., 2018; Berke et al., 2019). Thus, there is an urgent need to adopt a more comprehensive approach to assess the complexity of multiple possible scenarios of urbanization and dynamic flood risk in an integrated manner.
This paper uses the coupling of the future land use simulation (FLUS) model and the 2D floodplain inundation model (LISFLOOD-FP) to explore the possible interaction between different urbanization development scenarios and climate change scenarios. The FLUS model improves the simulation accuracy of the model by combining artificial neural network (ANN) and cellular automaton (CA) models to simulate nonlinear land use changes while considering parameters related to environment, society, climate change, etc. (Liu et al., 2017; Zhai et al., 2020). The LISFLOOD-FP model has become a mature hydrodynamic model that can predict potential flood events in near real time and is widely used in engineering applications (Wing et al., 2019; Sosa et al., 2020). The coastal metropolitan area of Shanghai in the Yangtze River Delta in China, one of the fastest-urbanizing cities in the world, is used as a case study.
The paper asks how different urban growth scenarios combined with climate change scenario analysis may help to inform preparedness for flood risks from climate change in urban flood risk assessments. To answer this question, we first assumed some future simulation scenarios by considering the factors that influence urban growth and lead to flood risk. Secondly, we coupled urban growth and flood risk scenarios and compared them using climate change scenarios from two representative concentration pathways (RCP2.6 and RCP8.5) proposed by the Intergovernmental Panel on Climate Change (IPCC). Finally, we assessed the risk of flooding in different urban development scenarios. The research illustrates the importance of assessing the performance of different future urban development scenarios in response to climate change, and the simulation study of urban risks will prove to decision makers that incorporating disaster prevention measures into urban development plans will help to reduce disaster losses and improve the ability of urban systems to respond to floods.
2.1 Study area
As the alluvial plain of the Yangtze River Delta, Shanghai is located on the coast of the East China Sea between 30∘40′–31∘53′ N and 120∘52′–122∘12′ E, which borders the provinces of Jiangsu and Zhejiang to the west (Fig. 1). It is a typical middle-latitude transition belt, a marine–land transitional zone, and also a typical estuarine and coastal city with a fragile ecological environment. The land area of Shanghai is about 6340.50 km2, accounting for 0.06 % of the total area of China, and has 213 km of coastlines. The Shanghai metropolitan area has undergone rapid urban expansion in the past decades and has become one of the largest urban areas in the world in both size and population (Sun et al., 2020). However, Shanghai's topography is low, with an average elevation of 4 m a.s.l., and there is no natural barrier against storm surges. In 1905, one of the deadliest storm surges occurred in Shanghai, killing more than 29 000 people. Typhoon Winnie made landfall in Shanghai 2 years later and flooded more than 5000 households (Du et al., 2020). The reasons for Shanghai's greater vulnerability might include the multiple effects of sea level rise due to climate warming, ground subsidence and storm surge water gain.
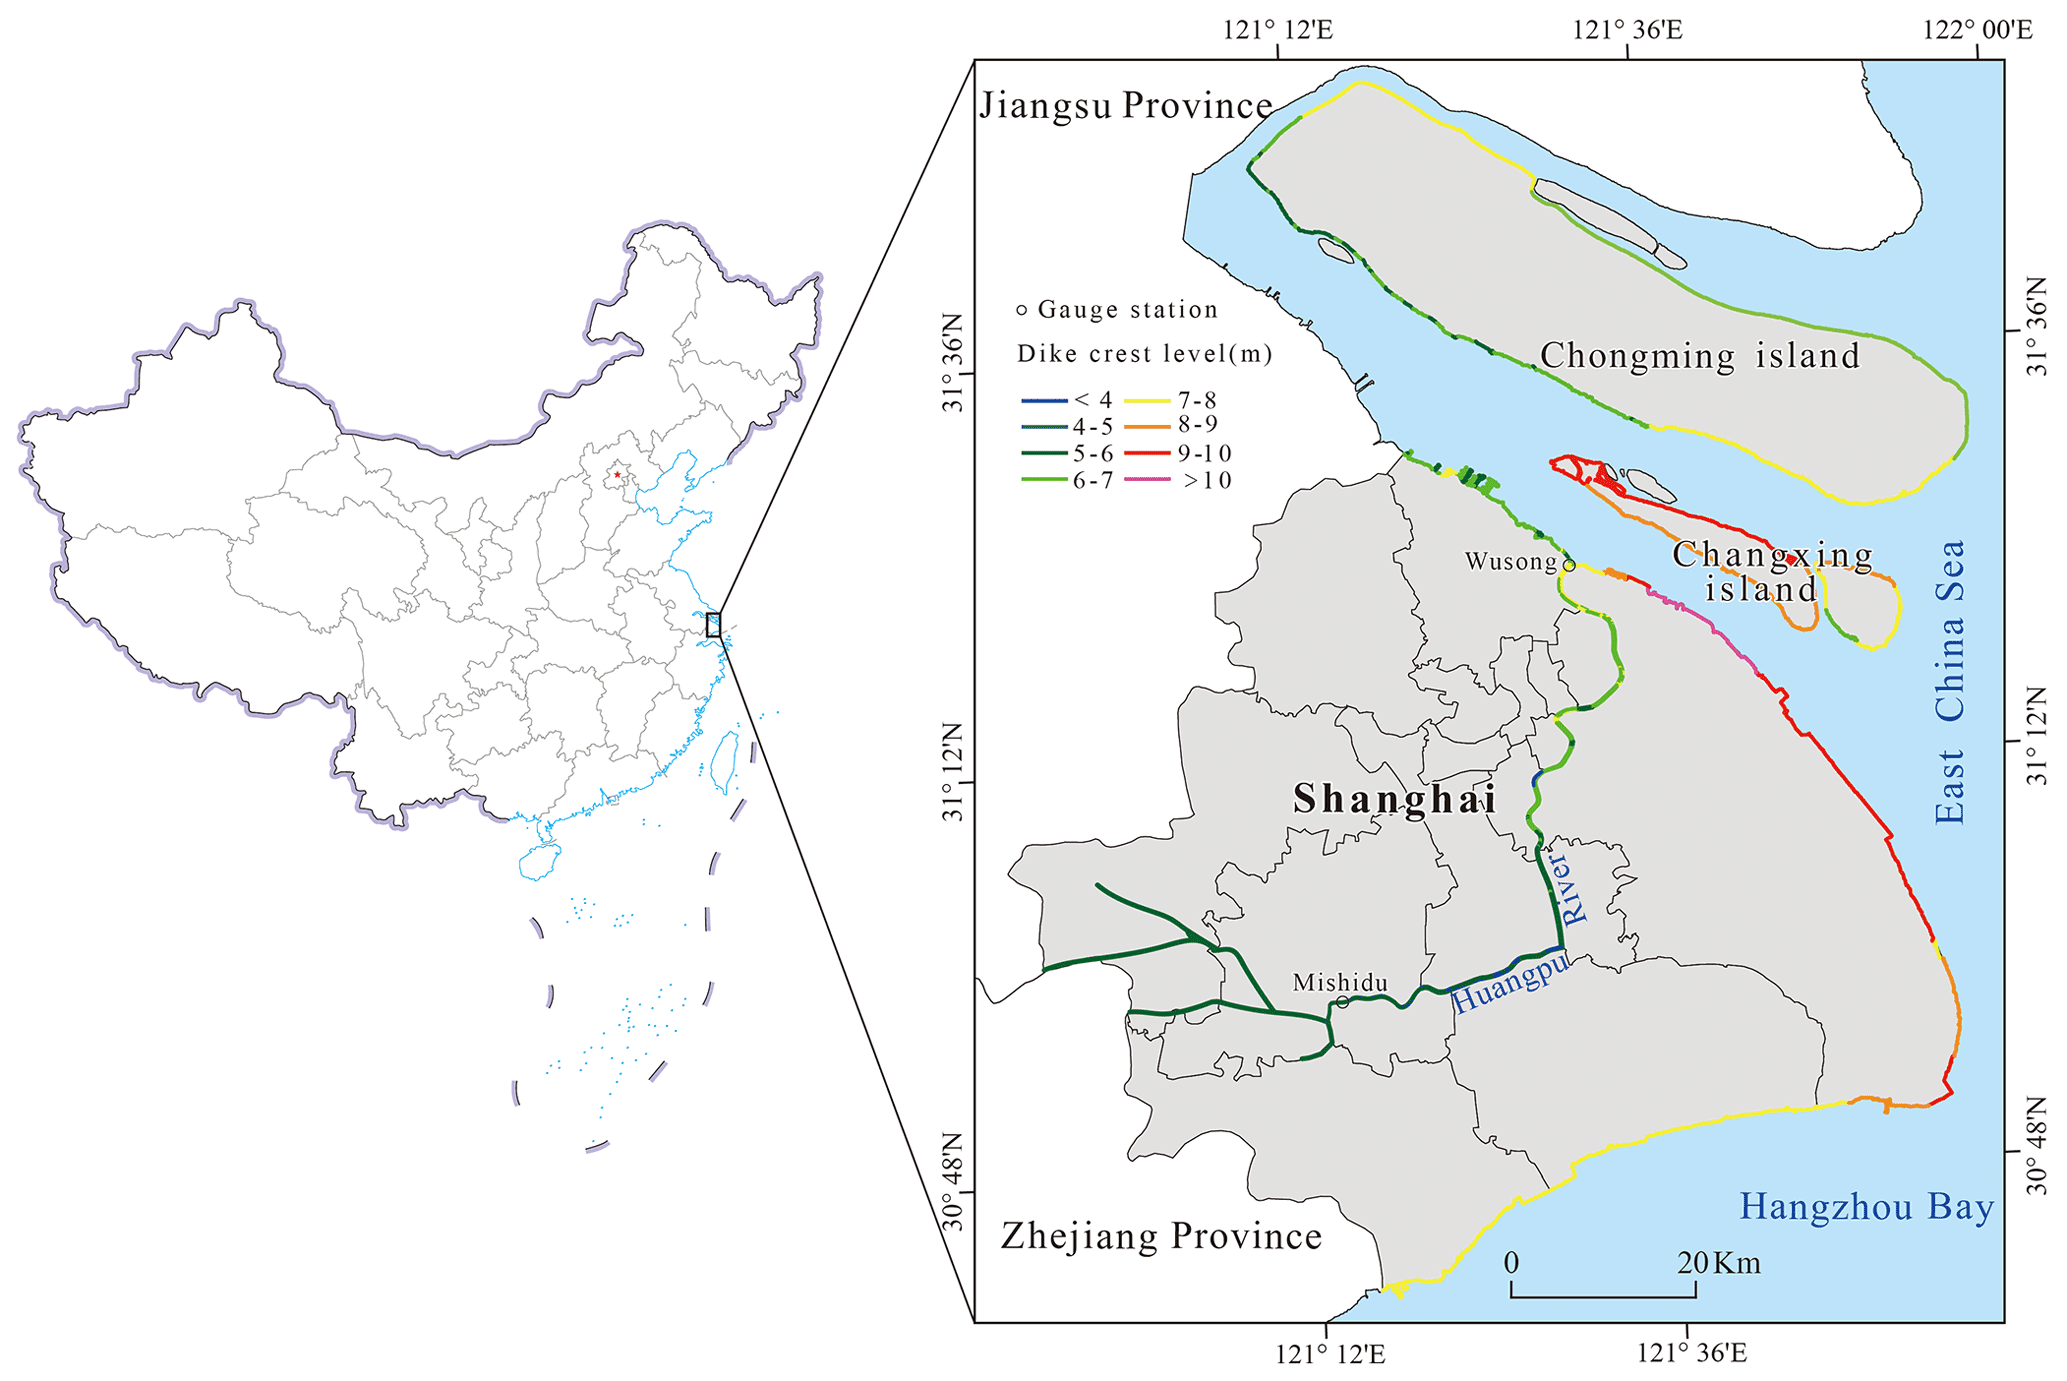
Figure 1Location map of the study area. The main inland rivers in Shanghai flow into the East China Sea through the Huangpu River. The lines with colored vectors in the figure indicate the different dike crest levels in Shanghai.
2.2 Data
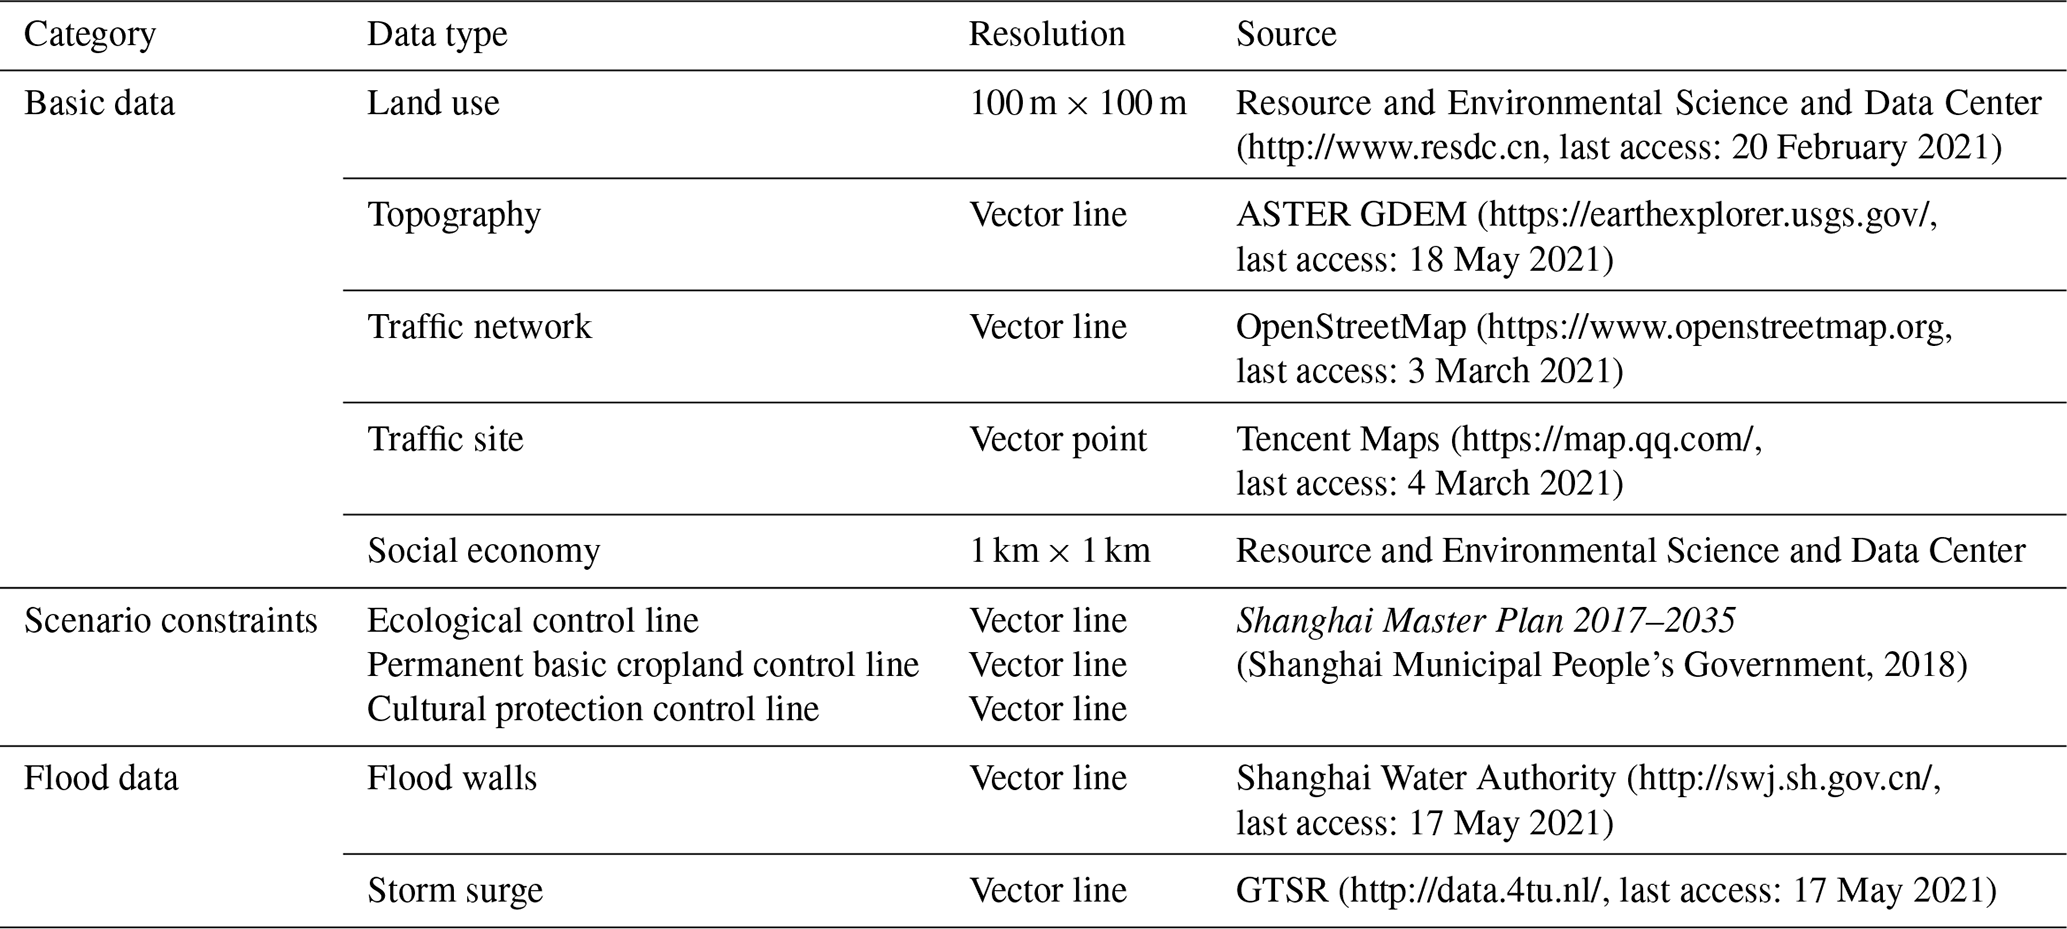
The research used three main categories of data, including basic data, scenario constraint data and flood simulation data (Table 1). The basic data include land use, topography, traffic network, traffic site and socioeconomic data. The land use data with a resolution of 100 m × 100 m from the Resource and Environmental Science and Data Center of the Chinese Academy of Sciences comprise currently the most accurate land use remote sensing monitoring data product in China (Liu et al., 2014). The data for 2005 and 2010 were derived from Landsat TM and Landsat ETM+ remote sensing image data, respectively, and the data for 2015 were interpreted using Landsat 8 remote sensing imagery. After the data were corrected and visually interpreted, the comprehensive evaluation accuracy of the interpretation accuracy of the first-class types of cultivated land, woodland, grassland, water area, urban land and unused land reached more than 94.30 %, and the discrimination accuracy rate on the map patches reached 98.70 % (Xu et al., 2017). Within the allowable error range, they can be used as the basic data for analyzing land use changes.
Topography factors (digital elevation model, DEM; slope), traffic network factors (distance to railway, highway, subway and main roads), traffic site factors (distance to the city center, train station and airports), socioeconomic factors (population; gross domestic product, GDP), etc., as well as planning constraints, were determined to be spatial-influence factors of the flood risk assessment of the Shanghai area. The Advanced Spaceborne Thermal Emission and Reflection Radiometer (ASTER) Global Digital Elevation Model (GDEM), which has a 30 m resolution, served as the basis data for terrain heights and slopes. The ASTER GDEM has been shown to be the most stable data performer among six types of open-access DEM products (SRTM, ASTER GDEM, AW3D, MERIT, NASADEM and CoastalDEM) for flood inundation simulations with different return periods (Xu et al., 2021). The traffic network and site were collected from open-source data retrieved from OpenStreetMap (OSM), and point of interest (POI) data were extracted from Tencent Maps. The Euclidean distance was calculated for all vector data. The data of population and GDP were provided by the Resource and Environmental Science and Data Center of the Chinese Academy of Sciences (Xu, 2017a, b), and their time span was consistent with the land use data. According to the simulation forecast demand, all materials were converted into a 100 × 100 m grid by resampling. The factors limiting space development were the basic ecological control line, permanent basic cropland and cultural protection control line as outlined in the Shanghai Master Plan 2017–2035 (Shanghai Municipal People's Government, 2018). All the impact factor data were normalized, and the range of values is between 0 and 1 for subsequent data mining.
The storm surge data are derived from the Global Tide and Surge Reanalysis (GTSR) dataset, which contains the values of storm surge and extreme water levels for different return periods simulated using hydrodynamic modeling based on the water levels of global tide stations from 1979–2016. The data are vector data covering the global coastline and were obtained from 4TU.ResearchData (see Supplement Fig. S1 for GTSR data in this study area). This dataset has been widely used in different regions of the world and has been validated to be of good accuracy (Muis et al., 2016). In addition, artificially constructed flood defenses have been considered to reasonably evaluate the inundation impact of the flooding. The constructed flood defense data were obtained from the historical archival of the Shanghai Water Authority (Yin et al., 2020). All data sources are listed in Table 1.
Table 1Data required and sources. The list details the resolution and sources of the data in the study.
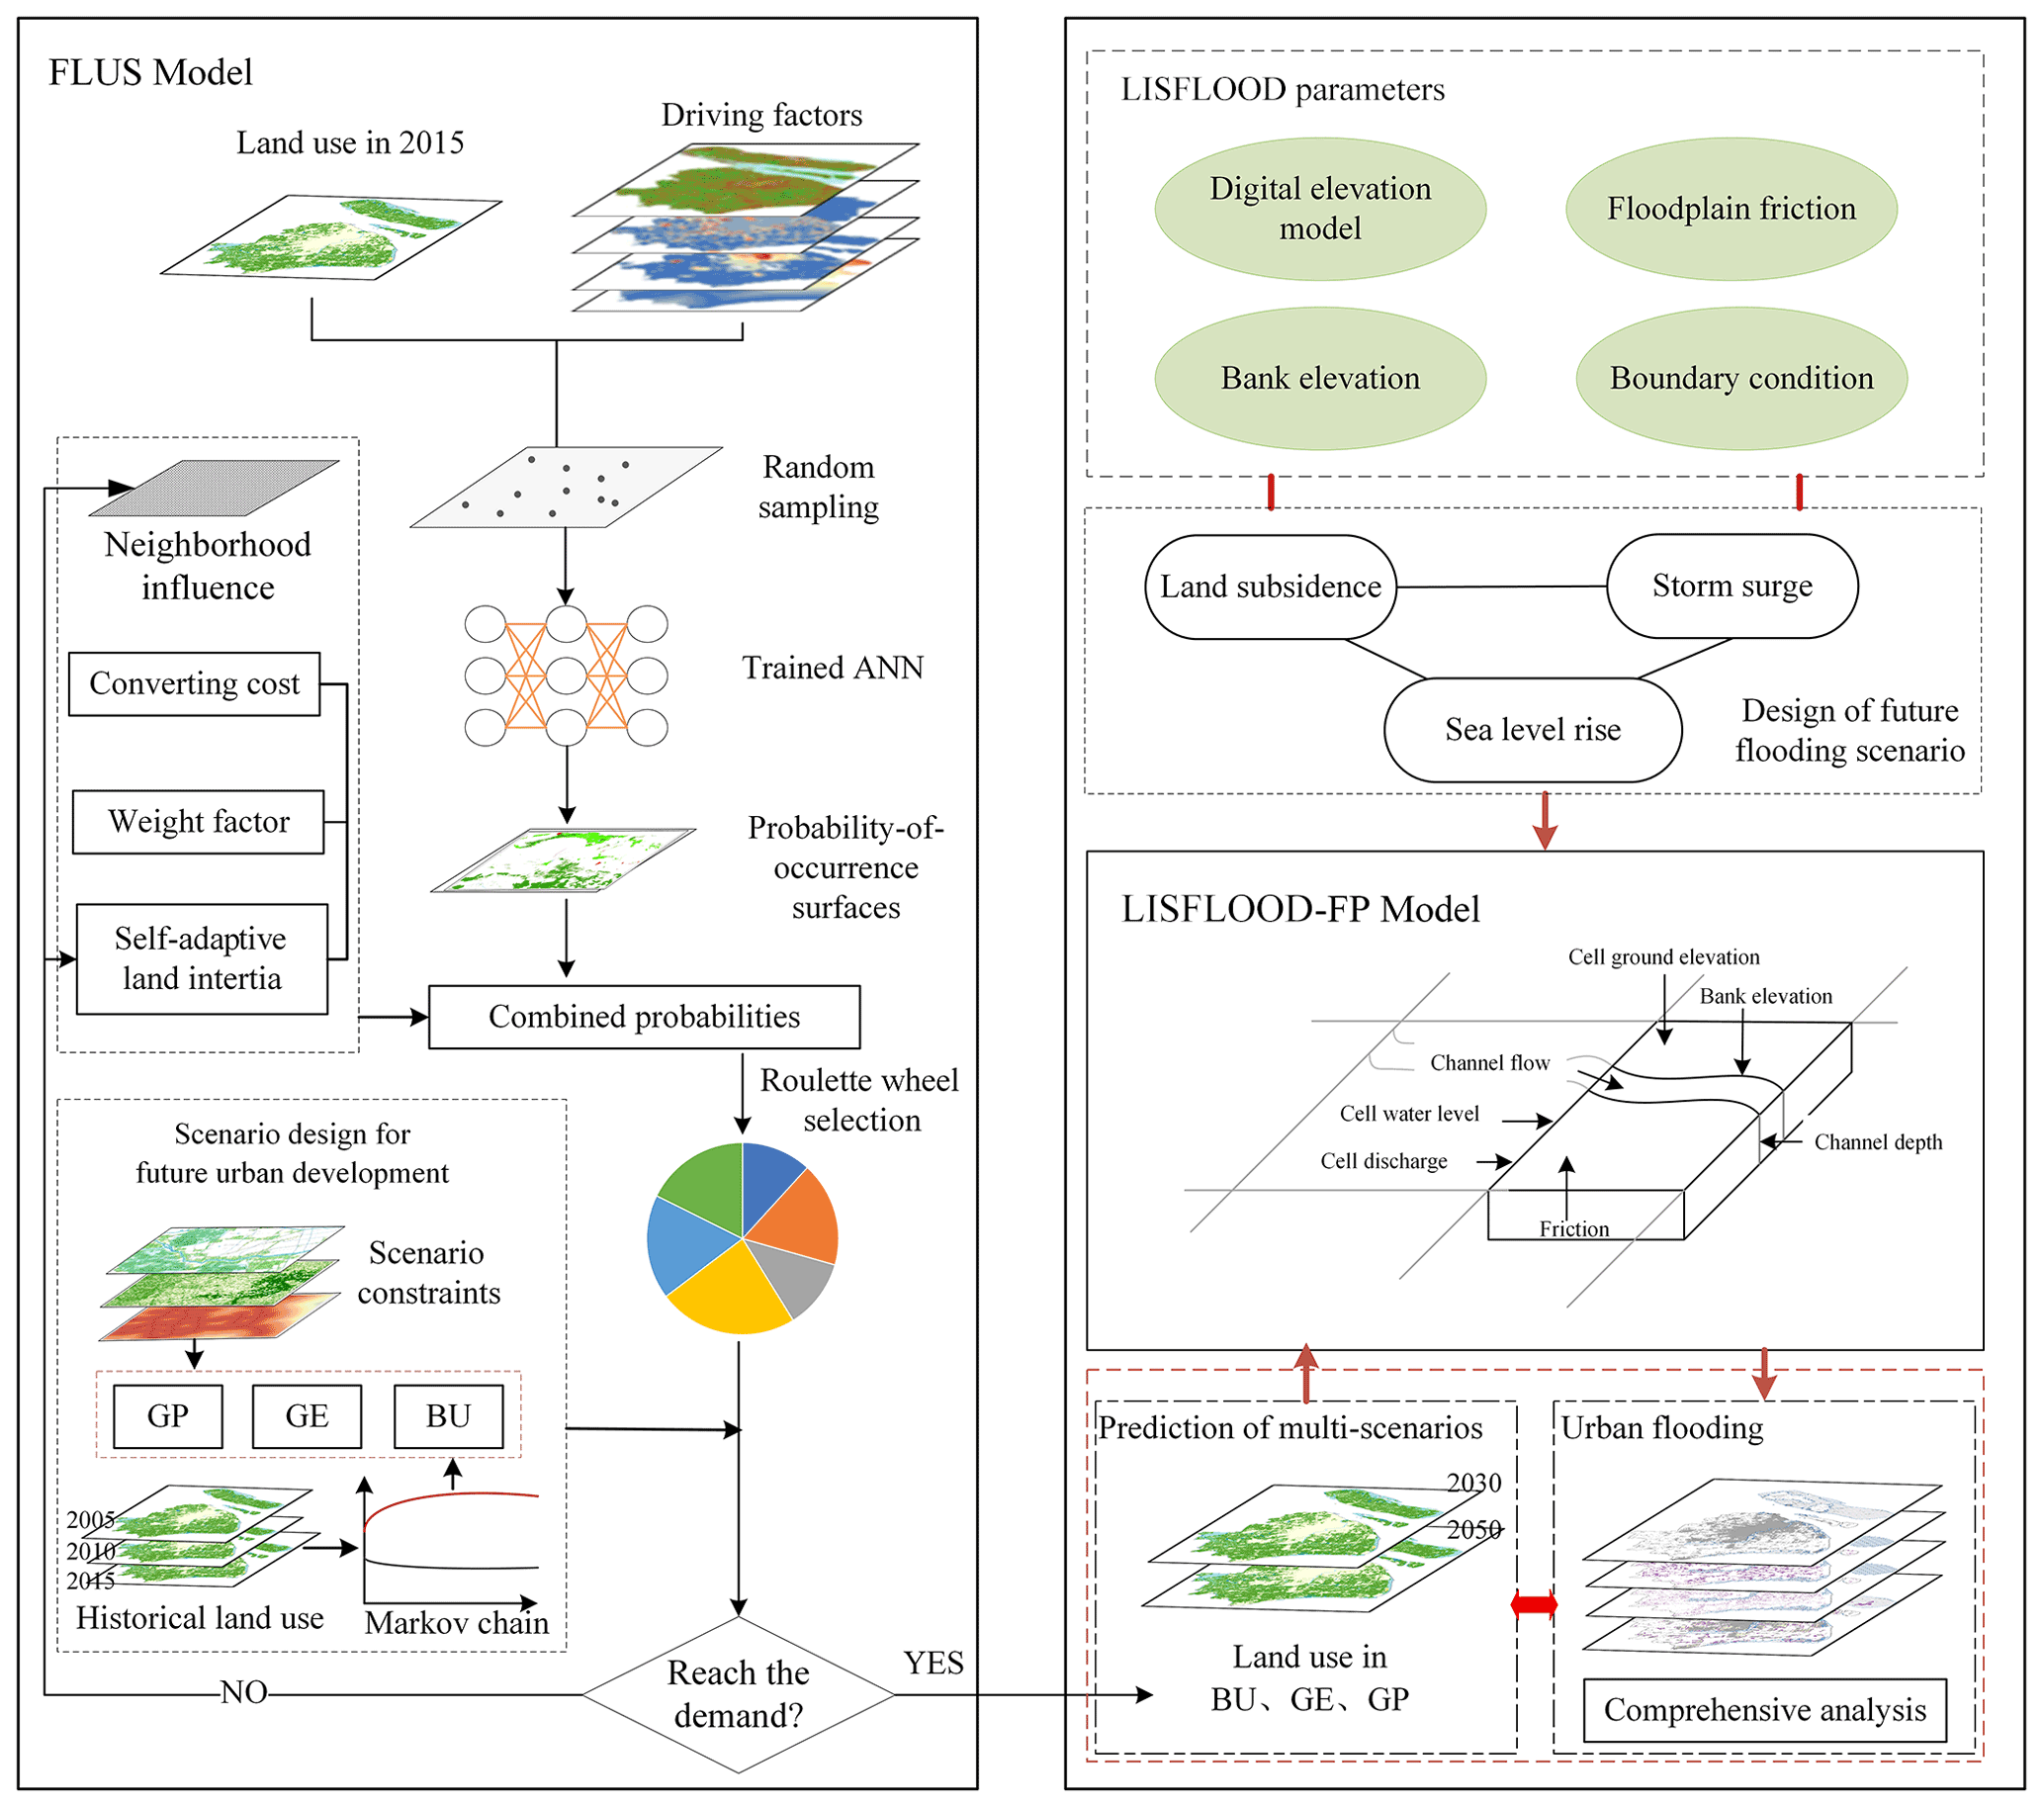
The presented approach for relative sea level rise scenario flood risk assessment is the integration of the FLUS model and LISFLOOD-FP model. In the framework, the FLUS model combined with a Markov chain model is designed to stimulate complex land use change processes in three different scenarios through 2030 to 2050, which include business as usual (BU), growth as planned (GP) and growth as eco-constraints (GE). A Markov chain model is used to predict land use demand in 2030 and 2050, combining planning policy factors, which is one of the crucial data inputs in the FLUS model. Next, the LISFLOOD-FP two-dimensional flood model is used to explore the potential flooding areas under the RCP2.6 and RCP8.5 scenarios in 2030 and 2050 to avoid the overestimation of the submerged range based on the GIS-based elevation area method. This model also considers the compound influence of sea level rise, storm surge and land subsidence. Finally, via ArcGIS spatial comprehensive analysis, the flooding of different land types is calculated employing different flooding scenarios. The overall flowchart of research is illustrated in Fig. 2.
3.1 Markov chain model
The Markov chain model refers to the random transition process of a state from one state to another, and its future state is only related to the state at the previous moment. In the study of land use change, the type of land use at a certain moment is only related to the type of land use at the previous moment. Therefore, land use change is a typical Markov process and has been widely used in the prediction of land use changes (Zhou et al., 2020). We predicted future land use by Eq. (1):
where St and St+1 represent the land use at times t and t+1 and Pi,j is a state transition matrix in which land use type i is converted to land use type j. This model has a good predictive effect on the process state (Gounaridis et al., 2019). Therefore, we use the Markov chain to calculate the probability of the conversion of various land types and then predict the number of future land changes.
3.2 The future land use simulation (FLUS) model
The FLUS model is an upgraded version of a cellular automata model (Liu et al., 2017) which can solve the complex land use simulation problems by self-adaptive inertia and a competition mechanism. FLUS shows the highest current performances among other simulation models such as CLUE-S, SLEUTH and LTM and has been applied to land use change simulation research at different scales and for different purposes (Liang et al., 2018; Lin et al., 2020).
As the most important scheme to manage the space of the urban area, an urban land use plan can reflect the general arrangement of land use in the future (Xu and Yang, 2019). In this research, three categories of urban growth scenarios are simulated through the FLUS model. The similarity of the three scenarios is that they use factors that affect urban development and changes, such as population, GDP, traffic and slope, as the main spatial driving factors. The difference are as follows:
- i.
Business as usual (BU). BU is natural growth without development laws and regulations. Its development is based on the premise of the current urban development patterns. Therefore, the land demand predicted by Markov is used as the constraint condition for the iteration of the CA model in the subsequent application of the scenario.
- ii.
Growth as planned (GP). Under the GP scenario, the urban growth projection is closely linked to the master plan for Shanghai in terms of quantity, reflecting how the city government prefers to develop. The master plan requires that the total area of planned urban construction land does not exceed 3200 km2 in 2035. We choose an urban area of 2768 km2 in 2030 and 3200 km2 in 2050 as the constraints under the GP scenario. The reason is that the Markov chain model projections result in an urban area that is 2768 km2 in 2030 and 3270 km2 in 2050, and the total urban construction land area in 2035 of the Shanghai Master Plan 2017–2035 does not exceed 3200 km2.
- iii.
Growth as eco-constraints (GE). The GE scenario is an eco-environmental protection scenario in which development is limited by ecological environment protection. Combined with Shanghai's ecological and environmental protection requirements and the distribution of permanent basic farmland, sensitive areas restricted for development are identified in the scenario, and we also establish a cultural protection control line for strengthening historical and cultural protection. In addition, the number of areas of future urban growth in the GE scenario also combines the requirements given in the urban master plan to enhance the reality of the scenario.
Therefore, the FLUS model is used to simulate future urban growth combining various scenarios. First, the driving factors and land use data are trained by an ANN model to obtain a probability-of-occurrence map, and this is then incorporated into the self-adaptive land inertial, conversion cost and neighborhood competition among the different land use types to estimate the combined probability for each grid. Next, the numbers of various types of land predicted by the Markov chain model are combined and the constraints of each scenario on predicted urban growth in 2030 and 2050 are considered. To better validate the model before predicting future change, we compared the output with the actual land use 2015. Note that the number of iterations in each scenario is set to 5000, which is much higher than the default value to show higher prediction accuracy.
3.3 The LISFLOOD-FP flood inundation model
LISFLOOD-FP is a 2D hydraulic model based on a raster grid (Bates et al., 2010), which can efficiently simulate the dynamic propagation of flood waves over fluvial and estuarine floodplains and show real-time changes in water depth of complex terrain. LISFLOOD-FP model solves the Saint-Venant equations at very low computational cost by omitting only the convective acceleration term over a structured grid using a highly efficient explicit finite-difference scheme to produce a two-dimensional simulation of floodplain hydrodynamics (O'Loughlin et al., 2020). The model has been widely used in the applications of small-scale and large-scale urban waterlogging and flooding (Hoch et al., 2019; Rajib et al., 2020; Zhao et al., 2020).
In the present study, the LISFLOOD-FP model is used to simulate storm surge floods along the coast of Shanghai and floods along the Huangpu River. The effectiveness of the model in the study area has been verified by another article of our group members and shows good simulation results (Xu et al., 2021). In addition, the validated relationship between the simulated and observed values of water levels at the tidal station was plotted using the observed records of the Huangpu Park tidal station for comparison (with reference to the recorded values of Yin et al., 2013), and the results showed a reasonable match (Fig. S2). In the Manning coefficient of the model, we assigned friction coefficients of 0.05, 0.15, 0.035 and 0.2 for cropland, woodland, grassland and urban land, respectively, based on the study of Dabrowa et al. (2015). In the boundary condition of the model, hydrological stations and global storm surge data are employed as the input of the scenario design. However, the Shanghai Geological Environmental Bulletin and land subsidence control plan show that land subsidence makes a significant contribution to the flood hazards in Shanghai (Xian et al., 2018). Land subsidence in Shanghai is mainly caused by tectonic subsidence and compaction of sediments due to geological structure conditions and human activities. With reference to the long-term tectonic subsidence monitoring data of the very long baseline interferometer (VLBI) in the Sheshan bedrock and the land subsidence analysis rules of Yin et al. (2013), the total land subsidence is predicted to be 0.12 and 0.24 m by 2030 and 2050, respectively. However, due to the uncertainty in future anthropogenic activities and spatial distribution, there could be large variations in the projection. This study also combines the storyline of the future scenarios of the IPCC, namely the representative concentration pathway (RCP) scenarios, and selects conservative (RCP2.6) and the largest-magnitude (RCP8.5) climate change scenarios, with values from Kopp et al. (2017). For the simulation of the Huangpu River flood, we conducted experiments for a 50-year return period under the RCP2.6 scenario and a 100-year return period under the RCP8.5 scenario during 2030 to 2050, with values from Yin et al. (2020). For 2030 and 2050, both Huangpu River and the coastal floods follow the RCP2.6 and RCP8.5 scenarios. Finally, we combine land subsidence and the RCP data to control the flood inundation simulation.
4.1 Model validity
Model verification is a prerequisite for model operation, and the operation can only be carried out after confirming the model to be valid. The applicability of the proposed model was tested by simulating land use and cover changes (LUCC) in 2015 in Shanghai. The spatial simulation result shows that the simulated result and the actual land use have a high consistency (Fig. 3). We compared the actual land use and the simulated result pixel by pixel in our study and found the overall accuracy (OA) was 93.20 % and the kappa coefficient (kappa) was 0.89. The discrepancy between the actual land use and simulated result is likely due to the neighborhood interaction in the CA model, in which grid cells in more urbanized neighborhoods have a higher probability of converting to urban, whereas the grid cells are less likely to change to urban in less urbanized neighborhoods. Overall, the measured model accuracy outputs showed an acceptable or good level of prediction; therefore the model is suitable for predicting changes in land use of the Shanghai area.
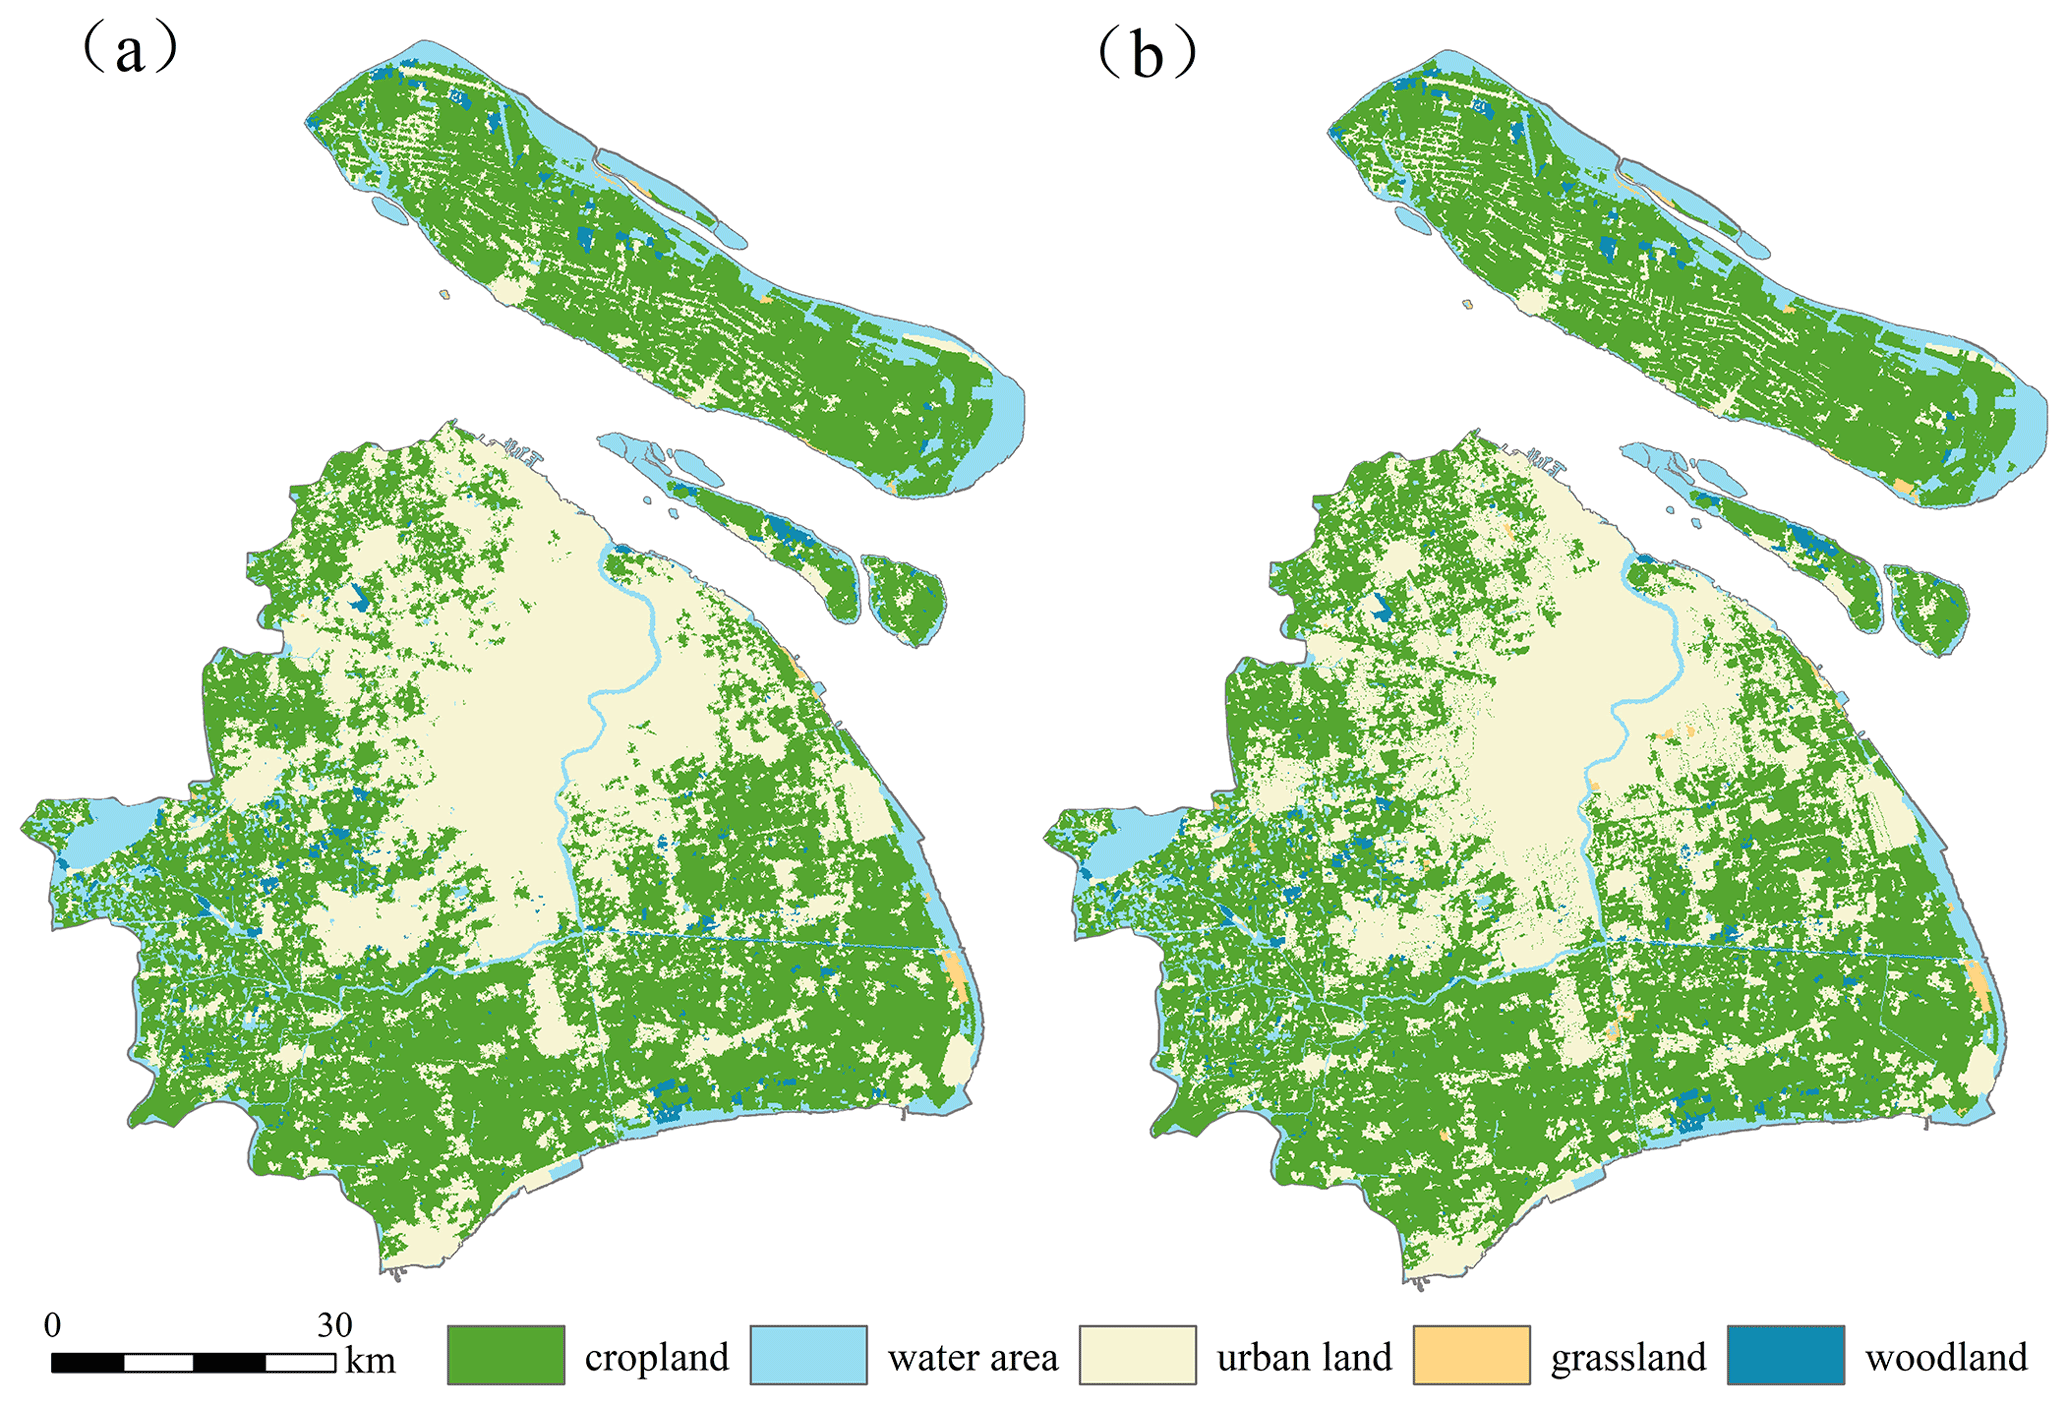
Figure 3Comparing the simulation results of Shanghai urban expansion with the actual situation: (a) simulation result in 2015 and (b) actual land use in 2015.
4.2 Future land use changes
Based on the conditions under three different development scenarios, we predicted the development of future urban land use change in 2030 and 2050. The prediction result shows different development patterns for each scenario (Fig. 4). Future urban growth under the BU scenario is primarily located in the northwest with some development in the central regions, and under the GP scenario the urban growth involves evenly distributed development. Urban growth in the GE scenario, however, indicates Chongming Island regions see more urban growth, and the downtown area is not fully occupied by urban expansion due to restrictions.
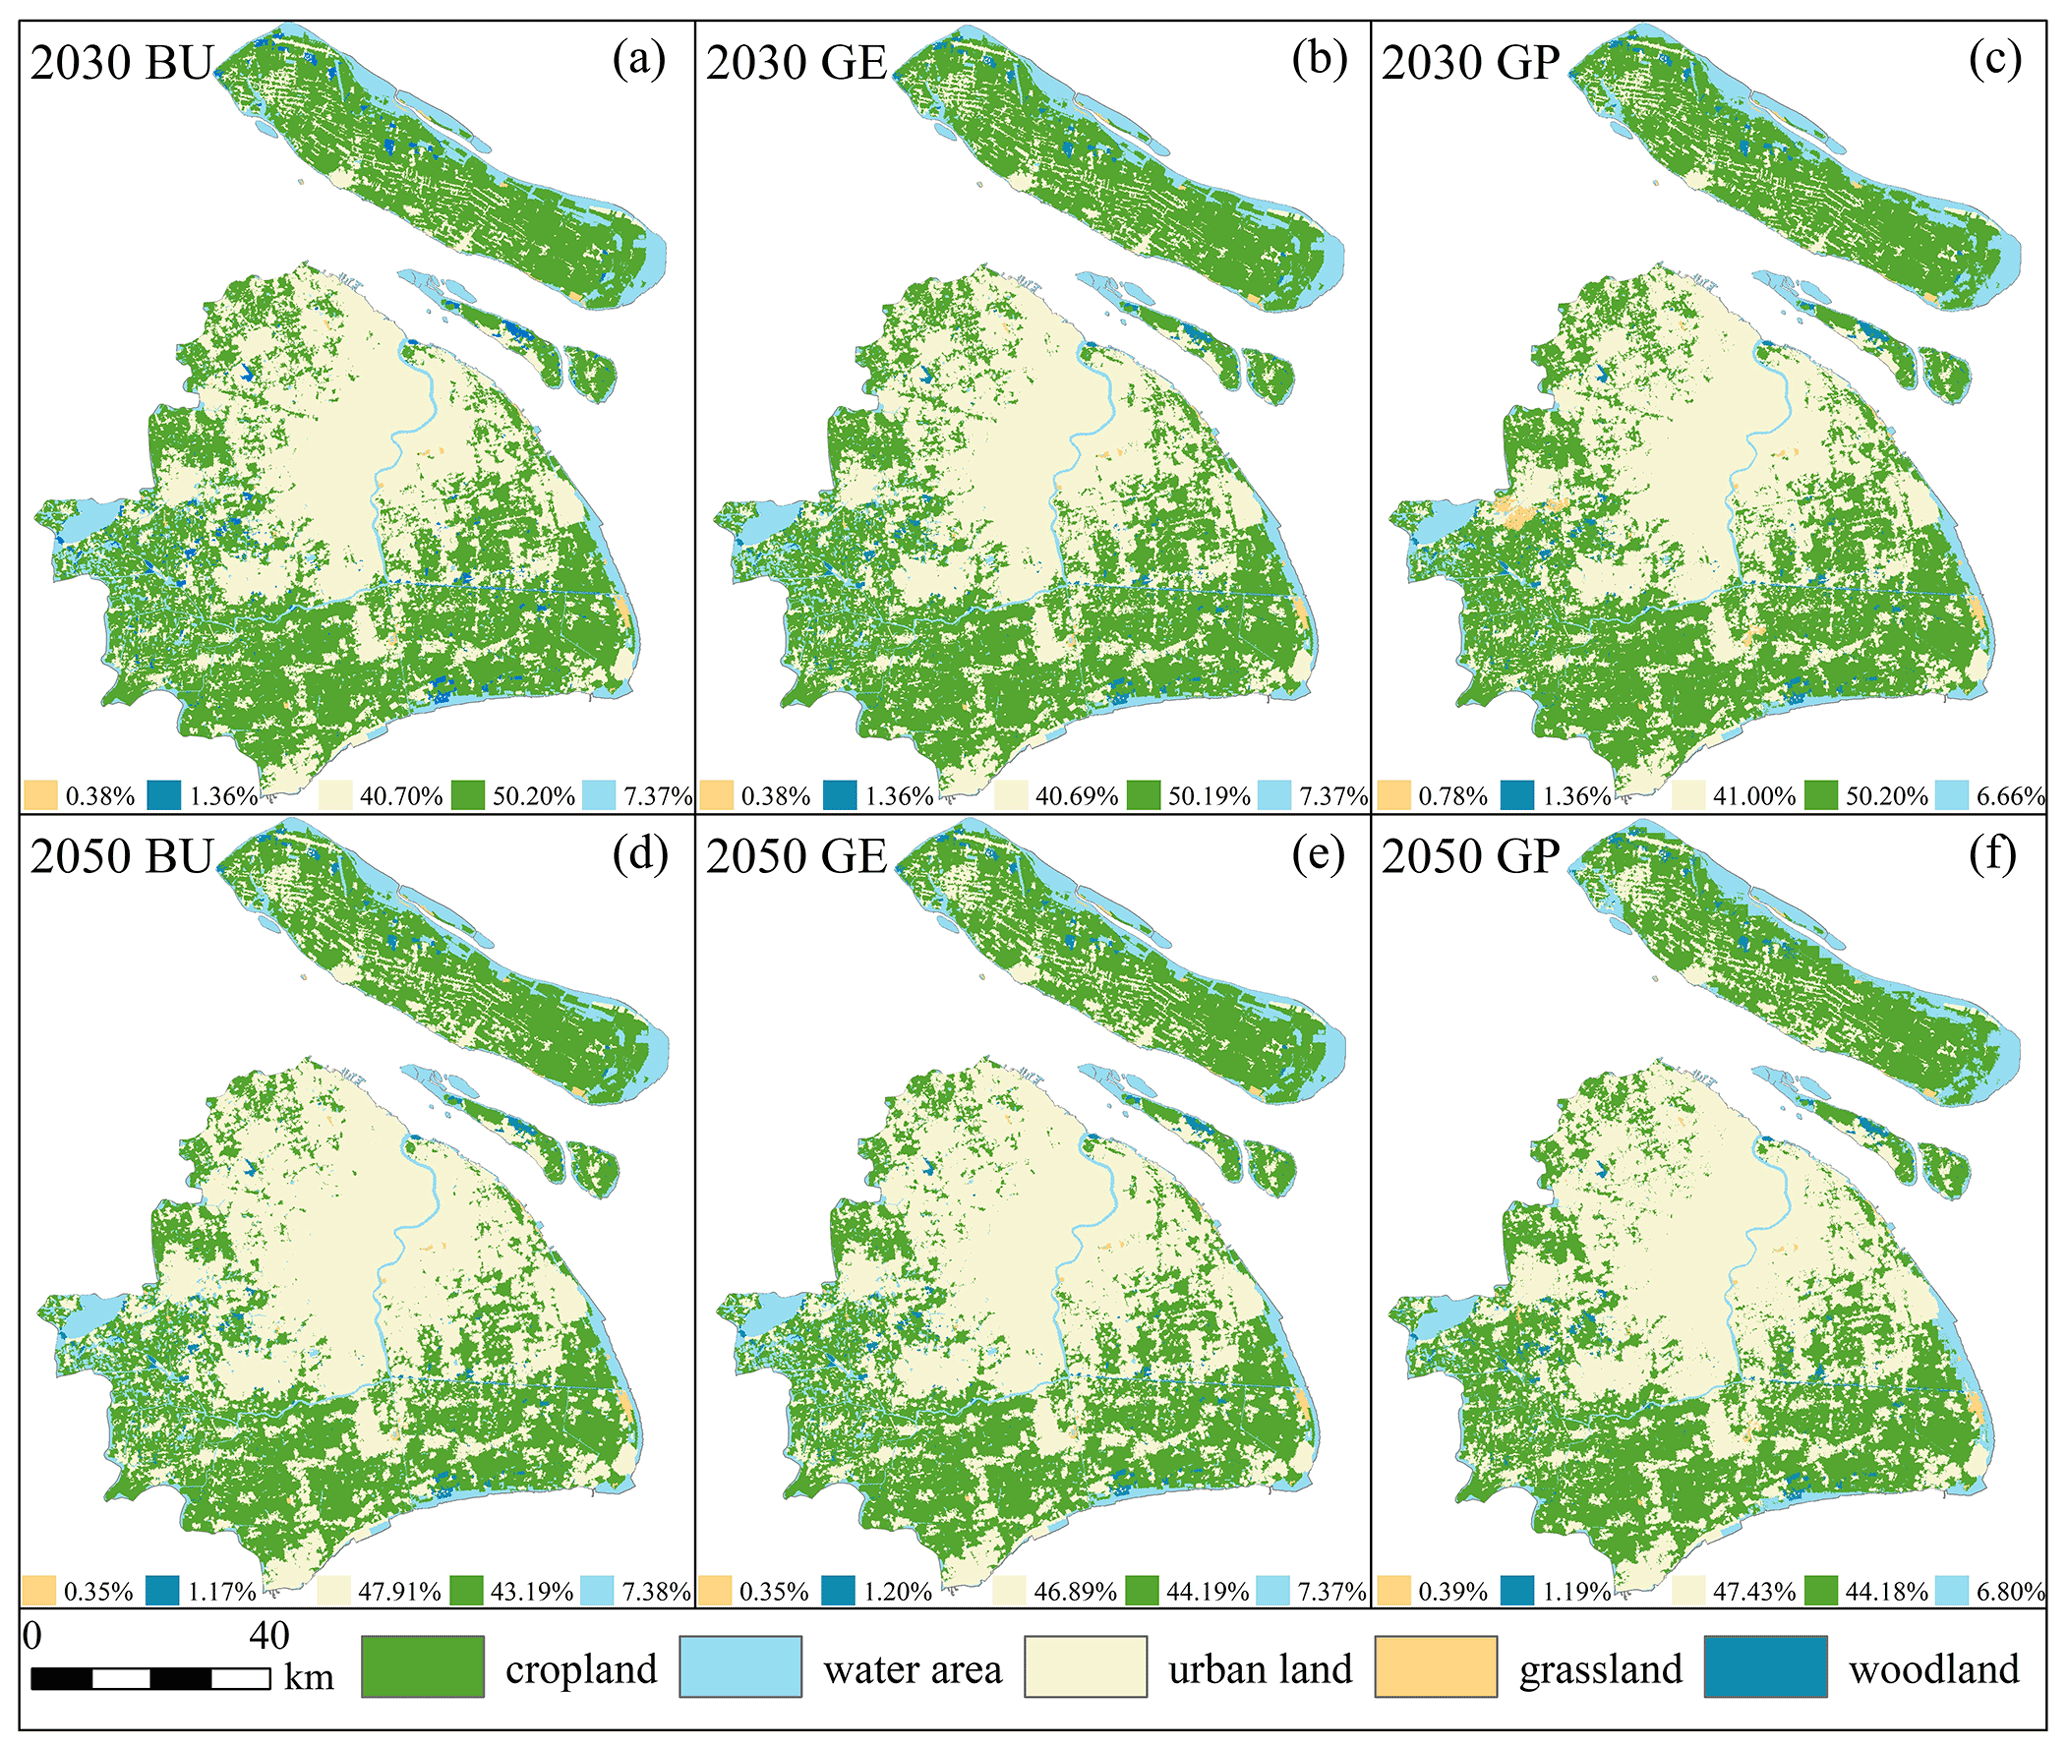
Figure 4Simulation results of different scenarios in 2030 (a–c) and 2050 (d–f). Each panel shows the spatial distribution and the proportion of area of different land use types in the simulated scenario.
Due to the impact of infrastructure construction, distance to the city center and policy restrictions, Shanghai's overall urban expansion model shows a center–periphery expansion. The built-up land areas in 2030 and 2050 are projected to increase by about 6 % and 13 %, respectively, as compared to 2015; the most significant reduction is found for cultivated land and woodland. Specifically, the built-up land areas in 2030 are projected to increase by 427.32, 428.27 and 429.12 km2 in the BU, GP and GE scenarios, respectively, and the built-up land areas in 2050 are projected to increase by 926.38, 857.63 and 751.47 km2 in the BU, GP and GE scenarios, respectively. The most significant reduction is found for cropland, which is predicted in 2050 to decrease by 876.97, 857.63 and 723.59 km2 as compared to 2015 in the BU, GP and GE scenarios. The southwestern region is not suitable for large-scale urban development, since large amounts of farmland in the region are listed as ecological protection areas, so the slow growth of these areas is not expected. The simulation maps show, as expected, land use changes under different planning scenarios, especially the urban-sprawl trend in the GE scenario, creating new development areas in suburbs. To sum up, the urban expansion trajectory under BU, GP and GE shows significant differences, and these changes are mainly at the expense of the cropland.
4.3 Changing flood hazard in the future
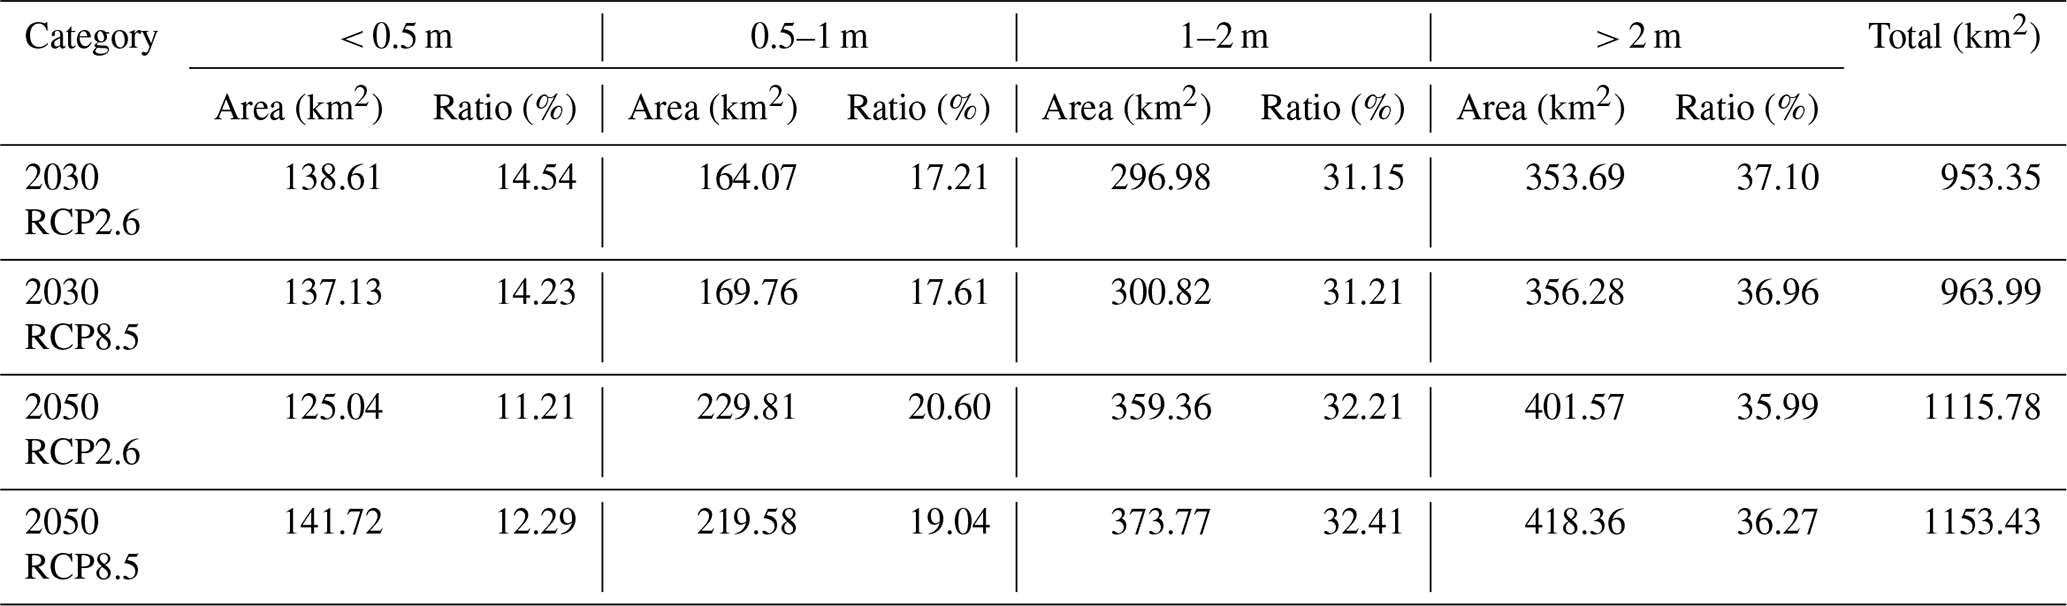
The LISFLOOD-FP model is used to simulate the flood evolution process under the RCP2.6 and RCP8.5 scenarios (the inundation results are plotted in Fig. S3), and the submerged depth and area under different scenarios are statistically analyzed to explore the future flood risk under different RCP scenarios. First, the maximum water depth risk of the submerged area is counted, and the submerged area is divided into four depth levels: submerged water depth less than 0.5 m is classified as shallow water, 0.5–1 m as medium water, 1–2 m as deep water and above 2 m as extremely deep. The area and proportion of each water depth level are calculated.
By comparing the scenarios in RCP2.6 and RCP8.5, it is evident that the submerged area is increasing with time (Table 2). The total flooded area increased by 162.43 and 189.44 km2 under the RCP2.6 and RCP8.5 scenarios, respectively, from 2030 to 2050. Additionally, the depth of submergence and the extent of submergence will gradually increase as the floodwater spreads. Taking the area with submergence depth above 2 m as an example, under the RCP2.6 scenario the area with submergence is 353.69 and 401.57 km2 in 2030 and 2050, respectively, and under RCP8.5 scenario the area with submergence is 356.28 and 418.36 km2 in 2030 and 2050, respectively. This shows that Shanghai will still face great flood risk under these two scenarios.
4.4 Future changes in urban flood risk
The flood risk of the urban area is calculated by overlapping existing urban and projected future urban scenarios with future flood risk zones. First, in the existing urban (EU) exposure to future flood risk scenarios (the upper left in Fig. 5), more urban areas with flood walls will be vulnerable to flood risk in the context of global climate change. The four pie charts for the EU scenarios represent the proportion of the existing urban area affected by the future flood risk scenario. Under the RCP2.6 scenario, 4.68 % and 5.96 % of the total existing urban areas in 2030 and 2050, respectively, would be susceptible to flood risk. In 2030 and 2050 in the RCP8.5 scenarios, the area of existing urban land which would be vulnerable to future flood risks is 110.27 and 146.23 km2, respectively. Many urban areas will be flooded under sea level rise caused by climate change even when protected by levees, and more than 5 % of urban areas in Shanghai will still be in the floodplain (Fig. 5).
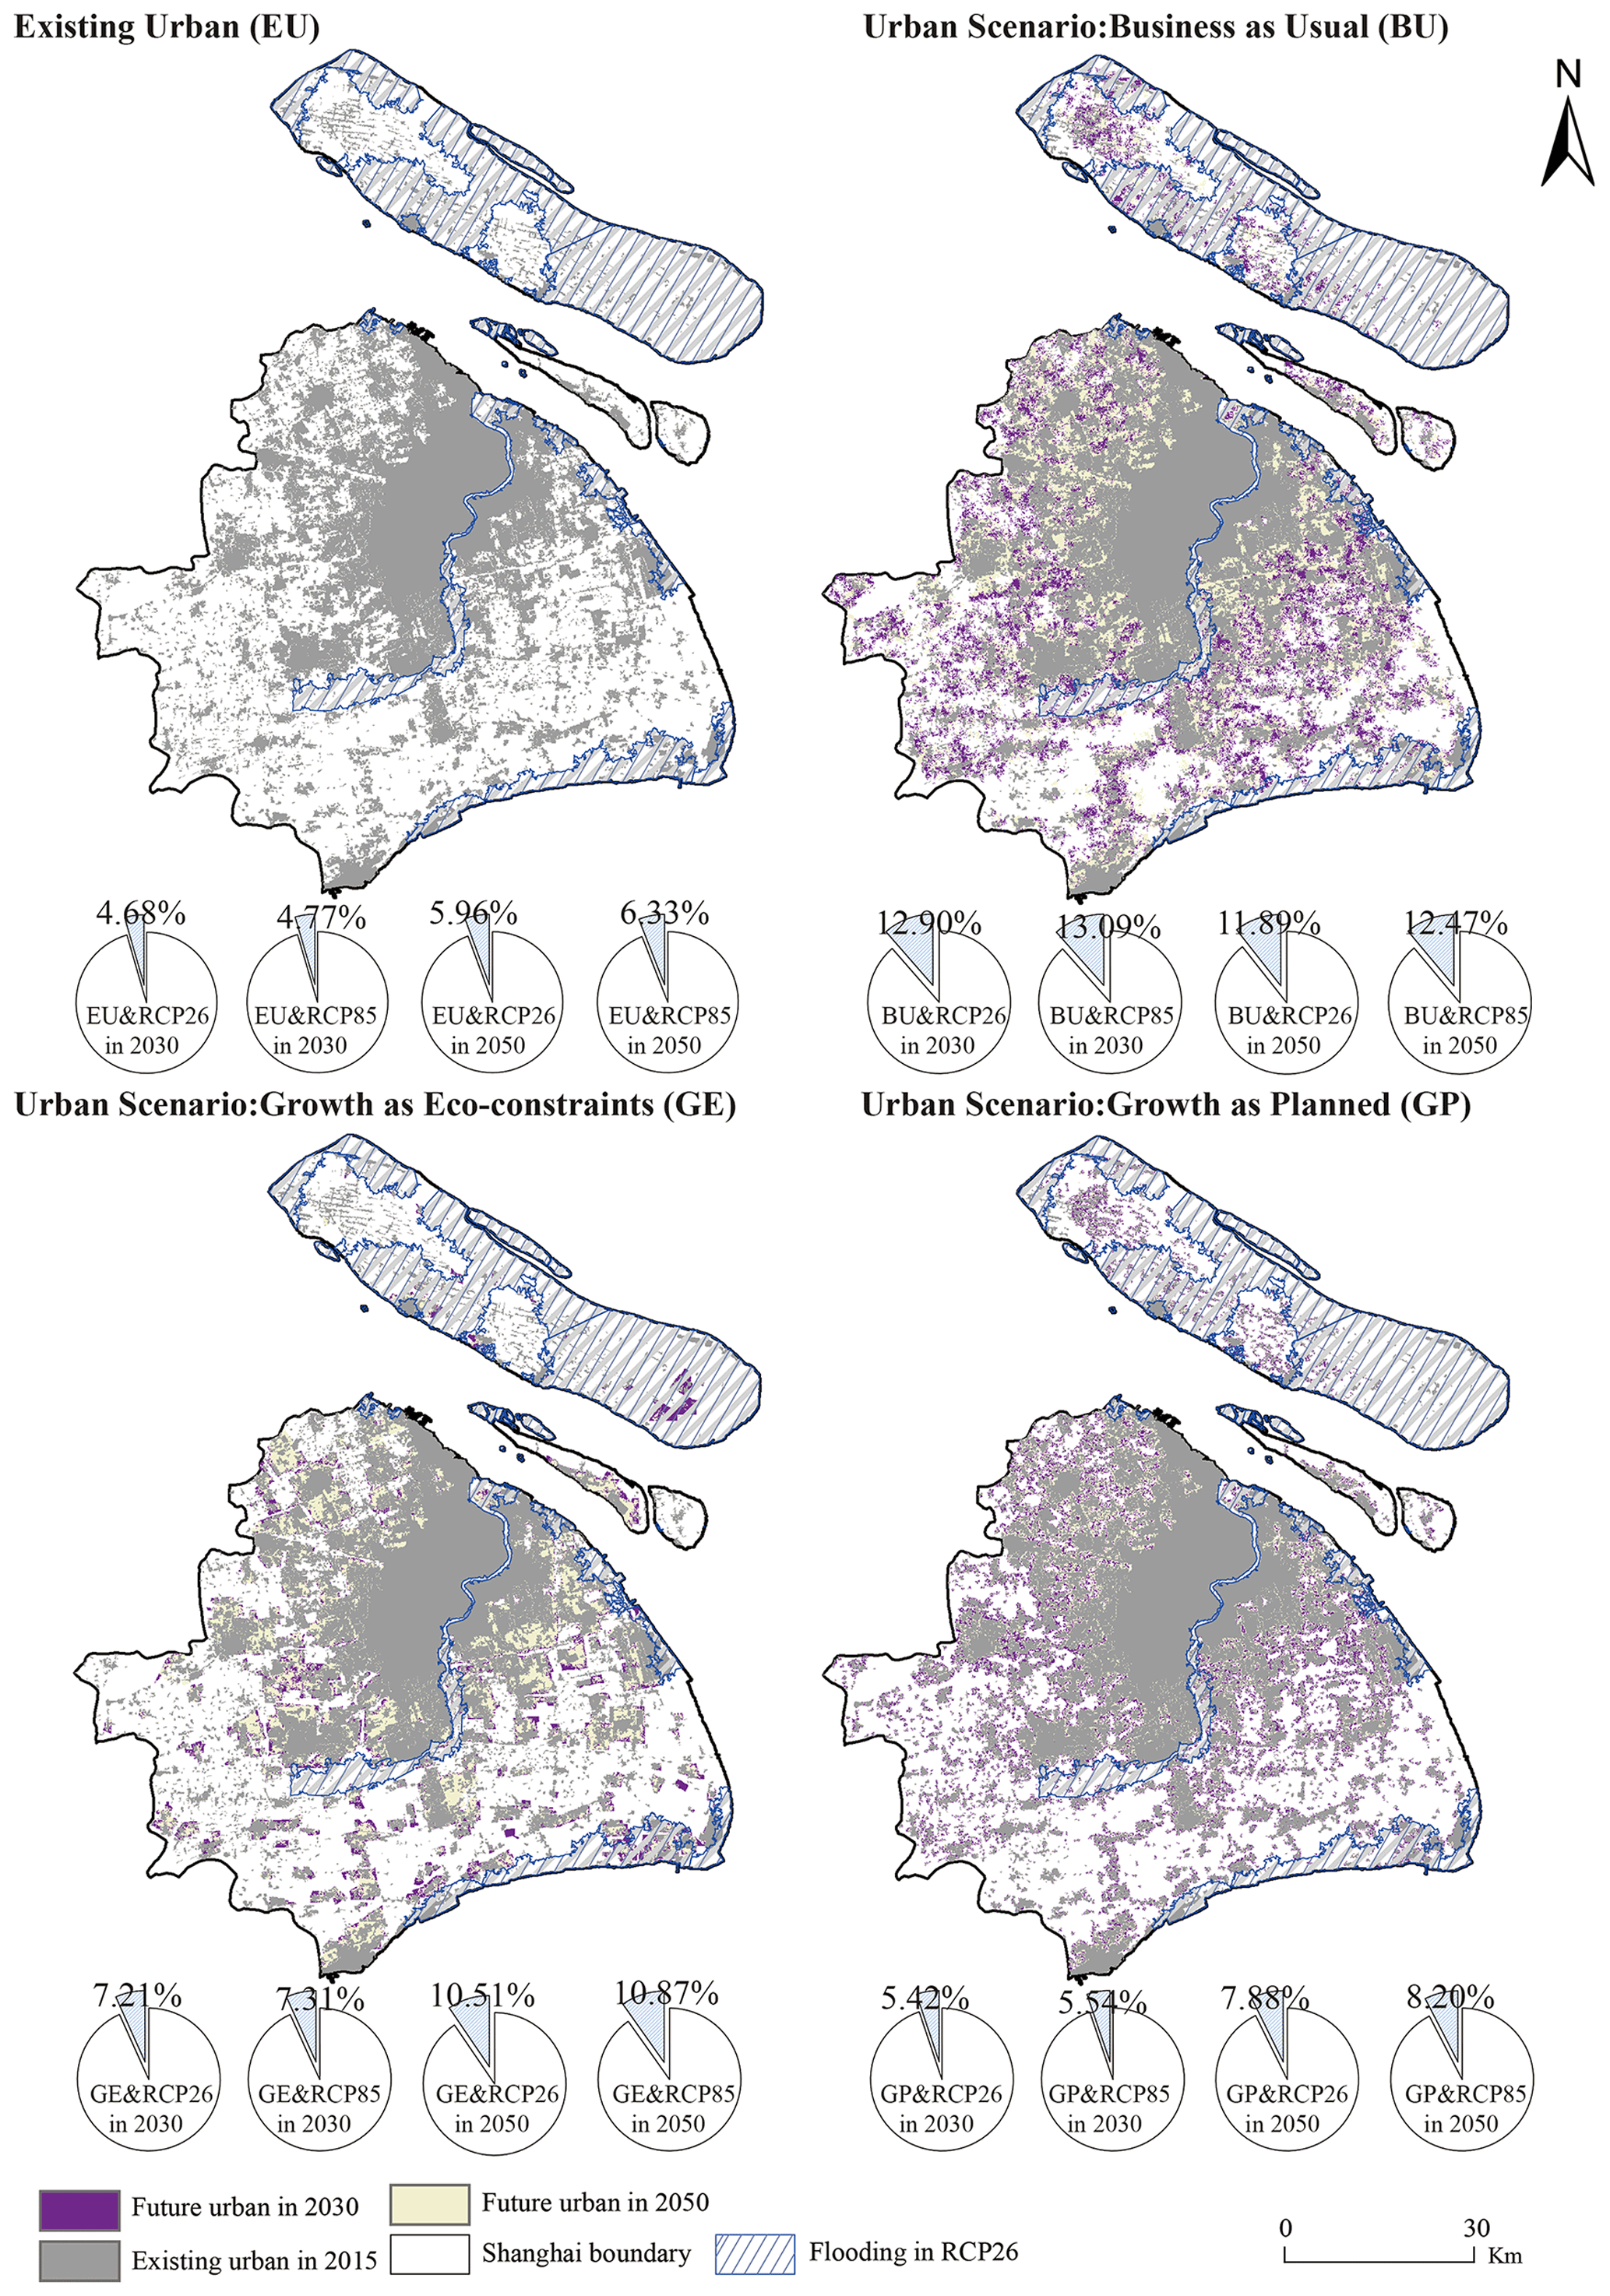
Figure 5Flood exposure of existing urban and future urban growth scenarios. The four pie charts for the BU, GE and GP scenarios represent the proportion of new grown urban area exposed to flooding under the 2030 RCP2.6, 2030 RCP8.5, 2050 RCP2.6 and 2050 RCP8.5 scenarios. The four pie charts for the EU scenarios represent the proportion of the existing urban area affected by the future flood risk scenario.
Future urban development would occur in the flood zone, with a rapid expansion of the urban area. Figure 5 also shows the comprehensive analysis results of the three urban growth scenarios under different climate change scenarios. Under the RCP2.6 scenario, new growth in urban land area affected by flooding in 2030 is 55.11, 23.22 and 30.92 km2 in the BU, GP and GE scenarios, respectively. Under the RCP8.5 scenario, more urban growth areas will be affected by the flooding, which will reach 115.53, 70.36 and 81.71 km2 in the BU, GP and GE scenarios in 2050, respectively. In general, the higher the sea level rises, the greater the risk of flooding in future urban areas. Small changes in sea level rise will affect a large amount of land, since the average altitude of Shanghai is only around 4 m.
Table 3Inundation of each land use type under different scenarios. The inundated areas of different land use types, including cropland, woodland, grassland and urban land, were calculated for each scenario, where * indicates new-growth areas of the urban class affected by flooding.
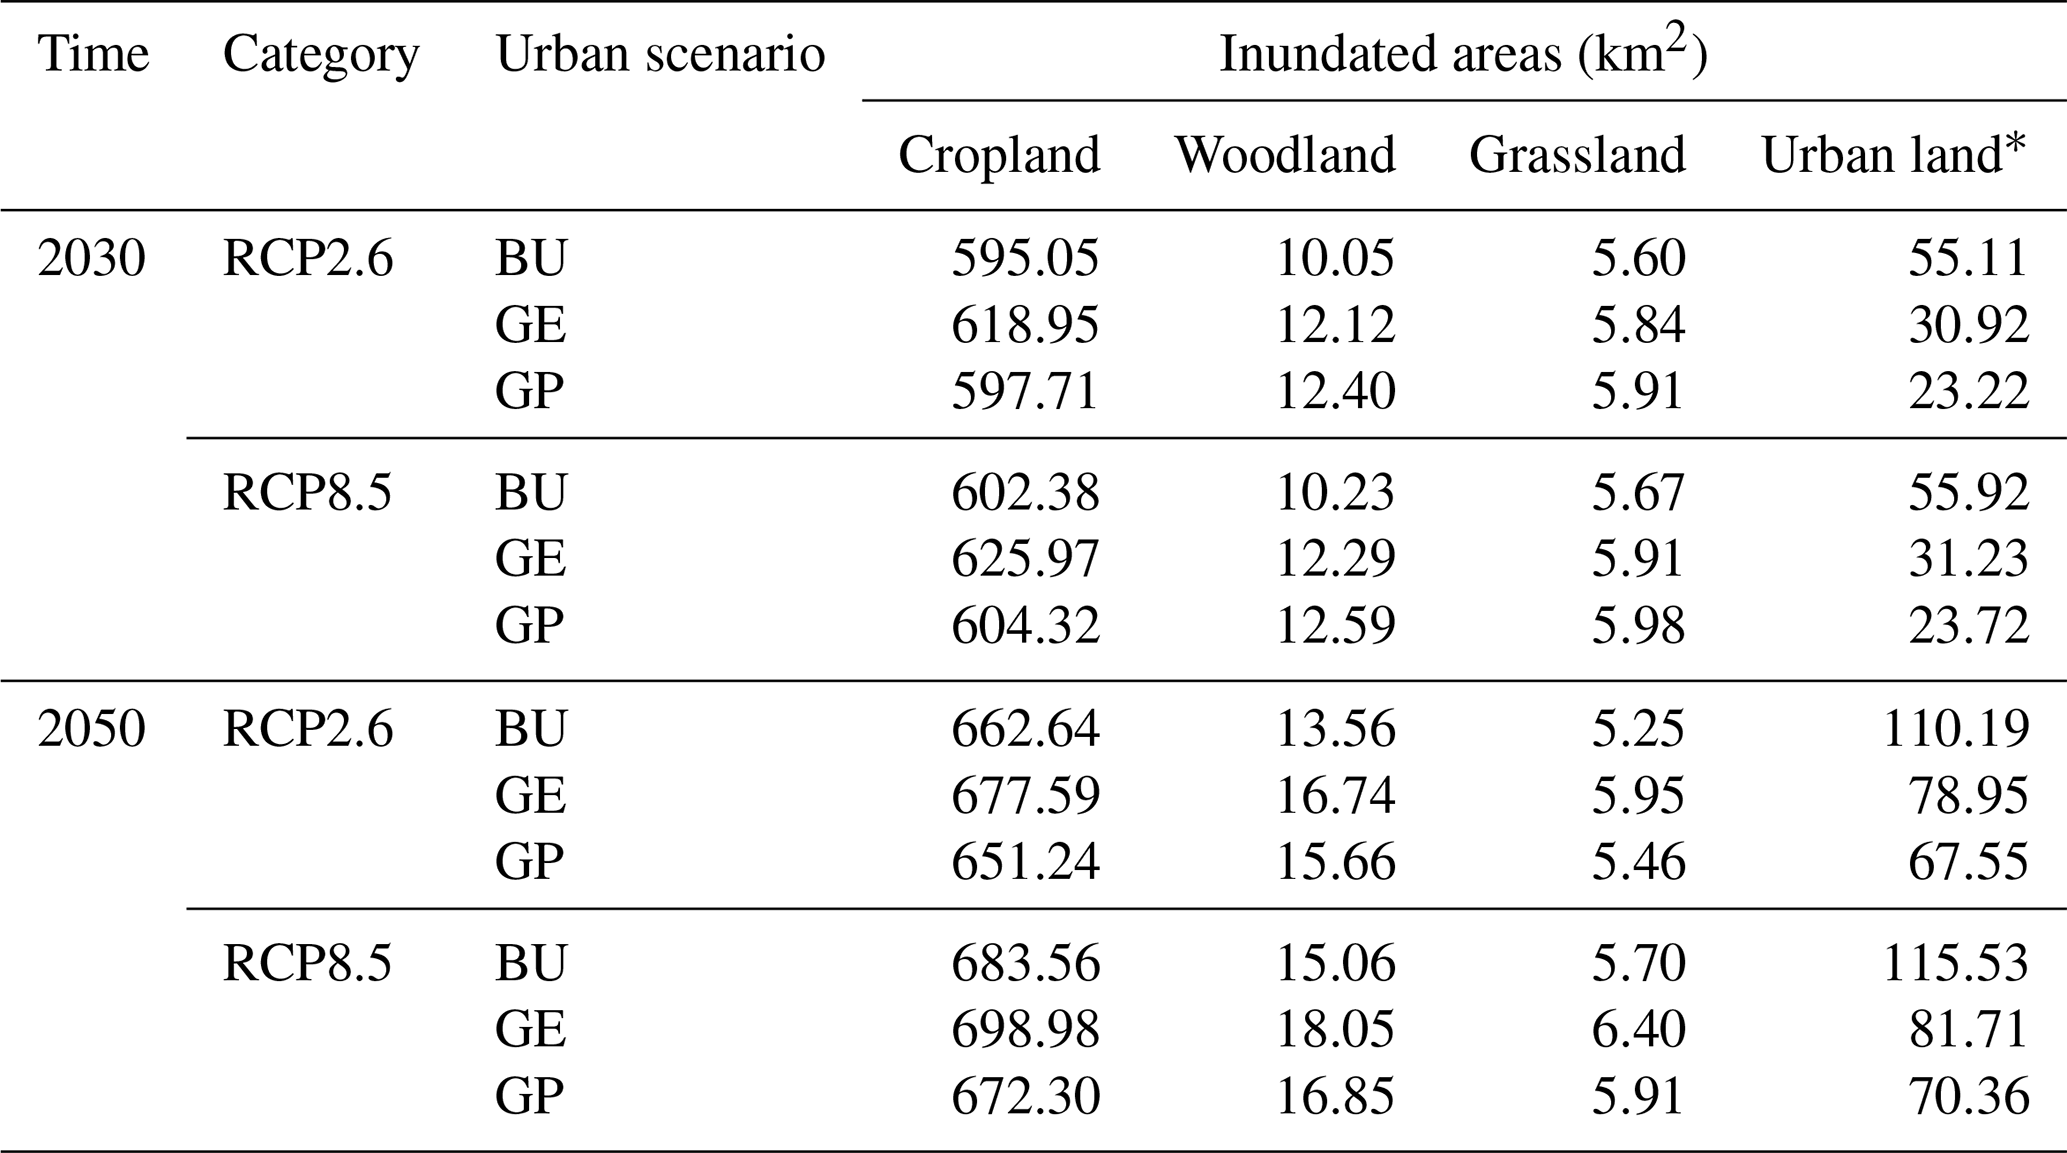
The research found that the cultivated land is the most affected land type by flooding relative to urban areas, woodland and grassland (Table 3). Under the GE scenario, the flooded area of cultivated land is 618.95 and 625.97 km2 in the RCP2.6 and RCP8.5 scenarios in 2030 and 677.59 and 698.98 km2 in the RCP2.6 and RCP8.5 scenarios in 2050. Further, the exposure of various types of land will increase with time, but urban land and cropland will be the most impacted land types in the future. Comparing the three scenarios, we can find that the urban development area under the planning scenario is less affected by flooding, as compared to the business-as-usual development scenario. Comparing the inundation of the two planning scenarios (GE and GP), the decision makers' trade-off between economic development and ecological protection is also reflected. The inundation area of the urban land under the GP scenario is less than that of the GE, which means that under the planning constraint of protecting ecological and cultural areas, urban built-up areas will develop in low-protection areas, which are more vulnerable to flooding. In conclusion, for reducing the risk of future flooding in urban areas, the GE scenario is shown to be better than the BU scenario but worse than the GP scenario.
5.1 Source of uncertainties
There are some limitations in our study, which we need to address in the future. First, there is still more room to improve the accuracy of model prediction. In this study, the performance of the FLUS model is tested by kappa and OA measures, which show a good range of prediction accuracy. In addition, this study proves that 16 driving factors contribute to the simulation and prediction of urban growth in Shanghai. The relationship between human and natural driving factors and land use change can be effectively integrated through the FLUS model embedded with an ANN to obtain more realistic simulation results. However, if more influential drivers and the latest land cover are employed, the prediction would have higher accuracy. Second, future flood risks in coastal areas are also not fully reflected through the use of hydrodynamic models, although these show higher accuracy than the elevation area submergence method. On the one hand, the LISFLOOD-FP model quickly simulates surface water dynamics at relatively low computational cost through simplified shallow water equations (SWEs); however, this also means that it cannot adequately capture flood shock waves, which affects the accuracy of 2D flood model simulations. On the other hand, this study is based on the modeling results of DEM data, which may overestimate or underestimate the simulation effect due to the error in the DEM data. In addition, extreme-storm-surge and land subsidence data are combined to enhance the reliability of the extreme-flood forecast in this study. However, the change in the impervious surface that affects hydrology has not yet been considered in this study. When other land uses are converted to urban land uses, the risk of flooding will also greatly increase due to changes in the impervious surfaces. Therefore, it is necessary to dynamically adjust relevant factors affecting flood peak flows and risk in future forecasts to enhance the accuracy of prediction.
In the context of global climate change, extreme weather in the future may become more and more serious, so it is necessary to dynamically combine climate scenarios to develop more accurate flood risk delineation methods to guide urban planning in the future and rely on new technology and equipment to provide data support. For example, unmanned aviation vehicles (UAVs) are deployed around the coastline to generate real-time information about weather conditions and sea level changes (Cochrane et al., 2017). These tools will act as a complement to existing information and early warning systems, which can also provide guidance for coastal flood risk management and urban planning in the future. Overall, although uncertainty cannot be avoided when assessing coastal flood risk, the deviation of the proposed model output is within an acceptable range, which ensures the accuracy of coastal flood risk assessments.
5.2 Recommendations for strategies and policies for urban adaptation to flooding
In the 21st century, adapting to climate change and coastal flooding is a critical challenge for coastal cities. The human response to the impacts of flooding largely depends on the allocation of urban facilities and managers' planning for future urban development (Hunt and Watkiss, 2011; Jia et al., 2022). Shanghai is considered one of the most protected Chinese cities in terms of flood protection, yet the expected annual disruption (EAD) GDP ratio (EAD is the direct damage to buildings and vehicles) is as much as 5 times that in New York (Aerts et al., 2014). Therefore, there is an urgent need to adopt flood risk adaptation strategies in Shanghai.
We conducted a set of comparative experiments to analyze the coastal flood damage in Shanghai with and without flood walls (hard adaptation strategies). Our analysis considered the important effects of land subsidence and sea level rise on flood risk. We found that the current flood protection wall can reduce flood losses due to climate change to a relatively low level (Fig. S4). In comparison, the flood protection wall constructed for the current conditions would reduce the flooded area under the RCP8.5 scenario by about 35 % and 36 % in 2030 and 2050, respectively. Furthermore, our results show that the area of future urban flood risk varies by scenario. Although the GE scenario gives higher values than the GP scenario in terms of the flood inundation area, this does not mean that the GE scenario is worse. From the cases of advanced flood risk management countries such as the Netherlands (Kabat et al., 2009; Song et al., 2018), an important lesson in success for future flood protection design is to leave enough space along coasts for wetland migration and leave space for nature. In other words, “soft strategies” such as “working with rivers and nature” are considered in flood protection measures. Therefore, from this perspective the GE scenario may be a more likely future development scenario among these three scenarios. In future, it is necessary to learn from the practical experience of advanced countries to strengthen the development and construction of coastal wetlands and tidal-flat ecosystems and further reduce residual risk through the adaptive regulation of coastal ecosystems and other soft strategies. In addition, the implementation of soft strategies can increase the value of ecosystem services, increase biodiversity and carbon sequestration, and improve social welfare (Du et al., 2020).
Scenario-based assessment has been found to be a powerful approach in numerous flood risk studies. This study combines an urban growth model with a two-dimensional flood inundation model to not only simulate urban development dynamics more accurately but also discard the shortcomings of the traditional elevation inundation method of overestimating inundation areas. We have also tested the resilience of Shanghai to future different climate scenarios with the current flood wall. The results of the study are beneficial to local planners and coastal managers in making decisions regarding future protected areas and developments.
This study employed three urban development scenarios and detected the relationships of urbanization and climate changes in 2030 and 2050. The results of the study show that urban growth under the three scenario models manifests significant differences in expansion trajectories, influenced by key factors such as infrastructure development and policy constraints. According to the predicted results of flood, new built-up areas are also potentially vulnerable areas of flood risk. New built-up areas under different scenarios show significant vulnerability and exposure risk under different climate scenarios, even with the support of flood banks and other hard structures. Additionally, the research provided significant insights into the range and spatial distribution of flood risk in future urban areas.
The current study is based on the multi-scenario analysis of RCP global warming scenarios. In the future, the shared socioeconomic pathways (SSPs) can be combined to predict land use change, which make urban development scenarios more realistic choices. The results of this study estimate the future urban flood exposure areas, but this does not mean that all flood-vulnerable areas will be flooded; it only means that in these areas, the probability of each possible occurrence is greater. Therefore, proper preparations (such as definition-restricted development zones) can reduce the damage risk of future flooding and build more resilient cities.
The data sources used for the case studies are listed in Table 1.
The supplement related to this article is available online at: https://doi.org/10.5194/nhess-22-3815-2022-supplement.
QS and JF designed the research; QS, KX and XD collected the data and carried out the experiments; QS wrote the draft; JF, XD, YF and ML revised the manuscript; JF, XL and ML supervised and provided critical feedback. All authors contributed to the final version of the manuscript.
The contact author has declared that none of the authors has any competing interests.
Publisher's note: Copernicus Publications remains neutral with regard to jurisdictional claims in published maps and institutional affiliations.
This article is part of the special issue “Future risk and adaptation in coastal cities”. It is not associated with a conference.
We are particularly grateful to editors and to the anonymous reviewers for their contribution and input to the manuscript. Qinke Sun is thankful for financial support from the program of the China Scholarships Council (no. 202206140060).
This work was supported by National Key R&D Program of China (grant no. 2017YFE0100700), National Natural Science Foundation of China (grant nos. 42001096 and 41730646), Shanghai Sailing Program (grant no. 19YF1413700), China Postdoctoral Science Foundation (grant no. 2019M651429), and East China Normal University Institute of Belt and Road & Global Development (grant no. ECNU-BRGD-202106).
This paper was edited by Paolo Tarolli and reviewed by six anonymous referees.
Aerts, J. C. J. H., Botzen, W. J. W., Emanuel, K., Lin, N., De Moel, H., and Michel-Kerjan, E. O.: Climate adaptation: Evaluating flood resilience strategies for coastal megacities, Science, 344, 473–475, https://doi.org/10.1126/science.1248222, 2014.
Bates, P. D., Horritt, M. S., and Fewtrell, T. J.: A simple inertial formulation of the shallow water equations for efficient two-dimensional flood inundation modelling, J. Hydrol., 387, 33–45, https://doi.org/10.1016/j.jhydrol.2010.03.027, 2010.
Berke, P. R., Malecha, M. L., Yu, S., Lee, J., and Masterson, J. H.: Plan integration for resilience scorecard: evaluating networks of plans in six US coastal cities, J. Environ. Plan. Manag., 62, 901–920, https://doi.org/10.1080/09640568.2018.1453354, 2019.
Bouwer, L. M.: Next-generation coastal risk models, Nat. Clim. Change, 8, 765–766, https://doi.org/10.1038/s41558-018-0262-2, 2018.
Chen, G., Li, X., Liu, X., Chen, Y., Liang, X., Leng, J., Xu, X., Liao, W., Qiu, Y., Wu, Q., and Huang, K.: Global projections of future urban land expansion under shared socioeconomic pathways, Nat. Commun., 11, 537, https://doi.org/10.1038/s41467-020-14386-x, 2020.
Cochrane, L., Cundill, G., Ludi, E., New, M., Nicholls, R. J., Wester, P., Cantin, B., Murali, K. S., Leone, M., Kituyi, E., and Landry, M. E.: A reflection on collaborative adaptation research in Africa and Asia, Reg. Environ. Change, 17, 1553–1561, https://doi.org/10.1007/s10113-017-1140-6, 2017.
Dabrowa, A., Neal, J. C., and Bates, P. D.: Floods and Storms Practical Exercises, in: Hydro-Meteorological Hazards, Risks and Disasters, chap. 8, edited by: Shroder, J. F., Paron, P., and Baldassarre, G. D., Elsevier, Boston, 213–229, https://doi.org/10.1016/B978-0-12-394846-5.00008-4, 2015.
Du, S., Van Rompaey, A., Shi, P., and Wang, J.: A dual effect of urban expansion on flood risk in the Pearl River Delta (China) revealed by land-use scenarios and direct runoff simulation, Nat. Hazards, 77, 111–128, https://doi.org/10.1007/s11069-014-1583-8, 2015.
Du, S., Scussolini, P., Ward, P. J., Zhang, M., Wen, J., Wang, L., Koks, E., Diaz-Loaiza, A., Gao, J., Ke, Q., and Aerts, J. C. J. H.: Hard or soft flood adaptation? Advantages of a hybrid strategy for Shanghai, Glob. Environ. Chang., 61, 102037, https://doi.org/10.1016/j.gloenvcha.2020.102037, 2020.
Dullo, T. T., Darkwah, G. K., Gangrade, S., Morales-Hernández, M., Sharif, M. B., Kalyanapu, A. J., Kao, S.-C., Ghafoor, S., and Ashfaq, M.: Assessing climate-change-induced flood risk in the Conasauga River watershed: an application of ensemble hydrodynamic inundation modeling, Nat. Hazards Earth Syst. Sci., 21, 1739–1757, https://doi.org/10.5194/nhess-21-1739-2021, 2021.
Fang, J., Lincke, D., Brown, S., Nicholls, R. J., Wolff, C., Merkens, J. L., Hinkel, J., Vafeidis, A. T., Shi, P., and Liu, M.: Coastal flood risks in China through the 21st century – An application of DIVA, Sci. Total Environ., 704, 135311, https://doi.org/10.1016/j.scitotenv.2019.135311, 2020.
Fang, J., Wahl, T., Zhang, Q., Muis, S., Hu, P., Fang, J., Du, S., Dou, T., and Shi, P.: Extreme sea levels along coastal China: uncertainties and implications, Stoch. Env. Res. Risk A., 35, 405–418, https://doi.org/10.1007/s00477-020-01964-0, 2021.
Gori, A., Blessing, R., Juan, A., Brody, S., and Bedient, P.: Characterizing urbanization impacts on floodplain through integrated land use, hydrologic, and hydraulic modeling, J. Hydrol., 568, 82–95, https://doi.org/10.1016/j.jhydrol.2018.10.053, 2019.
Gounaridis, D., Chorianopoulos, I., Symeonakis, E., and Koukoulas, S.: A Random Forest-Cellular Automata modelling approach to explore future land use/cover change in Attica (Greece), under different socio-economic realities and scales, Sci. Total Environ., 646, 320–335, https://doi.org/10.1016/j.scitotenv.2018.07.302, 2019.
Hallegatte, S., Green, C., Nicholls, R. J., and Corfee-Morlot, J.: Future flood losses in major coastal cities, Nat. Clim. Change, 3, 802–806, https://doi.org/10.1038/nclimate1979, 2013.
Haynes, P., Hehl-Lange, S., and Lange, E.: Mobile Augmented Reality for Flood Visualisation, Environ. Modell. Softw., 109, 380–389, https://doi.org/10.1016/j.envsoft.2018.05.012, 2018.
He, C., Liu, Z., Wu, J., Pan, X., Fang, Z., Li, J., and Bryan, B. A.: Future global urban water scarcity and potential solutions, Nat. Commun., 12, 1–11, https://doi.org/10.1038/s41467-021-25026-3, 2021.
Hoch, J. M., Eilander, D., Ikeuchi, H., Baart, F., and Winsemius, H. C.: Evaluating the impact of model complexity on flood wave propagation and inundation extent with a hydrologic–hydrodynamic model coupling framework, Nat. Hazards Earth Syst. Sci., 19, 1723–1735, https://doi.org/10.5194/nhess-19-1723-2019, 2019.
Hunt, A. and Watkiss, P.: Climate change impacts and adaptation in cities: A review of the literature, Clim. Change, 104, 13–49, https://doi.org/10.1007/s10584-010-9975-6, 2011.
Huong, H. T. L. and Pathirana, A.: Urbanization and climate change impacts on future urban flooding in Can Tho city, Vietnam, Hydrol. Earth Syst. Sci., 17, 379–394, https://doi.org/10.5194/hess-17-379-2013, 2013.
IPCC: Climate Change 2014: Impacts, Adaptation, and Vulnerability. Part A: Global and Sectoral Aspects. Contribution of Working Group II to the Fifth Assessment Report of the Intergovernmental Panel on Climate Change, Cambridge University Press, Cambridge, UK, https://doi.org/10.1017/CBO9781107415379, 2014.
Jia, H., Chen, F., Pan, D., Du, E., Wang, L., Wang, N., and Yang, A.: Flood risk management in the Yangtze River basin – Comparison of 1998 and 2020 events, Int. J. Disast. Risk Re., 68, 102724, https://doi.org/10.1016/j.ijdrr.2021.102724, 2022.
Kabat, P., Fresco, L. O., Stive, M. J. F., Veerman, C. P., van Alphen, J. S. L. J., Parmet, B. W. A. H., Hazeleger, W., and Katsman, C. A.: Dutch coasts in transition, Nat. Geosci., 2, 450–452, https://doi.org/10.1038/ngeo572, 2009.
Kim, Y. and Newman, G.: Advancing scenario planning through integrating urban growth prediction with future flood risk models, Comput. Environ. Urban Syst., 82, 101498, https://doi.org/10.1016/j.compenvurbsys.2020.101498, 2020.
Kopp, R. E., DeConto, R. M., Bader, D. A., Hay, C. C., Horton, R. M., Kulp, S., Oppenheimer, M., Pollard, D., and Strauss, B. H.: Evolving understanding of Antarctic ice-sheet physics and ambiguity in probabilistic sea-level projections, Earth's Future, 5, 1217–1233, https://doi.org/10.1002/2017EF000663, 2017.
Lai, C., Shao, Q., Chen, X., Wang, Z., Zhou, X., Yang, B., and Zhang, L.: Flood risk zoning using a rule mining based on ant colony algorithm, J. Hydrol., 542, 268–280, https://doi.org/10.1016/j.jhydrol.2016.09.003, 2016.
Liang, X., Liu, X., Li, X., Chen, Y., Tian, H., and Yao, Y.: Delineating multi-scenario urban growth boundaries with a CA-based FLUS model and morphological method, Landscape Urban Plan., 177, 47–63, https://doi.org/10.1016/j.landurbplan.2018.04.016, 2018.
Lin, W., Sun, Y., Nijhuis, S., and Wang, Z.: Scenario-based flood risk assessment for urbanizing deltas using future land-use simulation (FLUS): Guangzhou Metropolitan Area as a case study, Sci. Total Environ., 739, 139899, https://doi.org/10.1016/j.scitotenv.2020.139899, 2020.
Liu, J., Kuang, W., Zhang, Z., Xu, X., Qin, Y., Ning, J., Zhou, W., Zhang, S., Li, R., Yan, C., Wu, S., Shi, X., Jiang, N., Yu, D., Pan, X., and Chi, W.: Spatiotemporal characteristics, patterns and causes of land use changes in China since the late 1980s, Dili Xuebao/Acta Geogr. Sin., 69, 3–14, https://doi.org/10.11821/dlxb201401001, 2014.
Liu, X., Liang, X., Li, X., Xu, X., Ou, J., Chen, Y., Li, S., Wang, S., and Pei, F.: A future land use simulation model (FLUS) for simulating multiple land use scenarios by coupling human and natural effects, Landscape Urban Plan., 168, 94–116, https://doi.org/10.1016/j.landurbplan.2017.09.019, 2017.
Muis, S., Güneralp, B., Jongman, B., Aerts, J. C. J. H., and Ward, P. J.: Flood risk and adaptation strategies under climate change and urban expansion: A probabilistic analysis using global data, Sci. Total Environ., 538, 445–457, https://doi.org/10.1016/j.scitotenv.2015.08.068, 2015.
Muis, S., Verlaan, M., Winsemius, H. C., Aerts, J. C. J. H., and Ward, P. J.: A global reanalysis of storm surges and extreme sea levels, Nat. Commun., 7, 11969, https://doi.org/10.1038/ncomms11969, 2016.
Nithila Devi, N., Sridharan, B., and Kuiry, S. N.: Impact of urban sprawl on future flooding in Chennai city, India, J. Hydrol., 574, 486–496, https://doi.org/10.1016/j.jhydrol.2019.04.041, 2019.
O'Loughlin, F. E., Neal, J., Schumann, G. J. P., Beighley, E., and Bates, P. D.: A LISFLOOD-FP hydraulic model of the middle reach of the Congo, J. Hydrol., 580, 124203, https://doi.org/10.1016/j.jhydrol.2019.124203, 2020.
Parodi, M. U., Giardino, A., van Dongeren, A., Pearson, S. G., Bricker, J. D., and Reniers, A. J. H. M.: Uncertainties in coastal flood risk assessments in small island developing states, Nat. Hazards Earth Syst. Sci., 20, 2397–2414, https://doi.org/10.5194/nhess-20-2397-2020, 2020.
Parris, A., Bromirski, P., Burkett, V., Cayan, D., Culver, M., Hall, J., Horton, R., Knuuti, K., Moss, R., Obeysekera, J., Sallenger, A., and Weiss, J.: Global Sea Level Rise Scenarios for the US National Climate Assessment, NOAA Tech Memo OAR CPO, 1–37, https://scenarios.globalchange.gov/sites/default/files/NOAA_SLR_r3_0.pdf (last access: 17 May 2021), 2012.
Pecl, G. T., Araújo, M. B., Bell, J. D., Blanchard, J., Bonebrake, T. C., Chen, I. C., Clark, T. D., Colwell, R. K., Danielsen, F., Evengård, B., Falconi, L., Ferrier, S., Frusher, S., Garcia, R. A., Griffis, R. B., Hobday, A. J., Janion-Scheepers, C., Jarzyna, M. A., Jennings, S., Lenoir, J., Linnetved, H. I., Martin, V. Y., McCormack, P. C., McDonald, J., Mitchell, N. J., Mustonen, T., Pandolfi, J. M., Pettorelli, N., Popova, E., Robinson, S. A., Scheffers, B. R., Shaw, J. D., Sorte, C. J. B., Strugnell, J. M., Sunday, J. M., Tuanmu, M. N., Vergés, A., Villanueva, C., Wernberg, T., Wapstra, E., and Williams, S. E.: Biodiversity redistribution under climate change: Impacts on ecosystems and human well-being, Science, 355, eaai9214, https://doi.org/10.1126/science.aai9214, 2017.
Rajib, A., Liu, Z., Merwade, V., Tavakoly, A. A., and Follum, M. L.: Towards a large-scale locally relevant flood inundation modeling framework using SWAT and LISFLOOD-FP, J. Hydrol., 581, 124406, https://doi.org/10.1016/j.jhydrol.2019.124406, 2020.
Ramaswami, A., Russell, A. G., Culligan, P. J., Rahul Sharma, K., and Kumar, E.: Meta-principles for developing smart, sustainable, and healthy cities, Science, 352, 940–943, https://doi.org/10.1126/science.aaf7160, 2016.
Reckien, D., Salvia, M., Heidrich, O., Church, J. M., Pietrapertosa, F., De Gregorio-Hurtado, S., D'Alonzo, V., Foley, A., Simoes, S. G., Krkoška Lorencová, E., Orru, H., Orru, K., Wejs, A., Flacke, J., Olazabal, M., Geneletti, D., Feliu, E., Vasilie, S., Nador, C., Krook-Riekkola, A., Matosović, M., Fokaides, P. A., Ioannou, B. I., Flamos, A., Spyridaki, N. A., Balzan, M. V., Fülöp, O., Paspaldzhiev, I., Grafakos, S., and Dawson, R.: How are cities planning to respond to climate change? Assessment of local climate plans from 885 cities in the EU-28, J. Clean. Prod., 191, 207–219, https://doi.org/10.1016/j.jclepro.2018.03.220, 2018.
Shan, X., Yin, J., and Wang, J.: Risk assessment of shanghai extreme flooding under the land use change scenario, Nat. Hazards, 110, 1039–1060, https://doi.org/10.1007/s11069-021-04978-1, 2022.
Shanghai Municipal People's Government: Shanghai Master Plan (2017–2035), Shanghai Urban Planning and Land Resource Administration Bureau, Shanghai, http://www.shanghai.gov.cn/newshanghai/xxgkfj/2035004.pdf (last access: 15 May 2021), 2018.
Song, J., Fu, X., Wang, R., Peng, Z.-R., and Gu, Z.: Does planned retreat matter? Investigating land use change under the impacts of flooding induced by sea level rise, Mitig. Adapt. Strat. Gl., 23, 703–733, https://doi.org/10.1007/s11027-017-9756-x, 2018.
Sosa, J., Sampson, C., Smith, A., Neal, J., and Bates, P.: A toolbox to quickly prepare flood inundation models for LISFLOOD-FP simulations, Environ. Modell. Softw., 123, 104561, https://doi.org/10.1016/j.envsoft.2019.104561, 2020.
Sun, L., Chen, J., Li, Q., and Huang, D.: Dramatic uneven urbanization of large cities throughout the world in recent decades, Nat. Commun., 11, 5366, https://doi.org/10.1038/s41467-020-19158-1, 2020.
Tessler, Z. D., Vorosmarty, C. J., Grossberg, M., Gladkova, I., Aizenman, H., Syvitski, J. P. M., and Foufoula-Georgiou, E.: Profiling risk and sustainability in coastal deltas of the world, Science, 349, 638–643, https://doi.org/10.1126/science.aab3574, 2015.
United Nations: Factsheet: People and oceans, https://www.un.org/sustainabledevelopment/wp-content/uploads/2017/05/Ocean-fact-sheet-package.pdf (last access: 17 June 2021), 2017.
United Nations: 2018 Revision of World Urbanization Prospects, https://population.un.org/wup/ (last access: 16 May 2021), 2018.
Van Coppenolle, R. and Temmerman, S.: A global exploration of tidal wetland creation for nature-based flood risk mitigation in coastal cities, Estuar. Coast. Shelf S., 226, 106262, https://doi.org/10.1016/j.ecss.2019.106262, 2019.
Vousdoukas, M. I., Mentaschi, L., Voukouvalas, E., Verlaan, M., Jevrejeva, S., Jackson, L. P., and Feyen, L.: Global probabilistic projections of extreme sea levels show intensification of coastal flood hazard, Nat. Commun., 9, 1–12, https://doi.org/10.1038/s41467-018-04692-w, 2018.
Wang, Z., Lai, C., Chen, X., Yang, B., Zhao, S., and Bai, X.: Flood hazard risk assessment model based on random forest, J. Hydrol., 527, 1130–1141, https://doi.org/10.1016/j.jhydrol.2015.06.008, 2015.
Wing, O. E. J., Sampson, C. C., Bates, P. D., Quinn, N., Smith, A. M., and Neal, J. C.: A flood inundation forecast of Hurricane Harvey using a continental-scale 2D hydrodynamic model, J. Hydrol. X, 4, 100039, https://doi.org/10.1016/j.hydroa.2019.100039, 2019.
Xian, S., Yin, J., Lin, N., and Oppenheimer, M.: Influence of risk factors and past events on flood resilience in coastal megacities: Comparative analysis of NYC and Shanghai, Sci. Total Environ., 610–611, 1251–1261, https://doi.org/10.1016/j.scitotenv.2017.07.229, 2018.
Xu, K., Fang, J., Fang, Y., Sun, Q., Wu, C., and Liu, M.: The Importance of Digital Elevation Model Selection in Flood Simulation and a Proposed Method to Reduce DEM Errors: A Case Study in Shanghai, Int. J. Disaster Risk Sc., 12, 890–902, https://doi.org/10.1007/s13753-021-00377-z, 2021.
Xu, W. and Yang, L.: Evaluating the urban land use plan with transit accessibility, Sustain. Cities Soc., 45, 474–485, https://doi.org/10.1016/j.scs.2018.11.042, 2019.
Xu, X.: China GDP Spatial Distribution Kilometer Grid Dataset, Data Registration and publishing System of Resources and Environmental Sciences Data Center, Chinese Academy of Sciences [data set], http://www.resdc.cn/DOI/doi.aspx?DOIid=33 (last access: 18 February 2021), 2017a.
Xu, X.: China Population Spatial Distribution Kilometer Grid Dataset, Data Registration and publishing System of Resources and Environmental Sciences Data Center, Chinese Academy of Sciences [data set], http://www.resdc.cn/DOI/DOI.aspx?DOIid=32 (last access: 18 February 2021), 2017b.
Xu, X., Liu, J., Zhang, Z., Zhou, W., Zhang, S., Li, R., Yan, C., Wu, S., and Shi, X.: A Time Series Land Ecosystem Classification Dataset of China in Five-Year Increments (1990–2010), J. Glob. Chang. Data Discov., 1, 52–59, https://doi.org/10.3974/geodp.2017.01.08, 2017.
Yin, J., Yu, D., Yin, Z., Wang, J., and Xu, S.: Modelling the combined impacts of sea-level rise and land subsidence on storm tides induced flooding of the Huangpu River in Shanghai, China, Clim. Change, 119, 919–932, https://doi.org/10.1007/s10584-013-0749-9, 2013.
Yin, J., Jonkman, S., Lin, N., Yu, D., Aerts, J., Wilby, R., Pan, M., Wood, E., Bricker, J., Ke, Q., Zeng, Z., Zhao, Q., Ge, J., and Wang, J.: Flood Risks in Sinking Delta Cities: Time for a Reevaluation?, Earth's Future, 8, e2020EF001614, https://doi.org/10.1029/2020EF001614, 2020.
Zhai, Y., Yao, Y., Guan, Q., Liang, X., Li, X., Pan, Y., Yue, H., Yuan, Z., and Zhou, J.: Simulating urban land use change by integrating a convolutional neural network with vector-based cellular automata, Int. J. Geogr. Inf. Sci., 34, 1475–1499, https://doi.org/10.1080/13658816.2020.1711915, 2020.
Zhao, G., Bates, P., and Neal, J.: The Impact of Dams on Design Floods in the Conterminous US, Water Resour. Res., 56, 1–15, https://doi.org/10.1029/2019WR025380, 2020.
Zhao, L., Song, J., and Peng, Z.-R.: Modeling Land-Use Change and Population Relocation Dynamics in Response to Different Sea Level Rise Scenarios: Case Study in Bay County, Florida, J. Urban Plan. Dev., 143, 04017012, https://doi.org/10.1061/(asce)up.1943-5444.0000398, 2017.
Zhou, L., Dang, X., Sun, Q., and Wang, S.: Multi-scenario simulation of urban land change in Shanghai by random forest and CA-Markov model, Sustain. Cities Soc., 55, 102045, https://doi.org/10.1016/j.scs.2020.102045, 2020.
Zhou, Q., Leng, G., Su, J., and Ren, Y.: Comparison of urbanization and climate change impacts on urban flood volumes: Importance of urban planning and drainage adaptation, Sci. Total Environ., 658, 24–33, https://doi.org/10.1016/j.scitotenv.2018.12.184, 2019.